New integrated geodetic monitoring system at Stromboli volcano (Italy

Seismic and geodetic insights into magma accumulation at Katla
subglacial volcano, Iceland: 1999 to 2005
Erik Sturkell,1 Pall Einarsson,2 Matthew J. Roberts,3 Halldor Geirsson,3
Magnus T. Gudmundsson,2 Freysteinn Sigmundsson,1 Virginie Pinel,4
Gunnar B. Gu*mundsson,3 Halldor Olafsson,1 and Ragnar Stefansson5
Received 10 November 2006; revised 12 September 2007; accepted 17 December 2007; published 27 March 2008.
[1] Katla is one of Iceland’s most active volcanoes with at least 20 eruptions in the last1100 years. The volcano is coveredmostly by theMyrdalsjokull ice cap; consequently, Katlaeruptions are phreato-magmatic and are capable of producing jokulhlaups. A jokulhlaup inJuly 1999, preceded by an episode of continuous seismic tremor, was the first sign ofrenewed magma movement under the volcano since 1955. Using seismic and geodeticobservations, and insights into geothermal activity from ice-surface observations, weanalyze this period of unrest and assess the present state of Katla volcano. From 1999 to2004, GPSmeasurements on nunataks exposed on the caldera edge revealed steady inflationof the volcano. Our measurements show uplift and horizontal displacement of thenuntatak benchmarks at a rate of up to 2 cm a�1, together with horizontal displacement offar-field stations (>11 km) at about 0.5 cm a�1 away from the caldera centre. Using apoint-source model, these data place the center of the magma chamber at 4.9 km depthbeneath the northern part of the caldera. However, this depth may be overestimated becauseof a progressive decrease in the mass of the overlying ice cap. The depth may be only2–3 km. About 0.01 km3 of magma has accumulated between 1999 and 2004; this value isconsiderably less than the estimated 1 km3 of material erupted during the last eruption ofKatla in 1918. Presently, rates of crustal deformation and earthquake activity areconsiderably less than observed between 1999 and 2004; nonetheless, the volcano remainsin an agitated state.
Citation: Sturkell, E., P. Einarsson, M. J. Roberts, H. Geirsson, M. T. Gudmundsson, F. Sigmundsson, V. Pinel, G. B. Gu*mundsson,
H. Olafsson, and R. Stefansson (2008), Seismic and geodetic insights into magma accumulation at Katla subglacial volcano, Iceland:
1999 to 2005, J. Geophys. Res., 113, B03212, doi:10.1029/2006JB004851.
1. Introduction
[2] Active, ice-covered volcanoes are located in thediverse geographical regions in Eurasia, the Americas, andAntarctica. Eruptions of such volcanoes can cause severe,far-reaching hazards such as glacier floods (jokulhlaup) andlahars due to sudden melting of ice [Major and Newhall,1989]. In Iceland, subglacial volcanism is common, with thevolcanoes Grımsvotn and Katla renowned for frequenteruptive activity (Figure 1). Katla volcano is located be-neath the Myrdalsjokull ice cap (Figure 2) and sincesettlement time, around 874 AD, it has erupted at least 20times [Larsen, 2000]. Jokulhlaups and fallout of tephra are
primary hazards during a Katla eruption, and the proximityof the volcano to populated areas and to international flightpaths makes it a potent threat. In July 1999, an unexpectedjokulhlaup drained from Myrdalsjokull. This short-livedjokulhlaup was preceded several hours earlier by earth-quakes and pulses of low-frequency tremor that originatedfrom Myrdalsjokull. Inspection of Myrdalsjokull revealed anewly formed surface depression (ice cauldron) near to theepicenters of the earthquake swarm that preceded thejokulhlaup. The last Katla eruption to break the ice-surfaceoccurred in 1918. This event was accompanied by a massivejokulhlaup, which emerged from the eastern flank of Myr-dalsjokull, inundating the Myrdalssandur outwash plainbefore dissipating offshore [Tomasson, 1996] (Figure 1).Volcanogenic jokulhlaups from Katla typically begin withina few hours of the onset of the eruption. It is believed thatsubglacial topography does not allow floodwater to accumu-late in large quantities at the eruption site [Bjornsson, 2002];instead, floodwater propagates rapidly from its source loca-tion toward the edge of the ice cap [Roberts, 2005]. Withinjust a few hours, the resulting jokulhlaup reaches a maximumdischarge of-the-order of 100,000 m3 s�1.
JOURNAL OF GEOPHYSICAL RESEARCH, VOL. 113, B03212, doi:10.1029/2006JB004851, 2008ClickHere
for
FullArticle
1Nordic Volcanological Center, Institute of Earth Sciences, Universityof Iceland, Reykjavık, Iceland.
2Institute of Earth Sciences, University of Iceland, Reykjavık, Iceland.3Physics Department, Icelandic Meteorological Office, Reykjavık,
Iceland.4LGIT-Universite de Savoie, Le Bourget du Lac Cedex, France.5Department of Business and Natural Sciences, University of Akureyri,
Iceland.
Copyright 2008 by the American Geophysical Union.0148-0227/08/2006JB004851$09.00
B03212 1 of 17
[3] Iceland’s national seismic and continuous GPS(CGPS) networks – maintained by the Icelandic Meteoro-logical Office – are used to follow seismicity and crustaldeformation at Katla (Figures 2 and 3). Near-real-time datafrom these networks are available at http://hraun.vedur.is/ja.Seismic and CGPS observations at Katla are complementedby campaign GPS surveys, optical tilt measurements, obser-vations of ice-surface changes, and hydrological monitoringof glacial rivers from Myrdalsjokull. In combination, theseobservations allow comprehensive monitoring of the chang-ing state of the Katla volcano. In this article, we analyze theperiod of unrest that started in 1999 and assess the presentstate of the Katla volcano. For this analysis we studyvariations in seismicity, crustal deformation fields, andchanges in the surface of the ice cap, both in relation tochanges in geothermal activity and variations in ice load. Thehydrological monitoring of glacial rivers is performed by theNational Energy Authority and is not discussed further in thispaper; for additional information see http://www.os.is.
2. Geological Background
[4] The Katla volcano hosts a 600 to 750-m deep calderafilled by ice [Bjornsson et al., 2000]. The caldera rim is
breached in three places, to the south-east, north-west andsouth-west. These gaps in the caldera rim provide outflowpaths for ice in the caldera to feed the main outflow glaciers,Kotlujokull, Entujokull, and Solheimajokull (Figure 2).Apart from the large Eldgja flood lava eruption 934-40[Thordarson et al., 2001], all historic eruptions of the Katlavolcanic system have occurred within the caldera [Larsen,2000]. Since the 10th century AD, all large jokulhlaupscaused by Katla eruptions have emerged from Kotlujokullwhile large jokulhlaups issued from Solheimajokull in the8th and 9th centuries AD [Elıasson et al., 2006]. Duringhistorical time, at least two volcanogenic jokulhlaups areknown to have burst from Solheimajokull: one during theEldgja eruption, the other in 1860 [Larsen, 2000] (Figure 2).Large, pre-historic jokulhlaups have issued from Entujokullon the north-west flank of the volcano [Haraldsson, 1981;Smith, 2004; Smith and Dugmore, 2006; Larsen et al.,2005], and Solheimajokull on the south-west flank, asevidenced by jokulhlaup deposits.[5] The tectonic setting of the Katla volcano is not
simple, as it is located outside the main zones of divergentplate motion. In south Iceland the plate boundary is in astate of transition [e.g., Einarsson, 1991a; Sigmundsson etal., 1995; Sigmundsson, 2006]. Plate divergence is presently
Figure 1. Map of Iceland showing the neo-volcanic zone, which is divided into the Northern VolcanicZone (NVZ), the Western Volcanic Zone (WVZ), and the Eastern Volcanic Zone (EVZ) [Einarsson andSæmundsson, 1987]. The EVZ and the WVZ are connected by the South Iceland Seismic Zone (SISZ).The stars indicate the epicenters of the two magnitude 6.6 (MS) earthquakes on 17 and 21 June 2000.Continuous GPS stations are represented by squares and the diamond signifies the reference station(HAMR) for geodetic measurements of Katla volcano. The REYK GPS station is used as reference forthe continuous stations around the Katla volcano.
B03212 STURKELL ET AL.: MAGMA ACCUMULATION AT KATLA VOLCANO
2 of 17
B03212

taken up by two parallel rift zones: the West Volcanic Zone(WVZ) and the East Volcanic Zone (EVZ). Latitude-dependent variations in spreading rate are observed in bothzones, with the EVZ accommodating 55–100% of therelative motion between the North America and Eurasiaplates [LaFemina et al., 2005]. The spreading rate decreasessouthwards and active rifting terminates at the Torfajokullvolcano (Figure 1), where the EVZ rift zone meets thetransform boundary of the South Iceland Seismic Zone.From Torfajokull to the Vestmannaeyjar islands, the influ-ence of the EVZ is primarily seen in the decreasingalkalinity of rocks with increasing distance from the tip ofthe rift zone [Oskarsson et al., 1982]. Therefore Katla andthe neighboring volcanoes Eyjafjallajokull and Vestman-naeyjar (including the Heimaey and Surtsey eruption sites)move completely with the Eurasia plate [LaFemina et al.,2005; Geirsson et al., 2006]. Hence Katla may be classifiedas an intraplate volcano, in spite of its occasional connec-tion with rifting in the EVZ, exemplified by the AD 934Eldgja eruption.[6] The volcanic products of Katla are primarily bimodal
in composition, comprising alkali basalt and mildly alkalicrhyolites [Lacasse et al., 2007]. Intermediate rocks, mostlybasalt-rhyolite hybrids and occasional hawaiite are verysubordinate [Lacasse et al., 2007]. Volumetrically, FeTi-rich basalt with aphyric appearance dominates. This is
ascribed to rapid segregation of material from a largemantle-source beneath a propagating rift [Sinton et al.,1983]. Silicic volcanism is an important component ofKatla’s activity. At least 12 silicic tephra layers are knownfrom Katla during the Holocene, between 1700 and 6600 BP.[Larsen et al., 1999; Larsen, 2000], and almost all knownoutcrops of Katla at the caldera rim and immediatelyoutside it are silicic [Johannesson et al., 1990; Lacasse etal., 2007]. Katla tephras show that phreato-magmatic erup-tions have occurred throughout the Holocene [Oladottir etal., 2005].[7] Seismic undershooting within the Katla caldera has
revealed a zone where P wave velocities are reduced and S-waves are absent; this anomaly is interpreted as evidence ofa magma chamber [Gudmundsson et al., 1994]. Moreover,results from an aeromagnetic survey indicate the presence ofa non-magnetic body within the region of the postulatedmagma chamber [Jonsson and Kristjansson, 2000].[8] Since 1994, the ice-capped Eyjafjallajokull volcano,
situated 25 km west of Katla, has been the most activesource of crustal deformation signals in the region [Sturkellet al., 2003a] (Figure 1). In 1994, and again in 1999, magmaintrusion was detected under the southern slopes ofEyjafjallajokull. These intrusions had a center of uplift�4 km southeast of the volcano’s summit crater [Sturkellet al., 2003a; Pedersen and Sigmundsson, 2004, 2006] andFigure 2. Schematic view of Myrdalsjokull showing the
subglacial outline of the Katla caldera and the numberedlocation of ice-surface depressions (cauldrons) monitoredduring the period 2001–2004. White circles representcauldrons that were becoming shallower, whereas blackcircles indicate cauldrons that were getting deeper. Whitesquares represent cauldrons with a fixed surface elevationduring the observation period. The optical tilt stationsaround Myrdalsjokull are shown in inverted triangles.
Figure 3. Earthquake activity in the Katla volcano and thelocation of nearby seismic stations forming part of thenational seismic network. Contours depict the cumulativeseismic moment per square kilometer for the period01 January 1997 to 28 February 2005. The seismicmoment was calculated using the moment-magnituderelation logM0 = 1.5MLW + 9.1, where M0 is the moment(N m) and MLW moment magnitude for earthquakes MLW �1.7. Earthquake activity is focused in two regions: the areawithin the Katla caldera (234 events) and the Go*abungaregion (3020 events), separated by the dashed line.
B03212 STURKELL ET AL.: MAGMA ACCUMULATION AT KATLA VOLCANO
3 of 17
B03212

were associated with considerable seismic activity [e.g.,Dahm and Brandsdottir, 1997]. After the intrusion eventin 1999 crustal deformation and earthquake activity atEyjafjallajokull has remained low [Sturkell et al., 2006].This is, however, not the only known case of simultaneousactivity of Eyjafjallajokull and Katla. The two volcanoesapparently both erupted in 1612 and the Eyjafjallajokulleruption of 1821–23 was immediately followed by aneruption of Katla [Thoroddsen, 1925]. These are the onlyknown eruptions of Eyjafjallajokull in historic times.
3. The 1918 Eruption of Katla
[9] The latest large eruption of Katla began on 12October 1918, lasting for about three weeks [Sveinsson,1919; Johannsson, 1919]. It was a basaltic eruption and theeruption site was near the southeast rim of the caldera,beneath about 400 m of ice. At 13:00 GMT, earthquakeswere felt in the village of Vık (Figure 3); two hours later, aneruption column was seen over Myrdalsjokull from Vık. Atabout the same time, a debris-laden jokulhlaup was seenpropagating over Myrdalssandur at a speed of about 10 m s�1
[Tomasson, 1996]. The height of the eruption plume on12 October was estimated at 14 km a.s.l. and tephra wascarried northeast [Thorarinsson, 1975; Larsen, 2000]. By13 October, the intensity of the eruption had diminishedsignificantly, the jokulhlaup had almost abated, and theeruption ended on 04 November. The maximum dischargeof the jokulhlaup on 12October is estimated at 300,000m3 s�1
[Tomasson, 1996]. The total volume of the 1918 jokulhlaupmay be as high as 8 km3 [Tomasson, 1996]. An enormousamount of debris was deposited in the sea, advancing theMyrdalsssandur coastline by 3–4 km; however, this tem-porary extension to the coast was reduced to 2 km a fewmonths later [Sveinsson, 1919]. The 1918 eruption of Katlawas large, but estimates of the total volume of eruptedmaterial vary. The amount of tephra fallout is estimatedat 0.7 km3 [Eggertsson, 1919] and the volume of water-transported material is estimated at between 0.7 and 1.6 km3
[Larsen, 2000]. The dense-rock equivalent may have beenas high as 1 km3.
4. Short-Lived Katla Eruptions in 1955and 1999?
[10] It is possible that a short-lived subglacial eruptiontook place in 1955 on the eastern rim of the Katla caldera;however, no tephra erupted into the atmosphere. Instead,two shallow ice cauldrons formed in the surface of Myr-dalsjokull and a small jokulhlaup drained from Kotlujokull[Thorarinsson, 1975; Rist, 1967]. Additionally, earthquakeswere detected beneath Myrdalsjokull in the hours precedingthe onset of the jokulhlaup [Tryggvason, 1960]. The 1955jokulhlaup destroyed a bridge and caused damage totelecommunication lines.[11] A similar, but possibly smaller, event took place in
July 1999. Late on 17 July 1999, earthquakes and bursts oflow-frequency seismic tremor were registered at seismicstations around Myrdalsjokull [Einarsson, 2000; Vogfjor*,2002]. This tremor sequence culminated in the release of ajokulhlaup from Solheimajokull (Figure 2) early on 18 July[Sigur*sson et al., 2000; Roberts et al., 2003]. Following
the jokulhlaup, a newly formed ice cauldron (Figure 2) wasseen in the surface of Myrdalsjokull [Gudmundsson et al.,2007]. In the weeks following the 1999 jokulhlaup, in-creased geothermal activity was detected along the calderarim, as manifest by the deepening of pre-existing icecauldrons [Gudmundsson et al., 2007]. The 1999 jokulhlaupdamaged unpaved roads, electrical pylons, and it almostovertopped a bridge.
5. Seismic Unrest in 1967 and 1976–77
[12] At Katla, periods of high seismic activity wereobserved in 1967 and 1976–77 [Einarsson, 1991a]. In bothcases, seismicity remained elevated for about a year. It isproblematic to compare seismicity over such an extendedperiod of rapid progress in monitoring technology. Onlyfour seismic stations were in operation in Iceland in 1967 sono accurate locations are available for the activity. In 1976 alocal network of analog stations had been installed allowinga fairly high resolution of the location of the activity[Einarsson and Brandsdottir, 2000]. The different networksrequire different magnitude scales for the earthquakes. Thelargest earthquakes in Katla are detected teleseismically bystations on both sides of the Atlantic. They determine mb
(body wave magnitude) from the teleseismic P-waves andare comparable for the whole observation period. They alsosometimes determine MS (surface wave magnitude) fromlong wavelength Rayleigh waves, that are considered to beeven more reliable as a measure of earthquake size. Forsmaller events the ML-scale (local magnitude) is the mostcommonly used scale. ML is determined from the maximumamplitude of the event as recorded by local seismographs.Where these magnitude scales overlap they have been foundto agree well.[13] The 1967 episode was noticed early in the year due
to persistent activity that included earthquakes of mb 4.5 and4.1, which were recorded teleseismically (ISC). The largestearthquake, mb 5.0 (ISC), occurred on 01 April, and denseswarms took place in April and July, with events larger thanML 4. The largest swarm began on 03 October, lasting for4 days; this swarm contained seven events larger than ML 4,one of which was recorded teleseismically with an mb of4.5 (ISC). The locational accuracy of the 1967 activity didnot allow the recognition of discrete source areas beneaththe ice cap.[14] The 1976–1977 seismic crisis was well recorded by
a newly installed local seismograph network. Two epicen-tral areas could be identified within the Katla area, one inthe caldera and the other at Go*abunga west of the caldera.Both the western and the eastern source areas contributed tothe increased activity, i.e., both the caldera region and theGo*abunga cluster were active and agitated. The activityincreased gradually in June, July, and August 1976, andthen rather dramatically in September–November. Theactivity continued at a slightly diminishing rate for fourmonths. A few events reached ML 4. No events weredetected teleseismically until 24 March 1977. Then anmb 4.7 event occurred in the caldera region and was felt atseveral nearby farms. A slightly larger event occurred on02 June (mb 4.9; MS 5.0) that was widely felt in the region.The fault plane solution for this event showed a largecomponent of reverse faulting [Einarsson, 1987]. The
B03212 STURKELL ET AL.: MAGMA ACCUMULATION AT KATLA VOLCANO
4 of 17
B03212

physical mechanism of the two seismicity episodes is stillunclear. Einarsson [1991a] pointed out that both periodswere preceded by eruptions in the Vestmannaeyjar volcanicsystem, about 60 km west of Katla.[15] Written documents show that all large Katla erup-
tions since at least 1625 have been preceded by earthquakesthat were felt in neighboring areas [Thoroddsen, 1925]. It islikely that older eruptions were also preceded by felt earth-quakes, but documentary evidence is lacking. Typically theeruptions of Katla have become visible 1–8 h after the firstfelt earthquake [Thorarinsson, 1975].
6. Methods
[16] A combination of seismic and geodetic methods hasbeen particularly successful in monitoring the state ofIcelandic volcanoes [e.g., Sturkell et al., 2006]. Emphasishas been put on these methods in the monitoring of Katla,but additionally the location of the volcano beneath an icecap allows indirect monitoring of the heat flux from thevolcano by observing cauldrons in the ice surface producedby melting of ice at the rock-ice interface. Myrdalsjokull isone of the most seismically active regions in Iceland, withearthquakes occurring both within the Katla caldera and onthe western flank of the volcano in the Go*abunga region(Figure 3). Local seismograph observations are availablesince the fifties and seismic networks of high sensitivityhave been operated in the area continuously since 1973[Einarsson and Brandsdottir, 2000]. For this study we relymainly on data from the digital SIL network installed in1990. SIL (South Iceland Lowland) was originally a seismicnetwork with near-real time data acquisition in south Ice-land. Currently the SIL acronym refers to the wholeIcelandic seismic network, which has been spread to mostof the country. The network is reasonably sensitive for thisregion. The earthquake catalog of the Iceland Meteorolog-ical Office for the Katla area is complete for events largerthan MLw 1.4 (local moment magnitude).[17] Four optical tilt stations are installed around Myr-
dalsjokull (Figure 2). Three of them were installed in 1967by Tryggvason [1973] to measure ground deformationaround the Katla volcano. The Jokulkvısl (JOKV) andKotlukriki (KOTL) tilt stations are located east of Myrdals-jokull, and the Hof*abrekkuhei*i (HOFD) station to thesoutheast (Figure 2). An additional tilt station was installedin 1992 at Fimmvor*uhals (FIMM), situated betweenMyrdalsjokull and Eyjafjallajokull (Figure 2). StationFIMM is close to the Go*abunga area, enabling monitoringof ground motion and magma movements in the westernpart of the volcano. Stations JOKV, KOTL, and FIMM arevisited annually but station HOFD has proven unreliable,hence it is seldom visited [Tryggvason, 2000]. The HOFDbenchmarks are set in porous tuff and have tended to comeloose and give inconsistent results.[18] Two continuously recording GPS-stations were in-
stalled in 1999 to monitor crustal deformation around Katla.These stations are Solheimahei*i (SOHO) and Laguhvolar(HVOL), located to the south and southeast of Myrdalsjo-kull, respectively (Figure 2). The Continuous GPS-network(CGPS) is complemented by campaign GPS measurements.Benchmarks on the nunataks on the caldera rim which werefirst measured in 1993, have been surveyed at least annually
since 2000. For an overview of the GPS processing proce-dure [see Sturkell et al., 2003a].[19] Last, elevation profiles over Myrdalsjokull were
obtained using an aircraft-mounted radar altimeter whoseexact position was recorded continuously using a kinematicGPS. Within the survey area, the minimum elevationaccuracy of these combined measurements was ±2 m[Gudmundsson et al., 2007]. A preliminary version of thealtimeter system was used to monitor ice-surface subsidenceduring a volcanic eruption beneath Vatnajokull in 1996[Gudmundsson et al., 2004] (Figure 1). A description ofthe system is given by Gudmundsson et al. [2007]. SinceOctober, 1999 altimeter measurements have been made
Figure 4. Time series plot of geodetic and seismic data forthe Katla volcano. (a) Cumulative seismic moment for theKatla caldera and the Go*abunga region (see Figure 3 forexplanation). Between 2002 and the beginning of 2005earthquakes took place year-round within the Go*abungaregion. Note that ice-cauldron seven (see Figure 2) formedbefore the onset of sustained earthquake activity in theGo*abunga region. (b) Vertical displacement of GPSbenchmarks at Austmannsbunga (AUST), Go*aland(GOLA), and Hamragar*ar (HAMR) since 1993 (seeFigures 1 and 2). Displacement at AUST and GOLA isrelative to HAMR, which is referenced to Reykjavık(REYK) (see Figure 1). To clarify the use of geographicnames; Go*aland is a mountain range on the western flankof the Go*abunga glacier summit (1512 m.a.s.l.).
B03212 STURKELL ET AL.: MAGMA ACCUMULATION AT KATLA VOLCANO
5 of 17
B03212

twice a year along nine survey lines intersecting all knownice cauldrons These profiles provide the observational basisfor the changes in thermal output of the geothermal areas
underlying the ice cauldronswithin the caldera [Gudmundssonet al., 2007] as well as shrinkage of the ice cap due to climatewarming which is mostly manifested by retreat of outletglaciers [Pinel et al., 2007].
7. Seismic Observations
[20] Since at least 1960, seasonal earthquake activity hasoccurred beneath Go*abunga, with earthquakes typicallybeginning in early autumn, peaking in late autumn, andcontinuing until mid-winter [Einarsson and Brandsdottir,2000; Jonsdottir et al., 2007]. However, in early 2002earthquake activity did not stop; instead, sustained activitywas maintained throughout the year (Figure 4a). Persistentearthquake activity was observed beneath Go*abunga untillate 2004. The seasonal correlation was still noticeable, butthe activity did not stop in the winter as it typically didbefore 2002. In early 2005 the earthquake activity againdiminished substantially (Figure 4a). It is noteworthy,however, that in spite of the lower level the activity neverstopped completely during the winters of 2005 and 2006.From 1997 to 2004, the largest earthquake beneathGo*abunga registered MLW 2.8.[21] During the period of our study the seismicity within
the Katla caldera has been considerably lower than aroundGo*abunga. Seasonal correlation is less pronounced forthese earthquakes (Figure 4a) [Jonsdottir et al., 2007]. Thelargest earthquakes in the Myrdalsjokull region originate inthe northeast part of the Katla caldera, and since 1997earthquakes up to MLW 3.6 have occurred there. Thisindicates that the magnitude-frequency distribution for the
Figure 5. Earthquake epicenters within the Katla calderafor events MLW � 3 during the period 1997 to 2004.Earthquakes are categorized in relation to the optimal faultplane solution for each event, as represented by the fourpanels.
Table 1. Horizontal and Vertical Displacements and Tilt Calculated for the Most Frequently Measured Sites on and Around Katla,
Modeled as the Result of Point Pressure Source at the Depth d (Mogi Model)a
(a) Inflation Center Within the Caldera x [m] 593,000Dist., m
y [m] 7060,000Vert., cm
h0 [m] 0.12Hz., cm
d [m] 4900Tilt, mradName
Austmannsbunga AUST 3,053 7.34 4.57 20.16Enta ENTA 6,044 3.00 3.70 8.98Fimmvor*uhals FIMM 16,532 0.28 0.93 0.46Go*aland GOLA 9,941 1.04 2.10 2.52Hamragar*ar HAMR 42,951 0.02 0.15 0.01Hof*abrekkuhei*i HOFD 20,359 0.15 0.64 0.21Jokulkvısl JOKV 17,327 0.24 0.86 0.39Kotlukriki KOTL 15,201 0.35 1.08 0.62Laguhvolar-FS HVOL 19,691 0.17 0.68 0.24Solheimahei*i-FS SOHO 12,897 0.54 1.42 1.09Vestmannaeyjar VMEY 63,514 0.01 0.07 0.00
(b) Go*abungax [m] 582,513
Dist., my [m] 7060,798
Vert., cmh0 [m] 0.31Hz., cm
d [m] 2000Tilt, mrad
Austmannsbunga AUST 12,551 0.01 0.08 0.03Enta ENTA 8,540 0.04 0.16 0.12Fimmvor*uhals FIMM 8,247 0.04 0.17 0.14Go*aland GOLA 703 2.60 0.92 12.22Hamragar*ar HAMR 32,659 0.00 0.01 0.00Hof*abrekkuhei*i HOFD 28,649 0.00 0.01 0.00Jokulkvısl JOKV 27,605 0.00 0.02 0.00Kotlukriki KOTL 25,683 0.00 0.02 0.00Laguhvolar-FS HVOL 28,550 0.00 0.02 0.00Solheimahei*i-FS SOHO 13,118 0.01 0.07 0.02Vestmannaeyjar VMEY 54,551 0.00 0.00 0.00
aLocations are listed in UTM co-ordinates (zone 27). (a) Expected displacements caused by an inflating point-source in the Katla caldera for a four-yearperiod (inflation rate h0 = 3.0 cm y�1). Note that deformation signals are small beyond 15 km distance. (b) Deformation caused by the ascent of thehypothesized cryptodome beneath Go*aland from January 2004 to June 2004. The location and depth of the cryptodome is deduced from earthquakedistributions [Soosalu et al., 2006], and measured GPS displacements at GOLA are fitted to a point source, which equates to 3.1 cm of vertical uplift (h0).Signals are small everywhere else.
B03212 STURKELL ET AL.: MAGMA ACCUMULATION AT KATLA VOLCANO
6 of 17
B03212

two populations of earthquakes, Go*abunga and calderaearthquakes, is different. Within the caldera, the optimalfault plane solution [Rognvaldsson and Slunga, 1993] forthe majority of earthquakes greater than MLW 3 showsreverse faulting (Figure 5).
8. Tilt Measurements
[22] Both in 1994 and 1999 tilt measurements at stationFIMM revealed crustal uplift toward the southern flank ofEyjafjallajokull, as confirmed by GPS observations [Sturkellet al., 2003a]. These episodes of uplift were interpreted asbeing caused by magma intrusions. At the tilt stationFIMM no deformation has been detected that can beattributed to the activity at Go*abunga, which is located8 km northeast (Table 1). The deformation field causingearthquakes at Go*abunga must therefore either be verysmall or very localized.
[23] From 1967 to 1973 tilt stations KOTL and JOKV,located east of Myrdalsjokull, exhibited repeated, smalluplift and subsidence (Figure 6), which Tryggvason [1973,2000] attributed to annual variations in the mass of the icecap. The observations were discontinued in 1975, mainlydue to the Krafla volcano-tectonic episode (1975–1984) inN-Iceland, that was keeping the Icelandic geoscience com-munity very busy. After tilt measurements were resumed in1986 the cyclic pattern of uplift and subsidence was notobserved, possibly due to shrinkage of the ice cap. Thenorth component of tilt measurements made at KOTL since2000 (Figure 6) show subsidence to the north (or uplift tothe south), which might be caused by recent thinning[Sigur*sson, 2003] of the Kotlujokull outlet glacier, locatedimmediately south of the measurement point.
9. GPS Measurements
[24] Using geodetic methods for monitoring volcanoes inIceland it is important to take into account that the measuredsignal is superimposed on several other signals, many ofwhich are of geodynamic importance [e.g., Einarsson et al.,2006]. So in order to isolate the volcanic processes due toKatla one has to consider processes such as plate move-ments, plate boundary deformation, activity in neighboringvolcanoes, changes in ice load etc. For our purposes it is ofgreat importance that Katla is not located directly on theplate boundary and is only moderately influenced by eventsthere. It is also important to note that intrusion events tookplace in the neighboring Eyjafjallajokull in 1994 and 1999.These events did have a measurable effect in our network.[25] All campaign measurements presented here use the
Hamragar*ar (HAMR) benchmark as fixed in the process-ing. The displacement relative to the fixed HAMR for thedifferent surveys are given in Table 2. Some data fromCGPS stations are included in campaign measurements, butlong-term observations are processed relative to stationREYK, located in Reykjavık (Figure 1). Although HAMRis located outside the deformation field created by Katla, theintrusion event of 1999 beneath the neighboring Eyjafjalla-jokull volcano caused 1.0 cm of westward displacement(Figure 7) and the 1994 event that was very similar,probably did so as well. Additionally, in June 2000, twoMS 6.6 earthquakes struck in southern Iceland (Figure 1).Both of these earthquakes were produced by right-lateralslip on N–S trending faults; the resulting crustal deforma-tion was detected clearly at HAMR [Sturkell et al., 2003a](Figure 7). In addition, it is apparent that REYK is subsid-ing at a rate of 0.3 cm a�1 [Geirsson et al., 2006]. However,this anomaly is not taken into account in data from HAMRand SOHO.[26] In comparison to the NUVEL-1A plate model, sta-
tion SOHO (and to some extent HVOL) shows acceleratingsouthward displacement since mid 2000, which we attributeto a local source (Figure 8). Relative to REYK, the verticalsignal from SOHO varies annually, but the overall trendbetween mid 2000 and 2005 is vertical uplift at a rate ofabout 1 cm a�1. The same annual cycle has been observedat several nearby CGPS stations but with varying ampli-tudes [Geirsson et al., 2006; Grapenthin et al., 2006].[27] From 2001 until 2004 constant uplift at AUST
occurred at a rate of 1.8 cm a�1 (Figure 4b). Figure 9
Figure 6. Observed ground tilt at the Kotlukriki (KOTL)and Jokulkvısl (JOKV) leveling stations, located on theeastern flank of the Katla volcano (see Figure 2). At bothsites, the eastward component exhibits alternating uplift andsubsidence between 1967 and 1973. This has been inter-preted as the effect of annual variations in ice load[Tryggvason, 2000]. More recently, this trend is less obviousin the tilt data. At the Kotlukriki station, the downward trendin the north component from 2001 onwards is probably due tothinning of the nearby glacier Kotlujokull.
B03212 STURKELL ET AL.: MAGMA ACCUMULATION AT KATLA VOLCANO
7 of 17
B03212

shows the derived displacement vectors from benchmarkson and around Myrdalsjokull, relative to HAMR. BetweenMarch 2003 and January 2004 (Figure 9b), vertical upliftand radial displacement from the caldera center was ob-served, except for one measurement from AUST, whichexhibited horizontal displacement toward the caldera center(Figure 9b). The probable reason for the apparent inwardmovement of AUST is earthquake activity in August 2003that originated in the northeast sector of the caldera, veryclose to the station (Figure 5).
[28] In an attempt to monitor crustal deformation in thezone of maximum earthquake activity in the Go*abungaregion (Figure 3), we installed a GPS benchmark (GOLA)in 2004 to the immediate west of the ice cap (Figure 9d).Within a six-month interval, 2.0 cm of uplift was detected atGOLA (Figure 4b). Observations spanning the period June2004 to February 2005 revealed the same magnitude ofsubsidence at GOLA, in tandem with 0.5 cm of subsidenceat AUST (Figure 4b). Collectively, the GPS data demon-
Figure 7. Time-series plot of displacement at HAMR relative to REYK station, which was held fixedduring data processing. The solid lines in the east and north component show the predicted movement ofthe station according to the NUVEL1-A model of plate motion [DeMets et al., 1994]. An intrusion eventat Eyjafjallajokull caused westward movement of HAMR relative to the NUVEL1-A model. Horizontalmotion was also affected by two major strike-slip earthquakes, which occurred in the SISZ in 2000 (seeFigure 1). No vertical displacement was detected at HAMR as a consequence of the 2000 earthquakes.Following the earthquakes, however, progressive uplift has occurred.
B03212 STURKELL ET AL.: MAGMA ACCUMULATION AT KATLA VOLCANO
8 of 17
B03212

strate sustained inflation of Katla volcano since at least2000, culminating in 2004.
10. Ice Cauldrons and Geothermal Activity
[29] Geothermal activity within the Katla caldera is man-ifest by 12–17 ice cauldrons, most of which are 10–40 mdeep and 0.6–1.6 km wide (Figure 2). Within the caldera
accumulation of winter snow of 8–12 m (equivalent to 5–7 m of water) occurs between October and May. During themelt season (June-August) ablation removes 2–3 m (w.e.)[Gudmundsson et al., 2007]. This results in positive massbalance of 2–4 m (w.e.) within the caldera. This ice ismostly transported by ice flow down the outlet glaciers.However, roughly one tenth is melted beneath the icecauldrons that are considered to have a combined thermal
Figure 8. Time-series plot of displacement at SOHO relative to REYK, which was held fixed duringdata processing. The boxed error bar illustrates the minimum accuracy. The vertical lines denote thetiming of the Hekla volcanic eruption in February 2000 and the June 2000 earthquake sequence insouthern Iceland (see Figure 1). The sloping lines indicate the predicted movement of SOHO according tothe NUVEL1-A model of plate motion [DeMets et al., 1994]. Since at least the June 2000 earthquakes,data in the north component display increasing southward movement relative to the NUVEL1-A model.Data in the vertical component show repeated, annual variations, superimposed on progressivelyincreasing uplift throughout the observation period. It is suggested that variations in ice load dominate theuplift signal at SOHO, thus masking any volcanic influence.
B03212 STURKELL ET AL.: MAGMA ACCUMULATION AT KATLA VOLCANO
9 of 17
B03212

Figure 9. Displacement vectors at Katla volcano, as derived from GPS measurements between 2001and 2004, the data are given in Table 2. Observations are relative to HAMR. The black arrows signifyhorizontal motion and the white arrows denote vertical movement. (a) Benchmark displacements duringthe period June 2001 to March 2003. These data were used to derive the best fitting point source(illustrated by a star) for the observed displacement signals. (b) Benchmark displacements during theperiod March 2003 to January 2004. During this period, all displacement vectors fit to the point-sourcemodel apart from the horizontal component of AUST; this behavior may be due to earthquake activitynear the benchmark in August 2003 (see Figures 3 and 5b). (c) Benchmark displacements during theperiod March 2003 to June 2004 showing increased eastward displacement due to westward movementof HAMR (see east component of Figure 6). (d) Benchmark displacements during the period January2004 to June 2004, encompassing the period of uplift observed at GOLA. (e) Total benchmarkdisplacements around Katla volcano between June 2001 and June 2004. (f) Schematic view ofMyralsjokull and the Katla caldera showing the location of GPS benchmarks in Figures 9a to 9e. Theoptical tilt stations around Myrdalsjokull are shown in inverted triangles.
B03212 STURKELL ET AL.: MAGMA ACCUMULATION AT KATLA VOLCANO
10 of 17
B03212

output of a few hundred megawatts [Gudmundsson et al.,2007]. During the melt season, some cauldrons deepenconsiderably, signifying the release of water from storageat the glacier base beneath the site of the cauldron. Theresulting jokulhlaup are manifest by increasing dischargeand heightened levels of dissolved solutes in the affectedriver [e.g., Sigur*sson et al., 2000]. The ice cauldron thatformed in July 1999 (cauldron 7; Figure 2) corresponded to20 � 106 m3 of meltwater production, which resulted in ajokulhlaup from Solheimajokull on 18 July [Sigur*sson etal., 2000; Roberts et al., 2003]. When inspected from the airat 10:00 GMT on 18 July, the newly formed cauldron had awidth of 1–1.5 km and a depth of 40–50 m. Four weekslater, other ice cauldrons on the surface of Myrdalsjokullhad deepened by 5–10 m and two additional cauldronsformed: cauldrons 8 and 15 (Figure 2). Between late 1999and mid 2001, most ice cauldrons remained at a constantdepth or became shallower; however, between 2001 and2003, the depth of cauldrons 10, 15, and 16 increased by 6–15 m. If the three year period 2001–2004 is considered, theincrease also includes cauldrons 11 and 14 (Figure 2). Inaddition, by 2005 cauldrons 1, 2, and 5 had deepened by 5–10 m while cauldrons 10, 15 and 16 had started to decreaseagain [Gudmundsson et al., 2007]. Figure 10 shows thechange in cauldron geometry for cauldrons 10, 11, 15, and 16between 2001 and 2004.With the exception of cauldrons 1 and2 which are at the western caldera rim, the affected cauldronsare located on a circle with a 6–8 km radius, surrounding thenortheast sector of the caldera, the region where the largestearthquakes have happened (Figures 2 and 5). This change isconsistentwith increased geothermal activity over the inflationbulge. The sudden appearance and then gradual decrease in thedepth of cauldron 7 indicate that it was formed by a short-livedthermal pulse, such as would be produced by a small-volume,subglacial eruption.
11. Modeling of GPS Results
[30] Given that GPS measurements at HAMR wereinfluenced by the June 2000 earthquake sequence, weincluded only data from June 2001 to March 2003 (Figures 7and 11a) in a forward model designed to locate the center ofthe deformation source. Data from CGPS stations HVOL and
SOHO, together with survey results from AUST and ENTA,yielded four three-component displacements (n = 12) for usein the grid search. We used a Mogi-point pressure model tocalculate the best fitting location of a point-source within agrid comprising latitude, longitude, maximum uplift, andsource depth. A least squares criterion was employed tominimize the c2 merit function [see Bevington, 1969].
c2 ¼Xn
i¼1
resi
si
: ð1Þ
[31] Where resi is the residual between observations i andthe model prediction, and si is the standard deviation ofobservation i. Because of the effect of variation in ice loadon vertical displacements (see separate section) we weightedthe vertical component down to ensure that the effects ofhorizontal displacements dominated the modeling result.Figures 9 and 11 illustrate the optimal location of the pointsource at a depth of 4.9 km. A comparison was made bytesting the model prediction against GPS data collectedbetween June 2001 and June 2004 (Figure 11b); in this test,the residual vectors trended uniformly east with equalstrength. Given the uniform size and direction of theresidual vectors, we propose that slight, westward displace-ment of the reference station has occurred. The sourceresponsible for this signal lies somewhere between HAMRand the measured benchmarks, with Eyjafjallajokull as thelikely candidate. Mismatch between the predicted upliftvalue of 0.14 cm a�1 (Table 1) at SOHO and the observed,albeit uncorrected, value of 1 cm a�1 (Figure 8) suggeststhat non-volcanic processes are contributing to the uplift ofMyrdalsjokull.
12. Go**abunga Region: Signs of a Cryptodome?
[32] Seismicity at Go*abunga is remarkably regular,persistent, and spatially concentrated. Precise hypocentrallocations reveal a zone of seismicity at 1.5 km depth[Soosalu et al., 2006]. The displacement field associatedwith the earthquakes appears to be very localized; it is notdetected at a tilt station 8 km away and apart from GOLA,none of the GPS benchmarks are affected (Table 1b). The
Figure 10. Radar altimeter profiles across ice cauldron 10, 11, 15, and 16 in fall 2001 and 2004. Thedepth of these cauldrons increased by 6–13 m over this period. Changes in the depth of other cauldronswere smaller over this period.
B03212 STURKELL ET AL.: MAGMA ACCUMULATION AT KATLA VOLCANO
11 of 17
B03212

seasonal trend in earthquake activity in the Go*abungaregion has been interpreted by Einarsson and Brandsdottir[2000] as a triggering effect due to increased groundwaterpressure within the volcano during summertime melting ofthe overlying ice cap. More recently, Einarsson et al. [2005]and Soosalu et al. [2006] have proposed that persistentearthquakes in the Go*abunga region are generated by anintruding cryptodome; that is, an ascending pocket of silicicor intermediate magma at shallow depth. This argument isbased on the nature and style of the earthquake activity, theapparent displacement field, and the geographic proximityto the Katla caldera. Almost all outcrops of Katla rocks thatare close to or immediately outside the caldera rim aresilicic. Our deformation data are not inconsistent with thisinterpretation. A shallow source of pressure increase at
Go*abunga will only produce small displacements and tiltat our stations (Table 1b). Furthermore, if the cryptodome isascending without a volume increase the displacementswould be smaller still.
13. Crustal Deformation Due to Variations inIce Load
[33] An additional, alternative explanation for theobserved deformation of Katla volcano is crustal rebounddue to thinning of the Myrdalsjokull ice cap. During the lastdecade, significant ablation of the ice cap has occurred, withradar altimeter measurements between 1999 and 2004indicating the loss of over 3 km3 of ice, primarily fromthe margins of the ice cap [Pinel et al., 2007]. Would such areduction in ice load enhance rates of crustal deformationbeneath and around Myrdalsjokull?[34] Using GPS measurements of horizontal and vertical
displacement, the influence of a changing ice-load can beassessed. Beneath and at the edge of an ice cap, verticaluplift dominates as the crustal response to ice loss, withhorizontal displacements an order-of-magnitude less (ratio:<0.3) [Pinel et al., 2007]; this applies to both the immediateelastic response and to the final, relaxed state of the crust.For a point-source approximation of a magma chamber, theratio between horizontal and vertical displacement is >0.5 atdistances >0.5 D, where D is the depth to the source. ForKatla Pinel et al. [2007] showed that the derived ratio nears1. Furthermore, the rate of horizontal displacement is 1–2 cm a�1 away from the caldera edge, implying thatobserved horizontal deformation is principally due to mag-ma accumulation. However, some of the vertical componentof displacement observed outside the ice cap may be due toglacio-isostatic response (Figure 8).
14. Ice-Cauldron Size and GeothermalPower Output
[35] The change in ice cauldron size over a three yearperiod (2001 to 2004) can be considered to estimate thechange in geothermal power output. Taking the combinedadditional melting (DV) over the three year period 2001–2004 of 1 � 107 m3 of ice in cauldrons 10, 11, 14, 15, and16 (Table 3), using latent-heat (Li) and ice density (ri)values of 3.35 � 105 J kg�1 and 910 kg m�3, respectively, aminimum estimate of the increase in geothermal power(DP) from Katla can be obtained from: DP = DVriLi/t.Since t is 3 years, then DP = 34 MW. By taking intoaccount a likely increase of 15–50% due to increased flow ofice into an expanding cauldron [Jarosch and Gudmundsson,2007] the best estimate is DP = 40–50 MW. Since the totalpower-output of the Katla volcano is considered to be a fewhundred megawatts, the increased melting at the base ofthe Myrdalsjokull ice cap during 2001 to 2004 may signal a10–25% increase in geothermal heat production.
15. Insights Provided by Seismic, Geodetic, andGlaciological Observations
[36] By uniting observations presented here, together withinformation about previous episodes of unrest at Katla, apicture of magma accumulation since 1999 emerges. From
Figure 11. Total horizontal displacements and derivedresidual values from a point-source model of magmachamber inflation, depicted by the star. Black arrowssignify measured displacement and white arrows indicatethe deviation between data and model. (a) Total displace-ment for the period June 2001 to March 2003. The modeledpoint-source for the displacement signal lies at 4.9 km depthand an uplift rate of 3.0 cm a�1 is invoked to account for themeasurements. Note that the reference benchmark (HAMR)moved at a uniform rate throughout the observation period(see Figure 6). (b) Application of the point-source model tothe period June 2001 to June 2004. The uniform eastwardorientation of the modeled residuals suggests westwardmovement of HAMR.
B03212 STURKELL ET AL.: MAGMA ACCUMULATION AT KATLA VOLCANO
12 of 17
B03212

the combined data-set it is apparent that the latest period ofunrest began in July 1999 with fleeting volcanic tremor,followed immediately by a jokulhlaup from Solheimajokull.Back-tracing the uplift curve derived from GPS measure-ments since 2000 (Figure 4b) we conclude that the latestepisode of inflation began in mid 1999. Furthermore, ourseismic and geodetic measurements confirm that, by late2004, the inferred rate of magma accumulation had de-creased significantly. Our seismic and glaciological data-sets show that the largest earthquakes and the greatestconcentration of deepening cauldrons occur in the northeastsector of the Katla caldera. Within the Katla caldera,between 1997 and 2004, over half of the 93 recordedearthquakes greater than MLW 3 were confined to thenorthern part of the caldera (see Figure 5). Significantly,these earthquakes exhibited reserve, dip-slip faulting, and sotoo did the largest earthquake (MLW 3.6). Such a dominantfault-mechanism in that region of the caldera could beexplained by thrust-faulting due to crustal uplift. Likewise,the largest GPS-derived displacements have been observedat AUST on the northeast rim of the caldera (Figure 9e);nevertheless, some displacement in the vicinity of AUSTmay be a consequence of faulting near to the apex of theinflation bulge, as shown by earthquakes (e.g., Figure 9b).The shape of the inflation bulge is not very sensitive to theshape of the intrusive body [Dieterich and Decker, 1975].As a general rule, however, the flatter the source the morepronounced will be the vertical component of displacement.The significant horizontal motion observed at Katla would
therefore point to a spherical or a stock-like body rather thana flat, sill-like body. In remainder of this section, we use ourgeodetic results to locate the area of maximum crustal upliftand the volume of magma accumulated since 1999.[37] The grid search for the best fitting point-source using
data from June 2001 to March 2003 (1.7 years) suggeststhat the center of crustal uplift is located within the northeastpart of the caldera at 4.9 km depth (Figure 11). However,since the contribution to vertical uplift from the reduction ofice load is not considered, this value is an overestimate. Thedepth may be only 2–3 km. The modeled uplift directlyabove the point-source is 5.1 cm for the observation period(i.e., 3.0 cm a�1). Between 2000 and 2004, the surface ofthe volcano inflated by 0.018 km3, as derived from theformula: DVe = 2ph0d
2, where h0 corresponds to 12 cm ofuplift and d represents 4.9 km depth (see Table 1a).Assuming a Poisson ratio of 0.25, the equivalent volumeincrease at depth is about two-thirds of the integratedsurface volume; that is 0.012 km3. In comparison, the1918 eruption of Katla produced approximately 1 km3 oferuptives; however, it is possible that this material waspartly or solely coming from a deeper source. The relativelyhomogeneous chemical composition of the products of largebasaltic eruptions of Katla during the last 1000 years seemsto indicate that they have not had time to evolve in ashallow magma chamber [Oladottir et al., 2005, 2008]. Thewide range of composition for Katla magmas in general[Lacasse et al., 2007], however, points to a complicatedmagma plumbing system, that may even change signifi-
Table 2. All Campaign Measurements are Processed With the Hamragar*ar (HAMR) Benchmark as Fixeda
East, cm Formal Uncert., cm North, cm Formal Uncert., cm Up, cm Formal Uncert., cm
(a) 01 Jun – 03 MarHVOL �18.8475 63.52632 0.203 0.007 �0.409 0.007 0.303 0.041SOHO �19.2466 63.55252 �0.294 0.006 �0.606 0.007 0.647 0.041VMEY �20.2935 63.42703 0.033 0.006 �0.108 0.008 �0.605 0.045AUST �19.0805 63.67440 1.756 0.007 1.840 0.010 3.184 0.057ENTA �19.1822 63.70112 �0.837 0.007 0.954 0.010 2.273 0.058
(b) 03 Mar – 04 JanVMEY �20.2935 63.42703 0.145 0.007 0.401 0.010 0.259 0.054HVOL �18.8475 63.52632 0.634 0.008 �0.240 0.009 0.409 0.052SOHO �19.2466 63.55252 0.197 0.007 �0.592 0.009 0.751 0.052AUST �19.0805 63.67440 0.076 0.008 �1.264 0.010 1.676 0.059ENTA �19.1822 63.70112 �0.327 0.008 0.670 0.010 0.181 0.059
(c) 03 Mar – 04 JunVMEY �20.2935 63.42703 0.642 0.006 0.590 0.009 0.880 0.050HVOL �18.8475 63.52632 0.854 0.008 �0.154 0.009 1.025 0.049SOHO �19.2466 63.55252 0.539 0.006 �0.543 0.009 1.386 0.048AUST �19.0805 63.67440 1.024 0.007 0.421 0.010 2.381 0.054ENTA �19.1822 63.70112 0.158 0.007 0.828 0.010 0.605 0.054
(d) 04 Jan – 04 JunVMEY �20.2935 63.42703 0.496 0.006 0.189 0.009 0.621 0.050HVOL �18.8475 63.52632 0.217 0.008 0.095 0.009 0.612 0.049SOHO �19.2466 63.55252 0.338 0.007 0.053 0.009 0.621 0.049AUST �19.0805 63.67440 0.945 0.008 1.689 0.010 0.692 0.056ENTA �19.1822 63.70112 0.455 0.007 0.155 0.010 0.423 0.056GOLA �19.3221 63.65974 0.700 0.007 �0.550 0.010 2.628 0.057
(e) 01 Jun – 04 JunHVOL �18.8475 63.52632 1.058 0.006 �0.563 0.007 1.328 0.037SOHO �19.2466 63.55252 0.245 0.005 �1.149 0.007 2.032 0.037VMEY �20.2935 63.42703 0.675 0.005 0.481 0.007 0.275 0.040AUST �19.0805 63.67440 2.780 0.007 2.261 0.009 5.565 0.054ENTA �19.1822 63.70112 �0.679 0.007 1.781 0.009 2.878 0.055REYN �19.0272 63.41851 0.574 0.007 0.114 0.010 1.149 0.054aThe displacement relative to HAMR for five different surveys combinations are given. The formal uncertainties are underestimated by the Bernese
processing software [Hugentobler et al., 2001] and need to be rescaled to obtain a more rigorous uncertainty estimate. Comparing the formal uncertainty tothe standard deviation of the resulting coordinates scales the uncertainties.
B03212 STURKELL ET AL.: MAGMA ACCUMULATION AT KATLA VOLCANO
13 of 17
B03212
cantly on a timescale of thousands of years [Oladottir et al.,2008]. The existence of a magma chamber beneath thenorthern part of the caldera at the present time is thereforeby no means excluded by the chemical data. The criticalinflation level for this presently inflating magma chamber isunknown. It may be significantly lower than what thevolume of the last previous eruption would imply.[38] We note that the above estimate of the inflation
volume is likely to be too high due to the effects of decreasingice load. Similarly, the depth of the inflation source is likely tobe over-estimated. Decreasing ice load will affect primarilythe vertical component of the uplift signal. Therefore byremoving the ice-load effect the remaining displacement fieldwill imply a shallower inflation source. A depth of 2–3 kmis consistent with the deformation data. The inflating bodymay therefore coincide with the body of low P-velocity andhigh S-wave attenuation identified beneath the caldera byGudmundsson et al. [1994].[39] The present episode of unrest in Katla is the longest
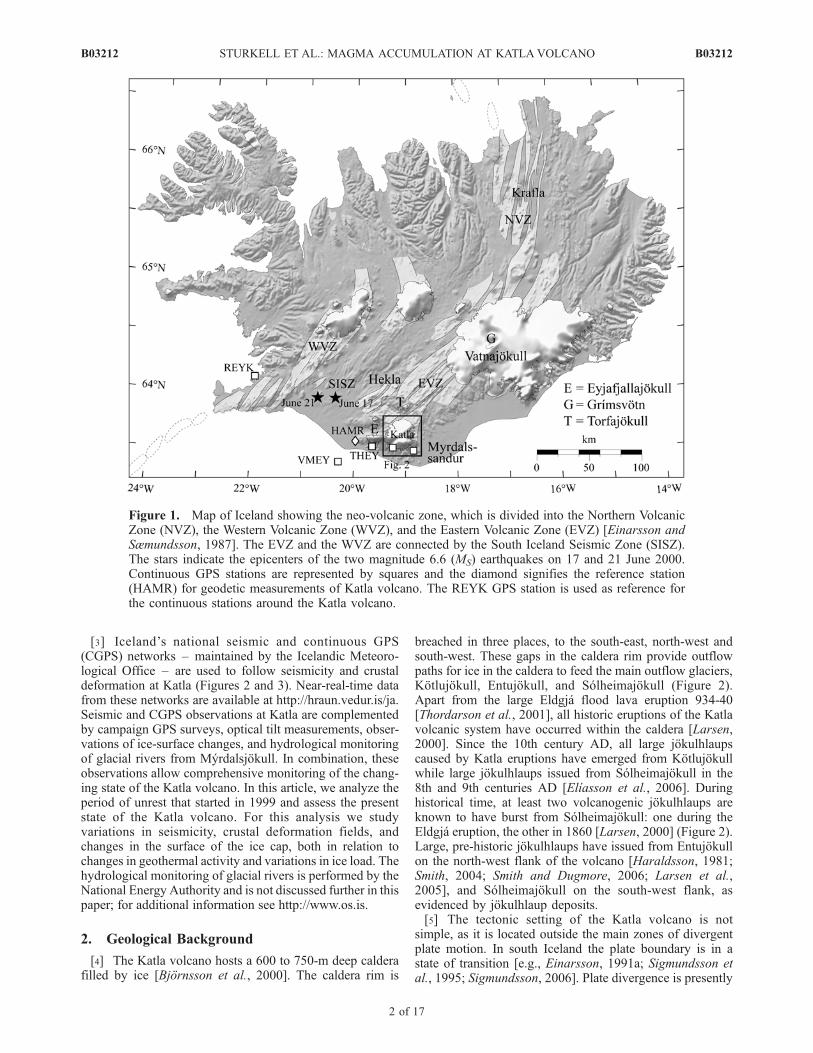
known since the major eruption of 1918. Whether it leads toa large eruption remains to be seen. The most hazardousaspect of historical eruptions of Katla has been the largejokulhlaups caused by the melting of glacier ice during thebeginning phase of the eruptions. The path of these outburstfloods depends critically on the location of the eruption sitewithin the caldera. The eruptions during historic time haveoriginated in the eastern part of the caldera and consequentlythe floods have issued to the flood plane of Myrdalssandur,SE of the volcano. The present water divides under the icewithin the caldera have been mapped by Bjornsson et al.[2000] (Figure 12). If the site of the next eruption is near theapex of the inflation bulge the next flood will similarly beissued to the SE. The apex is, however, very close to thewater divide and slight shift in the eruption site will change
the potential flood path dramatically. In addition, it is wellknown from other inflating volcanoes that the eruption sitemay not be located at the apex of the premonitory inflationbulge. The eruptions of Grımsvotn in 1998 and 2004, were,e.g., preceded by inflation centered on the caldera [Sturkellet al., 2003b, 2006] and yet the eruption sites were locatedat the caldera rim. The eruptions of Krafla in the 1980ieswere preceded by inflation of the caldera region but theeruptions were located on the transecting rift, some of themquite far from the caldera [e.g., Einarsson, 1991b; Buck etal., 2006]. The location of the inflation bulge of Katla maytherefore be of limited predictive value for the path of thenext jokulhlaup.
16. Conclusions
[40] A study of seismic, geodetic, and glaciological dataobtained in the last few decades leads us to the following
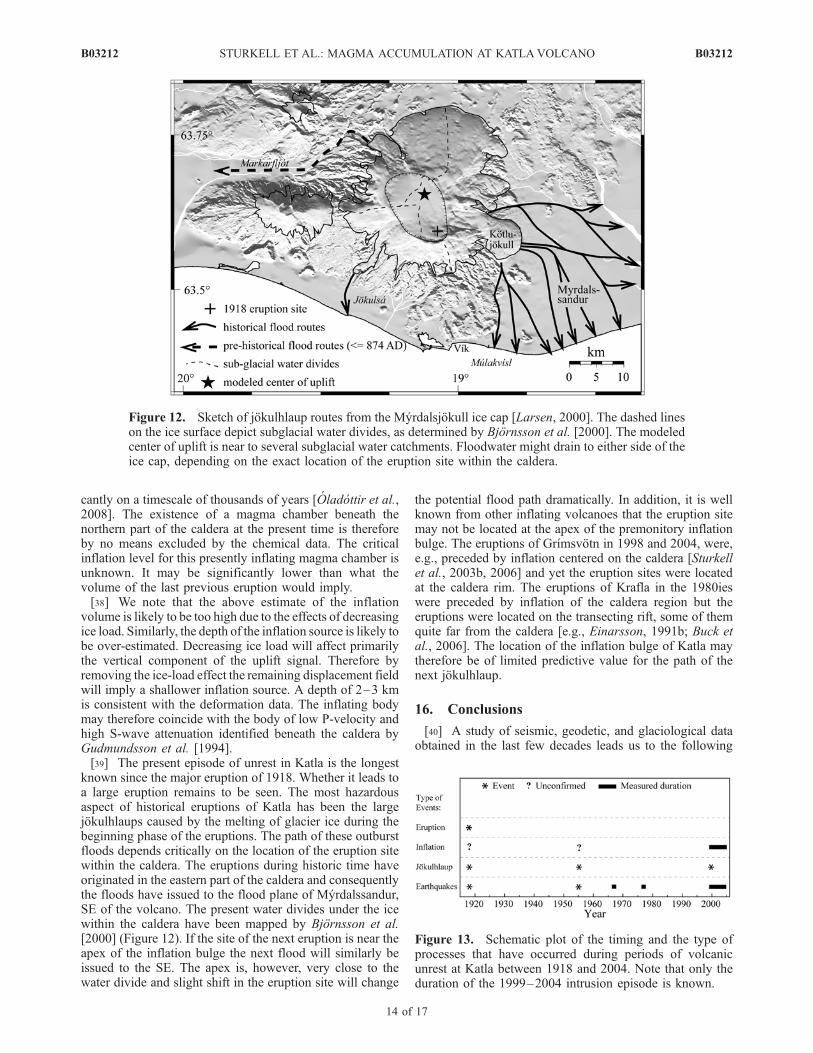
Figure 13. Schematic plot of the timing and the type ofprocesses that have occurred during periods of volcanicunrest at Katla between 1918 and 2004. Note that only theduration of the 1999–2004 intrusion episode is known.
Figure 12. Sketch of jokulhlaup routes from the Myrdalsjokull ice cap [Larsen, 2000]. The dashed lineson the ice surface depict subglacial water divides, as determined by Bjornsson et al. [2000]. The modeledcenter of uplift is near to several subglacial water catchments. Floodwater might drain to either side of theice cap, depending on the exact location of the eruption site within the caldera.
B03212 STURKELL ET AL.: MAGMA ACCUMULATION AT KATLA VOLCANO
14 of 17
B03212

conclusions regarding the present state of the magmasystem of the Katla volcano:[41] 1. The Katla volcano has been a persistent source of
high seismic activity for at least half a century, or since asensitive seismograph was installed in the region.[42] 2. Four episodes of unusual activity can be identified
after the 1918 eruption (Figure 13), probable small subgla-cial eruption in 1955, two episodes of greatly elevatedseismicity in 1967 and 1976–77, and an episode of unrestthat began in 1999 with a flash flood, probably as a result ofa small subglacial eruption.[43] 3. The present episode is characterized by elevated
seismic activity, both in the caldera and in a dense epicentralcluster west of the caldera rim at Go*abunga. A slowinflation began with a center in the northern part of thecaldera. GPS-points on nunataks near the caldera rim weredisplaced upwards and horizontally away from the center ata rate of 1–2 cm a�1. This is taken as evidence of magmaaccumulation at a depth of less than 5 km beneath thecaldera. Deepening of several depressions in the glaciersurface indicates that the heat output of the volcano in-creased, probably as a consequence of the inflation.[44] 4. The vertical movements by themselves could
alternatively be explained by the reduction of the ice loadof the glacier [Pinel et al., 2007], but the horizontal move-ments cannot. We therefore prefer to interpret the inflationas the result of pressure increase in the roots of the volcano.A depth of 2–3 km is consistent with the deformation data,taking the ice load reduction into account.[45] 5. The current episode of unrest of Katla was
preceded by two intrusion events of the neighboring volca-no Eyjafjallajokull, in 1994 and 1999. Eruptions of Eyjaf-jallajokull are known to have been previously associatedwith activity of Katla.[46] 6. The intense seismic cluster at Go*abunga does not
seem to produce a detectable deformation signal at ourmeasuring stations that are all more than 8 km distant. Thisindicates that the source of the activity has to be shallow. Ashallow, slowly migrating cryptodome, as has been postu-lated, can be reconciled with the data.[47] 7. The total volume added to the Katla magma
storage system since 1999 is of the order of 0.01 km3. Thisis minute in comparison to the volume produced in the lastmajor eruption. The volume of the 1918 products was of theorder of 1 km3.[48] 8. The course of events during the present episode
slowed down considerably in 2004. Nevertheless, the Katlavolcano remains in an agitated state, the present episode isthe longest recorded so far, and an eruption in the nearfuture should not be ruled out.
[49] 9. If the location of the next volcanic eruption is atthe inferred site of the center of volcanic uplift, then theresulting meltwater will drain beneath Kotlujokull to pro-duce a jokulhlaup on Myrdalssandur (Figure 12). However,the inferred center of uplift is near to three other subglacialwater-divides [Bjornsson et al., 2000], thus making therouting of the consequent jokulhlaup highly sensitive tothe location of the eruption site.
[50] Acknowledgments. We thank Benedikt Bragason and the rescueteam in Vık for assistance with field logistics. Comments from thereviewers, Dave McGarvie and Thorvaldur Thordarson, have helped usto significantly improve the paper. Also the suggestions of the associateeditor Sarah Fagents have been most helpful. This study was supported bythe following institutions and research grants: the Icelandic Roads Author-ity; the Icelandic government; the University of Iceland Research Fund; theIcelandic research council (RANNIS); and the European Union projectsFORESIGHT (GOCE-CT-2003-511139) and VOLUME (018471). Thefigures were produced using the GMT public domain software [Wesseland Smith, 1998].
ReferencesBevington, P. R. (1969), Data Reduction and Error Analysis, McGraw-Hill,New York.
Bjornsson, H. (2002), Subglacial lakes and jokulhlaups in Iceland, GlobalPlanet. Change, 35, 255–271.
Bjornsson, H., F. Palsson, and M. T. Gu*mundsson (2000), Surface andbedrock topography of Myrdalsjokull, South Iceland: The Katla caldera,eruption sites and routes of jokulhlaups, Jokull, 49, 29–46.
Buck, W. Roger, P. Einarsson, and B. Brandsdottir (2006), Tectonic stressand magma chamber size as controls on dike propagation: Constraintsfrom the 1975–1984 Krafla rifting episode, J. Geophys. Res., 111,B12404, doi:10.1029/2005JB003879.
Dahm, T., and B. Brandsdottir (1997), Moment tensors of microearthquakesfrom the Eyjafjallajokull volcano in South Iceland, Geophys. J. Int., 130,183–192.
DeMets, C., R. G. Gordon, D. F. Argus, and S. Stein (1994), Effect ofrecent revision to the geomagnetic reversal time scale on estimates ofcurrent plate motions, Geophys. Res. Lett., 21, 2191–2194.
Dieterich, J. H., and R. W. Decker (1975), Finite element modelling ofsurface deformation associated with volcanism, J. Geophys. Res., 80,4094–4102.
Eggertsson, S. (1919), Ymislegt smavegis vi*vıkjandi Kotlugosinu 1918,Eimrei*in, 25, 212–222.
Einarsson, P. (1987), Compilation of earthquake fault plane solutions in theNorth Atlantic and Arctic Oceans, in Recent Plate Movements and De-formation, edited by K. Kasahara, pp. 47–62, Geodynamics Series, 20,Am. Geophys. Union.
Einarsson, P. (1991a), Earthquakes and present-day tectonism in Iceland,Tectonophysics, 189, 261–279.
Einarsson, P. (1991b), The Krafla volcano-tectonic episode 1975–1989 (inIcelandic), in: Nattura Myvatns, (ed. A. Einarsson and A. Gar*arsson),Hi* Islenska Natturufræ*ifelag, Reykjavık, pp. 97–139.
Einarsson, P. (2000), Atbur*aras ı tengslum vi* hlaup ı Jokulsa a Solhei-masandi ı julı 1999 (Course of events associated with jokulhlaup inJokulsa a Solheimasandi in July 1999, abstract in Icelandic), GeoscienceSociety of Iceland, Special Conference, Feb. 17, 2000, Abstract Volume,p. 14.
Einarsson, P., and B. Brandsdottir (2000), Earthquakes in the Myrdalsjokullarea, Iceland, 1978–1985: Seasonal correlation and relation to volcanoes,Jokull, 49, 59–73.
Einarsson, P., and K. Sæmundsson (1987), Earthquake epicenters 1982–1985 and volcanic systems in Iceland (map), in I Hlutarsins E*li: Fes-tschrift for Thorbjorn Sigurgeirsson, edited by Th. Sigfusson, Mennin-garsjo*ur, Reykjavık.
Einarsson, P., H. Soosalu, E. Sturkell, F. Sigmundsson, and H. Geirsson(2005), Virkni ı Kotlueldsto*inni og nagrenni hennar sı*an 1999 oghugsanleg )roun atbur*arasar (Activity of Katla and surrounding areasince 1999 and potential scenarios, in Icelandic), in Hættumat vegnaeldgosa og hlaupa fra vestanver*um Myrdalsjokli og Eyjafjallajokli(Assessment of hazard due to eruptions and jokulhlaups from westernMyrdalsjokull and Eyjafjallajokull), edited by M. T. Gu*mundsson andA. G. Gylfason, pp. 151–158, University Publ., Reykjavık, Iceland.
Einarsson, P., F. Sigmundsson, E. Sturkell, (. Arnadottir, R. Pedersen,C. Pagli, H. Geirsson (2006), Geodynamic signals detected by geodeticmethods in Iceland, In: C. Hirt (editor), Festschrift for Prof. G. Seeber,
Table 3. Excess Melting Beneath Ice Cauldrons in the Period
2001–2004 (r: Cauldron Radius, Dh: Increase in Depth, DV =
pr2Dh/3 is Increase in Volume of Cauldron, Estimated as a Cone
With Height Dh and Radius r)
Cauldron r, m Dh, m DV, 106 m3
10 400 6 1.011 300 7 0.714 700 5 2.515 400 10 1.716 500 13 3.4Total 10.5
B03212 STURKELL ET AL.: MAGMA ACCUMULATION AT KATLA VOLCANO
15 of 17
B03212

Wissenschaftliche Arbeiten der Fachrichtung Geodasie und Geoinforma-tik der Universitat Hannover Nr. 258, 39–57.
Elıasson, J., G. Larsen, M. T. Gudmundsson, and F. Sigmundsson (2006),Probabilistic model for eruptions and associated flood events in the Katlacaldera, Iceland, Comput. Geosci., 10, 179–200.
Geirsson, H., Th. Arnadottir, C. Volksen, W. Jiang, E. Sturkell, T. Villemin,P. Einarsson, F. Sigmundsson, and R. Stefansson (2006), Current platemovements across the Mid-Atlantic Ridge determined from 5 years ofcontinuous GPS measurements in Iceland, J. Geophys. Res., 111,B09407, doi:10.1029/2005JB003717.
Grapenthin, R., F. Sigmundsson, H. Geirsson, T. Arnadottir, and V. Pinel(2006), Icelandic rhythmics: Annual modulation of land elevation andplate spreading by snow load, Geophys. Res. Lett., 33, L24305,doi:10.1029/2006GL028081.
Gudmundsson, O., B. Brandsdottir, W. Menke, and G. E. Sigvaldason(1994), The crustal magma chamber of the Katla volcano in south Icelandrevealed by 2-D seismic undershooting, Geophys. J. Int., 119, 277–296.
Gudmundsson, M. T., F. Sigmundsson, H. Bjornsson, and (. Hognadottir(2004), The 1996 eruption at Gjalp, Vatnajokull ice cap, Iceland: Courseof events, efficiency of heat transfer, ice deformation and subglacial waterpressure, Bull. Volcanol., 66, doi:10.1007/s00445-003-0295-9.
Gudmundsson,M. T.,(. Hognadottir, A. B.Kristinsson, and S. Gudbjornsson(2007), Geothermal activity in the subglacial Katla caldera, Iceland, 1999–2005, studied with radar altimetry, Ann. Glaciol., 45, 66–72.
Haraldsson, H. (1981), The Markarfljot sandur area, southern Iceland, se-dimentological, petrological and stratigraphic studies, Striae, 15, 1–58.
Hugentobler, U., S. Schaer, and P. Fridez (2001), Bernese GPS softwareversion 4.2, Astron. Inst., Univ. of Bern, Bern, Switzerland.
Jarosch, A. H., and M. T. Gudmundsson (2007), Numerical studies of iceflow over subglacial geothermal heat sources at Grımsvotn, Iceland,using the full Stokes equations, J. Geophys. Res., 112(F2), F02008,doi:10.1029/2006JF000540.
Johannesson, H., S. P. Jakobsson, and K. Saemundsson (1990), Geologicalmap of Iceland, sheet 6, South-Iceland, third edition, Icelandic Museumof Natural History and Geodetic Survey, Reykjavık.
Johannsson, G. (1919), Kotlugosi* 1918. (The Katla eruption of 1918, inIcelandic). Bokaverslun Arsæls Arnasonar, Reykjavık, p. 72.
Jonsdottir, K., A. Tryggvason, R. Roberts, B. Lund, H. Soosalu, andR. Bo*varsson (2007), Habits of a glacier-covered volcano: Seismicitypatterns and velocity structure of Katla volcano, Iceland, Ann. Glaciol.,45, 169–177.
Jonsson, G., and L. Kristjansson (2000), Aeromagnetic measurements overMyrdalsjokull and vicinity, Jokull, 49, 47–58.
Lacasse, C., H. Sigurdsson, S. N. Carey, H. Johannesson, L. E. Thomas,and N. W. Rogers (2007), Bimodal volcanism at the Katla subglacialcaldera, Iceland: Insight into the geochemistry and petrogenesis of rhyo-litic magmas, Bull. Volcanol., 69, 373–399, doi:10.1007/s00445-006-0082-5.
LaFemina, P. C., T. H. Dixon, R. Malservisi, T. Arnadottir, E. Sturkell,F. Sigmundsson, and P. Einarsson (2005), Geodetic GPS Measure-ments in South Iceland: Strain accumulation and partitioning in a propa-gating ridge system, J. Geophys. Res., 110, B11405, doi:10.1029/2005JB003675.
Larsen, G. (2000), Holocene eruptions within the Katla volcanic system,south Iceland: Characteristics and environmental impact, Jokull, 49, 1–28.
Larsen, G., A. J. Dugmore, and A. J. Newton (1999), Geochemistry ofhistorical-age silicic tephras in Iceland, Holocene, 9, 463–471.
Larsen, G., K. T. Smith, A. Newton, and O. Knudsen (2005), Jokulhlaup tilvesturs fra Myrdalsjokli: Ummerki um forsoguleg hlaup ni*ur Markarfl-jot (Jokulhlaups towards west from Myrdalsjokull, evidence for pre-historic floods in Markarfljot river, in Icelandic), in Hættumat vegnaeldgosa og hlaupa fra vestanver*um Myrdalsjokli og Eyjafjallajokli(Assessment of hazard due to eruptions and jokulhlaups from westernMyrdalsjokull and Eyjafjallajokull), edited by M. T. Gu*mundsson andA. G. Gylfason, pp. 75–98, University Publ., Reykjavık, Iceland.
Major, J. J., and C. G. Newhall (1989), Snow and ice perturbation duringhistorical volcanic eruptions and the formation of lahars and floods, Bull.Volcanol., 52, 1–27.
Oladottir, B. A., G. Larsen, Th. Thordarson, and O. Sigmarsson (2005), TheKatla volcano, S-Iceland: Holocene tephra stratigraphy and eruption fre-quency, Jokull, 55, 53–74.
Oladottir, B. A., O. Sigmarsson, G. Larsen, and Th. Thordarson (2008),Katla volcano, Iceland: Magma composition, dynamics and eruption fre-quency as depicted by the Holocene tephra layer record, Bull. Volc., 70,473–493.
Oskarsson, N., G. E. Sigvaldason, and S. Steinthorsson (1982), A dynamicmodel of rift zone petrogenesis and the regional petrology of Iceland,J. Petrol., 23, 28–74.
Pedersen, R., and F. Sigmundsson (2004), InSAR based sill model linksspatially offset areas of deformation and seismicity for the 1994 unrest
episode at Eyjafjallajokull volcano, Iceland, Geophys. Res. Lett., 31,L14610, doi:10.1029/2004GL020368.
Pedersen, R., and F. Sigmundsson (2006), Temporal development of the1999 intrusive episode in the Eyjafjallajokull volcano, Iceland, derivedfrom InSAR images, Bull. Volcanol., 68, 377–393, doi:10.1007/s00445-005-0020-y.
Pinel, V., F. Sigmundsson, E. Sturkell, H. Geirsson, P. Einarsson, M. T.Gudmundsson, and T. Hognadottir (2007), Green’s function estimates ofEarth response to variable surface loads: Application to deformation ofthe subglacial Katla volcano, Iceland, Geophys. J. Int., 169, 325–338,doi:10.1111/j.1365-246X.2006.03267.x.
Rist, S. (1967), Jokulhlaups from the ice cover of Myrdalsjokull on June 25,1955 and January 20, 1956, Jokull, 17, 243–248.
Roberts, M. J. (2005), Jokulhlaups: A reassessment of floodwater flowthrough glaciers,Rev. Geophys., 43, RG1002, doi:10.1029/2003RG000147.
Roberts, M. J., F. S. Tweed, A. J. Russell, O. Knudsen, and T. D. Harris(2003), Hydrological and geomorphic effects of temporary ice-dammedlake formation during jokulhlaups, Earth Surf. Processes Landforms, 28,723–737.
Rognvaldsson, S. T., and R. Slunga (1993), Routine fault plane solutionsfor local networks: A test with synthetic data, Bull. Seismol. Soc. Am., 83,1232–1247.
Sigmundsson, F. (2006), Iceland Geodynamics, Crustal Deformation andDivergent Plate Tectonics. Springer–Praxis Publishing Ltd, Chichester,209 pp.
Sigmundsson, F., P. Einarsson, R. Bilham, and E. Sturkell (1995), Rift-transform kinematics in south Iceland: Deformation from Global Posi-tioning System measurements, 1986 to 1992, J. Geophys. Res., 100,6235–6248.
Sigur*sson, O. (2003), Joklabreytingar 1930–1960, 1960–1990 og 2000–2001, Jokull, 52, 61–67.
Sigur*sson, O., S. Zophonıasson, and E. Isleifsson (2000), Jokulhlaup urSolheimajokli 18. julı 1999 (The jokulhlaup from Solheimajokull July 18,1999, in Icelandic with English summary), Jokull, 49, 75–80.
Sinton, J. M., D. S. Wilson, D. M. Christie, R. N. Hey, and J. R. Delaney(1983), Petrological consequences of rift propagation on oceanic spread-ing ridges, Earth Planet. Sci. Lett., 62, 193–207.
Smith, K. (2004), Holocene jokulhlaups, glacier fluctuations and palaeoen-vironment, Myrdalsjokull, South Iceland, PhD thesis 139 pp. EdinburghUniv.
Smith, K. T., and A. J. Dugmore (2006), Mid- to late first millennium ADfloods in South Iceland and their implications for landscapes of settle-ment, Geografiska Annaler, 88 A(2), 165–176.
Soosalu, H., K. Jonsdottir, and P. Einarsson (2006), Seismicity crisis at theKatla volcano, Iceland—signs of a cryptodome?, J. Volcanol. Geotherm.Res., 153, doi:10.1016/j.jvolgeores.2005.10.013.
Sturkell, E., F. Sigmundsson, and P. Einarsson (2003a), Recent unrest andmagma movements at Eyjafjallajokull and Katla volcanoes, Iceland,J. Geophys. Res., 108(B8), 2369, doi:10.1029/2001JB000917.
Sturkell, E., P. Einarsson, F. Sigmundsson, S. Hreinsdottir, and H. Geirsson(2003b), Deformation of Grımsvotn volcano, Iceland: 1998 eruption andsubsequent inflation, Geophys. Res. Lett., 30(4), 1182, doi:10.1029/2002GL016460.
Sturkell, E., P. Einarsson, F. Sigmundsson, H. Geirsson, R. Pedersen,E. Van Dalfsen, A. Linde, S. Sacks, and R. Stefansson (2006), Volcanogeodesy and magma dynamics in Iceland, J. Volcanol. Geotherm. Res.,150, doi:10.1016/j.jvolgeores.2005.07.010.
Sveinsson, G. (1919), Kotlugosi* 1918 og aflei*ingar )ess (The Katlaeruption of 1918 and its consequences, in Icelandic). Prentsmi*ja Guten-bergs, Reykjavık, pp. 61.
Thorarinsson, S. (1975), Katla og annall Kotlugosa (Katla and annals ofits eruptions, in Icelandic), In Arbok Fer*afelags Islands, Reykjavık,125–149.
Thordarson, T., D. J. Miller, G. Larsen, S. Self, and H. Sigurdsson (2001),New estimates of sulfur degassing and atmospheric mass-loading by the934 AD Eldgja; eruption, Iceland, J. Volcanol. Geotherm. Res., 108, 33–54.
Thoroddsen, (. (1925), Die Geschichte der Islandischen Vulkane (Thehistory of Icelandic volcanoes, in German). The Royal Danish ScienceSociety Skrifter, Department of Nat. Sciences and Mathematics, 8.Række, IX, 458 pp.
Tomasson, H. (1996), The jokulhlaup from Katla in 1918, Ann. Glaciol.,22, 249–254.
Tryggvason, E. (1960), Earthquakes, jokulhlaups and subglacial eruptions,Jokull, 10, 18–22.
Tryggvason, E. (1973), Surface deformation and crustal structure in theMyrdalsjokull area of south Iceland, J. Geophys. Res., 78, 2488–2497.
Tryggvason, E. (2000), Ground deformation at Katla: Results of precisionlevelling 1967–1995, Jokull, 48, 1–8.
B03212 STURKELL ET AL.: MAGMA ACCUMULATION AT KATLA VOLCANO
16 of 17
B03212

Vogfjor*, K. S. (2002), Var eldgos orsok jar*skjalftaoroans ı Solheimajo-kulshlaupinu, 17 julı 1999? (Was volcanic tremor during the jokulhlaupfrom Solheimajokull on 17 July 1999 caused by an eruption? In Icelan-dic), Geoscience Society of Iceland, Abstract Volume, p. 32.
Wessel, P., and W. H. F. Smith (1998), New, improved version of genericmapping tools released, Eos Trans. AGU, 79(47), 579.
�����������������������P. Einarsson and M. T. Gudmundsson, Institute of Earth Sciences,
University of Iceland, Sturlugata 7, 101 Reykjavık, Iceland. ([email protected]; [email protected])
H. Geirsson, G. B. Gu*mundsson, and M. J. Roberts, PhysicsDepartment, Icelandic Meteorological Office, Busta*avegur 9, 150Reykjavık, Iceland. ([email protected]; [email protected]; [email protected])H. Olafsson, F. Sigmundsson, and E. Sturkell, Nordic Volcanological
Center, Institute of Earth Sciences, University of Iceland, Sturlugata 7, 101Reykjavık, Iceland. ([email protected]; [email protected]; [email protected])V. Pinel, LGIT-Universite de Savoie Campus Scientifique, 73376 Le
Bourget du Lac Cedex, France. ([email protected])R. Stefansson, Department of Business and Natural Sciences, University
of Akureyri, 600 Akureyri, Iceland. ([email protected])
B03212 STURKELL ET AL.: MAGMA ACCUMULATION AT KATLA VOLCANO
17 of 17
B03212
Copyright © 2022 FDOKUMEN