Changes in food consumption in Iceland 1780-1940
19
This article was downloaded by: [The National University and Library] On: 21 June 2012, At: 02:00 Publisher: Routledge Informa Ltd Registered in England and Wales Registered Number: 1072954 Registered office: Mortimer House, 37-41 Mortimer Street, London W1T 3JH, UK Scandinavian Economic History Review Publication details, including instructions for authors and subscription information: http://www.tandfonline.com/loi/sehr20 Changes in food consumption in Iceland, 1770–1940 Gudmundur Jonsson Available online: 20 Dec 2011 To cite this article: Gudmundur Jonsson (1998): Changes in food consumption in Iceland, 1770–1940, Scandinavian Economic History Review, 46:1, 24-41 To link to this article: http://dx.doi.org/10.1080/03585522.1998.10414677 PLEASE SCROLL DOWN FOR ARTICLE Full terms and conditions of use: http://www.tandfonline.com/page/terms-and-conditions This article may be used for research, teaching, and private study purposes. Any substantial or systematic reproduction, redistribution, reselling, loan, sub-licensing, systematic supply, or distribution in any form to anyone is expressly forbidden. The publisher does not give any warranty express or implied or make any representation that the contents will be complete or accurate or up to date. The accuracy of any instructions, formulae, and drug doses should be independently verified with primary sources. The publisher shall not be liable for any loss, actions, claims, proceedings, demand, or costs or damages whatsoever or howsoever caused arising directly or indirectly in connection with or arising out of the use of this material.
Transcript of Changes in food consumption in Iceland 1780-1940

This article was downloaded by: [The National University and Library]On: 21 June 2012, At: 02:00Publisher: RoutledgeInforma Ltd Registered in England and Wales Registered Number: 1072954 Registered office: Mortimer House,37-41 Mortimer Street, London W1T 3JH, UK
Scandinavian Economic History ReviewPublication details, including instructions for authors and subscription information:http://www.tandfonline.com/loi/sehr20
Changes in food consumption in Iceland, 1770–1940Gudmundur Jonsson
Available online: 20 Dec 2011
To cite this article: Gudmundur Jonsson (1998): Changes in food consumption in Iceland, 1770–1940, Scandinavian EconomicHistory Review, 46:1, 24-41
To link to this article: http://dx.doi.org/10.1080/03585522.1998.10414677
PLEASE SCROLL DOWN FOR ARTICLE
Full terms and conditions of use: http://www.tandfonline.com/page/terms-and-conditions
This article may be used for research, teaching, and private study purposes. Any substantial or systematicreproduction, redistribution, reselling, loan, sub-licensing, systematic supply, or distribution in any form toanyone is expressly forbidden.
The publisher does not give any warranty express or implied or make any representation that the contentswill be complete or accurate or up to date. The accuracy of any instructions, formulae, and drug doses shouldbe independently verified with primary sources. The publisher shall not be liable for any loss, actions, claims,proceedings, demand, or costs or damages whatsoever or howsoever caused arising directly or indirectly inconnection with or arising out of the use of this material.

Gudmundur Jonsson
Changes in FoodConsumption in Iceland,1770-1940
ABSTRACTThe history of food consumption in Iceland differs in many fundamental ways fromthat in the rest of Europe. The prominence of domestically produced dairy products,fish, meat and suet, and the insignificance of cereals until the nineteenth century,are among the most unusual features. This paper presents the first attempt to estimate total food consumption in Iceland on the basis of food supply data, coveringthe period 1770-1940. The data, derived from trade statistics, production statisticsand the author's current study of Iceland's GNp, provides information on the level ofconsumption, on the composition and the nutritional value of the diet, and on thechanging patterns of consumption. In general terms, this can be described as a transition from an animal-based to a more grain-based diet. A short discussion on thecauses of dietary change, and its effects on the nutrional status of Icelanders andon population growth, concludes the paper.
Introduction
According to the scanty literature on Icelandic food history, the national diet underwent radical change between the later nineteenth century and well into thepresent century. This change, it is contended, marked a decisive break from ageold consumption patterns and entailed a shift from a basically animal-based diettowards a more grain-based one.
Such an important change has only been given tentative treatment in the literature as have, in fact, most other topics in the field of Icelandic food history.' Many
Interestingly, most of the important works were written in the 1940s, see Guojonsson, Skuli, Polhehost og sundhedsforhold i gamle dage belyst igiennem den oidnordiske litteratur. Kjebenhavn: Nyt nordisk forlag - Arnold Busck 1941; Jonsson, Bjorn L.,'Heilsufar og matareedi a islandi fyrr og nu',Nyjar leiair II. Reykjavik: Natturuleekningafelag islands 1946, 70-141; Johnsen, Baldur, Eleven Centuries of Food and Health in IcelandWith Special Reference to Caries Dentii. Reykjavik: Manneldisradrfkisins 1978; Steffensen, Jon, Urn hkamshsed islendinga og orsakir til breytinga a henni, Menning og meinsemdir. Reykjavik: Sogufelag 1975, 237-257, and also an abridged English version ofthe article, Stature as a criterion of the nutritional level of Viking Age Icelanders, Third VikingCongress, Reykjavik 1956, Arb6k Hins fslenzka fornleifafelags. Fylgirit 1958, 39-51. Studies of amore ethnological nature are, Eldjarn, Kristjan, Ao sauma sil og sta mjolk, Arb6k FomleifafeiagsIslands 1960, 48-63; Ionasson, Jonas, Islenzkirl>j6iJhamir. Reykjavik: lsafoldarprensmidia H.E 1961,34-55; Krist[ansson, Luovik, lslenznir sjdvarhattir I. Reykjavik: Menningarsjodur 1980, 35-195;Ibid 11,1982,449-478; Cfsladottir, Hallgerdur, 'The use of whey in Icelandic households', Milkand Milk Products from Medieval to Modern Times. Proceedings of the Ninth International Conferenceon Ethnological Food Research, Ireland, 1992, Ed. Patricia Lysaght. Edinburgh: Canongate 1994, 123129; Ibid, Eldhus og matur Ii lslandi, unpublished cando mag. thesis, University of Iceland 1991.
24 Scandinavian Economic History Review Vol. XLVI, no: 1, 1998
Dow
nloa
ded
by [
The
Nat
iona
l Uni
vers
ity a
nd L
ibra
ry]
at 0
2:00
21
June
201
2

Changes in Food Consumption in Iceland, 1770-1940
major aspects of this dietary change deserve closer investigation. But the purposeoffering a more systematic approach than is customary in writings on the Icelandic diet. We will start with a description of the traditional diet, but the bulk ofthe paper will be devoted to the findings of food-supply data compiled for thisstudy, covering the years 1770-1940. This data will be used to identify and analyze the timing, pace and nature of the transition in food consumption patternsin Iceland.
The traditional Icelandic diet
Until the mid-nineteenth century the type of production and the general economicconditions of Iceland set the parameters for food production and consumption.Farming and fishing provided a livelihood for most of the population, whereasonly a small number of people made a living from other activities, such as thetrades, transport, commerce and other services. There were 20-30 trading portsscattered around the coast but in none of them, excluding Reykjavik, did the population exceed one hundred people. Towns and villages hardly existed until thelast decades of the nineteenth century, so Icelanders either lived off the land orthe sea - many did both. There is evidence of grain growing in medieval timesbut by the sixteenth century the practice had come to an end and all cereals hadtherefore to be imported. Animal husbandry was the mainstay of agriculture andthere seems to have been a gradual but steady shift from cattle to sheep rearingover the centuries, which continued well into the second half of the nineteenthcentury. The emphasis was on keeping ewes for their milk and raising wethers formeat and tallow. With no fields to plough or carts to pull (roads fit for vehicleshardly existed until about 1900) Icelanders valued cattle, not for their ability asdraught animals, but for the production of milk. And the Icelandic breed of cowsseem to have been of good milking stock despite their small size, for one couldexpect 1600 litres of milk or more a year per cow according to eighteenth andearly nineteenth century sources.
Most Icelanders were thus engaged in food production in one way or another.In ordinary circumstances agriculture supplied most of the food the populationrequired, and the only imported foodstuffs of significance before the nineteenthcentury were rye and barley imported from Denmark. Other foods such as sugarand syrup, salt, coffee and alcoholic beverages were marginal until the second halfof the nineteenth century. Milk from cows and ewes and milk products constituted, together with mutton and suet, the most important foodstuffs of the farmingpopulation. The principal milk products were butter, whey and a special Icelandic curd called skyr, made of skimmed milk and rennet, all of which were eaten ingreat quantities. Also of great importance were blood pudding and liver pudding,which were made from sheep's blood, liver, kidneys and suet. Mixing the puddings with ryerneal, as is now customary, did not become common until the nineteenth century. Sheep were slaughtered in the autumn, after having been fattenedin highland pastures during the summer, and most of the meat products weresoured with whey, smoked or even dried for storage over the winter. Salted mutton was a significant export article, but as salt was too expensive for home useother mediums of conservation were used, particularly whey. These home-produced foodstuffs were complemented with dried fish and cereals bought from coastal farmers or merchants. Many farmers and their male servants worked as fisher-
25
Dow
nloa
ded
by [
The
Nat
iona
l Uni
vers
ity a
nd L
ibra
ry]
at 0
2:00
21
June
201
2
Scandinavian Economic History Review
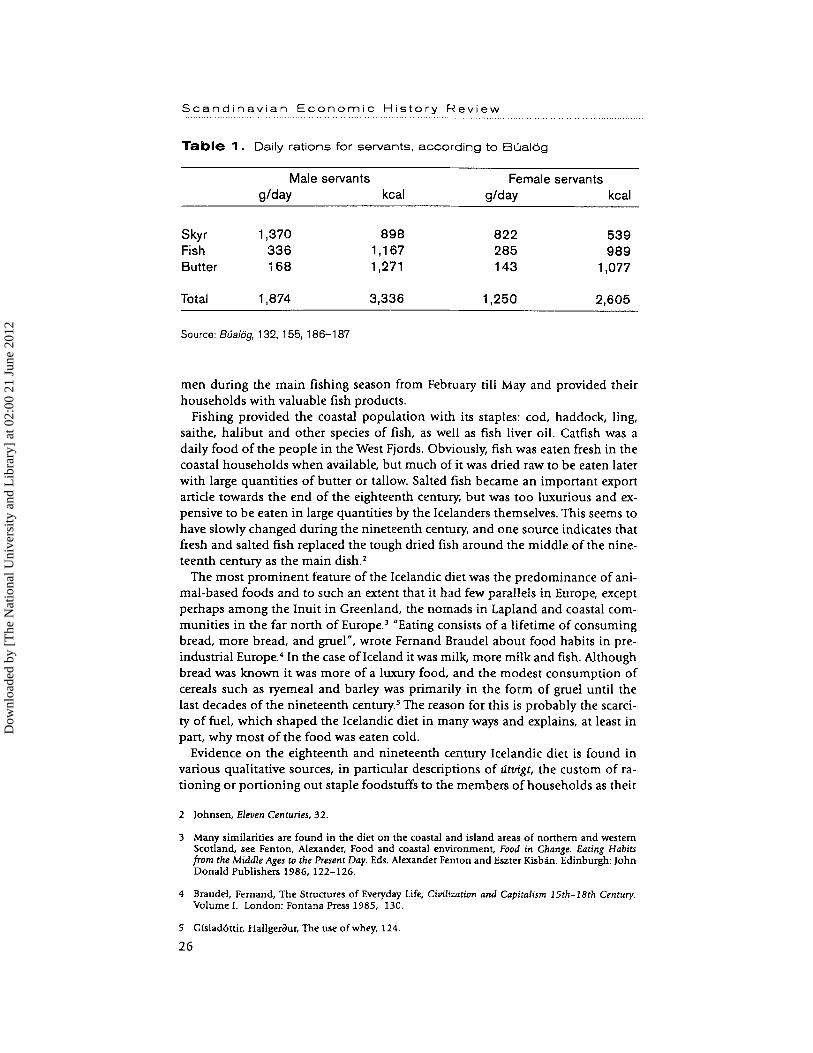
Table 1. Daily rations for servants, according to Bualbg
Male servants Female servantsg/day kcal g/day kcal
Skyr 1,370 898 822 539Fish 336 1,167 285 989Butter 168 1,271 143 1,077
Total 1,874 3,336 1,250 2,605
Source: 8ualog, 132, 155, 186-187
men during the main fishing season from February till May and provided theirhouseholds with valuable fish products.
Fishing provided the coastal population with its staples: cod, haddock, ling,saithe, halibut and other species of fish, as well as fish liver oil. Catfish was adaily food of the people in the West Fjords. Obviously, fish was eaten fresh in thecoastal households when available, but much of it was dried raw to be eaten laterwith large quantities of butter or tallow. Salted fish became an important exportarticle towards the end of the eighteenth century, but was too luxurious and expensive to be eaten in large quantities by the Icelanders themselves. This seems tohave slowly changed during the nineteenth century, and one source indicates thatfresh and salted fish replaced the tough dried fish around the middle of the nineteenth century as the main dish.'
The most prominent feature of the Icelandic diet was the predominance of animal-based foods and to such an extent that it had few parallels in Europe, exceptperhaps among the Inuit in Greenland, the nomads in Lapland and coastal communities in the far north of Europe.' "Eating consists of a lifetime of consumingbread, more bread, and gruel", wrote Fernand Braudel about food habits in preindustrial Europe.' In the case ofIceland it was milk, more milk and fish. Althoughbread was known it was more of a luxury food, and the modest consumption ofcereals such as ryemeal and barley was primarily in the form of gruel until thelast decades of the nineteenth century." The reason for this is probably the scarcity of fuel, which shaped the Icelandic diet in many ways and explains, at least inpart, why most of the food was eaten cold.
Evidence on the eighteenth and nineteenth century Icelandic diet is found invarious qualitative sources, in particular descriptions of utvigt, the custom of rationing or portioning out staple foodstuffs to the members of households as their
2 Johnsen, Eleven Centuries, 32.
3 Many similarities are found in the diet on the coastal and island areas of northern and westernScotland, see Fenton, Alexander, Food and coastal environment, Food in Change. Eating Habitsfrom the Middle Ages to the Present Day. Eds. Alexander Fenton and Eszter Kisban, Edinburgh: JohnDonald Publishers 1986, 122-126.
4 Brandel, Fernand, The Structures of Everyday Life, Civilization and Capitalism 15th-18th Century.Volume I. London: Fontana Press 1985, 130.
5 Gislad6ttir, Hallgerdur, The use of whey, 124.
26
Dow
nloa
ded
by [
The
Nat
iona
l Uni
vers
ity a
nd L
ibra
ry]
at 0
2:00
21
June
201
2

Changes in Food Consumption in Iceland, 1770-1940
food allowance for shorter or longer periods, from a week to several months at atime. The utvigt normally included fish, butter and sometimes skyr, but varied according to the availability of food. It applied especially to servants and fishermenduring the main fishing seasons.
The old by-laws, BualOg, which have been preserved in many manuscripts datingfrom the fifteenth to the eighteenth centuries, include regulations on rations forservants. Female servants were to have 5 marks or 1,250 g of food, and male servants 7.5 marks or 1,874 g a day." The exact composition of the diet is not stated,but most of the BualOg manuscripts prescribe a daily ration of no less than 822 g ofskyr for females and 1,370 g for males. The quantity of other foodstuffs is not stated, but we know that dried fish and butter were the most commonly rationed foods.Assuming that these made up the rest of the diet and were portioned out in theratio 2:1, as was customary, we arrive at the figures shown in Table 1. Calculatingthe nutritional value of the diet gives a daily energy value of 3,336 kcal for maleservants and 2,605 kcal for female servants. The value of the diet calculated in thisway corresponds roughly with the monetary value of a daily meal for servants asprescribed in Biialog, and we can therefore assume that other common foodstuffssuch as milk, whey or blood pudding were not included as additional fare but weresubstituted to a greater or lesser extent for the three staples.
If taken literally, Bualog and the sources on utvigt indicate staggeringly high annual consumption levels for butter and even more for fish. For a female servantthe annual consumption of dried fish would be 104 kg and for a male servant124 kg, or an equivalent amount of fresh fish. Converting these figures into fresh,ungutted fish, using the factor 7.7, we arrive at a yearly consumption of 801 kgand 946 kg respectively. These are high figures indeed, but as already noted otherfoodstuffs replaced fish, butter and skyr to a large extent.
Our concern here is with the general picture, but there were, of course, important regional and social variations in food consumption. The main geographicaldifference was between the inland farming areas, which relied heavily on meatand milk products, and the fishing communities on the coast, where fish products constituted by far the largest part of the food. In his Beskrivelse at Gullbringuog Kj6sar syslur, of 1785, Royal Treasurer Skull Magnusson describes the typicaldiets of farmers and fishermen in a county in the south-west, which can be regarded as the two most common types of diets all over the country, even thoughthere were, of course, local variations in the number of meals and their composition.? In the farming areas of the county the daily fare consisted of fish and butterfor the midday meal or lunch, and skyr for supper and possibly for breakfast aswell. In the coastal areas people took fish at most meals and maybe a little skyrand whey bought from farmers. It is difficult to overstate the importance of fish,especially dried fish, in the diet of the coastal population. Broth with meat, a little grain and vegetables were served instead of fish and butter at Sunday lunch,both in rural and coastal households. In addition, an early breakfast consisting ofgruel, skyr, meat or bread was served in farmers' households during hay harvesting. The three-meal system seems to have been predominant in most areas.
6 Two of the manuscripts mention 8.5 marks rations, cf. Bualiig um ven11ag og allshonat venjuT (vidskiptum og buskap Ii Islandi. Reykjavik: Sogufelag 1915-33, 34 and 61. The mark is here equal to250g.
7 Magnusson, Skiili, Beshrivelse at Gullbringu og Kj6saT syslur(1785), udgivet af J6n Helgason, Kebenhavn: Bibliotheca Amamagnseana, Vol. IV, 1944, 22-23.
27
Dow
nloa
ded
by [
The
Nat
iona
l Uni
vers
ity a
nd L
ibra
ry]
at 0
2:00
21
June
201
2

Scandinavian Economic History Review
Table 2. Diets of four households in 1847
average daily intake - male equivalents
A well-off
farmer's house
hold in the South
A poor farmer's
household
in the South
A well-off
farmer's house
hold in the East
A poor farmer's A well-off
household farmer's house-
in the East hold in the North
Size of household 11 4 25 11 15
Male equivalents 9,5 3,0 20,4 8,3 12,2
Foodstuffs, g
Cereals 121 38 304 125 85
Dried fish 46 36 5 27 50
lamb/mutton 171 31 296 90 77
Suet 57 10 98 30 25
Offal 23 4 40 12 10
Milk 1.241 618 616 494 806
Butter 100 34 69 48 63
Skyr 928 374 567 417 592
Whey 1.182 477 720 530 754
Iceland moss 27 11 11
Potatoes 45
Energy nutrients, g
Protein 230 102 173 114 158
Fat 230 71 253 113 129
Carbohydrate 240 94 339 168 177
Energy value, kcal
Total 3,994 1.437 4.370 2.168 2.534
% Energy value from:
Fats 12,1 6,0 19,2 11,8 8,6
Fish products 4,0 8,7 0,4 4,2 6,8
Vegetables and potatoes 0,0 0,0 2,2 1,8 2,9
Meat products 13,1 6,5 20,7 12,7 9,3
Cereals 10,8 9,4 24,9 20,7 12,0
Milk products 60,0 69,2 32,6 48,8 60,4
Protein 23,4 28,8 16,0 21,4 25,4
Fat 52,2 44,6 52,5 47,1 46,3
Carbohydrate 24,4 26,6 31,5 31,5 28,3
Source: Schleisner, Island, 137-138.
Some foods were particular to certain regions or areas: Iceland moss, for instance, was used extensively in the North and East; seabirds and their fat and eggsformed an important source of food in island communities like the Westman Islands and several coastal areas on the mainland; while edible plants like dulse,sol, on the south and west coast and scurvywort, skarfaklil, around the bay of Breidafiordur were much sought after. Farmers in the county of Skaftafellssysla in theSouth-East harvested lyme grass, melgresi, for grain and straw. Some of these regional foods, like dulse and Iceland moss, spread to other areas with trade, butnot as widely as the more important staples such as butter, tallow, salted muttonand dried fish.
28
Dow
nloa
ded
by [
The
Nat
iona
l Uni
vers
ity a
nd L
ibra
ry]
at 0
2:00
21
June
201
2

Changes in Food Consumption in Iceland, 1770-1940
Social class and income affected the diet in a fundamental way. Not only didthe poor have much less to eat than the well-off, but their fare was also moremonotonous. Fresh and dried fish, fish heads, fish liver oil and suet formed thestaples of cottar families by the seaside, while poor inland cottagers ate mostlymilk products, blood pudding and, to a lesser extent, meat. Few sources deal explicitly with the social differences in food consumption. Yet in a valuable studyof Icelandic health conditions around the middle of the nineteenth century theDanish physician, P. A. Schleisner, presents information on the annual consumption of 7 households of different classes and locations in the country which, inSchleisner's words, can be regarded as "averages of a sort"," Here we will take acloser look at the nutritional value of the five most detailed of those diets, twofrom South Iceland, two from the East and one from the North. A note of cautionis required, however, for the food lists are not complete: no mention is made, forinstance, of fresh fish or fish-liver oil which were an essential part of the diet incoastal regions. Quantities, moreover, are not stated for some of the foodstuffslisted, i.e. milk products are only expressed as butter, skyr and whey from x numberof cows and y number of ewes, and only the number of sheep slaughtered arereported. A number of assumptions have therefore been made about the quantities of produce per animal.
Nevertheless, Schleisner's information offers a rare opportunity to analyze actual food consumption in nineteenth-century Iceland, its composition and nutritional content. Table 2 shows a statistical interpretation of Schleisner's account.There are huge variations between households in terms of consumption levels,which reflect differentials between social groups rather than regions, although moreinformation is needed in order to establish how representative Schleisner's examples are. In any case, they offer important information on the composition of thediet and rough indications of the level of energy intake in different households.
The stark contrast between the three high-income households and the two lowincome households is primarily manifested in different amounts of food and therefore energy intake, which ranges from as low as 1,437 kcal to 4,370 kcal. Evidently the extremely low level of energy intake in the case of the poor farmer in theSouth must be partly due to incomplete information. Interesting variations in thecomposition of the diet can been observed between households, such as the prominence of meat and cereals and the relatively moderate role played by milk products in the well-off farmer's household in the East, despite this being a thrivingdairy farm by Icelandic standards, with 6 cows and 140 ewes." There are great variations in the consumption levels of cereals and fish between households, but itmust be borne in mind, as already mentioned, that fresh fish was not recorded inSchleisner's account.
The table conveys an important characteristic of the Icelandic diet, namely thegreat significance of milk products. They are shown in the form of the four mostcommon milk products, fresh milk, butter, skyr and whey, but the relative weightof the individual products is estimated. Changing the weight of individual milk
8 Schleisner, P.A., Island undersogt fra et Lagevidenskabeligt Synspunkt. Kjobenhavn: Boghandler C.G. Iversen 1849, 137-138.
9 Note, however, that butter is included in the "fats" category and not "milk products" throughoutthis paper.
29
Dow
nloa
ded
by [
The
Nat
iona
l Uni
vers
ity a
nd L
ibra
ry]
at 0
2:00
21
June
201
2

Scandinavian Economic History Review
products affects only slightly their overall nutritive content. Other foodstuffs ofimportance, i.e. mutton, cereals, dried fish and suet, show greater variation between households. 10
The prominence of fish, meat, butter and suet made the Icelandic diet rich inproteins and fat, whereas the carbohydrate content was small, as cereals and potatoes were scarce. Apart from the lack of fibre-rich foods in the form of grainsand vegetables, vitamin C seems to have been the most serious deficiency in thediet. It does not, therefore, come as a surprise that scurvy was presumably themost common deficiency disease, especially by the seaside, in the West Fjords andWest Iceland. 11 Rickets were also reported in the eighteenth and nineteenth centuries.F
The use of food supply datafor historical analysis
It is difficult to draw hard and fast conclusions about the radical changes in theIcelandic diet over the last two centuries because of the lack of quantitative information. In order to get a better grasp of the quantitative aspects of dietary change,I have compiled food supply data for the entire population of Iceland for the period 1770-1940. The food supply, which was basically composed of net importsof foodstuffs (imports less exports) and domestically produced foodstuffs, presentsthe total supply of foodstuffs available to the population and is therefore an important, albeit an indirect, measure of actual consumption. Estimating food consumption on the basis of food supply has its drawbacks, for there is always a discrepancy between available supply and actual consumption, and this approachtends to overestimate the level of consumption. This discrepancy is to some extent accounted for in the food supply data presented here, particularly for imports where quantities have been reduced by 3-5 per cent to allow for storageloss and waste, but also for milk. The figures on fish consumption are basicallyconsumption and not production figures.
There are two other factors of uncertainty in the food supply accounts that areworth mentioning here. First, when the food stock is converted into nutritionalelements modern food tables are used, which are based on techniques of foodpreparation, conservation and storage very different from those used in the past.By using the oldest available food tables, an attempt has been made to compensate somewhat for this deficiency. Secondly, the imperfection of the historicalmaterial often prevents the calculation of detailed and reliable measures of thefood supply. In the case of Iceland there is an additional problem caused by thefact that the bulk of the population was engaged in food production, for even aslate as 1940 a considerable part of the food production still took place within thehousehold economy. Because food production for own consumption was so widespread these important activities are less visible in the historical records than would
10 The weight of dried fish may be misleading ana its importance. As a rule of thumb. the factor of7.7 is used to convert dried fish into ungutted fresh fish.
11 Olafsson, Eggert, Ferdab6kEggetts 6/afssonaT og Bjarna PtflssonaT urn feTa beirraa lslandi aTin 17521757, I. Reykjavik: Om &1 Orlygur 1974, 263; lslandsleidangur Stan/eys 1789. Feraab6k. Reykjavik:Om &1 Orlygur 1979, 117; Jonsson, Heilsufar, 87-88.
12 Jonsson, Heilsufar, 88-89; Schleisner, Island, 143.
30
Dow
nloa
ded
by [
The
Nat
iona
l Uni
vers
ity a
nd L
ibra
ry]
at 0
2:00
21
June
201
2

Changes in Food Consumption in Iceland, 1770-1940
have been the case had market transactions been more prominent. Cases in pointare vegetable production around the country, animals slaughtered at home, andfishing by peasant or cottar households.
Despite all the drawbacks, the food supply data does provide fairly detailed and,in many ways, unique quantitative information on the consumption levels of allthe major foodstuffs in the whole of the country over a long period of time. Thusit offers the best possibility of analyzing the composition of the Icelandic dietand its nutritive contents in a long-term perspective, and of comparing it withthat of other nations. The principal sources are, on the one hand, official agricultural statistics and, on the other, external trade statistics. The construction of thefood supply data has greatly benefited from two research projects: Icelandic Historical Statistics," published recently by Statistics Iceland, where detailed and comparable statistics on foreign trade have been produced; and the other, the author'scurrent research on Iceland's national product for the period 1870-1945, in whichestimates are made for the production of important foodstuffs.
The foreign trade statistics provide us with figures on imported and exportedfood articles, stretching far back into the eighteenth century. Data within our period cover the years 1770, 1783-96, 1806, 1815-16, 1818-19, 1840, 1849, 1855and each year from 1862 onwards. The quantity figures for imports and exportsare reasonably accurate and comprehensive, especially on exports, but they mustbe regarded as a minimum, with higher margins of underrecording in imports ascompared to exports. The statistics include all articles of food and beverages, except alcoholic drinks. To allow for storage loss and wastage the trade statistics forthe quantities of vegetables, fruit and cereals have been reduced by 5 per cent andfor all other imported foodstuffs by 3 per cent.
Estimates for the consumption of domestically-produced foodstuffs are basedon the author's calculations for Icelandic agricultural production, including quantity and value data for all the major foodstuffs. As there are no official agricultural production records for most of the period, output has been indirectly measured by using livestock data and making certain assumptions about the quantities of foodstuffs produced per animal, based on various sources, the most important of which is a study on national income conducted under the auspices ofthe Icelandic Commission of Economic Planning in 1936. 14 Livestock data is available for many years in the period 1770-1817 and annually from 1818, which givesa breakdown of the main species of livestock: cattle, sheep and horses. Because ofa substantial underrecording of the sheep stock, especially during the latter halfof the nineteenth century, the figures have been increased by as much as onethird for a number of years during the 1880s.15 The estimation of production percow and ewe, a major determinant in the calculation of milk production, is basedon a close examination of the available sources, including the public records. Estimates of consumption figures derived from them are calculated in terms of thefour main products, fresh milk, butter, skyr and whey. The products have fixedweights which are changed in 1901 to reflect a shift in consumption from skyr
13 Hagskinna. Sogulegar hagtolur um Island (Icelandic Historical Statistics), Ed. by Cudmundur Jonsson and Magnus S. Magnusson. Reykjavik: Statistics Iceland 1997.
14 Alit og tillogur I. Reykjavik: Skipulagsnefnd atvinnumala 1936, 161-187.
IS Based on the author's reexamination of the livestock statistics and comparison with other sources, particularly the more reliable statistics on agricultural exports.
31
Dow
nloa
ded
by [
The
Nat
iona
l Uni
vers
ity a
nd L
ibra
ry]
at 0
2:00
21
June
201
2

Scandinavian Economic History Review
and whey to fresh milk, skimmed milk and cream." The weightings for skyr andwhey are probably too high towards the end of the period. The purpose behindbreaking milk down into its products is to give as good an indication as possibleof the actual consumption patterns of individual products, based on the available sources. However, it has very little effect on calculations of the nutritive valuewhether milk is calculated in terms of products other than fresh milk. Calculating the nutritive content of milk products entirely in terms of fresh milk wouldgive slightly higher energy values, some 3-4 per cent greater.
Where fish consumption is concerned, we are treading on more slippery ground.There are annual statistics of fish landings since 1897, and export statistics onfish sold to foreign markets, but they leave too many gaps to render them usefulin calculating the fish supply. Instead, I have made use of information on fishconsumption contained in the consumption surveys of 1939 and 1940, and thefood basket for the calculation of the consumer price index in 1922, which wasused until 1939. The 1922 figures have been extrapolated backwards, assuming acertain decline in fish consumption in the period 1870-1922. Consumption percapita is kept constant for the years 1770-1870, although account has been takenof the available information on seasonal fluctuations in the fish catch.
Estimates of domestically-produced foodstuffs have, to some extent, been adjusted to take into account various direct observations on food consumption, primarily the 1939-40 food survey and the food component in the consumer priceindex base from 1922. The figures presented here are calculated in terms of maleequivalents, a uniform unit signifying the consumption requirements of adult malesfor the purpose of eliminating the effects of different age and sex structures overtime." "Edible portion" tables, which exclude wastage, have been used in the calculation of nutrients.
Changes in food consumption, 1770-1940:the results of the food supply data
The main results from the food supply data are presented in Tables 3, 4 and 5.From Table 3 we can see the daily consumption of the principal food categoriesand the most important foodstuffs within each category per person (male equivalents) for the period 1770-1938. If we look at the consumption patterns beforethe middle of the nineteenth century, several interesting points emerge.
The first is the dominance of milk products, the table indicating the daily consumption of milk at 2-2.4 kg per person and as much as 2.9. kg in 1770. Fish wasanother staple, of which an average of 650-700 g was eaten daily, calculated interms of fresh fish, or the equivalent of 84-90 g of dried fish. The third mostimportant food was meat, especially mutton. Fruit and eggs" are interesting bytheir absence, and vegetables and sugar, although making an appearance, were
16 Ionsson, Heilsufar, 15-16.
17 The population is convened into consumption units by giving adult males between 15-64 yearsold the weight of 1.0, adult females between 15-64 years old 0.83, males and females 65 yearsand older 0.75, and children aged 0-15 0.6.
18 Seabirds' eggs were, of course, imponant in some areas. However, no estimates have been madeof eggs or seabirds in the food supply accounts. The breeding of hens for their eggs was very rareuntil this century.
32
Dow
nloa
ded
by [
The
Nat
iona
l Uni
vers
ity a
nd L
ibra
ry]
at 0
2:00
21
June
201
2

Ta
ble
3.
Su
pp
lyo
fp
rin
cip
al
foo
dstu
ffs
17
70
-19
38
0g/
day
per
mal
eeq
uiva
lent
.r OJ1
77
01
78
41
79
51
81
91
84
01
84
91
85
51
86
31
87
01
88
01
89
01
90
01
91
01
92
01
93
01
93
8::J co <lI
Fru
itsan
dbe
rrie
s(J
)
00
11
57
275
Egg
s0
11
312
18
::J
Fat
s8
45
673
83
7477
615
85
570
706
462
575
54
511
Bu
tte
r6
943
68
66
6268
60
514
55
247
39
2618
2019
0 0M
arga
rine
00
02
41
013
32
37Q
.
Fis
han
dfis
hp
rod
ucts
'7
06
65
06
18
65
47
03
69
46
96
68
45
89
51
54
40
431
44
54
47
40
73
69
0F
resh
fish
20
41
85
191
20
62
13
20
419
10 ::J
Sal
ted
fish
48
43
45
474
93
93
2(J
)
Drie
dF
ish
17c
121
08
77
83
Veg
etab
les
and
po
tato
es
03
33
04
951
6472
515
21
38
16
22
30
18
42
40
33
2D
Pot
atoe
s0
917
2327
2921
195
065
12
893
11
72
38
Pea
s0
03
313
1611
1719
1216
1412
75
43
::J
Mea
tan
dm
eat
pro
du
cts
201
15
32
37
251
25
427
42
32
19
51
90
20
22
16
18
920
11
99
24
71
98
::JM
utt
on
llam
b2
96
94
15
517
41
85
20
61
66
13
31
30
14
71
59
13
41
57
15
52
09
161
Cer
eals
811
39
7081
18
01
82
174
22
81
97
25
52
77
34
23
63
39
04
04
35
80 <lI
Rye
/rye
mea
l71
99
54
69
14
91
39
11
81
54
13
41
60
15
417
41
75
19
61
52
14
8- OJ
Whe
at0
01
11
427
49
691
12
14
914
1::J
Milk
pro
du
cts
32
90
61
66
22
44
02
32
12
03
82
17
71
981
17
68
14
87
16
60
14
96
14
38
12
85
10
82
12
80
145
1Q
.
Fre
shm
ilk1
261
68
59
67
90
67
60
801
73
86
85
55
46
03
54
46
06
674
59
77
23
82
8
Sug
aran
dsy
rup
00
14
812
111
21
83
25
477
93
12
31
45
--J
--J
0N
otes
:F
igur
esfo
r1
78
4an
d1
86
3-1
93
8sh
owth
ree-
year
aver
ages
.I
1F
resh
fish
equi
vale
nts.
(()
w2
Incl
udin
gof
fal.
~w
3B
utt
er
isin
clud
edin
the
""F
ats
""ca
tego
ry."
0
Dow
nloa
ded
by [
The
Nat
iona
l Uni
vers
ity a
nd L
ibra
ry]
at 0
2:00
21
June
201
2

\J.)
Ta
ble
4.
So
urc
es
of
en
erg
yb
yfo
od
ca
teg
ori
es
17
70
-19
38
(J)
*"0 III :J
per
cent
ofto
tal
ener
gyva
lue
Q.
18
49
19
20
--1
77
01
78
41
79
51
81
91
84
01
85
51
86
31
87
01
88
01
89
01
90
01
91
01
93
01
93
8:::J III < --
Tot
al1
00
10
01
00
10
01
00
10
01
00
10
01
00
10
01
00
10
01
00
10
01
00
10
0III :::J
Fru
itsan
db
err
ies
00
00
00
01
0m
Drin
ks0
00
0a
a0
00
00
00
00
00 0
Egg
s0
00
00
1:::J
Fat
s22
1821
2219
1916
1517
1818
1514
1416
160 3
Fis
h10
1310
1010
910
1010
86
66
64
4--
Veg
etab
les
and
po
tato
es
01
02
22
33
22
33
43
34
0
Mea
t11
1115
1615
1615
1213
1213
1011
1011
9I
Cer
eals
1023
1021
2027
3032
Ul
921
2737
3739
3532
r+
Milk
pro
du
cts
48
3540
3233
270
4433
3128
2322
1918
1719
--,
'<S
ug
ar
and
syru
p0
00
01
21
22
47
810
1214
::0 (1) <
Do
me
stic
foo
dst
uff
s9
0,4
76,5
90
,588
,176
,877
,674
,96
9,2
68
,96
5,4
61
,85
4,2
50
,64
4,3
44
,44
6,0
(1)
~Im
po
rte
dfo
od
stu
ffs
9,6
23,5
9,5
11,9
23,2
22,4
25,1
30
,831
,13
4,6
38
,24
5,8
49
,455
,75
5,6
54
,0
Of
anim
alor
igin
90
,476
,59
0,5
87,8
76,3
77,0
74,1
68
,46
8,2
64
,960
,15
2,4
48
,04
4,3
43,7
42
,4
Ofv
eg
eta
ble
orig
in9,
62
3,5
9,5
12,2
23,7
23
,025
,93
1,6
31
,835
,13
9,9
47,6
52
,055
,75
6,3
57,6
Not
e:1
78
4an
d1
86
3-1
93
8sh
owth
ree-
year
aver
ages
.
Dow
nloa
ded
by [
The
Nat
iona
l Uni
vers
ity a
nd L
ibra
ry]
at 0
2:00
21
June
201
2

Changes in Food Consumption in Iceland, 1770-1940
Figure 1. Energy value in the diet, 1770-1940kcal per day
o 0C') '<ten en
oC"<IenT'""
o....en
ooen
oenOJ
o 0l:'- coco co
o<0co
ooo8J
o 0 0 0 0~ C"l C') '<t LOco co co co co
o 0
o
oo
000co en 0l:'- l:'- co
4000
3500
3000
2500
2000
1500
1000
500
00l:'-e-
kcal
4500 fl----------------------.,
only consumed in small quantities. The consumption of cereals was modest, around70-80 g a day in a normal year until the second quarter of the nineteenth century. It should be noted that the year 1784 was a freak year with low figures for allfoodstuffs except cereals, due to the enormous volcanic eruption in Lagagfgar inthe south-east in 1783-84, one of the most devastating eruptions ever known inthe country, which killed the larger part of the livestock. In this catastrophe, commonly referred to as the 'Famine of the Haze', about 20 per cent of the population died, primarily as a result of the reduction in livestock and, to a lesser extent,disease.
The food supply data not only supports the thesis that the Icelandic diet underwent a radical change during the nineteenth century, but also offers a more precise indication of the timing, pace and structure of such change than has hithertobeen available. It shows that already in the first half of the century important dietary changes were taking place which became more pronounced as the centuryprogressed. The consumption of vegetables and potatoes increased rapidly, butmore important was an increase in the consumption of cereals, which more thandoubled between 1819 and 1840. After 1855 there was again a sharp upturn, presumably related to the setback in agriculture caused by a severe sheep disease,scab, which was raging in the period 1855-70. Cereal consumption continued toincrease steadily in the following decades, from about 180 g about the middle ofthe century to 340 g in 1900, and peaking in 1930 at a daily consumption ofmore than 400 g.
In the last two decades of the nineteenth century a broader-based change occurred as sugar and vegetable consumption (primarily potatoes and to lesser degree swedes and cabbage) rose to significant levels, while traditional foods likemilk, meat and fish declined, although the drop in the per capita consumption offish was partly offset by the growth of the fish-eating urban population. A more
35
Dow
nloa
ded
by [
The
Nat
iona
l Uni
vers
ity a
nd L
ibra
ry]
at 0
2:00
21
June
201
2

Scandinavian Economic History Review
varied consumption of cereals can be discerned from the increased imports of flour(to make white bread and cakes) and oatmeal (to make porridge and blood pudding). Fruit and berries, eggs and various vegetables made an appearance aboutthe tum of the century, but as their consumption levels were low their contribution to energy values was modest. There was a big drop in the consumption levelsof fruit and berries during the 1930s, presumably due to the combined effect oflower incomes and higher import tariffs. After slowly increasing during most ofthe nineteenth century, sugar consumption increased by leaps and bounds after1870, reaching one of the highest consumption levels in Europe towards the endof the period of 145 g a day per person.
It is worth noting the absence of potatoes in the diet, which stands in contrastto many countries in northern Europe. Although known and even grown amonga few "progressive" farmers in the eighteenth century the potato first started tomake real inroads in the decades about 1850 in some parts of the country. It thenspread rapidly after 1880, so that by the end of the period the daily consumptionwas around 240 g a day.
The importance of individual food categories can be better assessed when welook at their contribution to the energy value, as shown in Table 4. Milk productscontributed no less than 40-50 per cent of energy value well into the nineteenthcentury. Fats, i.e. butter and suet, took second place, providing about 20 per centof the energy value, followed by meat with 11-16 per cent and fish and cerealswith 10 per cent. As the nineteenth century progressed the share of cereals steadily increased; by 1840 they occupied second place after milk products. An historicturning point was reached in the last decades of the century when cereals replacedmilk products as the principal source of food, accounting for more than a thirdof the energy intake by 1900, and remaining at that level for several decades withbut a slight drop during the very last years of the period. Milk products, on theother hand, dropped to less than one-fifth of the total energy intake. Other traditional foodstuffs followed the same trend, although their relative decline was notas dramatic as that of the milk products.
The overall change in the Icelandic diet can be characterized as a transition fromalmost exclusively animal-based foodstuffs to more vegetable-based ones. Table4 shows that animal-based foods accounted for about 90 per cent of energy valuein the traditional diet. After 1819 their share rapidly declined, to amount to only52 per cent by the turn of the century, and continuing to decline to comprise only42 per cent in 1938. Conversely, the share of vegetable-based foods rose steeplyand had reached 50 per cent by 1910. As most foodstuffs of animal origin weredomestically produced and most foodstuffs of vegetable origin were imported wefind almost identical figures in the breakdown between domestic and importedfoodstuffs, as also shown in Table 4. About 90 per cent of all foodstuffs were produced in the country, confirming Iceland's high degree of self-sufficiency in theprovision of food. Imported foodstuffs gained increasing significance over the nineteenth century, so much so that after 1910 the country reached the stage wheremore than half of all the food consumed by its inhabitants was imported. Thiswas certainly a turning point in a country in where food production had such acentral role in the economy.
As Table 5 demonstrates, the combined results of these changes led to a majorshift in the balance of energy nutrients from the early nineteenth century to 1938.The share of proteins in total energy value declined from 31 per cent to 17 per cent
36
Dow
nloa
ded
by [
The
Nat
iona
l Uni
vers
ity a
nd L
ibra
ry]
at 0
2:00
21
June
201
2

Changes in Food Consumption in Iceland, 1770-1940
Table 5. Energy value and energy nutrients in the diet, 1770-1938
male equivalents
Year
17701784
179518191840184918551863
18701880
189019001910192019301938
Energyvalue,
kcal.
3.0482.3222.724
2.8873.0803.3812.9172.8852.5733.0023.106
3.3163.4993.6104.2074.066
Protein
30,829,731,029,728,1
27,828,827,426,824,222,120,519,1
18,117,1
17,0
% Energy value from:Fat
44,037,844,945,840,040,437,034,535,535,735,131,031,230,3
33,332,0
Carbohydrate
25,232,524,124,531,931,834,238,237,740,142,848,549,651,649,6
51,0
Note: The figures for 1784 and 1863-1938 are three-year averages.
and fat from 44 per cent to 32 per cent, while the share of carbohydrates doubledfrom 25 per cent to 51 per cent. If we take a closer look at the nutritive content ofthe traditional diet until the late nineteenth century, the high proportion of proteinis not surprising given the dependence on fish, meat and milk. Fat, almost exclusively animal fat, was the prime contributor of energy, providing around 45 percent of the energy value. This extremely large share is explained by the high consumption levels of butter and suet, especially as complements to fish, as alreadymentioned. Carbohydrates contributed only about a quarter of the energy value until1840, but by the end of the period their share had reached 50 per cent.
Table 5 also gives figures for total energy value, calculated as three-year averages. According to the food supply data, the daily energy intake was just over 3,000kcal for male adults in 1770, a level not reached again until 1840. The data clearly reflects the hardships during the 'Famine of the Haze' in 1783-85, when theenergy intake dropped below 1700 kcal. From then on the trend moves erraticallyupwards from 2,500-3,000 kcal in the first half of the nineteenth century to around4,000 kcal at the end of the period. There are interesting troughs in the years 185570, at the end of the First World War, and again in the 1930s, which correspondwell with the setbacks in the economy at those times.
37
Dow
nloa
ded
by [
The
Nat
iona
l Uni
vers
ity a
nd L
ibra
ry]
at 0
2:00
21
June
201
2

Scandinavian Economic History Review
Comparisons with other sources
How do the findings from the food supply data compare with other statistics onfood consumption in Iceland during the period under investigation? The foodconsumption survey of 1939-40, the first of its kind in Iceland, is the only directmeasurement of consumption levels available, but the study of the diet at the Leprosary in Reykjavik between 1899-1912, and the food basket used in constructing the cost of living index from 1922 onwards, are also useful reference points."Consumption levels of a number of important foodstuffs according to the foodsupply data were compared with the findings of these three sources.
The estimates of fish consumption are in fact derived from the survey of 193940 and the food basket of 1922, so we do not find discrepancies there. The foodsupply figures on the consumption levels for other domestically-produced foodstuffs, which are mainly based on the author's study of agricultural output, areslightly higher than those of the other sources (1899-1912, 1922 and 1939-40).In the case of milk a word of caution is needed, however, because the food supplydata gives considerably higher figures in all instances. As for imported foodstuffs,the figures show no systematic pattern of discrepancy. Sugar consumption is verysimilar in 1899-1912 and 1922, while the 1939-40 survey shows more than 50per cent lower sugar consumption than the food supply data, a discrepancy whichcan partly be explained by the unusually large imports encouraged by the government under the imminent danger of war in 1939.
J6n Steffensen's article from 1950 is one of the very few attempts to estimatethe energy intake and the nutritive content of the Icelandic diet in the past. Hisestimates, which offer a fairly rough reckoning, of the energy value, are much higherthan the figures presented here, showing a daily intake of 4,300 kcal until themiddle of the nineteenth century, with a steady drop to 3,500 kcal in 1940. Thefood supply data, however, casts serious doubts on the validity of Ion Steffensen'sfigures, and shows an opposite trend of upwards movement. But his figures onthe composition of the diet are more in line with the findings of the food supplydata and show similar trends, indicating a steady shift from milk products to cereals and sugar from the eighteenth century onwards, and especially between 1850and 1920. Between 1920 and 1940 the trend is reversed, as his figures indicate anincreasing consumption of milk products at the cost of cereals. According to J6nSteffensen milk products accounted for more than 60 per cent of Icelandic fare inthe early eighteenth century, maintaining about a 50 per cent level even as late asthe mid-nineteenth century, and then gradually falling to 24 per cent in 1920.
Bjorn L. Ionsson gives a similar account of dietary changes, but he dates theirbeginning later than the food supply data indicates, as do most writers. He makessome interesting observations about changes in the diet and its nutritional status.One is that the share of wheat flour among imported cereals became ever higher,replacing whole rye and barley with a consequent deterioration in vitamin levels.Like numerous other writers, Ionsson attaches great importance to the increasedimports of coffee, tobacco and sugar, which he viewes with dismay seeing them
19 Sigurjonsson, Julius, Matar~iJi og heil.sufar Ii fslandi. Rannsoknir Manneldisrads I, Reykjavik: Manneldisrad rikisins 1943. - The food budgets of the Leprosary in Reykjavik have been utilized bythe author of this paper to calculate the daily energy intake and the nutritive value of the diet of60-70 patients and staff at the hospital between 1899 and 1912. Summary figures are publishedin Hagskinna, 656. On the food basket in the cost of living index of 1922, cf. l>orsteinsson, l>orsteinn,VerClbreytingar siClustu ara, Tfmarit Iiigfr~iJinga og hagfr~iJinga I (1923), 64-66.
38
Dow
nloa
ded
by [
The
Nat
iona
l Uni
vers
ity a
nd L
ibra
ry]
at 0
2:00
21
June
201
2

Changes in Food Consumption in Iceland, 1770-1940
Figure 2. Relative price changes. 1784-1940Index of imported foodstuffs / index of domestic foodstuffs(1784=100)
1940192019001880
..
1840 1860
,'.
18201800
180 I I160
140
120
100
80
60
40
20
o I I I1780
as signs of a serious decline in the health status of the nation." He contendsthat, although the traditional diet may have been bleak and bare, it was morenutritious than many of the poor quality foodstuffs that had flooded the countryin recent times. This is a key argument in Bjorn L. Jonsson's overall conclusionthat the health status of Icelanders deteriorated during the preceding quarter of acentury.
Causes and effects of dietary change
The gradual retreat of the traditional diet during the first half of the nineteenthcentury was clearly linked with trade movements and changes in relative prices,changes which made grain-based foods more available and cheaper relative toanimal-based foods. This can be seen from Figure 2 which shows the developments in the relative prices of imported foodstuffs against the prices of domesticfoodstuffs." The Napoleonic Wars seriously disrupted Iceland's foreign trade andled to food shortages and sharp price rises. They were followed by a deflationaryperiod with a steeper fall in the prices of imported to domestic foodstuffs from1819 until about 1860. This trend was reversed for a decade or so, but after 1870the decline in relative import prices started again, until it levelled out and evenshowed a slight rise during the 1930s. In other words, cereals and sugar becamecheaper as compared to meat, fish and milk products. In terms of calories thegain of switching from animal-based to grain-based foods was much greater thanthe changes in relative prices indicate, as the latter type of food had a much higher calorific content.
Another factor in dietary change exerted a greater influence towards the end ofthe century, as the migration from country to town got underway and an ever-
20 Jonsson, 'Heilsufar' Similar findings, although more generally stated, are found in a collection ofessays by another phycisist, written in the 1920s and 1930s, see Kristjansson, Jonas, Ny jar leiJir:Fyrirlestrar og ritgerJir. Reykjavik: Natturulzekningafelag islands 1942, especially 14-41 and 140142.
21 The price index of imported foodstuffs was comprised of seven articles: rye, rye meal, pearl barley, rice, peas, flour and sugar. The index of domestic foodstuffs was comprised of six articles:butter, skyr, mutton, tallow, dried fish and salted cod. These were weighted indices with fixedweights.
39
Dow
nloa
ded
by [
The
Nat
iona
l Uni
vers
ity a
nd L
ibra
ry]
at 0
2:00
21
June
201
2

Scandinavian Economic History Review
larger part of the population was removed from the traditional means of living.People living in towns and villages increasingly turned to store-bought foods, inparticular cereals, sugar and margarine, which became the staples of workers inReykjavik and other towns. However, the growth of petty farming in and aroundtowns and villages, where people had a small stock of sheep and milking cowsand even vegetable gardens, somewhat lessened the reliance on marketed foodstuffs during the first decades of this century.
Consumption patterns are not explained by price levels alone; taste and habitsalso play an important role. The cases in point here include potatoes and herring,both of which were nourishing, cheap and fairly abundant foods, but which entered the Icelandic diet curiously late. According to the food supply data potatoeswere insignificant before the middle of the nineteenth century and even later, butby the turn of this century Icelanders were consuming daily some 65 g, and about240 gin 1938. The late appearance of herring in the diet is partly explained bythe fact that herring fishing first started in the second half of the nineteenth century; herring was only used as bait and fodder for cows, and later as an exportgood. Only slowly did Icelanders come to think of herring as food for humanconsumption. The food survey of 1939-40 indicates that herring still rarely appeared on the plates of Icelanders, a mere 2.8 g being eaten daily per male adultin the towns and 2.9 g in the rural areas.
The change in food habits raises interesting questions about their effects on nutrition in general and on population growth. Did the changes bring about an improvement or a deterioration in the nutritional quality of the diet? The answer,according to the food supply data, is that the Icelandic diet improved a great dealin terms of energy value, which increased, although somewhat erratically, overthe nineteenth century and especially after 1870. The supply data also shows thatthe diet became much more varied towards the end of the nineteenth century.These findings are in conflict with the descriptions given by many writers on dietary change in the middle of this century. Some writers, like Bjorn 1. Ionsson andJonas Krist[ansson, maintain that despite the fact that food became more abundant it was of poorer nutritional quality than before. And according to J6n Steffensen's estimate, even the total energy intake declined over this period. The lastcontention does not seem to hold up in the light of the evidence presented here.The question of food quality is a more complicated issue and needs to be lookedinto more closely. If we look at the balance of nutritional components in Table 5,a positive development seems to be taking place, as fats and proteins decreaseand carbohydrates, mainly from grains, are on the increase.
However, it must be stressed that national averages, such as those presented hereon the basis of the food supply data, hide important social and regional variations, both in the quantity and quality of the food consumed. Needless to say,the food supply data ignores such variations, and leaves therefore a substantialgap in our knowledge of the transition from traditional consumption patterns tomodern ones. When we turn our attention to the unequal distribution of food,especially as to how the increasing number of poor townspeople fared from thelast decades of the nineteenth century until the 1940s, the pessimistic interpretations of physicians in the 1930s and 1940s become more understandable. Theurban poor were certainly not winners in this transition; they were subject to undernourishment and more vulnerable to disease than other groups. Their monotonous diet consisted mainly of fish, ryebread, margarine, coffee and sugar, which
40
Dow
nloa
ded
by [
The
Nat
iona
l Uni
vers
ity a
nd L
ibra
ry]
at 0
2:00
21
June
201
2

Changes in Food Consumption in Iceland, 1770-1940
provided low-cost calories as compared to the higher quality milk and meat products. Only slowly did the diet of the poor start to improve, and probably not significantly until the Second World War, when there was a general improvement inliving standards in Iceland.
The relationship between dietary change and population growth is another areawhich needs to be explored further. Here we will just point out that the extremedependence on animal-based foods for centuries set tight limits to the size of thepopulation. The influx of relatively cheap grains during the nineteenth centuryupset the traditional balance between food supply and population, and paved theway for population expansion. From a demographic point of view, Iceland's foreign trade in foodstuffs is an exceptionally good example of a favourable exchangein calories, the replacement of expensive calories (fish and meat) by cheap calories (cereals, sugar and margarine), thus not only stimulating population growthbut also making it possible for more people to live outside the traditional, largelysubsistence, economy.
Conclusion
Icelandic food history is in many respects very different from that of continentalEurope. Traditionally, up to 90 per cent of the food was of animal origin, mostlymilk, fish, meat and suet, whereas cereals played a fairly insignificant part in thediet. The shift in Europe to a more grain-based diet which started in the sixteenthcentury seems to have had little effect in Iceland. However, when meat consumption started at long last to pick up again in Europe, as a result of better livingstandards and improvements in transportation in the second half of the nineteenthcentury, Icelanders moved slowly but steadily in the opposite direction, away fromthe traditional staples of milk, fish and meat towards cereals and sugar. The transition from animal-based foods to grain-based foods started in the first half ofthe nineteenth century and was well underway towards the end of the century. By1910 grain-based foods were providing more than half of the total energy value inthe Icelandic diet, which we can take as a turning point in the transition from ananimal-based to a vegetable-based diet.
41
Dow
nloa
ded
by [
The
Nat
iona
l Uni
vers
ity a
nd L
ibra
ry]
at 0
2:00
21
June
201
2