Experimental Crystallization of a High-K Arc Basalt: the Golden Pumice, Stromboli Volcano (Italy
27
Experimental Crystallization of a High-K Arc Basalt: the Golden Pumice, Stromboli Volcano (Italy) IDA DI CARLO 1 , MICHEL PICHAVANT 2 * , SILVIO G. ROTOLO 1 AND BRUNO SCAILLET 2 1 UNIVERSITA ´ DI PALERMO, DIPARTIMENTO DI CHIMICA E FISICA DELLA TERRA (CFTA), VIA ARCHIRAFI, 36, 90123 PALERMO, ITALY 2 INSTITUT DES SCIENCES DE LA TERRE D’ORLEANS, UMR 6113, 1A RUE DE LA FEROLLERIE, ORLEANS CEDEX 2, FRANCE RECEIVED JUNE 17, 2005; ACCEPTED FEBRUARY 22, 2006; ADVANCE ACCESS PUBLICATION MARCH 21, 2006 The near-liquidus crystallization of a high-K basalt (PST-9 golden pumice, 494 wt % SiO 2 ,185 wt % K 2 O, 796 wt % MgO) from the present-day activity of Stromboli (Aeolian Islands, Italy) has been experimentally investigated between 1050 and 1175 C, at pressures from 50 to 400 MPa, for melt H 2 O concentrations between 12 and 55 wt % and DNNO ranging from 007 to þ232. A drop-quench device was systematically used. AuPd alloys were used as containers in most cases, resulting in an average Fe loss of 13% for the 34 charges studied. Major crystallizing phases include clinopyroxene, olivine and plagioclase. Fe–Ti oxide was encountered in a few charges. Clinopyroxene is the liquidus phase at 400 MPa down to at least 200 MPa, followed by olivine and plagioclase. The compositions of all major phases and glass vary systematically with the proportion of crystals. Ca in clinopyroxene sensitively depends on the H 2 O concentration of the coexisting melt, and clinopyroxene Mg-number shows a weak negative correlation with DNNO. The experimental data allow the liquidus surface of PST-9 to be defined. When used in combination with melt inclusion data, a consistent set of pre-eruptive pressures (100–270 MPa), temperatures (1140–1160 C) and melt H 2 O concentrations is obtained. Near-liquidus phase equilibria and clinopyroxene Ca contents require melt H 2 O concentrations <27–36 and 3 1 wt %, respectively, overlapping with the maximum frequency of glass inclusion data (25–27 wt % H 2 O). For olivine to crystal- lize close to the liquidus, pressures close to 200 MPa are needed. Redox conditions around DNNO ¼þ05 are inferred from clino- pyroxene compositions. The determined pre-eruptive parameters refer to the storage region of golden pumice melts, which is located at a depth of around 75 km, within the metamorphic arc crust. Golden pumice melts ascending from their storage zone along an adiabat will not experience crystallization on their way to the surface. KEY WORDS: basalt; pumice; experiment; phase equilibria; Stromboli INTRODUCTION Knowledge of the physico-chemical conditions prevailing in magmas is a prerequisite for modelling igneous systems and volcanic eruptions. Possible approaches to reach this goal include: (1) geothermometry and geobarometry on phenocryst and cumulate assemblages from quenched eruption products (e.g. Luhr & Carmichael, 1980; Ghiorso & Sack, 1991; Lindsley & Frost, 1992; Salvioli- Mariani et al., 2002); (2) melt inclusion studies (e.g. Roggensack et al., 1997; Metrich et al., 2001; Wallace, 2005); (3) experimental simulations of crystal–liquid equi- libria (e.g. Johnson et al., 1994). During the past 20 years, experimental studies have increasingly been used to con- strain the pre-eruptive parameters (P, T, fO 2 , fS 2 , fH 2 O) of subvolcanic magma bodies (e.g. Rutherford et al., 1985; Martel et al., 1998; Scaillet & Evans, 1999; Costa et al., 2004). However, this approach has mainly concerned silicic to intermediate (i.e. rhyolitic–andesitic) systems, virtually excluding more mafic compositions. This situ- ation reflects the technical difficulties associated with the experimental crystallization of mafic melts in the pres- ence of volatiles (e.g. Sisson & Grove, 1993a). Added to *Corresponding author. E-mail: [email protected] Ó The Author 2006. Published by Oxford University Press. All rights reserved. For Permissions, please e-mail: journals.permissions@ oxfordjournals.org JOURNAL OF PETROLOGY VOLUME 47 NUMBER 7 PAGES 1317–1343 2006 doi:10.1093/petrology/egl011 by guest on January 7, 2014 http://petrology.oxfordjournals.org/ Downloaded from
-
Upload
independent -
Category
Documents
-
view
3 -
download
0
Transcript of Experimental Crystallization of a High-K Arc Basalt: the Golden Pumice, Stromboli Volcano (Italy
Experimental Crystallization of a High-KArc Basalt: the Golden Pumice, StromboliVolcano (Italy)
IDA DI CARLO1, MICHEL PICHAVANT2*, SILVIO G. ROTOLO1
AND BRUNO SCAILLET2
1UNIVERSITA DI PALERMO, DIPARTIMENTO DI CHIMICA E FISICA DELLA TERRA (CFTA),
VIA ARCHIRAFI, 36, 90123 PALERMO, ITALY
2INSTITUT DES SCIENCES DE LA TERRE D’ORLEANS, UMR 6113, 1A RUE DE LA FEROLLERIE,
ORLEANS CEDEX 2, FRANCE
RECEIVED JUNE 17, 2005; ACCEPTED FEBRUARY 22, 2006;ADVANCE ACCESS PUBLICATION MARCH 21, 2006
The near-liquidus crystallization of a high-K basalt (PST-9 golden
pumice, 49�4 wt % SiO2, 1�85 wt % K2O, 7�96 wt % MgO)
from the present-day activity of Stromboli (Aeolian Islands, Italy)
has been experimentally investigated between 1050 and 1175�C, atpressures from 50 to 400MPa, for melt H2O concentrations
between 1�2 and 5�5 wt % and DNNO ranging from �0�07 to
þ2�32. A drop-quench device was systematically used. AuPd alloys
were used as containers in most cases, resulting in an average Fe loss
of 13% for the 34 charges studied. Major crystallizing phases
include clinopyroxene, olivine and plagioclase. Fe–Ti oxide was
encountered in a few charges. Clinopyroxene is the liquidus phase
at 400MPa down to at least 200MPa, followed by olivine and
plagioclase. The compositions of all major phases and glass vary
systematically with the proportion of crystals. Ca in clinopyroxene
sensitively depends on the H2O concentration of the coexisting melt,
and clinopyroxene Mg-number shows a weak negative correlation
with DNNO. The experimental data allow the liquidus surface of
PST-9 to be defined. When used in combination with melt inclusion
data, a consistent set of pre-eruptive pressures (100–270MPa),
temperatures (1140–1160�C) and melt H2O concentrations is
obtained. Near-liquidus phase equilibria and clinopyroxene Ca
contents require melt H2O concentrations <2�7–3�6 and 3 �1 wt %, respectively, overlapping with the maximum frequency of
glass inclusion data (2�5–2�7 wt % H2O). For olivine to crystal-
lize close to the liquidus, pressures close to 200MPa are needed.
Redox conditions around DNNO ¼ þ0�5 are inferred from clino-
pyroxene compositions. The determined pre-eruptive parameters
refer to the storage region of golden pumice melts, which is located
at a depth of around 7�5 km, within the metamorphic arc crust.
Golden pumice melts ascending from their storage zone along an
adiabat will not experience crystallization on their way to the surface.
KEY WORDS: basalt; pumice; experiment; phase equilibria; Stromboli
INTRODUCTION
Knowledge of the physico-chemical conditions prevailingin magmas is a prerequisite for modelling igneous systemsand volcanic eruptions. Possible approaches to reach thisgoal include: (1) geothermometry and geobarometry onphenocryst and cumulate assemblages from quenchederuption products (e.g. Luhr & Carmichael, 1980;Ghiorso & Sack, 1991; Lindsley & Frost, 1992; Salvioli-Mariani et al., 2002); (2) melt inclusion studies (e.g.Roggensack et al., 1997; Metrich et al., 2001; Wallace,2005); (3) experimental simulations of crystal–liquid equi-libria (e.g. Johnson et al., 1994). During the past 20 years,experimental studies have increasingly been used to con-strain the pre-eruptive parameters (P, T, fO2, fS2, fH2O)of subvolcanic magma bodies (e.g. Rutherford et al., 1985;Martel et al., 1998; Scaillet & Evans, 1999; Costa et al.,2004). However, this approach has mainly concernedsilicic to intermediate (i.e. rhyolitic–andesitic) systems,virtually excluding more mafic compositions. This situ-ation reflects the technical difficulties associated with theexperimental crystallization of mafic melts in the pres-ence of volatiles (e.g. Sisson & Grove, 1993a). Added to
*Corresponding author. E-mail: [email protected]
� The Author 2006. Published by Oxford University Press. All
rights reserved. For Permissions, please e-mail: journals.permissions@
oxfordjournals.org
JOURNAL OF PETROLOGY VOLUME 47 NUMBER 7 PAGES 1317–1343 2006 doi:10.1093/petrology/egl011 by guest on January 7, 2014
http://petrology.oxfordjournals.org/D
ownloaded from

this are problems specific to mafic magmas, including thedefinition of liquid compositions and the possibility ofcomplex open-system polybaric crystallization histories(e.g. O’Hara, 1977). Despite these difficulties, there is aneed to apply the experimental approach to maficmagmas, in particular to complement data from meltinclusion studies. This study details the experimentalsimulation of near-liquidus crystal–liquid equilibria for ahigh-K basaltic melt from an active volcano, Stromboli(Aeolian Islands, Italy).
VOLCANOLOGICAL AND
PETROLOGICAL BACKGROUND
Stromboli, the northernmost volcano of the Aeolianarchipelago, southern Italy (Fig. 1), lies on 20 km thick
continental crust (Morelli et al., 1975). It was built duringthe last 200 kyr in six cycles of activity, separated fromeach other by caldera or flank collapses (Pasquare et al.,1993). Stromboli magmas typically show a trend of Kenrichment with time, from early erupted calc-alkaline,intermediate high-K calc-alkaline and shoshonites to lateK-rich products, the maximum K enrichment beingattained in the late K-series (13-6 ka BP). Productsyounger than 6 ka, including those emitted during pre-sent-day activity, are shoshonitic to high-K basalts(Francalanci et al., 2004). Coupled isotopic and elementalvariations suggest that the parental magmas originatefrom a metasomatized mantle source. These magmasfeed one or more crustal reservoirs in which they evolveby fractional crystallization, assimilation and mixing.These reservoirs, discontinuously refilled and tapped,
STROMBOLI
GINOSTRA
Fig. 1. Map of Stromboli island showing the summit craters (circles). The PST-9 starting material (star) comes from a trench dug near the summitof the volcano. The inset shows the location of Stromboli (star) within the Aeolian archipelago, and of Vesuvius and Etna volcanoes. The activesubduction plane and direction are also indicated.
1318
JOURNAL OF PETROLOGY VOLUME 47 NUMBER 7 JULY 2006 by guest on January 7, 2014
http://petrology.oxfordjournals.org/D
ownloaded from

provide the magmas associated with the present-dayactivity (Francalanci et al., 1989, 1993, 2004).Stromboli is famous for its persistent activity,
established 1400–1800 years ago (Rosi et al., 2000),which consists of intermittent low-energy explosions(3–6 events/h) throwing crystal-rich scoria, gas and ashto heights <150m above the summit vents. This steady-state activity, reflecting the equilibrium betweenemissions and magma supply from below, is periodicallyinterrupted by major explosions (Barberi et al., 1993;Speranza et al., 2004), which occur unpredictably0�5–3 times/year, and consist of much higher jets thannormal, resulting in fallout of meter-sized ballistic blocksand lapilli showers within a distance of several hundredsof meters from the craters upon the settled areas ofGinostra and Stromboli (Fig. 1). Eruptive paroxysms
represent the least frequent eruptive manifestations atStromboli (the last occurred in April 2003), but are alsothe most violent. They consist of fallout of bombs andlithic blocks (up to 10 tons) able to reach Ginostra andStromboli villages, showers of scoria, tephra accumula-tion, glowing avalanches and tsunamis (Barberi et al.,1993; Metrich et al., 2005). The distinctive feature ofmajor explosions and eruptive paroxysms is the eruptionof different products representing two different magmas:a highly vesicular pumice, yellowish in color (hereafterdesignated as golden pumice), and a black scoria. Thescoria, which is volumetrically far more abundant thanthe pumices, contains �50 vol. % phenocrysts (olivine,clinopyroxene, plagioclase), whereas the pumices are typ-ically crystal-poor (�10 vol. %, e.g. Metrich et al., 2001).These magma types are often intermingled at the hand-specimen scale and phenocrysts from the black scoriamay be found within the golden pumice.Despite their differences in crystal content, the black
scoria (BS) and golden pumice (GP) bulk-rock composi-tions are similar to each other (high-K shoshonitic basalt,Francalanci et al., 2004). Their olivine and clinopyroxenephenocrysts divide into two compositional groups. Thefirst group consists of crystals with relatively primitivecharacteristics (olivines with Fo >78 and up to 91, somecontaining Cr-spinel inclusions; diopsidic high-Cr, low-Ti clinopyroxenes with Mg-number up to 0�9, Metrichet al., 2001; Bertagnini et al., 2003; Francalanci et al.,2004). The second group includes olivines with Fo mostlybetween 68 and 74 and clinopyroxenes with Mg-numbermostly between 0�7 and 0�8. Compositions from the firstgroup tend to be associated with the GP and those fromthe second group with the BS (Metrich et al., 2001;Francalanci et al., 2004). Compositional gaps separatethe two groups, suggesting that two main olivine þclinopyroxene crystallization stages are recorded in pre-sent-day Stromboli magmas. In contrast, plagioclasecrystallization appears to be restricted to shallow levels(e.g. Francalanci et al., 2004). Plagioclase in BS shows a
large range of compositions, and is complexly zoned fromAn60 to An88. Calcic compositions (An75–90) are observedin growth zones surrounding plagioclase xenocrystsinherited from the BS magma and partially reacted inthe GP magma (Landi et al. (2004).Important insights on magmatic volatiles are given by
the study of olivine-hosted melt inclusions (MI). In goldenpumices, MI have elevated volatile concentrations(1�8–3�4% H2O, 707–1887 ppm CO2, 610–2500 ppmS, 980–2640 ppm Cl, 641–1364 ppm F; Metrich et al.,2001; Bertagnini et al., 2003). These volatile-rich inclu-sions yield minimum entrapment pressures of �350MPa(Bertagnini et al., 2003), when calculated using the solu-bility model for H2O–CO2 fluid mixtures of Papale(1999). In contrast, black scoria are characterized byvolatile-poor MI (e.g. H2O �0�2%), suggesting trappingof an extensively degassed melt at very low pressures.Phenocryst and MI data strongly suggest that the crys-
tal-rich scoria represents a shallow-level, degassed, crystalmush (the resident magma). This magma feeds lava flowssuch as those during the 2002–2003 eruption, and nor-mal Strombolian activity. The resident magma is period-ically injected with a volatile-rich, crystal-poor, magmaemitted as golden pumice during paroxysms and majorexplosions (e.g. Francalanci et al., 2004).
EXPERIMENTAL STRATEGY AND
STARTING MATERIAL
Near-liquidus crystal–liquid equilibria were experiment-ally determined to constrain the P–T–H2O–fO2 condi-tions of the golden pumice magma. Four experimentalvariables are considered: pressure, temperature, meltH2O content and fO2. Because minimum entrapmentpressures calculated from melt inclusion volatile contentscluster near 350MPa (Bertagnini et al., 2003), 400MPawas selected as the upper bound of the experimentalpressure range. The lower bound was set at 50MPa.Temperature was varied between 1050 and 1175�C.The effect of varying temperature on phase equilibriawas investigated systematically at 400MPa and that ofvarying pressure systematically at 1100�C. In mostexperiments (i.e. fixed P–T–fH2), charges with differentmelt H2O contents were run together to determine theeffect of H2O on phase equilibria. Oxygen fugacity wasnot systematically varied, but the experiments cover anfO2 range larger than 2 log units.Golden pumice sample PST-9 (Table 1) was selected as
the starting material. It is the same sample as used previ-ously in 1 atm continuous cooling experiments by Conteet al. (2004). PST-9 comes from a 10 cm thick layer erup-ted in the period AD 800–1600 (M. Pompilio, personalcommunication, 2001). This GP layer was found in atrench dug on the summit area of the volcano, at a height
1319
DI CARLO et al. CRYSTALLIZATION OF HIGH-K BASALT by guest on January 7, 2014
http://petrology.oxfordjournals.org/D
ownloaded from

of 795m above sea level (a.s.l.); the sample was kindlysupplied by Dr M. Pompilio (Fig. 1). PST-9 is stronglyvesicular (�60 vol. % vesicles) and slightly porphyritic(�11 vol. % crystals, within the range of other pumices),and its glassy groundmass is free of microlites. Modalproportions (vol. %, vesicle-free basis) are 89% glass,8% clinopyroxene, 1–2% olivine, 1–2% plagioclase.Mass-balance calculations (Albarede, 1995) using themajor element compositions of the bulk-rock and thephenocrysts (assumed homogeneous) are in good agree-ment with the point counting data for glass (91%), clin-opyroxene (8%) and olivine (1%). For plagioclase, aslightly negative proportion is obtained, consistent withthe very low abundance of plagioclase in the pumice.Metrich et al. (2001) found vol. % plagioclase � clino-pyroxene in other golden pumices, but noted that mostcrystals are in fact inherited from the crystal-rich residentBS magma and that golden pumice melts are nearlyaphyric.PST-9 is a K-basalt with 49�4 wt % SiO2 and 1�85 wt%
K2O (Table 1). TiO2 (0�79 wt %) is low, as expected for a
mafic arc melt, whereas CaO and CaO/Al2O3 are bothhigh (respectively 12�7 wt % and 0�81, Table 1). Althoughgolden pumices emitted over the last few centuries are allcompositionally very similar (e.g. Francalanci et al., 2004),PST-9 has the highest MgO (7�96 wt %), Cr, Ni andCaO/Al2O3. These geochemical characteristics indicatethat PST-9 is relatively primitive, although its Mg-number (0�64, calculated with FeOt) is low for a typicalprimary mantle melt. Rare earth element (REE)abundances are high for such a mafic rock (La ¼ 197 ·C1). REE patterns are light REE (LREE) enriched(LaN/YbN ¼ 15�3), with a slight negative Eu anomaly(Eu/Eu* ¼ 0�84).Clinopyroxenes in PST-9 have Mg-number (calculated
with FeOt) mostly between 0�7 and 0�8. One analyzedmicrophenocryst has an Mg-number of 0�89 and0�83 wt % Cr2O3 (Table 1), within the range of thediopsidic group (Francalanci et al., 2004). More evolvedcompositions, typical of crystals inherited from the BSmagma, were also found (Table 1, column 4) and corres-pond to xenocrysts incorporated in the GP melt during
Table 1: Composition of PST-9 golden pumice and starting glass, and of phenocrysts, xenocrysts and groundmass
Label PST-91 Glass2 (n ¼ 9)3 Cpx mph/r Cpx xe/r Ol ph/r Ol xe/c Plag xe Gdm (n ¼ 10)
SiO2 49.4 49.8(6)4 51.77 50.94 39.10 39.14 48.8 49.6 (5)
TiO2 0.79 0.80(6) 0.27 0.70 0.00 0.00 0.00 0.84 (5)
Al2O3 15.75 15.0(3) 3.38 2.63 0.03 0.03 31.66 17.2 (2)
Fe2O3 1.3 n.d. n.d. n.d. n.d. n.d. n.d. n.d.
FeO 6.5 7.76(33) 3.54 9.48 11.92 21.89 0.85 7.10 (20)
MnO 0.15 0.10(9) 0.03 0.41 0.29 0.28 0.00 0.09 (5)
MgO 7.96 8.06(11) 16.56 14.52 47.61 38.90 0.08 6.41 (11)
CaO 12.73 12.1(3) 22.27 19.74 0.20 0.38 14.92 11.4 (2)
Na2O 2.27 2.32(9) 0.26 0.33 0.00 0.00 2.36 2.58 (7)
K2O 1.85 1.84(7) 0.00 0.00 0.00 0.00 0.38 2.07 (8)
P2O5 0.43 0.62(6) n.d. n.d. n.d. n.d. n.d. n.d.
Cr2O3 —— 0.02(5) 0.83 0.09 0.01 0.00 0.05 0.03 (4)
NiO —— 0.02(3) n.d. n.d. 0.04 0.18 0.05 0.02 (4)
Total 99.1 98.5 98.91 98.84 99.20 100.80 99.07 97.3
Wo 46 42 Fo 88 76 An 76
En 48 43 Fa 12 24 Ab 22
Fs 6 15 Or 2
1Whole-rock analysis. The other values are electron microprobe data. Major elements (wt %) analysed by inductivelycoupled plasma atomic emission spectrometry (ICP-AES); total includes LOI ¼ 0.62 wt %; trace elements analysed byICP-mass spectrometry (ICP-MS) (Cr 259 ppm; Ni 75 ppm; Ba 920 ppm; La 45 ppm; Eu 2.0 ppm; Lu 0.3 ppm). Analysisperformed at the Centre de Recherches Petrographiques et Geochimiques (CRPG, Nancy, France).2PST-9 glass.3Number of electron microprobe analyses.4One standard deviation in terms of least unit cited.Cpx, clinopyroxene; Ol, olivine; Plag, plagioclase; Gdm, groundmass; mph, microphenocryst; ph, phenocryst; xe,xenocryst; r, rim; c, core. Cpx and Ol xenocrysts are identified from their composition (Metrich et al., 2001; Bertagnini et al.,2003). Plag is entirely xenocrystic (Landi et al., 2004). Xenocrysts are crystals from the crystal-rich resident black scoria (BS)magma incorporated and partially reacted in the golden pumice (GP) melt during eruption.
1320
JOURNAL OF PETROLOGY VOLUME 47 NUMBER 7 JULY 2006 by guest on January 7, 2014
http://petrology.oxfordjournals.org/D
ownloaded from

eruption. Olivines show complex zoning patterns, withrims in the range Fo85–88 and cores in the range Fo70–84(Table 1). Compositions with Fo <78–80 (Table 1, col-umn 6) probably correspond to xenocrysts (Metrich et al.,2001). Scanning electron microscope (SEM) observationsreveal olivine crystals crowded with melt inclusions(e.g. Metrich et al., 2001; Bertagnini et al., 2003), someof which have crystallized to Al-rich clinopyroxene, aK-rich phase (probably a mica) and sulphides. Plagioclasecrystals often show sieve textures and thin (<15mm)skeletal rims, and are all considered as xenocrysts derivedfrom the crystal-rich BS magma (Landi et al., 2004).They have compositions between An70 and An80, withvalues up to An86 (Table 1). Apatite and Ti-magnetite(13–21�5 wt % TiO2, 63�5–77 wt % FeO, 4�5–6�5 wt %Al2O3, 3�5–5 wt % MgO, 0�5–2�3 wt % Cr2O3)were found as inclusions in clinopyroxene. The glassygroundmass is homogeneous with 49�6 wt % SiO2,2�07 wt % K2O, 6�41 wt % MgO and CaO/Al2O3 ¼0�66 (Table 1).
EXPERIMENTAL METHODS
Charges and equipment
PST-9 pumice was first ground in an agate mortar to�50 mm, then fused in air at 1400�C, 1 atm in aPt crucible. Two cycles of melting of 2–4 h each (withgrinding between them) were performed, yielding ahomogeneous glass whose composition was checked byelectron microprobe (Tables 1, 4 and 5). The glass wasthen crushed to �10–50 mm and stored in an oven.About 30mg of glass powder was loaded in eitherAu90Pd10 or Au70Pd30 capsules (15mm length, 2�5mminternal diameter, 0�2mm wall thickness), depending onthe experimental temperature. Ag70Pd30 tubing was alsoused in a few cases. Variable quantities (0�6–2ml) ofdistilled water were introduced with a microsyringe atthe bottom of the capsule before adding the glass powder.Capsules were sealed by arc welding, keeping them in aliquid nitrogen bath to prevent water loss. They werethen put in an oven for several hours and reweighed tocheck for leaks.All experiments were carried out in the same internally
heated pressure vessel, working vertically and pressurizedwith Ar–H2 mixtures obtained by sequential loading ofH2 and Ar at room temperature (Scaillet et al., 1992).Most experiments were performed with an initial H2
pressure of 1 bar. Experimental fH2 was measuredusing Ni–Pd–O sensors (see below). Total pressure wasrecorded by a transducer calibrated against a Heise Bour-don tube gauge (uncertainty �20 bars). A double-wind-ing molybdenum furnace was used, allowing near-isothermal conditions in the 2–3 cm long hotspot (gradi-ent <2–3�C/cm). Temperature was measured using
three thermocouples (either type S or K) and recordedcontinuously (uncertainty �5�C). Overall, the run dura-tion range was 5–25�5 h, but except for run 4 (5 h), theothers lasted for an average of 18 h.A drop-quench technique, modified after Roux &
Lefevre (1992), was systematically used. Experimentalcapsules (up to a maximum of six) plus the fH2 sensorcapsule were placed together in a thin alumina tube thatserved as a sample holder. The alumina tube was hung inthe furnace hotspot by a thin (0�2mm) Pt wire. At the endof the experiment, the Pt wire was fused electrically,allowing the sample holder to fall into the cold part ofthe vessel. With this device, nearly isobaric quench ratesof �100�C/s were achieved. Dropping of the sampleholder causes the cold bottom gas to heat, and a success-ful quench is indicated by a peak of several tens of bars onthe pressure readout. When the quench was unsuccessful,the vessel was opened, and the experiment was restartedand run for a few additional hours before quenching wasattempted again. Only runs quenched with this techniqueare reported in Tables 2 and 3.At the end of the experiment, capsules were weighed to
check for leaks and then opened. For each PST-9 capsule,fragments of the run product were mounted in epoxy andpolished for SEM observations and electron microprobeanalyses. Some capsules were also prepared for deter-mination of their Fe concentration by electron micro-probe. Glass chips from supra-liquidus charges wereselected for H2O determination by Karl-Fisher titration(KFT). The metallic pellets in the sensor capsule wererecovered, mounted in epoxy and then analyzed byelectron microprobe.
Control of redox conditions
Each run included a Ni–Pd–O sensor capsule, whichserved to determine fH2. These consisted of two pelletsof NiPd metal mixtures (each with different Ni/Pd ratio)plus NiO, placed in either a Pt or a AuPd capsule in thepresence of excess H2O (Taylor et al., 1992). Analysis ofthe composition of the metallic phase after the experi-ment allows the fO2 of the sensor system to be determ-ined (Pownceby & O’Neill, 1994). The fH2 of the sensor(and by inference that of the experiment, as fH2 is ident-ical for all capsules) is then obtained from the waterdissociation equilibrium, using the fO2 determinedabove, the dissociation constant of water (Robie et al.,1979) and the fugacity of pure water at the experimentalP and T (Ferry & Baumgartner, 1987; Holloway, 1987;Papale, 1997). Tables 2 and 3 list sensor compositions(mole fraction of Ni in the metallic phase, XNi) and thecorresponding fH2 for each experiment.For a given experiment (i.e. constant P–T–fH2), the fO2
of each charge is not constant but varies along with aH2O(or fH2O). The latter was determined for each charge
1321
DI CARLO et al. CRYSTALLIZATION OF HIGH-K BASALT by guest on January 7, 2014
http://petrology.oxfordjournals.org/D
ownloaded from

from the H2O content of the quenched glass, using thethermodynamic model for H2O solution in multicom-ponent melts of Burnham (1979). The oxygen fugacityof each charge is then calculated from the water dissoci-ation equilibrium, using the fH2 and fH2O determined
above, and the dissociation constant of water (Robie et al.,1979). Typical uncertainty on log fO2 is <0�25 log units(e.g. Scaillet et al., 1995; Martel et al., 1999; Scaillet &Evans, 1999; Costa et al., 2004). In this study, fO2 valuesare expressed as deviations from the NNO (nickel–nickel
Table 2: Experimental results at 400MPa
Charge H2O melt (wt %) aH2O1 log fO2 DNNO Phase2 assemblage SR2 DFeO3(%) Kd cpx�liq
Fe�Mg Kd ol�liqFe�Mg Kd plag�liq
Ca�Na
Run 4, 1175�C, 416.8MPa, 5 h, fH2 ¼ 0.305MPa, XNi ¼ 0.18, Au70Pd304
4-1 4.65 0.65 �6.03 1.92 gl(100) 1.84 �8.40
4-2 3.25 0.42 �6.41 1.54 gl(100) 2.33 �12.10
4-3 2.8 0.32 �6.64 1.30 gl(93) þ cpx(7) 1.59 �15.20 0.36/0.41
Run 3, 1150�C, 406.8MPa, 14 h; fH2 ¼ 0.199MPa, XNi ¼ 0.14, Au70Pd30
3-1 5.15 0.72 �5.93 2.32 gl (100) 7.12 �24.10
Run 14, 1150�C, 405.0MPa, 19 h, fH2 ¼ 0.465MPa, XNi ¼ 0.24, Au70Pd30
14-16 2.5 0.25 �7.59 0.66 gl(n.d.) þ cpx(n.d.) n.d. n.d. 0.43/0.33
14-26 2.0 0.18 �7.87 0.38 gl(n.d.) þ cpx(n.d.) n.d. n.d. 0.53/0.41
Run 21, 1150�C, 400.0MPa, 21 h, fH2 ¼ 0.594MPa, XNi ¼ 0.27, Ag70Pd30
21-4 2.6 0.30 �7.65 0.60 gl(88) þ cpx(12) 2.37 �17.70 0.45/0.46
Run 5, 1125�C, 402.8MPa, 15 h, fH2 ¼ 0.677MPa, XNi ¼ 0.30, Au70Pd30
5-1 5.5 0.77 �7.29 1.26 gl(100) 4.85 �21.60
5-2 4.1 0.55 �7.58 0.86 gl(100) 6.33 �23.50
5-3 3.9 0.46 �7.74 0.81 gl(87) þ cpx(13) 5.91 �29.40 0.35/0.34
Run 6, 1100�C, 404.3MPa, 17 h, fH2 ¼ 0.903MPa, XNi ¼ 0.36, Au70Pd30
6-1 4.3 0.55 �8.19 0.68 gl(91) þ cpx(9) 4.01 �23.80 0.29/0.34
6-4 2.6 0.23 �8.94 �0.07 gl(70) þ cpx(27) þ ol(3) 4.02 �23.10 0.40/0.39 0.42/0.34
Run 10, 1100�C, 399.4MPa, 21 h, fH2 ¼ 0.109MPa, XNi ¼ 0.10, Au90Pd10
10-1 3.5 0.37 �6.86 2.01 gl(74) þ cpx(26) þ ox(tr) 0.63 �7.30 0.39/0.36
10-2 2.2 0.20 �7.24 1.63 gl(47) þ cpx(40) þ ol(3) þ plg(11) 0.90 �9.60 0.48/0.32 0.37/0.25 1.68
þ ox(tr)
Run 7, 1075�C, 408.2MPa, 16.5 h, fH2 ¼ 0.557MPa, XNi ¼ 0.29, Au70Pd30
7-1 5.2 0.62 �8.03 1.17 gl(80) þ cpx(20) þ qu 3.18 �18.30 0.44/0.33
7-2 5.0 0.57 �8.10 1.10 gl(80) þ cpx(17) þ ol(3) þ qu 2.27 �15.60 0.22/0.28 0.36/0.26
7-3 3.3 0.33 �8.57 0.62 gl(74) þ cpx(24) þ ol(2) þ qu 2.41 �17.60 0.41/0.24 0.46/0.31
7-4 2.9 0.26 �8.78 0.41 gl(70) þ cpx(27) þ ol(3) 2.97 �19.70 0.36/0.37 0.42/0.33
Run 11, 1050�C; 393.1MPa, 16 h, fH2 ¼ 0.469MPa, XNi ¼ 0.27, Au90Pd10
11-7 2.7 0.21 �9.24 0.30 gl(50) þ cpx(35) þ ol(4) þ plg (11) 0.19 �3.70 0.30/0.27 0.34/0.26 2.42
11-4 2.5 0.18 �9.37 0.16 gl(47) þ cpx(36) þ ol(4) þ plg(13) 1.09 �10.2 0.29/0.25 0.34/0.27 2.15
1aH2O calculated from H2O melt using the model of Burnham (1979) and melt compositions from Table 4; XNi is molefraction of Ni in the alloy phase of the sensor; log fO2 calculated from experimental fH2 and fH2O (determined from aH2O);DNNO ¼ log fO2 � log fO2 of the NNO buffer calculated at P and T (Pownceby & O’Neill, 1994); n.d., not determined; tr: atrace of (phase proportion <1% by weight).2Phase proportions calculated by mass balance; gl, glass; cpx, clinopyroxene; ol, olivine; plag, plagioclase; ox, Fe�Ti oxide;qu, quench crystals detected by SEM.3Apparent loss or gain of FeO (Fe ¼ FeOt) calculated as 100 · (FeOcalc � FeOstarting sample)/FeOstarting sample. FeOcalc and SR2
are obtained from the mass-balance calculations.4Capsule material.5H2O analyzed by Karl-Fischer titration. For the other charges, H2O analyzed with the by-difference method.6Starting material is PST-9 þ 10 wt % FeO. Mass-balance calculations were not performed.Kd cpx�liqFe�Mg ¼ (Fe/Mg in cpx)/(Fe/Mg in melt), Kd ol�liq
Fe�Mg¼ (Fe/Mg in ol)/(Fe/Mg in melt), Kd plag�liqCa�Na ¼ (Ca/Na in plag)/(Ca/Na
in melt). For cpx�liq and ol�liq, the first Kd is calculated with FeO ¼ FeO and the second with FeO ¼ FeOt (see text).
1322
JOURNAL OF PETROLOGY VOLUME 47 NUMBER 7 JULY 2006 by guest on January 7, 2014
http://petrology.oxfordjournals.org/D
ownloaded from
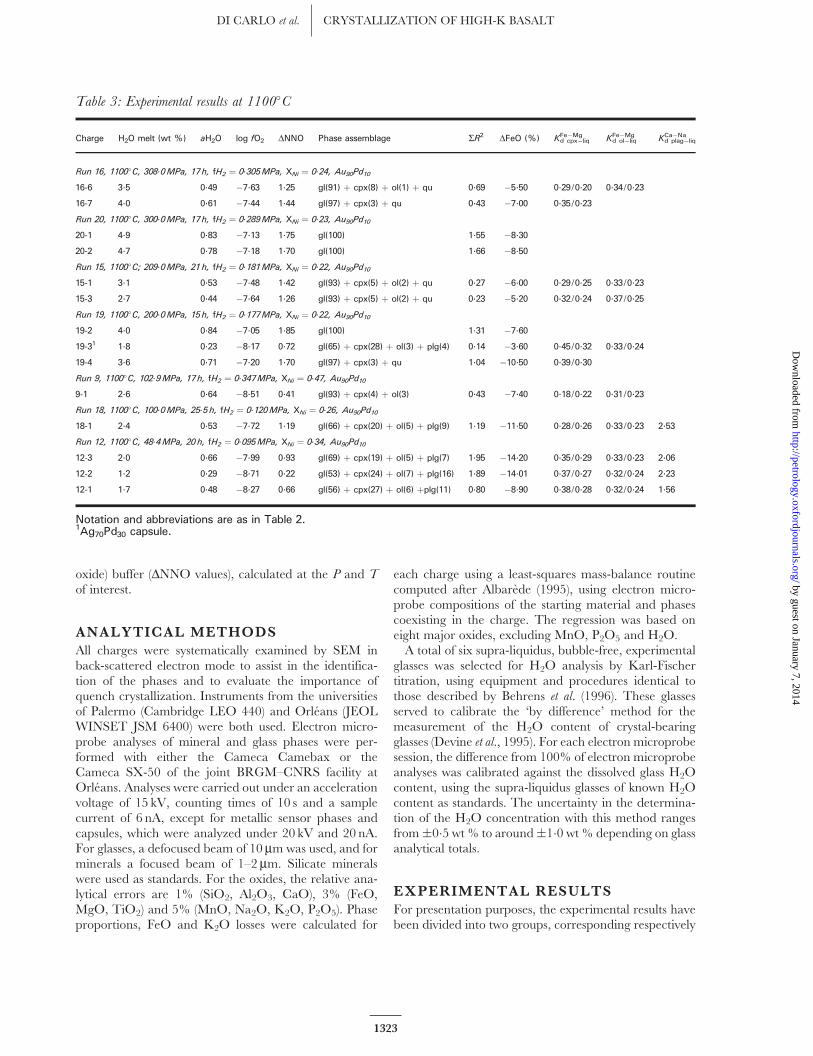
oxide) buffer (DNNO values), calculated at the P and T
of interest.
ANALYTICAL METHODS
All charges were systematically examined by SEM inback-scattered electron mode to assist in the identifica-tion of the phases and to evaluate the importance ofquench crystallization. Instruments from the universitiesof Palermo (Cambridge LEO 440) and Orleans (JEOLWINSET JSM 6400) were both used. Electron micro-probe analyses of mineral and glass phases were per-formed with either the Cameca Camebax or theCameca SX-50 of the joint BRGM–CNRS facility atOrleans. Analyses were carried out under an accelerationvoltage of 15 kV, counting times of 10 s and a samplecurrent of 6 nA, except for metallic sensor phases andcapsules, which were analyzed under 20 kV and 20 nA.For glasses, a defocused beam of 10mm was used, and forminerals a focused beam of 1–2 mm. Silicate mineralswere used as standards. For the oxides, the relative ana-lytical errors are 1% (SiO2, Al2O3, CaO), 3% (FeO,MgO, TiO2) and 5% (MnO, Na2O, K2O, P2O5). Phaseproportions, FeO and K2O losses were calculated for
each charge using a least-squares mass-balance routinecomputed after Albarede (1995), using electron micro-probe compositions of the starting material and phasescoexisting in the charge. The regression was based oneight major oxides, excluding MnO, P2O5 and H2O.A total of six supra-liquidus, bubble-free, experimental
glasses was selected for H2O analysis by Karl-Fischertitration, using equipment and procedures identical tothose described by Behrens et al. (1996). These glassesserved to calibrate the ‘by difference’ method for themeasurement of the H2O content of crystal-bearingglasses (Devine et al., 1995). For each electron microprobesession, the difference from 100% of electron microprobeanalyses was calibrated against the dissolved glass H2Ocontent, using the supra-liquidus glasses of known H2Ocontent as standards. The uncertainty in the determina-tion of the H2O concentration with this method rangesfrom�0�5 wt % to around�1�0 wt % depending on glassanalytical totals.
EXPERIMENTAL RESULTS
For presentation purposes, the experimental results havebeen divided into two groups, corresponding respectively
Table 3: Experimental results at 1100�C
Charge H2O melt (wt %) aH2O log fO2 DNNO Phase assemblage SR2 DFeO (%) Kd cpx�liqFe�Mg Kd ol�liq
Fe�Mg Kd plag�liqCa�Na
Run 16, 1100�C, 308.0MPa, 17 h, fH2 ¼ 0.305MPa, XNi ¼ 0.24, Au90Pd10
16-6 3.5 0.49 �7.63 1.25 gl(91) þ cpx(8) þ ol(1) þ qu 0.69 �5.50 0.29/0.20 0.34/0.23
16-7 4.0 0.61 �7.44 1.44 gl(97) þ cpx(3) þ qu 0.43 �7.00 0.35/0.23
Run 20, 1100�C, 300.0MPa, 17 h, fH2 ¼ 0.289MPa, XNi ¼ 0.23, Au90Pd10
20-1 4.9 0.83 �7.13 1.75 gl(100) 1.55 �8.30
20-2 4.7 0.78 �7.18 1.70 gl(100) 1.66 �8.50
Run 15, 1100�C; 209.0MPa, 21 h, fH2 ¼ 0.181MPa, XNi ¼ 0.22, Au90Pd10
15-1 3.1 0.53 �7.48 1.42 gl(93) þ cpx(5) þ ol(2) þ qu 0.27 �6.00 0.29/0.25 0.33/0.23
15-3 2.7 0.44 �7.64 1.26 gl(93) þ cpx(5) þ ol(2) þ qu 0.23 �5.20 0.32/0.24 0.37/0.25
Run 19, 1100�C, 200.0MPa, 15 h, fH2 ¼ 0.177MPa, XNi ¼ 0.22, Au90Pd10
19-2 4.0 0.84 �7.05 1.85 gl(100) 1.31 �7.60
19-31 1.8 0.23 �8.17 0.72 gl(65) þ cpx(28) þ ol(3) þ plg(4) 0.14 �3.60 0.45/0.32 0.33/0.24
19-4 3.6 0.71 �7.20 1.70 gl(97) þ cpx(3) þ qu 1.04 �10.50 0.39/0.30
Run 9, 1100�C, 102.9MPa, 17 h, fH2 ¼ 0.347MPa, XNi ¼ 0.47, Au90Pd10
9-1 2.6 0.64 �8.51 0.41 gl(93) þ cpx(4) þ ol(3) 0.43 �7.40 0.18/0.22 0.31/0.23
Run 18, 1100�C, 100.0MPa, 25.5 h, fH2 ¼ 0.120MPa, XNi ¼ 0.26, Au90Pd10
18-1 2.4 0.53 �7.72 1.19 gl(66) þ cpx(20) þ ol(5) þ plg(9) 1.19 �11.50 0.28/0.26 0.33/0.23 2.53
Run 12, 1100�C, 48.4MPa, 20 h, fH2 ¼ 0.095MPa, XNi ¼ 0.34, Au90Pd10
12-3 2.0 0.66 �7.99 0.93 gl(69) þ cpx(19) þ ol(5) þ plg(7) 1.95 �14.20 0.35/0.29 0.33/0.23 2.06
12-2 1.2 0.29 �8.71 0.22 gl(53) þ cpx(24) þ ol(7) þ plg(16) 1.89 �14.01 0.37/0.27 0.32/0.24 2.23
12-1 1.7 0.48 �8.27 0.66 gl(56) þ cpx(27) þ ol(6) þplg(11) 0.80 �8.90 0.38/0.28 0.32/0.24 1.56
Notation and abbreviations are as in Table 2.1Ag70Pd30 capsule.
1323
DI CARLO et al. CRYSTALLIZATION OF HIGH-K BASALT by guest on January 7, 2014
http://petrology.oxfordjournals.org/D
ownloaded from

to the 400MPa isobaric and the 1100�C isothermalsections. For each group, experimental conditions andresults are detailed in Tables 2 and 3, and experimentalcompositions in Tables 4 and 5, respectively. In total,16 experiments corresponding to 34 charges arereported.
Evaluation of quench crystallizationand Fe loss
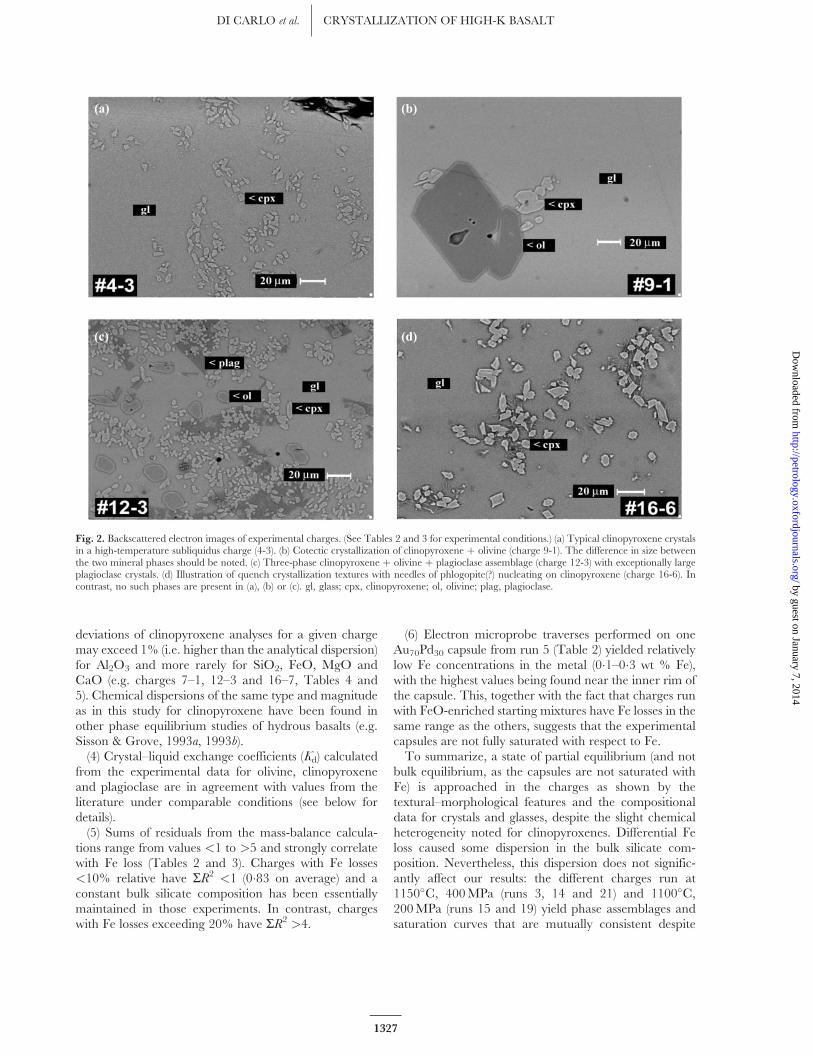
Stable phases encountered include clinopyroxene, oliv-ine, plagioclase and an oxide phase, found in one charge(10-2) and possibly in another (10-1, Table 2). Whenpresent, clinopyroxene is relatively small in size(�10–20mm, Fig. 2a and b). It may form clusters thatmimic the shape of larger crystals. Olivines are large(�30mm), with tabular to equant habits (Fig. 2b). Plagio-clase is tabular, usually very thin (�5mm) and difficult toanalyse by microprobe (it could not be analyzed in charge19-3). Large plagioclase crystals (60–120mm in length)were encountered only at 50MPa (charge 12-3, Fig. 2c).Despite the use of the rapid-quench device, quench
phases were detected by SEM in eight charges out ofthe 34 reported (Tables 2 and 3). Quench crystallizationis marked in SEM images by the appearance of very thinneedles that heterogeneously nucleate on clinopyroxene(Fig. 2d). Quench crystallization is correlated with, andcan be evaluated from, K2O loss calculated by massbalance. This indicates that the dominant quench phaseis most probably phlogopite, consistent with its abund-ance in preliminary experiments performed with relat-ively slow quench rates. In charges 16-7, 16-6, 15-1, 15-3and 19-4, all with quench phases detected by SEM(Fig. 2d; Tables 2 and 3), K2O losses are small(i.e. <10% relative), indicating no significant influenceof quench crystallization on phase compositions. Thehighest K2O losses were found in run 7. K2O loss is upto 36% relative in charge 7-1, decreasing regularly withthe melt H2O content from charge 7-1 to 7-3, no quenchphase being found in charge 7-4 (Table 2). Charges 7-1and 7-2 are the only ones for which quench crystallizationhas a detectable influence on glass composition. Fe–Mgcrystal–liquid exchange coefficients (Kd) in charges fromrun 7 and in those quenched without apparent problems(Tables 2 and 3) are in the same range. Overall, thisindicates that quench crystallization has a minor influ-ence in this study.The importance of Fe loss was evaluated from the
mass-balance calculations (Tables 2 and 3). FeO loss is13% on average. Half of the charges have Fe losses�10% relative, six have Fe losses >20% and one has>25% loss. In general, the smallest Fe losses are associ-ated with Au90Pd10 and the highest with Au70Pd30 cap-sules. However, fO2 also has a detectable influence, Felosses becoming higher for lower DNNO. Fe losses in the
same range as in this study were found previously withAuPd alloys (Kawamoto & Hirose, 1994; Gaetani &Grove, 1998; Pichavant et al., 2002b), and this confirmsthat Fe loss can be minimized, but not suppressed, withAuPd tubing. Fe losses in Ag70Pd30 capsules (charges 19-3and 21-4, Tables 2 and 3) are similar to those in AuPdcapsules for the same experimental conditions (charges19-2 and 3-1, Tables 2 and 3). Pre-saturating the capsuleswith Fe was not attempted in this study because fO2
varies between charges for a given experiment (fH2 isthe buffered parameter, not fO2). In addition, pre-calcu-lating the fO2 of a given charge is difficult, as this dependson the melt H2O content, a variable that does not relatedirectly to the amount of water loaded in the capsulewhen crystals are present. Therefore, capsule Fe pre-saturation was considered impractical. As a substitute,some experiments were performed with FeO-enrichedstarting mixtures (i.e. PST-9 glass þ about 10% FeO) totest for the influence of variable bulk FeO (run 14,Table 2). Results are consistent with other charges at1150�C, 400MPa (charges 3–1 and 21–4, the latter runwith Ag70Pd30 tubing) in terms of phase assemblages andlocation of the saturation curves.
Evaluation of equilibrium
All the experiments from this study are of the crystalliza-tion type and attainment of equilibrium has not beentested from reversals. Nevertheless, several lines of evid-ence can be used to evaluate the approach to equilibrium.(1) Experimental durations (18 h on average, except for
one run of 5 h) are in the range of previous phase equi-librium studies on hydrous basalts (Sisson & Grove,1993b; Barclay & Carmichael, 2004). Baker & Eggler(1987) found that 24 h was sufficient for phase assemblageand melt composition to reach a steady state at 1060�C,1 atm for a mafic andesite composition. Bartels et al.(1991) obtained reproducible phase assemblages andproportions after 6 h in near-liquidus anhydrous experi-ments on a partially crystalline high-alumina basalt at1280�C, 1�2GPa. Because crystallization kinetics aredramatically faster in the presence of H2O (quench crys-tallization is most important in charges that are the mostH2O-rich, e.g. charges 7-1 and 7-2), experimental dura-tions, as used in this study, were such that equilibriumproportions of crystals/phase assemblages should havebeen obtained.(2) Crystal morphologies (euhedral, equant or tabular)
suggest growth at small degrees of undercooling(e.g. Muncill & Lasaga, 1987). The distribution of crystalsin the charges is homogeneous and no crystal settlingwas recognized (Fig. 2). The difficulties encountered inquenching the charges (see above) can be taken asindications of easy crystal nucleation and growth in ourexperiments.
1324
JOURNAL OF PETROLOGY VOLUME 47 NUMBER 7 JULY 2006 by guest on January 7, 2014
http://petrology.oxfordjournals.org/D
ownloaded from

Table 4: Experimental compositions at 400MPa
Charge Phase SiO2 TiO2 Al2O3 FeO MnO MgO CaO Na2O K2O Cr2O3 NiO P2O5 Total Mol %
PST-9 gl1(9)2 50.6(6)3 0.81(6) 15.2(3) 7.88(33) 0.10(9) 8.19(11) 12.3(3) 2.36(9) 1.87(7) 0.02(5) 0.02(3) 0.63(6) 98.5
4-1 gl(8) 51.3(3) 0.86(8) 15.1(1) 7.58(24) 0.19(8) 7.73(7) 12.6(1) 2.21(7) 1.77(6) 0.07(7) 0.03(6) 0.63(5) 92.4
4-2 gl(9) 51.3(4) 0.87(5) 15.1(2) 7.28(33) 0.09(9) 7.79(13) 12.6(3) 2.32(9) 1.87(10) 0.04(5) 0.05(6) 0.66(5) 94.0
4-3 gl(5) 49.8(5) 0.73(7) 16.8(4) 7.16(36) 0.10(7) 7.99(12) 12.4(4) 2.40(3) 1.93(8) 0.05(6) 0.04(6) 0.60(8) 93.5
cpx(7) 48.9(12) 0.45(15) 5.38(66) 5.60(61) 0.12(9) 15.3(5) 21.9(4) 0.34(5) 0.09(4) 0.38(7) 0.05(6) n.d. 98.5 En47Wo48
3-1 gl(9) 52.0(6) 0.87(7) 15.2(2) 6.28(19) 0.16(9) 7.91(12) 12.7(2) 2.30(10) 1.87(6) 0.04(6) 0.02(4) 0.68(7) 91.4
14-1 gl(11) 52.1(2) 0.91(6) 17.5(2) 6.42(26) 0.16(11) 6.64(10) 11.2(3) 2.65(7) 2.31(9) 0.03(5) 0.07(6) n.d. 93.4
cpx(5) 51.3(8) 0.36(19) 3.63(60) 5.13(115) 0.13(7) 15.9(8) 21.1(3) 0.26(4) 0.05(2) 0.14(9) 0.03(3) n.d. 98.04 En47Wo45
14-2 gl(11) 52.8(3) 0.92(6) 18.1(2) 5.17(27) 0.16(5) 6.58(17) 11.2(2) 2.78(9) 2.29(13) 0.04(6) 0.01(4) n.d. 93.95
cpx(4) 52.1(10) 0.63(12) 6.33(126) 4.62(64) 0.07(8) 14.3(9) 19.8(10) 0.52(26) 0.33(27) 0.17(4) 0.07(11) n.d. 98.9 En46Wo46
21-4 gl(10) 51.9(3) 0.93(7) 16.2(2) 7.02(24) 0.13(8) 7.07(19) 11.5(3) 2.56(16) 2.00(6) 0.02(3) 0.02(3) 0.71(7) 95.1
cpx(13) 48.6(6) 0.67(12) 7.11(79) 6.43(75) 0.12(9) 14.0(5) 21.3(6) 0.47(9) 0.16(9) 0.28(11) 0.04(7) 0.35(9) 99.5 En44Wo48
5-1 gl(7) 50.9(7) 0.82(6) 16.2(2) 6.20(10) 0.07(5) 8.40(18) 12.6(2) 2.23(7) 1.90(9) 0.04(6) 0.01(3) 0.65(10) 90.6
5-2 gl(6) 51.0(5) 0.81(9) 16.0(2) 6.36(20) 0.07(5) 8.28(17) 12.6(1) 2.34(6) 1.85(5) 0.10(8) 0.02(4) 0.63(5) 90.9
5-3 gl(8) 51.2(7) 0.86(9) 17.9(2) 6.03(29) 0.12(10) 7.13(31) 11.3(3) 2.56(16) 2.13(14) 0.03(6) 0.01(2) 0.77(9) 92.4
cpx(7) 50.2(10) 0.57(15) 5.02(102) 4.50(74) 0.11(8) 15.6(7) 22.1(4) 0.28(6) 0.11(6) 0.30(18) 0.02(4) n.d. 98.84 En47Wo48
6-1 gl(9) 52.1(2) 0.85(6) 16.4(2) 6.63(27) 0.25(12) 7.08(17) 11.6(3) 2.46(12) 1.93(4) 0.04(6) 0.03(4) 0.66(10) 93.0
cpx(9) 50.6(18) 0.56(24) 4.60(158) 5.03(97) 0.13(9) 15.8(9) 22.8(7) 0.27(7) 0.06(7) 0.25(13) 0.09(10) n.d. 100.07 En46Wo48
6-4 gl(8) 52.7(4) 0.95(8) 18.9(3) 6.06(22) 0.18(6) 5.24(15) 9.62(22) 2.94(10) 2.53(9) 0.02(3) 0.03(3) 0.83(8) 95.2
cpx(6) 49.5(6) 0.79(8) 7.57(99) 6.52(50) 0.24(13) 14.4(4) 20.9(6) 0.54(22) 0.20(17) 0.11(8) 0.02(3) n.d. 100.75 En44Wo46
ol(5) 40.0(2) 0.03(3) 0.04(3) 17.4(6) 0.36(22) 44.10(3) 0.29(2) 0.03(3) 0.03(5) 0.04(5) 0.07(6) n.d. 102.4 Fo82
10-1 gl(10) 51.9(3) 0.87(11) 18.1(2) 8.05(34) 0.20(11) 5.70(22) 9.45(34) 2.73(16) 2.23(10) 0.03(4) 0.03(4) 0.78(7) 94.0
cpx(16) 48.0(7) 0.64(12) 6.53(70) 6.94(55) 0.13(10) 13.8(5) 21.5(6) 0.37(9) 0.10(11) 0.14(9) 0.05(7) 0.25(5) 98.5 En43Wo48
10-2 gl(11) 52.9(5) 1.06(8) 18.0(4) 8.12(35) 0.16(9) 4.34(49) 7.87(69) 3.26(15) 3.25(15) 0.01(1) 0.00(0) 1.03(10) 95.7
cpx(4) 48.8(5) 0.73(5) 8.05(81) 7.83(23) 0.19(7) 13.0(7) 17.8(9) 0.83(22) 0.51(29) 0.09(6) 0.00(0) n.d. 97.8 En43Wo42
ol(3) 38.5(2) 0.02(3) 0.12(11) 18.5(5) 0.28(5) 40.1(6) 0.26(11) 0.00(0) 0.02(2) 0.00(0) 0.00(0 n.d. 97.8 Fo79
plag(3) 50.3(3) 0.13(8) 29.1(104) 1.26(21) 0.00(0) 0.37(22) 13.3(9) 3.27(19) 0.79(26) 0.04(7) 0.06(10) n.d. 98.5 An66Or5
7-1 gl(8) 53.1(3) 0.92(7) 17.8(6) 7.26(33) 0.14(8) 5.91(30) 10.7(9) 2.50(14) 1.59(61) 0.02(3) 0.03(4) n.d. 90.3
cpx(7) 48.9(16) 0.84(31) 6.02(156) 5.99(156) 0.16(6) 14.6(8) 22.7(7) 0.28(6) 0.06(3) 0.15(11) 0.02(4) n.d. 99.7 En44Wo49
7-2 gl(7) 52.8(7) 0.89(7) 18.4(4) 7.26(35) 0.16(7) 5.64(64) 10.7(3) 2.61(7) 1.58(23) n.d. n.d. n.d. 90.3
cpx(5) 49.6(14) 0.62(10) 5.28(117) 5.52(111) 0.13(10) 15.2(9) 22.7(9) 0.33(12) 0.11(16) 0.17(3) 0.02(4) n.d. 99.7 En46Wo49
ol(6) 40.2(5) 0.01(2) 0.01(2) 15.3(8) 0.26(12) 45.4(5) 0.22(5) 0.01(2) 0.01(2) 0.05(6) 0.07(8) n.d. 101.6 Fo84
7-3 gl(8) 52.5(3) 0.94(7) 18.9(2) 6.90(54) 0.17(12) 5.56(24) 9.99(29) 2.80(16) 2.26(9) n.d. n.d. n.d. 92.8
cpx(5) 49.9(9) 0.71(14) 6.39(148) 6.37(63) 0.13(15) 14.9(7) 21.1(13) 0.43(25) 0.18(21) 0.09(6) 0.02(4) n.d. 100.24 En45Wo46
ol(7) 39.9(4) 0.01(1) 0.02(2) 17.2(9) 0.19(14) 44.2(4) 0.23(5) 0.02(3) 0.01(1) 0.02(3) 0.07(9) n.d. 101.8 Fo82
7-4 gl(8) 52.7(4) 0.97(5) 19.4(3) 6.48(36) 0.17(10) 5.25(15) 9.56(27) 2.95(13) 2.55(9) n.d. n.d. n.d. 93.24
cpx(6) 48.8(7) 0.83(11) 7.33(108) 6.44(69) 0.19(10) 14.2(7) 21.4(9) 0.47(20) 0.24(20) 0.10(7) 0.04(5) n.d. 99.9 En44Wo48
ol(3) 40.1(2) 0.01(2) 0.06(3) 17.6(6) 0.19(19) 43.8(1) 0.23(4) 0.01(1) 0.01(2) 0.03(4) 0.09(11) n.d. 102.1 Fo82
11-7 gl(8) 53.5(4) 1.01(7) 18.8(1) 8.33(26) 0.16(10) 3.78(15) 7.52(18) 3.46(12) 3.39(10) n.d. n.d. n.d. 93.5
cpx(5) 48.9(7) 0.86(10) 7.19(93) 8.21(55) 0.18(8) 13.7(4) 20.2(6) 0.50(7) 0.19(9) 0.05(8) 0.02(2) n.d. 100.0 En43Wo45
ol(3) 38.9(3) 0.00(0) 0.06(6) 22.2(2) 0.26(9) 38.3(1) 0.23(7) 0.03(1) 0.01(1) 0.00(0) 0.03(5) n.d. 100.0 Fo75
plag(3) 49.3(2) 0.11(6) 29.3(9) 1.62(28) 0.17(29) 0.65(22) 14.3(6) 2.73(21) 0.78(6) 0.00(0) 0.07(12) n.d. 99.1 An71Or5
11-4 gl(6) 54.1(9) 1.04(8) 19.5(106) 7.45(65) 0.17(3) 3.34(34) 7.50(81) 3.50(10) 3.41(25) n.d. n.d. n.d. 94.8
cpx(4) 50.1(8) 0.69(7) 6.24(30) 8.11(16) 0.20(14) 14.6(5) 19.7(100) 0.46(13) 0.17(14) 0.12(9) 0.01(2) n.d. 100.3 En44Wo43
ol(3) 38.8(3) 0.00(0) 0.03(3) 22.9(3) 0.34(3) 38.1(3) 0.22(12) 0.01(1) 0.01(1) 0.00(0) 0.12(10) n.d. 100.5 Fo75
plag(2) 49.7(7) 0.06(1) 29.4(5) 1.54(37) 0.12(15) 0.59(10) 13.7(1) 2.97(36) 0.82(2) 0.00(0) 0.01(1) n.d. 98.8 An68Or5
1Glass analyses normalized to 100% anhydrous, with all Fe as FeO. Unnormalized total is reported.2Number of microprobe analyses.3One standard deviation in terms of least unit cited.gl, glass; cpx, clinopyroxene; ol, olivine; plag, plagioclase; n.d., not determined. En ¼ 100 · at. Mg/(Mg þ Fe þ Ca);Wo ¼ 100 · at. Ca/(Mg þ Fe þ Ca) in pyroxene, calculated with Fe ¼ FeO; Fo ¼ 100 · at. Mg/(Mg þ Fe) in olivine,calculated with Fe ¼ FeOt; An ¼ 100 · at. Ca/(Ca þ Na þ K); Or ¼ 100 · at. K/(Ca þ Na þ K) in plagioclase. PST-9 glass isfrom Table 1.
1325
DI CARLO et al. CRYSTALLIZATION OF HIGH-K BASALT by guest on January 7, 2014
http://petrology.oxfordjournals.org/D
ownloaded from

(3) Crystals and glass phases are broadly chemicallyhomogeneous for a given charge. Electron microprobeanalyses for hydrous glasses, olivines and plagioclaseshave standard deviations in the same range as or lower
than analytical dispersions (Tables 4 and 5), suggestinghomogeneous compositions. For clinopyroxene, somechemical heterogeneity, mainly related to core–rimzonation, is apparent in some SEM images. Standard
Table 5: Experimental compositions at 1100�C
Charge Phase SiO2 TiO2 Al2O3 FeO MnO MgO CaO Na2O K2O Cr2O3 NiO P2O5 Total Mol %
PST-9 gl1(9)2 50.6(6)3 0.81(6) 15.2(3) 7.88(33) 0.10(9) 8.19(11) 12.3(3) 2.36(9) 1.87(7) 0.02(5) 0.02(3) 0.63(6) 98.5
16-6 gl(8) 51.6(2) 0.88(5) 16.5(2) 8.27(29) 0.19(8) 6.80(18) 11.6(2) 2.51(14) 1.66(27) 0.02(3) 0.03(3) n.d. 92.5
cpx(3) 53.7(7) 0.27(4) 2.54(50) 3.94(32) 0.04(7) 16.3(3) 23.8(4) 0.17(6) 0.11(3) 0.33(7) 0.10(10) n.d. 101.3 En46Wo48
ol(1) 41.31 0.00 0.01 12.7 0.13 45.12 0.23 0.00 0.00 0.00 0.01 n.d. 99.5 Fo86
16-7 gl(8) 51.0(9) 0.88(5) 15.6(3) 7.94(28) 0.17(5) 7.67(15) 12.3(3) 2.36(5) 1.96(9) 0.02(4) 0.05(6) n.d. 91.9
cpx(2) 53.5(10) 0.34(14) 2.75(108) 3.87(36) 0.10(14) 16.1(3) 23.6(1) 0.25(3) 0.01(2) 0.70(13) 0.10(14) n.d. 101.4 En46Wo48
20-1 gl(11) 50.7(7) 0.81(6) 16.0(2) 7.44(34) 0.20(11) 7.91(21) 12.4(2) 2.13(9) 1.73(14) 0.04(6) 0.04(6) 0.67(12) 91.6
20-2 gl(11) 50.5(6) 0.78(6) 16.0(3) 7.58(21) 0.17(8) 7.99(16) 12.3(2) 2.19(9) 1.75(8) 0.05(6) 0.03(4) 0.71(9) 91.7
15-1 gl(8) 50.6(2) 0.91(9) 16.1(28) 7.91(28) 0.21(7) 6.99(28) 12.1(3) 2.49(15) 1.98(8) 0.04(4) 0.03(5) 0.67(6) 92.8
cpx(2) 52.5(3) 0.40(2) 2.76(14) 4.58(22) 0.21(18) 16.5(6) 23.0(5) 0.20(0) 0.00(0) 0.24(4) 0.04(6) n.d. 100.4 En47Wo47
ol(5) 40.5(3) 0.05(3) 0.05(1) 12.3 (8) 0.18(9) 47.2(7) 0.29(4) 0.03(1) 0.00(0) 0.02(3) 0.06(4) n.d. 100.6 Fo87
15-3 gl(8) 50.9(2) 0.88(8) 16.2(2) 8.00(41) 0.19(5) 7.00(15) 12.3(2) 2.45(12) 1.95(8) 0.05(6) 0.08(8) n.d. 93.6
cpx(3) 53.2(2) 0.38(5) 2.98(24) 4.45(25) 0.03(4) 16.3(3) 23.6(2) 0.21(6) 0.07(1) 0.28(13) 0.04(6) n.d. 101.5 En46Wo48
ol(6) 40.5(6) 0.01(2) 0.02(2) 13.3(4) 0.28(7) 46.7(5) 0.30(3) 0.02(1) 0.01(1) 0.04(2) 0.10(7) n.d. 101.3 Fo86
19-2 gl(10) 51.2(1) 0.86 (2) 15.0(9) 7.66(14) 0.17(5) 7.98(8) 12.5(1) 2.32(5) 1.77(4) 0.05(4) 0.01(1) n.d. 94.5
19-3 gl(6) 51.3(4) 0.93(5) 17.5(2) 8.61(37) 0.10(6) 5.17(8) 9.77(25) 3.08(16) 2.68(9) 0.02(4) 0.08(6) 0.80(7) 95.0
cpx(2) 50.4(7) 0.72(2) 8.01(260) 7.00(21) 0.11(4) 13.0(24) 19.4(20) 0.78(39) 0.55(54) 0.13(15) 0.05(6) n.d. 100.3 En42Wo45
ol(4) 39.5(8) 0.01(2) 0.18(10) 17.1(5) 0.39(18) 43.4(6) 0.38(3) 0.07(5) 0.01(1) 0.01(2) 0.17(14) n.d. 101.5 Fo82
19-4 gl(9) 51.3(2) 0.85(2) 15.4(1) 7.63(25) 0.17(7) 7.52(9) 12.3(1) 2.40(8) 1.85(4) 0.04(3) 0.03(4) n.d. 95.0
cpx(5) 51.1(9) 0.48(12) 4.32(101) 4.74 (44) 0.10 (8) 15.6(8) 22.5(7) 0.30(10) 0.08(5) 0.52(21) 0.05(5) n.d. 99.9 En46Wo48
9-1 gl(17) 50.8(5) 0.87(5) 16.2(3) 7.78(26) 0.20(7) 6.81(9) 12.2(1) 2.40(11) 1.99(6) 0.05(4) 0.04(8) 0.69(3) 93.6
cpx(4) 51.0(11) 0.37(3) 2.93(62) 4.15(27) 0.14(6) 16.2(3) 23.1(3) 0.19(5) 0.03(4) 0.44(16) 0.07(8) n.d. 98.7 En47Wo49
ol(4) 40.0(3) 0.03(4) 0.02(4) 12.1(4) 0.22(10) 46.0(4) 0.35(5) 0.02(2) 0.02(2) 0.04(4) 0.02(4) n.d. 98.80 Fo87
18-1 gl(10) 53.0(2) 1.09(3) 17.1(2) 8.14(19) 0.18(6) 5.06(7) 9.72(9) 3.09(4) 2.63(3) 0.03(3) 0.02(2) n.d. 96.6
cpx(6) 49.8(6) 0.69(22) 4.94(108) 6.30(88) 0.19(8) 15.0(8) 21.5(8) 0.37(12) 0.15(13) 0.17(15) 0.07(15) n.d. 99.1 En45Wo47
ol(5) 40.6(9) 0.04(2) 0.24(31) 16.0(7) 0.30(11) 44.0(10) 0.43(8) 0.02(3) 0.01(1) 0.07(30) 0.03(8) n.d. 101.8 Fo83
plag(4) 48.3(3) 0.17(3) 30.1(3) 1.45(25) 0.03(5) 0.72(6) 15.8(2) 1.99(10) 0.49(6) 0.01(2) 0.07(6) n.d. 99.2 An79Or3
12-3 gl(9) 52.6(3) 1.07(8) 17.0(2) 7.89(21) 0.14(4) 5.03(9) 10.1(3) 2.87(7) 2.39(13) 0.01(1) 0.03(6) 0.88(11) 97.0
cpx(7) 49.5(8) 0.65(11) 5.04(175) 6.51(53) 0.13(6) 14.6(8) 20.9(6) 0.35(20) 0.15(17) 0.12(5) 0.06(7) n.d. 98.1 En44Wo45
ol(6) 39.5(5) 0.05(4) 0.04(4) 15.3(4) 0.26(7) 42.6(5) 0.44(9) 0.02(2) 0.02(2) 0.02(3) 0.02(4) n.d. 98.2 Fo83
plag(3) 47.1(3) 0.02(2) 30.6(5) 0.91(21) 0.02(4) 0.42(13) 16.6(5) 1.91(5) 0.23(6) 0.05(5) 0.02(3) 0.18(5) 98.1 An82Or1
12-2 gl(10) 53.2(3) 1.18(5) 16.5(2) 8.05(19) 0.20(10) 4.38(20) 8.99(21) 3.15(11) 3.31(8) 0.03(5) 0.10(9) 0.95(10) 96.0
cpx(7) 50.5(4) 0.77(10) 6.38(110) 6.87(53) 0.12(8) 13.8(10) 19.9 (11) 0.56(18) 0.40(28) 0.04(4) 0.05(11) 0.35(8) 99.7 En43Wo45
ol(3) 38.8(2) 0.06(5) 0.06(6) 17.7(1) 0.34(13) 40.6(2) 0.41(12) 0.02(3) 0.02(2) 0.01(1) 0.05(6) 0.32(2) 98.4 Fo80
plag(1) 49.2 0.31 27.0 1.54 0.00 1.72 15.5 2.44 0.58 0.03 0.07 0.31 98.73 An75Or3
12-1 gl(11) 52.3(3) 1.17(13) 17.4(7) 7.95(41) 0.21(16) 4.14(24) 9.66(43) 3.05(9) 3.06(32) 0.05(8) 0.00(0) 0.97(3) 95.3
cpx(3) 49.3(5) 0.76(22) 8.52(76) 6.62(107) 0.23(12) 12.4(4) 19.2(4) 0.76(5) 0.56(23) 0.10(11) 0.03(3) 0.34(14) 98.8 En42Wo46
ol(2) 39.5(5) 0.00(0) 0.22(10) 18.0(3) 0.38(1) 39.4(6) 0.63(25) 0.04(6) 0.03(0) 0.00(0) 0.10(8) n.d. 98.3 Fo80
plag(1) 49.7 0.19 25.3 1.68 0.00 1.64 14.1 2.85 0.60 0.00 0.00 0.28 96.3 An71Or4
1Glass analyses normalized to 100% anhydrous, with all Fe as FeO. Unnormalized total is reported.2Number of microprobe analyses.3One standard deviation in terms of least unit cited.gl, glass; cpx, clinopyroxene; ol, olivine; plag, plagioclase; n.d., not determined. En ¼ 100 · at. Mg/(Mg þ Fe þ Ca);Wo ¼ 100 · at. Ca/(Mg þ Fe þ Ca) in pyroxene, calculated with Fe ¼ FeO; Fo ¼ 100 · at. Mg/(Mg þ Fe) in olivine,calculated with Fe ¼ FeOt; An ¼ 100 · at. Ca/(Ca þ Na þ K); Or ¼ 100 · at. K/(Ca þ Na þ K) in plagioclase. PST-9 glass isfrom Table 1.
1326
JOURNAL OF PETROLOGY VOLUME 47 NUMBER 7 JULY 2006 by guest on January 7, 2014
http://petrology.oxfordjournals.org/D
ownloaded from
deviations of clinopyroxene analyses for a given chargemay exceed 1% (i.e. higher than the analytical dispersion)for Al2O3 and more rarely for SiO2, FeO, MgO andCaO (e.g. charges 7–1, 12–3 and 16–7, Tables 4 and5). Chemical dispersions of the same type and magnitudeas in this study for clinopyroxene have been found inother phase equilibrium studies of hydrous basalts (e.g.Sisson & Grove, 1993a, 1993b).(4) Crystal–liquid exchange coefficients (Kd) calculated
from the experimental data for olivine, clinopyroxeneand plagioclase are in agreement with values from theliterature under comparable conditions (see below fordetails).(5) Sums of residuals from the mass-balance calcula-
tions range from values <1 to >5 and strongly correlatewith Fe loss (Tables 2 and 3). Charges with Fe losses<10% relative have SR2 <1 (0�83 on average) and aconstant bulk silicate composition has been essentiallymaintained in those experiments. In contrast, chargeswith Fe losses exceeding 20% have SR2 >4.
(6) Electron microprobe traverses performed on oneAu70Pd30 capsule from run 5 (Table 2) yielded relativelylow Fe concentrations in the metal (0�1–0�3 wt % Fe),with the highest values being found near the inner rim ofthe capsule. This, together with the fact that charges runwith FeO-enriched starting mixtures have Fe losses in thesame range as the others, suggests that the experimentalcapsules are not fully saturated with respect to Fe.To summarize, a state of partial equilibrium (and not
bulk equilibrium, as the capsules are not saturated withFe) is approached in the charges as shown by thetextural–morphological features and the compositionaldata for crystals and glasses, despite the slight chemicalheterogeneity noted for clinopyroxenes. Differential Feloss caused some dispersion in the bulk silicate com-position. Nevertheless, this dispersion does not signific-antly affect our results: the different charges run at1150�C, 400MPa (runs 3, 14 and 21) and 1100�C,200MPa (runs 15 and 19) yield phase assemblages andsaturation curves that are mutually consistent despite
(a) (b)
(c) (d)
Fig. 2. Backscattered electron images of experimental charges. (See Tables 2 and 3 for experimental conditions.) (a) Typical clinopyroxene crystalsin a high-temperature subliquidus charge (4-3). (b) Cotectic crystallization of clinopyroxene þ olivine (charge 9-1). The difference in size betweenthe two mineral phases should be noted. (c) Three-phase clinopyroxene þ olivine þ plagioclase assemblage (charge 12-3) with exceptionally largeplagioclase crystals. (d) Illustration of quench crystallization textures with needles of phlogopite(?) nucleating on clinopyroxene (charge 16-6). Incontrast, no such phases are present in (a), (b) or (c). gl, glass; cpx, clinopyroxene; ol, olivine; plag, plagioclase.
1327
DI CARLO et al. CRYSTALLIZATION OF HIGH-K BASALT by guest on January 7, 2014
http://petrology.oxfordjournals.org/D
ownloaded from

variable Fe losses (Tables 2 and 3). We, therefore, con-clude that our experiments have reached a state of equi-librium sufficient to discuss the crystallization ofStromboli magmas.
400MPa isobaric phase equilibria
A total of 20 charges were run at 400MPa, covering thetemperature range 1050–1175�C at 25�C intervals.Their H2O contents range between 2�2 and 5�5 wt %and they have DNNO values between �0�07 and þ2�32.The 400MPa phase equilibria are represented in theT–melt H2O content diagram of Fig. 3. The H2Osaturation curve is constructed after Burnham (1979).Mineral saturation curves are drawn from the experi-mental data in Table 2. The two charges run with theFeO-added starting mixture (14-1 and 14-2) are reportedin Table 2, but they are not used in the construction ofthe phase diagram because their bulk composition differsstrongly from PST-9. Clinopyroxene is the first phase toappear on the liquidus, followed by olivine and thenplagioclase upon lowering either T or melt H2O content.At 1150�C, the liquidus is encountered for a melt H2Ocontent of about 3�3 wt %, and at 1100�C for about4�3 wt % H2O. Saturation curves have negative slopesin T–melt H2O space, as expected for anhydrous phases.They are progressively steeper in the order plagioclase >clinopyroxene > olivine, but the clinopyroxene satura-tion curve is poorly defined for H2O in melt >5 wt %.The diagram is characterized by a large primary clino-pyroxene stability field in the high-T, low-melt H2Ocontent region. Plagioclase is restricted to the low-T,low-melt H2O portion. At 1100�C, cotectic olivine þ
clinopyroxene crystallization occurs for melt H2O con-tents�3�5 wt %. For olivine to crystallize at temperaturesabove 1100�C, melt H2O contents <3 wt % would berequired at 400MPa. It should be noted that an oxidephase, too small to be analyzed by electron microprobe, ispresent in charge 10-2 at 1100�C. Because this oxidecould not be analyzed, it was not included in the mass-balance calculations for that charge. As, a consequence,the calculations reveal a TiO2 loss of 10% relative, sug-gesting that the missing phase is an Fe–Ti oxide. Incharge 10-1, no oxide was detected by SEM but mass-balance calculations also reveal a TiO2 loss of about 10%relative, which indicates that Fe–Ti oxide crystallizationalso probably occurred.Crystallinities range between zero (supra-liquidus
charges) and 53 wt % (Table 2). Clinopyroxene is by farthe most abundant mineral phase, followed by plagio-clase and olivine in decreasing abundance. The propor-tion of clinopyroxene reaches a maximum of 40 wt %,that of plagioclase 13 wt % and that of olivine 4 wt %.Both plagioclase and olivine crystallize in relatively con-stant amounts. Clinopyroxene:olivine weight ratios rangebetween 6 and 13, increasing with progressive crystalliza-tion, and clinopyroxene:plagioclase ratios are around 3(data in Table 2). Crystallization is marked mainly by anincrease in the proportion of clinopyroxene at theexpense of melt.
1100�C isothermal phase equilibria
At 1100�C, four pressures in addition to 400MPa wereinvestigated: 300, 200, 100 and 50MPa, correspondingto a total of 14 charges (Table 3). They cover a range of
1030
1050
1070
1090
1110
1130
1150
1170
1190
0.0 1.0 2.0 3.0 4.0 5.0 6.0 7.0 8.0
H2O melt (wt%)
Tem
pera
ture
(ºC
)
400 MPa
L+VL
L+cpx
L+cpx+ol
L+cpx+ol+plag
2σ
Fig. 3. Experimentally determined T–H2O in melt phase diagram for PST-9 golden pumice at 400MPa. Data are given in Table 2. The watersaturation curve is calculated from Burnham (1979). L, liquid; V, vapor; cpx, clinopyroxene; ol, olivine; plag, plagioclase.
1328
JOURNAL OF PETROLOGY VOLUME 47 NUMBER 7 JULY 2006 by guest on January 7, 2014
http://petrology.oxfordjournals.org/D
ownloaded from

melt H2O contents between 1�2 and 4�9 wt % andDNNO values between þ0�22 and 1�85. The 1100�Cphase equilibria are portrayed in the P–melt H2O con-tent diagram of Fig. 4, where the H2O saturation curve isfrom Burnham (1979). Mineral saturation curves areconstructed from the data in Table 3, and from Table 2for 400MPa. Clinopyroxene is the liquidus phase for thethree highest pressures investigated (400, 300, 200MPa).With progressive crystallization (i.e. upon lowering meltH2O content under isobaric conditions), clinopyroxene isjoined by olivine and then plagioclase. One critical aspectof the diagram is the positive slope of the clinopyroxenesaturation curve (Fig. 4). In comparison, the slopes of thesaturation curves for olivine and plagioclase are nearlyvertical or slightly negative. This results in the shrinkageof the clinopyroxene primary field and in the reduction ofthe crystallization interval with decreasing pressure. At200MPa, the cotectic olivine þ clinopyroxene assem-blage is close to the liquidus. The available experimentaldata suggest that the clinopyroxene and olivine saturationcurves may cross below 200MPa, as drawn in Fig. 4.Thus, olivine could replace clinopyroxene on the liquidusfrom �150MPa down to the saturation pressure for3�5 wt % H2O in the melt (about 100MPa, Fig. 4).Plagioclase crystallization is restricted to melt H2Ocontents <2�5 wt %. Only four-phase assemblages(clinopyroxene þ olivine þ plagioclase þ L) were foundat 50MPa.As expected from the change in phase relations, there
are substantial variations in crystallinities with pressure.For charges having similar melt H2O contents, crystallin-ities slightly decrease with decreasing pressure (e.g. from
53 wt % at 400MPa to 31 wt % at 50MPa, charges 10-2and 12-1, Tables 2 and 3). Clinopyroxene becomesless abundant at lower pressures whereas olivine andplagioclase become more abundant. At 100 and50MPa, clinopyroxene:olivine and clinopyroxene:pla-gioclase weight ratios are 3–5 and 1�5–3 (respectively6–13 and 3 at 400MPa).
Experimental compositions
Experimental compositions are reported in full (Tables 4and 5) for all charges in Tables 2 and 3, but compositionsfrom charges 14-1 and 14-2 (FeO-added experiments) areexcluded from the following discussion as their bulk com-position differs strongly from PST-9. Clinopyroxenes arediopsides to augites with Wo contents ranging between42 and 49%, Fs between 4 and 15% and En between41 and 47% (Tables 4 and 5). They have low TiO2
(0�27–0�86 wt %), and variable and relatively elevatedAl2O3 (2�54–8�52 wt %) and Cr2O3 (0�04–0�70 wt %).Mg-number (calculated with FeOt) is in the range0�75–0�88. The average clinopyroxene–liquid exchangecoefficient (Kd cpx–liq
Fe–Mg ) is 0�31 � 0�06 when calculated withFeO¼ FeOt, and 0�35� 0�07 when calculated with FeO.In this latter case, the clinopyroxene FeO is determinedfrom the structural formulae and the glass FeO from theexpression of Kress & Carmichael (1991), using the datain Tables 2–5. These average Kd values are similar tothose found in recent experimental studies of hydrousbasaltic compositions at P <500MPa (0�23–0�27, Sisson& Grove, 1993a; 0�28, Pichavant et al., 2002a). It shouldbe noted that all clinopyroxene-bearing charges from
0
50
100
150
200
250
300
350
400
450
0.0 1.0 2.0 3.0 4.0 5.0 6.0 7.0 8.0
H2O melt (wt%)
Pres
sure
(MPa
)
L+V
L
L+cpx
L+cpx+ol
L+cpx+ol+plag
L+ol
2σ
1100 °C
Fig. 4. Experimentally determined P–H2O in melt phase diagram for PST-9 golden pumice at 1100�C. Data are given in Table 3. The watersaturation curve is calculated from Burnham (1979). Abbreviations are as in Fig. 3.
1329
DI CARLO et al. CRYSTALLIZATION OF HIGH-K BASALT by guest on January 7, 2014
http://petrology.oxfordjournals.org/D
ownloaded from
Tables 2 and 3 have been averaged, with the exception ofcharges 14–1 and 14–2 (FeO-added experiments).Charges the most affected by either Fe loss (5–3) orquench crystallization (7–1, 7–2) have Kd values that donot significantly depart from the others (Tables 2 and 3).Clinopyroxene crystallizes from a range of melt com-
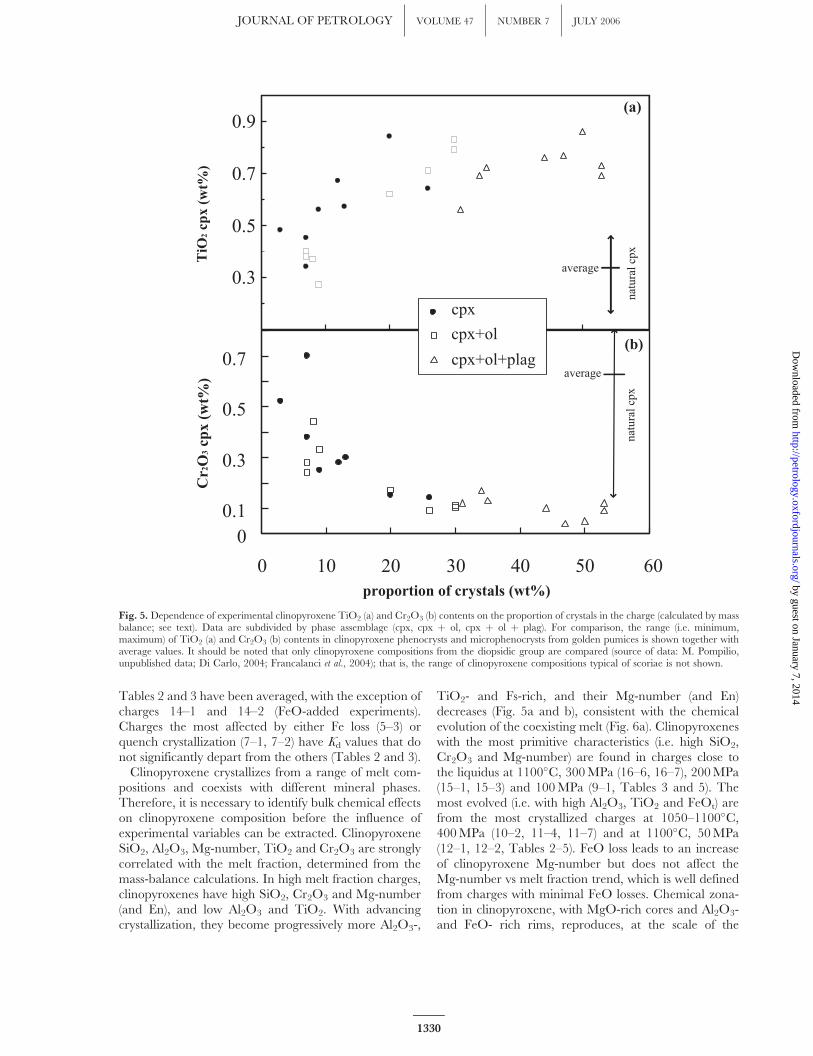
positions and coexists with different mineral phases.Therefore, it is necessary to identify bulk chemical effectson clinopyroxene composition before the influence ofexperimental variables can be extracted. ClinopyroxeneSiO2, Al2O3, Mg-number, TiO2 and Cr2O3 are stronglycorrelated with the melt fraction, determined from themass-balance calculations. In high melt fraction charges,clinopyroxenes have high SiO2, Cr2O3 and Mg-number(and En), and low Al2O3 and TiO2. With advancingcrystallization, they become progressively more Al2O3-,
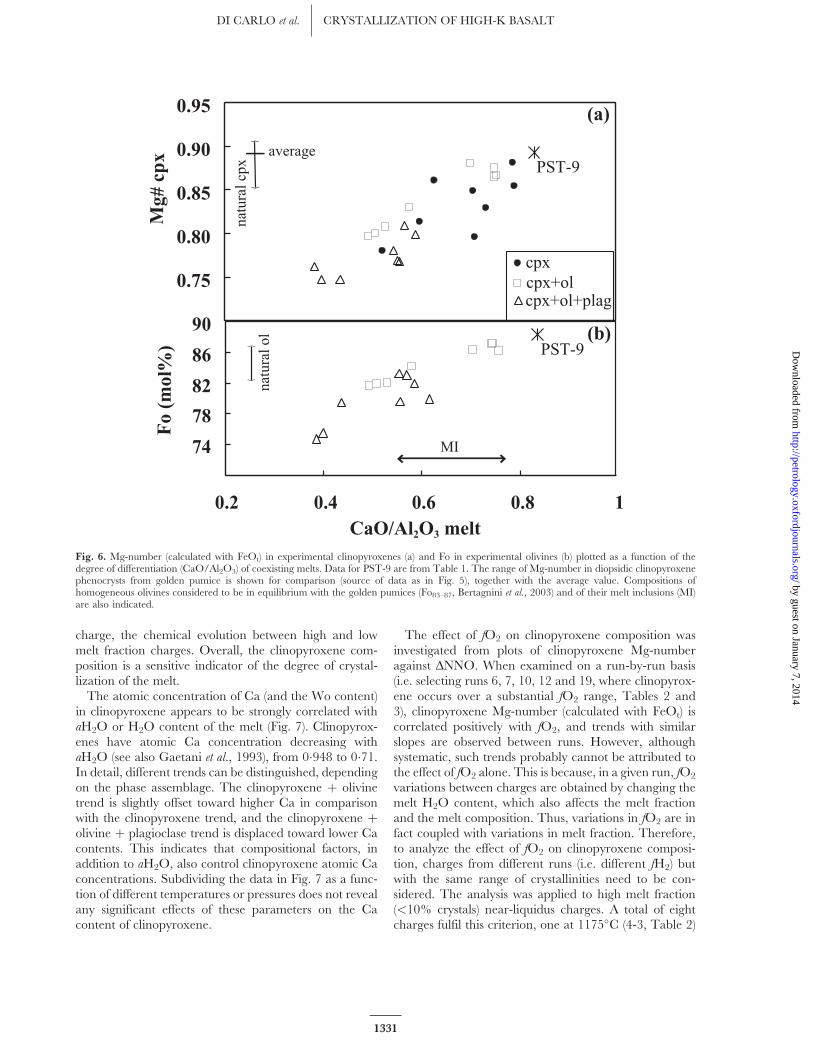
TiO2- and Fs-rich, and their Mg-number (and En)decreases (Fig. 5a and b), consistent with the chemicalevolution of the coexisting melt (Fig. 6a). Clinopyroxeneswith the most primitive characteristics (i.e. high SiO2,Cr2O3 and Mg-number) are found in charges close tothe liquidus at 1100�C, 300MPa (16–6, 16–7), 200MPa(15–1, 15–3) and 100MPa (9–1, Tables 3 and 5). Themost evolved (i.e. with high Al2O3, TiO2 and FeOt) arefrom the most crystallized charges at 1050–1100�C,400MPa (10–2, 11–4, 11–7) and at 1100�C, 50MPa(12–1, 12–2, Tables 2–5). FeO loss leads to an increaseof clinopyroxene Mg-number but does not affect theMg-number vs melt fraction trend, which is well definedfrom charges with minimal FeO losses. Chemical zona-tion in clinopyroxene, with MgO-rich cores and Al2O3-and FeO- rich rims, reproduces, at the scale of the
00.1
0.3
0.5
0.7
0 10 20 30 40 50 60proportion of crystals (wt%)
Cr2
O3 c
px (
wt%
)
(b)
0.3
0.5
0.7
0.9
TiO
2 cpx
(w
t%)
(a)
natu
ral c
pxna
tura
l cpx
average
averagecpx+ol+plag
cpx+ol
cpx
Fig. 5. Dependence of experimental clinopyroxene TiO2 (a) and Cr2O3 (b) contents on the proportion of crystals in the charge (calculated by massbalance; see text). Data are subdivided by phase assemblage (cpx, cpx þ ol, cpx þ ol þ plag). For comparison, the range (i.e. minimum,maximum) of TiO2 (a) and Cr2O3 (b) contents in clinopyroxene phenocrysts and microphenocrysts from golden pumices is shown together withaverage values. It should be noted that only clinopyroxene compositions from the diopsidic group are compared (source of data: M. Pompilio,unpublished data; Di Carlo, 2004; Francalanci et al., 2004); that is, the range of clinopyroxene compositions typical of scoriae is not shown.
1330
JOURNAL OF PETROLOGY VOLUME 47 NUMBER 7 JULY 2006 by guest on January 7, 2014
http://petrology.oxfordjournals.org/D
ownloaded from
charge, the chemical evolution between high and lowmelt fraction charges. Overall, the clinopyroxene com-position is a sensitive indicator of the degree of crystal-lization of the melt.The atomic concentration of Ca (and the Wo content)
in clinopyroxene appears to be strongly correlated withaH2O or H2O content of the melt (Fig. 7). Clinopyrox-enes have atomic Ca concentration decreasing withaH2O (see also Gaetani et al., 1993), from 0�948 to 0�71.In detail, different trends can be distinguished, dependingon the phase assemblage. The clinopyroxene þ olivinetrend is slightly offset toward higher Ca in comparisonwith the clinopyroxene trend, and the clinopyroxene þolivine þ plagioclase trend is displaced toward lower Cacontents. This indicates that compositional factors, inaddition to aH2O, also control clinopyroxene atomic Caconcentrations. Subdividing the data in Fig. 7 as a func-tion of different temperatures or pressures does not revealany significant effects of these parameters on the Cacontent of clinopyroxene.
The effect of fO2 on clinopyroxene composition wasinvestigated from plots of clinopyroxene Mg-numberagainst DNNO. When examined on a run-by-run basis(i.e. selecting runs 6, 7, 10, 12 and 19, where clinopyrox-ene occurs over a substantial fO2 range, Tables 2 and3), clinopyroxene Mg-number (calculated with FeOt) iscorrelated positively with fO2, and trends with similarslopes are observed between runs. However, althoughsystematic, such trends probably cannot be attributed tothe effect of fO2 alone. This is because, in a given run, fO2
variations between charges are obtained by changing themelt H2O content, which also affects the melt fractionand the melt composition. Thus, variations in fO2 are infact coupled with variations in melt fraction. Therefore,to analyze the effect of fO2 on clinopyroxene composi-tion, charges from different runs (i.e. different fH2) butwith the same range of crystallinities need to be con-sidered. The analysis was applied to high melt fraction(<10% crystals) near-liquidus charges. A total of eightcharges fulfil this criterion, one at 1175�C (4-3, Table 2)
0.75
0.80
0.85
0.90
0.95
74
78
82
86
90
0.2 0.4 0.6 0.8 1CaO/Al2O3 melt
(a)
(b)
Fo
(mol
%)
Mg#
cpx
natu
ral c
px
natu
ral o
l
PST-9
MI
average
PST-9
cpxcpx+olcpx+ol+plag
Fig. 6. Mg-number (calculated with FeOt) in experimental clinopyroxenes (a) and Fo in experimental olivines (b) plotted as a function of thedegree of differentiation (CaO/Al2O3) of coexisting melts. Data for PST-9 are from Table 1. The range of Mg-number in diopsidic clinopyroxenephenocrysts from golden pumice is shown for comparison (source of data as in Fig. 5), together with the average value. Compositions ofhomogeneous olivines considered to be in equilibrium with the golden pumices (Fo83–87, Bertagnini et al., 2003) and of their melt inclusions (MI)are also indicated.
1331
DI CARLO et al. CRYSTALLIZATION OF HIGH-K BASALT by guest on January 7, 2014
http://petrology.oxfordjournals.org/D
ownloaded from

and seven at 1100�C (6-1, 15-1, 15-3, 16-6, 16-7, 19-4and 9-1, Tables 2 and 3). Fe losses are <10% except incharges 4-3 and 6-1. Clinopyroxene Mg-number rangesbetween 0�83 and 0�88 without any clear dependence onfO2 in the limited DNNO range (from þ0�41 to þ1�7)covered. However, if Mg-number is calculated with FeOinstead of FeOt, a correlation emerges, clinopyroxene
Mg-number (from 0�88 to 0�92) being slightly negativelycorrelated with DNNO (Fig. 8). In these near-liquiduscharges, clinopyroxene Mg-number is not significantlyaffected by the presence of olivine (compare charges16-7 and 16-6, Tables 3 and 5).Olivines have Fo ranging between 74�7 and 87�3
(Tables 4 and 5). The CaO content is relatively high
0.6
0.7
0.8
0.9
1.0
aH2O
Ca
cpx
(apf
u)
(b)
0.80.4 0.60.20
natu
ral c
px
average
0.6
0.7
0.8
0.9
1.0
0 1 2 3 4 5 6H2O melt (wt%)
Ca
cpx
(apf
u)
(a)
natu
ral c
px
average
cpx+ol+plagcpx+olcpx
2σ
Fig. 7. Ca (a.p.f.u.) in experimental clinopyroxenes plotted as a function of (a) wt % H2O in melt and (b) aH2O, calculated from Burnham (1979)using melt compositions and experimental conditions from Tables 2–5. The influence of phase assemblage on the correlation should be noted. Forcomparison, the range of Ca in diopsidic clinopyroxene phenocrysts from the golden pumice is indicated (source of data as in Fig. 5), together withthe average value.
1332
JOURNAL OF PETROLOGY VOLUME 47 NUMBER 7 JULY 2006 by guest on January 7, 2014
http://petrology.oxfordjournals.org/D
ownloaded from

(average 0�32 wt %, total range 0�22–0�63 wt %) andpositively correlated with MnO (average 0�27 wt %, totalrange 0�13–0�39 wt %). The average olivine–liquidexchange coefficient (Kd ol–liq
Fe–Mg ) is 0�26 � 0�04 when calcu-lated with FeO¼ FeOt, and 0�36� 0�04 when calculatedwith FeO, the glass FeO being determined as above.These average Kd values are close to those found in recentexperimental studies of hydrous basaltic compositionsat P <500MPa (0�28–0�33, Sisson & Grove, 1993a;0�33, Pichavant et al., 2002a; 0�28, Barclay &Carmichael, 2004). As for clinopyroxene, all olivine-bearing charges from Tables 2 and 3 have been averaged;
the charges most affected by either FeO loss or quenchcrystallization do not yield anomalous values (Tables 2and 3).Olivine composition systematically varies with the
degree of crystallization and the composition of the coex-isting melt (Fig. 6b). Olivines with the highest Fo are fromhigh melt fraction charges at 100 and 200MPa (9-1 and15-1, Tables 3 and 5). Those with the lowest Fo comefrom the most crystallized charges at 400MPa, 1050�C(11-4 and 11-7, Tables 2 and 4). When plotted as afunction of pressure, Fo contents define a bell-shapedcurve with maxima at 100 and 200MPa (Fig. 9).
0.86
0.88
0.90
0.92
0.94
0 0.5 1.0 1.5 2.0
cpx+ol
∆NNO
Mg#
*
average
natu
ral
cpx
cpx
Fig. 8. Mg-number* (calculated with FeO) in experimental clinopyroxenes from near-liquidus charges plotted as a function of DNNO (see text).The entire range of Mg-number* in diopsidic clinopyroxene phenocrysts from the golden pumice is shown for comparison (source of data as inFig. 5), together with the average value.
70
74
78
82
86
90
0 100 200 300 400 500
Pressure (MPa)
Fo
(mol
%)
naturalol
cpx+olcpx+ol+plag
Fig. 9. Fo content of experimental olivines plotted as a function of pressure. The maximum in the range 100–200MPa should be noted.Compositions of olivines considered to be in equilibrium with the golden pumices (Fo83–87, Bertagnini et al., 2003) are also shown.
1333
DI CARLO et al. CRYSTALLIZATION OF HIGH-K BASALT by guest on January 7, 2014
http://petrology.oxfordjournals.org/D
ownloaded from
This is consistent with the change in phase relations withpressure noted earlier, and with the fact that, between100 and 200MPa, olivine crystallizes close to the liquidus(Fig. 4) with clinopyroxene. When olivine crystallizesmuch later than clinopyroxene (e.g. at 400MPa, Fig. 3),Fo contents are limited to values<84. Olivines coexistingwith plagioclase are the least Fo-rich, because plagioclaseis restricted to charges with low melt fractions.Plagioclase has An contents between 65�9 and 81�6, Or
between 1�4 and 4�9, and an average Fe concentration of1�26 wt % FeO (Tables 4 and 5). The plagioclase–liquidCa–Na exchange coefficient (Kd plg–liq
Ca–Na ) ranges between1�6 and 2�5, in good agreement with values for hydrousbasaltic compositions with comparable melt H2O con-tents (Sisson & Grove, 1993a). Plagioclase composition isprimarily controlled by the degree of crystallization.When the proportion of crystals increases, An progress-ively decreases and Or increases. Plagioclase An contentcorrelates negatively with pressure, the highest valuesbeing found in charges 12-3 (50MPa) and 18-1(100MPa) at 1100�C (Tables 3 and 5). The lowestAn contents are from the most crystallized charges at400MPa, 1050–1100�C (11-4, 11-7 and 10-2, Tables 2and 4).Compositions of experimental glasses can be discussed
using CaO/Al2O3 as a differentiation index. GlassCaO/Al2O3 systematically decreases with decreasingmelt fraction, reflecting the dominant influence of
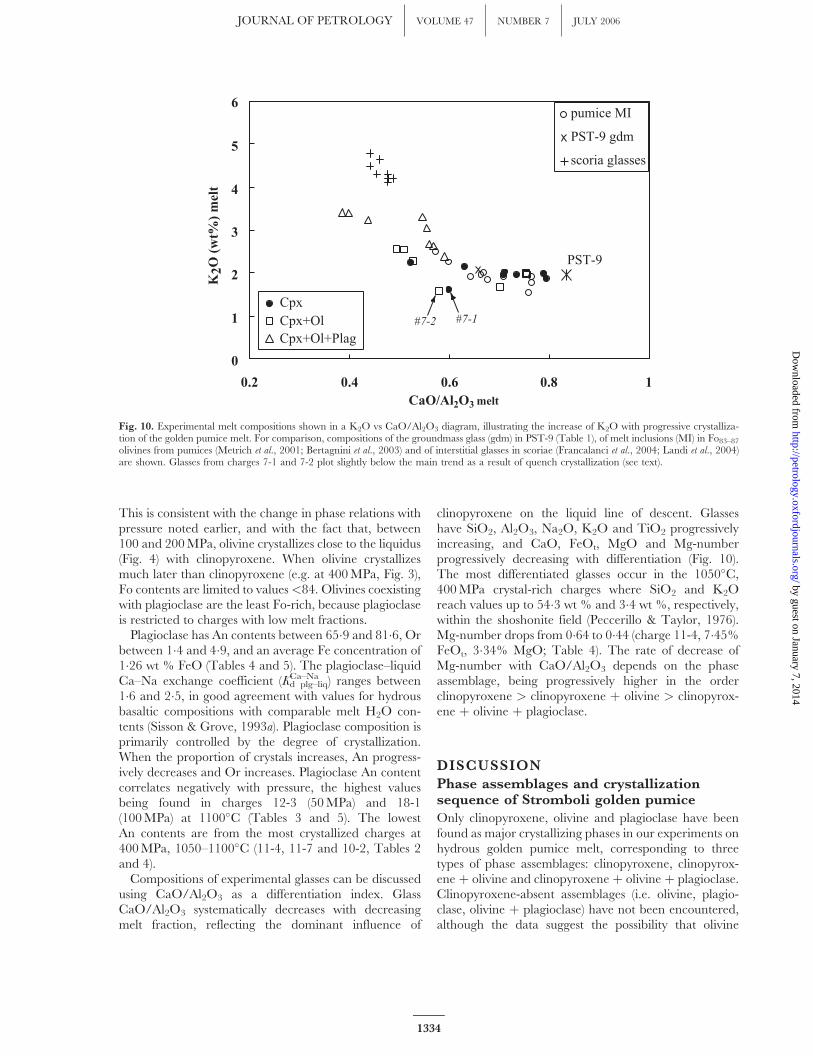
clinopyroxene on the liquid line of descent. Glasseshave SiO2, Al2O3, Na2O, K2O and TiO2 progressivelyincreasing, and CaO, FeOt, MgO and Mg-numberprogressively decreasing with differentiation (Fig. 10).The most differentiated glasses occur in the 1050�C,400MPa crystal-rich charges where SiO2 and K2Oreach values up to 54�3 wt % and 3�4 wt %, respectively,within the shoshonite field (Peccerillo & Taylor, 1976).Mg-number drops from 0�64 to 0�44 (charge 11-4, 7�45%FeOt, 3�34% MgO; Table 4). The rate of decrease ofMg-number with CaO/Al2O3 depends on the phaseassemblage, being progressively higher in the orderclinopyroxene > clinopyroxene þ olivine > clinopyrox-ene þ olivine þ plagioclase.
DISCUSSION
Phase assemblages and crystallizationsequence of Stromboli golden pumice
Only clinopyroxene, olivine and plagioclase have beenfound as major crystallizing phases in our experiments onhydrous golden pumice melt, corresponding to threetypes of phase assemblages: clinopyroxene, clinopyrox-ene þ olivine and clinopyroxene þ olivine þ plagioclase.Clinopyroxene-absent assemblages (i.e. olivine, plagio-clase, olivine þ plagioclase) have not been encountered,although the data suggest the possibility that olivine
0
1
2
3
4
5
6
0.2 0.4 0.6 0.8 1
PST-9
CaO/Al2O3 melt
K2O
(w
t%)
mel
t
#7-2 #7-1
pumice MI
PST-9 gdm
scoria glasses
Cpx+Ol+PlagCpx+OlCpx
Fig. 10. Experimental melt compositions shown in a K2O vs CaO/Al2O3 diagram, illustrating the increase of K2O with progressive crystalliza-tion of the golden pumice melt. For comparison, compositions of the groundmass glass (gdm) in PST-9 (Table 1), of melt inclusions (MI) in Fo83–87olivines from pumices (Metrich et al., 2001; Bertagnini et al., 2003) and of interstitial glasses in scoriae (Francalanci et al., 2004; Landi et al., 2004)are shown. Glasses from charges 7-1 and 7-2 plot slightly below the main trend as a result of quench crystallization (see text).
1334
JOURNAL OF PETROLOGY VOLUME 47 NUMBER 7 JULY 2006 by guest on January 7, 2014
http://petrology.oxfordjournals.org/D
ownloaded from

crystallizes alone on the liquidus at 1100�C between 150and 100MPa (Fig. 4). In the 1 atm continuous coolingexperiments of Conte et al. (2004), olivine was found asthe sole crystallizing phase between 1175 and 1150�C,and pigeonite appeared together with clinopyroxene andplagioclase from 1150 down to 1100�C. In our experi-ments, an Fe–Ti oxide phase is present in one (10-2) andprobably two (10-1) subliquidus charges that are amongthe most oxidized (DNNO >1�5, Table 2). Both charges10-2 and 10-1 have >10% crystals (10-2 with 53 wt %crystals is one of the two most crystallized charges), thusFe–Ti oxide was not encountered at near-liquidus condi-tions. This suggests that, for DNNO <1�5, Fe–Ti oxide islate in the crystallization sequence and follows clinopyr-oxene, olivine and plagioclase. It is also worth noting herethat phlogopite has not been found as a stable phase inthis study.One critical result of the experiments concerns the fact
that clinopyroxene precedes olivine in the crystallizationsequence for all the P–T–H2O–fO2 conditions investig-ated in this study. Clinopyroxene persists as the liquidusphase down to at least 200MPa; that is, in a pressurerange that is unexpectedly low on the basis of previousexperimental studies on basalts (e.g. Gust & Perfit, 1987;Falloon et al., 1999; Pichavant et al., 2002b). Clinopyrox-ene (and also orthopyroxene for primary melts fromlherzolitic mantle) is expected to saturate at relativelyhigh pressures on the liquidus of basalts. Olivine wouldsaturate at lower pressures, and multiple saturation pointsare expected in the range 1–1�2GPa or above if thesystem is hydrous (e.g. Pichavant et al., 2002b). In thecase of PST-9, co-saturation of olivine and clinopyroxeneon the liquidus is possible on the basis of the availabledata (Fig. 4), but only at very low pressures (P �150MPaat 1100�C). Orthopyroxene is totally absent. These fea-tures are unusual for a relatively primitive basaltic com-position (e.g. 8 wt % MgO in PST-9), but seem typical ofultra-calcic (i.e. ankaramitic) magmas from arc settings.In a recent study, Medard et al. (2004) established that amodel nepheline-normative ultra-calcic melt, represent-ative of those found in arc settings, is saturated at200MPa on its liquidus with clinopyroxene and olivine.Plagioclase was the third phase to crystallize andorthopyroxene was not encountered (Medard et al.,2004). Thus, the phase relations of PST-9 are similar inseveral critical aspects to the ultra-calcic melt studied byMedard et al. (2004). Indeed, Stromboli is one of thelocalities where ultra-calcic melt inclusions have beenrecognized (Schiano et al., 2000).Another important aspect of the PST-9 crystallization
sequence concerns plagioclase. Plagioclase is the thirdphase to appear in the sequence, whatever the pressure,between 50 and 400MPa. Crystallization of plagioclasewas observed for melt fractions between 32 and 53 wt %,irrespective of pressure, i.e. once a minimum of 30%
clinopyroxene plus olivine has already crystallized. Thisrange of crystallinities is much higher than the crystalcontent of the golden pumices (�10 vol. %, Metrich et al.,2001). Thus, plagioclase is unlikely to saturate at an earlystage in the golden pumice melts, and probably has anegligible importance in the early stages of magmaticdifferentiation. Golden pumice melts are undersaturatedwith respect to plagioclase and, therefore, are expected todissolve plagioclase during their initial stages of interac-tion and mixing with the resident magma, in agreementwith textures observed for plagioclase xenocrysts partiallyreacted in the golden pumice melt (Landi et al., 2004). Itshould be noted that this conclusion leaves aside the smallEu anomaly found in PST-9 and other pumices (seeabove and Metrich et al., 2001). One possibility is thatthis anomaly is a geochemical feature transferred fromthe scoria to golden pumice magmas because of magmamixing and advection of crystals. Alternatively, we can-not totally exclude the possibility that the Eu anomalyobserved reflects a stage of plagioclase fractionationunder P–T–volatile conditions that have not yet beeninvestigated experimentally.
Pre-eruptive pressure–temperature–meltH2O contents of the Stromboli goldenpumice magma
As the golden pumice is crystal-poor, it essentiallyrepresents a magmatic liquid and thus constraints onpre-eruptive magmatic conditions can be obtained fromthe experimental liquidus and its dependence on pres-sure, temperature and aH2O (or melt H2O content).Because, in this study, no significant effect of fO2 onphase equilibria was found between �NNO and�NNOþ 2, it will be assumed in the following discussionthat fO2 changes in this DNNO range do not influencethe location of the liquidus. The liquidus surface of PST-9is represented in Fig. 11 for pressures <500MPa andtemperatures <1200�C. It is defined by clino-pyroxene saturation curves for constant aH2O; these areinterpolated from the available experimental data. Inaddition to experiments from this study (Tables 2and 3), two additional clinopyroxene saturation bracketsat 1150�C, 200MPa and 1150�C, 100MPa, obtainedwith aH2O controlled by H2O–CO2 fluid mixtures(Di Carlo et al., in preparation), are included to locatemore precisely the clinopyroxene saturation curves in thehigh-T, low-P part of the diagram (Fig. 11). The constantaH2O liquidus curves all have negative slopes, becomingprogressively steeper with decreasing aH2O. To facilitatethe discussion, melt H2O concentrations have beencalculated along these curves, with PST-9 taken as themelt composition and using the model of Burnham(1979). Contours of melt H2O concentrations on theliquidus surface are shown in Fig. 11.
1335
DI CARLO et al. CRYSTALLIZATION OF HIGH-K BASALT by guest on January 7, 2014
http://petrology.oxfordjournals.org/D
ownloaded from

Assuming that PST-9 is a near-liquidus magma, oneparameter among the three parameters P, T and meltH2O content can be determined if the two others areknown. Below, two types of external constraints derivedfrom melt inclusion studies are used: H2O concentrationsin glasses and homogenization temperatures (Th, Metrichet al., 2001; Bertagnini et al., 2003). Glass inclusions ingolden pumice olivines have H2O concentrations rangingbetween 1�8 and 3�4 wt % with a well-defined frequencymaximum at 2�5–2�7 wt % (n ¼ 28; Metrich et al., 2001;Bertagnini et al., 2003). Th values obtained from opticalthermometry measurements on melt inclusions in olivinerange from 1125–1140�C for golden pumices to1101–1125�C for black scoria (Metrich et al., 2001). Itshould be noted that the homogenized glass inclusionsare on average more evolved than PST-9 (i.e. thoseyielding the highest Th have MgO between 6�03 and7�88 wt %, Metrich et al., 2001). In addition, Th valuesrepresent temperatures of melt entrapment by growingphenocrysts. Therefore, 1140�C is a minimum value forthe liquidus temperature of golden pumice melt. At1140�C, and for melt H2O contents between 2�5 and2�7 wt % (Fig. 11), the liquidus surface is intersectedbetween 100 and 190MPa. Keeping the range ofmelt H2O contents unchanged, but taking a liquidus
temperature of 1160�C instead of 1140�C, higher pres-sures, between 220 and 270MPa, are obtained on theliquidus surface (Fig. 11). Varying the H2O concentrationof the melt on either side of the 2�5–2�7 wt % H2Omaximum would alternatively increase or decreasethese conditions towards higher or lower pressures. Onaverage, pressures >100MPa and up to 270MPa on theliquidus surface are suggested for 1140–1160�C.Clinopyroxenes in the golden pumice include a com-
positionally distinctive group of high-Cr, high-Mg-num-ber and low-Ti, low-Al diopsidic phenocrysts andmicrophenocrysts. Experimental clinopyroxenes withthese characteristics were obtained in several chargesover a range of conditions, especially pressure, but alsomelt H2O concentration and DNNO (charges 9-1, 15-1,15-3, 19-4, 16-6 and 16-7). It is worth stressing that theseclinopyroxene compositions are obtained experimentallyonly when the proportions of crystals are small (<10%).This strongly suggests that diopsidic clinopyroxenephenocrysts represent near-liquidus crystallization pro-ducts of the golden pumice melts. At 1100�C, high-Cr,high-Mg-number and low-Ti, low-Al clinopyroxenes arefound at 300MPa for melt H2O concentrations between3�5 and 4�0 wt %, at 200MPa for melt H2O concentra-tions between 2�7 and 3�6 wt %, and at 100MPa for melt
0
100
200
300
400
500
1040 1060 1080 1100 1120 1140 1160 1180 1200
Temperature ( C)
Pre
ssu
re (
MP
a)
cpxol
aH2O = 0.5 0.50.60.7 0.4
2.3 wt% H2Oin melt
2.52.73.1
3.5
2.3
Fig. 11. P–T–aH2O location of clinopyroxene saturation curves (continuous lines) in PST-9 golden pumice melt projected onto the P–T plane.These are obtained by interpolation of the experimental clinopyroxene saturation brackets from Tables 2 and 3. Two additional brackets at1150�C, 200 and 100MPa with aH2O controlled by H2O–CO2 mixtures (Di Carlo et al., in preparation) are also used. Diamonds specify the P–Tconditions where constraints on clinopyroxene saturation as a function of the melt H2O content (or aH2O) are available. One olivine saturationcurve (bold dashed line), constructed in the same way from olivine saturation brackets, is shown for aH2O ¼ 0�5. Olivine saturation occurs atlower temperatures than clinopyroxene saturation for equivalent aH2O. Therefore, clinopyroxene saturation curves represent liquidus curveswhich define the liquidus surface of PST-9 as a function of P, T and aH2O. Concentrations of H2O in the melt have been calculated for P–T–aH2O conditions along the liquidus curves using the model of Burnham (1979) and taking PST-9 (Table 1) as the melt composition. This allowsH2O concentration contours to be drawn (dotted lines) on the liquidus surface. The pre-eruptive P–T–H2O melt conditions (grey field) areobtained by combining the constraints on temperature (light grey field) and on the melt H2O content (maximum frequency of melt inclusion H2Oconcentration: 2�5–2�7 wt %; see text).
1336
JOURNAL OF PETROLOGY VOLUME 47 NUMBER 7 JULY 2006 by guest on January 7, 2014
http://petrology.oxfordjournals.org/D
ownloaded from
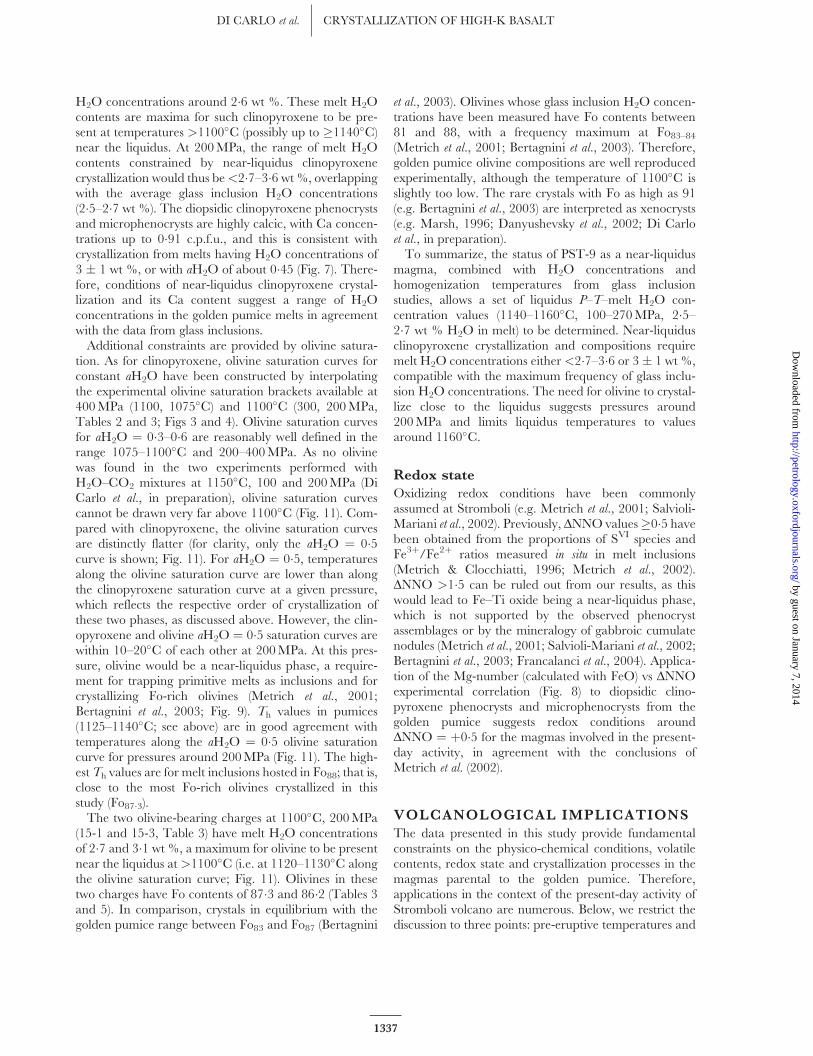
H2O concentrations around 2�6 wt %. These melt H2Ocontents are maxima for such clinopyroxene to be pre-sent at temperatures >1100�C (possibly up to �1140�C)near the liquidus. At 200MPa, the range of melt H2Ocontents constrained by near-liquidus clinopyroxenecrystallization would thus be<2�7–3�6 wt %, overlappingwith the average glass inclusion H2O concentrations(2�5–2�7 wt %). The diopsidic clinopyroxene phenocrystsand microphenocrysts are highly calcic, with Ca concen-trations up to 0�91 c.p.f.u., and this is consistent withcrystallization from melts having H2O concentrations of3 � 1 wt %, or with aH2O of about 0�45 (Fig. 7). There-fore, conditions of near-liquidus clinopyroxene crystal-lization and its Ca content suggest a range of H2Oconcentrations in the golden pumice melts in agreementwith the data from glass inclusions.Additional constraints are provided by olivine satura-
tion. As for clinopyroxene, olivine saturation curves forconstant aH2O have been constructed by interpolatingthe experimental olivine saturation brackets available at400MPa (1100, 1075�C) and 1100�C (300, 200MPa,Tables 2 and 3; Figs 3 and 4). Olivine saturation curvesfor aH2O ¼ 0�3–0�6 are reasonably well defined in therange 1075–1100�C and 200–400MPa. As no olivinewas found in the two experiments performed withH2O–CO2 mixtures at 1150�C, 100 and 200MPa (DiCarlo et al., in preparation), olivine saturation curvescannot be drawn very far above 1100�C (Fig. 11). Com-pared with clinopyroxene, the olivine saturation curvesare distinctly flatter (for clarity, only the aH2O ¼ 0�5curve is shown; Fig. 11). For aH2O ¼ 0�5, temperaturesalong the olivine saturation curve are lower than alongthe clinopyroxene saturation curve at a given pressure,which reflects the respective order of crystallization ofthese two phases, as discussed above. However, the clin-opyroxene and olivine aH2O ¼ 0�5 saturation curves arewithin 10–20�C of each other at 200MPa. At this pres-sure, olivine would be a near-liquidus phase, a require-ment for trapping primitive melts as inclusions and forcrystallizing Fo-rich olivines (Metrich et al., 2001;Bertagnini et al., 2003; Fig. 9). Th values in pumices(1125–1140�C; see above) are in good agreement withtemperatures along the aH2O ¼ 0�5 olivine saturationcurve for pressures around 200MPa (Fig. 11). The high-est Th values are for melt inclusions hosted in Fo88; that is,close to the most Fo-rich olivines crystallized in thisstudy (Fo87�3).The two olivine-bearing charges at 1100�C, 200MPa
(15-1 and 15-3, Table 3) have melt H2O concentrationsof 2�7 and 3�1 wt %, a maximum for olivine to be presentnear the liquidus at >1100�C (i.e. at 1120–1130�C alongthe olivine saturation curve; Fig. 11). Olivines in thesetwo charges have Fo contents of 87�3 and 86�2 (Tables 3and 5). In comparison, crystals in equilibrium with thegolden pumice range between Fo83 and Fo87 (Bertagnini
et al., 2003). Olivines whose glass inclusion H2O concen-trations have been measured have Fo contents between81 and 88, with a frequency maximum at Fo83–84(Metrich et al., 2001; Bertagnini et al., 2003). Therefore,golden pumice olivine compositions are well reproducedexperimentally, although the temperature of 1100�C isslightly too low. The rare crystals with Fo as high as 91(e.g. Bertagnini et al., 2003) are interpreted as xenocrysts(e.g. Marsh, 1996; Danyushevsky et al., 2002; Di Carloet al., in preparation).To summarize, the status of PST-9 as a near-liquidus
magma, combined with H2O concentrations andhomogenization temperatures from glass inclusionstudies, allows a set of liquidus P–T–melt H2O con-centration values (1140–1160�C, 100–270MPa, 2�5–2�7 wt % H2O in melt) to be determined. Near-liquidusclinopyroxene crystallization and compositions requiremelt H2O concentrations either <2�7–3�6 or 3� 1 wt %,compatible with the maximum frequency of glass inclu-sion H2O concentrations. The need for olivine to crystal-lize close to the liquidus suggests pressures around200MPa and limits liquidus temperatures to valuesaround 1160�C.
Redox state
Oxidizing redox conditions have been commonlyassumed at Stromboli (e.g. Metrich et al., 2001; Salvioli-Mariani et al., 2002). Previously, DNNO values�0�5 havebeen obtained from the proportions of SVI species andFe3þ/Fe2þ ratios measured in situ in melt inclusions(Metrich & Clocchiatti, 1996; Metrich et al., 2002).DNNO >1�5 can be ruled out from our results, as thiswould lead to Fe–Ti oxide being a near-liquidus phase,which is not supported by the observed phenocrystassemblages or by the mineralogy of gabbroic cumulatenodules (Metrich et al., 2001; Salvioli-Mariani et al., 2002;Bertagnini et al., 2003; Francalanci et al., 2004). Applica-tion of the Mg-number (calculated with FeO) vs DNNOexperimental correlation (Fig. 8) to diopsidic clino-pyroxene phenocrysts and microphenocrysts from thegolden pumice suggests redox conditions aroundDNNO ¼ þ0�5 for the magmas involved in the present-day activity, in agreement with the conclusions ofMetrich et al. (2002).
VOLCANOLOGICAL IMPLICATIONS
The data presented in this study provide fundamentalconstraints on the physico-chemical conditions, volatilecontents, redox state and crystallization processes in themagmas parental to the golden pumice. Therefore,applications in the context of the present-day activity ofStromboli volcano are numerous. Below, we restrict thediscussion to three points: pre-eruptive temperatures and
1337
DI CARLO et al. CRYSTALLIZATION OF HIGH-K BASALT by guest on January 7, 2014
http://petrology.oxfordjournals.org/D
ownloaded from
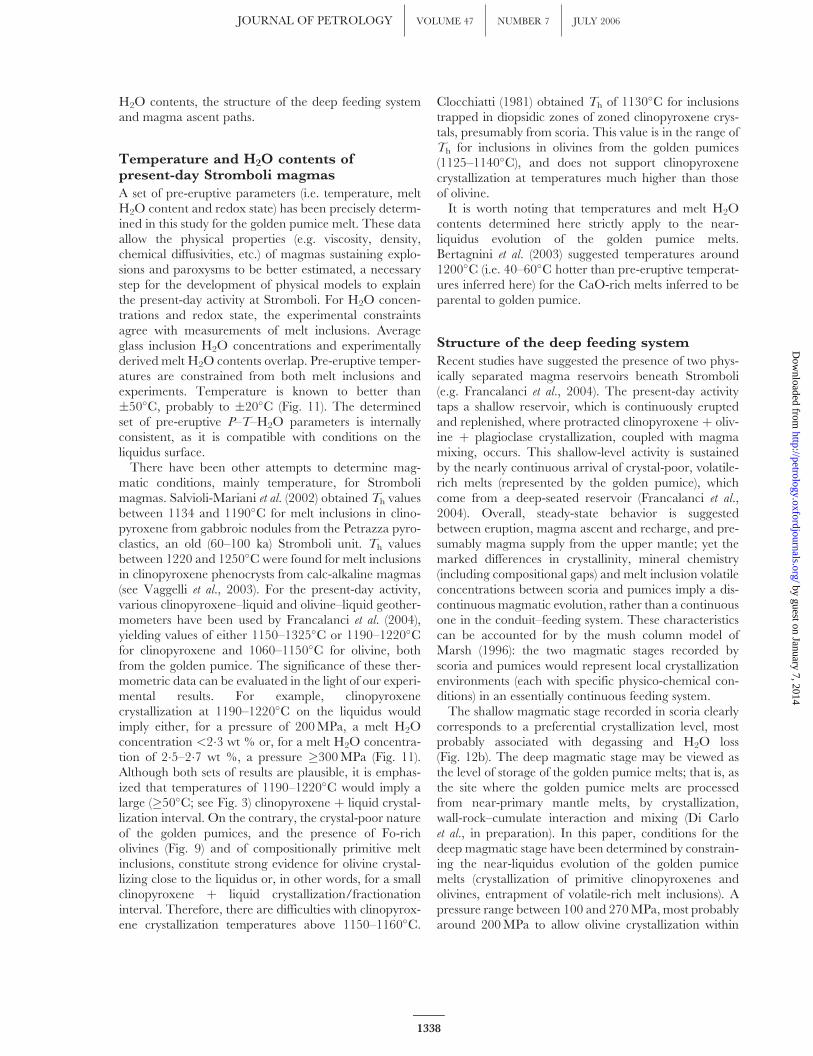
H2O contents, the structure of the deep feeding systemand magma ascent paths.
Temperature and H2O contents ofpresent-day Stromboli magmas
A set of pre-eruptive parameters (i.e. temperature, meltH2O content and redox state) has been precisely determ-ined in this study for the golden pumice melt. These dataallow the physical properties (e.g. viscosity, density,chemical diffusivities, etc.) of magmas sustaining explo-sions and paroxysms to be better estimated, a necessarystep for the development of physical models to explainthe present-day activity at Stromboli. For H2O concen-trations and redox state, the experimental constraintsagree with measurements of melt inclusions. Averageglass inclusion H2O concentrations and experimentallyderived melt H2O contents overlap. Pre-eruptive temper-atures are constrained from both melt inclusions andexperiments. Temperature is known to better than�50�C, probably to �20�C (Fig. 11). The determinedset of pre-eruptive P–T–H2O parameters is internallyconsistent, as it is compatible with conditions on theliquidus surface.There have been other attempts to determine mag-
matic conditions, mainly temperature, for Strombolimagmas. Salvioli-Mariani et al. (2002) obtained Th valuesbetween 1134 and 1190�C for melt inclusions in clino-pyroxene from gabbroic nodules from the Petrazza pyro-clastics, an old (60–100 ka) Stromboli unit. Th valuesbetween 1220 and 1250�C were found for melt inclusionsin clinopyroxene phenocrysts from calc-alkaline magmas(see Vaggelli et al., 2003). For the present-day activity,various clinopyroxene–liquid and olivine–liquid geother-mometers have been used by Francalanci et al. (2004),yielding values of either 1150–1325�C or 1190–1220�Cfor clinopyroxene and 1060–1150�C for olivine, bothfrom the golden pumice. The significance of these ther-mometric data can be evaluated in the light of our experi-mental results. For example, clinopyroxenecrystallization at 1190–1220�C on the liquidus wouldimply either, for a pressure of 200MPa, a melt H2Oconcentration <2�3 wt % or, for a melt H2O concentra-tion of 2�5–2�7 wt %, a pressure �300MPa (Fig. 11).Although both sets of results are plausible, it is emphas-ized that temperatures of 1190–1220�C would imply alarge (�50�C; see Fig. 3) clinopyroxene þ liquid crystal-lization interval. On the contrary, the crystal-poor natureof the golden pumices, and the presence of Fo-richolivines (Fig. 9) and of compositionally primitive meltinclusions, constitute strong evidence for olivine crystal-lizing close to the liquidus or, in other words, for a smallclinopyroxene þ liquid crystallization/fractionationinterval. Therefore, there are difficulties with clinopyrox-ene crystallization temperatures above 1150–1160�C.
Clocchiatti (1981) obtained Th of 1130�C for inclusionstrapped in diopsidic zones of zoned clinopyroxene crys-tals, presumably from scoria. This value is in the range ofTh for inclusions in olivines from the golden pumices(1125–1140�C), and does not support clinopyroxenecrystallization at temperatures much higher than thoseof olivine.It is worth noting that temperatures and melt H2O
contents determined here strictly apply to the near-liquidus evolution of the golden pumice melts.Bertagnini et al. (2003) suggested temperatures around1200�C (i.e. 40–60�C hotter than pre-eruptive temperat-ures inferred here) for the CaO-rich melts inferred to beparental to golden pumice.
Structure of the deep feeding system
Recent studies have suggested the presence of two phys-ically separated magma reservoirs beneath Stromboli(e.g. Francalanci et al., 2004). The present-day activitytaps a shallow reservoir, which is continuously eruptedand replenished, where protracted clinopyroxene þ oliv-ine þ plagioclase crystallization, coupled with magmamixing, occurs. This shallow-level activity is sustainedby the nearly continuous arrival of crystal-poor, volatile-rich melts (represented by the golden pumice), whichcome from a deep-seated reservoir (Francalanci et al.,2004). Overall, steady-state behavior is suggestedbetween eruption, magma ascent and recharge, and pre-sumably magma supply from the upper mantle; yet themarked differences in crystallinity, mineral chemistry(including compositional gaps) and melt inclusion volatileconcentrations between scoria and pumices imply a dis-continuous magmatic evolution, rather than a continuousone in the conduit–feeding system. These characteristicscan be accounted for by the mush column model ofMarsh (1996): the two magmatic stages recorded byscoria and pumices would represent local crystallizationenvironments (each with specific physico-chemical con-ditions) in an essentially continuous feeding system.The shallow magmatic stage recorded in scoria clearly
corresponds to a preferential crystallization level, mostprobably associated with degassing and H2O loss(Fig. 12b). The deep magmatic stage may be viewed asthe level of storage of the golden pumice melts; that is, asthe site where the golden pumice melts are processedfrom near-primary mantle melts, by crystallization,wall-rock–cumulate interaction and mixing (Di Carloet al., in preparation). In this paper, conditions for thedeep magmatic stage have been determined by constrain-ing the near-liquidus evolution of the golden pumicemelts (crystallization of primitive clinopyroxenes andolivines, entrapment of volatile-rich melt inclusions). Apressure range between 100 and 270MPa, most probablyaround 200MPa to allow olivine crystallization within
1338
JOURNAL OF PETROLOGY VOLUME 47 NUMBER 7 JULY 2006 by guest on January 7, 2014
http://petrology.oxfordjournals.org/D
ownloaded from
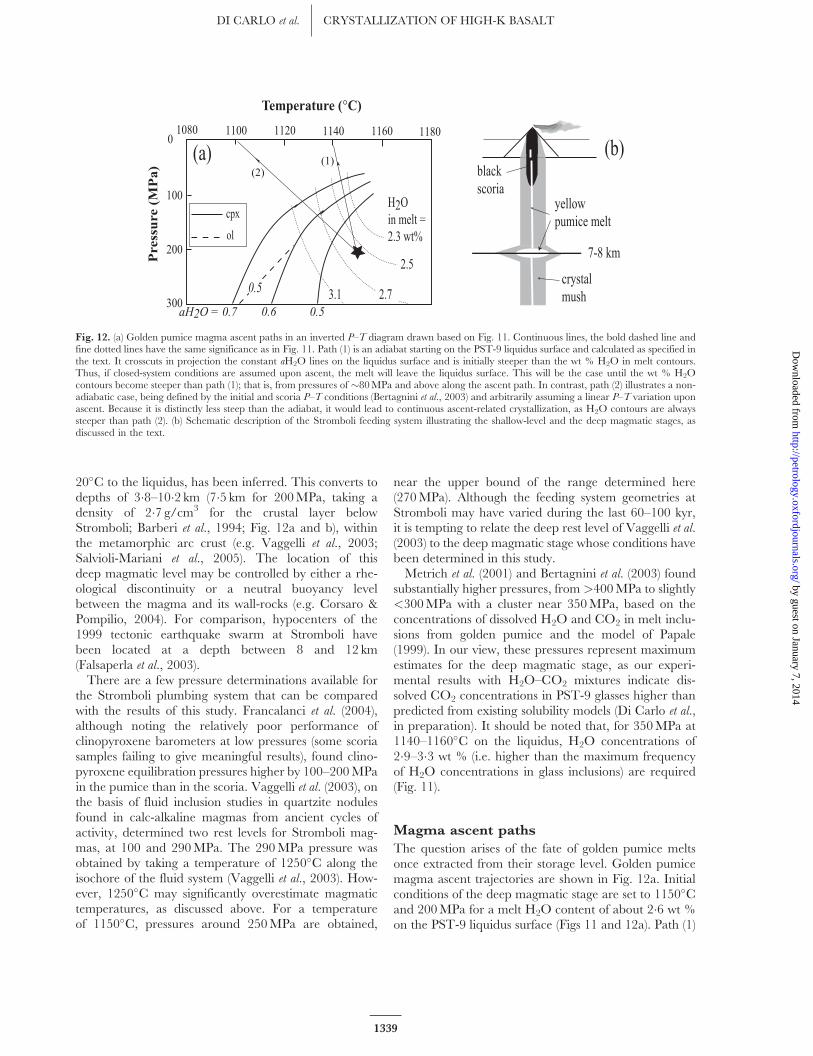
20�C to the liquidus, has been inferred. This converts todepths of 3�8–10�2 km (7�5 km for 200MPa, taking adensity of 2�7 g/cm3 for the crustal layer belowStromboli; Barberi et al., 1994; Fig. 12a and b), withinthe metamorphic arc crust (e.g. Vaggelli et al., 2003;Salvioli-Mariani et al., 2005). The location of thisdeep magmatic level may be controlled by either a rhe-ological discontinuity or a neutral buoyancy levelbetween the magma and its wall-rocks (e.g. Corsaro &Pompilio, 2004). For comparison, hypocenters of the1999 tectonic earthquake swarm at Stromboli havebeen located at a depth between 8 and 12 km(Falsaperla et al., 2003).There are a few pressure determinations available for
the Stromboli plumbing system that can be comparedwith the results of this study. Francalanci et al. (2004),although noting the relatively poor performance ofclinopyroxene barometers at low pressures (some scoriasamples failing to give meaningful results), found clino-pyroxene equilibration pressures higher by 100–200MPain the pumice than in the scoria. Vaggelli et al. (2003), onthe basis of fluid inclusion studies in quartzite nodulesfound in calc-alkaline magmas from ancient cycles ofactivity, determined two rest levels for Stromboli mag-mas, at 100 and 290MPa. The 290MPa pressure wasobtained by taking a temperature of 1250�C along theisochore of the fluid system (Vaggelli et al., 2003). How-ever, 1250�C may significantly overestimate magmatictemperatures, as discussed above. For a temperatureof 1150�C, pressures around 250MPa are obtained,
near the upper bound of the range determined here(270MPa). Although the feeding system geometries atStromboli may have varied during the last 60–100 kyr,it is tempting to relate the deep rest level of Vaggelli et al.(2003) to the deep magmatic stage whose conditions havebeen determined in this study.Metrich et al. (2001) and Bertagnini et al. (2003) found
substantially higher pressures, from >400MPa to slightly<300MPa with a cluster near 350MPa, based on theconcentrations of dissolved H2O and CO2 in melt inclu-sions from golden pumice and the model of Papale(1999). In our view, these pressures represent maximumestimates for the deep magmatic stage, as our experi-mental results with H2O–CO2 mixtures indicate dis-solved CO2 concentrations in PST-9 glasses higher thanpredicted from existing solubility models (Di Carlo et al.,in preparation). It should be noted that, for 350MPa at1140–1160�C on the liquidus, H2O concentrations of2�9–3�3 wt % (i.e. higher than the maximum frequencyof H2O concentrations in glass inclusions) are required(Fig. 11).
Magma ascent paths
The question arises of the fate of golden pumice meltsonce extracted from their storage level. Golden pumicemagma ascent trajectories are shown in Fig. 12a. Initialconditions of the deep magmatic stage are set to 1150�Cand 200MPa for a melt H2O content of about 2�6 wt %on the PST-9 liquidus surface (Figs 11 and 12a). Path (1)
cpx
ol
H2Oin melt =2.3 wt%
2.5
0.5 2.73.1crystalmush
blackscoria
yellowpumice melt
7-8 km
(a) (b)(2)
(1)
Temperature (°C)
Pre
ssu
re (
MP
a)
100
200
300
01100 1120 1140 1160 11801080
aH2O = 0.7 0.6 0.5
Fig. 12. (a) Golden pumice magma ascent paths in an inverted P–T diagram drawn based on Fig. 11. Continuous lines, the bold dashed line andfine dotted lines have the same significance as in Fig. 11. Path (1) is an adiabat starting on the PST-9 liquidus surface and calculated as specified inthe text. It crosscuts in projection the constant aH2O lines on the liquidus surface and is initially steeper than the wt % H2O in melt contours.Thus, if closed-system conditions are assumed upon ascent, the melt will leave the liquidus surface. This will be the case until the wt % H2Ocontours become steeper than path (1); that is, from pressures of �80MPa and above along the ascent path. In contrast, path (2) illustrates a non-adiabatic case, being defined by the initial and scoria P–T conditions (Bertagnini et al., 2003) and arbitrarily assuming a linear P–T variation uponascent. Because it is distinctly less steep than the adiabat, it would lead to continuous ascent-related crystallization, as H2O contours are alwayssteeper than path (2). (b) Schematic description of the Stromboli feeding system illustrating the shallow-level and the deep magmatic stages, asdiscussed in the text.
1339
DI CARLO et al. CRYSTALLIZATION OF HIGH-K BASALT by guest on January 7, 2014
http://petrology.oxfordjournals.org/D
ownloaded from

is an adiabat calculated with a slope of 5�C/100MPa,appropriate for wet basaltic melts (6 wt % H2O, Barclay& Carmichael, 2004). Although this slope maximizesascent-related cooling of the golden pumice magma(H2O melt 6 wt %), overall the degree of coolingalong the adiabat is very small (Fig. 12a), as the pressuredrop is at most 200MPa. The path crosscuts in projec-tion the constant aH2O lines on the liquidus surface,aH2O progressively increasing upon ascent. However,path (1) is steeper than the wt % H2O contours. Inother words, if closed-system conditions are assumed(neither loss nor gain of H2O), the golden pumicemelt should leave the liquidus surface and becomesuperheated. It should be noted that this will persistuntil the wt % H2O contours become steeper thanpath (1), which occurs from �80MPa along the ascentpath (Fig. 12a). Therefore, if the golden pumice meltascends along an adiabat, crystallization is not expecteduntil shallow (<3 km) depths. For comparison, anotherascent path defined by the initial and final (i.e. blackscoria) P–T conditions [the latter taken from Bertagniniet al. (2003)], and arbitrarily assuming a linear P–T vari-ation upon ascent, is shown in Fig. 12a [path (2)]. Thisonly serves to illustrate continuous ascent-related cry-stallization, as H2O contours are always steeper thanpath (2).The crystal-poor nature of the golden pumices and
the interpretation that their diopsidic clinopyroxene andFo-rich olivine crystals are of deep provenance are bothconsistent with adiabatic magma ascent. However, theanalysis above has ignored the possible presence of a fluidphase, which may be present at the storage level of thegolden pumice melt and above. If this is the case, open-system conditions, rather than closed-system as in theanalysis above, need to be considered for modellingmagma ascent beneath Stromboli. In the presence of afluid phase, a more elaborate treatment would be neces-sary and, therefore, the conclusions above should beviewed as preliminary.
CONCLUSIONS
In this paper, the evolution of a volatile-rich high-Kbasalt melt from the recent eruptive activity of Stromboli(PST-9) has been simulated experimentally at 1050–1175�C, 50–400MPa, for melt H2O concentrationsbetween 1�2 and 5�5 wt % and DNNO ranging from�0�07 to þ2�32. In most charges, quench crystallizationwas effectively suppressed by using a drop-quench tech-nique. Fe loss was minimized, but not eliminated. Despitethis problem, phase equilibrium results and compositionsdefine a reliable dataset that sheds light on the evolutionof the golden pumice melt.Major crystallizing phases are clinopyroxene, olivine
and plagioclase. Fe–Ti oxide is present in some charges.
Clinopyroxene precedes olivine in the crystallizationsequence and persists as the liquidus phase down to atleast 200MPa. This makes phase equilibria for PST-9similar to those for ultra-calcic (ankaramitic) liquids fromarc settings. Plagioclase is a late phase, in agreement withobserved textural relations.Clinopyroxene, olivine, plagioclase and glass composi-
tion vary systematically with the degree of crystallization.Diopsidic, Cr-rich and Al-, Ti-poor clinopyroxenephenocrysts in the golden pumice represent near-liquiduscrystallization products. Ca in clinopyroxene sensitivelydepends on the H2O content of the coexisting melt. Themost Fo-rich olivines (Fo87) are obtained at 100 and200MPa. With progressive crystallization, the glassesreach compositions within the shoshonite field.A set of pre-eruptive liquidus P–T–melt H2O concen-
tration conditions (1140–1160�C, 100–270MPa,2�5–2�7 wt % H2O in melt) is determined for the goldenpumice melt by combining experimental and melt inclu-sion data. Near-liquidus clinopyroxene crystallizationrequires melt H2O concentrations either <2�7–3�6 or3 � 1 wt %, overlapping with the maximum frequencyof glass inclusion H2O concentrations (2�5–2�7 wt %H2O). The need to have olivine crystallizing close to theliquidus suggests pressures around 200MPa and limitsliquidus temperatures to values around 1160�C. Com-positions of diopsidic clinopyroxene phenocrysts inthe golden pumice suggest redox conditions aroundDNNO ¼ þ0�5. The set of pre-eruptive parametersdetermined here allows the physical properties of mag-mas sustaining explosions and paroxysms to be betterevaluated.Contrasts in crystallinity, mineral chemistry and melt
inclusion volatile concentrations between scoria andpumices imply a discontinuous magmatic evolution inthe conduit–feeding system. The deep magmatic stage,which is marked by the near-liquidus crystallization ofprimitive clinopyroxenes and olivines as well as by theentrapment of volatile-rich melt inclusions, correspondsto the storage region of the golden pumice melt. Thisoccurs in the depth range 3�8–10�2 km (7�5 km for200MPa) within the metamorphic arc crust. For goldenpumice melts adiabatically ascending from their storageregion to the surface, no crystallization is expected. Theshallow-level magmatic stage corresponds to a preferen-tial crystallization level, most probably related to degass-ing and H2O loss.
ACKNOWLEDGEMENTS
This paper forms part of the Ph.D. thesis of the firstauthor. The experimental study on Stromboli was par-tially supported by an INGV–GNV Project (EruptiveScenarios), by Galileo funds for Italy–France scientific
1340
JOURNAL OF PETROLOGY VOLUME 47 NUMBER 7 JULY 2006 by guest on January 7, 2014
http://petrology.oxfordjournals.org/D
ownloaded from
co-operation and by funds for international co-operationfrom the University of Palermo. We wish to thankJ. Barclay, A. Bertagnini and M. Carroll for theirconstructive reviews, and M. Wilson for her carefuleditorial work. Special thanks to Dr. M. Pompilio forthe starting sample and his interest in this project.
REFERENCES
Albarede F. (1995). Introduction to Geochemical Modelling. Cambridge:
Cambridge University Press, 543 pp.
Baker, D. R. & Eggler, D. H. (1987). Compositions of anhydrous and
hydrous melts coexisting with plagioclase, augite and olivine or
low-Ca pyroxene from 1 atm to 8 kbar: application to the Aleutian
volcanic center of Atka. American Mineralogist 72, 12–28
Barberi, F., Rosi, M. & Sodi, A. (1993). Volcanic hazard assessment at
Stromboli based on review of historical data. Acta Vulcanologica 3,
173–187.
Barberi, F., Gandino, A., Gioncada, A., La Torre, P., Sbrana, A. &
Zenucchini, C. (1994). The deep structure of the Eolian arc
(Filicudi–Panarea–Vulcano sector) in light of gravity, magnetic and
volcanological data. Journal of Volcanology and Geothermal Research 61,
189–206.
Barclay, J. & Carmichael, I. S. E. (2004). A hornblende basalt from
western Mexico: water-saturated phase relations constrain a
pressure–temperature window of eruptibility. Journal of Petrology 45,
485–506.
Bartels, K. S., Kinzler, R. J. & Grove, T. L. (1991). High pressure
phase relations of primitive high-alumina basalts from Medicine
Lake volcano, northern California. Contributions to Mineralogy and
Petrology 108, 253–270.
Behrens, H., Romano, C., Nowak, M., Holtz, F. & Dingwell, D. B.
(1996). Near-infrared determination of water species in glasses of the
system MAlSi3O8 (M ¼ Li, Na, K): an interlaboratory study.
Chemical Geology 128, 41–63.
Bertagnini, A., Metrich, N., Landi, P. & Rosi, M. (2003). Stromboli
volcano (Aeolian Archipelago, Italy): an open window on the
deep-feeding system of a steady state basaltic volcano. Journal of
Geophysical Research 108(B7), 2336, doi:10.1029/ 2002JB002146.
Burnham, C. W. (1979) The importance of volatile constituents.
In: Yoder, H. S., Jr (ed.) The Evolution of Igneous Rocks. Princeton,
NJ: Princeton University Press, pp. 439–482.
Clocchiatti, R. (1981). La transition augite–diopside et les liquides
silicates intra-cristallins dans les pyroclastes de l’activite actuelle du
Stromboli: temoignages de la re-injection et du melange mag-
matiques. Bulletin of Volcanology 44, 339–357.
Conte, A. M., Perinelli, C. & Trigila, R. (2004). Cooling experiments
on Stromboli lavas of different serial affinity giving variable crystal
morphologies and phase compositions. Program and Abstracts of
2004 Workshop, Reconstructing eruptive scenarios by field measurements,
physical modelling and laboratory experiments, Napoli: INGV, pp. 29–34.
Corsaro, R. A. & Pompilio, M. (2004). Buoyancy-controlled eruption of
magmas at Mt Etna. Terra Nova 16, 16–22.
Costa, F., Scaillet, B. & Pichavant, M. (2004). Petrological and
experimental constraints on the pre-eruption conditions of Holocene
dacite from Volcan San Pedro (36�S, Chilean Andes) and the
importance of sulphur in silicic subduction-related magmas. Journal
of Petrology 45, 855–881.
Danyushevsky, L. V., Sokolov, S. & Falloon, T. J. (2002). Melt
inclusions in olivine phenocrysts: using diffusive re-equilibration to
determine the cooling history of a crystal, with implications for
the origin of olivine-phyric volcanic rocks. Journal of Petrology 43,
1651–1671.
Devine, J. D., Gardner, J. E., Brack, H. P., Layne, G. D. & Rutherford,
M. J. (1995). Comparison of microanalytical methods for estimat-
ing H2O contents of silicic volcanic glasses. American Mineralogist 80,
319–328.
Di Carlo, I. (2004). Experimental simulation of pre-eruptive conditions
of yellow pumice—Stromboli. Ph.D. thesis, University of Palermo,
96 pp.
Falloon, T. J., Green, D. H., Jacques, A. L. & Hawkins, J. W. (1999).
Refractory magmas in back-arc basin settings—experimental
constraints on the petrogenesis of a Lau basin example. Journal of
Petrology 40, 255–277.
Falsaperla, S., Alparone, S. & Spampinato, S. (2003). Seismic features
of the June 1999 tectonic swarm in the Stromboli volcano region,
Italy. Journal of Volcanology and Geothermal Research 125, 121–136.
Ferry, J. M. & Baumgartner, L. (1987). Thermodynamic models of
molecular fluids at the elevated pressures and temperatures of the
crustal metamorphism. In: Eugster, H. P. & Carmichael, I. S. E.
(eds) Thermodynamic Modelling of Geological Materials: Minerals, Fluids
and Melts. Mineralogical Society of America, Reviews in Mineralogy 17,
323–365.
Francalanci, L., Manetti, P. & Peccerillo, A. (1989). Volcanological and
magmatological evolution of Stromboli volcano (Aeolian Islands):
the roles of fractional crystallization, magma mixing, crustal
contamination and source heterogeneity. Bulletin of Volcanology 51,
355–378.
Francalanci, L., Manetti, P., Peccerillo, A. & Keller, J. (1993).
Magmatological evolution of the Stromboli volcano (Aeolian Arc,
Italy): inferences from major and trace elements and Sr
isotopic composition of lavas and pyroclastic rocks. Acta Vulcanologica
3, 127–151.
Francalanci, L., Tommasini, S. & Conticelli, S. (2004). The volcanic
activity of Stromboli in the 1906–1998 AD period: mineralogical,
geochemical and isotope data relevant to the understanding of the
plumbing system. Journal of Volcanology and Geothermal Research 131,
179–211.
Gaetani, G. A. & Grove, T. L. (1998). The influence of water on the
melting of mantle peridotite. Contributions to Mineralogy and Petrology
131, 323–346.
Gaetani, G. A., Grove, T. L. & Bryan, W. B. (1993). The influence of
water on the petrogenesis of subduction-related igneous rocks. Nature
365, 332–334.
Ghiorso, M. S. & Sack, R. O. (1991). Fe–Ti oxide geothermometry:
thermodynamic formulation and the estimation of the intensive
variables in silicic magmas. Contributions to Mineralogy and Petrology 108,
485–510.
Gust, D. A. & Perfit, M. R. (1987). Phase relations of a high-Mg basalt
from the Aleutian arc: implications for primary island arc basalts and
high-Al basalts. Contributions to Mineralogy and Petrology 97, 7–18.
Holloway, J. R. (1987). Igneous fluids. In: Eugster, H. P. & Carmichael,
I. S. E. (eds) Thermodynamic Modelling of Geological Materials: Minerals,
Fluids and Melts. Mineralogical Society of America, Reviews in Mineralogy 17,
211–233.
Johnson, M. C., Anderson, A. T., Jr & Rutherford, M. J. (1994).
Pre-eruptive volatile contents of magmas. In: Carroll, M. R. &
Holloway, J. R. (eds) Volatiles in Magmas. Mineralogical Society of America,
Reviews in Mineralogy 30, 281–330.
Kawamoto, T. & Hirose, K. (1994). Au–Pd sample containers for
melting experiments on iron and water-bearing systems. European
Journal of Mineralogy 6, 381–385.
Kress, V. C. & Carmichael, I. S. E. (1991). The compressibility of
silicate liquids containing Fe2O3 and the effect of composition,
1341
DI CARLO et al. CRYSTALLIZATION OF HIGH-K BASALT by guest on January 7, 2014
http://petrology.oxfordjournals.org/D
ownloaded from
temperature, oxygen fugacity and pressure on their redox states.
Contributions to Mineralogy and Petrology 108, 82–92.
Landi, P., Metrich, N., Bertagnini, A. & Rosi, M. (2004). Dynamics of
magma mixing and degassing recorded in plagioclase at Stromboli
(Aeolian Archipelago, Italy). Contributions to Mineralogy and Petrology
147, 213–227.
Lindsley, D. H. & Frost, B. R. (1992). Equilibria among Fe–Ti oxides,
pyroxene, olivine and quartz: Part I. Theory. American Mineralogist 77,
987–1003.
Luhr, J. F. & Carmichael, I. S. E. (1980). The Colima volcanic
complex, Mexico. I. Post-caldera andesites from volcan Colima.
Contributions to Mineralogy and Petrology 71, 343–372.
Marsh, B. (1996). Solidification fronts and magmatic evolution.
Mineralogical Magazine 60, 5–40.
Martel, C., Pichavant, M., Bourdier, J.-L., Traineau, H., Holtz, F. &
Scaillet, B. (1998). Magma storage conditions and control of
eruption regime in silicic volcanoes: experimental evidence from
Mt. Pelee. Earth and Planetary Science Letters 156, 89–99.
Martel, C., Pichavant, M., Holtz, F., Scaillet, B., Bourdier, J.-L. &
Traineau, H. (1999). Effects of fO2 and H2O on andesite phase
relations between 2 and 4 kbar. Journal of Geophysical Research 104,
29453–29470.
Medard, E., Schmidt, M. W. & Schiano, P. (2004). Liquidus surfaces of
ultracalcic primitive melts: formation conditions and sources.
Contributions to Mineralogy and Petrology 148, 201–215.
Metrich, N. & Clocchiatti, R. (1996). Sulfur abundance and its
speciation in oxidized alkaline melts. Geochimica et Cosmochimica Acta
60, 4151–4160.
Metrich, N., Bertagnini, A., Landi, P. & Rosi, M. (2001). Crystalliza-
tion driven by decompression and water loss at Stromboli volcano
(Aeolian Islands, Italy). Journal of Petrology 42, 1471–1490.
Metrich, N., Bonnin-Mosbah, M., Menez, B. & Galoisy, L. (2002).
Presence of sulfite (SIV) in arc magmas: implications for volcanic
sulfur emissions. Geophysical Research Letters 29(11),
doi:10.1029/2001GL14607.
Metrich, N., Bertagnini, A., Landi, P., Rosi, M. & Belhadj, O. (2005).
Triggering mechanism at the origin of paroxysms at Stromboli
(Aeolian Archipelago, Italy): the 5 April 2003 eruption. Geophysical
Research Letters 32, L10305, doi:10.1029/2004GL022257.
Morelli, C., Giese, P., Cassinis, R., Colombi, B., Guerra, I., Luongo,
G., Scarascia, S. & Schutte, K. G. (1975). Crustal structure of
Southern Italy. A seismic refraction profile between Puglia, Calabria
and Sicily. Bollettino Geofisica Teorica ed Applicata 17, 183–210.
Muncill, G. E. & Lasaga, A. C. (1987). Crystal-growth kinetics in
igneous systems: one atmosphere experiments and application of a
simplified growth model. American Mineralogist 72, 299–311.
O’Hara, M. J. (1977). Geochemical evolution during fractional
crystallization of a periodically refilled magma chamber. Nature
266, 503–507.
Papale, P. (1997). Modeling of the solubility of a one-component H2O
or CO2 fluid in silicate liquids. Contributions to Mineralogy and Petrology
126, 237–251.
Papale, P. (1999). Modeling of the solubility of two-component
H2O–CO2 fluid in silicate liquids. American Mineralogist 84,
477–492.
Pasquare, G., Francalanci, L., Garduno, V. H. & Tibaldi, A. (1993).
Structure and geologic evolution of the Stromboli volcano, Aeolian
Islands, Italy. Acta Vulcanologica 3, 79–89.
Peccerillo, A. & Taylor, S. R. (1976). Geochemistry of Eocene
calc-alkaline rocks from Kastamonu area, northern Turkey.
Contributions to Mineralogy and Petrology 58, 63–81.
Pichavant, M., Martel, C., Bourdier, J.-J. & Scaillet, B. (2002a).
Physical conditions, structure and dynamics of a zoned magma
chamber: Mount Pelee (Martinique, Lesser Antilles arc). Journal of
Geophysical Research 107(B5), doi:10.1029/ 2001JB000315.
Pichavant, M., Mysen, B. O. & Macdonald, R. (2002b). Source and
H2O content of high-MgO magmas in island arc settings: an
experimental study of a primitive calc-alkaline basalt from
St. Vincent, Lesser Antilles arc. Geochimica et Cosmochimica Acta 66,
2193–2209.
Pownceby, M. I. & O’Neill, H. St. C. (1994). Thermodynamic data
from redox reactions at high temperatures. III. Activity–composition
relations in Ni–Pd alloys from EMF measurements at 850–1250 K
and calibration of the NiO þ Ni–Pd assemblage as a redox sensor.
Contributions to Mineralogy and Petrology 116, 327–339.
Robie, R. A., Hemingway, B. S. & Fisher, J. R. (1979). Thermodyn-
amic properties of minerals and related substances at 298�15 K and
1 bar (105 pascals) pressure and at higher temperatures. US Geological
Survey Bulletin 1452, 456.
Roggensack, K., Hervig, R. L., McKnight, S. B. & Williams, S. N.
(1997). Explosive basaltic volcanism from Cerro Negro volcano:
influence of volatiles on eruptive style. Science 277, 1639–1642.
Rosi, M., Bertagnini, A. & Landi, P. (2000). Onset of the persistent
activity at Stromboli volcano (Italy). Bulletin of Volcanology 62,
294–300.
Roux, J. & Lefevre, A. (1992). A fast quench device for IHPV. European
Journal of Mineralogy 4, 279–281.
Rutherford, M. J., Sigurdsson, H. & Carey, S. (1985). The May 18,
1980, eruption of Mount St. Helens, 1. Melt compositions and
experimental phase equilibria. Journal of Geophysical Research 90,
2929–2947.
Salvioli-Mariani, E., Mattioli, M., Renzulli, A. & Serri, G. (2002).
Silicate melt inclusions in the cumulate minerals of gabbroic nodules
from Stromboli volcano (Aeolian Islands, Italy): main components of
the fluid phase and crystallization temperatures. Mineralogical
Magazine 66, 969–984.
Salvioli-Mariani, E., Renzulli, A., Serri, G., Holm, P. M. & Toscani, L.
(2005). Glass-bearing crustal xenoliths (buchites) erupted during the
recent activity of Stromboli (Aeolian Islands). Lithos 81, 255–277.
Scaillet, B. & Evans, B. W. (1999). The 15 June 1991 eruption of
Mount Pinatubo. I. Phase equilibria and pre-eruption P–T–
fO2–fH2O conditions of the dacite magma. Journal of Petrology 40,
381–411.
Scaillet, B., Pichavant, M., Roux, J., Humbert, G. & Lefevre, A. (1992).
Improvements of the Shaw membrane technique for measurements
and control of fH2 at high temperatures and pressures. American
Mineralogist 77, 647-655.
Scaillet, B., Pichavant, M. & Roux, J. (1995). Experimental
crystallization of leucogranite magmas. Journal of Petrology 36,
663–705.
Schiano, P., Eiler, J. M., Hutcheon, I. D. & Stolper, E. M. (2000).
Primitive CaO-rich, silica-undersaturated melts in island arcs:
evidence for the involvement of clinopyroxene-rich lithologies in
the petrogenesis of arc magmas. Geochemistry, Geophysics, Geosystems 1,
1999GC00032.
Sisson, T. W. & Grove, T. L. (1993a). Experimental investigation of
the role of H2O in calc-alkaline differentiation and subduction
zone magmatism. Contributions to Mineralogy and Petrology 113,
143–166.
Sisson, T. W. & Grove, T. L. (1993b). Temperature and H2O contents
of low-MgO high alumina basalts. Contributions to Mineralogy and
Petrology 113, 167–184.
Speranza, F., Pompilio, M. & Sagnotti, L. (2004). Paleomagnetism of
spatter lavas from Stromboli volcano (Aeolian Islands, Italy):
implications for the age of paroxysmal eruptions. Geophysical Research
Letters 31, L02607, doi:10.1029/20318944.
1342
JOURNAL OF PETROLOGY VOLUME 47 NUMBER 7 JULY 2006 by guest on January 7, 2014
http://petrology.oxfordjournals.org/D
ownloaded from

Taylor, J. R., Wall, V. J. & Pownceby, M. I. (1992). The calibration
and application of accurate redox sensors. American Mineralogist 77,
284–295.
Vaggelli, G., Francalanci, L., Ruggieri, G. & Testi, S. (2003). Persistent
polybaric rests of calc-alkaline magmas at Stromboli volcano, Italy:
pressure data from fluid inclusions in restitic quartzite nodules.
Bulletin of Volcanology 65, 385–404.
Wallace, P. J. (2005). Volatiles in subduction zone magmas: concen-
trations and fluxes based on melt inclusions and volcanic gas data.
Journal of Volcanology and Geothermal Research 140, 217–240.
1343
DI CARLO et al. CRYSTALLIZATION OF HIGH-K BASALT by guest on January 7, 2014
http://petrology.oxfordjournals.org/D
ownloaded from