First experimental evidence for the CO2-driven origin of Stromboli's major explosions
20
SED 3, 411–430, 2011 First experimental evidence for the CO 2 -driven origin A. Aiuppa et al. Title Page Abstract Introduction Conclusions References Tables Figures Back Close Full Screen / Esc Printer-friendly Version Interactive Discussion Discussion Paper | Discussion Paper | Discussion Paper | Discussion Paper | Solid Earth Discuss., 3, 411–430, 2011 www.solid-earth-discuss.net/3/411/2011/ doi:10.5194/sed-3-411-2011 © Author(s) 2011. CC Attribution 3.0 License. Solid Earth Discussions This discussion paper is/has been under review for the journal Solid Earth (SE). Please refer to the corresponding final paper in SE if available. First experimental evidence for the CO 2 -driven origin of Stromboli’s major explosions A. Aiuppa 1,2 , M. Burton 3 , P. Allard 4,5 , T. Caltabiano 5 , G. Giudice 2 , S. Gurrieri 2 , M. Liuzzo 2 , and G. Salerno 5 1 Dip. DiSTeM, Universit` a di Palermo, Italy 2 Istituto Nazionale di Geofisica e Vulcanologia, Sezione di Palermo, Italy 3 Istituto Nazionale di Geofisica e Vulcanologia, Sezione di Pisa, Italy 4 Institut de Physique du Globe, Paris Sorbonne Cit´ e, CNRS UMR 7154, Paris, France 5 Istituto Nazionale di Geofisica e Vulcanologia, Sezione di Catania, Italy Received: 29 March 2011 – Accepted: 9 April 2011 – Published: 19 April 2011 Correspondence to: A. Aiuppa ([email protected]) Published by Copernicus Publications on behalf of the European Geosciences Union. 411
Transcript of First experimental evidence for the CO2-driven origin of Stromboli's major explosions

SED3, 411–430, 2011
First experimentalevidence for the
CO2-driven origin
A. Aiuppa et al.
Title Page
Abstract Introduction
Conclusions References
Tables Figures
J I
J I
Back Close
Full Screen / Esc
Printer-friendly Version
Interactive Discussion
Discussion
Paper
|D
iscussionP
aper|
Discussion
Paper
|D
iscussionP
aper|
Solid Earth Discuss., 3, 411–430, 2011www.solid-earth-discuss.net/3/411/2011/doi:10.5194/sed-3-411-2011© Author(s) 2011. CC Attribution 3.0 License.
Solid EarthDiscussions
This discussion paper is/has been under review for the journal Solid Earth (SE).Please refer to the corresponding final paper in SE if available.
First experimental evidence for theCO2-driven origin of Stromboli’s majorexplosionsA. Aiuppa1,2, M. Burton3, P. Allard4,5, T. Caltabiano5, G. Giudice2, S. Gurrieri2,M. Liuzzo2, and G. Salerno5
1Dip. DiSTeM, Universita di Palermo, Italy2Istituto Nazionale di Geofisica e Vulcanologia, Sezione di Palermo, Italy3Istituto Nazionale di Geofisica e Vulcanologia, Sezione di Pisa, Italy4Institut de Physique du Globe, Paris Sorbonne Cite, CNRS UMR 7154, Paris, France5Istituto Nazionale di Geofisica e Vulcanologia, Sezione di Catania, Italy
Received: 29 March 2011 – Accepted: 9 April 2011 – Published: 19 April 2011
Correspondence to: A. Aiuppa ([email protected])
Published by Copernicus Publications on behalf of the European Geosciences Union.
411
SED3, 411–430, 2011
First experimentalevidence for the
CO2-driven origin
A. Aiuppa et al.
Title Page
Abstract Introduction
Conclusions References
Tables Figures
J I
J I
Back Close
Full Screen / Esc
Printer-friendly Version
Interactive Discussion
Discussion
Paper
|D
iscussionP
aper|
Discussion
Paper
|D
iscussionP
aper|
Abstract
We report on the first detection of CO2 flux precursors of the till now unforecastablelarger than normal (“major”) explosions that intermittently occur at Stromboli volcano(Italy). Automated survey of the crater plume emissions in the period 2006–2010,during which 12 such explosions happened, demonstrate that these events are sys-5
tematically preceded by a brief phase of increasing CO2/SO2 weight ratio (up to >40)and CO2 flux (>1300 t/d) with respect to the time-averaged values of 3.7 and ∼500 t/dtypical for standard Stromboli’s activity. These signals are best explained by the accu-mulation of CO2-rich gas at a discontinuity of the plumbing system (decreasing CO2emission at the surface), followed by increasing gas leakage prior to the explosion. Our10
observations thus support the recent model of Allard (2010) for a CO2-rich gas triggerof recurrent major explosions at Stromboli, and demonstrate the possibility to forecastthese events in advance from geochemical precursors. These observations and con-clusions have clear implications for monitoring strategies at other open-vent basalticvolcanoes worldwide.15
1 Introduction
Steady or/and mildly explosive eruptive activity at many open-vent basaltic volcanoesis occasionally interrupted by sudden large-scale explosions that constitute a majorhazard. These currently unforecastable discrete events thus raise dramatic issues tovolcano hazard managers and pose still unanswered questions to volcanologists: what20
are the trigger mechanisms for such events? Could they be preceded, and henceforecasted, by signals detectable from monitoring networks?
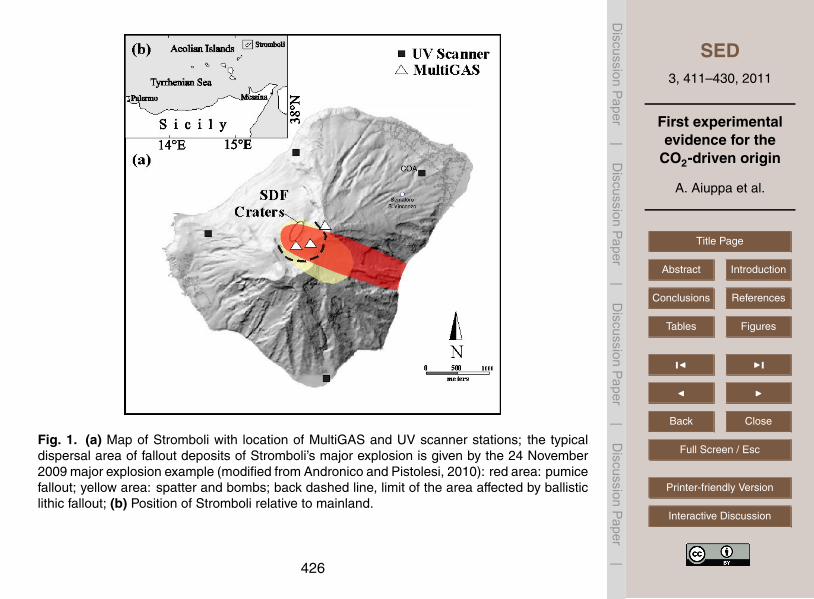
Stromboli volcano (Fig. 1), in Southern Italy, is an archetype for this explosive patternat open-vents basaltic volcanoes. Its regular activity consists of ∼5–20 “Strombolian”-type mild explosions per hour, characterized by 50–200 m high jets of gas and lava25
clots that produce only ∼1 m3 of scoriae and ash (e.g. Chouet et al., 1974; Ripepe et
412

SED3, 411–430, 2011
First experimentalevidence for the
CO2-driven origin
A. Aiuppa et al.
Title Page
Abstract Introduction
Conclusions References
Tables Figures
J I
J I
Back Close
Full Screen / Esc
Printer-friendly Version
Interactive Discussion
Discussion
Paper
|D
iscussionP
aper|
Discussion
Paper
|D
iscussionP
aper|
al., 2008). Intermittently, however, this standard activity is interrupted by more ener-getic explosive events, which range in magnitude from (i) major explosions (∼2–4 peryear, jets >200 m high, ∼100 m3 of erupted material) to (ii) more powerful but rarer“paroxysmal explosions” (∼1 every 5 years, km-sized columns, and ∼104–106 m3 ofdeposits) (Barberi et al., 1993; Bertagnini et al., 1999, 2003, 2008; Rosi et al., 2006).5
These latter explosions are very sudden and eject much coarser (including ballisticblocks) and more widely dispersed tephra than regular activity. They thus represent agreat hazard to the thousands of visitors per year attracted by the spectacular activityof Stromboli and even, occasionally, to the inhabitants of the island. This high volcanicrisk has motivated enhanced interest in the scientific community for a better under-10
standing of both major explosions and paroxysmal events, focused on their dynamics(Rosi et al., 2006; Ripepe and Harris, 2008; Andronico and Pistolesi, 2010), trigger-ing mechanisms (Metrich et al., 2005, 2010; Allard, 2010) and possible precursors(Falsaperla and Spampinato, 2003; Aiuppa and Federico, 2005).
The recent occurrence of two violent paroxysmal explosions, on 5 April 2003 and 1515
March 2007, has deeply improved our state of knowledge for such events. In particu-lar, detailed investigations of melt inclusions entrapped in olivine crystals of the eruptedproducts have led to the conclusion that these paroxysmal explosions were producedby the rapid ascent and decompression of small batches of gas-rich, low porphyric(LP) basaltic magma (Metrich et al., 2005, 2010) – erupted at the surface as highly20
vesiculated “blond” pumice – from a 7–10 km deep magma storage zone (all depthsbeing referred to as below summit vents, bsv). In contrast, the source mechanism ofthe “major” explosions is not yet understood, even though these are far more frequentand, therefore, potentially even more hazardous than paroxysmal events. Recently,Allard (2010) argued for a CO2-rich gas trigger of most of these major explosions: peri-25
odic accumulation of deeply-derived CO2-rich gas bubbles in the sub-volcano plumbingsystem would lead to the growth of bubble foams which, upon collapse, can trigger thefast ascent of large CO2-rich gas slugs driving the explosions (Jaupart and Vergniolle,1989; Woods and Cardoso, 1997; Menand and Phillips, 2007). According to Allard
413

SED3, 411–430, 2011
First experimentalevidence for the
CO2-driven origin
A. Aiuppa et al.
Title Page
Abstract Introduction
Conclusions References
Tables Figures
J I
J I
Back Close
Full Screen / Esc
Printer-friendly Version
Interactive Discussion
Discussion
Paper
|D
iscussionP
aper|
Discussion
Paper
|D
iscussionP
aper|
(2010), major explosions should be heralded by increasing leakage of CO2-rich gas asthe bubble foam approaches instability (Jaupart and Vergniolle, 1989), and the magni-tude of each explosion should be proportional to its source depth or/and the stored gasamount.
It is noteworthy that Aiuppa et al. (2010a) already detected large increases in Strom-5
boli’s CO2 plume flux (>10 times larger than normal) during the 1–2 weeks preced-ing the 15 March 2007 paroxysmal explosion (Fig. 2a). These unusually large CO2emissions were interpreted as reflecting passive gas leakage from decompressingLP magma emplaced at >4 km depth, just prior to its eruption during the paroxysm(Metrich et al., 2010). In this paper, we report on CO2 flux variations measured on10
top of Stromboli in the period 2006–2010, during which 12 major explosions occurred.We find that each of these explosions actually happened after a brief period (days toweeks) of increasing CO2 flux at the crater, following a previous phase of reduced CO2emission. We show that this pattern is consistent with periodic accumulation and re-lease of deeply-derived CO2-rich bubbles in the plumbing system. Our observations15
thus demonstrate a key role of CO2-rich gas in triggering these events, and provide thefirst experimental evidence in support to the model of Allard (2010). We finally discusstheir implications for the forecasting of major explosions in the future.
2 Recorded explosive activity and methods
In a previous work (Aiuppa et al., 2010a), we have reported on results for the May 200620
to November 2008 period, focusing on observations made during the 2007 effusiveeruption (27 February to 2 April) during which the 15 March 2007 paroxysmal explosionoccurred. Here, we extend our observations to the following 3 years of Stromboli’sactivity, from July 2007 to July 2010, during which 12 major explosions took place(Fig. 2). All these events were highly impulsive, generally consisted of a sequence25
of cannon-like blasts from one vent or several vents simultaneously (Andronico andPistolesi, 2010), and had durations of a few tens of seconds to a few minutes at most.
414

SED3, 411–430, 2011
First experimentalevidence for the
CO2-driven origin
A. Aiuppa et al.
Title Page
Abstract Introduction
Conclusions References
Tables Figures
J I
J I
Back Close
Full Screen / Esc
Printer-friendly Version
Interactive Discussion
Discussion
Paper
|D
iscussionP
aper|
Discussion
Paper
|D
iscussionP
aper|
They showered the volcano slopes with coarse lithic blocks, lava bombs and pumicelapilli up to 1–2 km distance from the summit (Andronico and Pistolesi, 2010; Fig. 1), butwithout making casualties nor damages to human settlements. Pumiceous LP basalticmagma was erupted only during the strongest five explosions, on 3 May 2009, 8 and 24November 2009, and 25 and 30 June 2010. These events were actually the largest in5
terms of pyroclastic tephra dispersal, erupted volumes, and recorded amplitude of syn-eruptive seismic and infrasonic signals (web reports from INGV-Catania and Universitadi Firenze). Figure 2 shows that, apart from isolated events (e.g., the 3 May 2009explosion), most of the major explosions succeeded within relatively short intervals:6–17 December 2008 (2 events), 8 November 2009 to 21 January 2010 (4 events),10
and 25–30 December 2010 (2 events). Such a clustering in their occurrence suggestsa common source process or instability in the plumbing system.
Our daily record of the CO2 plume flux from Stromboli summit crater (Fig. 2) hasbeen obtained following the procedure previously described by Aiuppa et al. (2010a).The CO2 plume flux is given by simultaneous measurement of the CO2/SO2 plume ratio15
(semi-continuous survey with three fully automated Multi-GAS instruments; Aiuppa etal., 2009) and the SO2 mass flux, determined by a remotely-controlled network (Fig. 1)of four UV scanning DOAS spectrometers (Burton et al., 2009). CO2 and SO2 concen-trations in the volcanic plume are measured and recorded every six hours, for 30 minand at a frequency of 9 seconds, during four sequential intervals per day (01:00–01:30,20
07:00–07:30, 13:00–13:30 and 19:00–19:30). The typical error associated with our cal-culated CO2 fluxes is ∼40%.
3 Data analysis
Figure 2a shows the results for >4 years of daily survey of the CO2 plume flux fromStromboli, which constitutes one of the most complete and systematic CO2 flux record25
ever acquired on an active volcano. The most prominent feature of the dataset is theexceptional CO2 degassing rate that characterized the February–April 2007 effusive
415

SED3, 411–430, 2011
First experimentalevidence for the
CO2-driven origin
A. Aiuppa et al.
Title Page
Abstract Introduction
Conclusions References
Tables Figures
J I
J I
Back Close
Full Screen / Esc
Printer-friendly Version
Interactive Discussion
Discussion
Paper
|D
iscussionP
aper|
Discussion
Paper
|D
iscussionP
aper|
eruption: the high (>6000 t/d) CO2 fluxes during this period were attributed to a largesupply of CO2-rich gas bubbles from the deep LP magma reservoir (Aiuppa et al.,2010a, b), as a consequence of its likely depressurisation following copious lavadrainage since 27 February 2007 (Bonaccorso et al., 2008). This depressurization-induced CO2 degassing event was thus precursory to fast ascent and eruption of the5
LP magma during the 15 March 2007 paroxysm (Aiuppa et al., 2010a; Metrich et al.,2010). Figure 2a also shows that, as the 2007 effusive eruption ended on 2 April 2007,CO2 fluxes progressively but slowly slowed down, recovering their pre-2007 eruptionlevels only by late summer 2008.
We thus consider the post-September 2008 period (Fig. 2b) as representative of10
the regular degassing regime of Stromboli. From the measured daily CO2/SO2 ra-tios and SO2 fluxes we compute a cumulative degassing of ∼0.36 Mtons of CO2 and∼0.098 Mtons of SO2 between September 2008 and July 2010. Over this period theCO2/SO2 mass ratio thus averaged ∼3.7 and the CO2 emission rate ∼550 t/d (a factor∼2 lower than the time-averaged value estimated by Allard (2010)). However, one also15
observes (Fig. 2b) that the CO2 flux displayed wide temporal fluctuations (from 60 t/dto 7000 t/d) and, in particular, increased noticeably (>1300 t/d) during 4 main phases (Ito IV in Fig. 2b) in which virtually all the major explosions have occurred.
In order to examine in detail the relationship between these phases of high CO2 de-gassing and the occurrence of major explosions, we focus in Fig. 3 on the period from20
22 January to 22 July 2010, during which 3 such events took place. This time intervalstarts just after a major explosion on 21 January that marked the end of the phaseIII (Fig. 2b). Figure 3 shows that over the entire period the SO2 flux remained rela-tively steady and low (mean: 105±46 t/d). In contrast, the CO2 flux varied significantlyin function of the explosive activity. After the 21 January explosion it dropped to a low25
level for about one month then moderately increased until a small-scale major explosionthat occurred on 12 March (among the smallest scale events in the dataset; Ripepe,persoanl communication). Afterwards, it tended to decrease again and preserved amoderate level until early June 2010. Then, it began to sharply increase (phase IV)
416

SED3, 411–430, 2011
First experimentalevidence for the
CO2-driven origin
A. Aiuppa et al.
Title Page
Abstract Introduction
Conclusions References
Tables Figures
J I
J I
Back Close
Full Screen / Esc
Printer-friendly Version
Interactive Discussion
Discussion
Paper
|D
iscussionP
aper|
Discussion
Paper
|D
iscussionP
aper|
by a factor ≥3, keeping high values for ∼2 weeks until 25 June when a strong majorexplosion happened (Fig. 3c). After this event, the CO2 flux slowly decayed, but 5 dayslater a second major explosion succeeded on 30 June. The phase IV ended with anultimate CO2 flux peak increase, but without any consequent explosive event.
Since the SO2 flux remained quite steady during the 6-months considered period, the5
CO2 flux increases registered before and, especially, during that phase IV essentiallyreflect net increases of the CO2/SO2 ratio (from ∼5 to >20) in Stromboli’s bulk plumeemissions, as shown in Fig. 3b. This is also verified by the composition of the gasphase driving the recurrent Strombolian-type explosions in the same period (Fig. 3a).As previously shown (Burton et al., 2007a), the gas phase driving the Strombolian ex-10
plosions is richer in CO2 than the non-explosive passive gas emission, with the lattercontributing most of the bulk gas output and hence determining the bulk plume com-position (Allard et al., 1994, Mori and Burton 2009). Our systematic determinationsin January–July 2010 (using the technique detailed in Aiuppa et al., 2010b) actuallydemonstrate an increasing CO2/SO2 ratio (>40) also during single Strombolian out-15
bursts prior to the strong 25 June major explosion (Fig. 3a). Therefore, we evidencethat an anomalous CO2-rich gas phase, recorded in both quiescent (∼bulk) and explo-sive standard emissions, was reaching the surface days to weeks before this event.We emphasize that similar observations apply to the most significant major explosionsin the period 2008–2010 (phases I to III; Fig. 3b), evidencing a systematic process.20
Owing to both our sequential analysis of the volcanic plume each day and the briefduration of major explosions, we did not get the chance to measure the CO2/SO2 gasratio right during any of these event.
4 Discussion
Our observations, detailed in Figs. 2 and 3, provide experimental support to the pro-25
posed model by Allard (2010) that major explosions at Stromboli would be systemati-cally anticipated by a phase of increasing CO2 degassing, and that the magnitude of
417
SED3, 411–430, 2011
First experimentalevidence for the
CO2-driven origin
A. Aiuppa et al.
Title Page
Abstract Introduction
Conclusions References
Tables Figures
J I
J I
Back Close
Full Screen / Esc
Printer-friendly Version
Interactive Discussion
Discussion
Paper
|D
iscussionP
aper|
Discussion
Paper
|D
iscussionP
aper|
this enhanced degassing should scale to the size of the forthcoming explosion. Ourdataset shows indeed that CO2 flux increase prior to the 15 March 2007, by far thelargest-scale event during the overall 2006–2010 period, was a factor ∼10 greater thanthe increases recorded prior to any of the major explosions in 2008–2010 (Fig. 2). Ittherefore follows that smaller (but still hazardous) explosive events will be preceded by5
smaller and less obvious precursors. Although additional measurements are requiredto strengthen our conclusions, our present results already emphasise that major explo-sions at Stromboli (the strongest ones at least) are preceded by a CO2 flux increase,and tend to cluster in periods when CO2 is being degassed at rates exceeding a crit-ical level, which we tentatively set at ∼1300 t/d (Fig. 2b). This opens new promising10
perspectives for the forecasting of such events in future.The association between major explosions and high CO2 degassing phases also
brings novel lines of evidence to constrain the source mechanisms of these events.Allard (2010) argued that CO2 is heavily implicated in triggering these explosions. Hepointed out that, due to their very high original CO2 content (∼2 wt %), Stromboli’s15
magma batches likely coexist with a large fraction of CO2-rich gas bubbles at crustalconditions. Combined with the low viscosity of Stromboli HK-basalt (∼20 Pa s at 10 kmdepth; Allard, 2010), such a high CO2 content should favour the segregation and henceseparate ascent of deeply-derived CO2-rich gas bubbles through the magma column.Differential bubbly gas flow across the magma column (quiescent degassing) is actually20
responsible for most the volcano gas discharge (Allard et al., 1994, 2008). However,bubble coalescence at depth is required to generate the large gas pockets or slugswhose fast upraise then bursting drive the periodic Strombolian-type explosions (Bur-ton et al., 2007a) and probably the intermittent major explosions as well (Allard, 2010).One common mechanism able to generate large gas slugs through bubble coalescence25
is bubble accumulation at the roof of a magma ponding zone or at a feeder discontinuity(Jaupart and Vergniolle, 1989; Menand and Phillips, 2007). Beneath Stromboli, olivine-hosted melt inclusions indicate the presence of such discontinuities, potentially actingas “gas traps”, at 7–10 km depth below the summit vents (bsv), where a main magma
418

SED3, 411–430, 2011
First experimentalevidence for the
CO2-driven origin
A. Aiuppa et al.
Title Page
Abstract Introduction
Conclusions References
Tables Figures
J I
J I
Back Close
Full Screen / Esc
Printer-friendly Version
Interactive Discussion
Discussion
Paper
|D
iscussionP
aper|
Discussion
Paper
|D
iscussionP
aper|
storage zone likely occurs, and at about the volcano-crust interface (2–4 km depthbsv), where magma may pond and CO2-rich gas bubbles may accumulate to contents>5 wt % (Allard et al., 2008; Metrich et al., 2010). This shallow magma-gas pondingzone is the probable source area for the gas slugs producing the regular explosive ac-tivity (Burton et al., 2007a). If “gas trapping” regularly occurs at those discontinuities,5
the accumulation of CO2-rich bubbles will lead to the growth of bubble-melt foam layers(Jaupart and Vergniolle, 1989; Woods and Cardoso, 1997; Menand and Phillips, 2007).When approaching a critical thickness such foams increasingly leak in a connectedconduit, first passively, then catastrophically as they collapse and coalesce, generatinglarge gas slugs that rapidly rise to the surface (Jaupart and Vergniolle, 1989). Allard10
(2010) proposed that Stromboli’s major explosions may typically result from that pro-cess, however no field validation had yet been obtained to date.
We show below that our CO2 flux dataset actually supports a process of gas bubbleretention, foam leakage and slug-driven explosion. Figure 4a reports the cumulativemasses of degassed SO2 and CO2 in the months preceding the 25 and 30 June major15
explosions. Note that the CO2 scale (left axis) was fitted to be 3.5 times greater thanthe SO2 scale (right), in order to clearly reflect the time-averaged CO2/SO2 weight ratiotypical for the whole period from January to July 2010 (3.7; see above).
The mass of degassed SO2 is a proxy for magma degassing and convective trans-port in the shallow (<3–4 km bsv) conduit system (Allard et al., 1994), because sulphur20
exsolves only in this shallow system (Metrich et al., 2010; Allard, 2010). Figure 4ashows a relatively flat cumulative trend for the SO2 flux and, in particular, no apprecia-ble change in its gradient prior to the 25–30 June explosions. This is fully consistentwith the idea (Bertagnini et al., 1999; Allard, 2010) that the shallow magmatic systemis not or very marginally involved in the generation of major explosions, as indicated25
by the lack of forerunners in surface volcanic activity and seismicity, and by the soonreturn to standard activity after each major explosion. We then conclude that the ratesof SO2 degassing and hence magma transport were in steady-state conditions duringthe months preceding the June 2010 major explosions.
419

SED3, 411–430, 2011
First experimentalevidence for the
CO2-driven origin
A. Aiuppa et al.
Title Page
Abstract Introduction
Conclusions References
Tables Figures
J I
J I
Back Close
Full Screen / Esc
Printer-friendly Version
Interactive Discussion
Discussion
Paper
|D
iscussionP
aper|
Discussion
Paper
|D
iscussionP
aper|
Instead, a more dynamic scenario emerges when the CO2 cumulative trend is con-sidered in concert with SO2. We note, in fact, that the SO2 and CO2 flux cumulativetrends remained almost overlapping in the January–March 2010 period (the CO2/SO2mass ratio remaining close to its time-averaged value of 3.7), but clearly diverged af-ter the 12 March explosion, when the cumulative CO2 flux decelerated relative to SO25
flux. Since the CO2 flux is a proxy for magma supply from the deep LP magma storagezone (Aiuppa et al., 2010b), and SO2 flux is a proxy for magma supply from 2–4 kmdepth, we attribute this CO2-specific deceleration to a phase of partial CO2-rich bubbleretention (and accumulation) somewhere at depth in the plumbing system. This CO2accumulation phase persisted until late May 2010 (Fig. 4a). From the magma flow rate10
constrained by SO2 degassing, and the difference between the amount of CO2 thatwould have been emitted for a steady CO2/SO2 of 3.7 and the actual amount of CO2degassed until late May, we calculate the retention of ∼11,000 tons of CO2 (Fig. 4b)in the system, likely accumulated in a growing foam layer. By early June 2010 theCO2 flux accelerated with respect to the SO2 flux (Fig. 4a), at a quite constant rate,15
suggesting that gas leakage from the foam was now prevailing over gas accumulation(Fig. 4b). This gas leakage did not provoke a significant change in the explosive regimeof the volcano, suggesting that it was very gradual and did not produce significant co-alescence events.
Strikingly, it was when the accumulated CO2 mass had been nearly exhausted that20
the 25 June major explosion occurred (Fig. 4b). However, we also observe that, eventhough decaying after this event, the CO2 flux (and thus the CO2/SO2 plume ratio;Fig. 3b, c) remained much higher than its mean background level in the following daysand weeks, concomitantly with another major explosion on 30 June. Therefore, carbondioxide in excess to its time-averaged supply rate was still available and being released25
for a while after the 25 June explosion.It is noteworthy that we observe a similar (but smaller) cycle of CO2 flux decrease
then increase prior to the 12 March major explosion (Fig. 4b), despite (but coherentwith) its lower energy and duration than the 25 and 30 June events. We thus conclude
420

SED3, 411–430, 2011
First experimentalevidence for the
CO2-driven origin
A. Aiuppa et al.
Title Page
Abstract Introduction
Conclusions References
Tables Figures
J I
J I
Back Close
Full Screen / Esc
Printer-friendly Version
Interactive Discussion
Discussion
Paper
|D
iscussionP
aper|
Discussion
Paper
|D
iscussionP
aper|
that the trends of decreasing followed by increasing CO2 flux in the days or weekspreceding major explosions are fully compatible with passive gas leakage from a pre-viously accumulated, increasingly instable bubble foam layer, soon destined to erupt(Jaupart and Vergniolle, 1989; Woods and Cardoso, 1997; Phillips and Woods, 2001).
Further illustration of this pattern is provided by Fig. 5, in which we have plotted the5
“normalised” cumulative CO2 and SO2 trends for 5 different periods of activity whichall ended with at least one major explosion in the period 2006–2010. The horizontalscale describes the “normalised” time elapsed since a previous explosive event, at thebeginning of which we assume the clock of “gas accumulation” in the system is resetto 0; in other words, the time lag between 0 and 1 denotes the repose interval be-10
tween one explosive phase and the following, and is ultimately the period over whicha complete cycle of gas bubble accumulation-leakage may occur. We find that thenormalised cumulative gas flux trends show similar behaviour in all the 5 consideredintervals: all cumulative SO2 flux curves describe strikingly similar flat trends, while thecumulative CO2 flux trends show (clearly in 4 of the 5 cases) a phase of deceleration15
(relative to the SO2 flux), followed by an acceleration prior to (at t > 0.8) the onset ofa new explosive phase (t= 1). Such similarities in the shapes and timing of the cumu-lative gas flux curves highlight a systematic and reproducible behaviour in the volcanodegassing regime, strongly supporting that a recurrent sequence of CO2-rich gas ac-cumulation, leakage and then explosive release regulates the periodical occurrence of20
major explosions at Stromboli, as actually proposed by Allard (2010).However, a novel and striking implication of our results is that, in terms of mass
balance, passive CO2 bubble release due to foam leakage before a major explosioncould by far prevail over instantaneous explosive gas release during the event itself(Fig. 4b). In other words, slug genesis by foam collapse would involve a comparatively25
minor quantity of the accumulated gas, and the explosions would represent brief ul-timate events superimposed on a dominant process of quiescent gas drainage fromthe plumbing system. This unexpected observation does not fit well with the foam col-lapse model, in which much of the foam empties upon collapse (Jaupart and Vergniolle,
421

SED3, 411–430, 2011
First experimentalevidence for the
CO2-driven origin
A. Aiuppa et al.
Title Page
Abstract Introduction
Conclusions References
Tables Figures
J I
J I
Back Close
Full Screen / Esc
Printer-friendly Version
Interactive Discussion
Discussion
Paper
|D
iscussionP
aper|
Discussion
Paper
|D
iscussionP
aper|
1989). Its quantitative interpretation will require additional measurements and falls be-yond the scope of this paper. Here we just outline that the behaviour of a bubble foamover time strongly depends on the geometry of the gas accumulation zone, on the evo-lution of the gas supply rate from depth, and on the balance between the rates of foamgrowth and foam leakage (Jaupart and Vergniolle, 1989). These latter two rates may5
even equilibrate when the total gas flux approaches a critical value, thus maintainingthe foam in nearly steady sate. Beneath Stromboli, whose eruptive regime involves thegeneration of small slugs every 15 min on average (driving the Strombolian explosions)and of larger slugs 1–3 times per year (producing the major explosions), one cannotexclude that a bubble foam layer (or bubble foams) persistently exist at depth, whose10
leakage could contribute to the time-averaged CO2 emission rate of 6.4 kg s−1 (550 t/d).In that case, much more gas could be available for generating a major explosion thaninferred, for instance, from our data for cumulative CO2 storage prior to the 25 June2010 major explosion (Fig. 4b).
5 Conclusions15
We have analysed a >4 years long record of systematic (daily) measurements of SO2and CO2 gas fluxes from Stromboli volcano in 2006–2010. The results show that themajor explosions which punctuate the volcano’s regular (mildly explosive) activity ap-parently cluster in periods when CO2 is emitted at a higher rate than normal (>1300 t/d).Inspection of gas flux cumulative trends reveals that these explosions appear to be sys-20
tematically preceded by cycles of CO2 retention (CO2 flux decelerates relative to SO2flux) and then passive release (CO2 accelerates relative to SO2). These cycles arecompatible with phases of accumulation and then leakage of a bubble-melt foam layerat depth, until its sudden collapse and the generation of CO2-rich gas pockets whichrapidly rise to the surface and produce a major explosion. Our observations are thus25
fully consistent with the proposed model (Allard, 2010) of a CO2-rich gas trigger ofStromboli’s major explosions. We thus highlight that CO2 flux monitoring can provide
422

SED3, 411–430, 2011
First experimentalevidence for the
CO2-driven origin
A. Aiuppa et al.
Title Page
Abstract Introduction
Conclusions References
Tables Figures
J I
J I
Back Close
Full Screen / Esc
Printer-friendly Version
Interactive Discussion
Discussion
Paper
|D
iscussionP
aper|
Discussion
Paper
|D
iscussionP
aper|
key warning signals for risk mitigation at Stromboli in the future. Finally, we proposethat systematic CO2 flux observations be extended to other open-vent basaltic volca-noes in order to verify whether the processes described here are specific to Strombolior, instead, of general relevance.
Acknowledgements. This work was funded by DPC-INGV project “V2 Paroxysm”, contract5
V2/01 (responsible A. Aiuppa). G. Giuffrida, R. Guida, F. Mure and A. La Spina (all at INGV)are acknowledged for support in the field work.
References
Aiuppa, A. and Federico, C.: Anomalous magmatic degassing prior to the 5th April 2003 parox-ysm on Stromboli, Geophys. Res. Lett., 31(14), 1–4, L14607, doi:10.1029/2004GL020458,10
2004.Aiuppa, A., Federico, C., Giudice, G., Giuffrida, G., Guida, R., Gurrieri, S., Liuzzo, M., Moretti,
R., and Papale, P.: The 2007 eruption of Stromboli volcano: Insights from real-time mea-surements of the volcanic gas plume CO2/SO2 ratio, J. Volcanol. Geoth. Res., 182, 221–230,2009.15
Aiuppa, A., Burton, M., Caltabiano, T., Giudice, G., Guerrieri, S., Liuzzo, M., Mure, F., andSalerno, G.: Unusually large magmatic CO2 gas emissions prior to a basaltic paroxysm,Geophys. Res. Lett., 37 (17), 1–5, L17303, doi:10.1029/2010GL043837, 2010a.
Aiuppa, A., Bertagnini, A., Metrich, N., Moretti, R., Di Muro, A., Liuzzo, M., Tamburello. G.: Amodel of degassing for Stromboli volcano, Earth Planet. Sci. Lett., 295, 195–204, 2010b.20
Allard, P.: A CO2-rich gas trigger of explosive paroxysms at Stromboli volcano, Italy, J. Volcanol.Geotherm. Res., 189, 363–374, 2010.
Allard, P., Carbonnelle, J., Metrich, N., Loyer, H., and Zettwoog, P.: Sulphur output and magmadegassing budget of Stromboli volcano, Nature, 368, 326–330, 1994.
Allard, P., Aiuppa, A., Burton, M., Caltabiano, T., Federico, C., Salerno, G., and La Spina, A.:25
Crater gas emissions and the magma feeding system of Stromboli volcano, in: The StromboliVolcano: An integrated study of the 2002–2003 eruption, edited by: Calvari, S., Inguaggiato,S., Ripepe, M., Rosi, M., AGU Geophys. Monograph. Series, Washington DC, 182, 65–80,2008.
423

SED3, 411–430, 2011
First experimentalevidence for the
CO2-driven origin
A. Aiuppa et al.
Title Page
Abstract Introduction
Conclusions References
Tables Figures
J I
J I
Back Close
Full Screen / Esc
Printer-friendly Version
Interactive Discussion
Discussion
Paper
|D
iscussionP
aper|
Discussion
Paper
|D
iscussionP
aper|
Andronico, D. and Pistolesi, M.: The November 2009 paroxysmal explosions at Stromboli, J.Volcanol. Geotherm. Res., 196, 120–125, 2010.
Andronico, D., Corsaro, R. A., Cristaldi, A., and Polacci, M.: Characterising high energy ex-plosive eruptions at Stromboli volcano using multidisciplinary data: an example from the 9January 2005 explosion, J. Volcanol. Geotherm. Res., 176, 541–550, 2008.5
Barberi, F., Rosi, M., and Sodi, A.: Volcanic hazard assessment at Stromboli based on reviewof historical data, Acta Vulcanol., 3, 173–187, 1993.
Bertagnini, A., Coltelli, M., Landi, P., Pompilio, M., and Rosi, M.: Violent explosions yield newinsights into dynamics of Stromboli volcano, EOS trans AGU, 80(52), 633–636, 1999.
Bertagnini, A., Metrich, N., Landi, P., and Rosi, M.: Stromboli volcano (Aeolian Archipelago,10
Italy): an open window on the deep-feeding system of a steady state basaltic volcano, J.Geophys. Res., 108, 1–15, 2003.
Bertagnini, A., Metrich, N., Francalanci, L., Landi, P., Tommasini, S., and Conticelli, S.: Vol-canology and magma geochemistry of the present-day activity: constraints on the feedingsystem, in: The Stromboli Volcano, An integrated study of the 2002-2003 eruption, edited by:15
Calvari, S., Inguaggiato, S., Ripepe, M., and Rosi, M.: AGU Geophys. Monograph. Series,Washington DC, 182, 19–38, 2008.
Bonaccorso, A., Gambino, S., Guglielmino, F., Mattia, M., Puglisi, G., and Boschi, E.: Stromboli2007 eruption: Deflation modelling to infer shallow-intermediate plumbing system, Geophys.Res. Lett., 35, doi:10.1029/2007GL03292, 2008.20
Burton, M., Allard, P., Mure, F., and La Spina, A.: Magmatic gas composition reveals the sourcedepth of slug-driven strombolian explosive activity, Science, 317, 227–230, 2007a.
Burton, M., Mader, H., and Polacci, M.: The role of gas percolation in quiescent degassing ofpersistently active basaltic volcanoes, Earth Planet. Sci. Lett., 264, 46–60, 2007b.
Burton, M., Caltabiano, T., Mure, F., Salerno, G., and Randazzo, D.: SO2 flux from Stromboli25
during the 2007 eruption: Results from the FLAME network and traverse measurements, J.Volcanol. Geotherm. Res., 182, 214–220, 2009.
Falsaperla, S. and Spampinato, S.: Seismic insight into explosive paroxysms at Stromboli vol-cano, Italy, J. Volcanol. Geotherm. Res., 125, 137–150, 2003.
Jaupart, C. and Vergniolle, S.: The generation and collapse of a foam layer at the roof of a30
basaltic magma chamber, J. Fluid. Mech., 203, 347–380, 1989.Menand, T. and Phillips, J. C.: Gas segregation in dykes and sills, J. Volcanol. Geotherm. Res.,
159(4), 393–408, 2007.
424

SED3, 411–430, 2011
First experimentalevidence for the
CO2-driven origin
A. Aiuppa et al.
Title Page
Abstract Introduction
Conclusions References
Tables Figures
J I
J I
Back Close
Full Screen / Esc
Printer-friendly Version
Interactive Discussion
Discussion
Paper
|D
iscussionP
aper|
Discussion
Paper
|D
iscussionP
aper|
Metrich, N., Bertagnini, A., Landi, P., Rosi, M., and Belhadj, O.: Triggering mechanism atthe origin of paroxysms at Stromboli (Aeolian archipelago, Italy): the 5 April 2003 eruption,Geophys. Res. Lett., 32, L103056, doi:10.1029/2004GL022257, 2005.
Metrich, N., Bertagnini, A., and Di Muro, A.: Conditions of magma storage, degassing andascent at Stromboli: New insights into the volcano plumbing system with interferences on5
the eruptive dynamics, J. Petrol., 51, 603–626, 2010.Mori, T. and Burton, M. R.: Quantification of the gas mass emitted during single explosions
on Stromboli with the SO2 imaging camera, J. Volcanol. Geotherm. Res., 188(4), 395–400,doi:10.1016/j.jvolgeores.2009.10.005, 2009,
Phillips, J. C. and Woods, A. W.: Bubble plumes generated during recharge of basaltic magma10
reservoirs, Earth Planet. Sci. Lett., 186, 297–309, 2001.Ripepe, M. and Harris, A. J. L.: Dynamics of the 5 April 2003 explosive paroxysm observed at
Stromboli by a near-vent thermal, seismic and infrasonic array, Geophys. Res. Lett., 35(7),1–4, L07306, doi:10.1029/2007GL032533, 2008.
Ripepe, M., Delle Donne, D., Harris, A., Marchetti, E., and Ulivieri, G.: Dynamics of Stromboli15
activity, in: The Stromboli volcano, An integrated study of the 2002–2003 eruption, editedby: Calvari, S., Inguaggiato, S., Ripepe, M., Rosi, M., AGU Geophys. Monograph. Series,Washington DC, 182, 39–48, 2008.
Rosi, M., Bertagnini, A., Harris, A. J. L., Pioli, L., Pistolesi, M., and Ripepe, M.: A case historyof paroxysmal explosion at Stromboli: Timing and dynamics of the April 5, 2003 event, Earth20
Planet. Sci. Lett., 243, 594–606, 2006.Woods, A. W. and Cardoso S. S. S.: Triggering basaltic volcanic eruptions by bubble-melt
separation, Nature, 385, 518–520, 1997.
425
SED3, 411–430, 2011
First experimentalevidence for the
CO2-driven origin
A. Aiuppa et al.
Title Page
Abstract Introduction
Conclusions References
Tables Figures
J I
J I
Back Close
Full Screen / Esc
Printer-friendly Version
Interactive Discussion
Discussion
Paper
|D
iscussionP
aper|
Discussion
Paper
|D
iscussionP
aper|
Fig. 1. (a) Map of Stromboli with location of MultiGAS and UV scanner stations; the typicaldispersal area of fallout deposits of Stromboli’s major explosion is given by the 24 November2009 major explosion example (modified from Andronico and Pistolesi, 2010): red area: pumicefallout; yellow area: spatter and bombs; back dashed line, limit of the area affected by ballisticlithic fallout; (b) Position of Stromboli relative to mainland.
426

SED3, 411–430, 2011
First experimentalevidence for the
CO2-driven origin
A. Aiuppa et al.
Title Page
Abstract Introduction
Conclusions References
Tables Figures
J I
J I
Back Close
Full Screen / Esc
Printer-friendly Version
Interactive Discussion
Discussion
Paper
|D
iscussionP
aper|
Discussion
Paper
|D
iscussionP
aper|
Fig. 2. (a) Daily averages of CO2 plume fluxes (in tonnes per day) from Stromboli’s summitcrater, between May 2006 and July 2010 (the weekly mobile average is given as a light greyline). The period from 15 September 2008 to 30 July 2010 is detailed in (b). The dashed areaslabelled I to IV denote the 4 main phases of CO2 flux increase, discussed in the text. Majorexplosions, indicated by the vertical grey lines (and crosses for the strongest ones), typicallyclustered during these phases of high CO2 flux.
427

SED3, 411–430, 2011
First experimentalevidence for the
CO2-driven origin
A. Aiuppa et al.
Title Page
Abstract Introduction
Conclusions References
Tables Figures
J I
J I
Back Close
Full Screen / Esc
Printer-friendly Version
Interactive Discussion
Discussion
Paper
|D
iscussionP
aper|
Discussion
Paper
|D
iscussionP
aper|
Fig. 3. A detail of plume observations taken in the 22 January to 30 July 2010 period.(a) CO2/SO2 ratios of the syn-explosive gas phase (the gas phase released during the dis-crete and short-lived explosions of the regular Strombolian activity); (b) CO2/SO2 ratios of theStromboli’s bulk plume, which is dominantly contributed by passive (quiescent) degassing in-between Strombolian explosions (Burton et al., 2007a); and (c) Daily record of SO2 fluxes (greyline; derived from the FLAMES network of UV scanning spectrometers; Burton et al., 2009) andCO2 fluxes (black curve). CO2 fluxes were calculated by combining the daily averages of thebulk plume CO2/SO2 ratio and SO2 flux.
428

SED3, 411–430, 2011
First experimentalevidence for the
CO2-driven origin
A. Aiuppa et al.
Title Page
Abstract Introduction
Conclusions References
Tables Figures
J I
J I
Back Close
Full Screen / Esc
Printer-friendly Version
Interactive Discussion
Discussion
Paper
|D
iscussionP
aper|
Discussion
Paper
|D
iscussionP
aper|
Fig. 4. (a) Cumulative CO2 (black curve) and SO2 (grey curve) fluxes (in tonnes), from 22 January to 30 July2010. Note that the CO2 scale (left) is 3.5 times greater than the SO2 scale, in order to normalize to the time-averagedCO2/SO2 mass ratio of Stromboli’s emissions. The two cumulative trends are fairly parallel and overlapping in January–March 2010. After the 12 March 2010 major explosion, the cumulative CO2 flux first decelerates (during March to May)and then accelerate (in May–June) relative to SO2 flux. This suggests an episode of gas retention, followed by passivegas leakage, prior to the major explosions on 25 and 30 June (see text). The cumulative masses of stored CO2 (e.g.,CO2 segregated deep in the system, possibly as a bubble foam layer) are calculated (in b) as the difference betweenthe amount of CO2 which would have been degassed in time-averaged conditions (CO2/SO2 of 3.7) and the actual(measured) amount of degassed CO2. Cumulative storage of CO2 occurs at a mean rate of 1.4 kg s−1 from 13 Marchto 22 April, then 2.5 kg s−1 from 23 April to 20 May, resulting in bulk accumulation of ∼11 000 t of carbon dioxide. From21 May to 10 June (20 days), the stored CO2 mass remains nearly steady or slightly decreases. Afterwards it suffersa rapid decrease (at a mean rate of 7.7 kg s−1) until the two major explosions on 25 and 30 June (passive bubble foamleakage widely prevails over bubble storage). A similar (but smaller) cycle of CO2 storage-leakage is observed prior tothe 12 March weaker explosion.
429

SED3, 411–430, 2011
First experimentalevidence for the
CO2-driven origin
A. Aiuppa et al.
Title Page
Abstract Introduction
Conclusions References
Tables Figures
J I
J I
Back Close
Full Screen / Esc
Printer-friendly Version
Interactive Discussion
Discussion
Paper
|D
iscussionP
aper|
Discussion
Paper
|D
iscussionP
aper|
Fig. 5. Normalised cumulative CO2 (black curve) and SO2 (grey curve) flux trends for 5 periodsof activity of Stromboli. The periods over which the cumulative curves were drawn were allselected in order to start (t=0) on the day after the previous explosive event and to end (t=1)with one (or more) major explosions (numbers 1–5 denote the specific explosion(s) occurringat t = 1). Curves 5 for CO2 and SO2 are totally analogous, in the normalised form, to thoseshown in Fig. 4a, and have t= 0 on 13 March and t= 1 on 30 June. The time interval between0 and 1 is thus the period over which a complete cycle of gas segregation-gas leakage canoccur. The 5 sets of normalised cumulative curves show similar shapes which indicate a re-producible degassing regime prior to each major explosion and, hence, a common recurrentsource mechanisms for these events.
430