Electrochemical CO2 Reduction into Chemical Feedstocks
45
TSpace Research Repository tspace.library.utoronto.ca Electrochemical CO2 Reduction into Chemical Feedstocks: From Mechanistic Electrocatalysis Models to System Design Md Golam Kibria, Jonathan P. Edwards, Christine M. Gabardo, Cao-Thang Dinh, Ali Seifitokaldani, David Sinton, Edward H. Sargent Version Post-print/accepted manuscript Citation (published version) Kibria MG, Edwards JP, Gabardo CM, Dinh CT, Seifitokaldani A, Sinton D, Sargent EH. Electrochemical CO2 Reduction into Chemical Feedstocks: From Mechanistic Electrocatalysis Models to System Design. Advanced Materials. 2019 May 16:1807166. Publisher’s Statement This is the peer reviewed version of the following article: Kibria MG, Edwards JP, Gabardo CM, Dinh CT, Seifitokaldani A, Sinton D, Sargent EH. Electrochemical CO2 Reduction into Chemical Feedstocks: From Mechanistic Electrocatalysis Models to System Design. Advanced Materials. 2019 May 16:1807166., which has been published in final form at https://doi.org/10.1002/adma.201807166.. This article may be used for non-commercial purposes in accordance with Wiley Terms and Conditions for Use of Self-Archived Versions. How to cite TSpace items Always cite the published version, so the author(s) will receive recognition through services that track citation counts, e.g. Scopus. If you need to cite the page number of the author manuscript from TSpace because you cannot access the published version, then cite the TSpace version in addition to the published version using the permanent URI (handle) found on the record page. This article was made openly accessible by U of T Faculty. Please tell us how this access benefits you. Your story matters.
-
Upload
khangminh22 -
Category
Documents
-
view
4 -
download
0
Transcript of Electrochemical CO2 Reduction into Chemical Feedstocks

TSpace Research Repository tspace.library.utoronto.ca
Electrochemical CO2 Reduction into Chemical Feedstocks: From Mechanistic Electrocatalysis Models to System Design
Md Golam Kibria, Jonathan P. Edwards, Christine M. Gabardo, Cao-Thang Dinh, Ali Seifitokaldani, David Sinton, Edward H.
Sargent
Version Post-print/accepted manuscript
Citation (published version)
Kibria MG, Edwards JP, Gabardo CM, Dinh CT, Seifitokaldani A, Sinton D, Sargent EH. Electrochemical CO2 Reduction into Chemical Feedstocks: From Mechanistic Electrocatalysis Models to System Design. Advanced Materials. 2019 May 16:1807166.
Publisher’s Statement This is the peer reviewed version of the following article: Kibria MG, Edwards JP, Gabardo CM, Dinh CT, Seifitokaldani A, Sinton D, Sargent EH. Electrochemical CO2 Reduction into Chemical Feedstocks: From Mechanistic Electrocatalysis Models to System Design. Advanced Materials. 2019 May 16:1807166., which has been published in final form at https://doi.org/10.1002/adma.201807166.. This article may be used for non-commercial purposes in accordance with Wiley Terms and Conditions for Use of Self-Archived Versions.
How to cite TSpace items
Always cite the published version, so the author(s) will receive recognition through services that track citation counts, e.g. Scopus. If you need to cite the page number of the author manuscript from TSpace
because you cannot access the published version, then cite the TSpace version in addition to the published version using the permanent URI (handle) found on the record page.
This article was made openly accessible by U of T Faculty. Please tell us how this access benefits you. Your story matters.

Electrochemical CO2 Reduction into Chemical Feedstocks:
From Mechanistic Electrocatalysis Models to System Design
Md Golam Kibria†⊥, Jonathan P. Edwards‡, Christine M. Gabardo‡, Cao-Thang Dinh†, Ali Seifitokaldani†, David Sinton‡, Edward H. Sargent†*
†Department of Electrical and Computer Engineering, University of Toronto, 10 King’s College
Road, Toronto, ON, Canada, M5S 3G4.
⊥Current address: Department of Chemical and Petroleum Engineering, University of Calgary,
2500 University Drive, NW Calgary, Alberta, Canada, T2N 1N4
‡Department of Mechanical and Industrial Engineering, University of Toronto, 5 King’s College
Road, Toronto, ON, Canada, M5S 3G8.
All authors contributed equally to this work.
(*) Correspondence and requests for materials should be addressed to Edward H. Sargent
([email protected]) (E.H.S)
Abstract
The electrochemical reduction of CO2 is a promising route to convert intermittent renewable energy to storable fuels and valuable chemical feedstocks. To scale this technology for industrial implementation, a deepened understanding of how the CO2 reduction reaction (CO2RR) proceeds will help converge on optimal operating parameters. In this Review, we first present a technoeconomic analysis (TEA) with the goal of identifying maximally profitable products and the performance targets that must be met to ensure economic viability – metrics that include current density, Faradaic efficiency, energy efficiency, and stability. We discuss the latest computational understanding of the CO2RR and discuss how this can contribute to the rational design of efficient, selective, and stable electrocatalysts. We classify catalyst materials, according to their selectivity for products of interest and discuss their potential to achieve performance targets. We discuss recent progress and opportunities in system design for CO2 electroreduction. We conclude by highlighting remaining technological challenges and suggesting full cell energy efficiency as a guiding performance metrics for industrial impact.
1. Introduction

Beginning with the industrial revolution, increasing combustion of fossil fuels has led to an escalation in atmospheric CO2 concentrations. These CO2 emissions trap solar energy within the Earth’s atmosphere and contribute to climate change. If global CO2 emissions continue to rise, the Earth is expected to warm 4°C above pre-industrial levels.[1–3] The projected effects of global warming include increased likelihood of extreme weather events, reduced food security, increased competition for fresh water, and species extinction.[4] In response to these projections, a recent global summit on climate change held in Paris in 2015 agreed to take the steps required to limit the temperature rise this century to below 2°C.[5] To limit global warming to these levels, society needs to find means to reduce the rate of global CO2 emissions.[1–3,6,7]
One approach to reduce atmospheric CO2 emissions is to capture CO2 and sequester or utilize it. Utilization includes the conversion of CO2 into value-added products via electrochemical CO2RR. This method, which has recently attracted increased research attention,[8,9] has several advantages. The increased deployment of renewable energy sources, such as wind and solar, is leading to an increasingly variable power supply, and calling for an improved means of energy storage to avoid the curtailment of excess power.[10–13] CO2RR can be scaled to facilitate the large-scale storage of these renewable electrons in the form of chemical products. Since, the products of CO2RR – chemicals and liquid fuels – are today derived from petrochemical sources, their production via CO2RR could reduce global demand for fossil fuels.[14–16] Additionally, certain CO2RR products are in high demand, and thus provide avenues to market adoption.[9,17–19] Liquid fuels produced via CO2RR can be distributed using the existing energy infrastructure, increasing the speed with which renewables-powered CO2 electroreduction can have impact.[20–23]
This Review examines the upgrading of CO2 to chemical feedstocks via electrochemical conversion. We present a TEA to determine which CO2RR products are most attractive from an economic point of view, and which operating parameters have the greatest impact on overall feasibility. Reaction pathways leading to the products of particular interest are highlighted. We also discuss ways in which improved models of electrocatalytic reactions could advance mechanistic understanding of CO2RR and inform better catalyst designs. Next, we discuss the state-of-the-art electrocatalysts and the material engineering techniques employed to enhance their performance. We then examine electrolyzer design and identify the system level parameters, such as reactor configuration, electrolyte, pressure and temperature that govern performance. We conclude by proposing promising routes to advance CO2 electrolyzers toward industrial adoption.
2. Techno-economic analysis of CO2RR
Techno-economic analysis can be used to evaluate the feasibility of the CO2 conversion process, target economically promising products, and identify the performance metrics that must be achieved to reach economic viability.
2.1 Products

Based on the number of electrons transferred during the reaction, CO2RR can produce up to 16 different gas and liquid products, albeit with a wide range of selectivities.[24] Two-electron-transfer products, such as carbon monoxide (CO) and formate (formic acid in acidic media), are readily achieved on a variety of catalysts with high selectivity. Multiple-electron-transfer products, including methanol, methane, ethanol (C2H5OH), ethylene (C2H4), and propanol (C3H8O), have so far been produced with lower selectivity. In addition to carbon-based products, the parasitic hydrogen evolution reaction (HER) can also occur and compete for reaction electrons.
2.2 Market size and price
Market size is critical both in terms of commercial potential and ultimate CO2 utilization potential. In this regard, methane, methanol, ethanol, and ethylene are promising products, with each having a market size larger than 80 million tons (Mtons) per year (Figure. 1a). Methane is the major constituent of natural gas and a precursor for various chemicals. Methanol and ethanol are used as solvents, precursors, and directly as fuels. Ethylene is an important precursor for the polymer industry, especially in the synthesis of polyethylene, the most widely used plastic globally.[25]
Another important consideration for targeted CO2RR products is the market price (US $/ton). Ethanol and ethylene are good targets compared to methanol and methane in view of their higher market price per ton (Figure. 1a). Price is often normalized to the chemical energy stored (equal to the thermodynamic energy required to produce the chemicals from CO2RR, measured in cents/kWh, herein termed energy value) to enable comparison of products requiring different electrical energy input (Figure. 1b). This analysis makes CO, formate, and propanol promising targets. In addition, ethanol and ethylene boast moderate energy values and remain attractive targets due to their large market size.
2.3 System analysis
The levelized cost of the CO2RR products consider both capital and operational costs. Capital costs are derived from CO2 electrolyzer hardware, whereas operational costs arise from the electricity use, CO2 feedstock, and product separation costs. CO2 electrolyzer cost. We leverage the analogy between CO2 and water electrolyzers for an initial estimate of CO2 electrolyzer cost, in the absence of commercial CO2 electrolyzers operating at large scales. In this TEA, we use an electrolyzer cost of 5000 – 15000 $/m2, a range seen in proton exchange membrane (PEM) water electrolyzers.[17]
Operational cost. As in hydrogen production from water electrolysis, electricity costs are the determining factor for the economic feasibility of CO2RR products in most techno-economic models.[17–19,26,27] Due to their higher energy requirements, products containing more C-H and C-C bonds such as ethylene and ethanol, are more sensitive to electricity prices compared to CO and formate, assuming similar energy efficiency and selectivity (Figure. 1d-g). For example, when the electricity price increases 2 cents, the electroproduction cost of CO and formate increases 25%, while that of ethylene and ethanol increases over 33%. With renewable electricity from wind and solar becoming
less expensive, the Department of Energy’s (DOE) target is 2-3 cents/kWh in 2030.[28] These cost reductions, in combination with CO2RR performance improvements, will improve the economics of CO2RR (Figure. 1c).
The cost associated with the CO2 feedstock is dependent on the CO2 capture method. CO2 captured from concentrated CO2 sources, such as power and chemical plants and using amine technology, has the lowest price of 50-70 $/ton with a DOE target of 40 $/ton in the 2020-2025 timeframe.[29] Capturing CO2 from air is more expensive than that from flue gas because of its low concentration: a recent study showed that the cost for CO2 capture from air could potentially reach in the future ~ 100-200 $/ton.[29] In this work, we use a CO2 cost of 40 $/ton for our TEA. Separation cost. In CO2RR, gas separation is required because of the presence of unconverted CO2 in the gas product stream, as well as the generation of unintended products. In addition, liquid product separation is often required to extract products contained in the liquid catholyte. For gas product separation, pressure swing adsorption (PSA) and membrane technologies are currently being used in other industrial processes with similar gas compositions.[30] Pressure swing is generally preferred in CO2RR product separation because of low operating costs and high efficiency. In this work, we use a separation cost of 10 $/ton which is similar to other CO2RR TEAs based on industrial biogas separation with PSA technology[18] and the Sherwood plot for the separation of dilute streams.[19] The capital costs associated with separation are not included in this study.
Liquid product separation can be achieved through distillation, extraction, precipitation, and pervaporation.[30] Among these methods, distillation is the most widely-used approach because the main liquid CO2RR products are alcohols. Compared to gas separation using PSA, liquid separation exhibits a similar capital cost, but a much higher operational cost.[18] Based on the Sherwood plot, a separation cost of 60 $/ton of liquid product is estimated assuming a minimum input of 10 wt % product concentration.[19] Similarly, we apply a separation cost of 60 $/ton for liquid products.
2.4 Performance targets for the CO2RR
In CO2RR, several figures of merit are used to characterize process performance
including current density, Faradaic efficiency (FE), energy efficiency (EE), and stability.
Current density. The current density in the CO2RR reflects the rate of the reaction. In
practical applications, a geometric current density, which is defined as the current flow
per geometric area (i.e. top-view area, rather than physical surface area, which can be
much higher) of the electrode, is used. The current density directly affects the capital cost
because it governs the size of the electrolyzer needed for a given production rate. Using
a base case capital cost of 920 $/m2 for an alkaline electrolyzer configuration, Jouny et
al. estimated that a current density of 250-300 mA/cm2 can enable a viable CO2RR
process. Increasing the current density to 500 mA/cm2 only slightly changed the profit
margin.[18] When a PEM electrolyzer configuration with an assumed capital cost of 15000
$/m2 was used, the current density needed to be much higher than 300 mA/cm2 to make
the conversion of CO2 to ethanol economically viable.[26] In this study, we found that the

production cost significantly increases when the current density decreases from 300 to
100 mA/cm2 (Figure. 1d-g) and only slightly decreases when the current density increases
from 300 to 1000 mA/cm2. Thus, a high current density (usually >300 mA/cm2) is required
to minimize capital investment for a desired CO2RR production rate.
Faradaic efficiency (FE). The FE reflects the selectivity of the current toward a specific
CO2RR product. A high FE minimizes separation requirements and reduces the total
current required for a target production rate. As shown in Figure 1d-g, the production cost
for all products show a strong dependence on FE.[18]
Energy efficiency (EE). The EE is the percentage of the energy stored in the desired
products compared to the total energy input needed to synthesis them. The EE of an
electrolyzer is calculated via the product of the FE and the voltage efficiency. The
voltage efficiency is the thermodynamic cell voltage divided by the actual cell voltage (the
sum of the thermodynamic voltage, reaction overpotentials, and cell losses). The total
electricity cost is dependent on the electricity price (cents/kWh) and the amount of
electricity used in light of the EE and the product energy value. The levelized cost of the
products of interest is sensitive to both variables (Figure.1d-g), indicating that electricity
requirements are a significant portion of the CO2RR product cost. For example, in the
case of ethanol and ethylene (Figure. 1f, g), when the electricity price increase 50% (from
4 to 6 cents/kWh), the production cost increases more than 30%, indicating that the
electricity cost accounts for more than 60% of the product cost. While the electricity price
may be subject to many external factors, the EE of the system can be optimized to reduce
total electricity requirements. This goal can be achieved by increasing the FE and
lowering the cell voltage. Our TEA (Figure. 1c) shows that with a FE of 90% and a cell
voltage of 1.8V, the production cost for several products are lower than current market
price, making their production from CO2RR profitable provided these metrics are
achieved.
Stability. The CO2 electrolyzer must meet the preceding performance targets (current
density, FE, and EE) over a prolonged period of time, typically 60,000-80,000 hours.
Long-term stability is crucial for reducing maintenance and replacement costs, as well as
associated electrolyzer downtime. Long-term CO2RR has not been well studied, with
most of the reports showing a very short testing time (usually < 100 hours). It is noted
that high CO2RR stability requires durability from all components of the electrolyzer
(discussed in Sec. 5). Industrial water electrolyzers have demonstrated stable
performance with operation times over 60,000-80,000 hours, and a similar bar will be
applied to CO2 electrolyzers.[19]
In summary, based on market prices and performance metrics, CO and formate appear the most promising target products for CO2RR . However, low energy density (Figure 1b), limited market of pure CO and formate (Figure 1a), as well as challenges with

storage and transportation have been the key issues in widespread large-scale production of these products. Larger market size, energy dense and long-chain hydrocarbon and oxygenate liquid products, such as ethanol and ethylene, are therefore promising targets to address the issues associated with CO and formate production. As outlined in our TEA, achieving the target performance metrics of current density (>300 mA/cm2), FE (80 - 90%), cell voltage (<1.8 V), and stability (> 60,000-80,000 hours) are required to make these products economically viable.
Figure 1: CO2RR product market and TEA. (a) Market size (Mtons) and market price ($/ton) of common CO2RR products. (b) Energy stored (KWh/Kg) in the CO2RR products and their energy values (current market price per energy unit). (c) Comparison between market price and levelized production cost for CO, formate, ethanol and ethylene. The levelized cost was calculated based on the assumptions: CO2 cost: 40$/ton; electrolyzer cost: 5000 $/m2; electricity price: 2 cents/kWh; cell voltage: 1.8 V; Faradaic efficiency: 90%; Current density: 500 mA/cm2. (d-g) Dependence of levelized cost for CO (d), formate (e), ethylene (f) and ethanol (g) on the electricity price (cents/KWh), cell voltage (V), Faradaic efficiency (FE, %), current density (mA/cm2), capital cost (electrolyzer, $/m2) and CO2 cost ($/ton). The numbers below each parameter correspond to (from left to right) high performance, base case, and low performance, respectively.
3. Computational insight into the reaction mechanisms

CO2RR is a reaction with multiple proton–electron transfer steps leading to carbon-based products and water:
𝑚𝐶𝑂2 + 𝑛(𝐻+ + 𝑒−)
→ 𝑝𝑟𝑜𝑑𝑢𝑐𝑡 + 𝑥𝐻2𝑂 Eq.1
There are three types of bond formation steps in CO2RR: oxygen hydrogenation (O-H), carbon hydrogenation (C-H), and carbon-carbon coupling (C-C). There are two proposed mechanisms for hydrogenation: the Eley–Rideal mechanism, in which H2O and e– are the reactants; and the Langmuir–Hinshelwood mechanism, in which catalyst surface adsorbed hydrogen (*H) is the reactant.
Experimental conditions can be simulated computationally to explore reaction mechanisms . Quantum chemistry calculations consider electron transfer in chemical reactions by calculating the electron structure of the reactants and products. Among different methods developed for quantum chemistry calculations, density function theory (DFT) efficiently calculates the reaction energetics based on the adsorption energies of different reaction intermediates. The calculated reaction energies have an uncertainty of 0.1 eV. However, describing all the complexities of the electrochemical interface within the DFT model, with respect to the number and the type of components (catalyst, solvent molecules, solvent ions, etc.), as well as the physics and chemical implications (electric fields, solvation, free energy, charge transfer, etc.) is challenging due to computational limitations. Early DFT computations assumed that the reaction took place in vacuum, without explicitly considering the water molecules in aqueous electrolytes or the electric field induced by the ions. To include solvation effects, such as hydrogen bonding, the adsorption energies calculated in this approach were corrected by 0.1 eV for CO and CHO, 0.45 eV for OH, and 0.25 eV for R-OH, where R denotes a hydrocarbon.[31–33] However, later studies revealed inaccuracies in calculating reaction energies in this approach. [34–37][38] resulting from the omission of electric field and solvation effects during the simulation. To address these inaccuracies, explicit and implicit solvation models were developed. The explicit solvation model considers the electrolyte in the simulation, allowing it to be more representative of experimental conditions. However, this model requires more computational resources and time compared to the implicit solvation model, which estimates the dielectric of the electrolyte and its effects on chemical bindings based on the Boltzmann-Poison equation in the continuum solvent model.
The combination of the Proton-Coupled Electron-Transfer (PCET) model with the Computational Hydrogen Electrode (CHE) model provides means of determining the chemical potential of protons and electrons by avoiding the explicit treatment of solvated protons.[39] In this model, protons and electrons are paired so that their collective chemical potential is equal to half of the chemical potential of gaseous hydrogen (H2) at a potential of 0 V and pH 0. This approach is widely used to calculate reaction energy barriers of hydrogenation steps as a function of applied potential; however, it does not model non-electrochemical steps, nor can it simulate steps involving only electrons or only protons. Moreover, in the PCET model, changes in pH are not reflected in changes on the Reversible Hydrogen Electrode (RHE) scale.
The electrochemical charge transfer barrier can be modeled either under constant voltage or constant current. Simulations under constant voltage mimic real experimental conditions in which metallic catalysts are poised at a specific potential, but this approach requires a hypothetically infinite model system with computationally expensive boundary

conditions. Although simulations at a constant current require a relatively small cell size, this approach can lead to dramatic potential shifts (~ 2V) due to the changes in the interfacial charge density along the reaction path. Different models have been proposed,[40] considering explicit [41] and implicit water,[34–37] a charged water layer,[42] a solvated proton and surface with excess electrons,[43,44] and surface hydrogenation,[45,46] to provide either constant voltage simulation in a regular unit cell size or constant current simulation without dramatic shifts in surface potential.
3.1 CO and formate formation
CO and formate are the simplest products of CO2RR, needing only two proton-electron pairs. The selectivity of these products depends on the initial binding mode of the first intermediate of CO2 reduction, i.e. *COOH or *HCOO (Figure 2, orange and green pathways, respectively), where * indicates the atom bound to the catalyst. The carboxyl intermediate (*COOH), believed to be formed through a PCET step (in which the proton (H+) and electron (e-) simultaneously transfer to the adsorbed species), leads to CO formation by further hydrogenation and dehydration. A detailed study at pH 7 was performed by Cheng et al. using an explicit water model to study the CO formation pathway.[38] In contrast with previously proposed models, CO formation was shown to proceed from physisorbed CO2 to chemisorbed CO2 (*CO2
δ−), with a free energy barrier of 0.43 eV (Figure 2, top orange pathway). Lower subsequent barriers of *CO2
δ− hydrogenation to form *COOH (0.37 eV) and the dissociation of *COOH to form *CO (0.30 eV) were calculated. In this report, chemisorbed *CO2
δ− species was stabilized through the hydrogen bond network and was considered as a reaction intermediate, not just a transition state.
Formate is formed through the *HCOO intermediate, which is bound to the surface via both oxygen atoms, leaving the C atom available for hydrogenation. This hydrogenation step involves either a surface hydrogen (*H) or a solvated proton (H+) (Figure 2, green pathways). Electrolyte pH regulates the availability and source of hydrogen for this step. A recent study showed that hydrogenation via surface hydrogen is favored because the C-H bond is less polar as compared to the O-H bond.[47] In addition, formate formation was shown to proceed through the direct surface protonation along with electron transfer to the physisorbed CO2.[38] Thus, the competition between CO and formate formation occurs in the first electron-transfer step.
3.2 C1 vs. C2 product formation
CO is considered a key intermediate in the formation of multi-carbon hydrocarbons and oxygenates from CO2RR because similar product distributions result from the direct reduction of CO. These two reactions exhibit similar potential dependencies, further suggesting that the rate determining step occurs after CO formation.[48,49] When activation energy barriers and solvation effects are omitted, CO hydrogenation to formyl (*CHO) is considered the rate determining step, and ethylene is formed by the dimerization of *OCHx species and subsequent deoxygenation.[32,50][51] However, experiments indicate a limiting step common in methane and ethylene formation that is not included in this mechanism.[52] When explicit water is included in the simulation, calculations of the

potential dependent activation energy for the transition state suggest that CO hydrogenation proceeds through the *COH intermediate.[41,42] The subsequent *COH hydrogenation steps result in the *CHx intermediate on the catalyst surface, which was considered as a common precursor for both methane and ethylene formation. Although this mechanism is in better agreement with experimental results, it contradicts experimental findings that pathways to methane and ethylene branch at an early stage of CO2RR.[53,54]
The coupling of two or more C containing intermediates is necessary to generate multi-carbon products. Experimental results for ethylene generation suggest that C-C coupling occurs early on in the reaction pathway based on the low overpotential for C2 products in alkaline electrolytes,[52] C-C coupling occurs before the cleavage of at least one of the C-O bonds in CO2. Consequently, early CO dimerization was proposed as a pathway for CO reduction to ethylene (Figure 2, red pathways), ethanol (Figure 2, blue
pathways), and acetaldehyde.[55] In this mechanism, the rate‐determining step involves an electron transfer to couple two CO molecules. This step generates a *OC-CO intermediate, which is successively transformed into ethylene and ethanol through several PCET steps. Since this rate-determining step only involves an electron transfer, i.e. no proton transfer, the mechanism agrees with experimental observation that ethylene formation is pH independent on the Standard Hydrogen Electrode (SHE) scale. Ethanol, another desirable C2 product, shares several of the same intermediates as ethylene along its pathway (Figure 2, mixed red and blue boxes). While two non-PCET pathways are proposed for ethanol formation (from the *HC-COH and *HC-C intermediates in Figure 2), ethylene pathways always proceed through the PCET mechanism. Surface water either serves as a proton donor for dehydration steps or directly reacts with the adsorbates, thereby playing an important role in modulating the selectivity between hydrocarbons and oxygenates.[56][57] Thus, controlling the surface water concentration is expected to be critical in tuning the ethylene and ethanol selectivity.
Given the mechanism toward multi-carbon products described above, several DFT studies have been performed to determine the influence of reaction conditions. [43] For example, Xiao et al. explored the pH effect on C1 and C2 product formation.[43] At acidic pH, C2/C3 pathways were kinetically blocked. However, at neutral pH, *COH was a common intermediate for both C1 and C2/C3 pathways, where the C–C coupling proceeded through the *CO–COH pathway. Finally, at high pH, early *CO dimerization was the dominant pathway for C2/C3 products, kinetically suppressing the C1 pathways. Thus, high pH conditions shift the selectivity towards multi-carbon products by shutting down C1 pathways.
The effect of the applied potential on C-C coupling mechanisms, and ultimately product distribution, was studied for CO reduction at pH 7.[41] At potentials greater than -0.6 V vs. RHE, CO dimerization had the lowest activation energy barrier (0.69 eV) of the C-C coupling mechanisms. The *OC-CO intermediate is immediately reduced to *OC-COH, and then to *HOC-COH. Notably, the hydrogenation of this final intermediate proceeds with an energy barrier of 0.02 eV, which is smaller than that of the previously proposed *CCO formation (energy barrier of 0.69 eV).[55] At this low applied potential, all hydrogenation steps in the ethylene pathway proceed through the Eley–Rideal mechanism with the protons provided by water molecules. At -0.69 V vs. RHE, the binding energy of surface protons is increased, matching the CO binding energy and resulting in

the competition of *H and *CO for surface sites. Higher surface proton availability at potentials less than -0.85 V vs. RHE leads to *CHO formation, altering the mechanism for ethylene production from exclusively CO dimerization (which does not require surface hydrogen) to the *CO and *CHO coupling mechanism (activation energy barrier of 0.71 eV).[34] At even more negative potentials, the HER activation energy barrier is lowered, thereby causing a decrease in the coverage of adsorbed hydrogen due to their consumption in this parasitic reaction. However, at these extremely negative potentials, the activation energy barrier for C-C bound formation increases, causing the CO dimerization pathway to shut down and the methane formation pathway to proceed through the *CHOH intermediate.[34] These findings suggest that working in the potential range of -0.6 to 0.85 V is beneficial for ethylene formation.
The effects of other reaction conditions on CO dimerization have also been studied. For example, when increasing *CO coverage, it has been shown that *CO binding energy significantly decreases due to the adsorbate-adsorbate lateral repulsion,[58] and consequently, *CO dimerization improves.[33] Simultaneously, *H adsorption becomes more difficult, and the overpotential for HER increases. Moreover, cation-induced electric fields have been shown to reduce the *CO dimerization barrier.[33] Another study demonstrated that cation-induced electric fields and solvation effects together significantly reduce both free and activation energies for *CO dimerization.[42] Furthermore, strain within a catalyst material can change the electronic structure and coordination, which in turn changes the reaction energetics and modulates catalyst selectivity.[59–61] Previous DFT studies have shown that tensile strain improves the *CO dimerization by increasing the adsorption energy of CO and consequently increasing CO surface coverage and suppresses the competing HER.[33,62] Thus, by altering the reaction environment through increased electric fields (e.g. larger cations in the electrolyte), increased CO coverage (e.g. higher CO2 pressure), and/or increased catalyst strain (e.g. engineering a core-shell structure[63]) it is possible to improve the catalytic activity towards multi-carbon products.
Overall, DFT calculations are a helpful tool for understanding CO2RR mechanisms. Many improvements have been made to the predictive capability of DFT, but further advances are necessary to model the complexities of multi-carbon product formation. With the inclusion of all electrochemical system parameters in DFT models, it will be easier to navigate the various C-C coupling mechanisms and multi-carbon pathways currently proposed. Knowing the mechanistic picture can help suggest strategies to shutdown unwanted pathways and improve the selectivity towards the desired products.
3.3 High-throughput computations and microkinetic models
DFT calculations are computationally demanding and cannot practically provide detailed large-scale screening of catalysts and conditions. The ability to predict the reaction energetics based on a few simple descriptors would enable high-throughput computations to optimize catalytic materials while decreasing the total number of DFT calculations. Similarities in the chemical bonds between adsorbed species at different catalytic surfaces, suggest a universal scaling relation. Specifically, adsorption energies of carbon-bound species and oxygen-bound species have been correlated to the adsorption energy of *CO and *OH, respectively.[64] In this case, the limiting potentials of each elementary step were estimated based on the surface affinity for *CO and *OH.

Similarly, in another study, the adsorption energies of CO2RR intermediates, such as *COOH, *COH, and *CHO, were scaled versus the *CO binding energy on close-packed transition metals.[58] These relations provide useful descriptors for high-throughput computations in search of materials with greater catalytic activities. For instance, high-throughput DFT simulations were used to screen Ag-based catalysts for efficient CO production.[65] It was found that p-block dopants modulate reaction energetics by imposing partial covalency into the Ag catalyst, thereby enhancing catalytic activity.
The complexity of accurate electrochemical models does not allow for high-throughput computational screening of the large parameter space of CO2RR variables. Using machine learning, one can leverage the ever-growing datasets for the adsorption energies of different reaction intermediates on different catalysts, to train models for predicting more active and selective CO2RR catalysts without running massive DFT computations in a large variable space, including catalyst type, reactants and reaction environment. There are a few recent studies using machine learning to explore the complex reaction network,[66] find active bimetallic facets for CO2RR,[67] or identify alloys for CO2RR and HER,[68] but this tool has great promise to aid in the design of next-generation, highly active catalyst materials.
DFT computations calculate the reaction free energy and activation energy barrier for each elementary step along a reaction pathway. From these calculations, the onset potential and the potential determining step can be ascertained. The onset potential is useful in determining the catalytic activity towards a certain reaction. However, microkinetic models are needed to use the DFT calculated activation energy barriers to determine the reaction rates, the catalytic activity, the product distribution, and the current density under real experimental conditions. Several microkinetic models on Ag[69] and Cu[34] have been proposed, but further work is needed to produce comprehensive models capable of accurately predicting the CO2RR product distribution under different applied potentials, pH, electrolyte concentrations, partial pressures, and temperatures.

Figure 2: Different proposed pathways for CO2RR products. Each arrow is a PCET step, except where otherwise indicated. The label +*H indicates surface hydrogenation rather than hydrogenation via a proton ion in the electrolyte (H+). The CO pathway (yellow arrows) is separated from formate pathway (green arrows) at first reduction step. The ethylene pathway (red arrows) is distinguished from the ethanol pathway (blue arrows), and the key branching intermediates are colored in both blue and red.
4. Catalysts for CO2 electroreduction
Over the last few decades, several catalysts have been explored to reduce the activation energy barrier for CO2RR. The ability of a catalyst to reduce the energy barrier depends on the binding energies of specific reaction intermediates along the pathway to the different CO2RR products, thereby directly influencing the final product distribution. As a result, electrocatalyst materials can be divided into three main groups based on their tendency to bind various CO2 reaction intermediates and generate certain products. Group 1 catalysts weakly bind the *CO2
− intermediate, resulting in the selective production of formate. Group 2 catalysts bind with the *CO2
− intermediate and the following *COOH intermediate strong enough for subsequent reduction to *CO. Weak binding of the *CO intermediate results in the production of CO from Group 2 catalysts. Finally, Group 3 catalysts bind to all the previously mentioned intermediates, including *CO, and can further reduce the *CO intermediate to form multi-carbon products, including hydrocarbons and oxygenates. Figure 3 summarizes performance achieved for the products of interest determined by the TEA using CO2RR catalysts from Groups 1 to 3.

Figure 3: Summary of CO2RR performance . (a) kernel density estimation of Faradaic efficiency and corresponding overpotential, the background color intensity represents the density of data points. (b) Maximum Faradaic efficiency and its corresponding current density.
4.1 Selective production of formate
Group 1 catalysts include p-block metals (e.g., Sn, In, Pb, Ti, Hg, Cd, and Bi) which are selective for formate production. Strategies such as structuring and catalyst doping have been employed to improve the selectivity of these catalyst materials. For example, Zheng et al. reported a three-fold enhancement in formate selectivity using a sulfur-modulated Sn catalyst (Sn(S)/Au) as compared to a Sn nanoparticle/Au catalyst,[70] which was attributed to the S-induced undercoordinated sites of the Sn nanoparticles. The Sn(S)/Au catalyst exhibited a FEHCOO
- up to 93% at -0.75 V vs RHE for over 40 hours. Recently, Garcia de Arquer et al. demonstrated a 2D Bi-based catalyst derived from a BiOBr template for highly selective (>90% FE) and stable CO2 reduction at 200 mA/cm2.[71] In situ grazing-incidence wide-angle X-ray scattering (GIWAXS) and X-ray absorption spectroscopy (XAS) studies reveal the preferential exposure of highly active
Bi (11̅0) facets in this oxyhalide-derived catalyst are the source of the high selectivity. Apart from the p-block metal catalysts, a few other catalysts show great promise for
formate production at low overpotentials. Gao et al. reported a partially oxidized Co 4-atomic layer catalyst that achieved FEHCOO
- up to 90% at -0.24 V vs RHE for over 40 hours.[72] The Tafel slope of 44 mV dec-1 suggested the enhanced CO2 adsorption capability of the layered catalyst accelerated CO2 activation. In addition, Pd has produced formate at low overpotentials, but CO poisoning of the catalyst has limited stable operation.[73] To circumvent the CO poisoning effect, Klinkova et al. synthesized Pd nanoparticles containing an abundance of high-index facets and surface kinks to weaken the CO binding affinity.[74] This catalyst was stable for over six hours and was able to achieve a FE > 90% at -0.2 V vs RHE. In brief, CO2RR to formate has achieved the target performance metrics (i.e., overpotential, current density) to be economically viable.
Although it has the highest energy value (Figure. 1b), limited industrial use of formate (Figure. 1a) has been the key hindrance for its widespread industrial production via CO2RR.
4.2 Selective production of CO With their selective production of CO, the most common Group 2 electrocatalyst
materials include Au and Ag, which have weak binding of the *CO intermediate.[75] Several nanostructuring strategies have been reported to enhance the selectivity and reduce the overpotential of Au and Ag, by increasing their surface area, edge sites, strain, or low coordinated sites. For example, Liu et al. designed a catalyst that significantly boosted local electric fields, enhancing the local concentration of electrolyte cations (Figure. 4A) and CO2, through ultrasharp nanoneedle structuring of Au (Figure. 4B) .[76] Tafel analysis showed faster kinetics of the first electron transfer for the Au nanoneedles as compared to Au nanorods and Au nanoparticles. As a result, the authors attained high FE (>95%) and current density (22 mA/cm2) for CO generation with very low overpotential (0.24 V) using Au nanoneedles (Figure. 4C). Similarly, performance enhancements have been reported on oxide-derived (OD) nanostructured Ag catalyst.[77] OD catalysts prepared by electrochemically reducing Ag2O demonstrated higher activity for CO2RR to CO than polycrystalline Ag. The OD Ag required 0.49 V less overpotential than polycrystalline Ag (0.89 V) to achieve a FECO of 80%. The reduction in overpotential is
attributed to the OD Ag’s low‐coordination surface sites, which enhance the stabilization of the *COOH intermediate. Moreover, OD Au catalysts, prepared by electrochemically reducing a thick Au oxide film, can also exhibit a high FECO (>96%) at low overpotentials (0.24 V) compared to their polycrystalline Au counterparts (Figure. 5A).[78] Further studies on OD Au demonstrated a large presence of grain boundaries (GB), which was linearly correlated with surface-area-normalized activity for CO2RR (Figure. 5B).[79] Recently, Mariano et al. verified the high CO2RR selectivity for GBs using scanning electrochemical cell microscopy.[80] It was revealed that GBs create catalytically active strained regions in polycrystalline Au by stabilizing dislocations. Distinct from dislocation-induced strain effects, GBs may also create high step densities that are catalytically active for the CO2RR. Atomistic modelling has revealed a deeper understanding of the catalytic activity of GB on Au surfaces, including broken scaling relations[81] and broken local spatial symmetry near the GB.[82] In summary, OD nanostructuring of the catalyst has been demonstrated to be an effective strategy to enhance the activity and reduce the overpotential for CO production. However, the current understanding of the key underlying mechanism is inconclusive and requires further study.

Figure 4: (a) Surface K+ density and current density distributions on the surface of Au needles. The tip radius is 5 nm. (b) Scanning electron microscopy (SEM) image of Au nanoneedles. (c) CO Faradaic efficiencies on Au nanoneedles (red), Au nanorods (blue), and Au nanoparticles (black) at different applied potentials.[76]
Apart from structural effects, a number of reports have highlighted the effect of adsorbed species on CO2RR activity to CO. For instance, Hsieh et al. fabricated a Ag nanocoral electrocatalyst in the presence of aqueous chloride anions which demonstrated a FECO of 95% at an overpotential of 0.37 V.[83] The presence of chloride ions on the surface of Ag nanocorals more than doubles the FECO as compared to chloride-free Ag nanocorals. Analogous effects pertaining to adsorbed chloride and cyanide anions has been observed on Au electrodes.[75,76] Likewise, the introduction of small organic molecules on the surface of Ag nanoparticles was reported to be an effective way to improve the CO2RR activity.[85] Detailed DFT studies suggest the attachment of amine molecules to Ag nanoparticles destabilizes hydrogen binding, and thereby suppresses HER.[85] Further in operando studies may elucidate the role of adsorbed species in enhancing selectivity, thereby assisting in the rational design of catalyst-adsorbed species combinations for selective CO production.
In an effort to reduce catalyst expense, metal-free carbon based materials have received attention due to their electrocatalytic activity for CO2RR.[86] Wu et al. reported a nitrogen-doped carbon nanotube (NCNT) catalyst which obtained a FECO of 80% at an overpotential of 0.26 V.[87] This performance was attributed to an optimum binding energy, yielding strong *COOH adsorption and *CO desorption. Further studies on NCNTs revealed that the catalytic activity is very dependent on the density and type of nitrogen defect.[88] In a separate study, nitrogen defect incorporated 3D graphene exhibited superior activity as compared to Ag and Au, achieving a FE of 85% at a lower overpotential of 0.47 V.[89] Pyridinic N is found to be the most active site in carbon matrix for CO2RR as reported in a number of studies. In general, the development of metal-free carbon-based materials for CO2RR is promising owing to their tailored porous structure, high resistance to acids and bases, high-temperature stability and environmental friendliness. Heteroatom (e.g., S, N, B etc.) doping has shown great potential in enhancing the selectivity of metal-free carbon-based materials. Elucidating the exact active sites in carbon matrices may aid in the rational design of highly selective catalysts towards the products of interest.

Figure 5: (a) FEs for CO and formate production on oxide-derived Au and polycrystalline Au electrodes at various potentials between −0.2 and −0.5 V in 0.5 M NaHCO3, pH 7.2. Dashed line indicates the CO equilibrium potential, reprinted with permission from[78] (b) Measured specific partial current for CO and GB surface density in Au nanoparticle on carbon nanotubes at low overpotentials, reprinted with permission from[79] (c) Schematic of the oxidation-reduction process of Cu foil, reprinted with permission from [90] (d) FE for CO and HCOOH vs. applied potential, reprinted with permission from [90]
In summary, great progress has been made in the production of CO from CO2RR with
the reported selectivity, current density and overpotential exceeding the minimum performance targets for economic viability, making it likely the first target product for large scale CO2 electrolyzers. Considering the fact that pure CO does have a small market (Figure. 1a), it would be worth pursuing a two-step tandem electrochemical system wherein the produced CO can further be electrochemical reduced (CORR)[91] to more energy value fuels.[26] Alternatively, a downstream process (e.g., Fischer-Tropsch or fermentation) [26,92] can be pursued in conjunction with CO2 electrolysis to upgrade CO.
4.3 Selective production of multi-carbon products
As the only metal catalyst in Group 3, Cu can produce up to 16 different products,[24] including various hydrocarbons and alcohols, due to its ability to bind and further reduce the *CO intermediate. In a recent study, Dinh et al. demonstrated that thermally deposited

Cu nanoparticle can exhibit ~83% selectivity towards C2+ products, with ethylene (66%) the primary product at 275 mA/cm2 and -0.54 V vs RHE.[93] This result indicates that unmodified Cu can be highly selective for C2+ products.
Due to the variety of possible products, many strategies have been explored to tune the product selectivity on Cu including morphological and compositional modifications of the catalysts. Similar to Au and Ag, a number of studies have explored the use of OD Cu for the enhancement of CO2RR activity at lower overpotential (Figure. 5C,D).[90,94,95] While high selectivity towards multi-carbon products has been demonstrated on OD Cu[96] at low overpotentials, the underlying mechanism is yet to be well understood, and is often pointed to crystallite sizes and facets, strains, GBs, and rise in local pH. A number of works have reported that the OD Cu catalyst possesses an abundance of GBs, shown to be strong CO-binding sites, enabling these catalysts to be highly active in CO reduction to multi-carbon products.[91,97–99] The unique catalytic activity of OD Cu has also been attributed to internal strain.[97] The presence of microstrain in GB-rich Cu nanoparticles was revealed using transmission electron microscopy (TEM) studies and Williamson-Hall analysis of the X-ray diffraction patterns. However, it remains unclear how such a small amount (< 0.2%) of microstrain in the GB-rich Cu can significantly alter the binding energy of the reaction intermediates.
Differences in the oxidation state of Cu is another potential factor that may alter CO2RR activity.[92,93] For example. Handoko et al. reported selective reduction of CO2 to ethane and ethanol on thick OD Cu electrodes which they attributed to the stabilization of *CH3 intermediates by Cu+.[96] Various studies [100,101] have utilized bulk sensitive in situ X-ray absorption near-edge structure (XANES) spectroscopy to show that Cu+ is stable during the course of CO2RR, a finding recently supported by another study using in situ soft XAS measurements (Figure. 6a,b).[102] These findings enable high selectivity towards C2 products to be attributed to the residual Cu+.[101]
In contrast to the above reports on the crucial role of Cu+, other groups have reported that Cu+ is rapidly reduced and remains as Cu0 under reducing conditions.[103] For example, using surface sensitive in-situ Raman spectroscopy with selected-ion flow tube mass spectrometry, Mandal et al. did not detect CO2RR products as long as Cu2O was present at the catalyst surface (Figure. 7).[104] Their DFT studies suggested that the reduction of Cu2O is favored both kinetically and energetically over CO2RR. In another
work, the stability of residual oxides was investigated by synthesizing 18O‐enriched OD Cu catalysts and measuring the 18O content via ex situ secondary‐ion mass spectrometry measurements.[105] Only <1 % of the original 18O content remained after only ∼10 min of reaction at −1.0 V vs RHE, indicating that residual oxides are unstable in OD Cu catalysts. Eilert et al. recently performed in situ ambient pressure X-ray photoelectron spectroscopy (APXPS) and TEM electron energy loss spectroscopy (TEM-EELS) to reveal the presence of residual surface oxygen (e.g., Cu2O or Cu(OH)2) and trapped subsurface oxygen during reaction.[106] On the catalyst surface, pure metallic phase Cu was revealed; however, the presence of subsurface oxygen was correlated with higher C2 selectivity, with the enhancement attributed to changes in the electronic structure of the Cu that enhance the binding of *CO. DFT studies further support that subsurface oxygen enhances the adsorption energy, and consequently, the surface coverage of *CO on Cu (100).[107] As a result, the probability of CO dimerization is increased, which is the rate determining step towards C2 products. Moreover, Cavalca et al. determined that the
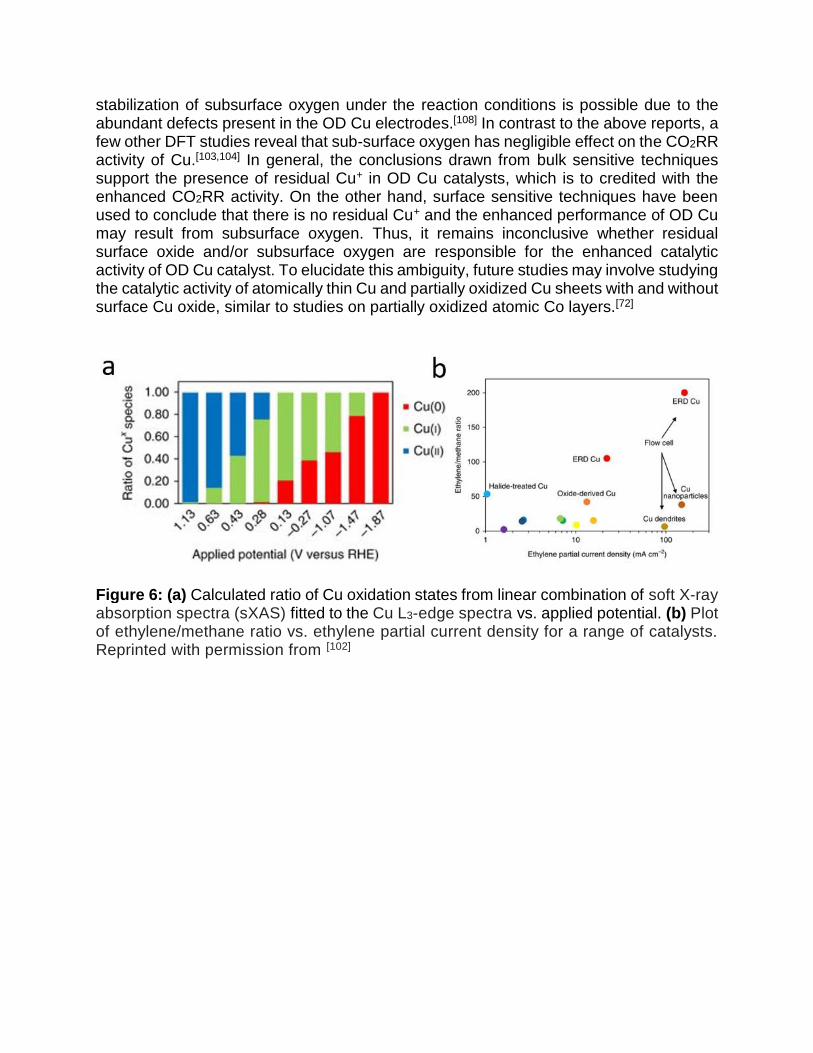
stabilization of subsurface oxygen under the reaction conditions is possible due to the abundant defects present in the OD Cu electrodes.[108] In contrast to the above reports, a few other DFT studies reveal that sub-surface oxygen has negligible effect on the CO2RR activity of Cu.[103,104] In general, the conclusions drawn from bulk sensitive techniques support the presence of residual Cu+ in OD Cu catalysts, which is to credited with the enhanced CO2RR activity. On the other hand, surface sensitive techniques have been used to conclude that there is no residual Cu+ and the enhanced performance of OD Cu may result from subsurface oxygen. Thus, it remains inconclusive whether residual surface oxide and/or subsurface oxygen are responsible for the enhanced catalytic activity of OD Cu catalyst. To elucidate this ambiguity, future studies may involve studying the catalytic activity of atomically thin Cu and partially oxidized Cu sheets with and without surface Cu oxide, similar to studies on partially oxidized atomic Co layers.[72]
Figure 6: (a) Calculated ratio of Cu oxidation states from linear combination of soft X-ray absorption spectra (sXAS) fitted to the Cu L3-edge spectra vs. applied potential. (b) Plot of ethylene/methane ratio vs. ethylene partial current density for a range of catalysts. Reprinted with permission from [102]

Figure 7: Left panel, Raman spectra of Cu oxide before (red) and after CO2RR (green), middle panel, chronopotentiometry (CP) curve of Cu oxide; right panel, selected-ion flow tube mass spectrometry (SIFT-MS) curves showing the evolution of different products over time. Reprinted with permission from [104] Cu-based metal alloys have also garnered interest due to their ability to tune product selectivity by modulating the stability of key reaction intermediates. In one report, Hoang et al. created an electrodeposited Cu-Ag alloy, containing 6% Ag, which demonstrated a FE for C2H4 and C2H5OH of nearly 55% and 26%, respectively, at a cathode potential of -0.7 V vs RHE.[111] In situ Raman revealed the origin of the high selectivity to be the optimum availability of the *CO intermediate and the enhanced stabilization of the Cu2O overlayer. Lee et al. used an electrochemical co-deposition technique to create phase-blended Ag-incorporated biphasic Cu2O-Cu catalysts. The Ag doped phase-blended catalysts exhibited a three-fold higher ethanol selectivity (FEC2H5OH 34.15%) than that of the Cu2O without Ag dopant (10.5%). The Ag-Cu biphasic boundaries were thought to suppress HER and increase *CO mobility from Ag to Cu sites.[112] Ren et al. tuned the Zn content in a series of OD CuxZn catalysts to achieve a FEC2H5OH of 29.1%.[113] Further, Ma et al. reported high selectivity (>60%) towards C2 chemicals using phase-separated CuPd alloys.[114] The geometric arrangements of the Cu and Pd rather than the electronic effect were reported to be the key in tuning the product selectivity. In addition, Xu et al. found that the incorporation of Au not only stabilizes Cu nanoparticles, but also lowers the overpotential for CO2RR.[115] Jia et al. reported an electrodeposited Cu-Au alloy (Cu63.9Au36.1), which exhibited an alcohol selectivity of 28% in contrast to 5% on the bulk Cu catalyst.[116] Kim et al. performed a systematic study on bimetallic Cu-Au nanoparticle monolayers and concluded that synergistic electronic and geometric effects govern the binding energies of the key intermediates along the alcohol pathway.[117] In brief, rationally designed Cu-based metal alloys have shown great promise in enhancing the selectivity of CO2RR towards multi-carbon alcohols.
Metal-free carbon electrode materials have also been reported for CO2RR to hydrocarbons and oxygenates.[86] Jingjie et al. reported a N-doped graphene quantum dot catalyst with a selectivity towards ethylene and ethanol of 45%. The high selectivity was attributed to the synergistic effect of the nanostructuring, yielding highly exposed edge sites, and the heteroatom N doping (Figure 8 a,b).[118] Liu et al. reported a B- and N-co-doped nanodiamond catalyst,, with very high ethanol selectivity (FE of 93.2 %) at −1.0 V vs. RHE.[119] The combination of B and N co-doping and the balance between the

N content and H2 evolution potential were key for achieving high ethanol selectivity. Liu et al. reported that nitrogen doped nanodiamond (NDD) can serve as a promising catalyst for the formation of acetate (Figure. 8 c,d).[120] Faradaic efficiency of 92% for acetate production has been demonstrated at -0.8 to -1.0 V vs RHE. Based on the XPS analysis, the authors reasoned the high activity to the presence of N-sp3C active sites as well as high overpotential for HER on NDD catalyst.
While significant progress has been made in synthesizing Cu and carbon-based catalysts for multi-carbon products, to date the reported performance is well below the performance targets to ensure economic viability, especially with respect to current density and EE. However, it is worth pursuing systematic further studies on Cu based metal alloys and carbon materials, since cooperative and synergistic effects of different materials may lead to further enhancements of overall performance.
Developing and demonstrating novel CO2RR catalyst materials increasingly relies upon parallel innovation in system design to optimize the reaction environment (i.e., electrolyte, temperature, pressure). The main systems architectures and the opportunities they present are discussed in the following sections.
Figure 8: (a) High-magnification TEM image of N-doped graphene quantum dots. Scale bar,2 nm. Inset shows a single N-doped graphene quantum dot containing zigzag edges as circled. The yellow line outlines the zigzag edge. Scale bar in inset, 1 nm. [118] (b) FEs of carbon monoxide (CO), methane (CH4), ethylene (C2H4), formate (HCOO−), ethanol (EtOH), acetate (AcO−) and n-propanol (n-PrOH) at various applied cathodic potentials N-doped graphene quantum dot.[118] (c) SEM images of N-doped nanodiamond/Si rod array.[120] (d) FE for acetate and formate production for CO2RRon a N-doped nanodiamond/Si rod array electrode at −0.55 to −1.30 V vs. RHE.[120]

5. System design for CO2 electroreduction
Many CO2RR studies have focused on catalyst development and optimization, with most of the performance testing conducted in traditional H cell reactors. In this configuration, CO2RR is a batch process where the reacting CO2 is dissolved in the liquid electrolyte. Such reactors make use of common carbon electrode substrates, such as glassy carbon or carbon paper, allowing for simple catalyst deposition and rapid screening of various catalysts. The stability of these systems is generally on the order of tens of hours. Given the simplicity of the experimental system, the measured performance can usually be directly attributed to the catalyst, albeit within the limitations of H cell conditions. In H cells the current density is limited (typically under 100 mA/cm2) by the available CO2 dissolved in the electrolyte, which is only 34 mM at room temperature.[121] However, as highlighted in our TEA, the current density must be greater than 300 mA/cm2 for industrial application. Thus, alternative electrolyzer architectures are being pursued for large-scale implementation. Inspiration for these flow cell designs come from water electrolyzers, a similar electrochemical technology to CO2 electrolyzers that have scaled efficiently to meet commercial demands.
5.1 Electrolyzer types
Inspired by water electrolyzers, three main architectures have emerged for CO2 electrolyzers: liquid phase, gas phase, and solid oxide electrolyzers (Figure. 9). With CO2RR taking place on the cathode of each type of reactor, the anode reaction is the well-studied oxygen evolution reaction (OER) borrowed from water electrolyzers. A summary of these electrolyzer architectures is presented in Table 1 with each configuration outlined below.
Liquid phase electrolyzer
A common flow cell architecture is the liquid phase electrolyzer, similar to alkaline electrolyzers. They consist of three flow channels, one for the each of the CO2 gas, catholyte, and anolyte as shown schematically in Figure 9. A gas diffusion electrode separates the catholyte and gas channel. The catalyst layer, located on the liquid facing front of the gas diffusion electrode, contacts the electrolyte while gas phase CO2 is continuously delivered to the catalyst through the back of the gas diffusion electrode. The catholyte and anolyte liquid streams are separated by an ion-exchange membrane, which serves several purposes. First, it prevents CO2RR products from crossing over to the anode where they can be oxidized back into CO2. In addition, ion-exchange membranes restrict evolved O2 at the anode from crossing-over to the cathode and stealing electrons for ORR that could otherwise be used for CO2RR. The choice of ion-exchange membrane, cation exchange membrane (CEM), anion exchange membrane (AEM), or bipolar membrane (BPM) depends on the products of interest. For ionic CO2RR products, using the opposite type of ion exchange membrane (i.e., a CEM for an anionic species, like formate) can prevent product crossover and loss.[122] Moreover, the selection of suitable membranes should also be based on the pH of the electrolytes used. For example, Dufek

et al. extended the lifetime of their syngas (CO and H2) producing cell with an AEM, by maintaining a high anode pH.[123] Another approach is to remove the membrane, and rely on laminar electrolyte flow to mitigate cross-over, akin to microfluidic fuel cells.[124,125] Removing the membrane reduces ohmic loss, simplifies the system requirements, decreases capital costs, and alleviates salting out issues.[126,127] However, this approach is not suitable for electrolyzers that generate liquid products while operating with recirculating electrolyte. In addition, it is difficult to maintain the laminar flow barrier when scaling these systems up in size, manifold length, and current density.
Liquid phase electrolyzer has achieved high current densities toward CO,[128–133] formate,[134–136] and multi-carbon hydrocarbons/oxygenates.[93,111,114,137,138] With control of fluid streams on both sides of the electrode, this configuration allows for precise control and optimization of the reaction environment (electrolyte tuning is discussed in section 5.3). While having a liquid electrolyte can be beneficial, it is also a source of instability in the system due to impurity deposition on the catalyst and the potential penetration of liquid electrolyte into the gas diffusion electrode, or flooding, which is a common failure mode. Some initial systems were designed to force gas phase CO2 through the gas diffusion electrode into the liquid channel rather than providing a gas channel exit.[123,139–143] Recently, Haas et al. generated CO at 50 mA/cm2 for over 1000 h by forcing the CO2 through their gas diffusion electrode; however, they did not operate at higher current densities without sacrificing selectivity.[92] In addition to increasing ohmic resistance of electrolytes through bubble production, forcing CO2 in alkaline electrolytes can lead to bicarbonate/carbonate formation and salt precipitation, which reduce electrolyte conductivity, alter electrolyte pH, and block gas diffusion electrode/membrane pores. Jeanty et al. exploited minor flooding of the gas diffusion electrode to clean off salt precipitate that had accumulated over time, allowing them to produce CO for over 600 h.[144] While good selectivity and current densities have been demonstrated, further advances in gas diffusion electrode design (recent examples in section 5.2) are needed to increase the stability of these liquid phase electrolyzers. Gas phase electrolyzer
This class of flow cell architecture resembles PEM electrolyzers. Gas phase
electrolyzers consist of a cathode and anode separated by a solid polymer electrolyte (ion-exchange membrane). The catalyst on the cathode is directly pressed against the ion-exchange membrane in a zero-gap configuration. A key difference for gas phase reactors is that humidity must be provided to the system, either through a liquid electrolyte on the anode side and/or through humidification of the gas inlet stream, to keep the membrane hydrated during operation. Gas phase electrolyzers have several advantages over their liquid phase counterparts as they involve less electrolyte pumps and flow fields, can be pressurized easily, and have lower ohmic losses. Also, the elimination of catholyte removes the possibility of electrolyte flooding the gas diffusion electrode, electrolyte impurity deposition onto the catalysts, and the generation of bicarbonate/carbonate salts, thereby removing multiple sources of instability. However, liquid products can accumulate in the gas diffusion electrodes and hamper gas diffusion. Highly wetting alcohol products are particularly challenging to handle. The successful extraction of the liquid products

from the gas diffusion electrodes can maintain stability and has the potential to produce a stream of concentrated liquid products.
The majority of gas phase CO2RR studies have been conducted with CEMs. In this configuration, protons (H+) or other cations travel from the anode to the cathode through the CEM. In direct comparisons with liquid phase electrolyzers, gas phase CEM electrolyzers have shown improved performance attributed to improved CO2 availability. For example, Lee et al. observed a significant improvement in their formate FE and stable multi-day production when using a gas phase system compared to a liquid phase electrolyzer.[145] Researchers have also used catalysts that have poor CO2RR selectivity in liquid phase electrolyzers (Pt, Fe, Fe-Co, Pt-Ru, etc.) to produce products not typically observed in other flow cell systems, such as methanol,[146–149] isopropanol,[150,151] and >C5 long chain products, although in small quantities.[152,153] These longer chain products may be more readily detected in these systems owing to their increased concentrations not being diluted in a bulk liquid electrolyte, multistep upgrading made possible by catalyst-confined shorter chain liquid products as reaction intermediates, or the enabling of distinct reaction pathways. Moreover, changes in product selectivity have been attributed to the influence of proton transport within the membrane, with poor proton transport favoring products requiring less proton transfers.[154] On the other hand, the acidification of the cathode compartment over time can be an issue in these systems, especially at higher current densities, leading to increased HER and decreased CO2RR.[155,156] Researchers have managed to circumvent this acidification by including a buffer layer between the catalyst and membrane, however, these layers may not be effective for long run timescales, increase the resistance of the cell, and negate some of the most attractive features of gas phase electrolyzers.[157] Controlling proton transport and the local catalyst environment is the key to higher CO2RR selectivity in these membrane systems.
In AEM gas phase electrolyzers, hydroxides (OH-) or other anions are the charge carrier in the membrane. Unlike CEM systems, when an AEM is used, water dissociation at the cathode provides the necessary protons for CO2RR. In this case, the humidity in the gas stream and/or membrane will act as the water source. Owing to the decreased proton availability, AEM systems typically have less competition from HER.[158] In addition, reduced proton availability in the AEM system can influence the CO2RR product distribution. For instance, Komatsu et al. reasoned that differences in proton availability led to C2H4 as the major product with a CEM and HCOOH as the major product with an AEM under otherwise similar conditions.[159] Similarly, type of membrane used can also influence product selectivity.[160,161] In the absence of a liquid electrolyte stream with which to control the local reaction environment, membranes have been functionalized to tune selectivity and other performance parameters.[162] For instance, AEMs functionalized with imidazolium have been used to produce CO or syngas at moderate (50 mA/cm2) and high current densities ≥100 mA/cm2, operating with high stability for hours,[163] days,[164] and even months.[165] Further tuning of membrane properties could allow for the precise control of product selectivity and cell voltage. In contrast with liquid phase electrolyzers, the electrolyte in gas phase electrolyzers is a manufactured part of the cell and thus present some unique opportunities. For instance, the solid electrolyte membrane can be designed to reflect the surrounding manifold geometries or to have properties varying in the downstream direction to reflect the changing composition of a reactant stream.

BPMs, consisting of an AEM and a CEM laminated together, are used in some water electrolyzers[166–169] and have been recently applied to CO2 electrolyzers. BPMs solve the problem of pH gradient development in monopolar membrane systems, which can result in voltage fluctuations and instability over time, by maintaining a constant pH in each side of the cell.[170] For example, Li et al. demonstrated the reduction of CO2 to syngas using a BPM configuration with a Bi/ionic liquid catalyst for 14 h at 80 mA/cm2.[171] Although the cell voltage was extremely stable over the run time, the FECO decreased significantly after the first hour due to cathode acidification. Salvatore et al. improved the product selectivity of this type of system through the addition of a solid-supported aqueous NaHCO3 layer between their BPM and Ag catalyst. With this modification, their system ran for over 24 hours at 100 mA/cm2 and 65% FECO.[172] Moreover, unlike AEMs, BPMs inhibit the loss of the cathodic liquid products to the anode via electromigration, diffusion, and/or electroosmotic drag, resulting in higher concentrations of recovered products.[173] While gas phase electrolyzers show promise for CO2RR, it remains a challenge to operate them at higher current densities (>200 mA/cm2) with high product selectivity, and multi-carbon products remain elusive.
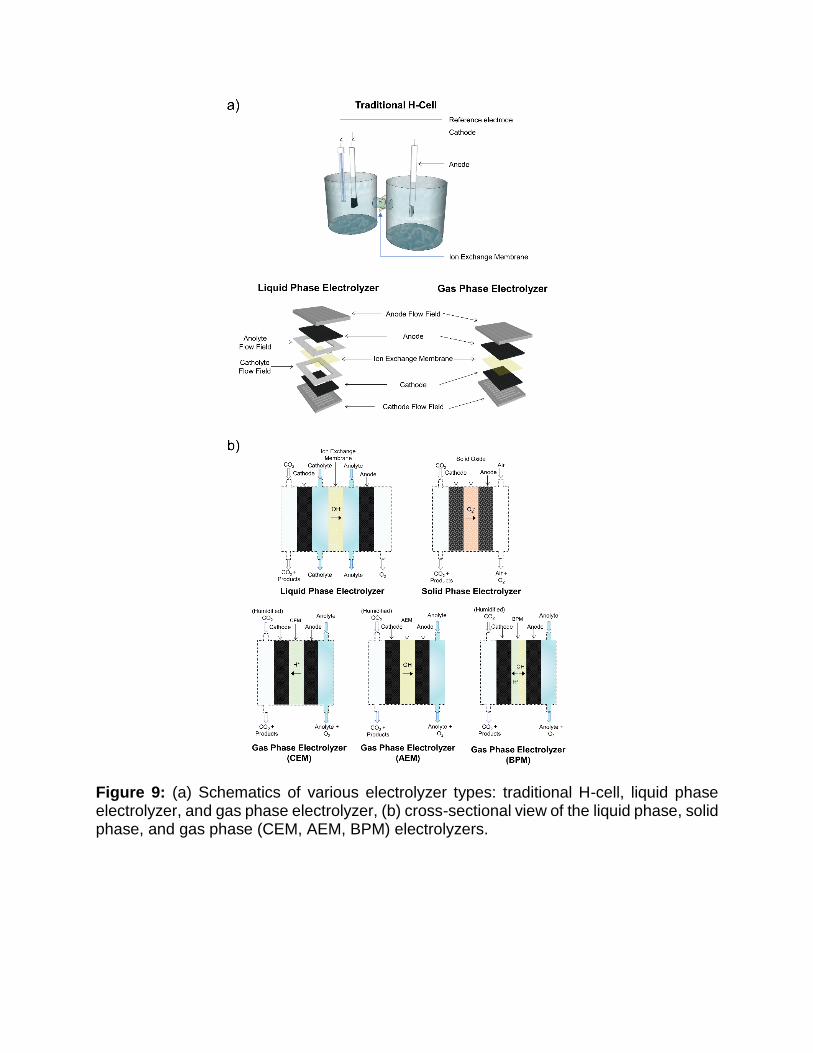
Figure 9: (a) Schematics of various electrolyzer types: traditional H-cell, liquid phase electrolyzer, and gas phase electrolyzer, (b) cross-sectional view of the liquid phase, solid phase, and gas phase (CEM, AEM, BPM) electrolyzers.

Solid oxide electrolyzer
The solid oxide flow cell architecture resembles that of solid oxide electrolyzers. This cell consists of a solid cathode, anode, and electrolyte. They utilize zirconia-based oxides, ceria-based oxides, or lanthanum gallates-based oxides as the solid electrolyte. Solid oxide electrolyzers combine electrocatalysis with high temperatures (>600°C) to generate C1 gas products like CO or CH4, at high current densities, typically on the order of A/cm2, from CO2 and H2O/H2 (proton source) feedstocks. Although this configuration operates at low cell voltages and high current densities with high stability, the extreme temperature requirement and limited product range restrict more widespread use.[174–177] Table 1: Comparison of the different architectures employed in CO2 electrolyzers
Reactor
Structure Type
Operating Conditions Max. Current Advantages Disadvantages
Electrolyte Membrane Temperature
Batch H cell
Liquid
electrolyte
(KHCO3, ionic
liquids, etc.)
CEM, AEM, or
membraneless
Range
dependent on
the electrolyte,
membrane, and
pressure chosen
<100 mA/cm2
Stability limited
to stability of
catalyst, simple
setup
Mass transport
limitations,
limited
electrolytes
(neutral or
acidic), low
currents, not
scalable
Electrolyzer
Architecture
Liquid Phase Electrolyzer
(Alkaline Electolyzer)
Liquid
electrolyte with
various pH
(KHCO3, KOH,
ionic liquids,
etc.)
CEM, AEM, or
membraneless
Range
dependent on
the electrolyte
and pressure
chosen
>1 A/cm2
Precise control
of reaction
environment,
high current
densities
Ohmic losses,
Flooding,
Complexity in
system setup
(pumps for
electrolyte),
Carbonate salt
formation
Gas Phase
Electrolyzer
(Polymer
Electrolyte
Membrane)
Cation
Exchange
Solid polymer
(CEM)
CEM
(ie. Nafion,
SPEEK, etc.)
Range
dependent on
the electrolyte,
membrane, and
pressure chosen
100 mA/cm2
Similarity to H2O
electrolyzer
makes scale up
easier, low
ohmic losses
Competition in
selectivity
between HER
and CO2RR,
hydration of
membrane,
acidification of
cathode
Anion
Exchange
Solid polymer
(AEM)
AEM (Fumasep,
sulfonated PVA,
AMI 7001,
Sustainion,
Fumatech, etc.)
Range
dependent on
the electrolyte,
membrane, and
pressure chosen
100s of
mA/cm2
Low ohmic
losses, stability
Hydration of
membrane and
gas stream
(catholyte-free
system),
carbonate ion
formation
Bipolar Solid polymer
(BPM)
BPM (AEM and
CEM together,
Fumasep FBM)
Range
dependent on
the electrolyte,
membrane, and
pressure chosen
200 mA/cm2
Stability, pH
balance in cell,
decreased liquid
product loss
Hydration of
membrane and
gas stream,
acidification of
cathode, higher
ohmic losses
across
membrane
Solid Oxide Electrolyzer Solid oxide None <600°C >1 A/cm2
High current
densities, good
energy
efficiencies
Mostly single
carbon products
5.2 Gas diffusion electrodes

Gas diffusion electrodes (Figure. 10a) are at the heart of most water electrolyzers, and are integral to both gas and liquid phase CO2 electrolyzers. Gas diffusion electrodes are composed of a gas diffusion layer with a catalyst layer deposited on one side. Gas diffusion electrodes allow for direct gas phase CO2 delivery from a gas inlet channel to the catalyst surface through a gas diffusion layer. The gas diffusion layer is a hydrophobic, porous, and conductive structure consisting of two layers, a microporous layer and a macroporous substrate. Most commercially available gas diffusion layers have been optimized for
Figure 10: (a) Structure of a conventional carbon-based gas diffusion electrode. (b) Study of the effect of the microporous layer on the gas diffusion electrode performance, reprinted with permission from ref.[178]. (c) Gas diffusion electrode structure developed by Dinh et al. to operate over 150 hours, reprinted with permission from ref.[93]

electrolyzer and fuel cell applications), and while they share similar functions in CO2 electrolyzers, few comprehensive studies have been performed to optimize each component of the gas diffusion layer for CO2RR applications.
The macroporous substrate serves the function of providing mechanical stability and electrical contact, as well as distributing gas through its macro-scale pores. Typical materials used for the macroporous substrate are carbon structures (paper, cloth, etc.).[179] Using a liquid phase CO2 electrolyzer, Kim et al. studied the effect of macroporous substrate thickness where notably higher current densities towards CO formation were achieved at a fixed cell voltage when using a thin, 60 µm substrate.[178]
The microporous layer, located between the macroporous substrate and the catalyst layer, is added to enhance interfacial electrical connection (Figure. 10b) and to prevent flooding. The microporous layer is commonly composed of a mixture of carbon black nanoparticles and a hydrophobic polymer, usually polytetrafluoroethylene (PTFE), and forms a layer with pores on the order of 200 nm.[179] To prevent flooding, especially in liquid phase electrolyzers, the PTFE content of the microporous layer can be increased at the expense of electrical conductivity and gas permeability.[178] In liquid phase electrolyzers, Li et al. determined that a 30% PTFE loading yielded high CO2 permeability,[180] while Kim et al. obtained the highest currents for CO production using a PTFE loading of 20% at the same cell voltage.[178] Recently, Dinh et al. developed a gas diffusion layer that decoupled the hydrophobicity and electrical conductivity requirements of the microporous layer (Figure. 10c), enabling 150 hours of continuous operation in a highly alkaline liquid phase electrolyzer.[93]
CO2 reduction takes place at the catalyst layer in the gas diffusion electrode. Just as in water electrolyzers, catalyst layers for CO2RR are typically comprised of a mixture of catalyst nanoparticles and a binder, such as Nafion. When an ionomer like Nafion is used as a binder, it improves catalyst utilization through increased ionic connection, but comes at the expense of elevated water content in pores owing to the hydrophilic nature of Nafion.[181] Using Sn catalysts in liquid phase electrolyzers, one study found 20 wt% Nafion to yield the highest CO2RR partial currents, whereas another study found the highest FEHCOOH at an optimal loading of 50 wt% Nafion.[182,183] Wang et al. added 11% PTFE to their Nafion-based ink and their current density and product selectivity both increased by approximately 25% due to the more porous catalyst layer structure improving gas diffusion and increasing surface area.[184]
Supporting carbon materials in fuel cells allow for significantly reduced catalyst loadings and improved performance.[181] Similarly, in CO2RR, Delacourt et al. found that catalysts with 20 wt% acetylene black support exhibited higher CO2RR selectivity compared to their unsupported counterparts.[157] Moreover, by replacing carbon black with TiO2 as the catalyst support, both at 40 wt%, allowed Ma et al. to nearly double the CO2RR partial current at the same cell voltage.[133] In a later report, they produced a four-fold increase in partial current density of CO when integrating carbon foam as the supporting material in place of carbon black.[185]
To achieve high catalyst utilization, the catalyst particles must be connected both ionically and electrically, making catalyst deposition critical to performance. Some researchers have adhered catalyst to the gas diffusion layer via solvent-free dry pressing[122] and rolling techniques,[186] whereas others have synthesized the catalyst material directly on the gas diffusion layer via electrodeposition.[187–189] However, it is most

common for a binder-catalyst mixture to be drop-cast or spray-deposited.[138,143,190,191] Comparing different deposition methods, Jhong et al. found that cathodes that were air-brushed outperformed hand-painted and screen-printed cathodes in terms of current density.[132] Moreover, physical vapor deposition methods used in the semiconductor industry, such as evaporation and sputtering as used by Dinh et al. for CO2RR,[93] are amenable to large scale production and can controllably deposit sub-micron thicknesses of catalyst materials.
5.3 Reaction environment engineering
Electrolyte engineering
The liquid electrolyte plays an integral role in H cell and liquid phase electrolyzers as it provides ionic transport of protons and provides the reaction environment. Although ionic liquids[190-191] and organic electrolytes[192-193] have been used, the vast majority of CO2RR studies have been performed in aqueous electrolytes. For a summary of recent advances in the other electrolyte types, the reader is directed to dedicated reviews.[196–
198] In this section, we outline three major areas of study for aqueous electrolytes: pH, cation, and anion effects.
The pH of the electrolyte is central to reaction selectivity and overpotentials. There is a distinction between bulk electrolyte pH and local cathode pH, as reduction reactions drive up the local pH at the electrode surface.[199] Numerous studies have demonstrated unique pH dependencies for CO2RR products. For example, when generating CO on Ag catalysts in liquid phase electrolyzers, alkaline conditions have resulted in reduced overpotentials[131,200] and HER,[201] however, as the pH is increased, the selectivity of CO decreases in favor of formate formation.[47,131] As for the production of formate, various studies in both H cells and flow cells have found that a bulk pH in the range of 2 – 4 yields the optimal selectivity with p-block metal catalysts.[125,202,203] With respect to C2H4, formation is largely independent of pH,[204] unlike the formation of CH4 which is pH dependent. Thus in H cells, solutions with weak buffering abilities have been shown to increase the ratio of C2H4 to CH4.[205–207] Flow cells operating under alkaline conditions have achieved improved selectivity for C2H4 at reduced overpotentials.[138,208] In general, alkaline conditions, only accessible through flow cell operation, benefit the formation of the products of interest through reduced overpotentials, reduced HER, and/or improved selectivity.
Cation effects have received a great deal of focus in the field of CO2RR, specifically the influence of alkali metals, such as Na+ and K+. Studies have demonstrated that larger cations, Cs+ and K+, can greatly increase the total current density,[209,210] suppress the HER,[205,211] and improve selectivity towards multi-carbon products, especially C2H4.[212,213] The larger, less hydrated, cations adsorb easier on the catalyst surface making the potential at the outer Helmholtz plane more positive and thereby reducing the concentration of H+ ions and impeding the formation of H2 and CH4.[205,209,211,212,214] Alternatively, Singh et al. have recently claimed that larger cations provide stronger buffering abilities, maintain a lower pH and keep the local dissolved CO2 concentration higher (Figure. 11). The higher CO2 concentrations reduce polarization losses, which preferentially improves selectivity towards C2H4 over CH4 and H2.[215] Moreover, larger cation concentrations can greatly reduce charge transfer resistances by helping to

stabilize the *CO2− anion radical and leading to higher current densities at the same
applied potentials.[190,210,211]
Figure 11: (a) pKa of hydrolysis for Li+ and Cs+ inside the Helmholtz layer and in the bulk electrolyte; (b) the distribution of pH and CO2 concentration in the boundary layer; (c) the improved experimental selectivity towards the CO2RR as compared to the HER when using larger cations on an Ag catalyst. Reprinted with permission from.[215] Copyright 2016 American Chemical Society.
Anion effects are less studied than cation effects. The most commonly employed anion in aqueous electrolytes is bicarbonate (HCO3
-), although some studies have been performed with hydroxide (OH-), sulfate, and various halides.[215,216] Verma et al. discovered that the best selectivity and lowest overpotentials for CO production were obtained in the order: OH- > HCO3
- > Cl-.[190] They suggested that weakly solvated anions, such as Cl-, interact directly with the electrode surface and can destabilize the *CO2
−
intermediate, unlike smaller, more-hydrated, anions which are located further away (Figure. 11). Studying the effects of different halides, Varela et al. demonstrated that while both Cl- and Br- can be used to suppress HER and improve the selectivity towards CO, I- can enhance hydrocarbon formation by donating more electronic charge to the Cu surface and facilitating charge transfer.[217]
In addition to the specific anion or cation effects on reaction kinetics, the cost and conductivity of the electrolyte solution (i.e. the concentration and composition of the electrolyte solution) are important considerations when operating flow cell electrolyzers. Ohmic losses may be prohibitively large in the case of less conductive electrolytes, such as 0.1 M KHCO3 (conductivity of 10 mS/cm as compared to 1.0 M KOH which has a conductivity of 220 mS/cm),[218,219] where the energy efficiency would be greatly impacted and more expensive electrolytes, such as CsHCO3, may be too costly to justify large scale implementation.

Figure 12: Schematic illustration demonstrating the arrangement of the electrode for (a)
more hydrated anions such as OH- and (b) less hydrated anions, such as Cl-. Reproduced
from [190] with permission from the PCCP Owner Societies.
Pressure
Pressure affects both electrochemical performance and industrial integration with up and downstream processes. There have only recently few systematic studies of pressurized flow cells [131,139–141,143,220], with most pressure studies being performed in H cell reactors, and pressures in the range of 1 to 60 atm. The primary benefit of elevated pressure is well-evidenced in H cell reactors, the enhanced CO2 solubility in aqueous electrolytes, which allows for higher CO2RR current densities[221,222]. On the other hand, even with the mass transport benefits afforded by gas diffusion electrodes in flow cells, Dufek et al. found a four-fold improvement in FECO
and a corresponding decrease in HER when operating at elevated pressures of 20 atm.[139,220]
Pressure not only influences the selectivity between CO2RR and HER, but also modulates the selectivity between CO2RR products and/or affects overpotentials. For catalysts producing CO (Au, Ag, etc.) or formate (Sn, Pb, etc.), elevated pressures do not greatly influence selectivity,[139,143,202,220,221,223–226] but reduce cathodic overpotentials.[131,143,221,224,225] In addition, some catalysts (Fe, Co, Rh, Ni, Pd, Pt, and C) with predominantly H2 selectivity at 1 atm can generate CO or HCOOH when pressurized.[140,141,143,223,227–229] It has been hypothesized that the high pressure of CO2 stimulates the desorption of CO molecules from the catalyst surface which are otherwise tightly bound at ambient conditions.[228,230] For Cu catalysts, increasing pressure typically results in increased CO production at the same applied potential[222,231] due to stimulated desorption of intermediates from the surface.[232,233] To produce hydrocarbons on pressurized Cu, the current density must be increased.[206,222] In addition to minimizing

HER, tuning selectivity, and/or minimizing overpotentials, pressurization can reduce bubble size in the liquid electrolyte when operating at high current densities, minimizing the bubble-induced blockages of electrode active area and ohmic losses.
Temperature
In commercial alkaline and PEM water electrolyzers, low-temperature systems are operated at temperatures of at least 60 °C.[234] Heating can be applied externally, or generated internally as a product of reactions and ohmic losses.[142,235] The role of temperature in CO2RR electrolyzer performance is complex as many properties of the reactor, reactants, and reaction kinetics exhibit unique sensitivities to temperature (Figure. 13).
Figure 13: Variation of different parameters with temperature as normalized to 20 °C baseline: vapour pressure of water,[236] diffusion of CO2 in water (predicted by Stokes-Einstein equation using the viscosity of water),[237] specific conductivity of 1 M KOH,[218] diffusion of CO2 in air,[238] cell voltage for a CO2 to CO electrolyzer with the OER on the anode side (tabulated using thermodynamic values from [236]), and CO2 solubility in water.[121]
Most temperature studies performed to date have been conducted in H cell reactors where the CO2 solubility determines the attainable partial current for CO2RR. In these systems, the increased CO2 solubility achieved at lower temperatures (Figure. 13) improves the selectivity for CO2RR as compared to the HER.[239–244] While the dominant products of CO2RR do not change significantly with temperature on most catalysts,[240] studies on Cu have demonstrated that hydrocarbon selectivity tends to shift from CH4 to C2H4 as temperature increases.[242,245–247] This improved C2H4 selectivity is attributed to reduced activation energies[240] and enhanced surface diffusion of adsorbed intermediates.[242]
To mitigate temperature-induced CO2 concentration effects, researchers have pressurized systems to study other impacts of temperature. On pressurized Ni and Fe, the selectivity towards longer chain hydrocarbon products increased with temperature up

to 80°C.[228,248] Moreover, Pb operating at a constant pressure and temperatures of 60 - 80 °C yielded significant increases in both current density and formate selectivity.[225,249] Therefore, when the CO2 concentration is high enough in H cells to negate the decrease in solubility of the CO2, increasing the temperature can have net positive effects on product selectivity and current density.
There are only a few published systematic temperature studies using liquid phase electrolyzers.[141,142] Here, the most comprehensive example is that of Dufek et al. which demonstrated an 18% improvement in their EE by increasing the temperature of their flow cell from 18 to 70 °C.[142] By comparison, there are many examples of gas phase electrolyzers operated at temperatures in the range of 60 - 80 °C.[149,153,164,191] Here, the reduced CO2 solubility is less concerning and the elevated temperatures offer improved electrochemical kinetics and increased humidity content (Figure. 13). For example, Lee et al. found that elevating the operating temperature from 30 to 70 °C doubled their CO2RR partial current density at the same cell voltage.[145] The maximum operating temperature of the membrane, is typically 90 °C and should not be exceeded so as to avoid reduced proton mobility through the membrane,[154] as well as flooding due to increased water crossover from the anode.[145,250] Recent advances in membrane technology have allowed higher temperatures to be used during cell operation. Notably, a recent work by Gutiérrez-Guerra et al. employed a H3PO4-doped polybenzimidazole-polymer electrolyte membrane, which enabled electrolyzer operation at 110 °C.[251] Elevated temperatures offer promising routes to increase conductivity and improve reaction kinetics. Reduced CO2 solubility and evaporation are challenges at elevated temperatures, but pressurization and gas phase electrolyzers can overcome these issues.
In summary, flow cell systems are becoming the standard platform for CO2RR
development and testing. Gas and liquid phase electrolyzers, and the materials and fluid
streams within, present vast opportunities for customization and optimization. While most
developments in the field to date can be categorized as either catalyst or systems
contributions, many of the coming breakthroughs will be integrated, coordinated efforts
with bespoke system architectures that realize and demonstrate materials innovation.
Conclusions
In this Review, we have summarized recent research and development progress in electrochemical CO2RR. Great strides have been made towards bringing this technology closer to industrial relevance. Several challenges remain on the path to achieve performance targets for economically viable products.
The TEA reveals that the most economically compelling target products include CO, formate, C2H4 and C2H5OH. The TEA also showed the key performance targets are: FE (90%), cell voltage (<1.8 V), current density (>300 mA/cm2), and stability (>60,000-80,000 hours). Nonetheless, a detailed analysis of CO2 electrolyzer cost is needed to build an accurate techno-economic model for CO2RR technology.
While high FE towards CO, HCOOH and C2H4 (~70%) have been demonstrated, high selectivity towards C2H5OH is yet to be achieved. Several promising strategies to further enhance the selectivity include, but are not limited to, nanostructuring the catalyst
material, alloying, inducing surface strain, functionalizing the catalyst surface, tuning the chemical environment etc. In addition, the ultimate commercial viability of these strategies will require catalyst synthesis routes that are scalable.[252]
Advances in the mechanistic understanding of CO2RR are also needed to move away from the current trial-and-error paradigm and towards accelerated, rational design of catalyst materials. Accurate DFT models which include the realities of surface coverage, electrolyte properties, and electric field influence are essential for a deeper, more reliable picture of reaction mechanisms. Accurate DFT modeling will further feed and enable high-throughput machine learning guided calculations and process optimization. Once sufficient quantity and quality of foundational data for machine learning models is available, the field can better navigate the vast parameter space of chemical, material and mechanical variables inherent to the CO2RR challenge.
By departing from traditional H cell configurations and the implementing liquid/gas phase electrolyzers, a number of groups have demonstrated high current density (>100 mA/cm2) CO2 conversion - a necessary condition for industrial applicability. A remaining barrier to commercialization of this technology is the stability of the catalyst and/or the electrodes in these systems. Therefore, significant research efforts towards understanding the failure mechanisms and improving the lifetime of CO2RR cathodes will be crucial going forward.
Given the dominance of electrical energy input cost on the technoeconomic potential of CO2RR, energy efficiency is of particular importance for the field. However, full cell EE performance are rarely reported while component metrics such as FE are emphasized. In many cases, high FEs for products of interest have been achieved with high overpotentials that are detrimental to the overall EE and the ultimate applicability. Significant reductions in cell resistance and overpotential for both CO2RR and the corresponding anode reaction, typically OER, are necessary as the field and technology mature. In addition, CO2RR is often performed in a different environment than the optimal OER conditions, introducing increased membrane resistances or other full cell kinetic and polarization losses, which are not typically captured in reported metrics. Full cell metrics and economics will be improved by exploring alternative anodic reactions that generate a valued product[253] and/or reduce the required potential. In summary, CO2 electrolyzer performance must be assessed on full cell figure of merit: this will provide the needed baseline for comparison, and will inspire and guide the development and optimization of CO2RR viable at scale for both commercial and environmental benefit.
Acknowledgments This work was financially supported by the Ontario Research Fund: Research Excellence Program, the Natural Sciences and Engineering Research Council (NSERC) of Canada, the CIFAR Bio-Inspired Solar Energy program. A.S. wishes to thank Fonds de Recherche du Quebec - Nature et Technologies (FRQNT) for support in the form of postdoctoral fellowship award. D.S. acknowledges the NSERC E.W.R. Steacie Memorial Fellowship. M.K. acknowledges Banting postdoctoral fellowship from Govt. of Canada. C.M.G acknowledges funding from NSERC in the form of a postdoctoral fellowship. J. P. E. thanks NSERC, Hatch and the Government of Ontario for their support through graduate scholarships. This research is also supported by Canada Research Chairs program.
References [1] E. Kintisch, Science 2015, 350, 1018. [2] J. Rogelj, M. den Elzen, N. Höhne, T. Fransen, H. Fekete, H. Winkler, R.
Schaeffer, F. Sha, K. Riahi, M. Meinshausen, Nature 2016, 534, 631. [3] A. A. Fawcett, G. C. Iyer, L. E. Clarke, J. A. Edmonds, N. E. Hultman, H. C.
McJeon, J. Rogelj, R. Schuler, J. Alsalam, G. R. Asrar, J. Creason, M. Jeong, J. McFarland, A. Mundra, W. Shi, Science (80-. ). 2015, 350, 1168.
[4] IPCC, Climate Change 2014: Synthesis Report. Contribution of Working Groups I, II, and III to the Fifth Assessment Report of the Intergovernmental Panel on Climate Change, Geneva, Switzerland, 2014.
[5] United Nations Framework Convention on Climate Change (UNFCC), “The Paris Agreement,” n.d.
[6] J. Rogelj, G. Luderer, R. C. Pietzcker, E. Kriegler, M. Schaeffer, V. Krey, K. Riahi, Nat. Clim. Chang. 2015, 5, 519.
[7] S. Fuss, J. G. Canadell, G. P. Peters, M. Tavoni, R. M. Andrew, P. Ciais, R. B. Jackson, C. D. Jones, F. Kraxner, N. Nakicenovic, C. Le Quéré, M. R. Raupach, A. Sharifi, P. Smith, Y. Yamagata, Nat. Clim. Chang. 2014, 4, 850.
[8] B. Kumar, J. P. Brian, V. Atla, S. Kumari, K. A. Bertram, R. T. White, J. M. Spurgeon, Catal. Today 2016, 270, 19.
[9] B. Endrődi, G. Bencsik, F. Darvas, R. Jones, K. Rajeshwar, C. Janáky, Prog. Energy Combust. Sci. 2017, 62, 133.
[10] C. J. Barnhart, M. Dale, A. R. Brandt, S. M. Benson, Energy Environ. Sci. 2013, 6, 2804.
[11] J. P. Barton, D. G. Infield, IEEE Trans. Energy Convers. 2004, 19, 441. [12] A. S. Brouwer, M. van den Broek, A. Seebregts, A. Faaij, Renew. Sustain. Energy
Rev. 2014, 33, 443. [13] F. H. Saadi, N. S. Lewis, E. W. McFarland, Energy Environ. Sci. 2018, 11, 469. [14] F. Cherubini, Energy Convers. Manag. 2010, 51, 1412. [15] G. A. Olah, A. Goeppert, G. K. S. Prakash, J. Org. Chem. 2009, 74, 487. [16] Á. Martín, A. Navarrete, M. D. Bermejo, J. Supercrit. Fluids 2018, 134, 141. [17] O. S. Bushuyev, P. De Luna, C. T. Dinh, L. Tao, G. Saur, J. van de Lagemaat, S.
O. Kelley, E. H. Sargent, Joule 2018, 2, 825. [18] M. Jouny, W. Luc, F. Jiao, Ind. Eng. Chem. Res. 2018, 57, 2165. [19] S. Verma, B. Kim, H.-R. “Molly” Jhong, S. Ma, P. J. A. Kenis, ChemSusChem
2016, 9, 1972. [20] P. J. G. Pearson, T. J. Foxon, Energy Policy 2012, 50, 117. [21] R. Fouquet, P. J. G. Pearson, Energy Policy 2012, 50, 1. [22] F. Kern, A. Smith, Energy Policy 2008, 36, 4093. [23] F. Barbir, Energy 2009, 34, 308. [24] K. P. Kuhl, E. R. Cave, D. N. Abram, T. F. Jaramillo, Energy Environ. Sci. 2012, 5,
7050. [25] H. M. Torres Galvis, K. P. de Jong, ACS Catal. 2013, 3, 2130. [26] J. M. Spurgeon, B. Kumar, Energy Environ. Sci. 2018, 11, 1536. [27] X. Li, P. Anderson, H.-R. M. Jhong, M. Paster, J. F. Stubbins, P. J. A. Kenis,

Energy & Fuels 2016, 30, 5980. [28] “DOE,” can be found under https://www.energy.gov/eere/solar/sunshot-2030, n.d. [29] A. Raksajati, M. T. Ho, D. E. Wiley, Ind. Eng. Chem. Res. 2013, 52, 16887. [30] J. B. Greenblatt, D. J. Miller, J. W. Ager, F. A. Houle, I. D. Sharp, Joule 2018, 2,
381. [31] M. Karamad, V. Tripkovic, J. Rossmeisl, ACS Catal. 2014, 4, 2268. [32] A. A. Peterson, F. Abild-Pedersen, F. Studt, J. Rossmeisl, J. K. Nørskov, Energy
Environ. Sci. 2010, 3, 1311. [33] R. B. Sandberg, J. H. Montoya, K. Chan, J. K. Nørskov, Surf. Sci. 2016, 654, 56. [34] J. D. Goodpaster, A. T. Bell, M. Head-Gordon, J. Phys. Chem. Lett. 2016, 7,
1471. [35] K. Letchworth-Weaver, T. A. Arias, Phys. Rev. B 2012, 86, 75140. [36] S. N. Steinmann, P. Sautet, J. Phys. Chem. C 2016, 120, 5619. [37] K. Mathew, R. Sundararaman, K. Letchworth-Weaver, T. A. Arias, R. G. Hennig,
J. Chem. Phys. 2014, 140, 84106. [38] T. Cheng, H. Xiao, W. A. Goddard, J. Am. Chem. Soc. 2016, 138, 13802. [39] J. K. Nørskov, J. Rossmeisl, A. Logadottir, L. Lindqvist, J. R. Kitchin, T. Bligaard,
H. Jónsson, J. Phys. Chem. B 2004, 108, 17886. [40] K. Chan, J. K. Nørskov, J. Phys. Chem. Lett. 2015, 6, 2663. [41] T. Cheng, H. Xiao, W. A. Goddard, Proc. Natl. Acad. Sci. 2017, 114, 1795 LP. [42] J. H. Montoya, C. Shi, K. Chan, J. K. Nørskov, J. Phys. Chem. Lett. 2015, 6,
2032. [43] H. Xiao, T. Cheng, W. A. Goddard, R. Sundararaman, J. Am. Chem. Soc. 2016,
138, 483. [44] J. Rossmeisl, E. Skúlason, M. E. Björketun, V. Tripkovic, J. K. Nørskov, Chem.
Phys. Lett. 2008, 466, 68. [45] X. Nie, M. R. Esopi, M. J. Janik, A. Asthagiri, Angew. Chemie Int. Ed. 2013, 52,
2459. [46] X. Nie, W. Luo, M. J. Janik, A. Asthagiri, J. Catal. 2014, 312, 108. [47] A. Seifitokaldani, C. M. Gabardo, T. Burdyny, C.-T. Dinh, J. P. Edwards, M. G.
Kibria, O. S. Bushuyev, S. O. Kelley, D. Sinton, E. H. Sargent, J. Am. Chem. Soc. 2018, 140, 3833.
[48] Y. Hori, A. Murata, R. Takahashi, J. Chem. Soc. Faraday Trans. 1 Phys. Chem. Condens. Phases 1989, 85, 2309.
[49] Y. Hori, A. Murata, R. Takahashi, S. Suzuki, J. Am. Chem. Soc. 1987, 109, 5022. [50] W. J. Durand, A. A. Peterson, F. Studt, F. Abild-Pedersen, J. K. Nørskov, Surf.
Sci. 2011, 605, 1354. [51] J. H. Montoya, A. A. Peterson, J. K. Nørskov, ChemCatChem 2013, 5, 737. [52] K. J. P. Schouten, Z. Qin, E. Pérez Gallent, M. T. M. Koper, J. Am. Chem. Soc.
2012, 134, 9864. [53] K. J. P. Schouten, Y. Kwon, C. J. M. van der Ham, Z. Qin, M. T. M. Koper, Chem.
Sci. 2011, 2, 1902. [54] F. S. Roberts, K. P. Kuhl, A. Nilsson, Angew. Chemie 2015, 127, 5268. [55] F. Calle-Vallejo, M. T. M. Koper, Angew. Chemie Int. Ed. 2013, 52, 7282. [56] H. Xiao, T. Cheng, W. A. Goddard, J. Am. Chem. Soc. 2017, 139, 130. [57] Y. Lum, T. Cheng, W. A. Goddard, J. W. Ager, J. Am. Chem. Soc. 2018, 140,

9337. [58] C. Shi, H. A. Hansen, A. C. Lausche, J. K. Nørskov, Phys. Chem. Chem. Phys.
2014, 16, 4720. [59] T.-T. Zhuang, Z.-Q. Liang, A. Seifitokaldani, Y. Li, P. De Luna, T. Burdyny, F.
Che, F. Meng, Y. Min, R. Quintero-Bermudez, C. T. Dinh, Y. Pang, M. Zhong, B. Zhang, J. Li, P.-N. Chen, X.-L. Zheng, H. Liang, W.-N. Ge, B.-J. Ye, D. Sinton, S.-H. Yu, E. H. Sargent, Nat. Catal. 2018, 1, 421.
[60] L. A. Kibler, A. M. El-Aziz, D. M. Kolb, J. Mol. Catal. A Chem. 2003, 199, 57. [61] M. Mavrikakis, B. Hammer, J. K. Nørskov, Phys. Rev. Lett. 1998, 81, 2819. [62] Z. Chen, X. Zhang, G. Lu, Chem. Sci. 2015, 6, 6829. [63] Z.-Q. Liang, T.-T. Zhuang, A. Seifitokaldani, J. Li, C.-W. Huang, C.-S. Tan, Y. Li,
P. De Luna, C. T. Dinh, Y. Hu, Q. Xiao, P.-L. Hsieh, Y. Wang, F. Li, R. Quintero-Bermudez, Y. Zhou, P. Chen, Y. Pang, S.-C. Lo, L.-J. Chen, H. Tan, Z. Xu, S. Zhao, D. Sinton, E. H. Sargent, Nat. Commun. 2018, 9, 3828.
[64] A. A. Peterson, J. K. Nørskov, J. Phys. Chem. Lett. 2012, 3, 251. [65] H.-K. Lim, H. Shin, W. A. Goddard, Y. J. Hwang, B. K. Min, H. Kim, J. Am. Chem.
Soc. 2014, 136, 11355. [66] Z. W. Ulissi, A. J. Medford, T. Bligaard, J. K. Nørskov, Nat. Commun. 2017, 8,
14621. [67] Z. W. Ulissi, M. T. Tang, J. Xiao, X. Liu, D. A. Torelli, M. Karamad, K. Cummins,
C. Hahn, N. S. Lewis, T. F. Jaramillo, K. Chan, J. K. Nørskov, ACS Catal. 2017, 7, 6600.
[68] K. Tran, Z. W. Ulissi, Nat. Catal. 2018, 1, 696. [69] L. D. Chen, M. Urushihara, K. Chan, J. K. Nørskov, ACS Catal. 2016, 6, 7133. [70] X. Zheng, P. De Luna, F. P. García de Arquer, B. Zhang, N. Becknell, M. B. Ross,
Y. Li, M. N. Banis, Y. Li, M. Liu, O. Voznyy, C. T. Dinh, T. Zhuang, P. Stadler, Y. Cui, X. Du, P. Yang, E. H. Sargent, Joule 2017, 1, 794.
[71] F. P. García de Arquer, O. S. Bushuyev, P. Luna, C.-T. Dinh, A. Seifitokaldani, M. I. Saidaminov, C.-S. Tan, L. N. Quan, A. Proppe, M. G. Kibria, S. O. Kelley, D. Sinton, E. H. Sargent, Adv. Mater. 2018, 30, 1802858.
[72] S. Gao, Y. Lin, X. Jiao, Y. Sun, Q. Luo, W. Zhang, D. Li, J. Yang, Y. Xie, Nature 2016, 529, 68.
[73] X. Min, M. W. Kanan, J. Am. Chem. Soc. 2015, 137, 4701. [74] A. Klinkova, P. De Luna, C.-T. Dinh, O. Voznyy, E. M. Larin, E. Kumacheva, E. H.
Sargent, ACS Catal. 2016, 6, 8115. [75] K. P. Kuhl, T. Hatsukade, E. R. Cave, D. N. Abram, J. Kibsgaard, T. F. Jaramillo,
J. Am. Chem. Soc. 2014, 136, 14107. [76] M. Liu, Y. Pang, B. Zhang, P. De Luna, O. Voznyy, J. Xu, X. Zheng, C. T. Dinh, F.
Fan, C. Cao, F. P. G. de Arquer, T. S. Safaei, A. Mepham, A. Klinkova, E. Kumacheva, T. Filleter, D. Sinton, S. O. Kelley, E. H. Sargent, Nature 2016, 537, 382.
[77] M. Ma, B. J. Trześniewski, J. Xie, W. A. Smith, Angew. Chemie Int. Ed. 2016, 55, 9748.
[78] Y. Chen, C. W. Li, M. W. Kanan, J. Am. Chem. Soc. 2012, 134, 19969. [79] X. Feng, K. Jiang, S. Fan, M. W. Kanan, J. Am. Chem. Soc. 2015, 137, 4606. [80] R. G. Mariano, K. McKelvey, H. S. White, M. W. Kanan, Science (80-. ). 2017,

358, 1187 LP. [81] T. Cheng, Y. Huang, H. Xiao, W. A. Goddard, J. Phys. Chem. Lett. 2017, 8, 3317. [82] K.-S. Kim, W. J. Kim, H.-K. Lim, E. K. Lee, H. Kim, ACS Catal. 2016, 6, 4443. [83] Y.-C. Hsieh, S. D. Senanayake, Y. Zhang, W. Xu, D. E. Polyansky, ACS Catal.
2015, 5, 5349. [84] S. Hong, S. Lee, S. Kim, J. K. Lee, J. Lee, Catal. Today 2017, 295, 82. [85] C. Kim, T. Eom, M. S. Jee, H. Jung, H. Kim, B. K. Min, Y. J. Hwang, ACS Catal.
2017, 7, 779. [86] X. Duan, J. Xu, Z. Wei, J. Ma, S. Guo, S. Wang, H. Liu, S. Dou, Adv. Mater. 2017,
29, 1701784. [87] J. Wu, R. M. Yadav, M. Liu, P. P. Sharma, C. S. Tiwary, L. Ma, X. Zou, X.-D.
Zhou, B. I. Yakobson, J. Lou, P. M. Ajayan, ACS Nano 2015, 9, 5364. [88] P. P. Sharma, J. Wu, R. M. Yadav, M. Liu, C. J. Wright, C. S. Tiwary, B. I.
Yakobson, J. Lou, P. M. Ajayan, X.-D. Zhou, Angew. Chemie Int. Ed. 2015, 54, 13701.
[89] J. Wu, M. Liu, P. P. Sharma, R. M. Yadav, L. Ma, Y. Yang, X. Zou, X.-D. Zhou, R. Vajtai, B. I. Yakobson, J. Lou, P. M. Ajayan, Nano Lett. 2016, 16, 466.
[90] C. W. Li, M. W. Kanan, J. Am. Chem. Soc. 2012, 134, 7231. [91] C. W. Li, J. Ciston, M. W. Kanan, Nature 2014, 508, 504. [92] T. Haas, R. Krause, R. Weber, M. Demler, G. Schmid, Nat. Catal. 2018, 1, 32. [93] C.-T. Dinh, T. Burdyny, G. Kibria, A. Seifitokaldani, C. M. Gabardo, F. P. G. de
Arquer, A. Kiani, J. P. Edwards, P. De Luna, O. S. Bushuyev, C. Zou, R. Quintero-Bermudez, Y. Pang, D. Sinton, E. H. Sargent, Science (80-. ). 2018, 360, 783.
[94] D. Raciti, K. J. Livi, C. Wang, Nano Lett. 2015, 15, 6829. [95] L. Cao, D. Raciti, C. Li, K. J. T. Livi, P. F. Rottmann, K. J. Hemker, T. Mueller, C.
Wang, ACS Catal. 2017, 7, 8578. [96] A. D. Handoko, K. W. Chan, B. S. Yeo, ACS Energy Lett. 2017, 2, 2103. [97] X. Feng, K. Jiang, S. Fan, M. W. Kanan, ACS Cent. Sci. 2016, 2, 169. [98] D. Raciti, L. Cao, K. J. T. Livi, P. F. Rottmann, X. Tang, C. Li, Z. Hicks, K. H.
Bowen, K. J. Hemker, T. Mueller, C. Wang, ACS Catal. 2017, 7, 4467. [99] A. Verdaguer-Casadevall, C. W. Li, T. P. Johansson, S. B. Scott, J. T. McKeown,
M. Kumar, I. E. L. Stephens, M. W. Kanan, I. Chorkendorff, J. Am. Chem. Soc. 2015, 137, 9808.
[100] S. Lee, D. Kim, J. Lee, Angew. Chemie Int. Ed. 2015, 54, 14701. [101] H. Mistry, A. S. Varela, C. S. Bonifacio, I. Zegkinoglou, I. Sinev, Y.-W. Choi, K.
Kisslinger, E. A. Stach, J. C. Yang, P. Strasser, B. R. Cuenya, Nat. Commun. 2016, 7, 12123.
[102] P. De Luna, R. Quintero-Bermudez, C.-T. Dinh, M. B. Ross, O. S. Bushuyev, P. Todorović, T. Regier, S. O. Kelley, P. Yang, E. H. Sargent, Nat. Catal. 2018, 1, 103.
[103] D. Ren, Y. Deng, A. D. Handoko, C. S. Chen, S. Malkhandi, B. S. Yeo, ACS Catal. 2015, 5, 2814.
[104] L. Mandal, K. R. Yang, M. R. Motapothula, D. Ren, P. Lobaccaro, A. Patra, M. Sherburne, V. S. Batista, B. S. Yeo, J. W. Ager, J. Martin, T. Venkatesan, ACS Appl. Mater. Interfaces 2018, 10, 8574.

[105] Y. Lum, J. W. Ager, Angew. Chemie Int. Ed. 2017, 57, 551. [106] A. Eilert, F. Cavalca, F. S. Roberts, J. Osterwalder, C. Liu, M. Favaro, E. J.
Crumlin, H. Ogasawara, D. Friebel, L. G. M. Pettersson, A. Nilsson, J. Phys. Chem. Lett. 2017, 8, 285.
[107] C. Liu, M. P. Lourenço, S. Hedström, F. Cavalca, O. Diaz-Morales, H. A. Duarte, A. Nilsson, L. G. M. Pettersson, J. Phys. Chem. C 2017, 121, 25010.
[108] F. Cavalca, R. Ferragut, S. Aghion, A. Eilert, O. Diaz-Morales, C. Liu, A. L. Koh, T. W. Hansen, L. G. M. Pettersson, A. Nilsson, J. Phys. Chem. C 2017, 121, 25003.
[109] A. J. Garza, A. T. Bell, M. Head-Gordon, J. Phys. Chem. Lett. 2018, 9, 601. [110] M. Fields, X. Hong, J. K. Nørskov, K. Chan, J. Phys. Chem. C 2018, 122, 16209. [111] T. T. H. Hoang, S. Verma, S. Ma, T. T. Fister, J. Timoshenko, A. I. Frenkel, P. J.
A. Kenis, A. A. Gewirth, J. Am. Chem. Soc. 2018, 140, 5791. [112] S. Lee, G. Park, J. Lee, ACS Catal. 2017, 7, 8594. [113] D. Ren, B. S.-H. Ang, B. S. Yeo, ACS Catal. 2016, 6, 8239. [114] S. Ma, M. Sadakiyo, M. Heim, R. Luo, R. T. Haasch, J. I. Gold, M. Yamauchi, P.
J. A. Kenis, J. Am. Chem. Soc. 2017, 139, 47. [115] Z. Xu, E. Lai, Y. Shao-Horn, K. Hamad-Schifferli, Chem. Commun. 2012, 48,
5626. [116] F. Jia, X. Yu, L. Zhang, J. Power Sources 2014, 252, 85. [117] D. Kim, J. Resasco, Y. Yu, A. M. Asiri, P. Yang, Nat. Commun. 2014, 5, 4948. [118] J. Wu, S. Ma, J. Sun, J. I. Gold, C. Tiwary, B. Kim, L. Zhu, N. Chopra, I. N. Odeh,
R. Vajtai, A. Z. Yu, R. Luo, J. Lou, G. Ding, P. J. A. Kenis, P. M. Ajayan, Nat. Commun. 2016, 7, 13869.
[119] Y. Liu, Y. Zhang, K. Cheng, X. Quan, X. Fan, Y. Su, S. Chen, H. Zhao, Y. Zhang, H. Yu, M. R. Hoffmann, Angew. Chemie Int. Ed. 2017, 56, 15607.
[120] Y. Liu, S. Chen, X. Quan, H. Yu, J. Am. Chem. Soc. 2015, 137, 11631. [121] J. J. Carroll, J. D. Slupsky, A. E. Mather, J. Phys. Chem. Ref. Data 1991, 20,
1201. [122] D. Kopljar, A. Inan, P. Vindayer, N. Wagner, E. Klemm, J. Appl. Electrochem.
2014, 44, 1107. [123] E. J. Dufek, T. E. Lister, M. E. McIlwain, Electrochem. Solid-State Lett. 2012, 15,
B48. [124] M. M. Monroe, P. Lobaccaro, Y. Lum, J. W. Ager, J. Phys. D. Appl. Phys. 2017,
50, 154006. [125] X. Lu, D. Y. C. Leung, H. Wang, M. M. Maroto-Valer, J. Xuan, Renew. Energy
2016, 95, 277. [126] D. V. Esposito, Joule 2017, 1, 651. [127] X. Lu, D. Y. C. Leung, H. Wang, J. Xuan, Appl. Energy 2017, 194, 549. [128] S. Verma, Y. Hamasaki, C. Kim, W. Huang, S. Lu, H.-R. M. Jhong, A. A. Gewirth,
T. Fujigaya, N. Nakashima, P. J. A. Kenis, ACS Energy Lett. 2018, 3, 193. [129] C. E. Tornow, M. R. Thorson, S. Ma, A. A. Gewirth, P. J. A. Kenis, J. Am. Chem.
Soc. 2012, 134, 19520. [130] H.-R. M. Jhong, C. E. Tornow, B. Smid, A. A. Gewirth, S. M. Lyth, P. J. A. Kenis,
ChemSusChem 2017, 10, 1094. [131] C. M. Gabardo, A. Seifitokaldani, J. P. Edwards, C.-T. Dinh, T. Burdyny, M. G.

Kibria, C. P. O’Brien, E. H. Sargent, D. Sinton, Energy Environ. Sci. 2018, DOI 10.1039/C8EE01684D.
[132] H. R. Q. Jhong, F. R. Brushett, P. J. A. Kenis, Adv. Energy Mater. 2013, 3, 589. [133] S. Ma, Y. Lan, G. M. J. Perez, S. Moniri, P. J. A. Kenis, ChemSusChem 2014, 7,
866. [134] D. Kopljar, N. Wagner, E. Klemm, Chem. Eng. Technol. 2016, 39, 2042. [135] A. Del Castillo, M. Alvarez-Guerra, J. Solla-Gullón, A. Sáez, V. Montiel, A. Irabien,
J. CO2 Util. 2017, 18, 222. [136] C. Liang, B. Kim, S. Yang, Yang Liu, C. Francisco Woellner, Z. Li, R. Vajtai, W.
Yang, J. Wu, P. J. A. Kenis, P. M. Ajayan, J. Mater. Chem. A 2018, 6, 10313. [137] T. T. H. Hoang, S. Ma, J. I. Gold, P. J. A. Kenis, A. A. Gewirth, ACS Catal. 2017,
7, 3313. [138] S. Ma, M. Sadakiyo, R. Luo, M. Heima, M. Yamauchi, P. J. A. Kenis, J. Power
Sources 2016, 301, 219. [139] E. J. Dufek, T. E. Lister, S. G. Stone, M. E. McIlwain, J. Electrochem. Soc. 2012,
159, F514. [140] K. Hara, A. Kudo, T. Sakata, M. Watanabe, J. Electrochem. Soc. 1995, 142, L57. [141] K. Hara, S. Tadayoshi, J. Electrochem. Soc. 1997, 144, 539. [142] E. J. Dufek, T. E. Lister, M. E. McIlwain, J. Appl. Electrochem. 2011, 41, 623. [143] K. Hara, T. Sakata, Bull. Chem. Soc. Jpn. 1997, 70, 571. [144] P. Jeanty, C. Scherer, E. Magori, K. Wiesner-Fleischer, O. Hinrichsen, M.
Fleischer, J. CO2 Util. 2018, 24, 454. [145] W. Lee, Y. E. Kim, M. H. Youn, S. K. Jeong, K. T. Park, Angew. Chemie 2018,
130, 6999. [146] S. Shironita, K. Karasuda, M. Sato, M. Umeda, J. Power Sources 2013, 228, 68. [147] S. Shironita, K. Karasuda, K. Sato, M. Umeda, J. Power Sources 2013, 240, 404. [148] B. C. Marepally, C. Ampelli, C. Genovese, T. Saboo, S. Perathoner, F. M. Wisser,
L. Veyre, J. Canivet, E. A. Quadrelli, G. Centi, ChemSusChem 2017, 10, 4442. [149] D. Sebastián, A. Palella, V. Baglio, L. Spadaro, S. Siracusano, P. Negro, F.
Niccoli, A. S. Aricò, Electrochim. Acta 2017, 241, 28. [150] M. Gangeri, S. Perathoner, S. Caudo, G. Centi, J. Amadou, D. Bégin, C. Pham-
Huu, M. J. Ledoux, J. P. Tessonnier, D. S. Su, R. Schlögl, Catal. Today 2009, 143, 57.
[151] C. Genovese, C. Ampelli, S. Perathoner, G. Centi, J. Catal. 2013, 308, 237. [152] G. Centi, S. Perathoner, G. Winè, M. Gangeri, Green Chem. 2007, 9, 671. [153] C. Ampelli, C. Genovese, M. Errahali, G. Gatti, L. Marchese, S. Perathoner, G.
Centi, J. Appl. Electrochem. 2015, 45, 701. [154] C. Jiménez, J. García, R. Camarillo, F. Martínez, J. Rincón, Energy and Fuels
2017, 31, 3038. [155] I. Merino-Garcia, J. Albo, A. Irabien, Nanotechnology 2018, 29, 14001. [156] D. W. Dewulf, A. J. Bard, Catal. Letters 1988, 1, 73. [157] C. Delacourt, P. L. Ridgway, J. B. Kerr, J. Newman, J. Electrochem. Soc. 2008,
155, B42. [158] G. Wang, J. Pan, S. P. Jiang, H. Yang, J. CO2 Util. 2018, 23, 152. [159] S. Komatsu, M. Tanaka, A. Okumura, A. Kungi, Electrochim. Acta 1995, 40, 745. [160] L. M. Aeshala, S. U. Rahman, A. Verma, Sep. Purif. Technol. 2012, 94, 131.

[161] L. M. Aeshala, R. G. Uppaluri, A. Verma, J. CO2 Util. 2013, 3–4, 49. [162] L. M. Aeshala, R. Uppaluri, A. Verma, Phys. Chem. Chem. Phys. 2014, 16,
17588. [163] K. Jiang, S. Siahrostami, T. Zheng, Y. Hu, S. Hwang, E. Stavitski, Y. Peng, J.
Dynes, M. Gangisetty, D. Su, K. Attenkofer, H. Wang, Energy Environ. Sci. 2018, 11, 893.
[164] Z. Liu, R. I. Masel, Q. Chen, R. Kutz, H. Yang, K. Lewinski, M. Kaplun, S. Luopa, D. R. Lutz, J. CO2 Util. 2016, 15, 50.
[165] R. B. Kutz, Q. Chen, H. Yang, S. D. Sajjad, Z. Liu, I. R. Masel, Energy Technol. 2017, 5, 929.
[166] M. B. McDonald, S. Ardo, N. S. Lewis, M. S. Freund, ChemSusChem 2014, 7, 3021.
[167] S. Chabi, A. G. Wright, S. Holdcroft, M. S. Freund, ACS Appl. Mater. Interfaces 2017, 9, 26749.
[168] J. Luo, D. A. Vermaas, D. Bi, A. Hagfeldt, W. A. Smith, M. Grätzel, Adv. Energy Mater. 2016, 6, 1600100.
[169] K. Sun, R. Liu, Y. Chen, E. Verlage, N. S. Lewis, C. Xiang, Adv. Energy Mater. 2016, 6, 1600379.
[170] R. S. Reiter, W. White, S. Ardo, J. Electrochem. Soc. 2016, 163, H3132. [171] Y. C. Li, D. Zhou, Z. Yan, R. H. Gonçalves, D. A. Salvatore, C. P. Berlinguette, T.
E. Mallouk, ACS Energy Lett. 2016, 1, 1149. [172] D. A. Salvatore, D. M. Weekes, J. He, K. E. Dettelbach, Y. C. Li, T. E. Mallouk, C.
P. Berlinguette, ACS Energy Lett. 2017, 149. [173] Y. C. Li, Z. Yan, J. Hitt, R. Wycisk, P. N. Pintauro, T. E. Mallouk, Adv. Sustain.
Syst. 2018, 1700187. [174] L. Zhang, S. Hu, X. Zhu, W. Yang, J. Energy Chem. 2017, 26, 593. [175] X. Zhang, Y. Song, G. Wang, X. Bao, J. Energy Chem. 2017, 26, 839. [176] R. J. Lim, M. Xie, M. A. Sk, J. M. Lee, A. Fisher, X. Wang, K. H. Lim, Catal. Today
2014, 233, 169. [177] S. D. Ebbesen, S. H. Jensen, A. Hauch, M. B. Mogensen, Chem. Rev. 2014, 114,
10697. [178] B. Kim, F. Hillman, M. Ariyoshi, S. Fujikawa, P. J. A. Kenis, J. Power Sources
2016, 312, 192. [179] L. Cindrella, A. M. Kannan, J. F. Lin, K. Saminathan, Y. Ho, C. W. Lin, J. Wertz, J.
Power Sources 2009, 194, 146. [180] A. Li, H. Wang, J. Han, L. Liu, Front. Chem. Sci. Eng. 2012, 6, 381. [181] N. P. Brandon, D. J. Brett, Philos. Trans. R. Soc. A Math. Phys. Eng. Sci. 2006,
364, 147. [182] Q. Wang, H. Dong, H. Yu, RSC Adv. 2014, 4, 59970. [183] J. Wu, P. P. Sharma, B. H. Harris, X. D. Zhou, J. Power Sources 2014, 258, 189. [184] Q. Wang, H. Dong, H. Yu, H. Yu, J. Power Sources 2015, 279, 1. [185] S. Ma, J. Liu, K. Sasaki, S. M. Lyth, P. J. A. Kenis, Energy Technol. 2017, 5, 861. [186] Q. Wang, H. Dong, H. Yu, J. Power Sources 2014, 271, 278. [187] J. Lee, R. Yip, P. Antonacci, N. Ge, T. Kotaka, Y. Tabuchi, A. Bazylak, J.
Electrochem. Soc. 2015, 162, F669. [188] A. S. Agarwal, Y. Zhai, D. Hill, N. Sridhar, ChemSusChem 2011, 4, 1301.

[189] S. Sen, B. Skinn, T. Hall, M. Inman, E. J. Taylor, F. R. Brushett, MRS Adv. 2017, 2, 451.
[190] S. Verma, X. Lu, S. Ma, R. I. Masel, P. J. A. Kenis, Phys. Chem. Chem. Phys. 2016, 18, 7075.
[191] N. Gutiérrez-Guerra, L. Moreno-López, J. C. Serrano-Ruiz, J. L. Valverde, A. de Lucas-Consuegra, Appl. Catal. B Environ. 2016, 188, 272.
[192] B. a Rosen, A. Salehi-khojin, M. R. Thorson, W. Zhu, D. T. Whipple, P. J. a Kenis, R. I. Masel, Science (80-. ). 2011, 334, 643.
[193] L. Sun, G. K. Ramesha, P. V. Kamat, J. F. Brennecke, Langmuir 2014, 30, 6302. [194] J. Li, G. Prentice, J. Electrochem. Soc. 1997, 144, 4284. [195] S. Kaneco, K. Iiba, H. Katsumata, T. Suzuki, K. Ohta, Electrochim. Acta 2006, 51,
4880. [196] P. P. Sharma, X.-D. Zhou, Wiley Interdiscip. Rev. Energy Environ. 2017, 6, e239. [197] Y. Wang, J. Liu, Y. Wang, A. M. Al-Enizi, G. Zheng, Small 2017, 13, 1701809. [198] J.-P. Jones, G. K. S. Prakash, G. A. Olah, Isr. J. Chem. 2014, 54, 1451. [199] N. Gupta, M. Gattrell, B. MacDougall, J. Appl. Electrochem. 2006, 36, 161. [200] S. Ma, R. Luo, S. Moniri, Y. Lan, P. J. A. Kenis, J. Electrochem. Soc. 2014, 161,
F1124. [201] B. Kim, S. Ma, H. R. Molly Jhong, P. J. A. Kenis, Electrochim. Acta 2015, 166,
271. [202] O. Scialdone, A. Galia, G. Lo Nero, F. Proietto, S. Sabatino, B. Schiavo,
Electrochim. Acta 2016, 199, 332. [203] D. T. Whipple, E. C. Finke, P. J. A. Kenis, Electrochem. Solid-State Lett. 2010,
13, B109. [204] A. S. Varela, M. Kroschel, T. Reier, P. Strasser, Catal. Today 2016, 260, 8. [205] A. Murata, Y. Hori, Bull. Chem. Soc. Jpn. 1991, 64, 123. [206] R. Kas, R. Kortlever, H. Yilmaz, M. T. M. Koper, G. Mul, ChemElectroChem 2015,
2, 354. [207] J. Resasco, Y. Lum, E. Clark, J. Z. Zeledon, A. T. Bell, ChemElectroChem 2018,
5, 1064. [208] C.-T. Dinh, T. Burdyny, G. Kibria, A. Seifitokaldani, C. M. Gabardo, F. P. G. de
Arquer, A. Kiani, J. P. Edwards, P. De Luna, O. S. Bushuyev, C. Zou, R. Quintero-Bermudez, Y. Pang, D. Sinton, E. H. Sargent, M. G. Kibria, A. Seifitokaldani, C. M. Gabardo, F. P. García de Arquer, A. Kiani, J. P. Edwards, P. De Luna, O. S. Bushuyev, C. Zou, R. Quintero-Bermudez, Y. Pang, D. Sinton, E. H. Sargent, Science (80-. ). 2018, 360, 783 LP.
[209] Y. Hori, S. Suzuki, Bull. Chem. Soc. Jpn. 1982, 55, 660. [210] J. Resasco, L. D. Chen, E. Clark, C. Tsai, C. Hahn, T. F. Jaramillo, K. Chan, A. T.
Bell, J. Am. Chem. Soc. 2017, 139, 11277. [211] M. R. Thorson, K. I. Siil, P. J. A. Kenis, J. Electrochem. Soc. 2012, 160, F69. [212] G. Z. Kyriacou, A. K. Anagnostopoulos, J. Appl. Electrochem. 1993, 23, 483. [213] S. Kaneco, H. Katsumata, T. Suzuki, K. Ohta, Energy and Fuels 2006, 20, 409. [214] S. Kaneco, H. Katsumata, T. Suzuki, K. Ohta, Electrochim. Acta 2006, 51, 3316. [215] M. R. Singh, Y. Kwon, Y. Lum, J. W. Ager, A. T. Bell, J. Am. Chem. Soc. 2016,
138, 13006. [216] J. Wu, F. G. Risalvato, F.-S. Ke, P. J. Pellechia, X.-D. Zhou, J. Electrochem. Soc.
2012, 159, F353. [217] A. S. Varela, W. Ju, T. Reier, P. Strasser, ACS Catal. 2016, 6, 2136. [218] R. J. Gilliam, J. W. Graydon, D. Kirk, S. J. Thorpe, Int. J. Hydrogen Energy 2007,
32, 359. [219] R. C. Weast, M. J. Astle, W. H. Beyer, CRC Handbook of Chemistry and Physics,
n.d. [220] E. J. Dufek, T. E. Lister, S. G. Stone, J. Appl. Electrochem. 2014, 44, 849. [221] K. Hara, A. Kudo, T. Sakata, J. Electroanal. Chem. 1995, 391, 141. [222] K. Hara, A. Tsuneto, A. Kudo, T. Sakata, J. Electrochem. Soc. 1994, 141, 2097. [223] T. Saeki, K. Hashimoto, N. Kimura, K. Omata, A. Fujishima, J. Electroanal. Chem.
1996, 404, 299. [224] M. Todoroki, K. Hara, A. Kudo, T. Sakata, J. Electroanal. Chem. 1995, 394, 199. [225] F. Köleli, D. Balun, Appl. Catal. A Gen. 2004, 274, 237. [226] F. Proietto, B. Schiavo, A. Galia, O. Scialdone, Electrochim. Acta 2018, 277, 30. [227] S. Nakagawa, A. Kudo, M. Azuma, T. Sakata, J. Electroanal. Chem. Interfacial
Electrochem. 1991, 308, 339. [228] Kudo, Nakagawa, Tsuneto, Sakata, J. Electrochem. Soc. 1993, 140, 1541. [229] K. Hara, A. Kudo, T. Sakata, J. Electroanal. Chem. 1997, 421, 1. [230] Y. Hori, A. Murata, Electrochim. Acta 1990, 35, 1777. [231] R. Kas, R. Kortlever, H. Yılmaz, M. T. M. Koper, G. Mul, ChemElectroChem 2014,
2, 354. [232] R. Kas, K. K. Hummadi, R. Kortlever, P. de Wit, A. Milbrat, M. W. J. Luiten-
Olieman, N. E. Benes, M. T. M. Koper, G. Mul, Nat. Commun. 2016, 7, 10748. [233] H. De Jesús-Cardona, C. del Moral, C. R. Cabrera, J. Electroanal. Chem. 2001,
513, 45. [234] EG&G Technical Services, Fuel Cell Handbook (Seventh Edition), U.S.
Department Of Energy, Morgantown, WV, 2004. [235] A. J. Martín, G. O. Larrazábal, J. Pérez-Ramírez, Green Chem. 2015, 17, 5114. [236] M. J. Moran, H. N. Shapiro, D. D. Boettner, M. B. Bailey, Fundamentals of
Engineering Thermodynamics, John Wiley & Sons Inc., Hoboken, NJ, 2014. [237] J. Kestin, M. Sokolov, W. A. Wakeham, J. Phys. Chem. Ref. Data 1978, 7, 941. [238] E. N. Fuller, P. D. Schettler, J. C. Giddings, Ind. Eng. Chem. 1966, 58, 18. [239] M. Azuma, K. Hashimoto, M. Hiramoto, M. Watanabe, T. Sakata, J. Electroanal.
Chem. Interfacial Electrochem. 1989, 260, 441. [240] M. Azuma, K. Hashimoto, M. Watanabe, T. Sakata, J. Electroanal. Chem.
Interfacial Electrochem. 1990, 294, 299. [241] S. Kaneco, N. Hiei, Y. Xing, H. Katsumata, H. Ohnishi, T. Suzuki, K. Ohta, J. Solid
State Electrochem. 2003, 7, 152. [242] S. T. Ahn, I. Abu-Baker, G. T. R. Palmore, Catal. Today 2017, 288, 24. [243] M. Azuma, K. Hashimoto, M. Hiramoto, M. Watanabe, S. Tadayoshi, J.
Electrochem. Soc. 1990, 137, 1772. [244] S. Kaneco, N. Hiei, Y. Xing, H. Katsumata, H. Ohnishi, T. Suzuki, K. Ohta,
Electrochim. Acta 2002, 48, 51. [245] Y. Hori, K. Kikuchi, A. Murata, S. Suzuki, Chem. Lett. 1986, 15, 897. [246] R. L. Cook, J. Electrochem. Soc. 1988, 135, 1320. [247] J. J. Kim, D. P. Summers, K. W. Frese, J. Electroanal. Chem. Interfacial
Electrochem. 1988, 245, 223. [248] Y. Ougitani, T. Aizawa, N. Sonoyama, T. Sakata, Bull. Chem. Soc. Jpn. 2001, 74,
2119. [249] T. Mizuno, K. Ohta, A. Sasaki, T. Akai, M. Hirano, A. Kawabe, Energy Sources
1995, 17, 503. [250] S. M. A. Kriescher, K. Kugler, S. S. Hosseiny, Y. Gendel, M. Wessling,
Electrochem. commun. 2015, 50, 64. [251] N. Gutiérrez-Guerra, J. L. Valverde, A. Romero, J. C. Serrano-Ruiz, A. de Lucas-
Consuegra, Electrochem. commun. 2017, 81, 128. [252] G. O. Larrazábal, A. J. Martín, J. Pérez-Ramírez, J. Phys. Chem. Lett. 2017, 8,
3933. [253] T. Li, Y. Cao, J. He, C. P. Berlinguette, ACS Cent. Sci. 2017, 3, 778.