The effect of ethanol/water on lignocellulosic biomass and ...

pubs.acs.org/JAFC Published on Web 07/29/2010 © 2010 American Chemical Society
9054 J. Agric. Food Chem. 2010, 58, 9054–9062
DOI:10.1021/jf100807b
Compositional Analysis of Lignocellulosic Feedstocks.2. Method Uncertainties
DAVID W. TEMPLETON,* CHRISTOPHER J. SCARLATA, JUSTIN B. SLUITER, AND
EDWARD J. WOLFRUM
National Bioenergy Center, National Renewable Energy Laboratory, 1617 Cole Boulevard,Golden, Colorado 80401-3305
The most common procedures for characterizing the chemical components of lignocellulosic
feedstocks use a two-stage sulfuric acid hydrolysis to fractionate biomass for gravimetric and
instrumental analyses. The uncertainty (i.e., dispersion of values from repeated measurement) in
the primary data is of general interest to those with technical or financial interests in biomass
conversion technology. The composition of a homogenized corn stover feedstock (154 replicate
samples in 13 batches, by 7 analysts in 2 laboratories) was measured along with a National Insti-
tute of Standards and Technology (NIST) reference sugar cane bagasse, as a control, using this
laboratory’s suite of laboratory analytical procedures (LAPs). The uncertainty was evaluated by the
statistical analysis of these data and is reported as the standard deviation of each component
measurement. Censored and uncensored versions of these data sets are reported, as evidence was
found for intermittent instrumental and equipment problems. The censored data are believed to
represent the “best case” results of these analyses, whereas the uncensored data show how small
method changes can strongly affect the uncertainties of these empirical methods. Relative standard
deviations (RSD) of 1-3% are reported for glucan, xylan, lignin, extractives, and total component
closure with the other minor components showing 4-10% RSD. The standard deviations seen with
the corn stover and NIST bagasse materials were similar, which suggests that the uncertainties
reported here are due more to the analytical method used than to the specific feedstock type being
analyzed.
KEYWORDS: Summative biomass compositional analysis; uncertainty; laboratory analytical procedure;LAP; corn stover; bagasse; lignocellulose
INTRODUCTION
The most common procedures for characterizing the chemicalcomponents of lignocellulosic feedstocks use a two-stage sulfuricacid hydrolysis to fractionate biomass for gravimetric and instru-mental analyses. These methods have been developed and refinedsince their original use in the pulp and paper industry. For areview of the lineage of these methods, see our companion paperin this issue (1). These analytical methods have enabled completesummative analysis of biomass feedstocks to become a routinepart of biofuels research and development.
The data from these methods are used to calculate massbalance and process yields and for technoeconomic analysis.These results affect evaluations of process configuration, reactordesign, and process performance. At the National RenewableEnergy Laboratory (NREL) we use these data to support techno-economic analyses of biomass to ethanol processes (2). Therefore,the uncertainty (i.e., dispersion of values from repeated measure-ment) in the primary data is of general interest to those withtechnical or financial interests in biomass conversion technology.
Earlier versions of these methods were used in a collaborativeinternational study of biomass reference materials nearly twodecades ago (3). In our previous paper (1), we described ourcurrent laboratory analytical procedures (LAPs) that are used todetermine the component concentrations in lignocellulosic bio-mass at NREL.
These biomass compositional analysis methods are empiricalin nature; the final results depend on how the method is run.Empirical methods can be compared using reference materialssuch as the National Institute of Standards and Technology(NIST) biomass reference materials (RMs 8491-4) (4). It isdifficult to compare method errors (measured difference from a“true” value) without an accepted true standard. Taylor andKuyatt state, “A measurement result is complete only whenaccompanied by a quantitative statement of its uncertainty. Theuncertainty is required in order to decide if the result is adequatefor its intended purpose and to ascertain if it is consistent withother similar results” (5).
For this work, wemeasured the composition of a homogenizedcorn stover feedstock (154 replicate samples in 13 batches, by 7analysts in 2 laboratories) along with a NIST reference bagasse,run as a control, using our suite of analytical methods (NREL
*Corresponding author [[email protected]; phone(303) 384-7764; fax (303) 384-6877].

Article J. Agric. Food Chem., Vol. 58, No. 16, 2010 9055
LAPs). We evaluate the uncertainty of our methods by thestatistical analysis of these data, and we report the standarddeviations of each component measurement.
MATERIALS AND METHODS
The corn stover sample (Pioneer hybrid 33B51) was harvested in the fallof 2003 from a farm in northeastern Colorado. We acquired a largequantity of this material, and it has been used as a feedstock for numerouspretreatment, saccharification, and fermentation experiments at NRELfor several years. The stover was knife-milled to pass a 1/4 in. (6.35 mm)round screen (Reduction Technologies, model 10 � 12, Leeds, AL) andstored in totes. A 5 gal (18.9 L) sample was taken fromone of the totes andground in a Wiley knife mill to pass through a 2 mm round screen. Wesieved the milled stover and collected the -20/þ80 mesh fraction. Weconed and quartered about 900 g of this sieved corn stover three times andthen distributed the well-mixedmaterial into 24 glass bottles. To assess thehomogeneity of the material, we selected four bottles at random andpredicted the composition of eight subsamples of each bottle were using anear-infrared (NIR) calibration model (6). We saw no statistically signi-ficant differences in predicted composition among the four bottles. Thesugar cane bagasse sample was purchased fromNIST as RM 8491 (4) andwas analyzed as received. We analyzed the bagasse sample in parallel withthe corn stover samples.
Description of Biomass Compositional Analysis Methods. Com-plete biomass compositional analysis of the feedstocks was performedusing methods described in detail in our companion paper (1), availablefrom ASTM International (7) and on the Web (8). Briefly, batches of 12replicate biomass samples (approximately 1.5 g in an 11 mL cell) weresequentially extracted with water and ethanol using automated solventextractors (ASE200, Dionex, Sunnyvale, CA). The batch size (12 cornstover plus 1 bagasse) was set by the available number of cells in theextractor. The insoluble portion from that extraction was air-dried andthen subjected to a two-stage sulfuric acid hydrolysis (1 h at 30 �C/72 wt%sulfuric acid, followed by 1 h at 121 �C/4 wt % sulfuric acid in anautoclave). Sulfuric acid (72 wt %, R8191600-1A, Ricca Chemical Co.,Arlington, TX) was used as received. Sugar recovery standards (SRS)wereincluded in the second stage of the hydrolysis to account for the loss ofcarbohydrates to degradation products. We used glass pressure vessels(part 8648-30) and Teflon caps (5845-47, ACE Glass Inc., Vineland, NJ)for both hydrolyses. We separated the lignin-rich residue from theanalytical hydrolysate liquor using vacuum filtration through ceramicfiltering crucibles (60531, CoorsTek, Golden, CO). The filter cruciblesare connected to the filter flask using a rubber gasket (24065-000, VWR,West Chester, PA) after removal of the accompanying glass stem.
Carbohydrates and acetyl content were determined by high-performanceliquid chromatography (HPLC). Lignin was measured by combining aUV measurement for acid-soluble lignin and a gravimetric method formeasuring acid-insoluble residue.
HPLC Analytical Conditions. All HPLCs (model 1100, Agilent,Santa Clara, CA) were equipped with an inline degassing unit, chilledautosampler, and refractive index detector (RI). We used a lead cation(Pb2þ) exchange column (ShodexSP0810, ShowaDenkoK.K.,Kawasaki,
Table 1. Corn Stover Composition Summary Statistics
glucan xylan galactan arabinan acetyl lignin ash protein sucrose
water extractives
(others)
ethanol
extractives
total
extractives
total
structurals total
Censored Data
mean 34.0 19.2 1.0 2.5 2.9 12.3 4.7 2.2 7.2 8.0 2.6 22.5 74.4 96.9
SD 0.5 0.3 0.1 0.2 0.3 0.2 0.2 0.1 0.5 1.1 0.1 0.6 1.0 1.0
pooled SD 0.4 0.3 0.1 0.1 0.1 0.1 0.1 NA 0.4 0.9 0.1 0.4 0.6 0.5
N 142 146 154 154 154 146 154 12 154 154 154 129 129 129
Uncensored Data
mean 34.2 19.3 1.0 2.5 2.9 12.3 4.7 2.2 7.2 8.0 2.6 22.1 74.9 97.0
SD 0.9 0.5 0.1 0.2 0.3 0.5 0.2 0.1 0.5 1.1 0.1 1.2 1.7 1.5
pooled SD 0.8 0.5 0.1 0.1 0.1 0.5 0.1 NA 0.4 0.9 0.1 0.8 1.4 1.3
N 154 154 154 154 154 154 154 12 154 154 154 154 154 154
Table 2. NIST Bagasse (RM 8491) Composition Summary Statistics
glucan xylan galactan arabinan acetyl lignin ash protein sucrose
water extractives
(others)
ethanol
extractives
total
extractives
total
structurals total
mean 39.0 21.8 0.8 1.8 3.3 24.8 3.9 0.5 0.7 2.7 1.9 5.7 95.1 100.8
SD 0.5 0.4 0.2 0.2 0.2 0.5 0.2 0.1 0.3 0.5 0.1 0.4 1.1 1.0
N 14 14 14 14 14 14 14 10 14 14 14 14 14 14
Figure 1. Summary compositional analysis results on a dry weight basisfrom this study for (a) corn stover and (b)NIST standard referencematerial(RM) 8491 (bagasse). Data were produced by 7 analysts working in2 different laboratories. The constituents are shown in decreasing con-stituent value in corn stover. Error bars show (1 standard deviation.The corn stover material is slightly lower in glucan and xylan, much lowerin lignin, and much higher in total extractives than the NIST RM. Uncer-tainties for each constituent are similar between the corn stover and thebagasse RM.

9056 J. Agric. Food Chem., Vol. 58, No. 16, 2010 Templeton et al.
Japan), running at 85 �C, using 18 MΩ water as the mobile phase at0.6 mL/min. We used deashing guard columns (125-0118, Bio-Rad,Sunnyvale, CA) located outside the heating compartment to keep theguard columns within their manufacturer’s temperature tolerance. Thisreduces the appearance of ghost peaks from the monomer sugars that caninterfere with quantitation. We purchased the calibration standards andindependent calibration verification standards from Absolute StandardsInc. (Hamden, CT). Calibration standards for sugars were run at fourlevels ranging from 0.01 mg/mL to 6.00 mg/mL for D-(þ)-cellobiose,D-(þ)-glucose, D-(þ)-xylose, D-(þ)-galactose, and L-(þ)-arabinose, with a50 μL injection volume into the HPLC. Acetyl separation was performedusing a cation H column (HPX-87H Bio-Rad), running at 55 �C, using0.01 N sulfuric acid in 18 MΩ water as the mobile phase at a flow rateof 0.6 mL/min. Calibration standards for acetyl ranged from 0.02 to1.08 mg/mL and were also run at four levels with a 50 μL injection size.
Description of Sugar Recovery Standards. The measured concen-trations of monomer sugars released from the biomass are corrected usingSRS autoclaved with the samples. Mixed solutions of biomass sugars,prepared in-house and similar in concentration to the samples, areanalyzed before and after the autoclave hydrolysis to account for thefraction of the liberated monosaccharides that are degraded during thehydrolysis. In practice, the glucose concentration in the SRS samples isreduced to approximately 95% of its original value after autoclaving, sothe corresponding glucose concentrations in the biomass samples aremultiplied by the ratio 1.0/0.95 to correct for this loss. Typical SRSrecoveries for xylose are approximately 85%, because xylose is more labilethan glucose.
Laboratory Equipment Comparison. We performed these analysesin two similarly equipped laboratories on the NREL campus. The twolaboratories (identified below as A and B) were equipped with similarequipment and reagents; with the following exceptions, the materials and
methods should be considered the same for both laboratories. LaboratoryA was equipped with a Thermolyne (Barnstead Thermolyne, Hampton,NH) 30400 furnace set to ramp to 575 �C, whereas laboratory B’s furnacewas set to a constant 575 �C and samples were ignited using a Bunsenburner prior to placement in the furnace. Laboratory A had two largeautoclaves with external steam generators (Consolidated SR-24C withMark II controllers, Consolidated Stills and Sterilizers, Boston, MA)available for the secondary acid hydrolysis. Laboratory B was equippedwith a benchtop autoclave that generated steam pressure internally(Sterilmatic model Stm_E,Market Forge, Everett,MA). The only commonmaterials between the laboratories were common batches of SRS solutionsand HPLC standards for both carbohydrate and acetyl measurements.
Measured Biomass Components.A total of 11 primary componentswere measured: glucan, xylan, galactan, arabinan (the structural carbo-hydrates), acetyl, lignin (the combined acid-insoluble residue and acid-soluble lignin), ash (apportioned between structural and nonstructural),protein (apportioned between structural and nonstructural), water andethanol extractives, and the sucrose content within the water extractivesfraction. On the basis of these primary data, we calculated the values of thefollowing components: water extractives (others), total extractives, totalstructurals, and total. Water extractives (others) is calculated as theamount of water-soluble material minus the soluble ash, soluble protein,and sucrose. The total extractives value is the sum of the water and theethanol-soluble material. The structurals value is calculated as the sum ofall material not solubilized during extraction; it consists of the glucan,xylan, galactan, arabinan, lignin, acetyl, structural protein, and structuralash. The total value is the sum of all components in the biomass.
To measure the overall method uncertainty, we had a homogenizedcorn stover sample analyzed in different laboratories, by different analysts,and in multiple batches run by the same analyst. Each analyst performedcomplete analysis on 12 replicate corn stover samples and 1 sugar cane
Figure 2. Summary compositional analysis uncertainty results from this study on dry weight basis for the corn stover (a) standard deviation (SD) and(b) relative standard deviation (RSD, SD/mean) for the uncensored data and (c) SD and (d) RSD (SD/mean) for the censored data. The constituents areshown in the same order as in Figure 1. The overall uncertainty is driven to a large extent by total extractives and glucan and drops substantially when outlierdata are removed.

Article J. Agric. Food Chem., Vol. 58, No. 16, 2010 9057
bagasse sample as a batch. The data presented below are the results of 13separate batches performed by 7 analysts. Each analyst was assigned alaboratory such that the number of batches was divided approximatelyevenly between the two laboratories. To evaluate the effect of multiplebatches run by a single analyst, two researchers each analyzed fourseparate batches, two batches in each laboratory. All other analystsperformed only one batch in an assigned laboratory.
Weused the statistical program “R” to analyze and plot the data (9).Alltests of statistical significance were performed at the 95% significance level(p < 0.05).
RESULTS AND DISCUSSION
We chose corn stover for this experiment, because it is a widelyand currently available herbaceous feedstock. An analyst homo-genized and distributed a 900 g sample of corn stover into 24bottles. We randomly selected four bottles, scanned the contentsby near-infrared (NIR) spectroscopy, and predicted the stovercompositions. In a one-wayANOVAof these data, no significantcompositional differences between the bottles were found. Wetherefore assumed that thematerial was homogeneous among thedifferent bottles. A total of 13 batches of 12 corn stover sampleswere analyzed by 7 analysts, resulting in a total of 156 analyses.
One sample each from two batches was lost during the analysis,leaving 154 complete analyses. As a control, one sample of NISTbagasse reference material (RM 8491) was analyzed with eachbatch for a total of 13 replicates. The compositional analysis dataare included in the Supporting Information.
The analysts performed the compositional analyses in batches(12 corn stover samples and 1 bagasse) over the course of severalweeks (Dec 2008-Jan 2009). Here we report both the censored(without Tukey outliers) and uncensored (all data) sets. Weremoved individual measurements after applying Tukey outliertests in conjunction with observed experimental anomalies. [Weapplied the Tukey outlier test to the major components (waterextractives, lignin, glucan, and xylan). This test identifies anysample having a value>1.5 times the interquartile range less thanthe lower hinge or greater than the upper hinge. A total of 17samples out of 154were identified as low outliers for water extrac-tives. All of these low water extractives were run in laboratory B.During this experiment, analysts noted occasional variability inthe volume of the solution in the water collection vial afterextraction, along with minor instrument warnings from theautomated solvent extractor in laboratory B. After all experi-ments were completed, we discovered and repaired a mechanical
Figure 3. Control chart plots of individual corn stover sample compositional analysis results from this study for glucan, xylan, lignin, and total extractives.These four constituents represent almost 90% of the total mass of the corn stover. Solid lines indicate the mean of each constituent. Dotted lines represent(3 standard deviations from the mean.

9058 J. Agric. Food Chem., Vol. 58, No. 16, 2010 Templeton et al.
problem with the automated solvent extractor in laboratory Bthatwe believewas responsible for the low outlierwater extractivevalues. The exclusion of these 17 samples reduced the waterextractives uncertainty considerably, but even after exclusion ofthese samples, the relative standard deviation of the water extrac-tives value for samples run in laboratory B was still larger thanthat in laboratory A (3.5 vs 2.5%), a statistically significantdifference. We identified a total of 13 Tukey outliers for glucanand/or xylan (7 for both glucan and xylan, 5 for glucan only, and1 for xylan only). Six of these 13 samples were also outliers forwater extractives but were not flagged as carbohydrate outliers onan extractives-free basis. Thus, the underlying carbohydrate datawere likely correct, and the low extractives value computationallybiased the final carbohydrate result high. Six of the other 7 werefrom laboratory A. These samples showed high carbohydratevalues and normal water extractives values, which suggests a pro-blem in the carbohydrate analysis separate from the waterextractives test. We had identified a problem with the gasket sealsused for filtration after analytical hydrolysis in laboratory A. Wehypothesize that excessive air flow through the flask causedevaporation of the filtrate, leading to artificially high carbohy-drate values. TheTukey outlier test also identified 8 ligninoutliers,all but 1 ofwhichwere associatedwith an outlier extractives value,which again suggests the low extractives result computationallybiased the final lignin result high.] In summary, of 154 analyses,weidentified as outliers 17 individual water extractives measure-ments, 12 glucan measurements, 8 xylan values, and 8 ligninvalues. We believe the censored data represent the “best case”results of our analyses, whereas the uncensored data show howsmall method changes can strongly affect the uncertainties of theseempirical methods.
It could be argued that we are simply excluding the∼5%of thedata that always fall outside the range covered by ∼2 standarddeviations from the mean. However, we believe these outliers arenot representative of the typical results of the compositionalanalysis procedure for two reasons. First, all of the water extrac-tives outliers were below the mean, and all of the lignin andglucan/xylan outliers were above themean, suggesting a systema-tic error in both cases. Second, we have working hypotheses toexplain the sources of both errors: a malfunctioning solventextractor in laboratory B for the water extractives and associatedlignin and glucan/xylan outliers, and a leaking gasket in labora-tory A during filtration for the independent carbohydrate out-liers.
Biomass Compositional Analysis and Uncertainty Data. Weshow in Table 1 the censored and uncensored compositional datafor the corn stover sample. We report both the overall and thepooled (weighted average within the batches) standard deviations(SD) for this set. The pooled SDs are less than the overall SDs forall components, suggesting that the uncertainty within thebatches is lower than the uncertainty between batches. We showin Table 2 the compositional data for the NIST bagasse (RM8491) control sample, which we ran once with each batch. Nobagasse data were censored.We report only the overall SD, as thepooled SD is not meaningful for single replicates. The averagetotal mass closures were 96.9% (SD 1.0%) and 100.8% (SD1.0%) for the corn stover and the bagasse sample, respectively. Acomponent closure near 100% suggests that most componentsare accounted for and little double counting of components isoccurring.
Figure 1 shows the average censored compositional data for thecorn stover material (Figure 1a) and the corresponding data forthe NIST sugar cane bagasse (Figure 1b). The constituents areshown in the same order in both figures and are sorted by percentdry weight in the corn stover samples. The error bars in this figurerepresent (1 SD about the mean of each constituent. Almost90% of the total mass is accounted for by glucan, xylan, lignin,and total extractives. The corn stover feedstock contains muchmore total (water þ ethanol) extractives than the sugar canebagasse (>22 vs<6%). The amount of extractives in corn stoverdepends on the variety, harvest time, and postharvest handling.Sugar cane bagasse is a byproduct of an industrial process toextract the cane juice, and this process leaves behind littleextractable material. Thus, these sample materials span a widerange of total extractives content.
The effect of the censoring process on the uncertainty of themeasurements is illustrated in Figure 2. Panels a and b of Figure 2show the SD and the relative standard deviation (RSD = SD/mean) of the uncensored compositional data for the main con-stituents of corn stover, whereas panels c and d show thecorresponding censored data. The SDs for the censored compo-nents are 30-50% lower than for the uncensored data, whichshows the outsized effect of the excluded samples. The extractivesterm has the highest RSD of the major components. Because thetotal extractives value is used to correct the measurement ofstructural components to a whole, dry weight basis, uncertaintiesin the extractives value affect all of the results. The RSD valuesare larger for the minor components, due largely to smaller meanvalues rather than the larger SD values.
Examination of Data Using Control Charts. Figure 3 showscontrol charts of the censored corn stover compositional data foreach of the individual samples analyzed for glucan, xylan, lignin,and total extractives. In eachplot, the solid line indicates themeanand the dashed lines indicate(3 SDs above and below the mean.Gaps in the data appear where samples were excluded in thecensoring process. Each plot is labeled with the mean and SD for
Figure 4. (a)Water extractives and (b) glucan content of 154 samples inthe round robin study, generated by seven analysts working in two differentlaboratories. In both plots the data are separated by laboratory, with Tukeyoutliers highlighted. All sample results with water extractives data flaggedas Tukey outliers (n = 17)were from the same solvent extraction instrumentin laboratory B and were excluded from the data analysis. A total of 12carbohydrate outliers were also identified, but 5 of these were flagged asextractives outliers as well. All but 1 of the remaining 7 outliers wereanalyzed in laboratory A.
Article J. Agric. Food Chem., Vol. 58, No. 16, 2010 9059
each constituent. No trends in constituent values are evident,suggesting that the analyses were performed consistently overtime.
Figure 4 shows the uncensored corn stover compositional datafor water extractives and glucan, noted by laboratory, for each ofthe samples. The triangles depict samples that failed a Tukeyoutlier test. Many of the glucan outliers (Figure 4b) correspondwith water extractives outliers (Figure 4a). As discussed above,this is due to the computational effect of using the extractivesvalue to convert the primary measurement of extractives-freeglucan to a whole, dry weight basis. A few of the glucan highoutliers do not correspond with water extractives outliers, and aswe mentioned previously, we believe these hydrolysate solutionsbecame concentrated during the vacuum filtration step.
Utility of Sugar Recovery Standards. As discussed above, SRSare included in the secondary (autoclave) hydrolysis step. The useof SRS as a proxy to estimate the extent of degradation of thestructural (polymer) carbohydratesmay overestimate the amountof sugars lost during hydrolysis, because the structural carbohy-drates are present as oligomers (not monomers as in the SRS) atthe beginning of the secondary hydrolysis. Although imperfect,until a good model polysaccharide is identified, hydrolyzingmonosaccharides simultaneously with biomass samples is thebest available method to correct for lost sugars.
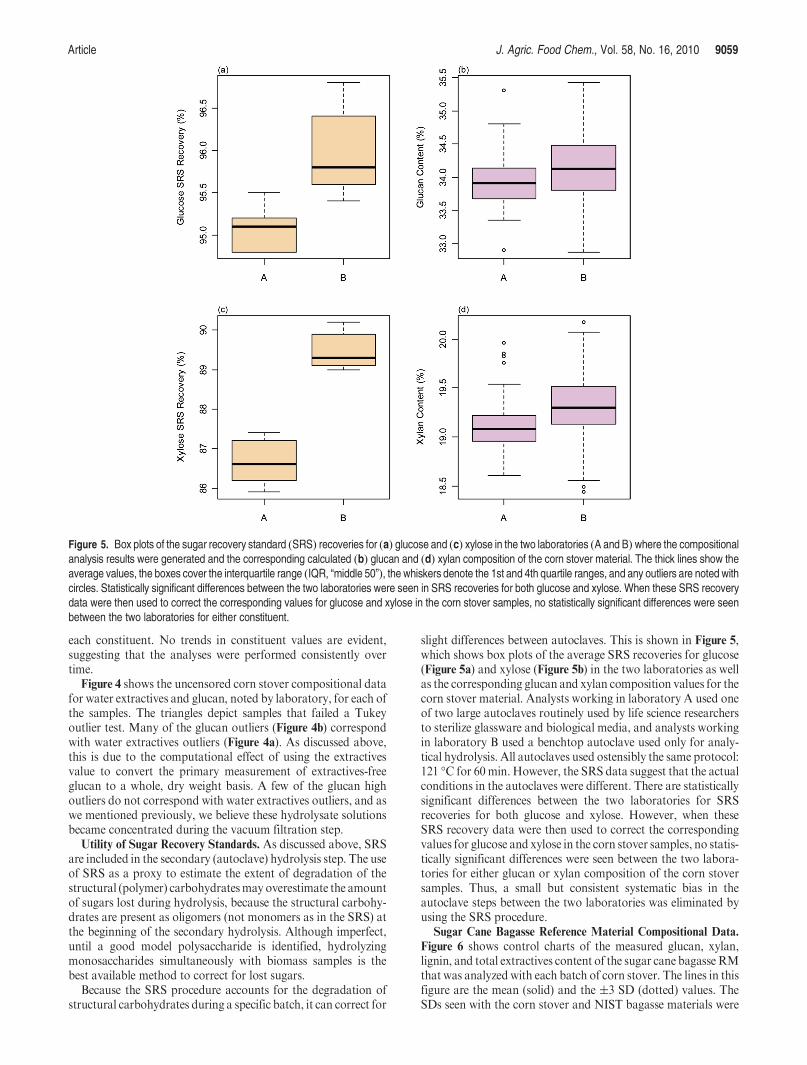
Because the SRS procedure accounts for the degradation ofstructural carbohydrates during a specific batch, it can correct for
slight differences between autoclaves. This is shown in Figure 5,which shows box plots of the average SRS recoveries for glucose(Figure 5a) and xylose (Figure 5b) in the two laboratories as wellas the corresponding glucan and xylan composition values for thecorn stover material. Analysts working in laboratory A used oneof two large autoclaves routinely used by life science researchersto sterilize glassware and biological media, and analysts workingin laboratory B used a benchtop autoclave used only for analy-tical hydrolysis. All autoclaves used ostensibly the same protocol:121 �C for 60min. However, the SRS data suggest that the actualconditions in the autoclaves were different. There are statisticallysignificant differences between the two laboratories for SRSrecoveries for both glucose and xylose. However, when theseSRS recovery data were then used to correct the correspondingvalues for glucose and xylose in the corn stover samples, no statis-tically significant differences were seen between the two labora-tories for either glucan or xylan composition of the corn stoversamples. Thus, a small but consistent systematic bias in theautoclave steps between the two laboratories was eliminated byusing the SRS procedure.
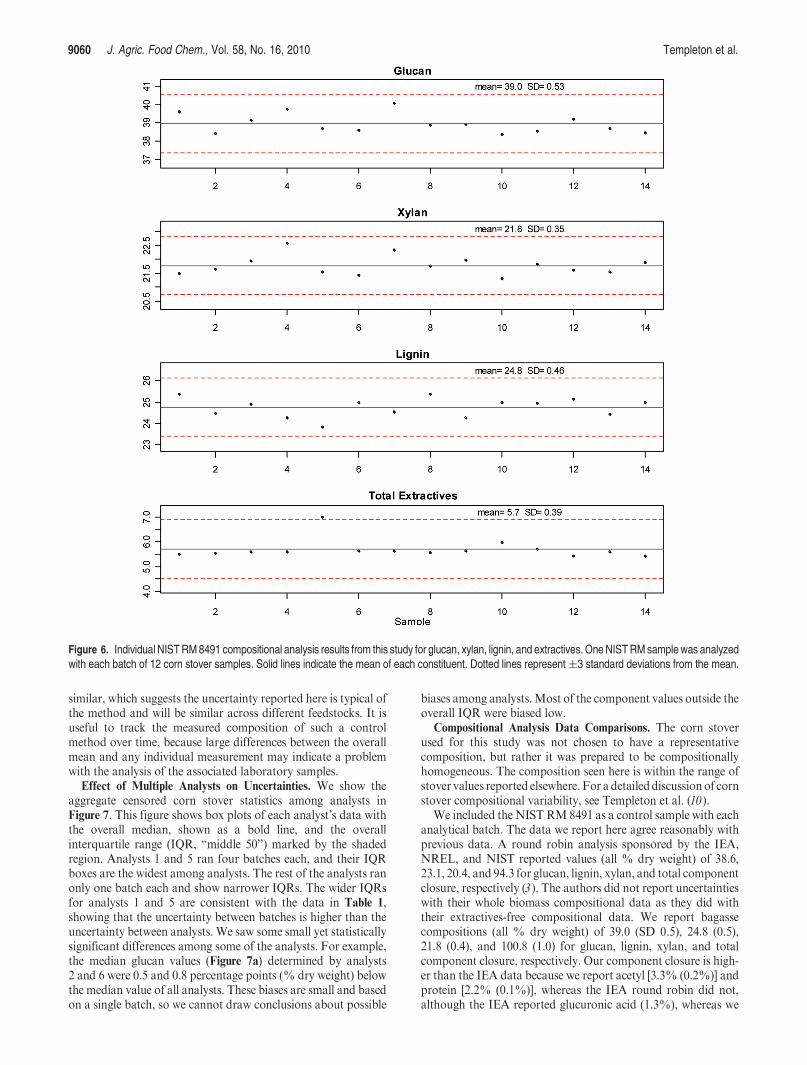
Sugar Cane Bagasse Reference Material Compositional Data.
Figure 6 shows control charts of the measured glucan, xylan,lignin, and total extractives content of the sugar cane bagasseRMthat was analyzed with each batch of corn stover. The lines in thisfigure are the mean (solid) and the (3 SD (dotted) values. TheSDs seen with the corn stover and NIST bagasse materials were
Figure 5. Box plots of the sugar recovery standard (SRS) recoveries for (a) glucose and (c) xylose in the two laboratories (A and B) where the compositionalanalysis results were generated and the corresponding calculated (b) glucan and (d) xylan composition of the corn stover material. The thick lines show theaverage values, the boxes cover the interquartile range (IQR, “middle 50”), the whiskers denote the 1st and 4th quartile ranges, and any outliers are noted withcircles. Statistically significant differences between the two laboratories were seen in SRS recoveries for both glucose and xylose. When these SRS recoverydata were then used to correct the corresponding values for glucose and xylose in the corn stover samples, no statistically significant differences were seenbetween the two laboratories for either constituent.
9060 J. Agric. Food Chem., Vol. 58, No. 16, 2010 Templeton et al.
similar, which suggests the uncertainty reported here is typical ofthe method and will be similar across different feedstocks. It isuseful to track the measured composition of such a controlmethod over time, because large differences between the overallmean and any individual measurement may indicate a problemwith the analysis of the associated laboratory samples.
Effect of Multiple Analysts on Uncertainties. We show theaggregate censored corn stover statistics among analysts inFigure 7. This figure shows box plots of each analyst’s data withthe overall median, shown as a bold line, and the overallinterquartile range (IQR, “middle 50”) marked by the shadedregion. Analysts 1 and 5 ran four batches each, and their IQRboxes are the widest among analysts. The rest of the analysts ranonly one batch each and show narrower IQRs. The wider IQRsfor analysts 1 and 5 are consistent with the data in Table 1,showing that the uncertainty between batches is higher than theuncertainty between analysts. We saw some small yet statisticallysignificant differences among some of the analysts. For example,the median glucan values (Figure 7a) determined by analysts2 and 6 were 0.5 and 0.8 percentage points (% dry weight) belowthe median value of all analysts. These biases are small and basedon a single batch, so we cannot draw conclusions about possible
biases among analysts.Most of the component values outside theoverall IQR were biased low.
Compositional Analysis Data Comparisons. The corn stoverused for this study was not chosen to have a representativecomposition, but rather it was prepared to be compositionallyhomogeneous. The composition seen here is within the range ofstover values reported elsewhere.For a detaileddiscussionof cornstover compositional variability, see Templeton et al. (10).
We included the NISTRM8491 as a control sample with eachanalytical batch. The data we report here agree reasonably withprevious data. A round robin analysis sponsored by the IEA,NREL, and NIST reported values (all % dry weight) of 38.6,23.1, 20.4, and 94.3 for glucan, lignin, xylan, and total componentclosure, respectively (3). The authors did not report uncertaintieswith their whole biomass compositional data as they did withtheir extractives-free compositional data. We report bagassecompositions (all % dry weight) of 39.0 (SD 0.5), 24.8 (0.5),21.8 (0.4), and 100.8 (1.0) for glucan, lignin, xylan, and totalcomponent closure, respectively. Our component closure is high-er than the IEA data because we report acetyl [3.3% (0.2%)] andprotein [2.2% (0.1%)], whereas the IEA round robin did not,although the IEA reported glucuronic acid (1.3%), whereas we
Figure 6. Individual NISTRM8491 compositional analysis results from this study for glucan, xylan, lignin, and extractives. OneNISTRMsamplewas analyzedwith each batch of 12 corn stover samples. Solid lines indicate the mean of each constituent. Dotted lines represent(3 standard deviations from the mean.

Article J. Agric. Food Chem., Vol. 58, No. 16, 2010 9061
did not. A new interlaboratory study is currently being performedto recertify the compositions of the four NIST biomass RMs.
Method Quality Control Considerations. These empirical meth-ods require attention to detail and can be problematic, withmanysample manipulations and therefore opportunities for mistakes.We have shown that it is possible to get reproducible feedstockcompositional data among different analysts and laboratoriesusing these compositional analysismethods.Wehave also shown,in the censored and uncensored data (Figure 2), that smalldifferences in the analytical technique can have a great effect onthe sample uncertainty.
To generate high-quality data, it is important to follow themethods closely, although simply following the written protocoldoes not guarantee good data. Additional quality control mea-sures are needed. In addition to good laboratory practices (pipetand balance calibration, properHPLC standards, etc.), we ensurequality compositional data by analyzing SRS with each samplebatch, running a reference material with each batch (NISTbagasse, in this case), and analyzing samples in duplicate (ormore). Evidence of good compositional analyses includes repli-cate data within these reported method uncertainties, goodanalytical component closure (95-105%), and good componentclosure around a given unit operation (pretreatment, condition-ing, saccharification, fermentation, etc.).
On the basis of our experience, there are several commonmistakes in technique that can affect the results. These includeimproperly dried samples and incomplete wetting or samplestirring during the primary hydrolysis, leading to incomplete
hydrolysis and biasing the carbohydratemeasurement low. Othertechnique mistakes included raising the pH of the analyticalhydrolysate to >6 during neutralization with CaCO3 and diffi-culties in interpreting and integrating the HPLC chromatograms,because baseline resolution of all sugars is not possible withcurrent columns. These mistakes could bias the carbohydrateresults higher or lower. We have also seen concentration of thehydrolysate during filtration of the acid-insoluble residue andincomplete extraction of samples prior to analytical hydrolysis,which tend to bias the carbohydrate results high. In general, thereare many possible causes to bias the carbohydrate measurementslow and fewer causes for high biases.
The uncertainties associated with these methods can be re-duced by having well-trained analysts running the methods;because the methods are so manually intensive, it is easy for ananalyst to fall out of practice. We recommend having one analystwork up each sample from beginning to end, which allows theanalyst to spot problems in the data and correct his or hertechnique.
Practical Consideration 1: Extractions. Even with all of thesesafeguards in place, we noted larger compositional uncertaintiesin the uncensored data due to problems in the extraction step.Poor extractions led to poor corrections from extractives-freedata to a whole, dry weight basis, and we excluded the poorlyextracted samples from the censored data set. We noted but didnot appreciate differences in the volume of water extract solutionand minor instrumental errors. In hindsight, this should havealerted us to mechanical problems with the instrument. We now
Figure 7. Box plots of the glucan, xylan, lignin, and extractives content of corn stover analyzed during this study, separated by analyst. Themedian value of theentire data set is shown as a solid horizontal line, and the interquartile range (IQR, “middle 50”) of the entire data set is shown in gray. Analysts 1 and 5 ran fourbatches each, whereas the other analysts ran a single batch.

9062 J. Agric. Food Chem., Vol. 58, No. 16, 2010 Templeton et al.
measure the amount of water extract solution to ensure moreconsistent extractions.
The outlier water extractives were easy to spot with so manyreplicates run in this data set (Figure 4a). Even if few replicateswere run, an alert analyst should note unusually low total massclosure, unusually lowextractionvolumes, or unusually high carbo-hydrate values, which indicate problems with the analytical data.
Practical Consideration 2: Concentrated Analytical Hydroly-
sates.We found a few samples with high carbohydrate values butnormal extractives values. We believe these are caused by con-centrating the analytical hydrolysate during the solid/liquidvacuum filtration step, because these samples tended to havehigh concentrations for all of the sugars and acetyl simulta-neously. We have replaced the filtration gaskets used in thatlaboratory to limit the amount of air drawn past the analyticalhydrolysate.
Practical Consideration 3: Sugar Recovery Standards. As dis-cussed previously, we recommend that a SRS be run with eachbatch. This allows for a direct correction of the samples with thespecific hydrolysis conditions and can be used to track changes inautoclave performance. Because the SRS recovery is specific toeach autoclave, we do not recommend using SRS values fromoneautoclave to correct for data run in a different autoclave.
Overall Method Uncertainties. The uncertainty values pre-sented here combine the uncertainty contributions from labora-tory operations (e.g., weighing, dilutions), instrumental opera-tions (ASE,HPLC), different analysts, and different laboratories.Using a homogenized corn stover sample, we report censoredRSDs in Figure 2 and Table 1. Estimates of errors, in the form of98% confidence intervals, for these methods have been publishedelsewhere, and are reported to range from 0.5 to 1.5% (absolutebasis) for all components (11, 12). In contrast, we report themethoduncertainties of replicate analyses on a homogenized cornstover sample. We report method uncertainties for the majorbiomass components (all % RSD) as glucan (1.6%), lignin(1.4%), xylan (1.8%), and extractives (2.7%). Not surprisingly,we found higher uncertainties for the lesser components includingprotein (4.7%), whole ash (4.4%), minor sugars (6.8%), andacetyl (9.8%). These uncertainties are based on results from 7analysts, run in 13 batches, analyzed in 2 laboratories.We believethese data demonstrate typical uncertainties associatedwith thesemethods. We recognize that these feedstock compositions areused for conversion and yield calculations, and the uncertaintiesin these primarymeasurements propagate into these calculations.We are currently examining the effect of this uncertainty propa-gation (manuscript in preparation).
ABBREVIATIONS USED
IEA, International Energy Agency; HPLC, high-performanceliquid chromatography; LAP, laboratory analytical procedure;NIST, National Institute of Standards and Technology; NREL,National Renewable Energy Laboratory;RM, referencematerial;RSD, relative standard deviation; SRS, sugar recovery standard.
ACKNOWLEDGMENT
We thank Crissa Doeppke, Erik Fisk, Deb Hyman, RyanNess, Courtney Payne, Kristen Reichel, and Jeff Wolfe forrunning these analyses. We thank Al Darzins, Stewart Black,SaraHavig, LingTao,Dan Schell, andAmie Sluiter for reviewingthe manuscript.
Supporting Information Available: CSV file containing all
compositional results and “R” codes used to analyze the data and
generate the figures and tables. This material is available free of
charge via the Internet at http://pubs.acs.org.
LITERATURE CITED
(1) Sluiter, J. B.; Ruiz, R. O.; Scarlata, C. J.; Sluiter, A. D.; Templeton,D. W. Compositional analysis of lignocellulosic feedstocks. 1. Re-view and description of methods. J. Agric. Food Chem. 2010,doi: 10.1021/jf1008023.
(2) Aden, A.; Ruth, M.; Ibsen, K.; Jechura, J.; Neeves, K.; Sheehan, J.;Wallace, B.; Montague, L.; Slayton, A.; Lukas, J. LignocellulosicBiomass to Ethanol Process Design and Economics UtilizingCo-Current Dilute Acid Prehydrolysis and Enzymatic Hydrolysis forCorn Stover; National Renewable Energy Laboratory; Harris Group:Golden, CO, and Seattle, WA, June 2002.
(3) Milne, T. A.; Chum, H. L.; Agblevor, F.; Johnson, D. K. Standar-dized analytical methods.Biomass Bioenergy 1992, 2 (1-6), 341–366.
(4) NIST Standard Reference Materials; http://ts.nist.gov/measure-mentservices/referencematerials/index.cfm (Dec 2009).
(5) Taylor, B. N.; Kuyatt, C. E. NIST Technical Note 1297: Guidelinesfor Evaluating and Expressing the Uncertainty of NISTMeasurementResults; U.S. Government Printing Office: Washington, DC, 1994.
(6) Wolfrum, E. J.; Sluiter, A. D. Improved multivariate calibrationmodels for corn stover feedstock and dilute-acid pretreated cornstover. Cellulose 2009, 16 (4), 567–576.
(7) ASTM Standards; http://www.astm.org/Standard/index.shtml (Dec2009).
(8) NREL Laboratory Analytical Procedures; http://www.nrel.gov/bio-mass/analytical_procedures.html (Dec 2009).
(9) R: A Language and Environment for Statistical Computing; R Devel-opment Core Team: Vienna, Austria, 2006; R Foundation for StatisticalComputing, ISBN 3-900051-07-0, http://www.R-project.org.
(10) Templeton, D. W.; Sluiter, A. D.; Hayward, T. K.; Hames, B. R.;Thomas, S. R. Assessing corn stover composition and sources ofvariability via NIRS. Cellulose 2009, 16 (4), 621–639.
(11) Decker, S. R.; Sheehan, J.; Dayton, D. C.; Bozell, J. J.; Adney,W. S.;Hames, B.; Thomas, S. R.; Bain, R. L.; Czernik, S.; Zhang, M.;Himmel, M. E. Biomass conversion. In Kent and Riegel’s Handbookof Industrial Chemistry and Biotechnology, 11th ed.; Kent, J. A., Ed.;Springer Verlag: New York, 2007; Vol. 2, pp 1449-1548.
(12) Hames, B. R. Biomass compositional analysis for energy applica-tions. In Biofuels, Methods in Molecular Biology; Mielenz, J. R., Ed.;Humana Press: Totowa, NJ, 2009; pp 145-167.
Received for review February 26, 2010. Revised manuscript received
May 26, 2010. Accepted June 2, 2010. This work was supported by the
U.S. Department of Energy Office of the Biomass Program.
Copyright © 2022 FDOKUMEN