The effect of ethanol/water on lignocellulosic biomass and ...
64
Master Thesis Sustainable Process Technology The effect of ethanol/water on lignocellulosic biomass and cellulose liquefaction Galuh Wirama Murti s1629220 August 2017 Examination Committee: prof. dr. ir. S.R.A. Kersten dr. ir. R.J.M. Westerhof dr. Bastian Mei P.S. Marathe M.Sc
-
Upload
khangminh22 -
Category
Documents
-
view
0 -
download
0
Transcript of The effect of ethanol/water on lignocellulosic biomass and ...

Master Thesis Sustainable Process Technology
The effect of ethanol/water on lignocellulosic biomass and cellulose liquefaction
Galuh Wirama Murti s1629220 August 2017 Examination Committee: prof. dr. ir. S.R.A. Kersten dr. ir. R.J.M. Westerhof dr. Bastian Mei P.S. Marathe M.Sc

2

3
ABSTRACT
Biomass and cellulose, as potential renewable alternative resources, were liquefied in the presence of ethanol and water. The aim of this work is to study the effects of ethanol/water mixture on direct liquefaction of biomass and cellulose. The experiments were conducted in a 45-ml batch autoclave at high temperature and elevated pressure. The parameters include feedstock (wood and cellulose), ethanol concentration (0 – 100 wt%), reaction temperature (250 – 350 oC), and reaction time (0 – 90 min). The products were analyzed by GC-MS, Karl Fischer titration, GPC, HPLC, and LC-MS.
The optimum operating condition for biomass liquefaction was achieved in the ethanol/water mixture of 60/40 (w/w) at a reaction temperature of 300oC, and a holding time of 30 min. Above 300oC, the solid residue yield increased significantly due to re-polymerization. Furthermore, prolonged reaction time more than 1 h led to high solid residue yield. During recovery, the bio-crude oil tended to be entrained through a filter when employing ethanol in the liquefaction process. It was revealed that bio-crude oil was partly dissolved in the ethanol/water mixture. The solubility of the hydrophobic-bio-crude oil increased proportionally to the amount of ethanol concentration. Cellulose liquefaction was also conducted by varying the concentration of ethanol. The results showed a similar trend to those from biomass liquefaction. The same operating condition gave the lowest solid residue yields. Some degradation products of cellulose in the aqueous phase such as levulinic acid, acetic acid, formic acid, and ethyl levulinate were observed by HPLC and LCMS. Then, the analyses were also applied to the aqueous phase from biomass liquefaction in which the compounds were also found.
In summary, ethanol and water mixture showed a synergistic effect on liquefaction process. Water accelerates the decomposition reaction, and simultaneously, ethanol may dissolve the heavy molecular weight compounds from the solid matrix. GPC analyses demonstrated that the average of molecular weight of the oil from biomass liquefaction increased gradually by increasing amount of ethanol in the medium. Nevertheless, in cellulose liquefaction, the average molecular weight decreased by an increase in ethanol. It indicated that charring might be avoided by using ethanol as a solvent. Also, ethanol reacts with the intermediate product and produces light molecular weight compounds. Our work confirmed that in a water-rich medium, the reaction occurred quickly toward the degradation products and charring; however, an addition of ethanol could decrease the reaction rate as well as protect the glucose into further degradation products, and eventually, levulinic ester was found as a stable product at the end of the reaction.

4
CONTENTS
ABSTRACT ........................................................................................................................................... 3
1. INTRODUCTION .......................................................................................................................... 6
2. LITERATURE REVIEW .................................................................................................................. 8
2.1. Biomass to Bio-Oil Conversion ........................................................................................... 8
2.2. Types of Solvents ............................................................................................................. 10
2.2.1. Acid/Base Solvents ................................................................................................... 10
2.2.2. Water ....................................................................................................................... 11
2.2.3. Alcohols .................................................................................................................... 11
2.2.4. Aromatics Solvents ................................................................................................... 12
2.3. Cellulose Degradation ...................................................................................................... 14
2.4. Research Questions ......................................................................................................... 16
3. RESEARCH METHODOLOGY ..................................................................................................... 17
3.1. Materials .......................................................................................................................... 17
3.2. Experimental Setup .......................................................................................................... 17
3.2.1. Liquefaction with Ethanol/Water Mixture ............................................................... 17
3.2.2. Liquid-liquid Equilibrium Experiment....................................................................... 19
3.2.3. Determination of Ethanol Balance ........................................................................... 20
3.2.4. Product Yields .......................................................................................................... 20
3.2.5. Molecular Weight Distribution ................................................................................ 21
3.2.6. Analysis the Aqueous Phase Products of Cellulose and Wood Liquefaction ........... 22
3.2.7. Analysis the Solid Residue of Cellulose Liquefaction ............................................... 22
4. RESULTS AND DISCUSSION ....................................................................................................... 23
4.1. Mass Balance and Reproducibility ................................................................................... 23
4.2. Solubility of HTL Oil in the Ethanol/Water Mixture ......................................................... 24
4.3. Biomass Liquefaction ....................................................................................................... 26
4.3.1. Effects of Ethanol Addition on Biomass liquefaction ............................................... 26
4.3.2. Effects of Temperature ............................................................................................ 29
4.3.3. Effects of Reaction Time .......................................................................................... 32
4.4. Cellulose Liquefaction ...................................................................................................... 35
4.5. The Degradation Products in the Aqueous Phase ........................................................... 38
4.6. FTIR Analysis for Oil and Solid Residue Products of Cellulose Liquefaction .................... 41
5. CONCLUSIONS .......................................................................................................................... 44

5
6. RECOMMENDATIONS ............................................................................................................... 45
7. REFERENCES ............................................................................................................................. 46
8. ACKNOWLEDGEMENTS ............................................................................................................ 50
APPENDIX A. LITERATURE REVIEW ................................................................................................... 51
APPENDIX B. LIQUEFACTION DATA EXPERIMENTS .......................................................................... 53
APPENDIX C. LIQUID PRODUCT ANALYSIS ........................................................................................ 57
APPENDIX D. SOLUBILITY DATA EXPERIMENTS ................................................................................ 59
APPENDIX E. OVERALL AND ETHANOL MASS BALANCES ................................................................. 60
APPENDIX F. GPC RESULTS ............................................................................................................... 62

6
1. INTRODUCTION
The world’s energy consumption for both fuels and chemicals is still mainly supplied by fossil resources. At a certain stage, the fossil must be replaced by new resources that are renewable, carbon-neutral, and sustainable. Many renewable energy technology developments have been conducted to compensate the deficiency of energy and chemicals demand. This scarcity has an impact on the utilization of renewable resources for fuel and chemicals such as biomass, solar, wind, CO2, and geothermal.
Bio-crude oil, a liquid product produced by biomass conversion through a thermochemical process, appears to be a potential fuel or chemical resources because of its sustainable feedstock. Liquefaction, a direct process which converts biomass or bio-based resources, is typically carried out at high temperature and elevated pressure into the energy-dense bio-crude oil. Solvent selection for this process is crucial since it may affect the reaction rates, the reaction pathways, product distributions, and yields. Solvents as a liquefaction medium have a role in dissolving the biomass components, for example, a polar compound (glucose) can be soluble or miscible in a polar solvent (water), but not in a nonpolar solvent [1].
Polar solvents are commonly preferred as liquefaction medium since these have better performance than nonpolar solvent. Water is ordinarily used as a solvent in the liquefaction process. Not only as an important reactant but water is also known as a catalyst in the process. The use of water only as solvent still produces high char yield (25 %C) [2]. Van Rossum et al. (2014) observed that the use of 10 wt% water as co-solvent together with guaiacol, hexanoic acid and n-undecane to the wood could minimize the formation of char compared to without water. By adding 10 wt.% of water in the reactant, the solid formation was reduced up to 10 - 15% [2]. This result was in line with other works that additional water could improve the liquefaction in various solvents [3-5]. Particularly, there is no additional energy consumption in the biomass drying step, unlike in the case of pyrolysis. Besides water, other organic solvents such as alcohols, hydrocarbon solvents, aromatic solvents, and acid/base solvents have been utilized as a medium to increase the bio-crude oil yield [4-8]. Some works also showed that primary alcohols such as methanol and ethanol have excellent performance together with water [5, 9].
The dielectric constant value of solvents decreases in the order of magnitude by an increase in temperature. The property of water at 25 oC and 300 oC has an entirely different dielectric constant value from 44 to 20 [10]. At this point, water behaves like acetone at 25 oC which can easily dissolve both polar and nonpolar compounds. Miller et al. (1999) investigated that ethanol gives higher activity than methanol because of its low dielectric constant [5]. Therefore, ethanol as a solvent can dissolve well the heavy molecular weight fraction.
Ethanol is more attractive than other solvents since it is a green solvent which can be sustainably produced by biomass fermentation. Furthermore, the critical point of ethanol is at 241oC and 6.14 MPa (ρc = 0.276 g/cm3) which are milder than that of water (374oC and 220.1 bar)[6]. Ethanol is easily recycled after liquefaction by evaporation. Ethanol is a protic solvent that

7
can donate H+ proton to the reactant of which can either saturate the double bonds or stabilize some aromatic free radicals [11, 12]. Moreover, it is less corrosive than water [13].
Cellulose was also studied in our work since the component is simpler than lignocellulosic biomass. Cellulose can be derived into valuable chemicals such as ethanol, ethylene, levulinic acid, and 5-hydroxymethylfurfural (5-HMF) via hydrolysis. However, the inter- and intramolecular H bonds of cellulose is hardly polymerized in common condition. Some works applied acids, enzymes, or supercritical water to break down the cellulose structure [14]. A study was conducted by Rataboul et al. (2011), the solubilizations of cellulose without a catalyst under supercritical methanol and methanol/water (90 wt%) were observed. The dissolution of cellulose in pure methanol at 300 oC and 100 bar for 1 min and 2 hours were found relatively high with 79 wt% and 83 wt%, respectively [14]. However, an opposite result regarding the cellulose liquefaction in supercritical methanol was reported by Ishikawa et al. (2001). There was still a significant insoluble methanol product (solid) roughly 79 wt% at 300oC and 300 bar for 10 min [15]. These results were obviously contradictory by the amount of solid residue after liquefaction which the former produced 21wt% at 300oC and 100 bar in 1 min while the latter generated 79 wt% at 300oC and 300 bar within 10 min. Regardless of these results, in the pure alcohol, the insoluble product was still found at the end of the reaction.
Interestingly, in water, cellulose is hydrolyzed via acid-catalysis into oligosugars. The further conversion is glucose to 5-(hydroxymethyl) furfural (HMF) which both products can readily polymerize into solid humins. However, Hu et al. (2011) observed that a methanol-rich medium might eliminate the solid polymeric humin formation by forming methyl -D-glucopyranoside (MGP) which is a relatively stable product. Then, MGP is converted into methyl levulinate [16]. As ethanol was used in this work, ethyl levulinate would be obtained in the product.
This work focused on the effects of ethanol/water solvent on the direct lignocellulosic biomass liquefaction. Temperature and reaction time, which are fundamental parameters on liquefaction, were also investigated. In addition, this work also proved that water was able to accelerate the reaction toward the degradation product. The ethanol balance was examined since there was a decent deviation of total mass balance. This work was approached by calculating the ethanol balance with or without separation step to discovering either ethanol consumed or evaporated. Since some of the nonpolar fraction of the bio-crude oil was entrained in the aqueous phase during filtration, the solubility of Hydrothermal Liquefaction (HTL) oil was also observed to see the behavior of HTL oil in the ethanol/water mixture. Due to the complexity of the wood structure, cellulose was used to examine the degradation products of cellulose in the ethanol/water system.

8
2. LITERATURE REVIEW
2.1. Biomass to Bio-Oil Conversion
Biomass is known as one of the alternative energies that can be used as fuel and chemical resources. It is also considered as a carbon-neutral resource because it does not increase the concentration of CO2 in the atmosphere. Carbon from plants can be converted into biofuel, and in the form of CO2, it is released into the atmosphere via biofuel combustion. Finally, CO2 is captured by plants via photosynthesis.
Biomass has a unique structural property that contains cellulose, hemicelluloses, and lignin. Figure 1 illustrates the structure of cellulose, hemicelluloses, and lignin in lignocellulosic biomass. Cellulose is the main structural compound in the lignocelluloses. It consists of amorphous and crystalline forms which randomly spread in the cellulose fibrils. The crystalline structure, a major component in cellulose, is linked by hydrogen and van der Waals bonds. The amorphous form is relatively easier to break than the crystalline bond because of short chain and weak intermolecular hydrogen bonds [17]. Hemicelluloses and lignin covers the cellulose microfibrils. Hemicelluloses consist of different types of sugars compared to cellulose which mostly monosaccharides such as pentose (xylose, rhamnose, and arabinose), hexoses (glucose, mannose, and galactose), and very little uronic acids [18]. The sugars from hemicelluloses are relatively easy to hydrolyze. Lignin lies between cellulose and hemicelluloses. It protects the plant from microbial degradation and resists dissolving by chemical reaction and fermentation due to its protein matrix in the plant cells [19, 20]. Lignin, light brown or black liquor, consists of three main components such as p-coumaryl, coniferyl, and sinapyl alcohols. Lignin is a residue containing complex aromatic compounds that can be utilized as either biopolymers or fuels intermediate feedstock. Still, the utilization of lignin is minimal as it is roughly only 2% of the lignin is used for dispersants or binding agent while the remains are used to fuel the boiler [21].
The thermal decomposition rate of lignin is much slower than that of cellulose and xylose (represents 30% content in hemicelluloses) with the range of 200-800oC. Cellulose and hemicelluloses often decompose below 360oC whereas the decomposition rate of lignin is the slowest due to dense polyaromatic structure [22]. Others observed that the hydrolysis rate of cellulose increases at 300-350oC while hemicelluloses in water are almost 100% decomposed at 190oC [17]. In contrary, Yamazaki et al. (2006) observed that lignocellulosic biomass with various types of alcohols, hemicelluloses and lignin were readily degraded at 270 oC while cellulose was completely decomposed at 350oC [6]. This result is similar to Barnes et al. (2016). Liquefying wood, glucose, cellulose, amylopectin (represents hemicelluloses), lignin in 1-methylnaphthalene/water 85/5 (w/w) at 300oC, it was found that glucose, amylopectin, and cellulose gave higher char yields compared to lignin and wood [4].

9
.
Figure 1. Pretreatment of lignocellulosic biomass to fracture the structure. Adapted from Ref. [23]
There are many conversion routes to convert biomass into valuable chemicals and fuels. These include bioprocesses (fermentation and enzymatic reaction), thermochemical (gasification and pyrolysis, hydrolysis, liquefaction, solvolysis, hydrogenation, deoxygenation, esterification, etc.) [13]. The idea of biomass/lignin depolymerization or liquefaction is to break down the complex biopolymer molecules to smaller molecules (aromatics or paraffin) to get useful chemicals and fuels.
Generally, pyrolysis and liquefaction processes are selected due to their liquefied product. Biomass liquefied product contains a considerable amount of oxygenated compounds that can make fuel worse due to instability. Figure 2 shows Van Krevelen diagram of several types of biomass and fossil resources and its products. Fuel containing higher ratio O/C has poorer quality while higher H/C is more desired.
Figure 2. Van Krevelen diagram for several biomass and coals (Adapted from Kersten et al. (2007) [24])
Liquefaction is more competitive than pyrolysis although it requires high-pressure process (50-200 bar) that costs more than high-temperature operation (370-526 oC) [25]. In the liquefaction, the feedstock may abstain from drying step implying that all type feedstock can be

10
used in the process. Typically, the liquefied product of liquefaction process has little oxygen and water contents but a high heating value of 30 MJ/kg compared to pyrolysis oil with 17 MJ/kg. HTL oil shows better quality than pyrolysis oil. However, the viscosity of the liquefied oil is relatively greater than that of pyrolysis oil.
At high temperature and elevated pressure, cellulose and hemicelluloses are converted into sugar (laevo-glucose, oligosaccharides, and monosaccharides, etc.), organic acid, formic acid, acetic acid, lactic acid, 2-hydroxy butyric acid, isobutyric acid, 2-hydroxyl-2-hydroxy-valeric acid, levulinic acid, benzoic acid, furfural, furan derivatives, and aromatics compounds, while the products of lignin are mainly phenol, naphthol, wood phenol, glycol, and oxygenated-aromatic compounds (e.g. methoxyl benzene) [26]. Carbohydrates could be converted via depolymerization into aromatics [4]. Gas and char products are mainly from carbohydrate and cellulose while heavy fractions of bio-crude oil are originally from lignin.
2.2. Types of Solvents
The two main types of biomass liquefaction are an aqueous solvent (water with acid or alkali) and organic solvents. Organic solvents are classified into four types: nonpolar solvents which do not have dipole or multipole moment as it cannot be mixed with polar solvents (e.g. hexane and dimethyl ether); polar aprotic solvents which cannot donate H+ proton (e.g. ketones, DMSO, DMF, and THF and GVL); polar protic solvents which have hydrogen atom bonding with oxygen (a hydroxyl group) or nitrogen (an amine group) that can donate H+ proton to the substrate (e.g. alcohols, formic acid and acetic acid); and ionic liquids (ILs) which are salt in the liquid state below 100oC or even at room temperature (e.g.[EMIM]+Cl-) [1].
Based on Table 9 (Appendix A), polar solvents are commonly used as liquefaction medium. Moreover, alkaline catalysts, a combination of solvents, and heterogeneous catalysts can be employed as alternatives additive to obtain high bio-crude yield, improve the quality of bio-crude oil, and prevent the form of char.
In general, liquefaction medium can be divided into 5 (five) groups such as water; alcohols; aromatic solvents; formic acid and acid/base solvents.
2.2.1. Acid/Base Solvents
Generally, an addition of acid or base in the liquefaction medium is preferable because it increases the yield of bio-oil product. Acid is utilized to increase the yield of glucose whereas the base is expected to prevent the formation of char. Kumar et al. (2015) investigated whether the acids or bases can lower the heavy formation. Base catalysts perform better in the liquefaction process as it can decrease the insoluble material and heavy formations [27]. In addition, increasing pH may prevent dehydration of monomers (alcohols) therefore the formation of char and tar can be reduced [28]. The strong base (e.g. NaOH and KOH) gives a higher result than a weak base, and it would be a promising technique to depolymerize lignin [7]. Karagoz et al. (2015) found that the catalytic activities of alkali salt for woody biomass liquefaction in hot compressed

11
water at 280oC for 15 min were showed in the order: K2CO3 > KOH > Na2CO3 > NaOH [8]. The discussions of the role of salt are summarized as follows:
a. To suppress the formation of char and to increase the yield of the liquid product [7, 29]. The molecular weight of the product can be lowered by increasing concentration of salt [30].
b. To enhance the yield of alkanes but reduce ester in the bio-oil products due to dissociation of fatty acid into anionic form. Decarboxylation of fatty acid can form alkanes while the esterification reactions between fatty acid and ethanol are weakened [11].
c. When using sodium hydroxide, sodium cation helps form the cation adducts which catalyze the formation of six-membered transition on -O-4 bond during the reaction and polarizing the ether bond [30, 31].
In Base Catalytic Depolymerization (BCD) treatment with ethanol, Miller et al. (1999) observed that ethanol altered to phenol and ethyl ethers by reaction with phenyl ethers [7]. Phenol and catechols were formed by alkylation in the presence of ethanol [28].
2.2.2. Water
Water is commonly used for liquefaction process since it is an abundant resource. During the reaction, water may act as a solvent, reactant, and catalyst. The increase of water temperature can change two properties of water molecules. Firstly, dielectric constant decreases, for example, above 300 oC water can behave like acetone at 25oC from very polar to a moderately nonpolar compound. The change of polarity affects the affinity so that it can more easily dissolve the hydrophobic or nonpolar molecules. At subcritical condition, water still behaves like polar; however, when the temperature above supercritical condition the dielectric constant drops dramatically and the rate constant increases [10]. Secondly, the reaction increased as the intensity of dissociation water increased along with the increase of temperature during hydrolysis[10]. However, pure water as liquefaction medium does not show good performance which results in low bio-oil yield and high solid yield [32].
Several feedstocks (lignocellulosic biomass, unicellular eukaryotic microorganism, and heterogeneous materials) have been observed to evaluate the products via hydrothermal liquefaction (HTL) process including bio-crude oil, gas, and solid residue yield. The range of woody liquefaction bio-crude oil yield is between 17% and 68 % in which depends on the operation parameters. Microalgae are commonly used for unicellular eukaryotic microorganism feedstock which consists of protein, lipids, and carbohydrate. A typical range of HTL bio-crude oil yield from algae is around 16-60%. Heterogeneous materials e.g. agricultural and municipal wastes have been used for bio-crude oil feedstock via HTL with the range of bio-crude yields of 21-36% [25].
2.2.3. Alcohols
Low-boiling-point solvents (e.g. acetone, methanol, THF, ethanol) are most preferred because they are less expensive. Low heat vaporizations of the solvent show they are easy to

12
recover. However, as the vapor pressure of solvents easily increases at elevated temperature, the process should carry out in a large reactor [1].
Various alcohols have been used as medium e.g. methanol, ethanol, 1-propanol, 1-butanol, 1-octanol and 1-decanol [6]. These alcohols provide milder operation conditions than water (critical temperature/Tc = 374oC and critical pressure/Pc= 220.1 bar). It was found that alcohols with longer alkyl chain such as 1-octanol can dissolve higher molecular constituents very well.
Miller et. al. (1999) observed that methanol and ethanol with KOH solution can reduce insoluble yield and the performance of ethanol was better than that of methanol[7].
Ouyang et al. (2015) observed the yield products among ethanol, formic acid/ethanol (3:1 v/v), and formic acid as solvent. It was found that pure ethanol had a low monophenol yield, whereas the mixture of ethanol/formic acid obtained a high monophenol yield [33]. Ethanol can increase the depolymerisation reaction of lignin since lignin is readily soluble in ethanol. Therefore, the homogeneous phase can be achieved by increasing the solubility of lignin and products which leads to improvement in liquefaction process.
Alcohols are known can donate hydrogen. Some studies reported that alkylation of phenols and catechols were formed because of the presence of ethanol. In addition, alkoxylation may occur on liquefaction in which bio-based polyols are produced as the final products [34]. Polyhydric alcohols (multiple alcohol groups) are desired in this reaction as it can offer higher hydroxyl group in the polyurethane product formulation. These polyhydric alcohols such as polyethylene glycol (PEG)/polypropylene glycol (PPG), glycerol, and low-boiling point alcohols (methanol and ethanol) are applied for a typical reaction such as alkoxylation. Inorganic and organic acid catalysts are commonly used with a temperature range from 90-250oC and reaction time from 30 minutes -3 hours [34].
2.2.4. Aromatics Solvents
In the earlier studies, tetralin and phenol are common mediums for coal liquefaction. They showed a good result with the higher conversion of solid. Then, phenol and aromatic compounds on biomass (wood) liquefaction also showed high performance. Aromatic solvents showed excellent performance than the hydrocarbons, carboxylic acid, anisoles and water [4]. However, still, the presence of water gives a positive impact on the yield[2, 4].
Guaiacol, which is a type of lignin monomer, can be derived from lignin was the best solvent amongst the acid (hexanoic acid) and nonpolar solvents (n-undecane) [2, 4]. It was also confirmed by Shuai et al. (2016) that dissolving of lignin in medium-polarity solvents (e.g. acetone, ethanol, and THF) is preferred rather than in high polar solvents (e.g. water) or nonpolar solvents (e.g. hexane) [1]. Barnès et al. (2016) revealed that phenolic solvents (guaiacol, phenol, catechol, 1-naphthol, pyrogallol) have a good performance in biomass liquefaction amongst others such as hydrocarbons (2,6-Diethylnaphthalene, 1-Methylnaphthalene, phenanthrene, toluene, tetralin, decalin, n-undecane), anisoles (1-methoxy-naphthalene, 1,2-dimethoxybenzene, anisole), carboxylic acid (hexanoic acid), and water [4]. Aromatics and oxygenated compounds
13
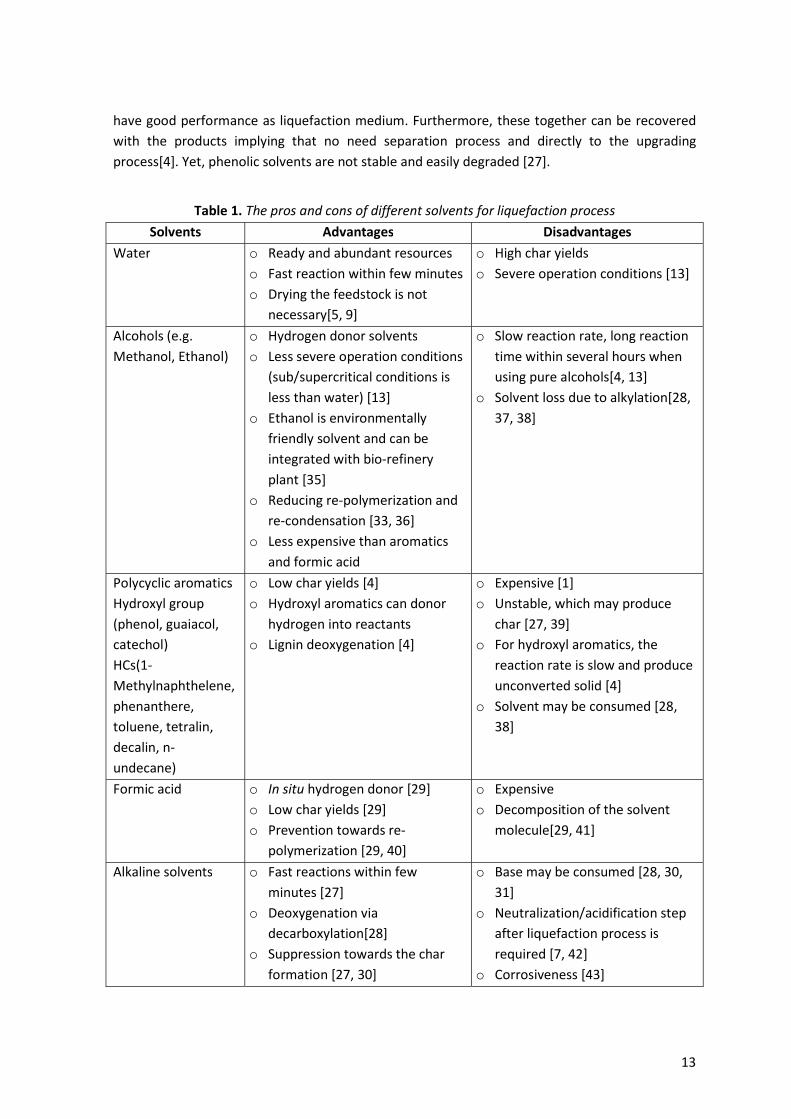
have good performance as liquefaction medium. Furthermore, these together can be recovered with the products implying that no need separation process and directly to the upgrading process[4]. Yet, phenolic solvents are not stable and easily degraded [27].
Table 1. The pros and cons of different solvents for liquefaction process
Solvents Advantages Disadvantages Water o Ready and abundant resources
o Fast reaction within few minutes o Drying the feedstock is not
necessary[5, 9]
o High char yields o Severe operation conditions [13]
Alcohols (e.g. Methanol, Ethanol)
o Hydrogen donor solvents o Less severe operation conditions
(sub/supercritical conditions is less than water) [13]
o Ethanol is environmentally friendly solvent and can be integrated with bio-refinery plant [35]
o Reducing re-polymerization and re-condensation [33, 36]
o Less expensive than aromatics and formic acid
o Slow reaction rate, long reaction time within several hours when using pure alcohols[4, 13]
o Solvent loss due to alkylation[28, 37, 38]
Polycyclic aromatics Hydroxyl group (phenol, guaiacol, catechol) HCs(1-Methylnaphthelene, phenanthere, toluene, tetralin, decalin, n-undecane)
o Low char yields [4] o Hydroxyl aromatics can donor
hydrogen into reactants o Lignin deoxygenation [4]
o Expensive [1] o Unstable, which may produce
char [27, 39] o For hydroxyl aromatics, the
reaction rate is slow and produce unconverted solid [4]
o Solvent may be consumed [28, 38]
Formic acid
o In situ hydrogen donor [29] o Low char yields [29] o Prevention towards re-
polymerization [29, 40]
o Expensive o Decomposition of the solvent
molecule[29, 41]
Alkaline solvents o Fast reactions within few minutes [27]
o Deoxygenation via decarboxylation[28]
o Suppression towards the char formation [27, 30]
o Base may be consumed [28, 30, 31]
o Neutralization/acidification step after liquefaction process is required [7, 42]
o Corrosiveness [43]

14
Overall, ethanol was considered in our work because it is a sustainable solvent which can be produced by biomass fermentation. Furthermore, it can be integrated with bio-refinery plant. It can reduce the unwanted polymerization reactions that lead to very heavy products. Due to its low boiling point, it can be easily removed from the bio-oil product by distillation, although it will add an extra operation unit.
2.3. Cellulose Degradation
In this study, due to the complexity of the lignocellulosic biomass composition, cellulose was used to evaluate ethanol as liquefaction medium. As shown in Figure 3, the acid-catalyzed pathway leads to the formation of levulinic acid and followed by -valerolactone (GVL) whereas the base-catalyzed pathway results in both lactic and acetic acid via retro-aldol transformations as final products.
Cellulose in the supercritical water condition (320-400oC and 250 bar) can rapidly decompose within 5-10 s into cellobiose, glucose, and levoglucosan [17]. However, Ishikawa et al. (2001) observed that by using supercritical methanol (350oC and 430 bar), cellulose was completely decomposed in 7 min to the methanol-soluble product [44]. It also shows that the hydrolysis rate in water is relatively faster than that in alcohol. These results were in line with Barnes that hydroxyl aromatic compounds showed slow reaction rate and remained unconverted wood in the solid product.
Decomposition of cellulose at a temperature below 240 oC leads to high water-soluble products. At a high temperature above 260oC, the product mainly consists of oil, char, and gas. Char starts to form resulting in the decrease of carbon in the liquid phase. 280oC is the optimum temperature to obtain high oil yield; however, high yield of char and gas in the products may reduce the oil yields [45].
Figure 3. A principal reaction pathway of cellulose by hydrothermal conversion [Adapted from Wang et al. (2014) [10]]
Liquefaction of cellulose with water medium in acid condition results in decomposition via hydrolysis into glucose. However, glucose as the intermediates is unstable and easily degraded to carbocation and then further polymerized into solid humins [16, 46]. Another unstable

15
intermediate product is 5 – (hydroxymethyl) furfural (HMF) that also tends to be polymerized and form solid humins [16]. Then, the common further reactions are to form levulinic acid and formic acid which has the more stable bond.
Based on several studies, methanol was found can stabilize the reactive intermediates (the carbocation) via etherification or acetalization. Figure 4 illustrates the reaction pathway of levoglucosan in both water and methanol towards monosaccharide and other organic compounds. The glucose structure is modified to methyl--D-glucopyranoside (MGP). This structure is more stable as it can prevent the polymerization of glucose to solid humins. As well HMF in methanol medium tends to form stable compound like 2-(dimethoxymethyl)-5-(methoxymethyl) furan (DMMF) [16, 44, 47, 48].
Figure 4. The reaction pathway of Levoglucosan in water and methanol medium towards monosaccharide and other organic compounds (adapted from Hu et al. (2013) [48])Note:
DDMP/PDDM is 2,3-dihydro-3,5-dihydroxy-6-methyl-4H-pyran-4-one; DDPN is 1,3-dihydroxy-2-propanone; HMCO/CPOH: 2-hydroxy-3-methyl-2-cyclopenten-1-one

16
2.4. Research Questions
The goal of this work is to evaluate the role of ethanol and ethanol/water mixtures in liquefaction of lignocellulosic biomass and cellulose. Moreover, the effects of these mixtures on the gas, solid residue, aqueous phase and, oil yields were also observed at different temperature and reaction time. The feed/solvent ratio of 15/85 was always applied in all runs. The parameters include ethanol concentration (10-100 wt%), reaction temperature (250-350o C), and reaction time (0-90 minutes). Cellulose, a major constituent of biomass and a simpler molecule compared to the whole biomass, was separately liquefied to gain insight into the reaction products. The general research questions can be formulated as follows:
1. What are the effects of operating conditions such as ethanol concentration, reaction time and temperature on the biomass liquefaction products?
2. What is the role of ethanol in liquefaction reactions; i) is ethanol only a solvent or also a reactant? ii) Does ethanol accelerate or slow down the liquefaction reactions? Moreover, does the process require water to reduce the reaction time?
3. Are there interesting chemicals formed in liquefaction of cellulose?

17
3. RESEARCH METHODOLOGY
3.1. Materials
Pine wood was obtained from Rettenmaier & Sӧhne GmbH (Germany) with the particle size below 0.5 mm. The pine wood contains roughly 11.4% (w/w) moisture. Therefore, pine wood was dried overnight at 105oC before using. Ethanol for pure analysis purity 99.8% was purchased from Merck. Microcrystalline cellulose (Avicel® PH-101) was provided by Sigma-Aldrich with particle size 50 m, 60.5% crystallinity). Water was used from Millipore ultra-filtration or known as Milli-Q and demineralized water. Other chemicals were also used for analysis purpose such as levulinic acid purity > 98% (Sigma Aldrich), ethyl levulinate purity 99% (Aldrich), acetic acid purity > 99.8% (Sigma Aldrich) and formic acid.
3.2. Experimental Setup
3.2.1. Liquefaction with Ethanol/Water Mixture
Because of requiring high temperature and elevated pressure, the liquefaction experiments were conducted in University of Twente’s High-Pressure Lab box 6. Figure 5 depicts the experimental setup of a 45-ml batch reactor system.
In total 15 gram of wood (or cellulose) and an ethanol/water mixture were added to the reactor. A 45-ml autoclave equipped with a hollow shaft stirrer was used. After feeding the feedstock, the reactor was closed and tested for leakages by adding 170 bar of nitrogen. If the pressure was constant for more than 10 minutes, it was assumed that the reactor was closed well. Then, the reactor was purged several times with nitrogen to remove the air from the reactor and pressurized to 5-10 bar of nitrogen pressure before starting the experiments. The reactor was heated with an electrical furnace adjacent to the cooling jacket system so that cooling water could flow through the system. The heating rate of the autoclave was on average 15 oC /min. Next, the temperature was set at the desired reaction temperature (250 – 350oC). After taking 17-24 min to reach the desired temperature (which is denoted as t - t0), the temperature was maintained for the predefined reaction time of 0 – 90 min. The reaction temperature and pressure could be accurately measured and was continuously monitored during the experiment. The pressure was raised autogenously during the reaction not only due to the increase in temperature but also due to the production of gas. The maximum pressures monitored were between 70-120 bar.

18
PSV-1
H2 VESSEL
V-3
V-4PRV-3
PIV-7
V-5
AUTOCLAVE
VENT OFF
COOLING WATER OUT
COOLING WATER IN
N2
H2
PI
V-1
V-2
PRV-1
PRV-2
TI
V-6
CkV-1
TI
Displayed Text DescriptionCkV-1 Check Valve
PRV-1,2,3 Pressure Reducing ValvePSV-1 Pressure Relief Valve
V-1,2,3,4 Globe ValveV-5,6,7 Three-Way Valve
Valve List
Displayed Text Description MaterialAUTOCLAVE AUTOCLAVE 45 ML SS
H2 VESSEL H2 VESSEL 350 BAR SS
Equipment List
Figure 5. Experimental setup of a 45-ml batch reactor system.
After the experiment, the reactor was cooled down by water cooling. The gas product was collected in the gas collector which allows for measuring the volume of the gas. A sample of gas was taken by using a 10 ml syringe. The gas composition was analyzed offline by GC Varian CP 4900 dual SN604 with 10 m Molecular sieve 5A and 10 m Porapak Q in Helium as a carrier gas. Calibration was always applied for some gases (such as O2, N2, CO2, CO, CH4, C2H6, C2H4, C3H8, and C3H6) before injecting the gas sample. With known gas volume and gas composition, the mass of produced gas can be calculated using the ideal gas law.
Next, the reactor was opened and the liquid/solid product was directly poured in the metal filter unit. This filtration setup was equipped with pressurized nitrogen to facilitate the liquid products through the filter. While doing so, the aqueous phase (water + ethanol + dissolved organic products) could be separated from the solids. This aqueous phase product was stored in the refrigerator to avoid evaporation and further reactions. The remaining product inside the reactor was completely rinsed using acetone and filtered in the same metal filter screen filled with the remaining solids. The obtained solid residue on the metal screen was rinsed with acetone several times to ensure oil, adhered to the solids, was recovered entirely. Then, the solids were dried overnight at 105 oC and its weight was determined. The oil product dissolved in acetone was recovered by evaporating the acetone at room temperature, using a flow of nitrogen until almost no weight change. This oil product was denoted as the acetone soluble oil or oil 2. In some the aqueous phases (with high ethanol concentration), after freezing and de-freezing, two layers were found. An immiscible dark oil was observed at the bottom of these bottles. The oil

19
was collected by decantation and was referred to as oil 1. Figure 6 shows the product recovery scheme.
The original idea was to analyze both aqueous and oil phases using GC-MS. However, the molecules in the oil phases turned out to be too heavy to be analyzed by the GC-MS. Therefore, GC-MS was used for measuring the ethanol and acetone content in both the aqueous phase and oil 2 products. Note, the sum of oil 1 and oil 2 was hereafter referred to as the oil phase. The mass balances of the oil were always based on the sum (oil phase) of these two fractions throughout the thesis. The GPC results are based on oil 1 + oil 2 (oil phase) for the experiments with different ethanol concentration. In the other experiments, only the GPC of oil 2 has been taken into account because the results of oil 1 were not much different from the oil 2 and the amount of oil 1 was very small. Therefore, it was not analyzed. Karl Fischer titration was used to determine the water content. FTIR analysis was used to study the chemical bonds of the solid residue.
Liquefaction Products
Gas products
Aqueous phase+
dissolved oil
Filtration
Solid Residue
Liquid and solidGas
FiltrationGC
GC-MS, Water content,
LC-MS, HPLC
Acetone
Acetone soluble oil
Evaporation
Heavy oil (Oil 2)
Precipitated oil (Oil 1)
Aq. Phase
GC-MS, Water content, GPC
GPC
FTIR
Oil phase
Decantation
Figure 6. Separation procedure for liquefaction products
3.2.2. Liquid-liquid Equilibrium Experiment
The liquid-liquid equilibrium between ethanol, water, and Hydrothermal Liquefaction (HTL) oil was determined for 10 different water/ethanol ratios. The added amount of HTL oil was always the same; the HTL oil: water/ethanol ratio was 1:10. The composition of each compound

20
in both the water-rich phase and oil-rich phase was determined using GC-MS and Karl Fischer titration analyses.
Some of HTL oils and the varied of ethanol/water mixtures were loaded into several small bottles. Mixtures of water, ethanol, and HTL in the bottles were stirred at 200 rpm in room temperature and pressure for an hour and then settled 24 h for separation phase. After aging, there were two layers formed; water-rich phase in the upper layer and oily phase in the bottom layer. The determination of the tie lines was performed by independent GC-MS and Karl Fischer titration analyses of both layers after being equilibrium. Karl Fischer titration was used to analyzing the water content and GC-MS is for measuring the ethanol concentration. The oil percentage is expressed by equation 1).
Oil (wt.%) = 100 % – Ethanol concentration (wt.%) – Water content (wt.%) 1)
3.2.3. Determination of Ethanol Balance
The ethanol balance was calculated as there was the mass loss by 18-30% after the separation step either due to ethanol evaporation or consumed. Since the amount of the bio-crude oil was relatively small, the ethanol balance calculation was conducted for biomass experiments with an ethanol concentration of 50, 60, 70, and 80 wt%.
The bio-crude oil and aqueous phase products were analyzed by GC-MS to determine the ethanol and acetone content. For GC-MS analysis, all the liquid products were diluted thus 5% into 1-Octanol and filtered with 0.45 m Whatman. The column was a capillary column Agilent HP-5MS, HP1909S-433 (30 m 0.25 mm 0.25 m) and the gas carrier was helium. The injection temperature was 250 oC. The split mode was set at a ratio of 20:1. The column temperature program was 45oC hold for 4 min, ramped up to 280oC at 3oC/min and hold for 20 min. The water content of the aqueous phase products were measured using Karl Fischer titration. Then, ethanol loss can be determined by the mass balance with known amount of initial ethanol at the start of the experiment. Some of the experiments for ethanol balances were conducted several times.
Ethanol loss = Initial EtOH (g) – EtOH in Aq. Phase – EtOH in bio-crude oil 2)
3.2.4. Product Yields
Yields of solid and oil phase were expressed as weight percentage based on dry wood loaded into reactor each experiment. The yield of gas was calculated by the ideal gas law which the total weight of gases such as CO2, CO, H2, CH4, C2H6, etc. divided by the initial dried feed. Since the recovery of the aqueous phase was quite challenging due to relatively low vapor pressure and the complexity of the compounds. Therefore, the yield of the aqueous phase was defined in equation 6) below and was determined by difference. Note, the solid residue could contain unconverted biomass, char, and re-polymerization products (which is large enough and unable to dissolve) in acetone, ethanol, and water. All yields were divided by the initial feed either biomass (wood) or cellulose.
21
Solid residue yield (wt%) = .
. × 100% 3)
Gas yield (wt%) = ∑
× × ×
×
. × 100% 4)
Oil yield (wt%) = . .
. × 100% 5)
Organics in Aq. phase yield (wt%) = 100 − solid − gas − oil phase (wt%) 6)
Several data points were done in duplo/triplo to ensure the reproducibility. The standard error of the mean (SEM) can be expressed by the sample estimate of the population standard deviation divided by the square root of the sample size. The smaller the amount of error is, the more accurate the value is.
𝜎 =∑ ( ̅)
( ) 7)
𝑆𝐸 = √
8)
where 𝜎 is the standard deviation, {𝑥 , 𝑥 , … , 𝑥 } are the experimental values of the sample items, 𝑥 is the mean value of these experiments, n is the number of experiments in the sample, and SE is the standard error.
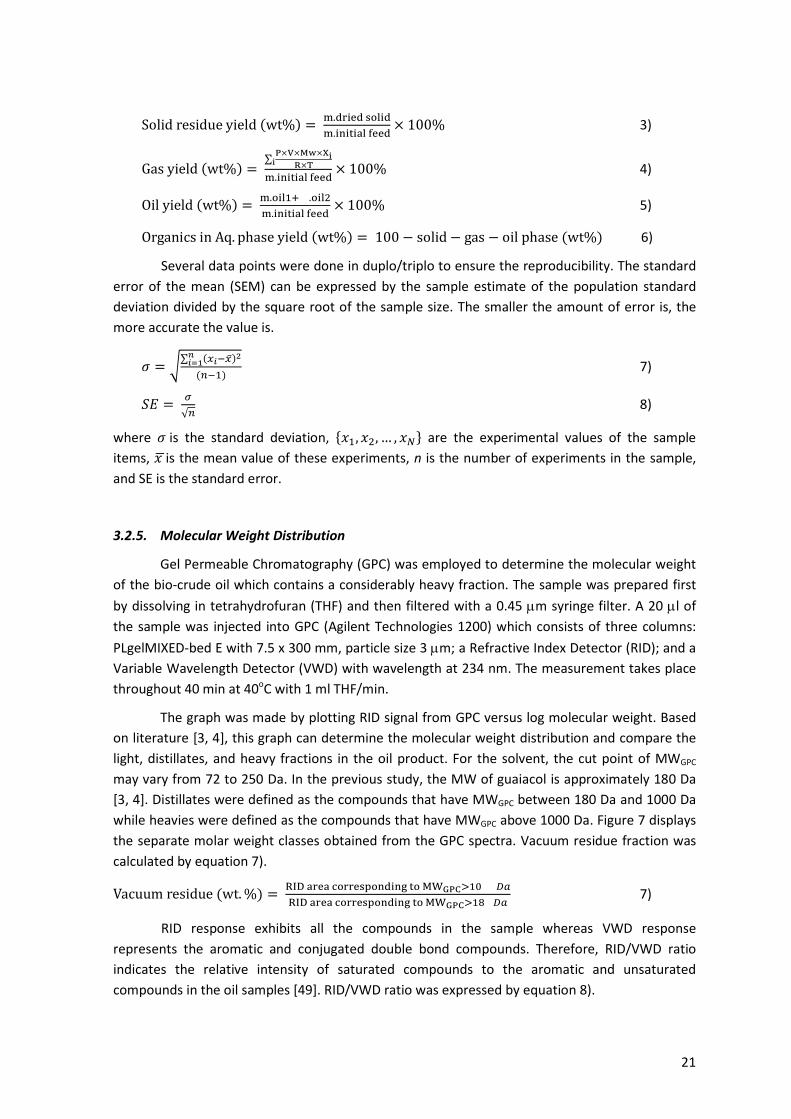
3.2.5. Molecular Weight Distribution
Gel Permeable Chromatography (GPC) was employed to determine the molecular weight of the bio-crude oil which contains a considerably heavy fraction. The sample was prepared first by dissolving in tetrahydrofuran (THF) and then filtered with a 0.45 m syringe filter. A 20 l of the sample was injected into GPC (Agilent Technologies 1200) which consists of three columns: PLgelMIXED-bed E with 7.5 x 300 mm, particle size 3 m; a Refractive Index Detector (RID); and a Variable Wavelength Detector (VWD) with wavelength at 234 nm. The measurement takes place throughout 40 min at 40oC with 1 ml THF/min.
The graph was made by plotting RID signal from GPC versus log molecular weight. Based on literature [3, 4], this graph can determine the molecular weight distribution and compare the light, distillates, and heavy fractions in the oil product. For the solvent, the cut point of MWGPC may vary from 72 to 250 Da. In the previous study, the MW of guaiacol is approximately 180 Da [3, 4]. Distillates were defined as the compounds that have MWGPC between 180 Da and 1000 Da while heavies were defined as the compounds that have MWGPC above 1000 Da. Figure 7 displays the separate molar weight classes obtained from the GPC spectra. Vacuum residue fraction was calculated by equation 7).
Vacuum residue (wt. %) =
7)
RID response exhibits all the compounds in the sample whereas VWD response represents the aromatic and conjugated double bond compounds. Therefore, RID/VWD ratio indicates the relative intensity of saturated compounds to the aromatic and unsaturated compounds in the oil samples [49]. RID/VWD ratio was expressed by equation 8).

22
RID/VWD Ratio =
8)
Figure 7. The quantification of solvent, distillates and vacuum residue in GPC spectra
3.2.6. Analysis the Aqueous Phase Products of Cellulose and Wood Liquefaction
The aqueous phases from both cellulose and wood liquefaction were analyzed by High-performance liquid chromatography (HPLC), Liquid chromatography–mass spectrometry (LC-MS).
The cellulose degradation product analysis was carried out by using HPLC (Agilent Technologies 1200 series with VWD and RID or ELSD). The used column was Hi-Plex H column which is suitable for byproduct and degradation of liquefaction products (acids, alcohols, furfural, and hydroxymethylfurfural). The aqueous phase samples were dissolved in Milli Q water. Elution time was set at 60 min to ensure the entire components detected. The column temperature was programmed at 60oC. Several calibration curves of HPLC were made to determine the concentration of the degradation compounds from cellulose (such as levulinic acid, ethyl levulinate, acetic acid, and formic acid).
LC-MS analysis was conducted by using Dionex Ultimate 3000 HPLC and UHPLC Systems equipped with Amazon SL MS by Bruker. The sample was prepared by diluting into Milli Q water between 100-300 ppm. Then, the sample was filtered with 0.2 m Whatman before putting to the vial.
3.2.7. Analysis the Solid Residue of Cellulose Liquefaction
The solid residue products were analyzed by Fourier transforms infrared spectroscopy (FTIR) to observe the spectra profiles. FTIR analysis was performed on Bruker equipped with Attenuated total reflection system (ATR) and a Deuterated Triglycine Sulfate Detector (DTGS) to characterize the functional groups of the solid residue. The analysis was carried out using a resolution of 4 cm-1 with the frequency range of 650 – 4000 cm-1. Then, the spectra were normalized and plotted using Origin.
Distillates Solvent Heavies

23
4. RESULTS AND DISCUSSION
In this section, the obtained results during this research will be presented and discussed. Firstly, mass balance and reproducibility were achieved. Because, during separation step, some varied amounts of precipitated oil was found in the aqueous phase product the behavior of HTL oil in the ethanol/water mixture was studied. The effect of ethanol concentration on biomass (pine wood) liquefaction was investigated. In addition, reaction time and temperature effect on the product yields are also studied. Afterward, the bio-crude oil and aqueous products were analyzed and discussed in more detail. Eventually, cellulose was also used for the experiment since it does represent one of the important constituents of lignocellulosic biomass.
4.1. Mass Balance and Reproducibility
Before further discussing the liquefaction mass balances in more detail, the thermal stability of ethanol and the recovery of ethanol were studied. In a separate experiment with only ethanol in the batch autoclave at 300oC for one hour, no significant decomposition of ethanol was observed. The recovery of ethanol after the experiment was 99.2 wt%. It was found that only 0.01 wt% gas was produced and no solid was generated. It indicated that ethanol is relatively stable at 300oC and 87 bar. For comparison, Brand (2015) also kept pure ethanol at severe conditions 400oC and 354 bar and found 5 vol% of ethanol lost due to cracking [22]. Another study observed the decomposition of ethanol was carried out at 576-624oC with excessively producing an amount of gas and brown polymer-like liquid [50].
The overall mass balances (including biomass, ethanol, and water) after the reaction in all experiments were observed above 98%, but after separation/recovery step the mass balance (including biomass, ethanol, and water) was reduced to 70 – 88%. The organics yields in the aqueous phase were observed by comparing the organics yields from the experiment and calculation (Appendix E Table 22). It was found that the standard deviation of both yields was about 0.8 – 19 %. Therefore, organics in the aqueous phase products were calculated by difference.
The decreases of mass balances during separation were found either because ethanol was consumed or lost by evaporation during product recovery. For examining the losses, ethanol balances were obtained by wood liquefaction experiments in ethanol/water mixtures of 50/50, 60/40, and 70/30 (w/w). These experiments were done by analyzing the mass of recovered ethanol directly after the experiments and comparing it with the mass of recovered ethanol after the product recovery procedure. Details of the calculation are shown in Appendix E Table 23 and Table 25. Indeed, the ethanol loss during the separation step was quite high; 14.6 wt.% 0.9%. Interestingly, roughly between 0.14 – 0.33 g ethanol/g biomass was consumed during liquefaction, this might happen due to alkylation or alkoxylation reactions with HTL intermediate products [28, 37].

24
The standard errors of the solid residue, oil, organics in the aqueous phase, and gas yields between 3 experiments performed under identical conditions, were roughly 0.02 – 1.1 %; 4.4 – 10.4 %; 0.5 – 8.4 % and 0.1 – 0.7 %, respectively. These deviations were considered small enough to analyze the obtained data as a function of varied process conditions.
4.2. Solubility of HTL Oil in the Ethanol/Water Mixture
It was observed that the solubility of the oil phase in the aqueous phase changed during each experiment in which different ethanol concentration was used in the experiment. This part of the work investigated how much HTL oil can dissolve in solvent containing different amounts of ethanol. Two phases, a both upper (in mass fraction) and lower layers (in mass fraction), were always obtained at room temperature and atmospheric pressure.
A study from Li et al. (1994) investigated the solubilities of aromatic compounds in the ethanol/water mixture such as chrysene, perylene, benzo[a]pyrene, pentachloro-benzene, and hexachlorobenzene which are very hydrophobic [51]. The results found that the solubilization depends on the solute hydrophobicity and the ethanol concentration in the mixture. Apparently, several aromatic hydrocarbons (benzene, naphthalene, biphenyl, anthracene, benzo[a]pyrene, perylene, and chrysene) tended to be more soluble in water with organic co-solvents such as methanol, ethanol, isopropanol, acetone, acetonitrile [51-53]. Based on the literature, it can be concluded that the solubility of the hydrophobic solute such as aromatics can be enhanced by increasing the fraction of solvent. The solubility number increases proportionally to the organic solvents concentration in the mixture.
Since HTL oil comprises mainly hydrophobic aromatic compounds derived from both lignin and cellulose, HTL oil is hardly soluble in pure water. However, an increase in ethanol concentration in the mixture resulted in more HTL oil dissolving in the aqueous phase. The mass fraction experimental tie lines of the equilibrium phases for which component in water-rich phase and HTL-oil-rich phase is displayed in Appendix D Table 20. The mass fractions and the tie lines are plotted into the ternary system that can be seen in Figure 8. From the slope of the tie lines obtained in the experiment, it illustrates that ethanol is polar and more soluble in the water than in the HTL oil. Temperature influences solubility, and it may change the equilibrium region in the ternary system. Therefore, this work only can be applied to the ambient temperature (20oC).

25
Figure 8. Ternary diagram for LLE (Liquid-Liquid Equilibrium) of the water + ethanol + HTL oil system at 20oC
Figure 9 displays the undissolved and dissolved HTL oil in 0 – 100% of ethanol/water mixture. This graph explains the changes in the oil 1 and oil 2 ratios found during the experiments with different ethanol concentrations (see Table 2). HTL oil was completely dissolved in the ethanol/water mixture of 80/20. This result was similar to other works [51-53] as there was a gradual increase of the solubility of HTL oil in ethanol/water mixture.
Figure 9. The dissolved and undissolved HTL oil in the ethanol/water system. Solubility experiment was performed at ambient temperature and pressure with 10 wt% of HTL oil and 90 wt% of
mixtures with ethanol concentrations of 0-100 wt% in water.
0102030405060708090
100
0 10 20 30 40 50 60 70 80 100
Oil
(wt%
)
Ethanol composition (wt%)
Dissolved oil
Undissolved oil

26
One of the HTL process challenges is the high viscosity of the bio-crude that can be a problem in either upstream or downstream [54]. Employing ethanol as liquefaction medium can be advantageous since ethanol facilitates the separation step on both the HTL oil product and the solid residue. Moreover, ethanol can be removed easily by evaporation afterward. Eventually, bio-crude and water can be separated only by gravity or decantation. Furthermore, in a large scale application, the spent of solvent will be taken into account to be recycled and reused to minimize the production cost.
4.3. Biomass Liquefaction
4.3.1. Effects of Ethanol Addition on Biomass liquefaction
The obtained product yields after biomass liquefaction at various ethanol concentrations were shown in Figure 11. The experiments were carried out at 300oC with ratio feed/solvent of 15/85 for an hour. The solvent used was varied by mixing water and ethanol at a certain weight ratio. Details of operating conditions and mass balance are shown in Appendix B Table 11.
Since ethanol is a good solvent, it can easily dissolve the oil in water. Then, some of the oil product (oil 1/light oil) was entrained together with the aqueous phase during filtration. Some of oil 1 was precipitated after employing ethanol above 20 wt % while the oil 2 (heavies) tended to adhere to the solid and reactor wall (see Table 2).
Table 2. Yield distribution of oil1 and oil2 at various ethanol concentrations
Run name Oil1 (%) Oil2 (%) B W 0.0 29.0 B E/W 10/90 0.0 30.7 B E/W 20/80 0.0 34.2 B E/W 30/70 9.3 48.6 B E/W 50/50* 11.0 42.0 B E/W 60/40* 15.5 45.8 B E/W 70/30* 17.0 36.8 B E/W 80/20* 22.4 34.5 B E/W 90/10 10.8 14.9 B E 3.2 9.6
* shows that some of oil 2 had been analyzed by GC-MS, the concentrations of ethanol and acetone were less than 1.7% and 0.1% on average, respectively.
In all cases, the gas products derived from biomass are mainly composed of CO2, CO, and H2. Few amount of other gases such as CH4, C2H4, C2H6, C3H6, and C3H8 was also produced during the liquefaction process. The gas products composition showed a general trend in the following order: CO2> CO>H2> CH4>> other gases ( 0.82%). During liquefaction, the gaseous products were

27
produced at the beginning of decomposition. The formation of CO and CO2 may be caused by decarbonylation and decarboxylation of intermediates reactions, respectively [55]. The detail gas product composition of biomass liquefaction by varying ethanol concentration is displayed in Figure 10.
Figure 10. Ethanol concentration dependence of gas yields. Liquefaction experiments were performed at 300 oC for an hour in ethanol-water of varying ethanol content.
The collected solid residue products were in a solid powder form with black color except for the solid residue of pure ethanol, that was light brown color (Appendix B.1 Figure 26a). It appeared that the solid residue had not been fully converted. Note, the solid residue can contain unconverted biomass, char and re-polymerization products large enough to be unable to dissolve in acetone, ethanol and water.
Either biomass with pure water or ethanol had a high amount of solid residue. The solid residue yield of pure ethanol was the highest amongst others with 76.7 wt%. The bio-crude oil yield peaked at 60% (w/w) ethanol mixture with 60.7 wt%. These results had an almost similar trend with other studies but with different feedstock [5, 9, 56]. A little amount of 10 wt% bio-crude oil was formed after liquefaction with pure ethanol. In addition, the gas yield products had almost the same amount from pure water to 60 wt% ethanol then started to decrease up to 0% in pure ethanol. This phenomenon showed that hydrolysis reaction was limited in pure ethanol [5, 9]. Therefore, the presence of water is required significantly for enhancing solvolysis reactions[5]. It can be concluded that ethanol plays a major role on liquefaction as well. Firstly, ethanol is found to be hydrogen donor solvent that can stabilize the free radicals and form lower molecular weight product and act as the reactant. Ethanol has a low dielectric constant that has high ability to dissolve nonpolar product especially for bio-crude oil that has high molecular weight compounds. It can enhance the solubility of high molecular weight resulting in higher liquefaction efficiency [5].
0
2
4
6
8
10
0 20 40 60 80 100
Gas
Yie
ld (w
t.%)
Ethanol Conc. (wt.%)
CO2COCH4H2Other gases

28
Figure 11. Solid, gas, bio-crude oil and organics in aqueous phase product yields of biomass liquefaction at various ethanol concentrations. Biomass liquefaction was carried out at 300oC for an hour with 15 wt% of biomass and 85% of ethanol/water mixtures. shows unconverted solid;
shows converted solid.
All the bio-crude oil samples were perfectly soluble in the THF solvent when preparing the samples for GPC analysis. The molecular weights (Mw) of bio crude oil produced at various ethanol concentrations are displayed in Table 3. The average molecular weights of precipitated oil (oil 1) and acetone soluble oil (oil 2) were calculated by using weight fraction ratio. The Mw of the bio-crude oil was increased by using ethanol as a solvent medium from 1373 to 2746. These results are proportional to the VR fraction. The significant lower Mw of the 20/80 oil could not be explained. The bio-crude oil from the biomass liquefaction in water has lower molecular weight than that in ethanol/water mixture. Cheng et al. (2010) found that the Mw of bio-oil being reduced gradually by increasing ethanol concentration to 100 wt% [5]. Thus our results contrast to another study likely due to the different steps/solvents involved in the recovery procedures [5]. They used acetone followed by ethyl acetate to extract the hydrophobic oil from the aqueous phase products while in this work only used acetone to get the oil. Another explanation might be that the low dielectric constant of ethanol dissolves the heavy molecular weight compounds (such as lignin) and therewith removing it from the lignocelluloses matrix leading ultimately to higher oil yields. The small increase of RID/VWD ratio indicates that the aromatic and double conjugated compounds were less formed by employing ethanol.
0102030405060708090
100
0 20 40 60 80 100
Yiel
ds (w
t.%)
Ethanol (wt.%)
GasOrganics in Aq. PhaseOil PhaseSolid Residue

29
Table 3. Weight average molecular weight (Mw) vacuum residue fraction (VR), and RID/VWD ratio at different ethanol concentration
Run name Mw
(g/mol) VR
RID/VWD Ratio
Oil-W 1373 0.80 5.65 Oil-E/W 20/80 954 0.65 5.83 Oil-E/W 30/70 1892 0.79 5.91 Oil-E/W 60/40 2445 0.90 5.88 Oil-E/W 80/20 3760 0.96 6.09 Oil-E 2746 0.94 6.78
The aqueous phase products became slightly acidic after liquefaction process. The range of pH was about 3.2 – 3.35 (see Table 4). It happened because of the formation of acids such as carboxylic acids. When 100% ethanol used as a medium, the pH of the aqueous phase product with pure ethanol was slightly more basic than that with water in the mixture, about 4.02. This pH increase showed that low HTL activity in pure ethanol because of limited hydrolysis reactions in the process and less carboxylic acid products.
Table 4. pH measurement for the aqueous phase productsfrom biomass liquefaction with various ethanol concentrations
Run name pH B W 300 60 min 3.237 B E/W 20/80 300 60 min 3.243 B E/W 50/50 300 60 min 3.218 B E/W 60/40 300 60 min 3.346 B E/W 80/20 300 60 min 3.314 B E 300 60 min 4.016
Some earlier studies exhibited that the aqueous phase products mainly consist of phenolic compounds, carboxylic acids, ethers, and esters compounds [5, 9, 57]. The aqueous phase products were managed to be analyzed by GC-MS; however, no peak appeared at all. It might happen because the applied column was different compared to several other works [5, 58] or the concentration of the monomers was very small and below the detection limit of the GC-MS. Then, HPLC with H-column was used to analyze the aqueous products. This part will be discussed further in Chapter 4.5.
4.3.2. Effects of Temperature
Effects of temperature were investigated by conducting the biomass liquefaction for an hour at the various temperatures ranging from 250oC to 350oC using the ethanol/water mixture 60/40 (w/w) and the ratio feed/solvent was always 15/85. The yields of the gaseous product

30
showed a slight increase from 4 wt% to 11.6 wt% when the temperature increases. The yields of gaseous products contained mainly CO2, CO, H2, and CH4. Still, CO2 was the primary component in gas yields in all cases, see Figure 13. At high temperature, the increase of gaseous products was due to solvent decomposition and cracking that was marked by increasing CH4 and other gases [55].
Figure 12. Gas yields from the biomass liquefaction in 60/40 (w/w) ethanol-water system for an hour at various temperatures. The biomass/solvent ratio = 15:85 (w/w).
Figure 13 shows bio-crude oil, gas, organics in an aqueous phase and solid residue yields by the effect of temperature increase on wood liquefaction. Based on the previous results, the ratio ethanol/water mixture of 60/40 (w/w) had the highest performance, so it was chosen in this section. The oil yield was the highest at 300oC by 60.7 wt%. It then decreased by 14.6 wt% at 350oC.
The solid residue was 42.1% at 250oC and it had remained unconverted wood marked by light brown color (Appendix B Figure 26b). It showed that the reaction should be carried out above 250 oC. Hemicelluloses decompose readily at a lower temperature (160 to 220oC), while cellulose requires more severe treatment usually above 250oC to de-crystallize the structure hence increase the hydrolysis towards the monomers [59]. The results showed that an increase of temperature improves the reaction kinetics.
The solid residue yield reduced drastically to below 2% at 300oC and it started increasing to 49.2% at 350oC. The black solid residues at 325 and 350 oC were hardly removed and adhered to the reactor wall although it was rinsed with acetone several times. At high temperature, the solid residue tends to increase because of re-polymerization [55]. A significant low number of the liquid products at elevated temperature could mainly be ascribed the increase in solid residue
0
2
4
6
8
10
250 275 300 325 350
Gas
Yie
ld (w
t.%)
Temperature (oC)
CO2COCH4H2Other gases

31
formation via re-polymerization/re-condensation reactions among intermediates as well as by hydrocarbon gas formation via bio-crude oil cracking reactions.
Figure 13. Temperature dependence of product yields obtained in 60/40 (w/w) ethanol-water system at 250-350oCwith residence time of an hour. The biomass/solvent ratio was 15:85 (w/w).
shows unconverted solid; shows converted solid.
Previous studies reported similar trends with difference feedstock [5, 57, 60]. Another study conducting pine saw dust liquefaction also found 300oC as the optimum temperature for liquefaction with the solid residue of 5wt%. However, in that work, the bio-crude oil products were not further analyzed whether the cracking reaction had occurred or not. Therefore in this study, the bio-crude oils were analyzed by GPC to observe the molecular weight distribution, VR, and RID/VWD ratio.
The Mw of the acetone soluble oil (oil 2) decreased gradually by increasing the reaction temperature (see Table 5). The reduced Mw of bio-crude oil from 3717 to 1664 g/mol can be explained by cracking reactions, and it is also proportional to the VR fraction that decreases significantly from 0.97 to 0.84. These results confirmed that further increase of the reaction temperature above 300oC might not lower the solids among the heavies instead of highly promoting the formation of char. A high reaction temperature is thermodynamically favourable for both condensation and cracking reactions [5].
RID/VWD ratio signals were also observed in Table 5. It can be seen that an increase in temperature contributed to high aromatics compounds. The decrease value showed the relative amount of saturated and aromatic compounds reduced linearly from 6.95 to 5.21. Some studies reported that aromatization is carried out at higher temperatures [49].
0
10
20
30
40
50
60
70
80
90
100
250 275 300 325 350
Yiel
ds (w
t.%)
Temperature (oC)
GasOrganics in Aq. PhaseOil PhaseSolid Residue

32
Table 5. Weight average molecular weight (Mw), vacuum residue fraction (VR), and RID/VWD ratio at various temperatures
Run Name Mw
(g/mol) VR
RID/VDW Ratio
Oil2-E/W 60/40 250 C 3717 0.97 6.95
Oil2-E/W 60/40 300 C 2821 0.94 5.81
Oil2-E/W 60/40 325 C 2564 0.93 5.58
Oil2-E/W 60/40 350 C 1664 0.84 5.21
The pH of all the aqueous phase products was monitored roughly 3.1-3.2 which was slightly acidic (see Appendix B Table 17). Although the conversion of wood at 250oC had not been fully completed (the solid residue was still brown), the pH of the aqueous products was 3.1 implying that the hydrolysis reaction might have occurred at low temperature.
4.3.3. Effects of Reaction Time
Biomass direct liquefaction experiments in the ethanol/water system with 60/40 (w/w) were carried out at 300oC for a reaction time ranging from 0 to 90 min. The reaction time is defined as the time starting when the reactor has reach the set-point (300oC) till the experiment was terminated. Due to slow heating rate, at 0 min (t-t0), the reaction had already started in the heating trajectory. The yield of gas rose slightly by increasing reaction time. As shownfrom Figure 14, the primary gas composition was CO2, followed by CO, CH4, and some minor amounts of other gaseous products.
Figure 14. Gas products composition in different reaction time. The biomass liquefaction was carried out with ethanol concentration of 0, 60, 100% for several reaction times.
0
2
4
6
8
10
0 20 40 60 80 100
Gas
Yie
ld (w
t.%)
Time (min)
CO2COCH4H2Other gases
t-t0

33
All the solid residue products were in black color. The effect of reaction time on the yields of gas, bio-crude oil and the solid residue is displayed in Figure 15. A longer reaction time can increase bio-crude oil and lower the formation of solid residue. However, after 60 min, the formation of char showed a slight increase from 1.9% to 2.74%. The results were similar to those reported by some studies [5, 9, 57]. This increase may happen because of re-condensation or cross-linking reactions between large-molecular-weight compounds to form char [9, 57]. In this study, 60 min was found to be the optimum reaction time for biomass liquefaction in the ethanol/water system. However, in their studies, there was no clear indicator if the bio-crude oil products underwent cross-linking or re-polymerization reactions. Therefore, GPC analysis was conducted to observe the VR fraction and RID/VWD ratio.
Figure 15. Effects of reaction time on product yields with obtained in 60/40 (w/w) ethanol-water system in the range of 0 – 90 min. The biomass/solvent ratio was 15:85. t-t0 describes a required
heating time between 17 and 24 min during achieving the desired temperatures. shows unconverted solid; shows converted solid.
Further prolonged of the reaction time to 60 min led to increasing of Mw. Details of the Mw and VR were shown in Table 6. All the bio-crude oil products with sole water had lower Mw than that with ethanol/water. This increase is possibly due to the ability of ethanol to improve dissolution of heavy compounds while stabilizing the intermediates formed by cracking reactions. Eventually, more heavy products can be obtained at the end of reaction in the ethanol/water system.
0
10
20
30
40
50
60
70
80
90
100
-10 10 30 50 70 90
Yiel
ds (w
t.%)
Time (min)
GasOrganics in Aq. PhaseOil PhaseSolid residue
t-t0

34
Table 6. Weight average molecular weight (Mw) and vacuum residue fraction (VR) at various reaction times
Run Name Mw
(g/mol) VR
Oil2-W-0min 1018 0.68
Oil2-W-60min 1373 0.80
Oil2-E/W 60/40-0min 3197 0.95
Oil2-E/W 60/40-5min 2521 0.93
Oil2-E/W 60/40-15min 2612 0.94
Oil2-E/W 60/40-30min 3057 0.95
Oil2-E/W 60/40-60min 2821 0.94
Oil2-E/W 60/40-90min 2445 0.92
Figure 16 shows the RID/VWD ratio from biomass liquefaction in both ethanol/water and pure water systems. The graph describes the linear relation of RID/VWD ratio by ranging reaction time. The reduced RID/VWD ratio in both results indicates that extended reaction time can produce more aromatics compounds. This result makes sense since the cross-linking reactions may happen between the intermediates products, and then those generate aromatic and double bond compounds as final products. Nevertheless, the differences were not very large.
Figure 16. RID/VWD ratio of bio-crude oil from biomass liquefaction. Liquefaction was performed in W/E 60/40 and pure water at 300oC with the biomass/solvent ratio of 15/85. The residence
time was set from t-t0 to 90 min.
In Figure 17, the solid residues of the HTL of biomass experiments are shown. The experiment was performed by varying temperatures (250 and 300oC) and varying the ethanol
0
2
4
6
8
0 30 60 90
Ratio
RID
/VW
D
Time (min)
B-E/W 60/40 at 300 C
B-W at 300 C
t-t0

35
concentration of 0 and 60 wt%. The solid residue yields in pure ethanol at 0 min and 60 min were the highest amongst others. Remarkably, the solid residues decreased very slowly even after 60 minutes reaction time. (Appendix B Figure 26d). The same high solid residue yield was observed for biomass liquefaction experiments with pure ethanol [13]. These results were confirmed by Barnes et al. (2016) that hydroxyl groups (hydroxyl aromatics such as phenol, guaiacol, and catechol) tend to undergo slow reaction rate and produce unconverted solid residue [4]. In this study, ethanol as a group of primary alcohol was used and it shows similar results to that study.
The solid residue at 250oC was the light brown color which indicated that the reaction had not been completed (Appendix B Figure 26c). When employing water solely at 300 oC, the solid residue yields were up to 44.4 % and stayed almost constant even after 60 min. It revealed that the reaction rate of water as liquefaction medium is much faster than pure alcohols. It is worthwhile mention that the conversion of biomass for the E/W 60/40, 300oC was finished after 30 minutes and hereafter no new solid was formed from the liquid products at longer residence time.
Figure 17. Solid residue products obtained in pure water, ethanol/water 60/40, and pure ethanol systems at 250 and 300 oC with residence time of t-t0 to 90 min.
4.4. Cellulose Liquefaction
Because cellulose is the largest component of the biomass, cellulose was used in the experiment to see the behaviour in the ethanol/water mixture. Cellulose represents most of the sugars in biomass and consists out of glucose units. These are straight glucose polymer chains interconnected with hydrogen bonds. Cellulose liquefaction experiments were performed in pure water, ethanol/water 10/90; 50/50; 60/40 and 80/20 (w/w) and pure ethanol at 300 oC for an hour. The overall mass balances of cellulose experiments were as high as that of the wood by around 99-96 % (see Appendix B Table 16).
0102030405060708090
100
-10 10 30 50 70 90
Solid
Res
idue
(wt.%
)
Time (min)
E, 300 C (unconverted)
E/W 60/40, 250 C (unconverted)
E/W 60/40, 300 C
W, 300 C
t-t0

36
Figure 18. Ethanol concentration dependence of gas yield. The cellulose liquefactions were carried out with an ethanol concentration of 0, 60, 100% at 300oC for an hour.
Figure 18 shows the gas products derived from cellulose were mainly CO2, CO, and H2. The yield of gas remained stable between ethanol concentration of 0 wt% and 60 wt% with 11 wt% and 9.1%. Then, it decreased gradually from 9.1% to 0%.
Figure 19. Solid, gas, bio-crude oil and organics in aqueous phase product yields of cellulose liquefaction at various ethanol concentrations (0, 10,50,60,80, and 100 wt%). Liquefaction carried
out at 300oC with the biomass/solvent ratio of 85:15 for an hour.
Yields of gas, solid, bio-crude oil from cellulose liquefaction are illustrated in Figure 19. Generally, yields of biomass and cellulose liquefaction had an almost similar trend. The yield of bio-crude oil increased from 3.1 wt % to 32.7 wt%, and no oil was found in pure ethanol. A considerable amount of organic products could be dissolved in the water/ethanol aqueous phase. It seems there was almost no reaction during cellulose liquefaction in pure ethanol and the
0
2
4
6
8
10
12
0 20 40 60 80 100
Gas
Yie
ld (w
t.%)
Ethanol Conc. (wt.%)
CO2COCH4H2Other gases
0102030405060708090
100
0 20 40 60 80 100
Yiel
ds (w
t%)
Ethanol (wt%)
GasOrganics in Aq. PhaseOil PhaseSolid Residue

appearance of solid residue remained the same like the unconverted sol(see Figure 20). The opposite trend was observed for solid residue yield. The yield of solid residue decreased gradually to 13.3 78.7 wt%.
Figure 20. The solid residue product
A limited number of studies have discussed system. A study reported that the hydrolysis of cellulose in the ethanol/water mixture (1:1 v/v) at 270oC gained high reducing sugar yield but the solid residue product was not [61]. Aforementioned in Chapter 1, there are contradicting results yield from woody biomass and cellulose liquefaction in methanol.
The products of cellulose liquefaction with sole water can be compared to another study by Fang et al. (2004). Based on their study, cellulose in water with residence time of 30 min at 220oC started to decompose lowest yield of 22.5 C% at 270C% at 350oC and reached 57C% at 350pure water at 300 oC was 36.1 wt%of char happens because the intermediates (furfurals and HMF) are unstable and readily polymerized into water-insoluble humus acids or “glucose char”
The low pH (3.1-3.3) of the aqueous products occurred in all runs (seecome from organic acids. These results were confirmed by Kumar et al. (2008), hydrolysis of cellulose produced approximately confirmed by the low pH (2.3was higher than that with the less. Furthermore, limited hydrolysis reaction may be the reason of less degradation activity in pure ethanol.
appearance of solid residue remained the same like the unconverted solid residue of biomass . The opposite trend was observed for solid residue yield. The yield of solid residue
wt% by adding ethanol of 60 wt%. It then drastically increased by
The solid residue products from cellulose liquefaction with increasing of ethanol concentration
A limited number of studies have discussed the cellulose liquefaction in ethanol/water system. A study reported that the hydrolysis of cellulose in the ethanol/water mixture (1:1 v/v) at
C gained high reducing sugar yield but the solid residue product was not . Aforementioned in Chapter 1, there are contradicting results regarding
ass and cellulose liquefaction in methanol.
The products of cellulose liquefaction with sole water can be compared to another study by Fang et al. (2004). Based on their study, cellulose in water with residence time of 30 min at
slowly to 90 (carbon basis) % and the residue product reached the lowest yield of 22.5 C% at 270oC. At 300oC, the residue was 40 C% then it rose gradually to 50
C and reached 57C% at 350oC when held for 1 h. [62]. In this work, the residue yield in C was 36.1 wt%, and the residue was char-like with black color. The formation
of char happens because the intermediates (furfurals and HMF) are unstable and readily insoluble humus acids or “glucose char” [62].
3.3) of the aqueous products occurred in all runs (seecome from organic acids. These results were confirmed by Kumar et al. (2008), hydrolysis of
lose produced approximately 64.2 % of other compounds that are mainly organic acids d by the low pH (2.3-3) [45]. However, the pH of cellulose liquefaction with pure ethanol
the addition of water implying that the formation of organic acids was , limited hydrolysis reaction may be the reason of less degradation activity in
37
id residue of biomass . The opposite trend was observed for solid residue yield. The yield of solid residue
wt% by adding ethanol of 60 wt%. It then drastically increased by
cellulose liquefaction with increasing of ethanol
the cellulose liquefaction in ethanol/water system. A study reported that the hydrolysis of cellulose in the ethanol/water mixture (1:1 v/v) at
C gained high reducing sugar yield but the solid residue product was not explicitly mentioned regarding the solid residue
The products of cellulose liquefaction with sole water can be compared to another study by Fang et al. (2004). Based on their study, cellulose in water with residence time of 30 min at
slowly to 90 (carbon basis) % and the residue product reached the 40 C% then it rose gradually to 50
. In this work, the residue yield in like with black color. The formation
of char happens because the intermediates (furfurals and HMF) are unstable and readily
3.3) of the aqueous products occurred in all runs (see Table 7) that might come from organic acids. These results were confirmed by Kumar et al. (2008), hydrolysis of
64.2 % of other compounds that are mainly organic acids . However, the pH of cellulose liquefaction with pure ethanol
er implying that the formation of organic acids was , limited hydrolysis reaction may be the reason of less degradation activity in

38
Table 7. pH measurement for the aqueous phase products from cellulose liquefaction with various ethanol concentration
Run name pH C W 300 60 min 3.314 C E/W 10/90 300 60 min 3.254 C E/W 50/50 300 60 min 3.129 C E/W 60/40 300 60 min 3.153 C E/W 80/20 300 60 min 3.297 C E 300 60 min 5.093
Table 8 presents GPC results of cellulose liquefaction. In general, average Mw of cellulose is relatively lower than that of biomass (wood). The Mw of bio-crude oil decreased from 2393 to 1584 g/mol. This trend was contrast to biomass liquefaction. It is likely that the lignocelluloses which consist of lignin might produce heavy molecular weight. However, in cellulose liquefaction, it produced distillates compounds. It indicated that glucose charring might be avoided by using ethanol as solvent. Also, ethanol reacted with the intermediate products and produced light molecular weight compounds. Barnes et al. (2016) also observed that carbohydrates tend to produce more distillate products than vacuum residue [2].
There was a slight decline in VR fraction. Lower VR showed that hydrolysis was limited in the 80/20 (w/w) ethanol/water system because less bio-crude oil was produced. RID/VWD ratio had a steady trend implying that there is almost no aromatic compound formed in the bio-crude oil.
Table 8. Weight average molecular weight (Mw) and vacuum residue fraction (VR) at various temperatures
Run Name Mw
(g/mol) VR
RID/VWD Ratio
Oil2-C-W 2393 0.92 5.77 Oil2-C-E/W 10/90 2239 0.91 5.66 Oil2-C-E/W 50/50 2473 0.92 5.37 Oil2-C-E/W 60/40 2111 0.90 5.41 Oil2-C-E/W 80/20 1584 0.85 5.61
4.5. The Degradation Products in the Aqueous Phase
In sub-chapter 2.3., the scheme of reaction pathway has been discussed. The glucose compound of the aqueous phases was analyzed for using HPLC with Hi-Plex Pb column. However, there was no degradation products (cellotriose, cellobiose, glucose, fructose, levoglucosan, furfural, MGP) peak of which commonly appear in the spectra [17, 44, 45]. It indicated that at

39
high temperature, the reaction tends to degrade and dehydrate unstable glucose into conversion products such as 2-furanmethanol, levulinic acid, formic acid, acetic acid, or polymer [45].
Levulinic and formic acid are mainly found in the aqueous product with water medium. This compounds showed that the reaction pathway of cellulose liquefaction in water via dehydration, as illustrated in Figure 3. The concentration of levulinic acid and acetic acid as a stable product existed in the aqueous phase, as shown in Figure 21. The yields of levulinic acid and acetic acid experienced a gradual decrease with increasing ethanol concentration. The initial yields of levulinic and acetic acid were 2.5 wt% and 1.5 wt%, respectively. It then dropped to 0 wt% in pure ethanol. The gradually declined levulinic acid and acetic acid can be explained by decreasing the amount of water in the medium and the limitation of hydrolysis. Actually, the peaks of formic acid could be seen in the spectra but they were deficient.
Figure 21. Yield of levulinic and acetic acids from cellulose liquefaction in the various ethanol concentrations
The low pH of the aqueous phase product from biomass liquefaction was confirmed by the existence of the acids. The aqueous phase products from both biomass and cellulose liquefaction had similar pH which was roughly 3.1 – 3.3. Interestingly, the pH in pure ethanol was slightly more basic than others with pH of 4-5. The plausible reason is the limitation of hydrolysis reaction which favors the reactions to the formation of acidic compounds like acetic, levulinic, and formic acids. Similar to cellulose, some significant amounts of acids were obtained from biomass liquefaction. As shown in Figure 22, biomass liquefaction could produce carboxylic acid and levulinic acid that resulted in the decrease of pH of the aqueous product.
0
0.5
1
1.5
2
2.5
3
0 20 40 60 80 100
Yiel
d in
Cel
lulo
se (w
t%)
Ethanol (wt%)
Levulinic acid
0
0.5
1
1.5
2
0 20 40 60 80 100
Yiel
d in
Cel
lulo
se (w
t%)
Ethanol (wt%)
Acetic acid

40
Figure 22. Acetic and levulinic acids yields found in the aqueous phase products from biomass liquefaction
The yields of acetic and levulinic acid were found to decrease steadily from 3 wt % and 0.7 wt% to 0 % by increasing the ethanol concentration. This decrease indicates that water has a significant role in the formation of acetic and levulinic acids via cellulose degradation.
Hu et al. (2011) investigated the acid-catalyzed reaction of levoglucosan/glucose in methanol/water mixture in the presence of 5 wt% Amberlyst 70 at 170oC for 180 min. The solid humin is more formed in the pure water than in the methanol/ water mixture. The amount of humin declined gradually by increase the methanol concentration. Contrarily, the formation of methyl levulinate increased and levoglucosan is selectively converted to MGP and DMMF. Therefore, the humin formation can be reduced [16]. Based on this study, instead of producing levulinic acid and formic acid, levulinic ester will be found in final products through stabilization of the unstable intermediates with a methanol-rich medium. As ethanol was used in this work, ethyl levulinate was formed in the product which is illustrated in Figure 23. The ethyl levulinate yield that can be found in the aqueous phase was 6.3% at 50/50 (w/w) ethanol/water. In pure water and 10wt% of ethanol, there was no ethyl levulinate found. In 50, 60, and 80wt% of ethanol, the yields of ethyl levulinate increased and declined in the pure ethanol. The levulinate ester yield profile from wood liquefaction was also similar to that from cellulose liquefaction.
Figure 23. Yield of ethyl levulinate from cellulose and wood liquefaction in the various ethanol concentrations
0
1
2
3
0 20 40 60 80 100
Yiel
ds in
Biom
ass (
wt%
)
Ethanol (wt%)
Acetic acidLevulinic acid
01234567
0 20 40 60 80 100
Yiel
d in
Cel
lulo
se (w
t%)
Ethanol (wt%)
01234567
0 20 40 60 80 100
Yiel
d in
Bio
mas
s (w
t%)
Ethanol (wt%)

41
Wang et al. (2012) hydrolyzed cellulose at 200-260oC in alcohol solvents and water mixture such as methanol, ethanol, isopropanol. Ethanol and water mixture was superior amongst others. The yield of reducing sugar was high about 98.22%. However, when increasing the alcohols above 50 vol.%, the yield of reducing sugar declined gradually [61].
Although ethanol can enhance the solvolytic and dissolve the hydrophobic phase, ethanol acts as anti-solvent for glucose. Some works [51, 52, 63, 64] investigated that the increase in ethanol concentration results in the solubility of sugars decreasing.
The reduction in oil yields also occurred in this work when employing ethanol above 60wt%. It can be concluded water which has fast reaction rate will directly attack cellulose, then convert and degrade toward the degradation products and char. However, when employing ethanol in the liquefaction medium, ethanol will lower the reaction rate and protect the sugar acting as anti-solvent of glucose from sugar degradation (or glucose charring). Instead of glucose charring, ethanol stabilizes the sugar by producing levulinate ester. Nevertheless, when the concentration of ethanol is too high, the reaction rate becomes very slow. It causes high yield of the solid residue (unconverted solid). Therefore, water is needed to increase the biomass decomposition rate. The hydrolysis reaction is limited and glucose has poor solubility in ethanol, it results in low the degradation products (carboxylic acids).
4.6. FTIR Analysis for Oil and Solid Residue Products of Cellulose Liquefaction
FTIR analysis was conducted to observe the solid residue after liquefaction. The characterizations of the solid residue are depicted in Figure 24. Cellulose has many hydroxyls in its structure which displayed at 3375-3340 cm-1 as the typical hydroxyl absorption [65]. The absorption peak around 2845-2945 cm-1 was attributed to C-H stretching vibration [5]. The band at 1040 cm-1 could be C-O stretching that can be found in the cellulose structure [4].

42
Figure 24. FTIR spectra of the original cellulose and the solid residue after liquefaction in ethanol/water system
The absorption profiles of solid residue with pure ethanol had distinct from others with water. It seems there was a slight change in the profile and it still had an appearance like cellulose profile. It indicates that at pure ethanol, cellulose underwent very slow reaction rate. Therefore the unconverted solid was found at the end of the reaction.
The absorption profiles of 0-80% solid residue products had changed. A significant alteration of the patterns is caused by the presence of water leading to fast conversion. The solid residue of 0 – 80 wt% ethanol concentration displayed similar IR absorption appearance, indicating similar chemical structure. There was no more O-H peak at 3375-3340 cm-1. The methoxyl stretching (C-H) vibration at 2845-2945 cm-1 was barely found in the solid residue. Some new peaks appeared in the profile, the adsorption at 1710 cm-1 and 1590 cm-1 is ascribed to the carbonyl (C=O) stretching and the aromatic skeletal vibrations, respectively [3]. The former showed that cellulose underwent dehydration and formed carbonyls such as an aldehyde of furan compounds.
C-O C=C Aromatic skeletal
C=O O-H C-H
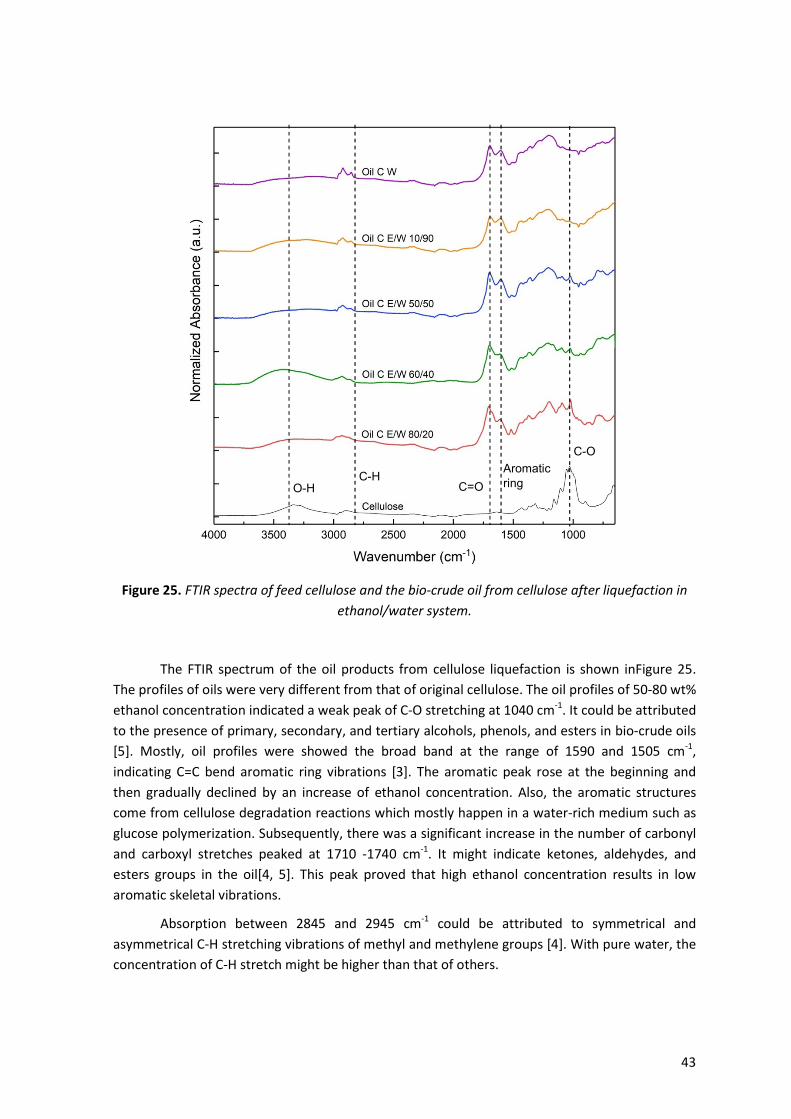
43
Figure 25. FTIR spectra of feed cellulose and the bio-crude oil from cellulose after liquefaction in ethanol/water system.
The FTIR spectrum of the oil products from cellulose liquefaction is shown inFigure 25. The profiles of oils were very different from that of original cellulose. The oil profiles of 50-80 wt% ethanol concentration indicated a weak peak of C-O stretching at 1040 cm-1. It could be attributed to the presence of primary, secondary, and tertiary alcohols, phenols, and esters in bio-crude oils [5]. Mostly, oil profiles were showed the broad band at the range of 1590 and 1505 cm-1, indicating C=C bend aromatic ring vibrations [3]. The aromatic peak rose at the beginning and then gradually declined by an increase of ethanol concentration. Also, the aromatic structures come from cellulose degradation reactions which mostly happen in a water-rich medium such as glucose polymerization. Subsequently, there was a significant increase in the number of carbonyl and carboxyl stretches peaked at 1710 -1740 cm-1. It might indicate ketones, aldehydes, and esters groups in the oil[4, 5]. This peak proved that high ethanol concentration results in low aromatic skeletal vibrations.
Absorption between 2845 and 2945 cm-1 could be attributed to symmetrical and asymmetrical C-H stretching vibrations of methyl and methylene groups [4]. With pure water, the concentration of C-H stretch might be higher than that of others.
C-H Aromatic ring C=O
C-O
O-H

44
5. CONCLUSIONS
The conclusions that can be drawn from this work are:
1. Ethanol acts synergistically with water on liquefaction process to suppress the formation of solid residue and improve the yield of liquid product. The optimum operating condition for biomass liquefaction was achieved with ethanol/water mixture of 60/40 (w/w) at a reaction temperature of 300oC and a holding time of 60 min. At a temperature higher than 300oC, the reaction becomes too harsh and produces a sufficiently great amount of char due to re-polymerization. Moreover, further prolonged the reaction time tends to increase the formation of char slightly. It may happen due to a cross-linking reaction among intermediates. Due to a complexity of biomass, cellulose was used as feed in the ethanol/water system. The gas, solid, and liquid yields of liquefaction from both cellulose and biomass had almost similar trends. The optimum ethanol/water mixture was at 60/40 (w/w). The trend of Mw of the oil from biomass liquefaction increased which was a contrast from cellulose. It might happen because ethanol dissolved the heavy molecular weight (such as lignin). However, in cellulose liquefaction, the reaction might produce light molecular weight compounds.
2. Not only acting as a solvent but ethanol also participates as a reactant during the liquefaction process. Ethanol balances calculation confirmed that there was a significant amount of consumed ethanol about 0.14-0.33 gethanol/gbiomass. Also, at the end of the reaction, ethyl levulinate was found as the product of the reaction.
3. It is discovered that ethanol has much lower the decomposition rate than water. The addition of water is required to speed up the reaction so that it can help to shorten the reaction time.
4. The pH of aqueous phase products from liquefaction with water was found acidic (3.1-3.3) because of the presence carboxylic acids (formic and acetic acid) and levulinic acid. On the other hand, when using pure ethanol, the pH increased at (4-5) because of the limitation of hydrolysis reaction which can prevent the formation of degradation products such as levulinic acid and acetic acid.
5. Besides enhancing the solvolytic, ethanol also acts as anti-solvent to glucose. Therefore, it can protect glucose from degradation toward charring.
In the water-rich medium, water that accelerates reaction rate will directly attack and convert the cellulose into degradation products and char while in the ethanol-rich medium, ethanol will reduce the reaction rate and protect the sugars from degradation by producing ester levulinate.
However, in pure ethanol, the reaction rate will decrease significantly and produce unconverted solid residue. It had been analyzed by FTIR, and there was still cellulose-like profile in the solid residue with pure ethanol.

45
6. RECOMMENDATIONS
There are several recommendations and ideas for further research.
1. The obtained oil from liquefaction contains complex compounds which are difficult to analyze. Oil characterization can be approached by H-NMR to know the functionalities of the product.
2. In this work, it is evident that the reaction rate of liquefaction in water is faster than that in pure ethanol. However, the information in term of reaction kinetic rate of liquefaction in the ethanol-water system is limited. This topic can be developed in the further research.
3. The intermediate products in the cellulose liquefaction products were not able to be found after an hour because they are unstable compounds. Therefore, the next experiments can be conducted by varying the reaction time to investigate and track the mechanism of intermediates into final products. HPLC equipped with UV should detect the intermediate product such as 5-HMF. Since ethanol was used as a solvent, ethyl--D-glucopyranoside may be found as intermediates.
4. Microcrystalline cellulose which contains mostly crystalline structure is tough to break, a pre-treatment by ultrasound or acid can be an option to get higher oil yield.
5. Using a slow heating autoclave tends to produce more char/solid residue than using a fast heating autoclave. Therefore, the liquefaction in ethanol/water system should be conducted in a fast heating autoclave to compare the effect of heating rate on product yields.

46
7. REFERENCES 1. Shuai, L. and J. Luterbacher, Organic Solvent Effects in Biomass Conversion Reactions.
ChemSusChem, 2016. 9(2): p. 133-155. 2. van Rossum, G., et al., Liquefaction of lignocellulosic biomass: solvent, process parameter,
and recycle oil screening. ChemSusChem, 2014. 7(1): p. 253-9. 3. Kumar, S., et al., Liquefaction of Lignocellulose: Process Parameter Study To Minimize
Heavy Ends. Industrial & Engineering Chemistry Research, 2014. 53(29): p. 11668-11676. 4. Barnés, M.C., Liquefaction of Lignocellulose: Bio-crude, Char and Chemistry of
Liquefaction. 2016: University of Twente. 5. Cheng, S., et al., Highly Efficient Liquefaction of Woody Biomass in Hot-Compressed
Alcohol−Water Co-solvents. Energy & Fuels, 2010. 24(9): p. 4659-4667. 6. Yamazaki, J., E. Minami, and S. Saka, Liquefaction of beech wood in various supercritical
alcohols. Journal of Wood Science, 2006. 52(6): p. 527-532. 7. Miller, J.E., et al., Batch microreactor studies of lignin and lignin model compound
depolymerization by bases in alcohol solvents. Fuel, 1999. 78(11): p. 1363-1366. 8. Karagöz, S., et al., Low-temperature catalytic hydrothermal treatment of wood biomass:
analysis of liquid products. Chemical Engineering Journal, 2005. 108(1–2): p. 127-137. 9. Cheng, S., et al., Hydrothermal degradation of alkali lignin to bio-phenolic compounds in
sub/supercritical ethanol and water–ethanol co-solvent. Polymer Degradation and Stability, 2012. 97(6): p. 839-848.
10. Application of Hydrothermal Reactions to Biomass Conversion, in Green Chemistry and Sustainable Technology, F. Jin, Editor. 2014, Springer-Verlag Berlin Heidelberg.
11. Huang, H.-j. and X.-z. Yuan, Recent progress in the direct liquefaction of typical biomass. Progress in Energy and Combustion Science, 2015. 49: p. 59-80.
12. Xu, C. and T. Etcheverry, Hydro-liquefaction of woody biomass in sub- and super-critical ethanol with iron-based catalysts. Fuel, 2008. 87(3): p. 335-345.
13. Güvenatam, B., Catalytic pathways for lignin depolymerization. 2015, Ph. D. thesis, Eindhoven University of Technology, ISBN: 978-90-386-3844-7.
14. Rataboul, F. and N. Essayem, Cellulose Reactivity in Supercritical Methanol in the Presence of Solid Acid Catalysts: Direct Synthesis of Methyl-levulinate. Industrial & Engineering Chemistry Research, 2011. 50(2): p. 799-805.
15. Minami, E. and S. Saka, Decomposition behavior of woody biomass in water-added supercritical methanol. Journal of Wood Science, 2005. 51(4): p. 395-400.
16. Hu, X. and C.-Z. Li, Levulinic esters from the acid-catalysed reactions of sugars and alcohols as part of a bio-refinery. Green Chemistry, 2011. 13(7): p. 1676-1679.
17. Sasaki, M., et al., Dissolution and Hydrolysis of Cellulose in Subcritical and Supercritical Water. Industrial & Engineering Chemistry Research, 2000. 39(8): p. 2883-2890.
18. Kumar, P., et al., Methods for Pretreatment of Lignocellulosic Biomass for Efficient Hydrolysis and Biofuel Production. Industrial & Engineering Chemistry Research, 2009. 48(8): p. 3713-3729.
19. Xu, C., et al., Lignin depolymerisation strategies: towards valuable chemicals and fuels. Chem Soc Rev, 2014. 43(22): p. 7485-500.
20. Jongerius, A.L., Catalytic Conversion of Lignin for the Production of Aromatics. 2013, Netherlands: Universiteit Utrecht.
21. Laskar, D.D., et al., Pathways for biomass-derived lignin to hydrocarbon fuels. Biofuels Bioproducts & Biorefining-Biofpr, 2013. 7(5): p. 602-626.
22. Brand, S. and J. Kim, Liquefaction of major lignocellulosic biomass constituents in supercritical ethanol. Energy, 2015. 80: p. 64-74.

47
23. Mosier, N., et al., Features of promising technologies for pretreatment of lignocellulosic biomass. Bioresource Technology, 2005. 96(6): p. 673-686.
24. Kersten, S.R.A., et al., Options for Catalysis in the Thermochemical Conversion of Biomass into Fuels, in Catalysis for Renewables. 2007, Wiley-VCH Verlag GmbH & Co. KGaA. p. 119-145.
25. Dimitriadis, A. and S. Bezergianni, Hydrothermal liquefaction of various biomass and waste feedstocks for biocrude production: A state of the art review. Renewable and Sustainable Energy Reviews, 2017. 68, Part 1: p. 113-125.
26. Chen, H., 4 - Lignocellulose biorefinery conversion engineering, in Lignocellulose Biorefinery Engineering. 2015, Woodhead Publishing. p. 87-124.
27. Kumar, S., et al., Liquefaction of lignocellulose: Do basic and acidic additives help out? Chemical Engineering Journal, 2015. 278: p. 99-104.
28. Nielsen, J.B., Valorization of lignin from biorefineries for fuels and chemicals. 2016, Technical University of Denmark Kgs. Lyngby. p. 2016. 167 p.
29. Kleinert, M. and T. Barth, Towards a Lignincellulosic Biorefinery: Direct One-Step Conversion of Lignin to Hydrogen-Enriched Biofuel. Energy & Fuels, 2008. 22(2): p. 1371-1379.
30. Roberts, V.M., et al., Towards Quantitative Catalytic Lignin Depolymerization. Chemistry – A European Journal, 2011. 17(21): p. 5939-5948.
31. H. Wang, M.T., and Y. Ji, Recent Development in Chemical Depolymerization of Lignin: A Review. Journal of Applied Chemistry, 2013.
32. Wang, Y., et al., Effects of solvents and catalysts in liquefaction of pinewood sawdust for the production of bio-oils. Biomass and Bioenergy, 2013. 59: p. 158-167.
33. Xinping Ouyang, X.H., Yuan Zhu, and Xueqing Qiu* Ethanol-Enhanced Liquefaction of Lignin with Formic Acid as an in Situ Hydrogen Donor. Energy Fuels, 2015, 2015. 29((9)): p. pp 5835-5840.
34. D'Souza, J., R. Camargo, and N. Yan, Biomass Liquefaction and Alkoxylation: A Review of Structural Characterization Methods for Bio-based Polyols. Polymer Reviews, 2017: p. 1-27.
35. Morgan, T., et al., Catalytic deoxygenation of triglycerides to hydrocarbons over supported nickel catalysts. Chemical Engineering Journal, 2012. 189: p. 346-355.
36. Vasilakos, N.P. and D.M. Austgen, Hydrogen-donor solvents in biomass liquefaction. Industrial & Engineering Chemistry Process Design and Development, 1985. 24(2): p. 304-311.
37. Zakzeski, J., et al., The Catalytic Valorization of Lignin for the Production of Renewable Chemicals. Chemical Reviews, 2010. 110(6): p. 3552-3599.
38. Castellvi Barnes, M., et al., A new approach for bio-oil characterization based on gel permeation chromatography preparative fractionation. Journal of analytical and applied pyrolysis, 2015. 113: p. 444-453.
39. Wahyudiono, M. Sasaki, and M. Goto, Thermal decomposition of guaiacol in sub- and supercritical water and its kinetic analysis. Journal of Material Cycles and Waste Management, 2011. 13(1): p. 68-79.
40. Gosselink, R.J., et al., Lignin depolymerisation in supercritical carbon dioxide/acetone/water fluid for the production of aromatic chemicals. Bioresour Technol, 2012. 106: p. 173-7.
41. Yu, J. and P.E. Savage, Decomposition of Formic Acid under Hydrothermal Conditions. Industrial & Engineering Chemistry Research, 1998. 37(1): p. 2-10.
42. Miller, J.E., Evans, L. R., Mudd, J. E. & Brown, K. A., Batch Microreactor Studies of Lignin Depolymerization by Bases. 2. Aqueous Solvents. 2002.

48
43. Toor, S.S., L. Rosendahl, and A. Rudolf, Hydrothermal liquefaction of biomass: A review of subcritical water technologies. Energy, 2011. 36(5): p. 2328-2342.
44. Ishikawa, Y. and S. Saka, Chemical conversion of cellulose as treated in supercritical methanol. Cellulose, 2001. 8(3): p. 189-195.
45. Kumar, S. and R.B. Gupta, Hydrolysis of Microcrystalline Cellulose in Subcritical and Supercritical Water in a Continuous Flow Reactor. Industrial & Engineering Chemistry Research, 2008. 47(23): p. 9321-9329.
46. Pilath, H.M., et al., Glucose Reversion Reaction Kinetics. Journal of Agricultural and Food Chemistry, 2010. 58(10): p. 6131-6140.
47. Hu, X., et al., Effects of water and alcohols on the polymerization of furan during its acid-catalyzed conversion into benzofuran. RSC Advances, 2016. 6(46): p. 40489-40501.
48. Hu, X., et al., Polymerization on heating up of bio-oil: A model compound study. AIChE Journal, 2013. 59(3): p. 888-900.
49. Hoekstra, E., et al., Heterogeneous and homogeneous reactions of pyrolysis vapors from pine wood. AIChE Journal, 2012. 58(9): p. 2830-2842.
50. Barnard, J.A. and H.W.D. Hughes, The pyrolysis of ethanol. Transactions of the Faraday Society, 1960. 56(0): p. 55-63.
51. Li, A. and S.H. Yalkowsky, Solubility of Organic Solutes in Ethanol/Water Mixtures. Journal of Pharmaceutical Sciences, 1994. 83(12): p. 1735-1740.
52. Morris, K.R., et al., Solubility of aromatic pollutants in mixed solvents. Chemosphere, 1988. 17(2): p. 285-298.
53. Jaw-Kwei Fu, A.M.A.a.R.G.L., M. ASCE, Aromatic Compound Solubity in Solvent/Water Mixture. Journal of Environmental Engineering, 1986. Vol. 112, No. 2(April, 1986).
54. Elliott, D.C., et al., Hydrothermal liquefaction of biomass: Developments from batch to continuous process. Bioresource Technology, 2015. 178: p. 147-156.
55. Brand, S., et al., Supercritical ethanol as an enhanced medium for lignocellulosic biomass liquefaction: Influence of physical process parameters. Energy, 2013. 59: p. 173-182.
56. Chen, Y., et al., Direct liquefaction of Dunaliella tertiolecta for bio-oil in sub/supercritical ethanol–water. Bioresource Technology, 2012. 124: p. 190-198.
57. Mahmood, N., et al., Hydrolytic liquefaction of hydrolysis lignin for the preparation of bio-based rigid polyurethane foam. Green Chemistry, 2016. 18(8): p. 2385-2398.
58. Hu, X., et al., Reaction pathways of glucose during esterification: Effects of reaction parameters on the formation of humin type polymers. Bioresource Technology, 2011. 102(21): p. 10104-10113.
59. Yan, L., L. Zhang, and B. Yang, Enhancement of total sugar and lignin yields through dissolution of poplar wood by hot water and dilute acid flowthrough pretreatment. Biotechnology for Biofuels, 2014. 7(1): p. 76.
60. Celikbag, Y., et al., The effect of ethanol on hydroxyl and carbonyl groups in biopolyol produced by hydrothermal liquefaction of loblolly pine: 31P-NMR and 19F-NMR analysis. Bioresource Technology, 2016. 214: p. 37-44.
61. Wang, C., et al., Hydrolysis of cellulose into reducing sugar via hot-compressed ethanol/water mixture. Biomass and Bioenergy, 2012. 42: p. 143-150.
62. Fang, Z., et al., Liquefaction and Gasification of Cellulose with Na2CO3 and Ni in Subcritical Water at 350 °C. Industrial & Engineering Chemistry Research, 2004. 43(10): p. 2454-2463.
63. Alves, L.A., J.B. Almeida e Silva, and M. Giulietti, Solubility of d-Glucose in Water and Ethanol/Water Mixtures. Journal of Chemical & Engineering Data, 2007. 52(6): p. 2166-2170.

49
64. Bouchard, A., G.W. Hofland, and G.-J. Witkamp, Properties of Sugar, Polyol, and Polysaccharide Water−Ethanol Solu ons. Journal of Chemical & Engineering Data, 2007. 52(5): p. 1838-1842.
65. Schwanninger, M., et al., Effects of short-time vibratory ball milling on the shape of FT-IR spectra of wood and cellulose. Vibrational Spectroscopy, 2004. 36(1): p. 23-40.
66. Okuda, K., et al., Disassembly of lignin and chemical recovery—rapid depolymerization of lignin without char formation in water–phenol mixtures. Fuel Processing Technology, 2004. 85(8–10): p. 803-813.
67. Cheng, S., et al., Highly efficient de-polymerization of organosolv lignin using a catalytic hydrothermal process and production of phenolic resins/adhesives with the depolymerized lignin as a substitute for phenol at a high substitution ratio. Industrial Crops and Products, 2013. 44: p. 315-322.
68. Yuan, Z., et al., Hydrolytic degradation of alkaline lignin in hot-compressed water and ethanol. Bioresource Technology, 2010. 101(23): p. 9308-9313.
69. Mahmood, N., et al., Production of polyols via direct hydrolysis of kraft lignin: Effect of process parameters. Bioresource Technology, 2013. 139: p. 13-20.
70. Kumar, S., et al., Liquefaction of Lignocellulose in Fractionated Light Bio-Oil: Proof of Concept and Techno-Economic Assessment. ACS Sustainable Chemistry & Engineering, 2015. 3(9): p. 2271-2280.

50
8. ACKNOWLEDGEMENTS
I would like to pay special thankfulness to the Ministry of Research, Technology and Higher Education of the Republic of Indonesia (Kemenristek) for providing a 2-year full master degree via RISET PRO scholarship program, to the Agency of the Assessment and Application of Technology (BPPT) for permitting me to pursue my study. Secondly, I would like to thank all the examination member prof. dr. ir. S.R.A. Kersten and dr. Bastian Mei, for their supports and feedbacks during the halfway meeting. I would like to show my great gratitude to dr. ir. R.J.M. Westerhof who helped me at every point and encouraged me a lot by giving the constructive input and feedbacks during my research. I would like to thank P.S. Marathe M.Sc who helped me a lot with GC-MS, GPC, and LC-MS analysis and gave me the feedback on analyses and calculation during the project. I am also grateful for having a chance to meet so many wonderful people and professionals at SPT (Sustainable Process Technology) group and HPL member who led me through during the research. Last but not least, my parents Bapak Tri Haryono W. Murti and Ibu Musyawati, my husband Rakhmat Zuhdi S. and my son Roufan Zuhdi Bramantyo; without whom I was nothing, despite living far apart, they always encouraged me morally and emotionally throughout the time of my study.
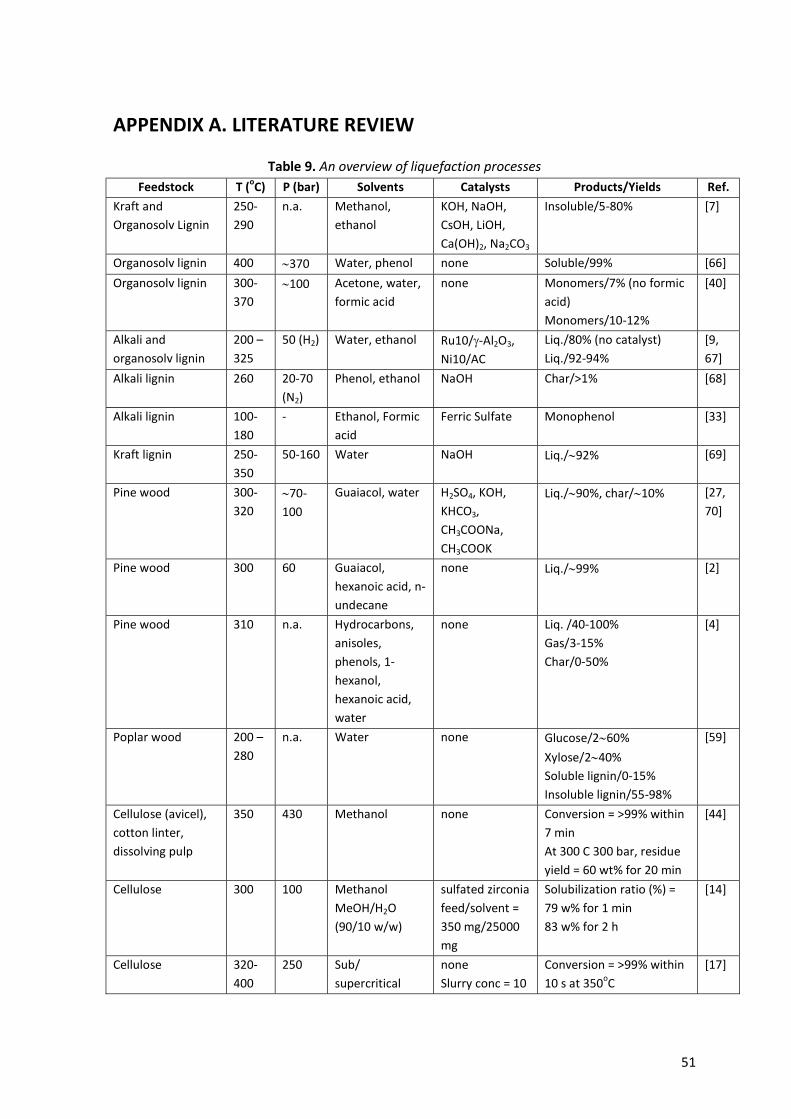
51
APPENDIX A. LITERATURE REVIEW
Table 9. An overview of liquefaction processes Feedstock T (oC) P (bar) Solvents Catalysts Products/Yields Ref.
Kraft and Organosolv Lignin
250-290
n.a. Methanol, ethanol
KOH, NaOH, CsOH, LiOH, Ca(OH)2, Na2CO3
Insoluble/5-80% [7]
Organosolv lignin 400 370 Water, phenol none Soluble/99% [66] Organosolv lignin 300-
370 100 Acetone, water,
formic acid none Monomers/7% (no formic
acid) Monomers/10-12%
[40]
Alkali and organosolv lignin
200 – 325
50 (H2) Water, ethanol Ru10/-Al2O3, Ni10/AC
Liq./80% (no catalyst) Liq./92-94%
[9, 67]
Alkali lignin 260 20-70 (N2)
Phenol, ethanol NaOH Char/>1% [68]
Alkali lignin 100-180
- Ethanol, Formic acid
Ferric Sulfate Monophenol [33]
Kraft lignin 250-350
50-160 Water NaOH Liq./92% [69]
Pine wood 300-320
70-100
Guaiacol, water H2SO4, KOH, KHCO3, CH3COONa, CH3COOK
Liq./90%, char/10% [27, 70]
Pine wood 300 60 Guaiacol, hexanoic acid, n-undecane
none Liq./99% [2]
Pine wood 310 n.a. Hydrocarbons, anisoles, phenols, 1-hexanol, hexanoic acid, water
none Liq. /40-100% Gas/3-15% Char/0-50%
[4]
Poplar wood 200 – 280
n.a. Water none Glucose/260% Xylose/240% Soluble lignin/0-15% Insoluble lignin/55-98%
[59]
Cellulose (avicel), cotton linter, dissolving pulp
350 430 Methanol none Conversion = >99% within 7 min At 300 C 300 bar, residue yield = 60 wt% for 20 min
[44]
Cellulose 300 100 Methanol MeOH/H2O (90/10 w/w)
sulfated zirconia feed/solvent = 350 mg/25000 mg
Solubilization ratio (%) = 79 w% for 1 min 83 w% for 2 h
[14]
Cellulose 320-400
250 Sub/ supercritical
none Slurry conc = 10
Conversion = >99% within 10 s at 350oC
[17]

52
Water w% Flowrate =5 mL/min
Yield = 75%
Cellulose 302-405
276 Water K2CO3 Slurry 2.7 wt%
Conversion = >90% Yield= 65-77% at 400oC and 250 bar Solid yield = 65.5 % at 302oC with 0.22 wt% K2CO3.
[45]
Cellulose 200-350
30 (Initial N2)
Water Na2CO3 5 g/3 mL
The main product at 350oC is solid. With Cat = oil (43%) gas (74%)
[62]
Cellulose 200-270
57.5 Water, methanol, ethanol, isopropanol
none Reducing sugar (RS) yield increases in the order: pure water> methanol/water> ethanol/water > isopropanol/water
[61]
Table 10. Critical point of solvents
Compound Critical point
Tc (oC) Pc (bar) Water 374 220.1
Methanol 239 80.9 Ethanol 243 63.8
All data taken from [6].

53
APPENDIX B. LIQUEFACTION DATA EXPERIMENTS B.1. Effects of Ethanol Concentration
Table 11. Mass balance and operating conditions of wood experiments by varying ethanol concentration
Run name Ethanol
conc. (%)
Temp. (oC)
Reaction time (min)
Overall mass
balance*
Pinitial
(bar) Pmax (bar)
Gas yield (%)
Oil phase yield (%)
Solid Residue
yield (%)
B W 0 300 60 99.15 11.40 72.59 9.95 29.04 43.92 B E/W 10/90 10 300 60 99.84 9.96 74.75 9.77 30.72 39.67 B E/W 20/80 20 300 60 98.39 10.68 70.38 8.59 34.21 27.07 B E/W 30/70 30 300 60 98.52 8.16 82.83 9.67 54.11 24.23 30** 300 60 99.89 11.22 84.37 10.01 45.24 23.83 B E/W 50/50 50 300 60 100.04 7.62 92.10 10.53 62.99 6.54 50** 300 60 100.02 6.90 89.44 9.76 51.84 4.27 B E/W 60/40 60 300 60 98.34 7.44 97.54 9.39 81.39 1.82 60** 300 60 97.71 7.08 97.79 9.60 60.68 1.87 B E/W 70/30 70 300 60 99.52 7.98 101.39 7.50 36.83 4.30 70** 300 60 96.91 7.08 91.31 8.86 57.16 4.25 B E/W 80/20 80 300 60 99.59 7.98 91.57 2.38 56.57 25.51 80** 300 60 99.99 7.98 83.39 5.31 41.36 12.95 B E/W 90/10 90 300 60 98.72 7.80 82.67 2.46 25.65 42.67 B E 100 300 60 98.72 8.34 67.01 0.85 12.77 76.68
Note: B = Biomass (pine wood); W = Water; E = Ethanol; Organics in Aqueous phase is calculated by difference; Feedstock = Pine wood, ratio feed/solvent = 15:85 * Overall mass balances were obtained right after the reaction by calculating total mass of gas and liquid+solid before separation step. ** redo experiment B.2. Effects of Temperature
Table 12. Mass balance and operating conditions of wood experiments at various temperatures
Run name Ethanol
conc. (%)
Temp. (oC)
Reaction time (min)
Overall mass
balance
Pinitial
(bar) Pmax (bar)
Gas yield (%)
Oil phase yield (%)
Solid Residue
yield (%)
B E/W 60/40 25060 min 60 250 60 98.74 7.80 49.55 4.00 32.98 42.11 B E/W 60/40 32560 min 60 325 60 97.57 7.80 117.23 8.55 40.09 5.29 B E/W 60/40 35060 min 60 350 60 101.79 6.72 143.42 11.57 14.60 49.16
Note: B = Biomass (pine wood); W = Water; E = Ethanol; Organics in Aqueous phase is calculated by difference; Feedstock = Pine wood, ratio feed/solvent = 15:85

54
Table 13. Total mass oil1 and oil2 at different temperatures
Run name Oil1 (g) Oil2 (g) Total Oil (g) B E/W 60/40 250 60 min 0.27 0.47 0.74 B E/W 60/40 0.35 1.03 1.38 B E/W 60/40 325 60 min 0.25 0.65 0.90 B E/W 60/40 350 60 min - 0.33 0.33
B.3. Effects of Reaction Time
Table 14. Mass balance and operating conditions of wood experiments by varying reaction time
Run name Ethanol
conc. (%)
Temp. (oC)
Reaction time (min)
Overall mass
balance
Pinitial
(bar) Pmax (bar)
Gas yield (%)
Liquid yield (%)
Solid Residue
yield (%)
B W 300 0 min 0 300 0 99.32 7.80 57.68 2.88 66.11 31.01 0* 300 0 100.91 7.80 61.77 4.47 51.13 44.40 B E/W 60/40 250 0 min 60 250 0 101.35 7.80 42.35 1.23 18.32 80.44 B E/W 60/40 300 0 min 60 300 0 99.28 7.78 87.19 3.18 31.96 27.72 B E/W 60/40 300 5 min 60 300 5 99.65 7.44 89.98 2.87 33.86 39.60 B E/W 60/40 300 15 min 60 300 15 98.63 7.80 94.91 5.81 39.48 10.44 B E/W 60/40 300 30 min 60 300 30 98.77 7.78 94.76 7.07 43.13 3.96 B E/W 60/40 300 90 min 60 300 90 101.60 8.16 97.57 10.60 56.55 2.74 B E 300 0 min 100 300 0 100.07 7.96 64.67 0.42 7.13 92.44
Note: B = Biomass (pine wood); W = Water; E = Ethanol; Organics in Aqueous phase is calculated by difference; Feedstock = Pine wood, ratio feed/solvent = 15:85
Table 15. Total mass oil1 and oil2 at various reaction times
Run name Oil1 (g) Oil2 (g) Total Oil (g)
B W 300 0 min - 0.70 0.70
B E/W 60/40 250 0 min - - - B E/W 60/40 300 0 min 0.27 0.45 0.72 B E/W 60/40 300 5 min 0.26 0.50 0.76 B E/W 60/40 300 15 min 0.31 0.57 0.89 B E/W 60/40 300 30 min 0.32 0.92 1.24 B E/W 60/40 0.35 1.03 1.38 B E/W 60/40 300 90 min 0.35 0.94 1.28 B E 300 0 min - 0.17 0.17

55
B.4. Cellulose liquefaction
Table 16. Mass balance and operating conditions of cellulose experiments by varying ethanol concentration
Run name Ethanol
conc. (%)
Temp. (oC)
Reaction time (min)
Overall mass
balance*
Pinitial
(bar) Pmax (bar)
Gas yield (%)
Oil phase yield (%)
Solid Residue
yield (%)
C W 0 300 60 99.39 7.80 67.55 11.05 3.07 36.09 C E/W 10/90 10 300 60 99.93 8.34 73.31 10.03 8.54 30.65 C E/W 50/50 50 300 60 98.33 7.08 94.91 9.10 20.91 19.80 C E/W 60/40 60 300 60 98.49 7.00 99.23 9.11 41.34 13.30 60** 300 60 98.08 8.34 98.69 10.65 24.13 9.64 C E/W 80/20 80 300 60 96.73 7.98 94.63 5.21 8.92 22.71 C E 100 300 60 98.67 7.98 85.55 0.36 0.00 78.66
Note: C = Cellulose (Avicel); W = Water; E = Ethanol; Organics in Aqueous phase is calculated by difference;Feedstock = Cellulose, ratio feed/solvent = 15:85
Figure 26. The solid residue products from liquefaction experiment. a) wood liquefaction by increasing ethanol concentration; b) wood liquefaction by increasing temperature; c)wood
liquefaction in ethanol/water 60/40 (w/w) by varying reaction time; d) wood liquefaction in pure ethanol at 0 min and 60 min
a) b)
d) c)

56
B.5. Acidity of Aqueous Phase Products
Table 17. List of pH measurement for the aqueous phase products
Run name pH B E/W 60/40 25060 min 3.126 B E/W 60/40 32560 min 3.104 B E/W 60/40 35060 min 3.206 B E/W 60/40 300 0 min 3.128 B E/W 60/40 300 30 min 3.068 B E/W 60/40 300 90 min 3.128
Note: B = Biomass (pine wood); W = Water; E=Ethanol

57
APPENDIX C. LIQUID PRODUCT ANALYSIS
Table 18. Analyses for aqueous phase and oil phase products
Products Analysis Analyzer Aqueous phase
Water content Ethanol Organic acids (acetic, levulinic, formic acids), MGP Ethyl Levulinate
KF GC-MS/HPLC HPLC LC-MS
Oil phase Acetone Ethanol
GC-MS GC-MS
Table 19. Retention time and response factor of compounds in GC-MS, HPLC, LC-MS Analyzer Compounds RT (min) Response factor R2 GC Ethanol 3.93-3.94 7,472,377.91 0.9993
Acetone 4.15-4.21 80,922,639.74 0.9975 HPLC Formic acid 14.62-14.63 489,871.73 0.9991
Acetic acid 15.92 -15.95 706,849.91 0.9999 Levulinic acid 16.9-17.1 1,016,750.04 1.0000 Ethanol 24.9-25 757,493.64 0.9990
LC-MS Ethyl levulinate 20.1-20.2 58,668,221,479.59 0.9138
Figure 27. Concentrations of levulinic acid, acetic acid, and ethyl levulinate in the aqueous phase from cellulose liquefaction
0
0.1
0.2
0.3
0.4
0.5
0 20 40 60 80 100
Conc
entr
atio
n (w
t%)
Ethanol (wt%)
Levulinic acid
0
0.1
0.2
0.3
0 20 40 60 80 100
Conc
entr
atio
n (w
t%)
Ethanol (wt%)
Acetic acid
0
0.2
0.4
0.6
0.8
1
0 20 40 60 80 100
Conc
entr
atio
n (w
t%)
Ethanol (wt%)
Ethyl Levulinate

58
Figure 28. Concentrations of levulinic acid, acetic acid, and ethyl levulinate in the aqueous phase from biomass liquefaction
0
0.1
0.2
0.3
0.4
0.5
0.6
0.7
0 20 40 60 80 100
Yiel
ds in
Biom
ass
(wt%
)
Ethanol (wt%)
Acetic acid
Levulinic acid
00.10.20.30.40.50.60.70.80.9
1
0 20 40 60 80 100
Conc
entr
atio
n (w
t%)
Ethanol (wt%)
Ethyl Levulinate

59
APPENDIX D. SOLUBILITY DATA EXPERIMENTS
Figure 29. HTL Oil dissolved in the ethanol-water mixture
Table 20. Experimental tie line data of (oil/ethanol/ water) systems at room temperature (20 oC)
Run name Upper layer(%) Lower layer(%)
Oil Ethanol Water Oil Ethanol Water
W 0.80 0.00 99.20 93.68 0.00 6.32
E/W 10/90 0.59 9.24 90.17 88.94 3.03 8.03
E/W 20/80 1.58 18.86 79.56 84.63 7.39 7.98
E/W 30/70 1.74 27.84 70.42 78.14 13.13 8.72
E/W 40/60 3.67 37.78 58.55 68.59 18.57 12.85
E/W 50/50 5.66 45.93 48.41 65.52 20.67 13.80
E/W 60/40 7.76 54.77 37.47 49.75 31.64 18.61
E/W 70/30 9.32 62.64 28.04 21.55 53.70 24.75
0% 20% 40% 50% 60%80% 100%

60
APPENDIX E. OVERALL AND ETHANOL MASS BALANCES Mass Balance of Biomass Liquefaction with Various Ethanol Concentrations
Aqueous phase were not easy to collect since ethanol and other light productsmay be volatile. Moreover, the liquid products (oil phase and aqueous phase) might be loss during separation step. Table 22shows yield results from the experiment and the assumption calculation. The assumption calculation is expressed by equation 6).
Table 21. Water, ethanol, and organics in the aqueous phase from biomass liquefaction
Run name Water (wt.%) Ethanol (wt.%) Organics (wt.%)* B W 96.80 0.00 3.20 B E/W 10/90 91.69 8.25 0.06 B E/W 20/80 81.89 15.70 2.41 B E/W 30/70 71.39 23.81 4.80 B E/W 50/50 52.43 39.60 7.97 B E/W 60/40 43.32 47.28 9.40 B E/W 70/30 30.76 56.06 13.18 B E/W 80/20 21.11 66.31 12.58 B E/W 90/10 13.41 79.53 7.06 B E 2.02 92.89 5.09
The aqueous phases were from biomass liquefaction at 300oC for an hour. * Organics were calculated by difference [100(%) - water (%) - ethanol (%) ].
Table 22. Comparison of the organics yields by the experiment and the calculation equation 6)
Run name
Yields (%) Total Mass
Balance (%)
Organics yield (%) from eq.
6)**eq.
𝝈 (the Standard
Deviation) Gas Oil
phase Solid
Residue
Organics from
Aqueous phase *exp
B W 9.95 29.04 43.92 14.92 97.82 17.09 1.5 B E/W 10/90 9.77 30.72 39.67 0.21 80.38 19.83 13.9 B E/W 20/80 8.59 34.21 27.07 13.19 83.05 30.14 12.0 B E/W 30/70 10.01 45.24 23.83 29.58 108.67 20.91 6.1 B E/W 50/50 9.76 51.84 4.27 29.57 95.44 56.40 19.0 B E/W 60/40 9.60 60.68 1.87 44.78 116.93 27.85 12.0 B E/W 70/30 8.86 57.16 4.25 34.82 105.10 29.72 3.6 B E/W 80/20 5.31 41.36 12.95 46.47 106.09 40.39 4.3 B E/W 90/10 2.46 25.65 42.67 30.37 101.15 29.22 0.8 B E 0.85 12.77 76.68 18.38 108.68 9.70 6.1
* Organics yieldswere obtained from the experiment which was expressed by mass of aqueous phase multiplied by organics (wt.%) from Table 21. ** Organics yields were calculated by difference [100 (wt%)-gas yield (wt%)-oil phase yield (wt%)-solid residue yield (wt%) ]

61
Ethanol balance with involving the separation step Table 23. Ethanol balance involving separation step
Run name Ethanol balance (gr) Ethanol loss
Initial Aq. phase Oil phase (gr) (%) B E/W 50/50 6.2 4.9 0.024 1.2 20.02 B E/W 60/40 7.5 5.8 0.014 1.7 22.46 B E/W 70/30 8.7 6.8 0.021 1.9 21.62 B E/W 80/20 10.0 8.3 0.009 1.7 16.51
Ethanol balance without involving the separation step
Table 24. Mass balance for aqueous phase by calculation
Run name Yield in total mass (%)
Total Feed (gr)
m. Aq. Phase
(gr) Gas Solid Oil
Aqueous phase (by difference)*
B E/W 50/50 1.46 0.64 7.77 90.12 15.021 13.537 B E/W 60/40 1.45 0.28 9.19 89.07 15.041 13.397 B E/W 70/30 1.36 0.65 8.74 89.26 15.036 13.420
* All the overall mass balances achieved above 99%. By using the average yields of gas, solid, and oil phase can get the estimation mass of aqueous phase of each component. From Appendix B Table 11, the standard error of gas, solid and oil phase yields were low between 0 and 5.1%.
Table 25. Ethanol balance without separation step
Run name Ethanol(gr) Ethanol loss
Initial End (gr) (%) B E/W 50/50 6.38 6.06 0.32 4.97 B E/W 60/40 7.66 6.92 0.74 9.61 B E/W 70/30 8.93 8.43 0.51 5.65
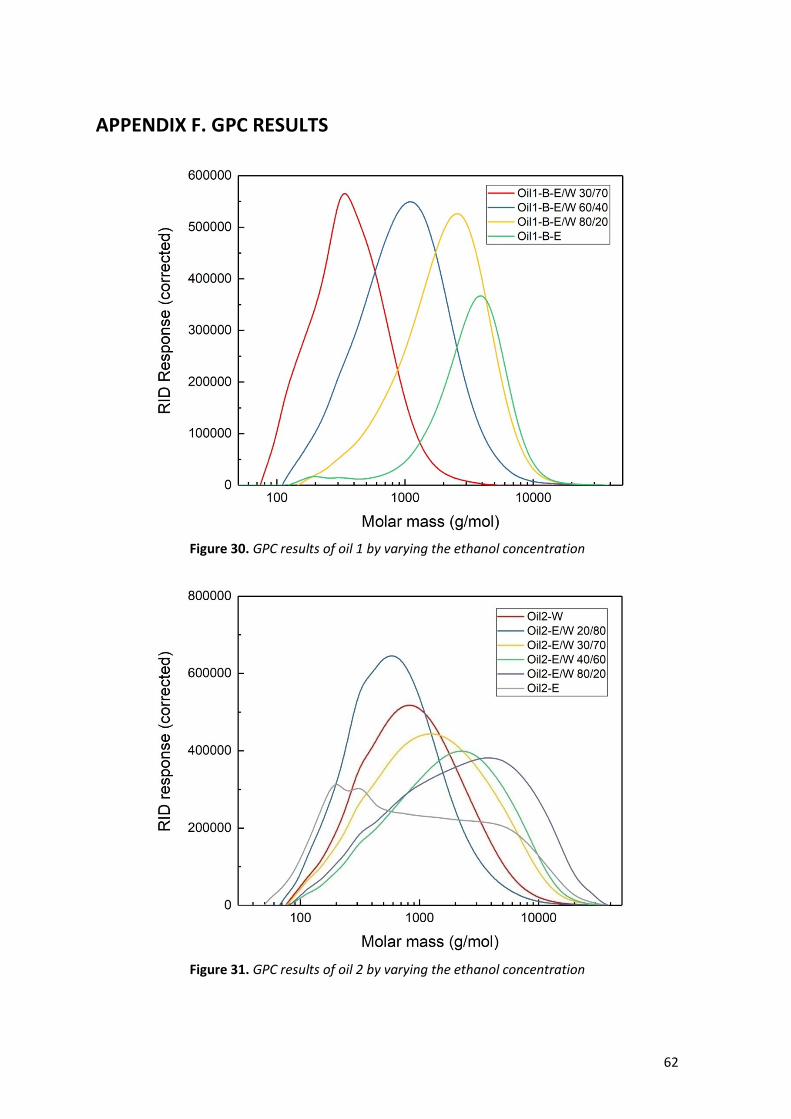
62
APPENDIX F. GPC RESULTS
Figure 30. GPC results of oil 1 by varying the ethanol concentration
Figure 31. GPC results of oil 2 by varying the ethanol concentration

63
Figure 32. GPC results of oil 2 by varying the reaction time
Figure 33. GPC results of oil 2 by varying the operating temperature

64
Figure 34. GPC results of oil 2 from cellulose liquefaction
Figure 35. GPC results of aqueous phase from cellulose liquefaction