Fungal pretreatments for lignocellulosic biomass anaerobic ...
262
HAL Id: tel-02801947 https://hal.inrae.fr/tel-02801947 Submitted on 5 Jun 2020 HAL is a multi-disciplinary open access archive for the deposit and dissemination of sci- entific research documents, whether they are pub- lished or not. The documents may come from teaching and research institutions in France or abroad, or from public or private research centers. L’archive ouverte pluridisciplinaire HAL, est destinée au dépôt et à la diffusion de documents scientifiques de niveau recherche, publiés ou non, émanant des établissements d’enseignement et de recherche français ou étrangers, des laboratoires publics ou privés. Fungal pretreatments for lignocellulosic biomass anaerobic digestion Elsa Rouches To cite this version: Elsa Rouches. Fungal pretreatments for lignocellulosic biomass anaerobic digestion. Life Sciences [q-bio]. Université de Montpellier, 2015. English. tel-02801947
-
Upload
khangminh22 -
Category
Documents
-
view
2 -
download
0
Transcript of Fungal pretreatments for lignocellulosic biomass anaerobic ...

HAL Id: tel-02801947https://hal.inrae.fr/tel-02801947
Submitted on 5 Jun 2020
HAL is a multi-disciplinary open accessarchive for the deposit and dissemination of sci-entific research documents, whether they are pub-lished or not. The documents may come fromteaching and research institutions in France orabroad, or from public or private research centers.
L’archive ouverte pluridisciplinaire HAL, estdestinée au dépôt et à la diffusion de documentsscientifiques de niveau recherche, publiés ou non,émanant des établissements d’enseignement et derecherche français ou étrangers, des laboratoirespublics ou privés.
Fungal pretreatments for lignocellulosic biomassanaerobic digestion
Elsa Rouches
To cite this version:Elsa Rouches. Fungal pretreatments for lignocellulosic biomass anaerobic digestion. Life Sciences[q-bio]. Université de Montpellier, 2015. English. �tel-02801947�


Délivré par Université de Montpellier
Préparée au sein de l’école doctorale GAIA
Et de l’unité de recherche Laboratoire de Biotechnologie de
l’Environnement (INRA, UR0050 LBE)
Spécialité : APAB - Agroressources, Procédés, Aliments,
Bioproduits
Présentée par Elsa ROUCHES
Soutenue le 17/12/2015 devant le jury composé de
Mme Christelle WISNIEWSKI, Professeure,
Université de Montpellier
Présidente du jury
Mme Hélène CARRERE, Directrice de recherche,
INRA Narbonne
Directrice de thèse
M Rémy BAYARD, Maître de conférences,
INSA de Lyon
Rapporteur
M Thierry RIBEIRO, enseignant-chercheur,
Institut Polytechnique LaSalle Beauvais
Rapporteur
Mme Isabelle GIMBERT, Maître de conférences,
Université Aix- Marseille
Examinatrice
Mme Maritxu GUIRESSE, Professeure,
Institut National Polytechnique, ENSA Toulouse
Examinatrice
Prétraitements fongiques
pour la méthanisation
de la biomasse lignocellulosique
Fungal pretreatments for lignocellulosic biomass
anaerobic digestion
TITRE DE LA THESE

2

A ma grand-mère,
Idalina Amélia FERREIRA LOPES


Abstract
Anaerobic digestion of lignocellulosic biomass is one of the most efficient ways to produce renewable energy. However, lignin contained in this
biomass is difficult to hydrolyze. This limitation can be overcome by pretreatments. Among them, low-cost white-rot fungi pretreatments seem
attractive but were scarcely applied for anaerobic digestion. The current study investigates white-rot fungi pretreatments of wheat straw to
improve its methane production. Firstly, a selection step has revealed the efficiency of Polyporus brumalis BRFM 985 since 43% more methane
per gram of pretreated volatile solids were obtained compared to the control straw. Taking into account the dry weight loss occurring during the
pretreatment, it still corresponded to 21% more methane per gram of initial total solids. Moreover, glucose addition during the pretreatment was
shown to limit delignification and thus methane production from the substrate. Secondly, pretreated samples were obtained in an experiment
device aiming to optimize the pretreatment with P. brumalis BRFM 985; tested pretreatments parameters were: culture duration, temperature,
initial substrate moisture content and metals addition. Response surfaces of methane production from those samples were built. Optimum
methane production was not reached in the experimental domain but the positive impact of metals addition was demonstrated, so as the
importance to choose adequate culture duration. Then, the use of pyrolysis-GC-MS technic to access pretreatment efficiency was studied.
Estimation of fungal biomass amount on wheat straw with this method appeared possible. Polysaccharides/lignin ratio determined with py-GC-
MS allowed to classify some pretreated samples according to their anaerobic degradability. Solid State Anaerobic Digestion (SSAD) of wheat
straw pretreated in pilot-reactor was carried out in batch with leachate recycle. During SSAD start-up phase, too high Substrate/Inoculum (S/I)
ratio leads to Volatile Fatty Acid (VFA) accumulation and sometimes to reactor failure but with high S/I more substrate can be treated and
methane production per reactor volume increases. With wheat straw, S/I between 2 and 3 (Volatile Solid basis) allow a successful start-up in
SSAD. Whereas Total VFA/alkalinity ratio under 0.6 corresponds to stable wet anaerobic digestion; this limit seems not well adapted to SSAD. It
was observed that SSAD reactors were able to recover from acidification phase when Total VFA/alkalinity was lower than 2 and with VFA
concentrations inferior to 10 g/L in leachate. Despite the improvement of biodegradability and the facilitation of start-up phase, non-optimized
fungal pretreatment did not improve methane production after taking into account mass losses occurring during the pretreatment.
Keywords: White-Rot Fungi (WRF); wheat straw; Solid State Anaerobic Digestion (SSAD); Solid-State-fermentation (SSF); culture conditions;
delignification; py-GC-MS; methane;
Résumé
La méthanisation de la biomasse lignocellulosique est un des moyens les plus efficients pour la production d’énergie renouvelable. Cependant,
la lignine présente dans cette biomasse est difficile à hydrolyser. Cette limite peut être surmontée grâce aux prétraitements. Parmi eux, les
prétraitements peu couteux par pourritures blanches sont attrayants mais ils ont été peu appliqués pour la digestion anaérobie. La présente
étude explore les prétraitements par pourritures blanches de la paille de blé afin d’en améliorer sa méthanisation. Tout d’abord, une étape de
sélection a révélé l’efficacité de la souche Polyporus brumalis BRFM 985 puisque 43% de méthane supplémentaire ont été obtenus par gramme
de matières volatiles par comparaison avec la paille témoin. En prenant en compte les pertes de matières occasionnées par le prétraitement,
cela correspondait à 21 % d’amélioration par gramme de matière sèche initiale. De plus, il fut montré que l’addition de glucose durant le
prétraitement limitait la délignification et donc la production de méthane du substrat. Puis, des échantillons prétraités ont été obtenus lors d’un
plan d’expérience visant à optimiser le prétraitement par P. brumalis BRFM 985 ; les paramètres du prétraitement testés étaient : la durée et la
température de culture, l’humidité initiale du substrat et l’addition de métaux. Les surfaces de réponse de la production de méthane à partir de
ces échantillons ont été construites. La production optimale de méthane n’a pas été atteinte dans le domaine expérimental testé mais l’impact
positif de l’addition de métaux a été démontré, ainsi que l’importance de choisir une durée de culture adaptée. Ensuite, l’usage de la technique
de la pyrolyse-GC-MS pour évaluer l’efficacité du prétraitement a été étudié. Une estimation de la quantité de biomasse fongique avec cette
méthode apparaît possible. Le ratio polysaccharides/lignine déterminé par py-GC-MS a permis de classer des échantillons prétraités selon leur
biodégradabilité anaérobie. La digestion anaérobie en voie sèche (DAVS) de paille de blé prétraitée en réacteur pilote a été menée en batch
avec recirculation des lixiviats. Durant le démarrage de la DAVS, un trop fort S/I mène à une accumulation d’acides gras volatils (AGV) et
parfois à la défaillance de la DAVS. Néanmoins, de forts S/I permettent de traiter plus de substrat et augmentent la production de méthane par
volume de réacteur. Avec la paille de blé, des S/I entre 2 et 3 (en matières volatiles) permettent un bon démarrage de la DAVS. Alors qu’un ratio
AGV totaux/alcalinité inférieur à 0,6 correspond à des réacteurs stables en digestion anaérobie voie liquide ; cette limite semble mal adaptée à
la DAVS. Il a été observé que la DAVS pouvait récupérer d’une phase d’acidification tant que le ratio AGV totaux/alcalinité était inférieur à 2 et
que la concentration en AGV était inférieure à 10 g/L dans les lixiviats. Malgré une amélioration de la biodégradabilité et une phase de
démarrage facilitée, le prétraitement fongique non optimisé n’a pas permis d’améliorer la production de méthane après prise en compte des
pertes de matière occasionnées par le prétraitement.
Mots-clés: pourritures blanches ; paille de blé ; digestion anaérobie en voie sèche ; Fermentation en Milieu Solide (FMS) ; conditions de
culture ; délignification ; py-GC-MS ; méthane ;

Remerciements
Je remercie tous les membres du projet Stockactif et plus particulièrement les personnes qui ont eu la
gentillesse de me fournir quelques informations utiles : Francis DUCHIRON (UMR FARE), Gérard LAINE
(Vivescia), Pauline RAPPINAT et Anaïs GUILLAUME (Soufflet). Les expérimentations et échanges avec
Mathieu MULLER (Envolure) et Abdellatif BARAKAT (UMR IATE) se sont également révélées
enrichissants. Merci à l’INRA et à l’ANR pour m’avoir financée et avoir cru en ce projet. Merci à Marie-
France DIGNAC (UMR EcoSYS) pour sa participation aux travaux de pyrolyse et pour m’avoir formée à
cette technique. La collaboration avec l’UMR BBF et notamment avec Simeng ZHOU a aussi fortement
contribué à étayer mes connaissances sur les champignons. Je remercie Michelle SERGENT pour
l’élaboration du plan d’expérience. J’ai également particulièrement apprécié les encouragements et conseils
d’Isabelle GIMBERT. Grâce à elle, j’ai pu accéder à des résultats expérimentaux indispensables à cette thèse
(qPCR et deep-well avec différentes quantités de glucose). Elle s’est également impliquée dans mon comité
de thèse, la relecture de ma revue bibliographique ou encore de ma thèse en tant que membre du jury.
J’en viens donc à remercier les autres membres de mon comité de thèse pour avoir pris le temps de
s’intéresser à mon travail : Jean TAYEB (UMR IATE), Richard AURIA (IRD) et Sylvaine CRAPART
(ARD). Finalement, j’ai aussi une pensée pour les autres membres de mon jury de thèse Christelle
WISNIEWSKI (Université de Montpellier), Rémy BAYARD (INSA de Lyon), Thierry RIBEIRO (Institut
Polytechnique LaSalle Beauvais) et Maritxu GUIRESSE (INP ENSAT). Je les remercie pour leur temps,
conseils et encouragements. Je garderai un bon souvenir d’eux et aussi bizarre que cela puisse paraître de ma
soutenance.
Bien entendu, je te remercie de tout cœur Hélène CARRERE (UR LBE), ma directrice de thèse, pour ton
investissement important dans mon travail, tes connaissances, ta pertinence, ta porte toujours ouverte, ton
calme, ton honnêteté, ta confiance… Peut-être m’auras-tu transmis un peu de ta patience ? Je suis vraiment
heureuse et reconnaissante d’avoir passé ces trois années sous ta tutelle. Merci aussi pour la Grèce où nous
et Denis LOISEL avons passé de bons moments, ce fut agréable d’échanger avec vous. Merci pour le Chili,
je suis sortie de l’Europe pour la première fois. La main de Jean-Phillipe STEYER, que je tenais dans
l’avion s’en rappellera. Jean-Phi, tu as toujours cru en moi et m’a orientée dans mes moments difficiles.
Eric LATRILLE, cela serait long de tout dire entre les sorties canoë à renfort de bébés goélands et de taboulé
ainsi que les ateliers groupe de rock agrémentés d’interminables discussions sur comment travailler
proprement dans un milieu moyennement propre, etc. J’ai particulièrement apprécié ta gaité et ta
bienveillance notamment envers les « jeunes » ; ton esprit toujours en ébullition et tes grandes compétences
en statistiques m’ont également été précieuses. Renaud ESCUDIE, je retiendrai ta bonne humeur et surtout
ta patience pour m’avoir toujours expliqué deux fois ce que tu me disais (j’étais pas très en forme en fin de
thèse ).
Thierry CONTE, ce fut un plaisir de te cotoyer en début de thèse. Merci pour ton altruisme et la transmission
d’une partie de tes connaissances dans la gestion de l’HPLC. Cela me fait penser que je pourrai en dire
autant de Nadine DELGENÈS. J’ai aussi une pensée pour mes stagiaires, Marie-Aude SOULA et Rita
SCHUBERT, dont j’ai su apprécier la motivation et le sérieux.

Je souhaiterais sincèrement remercier tous les membres de mon laboratoire pour leur aide, empathie et
soutien. Je ne pourrai probablement pas tous vous citer mais chacun de vos petits gestes m’ont toujours été
droit au cœur qu’il s’agisse du chocolat noir de Frédéric HABOUZIT, de la réparation de mon pare-choc par
Guillaume GUIZARD ou de l’aide de Marjolaine HAMELIN pour les reliures de mes thèses, etc. Merci,
Véronique MAUGENET pour m’avoir trouvé des multitudes de publis introuvables même si elles dataient
de 1960. Merci, Philippe SOUSBIE, expert en bricolage de réacteurs et plus encore… Merci Nori
HENNAOUI-ROSAY pour le fond et la forme. Merci aux administratrices Sylvie FARINE, Nadine LE
THINH, Alexandra MESEGUER et Annie VIDAL pour leur gentillesse.
J’ai durant ma thèse fait appel au moins une fois à chacun des permanents du laboratoire (désolée de ne tous
vous citer), j’ai toujours reçu de bons conseils scientifiques et un bon accueil de la part de tous. Vous m’avez
aussi tous beaucoup soutenue sur la difficile fin de ma thèse et avez contribué au succès de ma journée de
soutenance. Je vous souhaite le meilleur, j’espère vous avoir rendu un peu de ce que vous m’avez donné et si
ce n’est pas le cas, sachez que je compte bien m’améliorer.
Enfin, merci à l’échoppe pour son soutien moral et merci aux coupaings qui ont pu y venir avec moi. Une
belle équipe qui a mis un peu de magie dans ces trois années : ceux qui sont partis, Mélanie PIERRA,
Thibaut SAUR et ceux qui sont arrivés, Diane PLOUCHART, Wendy LAPERRIÈRE… Lister vos qualités
et tout ce qu’on a pu faire risquerait d’être plus long que ma thèse elle-même… Alice DANEL, mon petit
viking et ses brownckis (un mélange de cookies et de brownies, dooble fat, oui c’est possible), comment
aurais-je pu faire sans ta senseo pour me tenir concentrée 10 heures par jour ? Marie-Lou HILLION, je ne
pensais pas qu’un jour je pourrais aller courir sans y être contrainte et pourtant c’est maintenant une habitude
grâce à toi. Je repense aussi aux balades en roller accompagnées par Antonella MARONE, sa sérenité et son
humour. Angel ROBLES, mi osito, sería indecente de decir màs ;) Je compte bien passer te voir à Valencia
un jour, peut-être accompagnée par le mignon Gabriel CAPSON et dark pipine. Julie JIMENEZ, mon
agence conseil, parfois inadaptée mais toujours drôle et empathique. Florian PAILLET, mon premier fan à
qui je dédierai mon unique futur single. Cyrille CHARNIER, Sissi, je retiendrai entre autres ton sens de
l’humour déplacé et tes questions indiscrètes… Roman MOSCOVIZ, merci pour ta patience et ton
intelligence. Quentin AEMIG, mon pti Q d’amur, après avoir partagé notre goûter (^^), avoir dormi
ensemble et t’avoir déguisé en fille, j’ai fini par assister à ton mariage ! Lucile CHATELLARD, Lulu, ma
co-bureau (des plaintes), t’en as parcouru du chemin depuis ton stage ! Tout ira bien, promis. J’espère être là
pour ta soutenance, merci de t’être si bien occupée de moi. Elisabeth CAZIER et Violette TURON, mes
compagnonnes de galère… Zaza, même si ce fut parfois douloureux, j’admire ta générosité infinie. Vio, les
soirées sans toi c’est moins rigolo. J’espère qu’on fera encore pleins de voyages en namoureuses pour
manger plein de gras . Je suis contente de t’avoir eue à mes côtés durant ces trois ans et après mes
rupturesss, je te retourne tes mots « sans toi c’aurais pas été pareil, » et j’ajoute « beaucoup moins bien ».
Plein d’agréables moments avec vous, plein de belles personnes, vous me manquerez même si j’espère bien
vous garder un peu dans ma vie !
Finalement, merci à mes parents, André et Isabel ROUCHES, notamment pour m’avoir transmis la valeur de
l’honnêteté et du travail et pour avoir toujours fait de leur mieux pour nous élever mon frère Sébastien et
moi. Merci également à Sébastou pour son soutien inconditionnel et sa gentillesse. Cette thèse c’est un peu
pour vous.

Table of contents
List of figures .................................................................................................................................................. 13
List of tables.................................................................................................................................................... 15
List of abbreviations ...................................................................................................................................... 16
List of communications.................................................................................................................................. 18
Résumé étendu ............................................................................................................................................... 19
Introduction .................................................................................................................................................. 27
Chapter 1. Literature review ................................................................................................................... 33
1.1 ANAEROBIC DIGESTION ............................................................................................................................................................. 34 1.1.1 A four steps biological reaction ................................................................................................................................. 34 1.1.2 Anaerobic digestion of lignocellulosic crop residues ................................................................................................. 36
1.1.2.1 Crop residues: an important resource ................................................................................................................................ 36
1.1.2.2 Main constituents of lignocellulosic biomass ..................................................................................................................... 37
1.1.2.3 Other possibilities for energy recovery from crop residues ............................................................................................... 40
1.1.2.4 A solid substrate adapted to Solid-State anerobic digestion .............................................................................................. 41
1.1.3 Solid-State Anaerobic Digestion: definition, advantages and limits ......................................................................... 42 1.1.4 Main parameters influencing anaerobic digestion ................................................................................................... 44
1.1.4.1 Temperature ....................................................................................................................................................................... 44
1.1.4.2 Mixing ................................................................................................................................................................................. 44
1.1.4.3 pH and alkalinity ................................................................................................................................................................. 45
1.1.4.4 Carbon/Nitrogen (C/N) ratio ............................................................................................................................................... 46
1.1.4.5 Nutrient supplementation .................................................................................................................................................. 46
1.1.4.6 Inhibitors............................................................................................................................................................................. 46
1.1.4.7 Particle size of the substrate............................................................................................................................................... 46
1.1.4.8 Inoculum ............................................................................................................................................................................. 47
1.1.5 Anaerobic digestion processes .................................................................................................................................. 47 1.1.5.1 Biochemical Methane potential (BMP) ............................................................................................................................... 47
1.1.5.2 SSAD processes ................................................................................................................................................................... 50
1.2 PRETREATMENTS FOR ANAEROBIC DIGESTION ................................................................................................................................ 54 1.2.1 Non-biological pretreatments ................................................................................................................................... 56 1.2.2 Biological treatments ................................................................................................................................................ 59
1.3 ENZYMATIC MECHANISMS OF WRF AND CULTURE PARAMETERS ....................................................................................................... 64 1.3.1 Enzymatic degradation by WRF and Solid-State Fermentation (SSF) ........................................................................ 64 1.3.2 Cultivation parameters for Solid-State Fermentation (SSF) ...................................................................................... 66
1.4 QUANTIFICATION OF ANAEROBIC DIGESTIBILITY IMPROVEMENT AFTER WRF PRETREATMENT .................................................................. 69 1.4.1 Anaerobic digestion studies with WRF pretreatment ............................................................................................... 69
1.4.1.1 Nitrogen metabolism for anaerobic digestion of fungal pretreated substrates ................................................................. 69
1.4.1.2 Slight acidification of pretreated substrates ....................................................................................................................... 70
1.4.2 In Vitro Dry Matter Digestibility (IVDMD) studies ..................................................................................................... 73 1.5 PARAMETERS OF LIGNOCELLULOSIC BIOMASS INFLUENCING ITS ANAEROBIC DEGRADABILITY .................................................................... 77
1.5.1 Polymers composition and enzymatic accessibility ................................................................................................... 77 1.5.2 The lignin-carbohydrates complex (LCC): linkages and derived compounds ............................................................. 77
1.5.2.1 Major lignin linkages in cell-wall: ferulic acid (FA) and p-coumaric acid (pCA) ................................................................... 77
1.5.2.2 Anaerobic degradability of FA and pCA .............................................................................................................................. 79
1.5.2.3 Other cell-wall linkages in anaerobic digestion .................................................................................................................. 80
1.5.2.4 Lignin-derived compounds ................................................................................................................................................. 80

1.5.3 Influence of histology ................................................................................................................................................ 80 1.5.3.1 Epidermis role and composition ......................................................................................................................................... 80
1.5.3.2 Anaerobic digestion at cell scale ......................................................................................................................................... 81
1.6 QUALITATIVE EFFECTS OF FUNGAL PRETREATMENT ON ANAEROBIC DIGESTIBILITY .................................................................................. 82 1.6.1 Modifications of lignin: G/S (guaiacyl/synapyl) ratio ................................................................................................ 82 1.6.2 Cellulose digestibility improvement .......................................................................................................................... 82 1.6.3 Changes in hemicelluloses X/A (xylose/arabinose) ratio and acetate ....................................................................... 83 1.6.4 Increase of porosity ................................................................................................................................................... 83 1.6.5 Actions of WRF on lignin-carbohydrates complex (LCC) linkages ............................................................................. 83 1.6.6 Release of lignocellulosic polymers main constituents ............................................................................................. 84
1.6.6.1 Lignin-derived compounds ................................................................................................................................................. 84
1.6.6.2 Hemicelluloses and cellulose derived compounds ............................................................................................................. 85
1.6.7 Influence of histology: fungal degradation at cell scale ............................................................................................ 85 1.7 PYROLYSIS-GAZ CHROMATOGRAPHY-MASS SPECTROPHOTOMETRY (PY-GC-MS): A POWERFUL TOOL FOR STRUCTURE ANALYSIS .................. 87
1.7.1 Definition and interest .............................................................................................................................................. 87 1.7.2 Pyrolysis products (pyrolysates) ................................................................................................................................ 88
1.7.2.1 Formation mechanisms ...................................................................................................................................................... 88
1.7.2.2 Parameters influencing pyrolysates yield and nature......................................................................................................... 90
1.7.3 Various existing technologies for Py-GC-MS ............................................................................................................. 91 1.7.4 Py-GC-MS compared to chemical methods to study lignin structure ........................................................................ 92
1.8 CONCLUSION .......................................................................................................................................................................... 95
Chapter 2. Main experimental strategy .................................................................................................. 97
2.1 MATERIAL AND METHOD COMMON TO ALL RESULTS CHAPTERS: MATERIAL ORIGIN AND BMP TESTS ......................................................... 98 2.1.1 Fungal strains ............................................................................................................................................................ 98 2.1.2 Wheat straw .............................................................................................................................................................. 98 2.1.3 Cultivation of Polyporus brumalis BRFM 985 in liquid medium ................................................................................ 98 2.1.4 Total Solids and Volatile Solids determination .......................................................................................................... 98 2.1.5 Biochemical Methane Potential (BMP) measurements: general case ...................................................................... 98
2.2 OVERVIEW OF ANALYSED SAMPLES ............................................................................................................................................ 100 2.3 MATERIAL AND METHODS SPECIFIC TO RESULTS OVERVIEW (CHAPTER 7) .......................................................................................... 102
2.3.1 Contamination problem .......................................................................................................................................... 102 2.3.1.1 Pilot-reactor cleaning verification..................................................................................................................................... 102
2.3.1.2 Wheat straw microflora .................................................................................................................................................... 102
2.3.1.3 BMP-tests ......................................................................................................................................................................... 102
2.3.2 Enzyme assays ......................................................................................................................................................... 103
2.3.2.1 Glycoside Hydrolases (GH) activities ................................................................................................................................. 103
2.3.2.2 Ligninolytic activities ......................................................................................................................................................... 103
2.3.3 Wheat straw compositional analyses ..................................................................................................................... 103 2.3.3.1 Data obtained for ethanol production study and PCA ...................................................................................................... 103
2.3.3.2 Fourier Transform InfraRed (FTIR) spectroscopy .............................................................................................................. 103
2.3.3.3 Crystallinity measurement with X-Ray Diffractometry (XRD) ........................................................................................... 104
Chapter 3. White-rot Fungi selection for pretreatment of lignocellulosic biomass for anaerobic
digestion and impact of glucose supplementation ..................................................................................... 105
3.1 INTRODUCTION ..................................................................................................................................................................... 105 3.2 MATERIAL AND METHODS SPECIFIC TO SELECTION STEP ................................................................................................................. 106
3.2.1 Fungal pretreatment ............................................................................................................................................... 106 3.2.1.1 SSF in 24-well plates ......................................................................................................................................................... 106
3.2.1.2 SSF in columns .................................................................................................................................................................. 107
3.2.2 Anaerobic digestion: samples characterization and normalization of BMP results ................................................ 108 3.2.2.1 Total Carbon (TC) measurements for pretreated samples in columns ............................................................................. 108
3.2.2.2 BMP-tests ......................................................................................................................................................................... 108

3.2.2.3 Normalization of BMP results for samples pretreated in deep-well................................................................................. 108
3.2.3 Impact of nutrient solution amount ........................................................................................................................ 109 3.2.3.1 SSF in deep well ................................................................................................................................................................ 109
3.2.3.2 Acid hydrolysis (Klason lignin, cellulose and hemicelluloses) ........................................................................................... 109
3.2.3.3 Determination of residual glucose .................................................................................................................................... 110
3.3 BMP IMPROVEMENT ............................................................................................................................................................. 110 3.3.1 Straw pretreated in 24-well plates .......................................................................................................................... 110 3.3.2 Straw pretreated in SSF columns ............................................................................................................................. 111 3.3.3 Pretreatments comparison...................................................................................................................................... 113
3.4 INFLUENCE OF STARTER SOLUTION ON PRETREATMENT .................................................................................................................. 113 3.4.1 Fate of the nutrient solution during the pretreatment ........................................................................................... 114 3.4.2 Nutrient solution and wheat straw composition ..................................................................................................... 115
3.4.2.1 Limited delignification ...................................................................................................................................................... 116
3.4.2.2 Carbohydrates consumption ............................................................................................................................................ 117
3.5 CONCLUSION ........................................................................................................................................................................ 119
Chapter 4. Influence of Polyporus brumalis culture parameters for the fungal pretreatment:
optimization step .......................................................................................................................................... 121
4.1 INTRODUCTION ..................................................................................................................................................................... 122 4.2 MATERIAL AND METHODS SPECIFIC TO OPTIMIZATION STEP ............................................................................................................ 122
4.2.1 Fungal pretreatment for anaerobic digestion ......................................................................................................... 122 4.2.1.1 SSF in columns .................................................................................................................................................................. 122
4.2.1.2 BMP-tests ......................................................................................................................................................................... 123
4.2.2 Experimental design ................................................................................................................................................ 124 4.2.2.1 Building of the experimental design ................................................................................................................................. 124
4.2.2.2 Analyze of the experimental design and response variables ............................................................................................ 124
4.2.3 Substrate characterization ...................................................................................................................................... 125 4.2.3.1 Dry matter losses after pretreatment............................................................................................................................... 125
4.2.3.2 Klason lignin, cellulose and hemicelluloses determination by acid hydrolysis ................................................................. 125
4.2.3.3 Lignin losses in pretreated samples compared to Non inoculated Controls (NIC) ............................................................ 125
4.2.3.4 Soluble sugars ................................................................................................................................................................... 125
4.2.3.5 Enzymatic hydrolysis of cellulose: glucose yield ............................................................................................................... 125
4.2.3.6 Real Time Quantitative Polymerase Chain Reaction (qPCR) ............................................................................................. 126
4.3 RELATIONSHIPS BETWEEN ANAEROBIC DIGESTION AND SUBSTRATE CHARACTERISTICS .......................................................................... 127 4.3.1 Methane production results during BMP tests........................................................................................................ 127 4.3.2 Parameters influencing anaerobic degradability .................................................................................................... 129 4.3.3 Negative impact of lignin amount on methane production .................................................................................... 130 4.3.4 Influence of fungal mycelium on CH4 production .................................................................................................... 131 4.3.5 Contribution of cellulose degradation to methane production ............................................................................... 133
4.4 RESPONSE SURFACES FOR METHANE PRODUCTION ........................................................................................................................ 137 4.4.1 Methane production after 6 days ........................................................................................................................... 138 4.4.2 Methane production after 57 days ......................................................................................................................... 139
4.4.2.1 Samples pretreated with metals addition ........................................................................................................................ 139
4.4.2.2 Samples pretreated without metals addition ................................................................................................................... 140
4.4.3 BMP ......................................................................................................................................................................... 141 4.5 CONCLUSION ........................................................................................................................................................................ 143
Chapter 5. Pyrolysis-GC-MS study of White-Rot Fungi pretreated wheat straws for anaerobic
digestion……. ............................................................................................................................................... 145
5.1 INTRODUCTION ..................................................................................................................................................................... 146 5.2 MATERIAL AND METHODS SPECIFIC TO PY-GC-MS STUDY OF PRETREATED STRAWS ............................................................................. 147
5.2.1 Fungal pretreated samples ..................................................................................................................................... 147 5.2.2 Pyrolysis-GC-MS ...................................................................................................................................................... 148
5.2.2.1 Spectra obtaining .............................................................................................................................................................. 148

5.2.2.2 Spectrum analysis and interpretation............................................................................................................................... 149
5.2.3 Characterization of fungal pretreated straws for anaerobic digestion ................................................................... 149 5.2.3.1 Acid hydrolysis (Klason lignin, cellulose and hemicelluloses) with NREL method ............................................................ 149
5.2.3.2 Qpcr .................................................................................................................................................................................. 149
5.2.3.3 BMP-tests ......................................................................................................................................................................... 149
5.2.4 Statistical analysis ................................................................................................................................................... 150 5.2.4.1 Analysis of Variances (ANOVA) ......................................................................................................................................... 150
5.2.4.2 Principal Component Analysis (PCA) ................................................................................................................................. 150
5.3 ORIGIN OF THE MAIN COMPOUNDS FOUND IN PYROLYSATES ........................................................................................................... 150 5.3.1 Fungus characterization .......................................................................................................................................... 150
5.3.1.1 N-containing (N) and unspecific compounds (UN) ........................................................................................................... 151
5.3.1.2 Polysaccharide-derived products (PS) .............................................................................................................................. 152
5.3.1.3 Possible presence of small lignin amount ......................................................................................................................... 152
5.3.2 Straws characterization .......................................................................................................................................... 153 5.3.2.1 Lignin derived pyrolysis products ..................................................................................................................................... 153
5.3.2.2 Polysaccharide-derived products ...................................................................................................................................... 154
5.3.2.3 N-containing compounds .................................................................................................................................................. 155
5.4 COMPARISON BETWEEN PY-GC-MS DATA, OTHER CHARACTERIZATION TECHNICS AND ANAEROBIC DIGESTIBILITY ...................................... 155 5.4.1 Variations of the S/G ratio ...................................................................................................................................... 156 5.4.2 PCA to study relationships between samples characteristics .................................................................................. 158
5.4.2.1 qPCR variable opposed to straw composition variables in the plan 1-2 ........................................................................... 159
5.4.2.2 Correlation between BMP and PS/LIG-pyr or PS/LIG NREL in the plan 1-3 ...................................................................... 160
5.4.3 Fungal biomass (qPCR variable) .............................................................................................................................. 162 5.4.4 Polysaccharides (PS)/Lignin (LIG) ratio determined by py-GC-MS........................................................................... 163
5.5 CONCLUSION ........................................................................................................................................................................ 164
Chapter 6. Solid-State Anaerobic Digestion of wheat straw: impact of substrate/inoculum ratio and
of fungal pretreatment ................................................................................................................................. 165
6.1 INTRODUCTION ..................................................................................................................................................................... 166 6.2 MATERIAL AND METHODS SPECIFIC TO SSAD IN BATCH REACTORS (CHAPTER 6) ................................................................................ 166
6.2.1 Wheat straw pretreatment in a pilot-reactor ......................................................................................................... 166 6.2.2 Solid state Anerobic Digestion in batch ................................................................................................................... 167
6.2.2.1 SSAD reactors design ........................................................................................................................................................ 167
6.2.2.2 Experiment I: tests of several S/I ...................................................................................................................................... 168
6.2.3 Experiment II: fungal pretreatment for SSAD .......................................................................................................... 168 6.2.3.1 Substrates and inoculum .................................................................................................................................................. 168
6.2.3.2 Experimental configuration .............................................................................................................................................. 168
6.2.4 Analytical methods .................................................................................................................................................. 169 6.2.4.1 SSAD monitoring parameters: leachate pH, VFA, alkalinity and biogas composition ....................................................... 169
6.2.4.2 BMP-tests ......................................................................................................................................................................... 169
6.2.4.3 Total Kjeldahl Nitrogen (TKN) ........................................................................................................................................... 170
6.2.4.4 Ammonium concentration in final leachate ..................................................................................................................... 170
6.2.4.5 Final Total Carbon (TC) in digestate .................................................................................................................................. 170
6.2.4.6 Analysis of Variances (ANOVA) ......................................................................................................................................... 170
6.3 EXPERIMENT I: TESTS OF SEVERAL S/I ........................................................................................................................................ 172 6.3.1 Anaerobic digestion of wheat straw: start-up phase progress ............................................................................... 172 6.3.2 TVFA/alkalinity as process stability indicator .......................................................................................................... 174
6.4 EXPERIMENT II: FUNGAL PRETREATMENT FOR SSAD ..................................................................................................................... 177 6.4.1 Substrates anaerobic digestibility ........................................................................................................................... 177 6.4.2 SSAD start-up phase ................................................................................................................................................ 178 6.4.3 Methane production of fungal pretreated straw in SSAD ....................................................................................... 180
6.5 CONCLUSION ........................................................................................................................................................................ 183

Chapter 7. Results overview and general discussion ........................................................................... 185
7.1 AN EFFICIENT PRETREATMENT .................................................................................................................................................. 186 7.2 WRF PRETREATMENT SCALE-UP: THE CONTAMINATIONS CHALLENGE ............................................................................................... 190 7.3 WRF PRETREATMENT FOR ETHANOL AND METHANE PRODUCTION ................................................................................................... 194 7.4 FURTHER RELATIONSHIPS BETWEEN BMP AND SUBSTRATE CHARACTERISTICS..................................................................................... 199
7.4.1 Samples from the optimization step ....................................................................................................................... 199 7.4.2 Samples from the selection step ............................................................................................................................. 201
7.5 OTHER EXPERIMENTAL PROSPECTS ............................................................................................................................................ 207 7.6 CONCLUSION ........................................................................................................................................................................ 209
Chapter 8. Expanded prospects about aerobic fungi and anaerobic digestion and conclusion ...... 211
8.1 COMBINATION OF PRETREATMENTS ........................................................................................................................................... 212 8.2 USE OF OTHER SUBSTRATES ..................................................................................................................................................... 212 8.3 MIXED CULTURE AND STRAIN ENGINEERING ................................................................................................................................ 213 8.4 FUNGAL CULTURE ON DIGESTATE .............................................................................................................................................. 213 8.5 BIOHYDROGEN PRODUCTION .................................................................................................................................................... 214 8.6 PRODUCTION OF EDIBLE MUSHROOMS ....................................................................................................................................... 214 8.7 OTHER APPLICATIONS OF WRF ................................................................................................................................................. 215 8.8 CONCLUSION ........................................................................................................................................................................ 215
References ..................................................................................................................................................... 217
List of annexes .............................................................................................................................................. 240
Annexes ......................................................................................................................................................... 241

13
List of figures
FIGURE 1. POSITIONNEMENT DES OBJECTIFS DE LA THÈSE (LBE EN BLEU) DANS LE CONTEXTE EXPÉRIMENTAL. ............................................................21
FIGURE 2. SCHEME OF THE ANR STOCKACTIF PROJECT, MAIN TASKS AND MAIN ASSOCIATED PARTNERS. ..................................................................29
FIGURE 3. STUDY OF FUNGAL PRETREATMENT FOR WHEAT STRAW ANAEROBIC DIGESTION IN STOCKACTIF PROJECT: DIFFERENT SCALES OF PROCESSES AND
APPLIED OBJECTIVES OF THIS PHD THESIS............................................................................................................................................31
FIGURE 1-1. CONVERSION OF ORGANIC MATTER TO METHANE BY ANAEROBIC DIGESTION. .....................................................................................35
FIGURE 1-2. REPARTITION OF SUPPLEMENTARY VOLUMES AVAILABLE FOR ENERGY PRODUCTION FROM BIOMASS. ......................................................37
FIGURE 1-3. MOLECULAR AND FIBRILLARY STRUCTURE OF CELLULOSE. ...............................................................................................................38
FIGURE 1-4. DIVERSE STRUCTURES PRESENT IN WHEAT STRAW LIGNIN. ..............................................................................................................39
FIGURE 1-5. SCHEMATIC REPRESENTATION OF LIGNOCELLULOSIC BIOMASS COMPOSITION BEFORE AND AFTER ANAEROBIC DIGESTION (AD). ...................41
FIGURE 1-6. EFFECTS OF TOTAL SOLIDS CONTENT ON ANAEROBIC DIGESTION. .....................................................................................................42
FIGURE 1-7. RELATIVE GROWTH RATES OF PSYCHROPHILIC, MESOPHILIC AND THERMOPHILIC METHANOGENS. ..........................................................44
FIGURE 1-8.WHEAT STRAW BIOCHEMICAL METHANE POTENTIAL FROM LITERATURE. ..........................................................................................49
FIGURE 1-9. EXAMPLES OF LEACHATE RECYCLE PATTERNS IN BATCH SYSTEMS. .....................................................................................................51
FIGURE 1-10. THREE MAIN CONTINUOUS REACTOR DESIGNS. ..........................................................................................................................52
FIGURE 1-11. GENERAL CONCEPT OF TWO-STAGE REACTORS. ..........................................................................................................................53
FIGURE 1-12. EVOLUTION OF BIOGAS PRODUCTION WITH REACTION DURATION. .................................................................................................55
FIGURE 1-13. MOST COMMON PRETREATMENT METHODS USED ON WHEAT STRAW AND THEIR POSSIBLE EFFECTS. ....................................................56
FIGURE 1-14. STRATEGIES FOR THE COMBINATION OF ENZYMATIC OR FUNGAL PRETREATMENTS AND ANAEROBIC DIGESTION OF LIGNOCELLULOSIC BIOMASS.
..................................................................................................................................................................................................62
FIGURE 1-15. SCHEMATIC DIAGRAM OF LIGNIN DEGRADATION BY WHITE-ROT FUNGI. ..........................................................................................64
FIGURE 1-16. LIGNIN-CARBOHYDRATES COMPLEX (LCC)................................................................................................................................78
FIGURE 1-17. POSSIBLE REARRANGEMENTS FOR ANISOLE DURING PY-GC-MS. ..................................................................................................89
FIGURE 1-18. FORMATION OF CERTAIN PYROLYSATES FROM CELLULOSE AND GLUCANS. ........................................................................................89
FIGURE 1-19. THE DIFFERENTIAL THERMOGRAVIMETRY (DTG) CURVES OF CORN STALK AND ITS THREE MAIN COMPONENTS. ......................................90
FIGURE 1-20. YIELDS OF MAJOR CARBOHYDRATES, EXPRESSED AS PERCENT OF THE INITIAL DRY WOOD MASS (WEIGHT TOTAL: WT), AS FUNCTIONS OF THE
PYROLYSIS TEMPERATURE. ...............................................................................................................................................................90
FIGURE 1-21. STATIONARY PHASE FOR COLUMN SOLGELWAX, SGE: POLYETHYLENEGLYCOL WITH FUSED SILICA. ......................................................92
FIGURE 1-22. HYPOTHETICAL SCHEME FOR WHEAT LIGNIN STRUCTURE SHOWING PHENOLIC AND ETHERIFIED P-HYDROXYPHENYL (H), GUAIACYL (G) AND
SYRINGYL (S) PHENYLPROPANOIDS UNITS TOGETHER WITH P-COUMARIC (COU) AND FERULIC (FER) ACIDS, THE LATTER INVOLVED IN LIGNIN-
CARBOHYDRATE LINKAGES. ..............................................................................................................................................................94
FIGURE 2-1. METHOD TO FOLLOW METHANE PRODUCTION BY PRESSURE MEASUREMENTS. ...................................................................................99
FIGURE 3-1. THREE STEPS TO INOCULATE WHEAT STRAW FOR CULTURE IN SSF COLUMNS. ................................................................................. 108
FIGURE 3-2. EXPERIMENTAL AND PREDICTED FUNGAL BIOMASS, HOLOCELLULOSE, LIGNIN DURING 14 DAYS PRETREATMENT OF COTTON STALKS BY
PHANEROCHAETE CHRYSOSPORIUM. ............................................................................................................................................... 115
FIGURE 3-3. INFLUENCE OF GLUCOSE ADDITION OR STARTER (GLUCOSE + N SOURCE) ADDITION ON DELIGNIFICATION (ACID INSOLUBLE LIGNIN CONTENT) OF
PRETREATED WHEAT STRAW WITH P. BRUMALIS BRFM 985 AND T. MENZIESII BRFM 1369. .................................................................. 116
FIGURE 3-4. INFLUENCE OF GLUCOSE OR STARTER (GLUCOSE + N SOURCE) ADDITION FOR WHEAT STRAW PRETREATMENT WITH P. BRUMALIS BRFM 985
OR T. MENZIESII BRFM 1369. ..................................................................................................................................................... 118
FIGURE 4-1. CENTERED AND REDUCED REGRESSION COEFFICIENTS WITH THEIR 95% CONFIDENCE INTERVALS FOR THE PREDICTION OF METHANE POTENTIALS
AND PREDICTIVE EQUATION. ......................................................................................................................................................... 129

14
FIGURE 4-2. SIGNIFICANT NEGATIVE CORRELATIONS BETWEEN LIGNIN AMOUNT AND METHANE PRODUCTION WHATEVER THE DURATION OF ANAEROBIC
DIGESTION. ............................................................................................................................................................................... 130
FIGURE 4-3. START-UP PHASE OF BMP-TESTS FOR P. BRUMALIS BRFM985 MYCELIUM, PRETREATED STRAWS WITH METALS ADDITION, NON INOCULATED
CONTROL WITH METALS ADDITION (NIC-M2) AND UNTREATED WHEAT STRAW (UWS). .......................................................................... 131
FIGURE 4-4. QPCR MEASUREMENTS OF FUNGAL BIOMASS ON STRAWS PRETREATED WITH METALS ADDITION. ....................................................... 132
FIGURE 4-5. CORRELATIONS WITH DRY MASS LOSSES (DML). ....................................................................................................................... 133
FIGURE 4-6. RELATIONSHIP BETWEEN METHANE PRODUCTION AND SUGARS IN SUBSTRATE. ................................................................................ 134
FIGURE 4-7. CORRELATION BETWEEN METHANE PRODUCTIONS EXPRESSED PER GRAM OF VS PRETREATED OR PER GRAM OF TS INITIAL. ..................... 137
FIGURE 4-8. RS FOR METHANE PRODUCTION AT DAY 6 (NML/G TSI). ............................................................................................................ 138
FIGURE 4-9. RS FOR METHANE PRODUCTION AT DAY 57 (NML/G TSI). .......................................................................................................... 139
FIGURE 4-10. RS FOR BMP (NML/G TSI). .............................................................................................................................................. 142
FIGURE 5-1. ANALYTICAL PYROLYSIS APPARATUS AND SAMPLE LOADING. ........................................................................................................ 148
FIGURE 5-2. PYROGRAM OF MYCELIUM OF POLYPORUS BRUMALIS BRFM 985. .............................................................................................. 151
FIGURE 5-3. PYROGRAMS COMPARISON OF UNTREATED WHEAT STRAW (UWS) AND FUNGAL TREATED STRAWS. ................................................... 154
FIGURE 5-4. PLAN 1-2 OF THE PCA WITH PYROLYSIS AND OTHER CHARACTERIZATION VARIABLES. ....................................................................... 159
FIGURE 5-5. PLAN 1-3 OF THE PCA WITH PYROLYSIS AND OTHER CHARACTERIZATION VARIABLES. ....................................................................... 160
FIGURE 5-6. CORRELATION BETWEEN TOLUENE (UN1), STYRENE (UN2) AND ETHYLBENZENE (64) (PY-GC-MS) AND FUNGAL BIOMASS (QPCR) FOR
STRAWS PRETREATED WITH WRF. ................................................................................................................................................. 162
FIGURE 5-7. CORRELATION BETWEEN PS/LIG DETERMINED WITH PY-GC-MS OR NREL METHOD AND BMP. ...................................................... 163
FIGURE 6-1. AEROBIC PILOT-REACTOR DESIGN FOR WHEAT STRAW PRETREATMENT WITH POLYPORUS BRUMALIS, BRFM 985. ................................. 167
FIGURE 6-2. SCHEMATIC DIAGRAM OF LABORATORY-SCALE SSAD DIGESTERS. ................................................................................................. 167
FIGURE 6-3. MAIN PARAMETERS OF ANAEROBIC DIGESTION IN FUNCTION OF TIME FOR EXPERIMENT I TESTING SEVERAL S/I RATIO. ........................... 173
FIGURE 6-4. PARAMETERS OF ANAEROBIC DIGESTION DURING THE START-UP PHASE FOR EXPERIMENT II IN FUNCTION OF TIME. ................................ 179
FIGURE 6-5. METHANE PRODUCTIONS FOR EXPERIMENT II. ......................................................................................................................... 181
FIGURE 7-1. STEREOMICROSCOPIC OBSERVATIONS OF THE FUNGAL CONTAMINANT IN THE PILOT-SCALE PRETREATMENT. ......................................... 191
FIGURE 7-2. BMP OF STRAWS (1MM) PRETREATED IN THE LBE PILOT-REACTOR WITH DIFFERENT LEVEL OF CONTAMINATIONS AND COMPARED TO BMP OF
RAW STRAW (1MM). ................................................................................................................................................................... 194
FIGURE 7-3. ENZYMATIC ASSAYS AFTER 21 DAYS OF PRETREATMENT FOR SAMPLES FROM THE SELECTION STEP. ...................................................... 196
FIGURE 7-4. CORRELATIONS BETWEEN BMP AND SUBSTRATE CHARACTERIZATIONS FOR NON INOCULATED WHEAT STRAW AND WRF PRETREATED STRAWS
FROM TABLE 7-2 (SELECTION STEP)................................................................................................................................................ 197
FIGURE 7-5. CHARACTERIZATIONS OF PRETREATED STRAWS USED FOR THE PATENT DEPOSIT. .............................................................................. 198
FIGURE 7-6. CORRELATIONS BETWEEN CELLULOSE, HEMICELLULOSES AND LIGNIN LOSSES FOR SAMPLES FROM THE OPTIMIZATION STEP. ..................... 199
FIGURE 7-7. CORRELATIONS WITH CELLULOSE DIGESTIBILITY FOR SAMPLES PRETREATED IN THE OPTIMIZATION STEP. ............................................... 200
FIGURE 7-8. RELATIONSHIP BETWEEN BMP AND PS/LIG NREL FOR SAMPLES PRETREATED IN THE OPTIMIZATION STEP. ......................................... 201
FIGURE 7-9. PLAN 1-2 OF PCA FOR CHARACTERIZATIONS OF PRETREATED STAWS WITH SEVERAL STRAINS. ............................................................ 203
FIGURE 7-10. PLAN 1-3 OF PCA FOR CHARACTERIZATIONS OF PRETREATED STAWS WITH SEVERAL STRAINS. .......................................................... 205
FIGURE 7-11. PLAN 2-3 OF PCA FOR CHARACTERIZATIONS OF PRETREATED STAWS WITH SEVERAL STRAINS. .......................................................... 206

15
List of tables
TABLE 1. EXTREMA POUR LES SURFACES DE RÉPONSES DE LA PRODUCTION DE METHANE ESTIMÉE PAR TESTS BMP. ....................................................23
TABLE 1-1. ENERGY PRODUCTION FROM WHEAT STRAW. ................................................................................................................................41
TABLE 1-2: INTEREST OF SSAD COMPARED TO WET AD PROCESSES. .................................................................................................................43
TABLE 1-3. IMPACT OF PRETREATMENT ON WHEAT STRAW DIGESTIBILITY. ..........................................................................................................57
TABLE 1-4 (PART 1/2). IMPROVEMENT OF ANAEROBIC DIGESTION OF PRETREATED LIGNOCELLULOSIC SUBSTRATES BY WRF. .......................................71
TABLE 1-5 (PART 1/2). IMPROVEMENT OF IVDMD BY FUNGAL PRETREATMENT OF LIGNOCELLULOSIC BIOMASS........................................................75
TABLE 1-6. ROLE OF PHENOLIC ACIDS ON ANAEROBIC DIGESTIBILITY (IN VITRO AND RUMEN BACTERIA).....................................................................79
TABLE 2-1. SUMMARY OF MAIN ANALYSES PER RESULT CHAPTER AND SCOPE. .................................................................................................. 101
TABLE 2-2. ASSIGNATION OF ABSORPTION BANDS IN FTIR SPECTRA. .............................................................................................................. 104
TABLE 3-1. PERFORMANCE OF PRESELECTED STRAINS FOR ANAEROBIC DIGESTION OF PRETREATED WHEAT STRAW IN DEEP WELL. ............................... 111
TABLE 3-2. BMP, TOTAL CARBON (TC), MASS AND CARBON LOSSES OF STRAW PRETREATED IN COLUMNS WITH DIFFERENT STRAINS. ........................ 112
TABLE 3-3. REMAINING GLUCOSE FOR SEVERAL NUTRIENT SOLUTION AMOUNTS ADDED FOR THE PRETREATMENT OF WHEAT STRAW WITH P. BRUMALIS
BRFM 985 OR T. MENZIESII BRFM 1369. .................................................................................................................................... 114
TABLE 4-1. DOEHLERT DESIGN: CODED VARIABLES FOR EXPERIMENTAL POINTS AND CULTURE PARAMETERS FOR CONTROLS. ..................................... 123
TABLE 4-2. EXPERIMENTAL DOMAIN FOR QUANTITATIVE VARIABLES. .............................................................................................................. 124
TABLE 4-3. METHANE PRODUCTION AND CHARACTERIZATIONS OF PRETREATED AND CONTROL STRAWS. ............................................................... 128
TABLE 4-4. ABSENCE OF INFLUENCE OF AUTOCLAVING AND FREEZE DRYING ON BMP (NML/G VS) OF WHEAT STRAW. ........................................... 128
TABLE 4-5. METHANE PRODUCTION DURING THE BMP TEST EXPRESSED IN NML/G VS AND IN PERCENTAGE OF THE BMP VALUE. ............................ 131
TABLE 4-6. EXTREMA FOR RS OF THE CURRENT STUDY: DML, LIGNIN LOSSES, GLUCOSE YIELD, METHANE PRODUCTION AT DAY 6 AND 57 AND BMP. ... 136
TABLE 4-7. SUMS OF SQUARES FOR REGRESSION AND RESIDUES, STATISTIC F AND P-VALUE ................................................................................ 137
TABLE 5-1. PRETREATED WHEAT STRAWS STUDIED WITH PY-GC-MS. ............................................................................................................ 147
TABLE 5-2. CHARACTERIZATIONS WITH PY-GC-MS, ACID HYDROLYSIS AND QPCR AND BMP OF FUNGAL PRETREATED STRAWS DURING THE SELECTION STEP.
............................................................................................................................................................................................... 157
TABLE 5-3. PYROLYSIS AND CHARACTERIZATION DATA USED FOR PCA FOR SAMPLES FROM THE OPTIMIZATION STEP. ............................................... 161
TABLE 6-1. CHARACTERISTICS OF SUBSTRATES AND INOCULA FOR EXPERIMENT I AND II. .................................................................................... 171
TABLE 6-2. EXPERIMENTAL SET-UP FOR EXPERIMENT I AND II. ...................................................................................................................... 171
TABLE 6-3. ALKALINITY AND TVFA/ALKALINITY WITH TVFA IN G HAC EQ/L ON DAY 1 AND 10 OF THE EXPERIMENT I............................................. 174
TABLE 6-4. STABILITY LIMITS FOR SSAD PROCESS WITH HIGH TVFA/ALKALINITY RATIOS.................................................................................... 176
TABLE 6-5. METHANE PRODUCTION AND FINAL NITROGEN AMOUNT FOR EXPERIMENT II. .................................................................................. 180
TABLE 6-6. ESTIMATION OF ANNUAL METHANE PRODUCTION IN THE CASE OF LIMITED STRAW AMOUNT. .............................................................. 182
TABLE 7-1.VARIATION OF METHANE PRODUCTION FROM P. BRUMALIS BRFM 985 PRETREATED WHEAT STRAWS COMPARED TO CONTROL ACCORDING
PRETREATMENT CONDITIONS. ....................................................................................................................................................... 188
TABLE 7-2. COMPOSITION CHANGES OF PRETREATED WHEAT STRAWS COMPARED TO CONTROL. ......................................................................... 195
TABLE 7-3. CRYSTALLINE CELLULOSE MEASURED WITH XRD AND FTIR FOR FEW SAMPLES FROM THE SELECTION STEP. ............................................ 207
TABLE 8-1. COMBINED WHITE ROT FUNGAL PRETREATMENT AND PHYSICAL/CHEMICAL PRETREATMENT. ............................................................... 212
16
List of abbreviations
3D: 3 dimensions
2w: two weeks (pretreatment duration)
A: arabinose
AAO: aryl-alcohol oxidase.
ABTS: Acide 2,2’-azino-bis (3ethylBenzoThiazoline-6-
Sulphonique)
AD: Anaerobic Digestion
ADD: aryl-alcohol dehydrogenases.
AFEX: Ammonia Fiber EXplosion
Am: Amorphous holocelluloses
ANOVA: ANalysis Of Variance
ANR: Agence Nationale de Recherche
APO: Aromatic PerOxygenase
BBF: Biodiversité et Biotechnologies Fongiques
BMP: Biochemical Methane Potential
BRF: Brown-Rot Fungi
BRFM: Banque de Ressources Fongiques de Marseille,
Bank of Fungal Ressources of Marseille
Cel: Cellulose
CIRM-CF: Centre International de Ressources
Microbiennes-Champignons Filamenteux
cMWS: fungal colonized Miscanthus and Wheat Straw,
and the corresponding batch
COD: Chemical Oxygen Demand
Cri: Crystalline cellulose
CrI: Crystallinity Index
Cs: Cyathus stercoreus
Cster: Cyathus Stercoreus AW 03-72
Csub: Ceriporiopsis subvermispora
d: days
DAVS: Digestion Anaérobie Voie Sèche
DCPIP: 2,6-DiChloroPhenol-IndoPhenol)
DFRC: Derivatization Followed by Reductive Cleavage
DHP: DeHydrogenation Polymer
DML: Dry matter losses
DMSO: DiMethylSulfOxide.
DNA: DeoxyriboNucleic Acid
DNS: DiNitroSalicylic acid method
DOF: Degree Of Freedom
DP: degree of polymerization
Ds: Dichomitus squalens
DTG: Differential ThermoGravimetry
DyP: DYe-decolorizing Peroxidase
ECOSYS: Ecologie fonctionnelle et écotoxicologie des
agroécosystèmes
EDA: EthyleneDiAmine.
EDTA: EthyleneDiamineTetraAcetic acid
Ev. ElectronVolt
FA: ferulic acid
FARE: Fractionnement des Agroressources et
Environnement
FTIR: Fourier-Transform InfraRed
FWS: Fungal pretreated Wheat Straw and the
corresponding batch
G: guaiacyl-lignin units
GC: Gas Chromatography
Gf: Grifola frondosa
GLOX: glyoxal oxidase.
H2O2-GO: H2O2-generating oxidases.
Hc: Hericium clathroides
HCA: Hierarchical Cluster Analysis
Hemi: Hemicelluloses
HPLC: High Performance Liquid Chromatography
HSD: Honest Significant Difference
i. d.: internal diameter
i: initial
IATE: Ingénierie des Agro-polymères et
Technologies Émergentes
Id: lnonotus dryophilus
INRA: Institut National de Recherches
Agronomiques
Ir: Inonotus rheades
ITS (Internal Transcribed Spacer)
IVDMD: In vitro Dry Matter Digestibility
KL: Klason lignin
kPET (Petroleum Equivalent Ton)
LAC: laccases
LB: Lignocellulosic Biomass
LBE: Laboratoire de Biotechnologie de
l’Environnement
LCC: Lignin-carbohydrates complex
LDS: Lignin Decomposing Selectivity
LIG: Lignin
Lig: Lignin
PS1/LIG: PS (Area at 1375 cm−1
) /Lig (1512 cm−1
)
PS2/LIG: PS (1158 cm−1
) /Lig (1512 cm−1
)
LiP: Lignin Peroxidase
LMS: Laccase-mediator system.
LOI: Lateral Order Index
M: Molar mass
MC: Moisture Content
MH: Mzsse Humide
Mip: Manganese independent peroxidase
MnP: Manganese Peroxidase
MS: Mass Spectrophotometry ou Masse Sèche
selon contexte
MWS: Miscanthus pellets and Wheat Straw, and the
corresponding batch
N. A.: Not Available
n: number of samples taken into account
NBO: NitroBenzene Oxidation
NIC: Non-inoculated SSF Control
17
NL: NormoLiters (Liters in Standard conditions for temperature and pressure)
NREL: National Renewable Energy Laboratory
OFMSW: Organic Fraction Municipal Solid Waste
OM: Organic Matter
PC: Phanerochaete chrysosporium
pCA: p-coumaric acid
PCA: Principal Component Analysis
Pci: Pycnoporus cinnabarinus
Pco: Pleurotus cornucopiae
PCS: Peptone Cellulose Solution
Pl : Pleurotus liguatilis
Pro: Protein
PS/LIG: polysaccharides (holocelluloses)/lignin
PS: Polysaccharides
Py-GC-MS: Pyrolysis-Gas Chromatography-Mass Spectrophotometry
Pyr: Pyrolysis
q. s.: quantum satis
qPCR: Quantitative Polymerase Chain Reaction
QR: quinone reductases
RI: Refractive Index
rpm: Revolutions Per Minute
RS: Response surface
RSM: Response surface methodology
RT: Retention Time
S. D.: Standard-Deviation
S/G: synapyl/ guaiacyl-lignin units
S/I: Substrate/Inoculum
S: synapyl-lignin units
SEBAC: Sequential Batch Anaerobic Composting
SGE: SolGelWax
SolSu: Soluble Sugars
Sr: Stropharia rugosoannulata
SSAD: Solid-State Anaerobic Digestion
SSF: Solid-State Fermentation
TC: Total Carbon
Temp: Temperature
Th: Trametes hirsuta AW 03-72
TKN: Total Kjeldahl Nitrogen
TS: Total Solids
TVFA: Sum of Volatile Fatty Acids expressed in acid acetic equivalents
Ua: Uronic acids
UMR: Unité Mixte de Recherche
UR: Unité de Recherche
UWS: Untreated Wheat Straw
VFA: Volatile Fatty Acids
vol: volume
VP: Versatile Peroxydase
VS: Volatile Solids
w: weight
WO: Wet Oxydation
WRF: White-Rot Fungi
wt: weight total
WW/TS: Wet Weight/Total Solid
X: xylose
XRD: X-ray diffractometry

18
List of communications
Patent
Gimbert I, Raouche S, Sigoillot J-C, Zhou S, Carrere H, Rouches E. Brevet FR 1460472 : Prétraitement de biomasses lignocellulosiques par des champignons filamenteux pour la production de bioénergies. 2014.
Publications
Rouches E, Zhou S, Gimbert I, Sigoillot JC, Steyer JP, Carrère H. Prétraitement fongique pour la méthanisation de la biomasse lignocellulosique: premiers résultats du projet stockactif. L’eau, l’industrie les nuisances, Numéro thématique méthanisation/biogaz Octobre 2014, 99-102.
Rouches E, Herpoël-Gimbert I, Steyer JP, Carrere H. Improvement of anaerobic degradation by white-rot fungi pretreatment of lignocellulosic biomass: a review. Renewable & Sustainable Energy Reviews. 2016;59:179–98.
Rouches E, Zhou S, Steyer JP, Carrere H. White-Rot Fungi pretreatment of lignocellulosic biomass for anaerobic digestion: impact of glucose supplementation. Process Biochemistry. In press.
Rouches E, Dignac MF, …, Carrere H. Pyrolysis-GC-MS study of White-Rot Fungi pretreated wheat straws for anaerobic digestion. Journal of Analytical and Applied Pyrolysis. Under writing.
Rouches E, Zhou S, Rancon A, Sergent M, Latrille E, …, Carrere H. Importance of Polyporus brumalis culture parameters to improve anaerobic digestion of fungal pretreated wheat straws. Under writing.
Rouches E, Escudie R, Latrille E, Carrere H. Solid-State Anaerobic Digestion of wheat straw: impact of substrate/inoculum ratio and of fungal pretreatment. Under writing.
Rouches E, Zhou S, … Influence of Polyporus brumalis culture parameters on pretreated wheat straws and their biogas production. Under writing.
Conferences
Carrere H, Passos F, Antonopoulou G, Rouches E, Affes R, Battimelli A, Ferrer I, Steyer JP, Lyberatos, G. Enhancement of anaerobic digestion performance: which pretreatment for which waste? 5th International Conference on Engineering for Waste and Biomass Valorisation (WastenEng14). Rio de Janeiro (Brazil). 2014.
Rouches E, Zhou S, Gimbert I, Sigoillot JC, Steyer JP, Carrère H. Prétraitement fongique de la lignocellulose en méthanisation : criblage. Journées Industrielles Méthanisation (JIM, 4ème edition). Chambéry (France). 2014.
Rouches E, Zhou S, Gimbert I, Steyer JP, Carrere H. Fungal Pretreatment Of Wheat Straw For Anaerobic Digestion. World Congress of Anaerobic Digestion (AD14). Viña del Mar (Chile). 2015.
Rouches E, Escudié R, Loisel D, Latrille E, Carrere H. Combination of white rot fungi pretreatment and batch solid-state anaerobic digestion of wheat straw. 6th International Conference on Engineering for Waste and Biomass Valorisation (WasteEng2016). Albi (France). 2016.

19
Résumé étendu
Le réchauffement climatique, l’épuisement des ressources pétrolières, la compétition entre les cultures
alimentaires et énergétiques et la diminution de la disponibilité des terres arables, sont autant de
challenges mondiaux qui doivent être surmontés à l’heure actuelle. L’utilisation de substrats non-
alimentaires, tels que la lignocellulose, devient donc une nécessité. De plus, la bioraffinerie n’est plus
cantonnée à la production d’énergie puisqu’elle doit aussi fournir des réactifs chimiques ou encore des
matériaux divers.
Le prétraitement de la lignocellulose est une étape clé afin de pouvoir combiner les divers usages. En
effet, les végétaux sont constitués de trois polymères majoritaires : cellulose, hémicelluloses et lignine.
Chacun de ces polymères peut couvrir un besoin. Le prétraitement permet d’isoler les fractions d’intérêt
ou à minima de fragmenter les polymères qui limiteraient la production du produit recherché. Par
exemple, les polysaccharides sont un substrat pour la méthanisation. Ils forment dans la paroi des
végétaux la cellulose et les hémicelluloses. Cependant, la lignine (polyphénols) qui encercle ces
polysaccharides est difficilement dégradable. Rompre la lignine va favoriser l’accès aux sucres et donc
augmenter la production de méthane. Ainsi, le but principal du prétraitement pour la méthanisation va
être la délignification de la matière. Chandler et al. (1980) ont montré qu’un pourcent de lignine
entrainait une baisse de la digestion de la matière organique de l’ordre de 3% (Lesteur et al., 2010).
Cependant, l’application industrielle des prétraitements est peu développée à l’heure actuelle. Elle est
notamment limitée par des coûts de prétraitement excessifs. Les prétraitements sont généralement évalués
par rapport à leur efficacité alors qu’en fait il est plutôt nécessaire d’avoir une balance économique
positive ; c’est-à-dire que l’efficacité mesurable économiquement doit être supérieure aux coûts
additionnels engendrés par le prétraitement. Néanmoins, si la production supplémentaire est en général
facilement mesurable au laboratoire, l’estimation des coûts nécessite souvent des études à grandes
échelles qui sont coûteuses et complexes à mettre en œuvre. Concernant la lignocellulose, l’explosion à la
vapeur et les réactifs alcalins apparaissent comme les prétraitements les plus faisables à l’échelle
industrielle (Hendriks and Zeeman, 2009). La durée requise pour qu’ils permettent un prétraitement
efficace n’est que de quelques heures, voire quelques minutes. Pourtant, le contexte d’application doit
également être pris en compte. En effet, l’explosion à la vapeur qui nécessite l’utilisation de hautes
pressions est encadrée par des règles de sécurités strictes ce qui peut être plus problématique sur une
exploitation agricole individuelle que sur un site industriel déjà soumis à des règlementations.
Finalement, les impacts environnementaux potentiels doivent également être envisagés pour le choix d’un
prétraitement. Par exemple, l’utilisation de produits chimiques nécessite parfois des étapes de
récupération de ces produits qui sont coûteuses. Dans ce contexte, les prétraitements fongiques qui
nécessitent une faible consommation d’énergie et de produits chimiques, et qui présentent donc un intérêt
économique et environnemental, apparaissent intéressants par rapport aux autres types de prétraitements.
Cependant, la durée nécessaire pour obtenir un prétraitement efficace est de plusieurs semaines. D’autres

20
part, certains substrats lignocellulosiques sont stockés durant une longue période d’où l’idée de mettre à
profit cette période de stockage pour effectuer le prétraitement. Cette idée est à l’origine du projet ANR
STOCKACTIF (2012-2016).
Actuellement, une période de stockage (par exemple, pour des pailles) est généralement suivie d’un
prétraitement, puis de la valorisation de la matière. Avec le projet Stockactif un prétraitement fongique
est réalisé durant le stockage. Les enjeux du projet sont de préserver un maximum de potentiel
d’utilisation de la biomasse, d’identifier des conditions de stockage reproductibles et de favoriser la
faisabilité industrielle. Ainsi, le projet s’intéresse à trois formes de valorisation de la biomasse :
bioéthanol, biogaz et phénols. La valorisation en biogaz a été étudiée au Laboratoire de Biotechnologie
de l’Environnement dans le cadre de cette thèse.
Le biogaz, constitué majoritairement de méthane et dioxyde de carbone est produit lors de la digestion
anaérobie de la matière organique par des microorganismes. Alors que le méthane est convertible en
énergie, le résidu solide, appelé digestat, est la plupart du temps valorisable sous forme d’engrais
organique. La paille de blé, substrat modèle largement disponible et qui possède une composition
représentative des biomasses lignocellulosiques (Vassilev et al., 2012), a plus particulièrement été
étudiée. Ce substrat est constitué à 95% de matière sèche, il semble donc logique de se tourner vers des
technologies de digestion anaérobie en voie sèche puisqu’elles permettent la digestion de la matière pour
des teneurs en matière sèche supérieures à 15% (Li et al., 2011). De plus ce choix présente des avantages,
tels que la possibilité de traiter plus de substrat par volume de réacteur d’où des réacteurs moins coûteux.
La technologie batch semble plus adaptée aux exploitations agricoles individuelles par rapport aux
technologies continues. Effectivement, les entrées et sorties moins fréquentes de matière facilitent la
gestion du procédé et les réacteurs sont moins chers.
Afin d’améliorer la digestion anaérobie de la biomasse lignocellulosique, l’objectif principal des
prétraitements doit être la délignification (Monlau et al., 2012). Pour ce faire, les pourritures blanches
sont particulièrement intéressantes. Ces basidiomycètes ont, en effet, un système enzymatique unique qui
leur confère une bonne efficacité pour oxyder la lignine. Les enzymes lignolytiques les plus répandues
sont la laccase, la lignine peroxydase (LiP) et la manganese peroxydase (MnP). Ces dernières possèdent
un noyau hémique alors que la laccase contient du cuivre. La présence nécessaire de manganèse pour le
bon fonctionnement de la manganèse peroxydase peut également être relevée. Les champignons peuvent
être cultivés en milieu solide ou en milieu liquide mais les enzymes lignolytiques sont plus efficaces en
milieu solide et les coûts sont moindres, notamment grâce aux réacteurs moins complexes. Finalement, la
culture en milieu solide va être compatible avec la méthanisation voie sèche. Ce type de culture a donc
été retenu pour les prétraitements fongiques du projet Stockactif.
L’une des problématiques lors d’un prétraitement fongique concerne la perte de matière (sous forme de
CO2) par respiration des champignons. Cette perte de matière peut limiter la rentabilité du procédé. En
théorie, si les pertes de matière sont constituées exclusivement de lignine, la production de méthane par

21
digestion anaérobie de la paille prétraitée va augmenter. En revanche, si les pertes sont constituées
exclusivement de sucres, la production de méthane sera diminuée car il s’agit du substrat de la
méthanisation. Dans la réalité, la lignine et les sucres sont dégradés et, selon les proportions entre ces
deux parties, le prétraitement fongique peut mener à des augmentations ou diminutions de la production
de méthane. L’efficacité du prétraitement requiert donc une délignification sélective du substrat.
Pour ce faire, il est nécessaire de choisir une souche fongique efficace et d’en optimiser les conditions de
culture, ce qui constituait deux objectifs spécifiques de cette thèse. Ce travail a été réalisé en étroite
collaboration avec l’UMR BBF de l’INRA de Marseille (Figure 1). Le dernier objectif spécifique de la
thèse, consistait à accroître l’échelle du prétraitement et de la méthanisation afin de caractériser la
Digestion Anaérobie Voie Sèche (DAVS) de la paille prétraitée. La question scientifique sous-jacente
commune aux objectifs spécifiques était : comment et dans quelles proportions le prétraitement fongique
impacte-t-il la digestion anaérobie de la paille de blé ? Pour répondre à cette question, non seulement la
digestion anaérobie des pailles prétraitées devait être étudiée mais les modifications de la paille prétraitée
devaient être caractérisées. Pour cela, la technique de pyrolyse-GC-MS a notamment été utilisée afin de
déterminer si elle pouvait permettre de mesurer les modifications de la biomasse après prétraitement et
d’évaluer la dégradabilité anaérobie des pailles prétraitées.
Figure 1. Positionnement des objectifs de la thèse (LBE en bleu) dans le contexte expérimental.
Objectifs spécifiques de la thèse
❶ Choix d’une souche d’intérêt
❷ Optimisation du prétraitement
❸ Caractériser la méthanisation voie sèche de paille prétraitée
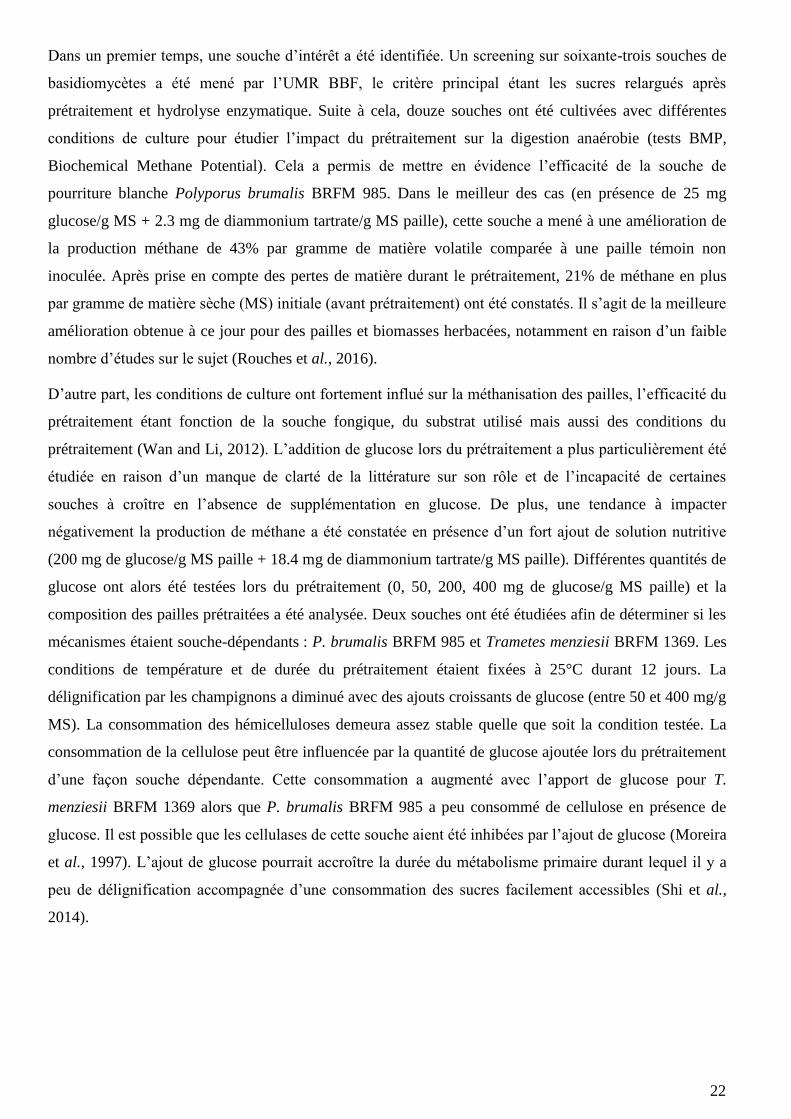
22
Dans un premier temps, une souche d’intérêt a été identifiée. Un screening sur soixante-trois souches de
basidiomycètes a été mené par l’UMR BBF, le critère principal étant les sucres relargués après
prétraitement et hydrolyse enzymatique. Suite à cela, douze souches ont été cultivées avec différentes
conditions de culture pour étudier l’impact du prétraitement sur la digestion anaérobie (tests BMP,
Biochemical Methane Potential). Cela a permis de mettre en évidence l’efficacité de la souche de
pourriture blanche Polyporus brumalis BRFM 985. Dans le meilleur des cas (en présence de 25 mg
glucose/g MS + 2.3 mg de diammonium tartrate/g MS paille), cette souche a mené à une amélioration de
la production méthane de 43% par gramme de matière volatile comparée à une paille témoin non
inoculée. Après prise en compte des pertes de matière durant le prétraitement, 21% de méthane en plus
par gramme de matière sèche (MS) initiale (avant prétraitement) ont été constatés. Il s’agit de la meilleure
amélioration obtenue à ce jour pour des pailles et biomasses herbacées, notamment en raison d’un faible
nombre d’études sur le sujet (Rouches et al., 2016).
D’autre part, les conditions de culture ont fortement influé sur la méthanisation des pailles, l’efficacité du
prétraitement étant fonction de la souche fongique, du substrat utilisé mais aussi des conditions du
prétraitement (Wan and Li, 2012). L’addition de glucose lors du prétraitement a plus particulièrement été
étudiée en raison d’un manque de clarté de la littérature sur son rôle et de l’incapacité de certaines
souches à croître en l’absence de supplémentation en glucose. De plus, une tendance à impacter
négativement la production de méthane a été constatée en présence d’un fort ajout de solution nutritive
(200 mg de glucose/g MS paille + 18.4 mg de diammonium tartrate/g MS paille). Différentes quantités de
glucose ont alors été testées lors du prétraitement (0, 50, 200, 400 mg de glucose/g MS paille) et la
composition des pailles prétraitées a été analysée. Deux souches ont été étudiées afin de déterminer si les
mécanismes étaient souche-dépendants : P. brumalis BRFM 985 et Trametes menziesii BRFM 1369. Les
conditions de température et de durée du prétraitement étaient fixées à 25°C durant 12 jours. La
délignification par les champignons a diminué avec des ajouts croissants de glucose (entre 50 et 400 mg/g
MS). La consommation des hémicelluloses demeura assez stable quelle que soit la condition testée. La
consommation de la cellulose peut être influencée par la quantité de glucose ajoutée lors du prétraitement
d’une façon souche dépendante. Cette consommation a augmenté avec l’apport de glucose pour T.
menziesii BRFM 1369 alors que P. brumalis BRFM 985 a peu consommé de cellulose en présence de
glucose. Il est possible que les cellulases de cette souche aient été inhibées par l’ajout de glucose (Moreira
et al., 1997). L’ajout de glucose pourrait accroître la durée du métabolisme primaire durant lequel il y a
peu de délignification accompagnée d’une consommation des sucres facilement accessibles (Shi et al.,
2014).

23
Etant donné l’importance des conditions de culture, une optimisation du prétraitement avec la souche P.
brumalis BRFM 985 a été menée afin de maximiser la production de méthane et de comprendre
l’influence des conditions de culture sur le substrat et sa méthanisation. Un plan d’expérience de Doelhert
a été réalisé par l’UMR BBF, consistant à tester la Masse Humide (MH)/MS paille initiale en début de
prétraitement (de 2.1 à 4.5 g/g), la durée (entre 10 et 20 jours) et la température de culture (entre 20 et
30°C). Finalement, l’ajout ou non d’une solution de métaux (Cu2+
, Fe2+
, Mn2+
à raison de 0,9 mM/g MS
paille), supposée favoriser l’activité des enzymes lignolytiques (Salvachúa et al., 2013), a également été
testée. P. brumalis BRFM 985 pouvant croître sans glucose et le glucose représentant un coût additionnel
potentiellement important, le plan d’expérience a été mené en l’absence de supplémentation en glucose.
Après méthanisation des pailles prétraitées, les surfaces de réponses de la production de méthane en NmL
de CH4/g MS initiale (prise en compte des pertes de matière) ont été tracées. Celles-ci ont montré un fort
impact positif de l’ajout de métaux lors du prétraitement sur la méthanisation (parfois plus de 30
NmL/g MS initiale (i) supplémentaires avec métaux). La durée de culture a également fortement
influencé la production de méthane avec une production minimisée aux environs de 15 jours de
prétraitement et maximisée (ou presque) pour de courtes durées de culture (≈11 j) (Table 1). En présence
de métaux, la meilleure production de méthane a été obtenue pour de longues durées de culture (≈20 j).
Table 1. Extrema pour les surfaces de réponses de la production de methane estimée par tests
BMP. Metaux
Durée
(j) MH/MS
Température
(°C) BMP maximum calculées
(NmL CH4/g MSi) BMP minimum calculées
(NmL CH4/g MSi)
Oui 11,37 4,00 27,84 206
Oui 19,99 3,22 25,04 213
Non 10,31 3,74 25,85 185
Non 19,54 2,98 22,91 169
Oui 13,48 3,18 19,31 142
Non 14,92 3,81 19,42 141
L’humidité initiale de la paille ainsi que la température de culture se sont révélées moins influentes
(moins de 10 NmL/g MS i, avec les autres conditions fixées). A l’avenir, il est donc possible de fixer ces
paramètres pour approfondir l’étude de la durée de culture pour laquelle le domaine expérimental trop
restreint n’a pas permis de mettre en évidence l’optimum de la production de méthane. En outre, la
meilleure amélioration constatée après prise en compte des pertes de matière n’était que de 5% (contre
20% précédemment). Il est possible que l’ajout d’une légère quantité de glucose lors de l’étape de
sélection précédente ait été un facteur déterminant pour l’efficacité du prétraitement (possible inhibition
des cellulases de P. brumalis).
Afin de mieux expliquer l’influence des paramètres du prétraitement sur la production de méthane,
d’autres surfaces de réponse ont été tracées à partir des caractérisations de matière effectuées par l’UMR
BBF. L’addition de métaux a permis en moyenne 5% MS de pertes de lignine en plus, d’où leur impact
positif sur la production méthane. En revanche les métaux n’ont pas influencé les pertes totales de

24
matière. Celles-ci augmentaient avec la durée du prétraitement. Pour de longues durées de culture, à
pertes de matières égales, la proportion de lignine consommée était plus importante en présence de
métaux que sans. Ceci expliquerait le maximum observé pour de longues durées de culture avec métaux.
D’autre part, une importante et rapide digestibilité anaérobie pour la biomasse fongique a été montrée.
Quelques mesures de biomasse fongique sur la paille prétraitée démontrent une très légère influence
positive de la biomasse fongique sur la production de méthane des pailles prétraitées. De plus, le
rendement glucose après hydrolyse enzymatique a été positivement corrélé à la production de méthane
après prétraitement mais etait surtout négativement corrélé à la teneur en lignine de la paille (R² = 0,95).
Des pyrolyses-Chromatographies Gazeuses-Spectrophotometries de Masse (py-GC-MS) ont en outre été
effectuées à l’UMR EcoSYS avec diverses pailles prétraitées. Cette technique semi-quantitative est
considérée comme rapide, sensible et reproductible (Galletti and Bocchini, 1995). De plus, elle fournit
des informations sur des composés divers (protéines, lignine, sucres…). En utilisant une large gamme de
teneur en lignine, des études ont établi une corrélation entre la lignine Klason et la lignine déterminée par
py-GC-MS (Alves et al., 2006; Fahmi et al., 2007; Ross & Mazza, 2011).
L’étude du mycelium de P. brumalis BRFM 985 par Py-GC-MS a montré qu’il était majoritairement
constitué de sucres et de protéines d’où sa bonne dégradabilité anaérobie. Le glucose a été identifié
comme un élément majoritaire des polysaccharides du mycelium. Des hypothèses sur la composition en
acides aminés de P. brumalis BRFM 985 ont également pu être formulées, avec une part supposée
conséquente de phénylalanine et tyrosine. Cette hypothèse provenait de la présence importante de toluène
et styrène dans le pyrolysat du mycelium qui peuvent dériver des acides aminés évoqués. L’aire relative
de ces composés sur les pyrolysats des pailles prétraitées a été corrélée à la biomasse fongique déterminée
par qPCR de ces pailles (R² entre 0,7 et 0,8). Cette corrélation a montré que la Py-GC-MS pourrait
permettre une estimation de la biomasse fongique sur des pailles de blé prétraitées avec différentes
souches de pourritures blanches dans des conditions identiques.
Au regard de l’absence de corrélation entre la lignine (LIG) déterminée par Py-GC-MS avec la lignine
obtenue par la technique plus usuelle d’hydrolyse acide (LIG NREL), il semblait pertinent d’étudier le
ratio polysaccharides/lignine (PS/LIG) déterminé par Py-GC-MS pour le comparer à celui obtenu par
hydrolyse acide (PS/LIG NREL). Cependant, ces deux ratios n’étaient pas corrélés. En revanche, le ratio
PS/LIG obtenu par Py-GC-MS était corrélé à la production de méthane des pailles prétraitées (R² = 0,6),
de même que PS/LIG NREL (R² = 0,6). Cela montre que le ratio PS/LIG pourrait être un bon indicateur
de la dégradabilité anaérobie de pailles de blé prétraitées dans les mêmes conditions avec différentes
souches. Cet indicateur pourrait être déterminé par Py-GC-MS et permettrait une pré-sélection des
souches. D’autres expériences sont requises pour savoir dans quelles mesures ce ratio pourrait être utilisé
avec d’autres types d’échantillons prétraités fongiquement (autres substrats, autres conditions de
culture…).

25
Finalement, la Digestion Anaérobie par Voie Sèche (DAVS) de la paille de blé a été étudiée en réacteurs
batch de 6 L. Cela a permis un accroissement de l’échelle d’étude de la digestion anaérobie qui était
jusqu’alors effectuée en voie liquide en fiole de 600 mL (tests BMP). Dans une première expérience, le
ratio substrat/inoculum (S/I) adéquat a été déterminé afin de traiter le plus de substrat possible tout en
évitant les problèmes d’acidification. L’acidification provient d’une accumulation d’Acides Gras Volatils
(AGV) suite à un apport de substrat trop conséquent. Une forte acidification peut mener à une longue
période d’inhibition de la production de méthane car les microorganismes méthanogènes fonctionnent
préférentiellement à des pH neutres. Le choix d’un ratio S/I adéquat permet donc de d’assurer une
production de méthane maximale par volume de réacteur. Pour la paille de blé, un S/I compris entre 2 et 4
(en matières volatiles) semble bien adapté à la DAVS. Alors qu’en voie liquide des ratios AGV/alcalinité
inférieurs à 0.6 correspondent à des réacteurs stables, cette limite pourrai être inadaptée à la DAVS. Il a
été observé que pour un ratio AGV/alcalinité inférieur à deux et avec une concentration d’AGV dans les
lixiviats inférieure à 10 g/L, la production de méthane pouvait être rétablie après une acidification.
Dans une seconde expérience, l’échelle du prétraitement a été accrue (de 20 g MS à 400 g MS) et bien
que le substrat utilisé fût toujours stérile, le réacteur de prétraitement ne l’était pas. En l’état des
connaissances actuelles, le travail à grande échelle dans des conditions stériles seraient, en effet, coûteux
et peu pratique. Après plusieurs tentatives, de la paille prétraitée avec P. brumalis BRFM 985 a été
obtenue, celle-ci ne présentait pas de contaminations visibles à l’œil nu mais de larges zones non
prétraitées. Cette paille prétraitée a été digérée en DAVS, ce qui a montré une légère amélioration de sa
biodegradabilité par comparaison aux témoins ainsi qu’un démarrage de la méthanisation facilité (peu
d’acidification). Cependant, après prise en compte des pertes de matière (de l’ordre de 20%), le
prétraitement s’est révélé inefficace probablement en raison de conditions de culture non optimales.

26
Pour conclure, il faut rappeler qu’une bonne amélioration de la production de méthane après prise en
compte des pertes de matières lors du prétraitement a été obtenue (de l’ordre de 20%). Cette amélioration
provenait d’une délignification importante par P. brumalis BRFM 985 ainsi que d’une certaine
conservation de la cellulose en présence d’une légère quantité de glucose (25 mg/g MS). Finalement, une
diminution importante de la cristallinité de la cellulose (≈ 50 % de cellulose cristalline en moins) a
également été mesurée dans ces conditions. Une telle diminution est reconnue dans la littérature comme
un facteur favorisant la production de méthane même si l’impact des pourritures blanches sur la
cristallinité de la cellulose est peu caractérisé dans la littérature (Rouches et al., 2016).
Le prétraitement par pourritures blanches est largement étudié pour la production de bioéthanol mais il a
été peu caractérisé pour la production de biométhane. Par exemple, bien que constituant des points
importants pour l’efficacité du prétraitement, les conditions de culture ou les pertes de matières sont
rarement discutées dans les études dédiées. Les travaux de cette thèse soulignent: (i) la nécessité
de prendre en compte les pertes de matière durant le prétraitement pour en évaluer son efficacité ; (ii)
l’importance de l’étude des conditions de culture pour l’évaluation des souches fongiques ; (iii) le besoin
de recherche pour favoriser le prétraitement fongique d’un substrat en conditions non stériles. Diverses
études restent nécessaires pour envisager une exploitation industrielle du procédé, comme par exemple
l’évaluation des coûts d’un prétraitement fongique à grande échelle.
Finalement diverses perspectives plus larges peuvent être envisagées. La combinaison d’un prétraitement
fongique avec un prétraitement non-biologique pourrait permettre un gain de temps par rapport à un
prétraitement fongique seul ainsi qu’un prétraitement plus économique par rapport à un prétraitement
non- biologique seul. Certains auteurs rapportent d’ailleurs une amélioration de la délignification suite à
une telle combinaison de prétraitement (Wan and Li, 2012). La combinaison de plusieurs souches pourrait
également avoir un effet synergique sur la délignification (Sundman and Näse, 1972). Finalement, l’étude
d’autres substrats (comme le fumier de cheval) ou d’autres usages (comme la production de
biohydrogène) après prétraitement fongique représente également une importante perspective.

27
Introduction
“Human influence on the climate system is clear, and recent anthropogenic emissions of greenhouse gases
are the highest in history. Recent climate changes have had widespread impacts on human and natural
systems.” Global warming increases the intensity and frequency of extreme climatic events (heat waves,
floods, storms). Without modification of our lifestyles, ecosystems will be deeply modified leading notably
to food and water shortages and diseases development. Use of fossil fuels releasing greenhouse gases has a
major impact in those phenomena (Pachauri et al., 2014). Moreover with petrol, there is a frequent reliance
to foreign energy and its depletion implies regularly rising prices, recourse to renewable energy is also
interesting from an economical point of view (Mohan et al., 2006).
To be sustainable and avoid increasing starvation, energy production must favor substrates that do not
compete with food production; as with increasing population, global food production must be very efficient
although facing the diminishing of fertile farmlands (erosion and degradation of soils, urbanization…)
(Ehrlich et al., 1993). Consequently, emerging second generation biorefineries are based on non-edible
lignocellulosic substrates (Frigon and Guiot, 2010). This approach also allows a greater net energy
generation per area of land (Hallac et al., 2009). Valorization of materials previously considered as wastes
becomes possible. Waste management is also an important concern as it can be illustrated by the legislation
for wastes reduction of the European Union (Directive n° 2008/98/CE).
Thus, lignocellulosic biomass (LB) is a choice substrate for energy production because it is renewable,
widely available and rich in sugars (55-75% dry matter) (Wan & Li, 2012). Crop residues, such as straw,
must be preferred since they generate a limited competition for land use with food. Lignocellulosic biomass
is principally constituted by cellulose, hemicelluloses (carbohydrates) and lignin (phenols). Lignin
hydrolysis is difficult (Grabber, 2005; Karunanandaa et al., 1995; Monlau et al., 2013). Consequently,
carbohydrates are less accessible for energy production owing to interactions and linkages with lignin
forming the Lignin Carbohydrates Complex (LCC). Furthermore, other parameters such as the cellulose
crystallinity increase cell-wall robustness and restrain the biodegradation (Monlau et al., 2012a). Several
pretreatments of lignocellulosic biomass have been studied to overcome those bottlenecks (Shah et al.,
2015). The main goal is to break down linkages between polysaccharides and lignin to increase their
conversion yield into renewable fuels production.
Pretreatments, especially physical (grinding…) and thermo-chemical (acid, steam explosion…) constitute
an expensive step representing a significant barrier to the marketing of bioenergy production processes.
They also can generate large amounts of wastes. Moreover, the European Directive 2009/28/EC requires
environmental performance for renewable fuels and it is the whole life cycle that needs to be investigated.
Although less studied, biological pretreatments (fungi, enzymes, etc.) have significantly less inconvenience.
In particular, the use of fungal pretreatments enables economical gain notably by low energy (ambient
Introduction
28
temperature) and chemicals requirements.. They are also less expensive than enzymatic treatments
necessitating enzymes production and extraction steps. Furthermore, fungi have environmental benefits with
low inputs and outputs (inhibitors and wastes). Among fungi, White-Rot Fungi (WRF) are considered as the
most efficient microorganisms to delignify a substrate. However, fungal pretreatments are not only strain
and substrate dependent but culture conditions also highly influence their efficiency (Wan and Li, 2012).
Moreover, they require several weeks for the establishment of a sufficient fungal population to significantly
alter the substrate.
To circumvent this inconvenient and as high organic matter losses can occur during storage period
(Herrmann et al., 2011), the idea to use the storage period to pretreat the substrate is the object of the ANR
STOCKACTIF project. This project concerns the growth of ligninolytic fungi under solid-state
fermentation (SSF). The main advantage is lower costs with SSF than with liquid culture (less aeration,
heating, agitating) (Tian et al., 2012). The Stockactif project is motivated by a potential receptivity to
innovation for industries owing to the relatively recent interest towards lignocellulosic biomass. The desired
fungal pretreatment must, among others, limit the hydrolysis of carbohydrates polymers (cellulose and
hemicelluloses). Carbohydrates are the substrate for fuels production and their consumption by fungi would
lead to a lower biofuel production. Project challenges are to preserve a maximum of "biomass use
potential" (bioethanol, biogas and building blocks); to identify reproducible storage conditions and to
promote the industrial feasibility (cost minimization, etc.).
Several research and industrial partners took part in this project (Figure 2). BBF UMR (Unité Mixte de
Recherche Biodiversité et Biotechnologie Fongiques), INRA of Marseille, was implied in all aspects
concerning fungal culture. FARE UMR (Fractionnement des Agroressources et Environnement), research
unity of INRA in Reims studied the bioethanol production from fungal pretreated miscanthus (a bioethanol
dedicated culture). LBE UR (Unité de Recherche Laboratoire de Biotechnologie de l’Environnement), or
INRA of Narbonne, worked on anaerobic digestion of fungal pretreated wheat straw (particularly through
this thesis). To better characterize the structure and composition of the pretreated wheat straw, pyrolysis-
GC-MS (Gas Chromatography-Mass Spectrophotometry) and 3D spectrophotometry technics were used
thanks to ECOSYS UMR (Ecologie fonctionnelle et écotoxicologie des agroécosystèmes), INRA of Grignon
and the company Envolure (Montpellier), respectively. In order to favor industrial feasibility, IATE UMR
(Ingénierie des Agro-polymères et Technologies Émergentes), INRA of Montpellier, studied the grinding of
fungal pretreated biomass and the association Solagro (Toulouse) led a technico-economical study (potential
costs, existing industrial processes…). Finally two industrial partners will allow the realization of an
industrial trial (two tons of wheat straw) at the end of the project (March 2016). It will be carried out by
Vivescia, a large agricultural cooperative of Champagnes-Ardennes and Groupe Soufflet, an international
society working on solid-state fermentation. Vivescia will organize the large scale anaerobic digestion
whereas Soufflet will pretreat straw for the industrial trial.

Introduction
29
Figure 2. Scheme of the ANR Stockactif project, main tasks and main associated partners.
P
Anaerobic digestion consists in the degradation of organic matter to biogas (mainly CO2 and CH4) thanks
to microorganisms and presents several advantages. Among them, the final solid residue (called digestate)
can often be valorized as fertilizer (rich in available N, P, K) (Tambone et al., 2010) and methane produced
has several applications (heat, electricity, biofuel, injection in gas grid). Methane is generally burnt to
produce heat and be converted in electricity thanks to an Internal Combustion Engines. The combustion
releases CO2 that will not increase greenhouse effect as the carbon has been recently removed from the
atmosphere by plant uptake, to be soon released in the atmosphere by methane use. Methane is a storable
energy that can be used for fluctuating demands. Compared to the majority of liquid biofuels in use today
(biodiesel and bioethanol), biogas production from lignocellulosic residues has far better performance
regarding life cycle emissions, energy recovered per hectare and energy efficiency (ratio of energy produced
to energy input for the production and conversion of biomass) (Börjesson and Mattiasson, 2008). In term of
waste management, diverse advantages are also reported such as low odor emissions, effective pathogens
removal and valorization of organic matter (Ward et al., 2008). However, some precautions must be taken
for the exploitation of anaerobic digesters such as operators training or reactor tightness. It can also be
difficult to provide the important investment capacity required or to ensure a lasting wastes supply
(ADEME, 2011).

Introduction
30
Solid State Anaerobic Digestion (SSAD), working with more than 15% Total Solid, is particularly adapted
to the digestion of dry crop residues such as straw. Farm SSAD processes, less expensive and simpler (Li et
al., 2011), are at present facing a fast development in France.
This PhD work focusses on the anaerobic digestion of fungal pretreated wheat straw. The substrate chosen
for anaerobic digestion production is wheat straw since it is: i) an experimental model because the
composition of the organic matter (VS) is representative of herbaceous biomass (Vassilev et al., 2012); ii)
the main crop residues in Europe and the second worldwide (Talebnia et al., 2010); iii) a biomass that can
overcome the problem of feedstock seasonality in biogas plants.
The main parameter to characterize a substrate for anaerobic digestion is its Biochemical Methane Potential
(BMP) value. This value is obtained with BMP tests that consist to anaerobically digest the substrate under
optimal conditions in order to determine the maximal methane production of this substrate: the BMP value.
BMP tests allow to compare lot of different conditions but they are not sufficient to predict full-scale
performance (Carlsson et al. 2012). Anaerobic digestion with higher substrate amount in conditions closest
to industrial processes is required to validate and transpose results to higher scale. It is especially the case
when Solid State Anaerobic Digestion (SSAD) is applied. Both BMP tests and study in SSAD reactors were
carried out on fungal pretreated wheat straw in the current work. This work was realized in close
collaboration with several partners; and in particular, BBF team, since most pretreatments were realized by
Simeng Zhou, a PhD student from BBF (Figure 2).
Three main applied objectives were fixed in link with the project tasks (Figure 2):
i) choice of an efficient fungal strain based on anaerobic degradability of pretreated straws (selection step);
ii) with the retained strain, determination of fungal culture conditions maximizing methane production from
the pretreated substrate (optimization step);
iii) to provide necessary elements for scale-up (industrial trial) by studying SSAD of pretreated straw.
The scientific question common to the three applied objectives was: how and in what proportion do fungal
pretreatments impact anaerobic digestion of wheat straw? To answer this question, not only anaerobic
digestion of pretreated straws must be investigated but it is also necessary to characterize wheat straw
modifications (composition, structure…). For this purpose, it was notably investigated if Pyrolysis-GC-MS
technic can provide information to study anaerobic degradability of pretreated straws.
The state of the art, in Chapter 1, particularly emphasizes substrate modifications by white-rot fungi
susceptible to improve its anaerobic digestibility. Results chapters 3, 4 and 6 directly aimed to answer to
applied objective whereas in Chapter 5 it was attempted to use the py-GC-MS characterization technic to
assess pretreatment efficiency. Material and methods specific to each results chapter are detailed in the
corresponding chapters whereas global experimental strategy with most common methods are presented in
Chapter 2. Finally, a general discussion and expanded prospects are provided in Chapter 7 and Chapter 8,
respectively.

31
RA W
M A T E R I A L S
APPLIED OBJECTIVES OF THIS PhD THESIS For anaerobic digestion application: ❶ Choice of an interesting fungal strain for the pretreatment
❷ Optimization of pretreatment conditions
❸ Investigation of fungal pretreated substrate behavior in
SSAD reactors for industrial trial P R E A T R E A T M E N T
(Fu n g a l c u l t u r
e)
ANAE ROB I C
D I G E S T I ON
Figure 3. Study of fungal pretreatment for wheat straw anaerobic digestion in Stockactif project:
different scales of processes and applied objectives of this PhD thesis.
Lab-scale (6L reactor): 200 g straw
Biochemical Methane Potential (600 mL): 1.3 g straw
Semi-industrial scale : 2 T straw
White-rot fungi Lignocellulosic biomass
Semi-industrial scale : 2.5 T
straw
20 cm
Miniaturized scale (deep-well): 100 mg straw/well
Lab-scale (glass column): 20 g straw/columns
10 cm
Semi-industrial scale : 2.5 T straw ❶
❷
Pilot-scale (Fongitron): 400 g straw
❸
Water tank for air moisture
Aerobic reactor
Monitoring


33
Chapter 1.
Literature review
This chapter provides, firstly, general information about anaerobic digestion with a focus on solid-state
anaerobic digestion. Lignocellulosic residues are also defined (availability, composition, energy use). Then,
overview of lignocellulosic pretreatments for anaerobic digestion is presented with a special emphasizes on
biological pretreatments and white-rot fungi (WRF) in particular (enzymatic mechanisms and culture
parameters). Finally, a detailed bibliographic study on anaerobic digestibility improvement using WRF was
carried out (and published in Renewable & Sustainable Energy Reviews, 2016: 59, 179-198 ). It focuses on
quantitative aspects, e.g. methane improvement, but also on qualitative aspects, i. e. lignocellulosic
structures modifications. The last part of this chapter is dedicated to Pyrolysis-Gas Chromatography-Mass
Spectrophotometry to study lignocellulosic biomass (principle, relevance…).
Table of content o
1.1 ANAEROBIC DIGESTION ............................................................................................................................................................. 34 1.1.1 A four steps biological reaction ................................................................................................................................. 34 1.1.2 Anaerobic digestion of lignocellulosic crop residues ................................................................................................. 36 1.1.3 Solid-State Anaerobic Digestion: definition, advantages and limits ......................................................................... 42 1.1.4 Main parameters influencing anaerobic digestion ................................................................................................... 44 1.1.5 Anaerobic digestion processes .................................................................................................................................. 47
1.2 PRETREATMENTS FOR ANAEROBIC DIGESTION ................................................................................................................................ 54 1.2.1 Non-biological pretreatments ................................................................................................................................... 56 1.2.2 Biological treatments ................................................................................................................................................ 59
1.3 ENZYMATIC MECHANISMS OF WRF AND CULTURE PARAMETERS ....................................................................................................... 64 1.3.1 Enzymatic degradation by WRF and Solid-State Fermentation (SSF) ........................................................................ 64 1.3.2 Cultivation parameters for Solid-State Fermentation (SSF) ...................................................................................... 66
1.4 QUANTIFICATION OF ANAEROBIC DIGESTIBILITY IMPROVEMENT AFTER WRF PRETREATMENT .................................................................. 69 1.4.1 Anaerobic digestion studies with WRF pretreatment ............................................................................................... 69 1.4.2 In Vitro Dry Matter Digestibility (IVDMD) studies ..................................................................................................... 73
1.5 PARAMETERS OF LIGNOCELLULOSIC BIOMASS INFLUENCING ITS ANAEROBIC DEGRADABILITY .................................................................... 77 1.5.1 Polymers composition and enzymatic accessibility ................................................................................................... 77 1.5.2 The lignin-carbohydrates complex (LCC): linkages and derived compounds ............................................................. 77 1.5.3 Influence of histology ................................................................................................................................................ 80
1.6 QUALITATIVE EFFECTS OF FUNGAL PRETREATMENT ON ANAEROBIC DIGESTIBILITY .................................................................................. 82 1.6.1 Modifications of lignin: G/S (guaiacyl/synapyl) ratio ................................................................................................ 82 1.6.2 Cellulose digestibility improvement .......................................................................................................................... 82 1.6.3 Changes in hemicelluloses X/A (xylose/arabinose) ratio and acetate ....................................................................... 83 1.6.4 Increase of porosity ................................................................................................................................................... 83 1.6.5 Actions of WRF on lignin-carbohydrates complex (LCC) linkages ............................................................................. 83 1.6.6 Release of lignocellulosic polymers main constituents ............................................................................................. 84 1.6.7 Influence of histology: fungal degradation at cell scale ............................................................................................ 85
1.7 PYROLYSIS-GAZ CHROMATOGRAPHY-MASS SPECTROPHOTOMETRY (PY-GC-MS): A POWERFUL TOOL FOR STRUCTURE ANALYSIS .................. 87 1.7.1 Definition and interest .............................................................................................................................................. 87 1.7.2 Pyrolysis products (pyrolysates) ................................................................................................................................ 88 1.7.3 Various existing technologies for Py-GC-MS ............................................................................................................. 91 1.7.4 Py-GC-MS compared to chemical methods to study lignin structure ........................................................................ 92
1.8 CONCLUSION .......................................................................................................................................................................... 95
Literature review
34
1.1 Anaerobic Digestion
Anaerobic digestion is a biological reaction encountered in all environments where there is organic matter in
absence of oxygen, and where the physicochemical conditions are compatible with living microorganisms:
marshes, rice fields, intestines, etc. (Moletta, 2008)
1.1.1 A four steps biological reaction
Anaerobic digestion (AD) can be divided in four main steps, namely hydrolysis, acidogenesis,
acetogenesis, and methanogenesis (Figure 1-1), each one involving a specific group of microorganisms (blue
rectangles on Figure 1-1). Firstly during the hydrolysis step, complex organic molecules (proteins, lipids
and carbohydrates) are hydrolyzed into soluble monomers (simple sugars, amino acids, and fatty acids).
Hydrolytic bacteria secrete extracellular enzymes. Even if population doubling times reach only few hours,
this step is generally considered as rate-limiting for solid wastes (Moletta, 2008). Substrate accessibility to
enzymes can be difficult, especially for lignocellulosic substrates (Taherzadeh and Karimi, 2008). Thus,
improvement of this accessibility can be required (pretreatments, mixing, etc.).
Acidogenesis occurs after hydrolysis or in parallel, fermenting bacteria absorb products of hydrolysis and
convert them into Volatile Fatty Acids (VFA), alcohols, hydrogen and carbon dioxide. In steady state
anaerobic digestion, main products are acetate, carbon dioxide and hydrogen that can directly be used by the
methanogens. Acidogenesis is rapid, even the fastest step for degradation of complex organic matter in
liquid phase digestion (Merlin Christy et al., 2013). Thus, it can lead to acids and/or hydrogen accumulation.
Those products may be responsible for anaerobic digestion failure inhibiting acetogens and methanogens if
not enough numerous.
Hydrolytic and fermenting bacteria are obligate or facultative anaerobes. Genus of implied bacterias are
numerous and depend on operating conditions (substrate, pH, temperature, etc.): Clostridium, Bacillus,
Pseudomonas, etc. (Moletta, 2008)
During acetogenesis takes place the conversion of the acidogenic products (mainly VFA) into acetic acid,
hydrogen and carbon dioxide. Syntrophic acetogens are obligate hydrogen-producing bacteria but require
low hydrogen partial pressure and therefore a syntrophic association with hydrogen consuming methanogens
is required. They are slow growing (few days of population doubling time). Then, homoacetogens produce
acetate (C2H3O2) by cleavage of organic molecules or by reduction of CO2 with H2. Corresponding genus
are: Syntrophomonas, Syntrophococcus, Butyribacterium, Acetoanerobaiuum, etc.
Finally, methane formation occurs during methanogenesis thanks to Archaea microorganisms
(Methanohalobium, Methanocaldococcus, etc.). They are obligate anaerobes and can be divided into
acetoclastic and hydrogenophilic methanogens. Their population doubling times are between 3 hours to
several days. As they grow much slower than acidogenic bacteria, an imbalance in the process can occur,

Literature review
35
leading to acidification and finally, ending the anaerobic digestion (Vavilin and Angelidaki, 2005).
Hydrogenophilic methanogens use specifically CO2 and H2 and live in association with other fermentative
microorganisms. The consumption of H2 gives them a central role in the whole reaction equilibrium.
Acetoclastic methanogens have several substrates such as methanol, formate, methylamine, CO2 and H2 but
the most common is acetate. Words ‘methylotroph methanogens’ are sometimes employed to designate
organisms using methanol and methylamine. Acetoclastic methanogens generate more than 70% of methane
produced. They are less resistant to environmental changes than hydrogenophilic (Merlin Christy et al.,
2013; Moletta, 2008). Final product of anaerobic digestion, called biogas, is mainly composed of methane
(55-75 vol %) and of carbon dioxide (25-45 vol %).
Other minor reactions can take place in stable reactors (Figure 1-1). If sulfate concentrations are sufficient,
sulfate-reducing microorganisms (bacteria and Archaea) grow faster than methanogens. Sulfate-reducing
microorganisms are microaerophiles and produce H2S. This gas can inhibit methanogens directly or by
metals precipitation (essential nutrient for them). Without sulfate, sulfate-reducing microorganisms can
oxidize organic acids and alcohols. Some of them work in facultative syntrophy with hydrogenophilic
methanogens. Then, nitrate reduction (final product NH3) and denitrification (final product N2) arise with
enough nitrogen in the medium.
Figure 1-1. Conversion of organic matter to methane by anaerobic digestion. Solid lines represent the usual pathways in anaerobic digestion whereas dash lines indicate alternative pathways.
(Adapted from Alvarado et al., 2014)

Literature review
36
1.1.2 Anaerobic digestion of lignocellulosic crop residues
1.1.2.1 Crop residues: an important resource
To obtain a sustainable energy production from lignocellulosic biomass, only residues should be used. They
are constituted by woody and non-woody biomasses. Woody biomasses, with their high lignin content, lead
to almost no methane production that is why lignocellulosic residues concerned by anaerobic digestion are
mainly crop residues issued from agriculture. A part of the biomass that will not lack to another use such as
food, feed but also soil fertility can be considered as a residue.
Plants growth implies an uptake of fertilising elements into soil. In natural ecosystems, those elements return
to the soil at plants death, creating no soil depletion. In agricultural ecosystems, some plants parts (at least
edible one) are exported out of the field and do not return to the soil. In those ecosystems, fertilizers and
amendments are generally used and it is possible to take off a certain amount of plants without leading to a
soil degradation in terms of organic matter and nutrients (N, P, K…). Organic matter in soil maintains its
agronomic value by providing a structure (less sensitivity to erosion, better water circulation, etc.) and a
long term nutrients release. From an economical point of view, soil preservation is crucial because without it
agricultural yields can drastically decrease. Thus, quantification of lignocellulosic resources available for
energy production should not include the part necessary for the return back to the soil. However, this
part is difficult to estimate as it is a function of soil characteristics (texture, nutrients…) and of agricultural
system (crops rotations and requirements, fertilization strategies…) (Castillon et al., 1993; Tomis et al.,
2009). In average, it is considered that around 50% of the culture must return to the soil (FranceAgrimer,
2012). The possible uptake would be greater if biomass is used for anaerobic digestion since digestate can be
spread to fields leading to a partial restitution of the uptake into the soil. Digestates are significantly
different from initial feedstock and their properties are not well known (Tambone et al., 2010). Moreover,
there is a lack of study concerning the influence of single feedstock on nutrient contents and speciation in
digestates (Möller and Müller, 2012). Thus, uncertainties on possible uptake remain.
Non-woody agricultural residues are principally constituted by gramineous and oleaginous straws. In
France, cereal culture concern 60% of arable lands with a majority of wheat. The use and availability of
these residues depend of the territorial context and of the agricultural holding (yield, etc.) (FranceAgrimer,
2012; Motte, 2013). Among available straws, i. e. after taking into account the part necessary to soil fertility
maintenance, a major part is dedicated to breeding as litter (≈ 54%), minor amounts are incinerated for
energy recovery or used as raw material in industry such as chemical, construction or paper industries.
digestion. Sometimes when straw amount is important, the composition is related to straw but substantial
modifications occurred (crushed fibers, nitrogen enrichment with urea…) and it can be no more considered
as straw. Thus, remaining usable part is important.
In France, more than 4000 kPET (Petroleum Equivalent Ton) per year could be produced from crop residues
without soil damage. As it can be observed in Figure 1-2,crop residues are largely under exploited and

Literature review
37
represent one of the greatest options for improvement (with manure) among other biomasses usable in
anaerobic digestion (waste from food industry…) (FranceAgrimer, 2012). Anaerobic digestion of
lignocellulosic residues occurs principally in farm digesters. Organic Fractions of Municipal Solid Waste
(OFMSW) can also be considered as lignocelulosic residues (vegetable peelings…). However, they are not
included in the Figure 1-2, they are generally valorised even if the valorisation is not always optimal
(methane production in landfill…). Moreover, Figure 1-2 shows volumes, lignocellulosic residues have
generally a low density and repartition will be changed with a figure showing mass. Finally, forest
represents the highest energetical potential but its transformation into methane with anaerobic digestion is
not efficient and other energy systems must be chosen.
Figure 1-2. Repartition of supplementary volumes available for energy production from biomass. (FranceAgrimer, 2012)
1.1.2.2 Main constituents of lignocellulosic biomass
1.1.2.2.1 Cellulose
Cellulose, the most abundant LB polymer, is composed of dimeric subunits of D-anhydroglycopyranose
(glucose anhydride) connected by β-1,4 glycosidic bonds (Figure 1-3A). These dimers or cellobiose
combine in cellulose microfibrils through hydrogen bonds and van der Waals interactions. Cellulose
molecules contain between 15 and 15 000 glucose units (chair conformation). The antiparallel arrangement
allows the establishment of various hydrogen bonds in a same chain (dotted in the Figure 1-3) (Sun, 2010).
H-bonds are also formed between fibers making microfibrils sheets that associate into tubular structures
(Figure 1-3B) (Mohan et al., 2006). In plants, the majority of cellulose is under an organized/oriented form
and it is called crystalline cellulose. Less structured areas correspond to amorphous cellulose (also called
paracrystalline). Various arrangements have been proposed for amorphous and crystalline regions (Figure
1-3C) (Sun, 2010). Amorphous cellulose is more accessible for enzymatic degradation (Sánchez, 2009) and
50%
28%
20% 2%
Forest
Crop residues
Manure
Hedge trimming (wood)
Food industry: co-products or sludges

Literature review
38
less hydrophobic. Cellulose accessibility depends also of molecular weight, particle size, degree of
polymerization. Those parameters influence surface area and solubility. These elements depend on the plant
species, but also on the tissue and plant maturity.
Figure 1-3. Molecular and fibrillary structure of cellulose. A) Intra-chain H bonds formation between cellobiose subunits of cellulose. B) Fibrillary organization of cellulose due to inter-
chain H bonds formation. C) Possible organization between crystalline and amorphous cellulose. (Sun, 2010)
1.1.2.2.2 Hemicelluloses
Hemicelluloses are the second most abundant compound in cereals where they consist mainly of D-xylose
for grasses. In all plants, xylose is the main sugar monomer of hemicelluloses. Besides, xylan is the principal
component of hemicelluloses from hardwood and crops whereas glucomannan is dominant in softwoods.
Hemicelluloses have an amorphous structure (Monlau et al. 2013). In straws, other sugars from
hemicelluloses are D-mannose, D-galactose, D-glucose, L-arabinose, and acids (uronic, ferulic, glucuronic).
These sugars are linked by β-1,4 glycosidic and sometimes by β-1,3 glycosidic bonds (Sanchez, 2009).
Hemicelluloses are soluble in basic medium after extraction of pectic substances. The polymer has a lower
molecular weight than cellulose since it is composed of 80 to 200 units of hexoses and pentoses. An
important part of cereal hemicelluloses are acetylated xylose (Sun, 2010). Hemicelluloses composition
varies also with species, tissue and plant maturity.
A
A
B
A
C
A

Literature review
39
1.1.2.2.3 Lignin
Lignin is the third most abundant polymer in nature, and is present in cell walls. It is an amorphous
heteropolymer consisting of three different phenylpropane alcohols: p-coumaryl (H), coniferyl (G), and
sinapyl (S). Ratios between the different lignin monomers vary according to species, maturity, and tissues.
Contrarily to woody biomass, the three units are in significant amounts in herbaceous plants, e. g. for wheat
straw G/S/H is 49/46/5 (Monlau et al., 2013) (Annex 1). Several linkages exist between those units. Some of
them are condensed, i.e. more resistant to degradation. They are classified as carbon-carbon bonds (5–5, β-1,
β-5, β-β) or diaryl-ether (4-O-5). Uncondensed linkages are aryl-ether type, in majority β-O-4, but also α-O-
4 (Figure 1-4). The molecule organization will affect its hydrophobicity. Lignin starts to dissolve in water at
around 180°C under neutral conditions (Kubikova et al., 1996). Its solubility in different pH depends on
lignin precursor (p-coumaryl, coniferyl, sinapyl alcohols) (Grabber, 2005). The role of lignin is to give
rigidity, impermeability and resistance to plants (microbial attacks, oxidative stress) (Monlau et al., 2013).
Thus, it is difficult to degrade, especially owing to important steric hindrance that limits the access of
enzymes to the molecule (Boukari et al., 2009). Chandler et al. (1980) showed that one percent lignin
decreased organic matter digestion of about 3% (Lesteur et al., 2010).
Figure 1-4. Diverse structures present in wheat straw lignin. A) β-O-4′ alkyl-aryl ethers. A′) β-O-4′ alkyl-aryl ethers with acylated γ-OH. Aox) Cα- oxidized β-O-4′ structures. B) α,β-diaryl
ethers. PCA) p-coumarates. FA) ferulates. H) p-hydroxyphenyl units. G) guaiacyl units. S) syringyl units. (Río et al., 2012)
Literature review
40
1.1.2.3 Other possibilities for energy recovery from crop residues
Currently, various energy sectors based on the use of LB are developing. It is therefore legitimate to wonder
about the advantages and disadvantages of each one. Crop residues can be valorized by combustion
(incineration). With wheat straw, recoverable energy amount with combustion is more important than with
anaerobic digestion since all organic matter is used (even lignin) (Table 1-1). However with combustion, all
organic matter and its nutrients are burnt and do not return to the soil. Moreover, it is a quite expensive
process (Kalyuzhnyi et al., 2000). A major technical bottleneck is often reported, it is due to important ash
generation leading to material corrosion (Lu et al., 2009). The storability of methane allows a better
flexibility than heat generation by combustion (Monlau et al., 2013).
Two other processes emerge for the thermo-chemical conversion of lignocellulose into energy, namely
gasification and pyrolysis. Gasification produces a combustible gas mixture by the partial oxidation of
biomass under high temperatures (800-900°C). Gas (called syngas) can be then converted to fuel (e. g.
methanol) and energy production is high (Table 1-1) (McKendry, 2002a). However, environmental
evaluation is not so good even if it would be more environmental friendly than direct combustion. Diverse
molecules are generated and lot of them are considered as harmful for human health or with high greenhouse
effect (particulate matter, NOx…) (Nguyen et al., 2013). This point must be improved and further research
work is necessary in order to apply gasification to biofuel production (Broust et al., 2008).
Flash pyrolysis consists to heat (≈ 500°C) the biomass in absence of oxygen to obtain a liquid product, the
bio-oil. Bio-oil would be usable as fuel for diesel vehicles but research efforts are still required to improve
its properties, notably to reduce its corrosivity and improve its thermal stability (McKendry, 2002a; S. Wang
et al., 2012b). Bio-oils composition and yield can be studied with Pyrolysis-Gas Chromatography-Mass
Spectrophotometry (Py-GC-MS) (Mohan et al., 2006). For wheat straw, only 37.6% of the biomass can be
converted to bio-oil (Mahinpey et al., 2009) that can explain the little energy production compared to other
techniques (Table 1-1).
Wheat straw utilization for bioethanol production leads to a lower energy generation than with anaerobic
digestion (Table 1-1). Indeed, hemicelluloses are currently not or low transformed into ethanol whereas very
degradable with anaerobic digestion. Furthermore, anaerobic digestion is less sensitive to certain inhibitors
(HMF, furfural…) that can be converted to methane after an adaptation period if little concentrated (Barakat
et al., 2012). Finally, hydrogen production is possible by anaerobic digestion-like process where
methanogenic archaea are inhibited. This process is called dark fermentation. Hydrogen and methane can be
produced concomitantly using a two-stage reactor with favorable conditions for methanogens in the second
reactor (and unfavorable in the first one). Even if energy yield of biohydrogen seems anecdotic, a
combination of small hydrogen amount and methane can be useful to improve combustion (speed and
stability) for electricity production or use as biofuel (Kaparaju et al., 2009).

Literature review
41
For McKendry (2002a), gasification, pyrolysis and AD are the most likely cost-effective processes. The
choice of the technology would be dependent of the requirement since liquid products can easily be
transported whereas gas products are best used at the production point.
Table 1-1. Energy production from wheat straw. (Gaunt and Lehmann, 2008; Adapted from Monlau et al., 2013; Nguyen et al., 2013)
Bioethanol
(MJ/kg TS)
CH4 (Anaerobic
digestion)
(MJ/kg TS)
Combustion
(MJ/kg TS)
BioHydrogen
(MJ/kg VS added)
Bio-oil
(Pyrolysis)
(MJ/kg TS)
Syngas
(Gasification)
(MJ/kg TS)
Wheat
straw
6.7 10.2 17.9 0.5 8 14.3
The recovery of high-value molecules, such as phenols, is another possibility for biomass use. Phenols are
lignin building-blocks and have interesting antioxidant properties (usable in cosmetic industry…). They
could be a valuable by-product from a pretreatment step before anaerobic digestion, especially with
biological pretreatment (Sánchez, 2009). Research efforts must continue to easily recover those molecules.
1.1.2.4 A solid substrate adapted to Solid-State anerobic digestion
Crop residues are constituted by water and dry matter (Figure 1-5). Dry matter, also called Total Solids (TS)
is formed by organic and mineral matter (ash). In wheat straw, organic matter or Volatile Solids (VS)
correspond to 39.6%TS of cellulose, 26.6% TS of hemicelluloses, 21% TS of lignin and soluble compounds
( ≈ 12% TS) in average (Monlau et al., 2013; Sun, 2010) (see also Annex 1). During anaerobic digestion
process, only organic matter is digested but lignin, hardly hydrolysable, remains. Moreover, water is
conserved in the medium. In straws, water amount is low that is why Solid-State Anaerobic Digestion
(SSAD) is better suited to straws fermentation.
LILAAL Before AD After AD
Figure 1-5. Schematic representation of lignocellulosic biomass composition before and after
anaerobic digestion (AD). (Adapted from Motte, 2013)
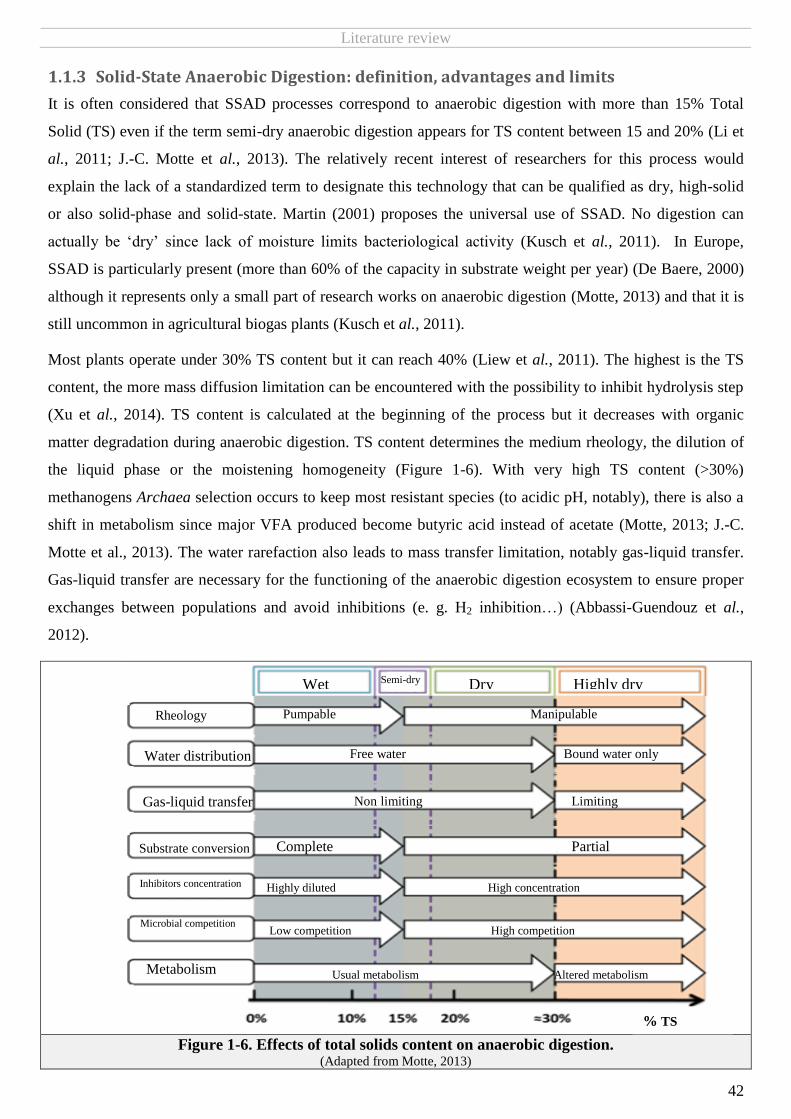
Literature review
42
1.1.3 Solid-State Anaerobic Digestion: definition, advantages and limits
It is often considered that SSAD processes correspond to anaerobic digestion with more than 15% Total
Solid (TS) even if the term semi-dry anaerobic digestion appears for TS content between 15 and 20% (Li et
al., 2011; J.-C. Motte et al., 2013). The relatively recent interest of researchers for this process would
explain the lack of a standardized term to designate this technology that can be qualified as dry, high-solid
or also solid-phase and solid-state. Martin (2001) proposes the universal use of SSAD. No digestion can
actually be ‘dry’ since lack of moisture limits bacteriological activity (Kusch et al., 2011). In Europe,
SSAD is particularly present (more than 60% of the capacity in substrate weight per year) (De Baere, 2000)
although it represents only a small part of research works on anaerobic digestion (Motte, 2013) and that it is
still uncommon in agricultural biogas plants (Kusch et al., 2011).
Most plants operate under 30% TS content but it can reach 40% (Liew et al., 2011). The highest is the TS
content, the more mass diffusion limitation can be encountered with the possibility to inhibit hydrolysis step
(Xu et al., 2014). TS content is calculated at the beginning of the process but it decreases with organic
matter degradation during anaerobic digestion. TS content determines the medium rheology, the dilution of
the liquid phase or the moistening homogeneity (Figure 1-6). With very high TS content (>30%)
methanogens Archaea selection occurs to keep most resistant species (to acidic pH, notably), there is also a
shift in metabolism since major VFA produced become butyric acid instead of acetate (Motte, 2013; J.-C.
Motte et al., 2013). The water rarefaction also leads to mass transfer limitation, notably gas-liquid transfer.
Gas-liquid transfer are necessary for the functioning of the anaerobic digestion ecosystem to ensure proper
exchanges between populations and avoid inhibitions (e. g. H2 inhibition…) (Abbassi-Guendouz et al.,
2012).
Figure 1-6. Effects of total solids content on anaerobic digestion. (Adapted from Motte, 2013)
Wet Dry Highly dry
Rheology Rheology
Water distribution
Gas-liquid transfer
Substrate conversion
Inhibitors concentration
Microbial competition
Metabolism
Pumpable Manipulable
Free water Bound water only
Non limiting Limiting
Complete Partial
Highly diluted High concentration
Low competition High competition
Usual metabolism Altered metabolism
Semi-dry
% TS

Literature review
43
If biological process is the same in wet and dry processes, there are several particularities to operate solid-
state anaerobic digestion. Reactors start-up is a particularly difficult step in SSAD (Jha et al., 2011). SSAD
processes are less expensive (especially batch process) owing to smaller and simpler reactors (few
moving parts, lower energy requirement for heating) and digestate management is easier due to the absence
of phase separation (Li et al., 2011). Lignocellulosic substrates, like straw, have a tendency to float on the
top of liquid reactors leading to operating difficulties and even to a lower methane production (Liao et al.,
1984). Moreover, the presence of inorganic or inert matter (sand, stones, plastics…) in wet process often
leads to technical failures (corrosion…) and the substrate must be carefully prepared. Wet processes require
complete mix reactors that lead to the occurrence of short-circuiting i. e. the output of digested matter before
the planned duration for anaerobic digestion. Short-circuiting diminishes the biogas yield (Vandevivere et
al., 2003). However, several difficulties are encountered with SSAD owing to low moisture content, e. g.
inhibitors concentrations or lack of homogeneity inside the reactor (Table 1-2).
Table 1-2: Interest of SSAD compared to wet AD processes. (Karthikeyan and Visvanathan, 2013; Motte, 2013; Rapport et al., 2008)
Criteria Advantages
Disadvantages
Technical
Few moving parts within the reactor
which limit short circuiting and
operational problems
Robust, no need to remove inert material and
plastics since reactor not prone to abrasion from
sand and grit
Not appropriate for wet (TS
<5%) waste streams
Biological
Less VS loss in substrate preparation (no inert
removal…)
Larger biomass amount
Less dispersion of inhibitors (less mixing and
water)
Low dilution of inhibitors
with fresh water
Less contact between
microorganisms and
substrate (without
inoculation loop)
Economic and
Environmental
Cheaper substrate preparation
Very small water usage
Smaller heat requirement (smaller volume)
Less wastewater and more compost formed as the
final product
Robust and expensive waste
handling equipment required
Possible disminushing of
theed substrate conversion
rate
Under 30% TS content and with optimal SSAD (adequate Substrate/Inoculum ratio…), laboratory and full-
scale reactors achieve biogas production per reactor volume comparable to those obtained in liquid-phase
digestion. However, suboptimal conditions resulted in an inhomogeneous and incomplete degradation at
farm-scale. Optimal conditions are difficult to be determined for full scale SSAD (Kusch et al., 2011),
notably because diverse parameters influence the reaction such as temperature and mixing.

Literature review
44
1.1.4 Main parameters influencing anaerobic digestion
AD processes are classified by critical operating parameters and reactor design such as continuity (batch
versus continuous), reactor design (plug-flow, complete-mix, and covered lagoons), operating temperature
(psychrophilic, mesophilic and thermophilic), and solid content (wet versus dry) (Li et al., 2011).
1.1.4.1 Temperature
Three ranges of temperatures are used to perform anaerobic digestion: psychrophiles, mesophiles and
thermophiles (Figure 1-7). Each of this temperature range corresponds to species most able to live at these
temperatures but there is not a clear boundary between classic groups of psychrophilic, mesophilic and
thermophilic microorganisms (Lettinga et al., 2001). At industrial scale mesophilic (optimum ≈ 37°C) and
thermophilic (optimum ≈ 55°C) temperatures are generally employed (Jha et al., 2011). Thermophilic
conditions helped the successful start-up of dry anaerobic digesters with food wastes without too much VFA
accumulation (Lu et al., 2007) whereas with corn stover, it have led to increased VFA accumulation (Shi et
al., 2013). Thermophilic conditions act on hydrolytic enzymes activities (Lu et al., 2007) and hydrolytic
microorganisms population abundance. Thermophilic systems against mesophilic are reported to be more
rapid and to sometimes improve methane yield but they are also less stable in performance and sensitive to
small temperature changes and to inhibitors. Moreover, they require increased energy for maintaining the
reactor at the higher temperature that is why mesophilic systems are the most used (Jha et al., 2011).
Reactors can be heated with a part of the biogas. Under SSAD conditions, reactors are smaller and less
energy is required to heat them thereby it is easiest to have positive earnings using thermophilic conditions
than with liquid AD. Small water amount in SSAD generally induces more thermal heterogeneity (Motte,
2013).
Figure 1-7. Relative growth rates of psychrophilic, mesophilic and thermophilic methanogens. (Lettinga et al., 2001)
1.1.4.2 Mixing
Mixing allows an enhance contact between enzymes, substrates (and nutrients) and microorganisms. It also
promotes heat transfer and release of produced gas from the digester contents. This release is useful to avoid

Literature review
45
sedimentation (Jha et al., 2011). Moreover, gas accumulation (H2, H2S…) can affect the overall process
performance (Karthikeyan and Visvanathan, 2013). Inactive zone formations (more frequent in SSAD),
affecting bioconversion can impact biogas yield (Karthikeyan and Visvanathan, 2013; Kusch et al., 2011).
However, excessive mixing can reduce the gas production and even lead to failure with high organic loading
rate (Gómez et al., 2006; Vavilin and Angelidaki, 2005). A destructuration of microbial compartments may
explain this fact. Microorganisms would be exposed to inhibitors which they were previously protected due
to the structuration of communities (Martin, 2001; Vavilin and Angelidaki, 2005). Limited mixing
represents energy saving. Mixing is carried out by several ways: mechanical agitation, biogas recirculation
in the substrate, or even, for SSAD, by leachate recycle (Jha et al., 2011). Mixing during start-up phase is
not beneficial and increases pH drop (Karim et al., 2005). In SSAD process, mixing is difficult and
comparatively expensive (Jha et al., 2011). Furthermore, in dry conditions mixing with biogas recirculation
is possibly ineffective (Karim et al., 2005). Leachate recycle can be used to favor homogeneity
(temperature, microorganisms, nutrients…). This action is limited since preferential pathways often appear
(Motte, 2013) but help to maximize methane production per reactor volume (Kusch et al., 2011).
1.1.4.3 pH and alkalinity
Even if optimum pH range for anaerobic digestion is always neutral, slight variations can be found in
literature (Angelidaki and Sanders, 2004; Jha et al., 2011). Optimum pH for methanogens is between 7 and
8 (Angelidaki and Sanders, 2004) and for hydrolysis and acidogenesis is between 5.5 and 6.5 (Jha et al.,
2011). Anaerobic digestion can occur between 6 and 8.3 (Angelidaki and Sanders, 2004). pH influences the
toxicity of inhibitors modifying the proportion of ionized and non-ionized forms. Thereby, ammonia is toxic
when the pH is above 7, while VFAs and hydrogen sulfide are more toxic below pH 7; even if
microorganisms can sometimes acclimate (Jha et al., 2011). Alkali addition to approach neutral pH can
reduce the time to start a SSAD reactor (until 250 days in worst cases) (Karthikeyan and Visvanathan,
2013).
Alkalinity is related to the buffer capacity of the medium. A sufficient alkalinity is required during anaerobic
digestion, it can notably help to face high VFA concentrations without detrimental pH decrease. Alkalinity
in stable reactor is frequently between 2 and 4 g CaCO3/L (APHA, 1998). This parameter is often measured
thanks to titrimetric methods since they are cost-effective, rapid and simple. However, it exist lot of
measurement techniques with different accuracy. Among them, Ripley et al. (1986) technique provides a
good compromise between ease of execution and accuracy. Suspended solids like struvite or humic
substances (especially present in manure) can alter the measurement. A filtration to 0.45 µm is thus
recommended (Scherer, 2007) that is sometimes replaced by a centrifugation step (Ripley et al., 1986; E
Voß et al., 2009).

Literature review
46
1.1.4.4 Carbon/Nitrogen (C/N) ratio
It is well known that anaerobic digestion substrate must have a C/N ratio adapted to microorganisms
requirements. Optimal ratio is between 20 and 35, lower ratios lead to potential inhibition with ammonia
whereas higher ratios may lead to nitrogen limitations (Sialve et al., 2009). Certain reactor designs (two-
stage) would tolerate lower ratios. Crop residues have generally a C/N ratio higher than required, e. g. up to
161 for wheat straw (McKendry, 2002b). Co-digestion with a substrate rich in nitrogen (sludge, manure…)
is a good way to adjust C/N ratio and eventually to improve methane production (Ward et al., 2008). Co-
digestion promotes digestion kinetics. It can also be used to provide buffer capacity, to reduce external
nutrient supply or even to improve digestate quality (Karthikeyan and Visvanathan, 2013).
1.1.4.5 Nutrient supplementation
Diverse macro- and micro- nutrients are required for optimal work of anaerobic microorganisms. Micro
elements like iron, cobalt, nickel, etc., can be co-enzymes or co-factors for the biosynthesis of CH4 or be
involved in the growth of anaerobic microorganisms. Poor nutrient content of anaerobic digestion medium
leads to low CH4 yield and process instability. Moreover, it also affects the digestate quality. Macro- and
micro-nutrients addition is required (see Chapter 2, 2.1.5, for medium composition), unless it can be
documented that they are present in inoculum or substrate. Co-substrate can sometimes provide missing
nutrients. Limited studies are available concerning nutrients in SSAD process (Angelidaki et al., 2009;
Karthikeyan and Visvanathan, 2013).
1.1.4.6 Inhibitors
Diverse inhibitors commonly present in biomass are encountered in anaerobic digesters: ammonia, sulfide,
light metal ions (Na, K…), heavy metals (cadmium, nickel…) and organics (phenols, benzenes…). The
inhibition concentration ranges vary widely for specific toxiccompounds since a lot of parameters can
influence the toxicity (anaerobic inocula, waste composition, and experimental conditions). Microorganisms
are sometimes able to adapt to inhibitory substances, especially with low concentrations. Certain technics
exist also to remove or counteract toxicants, e. g. activated carbon against sulfide or Na+, Ca
2+, and Mg
2+
addition to fight ammonia inhibition (antagonists) (Chen et al., 2008).
1.1.4.7 Particle size of the substrate
As hydrolysis is often the limiting step, a reduction of particle size generally improves methane production
rate. Particle size is considered as a major parameters in kinetic studies but would not improve the total
amount of produced methane (Angelidaki et al., 2009). However, some studies report that increased
methane amount can be obtained thanks to particle size diminishing and in particular for lignocellulosic
biomass but it seems to concern very small particle size (< 1 mm) that are not found in industrial biogas
plants (Jȩdrczak and Królik, 2007; Palmowski and Muller, 2000). Moreover, particles size reduction with

Literature review
47
SSAD increases the risk of acidification because of rapid and high acids production that are not enough
diluted by the little available water (Motte et al., 2014b).
1.1.4.8 Inoculum
Inoculum must contain all microorganisms required for anaerobic digestion. The use of digestate (solid
and/or liquid) from a previous anaerobic digestion is common to inoculate the substrate. When substrate is
similar to the one of the previous digestion, the inoculum is already adapted and anaerobic digestion can
start easily. Digested sewage sludge or manure are also currently used as inoculum (Karthikeyan and
Visvanathan, 2013). Inoculation step allows the contact between microorganisms and substrate, it is
particularly important in SSAD processes since microorganisms are little transported by water or mixing
(Motte, 2013). High inoculation ratios are generally used in SSAD to maximize the contact with substrate
but also to avoid acidification. An important acidification period due to imbalance between acid production
and consumption leads to the death of methanogens. To avoid this situation and decrease digestion duration,
a sufficient amount of methanogens must be provided by the inoculum. However, the higher the inoculum
amount, the lower the substrate amount and thus the lower methane production per reactor (Ahring et al.,
1995). Amount of required inoculum strongly depends on specific substrate characteristics and may vary
within a wide range (ensiled maize or grass: around 70% w/w based on TS; horse dung with straw: 10 to
20% w/w TS; cattle dung: 0%) (Kusch et al., 2011). Some quite low substrate/inoculum ratios are employed
in plants and this ratio must be optimized. In contrast, very high ratios were sometimes used for research
convenience (2%) resulting in a long start-up phase (month) not adapted to industrial requirements. With
SSAD, it was shown that substrate/inoculum (S/I) influences principally the start-up phase whereas the
growing phase depends probably of water compartmentation (TS content and particle size) (J. C. Motte et
al., 2013). To finish, inoculum efficiency is function of its microorganism communities and of substrate
used but other abiotic parameters can also have an important influence on anaerobic digestion such as
nutrient content or buffer capacity (Shi et al., 2014b). Besides, optimum C/N ratios in reactors take into
account the part coming from inoculum (often rich in N).
1.1.5 Anaerobic digestion processes
1.1.5.1 Biochemical Methane potential (BMP)
1.1.5.1.1 Definition and measurement
Biochemical Methane Potential (BMP) measurement is central for anaerobic digestion characterization of a
substrate. The BMP of a substrate is the maximum methane quantity produced by degradation of this
substrate. It is expressed in methane volume per substrate mass unit. As gas volume is a function of
temperature and pressure, gas volumes are expressed in NormoLiters i. e. volume in Standard conditions for
temperature and pressure (1 atm, 0°C). BMP of the planned feedstock are measured before biogas plants
construction to estimate their profitability and size since it represents the aptitude of a substrate to generate

Literature review
48
energy. In operating plants, BMP can also help to predict the behavior of a new input or to optimize the
composition of substrate mixtures. If several standards and recommendations exist for the BMP
measurement (BMP test), there is no standard protocol. With simple substrate, BMP tests precision can vary
from 20% between laboratories (Bachmann et al., 2011; Raposo et al., 2011). BMP tests that consist in
anaerobic digestion in optimized conditions, must be carried out in triplicates. In addition, even if some
authors found no influence of inoculum origin on quite degradable substrate (Raposo et al., 2011), with
toxic substrate such as phenol influence of inoculum source was clear and a correlation was found between
extent of degradation and specific methanogens activity (maximal slope of methane production curve)
(Moreno-Andrade and Buitron, 1995). Therefore, if a comparison between substrates is required, BMP tests
must be launched at the same time to ensure same conditions, especially to have the same inoculum.
BMP is defined as a maximum obtainable methane yield that is why micro (Fe, Mn…) and macroelements
(N, Ca…) are generally added before the anaerobic digestion to ensure microorganisms needs. To keep
neutral pH, a buffer solution must also be used. BMP tests are realized in liquid medium. Agitation must be
providing during the reaction. Temperature is fixed at whether thermophilic or mesophilic conditions
depending on the goal of the BMP determination but mesophilic conditions are more widespread. Various
precautions should be followed concerning the inoculum for BMP tests. This inoculum comes from
anaerobic reactors and must be kept warm (mesophilic or thermophilic temperatures). Inoculum is better
preserved in absence of oxygen and with regular organic matter input to ‘feed’ microorganisms. Activity of
the inoculum can be followed using an entirely biodegradable substrate such as ethanol. This high
biodegradability confers to ethanol a little variable BMP equals to 730 mL CH4 per g. Thus, known amount
of ethanol can serve as control substrate during the BMP tests to follow inoculum efficiency: if measured
BMP is too far from known BMP, it means that inoculum is no more active. Endogenous methane
production of the inoculum must also be measured, it corresponds to methane production of the inoculum
alone without substrate and in the same conditions as those for BMP tests. This methane production can be
due to residual substrate in the inoculum or also to the consumption of death bacteria. Endogenous
production is removed from total methane production measured during BMP test in batch with substrate in
order to obtain only methane production due to the substrate. Thus, endogenous production must be largely
inferior to substrate methane production to allow detection of little methane production variations between
samples. Finally, sufficient amount of inoculum (I) must be provided regarding to the substrate (S) quantity.
A high amount of inoculum allows facing potential inhibitors issued from substrate degradation. Without
inhibition mechanisms, S/I (VS basis) between 1 and 6 had no influence on BMP values of cellulose (less
than 10%) (Bachmann et al., 2011). However, with kitchen wastes, it was shown that S/I is particularly
impacting when added alkalinity is low since acidification can occur (Neves et al., 2004).
1.1.5.1.2 Experimental and theoretical BMP values: example of wheat straw
BMP is a characteristic value of the substrate that reflects its biodegradability. BMP values range between 0
to 1000 m3 CH4/t VS (Raposo et al., 2012). Fats have a particularly high BMP value whereas ligneous

Literature review
49
wastes have a lower BMP (≈250 m3 CH4/t VS). BMP are function of the composition and of the structure of
the substrate. BMP of a given substrate, e. g. wheat straw, can vary in a wide range (Figure 1-8) even if
experimental conditions for the BMP tests are identical (same inoculum, etc.). This is due to the variable
biochemical composition for a same species reflecting growth stage, availability of nutrient during the plant
culture, etc. Moreover, if the feedstock is not well stored, degradation can occur before the entrance in
anaerobic digestion reactor leading to a lower methane production. For wheat straw, average BMP value
obtained with mesophilic temperature reaches 225 NmL/g TS taking into account thirteen experiments
(Figure 1-8). The average standard deviation corresponds to 23% (Annex 1). With thermophilic temperature,
BMP of wheat straw is 265 NmL/g TS in average (Figure 1-8) but only three studies were taken into account
that would explain the lower variability in results and the highest value obtained in thermophilic conditions
(Standard-deviations, minimum and maximum values in Annex 1). However with thermophilic SSAD, it
was reported a better efficiency for wheat straw anaerobic digestion (methane production-rate and yield) due
to a higher hydrolysis rate (Pohl et al., 2012).
Figure 1-8.Wheat Straw Biochemical Methane Potential from literature. (Motte, 2013)
BMP corresponds to the value reached at the plateau phase of methane production (called “stationary” in
Figure 1-12A). It can take few days (e. g. for ethanol, highly biodegradable) or months (e. g. wheat straw,
little biodegradable) to obtain this value. For entirely biodegradable substrate (glucose solution, etc.), the
BMP can be determined by a Chemical Oxygen Demand (COD) measurement. It is admitted that 1 g of
COD produces about 350 mL of CH4 (Lesteur et al., 2010). COD measurement are generally realized on
liquid substrate (Buffière et al., 2009). The Buswell formula, using a stoichiometric equation based on the
chemical composition of the substrate (CnHaObNc), can also be useful to calculate the theoretical amount of
methane produced (Lesteur et al., 2010). The Buswell formula is expressed as follows:
𝐶𝑛𝐻𝑎𝑂𝑏𝑁𝑐 + (𝑛 − 𝑎
4−
𝑏
2+
3𝑐
4) 𝐻2𝑂 → (
𝑛
2−
𝑎
8−
𝑏
4+
3𝑐
8) 𝐶𝐻4 + (
𝑛
2−
𝑎
8−
𝑏
4+
3𝑐
8) 𝐶𝑂2 + 𝑐𝑁𝐻3 . However,
chemical composition includes all organic matter even non-biodegradable ones (such as lignin), that is why
Ave
rage
fo
r m
eso
ph
ilic
Ave
rage
fo
r th
erm
oph
ilic
Me
tha
ne (
Nm
L/g
TS
)

Literature review
50
Buswell Formula is not adapted to determine the BMP of not entirely biodegradable substrate. Moreover,
this formula does not take into account the part of substrate not converted to methane because used for
microorganisms growth (Lesteur et al., 2010).
With Buswell formula, calculated BMP for wheat straw is 466 NmL/g TS (Annex 1. Characterization of
wheat straws in literature.). Comparing to the experimental value (225 NmL/g TS), it means that wheat
straw biodegradability is inferior to 50% (Motte, 2013). This is notably due to the presence of lignin that
cannot (or very poorly) be converted into methane. Thus, wheat straw requires high digestion time, it is
estimated that only 49% of the methane potential is obtained in 26 days and 61% in 42 days in industrial
reactor (Kusch et al., 2011).
As BMP tests produce methane in optimum conditions, studies in conditions closest to industrial scale must
also be carried out to identify possible failure (deficiency, inhibitions etc.). In addition, BMP tests are
realized in liquid medium and would not be enough representative of SSAD. In SSAD, inhibitions are most
current, notably acidification, because there is little water to dilute inhibitors. In 2001, Federal Government
of Germany recognized the GB21 tests for solid wastes, it consists in a digestion of 50 g TS with 50 mL
inoculum and 300 mL water during 21 days (Ponsá et al., 2008). To our knowledge, the relationship
between methane production from GB21 and BMP tests is unknown. For these reasons, studies at reactor
scale are required to better predict behavior in full scale plants.
1.1.5.2 SSAD processes
Several reactor configurations exist, one of the most discriminant aspects concerning existing technologies is
the functioning mode: continuous or discontinuous. Among the several reactor designs existing for SSAD,
no one is more attractive than others and it must be chosen taking into account substrate characteristics
(Karthikeyan and Visvanathan, 2013).
1.1.5.2.1 Batches
Discontinuous processes also called batches are characterized by a closed reactor in which anaerobic
digestion proceeds during a pre-defined period. There is no in and out flux for solid matter during this
period. When this period is over, digestate is removed and fresh substrate mixed with inoculate is loaded to
begin a new reaction. Biogas supply is not continuous since digestion and methane production start again
with each filling of the reactor (Figure 1-12C). To avoid excessive biogas fluctuations, at least three reactors
should run off-set (alternative loading and unloading) (Kusch et al., 2011).
Leachate recycle is generally used to favor anaerobic digestion (temperature homogenization, substrate
moisture, microorganisms transportation) (Brummeler et al., 1992; Buffière et al., 2009). Batch technologies
can differed in their management of leachate (Figure 1-9). Batch systems such as tunnel anaerobic digestion
(Biocel® technology) have a chamber to collect leachates that are then sprayed on top of the wastes that are
being digested (Figure 1-9A). In France, tunnel anaerobic digestion is comercialized by Naskeo Methajade.

Literature review
51
Leachates can also be recycled between new and mature reactors in the Sequential Batch Anaerobic
Composting technology (SEBAC) (Figure 1-9B). This allows a better process stability due to a lower risk of
acidification. In older reactor, leachates have less acids than in new reactor since in older reactor time was
sufficient for acids consumption (Chavez-Vazquez and Bagley, 2002).
Figure 1-9. Examples of leachate recycle patterns in batch systems. A) Single stage. B) Sequential batch. (Lissens et al., 2001)
1.1.5.2.2 SSAD continuous processes
SSAD continuous process reactors were notably developed for treatment of Organic Fractions of Municipal
Solid Waste (OFMSW). Substrate addition and digestate removing occur at regular intervals. SSAD
continuous reactors are based on plug flow, materials added on one end of the digester push older materials
toward the opposite end. Reactors are partially mixed to inoculate the incoming feedstock and limit localized
acidification. Three main reactor designs are currently employed (Figure 1-10): Valorga, Dranco and
Kompogas (Rapport et al., 2008). Those designs are distinguished by their mixing systems (Moletta, 2008).
Kompogas process (Figure 1-10A) is a horizontal steel tank with slowly rotating axial mixers that contribute
to push the material to the outlet, to avoid decantation and favor degassing (Li et al., 2011). Dranco
technology (Figure 1-10B) corresponds to vertical silo design with a conical bottom auger discharge. It is
mixed by digestate recycle outside the tank (up to 6/1 parts of recycled digestate/fresh OFMSW).
Finally,Valorga reactors (Figure 1-10C) are agitated thanks to biogas injection into the waste on the bottom
of the reactor. They are vertical steel tanks with a central baffle that pushes the material from the inlet to the
outlet port. Principal limitation of this process is that gas nozzles can clog.
Dranco and Kompogas systems operate at thermophilic temperature. Kompogas is the most widespread
design probably because, the retention time is short (15-20 d) and thus more OFMSW can be digested
during a given period.
B
A
A
A

Literature review
52
Figure 1-10. Three main continuous reactor designs. A) Kompogas process with axial mixer to move digestate. B) Dranco process, use of gravity for digestate progression. C) Valorga
process, agitation with biogas injection. (Adapted from Motte, 2013)
Finally, continuous SSAD processes can also be realized with two reactors (technology Arkometha). Two-
step processes consist to separate the hydrolysis/acidogenesis steps from acetogenesis and methanogenesis
steps thanks to two reactors in series (even if acetogenesis sometimes occurred with hydrolysis/acidogenesis
steps) (Figure 1-11). This configuration allows a best management of the biological reaction as operating
conditions are different in each reactor (e.g. more acidic conditions in hydrolysis reactor or possibility to
work in aerobic conditions for hydrolysis…). This can allow a more efficient hydrolysis (often limiting step)
and a better process stability (lower risk of acidification).This process allow the recuperation of hydrogen
produce in the first reactor. One-step processes are the most curent in Europe (≈ 90% of anaerobic digestion
capacity) (De Baere, 2000). Two-step processes allow higher loading rates, improved stability and flexibility
but the added complexity and presumed expense of building have negated the possible yield and rate
enhancements (Rapport et al., 2008).
Input Output
Output
Input
Direction of digestate rotation
Biogas arrival
Pump Pump
Dry Inactive Digestate substrate digestate storage
Mixer
Plug-flow reactor
Active fermentation
Post
fermentation
B
A
A
C
A

Literature review
53
Figure 1-11. General concept of two-stage reactors. (Motte, 2013; Adapted from Rapport et al., 2008)
1.1.5.2.3 Batch VS continuous
Batch systems require less capital cost and are relatively simpler notably because heavy process equipment
are not required to mix dry viscous material during the reaction (Li et al., 2011). Continuous mode is
particularly adapted to substrates that are regurlarly produced in high amount or that are difficult to store
(highly putrescible…) (Buffière et al., 2009). However, charging/discharging cycles in batch processes
require agricultural machinery and the regular opening of the digesters (odors and noise) that is why they are
most adapted for sparsely populated areas (Motte, 2013). Batch processing prevails in agricultural solid-state
anaerobic digestion. Crop residues-containing biomass (solid dung, green cut, wheat straw…) is especially
interesting in batches because it can prevent problems of compaction that impede a proper leachate recycle
(Kusch et al., 2011).
Performances of optimised continuous SSAD plants are comparable to wet digestion with similar methane
yield and volumetric productivity (methane per reactor volume unit per day) (Chen et al., 2014).
Maintenance and technical equipment requirements are more important (pump for high viscosity fluid,
additon of micronutrients…).
Lower gas yields are sometimes encountered in dry discontinuous reactors than in continuous.
Notwithstanding, explotation of dry batches is robust, failure rarely occurs and less control measures are
required. Thus, there is no extensive need of operators training (Karthikeyan and Visvanathan, 2013; Kusch
et al., 2011).
Biogas
Solid feed
Composting
Water addition Liquid
recycle
Liquid
digestate Stage 1
hydrolysis reactor
Stage 2
methanogenesis reactor

Literature review
54
Methane production in batch can be linked to bacterial growth: lag phase, acceleration phase, exponential
phase, stationnary phase. Thus the kinetic of production is not constant and there is a peak of productivity
during “exponential phase” (Figure 1-12B). Then, slow methane production continues during quite a long
time. The duration of anaerobic digestion in plants is generally issued from a sufficient substrate degradation
for a satisfiing methane production. Methane production in continuous processes is more regular. Their
functionning is sometimes comparable to a succession of batch reactors owing to the plug-flow and the low
mixing (Figure 1-12D). Methane production is variable depending on the reactor area and thus on the stage
of completion of the degradation. Addition of all local methane production allows a quite stable production.
Studies in batch reactors can be usefull to collect data on local functionning in continuous processes (Motte,
2013).
1.2 Pretreatments for anaerobic digestion
Pretreatments can be applied to increase methane yield or anaerobic digestion rate and sometimes to
circumvent harmful substrate specificities (e. g. sanitation of animal by-products…). To be economically
viable, pretreatment cost must be sufficiently inferior to its economical gain (represented by methane
production improvements). Without pretreatment, energy input/output for biogas plant is estimated to 35%
for straw considering a distance of 10 km between field and biogas plant (Berglund and Börjesson, 2006).
Thus, a pretreatment step must increase this ratio. For lignocellulosic biomass, hydrolysis (limiting step)
must be favored and in this goal enzymatic accessibility must be improved (Bertrand et al., 2006). To do
that, the major aim of lignocellulosic biomass (LB) pretreatments is delignification (Carrere et al., 2014).
However, other beneficial effects occur (listed in Figure 1-13) such as specific surface area increase that will
also favor enzymatic accessibility.

Literature review
55
Figure 1-12. Evolution of biogas production with reaction duration. A) Cumulated biogas production in function of time. B) Biogas production rate in function of time. C) Variable biogas production
in a single batch reactor and necessity of multiple batch reactors to limit fluctuations of biogas supply. D) Similarity of continuous
plug-flow reactor with multiple batch reactors. (Adapted from Motte, 2013)
Loading Reaction starting Maximal production Maturation Partial emptying
la
g p
has
e
acce
lera
tion
exponen
tial
phas
e
dec
eler
atio
n
stat
ionnar
y
phas
e
Time
Time
Biogas Biogas
Input Output
Biogas
B
A
A
B
A
C
B
A
D
A
lag p
has
e
acce
lera
tion
exponen
tial
phas
e
dec
eler
atio
n
stat
ionnar
y
phas
e
Biogas
Biogas Biogas Biogas
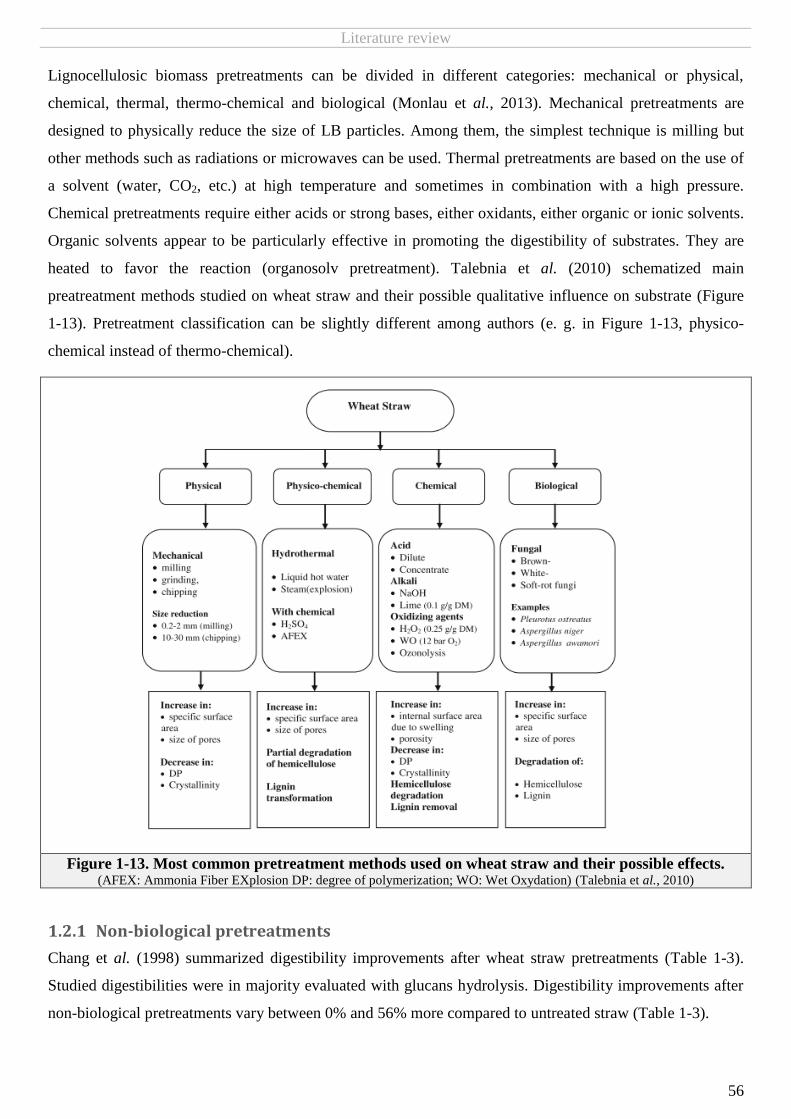
Literature review
56
Lignocellulosic biomass pretreatments can be divided in different categories: mechanical or physical,
chemical, thermal, thermo-chemical and biological (Monlau et al., 2013). Mechanical pretreatments are
designed to physically reduce the size of LB particles. Among them, the simplest technique is milling but
other methods such as radiations or microwaves can be used. Thermal pretreatments are based on the use of
a solvent (water, CO2, etc.) at high temperature and sometimes in combination with a high pressure.
Chemical pretreatments require either acids or strong bases, either oxidants, either organic or ionic solvents.
Organic solvents appear to be particularly effective in promoting the digestibility of substrates. They are
heated to favor the reaction (organosolv pretreatment). Talebnia et al. (2010) schematized main
preatreatment methods studied on wheat straw and their possible qualitative influence on substrate (Figure
1-13). Pretreatment classification can be slightly different among authors (e. g. in Figure 1-13, physico-
chemical instead of thermo-chemical).
U
Figure 1-13. Most common pretreatment methods used on wheat straw and their possible effects. (AFEX: Ammonia Fiber EXplosion DP: degree of polymerization; WO: Wet Oxydation) (Talebnia et al., 2010)
1.2.1 Non-biological pretreatments
Chang et al. (1998) summarized digestibility improvements after wheat straw pretreatments (Table 1-3).
Studied digestibilities were in majority evaluated with glucans hydrolysis. Digestibility improvements after
non-biological pretreatments vary between 0% and 56% more compared to untreated straw (Table 1-3).
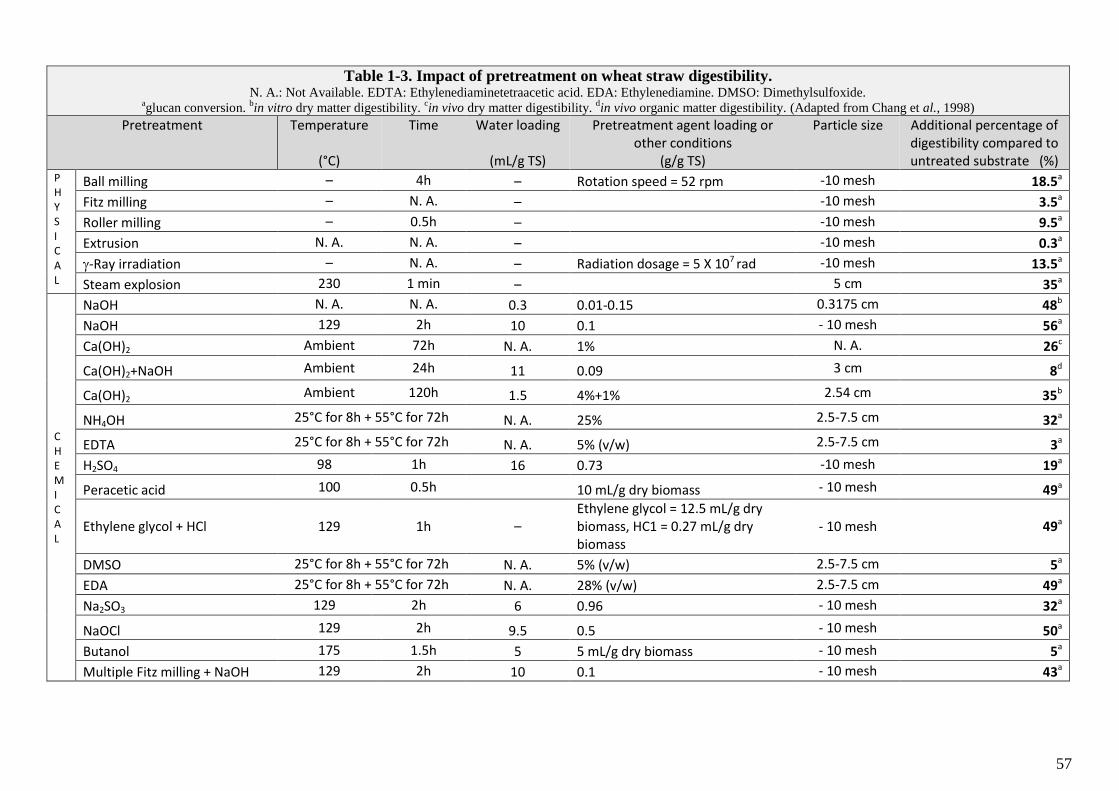
57
Table 1-3. Impact of pretreatment on wheat straw digestibility. N. A.: Not Available. EDTA: Ethylenediaminetetraacetic acid. EDA: Ethylenediamine. DMSO: Dimethylsulfoxide.
aglucan conversion.
bin vitro dry matter digestibility.
cin vivo dry matter digestibility.
din vivo organic matter digestibility. (Adapted from Chang et al., 1998)
Pretreatment
Temperature
(°C)
Time
Water loading
(mL/g TS)
Pretreatment agent loading or other conditions
(g/g TS)
Particle size
Additional percentage of digestibility compared to untreated substrate (%)
P H Y S I C A L
Ball milling – 4h – Rotation speed = 52 rpm -10 mesh 18.5a
Fitz milling – N. A. –
-10 mesh 3.5a
Roller milling – 0.5h –
-10 mesh 9.5a
Extrusion N. A. N. A. –
-10 mesh 0.3a
-Ray irradiation – N. A. – Radiation dosage = 5 X 10⁷ rad -10 mesh 13.5a
Steam explosion 230 1 min –
5 cm 35a
C H E M I C A L
NaOH N. A. N. A. 0.3 0.01-0.15 0.3175 cm 48b
NaOH 129 2h 10 0.1 - 10 mesh 56a
Ca(OH)2 Ambient 72h N. A. 1% N. A. 26c
Ca(OH)2+NaOH Ambient 24h 11 0.09 3 cm 8d
Ca(OH)2 Ambient 120h 1.5 4%+1% 2.54 cm 35b
NH4OH 25°C for 8h + 55°C for 72h N. A. 25% 2.5-7.5 cm 32a
EDTA 25°C for 8h + 55°C for 72h N. A. 5% (v/w) 2.5-7.5 cm 3a
H2SO4 98 1h 16 0.73 -10 mesh 19a
Peracetic acid 100 0.5h 10 mL/g dry biomass - 10 mesh 49a
Ethylene glycol + HCl 129 1h – Ethylene glycol = 12.5 mL/g dry biomass, HC1 = 0.27 mL/g dry biomass
- 10 mesh 49a
DMSO 25°C for 8h + 55°C for 72h N. A. 5% (v/w) 2.5-7.5 cm 5a
EDA 25°C for 8h + 55°C for 72h N. A. 28% (v/w) 2.5-7.5 cm 49a
Na2SO3 129 2h 6 0.96 - 10 mesh 32a
NaOCl 129 2h 9.5 0.5 - 10 mesh 50a
Butanol 175 1.5h 5 5 mL/g dry biomass - 10 mesh 5a
Multiple Fitz milling + NaOH 129 2h 10 0.1 - 10 mesh 43a

Literature review
58
Pretreatments are often evaluated for their effect on hydrolysis (sometimes only on cellulose), it is not sufficient
to evaluate their efficiency on AD. With 4% ammonium (w/v) pretreated hay, no methane production increase
was observed even if hydrolysis rate was significantly enhanced. With wheat straw, steam explosion at 180°C
for 25 min increased methane production by 31% (Monlau et al., 2013) whereas no improvement was observed
with a lower temperature (Theuretzbacher et al., 2015). Fine grinding (0.4 mm) led to a 53% enhancement of
the energy yield from wheat straw (Sharma et al., 1988). Particle size reduction can improve both methane
production yield and rate. On wheat straw, it was reported a 43% BMP increase with 10% NaOH at 40°C for
24 h and 67% with 10% NaOH at 100°C for 30 min (Carrere et al., 2014).
Pretreatments can incur important additional costs for processes. These costs can be due to high energy
consumption, chemicals, and eventually, expensive anti-corrosion reactors to resist harsh reaction conditions
(Zhao et al., 2014b; Zheng et al., 2009). Additional production represent additional profits that must be superior
to additional costs generated by the pretreatment. The evaluation of these costs is rare because it necessitates
full-scale experimentations often expensive and complex. Moreover, pretreatments can reduce the
environmental friendly advantages of anaerobic digestion by using chemicals and/or generating wastes (Mosier
et al., 2005). Some pretreatments (thermal or acid processes…) lead to the release of inhibitory by-products
such as 5-HMF, furfural or phenols generated by the degradation of cellulose, hemicelluloses and lignin,
respectively. Although there is a debate about their biodegradation during anaerobic digestion (Monlau et al.,
2014), a detoxification step is sometimes proposed (López-Abelairas et al., 2013). Finally, sophisticated
expensive pretreatment seems inappropriate for utilisation on single farms (Kusch et al., 2011). Thus, there are
obstacles for commercial scale of non-biological pretreatments of lignocellulosic biomass (Zheng et al., 2009),
except for grinding that is common in plants. It would exists around forty pilot-scale plants worldwide using
diverse non-biological pretreatment such as steam explosion (personnal communication from R. Bakker,
Wageningen University and Research). Full-scale non-biological pretreatment plants on crop residues are
almost inexistant to our knowledges but a process called Economizer SE is commercially available
(BiogasSystems, 2015). Non-biological pretreatments most likely to be applied at industrial scale (efficiciency,
costs) are hydrothermal (steam explosion, hot water), chemical alkali ones (lime, ammonia, etc.) and grinding
(Hendriks and Zeeman, 2009; Mönch-Tegeder et al., 2014b). Among them, alkaline pretreatments are often
highlighted for their efficiency and faisability (Carrere et al., 2014; Chang et al., 1998).
Concerning grinding, it must be noticed that usual grinding at industial scale are generally coarse. At laboratory
scale, studied pretreatments correspond to a particule size of few millimeters (Monlau et al., 2013). This kind of
grinding is highly energy-consuming. For this reason, it is sometimes considered as not applicable at industrial
scale (Hendriks and Zeeman, 2009). However, the applicability of mechanical disintegration pretreatment
(median particle size ≈ 3 mm) was shown in a full-scale biogas plant with horse manure (Mönch-Tegeder et al.,
2014a, 2014b). The additional energy demand for mechanical pretreatment was considered as negligible

Literature review
59
compared to the 26.5% increase methane production (Mönch-Tegeder et al., 2014b). Thus, applicability of a
pretreatment is dependent of process conditions and of the substrate.
Concerning chemical pretreatments, alkali ones may be less expensive and result in less cellulose degradation
and high lignin degradation. Sodium hydroxide, lime (calcium hydroxide) and ammonia are common efficient
alkalis used as pretreatment agents. In term of cost, sodium hydroxide is relatively expensive ($0.68/kg),
ammonia is moderately expensive ($0.25/kg) and lime is inexpensive ($0.06/kg). Moreover, lime is safe to
handle whereas NaOH and ammonia require careful handling (Chang et al., 1998). The possibility to valorize
digestate must also be considered. Again, CaOH (lime) appears as more interesting than NaOH. Calcium is
necessary to plant and limits the counterproductive soil acidification whereas sodium increases
counterproductive soil salinity. Another point to take into account with chemical pretreatments is the recycling
and the possibility to recover chemicals. However, in anaerobic digestion it is not always necessary to wash
pretreated substrate. Alkali can notably be helpful to limit acidification in AD reactors (C Sambusiti et al.,
2013) but sodium and calcium can both have an inhibitory effect on anaerobic digestion (from ≈ 4g/L) (Chen et
al., 2008). Finally, chemical pretreatments require high water amount to dilute reactives even if some
investigations are carrying out to obtain solid-state pretreatment (Abdellatif Barakat et al., 2014a).
Concerning thermo-chemical techniques, steam-explosion can be interesting for subsequent methane production
(Monlau et al., 2013) only if good parameters (temperature, duration…) are applied: too severe conditions can
lead to condensation and precipitation of soluble lignin compounds and/or to an increase of cellulose
crystallinity. Liquid hot water treatment is simple and not expensive but its action on lignin is minor (Hendriks
and Zeeman, 2009). These pretreatments, with reduced exploitation costs, are interesting for an industrial
application but the use of high pressure require important security rules that are sometimes difficult to apply in
small plants.
In this context, biological pretreatments are promising (Zheng et al., 2014). They include ensiling, partial
composting, fungal and enzymatic pretreatments.
1.2.2 Biological treatments
Energy crops are usually stored by ensiling before anaerobic digestion. However, few studies have been carried
out on the impact of such pretreatment. Ensiling consists of lactic fermentation (anaerobic) which converts
sugars into acids (mainly lactic and acetic acids) and ethanol. Lignin is thus not degraded: generally, less than
6% without NaOH addition (Cui et al., 2012; Herrmann et al., 2011). High losses of cellulose and
hemicelluloses can be observed: up to 21% after 83 days of wheat straw ensiling (Thompson et al., 2005).
Herrmann et al. (2011) measured organic matter loss ranging from 1 to 13% depending on: ensiling duration

Literature review
60
(10 to 365 d), the feedstock (maize, sorghum, forage rye, triticale) and chemical (sodium nitrite and
hexamethylene tetramine) or biological (Lactobacillus plantarum and Lactobacillus buchneri) additives. These
organic matter losses led to an increase of the methane yield of ensiled biomass (up to 17%) but resulted to a
little or no variation of the methane production reported to the initial biomass. With a mixture of grasses and
ryegrass, ensiled as such or after drying, optimal ensiling conditions allowed preserving 96% of methane yield
compared to substrate without storage. Under suboptimal conditions, up to 37% and 52% of CH4 production
were lost (Pakarinen et al., 2008). Pakarinen et al. (2011) studied methane potential (L/kg VS) of several
ensiled biomasses with no systematic measurements of dry matter loss during ensiling. They reported a 25 to
50% increase for hemp, 16% increase or 4% decrease for maize depending on duration and additives, and a
decrease down to 34% for faba beans compared to fresh material. Even if ensiling is commonly used in farming,
there are several parameters to optimize in order to maximize the subsequent methane production: initial
moisture content, particles size, additives (chemical or enzymatic), etc. (Cui et al., 2012; Ren et al., 2006).
Partial composting has been scarcely investigated as pretreatment of anaerobic digestion. After 24 h
pretreatment of the organic fraction of municipal solid wastes (OFMSW) with 2.5% v/v of mature compost,
Fdez.-Güelfo et al. (2011) observed a 73% (L/Lreactor) increase of daily methane production in semi-continuous
dry thermophilic anaerobic digesters. Brummeler & Koster (1990) carried out a pretreatment with a partial
composting step (between 20 and 240 hours) on OFMSW. With SSAD batch (35% Total Solids, TS), they
obtained up to 60% of the maximum methane production (determined in batch assays at low solid content) but
with a 20% Volatile Solid (VS) loss. Without pretreatment those OFMSW did not produce methane in the same
anaerobic digestion process which underwent acidification. Mshandete et al. (2005) obtained 26% higher
methane yield with sisal pulp pretreated during 9 h under aerobic conditions. However, the obtained methane
yield was lower than usual for this kind of biomass (Mshandete et al., 2004). During aeration, there is a
consumption of easily degradable compounds representing a loss of matter and so possibly less methane but this
consumption can sometimes help to avoid acidification during the anaerobic digestion (Brummeler and Koster,
1990; Kusch et al., 2008). Acidification can lead to an irreversible cessation of methane production.
Zhou and al. (2012) realized a stack-pretreatment with corn stover (5 cm). The pile was 1 meter high (5 kg/m3)
and let at ambient temperature for twenty days. The layer between 30 and 60 cm reached 52°C. It was then
mixed with cow dung (1:1) and gave 30% more biogas than untreated material.
Whereas the above pretreatments are based on natural or uncontrolled complex microbial consortia, some
authors have studied pretreatments with specific complex consortia. Zhong et al. (2011) used, on corn straw, a
consortium containing yeasts (Saccharomyces cerevisiae sp., Coccidioides immitis sp., and Hansenula anomala
sp.), cellulolytic bacteria (Bacillus licheniformis sp., Pseudomonas sp., Bacillus subtilis sp.), a ligninolytic
white-rot fungi (Pleurotus florida sp.), and the lactic acid bacteria Lactobacillus deiliehii sp.. A 15-day

Literature review
61
pretreatment with 0.01% of this mixture allowed a 75% increase of methane production. Another route to obtain
efficient microbial consortia consists in successive subcultivations (on PCS medium with lignocellulose
addition) in order to enrich the consortium in lignocellulolytic microorganisms (Yan et al., 2012). The resulting
consortium was composed of Bacteroidetes, Proteobacteria, Deferribacteres, Firmicutes, Lentisphaerae,
Fibrobacteraceae and other unidentified microorganisms. A 10-day pretreatment of rice straw with this
consortium led to a 10% increase in batch methane production. Muthangya et al. (2009) realized a two-step
fungal pretreatment with a four-day incubation with fungus CCTH-1 followed by eight-day incubation with the
soft-rot Trichoderma reesei on sisal leaf decortication residues. Up to 101% of methane yield improvement was
obtained per gram of pretreated substrate.
The most studied biological pretreatments of lignocellulosic biomass concern filamentous fungi pretreatment
and enzymatic pretreatment or hydrolysis. In the case of enzymatic hydrolysis, most of the commercial enzyme
cocktails are produced by fungi, in majority by ascomycetes Trichoderma and Aspergillus genus (Singhvi et
al., 2014). These cocktails are mainly composed of cellulases and xylanases. Their use requires a prior step to
delignify the biomass and to make the holocelluloses accessible to enzymes. In comparison to fungi
pretreatments, enzymatic pretreatments are in general, more complex and expensive as they require steps for
enzyme production and extraction (Figure 1-14).
The first process scheme derives from the second generation bioethanol production which includes a physico-
chemical pretreatment (Figure 1-14A). Although this step is mandatory in bioethanol process, it is optional in
the case of use of ligninolitic enzyme extracts for anaerobic digestion. Enzymatic hydrolyse needs to be carried
out under sterile conditions to avoid the consumption of released sugars by endogeneous microorganisms
(Quéméneur et al., 2012) before their conversion by anaerobic digestion. Another option is the introduction of
enzymes in the digesters. It is not really a pretreatment because it occurs during the anaerobic digestion process
but the goal is still to increase methane production. Although some enzymes are added in few full-scale
anaerobic digester fed with maize silage, this process is not well referenced in litterature (Figure 1-14B).
Several experiments were realized on this topic, principaly during anaerobic digestion of sillage but methane
yield improvement rarely exceeded 20% (Brulé, 2014). This process also requires the costly production of
enzymes extracts. Other biological techniques are used during the anaerobic digestion process like
microaeration and two-stage digestion. For microaeration, small amount of oxygen is introduced in the reactor
in order to allow aerobic or partial aerobic reactions like biogas desulphurization or hydrolysis improvement
(Lim and Wang, 2013). To our knowledge, no methane yield improvements were measured for anaerobic
digestion of lignocellulose with microaeration. Two-stage digestion consists in two reactors as already
presented (see 1.1.5.2). Hydrolysis and methane production are improved with this reactor design. Moreover,
hydrogen can be extracted and used as energy. However, the reactors cost is greater and must be considered.
Finally, the simplest process scheme consists in the direct fungal pretreatment of lignocellulosic biomass before

Literature review
62
its anaerobic digestion (Figure 1-14C). The number of steps of this process is minimum and it does not require
any additional feedstock to produce fungi. Since fungi pretreatments are not expensive, they currently receive a
growing interest.
Figure 1-14. Strategies for the combination of enzymatic or fungal pretreatments and anaerobic digestion
of lignocellulosic biomass.
Fungi that are able to degrade lignocellulosic biomass have been classified into white-, brown-, and soft-rot
fungi. Degradation mechanisms by soft-rot fungi (asomycetes and deuteromycetes) are not well-known
(Hammel, 1997). Sánchez (2009) reported that soft-rot fungi decrease Klason lignin in angiosperm wood and
erode the secondary cell wall. However, they prefer substrate with low lignin content and degrade non phenolic
structures. Brown rot fungi (BRF), basidiomycetes known to modify lignin, are able to attack cellulose and
hemicelluloses with only small modifications on lignin (Eriksson et al., 1990; Sánchez, 2009). Therefore,
lignin is still a major component after fungal attack. The remaining lignin contains a greater number of ring
A
B
C

Literature review
63
hydroxyl groups and is demethylated on arylmethoxy groups(Wan and Li, 2012). Conversely, white-rot fungi
(WRF) are the most efficient organisms for delignification (Hatakka, 1983; Müller and Trösch, 1986; Wan and
Li, 2012). They have a unique enzymatic system giving them the capacity to attack phenolic structures and to
degrade lignin to CO2 (Sánchez, 2009).
WRF give a bleached appearance to their substrate due to lignin removal. They belong to the basidiomycota
phylum and, for a small part of them, to Ascomycota phylum (Hammel, 1997; Pointing et al., 2003). Among
WRF, the most rapid lignin degraders are basidiomycetes (Hammel, 1997; Sánchez, 2009). Some ’selective’
strains of WRF lead to small loss of cellulose since they mostly use hemicelluloses as carbon source (Wan and
Li, 2012). Sometimes, lignin tends to be removed faster than cellulose and hemicelluloses (Müller and Trösch,
1986; Salvachúa et al., 2011) . WRF have a large field of action (Isroi et al., 2011). They are able to decompose
several aromatic pollutants or xenobiotics and thus can treat soil and water (Pinedo-Rivilla et al., 2009). They
are also used in paper industry to bleach kraft pulp (Ha et al., 2001). Because of their ability to delignify, they
were first investigated in order to improve forage digestibility. Lignin content and/or lignin linkages with
holocelluloses are key parameters limiting biomass conversion into biofuels. Considering the obtained
enhancement in forage digestibility or sugars yield, WRF are relevant to increase methane or bioethanol
production.
WRF and ensiling both allow wet storage which reduces dry matter loss and fire risk and improves feedstock
digestibility as compared with dry storage (Cui et al., 2012). Cui et al. (2012) compared corn stover ensiling
with or without NaOH addition and pretreatment with the WRF Ceriporiopsis subvermispora. Enzymatic
hydrolysis yields were better with the WRF: until four times more released sugars (depending on operating
conditions). Moreover, a 35-days pretreatment with C. subvermispora seemed sufficient whereas ensiling was
carried out during 90 days. However, the WRF required an autoclave step for substrate sterilization.
The pretreatment with mature compost before anaerobic digestion gave good results (Fdez-Güelfo et al., 2011).
It is possible that WRF contributed to the increase of methane since they have been isolated during cooling and
maturation phases (Pérez et al., 2002). During main composting steps, WRF may not be involved in lignin
degradation. To finish, even if other microorganisms than WRF can be interesting as pretreatment step for
anaerobic digestion, they do not seem to outcompete WRF. Consortia (with WRF or not) can probably give
better efficiency but they are also more difficult to control.
Notwithstanding, the use of WRF has also limitations, especially a long period (weeks to months) to provide an
efficient pretreatment. Fungal pretreatment during storage can solve this issue (Cui et al., 2012). Additional
studies are also required to improve the selective degradation of lignin with WRF. Negative or positive results
of the pretreatment step can be obtained depending on strains and cultivation parameters; and the establishment
of inoculum is one of the main difficulties for WRF pretreatments (Cui et al., 2012).

Literature review
64
1.3 Enzymatic mechanisms of WRF and culture parameters
1.3.1 Enzymatic degradation by WRF and Solid-State Fermentation (SSF)
To attack lignocellulose, WRF use extra-cellular enzymes that form an hydrolytic system (hydrolases) and a
ligninolytic system (Sánchez, 2009). The latter is composed by three major oxidizing enzymes: lignin
peroxidase (LiP or ‘ligninase’ EC 1.11.1.14), manganese peroxidase (MnP, EC 1.11.1.13) and laccase (or
phenoloxidases, EC 1.10.3.2). Not all WRF have all these enzymes. They can have one or three of them or
different paired combinations (Dashtban et al., 2010; Tuor et al., 1995). Other peroxidases were also reported:
Versatile Peroxidase (VP, EC 1.11.1.16) (Martínez et al., 2005), manganese independent peroxidase (MiP)
(Moreira et al., 1997), dye-decolorizing peroxidase (DyP) and aromatic peroxygenase (APO) (Liers et al.,
2011). Finally, several accessory oxidases are implied; some of them lead to H2O2 generation that is used by
peroxidases. Accessory oxidases acts on several substrates: glyoxal, aromatic alcohols, etc. (Tian et al., 2012).
Dashtban et al.(2010) schematized enzymatic processes of delignification (Figure 1-15). To sum up, laccase,
LiP, MnP and VP are too bulky to penetrate cell walls. Thus, they oxidize small intermediates that will catalyze
the pulling out of an electron from lignin aromatic rings (Tian et al., 2012). Donors are organic acids, mediators
and enzymes. The mycelia can also produce a non-enzymatic lignin degradation based on Fenton reaction. This
leads to the production of free radicals that cleave cell-wall and favor the penetration of ligninolytic enzymes.
Martínez et al. (2005) explained step by step chemical modifications on lignin with fungal enzymes. They
reported diverse effects on lignin such as C4-ether breakdown, aromatic ring cleavage, Cα-Cβ breakdown or
demethoxylation. They also pointed out that some lignin monomers can polymerize again or enter into the
fungal hyphae to incorporate intracellular catabolic routes.
Figure 1-15. Schematic diagram of lignin degradation by white-rot fungi. LMS: Laccase-mediator system. H2O2-GO: H2O2-generating oxidases. AAO: aryl-alcohol oxidase. GLOX: glyoxal oxidase.
ADD: aryl-alcohol dehydrogenases. QR: quinone reductases. (Tian et al., 2012)

Literature review
65
Laccases and MnP act principally on phenols whereas LiP cleaves principally non-phenolic (lignin) compounds
(up to 90% of the polymer). Under certain conditions, MnP can also act on non-phenolic moieties and so as
laccases (Hatakka, 1994; Martínez et al., 2005; Wan and Li, 2012). Even if it is not its principal function, it was
reported that LiP can act on phenols in presence of veratryl alcohol (Camarero et al., 1994). The three enzymes
perform one-electron oxidation (Martínez et al., 2005; Wan and Li, 2012). In contrast, VP is able to degrade
phenolic and non-phenolic compounds (Martínez et al., 2005). To bleach kraft pulp, MnP has a central role
(Moreira et al., 1997) and bleaching is related to lignin amount (Reid and Paice, 1994). Then, the important role
of aryl alcohols (veratryl, etc.) must be noticed: stabilization of LiP, substrate for oxidases generating H2O2, etc.
(Jong et al., 1992).
Enzymatic equipment for delignification varies with fungi. Thus, the effectiveness of the pretreatment is
dependent of the fungal strain and of the substrate but also of cultivation conditions. Solid cultures, better
known under the name of solid-state fermentation (SSF), is an optimum way to cultivate fungi (Agosin and
Odier, 1985; Tian et al., 2012; Wan and Li, 2010). Several studies have shown that ligninolytic activity is more
important with SSF culture than with liquid culture (Hölker et al., 2004), perhaps because mechanisms are
closer to those met in nature.
SSF is defined as a process in which substrate are decomposed by known microorganisms under controlled
environmental conditions with the aim of producing a high quality standardized product. Substrate water
content is low, generally between 1/1 and 1/10 water/substrate (Zadražil, 1993)
Advantages of SSF have been discussed by Tian et al. (2012). To summarize, much more substrate per volume
unit is pretreated in solid process than in liquid culture. With SSF, the mycelia presence favors the attachment
of enzymes to the substrate. Oxygen diffusion, necessary to fungal growth and lignin depolymerization, is
greater. Moreover, SSF reactors design is less complex than those for liquid cultures and the process is cheaper
(less aeration, agitation and heating). SSF also offers a less favorable environment for many bacteria and
sterilization required energy costs are lower (Laskin et al., 1992).
SSF with WRF, besides its practicality and its lower cost, is advantageous compared to enzymatic solutions.
Modifying lignin, WRF increase its hydrophilicity (and thus its accessibility for hydrolysis). The mycelial
penetration creating pores allows a greater available surface for enzymatic attacks. Inhibitors concentration is
reduced owing to the fungal metabolism (Tian et al., 2012).

Literature review
66
1.3.2 Cultivation parameters for Solid-State Fermentation (SSF)
In their review, Wan & Li (2012) studied how to optimize the SSF parameters: inoculation, moisture content,
temperature, aeration, particle size, supplements, and decontamination. For most of these factors, the optimum
is substrate and fungal strain dependent.
Most WRF basidiomycetes are non-sporulating. Preculture in liquid medium, precolonized substrate or
Cellophane Film Culture (CFC) can be used for inoculation. CFC was especially developed for SSF: low risk of
inoculum contamination and less handling. Adequate amount of inoculum must be found to ensure good fungal
growth and substrate colonization (Yoon et al., 2014). Then, particle size (few centimeters) must be
investigated to allow good exchanges (oxygen, water, metabolites) and hyphae penetration (Wan and Li, 2012).
For delignification, optimum moisture content is around 70 to 80% (Wan and Li, 2012) Optimum moisture
content is function of the fiber retention capacity of the substrate (Reid, 1989). Thereby, for yard trimmings
(Table 1-4), higher lignin degradation and lower cellulose loss were obtained at 60% than 75% (Zhao et al.,
2014b). A too high moisture limits oxygen circulation and substrate loading (Wan and Li, 2012) but high
moisture content can favor ligninolytic enzymes production (Isroi et al., 2011). It is likely caused by the
transferring nutrients role of water (Zhao et al., 2014a). Sufficient water is thus required for fungal growth
(Reid, 1989; Wan and Li, 2012). Moisture content can sometimes decrease during SSF (Reid, 1989; Zadražil
and Brunnert, 1982). In contrast, a significant increase in moisture content can be observed with fast-growing
fungi because fungal metabolism generates water.
Decontamination of the reactor and inputs (water, air and substrate) is an important parameter especially for
process scale up. However, Akin et al. (1995) observed no difference in the in vitro digestibility by rumen
microorganisms with or without endogenous microflora of Bermuda grass stems. Some fungal strains are more
tolerant to some contaminations. Endogenous flora can sometimes inhibit fungal growth (Pointing, 2001; Reid,
1989). It is possible to partially decontaminate with cheap techniques (steam, salts, solar heat pasteurization…)
(Wan and Li, 2012). Zadražil & Puniya (1995) suggest that moderate acidic pH would favor delignification and
limit bacterial contamination, WRF have a natural tendency to decrease substrate pH. On wheat straw Zadražil
&Peerally (1986) obtained similar results with a short anaerobic fermentation step (50°C for 48h) before
inoculation with the desired fungus as with a sterilization step (Zadražil, 1993). Comparing several disinfection
methods, Ficior et al. (2006) showed that a dilute aromatic fungicide (Derosal 0.01%) can also be a successful
way to disinfect the substrate. Even if fungal metabolism could be affected by disinfection, it must be noticed
that fungal yield can be very low without decontamination (Ficior et al., 2006).
Pre-treatment duration can last for weeks or months, it is a function of fungal growth rate and of the substrate
recalcitrance (Wan and Li, 2012). It seems that during the substrate colonization, the digestibility decreases
before increasing during fungus maturation (Zadražil, 1993). The decrease can be due to water soluble
Literature review
67
substances consumption (Zadražil, 1977). Cereal straw can be totally mineralized in approximately 90 days
(Zadražil, 1985) although the treatment generally lasts between two and four weeks (Table 1-5).
For basidiomycetes, optimum temperature for delignification is around 25°C to 30°C. Fungal metabolism
produces heat that sometimes leads to temperature gradients in the solid substrate. A too high temperature can
kill the selected fungi and heat dissipation must be provided for full-scale plants (Wan and Li, 2012). According
to Zadražil (1993), a too high temperature (regarding optimum temperature for fungi) favors contamination. The
optimum temperature is fungi dependent. Higher temperature did not always lead to increased organic matter
(OM) decomposition rate even with a long pretreatment period (60 days). In addition, enhanced OM
decomposition did not always lead to a better anaerobic degradability (Zadražil, 1985) since OM decomposition
must be selective (lignin, high crystalline structures…).
Oxygen is essential for WRF growth and for the oxidative process of delignification. Oxygenation often
enhances ligninolytic enzymes production (Isroi et al., 2011). Thus, delignification is sometimes better with
greater oxygenation (Kamra and Zadražil, 1986 with Pleurotus eryngii; Kirk et al., 1978 with Phlebia
Tremellosa) but this parameter is strain dependent (López et al., 2002). As reviewed by Reid (1989), selective
delignification was not increased with higher oxygenation. However, a better reducing sugars yield after
hydrolysis can be obtained under oxygen atmosphere (Hatakka, 1983). Delignification is enhanced by oxygen
through the production of hydrogen peroxide. However, hydrogen peroxide comes from the co-metabolism of
cellulose and/or hemicelluloses (Sánchez, 2009). This phenomenon could explain the lower selectivity for
lignin degradation. Since the pre-treatment duration can sometimes be reduced with oxygenation (Hatakka,
1983), it must be taken into account as well as the additive cost. Furthermore, aeration is function of the
substrate packing behavior and of its porosity. Finally, there is an interdependence with other parameters (heat
dissipation, water distribution…) (Isroi et al., 2011).
Concerning supplements, several have been tested to improve fungal pretreatments (N, Mn…). Firstly, the
effect of supplements can be substrate dependent as with wood chips where diffusion is difficult and where
supplements increase fungal biomass and colonization in depth (Messner et al., 1998). Secondly, results vary
between liquid and solid cultures (Wan and Li, 2012), they are also function of other parameters such as
agitation for liquid cultures (Khiyami et al., 2006) or culture duration. Finally, beneficial or negative effects are
function of the concentration used (Shrestha et al., 2008b). Several indicators were measured to evaluate the
effect of supplementation during fungal pretreatment such as Klason lignin reduction, glucose yield or
ligninolytic enzymes production. However, for anaerobic digestion applications these indicators are not
sufficient to assess the efficiency of the pretreatment. Therefore, caution is required to compare the performed
studies.

Literature review
68
It must be noticed that for most WRF, delignification is induced under nitrogen starvation. Jung et al. (1992)
hypothesized that lignocellulosic substrate with high protein content (like alfalfa) can limit delignification with
fungal treatment. Nitrogen supplementation can inhibit delignification while stimulating fungal growth and
sugars consumption (Wan and Li, 2012). Some studies reported a positive effect of N supplementation on
ligninolytic enzymes production with sometimes an influence of pH and N source (Isroi et al., 2011). This
higher enzymatic production cannot be linked to a better delignification. During biobleaching, Moreira et al.
(1997) hypothesized that the limiting factor can be the production of intermediates, especially H2O2, instead of
enzymatic production. The lack in selectivity under high nitrogen medium can be linked to a stimulation of
cellulose consumption under those conditions. According to Mikiashvili et al. (2006) better ligninolytic
enzymes accumulation in the medium was caused by higher fungal biomass.
Mn2+
addition was shown to be beneficial in several studies (Khiyami et al., 2006; Salvachúa et al., 2013;
Shrestha et al., 2008b), probably because of its cofactor role for MnP and VP (conversion of Mn2+ to Mn3+)
(Wan and Li, 2012). Mn3+
acts as a starter of lipid peroxidation reactions and as an oxidizer of phenolic
structures (Monlau et al., 2013). In addition, Mn2+ has a regulatory role on MnP gene (Isroi et al., 2011).
Copper and iron can improve delignification by WRF (Salvachúa et al., 2013), they are present in laccase and
LiP, respectively. Copper increases transcription and activity of laccase (Shah et al., 2010). Hydrolytic enzymes
production was significantly decreased with nanoparticles (of iron and copper) under submerged fermentation
conditions whereas it was enhanced with ionic forms (Shah et al., 2010). Ethanol was successfully used as
laccase inducer (Meza et al., 2006). Some improvements were also reported with concomitant H2O2 and
veratryl alcohol supplementation (Khiyami et al., 2006). Phenolic compounds can enhance substrate
degradation and fungal growth if combined with sugars (Platt et al., 1983).To our knowledge, no
supplementation was done to a fungal pretreated substrate followed by anaerobic digestion. After the
pretreatment, if the remaining concentration of added nutriment is sufficient, it may act as useful oligoelements
for anaerobic microorganisms (Angelidaki et al., 2003) or may have an inhibitory effect, especially with heavy
metals (Lin, 1992).
To conclude, SSF is a complex process to monitor and to optimize. Several culture parameters are
interdependent. Best conditions for fungal growth are not always best conditions for delignification.

Literature review
69
1.4 Quantification of anaerobic digestibility improvement after WRF pretreatment
1.4.1 Anaerobic digestion studies with WRF pretreatment
Several numeric data are given by Isroi et al. (2011) regarding hydrolysis yield or lignin loss. However, few
studies use WRF to improve methane yield or rate. Among them, some are based on the depolluting action of
WRF to reduce inhibitors of anaerobic digestion like limonene or phenols (Dhouib et al., 2006; Fountoulakis et
al., 2002). Thus, a small number of publications related the beneficial delignification effect of a pretreated
substrate for methane production (Table 1-4). On average, it seems possible to improve methane yield by 50%
with a pretreatment period of 30 days. Several authors observed not only an increase of the biogas production
but also a higher content of methane. When the pretreatment increases the anaerobic degradability, the prior
production of Volatile Fatty Acids (VFA) is sometimes augmented (Jalč et al., 1997; Karunanandaa and Varga,
1996a; Müller and Trösch, 1986). Fungal pretreatment seems particularly effective on woody biomass with high
lignin content (Table 1-4). This biomass has a little methane potential and the effect of the pretreatment is more
visible. It can also be noticed that some fungi are well-known and more studied like Pleurotus florida or
Phanerochaete chrysosporium.
The enhancement in methane production must be compared to the loss of substrate during the pretreatment
period. Improvement of methane production is often expressed in terms of volume per weight of pretreated
substrate although this weight is inferior to the weight of untreated sample. Dry matter losses lead to losses of
methane potential therefore these losses must be compensated by sufficiently higher methane potential for
pretreated substrate. Notwithstanding, measurements of dry matter losses due to the pretreatment are rare for
anaerobic digestion studies. If carbohydrates losses are too high, the pretreatment can impact negatively
methane production (López et al., 2013). Another possible benefit of fungal action is the enhancement of
anaerobic digestion kinetics (Müller and Trösch, 1986).
1.4.1.1 Nitrogen metabolism for anaerobic digestion of fungal pretreated substrates
Dry crop residues are rich in carbon. Their C/N ratio is often superior to the optimum value for anaerobic
digestion that is between 20 and 35 (Angelidaki et al., 2003; Sialve et al., 2009). To obtain a better C/N ratio
and to enhance biogas production, Zhou et al. (2012) codigested biological pretreated corn stover with cow
dung. Moreover, the source of N supplementation for anaerobic digestion has an influence on the process. Cow
dung is already rich in ammonia-N whereas proteins should be hydrolyzed to be converted in ammonia-N. A
combination of concentrate feed (11% crude proteins) and fungal treated rice straw led to a difficult nitrogen
utilization by ruminal microorganisms (Karunanandaa & Varga, 1996b). Digestion of crude proteins was lower
compared to same diet but with untreated straw. However, the digestibility for the pretreated straw was
improved even if the low concentration of ammonia-N can have possibly limited the anaerobic digestion.

Literature review
70
Cellulolytic bacteria require isoacids and ammonia-N but none of these components was present in the
pretreated diet. It is thus possible that there was stimulating molecules for cellulolytics generated during Solid-
State Fermentation (SSF) by WRF: for example 3-phenylpropanoic acid derived from lignin degradation
(Eggeling, 1983).
Fungal pretreatment can increase the content of N (Bisaria et al., 1983; Zeng et al., 2011) and crude proteins
(Jalč et al., 1997) reported to dry matter. However, there is dry matter loss during the pretreatment. Without loss
of nitrogen, if analyses are expressed in percentage of dry matter, an artifactitious increase could be observed
because N amount is reported to the dry matter amount. The augmented protein content can also result from
fungal biomass (Jalč et al., 1997). Agosin et al. (1985) found that mycelial content rarely exceed 10% of wheat
straw TS in 18 days or more. Fungal pretreatment can modify the amino acids composition of the substrate
(Valmaseda et al., 1991). Biodegradability and anaerobic digestibility of proteins vary according to their
compositions (Jimenez et al., 2014).
1.4.1.2 Slight acidification of pretreated substrates
In general, WRF lead to a pH drop (Jalč et al., 1997; Zadražil, 1985). Agosin et al. (1985) observed
approximately one pH unit less in five days. Moderate low pH values favor ligninolytic enzymes production.
Agosin & Odier (1985) stated that the more ligninolytic the fungus, the lower the substrate pH. Lignin
degradation products probably have a role in this pH drop even if Borneman et al. (1986) did not see a pH drop
with addition of phenolic monomers until 10 mM. The release of acetyl groups during the solubilization of
lignin and hemicelluloses can also be responsible for pH drop (Cui et al., 2012). During pretreatment, there is
also oxalic acid production associated with MnP activity and acting as chelator of produced Mn3+
(D’Annibale
et al., 1998; Tian et al., 2012). Moderate low pH can sometimes contribute to limit contamination but pH
should not be too low for anaerobic digestion (near neutrality). Thus, Müller & Trösch (1986) added cow
manure in the anaerobic reactor to avoid acidification, they tested 50%, 33% and 25% addition of straw to cow
manure and retained 33% straw (in dry matter) (Table 1-4).
Thus, co-digestion with cow dung was sometimes required with different goals: to obtain an optimal C/N ratio
and to avoid acidification. For anaerobic digestion, cow dung can also play the role of inoculum.
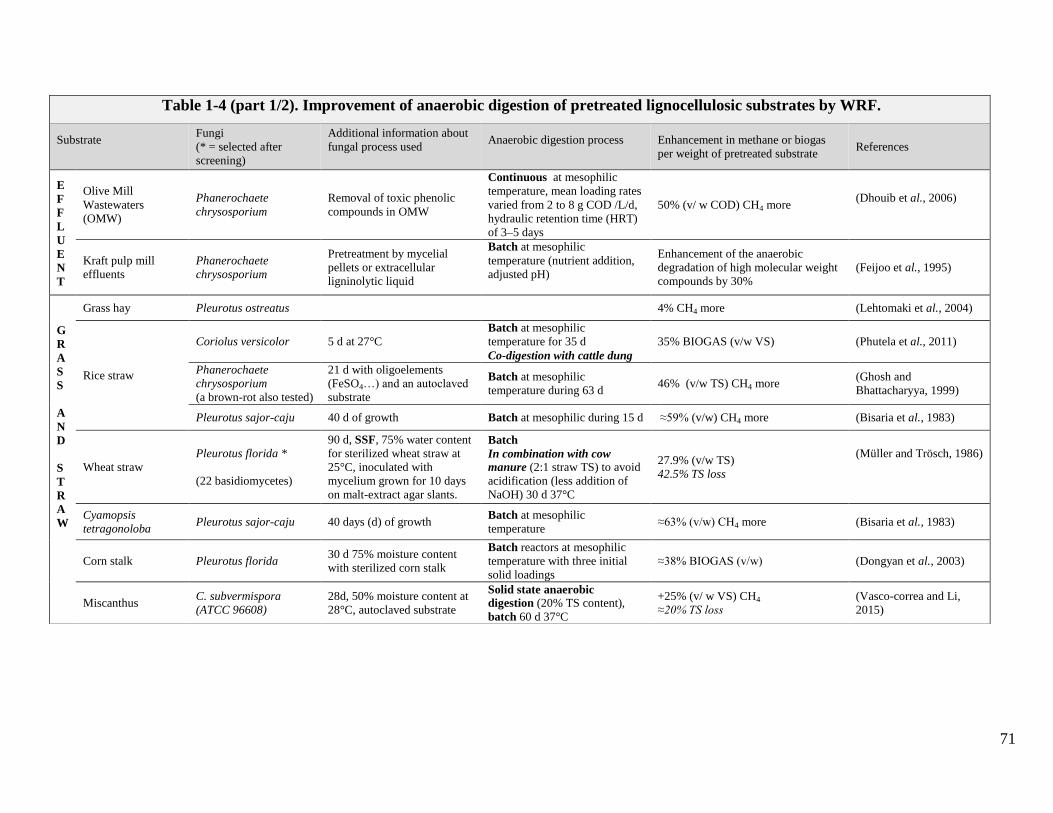
71
Table 1-4 (part 1/2). Improvement of anaerobic digestion of pretreated lignocellulosic substrates by WRF.
Substrate
Fungi
(* = selected after
screening)
Additional information about
fungal process used
Anaerobic digestion process
Enhancement in methane or biogas
per weight of pretreated substrate References
E
F
F
L
U
E
N
T
Olive Mill
Wastewaters
(OMW)
Phanerochaete
chrysosporium
Removal of toxic phenolic
compounds in OMW
Continuous at mesophilic
temperature, mean loading rates
varied from 2 to 8 g COD /L/d,
hydraulic retention time (HRT)
of 3–5 days
50% (v/ w COD) CH4 more (Dhouib et al., 2006)
Kraft pulp mill
effluents
Phanerochaete
chrysosporium
Pretreatment by mycelial
pellets or extracellular
ligninolytic liquid
Batch at mesophilic
temperature (nutrient addition,
adjusted pH)
Enhancement of the anaerobic
degradation of high molecular weight
compounds by 30%
(Feijoo et al., 1995)
G
R
A
S
S
A
N
D
S
T
R
A
W
Grass hay Pleurotus ostreatus 4% CH4 more (Lehtomaki et al., 2004)
Rice straw
Coriolus versicolor 5 d at 27°C
Batch at mesophilic
temperature for 35 d
Co-digestion with cattle dung
35% BIOGAS (v/w VS) (Phutela et al., 2011)
Phanerochaete
chrysosporium
(a brown-rot also tested)
21 d with oligoelements
(FeSO4…) and an autoclaved
substrate
Batch at mesophilic
temperature during 63 d 46% (v/w TS) CH4 more
(Ghosh and
Bhattacharyya, 1999)
Pleurotus sajor-caju 40 d of growth Batch at mesophilic during 15 d ≈59% (v/w) CH4 more (Bisaria et al., 1983)
Wheat straw
Pleurotus florida *
(22 basidiomycetes)
90 d, SSF, 75% water content
for sterilized wheat straw at
25°C, inoculated with
mycelium grown for 10 days
on malt-extract agar slants.
Batch
In combination with cow
manure (2:1 straw TS) to avoid
acidification (less addition of
NaOH) 30 d 37°C
27.9% (v/w TS)
42.5% TS loss
(Müller and Trösch, 1986)
Cyamopsis
tetragonoloba Pleurotus sajor-caju 40 days (d) of growth
Batch at mesophilic
temperature ≈63% (v/w) CH4 more (Bisaria et al., 1983)
Corn stalk Pleurotus florida 30 d 75% moisture content
with sterilized corn stalk
Batch reactors at mesophilic
temperature with three initial
solid loadings
≈38% BIOGAS (v/w) (Dongyan et al., 2003)
Miscanthus C. subvermispora
(ATCC 96608)
28d, 50% moisture content at
28°C, autoclaved substrate
Solid state anaerobic
digestion (20% TS content),
batch 60 d 37°C
+25% (v/ w VS) CH4
≈20% TS loss
(Vasco-correa and Li,
2015)
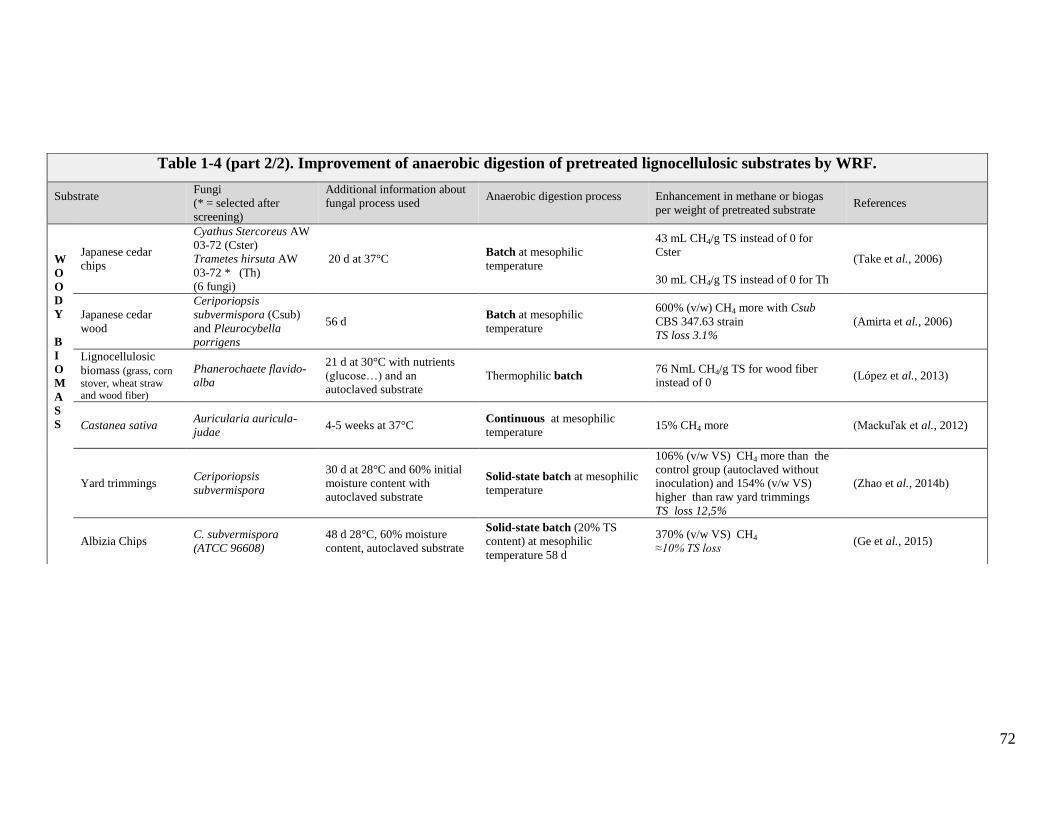
72
Table 1-4 (part 2/2). Improvement of anaerobic digestion of pretreated lignocellulosic substrates by WRF.
Substrate
Fungi
(* = selected after
screening)
Additional information about
fungal process used
Anaerobic digestion process
Enhancement in methane or biogas
per weight of pretreated substrate References
W
O
O
D
Y
B
I
O
M
A
S
S
Japanese cedar
chips
Cyathus Stercoreus AW
03-72 (Cster)
Trametes hirsuta AW
03-72 * (Th)
(6 fungi)
20 d at 37°C Batch at mesophilic
temperature
43 mL CH4/g TS instead of 0 for
Cster
30 mL CH4/g TS instead of 0 for Th
(Take et al., 2006)
Japanese cedar
wood
Ceriporiopsis
subvermispora (Csub)
and Pleurocybella
porrigens
56 d Batch at mesophilic
temperature
600% (v/w) CH4 more with Csub
CBS 347.63 strain
TS loss 3.1%
(Amirta et al., 2006)
Lignocellulosic
biomass (grass, corn
stover, wheat straw
and wood fiber)
Phanerochaete flavido-
alba
21 d at 30°C with nutrients
(glucose…) and an
autoclaved substrate
Thermophilic batch 76 NmL CH4/g TS for wood fiber
instead of 0 (López et al., 2013)
Castanea sativa Auricularia auricula-
judae 4-5 weeks at 37°C
Continuous at mesophilic
temperature 15% CH4 more (Mackuľak et al., 2012)
Yard trimmings Ceriporiopsis
subvermispora
30 d at 28°C and 60% initial
moisture content with
autoclaved substrate
Solid-state batch at mesophilic
temperature
106% (v/w VS) CH4 more than the
control group (autoclaved without
inoculation) and 154% (v/w VS)
higher than raw yard trimmings
TS loss 12,5%
(Zhao et al., 2014b)
Albizia Chips C. subvermispora
(ATCC 96608)
48 d 28°C, 60% moisture
content, autoclaved substrate
Solid-state batch (20% TS
content) at mesophilic
temperature 58 d
370% (v/w VS) CH4
≈10% TS loss (Ge et al., 2015)
Literature review
73
1.4.2 In Vitro Dry Matter Digestibility (IVDMD) studies
Not so much data are available about the use of a WRF pretreated substrate in anaerobic digestion reactors. In contrast
several studies were carried out to evaluate in vitro digestibility. The idea to use white-rot fungi to improve the
digestibility of lignocellulosic biomass for ruminants dates of 1902 by Falck (Cohen et al., 2002).
The determination of the In Vitro Dry Matter Digestibility (IVDMD) is another way to access the anaerobic
biodegradability of a pretreated substrate. This method (Tilley and Terry, 1963) typically consists in a 48 h
digestion of the substrate with rumen fluid followed by an acid pepsin digestion. The original method was
established with 146 samples of gramineae and legumes, it was improved by Marten & Barnes (1980). In order
to increase digestibility for animal feeding, a lot of authors have used the IVDMD to study the impact of a
fungal pretreatment on lignocellulosic biomass.
Tilley & Terry (1963) found a good correlation between IVDMD and in vivo digestibility in the rumen. It is not
always the case, especially for substrates with high post-rumen digestion like acid substrates (maize silage…)
(Adesogan et al., 1998). Another way to evaluate the in vitro digestibility consists in measuring the gas
production of a substrate digested with rumen fluid during few hours to few days (Blümmel and Ørskov, 1993;
Khazaal et al., 2010; Menke et al., 1979). The link between an industrial anaerobic reactor and anaerobic
digestion with rumen flora is not very obvious in term of methane production. First, substrates have more time
to be degraded in biogas plant and thus potentially produce more biogas. Cellulose can only be partially
degraded in the rumen compared to degradation in a biogas plant (25% to 50% less) (Amon et al., 2007).
Second, VFA are absorbed by the rumen epithelium in vivo. Those ones are no more available for the
transformation into methane. Bacterial populations of rumen and biogas plant are different. In the rumen, there
are more hydrogenotrophic methanogens (H2/CO2 substrate) and not many acetoclastic methanogens. However,
anaerobic digestion of lignocellulosic materials in reactors seeded with rumen microorganisms was efficient
(Hu and Yu, 2006). Raju et al. (2011) failed to find a good correlation between IVDMD and methane potential
for meadow grasses (R² = 0.41). As part of digested matter is converted to CO2 with anaerobic digestion, the
study of the correlation between biogas production and IVDMD would be interesting. Chynoweth et al. (1993)
compared BMP and IVDMD assays. They observed a similar disappearance of suspended solids in both process
but biogas production was not directly linked to this disappearance. Thus, a part of the solubilized matter was
lost (handling error) or converted into refractory compounds. Therefore IVDMD studies on fungal pretreated
biomass may give information on the behavior of theses substrate during anaerobic digestion.

Literature review
74
As for anaerobic digestion, several parameters influence IVDMD. Jalč et al. (1997) observed an improvement
of the IVDMD pretreating the substrate with a strain unable to delignify it (lnonotus dryophilus). Therefore,
biodegradability is not only dependent on the lignin content. At the beginning of fungal growth, a decrease in
IVDMD is observed, then there is a rapid improvement (Agosin and Odier, 1985; Jalč, 2002; Zadražil, 1993).
Studies on white-rot pretreated feed were grouped together by Jalč (2002) and Isroi et al. (2011) with positive
and negative impacts on IVDMD. Depending on the pretreatment, the IVDMD can be decreased, especially if
fermentable carbohydrates are consumed (Zadražil, 1985). In Table 1-5 are reported some positive results given
by Jalč (2002) and Isroi et al. (2011) and by others. As for biogas plants, the total solids (TS) loss must be taken
into account. Pretreatment periods vary from 20 to 120 days and the average TS loss is around 20% (Table 1-5).
One of the highest TS loss was 52% in five weeks (Hatakka, 1994). Jalč (2002) in an extensive review on straw
degradation by white-rot fungi, noted that average TS loss is normally about 26% for wheat straw with values
varying from 12% to 66% (Rodrigues et al., 2008). Average IVDMD improvement by WRF pretreatment
varied between 10 and 40% (Table 1-5). Some IVDMD increases were higher than 80% with less than 20% TS
loss (Agosin et al., 1985; Akin et al., 1993b). In Table 1-5, the increased digestibility of a substrate coming
from a SSF pilot scale process (5 kg) should be noticed (Karunanandaa et al., 1992). With a large scale
experiment (1500 kg of treated wheat straw by SSF), IVDMD was also improved (Zadražil, 1993).The process
used can be optimized: for example by diminishing the thickness of the wheat straw layer (between 1.5 and 2 m
in the experiment) to favor transfers (water, O2…).

75
Table 1-5 (part 1/2). Improvement of IVDMD by fungal pretreatment of lignocellulosic biomass.
Substrate Fungi (WRF)
(* = selected after screening)
Additionnal information
about fungal culture
Improvement percentage
of IVDMD compared to control a
References
W
H
E
A
T
S
T
R
A
W
Grifola frondosa (Gf)
Dichomitus squalens (Ds)
Inonotus rheades (Ir)
Pleurotus liguatilis (Pl)*
(235 strains belonging to 150 species)
sterilized wheat straw
(25 g < 1mm + 75 mL deionized
water) pretreated at 22°C, 25°C and
30°C during 30 and 60 d
33.5% for Gf, 25°C, 60 d
32.2% for Ds, 22°C, 60 d
36.1% for Ir, 30°C, 60 d
31.6% for Pl, 30°C, 60 d
ΔIVDMD at 60 d: -32 to +36%
for all tested strains
TS loss between 0% to 118%
(Zadražil, 1985)
Cyathus stercoreus (Cs)
Pycnoporus cinnabarinus (Pci)
SSF with ground autoclaved wheat
straw
≈18 d at 30°C for Cs and 37°C for
Pci under 100% oxygen
94% for Cs TS loss -18%
63% for Pci TS loss -12%
(Agosin et al.,
1985)
Cyathus stercoreus (Cs)*
(from 8 strains)
20 d 78% for Cs
-15-20% TS loss
(Agosin and Odier,
1985)
Stropharia rugosoannulata (Sr)
(from 4 strains)
Pleurotus cornucopiae (Pco)
30°C 120 d for Sr
22°C 120 d for Pco
31.6% for Sr ≈ -60% OM loss
19.8% for Pco≈ -35% TS loss
(Zadražil, 1977)
Pleurotus sp. 1500 kg of wheat straw during 38 d 13.8% more in average (Zadražil, 1993)
Peniophora utriculosa*
(72 brazilian tropical fungi)
30 d at 25°C or 30°C
25 g milled sterile straw (<1mm) in
75 mL deionized sterile water
36% more
(Capelari and
Zadražil, 1997)
Hericium clathroides(Hc)
lnonotus dryophilus (Id) (from 6 strains)
SSF, 30 d at 28° C 35% IVDMD
12% TS loss for Hc and 24% for
Id
(Jalč et al., 1997)
Phanerochaete chrysosporium (PC),
Scytinostrorna galactinum, Phlebia
tremellosa, Phellinus pini, and
Pholiota mutabilis
30 d at 28° C and 90% relative
humidity
26.4% only PC increased
IVDMD of oat straw
42.3% TS loss (11.7% for
control)
(Jung et al., 1992)
a = 100-(IVDMD of pretreated substrate * 100/ IVDMD of the control)

76
a = 100-(IVDMD of pretreated substrate * 100/ IVDMD of the control)
Table 1-5 (part 2/2). Improvement of IVDMD by fungal pretreatment of lignocellulosic biomass.
Substrate Fungi (WRF)
(* = selected after screening)
Additionnal information
about fungal culture
Improvement percentage
of IVDMD compared to control a
References
Oat straw
and
alfalfa
stems
Cyathus stercoreus (Cs)
Phanerochaete chrysosporium (PC)
Pleurotus sajor-caju
SSF (5 kg batches), 30 days, initial
moisture content 75-80%, sterilized
straw (5-15cm)
42% for Cs
(Karunanandaa and
Varga, 1996a)
Rice
straw leaf
and stem
Cyathus stercoreus (Cs)
Phanerochaete chrysosporium (PC)
Pleurotus sajor-caju
50 g TS autoclaved in 150 mL
water in flasks stoppered with
cotton plugs during 30 d
29% for Cs on leaf (lesser
digestibility for stem richer in
silicates)
≈10% Loss of Organic Matter
(Karunanandaa et
al., 1995)
Rice
straw,
Corn
stover
Dichomitus squalens and two strains
(cellulase-less mutant and a wild
type) of Phanerochaete
chrysosporium
SSF 30 d (better improvement than
15 d) at 25°C
sterilized straw
45.8% for Cs on rice straw
TS loss = 6.8%
38.2% for Cs on corn stover
TS loss = 3.3%
(Karunanandaa et
al., 1992)
Bermuda
grass
Cyathus stercoreus (Cs)
3 Phanerochaete chrysosporium
Phellinus pini
sterilized stem sections (10-mm-
long) in agar plates during 6 weeks
at 39°C for PC and 27°C for others
80% for Cs
TS loss 18%
(Akin et al., 1993b)

Literature review
77
1.5 Parameters of lignocellulosic biomass influencing its anaerobic degradability
1.5.1 Polymers composition and enzymatic accessibility
A predictive model for methane production allowed classifying some parameters of lignocellulosic biomass:
there was a high negative influence of lignin content and a small negative influence of crystalline cellulose
content, a positive influence of soluble sugars content (measured after mild acid hydrolysis) and, to a lesser
extent, a positive influence of crude protein and amorphous holocelluloses contents (Monlau et al., 2012b).
In addition, Monlau et al. (2013) inventoried the main parameters influencing anaerobic digestion of
lignocellulose. This latter is limited by the hydrolysis step. Thus, the accessibility of the substrate to
enzymatic attacks is primordial. Pore volume influences the digestibility (must be high). G/S
(guaiacyl/synapyl) ratio influences lignin degradability. G units lead to condensed structure (C-C bounds)
with little biodegradability whereas lignin S units are easier to degrade anaerobically (Abdellatif Barakat et
al., 2014b). Crystalline cellulose is more recalcitrant than the amorphous form during anaerobic digestion,
so crystalline index must be low. The higher the ratio xylose/arabinose (X/A), the better the hemicelluloses
digestibility (A Barakat et al., 2014). The substitution of xylose by arabinose makes the structure more
complex and decreases the digestibility. Hemicelluloses and cellulose are linked by H bonds (Sun, 2010).
Some hemicelluloses contain acetyl groups contributing to those linkages (in graminaceous, for example).
Acetyl groups removal led to a better hydrolysis of cellulose and xylan (Kong et al., 1992; Zhang et al.,
2011). Those groups are partly responsible for the restricted degradation of forages in the rumen. Xylan
degradation is difficult prior to the removal of lateral substituents. Finally, the hydrolysis of the complex
lignin-carbohydrates is the main obstacle to anaerobic degradation.
1.5.2 The lignin-carbohydrates complex (LCC): linkages and derived compounds
1.5.2.1 Major lignin linkages in cell-wall: ferulic acid (FA) and p-coumaric acid (pCA)
Cross-linkages (both between lignin and carbohydrates and within lignin) enhance the rigidity, complicate
the structure and limit the availability of carbohydrates to anaerobic microorganisms (Jalč, 2002) (Figure
1-16). Major obstacles to the biodegradability of lignocellulosic biomass remain the cleaving of LCC bonds
and the removal of lignin (Monlau et al., 2013). Complete removal of lignin is not necessary for important
glucose released after enzymatic hydrolysis and cleavage of bonds between lignin and cellulose would be
sufficient (Brudecki et al., 2013). The level of delignification required may depend on the lignocellulosic
matrix considered (species, etc.). It exist two biosynthetic pathways to build LCC (nucleophilic attack or
oxidative coupling), but even if they modify the structure, they have no effect on degradability (Boukari et
al., 2009; Grabber, 2005; Monlau et al., 2013).

Literature review
78
Figure 1-16. Lignin-carbohydrates Complex (LCC) A. Schematic representation of cell-wall and its main polymers (Adapted from Ceres, 2007). B. Representation of linkages
between lignin and carbohydrates via phenolic acids and arabinose in non-woody plants (Monlau et al., 2013).
Lignin monomers are linked together by β-O-4 aryl ether linkages in majority (Annex 1). Uncondensed units
linked in this way are preferentially degraded. However, Agosin et al. (1985) failed to find a direct
correlation between the cleavage of these bounds and digestibility improvement (IVDMD). Thus, other
linkages are important to cleave like lignin-carbohydrates bounds Monlau et al. (2013). Indeed, lignin is
linked to hemicelluloses, limiting their hydrolysis. These linkages are in majority phenolic acids ester-linked
(1-2% of cell walls, Annex 1) to arabinose. Ferulic acid (FA) is one of them and is also ether-linked to lignin
(hemicelluloses-ester-FA-ether-lignin bridges). In gramineae, hemicelluloses can also be bound to lignin via
A
B

Literature review
79
diferulic acids (Figure 1-16B). Recent studies have also concluded that FA is an intrinsic part of the lignin
structure in grasses (Río et al., 2012) . Then, p-coumaric acids (pCA) can sometimes have a
lignin/hemicelluloses cross-linking function but lots of pCA are also ester-linked inside lignin molecules
(Sun, 2010).
1.5.2.2 Anaerobic degradability of FA and pCA
The impact of FA and pCA on anaerobic digestion is not very clear (Yosef and Ben-Ghedalia, 2000) but
they can be inhibitory depending on their concentrations (Table 1-6). If added individually, those phenolic
acids (also called hydroxycinnamic acids) can decrease in vitro fermentation of cellulose (Borneman et al.,
1986; Jung et al., 1992). pCA added to wheat straw did not lead to limitation of degradation but lignin-
linked pCA can potentially limit straw hydrolysis (Besle et al., 1986). Borneman et al. (1986) observed in
vitro that 1mM pCA is generally inhibitory for rumen bacteria studied and 10 mM FA is only inhibitory for
one out of four strains. In addition, pCA was less degraded than FA in the rumen (Varel and Jung, 1986).
With synthetically esterified phenolic acids to oat spelts xylan fractions, Jung et al. (1991 cited by Yosef and
Ben-Ghedalia 2000) observed a negative correlation between concentration of esterified phenolic acids and
IVDMD. In this study, esterified FA was slightly more inhibitory to IVDMD than esterified pCA (Yosef and
Ben-Ghedalia, 2000). Akin et al. (1993a) tested the effect of esterified pCA and FA on the digestion of
linked arabinoxylan by three rumen strains. They concluded that ester bonds can limit the availability of
carbohydrates in a species dependent way; perhaps due to different enzymatic material especially in terms of
esterases. Finally, it seems that a lot of rumen organisms have high levels of cinnamoyl esterases
(responsible for hydrolysis of hydroxycinnamic acids) (McSweeney et al., 1998) and thus can cut those
links.
In terms of anaerobic digestion studies, FA and pCA can be converted into biogas up to 85% with
acclimated microorganisms (Healy and Young, 1979). At concentration of 12 mM, FA was well converted
to biogas after a lag period of fifteen days. CH4 production of cellulose and FA mixture was slightly better
than expected but a lag phase was observed (Nordmann, 2013).
Table 1-6. Role of phenolic acids on anaerobic digestibility (in vitro and rumen bacteria).
Phenolic acids
(concentration) Co-substrate Impact References
pCA (5 mM and 10 mM) Cellulose
Negative (Borneman et al., 1986;
Jung et al., 1992) FA (5 mM) Negative
pCA (9 mM) Wheat straw Ø (Besle et al., 1986)
pCA (1 mM) Ø
Negative (Borneman et al., 1986)
FA (10 mM) Negative
pCA and FA oatspelts xylan fractions
and synthetic esterification Negative (Jung et al., 1991)

Literature review
80
1.5.2.3 Other cell-wall linkages in anaerobic digestion
Pectins bind to cellulose and are covalently and non-covalently linked to xyloglucan (Cosgrove, 2005).
Pectins are principally formed by galacturonic acids that are linked together with carbohydrates and α-1,4
bounds (Sun, 2010). They constitute an amorphous structure (Le Troedec et al., 2008). To a lesser extent,
other molecules have a role as lignin inter-bound or lignin/hemicelluloses cross-linkage: sinapic, cinnamic,
ρ-hydroxybenzoic, galacturonic and glucuronic acids (Bidlack et al., 1992; Sun, 2010). Some of them
(including FA and pCA) can be covalently bound to cell wall pectins (Dinis et al., 2009; Sun, 2010).
Uronic acids are pretty well degraded in the rumen (Ben-Ghedalia and Miron, 1984). Monlau et al. (2012b)
did not observe an impact of uronic acids content on methane production of various lignocellulosic residues.
Thus, they may be easily digested. During anaerobic digestion, breaking bounds of pectin occurred during
hydrolysis step and allowed anaerobic microorganisms to use linked fermentable carbohydrates.
Pretreatment with pectinases can improve hydrolysis and subsequent methane production even if pectin is a
minor compounds. Generally, activities used are high (more than 2000 U) (Pakarinen et al., 2012).
However, Frigon et al. (2012) obtained 72% methane more with only 50 U of pectinase but with an
incubation of 78 days with sodium acetate.
1.5.2.4 Lignin-derived compounds
Lignin-derived compounds can bind proteins rendering them unavailable for anaerobic microbial utilization
(Han et al., 1975; Karunanandaa and Varga, 1996a; Velez et al., 1985) and/or inactivating anaerobic
digestive enzymes (Gamble et al., 1996; Han et al., 1975). Rumen cellulolytic bacteria can be inhibited by
small phenolic compounds. The lignin compound syringaldehyde was well digested anaerobically, alone or
in combination with xylose. With vanillin, even if methane was produced, some inhibitions are possible
(Barakat et al., 2012). Anaerobic digestion processes are pretty tolerant to phenolic compounds, depending
on their concentrations (Monlau et al., 2014) and their structures (Hernandez and Edyvean, 2008). Reactor
mode (batch or continuous) and inoculum adaptation influence the inhibitory capacity of such molecules
(Monlau et al., 2014).
1.5.3 Influence of histology
1.5.3.1 Epidermis role and composition
Epidermis is composed by the outmost surface cells (Han et al., 1975). Surface of plants contains, among
others, silica, cutin and waxes. It plays a protective role against biotic and abiotic stress (Sun, 2010). Thus, it
is difficult to degrade. In cereals, it is a non-negligible tissue: for wheat straw, epidermis represent 5 to 7%
of the volume and 15% of the total mass (Zeitoun, 2011).
Silica is found in cell-wall and especially in epidermis. It provides a physical barrier to enzymatic
degradation and helps to fight metal toxicity, salinity, drought and temperature stresses (Currie and Perry,
2007). In average, silica concentration in angiosperms is between 3 to 5% dry weight. It constitutes an
Literature review
81
important part of the ash (more than 90% in wheat straw) (Han et al., 2010). This small quantity is sufficient
to increase mechanical resistance and to cause difficulties during pretreatment (Motte, 2013).
Cuticle is constituted by cutin. Cutin is a lipophilic polymer (fatty acids) with phenolic structures such as FA
and pCA. It is embedded in waxes and found in majority on the surface of leaves and stems. Waxes are also
present in the epidermis. Most plants and all gramineae are covered on aerial parts with semicrystalline wax
(Sun, 2010). Epidermis (wax, cutin…) is composed by alkane, ester, alcohol, phenolic acids, fatty acids…
Natural wax level in crop materials is commonly between 1% and 2%, which is sufficiently high to lower
straw wettability and to inhibit bonding among particles (Han et al., 2010). Lipophilic extractives constitute
a small part of lignocellulosic biomass but can have an important role. They give wood its color, its odor,
and, to some extent, its physical properties (Imamura, 1989). A major part of lipophilic substances are
deposited on the middle lamella and on epidermal cells (cutin and waxes) to play a waterproofing role and a
barrier to microbial attacks.
1.5.3.2 Anaerobic digestion at cell scale
Anaerobic degradation occurs from the center to the outer tissues (Akin et al., 1974; Motte, 2013). In the
center, the vacuole is easily accessible (like a pore) and outer tissues are more lignified (schlerenchyma and
xylem). Outer tissues are therefore more difficult to degrade in anaerobic digestion than parenchyma (Akin,
1989; Motte, 2013).
During high solids anaerobic digestion, Motte (2013) showed that tissue kept their structure since medium
lamella, silicified epidermis and cell intersections are recalcitrant. Cells from medium lamella contain very
resistant lignin (Engels, 1989). One unit increase in silica content decreased forage grass digestibility by
three percent (Van Soest and Jones, 1968). High content in silica can probably impede a good delignification
(Zadražil, 1980).
Cuticle (lipophilic) is difficult to degrade anaerobically (Motte, 2013). Rumen bacteria split the cuticle by
preferentially attacking the cell just underneath the cuticle (Akin et al., 1974). Bacterial attachment is
primordial to digeste a substrate. Rumenal bacteria are unable to attach to cuticle whereas anaerobic fungi
hyphae are abble to penetrate the cuticle (McAllister et al., 1994). If lipophilic substances of the cuticle are
degraded, it could favor the accessibility to the substrate and perhaps improve methane production. Several
studies showed a negative impact of lipophilic extractives on methanogenesis. Some resin acids, in
particular, can inhibit anaerobic digestion at only 20 mg/L (Baroutian et al., 2013).
From these findings, one may wonder on which of these parameters fungal pretreatment can act.

Literature review
82
1.6 Qualitative effects of fungal pretreatment on anaerobic digestibility
1.6.1 Modifications of lignin: G/S (guaiacyl/synapyl) ratio
Lignin degradation is a key point to improve digestibility. Qin et al. (2009) showed that WRF can increase
the hydrophilicity of lignin. Polar extractives, especially vanillyl compounds, were identified as products of
lignin depolymerisation after basidiomycete pretreatment (Gutiérrez et al., 1999).
For WRF, G units are also more difficult to degrade (Sánchez, 2009) and S units are generally
depolymerized more rapidly (Akhtar et al., 1997). However, some fungi like C. subvermispora FP 90031-sp
preferentially degrade G units than S units (Akhtar et al., 1997; Akin et al., 1993b; Terrón et al., 1995).
Fungi found in coniferous wood like Phellinus pini seems also efficient for G units degradation (Akhtar et
al., 1997). The preferential degradation of S and G can be a function of fungal treatment duration; as
observed by Agosin et al. (1985): preferential degradation for G units before 10 days and for S units after. In
contrast, it was considered that S units are first erode whereas G units are attacked in a later degradation
stage (Backa et al., 2001). Camarero et al. (2001) found an influence of the MnP amount on G/S. To
resume, it seems possible to increase S/G even if it is not the most frequent case. This increase is often
linked to a better IVDMD: 80% improvement in the study of Akin et al. (1993b). Although, it is not a
sufficient parameters to explain improvement since a decreasing ratio can correspond to a better digestibility
(Agosin et al., 1985).
1.6.2 Cellulose digestibility improvement
Concerning the crystalline cellulose, it appears that enzymes secreted by aerobic and anaerobic fungi are
able to solubilize it (Sánchez, 2009; Wood et al., 1988). In their review, Isroi et al. (2011) explained that it is
possible to reduce crystallinity of cellulose with WRF. On wheat straw pretreated with Phanerochaete
chrysosporium and with inorganic salts addition, a crystalline degree reduction from 44% to 15% was
observed. It corresponded to 25% lignin loss and 27% overall sugars loss but also to 250% higher efficiency
for sugar release through enzymatic hydrolysis (Zeng et al., 2011). Without additives, crystalline degree can
be slightly decreased (around 4% less) in pretreated substrates (Lee et al., 2007; Zeng et al., 2011). Yang et
al. (2013) confirmed that fungi can open the crystalline cellulose structure and create an amorphous
structure less water repellent. Yet, no improvement of crystalline index occurred perhaps because of the
amorphous cellulose consumption. Müller & Trösch (1986) studied the hydrolysis by cellulase of a WRF
pretreated substrate (Table 1-4). They suggested a decrease in cellulose crystallinity caused by fungi. They
obtained a higher glucose yield with a longer WRF pretreatment period. Improvement of cellulose
digestibility is caused by a better cellulose accessibility that can be due to a decrease in crystalline index but
also to delignification (Taniguchi et al., 2005).
According to Monlau et al. (2012b), amorphous holocelluloses loss must be limited to avoid a decrease in
methane production. The availability of cellulose is very important and can be illustrated by the study of

Literature review
83
Karunanandaa & Varga (1996a). They observed an increase in Dry Matter (DM) and Organic Matter (OM)
digestibility of the treated straw in spite of a decrease in hemicelluloses and crude protein digestibility. This
was probably due to a better cellulose digestibility. Similarly, Agosin et al. (1985) found a good IVDMD
and delignification with a preferential hemicelluloses removal instead of cellulose.
1.6.3 Changes in hemicelluloses X/A (xylose/arabinose) ratio and acetate
Karunanandaa & Varga (1996b) observed a decreased X/A ratio on rice straw pretreated with Cyathus
stercoreus. The resulting hemicelluloses were slowly digested and thus less degradable. In contrast, a rapid
decrease in the arabinose content of wheat straw pretreated with C. stercoreus was suggested to be partly
responsible for digestibility improvement (Agosin et al., 1985). Thus, it is possible to improve
hemicelluloses digestibility and X/A ratio with the good strain and good culture conditions. Hemicelluloses
are often degraded by WRF that have endoxylanases (Isroi et al., 2011). It appears that acetate can easily be
degraded by WRF and even that deacetylation can sometimes occurred with a small advance prior xylose
removal (Agosin et al., 1985).
1.6.4 Increase of porosity
The presence of fungi can increase pore sizes and surface areas by the penetration of mycelium in SSF
process (Talebnia et al., 2010; Tian et al., 2012). It was notably observed by scanning electron microscopy
(SEM) (Isroi et al., 2011). This technique even allowed Zeng et al. (2011) to discern more clearly cellulose
microfibrils in the best pretreated samples (SSF + P. chrysosporium + salts) showing important lignin
removal. In pretreated wood powder with Stereum hirsutum Lee et al. (2007) saw a 10-fold higher pore
volume. Therefore, the accessibility to enzymatic attack is favored.
1.6.5 Actions of WRF on lignin-carbohydrates complex (LCC) linkages
Lignin ‘selective’ WRF are able to degrade rapidly esterified phenolic acids. Some fungi are more efficient
to degrade selectively phenolic acids (Dinis et al., 2009; Karunanandaa and Varga, 1996b). FA was
degraded faster than pCA (Agosin et al., 1985; Akin et al., 1993b). It may be related to a preferential
breakdown of hemicelluloses. At the beginning, FA and pCA were degraded faster than lignin, then they
reached almost the same rate as lignin (Agosin et al., 1985). Fungal esterases allow fungi to release FA and
pCA from lignocellulosic material. To disrupt the hemicellulose-lignin association, fungal esterases act
synergistically with xylanases, without lignin mineralization (Sánchez, 2009). Thanks to their esterases,
anaerobic rumen fungi are more efficient than rumen bacteria to attack recalcitrant cell-wall (Akin et al.,
1993a). Karunanandaa & Varga (1996b) found a negative correlation between IVDMD of a fungal
pretreated rice straw and pCA (r=-0.73) and cellulose/pCA ratio also (-0.69). However, it is possible that the
consumption of cellulose by some tested fungi led to increased phenolic acids and or lignin concentration
per cellulose unit. No correlation was found with FA.

Literature review
84
During fungal pretreatment there is an accumulation of uronic acids. This phenomenon depends probably on
fungal enzymatic material (Agosin et al., 1985). Some phenolic substances (4-hydroxy cinnamic acid,
FA…) sometimes implied in linkages were significantly decreased by Phanerochaete chrysosporium on
wheat straw. They were probably digested by the fungus as nutrition source (Qin et al., 2009). Even if
pectins are water soluble and can be used by a lot of microorganisms (Motte et al., 2014a), they seem
difficult to be selectively hydrolysed by WRF. Pectin degradation by WRF were observed but
simultaneously with cellulose degradation (Gamble et al., 1996).
1.6.6 Release of lignocellulosic polymers main constituents
WRF decrease the degree of polymerization, creating lower molecular weight compounds (Yang et al.,
2013).
1.6.6.1 Lignin-derived compounds
Lignin degradation by WRF may create anti-nutritive factors for anaerobic digestion even if some
compounds can be cleaved by WRF: C-C bounds breaking in condensed tannins, for example (Gamble et
al., 1996). However, when a significant increase of digestibility is observed for pretreated samples, this
potential toxicity seems insignificant (Agosin and Odier, 1985).
Agosin & Odier (1985) studied wheat straw delignification by WRF using 14
C-labelled lignin. 14
C-polymeric
soluble compounds were released. Those ones were degraded to 14
CO2 and low molecular weight 14
C-soluble
compounds. These small compounds can be easily converted to methane and increase its production
(Barakat et al., 2012). After 15-20 days they were converted faster than being formed. Low molecular
weight phenolics can repolymerize by the action of laccase (Sánchez, 2009) instead of entering the
mycelium and being further metabolized. Degraded lignin contains a higher proportion of ionizable groups
(carboxyl groups…) and this may contribute to the formation of water-soluble lignin that is very important
for the improvement of in vitro digestibility (Agosin and Odier, 1985). Acid insoluble lignin (AIL)
decreased more rapidly than acid soluble lignin (ASL) for poplar treated with Trametes velutina (Yang et
al., 2013). Since ASL is composed by low molecular weight and hydrophilic materials, this phenomenon
shows lignin depolymerization and structure modifications with biopretreatment.
Finally, Müller & Trösch (1986) did not observe a good hydrolysis for a well delignified pretreated straw
with Hapalopilus rutilans. This shows, again, that delignification is not the only parameter to take into
account to improve anaerobic digestibility since hydrolysis is the limiting step. Agosin & Odier (1985)
advanced that only partial delignification is necessary for achieving maximal increases in digestibility (with
lignin ‘selective’ strains). As delignification is a secondary metabolism (Jeffries, 1987), the selective
degradation of lignin is difficult to obtain.

Literature review
85
1.6.6.2 Hemicelluloses and cellulose derived compounds
After fungal pretreatment, resulting hemicelluloses can become more recalcitrant to anaerobic digestion or
IVDMD. Hemicelluloses solubilization by autoclaving followed by fungal consumption may explain this
phenomenon. Lack of ammonia-N or modification of the xylose to arabinose ratio is also a possible
explanation for the increased recalcitrance (Karunanandaa and Varga, 1996a; Zhao et al., 2014b).
Hemicelluloses loss may be less impacting than cellulose loss on IVDMD; indeed Agosin et al. (1985)
observed good IVDMD and delignification with a preferential hemicelluloses removal instead of cellulose.
Structural carbohydrates can lead to non-structural soluble carbohydrates owing to fungal metabolism. They
were increased with fungal pretreatments and thus can indicate a successful fungal growth (Karunanandaa et
al., 1992). Conversely, Qin et al. (2009) found sugars losses with fungal pretreatment but anaerobic
degradability was not studied. Moreover, the tested fungus (P. chrysosporium ME446) was perhaps non
selective for lignin as observed by Karunanandaa et al. (1992) with other strains of P. chrysosporium.
Released sugars increased during the fermentation of pretreated wheat straw with Sporotrichum
pulverulentum. The degradation of cellulose and hemicelluloses was concomitant and IVDMD was not
improved. Released sugars reached a maximum level then decreased with fungi that prefer hemicelluloses
than cellulose and IVDMD was improved. For all tested strains, the ratio soluble sugars/soluble substances
decreased during the decay of the substrate (Agosin et al., 1985).
Soluble sugars concentration modifications have a role on anaerobic degradation. With fungal pretreated
substrate, a raised IVDMD corresponded to higher total non-structural carbohydrates content. However,
there was no correlation between IVDMD and non-structural carbohydrates content (Karunanandaa and
Varga, 1996b). Monlau et al. (2012b) demonstrated the positive effect on anaerobic digestion of increased
amounts of soluble sugars. Fungi can consume these compounds, converting them to CO2 or fungal biomass.
CO2 transformation is a real loss for methane production but fungal biomass is digested and can produce
methane.
1.6.7 Influence of histology: fungal degradation at cell scale
Penetration of the hyphae in plant cells during pretreatment provides an increased accessibility to the
substrate and favors the digestibility improvement. The degradation by fungi is also function of histological
composition. Some fungi can colonize all tissues (like Cyathus stercoreus) whereas others are localized in
poor lignified areas like mesophyll (leaf parenchyma) (Karunanandaa et al., 1995). The capacity to degrade
cellulose can possibly influence the fungal repartition. Thanks to electron microscopy, the degradation of
parenchym after a 72 h rumenal digestion was observed for a treated substrate with Cyathus stercoreus
(Cs). Parenchym was not digested in the control sample (Karunanandaa et al., 1995). With the same fungi
Akin et al. (1995) also observed a partial degradation of sclerenchyma depending on strain and distance
with the colonised end (probably caused by the action at a distance of delignifiing enzymes). In contrast to
anaerobic digestion, Akin et al. (1995) showed that fungal attack can cause cells separation in the

Literature review
86
parenchyma and degrade partly the middle lamella. Fungal attack was also supposed to be function of the
thickness of the cell wall (Messner et al., 1998).
Some fungal treatments (30 d SSF with P. chrysosporium or C. stercoreus or P. sajor-caju) can increase the
silica content of rice straw (% TS). Thus, they are unable to remove this component (Karunanandaa et al.,
1995). In contrast, with a strain of Coriolus versicolor, a diminution of 30% in silica content was observed
for a 25-days pretreated rice straw (Phutela et al., 2011). It is likely that WRF can penetrate cuticle as
anaerobic fungi. Gamble (Gamble et al., 1996) observed cutin degradation by WRF but it was simultaneous
with cellulose degradation. Several authors found a capacity for white rot fungi to degrade lNipophilic
substances (Dorado et al., 2001; Qin et al., 2009) into fatty acids and sterols, this phenomenon could be
linked to the presence of laccase (Gutiérrez et al., 2006). Those components were consumed by fungi after
weeks of pretreatment (Dorado et al., 2001). Fatty acids take part in the anaerobic digestion reaction and
sterols seem no or little toxic for anaerobic process (Vidal et al., 2007). Pretreated straw surface became
hydrophilic, it facilitates microorganisms attachment (Liu et al., 2014). To finish, Phanerochaete
chrysosporium on wheat straw led to a disappearance of some resin acids (Qin et al., 2009). It can possibly
have a good influence on anaerobic digestion process (depending on resin acids and concentrations).
To investigate biomass composition and modifications due to fungal pretreatments, measurement techniques
are required, py-GC-MS is one of them.

Literature review
87
1.7 Pyrolysis-Gaz Chromatography-Mass Spectrophotometry (Py-GC-MS): a powerful tool for structure analysis
1.7.1 Definition and interest
Several techniques exist to study lignocellulosic biomass composition like Nuclear Magnetic Resonance
(NMR) or thioacidolysis. They can be very costly and required expert users (NMR) or time consuming
(several hours to degrade the substrate with thioacidolysis). Pyrolysis-Gas Chromatography-Mass
Spectrophotometry (Py-GC-MS) appears as a useful tool because almost no sample manipulation is required
and data from different compounds are provided (carbohydrates, proteins…) (Rodriguez et al., 1997). It is a
degradation technique but few milligrams are necessary.
Analytical pyrolysis (pyr) was first applied in 1860 (Moldoveanu, 2001) but pyrolysis coupled to GC-MS
first use occurred in 70’s by the NASA to detect bacteria in liquids (Mitz, 1969). Galletti & Bocchini (1995)
defined pyrolysis as the thermal fission (break) of a sample in the absence of oxygen into molecules of lower
mass, low enough to be suitable for Gaz Chromatography (GC) and/or Mass Spectrophotometry (MS) and
large enough to provide analytical information on the original sample. Fragments are separated and
identified thanks to GC-MS. Their nature and relative distribution constitute a fingerprint characteristic of a
particular sample.
Volatile compounds issued of pyrolysis are separated with GC according to their affinity with the
chromatographic column used and there are identified with their mass spectra (ions abundance and mass to
charge ratio). For Py-GC-MS, MS is generally equipped with an electron impact (EI) that allows breaking
molecules into charged fragments, then a separation takes place in a quadrupole. The quadrupole is
composed of four rods, two positively charged and two negatively charged, creating an electrical field that
leads to a separation of ions according to their m/z (mass/charge) ratio.
Quantitative methods used to measure main components of lignocellulose allow good estimation but
different methods give different results. This is partly due to the difficulty to isolate pure fractions (proteic
residue in lignin fraction, etc.) (Reeves and Francis, 1997). Generally pyrolysis is a semi-quantitative
method but use of internal standard is possible (Alves et al., 2006). However, using a large range of lignin
contents, it was possible to establish a correlation between Klason lignin and lignin estimated with pyrolysis
for wood, grasses and crop residues without internal standard (Alves et al., 2006; Fahmi et al., 2007; Ross
and Mazza, 2011). Py-GC-MS is considered as a sensitive, rapid and reproducible technique with almost no
waste generation (Galletti and Bocchini, 1995).
Some compounds formed by Py-GC-MS of organic matter are known to originate from lignin,
polysaccharides or also proteins, etc. (Dignac et al., 2005). This technic is particularly suitable for lignin
since aromatic nuclei largely retain their substitution patterns (Ralph and Hatfield, 1991). Thus, Py-GC-MS
allows to differentiate lignin G-units and S-units, some authors also studied H-units but compounds derived

Literature review
88
from H-units are often considered as unspecific, especially because they can also originate from cinnamic
acids which are frequent in non-woody-plant (Camarero et al., 1999; Ross and Mazza, 2011). Moreover, H-
units are the less abundant units in grasses (Fahmi et al., 2007) but would be the most difficult to degrade
(Burlat et al., 1997; Camarero et al., 2001). Concerning information about carbohydrates, unique origin
peaks are rare, it can be notably difficult to differentiate hemicelluloses and cellulose products (Ralph and
Hatfield, 1991).
Py-GC-MS of lignocellulose was successfully applied to study relative amounts of lignin and
carbohydrates (efficiency of isolation methods…), to classify lignin based on their S/G ratio (hybrids
differentiation…), and to follow chemical changes in cell walls during plant maturation or after chemical or
biological delignification. Finally, it is a useful tool to determine the origin and composition of food and
feed, forest litter, compost and materials from paper industry (pulps, papers, effluents) (Galletti and
Bocchini, 1995; Ohra-Aho et al., 2013; Reeves and Galletti, 1993).
1.7.2 Pyrolysis products (pyrolysates)
1.7.2.1 Formation mechanisms
Samples are rapidly (few milliseconds) heated to a precisely controlled equilibrium temperature, generally in
the range 600-800 °C for few seconds, and cooled rapidly in order to avoid non-isothermal pyrolysis. The
same substance pyrolyzed in identical conditions gives the same degradation products (profile) that is why
Py-GC-MS is a reproducible technique. Degradation of polymer is dependent on the relative strengths of
the bonds inside the molecule. Bonds breaking form free radicals requiring rearrangement to form stable
compounds that is why products reflect molecular structure, stability of free radicals, substitution and
internal rearrangements. Substituents of the polymer backbone can be split off (side-group scission), the
backbone can be partially cut leading to smaller polymers (chain scission) or almost entirely reverts to
monomer (unzipping) (Galletti and Bocchini, 1995; Wampler, 1999). It is difficult to elaborate a general
theory concerning pyrolysates formation as substrate and operating conditions interact (Moldoveanu, 2001).
Aromatic structures are generally resistant. Thereby, bonds between monomers (ether and certain C-C
linkages) with lower bond dissociation energy than aromatic rings are preferentially attacked during lignin
thermal decomposition. Breakdown products are phenols, aldehydes, ketones, acids and alcohols, generally
with the retention of the original substituents (OH, OCH3) on the phenyl ring (Simoneit, 2002). Therefore,
products reflect the distribution of monomers (G- and S-units) and the types of bonds linking them (Ware,
2013). Pyrolysis of lignin forms small compounds such as H2O, CO2, CH2O and CH2O2 and leads to the
generation of free radicals, concerned molecules must then rearrange to keep a stable structure. For
example, anisole can lead to benzyl alcohol formation (Figure 1-17). Different thermal reactivities exist
among bonds and monolignols constituting lignin or formed with pyrolysis (easier removal of OH groups
against OCH3, etc.). A same linkage, for example ether bond (C-O-C) can be easily broken when situated

Literature review
89
near the carbon ring (α- or β-O-4 bonds) whereas it is more resistant with a γ-carbon. C-C cleavage occurs
in side chain but dehydration reactions can produce new C-C bonds increasing lignin heat resistance. After
extensive oxygen removal, dehydrogenation takes place, some hydrogen atoms are even splitted from
aromatic rings. Phenolic composition yield is dependent on pyrolysis temperature, aldehydes start to be
reconverted at temperature higher than 600°C (C Amen-Chen et al., 2001).
Figure 1-17. Possible rearrangements for anisole during Py-GC-MS. (Schlosberg et al., 1983)
The depolymerization of polysaccharides by cleavage of glycosidic bonds arises during carbohydrates
pyrolysis. These processes are accompanied by dehydrations, ring opening mechanisms and cracking
reactions (C-C break). Figure 1-18 illustrates some products formation mechanisms during pyrolysis of
glucose polymers such as cellulose (Ware, 2013). Polysaccharides pyrolysis produces fragments of furanic
and pyranic nature (rings with an oxygen replacing a carbon atom), generally deriving from sequential
dehydration processes (Galletti and Bocchini, 1995) but also from fission, decarbonylation (carbonyl: R2-
C=O) and decarboxylation (carbonyl with OH) reactions (Lv and Wu, 2012). Their identification is more
difficult than that of lignin markers, notably because of several isomers formation with dehydration. Isomers
are difficult to differentiate on pyrograms (Galletti and Bocchini, 1995).
J
Figure 1-18. Formation of certain pyrolysates from cellulose and glucans.
Anisole
Benzyl acohol
Pyrolysis
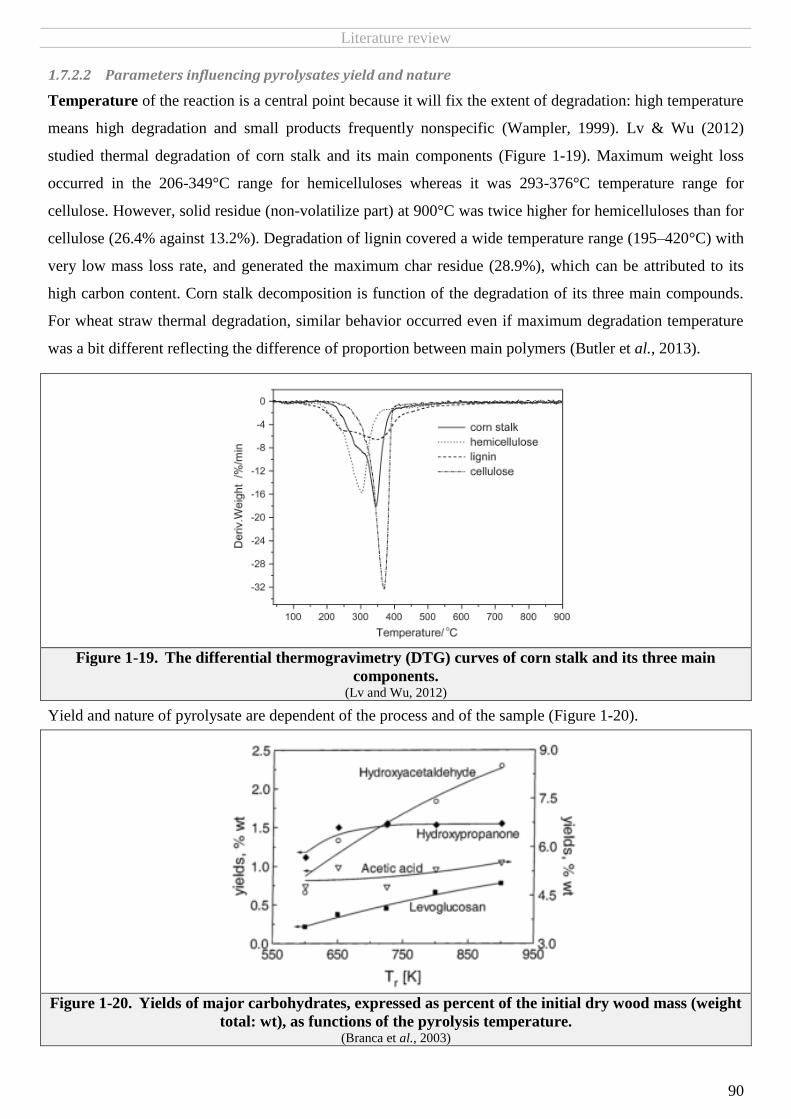
Literature review
90
1.7.2.2 Parameters influencing pyrolysates yield and nature
Temperature of the reaction is a central point because it will fix the extent of degradation: high temperature
means high degradation and small products frequently nonspecific (Wampler, 1999). Lv & Wu (2012)
studied thermal degradation of corn stalk and its main components (Figure 1-19). Maximum weight loss
occurred in the 206-349°C range for hemicelluloses whereas it was 293-376°C temperature range for
cellulose. However, solid residue (non-volatilize part) at 900°C was twice higher for hemicelluloses than for
cellulose (26.4% against 13.2%). Degradation of lignin covered a wide temperature range (195–420°C) with
very low mass loss rate, and generated the maximum char residue (28.9%), which can be attributed to its
high carbon content. Corn stalk decomposition is function of the degradation of its three main compounds.
For wheat straw thermal degradation, similar behavior occurred even if maximum degradation temperature
was a bit different reflecting the difference of proportion between main polymers (Butler et al., 2013).
Figure 1-19. The differential thermogravimetry (DTG) curves of corn stalk and its three main
components. (Lv and Wu, 2012)
Yield and nature of pyrolysate are dependent of the process and of the sample (Figure 1-20).
Figure 1-20. Yields of major carbohydrates, expressed as percent of the initial dry wood mass (weight
total: wt), as functions of the pyrolysis temperature. (Branca et al., 2003)

Literature review
91
Concerning process variables, influence of set point temperature was already discussed but heating rate is
another important parameters. It can influence the occurrence of secondary reactions, i.e. recombination into
larger fragments (C Amen-Chen et al., 2001). Samples moisture, ash content (especially alkali metal
content), organic composition and particle size can also modify yield of pyrolytic products (Fahmi et al.,
2007). To achieve the fast heating rates needed, pyrolysis zone and sample amount (less than 1 mg) must be
small to favor energy transfer. Small samples avoid also temperature gradients that would hamper
reproducibility owing to different pyrolysis temperatures. Finally, small samples degrade completely and
rapidly and the capacity of the column is not exceeded, so good resolution is possible (Wampler, 1999).
However, small sample amount limit sample representativeness especially for heterogeneous sample. The
pyrolyzer should have a small internal volume to transfer the pyrolysate into the column efficiently, i. e.
recovering of all products without additional reactions caused by a too long exposure to high temperature.
With the same goal, a rapid inert gas carrier flow is applied. The gas is also used to purge the system: avoid
oxidation during pyrolysis and protection, especially for the mass spectrometer, from intrusion of air into the
system (Wampler, 1999)
Ash content (salts and metal ions) and thus also pretreatment modifying ash content (hot water or acid
washing) have an influence on pyrolysates (Branca et al., 2003). Some specific mineral content (potassium,
sodium, magnesium and calcium) introduces catalytic effects on the degradation of biomass favoring
fragmentation to low molecular weight components. Potassium concentration in plant varies over the
growing season. It is considered to have the greatest influence on plant thermal conversion comparing to
other metals present in biomass (Nowakowski and Jones, 2008). Washing biomass reduces the alkali metal
content that is thought to inhibit the release of specific products during pyrolysis. With a washing step,
cellulose derived compounds would be increased due to more depolymerisation rather than fragmentation
(ring scission) leading to compounds with higher molecular weight and reducing compounds of lower
molecular weight. Similar principle can be applied to lignin compounds (Fahmi et al., 2007).
1.7.3 Various existing technologies for Py-GC-MS
Several heating techniques are employed in pyrolysers. Samples can directly been introduced in hot furnace
(continuous mode) or placed on cold probe that will be rapidly heated to the desired temperature (pulse
mode): Curie-point pyrolysis and heated filament. Curie-point temperature is reached through induction of
current using a high frequency coil, when this temperature is attained (depending on the metal used), no
more current can be induced. Thus, temperature in Curie-point pyrolysers is rigorously controlled. Heated
filament pyrolysers have generally a platinum coil heated electronically to the chosen temperature. This
system allows temperature variation and larger sample amounts (leading to better reproducibility).
Moreover, sample loading is simplest as introduced in quartz tube whether than deposited on the coil as it
can be the case for Curie-point heating technique (Galletti and Bocchini, 1995; Wampler, 1999). Pulse mode

Literature review
92
with a metal coil offers maximum heating rate and heat transfer to the sample comparatively to a continuous
mode with heated chamber.
Then, several GC columns are used depending on pyrolysates (and thus on sample). According Dignac et al.
(2006), polar columns are better to separate main compounds originating from lignocellulosic biomass. The
stationary phase of polar columns can be composed of polyethyleneglycol with fused silica (Figure 1-21) as
for column SolGelWax, SGE. The use of semi-polar column for a good separation of carbohydrates and
lignin is also reported (Fahmi et al., 2007).
J
Figure 1-21. Stationary phase for column SolGelWax, SGE: polyethyleneglycol with fused silica.
1.7.4 Py-GC-MS compared to chemical methods to study lignin structure
Most applied methods to study lignin structure are nitrobenzene oxidation (NBO), CuO oxidation and
thioacidolysis. They allow differentiating phenylpropanoid units (G-, S- and H- units) of lignin. Ratio of
phenylpropanoid units obtained with Py-GC- MS are often compared to those obtained with usual methods.
However, results are generally different between methods, especially because different bonds are cleaved.
Most frequent intermonomer linkages in lignin are ether bonds (C-O-C, especially β-O-4) but some units are
linked with C-C bonds.
Nitrobenzene oxidation (NBO) is a major technique for lignin structure analysis. It consists in a lignin
oxidation by nitrobenzene in alkaline medium (2 M NaOH) and at high temperature (160-180°C for 2-3
hours) followed by HPLC or derivatization step and GC. NBO cleaves uncondensed bonds type aryl-ether
(α-O-4, β-O-4) and α-β benzylic connections (Figure 1-4) that are alkali labile (Besle et al., 1986; Lapierre,
2010). There is not really a standard protocol and interlaboratory standard deviation can be as high as 20-
30% but for S/G ratio this standard deviation falls to 4-8%. S/G ratio determinated with NBO are lower than
actual since carbon-carbon condensed bonds are not cleaved (5–5, β-1, β-5, β-β) and G-units are most able
to form these resistant linkages than S-units (Lapierre, 2010; Monlau et al., 2013). NBO is not well adapted
to grasses because of the substantial amount of H-units (contrary to wood lignin) that decreases with mild
alkaline treatment (Lapierre, 2010). CuO oxidation, a method similar to NBO, is better suited for grass
lignin and is simpler (Camarero et al., 1994; Hedges and Ertel, 1982; Pepper et al., 1967), although on
wheat straw results of both methods are similar. Both oxidations yield 25-75% of the treated lignin in the

Literature review
93
form of simple phenols (Sun et al., 1995). NBO and CuO oxidation allow the identification of cinnamic
acids.
Thioacidolysis is an acid-catalyzed reaction for cleaving of β-O-4 bonds. Thioacidolysis is useful to study
uncondensed lignin but G/S ratio obtained with this technique does not represent the whole lignin
(Kishimoto et al., 2010). The addition of a desulfurization step after thioacidolysis leads to the obtaining of
dimers issued of condensed lignin (C-C linked units) and allows to study the proportion of the different
linkages (5–5, β-1, β-5, β-β). Finally, other chemical techniques exist but are more difficult to handle like
permanganate oxidation or derivatization followed by reductive cleavage (DFRC).
By taking only few compounds derived from lignin pyrolysis(rather than all lignin-derived compounds),
similar results between NBO and pyrolysis S/G were obtained on Eucalyptus wood (Lima et al., 2008). In
presence of tetramethylammonium hydroxide, Py-GC-MS main product was issued from β-O-4 bonds
cleavage that is why a linear correlation was obtained between Py-GC-MS results and thioacidolysis
(Kuroda et al., 2002). More studies would be required to better understand links between methods. Synthetic
lignin (DeHydrogenation Polymer: DHP) with known S/G could help but existing linkages in DHP are
considered to not be representative of natural lignin (Kishimoto et al., 2010; Saiz-Jimenez and De Leeuw,
1986).
Another application of chemical degradation is the estimation of phenolic content. Phenolic units of lignin
do not have their OH function engaged in ether bonds (Figure 1-22) and have a different reactivity than
etherified units. This property allows the fixation of a methyl function on their OH function. After this
methylation step, it is possible to study phenolic units with Py-GC-MS. Phenolic content of wheat straw
lignin was estimated as 19% of total units. Results were similar whether alkaline CuO oxidation or
thioacidolysis were employed for the determination. With Py-GC-MS, phenolic content is slightly
overestimated due to the joint estimation of pyrolysis products from lignin and cinnamic acid (Camarero et
al., 1994).
Lignin phenolic content influences lignin solubility and high content facilitates lignin extraction (as
alkaline extraction during paper pulp manufacture) (Camarero et al., 1999). It is not clear if phenolic units
are more susceptible to fungal degradation than etherified; as shown by Martinez-Inigo and Kurek (1997) on
wheat straw alkali lignin but contrary to the study of Burlat et al. (1997) on wheat straw degraded with
Phlebia radiata. Camarero et al. (2001) advanced that phenolic units are easier to degrade owing to a lower
redox potential.

Literature review
94
J
Figure 1-22. Hypothetical scheme for wheat lignin structure showing phenolic and etherified p-
hydroxyphenyl (H), guaiacyl (G) and syringyl (S) phenylpropanoids units together with p-coumaric
(Cou) and ferulic (Fer) acids, the latter involved in lignin-carbohydrate linkages. 1, etherified H; 8, phenolic H; 2, 5, 7 and 10, etherified G; 4 and 11, phenolic G; 3, 6, 9, 12 and 13, etherified S.
(Camarero et al., 2001)
The increased chemical agent strength to access C-C linked units goes with important risk of artifacts. Little
artifacts are obtained with Py-GC-MS. Moreover, contrary to Py-GC-MS, thioacidolysis requires volatile
chemicals and several preparation steps prior to chromatographic analyses (Kuroda et al., 2002). However,
with Py-GC-MS some structures coming from cinnamic acid (4-vinylphenol and 4-vinylguaiacol) can also
derive from lignin units. This could constitute an overestimation of lignin and those compounds must not be
taken into account to study lignin structure (Camarero et al., 1994; del Río et al., 2008). This phenomenon is
often considered as a limitation of the technic even if Ralph & Hatfield (1991) estimated that differentiation
of p-coumaric and ferulic acid derivatives in tissues with py-GC-MS is possible. The differentiation of
phenolic and etherified lignin units is possible with Py-GC-MS if a derivatization of lignin is made before
pyrolysis, e. g. a methylation step (Camarero et al., 1994). Finally, grass lignins are partially acetylated and
their acetylation cannot be studied with usual chemical techniques (except with derivatization followed by
reductive cleavage) but it seems possible with Py-GC-MS (del Río et al., 2004).
Derivatization of pyrolysates may also be done. It can improve the detectability of some analytes by
modifying their behavior in the chromatographic column. It was notably applied to differentiate the origin of
several carbohydrates (glucose, mannose, etc.) which is generally difficult with conventional techniques
(Moldoveanu, 2001). Py-GC-MS is not only a tool to investigate lignin structure but also other components
of lignocellulose.
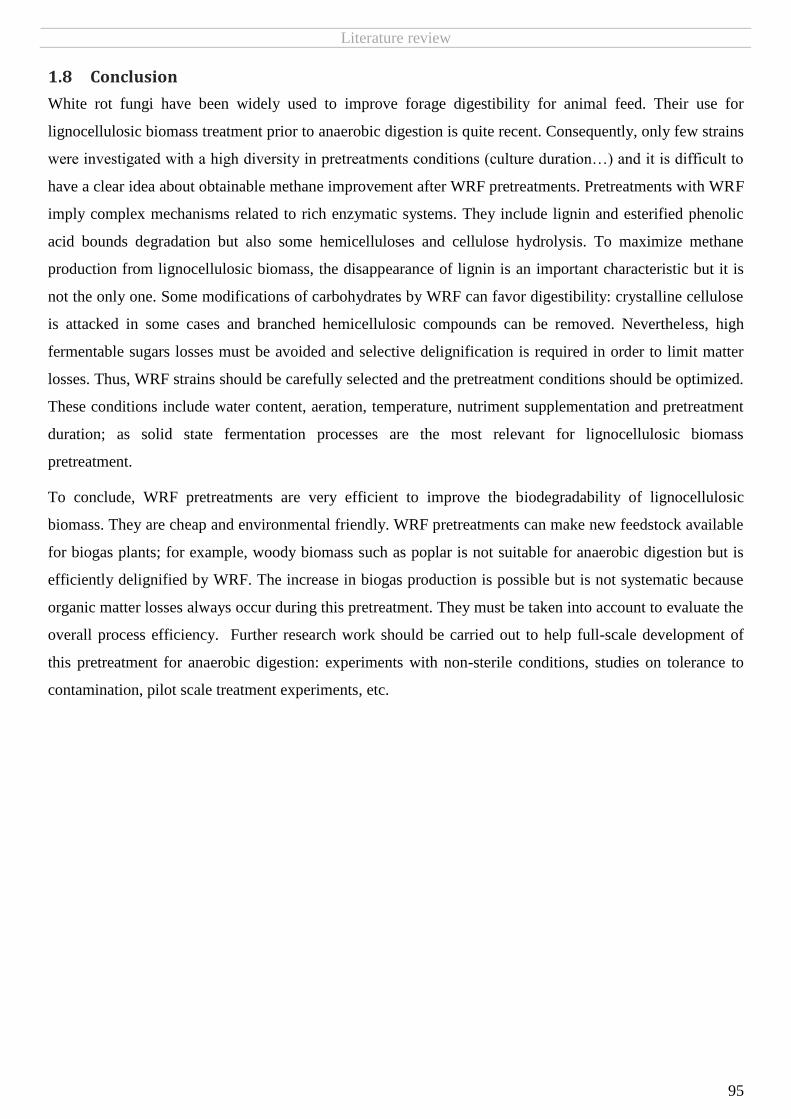
Literature review
95
1.8 Conclusion
White rot fungi have been widely used to improve forage digestibility for animal feed. Their use for
lignocellulosic biomass treatment prior to anaerobic digestion is quite recent. Consequently, only few strains
were investigated with a high diversity in pretreatments conditions (culture duration…) and it is difficult to
have a clear idea about obtainable methane improvement after WRF pretreatments. Pretreatments with WRF
imply complex mechanisms related to rich enzymatic systems. They include lignin and esterified phenolic
acid bounds degradation but also some hemicelluloses and cellulose hydrolysis. To maximize methane
production from lignocellulosic biomass, the disappearance of lignin is an important characteristic but it is
not the only one. Some modifications of carbohydrates by WRF can favor digestibility: crystalline cellulose
is attacked in some cases and branched hemicellulosic compounds can be removed. Nevertheless, high
fermentable sugars losses must be avoided and selective delignification is required in order to limit matter
losses. Thus, WRF strains should be carefully selected and the pretreatment conditions should be optimized.
These conditions include water content, aeration, temperature, nutriment supplementation and pretreatment
duration; as solid state fermentation processes are the most relevant for lignocellulosic biomass
pretreatment.
To conclude, WRF pretreatments are very efficient to improve the biodegradability of lignocellulosic
biomass. They are cheap and environmental friendly. WRF pretreatments can make new feedstock available
for biogas plants; for example, woody biomass such as poplar is not suitable for anaerobic digestion but is
efficiently delignified by WRF. The increase in biogas production is possible but is not systematic because
organic matter losses always occur during this pretreatment. They must be taken into account to evaluate the
overall process efficiency. Further research work should be carried out to help full-scale development of
this pretreatment for anaerobic digestion: experiments with non-sterile conditions, studies on tolerance to
contamination, pilot scale treatment experiments, etc.


Experimental strategy
97
Chapter 2.
Main experimental strategy
The current study investigates WRF pretreatment of wheat straw for anaerobic digestion notably because
few figures on methane improvement after such a pretreatment are available for grasses and straws. The
necessity to select a strain attacking lignin “selectively” was shown in the previous chapter; as well as the
requirement to optimize cultures conditions. Thus, the current work began with a strain selection step
followed by an optimization step. These two steps corresponded to two applied objectives of this work, their
goal was the maximization of methane production. Py-GC-MS was also used to characterize pretreated
straws for anaerobic digestion. The objective was to complete the answer to the central scientific question of
this work: how and in what proportion do fungal pretreatments impact anaerobic digestion of wheat straw?
Anaerobic digestion was carried out using Biochemical Methane Potential tests for all those steps.
Therefore, anaerobic digestion in reactor (6 L) was carried out with pretreated straw in order to be closer to
full-scale anaerobic digestion plant conditions. The third applied objective consisted to study Solid State
Anaerobic Digestion (SSAD) of pretreated straw.
In this chapter, common material and methods to several chapter are presented: fungal strains, BMP-tests,
etc. In others chapters, specific methods and results can be found, they are divided in: selection step,
optimization step, py-GC-MS study and solid state anaerobic digestion in reactor (6L). A non-exhaustive list
of main analyses per goal and results chapter is presented. Then, some precisions are given about material
and methods used for the general discussion (Chapter 7).
Table of content
2.1 MATERIAL AND METHOD COMMON TO ALL RESULTS CHAPTERS: MATERIAL ORIGIN AND BMP TESTS ......................................................... 98 2.1.1 Fungal strains ............................................................................................................................................................ 98 2.1.2 Wheat straw .............................................................................................................................................................. 98 2.1.3 Cultivation of Polyporus brumalis BRFM 985 in liquid medium ................................................................................ 98 2.1.4 Total Solids and Volatile Solids determination .......................................................................................................... 98 2.1.5 Biochemical Methane Potential (BMP) measurements: general case ...................................................................... 98
2.2 OVERVIEW OF ANALYSED SAMPLES ............................................................................................................................................ 100 2.3 MATERIAL AND METHODS SPECIFIC TO RESULTS OVERVIEW (CHAPTER 7) .......................................................................................... 102
2.3.1 Contamination problem .......................................................................................................................................... 102 2.3.2 Enzyme assays ......................................................................................................................................................... 103 2.3.3 Wheat straw compositional analyses ..................................................................................................................... 103

Experimental strategy
98
2.1 Material and method common to all results chapters: material origin and BMP tests
2.1.1 Fungal strains
As described by Zhou et al. (2015a), basidiomycete strains used in this study belong to the “Centre
International de Ressources Microbiennes” (CIRM-CF) dedicated to filamentous fungi of biotechnological
interest (INRA, 2013) and maintained at the French National Institute of Agricultural Research (INRA;
Marseille, France). The screened fungi were isolated from tropical and temperate forests.
2.1.2 Wheat straw
Winter wheat straw (Triticum aestivum, Haussmann) was obtained from Vivescia (Annex 2) and harvested
in the North of France in 2012 (unless otherwise indicated).
2.1.3 Cultivation of Polyporus brumalis BRFM 985 in liquid medium
To investigate properties of fungi (BMP, py-GC-MS…), strain P. brumalis BRFM 985 was cultivated on
200 mL liquid medium (malt extract broth 20 g/L) in Roux flasks plugged with cotton wool. All materials
and culture medium were autoclaved 20 min at 120°C. Inoculation was done with five 5-mm diameter agar
disc of 7-days-old mycelia grown on MA2 (malt extract broth 20 g/L and agar 20 g/L). After 10 days at
30°C, mycelium was harvested on sterile gauze, washed extensively with ultra-pure water and freeze-dried.
2.1.4 Total Solids and Volatile Solids determination
For each substrate and for the inoculum of anaerobic digestion, TS and VS were measured according to
Standard Methods (APHA, 1998). TS and VS were determined gravimetrically. TS correspond to the
residue after 24h (solid samples) or 48 h (liquid samples) drying period at 105°C. It is expressed in percent
of the sample initial weight. Dry residue is, then, burnt 3 h at 550°C. VS are the combusted organic matter
(expressed in percent of TS or of wet weight) whereas residue of the calcination step is the mineral matter
(ash). TS and VS measurements were realized in duplicates. Samples were measured again (in duplicates)
when a variation of more than 1% in TS or VS content between duplicates was observed.
2.1.5 Biochemical Methane Potential (BMP) measurements: general case
BMP were measured anaerobically in batch flasks at 36 °C. The volume of each flask was 600 mL, with a
working volume of 400 mL. It contained the substrate (VS substrate/VS inoculum = 1), a mesophilic
inoculum from anaerobic digester stored at 37°C (≈ 3 g VS/L), 5 mL of a macro-elements solution (NH4Cl
26.6 g/L; KH2PO4 10 g/L; MgCl2, 6H2O 6 g/L; CaCl2, 2H2O 3g/L), 4 mL of a microelements solution
(FeCl2, 4H2O 2 g/L; CoCl2, 6H2O 0.5 g/L; MnCl2, 4H2O 0.1 g/L; NiCl2, 6H2O 0.1 g/L; ZnCl2, 0.05 g/L;
H3BO3, 0.05 g/L; Na2SeO3, 0.05 g/L; CuCl2, 2H2O 0.04 g/L; Na2MoO4, 2H2O 0.01 g/L), 20.8 mL of a

Experimental strategy
99
bicarbonate buffer (50 g/L) and water (q. s. to 400 mL). Once the flasks were prepared, a degasification step
with nitrogen gas was carried out to obtain anaerobic conditions. The bottles were closed with air
impermeable red butyl rubber septum-type stoppers.
Flasks were mechanically agitated. Biogas production was followed by pressure measurements (Figure 2-1)
until the end of production (plateau phase). Methane volume produced between two pressure measurements
is determined using the ideal gas law: ∆𝑉 =(𝑦𝑗×𝑃𝑗−𝑦𝑗−𝑥×𝑃𝑗−𝑥)×𝑉𝑜𝑣𝑒𝑟ℎ𝑒𝑎𝑑
𝑅×𝑇×
𝑅×𝑇0
𝑃0. It is, thus, necessary to
known the gas overhead volume (Voverhead) and its temperature (T), as well as the pressure (Pj) in the bottle
and the methane content in biogas (yj); and finally, the methane content of the previous measurement (yj-x)
and the pressure after degassing of the previous measurement (Pj-x). The volume is expressed in Standard
conditions for temperature (T0 =273.15 K) and pressure (P0 =1 atm), so as the ideal gas constant
(R = 8.31 J/mol/K). At each measurement, endogenous production from the inoculum is calculated in the
same way (in flasks without substrate) and subtracted from the global production (∆𝑉) measured in flasks
with samples.
Figure 2-1. Method to follow methane production by pressure measurements. (Adapted from Motte, 2013)
Biogas composition (notably methane content: yj) was obtained at each pressure reading with a micro-gas
chromatograph: μGC Varian lGC-CP4900. The µGC was equipped with two columns: the first one,
Molsieve 5A PLOT, was set to 110°C to separate O2, N2, CH4; the second one, HayeSep A, was set to 70°C
to separate CO2 and H2S from other gases. The injector temperature was 110°C. The detection of gaseous
compounds was done using a thermal conductivity detector set to 55°C. The calibration was carried out with
a standard gas composed of 0.1% H2S, 0.5% O2, 10% N2, 25% CO2, and 64.4% CH4.
Preparation Incubation Initial pressure Analyze of Degassing Final pressure
at 36°C reading biogas composition reading

Experimental strategy
100
Measurements reliability is ensured by the sufficient production (around 350 NmL CH4/g DCO) obtained on
two positive controls containing 1 g DCO ethanol. Samples were generally measured in triplicates.
Specificities occurring for BMP tests of certain samples are mentioned in corresponding results chapters.
Substrate/inoculum ratio (VS basis) was the same for all BMP-tests. Even if inoculum source is constant, its
activity can vary between BMP-tests (see Chapter 1, 1.1.5.1).
Biogas composition for few BMP-tests was measured with a Clarus GC 480 (PerkinElmer, USA); equipped
with two columns used at 65°C: the first (RtUbond) was to separate O2, N2, CH4, the second (RtMolsieve)
was used to separate H2S and CO2 from other gases. The carrier gas was helium at pressure of 36 psi at 50
mL.min‐1. The injector and detector temperature was 200°C. The detection of gaseous compounds was done
using a thermal conductivity detector. The same calibration gas than for μGC was used to calibrate the GC
480.
2.2 Overview of analysed samples
In result chapters, diverse pretreatment conditions, anaerobic digestion system and analyses were used
(Table 2-1).
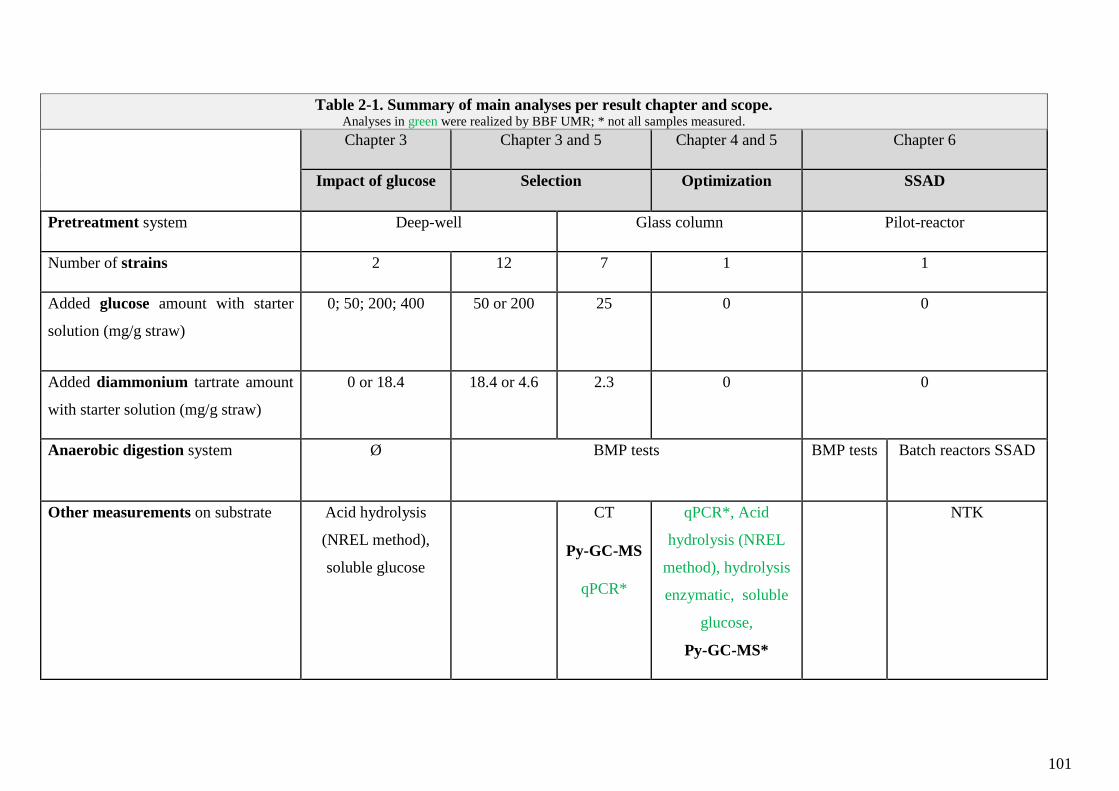
101
Table 2-1. Summary of main analyses per result chapter and scope. Analyses in green were realized by BBF UMR; * not all samples measured.
Chapter 3 Chapter 3 and 5 Chapter 4 and 5 Chapter 6
Impact of glucose Selection Optimization SSAD
Pretreatment system Deep-well Glass column Pilot-reactor
Number of strains 2 12 7 1 1
Added glucose amount with starter
solution (mg/g straw)
0; 50; 200; 400 50 or 200 25 0 0
Added diammonium tartrate amount
with starter solution (mg/g straw)
0 or 18.4 18.4 or 4.6 2.3 0 0
Anaerobic digestion system Ø BMP tests BMP tests Batch reactors SSAD
Other measurements on substrate Acid hydrolysis
(NREL method),
soluble glucose
CT
Py-GC-MS
qPCR*
qPCR*, Acid
hydrolysis (NREL
method), hydrolysis
enzymatic, soluble
glucose,
Py-GC-MS*
NTK

Experimental strategy
102
2.3 Material and methods specific to results overview (Chapter 7)
2.3.1 Contamination problem
2.3.1.1 Pilot-reactor cleaning verification
After cleaning and before inoculation, petri dishes were let in the pilot reactor with moisten air. Medium of
culture retained were PCA (Plate Count Agar) to access “total” bacterial growth and Sabouraud with
gentamicine to access fungal contaminations. PCA medium composition was: tryptone (5 g/L), yeast extract
(2.5 g/L), glucose (1 g/L) and agar (12 g/L). Sabouraud (Emmons) with gentamicine medium composition
was: peptone (10 g/L), glucose (20 g/L), agar (17 g/L), gentamicine (0.05 g/L). Sterile swabs moisten with
sterile physiological water were used to take samples on the pilot walls and in the water tank (used to moist
the air). Theses samples were also spread sterilely on PCA and Sabouraud with gentamicine. Then, petri
dishes were incubated for almost 10 days at 30°C. Physiological water was preferred to mQ water to avoid
osmotic lysis of microorganisms.
2.3.1.2 Wheat straw microflora
To check the absence of contaminants on wheat straw and sterile wheat straw and to test the ability of the
contaminant to survive after autoclaving, wheat straw microflora was studied on autoclaved wheat straw and
on contaminated straw which was autoclaved. Sterilely, 1 g straw was putted in Falcon® tube with glass
beads (abrasive effect) and 9 mL of physiological water with tween 1% (to avoid spores agglutination). The
medium was vortexed 2 minutes and incubated in horizontal position at 200 rpm during 45 minutes. Then,
0.5 mL was used to inoculate petri dishes with PCA and Sabouraud with gentamicine medium. Petri dishes
were incubated two weeks at 30°C. This protocol was elaborated by BBF UMR.
2.3.1.3 BMP-tests
BMP-tests comparing diverse wheat straws pretreated with P. brumalis BRFM 985 in the pilot-reactor of the
LBE. Straw without apparent fungal contaminations was the one used for SSAD (see 6.2.1). Straw
considered as moderately contaminated was obtained in the same conditions, except that: particles sizes was
around 10 cm for the two trays, 150 mL mQ were added before and after straw autoclaving, mix of
inoculum and straw was carried out in closed bags in a cement mixer. Straw considered as highly
contaminated was obtained in same conditions than the one for straw moderately contaminated but only
75 mL mQ water were added after autoclaving.

Experimental strategy
103
2.3.2 Enzyme assays
At the end of the pretreatment, enzymatic activities were measured by S. Zhou on water extracts (2 g TS in
40 mL mQ for 1 h at 4 °C, as for “4.2.3.4 Soluble sugars”). One unit of enzymatic activity was defined as
enzymes amount necessary to release 1µmol of reducing sugars per minute (Gimbert et al., 2014).
2.3.2.1 Glycoside Hydrolases (GH) activities
Enzymatic activities on carboxymethylcellulose (CMC), cellulose microcrystalline (avicel PH-101), xylans,
pectins, mannan, galactomannan, arabinan and arabinogalactan were measured with dinitrosalicylique
(DNS) method using glucose as standard.
2.3.2.2 Ligninolytic activities
Laccase activities were determined using ABTS (Acid 2,2’-azino-bis (3ethylbenzothiazoline-6-sulphonique)
oxidation by laccases. As previously described by (Bey et al., 2011), this reaction can be visualized by the
reduction of DCPIP (2,6-dichlorophenol-indophenol) after zymography (electrophoretic migration on gel
containing a substrate for enzymatic digestion).
Global peroxidase activity (MnP + MiP activities) was measured using 5 mM 2, 6-dimethoxyphenol in 100
mM sodium tartrate buffer (pH 5) in the presence of 0.1 mM H2O2 and 4 mM of sodium fluoride. Same
solution without MnSO4 was used to measure MiP activity. MnP activity was determined by the difference
between global activity and MiP activity.
2.3.3 Wheat straw compositional analyses
2.3.3.1 Data obtained for ethanol production study and PCA
Diverse analyses were carried out on straws pretreated with several strains, most of them were already
presented (e. g. TC in 3.2.2.1, fungal biomass in 5.2.3.2). Acid hydrolysis (to determine main polymers
amount) and cellulose enzymatic hydrolysis were carried out by S. Zhou (as explained in 4.2.3.2 and, 4.2.3.5
respectively). Glucose released by enzymatic hydrolysis of cellulose during 72 h was notably used to
calculate cellulose digestibility, as follows: 𝐷𝑖𝑔𝑒𝑠𝑡𝑖𝑏𝑖𝑙𝑖𝑡𝑦 (%) =𝑔𝑙𝑢𝑐𝑜𝑠𝑒 (𝑔) 𝑟𝑒𝑙𝑒𝑎𝑠𝑒𝑑 /𝑝𝑟𝑒𝑡𝑟𝑒𝑎𝑡𝑒𝑑 𝑊𝑆 (𝑔)
𝑔𝑙𝑢𝑐𝑜𝑠𝑒 (𝑔) 𝑐𝑜𝑛𝑡𝑎𝑖𝑛𝑒𝑑 𝑝𝑟𝑒𝑡𝑟𝑒𝑎𝑡𝑒𝑑 𝑊𝑆 (𝑔)⁄.
Lignin, cellulose and hemicelluloses losses compared to NIC were also calculated (see 4.2.3.3). Total
Kjeldahl Nitrogen (TKN) was measured in the same way as in 6.2.4.3 (Buchi 370-K distillater/titrator after
mineralization with Buchi digestion unit K438). PCA was realized with SIMCA software (see 5.2.4.2).
2.3.3.2 Fourier Transform InfraRed (FTIR) spectroscopy
FTIR was used to investigate changes in functional groups for constitutive polymers of straw. Covalently
bonded atoms and groups excited with infrared are set in motion. Vibrational excitation occurring is

Experimental strategy
104
characteristic of group component atoms. Consequently, compounds absorb infrared radiation that
corresponds to their energy vibration.
FTIR spectra were obtained on a Nicolet iS10 FTIR spectrometer (Thermo-scientific) equipped with a Smart
iTR module (diamond plate). Spectra were recorded in ten replicates, 16 scans with and an intervals
resolution of 4 cm−1 from 4000 to 600 cm−1. Then, spectra were analyzed using the Omnic software
(version 9.1).
Areas of diverse characteristic absorption bands (Table 2-2) were notably used to study relative amount of
polysaccharides compared to lignin: PS1/LIG (Area at 1375 cm−1
/ Area at 1512 cm−1
) and PS2/ LIG (Area
at 1158 cm−1
/ Area at 1512cm−1
). Lower Order Index (LOI) was also determined using a band ratio at 1430
and 898 cm−1
(peaks area). Same methodology as Monlau et al. (2012b) was then applied to determine the
amount of crystalline cellulose (%TS):
Crystalline cellulose𝐹𝑇𝐼𝑅(% 𝑇𝑆) = 𝐿𝑂𝐼
1+𝐿𝑂𝐼 × 𝐶𝑒𝑙𝑙𝑢𝑙𝑜𝑠𝑒 𝑁𝑅𝐸𝐿 (% 𝑇𝑆).
Table 2-2. Assignation of absorption bands in FTIR spectra.
Absorption
bands (cm−1
)
Characteristic chemical groups References
1512 C=C aromatic skeletal vibration in lignin (Shafiei et al., 2010; Yang et al.,
2009)
1430 CH2 of crystalline cellulose (Spiridon, 2011)
1375 C–H deformation in cellulose and hemicelluloses (Yang et al., 2009)
1158 C–O–C vibration in celluloses and hemicelluloses (Yang et al., 2009)
898 C–O–C vibration from amorphous cellulose (Shafiei et al., 2010; Spiridon, 2011)
2.3.3.3 Crystallinity measurement with X-Ray Diffractometry (XRD)
As described by Monlau et al. (2012b), X-ray measurements were performed by A. Barakat (IATE UMR)
with a Philips Analytical X-diffractometer, using Cu Ka radiation at k = 0.1540 nm (40 kV, 40 mA).
Measurements were carried out on powder compacted to small mats. XRD data were collected at 2θ angle
range from 5° to 50° with a step interval of 0.02°. The degree of crystallinity was expressed as a percentage
of crystallinity index (% CrI). The equation used to calculate the CrI was: CrI = I002−Iam
I002× 100, where I002
corresponds to the counter reading at peak intensity at a 2θ angle of 22° and Iam the counter reading at peak
intensity at 2θ angle of 16° in cellulose. I002 - Iam corresponds to the intensity of the crystalline peak and I002 is
the total intensity after subtraction of the background signal measured without cellulose. Crystalline
cellulose was determined using the equation:
Crystalline cellulose𝑋𝑅𝐷(% 𝑇𝑆) = CrI × 𝐶𝑒𝑙𝑙𝑢𝑙𝑜𝑠𝑒 𝑁𝑅𝐸𝐿 (% 𝑇𝑆).

Results and discussion: selection step (Chapter 3)
105
Chapter 3.
White-rot Fungi selection for pretreatment of
lignocellulosic biomass for anaerobic digestion and
impact of glucose supplementation
Objectives
Selection of a fungal strain for pretreatment of wheat straw for anaerobic digestion
To quantify methane improvement due to fungal pretreatments
To understand some mechanisms implied in pretreatment: impact of glucose addition
Table of content
3.1 INTRODUCTION ..................................................................................................................................................................... 105 3.2 MATERIAL AND METHODS SPECIFIC TO SELECTION STEP ................................................................................................................. 106
3.2.1 Fungal pretreatment ............................................................................................................................................... 106 3.2.1.1 SSF in 24-well plates ......................................................................................................................................................... 106
3.2.1.2 SSF in columns .................................................................................................................................................................. 107
3.2.2 Anaerobic digestion: samples characterization and normalization of BMP results ................................................ 108 3.2.2.1 Total Carbon (TC) measurements for pretreated samples in columns ............................................................................. 108
3.2.2.2 BMP-tests ......................................................................................................................................................................... 108
3.2.2.3 Normalization of BMP results for samples pretreated in deep-well................................................................................. 108
3.2.3 Impact of nutrient solution amount ........................................................................................................................ 109 3.2.3.1 SSF in deep well ................................................................................................................................................................ 109
3.2.3.2 Acid hydrolysis (Klason lignin, cellulose and hemicelluloses) ........................................................................................... 109
3.2.3.3 Determination of residual glucose .................................................................................................................................... 110
3.3 BMP IMPROVEMENT ............................................................................................................................................................. 110 3.3.1 Straw pretreated in 24-well plates .......................................................................................................................... 110 3.3.2 Straw pretreated in SSF columns ............................................................................................................................. 111 3.3.3 Pretreatments comparison...................................................................................................................................... 113
3.4 INFLUENCE OF STARTER SOLUTION ON PRETREATMENT .................................................................................................................. 113 3.4.1 Fate of the nutrient solution during the pretreatment ........................................................................................... 114 3.4.2 Nutrient solution and wheat straw composition ..................................................................................................... 115
3.4.2.1 Limited delignification ...................................................................................................................................................... 116
3.4.2.2 Carbohydrates consumption ............................................................................................................................................ 117
3.5 CONCLUSION ........................................................................................................................................................................ 119
Highlights
White-rot fungi pretreatment of wheat straw for anaerobic digestion
Polyporus brumalis BRFM 985 most efficient strain among screened ones
40% more methane (CH4) per gram of organic matter are produced
By taking into account weight losses during the pretreatment, still 20% more CH4
Possible limitation of delignification with addition of nutritive solution (glucose)

Results and discussion: selection step (Chapter 3)
106
3.1 Introduction
Most efficient lignocellulose degraders among fungi are Basidiomycete strains. In this phylum, Brown- and
White-Rot Fungi (WRF) are able to attack lignin. Whereas Brown-Rot Fungi (BRF) attack cellulose and
hemicelluloses with only small lignin modifications, WRF can lead to high lignin losses and are considered
as the best delignifying organisms.
A miniaturized screening (300 mg straw per strain) with SSF allowed comparing 63 Basidiomycetes strains
cultivated on wheat straw and miscanthus. They were grown on wheat straw in presence of nutrient solution
(starter solution) composed mainly of glucose (200 mg/g TS straw). Then, glucose and reducing sugars
released after 72 h enzymatic hydrolysis were measured for pretreated straws. Those data were analyzed
with a Hierarchical Cluster Analysis (HCA) and three groups were obtained: efficient, no effect and negative
effect strains. In the best case, sugar yield was up to 62% than the one of untreated control (Zhou et al.,
2015b).
Twelve strains were selected for further studies: eleven White-Rot Fungi (WRF) belonging to the efficient
group and a Brown-Rot Fungi, Gloeophyllum trabeum BRFM 236 (Banque de Ressources Fongiques de
Marseille). Gloeophyllum trabeum BRFM 236 belonged to the “no effect group” in the screening on wheat
straw and miscanthus but it was the first strain for the release of reducing sugars after hydrolysis when
cultivated on wheat straw (personal communication from Zhou).
Next selection step, presented in this chapter, consisted to investigate methane potential of wheat straw
pretreated with preselected strains. In addition, the impact of starter solution during wheat straw
pretreatment was studied.
3.2 Material and methods specific to selection step
3.2.1 Fungal pretreatment
Pretreatments were realized by S. Zhou (BBF UMR). Wheat straw composition was 37.5% of cellulose,
31.3% of hémicelluloses and 21.9% of lignin.
3.2.1.1 SSF in 24-well plates
Twelve preselected strains (Chapter 1, Table 3-1) were cultivated in three series, at different times in the
year by Zhou et al. (2015b) in BBF laboratory. Pretreatments were carried out with two and a half 24-well
plates (Whatman INC, Piscataway, USA) per strain (100 mg of straw/well). After the addition of 4 mL
deionized water to each well, plates were sealed with aluminum foil by an automatic plate sealer (PlateLoc,
Agilent, USA) and autoclaved at 110 °C for 30 min. After sterilization, the plates were centrifuged at 3500
rpm for 5 min, and 2 mL of the supernatant were discarded. The substrate was then washed by adding 2 mL
of sterilized water to each well, stirring at 450 rpm for 10 min (Microtron, Infors AG, Switzerland) and
removing 2 mL of the wash liquid after subsequent centrifuging. After three washing steps, 2 mL of nutrient

Results and discussion: selection step (Chapter 3)
107
solution (starter solution) were added per well and mixed. This addition of a carbon and nitrogen source was
to ensure initial fungal growth. For the first series, 200 mg glucose/g dry straw and 18.4 mg of tartrate
diammonium/g TS were added. In contrast, these quantities were divided by four for series 2 and 3,
notably to reduce the proportion of methane originated from the addition of the nutrient solution. The excess
liquid medium (i.e. 3 mL) was removed, leading to an initial wet wheat straw weight/TS ratio equals to 11.
The inoculation was carried out with one agar disc of 7-days-old mycelia (5-mm diameter) crushed and
mixed with substrates using a sterilized toothpick. The plates were covered with an adhesive membrane
(Breathseal, Greiner Bio-One), which allows gas exchange. The straw was then pretreated under a constant
humidity during 12 days at 25°C. To allow an extensive fungal colonization, the substrates embedded in
fungal mycelium were turned upside down at day 6, leaving an air space at the bottom of the well.
A control (T) was made: wheat straw treated under the same conditions but without fungal inoculation and
without starter solution. Another control with starter solution was also made (T starter). Samples were freeze-
dried and weighed to determine mass losses during the pretreatment. Owing to washing steps before fungal
inoculation, control straw also had mass losses (7%). Mass losses were expressed in percent of washed
control straw.
3.2.1.2 SSF in columns
In Solid-State Fermentation (SSF) glass columns (20 cm × 4 cm), other pretreated samples were obtained
from S. Zhou with a greater amount of substrate with seven fungi among the twelve tested in deep-well.
These seven strains were the best strains of the efficient group (most different than control) after a
clustering on both miscanthus and wheat straw based notably on fermentable sugars released after enzymatic
hydrolysis (Zhou et al., 2015b). A Brown-Rot Fungi (BRFM 236) belonging to “no effect group” was also
kept by way of comparison. In the same way as previously described by Zhou et al. (2015a), each column
contained 20 g total solids (TS) of autoclaved ground wheat straw (≈4 mm, cutting Mill SM 100, Retsch®,
Germany), 25 mg of glucose/g TS and 2.5 mg of tartrate diammonium/g TS (Sigma-Aldrich, France). Each
column was inoculated (Figure 3-1) with 120 mg (dry weight) ground mycelium. It was issued from liquid
culture (as presented in 2.1.3) and blended with sterile deionized water at 9500 rpm for 60 s using an Ultra-
turrax T25 Blender. Columns were thermostated at 28°C. Wet straw weight corresponded to 4.5 fold initial
TS weight. Airflow saturated with moisture was set to 120 mL/min, measured by a ball flowmeter. For each
strain, cultures in SSF columns were triplicated and the obtained pretreated wheat straws were homogenized
after 21 days of pretreatment. A Non-Inoculated Control (NIC) consisting of SSF culture without
inoculation was also made. Then, samples were freeze-dried.

Results and discussion: selection step (Chapter 3)
108
3.2.2 Anaerobic digestion: samples characterization and normalization of BMP results
3.2.2.1 Total Carbon (TC) measurements for pretreated samples in columns
The Total Carbon (TC) was estimated by a carbon analyzer (TOC-V CSN, Shimadzu and Solid Sample
Module-5000A) consisting in a combustion of the sample at 900°C with a cobalt/platinum catalyzer and
pure oxygen. The carbon dioxide released during the combustion is measured by a non-dispersive infrared
detector. Measurements were performed in duplicates. Glucose was used as control.
3.2.2.2 BMP-tests
BMP (see 2.1.5) of samples in deep-well were measured in duplicate, and were carried out independently for
each series.
3.2.2.3 Normalization of BMP results for samples pretreated in deep-well
Because of the two different concentrations of nutrient solution and the three series of BMP measurements,
results were normalized to better compare all samples. As nutrient solution implies further methane
production, a correction was performed to remove the effect of the nutrient solution: theoretical amount of
methane produced by nutrient solution (373 NmL/g glucose and 152 NmL/g tartrate diammonium) was
subtracted from the treated straw BMP (BMPX). Indeed, the difference between the control straw BMP
(BMPT) and the BMP of control straw with starter corresponded to the theoretical amount of methane
expected for the starter (data not shown).
BMPX were then normalized by the BMP of control straw obtained for each series (BMPT), to ensure that
results are not dependent of the inoculum that can slightly change. Finally, the improvement ratio
‘Improvement VSpretr’ was calculated: Improvement VSpretr = (BMPX - starter)/BMPT;
with BMPX: BMP of pretreated straw with strain X;
starter: theoretical amount of methane produced from the nutrient solution;
BMPT: BMP of the control straw;
BMPX, starter and BMPT are expressed in NmL/g of pretreated VS.
Figure 3-1. Three steps to inoculate wheat straw for culture in SSF columns. A. Strain conservation on agar dish. B. Realization of liquid culture in Roux flask inoculated with agar disks in static conditions.
C. Sterile straw inoculated with ground mycelium before culture in SSF column.
A B C

Results and discussion: selection step (Chapter 3)
109
During pretreatment there were mass losses from 8 to 29% TS depending on the strain and culture
conditions (see Chapter 1, Table 3-1 and Table 3-2). They can reduce the effectiveness of the pretreatment,
especially if losses concern fermentable sugars (cellulose and hemicelluloses). In order to consider these
losses, BMP were expressed in NmL/g of initial TS (before pretreatment) and the improvement ratio
‘Improvement TSinit’ was calculated: Improvement TSinit = (BMPX - starter)/BMPT;
in the same way as ratio ‘Improvement VSpretr’ but with BMPX, starter and BMPT expressed in NmL/g initial
TS and not in NmL/g VSpretr, as previously.
3.2.3 Impact of nutrient solution amount
3.2.3.1 SSF in deep well
S. Grisel (from BBF UMR) carried out SSF in deep-well in the same already described conditions (12 days
at 25°C) but straw was ground to 1 mm (using Retsch® SM100) for subsequent acid hydrolysis. Two strains
were used (BRFM 1369 and 985), one per 24-well plate. Several glucose solutions were added before fungal
inoculation: 0, 50, 200 and 400 mg glucose/g dry straw. To investigate the impact of added nitrogen, starter
was also tested with the same amount previously used for series 1: 200 mg glucose/g dry straw and 18.4 mg
of tartrate diammonium/g TS. Four to five wells per conditions were prepared. After fungal growth, samples
were freeze-dried.
3.2.3.2 Acid hydrolysis (Klason lignin, cellulose and hemicelluloses)
The lignin, cellulose and xylan contents were analyzed following adapted NREL (National Renewable
Energy Laboratory) acid hydrolysis method (Sluiter et al., 2011). Two-stage sulfuric acid hydrolysis was
used to determine carbohydrates (glucan and xylan). Klason lignin was the insoluble residue remaining after
immersion of the samples in 72% sulfuric acid at 30°C for 1 h and then boiling the sample in 4% sulfuric
acid at 120°C for 1 h. The insoluble residue was separated from the supernatant by filtration on fibreglass
paper (GF-F, Whatman). Each fiberglass filter was previously dried at 105°C during 24 h in crucible and
weighted. Once acid insoluble lignin recovered on filters, they were dried again in the corresponding
crucible and weighted to know the dry amount of Klason lignin. The soluble fraction was used to determine
the acid-soluble lignin using a spectrophotometric method. The lignin content corresponded to the
summation of Klason lignin and acid-soluble lignin.
After filtering to 0.2 µm (Nylon membrane, Acrodlsc ®), the supernatant was used to determine its glucose
and xylose content. A high performance liquid chromatography (HPLC) (Dionex, Ultimate 3000) equipped
with a Bio-Rad Aminex HPX-87H column (heated to 35°C) and corresponding microguard were used to
separate sugars monomers. A refractive index (RI) detector (Water R410) was used to detect monomeric
sugars in the acid hydrolysates. The mobile phase was 0.004 M H2SO4 at a flow rate of 0.4 mL/min. The
system was calibrated with glucose and xylose (Sigma–Aldrich) solutions at 0.2; 0.5; 1; 2 and 5 g/L. The

Results and discussion: selection step (Chapter 3)
110
conversion from glucose to cellulose required a factor 0.9 (M cellulose/M glucose), glucose content was
used to obtain cellulose amount, as follows:
𝐶𝑒𝑙𝑙𝑢𝑙𝑜𝑠𝑒 (%) = [𝐺𝑙𝑢𝑐𝑜𝑠𝑒](𝑔/𝐿) × 𝑉𝑓𝑖𝑙𝑡𝑟𝑎𝑡𝑒 (𝐿)
𝑑𝑟𝑦 𝑤𝑒𝑖𝑔ℎ𝑡 𝑠𝑎𝑚𝑝𝑙𝑒 (𝑚𝑔)× 0.9 × 100
In the same way, xylose content allowed determining xylan amount (main component of wheat straw
hemicelluloses), the conversion factor used is 0.88 (instead of 0.9 for cellulose). One or two measurements
were carried out, depending on sample available amount.
3.2.3.3 Determination of residual glucose
Because cellulose is calculated from glucose amount, it is necessary to estimate the remaining glucose
coming from starter solution to not overestimate cellulose. As glucose is very soluble, 100 mg pretreated
straw were put in 10 mL mQ heated half an hour at 50°C under agitation. This solution was then analyzed
by HPLC. Owing to limited straw quantity, one sample per glucose solution and per strains was used.
Residual glucose (Chapter 1, Table 3-3) was removed from total glucose obtained after acid hydrolysis to
determine cellulose amount.
3.3 BMP improvement
3.3.1 Straw pretreated in 24-well plates
BMP of straws pretreated in deep-well were normalized to express ratio Improvement VSpretr and
Improvement TSinit, notably because of the use of two different amounts of nutrient solution (mainly
glucose) for pretreatment (series 2 and 3 different from series 1, see 3.2.1.1 for further details).
Table 3-1 shows the improvement of methane potential relatively to the control straw and expressed per
gram of pretreated straws Volatile Solids (VS): ratio ‘Improvement VSpretr’. Values of this ratio higher than
one show an improved biodegradability of pretreated straws. It can be observed an improvement up to 40%
after pretreatments with Trametes pavonia and Trametes menziesii.
If mass losses are taken into account thanks to the ratio ‘Improvement TSinit’ (Table 3-1), up to 20%
improvement was found after pretreatment with Trametes menziesii (BRFM 1369). Three other strains are
efficient regarding to this ratio: Trametes pavonia (BRFM 1554), Leiotrametes sp. (BRFM 1048),
Ganoderma flaviporum (BRFM 1570). Methane improvement considering mass losses is scarcely studied in
literature.
From this experiment, strains that did not seem efficient with the criterion ‘Improvement VSpretr’ were all
grown with the greater amount of starter solution (series 1: 200 mg glucose/g TS straw and 18.4 mg of
tartrate diammonium/g TS) which may have limited the effect of the pretreatment (as shown in 3.4). Among
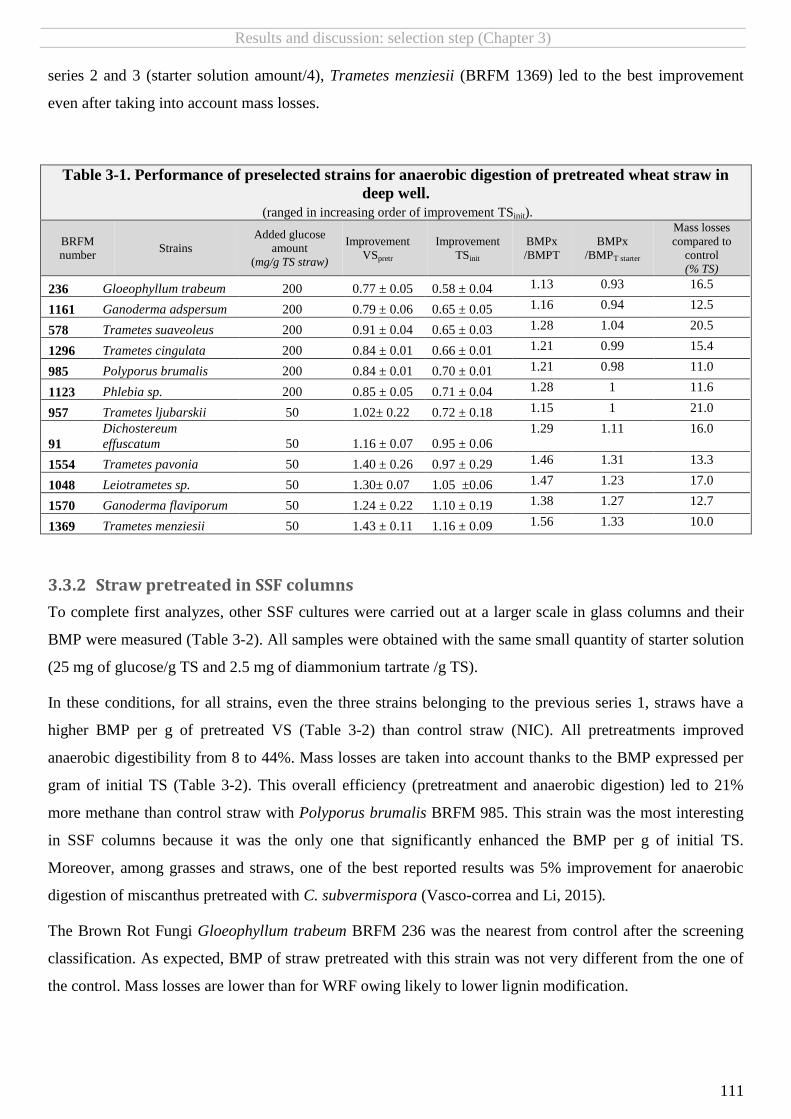
Results and discussion: selection step (Chapter 3)
111
series 2 and 3 (starter solution amount/4), Trametes menziesii (BRFM 1369) led to the best improvement
even after taking into account mass losses.
Table 3-1. Performance of preselected strains for anaerobic digestion of pretreated wheat straw in
deep well.
(ranged in increasing order of improvement TSinit).
BRFM
number Strains
Added glucose
amount
(mg/g TS straw)
Improvement
VSpretr
Improvement
TSinit
BMPx
/BMPT
BMPx
/BMPT starter
Mass losses
compared to
control
(% TS)
236 Gloeophyllum trabeum 200 0.77 ± 0.05 0.58 ± 0.04 1.13 0.93 16.5
1161 Ganoderma adspersum 200 0.79 ± 0.06 0.65 ± 0.05 1.16 0.94 12.5
578 Trametes suaveoleus 200 0.91 ± 0.04 0.65 ± 0.03 1.28 1.04 20.5
1296 Trametes cingulata 200 0.84 ± 0.01 0.66 ± 0.01 1.21 0.99 15.4
985 Polyporus brumalis 200 0.84 ± 0.01 0.70 ± 0.01 1.21 0.98 11.0
1123 Phlebia sp. 200 0.85 ± 0.05 0.71 ± 0.04 1.28 1 11.6
957 Trametes ljubarskii 50 1.02± 0.22 0.72 ± 0.18 1.15 1 21.0
91
Dichostereum
effuscatum 50 1.16 ± 0.07 0.95 ± 0.06
1.29 1.11 16.0
1554 Trametes pavonia 50 1.40 ± 0.26 0.97 ± 0.29 1.46 1.31 13.3
1048 Leiotrametes sp. 50 1.30± 0.07 1.05 ±0.06 1.47 1.23 17.0
1570 Ganoderma flaviporum 50 1.24 ± 0.22 1.10 ± 0.19 1.38 1.27 12.7
1369 Trametes menziesii 50 1.43 ± 0.11 1.16 ± 0.09 1.56 1.33 10.0
3.3.2 Straw pretreated in SSF columns
To complete first analyzes, other SSF cultures were carried out at a larger scale in glass columns and their
BMP were measured (Table 3-2). All samples were obtained with the same small quantity of starter solution
(25 mg of glucose/g TS and 2.5 mg of diammonium tartrate /g TS).
In these conditions, for all strains, even the three strains belonging to the previous series 1, straws have a
higher BMP per g of pretreated VS (Table 3-2) than control straw (NIC). All pretreatments improved
anaerobic digestibility from 8 to 44%. Mass losses are taken into account thanks to the BMP expressed per
gram of initial TS (Table 3-2). This overall efficiency (pretreatment and anaerobic digestion) led to 21%
more methane than control straw with Polyporus brumalis BRFM 985. This strain was the most interesting
in SSF columns because it was the only one that significantly enhanced the BMP per g of initial TS.
Moreover, among grasses and straws, one of the best reported results was 5% improvement for anaerobic
digestion of miscanthus pretreated with C. subvermispora (Vasco-correa and Li, 2015).
The Brown Rot Fungi Gloeophyllum trabeum BRFM 236 was the nearest from control after the screening
classification. As expected, BMP of straw pretreated with this strain was not very different from the one of
the control. Mass losses are lower than for WRF owing likely to lower lignin modification.

112
Table 3-2. BMP, Total Carbon (TC), mass and carbon losses of straw pretreated in columns with different strains. (ranged in increasing order of BMP expressed in NmL/g initial TS: BMP TSi).
a, b samples followed by the same letter are not significantly different and
bc sample is different from
bd sample (ANOVA, α = 0.05).
BRFM
number
Strains Added
glucose
amount
(mg/g TS
straw)
Series number
when
pretreated in
24-well plates
BMP TS final
(NmL/g
pretreated TS)
BMP VS
(NmL/g
pretreated VS)
BMP VS/
BMP NIC
(%)
BMP TSi
(NmL/g
initial TS)
BMP TSi/
BMP NIC
(%)
Mass loss
compared
to control
(% TS)
TC
(% TS)
TC
(%TS
initial)
C loss
(% TS)
Mass
loss/
C loss
1369 Trametes
menziesii 25 2 198 ± 5 210 ± 5 108 167± 6 93 20.7 44.35
b 35.16 10.85 1.91
1554 Trametes
pavonia 25 2 200 ± 1 212 ± 2 109 164 ± 1 92 15.2 44.34
b 37.60 8.41 1.81
957 Trametes
ljubarskii 25 3 249 ± 21 266 ± 23 137 172 ± 21 96 28.8 43.91
b 31.27 14.74 1.95
NIC 25 Ø 186 ± 12 194 ± 13 179 ± 12 0 46.01a 46.01
236 G.trabeum 25 1 207 ± 41 217 ± 43 112 184 ± 41 103 7.7 46.31a 42.73 3.28 2.36
1296 Trametes
cingulata 25 1 230 ± 2 243 ± 3 125 186 ± 2 104 15.6 44.26
b 37.35 8.67 1.80
1048 Leiotrametes sp. 25 2 220 ± 2 232 ± 2 120 190 ± 2 106 14.9 43.81bc
37.29 8.72 1.71
985 Polyporus
brumalis 25 1 264 ± 5 280 ± 5 144 217 ± 5 121 13.7 44.93
bd 38.80 7.22 1.89

Results and discussion: selection step (Chapter 3)
113
3.3.3 Pretreatments comparison
Few studies were carried out on anaerobic digestion after fungal pretreatment. For grass and straw, the
methane production can be enhanced between 4% and 63% volume per amount of pretreated TS (Chapter 1,
Table 1-4, Rouches et al. 2016). With improvement between 2 and 44% for pretreated VS in deep well or in
columns, results of the present study are of the same order of magnitude than literature. However these
values do not take into account the mass loss that occurred during pretreatment. This loss can lead to a
negative impact of the pretreatment as observed by Müller and Trösch (1986) on wheat straw pretreated with
Pleurotus florida: 27.9% CH4 more (v/w TS) but with 42.5% TS loss for 90 days of pretreatment. In this
study, impact of the pretreatment is sometimes positive even after taking into account mass losses (3% to
21%). Mass losses are very dependent of pretreatment duration. Average TS loss is normally about 26% for
wheat straw degraded with WRF and it varies from 12% to 66% (Jalč, 2002) cited by (Rodrigues et al.,
2008). Obtained mass losses in this study are in agreement with literature for both deep well and column
cultivations.
In deep well, strains that had received the greater amount of starter (series 1) were less efficient but are
interesting when grown in SSF column conditions which had received a very low amount of starter solution.
A negative impact of starter addition is suspected.
Taking into account standard deviation and treating separately series 1 from other samples, there are no
drastic differences in strains classification according to their pretreatment ability between culture in deep-
well or in column. Moreover, weight losses are of the same order of magnitude in both processes. Implied
mechanisms can thus be assumed to be well represented with small straw amounts used in deep well. This
technic is adapted for a screening. However, culture conditions play an important role for the effectiveness
of pretreatment and must be studied to optimize pretreatment (Wan and Li, 2012).
3.4 Influence of starter solution on pretreatment
Glucose addition represents an additional cost. Moreover, glucose addition during the pretreatment seems to
have a negative influence on the BMP. Several phenomena can explain the lower BMP for series 1 in deep-
well: i) the correction due to the starter can be overestimated; ii) consumption of cellulose and
hemicelluloses may have increased and iii) delignification may have decreased compared to samples that
had received less starter.

Results and discussion: selection step (Chapter 3)
114
3.4.1 Fate of the nutrient solution during the pretreatment
At the end of the pretreatment, the nutrient solution can have been converted to fungal biomass, lost under
the form of CO2 or remained on straw.
Soluble glucose remaining in samples was measured with several pretreatments conditions in deep well
(Table 3-3). All the glucose from nutrient solution was consumed when added amount was 50 mg of
glucose/g (as for series 2 and 3) whereas until half of the glucose remained for 200 mg of glucose/g (as for
series 1).
Amount of fungal biomass formed is dependent of strains and of culture conditions. Literature data
transposable to this study cannot be found but by way of example, Jeffries et al. (1981) estimated that
without limitations 2.2 mg of carbohydrates produce 1 mg of mycelial biomass for the WRF Phanerochaete
chrysosporium. BMP of fungi are high but inferior to the one of glucose, as it is 327 ± 36 NmL/g VS for the
mycelium of P. brumalis (BRFM 985) against 373 NmL/g VS for glucose.
Small quantities used in deep well did not allow to measure fungal biomass and it was considered that all
nutrient solution remained on straw to express BMP improvement ratio. Thus, impact of starter solution was
a bit overestimated and can partly explain lower results for series 1. The more glucose was added, the more
fungal biomass growth can be assumed and the more the impact of starter is overestimated with ratios
Improvement VSpretr and TSinit. However, without starter correction, taking the ratio BMPX/BMPT (Table
3-1), series 1 seemed still less interesting than others. In addition, almost no strain of series 1 gave higher
BMP than the one of control with starter (BMPx/BMPNIC in Table 3-1). Consequently, other reasons would
explain bad results for series 1 like greater carbohydrates consumption or lower delignification.
Carbon loss under the form of CO2 can come either from straw or from starter. To have an idea of carbon
loss, Total Carbon content (TC) was measured for pretreated samples in columns (Table 3-2). Mass losses
are taken into account by the expression of TC in percent of initial TS (%TS init), i.e. TS before
Table 3-3. Remaining glucose for several nutrient solution amounts added for the pretreatment of
wheat straw with P. brumalis BRFM 985 or T. menziesii BRFM 1369.
Strains
Added diammonium
tartrate
(mg/g straw)
Glucose added during the
pretreatment
(mg/g straw)
Soluble glucose in substrate
(mg/g straw)
Polyporus brumalis
BRFM 985
0 0 5.6
0 50 3.0
0 200 43.6
18.4 200 12.3
0 400 170.3
Trametes menziesii
BRFM 1369
0 0 7.9
0 50 4.8
0 200 92.8
18.4 200 112.8
0 400 212.8

Results and discussion: selection step (Chapter 3)
115
pretreatment. Then, C losses are expressed as the difference between TC of the control and TC (%TS init)
for pretreated straw. Finally, to determine the part of mass losses due to CO2 release: ratio mass loss/C loss
was calculated. In average, this ratio reaches 1.85 for WRF, whereas it is higher for the BRF, G. trabeum
(BRFM 236). It may reveal greater carbohydrates consumption for the BRF (Sánchez, 2009).
3.4.2 Nutrient solution and wheat straw composition
According Reid and Deschamps (1991), glucose as co-substrate with synthetic lignin can limit the
delignification by WRF. With the WRF Phanaerochaete chrysosporium, when carbohydrates are limiting,
supplementary carbohydrates cause a transient repression of ligninolytic activity (Jeffries et al., 1981). First
metabolism of WRF consists in mycelial growth along with easily accessible carbohydrates consumption.
Then, mycelial growth stops or even decreases, and the secondary metabolism of delignification takes place
in response to depletion (carbohydrates, N…) (Jeffries et al., 1981; Mester et al., 1996; Zadražil, 1977). Shi
et al. (2014a) modeled this behavior for P. chrysosporium growing on cotton stalks (Figure 3-2). However,
duration of each step is function of strain, substrate and cultures conditions.
In addition, delignification is dependent on the amount of mycelium produced during the primary
metabolism. If time is sufficient for the consumption of added glucose, delignification could be enhanced
due to higher fungal biomass (Jeffries et al., 1981). Moreover, some strains are also able to delignify during
the first metabolism (Hatakka, 1994).
Figure 3-2. Experimental and predicted fungal biomass, holocellulose, lignin during 14 days
pretreatment of cotton stalks by Phanerochaete chrysosporium. (Shi et al., 2014a)
As a negative impact of glucose addition was suspected during the pretreatment in deep-well and because
miscellaneous parameters are identified in literature about the influence of glucose addition, two strains
were cultivated with different amounts of glucose and lignin and carbohydrates were quantified in pretreated
samples. The two chosen stains were: BRFM 1369 that gave good results in deep-well (series 2) and BRFM
985 that gave bad results in deep-well (series 1) and good results in column with less starter solution (see

Results and discussion: selection step (Chapter 3)
116
3.2). Untreated wheat straw (UWS) was also analysed as control, measured composition for UWS is in
accordance with litterature (Annex 1).
3.4.2.1 Limited delignification
Klason Lignin is the sum of Acido-Soluble Lignin (ASL) and Acido-Insoluble Lignin (AIL) but as ASL was
between 0.4 and 0.6% of the pretreated material, only AIL was studied (Figure 3-3).
For each strain, AIL with addition of starter solution (glucose and N source) was superior to that with the
addition of the same solution without N (Figure 3-3). For most WRF, delignification is induced under
nitrogen starvation (Wan and Li, 2012), it also seems to be the case for studied strains. With a same fungus,
high level of nitrogen can inhibit lignin degradation whereas low nitrogen addition could promote the
degradation as observed with Phanerochaete chrysosporium and Pleurotus ostreatus (Wu et al., 2005).
Figure 3-3. Influence of glucose addition or starter (glucose + N source) addition on delignification
(Acid Insoluble Lignin content) of pretreated wheat straw with P. brumalis BRFM 985 and
T. menziesii BRFM 1369.
For T. menziesii BRFM 1369, a clear positive correlation (R² = 0.99) exists between AIL in percent of initial
TS straw and the amount of glucose added. Thus, delignification was imped because of added glucose. For
P. brumalis BRFM 985, the correlation only has an R² of 0.53 but except for 400 mg glucose/g TS straw, a
positive correlation seems to exist also. Several authors have observed a negative influence of glucose on
Manganese Peroxidase, a key delignifying enzyme (Ha et al., 2001; Mester et al., 1996). Moreover, with
almost ten times more glucose than 14
C-(RING)-lignin of poplar wood, Hatakka and Uusi-Rauva (1983)
observed a slight or strong repression of the lignin degradation for four strains out of the five tested. C/N
ratio in the culture medium seemed not responsible for these results. In the present study, it is estimated that
glucose/lignin ratios are between 0.25/1 to 2/1. Thus, limitation of lignin degradation with glucose as co-
R² = 0.9995
15
16
17
18
19
20
21
22
23
24
25
0 100 200 300 400
AIL [% initial straw]
Added glucose [mg/g wheat straw]
Untreated wheat straw BRFM 1369
BRFM 985 BRFM 1369 starter
BRFM 985 starter

Results and discussion: selection step (Chapter 3)
117
substrate would exist also for whole lignocellulosic biomass even with lower glucose quantity than those
used by Hatakka and Uusi-Rauva (Hatakka and Uusi-Rauva, 1983).
In contrast, Wu et al. (2005) observed a slight improvement of delignification in pulp mill wastewaters
supplemented with glucose (1 g/L glucose for 0.92 g/L lignin and 4.96 g/L COD) but with greater
supplementation, repression of lignin degradation was also observed.
Those different results could be explained by the presence or absence of glucose deficiency. Glucose helps
fungal growth and the more substrate is colonized the more delignification is possible. However, to take
place delignification often requires carbohydrates starvation that means the consumption of glucose. Thus, if
time is sufficient to reach carbohydrates starvation, efficient delignification would take place whereas with
shorter time, fungi just grow thanks to added glucose (first metabolism) with almost no delignification
(phase I in Figure 3-2).
3.4.2.2 Carbohydrates consumption
If few studies were carried out concerning the impact of nutrient solution on delignification, they often did
not study the impact on resulting carbohydrates. N addition in nutrient solution did not influence
carbohydrates consumption (Figure 3-4), as starter addition or glucose addition did not lead to significant
differences in cellulose or xylan (≈ hemicelluloses) amounts with the tested concentrations.
Xylan consumption and thus hemicelluloses consumption seem independent of added glucose amount. For
the two tested strains xylan content was around 14% in pretreated wheat straw whereas it was around 23%
for untreated straw (Figure 3-4A).
Concerning cellulose consumption, the two strains have a different behavior. For P. brumalis BRFM 985,
there was little or no cellulose consumption whatever the amount of glucose added (Figure 3-4B). Glucose is
known to repress cellulase activity (Moreira et al., 1997) but other experiments are required to determine
whether it is the case for P. brumalis BRFM 985.
For T. menziesii BRFM 1369, a decrease of cellulose while increasing the amount of added glucose was
observed (R² =0.99). Cellulases were most active for this fungi than for P. brumalis BRFM 985 at the end
of pretreatment in SSF columns (Gimbert et al., 2014) (Chapter 7, Figure 7-3). Lower delignification yield
can perhaps be explained by a simultaneous consumption of glucose and cellulose leading to no C-starvation
for BRFM 1369. More samples would allow to better confirmed impact of glucose addition during
pretreatment on lignocellulosic composition of the substrate.
Remaining cellulose seems to be linked with remaining AIL, for both strains (Figure 3-3 and Figure 3-4):
the less cellulose left, the more lignin remained. Some enzymes (glucose oxidase, etc.) are both dependent of
cellulose and lignin degradation (Leonowicz et al., 1999). However, further investigations would be
required to draw more robust conclusions about this observation, and about influence of glucose addition
during pretreatement in general.

Results and discussion: selection step (Chapter 3)
118
10
12
14
16
18
20
22
24
0 100 200 300 400
Xylan [% initial straw]
Added glucose [mg/g wheat straw]
Untreated wheat straw BRFM 1369
BRFM 985 BRFM 1369 starter
BRFM 985 starter
R² = 0.9918
15
20
25
30
35
40
0 100 200 300 400
Cellulose [% initial straw]
Added glucose [mg/g wheat straw]
Untreated wheat straw BRFM 1369
BRFM 985 BRFM 1369 starter
BRFM 985 starter
Figure 3-4. Influence of glucose or starter (glucose + N source) addition for wheat straw pretreatment
with P. brumalis BRFM 985 or T. menziesii BRFM 1369. A. On xylan content. B. On cellulose content.
To improve the BMP of pretreated substrate, it is necessary that hemicelluloses and celluloses are not too
attacked concomitantly with lignin degradation. In consequence, starter addition should be limited and and
P. brumalis BRFM 985 leading to low cellulose attack seems an interesting strain for pretreatment (Gimbert
et al. 2014; Zhou et al. 2016, under writing). This strain was highlighted by the screening step due to its
efficiency to increase fermentable sugar from wheat straw and miscanthus (Zhou et al., 2015b) and lead to
the best methane improvement for straw pretreated in column.
A
B

Results and discussion: selection step (Chapter 3)
119
3.5 Conclusion
Some WRF are able to improve anaerobic digestion of straw up to 20%, even after taking into account mass
loss. This result may be improved by pretreatment conditions optimization (duration, etc.) which will be
strain-dependent. Among tested strains, Polyporus brumalis BRFM 985 was found to be the most efficient
to pretreat straw for anaerobic digestion. However, the use of high starter amount (e.g. 200 mg glucose/g TS
and 18.4 mg of tartrate diammonium/g TS) can limit fungal pretreatment efficiency. Delignification seems
lower with increased glucose addition (between 50 and 400 mg/g straw) and cellulose consumption could be
enhanced in a strain dependent way and for fixed culture duration.


121
Chapter 4.
Influence of Polyporus brumalis culture parameters
for the fungal pretreatment: optimization step
Objectives
To find pretreatment conditions maximizing methane production from wheat straw pretreated with P.
brumalis BRFM 985
To link methane production to substrate modifications occurring during the pretreatment
To prioritize pretreatment parameters according to their impact on methane production
Table of content
4.1 INTRODUCTION ............................................................................................................................................................................................ 122 4.2 MATERIAL AND METHODS SPECIFIC TO OPTIMIZATION STEP ......................................................................................................................................... 122
4.2.1 Fungal pretreatment for anaerobic digestion ..................................................................................................................................... 122 4.2.1.1 SSF in columns ............................................................................................................................................................................................ 122 4.2.1.2 BMP-tests .................................................................................................................................................................................................. 123
4.2.2 Experimental design ........................................................................................................................................................................ 124 4.2.2.1 Building of the experimental design ............................................................................................................................................................... 124 4.2.2.2 Analyze of the experimental design and response variables ............................................................................................................................... 124
4.2.3 Substrate characterization ............................................................................................................................................................... 125 4.2.3.1 Dry matter losses after pretreatment ............................................................................................................................................................. 125 4.2.3.2 Klason lignin, cellulose and hemicelluloses determination by acid hydrolysis ........................................................................................................ 125 4.2.3.3 Lignin losses in pretreated samples compared to Non inoculated Controls (NIC) ................................................................................................... 125 4.2.3.4 Soluble sugars ............................................................................................................................................................................................. 125 4.2.3.5 Enzymatic hydrolysis of cellulose: glucose yield ................................................................................................................................................ 125 4.2.3.6 Real Time Quantitative Polymerase Chain Reaction (qPCR) ................................................................................................................................ 126
4.3 RELATIONSHIPS BETWEEN ANAEROBIC DIGESTION AND SUBSTRATE CHARACTERISTICS ........................................................................................................... 127 4.3.1 Methane production results during BMP tests .................................................................................................................................... 127 4.3.2 Parameters influencing anaerobic degradability ................................................................................................................................. 129 4.3.3 Negative impact of lignin amount on methane production ................................................................................................................... 130 4.3.4 Influence of fungal mycelium on CH4 production ................................................................................................................................. 131 4.3.5 Contribution of cellulose degradation to methane production .............................................................................................................. 133
4.4 RESPONSE SURFACES FOR METHANE PRODUCTION.................................................................................................................................................... 137 4.4.1 Methane production after 6 days ...................................................................................................................................................... 138 4.4.2 Methane production after 57 days .................................................................................................................................................... 139
4.4.2.1 Samples pretreated with metals addition ........................................................................................................................................................ 139 4.4.2.2 Samples pretreated without metals addition ................................................................................................................................................... 140
4.4.3 BMP .............................................................................................................................................................................................. 141 4.5 CONCLUSION ............................................................................................................................................................................................... 143
Highlights
Optimization of wheat straw pretreatment with P. brumalis BRFM 985 in Solid-State Fermentation
glass columns
High negative impact of lignin on cellulose hydrolysis and methane production
Possible increased methane production rate by the rapid anaerobic degradation of fungal mycelium
Requirement of lignin selective attack by fungi to obtain an efficient pretreatment
Increase lignin losses and methane production thanks to metals addition during pretreatment
Importance of pretreatment duration: minimum methane production with 12 to 15 days of
pretreatment in tested culture conditions

Results and discussion: optimization step (Chapter 4)
122
4.1 Introduction
In the previous chapter, P. brumalis BRFM 985 was shown as the most interesting strains among tested ones
to pretreat wheat straw for anaerobic digestion. However, fungal pretreatment efficiency is substrate and
fungal strain dependent but culture conditions are also very important (Wan and Li, 2012). The study of
López-Abelairas et al. (2013) can well illustrate this fact since they obtained 30% more cellulose
digestibility and 50% more hemicelluloses digestibility with optimized conditions compared to basal
conditions for wheat straw pretreatment with I. lacteus after 21 days.
The goals of this chapter were to find optimal P. brumalis BRFM 985 pretreatment conditions for anaerobic
digestion, and to explain implied mechanisms. To do that, investigated culture parameters were: initial
wheat straw moisture content, pretreatment temperature and duration and metals addition. Pretreatment
conditions that maximized methane production of fungal pretreated wheat straw were investigated.
Pretreated straws were also extensively characterized by S. Zhou and characterizations were used to explain
methane production changes by structural modifications of the substrate.
4.2 Material and methods specific to optimization step
4.2.1 Fungal pretreatment for anaerobic digestion
4.2.1.1 SSF in columns
As previously described (see 3.2.1.2), pretreatments were carried out by S. Zhou (BBF UMR) in glass
columns containing 20 g Total Solid (TS) of ground (4 mm) autoclaved wheat straw inoculated in sterile
conditions with 120 mg TS ground mycelium. Airflow saturated with moisture was set to 120 mL/min. After
pretreatment, samples (Table 4-1) were freeze-dried.
The metals solution added to some samples (1 mL) was composed of MnSO4; CuSO4 and FeSO4 at 18 mM
each and filtered sterilely at 0.2 µm. This solution is suspected to enhance fungal delignification (Salvachúa
et al., 2013). Diverse culture temperatures, pretreatment durations and initial moisture contents were tested
according a Doehlert experimental design (Table 4-1). Four controls (NIC and NIC-M in duplicates) were
also made, they corresponded to the central point (15 d, 25°C, 3.3 g wet weight/g TS) but without fungal
inoculation. Among controls, two were realized with metals addition (NIC-M) and two without (NIC). Three
samples (samples 23, 24 and 25) were cultivated and analyzed at a different period. Those samples were
obtained at the central point of the experimental domain to estimate repeatability of the whole process
(pretreatment and BMP tests).
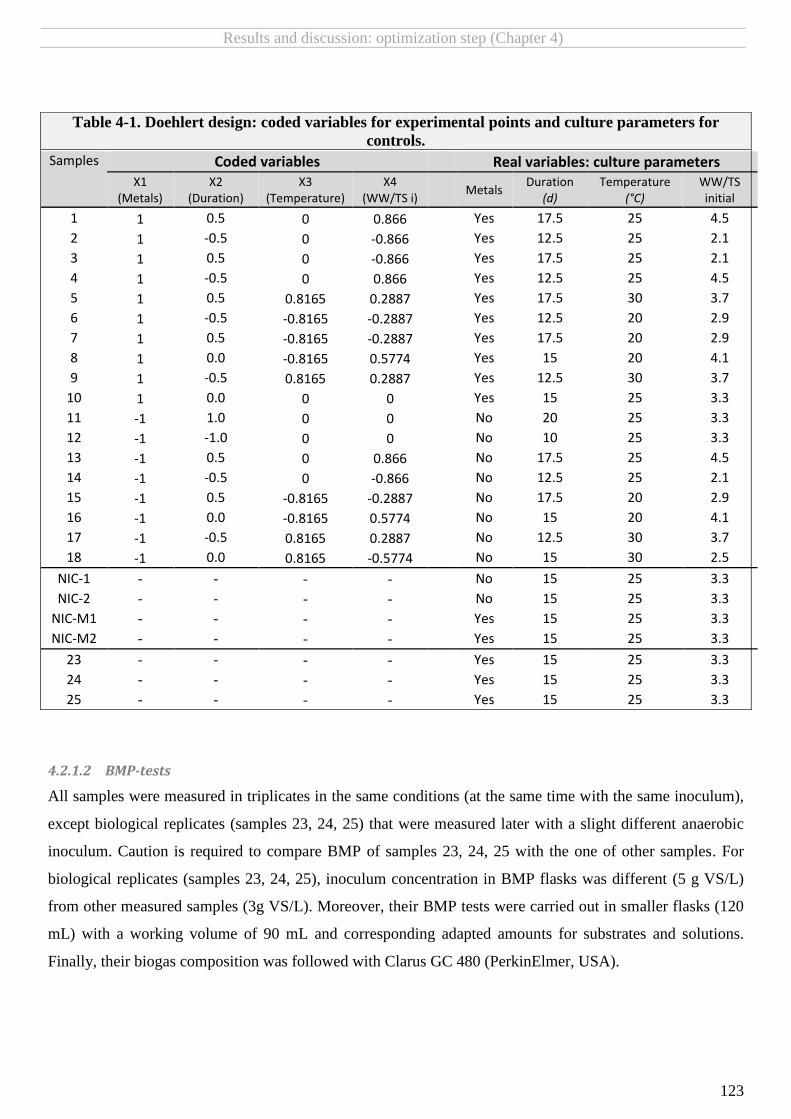
Results and discussion: optimization step (Chapter 4)
123
4.2.1.2 BMP-tests
All samples were measured in triplicates in the same conditions (at the same time with the same inoculum),
except biological replicates (samples 23, 24, 25) that were measured later with a slight different anaerobic
inoculum. Caution is required to compare BMP of samples 23, 24, 25 with the one of other samples. For
biological replicates (samples 23, 24, 25), inoculum concentration in BMP flasks was different (5 g VS/L)
from other measured samples (3g VS/L). Moreover, their BMP tests were carried out in smaller flasks (120
mL) with a working volume of 90 mL and corresponding adapted amounts for substrates and solutions.
Finally, their biogas composition was followed with Clarus GC 480 (PerkinElmer, USA).
Table 4-1. Doehlert design: coded variables for experimental points and culture parameters for
controls.
Samples Coded variables Real variables: culture parameters X1
(Metals) X2
(Duration) X3
(Temperature) X4
(WW/TS i)
Metals
Duration (d)
Temperature (°C)
WW/TS initial
1 1 0.5 0 0.866 Yes 17.5 25 4.5 2 1 -0.5 0 -0.866 Yes 12.5 25 2.1 3 1 0.5 0 -0.866 Yes 17.5 25 2.1 4 1 -0.5 0 0.866 Yes 12.5 25 4.5 5 1 0.5 0.8165 0.2887 Yes 17.5 30 3.7 6 1 -0.5 -0.8165 -0.2887 Yes 12.5 20 2.9 7 1 0.5 -0.8165 -0.2887 Yes 17.5 20 2.9
8 1 0.0 -0.8165 0.5774 Yes 15 20 4.1 9 1 -0.5 0.8165 0.2887 Yes 12.5 30 3.7
10 1 0.0 0 0 Yes 15 25 3.3 11 -1 1.0 0 0 No 20 25 3.3
12 -1 -1.0 0 0 No 10 25 3.3 13 -1 0.5 0 0.866 No 17.5 25 4.5 14 -1 -0.5 0 -0.866 No 12.5 25 2.1 15 -1 0.5 -0.8165 -0.2887 No 17.5 20 2.9 16 -1 0.0 -0.8165 0.5774 No 15 20 4.1 17 -1 -0.5 0.8165 0.2887 No 12.5 30 3.7 18 -1 0.0 0.8165 -0.5774 No 15 30 2.5
NIC-1 - - - - No 15 25 3.3
NIC-2 - - - - No 15 25 3.3 NIC-M1 - - - - Yes 15 25 3.3 NIC-M2 - - - - Yes 15 25 3.3
23 - - - - Yes 15 25 3.3
24 - - - - Yes 15 25 3.3
25 - - - - Yes 15 25 3.3
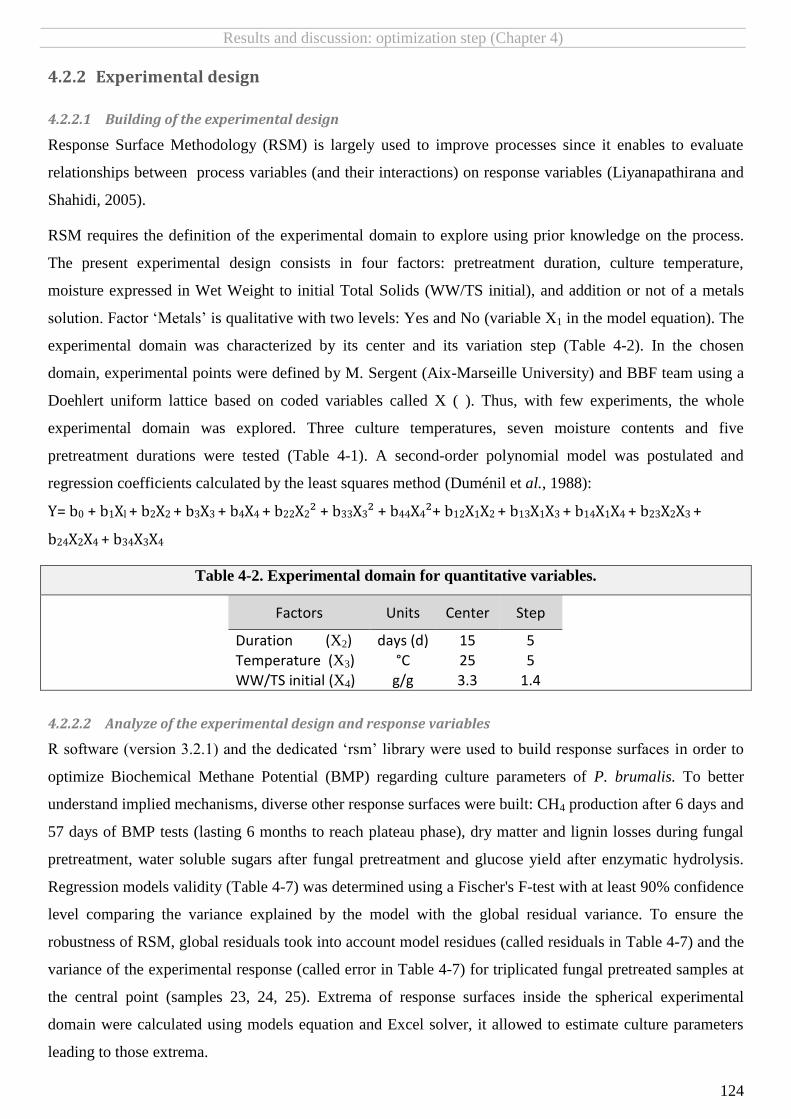
Results and discussion: optimization step (Chapter 4)
124
4.2.2 Experimental design
4.2.2.1 Building of the experimental design
Response Surface Methodology (RSM) is largely used to improve processes since it enables to evaluate
relationships between process variables (and their interactions) on response variables (Liyanapathirana and
Shahidi, 2005).
RSM requires the definition of the experimental domain to explore using prior knowledge on the process.
The present experimental design consists in four factors: pretreatment duration, culture temperature,
moisture expressed in Wet Weight to initial Total Solids (WW/TS initial), and addition or not of a metals
solution. Factor ‘Metals’ is qualitative with two levels: Yes and No (variable X1 in the model equation). The
experimental domain was characterized by its center and its variation step (Table 4-2). In the chosen
domain, experimental points were defined by M. Sergent (Aix-Marseille University) and BBF team using a
Doehlert uniform lattice based on coded variables called X ( ). Thus, with few experiments, the whole
experimental domain was explored. Three culture temperatures, seven moisture contents and five
pretreatment durations were tested (Table 4-1). A second-order polynomial model was postulated and
regression coefficients calculated by the least squares method (Duménil et al., 1988):
Y= b0 + b1Xl + b2X2 + b3X3 + b4X4 + b22X2² + b33X3² + b44X4²+ b12X1X2 + b13X1X3 + b14X1X4 + b23X2X3 +
b24X2X4 + b34X3X4
Table 4-2. Experimental domain for quantitative variables.
Factors Units Center Step
Duration (X2) days (d) 15 5 Temperature (X3) °C 25 5 WW/TS initial (X4) g/g 3.3 1.4
4.2.2.2 Analyze of the experimental design and response variables
R software (version 3.2.1) and the dedicated ‘rsm’ library were used to build response surfaces in order to
optimize Biochemical Methane Potential (BMP) regarding culture parameters of P. brumalis. To better
understand implied mechanisms, diverse other response surfaces were built: CH4 production after 6 days and
57 days of BMP tests (lasting 6 months to reach plateau phase), dry matter and lignin losses during fungal
pretreatment, water soluble sugars after fungal pretreatment and glucose yield after enzymatic hydrolysis.
Regression models validity (Table 4-7) was determined using a Fischer's F-test with at least 90% confidence
level comparing the variance explained by the model with the global residual variance. To ensure the
robustness of RSM, global residuals took into account model residues (called residuals in Table 4-7) and the
variance of the experimental response (called error in Table 4-7) for triplicated fungal pretreated samples at
the central point (samples 23, 24, 25). Extrema of response surfaces inside the spherical experimental
domain were calculated using models equation and Excel solver, it allowed to estimate culture parameters
leading to those extrema.

Results and discussion: optimization step (Chapter 4)
125
4.2.3 Substrate characterization
Substrate characterizations for optimization step were carried out by S. Zhou et al. (2016, under writing).
4.2.3.1 Dry matter losses after pretreatment
After freeze-drying, samples were weighted. Dry mass losses (DML) were the difference in percent of initial
straw amount (before pretreatment) and final (pretreated) amount.
4.2.3.2 Klason lignin, cellulose and hemicelluloses determination by acid hydrolysis
Cellulose, hemicelluloses and Klason lignin content of straws were analyzed in duplicates following adapted
NREL two-stage acid hydrolysis method (more details in 3.2.3.2). Reducing sugars and glucose released
after hydrolysis were quantified respectively using the dinitrosalicylic acid method (DNS) and the Glucose
RTU kits (Biomérieux, Marcy-l’étoile, France). Hemicelluloses constituting carbohydrates were determined
by difference between reducing sugars and glucose, conversion factor was 0.88 (M xylan/M xylose), as
previously (see 3.2.3.2).
4.2.3.3 Lignin losses in pretreated samples compared to Non inoculated Controls (NIC)
Lignin amount in pretreated straw cannot directly be compared to lignin in NIC, Dry Mass Losses (DML)
during pretreatment must be taken into account to determinate the amount of lignin residual in pretreated
straw. It corresponds to the remaining lignin per amount of initial straw (before pretreatment). This amount
can then be compared to lignin amount in NIC to express lignin losses for pretreated straw:
𝑅𝑒𝑠𝑖𝑑𝑢𝑎𝑙 𝑙𝑖𝑔𝑛𝑖𝑛 (%) = 𝐿𝑖𝑔𝑛𝑖𝑛 (%) ×(100 − DML)
100
𝐿𝑖𝑔𝑛𝑖𝑛 𝑙𝑜𝑠𝑠𝑒𝑠 (%) = (𝐿𝑖𝑔𝑛𝑖𝑛 (%) 𝑖𝑛 𝑁𝐼𝐶 − 𝑅𝑒𝑠𝑖𝑑𝑢𝑎𝑙 𝑙𝑖𝑔𝑛𝑖𝑛 (%))
𝐿𝑖𝑔𝑛𝑖𝑛 (%) 𝑖𝑛 𝑁𝐼𝐶 × 100
4.2.3.4 Soluble sugars
Soluble sugars were extracted from 2 g TS straw in 40 mL deionized water during 1 h at 4 °C and shaken at
200 rpm. Extracts were recovered by filtration through GF/F filters (Whatman) and stored at 4 °C before
analysis. DNS kit was used to measure reducing sugars (Biomérieux, Marcy-l’étoile, France).
4.2.3.5 Enzymatic hydrolysis of cellulose: glucose yield
A mild alkali washing step (Salvachúa et al., 2011) and enzymatic hydrolysis were performed in situ with a
Tornado™ Overhead Stirring System (Radleys Discovery Technologies, United Kingdom). 6 g TS of
untreated and pretreated wheat straws were subjected to alkali treatments in 100 mL of 0.1% sodium
hydroxide at 50°C and 700 rpm for one hour. Then, pH was adjusted at 4.8 by addition of citrate phosphate
buffer (pH 4.4, 100 mM). The suspension was further supplemented with 12 FPU/g TS substrate of
commercial cellulases GC220 from Trichoderma reesei (Genencor Danisco, NY, USA) and 60 U/g TS

Results and discussion: optimization step (Chapter 4)
126
substrate of β-glucosidase from Aspergillus niger (Novozyme SP188). Tetracycline (150 mg/l) and
cycloheximide (40 mg/L) were added to prevent any microbial contamination. The reaction was carried out
at 3% (w TS/v) consistency, 50°C, and 500 rpm for 72 h. Glucose released were quantified using the
Glucose RTU kit (Biomérieux, Marcy-l’étoile, France) in centrifuged samples (5000 rpm for 5 min).
Glucose yield was calculated according to the following equation:
𝐺𝑙𝑢𝑐𝑜𝑠𝑒 𝑦𝑖𝑒𝑙𝑑 (%) = 𝑔𝑙𝑢𝑐𝑜𝑠𝑒 𝑟𝑒𝑙𝑒𝑎𝑠𝑒𝑑(𝑔) /((𝑔) 𝑇𝑆 𝑝𝑟𝑒𝑡𝑟𝑒𝑎𝑡𝑒𝑑 𝑊𝑆 × (1 − weight loss (%))
Total glucose (g)/ (g) TS Non Inoculated Controls
4.2.3.6 Real Time Quantitative Polymerase Chain Reaction (qPCR)
qPCR was used to quantify fungal biomass, according to the technic developed by Zhou et al. (2015a) as the
suitability and the practicality of this method was demonstrated.
4.2.3.6.1 DNA isolation
Genomic DNA was extracted from fresh mycelia or SSF-treated wheat straw using the NucleoSpin® Plant
II kit (Macherey-Nagel, Germany) according to the manufacturer's instructions except for the following
modifications: samples were ground to fine powder using a cryogenic grinder (6770 Freezer/Mill). Aliquots
(20–100 mg) of ground samples were transferred to 2 mL Lysing Matrix A tubes (MP Biomedicals, France)
with lysis solution PL1 and processed for 30 s at 4 m/s and 20 s at 6 m/s using a FastPrep-24 instrument
(MP Biomedicals). Elution of DNA from the binding matrix was performed by centrifugation after two
incubation steps with 50 μL Milli-Q water at 65 °C for 10 min. DNA concentrations were determined using
a NanoDrop ND-1000 spectrophotometer (Thermo Scientific). DNA samples were stored at−20 °C until use.
4.2.3.6.2 qPCR
Quantitative PCR was performed using qPCR Master Mix for SYBR Plus (Bio-Rad, France) on a C1000
Touch Thermal Cycler CFX96 real- time system (Bio-Rad). The oligonucleotide primers were designed to
amplify a 150-bp fragment in the 5.8S conserved sequence: 5.8S-F (5′-TTTCAGCAACGGATCTCTTGGC-
3′), 5.8S-R (5′-CAAACAGGCATGCTCCTCGG-3′). Reactions were performed in duplicate, in a 10 μL
final reaction volume, with 2 μL of template diluted 1/100 in water, and primers 300 nM each. Contrary to
Zhou et al. (2015a), standard curves were established by A. Rancon (BBF UMR) using serial dilutions of
genomic DNA ranging from 1,8 ng/μL down to 1.8.10−3
ng/μL. The PCR cycle was as follows: 30 s at 95
°C, and then 5 s at 95 °C, and 5 s at 65 °C for 39 cycles, followed by a melt curve step (65 to 95 °C, with 0.5
°C steps). The melting curve (fluorescence=f°(Temperature)) was observed to check the presence of a single
amplicon. A shoulder on this curve shows the co-existence of double-stranded and single-stranded
configurations and thus two different amplicons (with different temperature of dissociation). All qPCR runs
included a negative control without DNA template. Number of quantification cycles were determined using
the regression mode of the Bio-Rad CFX Manager™ software (v 3.0).

Results and discussion: optimization step (Chapter 4)
127
4.3 Relationships between anaerobic digestion and substrate characteristics
4.3.1 Methane production results during BMP tests
BMP values are presented in Table 4-3. As expected, it can be noticed that BMP (NmL/g VS pretreated) of
non-inoculated controls (NIC) was identical whether they received metals solution (NIC-M) or not during
the pretreatment. BMP of NIC is superior to BMP of untreated straw (≈227 NmL/g VS against 200 NmL/g
VS). Similar observation was already reported with yard trimmings and was attributed to the solubilization
of hemicelluloses by autoclaving (Zhao et al., 2014b). However this explanation is unlikely in the current
study since with 1 mm wheat straw, the same BMP was obtained comparing raw and autoclaved substrates
(Table 4-4). The consumption of recalcitrant matters (lignin, crystalline cellulose…) probably did not occur
for NIC since they were in sterile conditions but sugars solubilization during the stay in glass columns seems
possible and would have raised BMP. Indeed, soluble sugars content is an important factor for the
enhancement of BMP values (Monlau et al., 2012b).
Taking into account standard deviations, very few pretreated samples had a BMP (NmL/g VS pretreated)
superior to culture control (NIC) (Table 4-3), namely samples 5 and 9. In the best case (sample 5), BMP
(NmL/g VS) was increased by almost 20%. Those samples were obtained with the same culture conditions
(30°C, 3.7 g WW/TS i, with metals addition) except for incubation time that was 17.5 days for sample 5
against 12.5 days for sample 9. BMP of pretreated straw can be decreased comparing to controls because of
holocelluloses consumption by P. brumalis BRFM 985. Holocelluloses especially amorphous structures,
constitute the substrate of AD (Monlau et al., 2012b). For this reason, culture conditions of P. brumalis
BRFM 985 must be optimized in order to delignify selectively the substrate and thus to obtain an efficient
pretreatment. However, as there are mass losses during pretreatment, they must be taken into account to
evaluate the global efficiency of pretreatment. Thus, BMP were expressed per gram of initial matter (matter
before pretreatment).
Taking into account mass losses (Table 4-3) and standard deviation, no fungal culture conditions allow to
improve BMP (NmL/g TS i) compared to controls. In contrast, 21% more methane (NmL/g TS i) were
obtained from wheat straw pretreated with the same strain (Chapter 1) in other culture conditions (21 days,
slight starter solution addition…).
Methane yield after 6 days of BMP tests was studied to better understand mechanisms implied in BMP
modifications. A rapid start-up is linked to easily accessible compounds (soluble sugars and proteins…).
Methane yield after 57 days of BMP tests was also studied. BMP tests cannot be directly used to predict full-
scale plant performances (Carlsson et al., 2012) but two months duration seems adapted to digest straw in
AD plants. Pretreatment optimization for methane production after 57 days of BMP tests would be more
relevant from an industrial point of view than optimization for BMP values (obtained after ≈ 6 months).

128
Table 4-3. Methane production and characterizations of pretreated and control straws. minimum and maximum values among pretreated samples. *measured by S. Zhou.
Samples
BMP
(NmL/g TS i)
BMP
(NmL/g TS pretreated)
BMP
(NmL/g VS pretreated)
CH4 production at
day 6 (NmL/g VS pretreated)
CH4 production at
day 57 (NmL/g VS pretreated)
CH4 production at
day 6
(NmL/g TS i)
CH4 production at
day 57
(NmL/g TS i)
Dry Mass Losses*
(%)
Water soluble carbohydrates*
(mg/g TS)
Glucose Yield*
(%)
Lignin losses*
(%)
Lignin*
(%)
1 188 ± 10 232 ± 13 247 ± 14 90 ± 16 214 ± 10 71 ± 12 164 ± 7 18.9 ± 1.3 41 ± 1 35.6 ± 0.7 28.7 ± 0.7 17.6 ± 0.3 2 151 ± 3 173 ± 3 183 ± 3 48 ± 10 155 ± 17 41 ± 8 129 ± 14 12.9 ± 1.3 22 ± 0 13.8 ± 1.0 13.1 ± 0.6 22.5 ± 0.1 3 181 ± 24 221 ±29 235 ± 31 68 ± 2 187 ± 9 54 ± 1 144 ± 7 18 ± 0.1 36 ± 0 19.0 ± 1.2 19.3 ± 0.4 21.6 ± 0.1 4 193 ± 14 229 ± 17 243 ± 18 86 ± 4 211 ± 14 71 ± 4 168 ± 11 15.4 ± 0.8 33 ± 1 26.6 ± 0.6 22.2 ± 0.4 20.0 ± 0.1 5 190 ± 3 253 ± 4 272 ± 4 114 ± 3 248 ± 7 82 ± 2 173 ± 5 25.0 ± 0.4 84 ± 3 36.4 ± 0.4 32.7 ± 0.2 17.5 ± 0.1 6 147 ± 25 154 ± 26 163 ± 28 54 ± 5 139 ± 26 50 ± 5 125 ± 23 5.1 ± 1.2 12 ± 1 14.1 ± 0.4 1.4 ± 1.0 23.3 ± 0.1
7 186 ± 53 212 ± 61 225 ± 65 56 ± 11 183 ± 29 48 ± 9 151 ± 24 12.4 ± 1.4 20 ± 1 12.0 ± 0.2 12.8 ± 1.0 22.1± 0.5
8 143 ± 14 157 ± 16 167 ± 17 56 ± 1 138 ± 2 49 ± 1 118 ± 2 9.1 ± 0.6 20 ± 1 12.3 ± 0.4 9.9 ± 0.6 22.4± 0.1 9 206 ± 12 251 ±15 268 ± 16 94 ± 4 230 ± 20 74 ± 3 176 ± 16 18.2 ± 0.5 31 ± 2 31.0 ± 0.6 24.6 ± 0.4 19.0 ± 0.2 10 175 ± 32 228 ± 41 244 ± 44 94 ± 7 212 ± 36 69 ± 5 152 ± 26 23.1 ± 0.4 40 ± 2 22.1 ± 1.2 26.7 ± 2.5 20.1± 0.3 11 159 ± 40 210 ± 53 226 ± 57 77 ± 10 198 ± 52 56 ± 7 140 ± 37 24.2 ± 0.5 38 ± 1 16.7 ± 0.4 23.8 ± 0.3 22.0 ± 0.1 12 185 ± 49 212 ± 56 224 ± 60 74 ± 6 184 ± 11 48 ± 4 152 ± 25 12.6 ± 1.1 18 ± 0 14.4 ± 0.3 11.5 ± 0.2 22.9 ± 0.1 13 154 ± 13 193 ± 16 205 ± 17 96 ± 5 172 ± 8 58 ± 4 129 ± 6 20.0± 0.9 28 ± 2 24.4 ± 0.4 24.4 ± 0.5 20.0 ± 0.2 14 145 ± 26 163 ± 29 174 ± 31 59 ± 4 135 ± 15 39 ± 4 112 ± 12 11.1 ± 0.3 20 ± 5 7.9 ± 0.2 8.3 ± 1.2 24.0 ± 0.1 15 152 ± 10 165 ± 11 176 ± 12 72 ± 1 150 ± 9 51 ± 1 129 ± 8 8.1 ± 1.0 11 ± 1 11.9 ± 0.4 10.2 ± 1.4 22.5± 0.7 16 143 ± 10 159 ± 11 170 ± 12 70 ± 5 142 ± 10 47 ± 4 120 ± 8 10.2 ± 0.5 16 ± 0 10.0 ± 0.2 8.4 ± 0.5 23.0 ± 0.2 17 145 ± 9 181 ± 12 194 ± 13 96 ± 3 168 ± 6 59 ± 2 125 ± 4 19.9 ± 0.7 23 ± 3 29.8 ± 0.5 20.0 ± 0.4 21.8 ± 0.1 18 131 ± 13 165 ± 16 178 ± 18 87 ± 7 150 ± 14 54 ± 5 111 ± 10 20.4 ± 0.6 20 ± 2 9.4 ± 0.4 20.6 ± 1.8 23.0± 0.4
NIC-1 204 ± 6 206 ± 6 217 ± 6 _ _ _ _ 1.3 ± 0.8 8 ± 1 26.5 ± 0.5 0 23.1 ± 0.2 NIC-2 210 ± 7 216 ± 8 227 ± 8 _ _ _ _ 2.6 ± 0.2 7 ± 1 27.2 ± 0.7 0 22.9 ± 0.8 NIC-M1 214 ± 14 216 ± 14 227 ± 15 _ _ _ _ 0.7 ± 0.7 7 ± 1 27.5 ± 1.1 0 23.0 ± 0.1 NIC-M2 220 ± 6 216 ± 8 227 ± 8 _ _ _ _ 1.7 ± 1.5 10 ± 1 27.6 ± 0.3 0 23.2 ± 0.1
23 327 ± 8 _ _ _ _ 93 ± 5 242 ± 9 0 21.9 ± 0.7 22.8 ± 0.2 20.7 ± 0.1 24 292 ± 24 _ _ _ _ 90 ± 9 222 ± 15 0 22.9 ± 0.7 24.1 ± 0.7 20.4 ± 0.1 25 265 ± 12 _ _ _ _ 88 ± 12 208 ± 28 0 24.5 ± 0.7 24.6 ± 0.3 20.3 ± 0.1
Table 4-4. Absence of influence of autoclaving and freeze drying on BMP (NmL/g VS) of wheat straw.
Wheat straw harvested in 2013 (1 mm) Autoclaved 213 ± 16
Raw straw 229 ± 2
Wheat straw harvested in 2012 (1 mm) Autoclaved and freeze-dried 238 ± 2
Raw straw 238 ± 9

Results and discussion: optimization step (Chapter 4)
129
4.3.2 Parameters influencing anaerobic degradability
Monlau et al. (2012b) showed the negative impact of lignin and crystalline cellulose content and the positive
impact of soluble sugars, protein and amorphous holocelluloses on the BMP of lignocellulosic biomasses. A
mathematical model was built to predict BMP: centered and reduced coefficients were close except for
lignin (Figure 4-1). The fungal pretreatment can influence the BMP value by a delignifying action (positive
impact). Holocelluloses consumption by fungi must be minimized since they are the substrate of anaerobic
digestion.
BMP (NmL CH4 g/g TS) = 303.14 – 4.53*Lig (% TS) + 0.77*SolSu (% TS) + 1.28*Pro (% TS) -1.59*Cri
(% TS) + 0.61Am (% TS) +1.33Ua (% TS)
Figure 4-1. Centered and reduced regression coefficients with their 95% confidence intervals for the
prediction of methane potentials and predictive equation. Lig: Lignin. SolSu: Soluble Sugars. Pro: Protein. Cri: Crystalline cellulose. Am: Amorphous holocelluloses.
Ua: Uronic acids. (Monlau et al., 2012b)
Some composition analyses of pretreated straws were carried out by Zhou (BBF project partner, INRA of
Marseille). Cellulose crystallinity was not studied but enzymatic hydrolyses were achieved. Glucose
amounts released by enzymatic hydrolysis are dependent of lignin amount and cellulose crystallinity since
they must be accessible. Crystalline cellulose represents around 50% of cellulose in wheat straw (Monlau et
al., 2013) (Annex 1). According literature review (Chapter 1, 1.6.2), lignin selective WRF do not
preferentially consume amorphous cellulose and consequently do not increase cellulose crystallinity. Slight
decrease in cellulose crystallinity can even be observed. Concerning protein content that is a minor
compound in wheat straw ≈ 3% (Lee, 1997), it can be increased by the presence of fungi that have poor N
requirements. Li et al. (2001) reported an increase of 6.2% on cottonseed hull where WRF Pleurotus

Results and discussion: optimization step (Chapter 4)
130
ostreatus were cultivated. WRF are rich in proteins and carbohydrates, e. g. Pleurotus ostreatus has a
protein content of 24.3%TS and contains 13.4%TS of glycogen (Hadar and Cohen-arazi, 1986).
4.3.3 Negative impact of lignin amount on methane production
Negative correlation between lignin content and anaerobic degradability is known (Chandler and Jewell,
1980; Monlau et al., 2012b). Even after only 6 days of methane production (NmL/g VS pretreated), the
negative impact of lignin was visible (Figure 4-2).
Figure 4-2. Significant negative correlations between lignin amount and methane production
whatever the duration of anaerobic digestion.
Lignin influence less the CH4 production at day 6 than at day 57 because easy accessible compounds are
consumed in first days of reaction. If the correlation is a bit weaker for BMP rather than for CH4 production
at day 57 it would be due to the digestion of some recalcitrant compounds like soluble lignin fractions and
slight lignin amounts. Small digested proportions of those compounds would increase with anaerobic
digestion duration (Benner and Hodson, 1985; Motte et al., 2015; Sleat and Robinson, 1984; Somayaji and
Khanna, 1994). Lignocellulosic composition analyses on solid degraded straw residues during and after
BMP tests would help to conclude on this point.
Response Surfaces (RS) were built for lignin losses during pretreatment (Annex 3 and Annex 5). As
expected, lignin losses were higher with metal addition (Table 4-6 and Annex 3). Metals solutions were
composed of Fe2+
, Mn2+
and Cu2+
that are constituents or co-factors of WRF ligninolytic enzymes (Tian et
al., 2012). They can favor not only ligninolytic activity but also the non-enzymatic degradation of lignin
(Fenton reaction) (Salvachúa et al., 2013). Lignin losses are maximized with high culture duration, sufficient
water amount (≈3.8) and high temperatures (Table 4-6).
y = -15.443x + 541.42 R² = 0.6713
y = -15.513x + 510.8 R² = 0.7493
y = -7.1843x + 230.97 R² = 0.5624
0
50
100
150
200
250
300
0 5 10 15 20 25 30
Me
than
e p
rod
uct
ion
(N
mL
/g V
S)
Lignin (%)
BMP
CH4 at day 57
CH4 at day 6

Results and discussion: optimization step (Chapter 4)
131
4.3.4 Influence of fungal mycelium on CH4 production
The good anaerobic degradability of P. brumalis BRFM 985 freeze-dried mycelium was evocated in the
previous chapter (327 ± 36 NmL/g VS). The BMP of fungal mycelium was 127 NmL/g VS more elevated
than the one of untreated straw (200 ± 6 NmL/g VS). Moreover, the AD of fungal biomass is quite rapid. In
Table 4-5, it can be observed that methane production from fungal biomass reached 93.9% of the BMP
value in 33 days whereas, at the same date, average value for samples pretreated with metals addition
reached only 73.7% of the average BMP value. In Table 4-5, it can also be found a comparison between the
most degradable sample (sample 5) and the least degradable one (sample 8) among samples pretreated with
metal addition. Moreover in Figure 4-3, it can be seen that the anaerobic digestion start-up for fungal
mycelium was faster than for straws. During the BMP test, methane production began on day 1 for straws
whereas it started directly after anaerobic inoculation for the mycelium of P. brumalis BRFM 985. After 6
days of production, methane yield was almost twice higher for mycelium than for the average of straws
pretreated with metals.
Table 4-5. Methane production during the BMP test expressed in NmL/g VS and in percentage of the
BMP value.
Days BRFM 985 Sample 5 Sample 8 Average for samples with metals
6 139 ± 10 (42.4%) 114 ± 3 (41.9%) 56 ± 1 (33.5%) 76 ± 6 (33.3%)
33 308 ± 34 (93.9%) 228 ± 5 (83.8%) 128 ± 2 (76.6%) 168 ± 15 (73.7%)
57 320 ± 37 (97.6%) 248 ± 7 (91.2%) 138 ± 2 (82.6%) 192 ± 17 (84.2%)
BMP 328 ± 36
272 ± 4
167 ± 16
228 ± 20
Figure 4-3. Start-up phase of BMP-tests for P. brumalis BRFM985 mycelium, pretreated straws with
metals addition, non inoculated control with metals addition (NIC-M2) and untreated wheat straw
(UWS). c
0
20
40
60
80
100
120
140
160
180
200
0 2 4 6 8
Me
than
e
pro
du
ctio
n
(Nm
L C
H4
/g V
S)
Duration (days)
BRFM 985
5
NIC
Average with metals
UWS
8

Results and discussion: optimization step (Chapter 4)
132
Even without substrate modifications, the mere presence of the mycelium on straw would increase the
substrate BMP. To investigate the influence of fungal mycelium on methane yield of pretreated straws,
qPCR analyses were carried out on few samples pretreated with metals addition (Figure 4-4).
Figure 4-4. qPCR measurements of fungal biomass on straws pretreated with metals addition.
Samples with a 17.5-days culture duration have higher fungal biomass than those cultivated for 12.5 d
(whatever the unit used: mg/g TS pretreated or mg/g TS initial, before pretreatment). It can especially be
observed comparing samples 5 and 9 that were obtained in the same conditions (30°C, WW/TS = 3.7)
except for pretreatment duration. qPCR quantifies DNA from alive cells but also from a part of dead ones (if
their DNA is not lysed) (Cangelosi and Meschke, 2014). However, in this study it does not seem to be a
limitation since methane production from fungal cells depends on their constituents (protein,
carbohydrates…) and not of their viability. qPCR appears particularly adapted to estimate fungal biomass in
early stage of decay, i. e. firsts weeks (Eikenes et al., 2005), especially when the extraction step is efficient
as it was the case for the current study (Zhou et al., 2015a).
To fully investigate influence of mycelium amount on methane production, an estimation of fungal biomass
in the whole experimental domain would be helpful. Fungal biomass is correlated to dry matter losses
(DML) whatever the WRF strains (Shi et al., 2014a). DML are correlated to qPCR results (R² = 0.8018,
n=5, Figure 4-5A). Response surfaces (RS) were built for DML (Annex 4 and Annex 5). Those RS showed
that DML (and probably fungal biomass) were almost independent of metals addition factor and increased
with culture duration with a maximum between 18 and 19 days. DML were maximized near 28-29°C and

Results and discussion: optimization step (Chapter 4)
133
y = 5.1956x - 23.49 R² = 0.8018
0
20
40
60
80
100
120
140
0 10 20 30
qP
CR
re
sult
s
(mg
myc
eliu
m/
g p
retr
eat
ed
wh
eat
str
aw)
DML (% TS)
with WW/TS close to 3.3 (Table 4-6). Thus, fungal biomass would increase with rising temperatures (Figure
4-4 and Annex 4). DML were minimized for low durations, moisture content and temperature.
Methane production at day 6 (NmL/g VS pretreated) was correlated to DML (R² = 0.6162, n=18, Figure 4-5B).
Furthermore, methane production at day 57 (NmL/g VS pretreated) was slightly correlated to DML (R² =
0.5065, n=18, Figure 4-5B), as well as BMP (NmL/g VS pretreated) (R² = 0.4567; R = 0.6904 > 0.4821,
threshold of significance for 18 points (DOF=15) with α = 0.05, Figure 4-5B). Since DML are probably
representative of fungal biomass, correlations in Figure 4-5B would be linked to the fast degradation of
fungal mycelium which principally occurs in the first days of BMP tests.
4.3.5 Contribution of cellulose degradation to methane production
Holocelluloses digestibility reflects the accessibility to anaerobic digestion substrate. After pretreatments for
optimization step, S. Zhou measured glucose released after enzymatic hydrolysis. The enzymatic cocktail
used (GC220 and β-glucosidase, see 4.2.3.5) contained few hemicellulases but xylose release is poorly
efficient (Ravalason et al., 2012). However, xylose is the major compound of wheat straw hemicelluloses.
Thus, even if whole reducing sugars released after enzymatic hydrolysis were also measured by S. Zhou;
this amount would not well represent holocelluloses digestibility that is why it was chosen to only study the
link between cellulose digestibility and methane production. After the pretreatment, a correlation between
cellulose and hemicelluloses losses was observed (R² = 0.8663, n=18, Chapter 7, Figure 7-6).
Hemicelluloses are generally considered as more degradable than cellulose during anaerobic digestion,
notably owing to their amorphous structure. However, cellulose degradation is sometimes more efficient
than the one of hemicelluloses. Pakarinen et al. (2012) observed a preferential degradation of C6 (soluble
Figure 4-5. Correlations with dry mass losses (DML). A. qPCR versus DML. B. Methane production versus DML.
A y = 4.164x + 144.91
R² = 0.4567
y = 4.1689x + 112.72 R² = 0.5065
y = 2.4581x + 38.27 R² = 0.6162
0
50
100
150
200
250
300
0 10 20 30
Me
than
e p
rod
uct
ion
(N
mL
/g V
S p
retr
eat
ed)
DML (% TS)
BMP
CH4 at day 57
CH4 at day 6
B
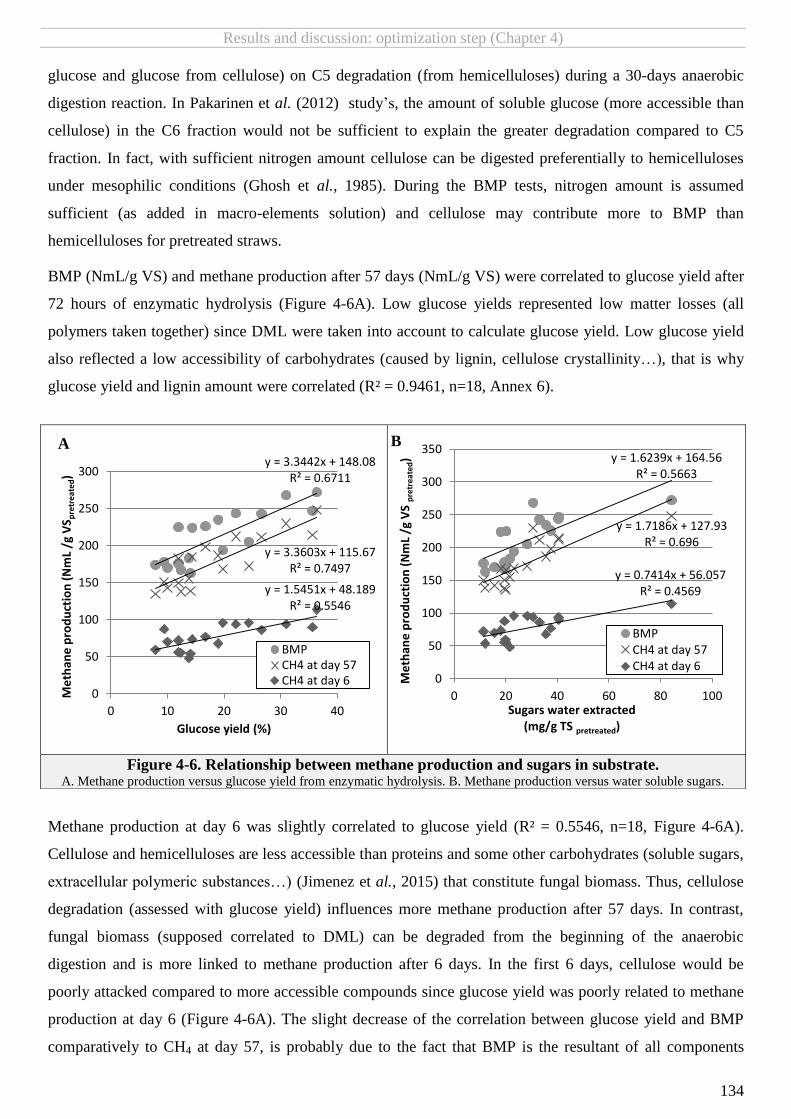
Results and discussion: optimization step (Chapter 4)
134
glucose and glucose from cellulose) on C5 degradation (from hemicelluloses) during a 30-days anaerobic
digestion reaction. In Pakarinen et al. (2012) study’s, the amount of soluble glucose (more accessible than
cellulose) in the C6 fraction would not be sufficient to explain the greater degradation compared to C5
fraction. In fact, with sufficient nitrogen amount cellulose can be digested preferentially to hemicelluloses
under mesophilic conditions (Ghosh et al., 1985). During the BMP tests, nitrogen amount is assumed
sufficient (as added in macro-elements solution) and cellulose may contribute more to BMP than
hemicelluloses for pretreated straws.
BMP (NmL/g VS) and methane production after 57 days (NmL/g VS) were correlated to glucose yield after
72 hours of enzymatic hydrolysis (Figure 4-6A). Low glucose yields represented low matter losses (all
polymers taken together) since DML were taken into account to calculate glucose yield. Low glucose yield
also reflected a low accessibility of carbohydrates (caused by lignin, cellulose crystallinity…), that is why
glucose yield and lignin amount were correlated (R² = 0.9461, n=18, Annex 6).
Methane production at day 6 was slightly correlated to glucose yield (R² = 0.5546, n=18, Figure 4-6A).
Cellulose and hemicelluloses are less accessible than proteins and some other carbohydrates (soluble sugars,
extracellular polymeric substances…) (Jimenez et al., 2015) that constitute fungal biomass. Thus, cellulose
degradation (assessed with glucose yield) influences more methane production after 57 days. In contrast,
fungal biomass (supposed correlated to DML) can be degraded from the beginning of the anaerobic
digestion and is more linked to methane production after 6 days. In the first 6 days, cellulose would be
poorly attacked compared to more accessible compounds since glucose yield was poorly related to methane
production at day 6 (Figure 4-6A). The slight decrease of the correlation between glucose yield and BMP
comparatively to CH4 at day 57, is probably due to the fact that BMP is the resultant of all components
Figure 4-6. Relationship between methane production and sugars in substrate. A. Methane production versus glucose yield from enzymatic hydrolysis. B. Methane production versus water soluble sugars.
y = 1.6239x + 164.56 R² = 0.5663
y = 1.7186x + 127.93 R² = 0.696
y = 0.7414x + 56.057 R² = 0.4569
0
50
100
150
200
250
300
350
0 20 40 60 80 100
Me
than
e p
rod
uct
ion
(N
mL
/g V
S p
retr
eat
ed)
Sugars water extracted (mg/g TS pretreated)
BMPCH4 at day 57CH4 at day 6
B
y = 3.3442x + 148.08 R² = 0.6711
y = 3.3603x + 115.67 R² = 0.7497
y = 1.5451x + 48.189 R² = 0.5546
0
50
100
150
200
250
300
0 10 20 30 40
Me
than
e p
rod
uct
ion
(N
mL
/g V
S pre
tre
ated
)
Glucose yield (%)
BMPCH4 at day 57CH4 at day 6
A

Results and discussion: optimization step (Chapter 4)
135
degradation (proteins, holocelluloses…). Moreover, hemicelluloses degradation was not assessed. During
the long reaction duration necessary to obtain the BMP values (≈ 6 months), more compounds would be
released than after the 72 h enzymatic hydrolysis (better accessibility, enzymes efficiency…). Furthemore,
recalcitrant compounds can be transformed into methane for long-reaction duration, as already discussed.
It can also be noticed that water soluble sugars are moderately correlated to glucose yield (R² = 0.5928,
n=18, Annex 6). Thus, water extracted sugars are correlated to methane production at 57 days (R² =0.6505,
Figure 4-6B) but slightly to CH4 at day 6 (R² = 0.4569, Figure 4-6B) and to BMP (R² = 0.5663, Figure
4-6B). Small water soluble sugars obtained in this study would slightly influence BMP (low slope and R²).
According to the model of Monlau (2012b) (Figure 4-1), maximum methane amount (NmL/g TS pretreated)
due to soluble sugars would be 6.5 mL (for sample 5) that is not higher than the standard-deviation obtained
in BMP measurements (Table 4-3). However, it must be noticed that in their study soluble sugars where
extracted under mild acid conditions. Thus, water soluble sugars may not be enough representative of mild
acid soluble sugars. Otherwise, their small amount would explain why their influence was slightly observed
on methane production at day 6 although those compounds would not require extensive hydrolysis.
The moderate correlation between soluble sugars and glucose yield probably shows that solubilization of
holocelluloses contribute to soluble sugars. Soluble sugars were also positively correlated to qPCR results
(R² correlation=0.9971, n=5, Annex 6) and DML (R² correlation=0.5403, n=18, Annex 6). Those
correlations would show that soluble sugars origin can also be the release of fungal extracellular
polysaccharides (Gutierrez et al., 1995). Thus, water extracted sugars would be directly linked to fungal
pretreatment. Soluble sugars increase is often reported for fungal culture durations varying from 1 to 2
weeks (Agosin et al., 1985; Shrestha et al., 2008a) whereas a decrease is observed for longer times (from 2
to 4 weeks) (Agosin et al., 1985; De Souza et al., 2006) probably due to fungal consumption of sugars
released from lignocellulosic biomass (Salvachúa et al., 2013).
Study of glucose yield after enzymatic hydrolysis appeared relevant to study BMP and methane production
at 57 days and RS for glucose yield were built (Annex 7 and Annex 5). Glucose yield was higher with
metals and was mostly influenced by moisture content (high moisture content led to high glucose yield)
(Table 4-6). Duration is slightly influent. Increased temperature (> ≈ 25°C) in combination with a sufficient
moisture content (> ≈ 3.5°C) enhanced glucose yield.

Results and discussion: optimization step (Chapter 4)
136
Table 4-6. Extrema for RS of the current study: DML, lignin losses, glucose yield, methane
production at day 6 and 57 and BMP. Metals
Time (d)
WW/TS
Temp (°C)
Maximum calculated values
Minimum calculated values
Yes 18.68 3.21 28.59 DML = 28% TS
No 18.36 3.38 28.86 DML = 28% TS
Yes 18.18 3.81 28.62 Lignin losses = 34%TSi
No 17.82 3.71 27.5 Lignin losses = 28%TSi
Yes 16.49 4.29 28.83 Glucose yield = 42%
No 16.16 4.42 28.34 Glucose yield = 30%
Yes 15.85 4.15 29.67 CH4 day 6 = 86 NmL/g TSi
No 16.29 4.06 29.79 CH4 day 6 = 72 NmL/g TSi
Yes 11.67 4.02 28.22 CH4 day 57 = 180 NmL/g TSi
Yes 19.84 3.46 26.36 CH4 day 57 = 182 NmL/g TSi
No 10.32 3.76 25.78 CH4 day 57 = 152 NmL/g TSi
No 19.86 3.15 23.73 CH4 day 57 = 144 NmL/g TSi
Yes 11.37 4.00 27.84 BMP = 206 NmL/g TSi
Yes 19.99 3.22 25.04 BMP = 213 NmL/g TSi
No 10.31 3.74 25.85 BMP = 185 NmL/g TSi
No 19.54 2.98 22.91 BMP = 169 NmL/g TSi
Yes 13.61 2.97 19.41 DML = 4% TS
No 13.80 2.83 19.54 DML = 2% TS
Yes 12.23 2.78 20.52 Lignin losses = 6%TSi
No 12.84 2.93 19.82 Lignin losses = 2%TSi
Yes 12.78 2.09 26.37 Glucose yield = 14%
No 13.99 2.17 28.30 Glucose yield = 6%
Yes 17.12 3.47 19.62 CH4 day 6 = 47 NmL/g TSi
No 17.36 3.91 20.39 CH4 day 6 = 45 NmL/g TSi
Yes 13.92 3.12 19.19 CH4 day 57 = 121 NmL/g TSi
No 15.22 4.07 19.98 CH4 day 57 = 118 NmL/g TSi
Yes 13.48 3.18 19.31 BMP = 142 NmL/g TSi
No 14.92 3.81 19.42 BMP = 141 NmL/g TSi

Results and discussion: optimization step (Chapter 4)
137
4.4 Response surfaces for methane production
To further investigate implied mechanisms in methane production from pretreated straws and to find
optimum pretreatment conditions to maximize methane production; RS for methane productions at day 6,
day 57 and BMP were built (models coefficients in Annex 5). All RS of the current studies were significant
(Table 4-7) at least at a 90% confidence level (p-value < 0.1).
Table 4-7. Sums of squares for regression and residues, statistic F and p-value
for built response surfaces. ***<0.001; **<0.05;*<0.1.
DOF
DML (%TS)
CH4 d 6 (NmL/g TS i)
CH4 d 57 (NmL/g TS i)
BMP (NmL/g TS i)
Lignin losses (%)
Glucose yield (%)
Regression 13 578.98 2386.39 7146.22 7849.09 1277.85 1311.54
Global residuals 6 8.64 41.38 978.14 359.76 15.88 27.49
Residuals 4 7.32 27.61 388.48 738.60 14.16 24.11
Error 2 1.32 13.77 589.66 1419.97 1.72 3.37
F statistic - 30.92 26.62 3.37 10.07 37.15 22.02
p-value - 2.07E-04*** 3.19E-04*** 7.22E-02* 4.84E-03** 1.21E-04*** 5.49E-04***
In the current study, response surfaces were calculated for CH4 yields expressed per g of initial TS (before
pretreatment) since they are the most relevant to optimize for industrial applications as they take into
account mass losses. RS for methane productions without taking into account mass losses were also studied
(NmL/g VSpretreated) but did not allow to better explain mechanisms, probably because methane production
expressed in different units were correlated (Figure 4-7).
Figure 4-7. Correlation between methane productions expressed per gram of VS pretreated or per
gram of TS initial.
R² = 0.8362
R² = 0.8147
R² = 0.7265
0
50
100
150
200
250
300
0 50 100 150 200 250
Me
than
e p
rod
uct
ion
(N
mL
/g V
S p
retr
eat
ed)
Methane production (NmL /g TSi)
BMP
CH4 at day 57
CH4 at day 6

Results and discussion: optimization step (Chapter 4)
138
4.4.1 Methane production after 6 days
Apart from fungal biomass, lignin content and sugars yield, other unidentified structural features were likely
implied in methane production at day 6 (since R² were not extremely high < 0.65 for the three correlation,
see 4.3). RS for this variable (Figure 4-8) showed a small positive influence of metal addition on CH4
production (as for lignin content and sugars yield). It also gave highest values for high temperature and
water amount (in accordance with RS for lignin losses, DML and sugars yield). However, the maximum was
obtained between day 15-16, close to optimized culture duration for glucose yield after enzymatic hydrolysis
whereas maximum DML and lignin losses require 18-days culture duration (Table 4-6). Since culture
duration is only slightly influent on glucose yield, other parameters would explain the maximum methane
production after 6 days of BMP-tests for culture duration close to 16 days.
A positive influence of WW/TS, especially for short culture duration, was noticed. It can be related to a
limitation of nutrients and enzymes circulation with small water amount. Without metal addition, WW/TS
had a lower influence on methane production at day 6. A slight lower influence of moisture without metals
was also visible on RS of lignin losses. With RS of DML, lignin losses and sugars yield, temperature had
generally a higher influence than moisture content. It is also the case for RS of methane production at day 6
(increasing with enhanced temperature). As for lignin losses and DML, low methane productions at day 6
were obtained for small culture duration and low WW/TS.
Figure 4-8. RS for methane production at day 6 (NmL/g TSi). Contour plots correspond to methane production at day 6 depending on pretreatment parameters:
Temp: Temperature in °C; WW/TS: initial moisture content in g/g; and Time: duration in days.

Results and discussion: optimization step (Chapter 4)
139
4.4.2 Methane production after 57 days
RS for methane yield after 57 days of anaerobic digestion (NmL/g TSi) showed a positive influence of metal
addition (Figure 4-9) as for delignification and glucose yield after enzymatic hydrolysis (shown influent on
this methane production).
Figure 4-9. RS for methane production at day 57 (NmL/g TSi). Contour plots correspond to methane production at day 57 depending on pretreatment parameters:
Temp: Temperature in °C; WW/TS: initial moisture content in g/g; and Time: duration in days.
4.4.2.1 Samples pretreated with metals addition
After metal addition, culture duration was the second most influent parameter of RS for methane yield at 57
days (/g initial TS). In Figure 4-9, it can be observed that greatest variations of methane production at 57
days correspond to culture duration changes. The optimal methane production at 57 days, i. e. the maximum
obtainable methane production with the fungal pretreatment, is not reached in the experimental domain.
However, highest methane productions were observed for short (≈11 d) and long (≈19 d) durations (Table
4-6).

Results and discussion: optimization step (Chapter 4)
140
The maximum methane production for long culture duration for samples with metals addition was due to
high lignin losses and high glucose yield (enzymatic hydrolysis) for those durations. It was also highlighted
that fungal biomass amount (estimated with DML) was probably maximal for long culture duration and
contributed positively to methane production. For long culture duration, increased temperature had slightly
more positive influence than increased moisture content on methane production at 57 day (Figure 4-9).
High values of methane production were also obtained for small durations of pretreatment. For small
pretreatment durations (with metals), it seems that fungal biomass also had a positive influence since highest
methane production were obtained with highest fungal biomass (Sample 6 < Sample 2 < Sample 9) (Figure
4-4 and Table 4-3). DML and lignin losses were maximized with high temperature for short duration.
Moisture content was less influent (especially on lignin losses). Highest values of DML corresponded to
moisture content close to 3.5 (Annex 4). For short durations, good glucose yield after enzymatic hydrolysis
can be obtained with high temperature and moisture content (Annex 7). Thus, high temperature and moisture
content also maximized methane production at 57 days for short duration (Table 4-6).
Culture conditions leading to minimum calculated values for methane production at 57 day were close to
those minimizing lignin losses and DML: small temperature and duration between 12-14 d.
4.4.2.2 Samples pretreated without metals addition
Even if added metals amount is small, it will constitute an additional cost at industrial scale. This cost is not
crippling if methane increase is consequent. Notwithstanding, substrate modifications and methane
production without metals addition must also be studied. Without metals, calculated lignin losses are in
average 5% lower than with metals addition (Annex 3). Without metals, response surfaces for methane
production at day 57 were similar to those with metals, except that maximum value is only found for small
duration (Figure 4-9). Assumptions on the pretreatment action outside of the experimental domain are not
possible without complementary experiments (allowing an increased experimental domain). However, RS
for lignin losses inside the experimental domain show that approximately two days more without metals
addition are required to reach same delignification levels as those obtained with metals addition (Annex 3).
It shows the positive influence of metals on fungal delignification-rate. The maximum delignification level
seems to be reached inside the experimental domain (Annex 3). The absence of maximum calculated BMP
value for long culture duration without metals can be explained by similar DML for long-culture duration
with or without metals but lower lignin losses without metals. Thus, sugars losses were probably increased
compared to sample with metals for long-culture duration.

Results and discussion: optimization step (Chapter 4)
141
Fungal biomass amount (represented by DML) was more influent on methane production rate than on
methane yield (Figure 4-5B). DML are taken into account to evaluate the global efficiency of the process
(pretreatment and anaerobic digestion) by expressing methane productions per gram of initial TS. Thus,
DML must be moderate. However, lignin losses were shown very important to increase methane production.
High lignin losses correspond to high DML. In fact, the selectivity for lignin losses must be considered and
DML without information on lignin losses is not enough informative. Notwithstanding, BMP (NmL/g TSi)
for two pretreated straws having similar lignin losses while be maximized for the sample having the lower
DML. Importance of lignin selective attack can also be observed for samples with metals for long culture
duration: lignin losses were identical above ≈ 25°C whereas DML continued to increase with rising
temperatures (Annex 3 and Annex 4). It means that above ≈ 25°C for long-culture duration sugars losses
increased. It explains why smaller culture temperature maximizes methane production for long culture
duration compared to temperature required for short culture duration (Table 4-6).
4.4.3 BMP
Methane production at day 57 and BMP had similar behavior regarding lignin content, DML and glucose
yield after enzymatic hydrolysis (see 4.3). Thus, RS for BMP (Figure 4-10) had a similar behavior than RS
for methane production at 57 days: significant positive influence of metals addition and presence of two
maxima with short and long culture durations (with metals), respectively. The maximum for long culture
duration with metals addition is also higher than the one for short duration (Table 4-6). Implied mechanisms
discussed for methane production at day 57 would be also valuable for BMP. Temperatures for maximum
BMP with short-culture duration were highest than for long-culture duration (as with methane production at
day 57). Without metals, maximum calculated BMP value corresponded to short culture duration (Table
4-6). Temperature for this maximum was lower than the one for maximization of BMP with metals for short
culture duration. This was likely linked to the little influence of temperature on glucose yield after
enzymatic hydrolysis (influencing BMP) without metals and for short culture duration (Annex 7).
For samples with metals and for long culture duration, temperature and moisture content have little influence
on the BMP (Figure 4-10). However, high values for temperature and WW/TS allow an increase BMP for
the short culture duration (30-40 NmL/g TS i more). To increase BMP, elevation of temperature during the
pretreatment appears slightly more efficient than moisture content increase for short duration. It is also the
case for lignin losses (Annex 3).
Maximum calculated BMP value (239 NmL/g TS i, Table 4-6) is not very different from the measured BMP
of NIC (≈227 NmL/g TS i) but is better than measured BMP for untreated wheat straw (183± 5 NmL/g TS).
Parameters used for pretreatment of sample 9 are the closest ones from the maximum calculated BMP for
short duration (at 10.63 d) (Table 4-6). Measured BMP of this sample is among the best ones (Table 4-3).
According to the response surfaces for samples with metals addition, the minimum calculated BMP (144
NmL/g TS i) is obtained with culture parameters very close to those of samples 6 that had effectively one of

Results and discussion: optimization step (Chapter 4)
142
the worst measured BMP. Minimum calculated value for lignin losses with metals addition (Table 4-6) was
obtained for pretreatment conditions very close to those leading to the minimum calculated BMP and to one
of the minimum measured BMP with metals (sample 6).
In the current study, it was highlighted that pretreatment conditions were not optimal and did not allow a
sufficient BMP improvement. Thus, effects on biodegradability were limited. The highest calculated values
for BMP was 213 NmL/g TSi (Table 4-6), it is not different from BMP values obtained for NIC (216 NmL/g
TS) but better than BMP of UWS (183 NmL/g TS). Maximum values were generally obtained with WW/TS
between 3 and 4, that was already considered as optimal for wheat straw pretreated with WRF (Zadražil and
Brunnert, 1981).
j
Figure 4-10. RS for BMP (NmL/g TSi). Contour plots correspond to BMP depending on pretreatment parameters:
Temp: Temperature in °C; WW/TS: initial moisture content in g/g; and Time: duration in days.

Results and discussion: optimization step (Chapter 4)
143
4.5 Conclusion
Metals addition enhances lignin decomposition by fungi. Increased lignin decomposition improves
enzymatic hydrolysis of cellulose and methane production from the substrate. Fungal biomass, easily and
rapidly degradable, would increase methane production rate and influence positively but slightly the BMP
value of pretreated substrate. The second most important pretreatment parameter to increase methane
production was culture duration. With metals addition two maxima for BMP (NmL/g TSi) were observed for
short and long culture duration, respectively. It would allow a certain flexibility of the pretreatment duration
that can be advantageous for industrial application.The absence of maximum for long-culture duration
without metals is probably due to a less selective delignification. Best pretreatment duration in those
conditions is still unknown. Pretreatment temperature and initial moisture content of the substrate must be
sufficient even if those parameters have a lower influence on subsequent methane production. In the tested
conditions, it seem possible to work with fixed temperature and moisture content. According RS for BMP
(Figure 4-10), it is proposed to use 25-26°C and WW/TS = 4.


145
Chapter 5.
Pyrolysis-GC-MS study of White-Rot Fungi pretreated
wheat straws for anaerobic digestion
Objectives
To determine the interest of py-GC-MS technique to investigate fungal pretreated wheat straws for
anaerobic digestion and, notably the possibility to use py-GC-MS to access pretreatment efficiency
To understand the link between py-GC-MS data and data from more usual measurement techniques
Table of content 5.1 INTRODUCTION ....................................................................................................................................................................................................................146 5.2 MATERIAL AND METHODS SPECIFIC TO PY-GC-MS STUDY OF PRETREATED STRAWS ...........................................................................................................................147
5.2.1 Fungal pretreated samples .............................................................................................................................................................. 147 5.2.2 Pyrolysis-GC-MS ............................................................................................................................................................................. 148
5.2.2.1 Spectra obtaining ........................................................................................................................................................................................ 148 5.2.2.2 Spectrum analysis and interpretation ............................................................................................................................................................. 149
5.2.3 Characterization of fungal pretreated straws for anaerobic digestion ................................................................................................... 149 5.2.3.1 Acid hydrolysis (Klason lignin, cellulose and hemicelluloses) with NREL method .................................................................................................... 149 5.2.3.2 Qpcr .......................................................................................................................................................................................................... 149 5.2.3.3 BMP-tests .................................................................................................................................................................................................. 149
5.2.4 Statistical analysis .......................................................................................................................................................................... 150 5.2.4.1 Analysis of Variances (ANOVA) ...................................................................................................................................................................... 150 5.2.4.2 Principal Component Analysis (PCA) ............................................................................................................................................................... 150
5.3 ORIGIN OF THE MAIN COMPOUNDS FOUND IN PYROLYSATES .........................................................................................................................................................150 5.3.1 Fungus characterization .................................................................................................................................................................. 150
5.3.1.1 N-containing (N) and unspecific compounds (UN)............................................................................................................................................. 151 5.3.1.2 Polysaccharide-derived products (PS) ............................................................................................................................................................. 152 5.3.1.3 Possible presence of small lignin amount ........................................................................................................................................................ 152
5.3.2 Straws characterization ................................................................................................................................................................... 153 5.3.2.1 Lignin derived pyrolysis products ................................................................................................................................................................... 153 5.3.2.2 Polysaccharide-derived products ................................................................................................................................................................... 154 5.3.2.3 N-containing compounds .............................................................................................................................................................................. 155
5.4 COMPARISON BETWEEN PY-GC-MS DATA, OTHER CHARACTERIZATION TECHNICS AND ANAEROBIC DIGESTIBILITY ....................................................................................155 5.4.1 Variations of the S/G ratio ............................................................................................................................................................... 156 5.4.2 PCA to study relationships between samples characteristics ................................................................................................................. 158
5.4.2.1 qPCR variable opposed to straw composition variables in the plan 1-2 ................................................................................................................ 159 5.4.2.2 Correlation between BMP and PS/LIG-pyr or PS/LIG NREL in the plan 1-3 ............................................................................................................ 160
5.4.3 Fungal biomass (qPCR variable) ........................................................................................................................................................ 162 5.4.4 Polysaccharides (PS)/Lignin (LIG) ratio determined by py-GC-MS .......................................................................................................... 163
5.5 CONCLUSION ......................................................................................................................................................................................................................164
Highlights
High protein (containing phenylalanine) and carbohydrate (glucose polymers) amounts in mycelium
of P. brumalis BRFM 985
Suitability of py-GC-MS to study S/G ratio
Possibility to estimate fungal biomass amount on WRF pretreated straws with py-GC-MS
Possible usefulness of polysaccharides/lignin ratio to select efficient strain for fungal pretreatment
Possibility to access strain efficiency thanks to polysaccharides/lignin ratio determined with py-GC-
MS

Results and discussion: py-GC-MS study (Chapter 5)
146
5.1 Introduction
Galletti & Bocchini (1995) defined pyrolysis as the thermal fission (break) of a sample in the absence of
oxygen into molecules of lower mass, low enough to be suitable for GC and/or MS and large enough to
provide analytical information on the original sample. Fragments are separated and identified thanks to GC-
MS. Their nature and relative distribution constitute a fingerprint characteristic of a particular sample. Py-
GC-MS is considered as a sensitive, rapid and reproducible technique with almost no waste generation
(Galletti and Bocchini, 1995). Moreover, analysis duration is short compared to other existing methods
(Alves et al., 2006).
Some compounds formed by Py-GC-MS are known to originate specifically from lignin, polysaccharides,
protein, etc. Thus, Py-GC-MS of lignocellulose was successfully applied to study relative amounts of lignin
and carbohydrates, to classify lignin based on their S/G ratio, to follow chemical changes in cell walls
during plant maturation or after chemical or biological delignification. Finally, it was used to evaluate the
origin and composition of food and feed, forest litter, compost and materials from paper industry (pulps,
papers, effluents) (Galletti and Bocchini, 1995). Pyrolysis is generally a semi-quantitative method but some
studies established a correlation between Klason lignin and lignin estimated with pyrolysis for
lignocellulosic biomass (Alves et al., 2006; Fahmi et al., 2007; Ross and Mazza, 2011).
Few studies were carried out on WRF pretreated wheat straw using py-GC-MS (Camarero et al., 1994;
Galletti and Bocchini, 1995). Application potential of this technique seems not yet fully exploited. In
particular, estimation of fungal biomass amount with py-GC-MS would be interesting in order to control
the fungal growth during pretreatment. A recurrent difficulty with fungal biomass measurement methods is
the frequent variation of conversion factors with fungal species but also within a single species (due to
environmental growth conditions) (Zhou et al., 2015a).
Methane production from lignocellulosic biomass can be predicted using biomass contents of: lignin and
crystalline cellulose (negative impact), amorphous holocelluloses and protein (positive impact) (Figure 4-1).
With the same straw, protein content of fungal pretreated straws is mainly a function of fungal biomass
amount that was shown to influence positively anaerobic digestion of fungal pretreated substrate (Chapter
4). Crystallinity of cellulose can influence cellulose behavior under pyrolysis (Zhang et al., 2010; Zhu et
al., 2004), amorphous regions would produce less characteristic fragments. Consequently, the ratio
polysaccharides/lignin (PS/LIG), with PS corresponding to holocelluloses, seems a good indicator for the
valorization of a WRF pretreated lignocellulosic substrate and for the evaluation of the pretreatment
effectiveness. Measurement of S/G (synapyl /guaiacyl) ratio can also be helpful to study anaerobic
digestibility since S/G ratio influences lignin degradability (Monlau et al., 2013).
The aim of this study was to investigate the suitability of py-GC-MS to assess the anaerobic
biodegradability of wheat straw pretreated by several fungal strains (five WRF and one Brown-Rot Fungi
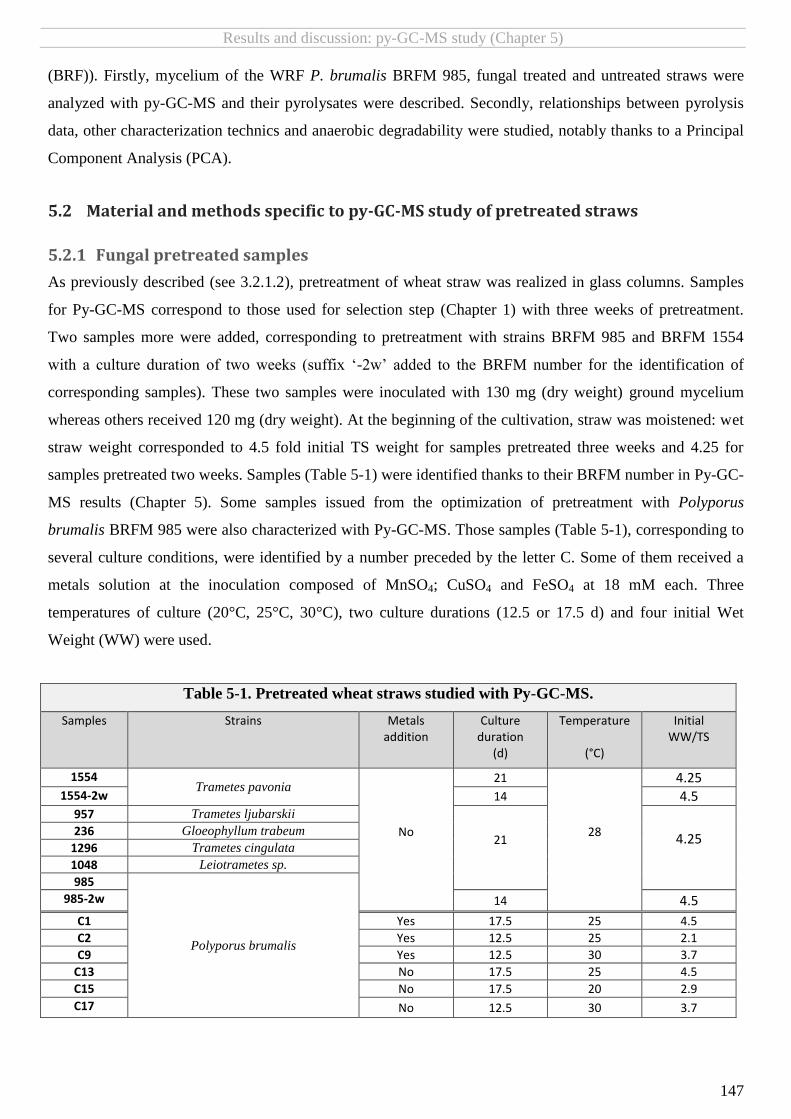
Results and discussion: py-GC-MS study (Chapter 5)
147
(BRF)). Firstly, mycelium of the WRF P. brumalis BRFM 985, fungal treated and untreated straws were
analyzed with py-GC-MS and their pyrolysates were described. Secondly, relationships between pyrolysis
data, other characterization technics and anaerobic degradability were studied, notably thanks to a Principal
Component Analysis (PCA).
5.2 Material and methods specific to py-GC-MS study of pretreated straws
5.2.1 Fungal pretreated samples
As previously described (see 3.2.1.2), pretreatment of wheat straw was realized in glass columns. Samples
for Py-GC-MS correspond to those used for selection step (Chapter 1) with three weeks of pretreatment.
Two samples more were added, corresponding to pretreatment with strains BRFM 985 and BRFM 1554
with a culture duration of two weeks (suffix ‘-2w’ added to the BRFM number for the identification of
corresponding samples). These two samples were inoculated with 130 mg (dry weight) ground mycelium
whereas others received 120 mg (dry weight). At the beginning of the cultivation, straw was moistened: wet
straw weight corresponded to 4.5 fold initial TS weight for samples pretreated three weeks and 4.25 for
samples pretreated two weeks. Samples (Table 5-1) were identified thanks to their BRFM number in Py-GC-
MS results (Chapter 5). Some samples issued from the optimization of pretreatment with Polyporus
brumalis BRFM 985 were also characterized with Py-GC-MS. Those samples (Table 5-1), corresponding to
several culture conditions, were identified by a number preceded by the letter C. Some of them received a
metals solution at the inoculation composed of MnSO4; CuSO4 and FeSO4 at 18 mM each. Three
temperatures of culture (20°C, 25°C, 30°C), two culture durations (12.5 or 17.5 d) and four initial Wet
Weight (WW) were used.
Table 5-1. Pretreated wheat straws studied with Py-GC-MS.
Samples Strains Metals addition
Culture duration
(d)
Temperature
(°C)
Initial WW/TS
1554 Trametes pavonia
No
21
28
4.25 1554-2w 14 4.5
957 Trametes ljubarskii
21
4.25
236 Gloeophyllum trabeum
1296 Trametes cingulata
1048 Leiotrametes sp.
985
Polyporus brumalis
985-2w 14 4.5
C1 Yes 17.5 25 4.5
C2 Yes 12.5 25 2.1
C9 Yes 12.5 30 3.7
C13 No 17.5 25 4.5
C15 No 17.5 20 2.9
C17 No 12.5 30 3.7

Results and discussion: py-GC-MS study (Chapter 5)
148
5.2.2 Pyrolysis-GC-MS
Py-GC-MS were realized at the INRA of Grignon (ECOSYS UMR) with the help of MF Dignac.
5.2.2.1 Spectra obtaining
Prior to the pyrolysis-GC-MS analysis, samples were ground for 5 min at 25 Hz (Mix Mill 400, Retsch).
Straws pretreated with several strains (selection step), with a culture duration of three weeks or two weeks
(‘-2w’) and untreated straw (UWS) were analyzed with Py-GC-MS. Moreover, mycelium of BRFM 985 was
also studied (cultivated in liquid medium, see 2.1.3). Triplicates were measured for straw samples. Only one
mycelium sample was pyrolyzed as considered more homogeneous than straws.
Approximately 0.5–1 mg of sample was loaded in a quartz tube (2 mm x 25 mm) closed with quartz wool
(B) and heated at 650°C in 0.15 s (30 s hold) with a pyrolysis unit (CDS Pyroprobe 5000 Series, A). At
650°C, all wheat straw polymers are attacked (Figure 1-19). Moreover, Wang et al. (2012a) recommended
almost 600°C for cellulose pyrolysis. Pyrolysis products were transferred in splitless mode to a Hewlett
Packard HP-6890 gas chromatograph (GC) equipped with a 60 m fused silica capillary column SolGelWax
(SGE, 0.32 mm i.d., film thickness 0.5µm), with helium as carrier gas (1 mL/min) .
The temperature program of the GC oven was set with an increase from 30 to 280°C at 2°C/min, with the
temperature maintained at 280 °C for 15 min. The GC was coupled to a Hewlett Packard HP-5973 mass
spectrometer (electron energy 70 Ev.).
Figure 5-1. Analytical pyrolysis apparatus and sample loading. A. CDS pyroprobe (Ware, 2013). B. Sample loading into quartz tube before insertion in the platinum coil (Carlson et al., 2009).
A B

Results and discussion: py-GC-MS study (Chapter 5)
149
5.2.2.2 Spectrum analysis and interpretation
Compounds in pyrolysates were identified on the basis of their mass spectra, GC retention times, and
comparison with Wiley library mass spectra. Peaks were integrated using the HP MS Chemstation (Version
C.01.05) on the total ion current trace. All pyrograms are displayed with phenol, 2,6-dimethoxy- (coded
LIG6-S) having the same peak height. Compounds with a quality almost equals to 60% were taken into
account (estimated by the software comparing library and measured mass spectrum). Other compounds were
added and research manually (triplicates comparison, notably) to improve analysis precision. Relative areas
per thousand of total area of spectra were calculated per sample for each molecule. An average of relative
areas per compound was calculated for triplicates. Average relative areas per thousand were used to sum
certain group of compounds or to obtain ratio with chosen compounds (results in Table 5-2). For these
calculations, few values were excluded when too different from the two other replicate values (as mentioned
in Table 5-2).
Samples issued from the optimization step (samples identified with letter “C”) were extra-samples used to
improve correlations robustness. For those samples, only few compounds were researched on pyrolysates
and their peaks were integrated by the software (results in Table 5-3) without manual verification (based on
triplicate comparison for peaks integration and identification). To calculate polysaccharides/lignin (PS/LIG)
ratio, all compounds detected automatically by the software with a quality superior to 60% (without manual
verification), were taken into account.
5.2.3 Characterization of fungal pretreated straws for anaerobic digestion
5.2.3.1 Acid hydrolysis (Klason lignin, cellulose and hemicelluloses) with NREL method
As previously described (in 3.2.3.2), the lignin, cellulose and hemicelluloses contents were analyzed by S.
Zhou following adapted NREL two-stage acid hydrolysis method.
5.2.3.2 Qpcr
As already presented (see 4.2.3.6) fungal biomass was quantified with qPCR for few samples from the
optimization step (C1, C2, C9). In their study, Zhou et al. (2015a) had estimated fungal biomass amount for
samples pretreated two weeks but standard curves were different than for samples from the optimization
step: standard curves were established for each strain using serial dilutions of genomic DNA ranging from
1 ng/μL down to 1.10−4
ng/μL. Zhou used the same methodology to measure samples from the selection
steps (pretreated three weeks).
5.2.3.3 BMP-tests
Samples pretreated three weeks for selection step were measured in the same BMP-test whereas samples
pretreated two weeks (985-2w and 1554-2w) were measured together in another BMP-test. Samples from
the optimization step were measured together in a third BMP-test.

Results and discussion: py-GC-MS study (Chapter 5)
150
5.2.4 Statistical analysis
5.2.4.1 Analysis of Variances (ANOVA)
Analysis of variance (ANOVA, α = 0.05) was carried out using R software (version 3.2.1) with “lattice” and
“lawstat” libraries. Multiple means comparisons were performed with Tukey’s HSD (Honest Significant
Difference) test at the same significance threshold of 0.05.
5.2.4.2 Principal Component Analysis (PCA)
Principal Component Analysis (PCA) was built with SIMCA software from UMETRICS. Number of
components is automatically fixed (based notably on Kaiser criterion). Quality representation for individuals
(samples) is based on Dmodx that represents the samples distance to the model in the X-space (space defined
by variables on retained component). Dmodx is expressed in normalized units when divided per the residual
standard deviation of a sample to the model. The software plots it in a chart that allows detection of outliers
(Dmodx > F crit) since statistical distribution is known (F-distribution) (Wikstrom et al., 1998).
5.3 Origin of the main compounds found in pyrolysates
Compounds observed in the pyrolysates were classified according to their origin into several groups:
polysaccharides derived products (PS), N-containing compounds (N), lignin-derived products (LIG).
Another group was used for compounds with unspecific origin (UN) which can be formed from several
sources during pyrolysis. The code attributed to main chemical compounds identified in pyrolysates is
composed of an abbreviation of the origin (PS, N, LIG or UN) followed by a number (Annex 8 and Annex
9). Finally, compounds with unknown origin were just numbered: e. g. 64 for ethylbenzene and 66 for
xylene.
5.3.1 Fungus characterization
Pyrogram of the mycelium of Polyporus brumalis BRFM 985 is presented in Figure 5-2. It is dominated by
molecules with a polysaccharide origin (PS). Several N-containing compounds are also identified (N), they
can have a protein origin or a chitin origin (Buurman et al., 2007; Dignac et al., 2005).
Chitin is specific to fungi and arthropod invertebrates. Chitin, a polymer of N-acetylglucosamine, has a
structure similar to glucose but with a N-acetyl group replacing the hydroxy methyl group. Chitin amount in
wood decaying fungi is variable, e. g. 2.6% or 26.6% of the dry cell-wall (Chen and Johnson, 1983).
Fungal dry weight is constituted in majority by carbohydrates and proteins and in minor amount by
minerals, fat and pigments (Hadar and Cohen-arazi, 1986; Mohaček-Grošev et al., 2001). Thus, pyrogram of
P. brumalis BRFM 985 is in agreement with fungal composition in literature.

Results and discussion: py-GC-MS study (Chapter 5)
151
LLKL
Figure 5-2. Pyrogram of mycelium of Polyporus brumalis BRFM 985. Compounds codes are reported in Annex 9 (for compounds 64 and 66) and Annex 8 (all other compounds).
5.3.1.1 N-containing (N) and unspecific compounds (UN)
The most probable origin for N-containing compounds found in the mycelium pyrogram (Figure 5-2) was
investigated. Pyridine (N4, N5) can derived from chitin pyrolysis or from proteins containing alanine
(Buurman et al., 2007; Dignac et al., 2005).
Indoles (N1, N2) probably have a tryptophan origin in the fungus pyrolysate. Pyrrole (N8) can have whether
a protein origin (hydroxyproline, proline, glycine and glutamic acid) or a pigments origin (Dignac et al.,
2005). Given the fact that pigments are minor compounds in fungi, the protein origin is the most likely.
Toluene (UN1), 4-methyl phenol (UN6) and phenol (UN5), are considered as unspecific (UN) because
besides their protein origin, they can be minor peaks in lignin or tannins pyrograms (Dignac et al., 2005). A
lignin or tannin origin is unlikely for this fungus sample. Toluene (UN1) can also have a PS-origin (Ross
and Mazza, 2011) and was detected in xylan fractions (Pouwels et al., 1987). Phenol (UN5) and 4-methyl
phenol (UN6) were minor compounds of cellulose or xylan pyrolysates (Nowakowski and Jones, 2008), but
their polysaccharide origin was not strongly established. They could also originate from the presence of
lignin in xylan (strong hemicelluloses-lignin linkages, difficult isolation of pure xylan fraction…)
(Chimphango et al., 2012; Monlau et al., 2013). In the mycelium pyrolysate, toluene (UN1), 4-methyl
phenol (UN6) and phenol (UN5) would be mainly due to proteins.
The origin of styrene (UN2) is unspecific (Dignac et al., 2005). Significant contribution is found after
pyrolysis of BRFM 985 mycelium. Apart from proteins, other possible origins for styrene (UN2) are p-
coumaric or ferulic acids, lignin or tannins (Dignac et al., 2005; Ralph and Hatfield, 1991). Since these

Results and discussion: py-GC-MS study (Chapter 5)
152
molecules are not major fungal compounds, a protein origin (phenylalanine) is also favored for mycelium
pyrolysate. Phenylalanine pyrolysis leads to a high toluene (UN1) peak, a medium styrene (UN2) peak and a
small ethylbenzene (64) peak (Chiavari and Galletti, 1992), which corresponds to the distribution of these
three peaks in the fungus pyrolysate (Figure 5-2). Thus, they very likely indicate the presence of high
phenylalanine amount in mycelium. Then, a tyrosine origin can be suggested for 4-methyl phenol (UN6) and
phenol (UN5). UN1, UN2, UN5 and UN6 were main peaks in the fungus pyrolysate. Therefore,
phenylalanine and tyrosine would be major amino acids in P. brumalis BRFM 985 mycelium.
By way of comparison, they were found in high quantity along with threonine in the WRF Lentinus tigrinus
(Lechner and Papinutti, 2006) whereas histidine, aspartic and glutamic acids were main amino acids in the
WRF Pleurotus ostreatus mycelium (Manu-Tawiah and Martin, 1987). However, amino-acids composition
is strain and substrate dependent but also function of culture conditions (Hadar et al., 1992).
5.3.1.2 Polysaccharide-derived products (PS)
Major peaks derived from polysaccharides in fungus pyrolysate (Figure 5-2) are most likely issued from
glucose polymers: furan, 2-methyl (PS28), 1,4:3,6-dianhydro-.alpha.-d-glucopyranose (PS21), Furan, 2,5-
dimethyl- (PS35), 2-Cyclopenten-1-one, 2-hydroxy-3-methyl- (PS34) and 2-Cyclopenten-1-one, 2,3-
dimethyl- (PS8). Those products can effectively be encountered in cellulose pyrolysates (Lu et al., 2012;
Moldoveanu, 2001). Some of them are also reported in other kind of glucose polymers, PS21 can notably be
found in 1-3 branched glucan pyrolysates. Glucose polymers constitute an important part of fungi
polysaccharides. They can be under the form of glycogen and trehalose (storage function) or hyphal linked
glucans excreted by fungi (Gutierrez et al., 1995; van der Kaaden et al., 1984; Walker and White, 2005).
PS28 can come from chitin (glucose-like polymer). The minor peak of 2-furancarboxaldehyde, 5-methyl-
(PS9) can derive from glycogen (Kalač, 2009; Moldoveanu, 1998).
Finally, mannitol was also described as a major carbohydrate in fungi (Kalač, 2009; Obatake, 1998) but no
mannitol specific products were found after pyrolysis of P. brumalis BRFM 985 mycelium. Thus, no
conclusion about the amount of this polymer in P. brumalis BRFM 985 can be provided. The maltol (PS36)
peak does not derive from mannitol (Ross et al., 2009) but from glucose polymers since reported in cellulose
pyrolysis (Moldoveanu, 2001).
5.3.1.3 Possible presence of small lignin amount
The presence of one small guaiacol (LIG1-G) peak in the pyrolyzate of the mycelium can be noticed. This
compound is considered as a lignin marker (LIG) and, to our knowledge, no other origin are identified. The
presence of small lignin amount in WRF that had grown on lignocellulosic substrate is very likely since
compounds enter into the hyphae (Martínez et al., 2005) and hyphal wall was labelled with anti-lignin
antibodies (Burlat et al., 1997). These mechanisms are unlikely with the mycelium of P. brumalis that grew
on synthetic medium (without lignin).

Results and discussion: py-GC-MS study (Chapter 5)
153
However, high amount of dietary fiber can exist in fungi fruiting body. A part of this fiber is Klason lignin,
as notably observed in white-rot (Pleurotus spp. and Ganoderma lucidum) but also for other kinds of fungi
(Cheung, 1997; Ragunathan and Swaminathan, 2003). Klason lignin determination is based on acid
precipitation and can notably be contaminated with proteins (Reeves and Galletti, 1993). Klason lignin
(KL) measurement is the most common method to estimate lignin amount with Van Soest method. No one
of these methods allow the obtaining of a pure analytical fraction without matter losses (Giger S., 1985). KL
values may often be more accurate (Goff et al., 2012; Hatfield et al., 1994). Thus, the possibility to
encounter lignin-like fractions rather than real lignin in fungi cannot be excluded. Further investigations are
required to conclude.
5.3.2 Straws characterization
Pyrograms of untreated straw and straws pretreated in the selection step are presented in Figure 5-3. Given
that three main constituents of wheat straw are cellulose, hemicelluloses (carbohydrates) and lignin
(polyphenols) (Sun, 2010); straws pyrograms were dominated by lignin- and polysaccharide-derived
compounds.
5.3.2.1 Lignin derived pyrolysis products
Lignin-derived pyrolysis products dominated pyrolysates of wheat straws, as already observed by Reeves
and Galletti (1993). Lignin is formed by an association of three monolignols: p-hydroxyphenyl (H, no
methoxy substituent), guaiacyl (G, methoxy substituent) and syringyl (S, di methoxy substituent) units.
Pyrolysis products were labeled according to their origin: S- and G-units derived compounds are classified
as LIG-S and LIG-G, respectively. Compounds derived from H-units in pyrograms are often considered as
unspecific, especially because they can also originate from cinnamic acids (not lignin units) which are
frequent in non-woody-plants (Camarero et al., 1999; Ross and Mazza, 2011). In addition, H-units are less
abundant in grasses compared to S- and G-units (Fahmi et al., 2007). For those reasons, H-units were not
considered in the current study.
Major peaks in straws pyrolysates (Figure 5-3) were guaiacol (LIG1-G), phenol, 2,6-dimethoxy- (LIG6-S)
and 2-Methoxy-4-vinylphenol (UN13). Guaiacol (LIG1-G) and/or 2-Methoxy-4-vinylphenol (UN13) were
already reported as major compounds in untreated wheat straw. Phenol, 2,6-dimethoxy- (LIG6-S) was not
reported as a major peak in straws pyrolysates, even if generally present (Camarero et al., 1994; Reeves and
Galletti, 1993; Ross and Mazza, 2011). However, a major peak of a compound (4-Vinyl-2,6-
dimethoxyphenol) with a chemical structure close to the one of LIG6-S was observed by Camarero et al.
(1994).
2-Methoxy-4-vinylphenol (UN13) was classified as unspecific compound since it was identified in lignin
samples but also in small amounts in xylan samples. However, lignin origin is favored (Dignac et al., 2005)
because lignin residues can be found in xylan fractions. Methyl guaiacol (LIG2-G) is additionally quite
important in pyrolysates (Figure 5-3). Methyl guaiacol (LIG2-G) and vanillin (LIG22-G) were major

Results and discussion: py-GC-MS study (Chapter 5)
154
compounds of pyrolyzed milled wood lignin (Terrón et al., 1995). Vanillin (LIG22-G) is a minor peak in
studied pyrolysates.
L
Figure 5-3. Pyrograms comparison of untreated wheat straw (UWS) and fungal treated straws. Compounds codes are reported in Annex 8 and Annex 9.
Yield and composition of pyrolysates can vary notably owing to the variety of py-GC-MS operating
conditions (heating rates, temperatures…) (Carlos Amen-Chen et al., 2001). Moreover, lignocellulosic
samples even within a same species can also vary in their composition (growth stage, tissue…).This explains
why similarities and few variations were observed between the current study and literature on pyrolysis-GC-
MS of wheat straw.
5.3.2.2 Polysaccharide-derived products
Cellulose is a polymer of glucose whereas wheat straw hemicelluloses are mainly composed of xylan with
other carbohydrates in minor amount (glucose…). Therefore, polysaccharide-derived pyrolysis products
were abundant in the pyrolysates of wheat straw. Major polysaccharide compounds encountered in straw
samples are 1,2-Cyclopentanedione (PS30), 1,2-Cyclopentanedione, 3-methyl- (PS16) and furfural (PS25)
(Figure 5-3). Furfural (PS25) was reported as a major compound by Ross and Mazza (2011) in herbaceous
crop pyrolysates (including wheat straw). They also reported PS16 in wheat straw pyrolysates. Those
compounds (PS30, PS16 and PS25) were not found in the mycelium pyrolysates (Figure 5-2) whereas some
other compounds were both present in straw and fungus chromatograms such as furan, 2-methyl (PS28),
1,4:3,6-dianhydro-.alpha.-d-glucopyranose (PS21), furan, 2,5-dimethyl- (PS35). For PS-class compounds, it
is sometimes possible to identify the carbohydrate origin (glucose, xylose…), e. g. 1,4:3,6-Dianhydro-

Results and discussion: py-GC-MS study (Chapter 5)
155
.alpha.-d-glucopyranose (PS21) derived from glucose polymers (Dignac et al., 2005). Glucose is a major
compound in fungus but also in straws (cellulose and hemicelluloses). Moreover, no specific compounds
from hemicelluloses were identified in the current study. Thus, polysaccharides originating from fungus
cannot be well distinguished from those derived from straws.
5.3.2.3 N-containing compounds
Only one N-containing compound was found (in sample 1554-2w). This N-containing compound, pyridine
(N4), originated from protein or chitin. The low amount of N-class can be explained by the poor protein
content of wheat straw (around 3%) (Lee, 1997) and also by the low amount of fungal biomass on pretreated
straw in comparison with other straw compounds (qPCR results in Table 5-2).
5.4 Comparison between py-GC-MS data, other characterization technics and
anaerobic digestibility
Cellulose and hemicelluloses, especially amorphous structure, are converted into methane during anaerobic
digestion. Lignin, with its protective role, is recalcitrant to degradation (Sun, 2010). Anaerobic digestibility
is most often measured by a BMP-test that consists to digest a substrate under optimal conditions. However,
with slowly degradable substrates such as straw, several months can be required to reach the BMP value.
The characterization of fungal pretreated wheat straws helps to evaluate the pretreatment efficiency and to
understand modifications of BMP values. The possibility to use py-GC-MS to characterize fungal pretreated
straw for anaerobic digestion is investigated. It relies on detection of major differences between untreated
and pretreated straws (notably lignin content) and on the possibility to compare fungal treated straws
between them in order to assess the efficiency of fungal pretreatment (PS/LIG…).
Pyrolysis peaks were integrated in order to compare the yield of pyrolysis products obtained in the treated
and untreated samples. Peak areas were expressed in per thousand of total peak area per chromatogram. For
each molecule, average relative areas per thousand for triplicates were calculated (Annex 9).
Identification results and relative areas per thousand for straw samples are reported in Annex 9 and
ordered by their retention time (RT). Then, sums of average relative areas were calculated for chosen groups
of compounds (PS, LIG-G, etc.). Lignin percent for pyrolysis is calculated by comparison of sum of relative
areas for all compounds with sum of relative areas for lignin compounds. This quantitative overview of
main compounds in pyrolysates is reported in Table 5-2. In this table, a comparison with straw
composition (determined by acid hydrolysis with NREL method) and fungal biomass amount (determined
by qPCR) is also presented.
Comparatively to untreated straw, it can be observed a tendency for PS compounds to increase in
pyrolysates. It is likely that the increase is due to lignin removal that leads proportionally to more
carbohydrates in the pyrograms (Ohra-aho et al., 2013; Reeves and Galletti, 1993). Then, the amount of
compounds with a lignin origin (LIG) is greater in untreated wheat straw (UWS). This is in accordance with
Klason lignin measurements.

Results and discussion: py-GC-MS study (Chapter 5)
156
It is difficult to find a link between composition determined with NREL method (acid hydrolysis) and
pyrolysis data. It does not exist linear correlations for lignin percentages (R² = 0.07, n = 8) or PS/LIG ratios
obtained with the two measurement technics (Annex 10). In those conditions, supplementary information is
required to compare samples between them based on their PS or lignin contents determined with py-GC-MS
data. For PS/LIG ratios, the mismatch can be explained by the little efficiency of PS amount estimation with
pyrolysis compared to lignin.
Carbohydrate polymers have a structure less stable than lignin and they fragment easily upon pyrolysis to
produce non-diagnostic low molecular weight compounds (Ralph and Hatfield, 1991). Lignin measurement
with pyrolysis can depend of several parameters but the most likely explanation for the mismatch between
the two lignin content measurement methods is that small variations between samples imped the
establishment of a significant correlation. The addition of the mycelium sample (lignin amount close to zero)
improved the R² coefficient (R² = 0.5565, n = 9, Annex 10).
5.4.1 Variations of the S/G ratio
Concerning the S/G ratio determination with pyrolysis, no chemical measurements were carried out to
compare results. Monomers coming from lignin G-units (LIG-G) were more abundant than S-units
(LIG-S) in the pyrolyzates. The same observation was done by Fahmi et al. (2007) with grass lignins. S-
units are, in general, more biodegradable than G-units (Camarero et al., 2001; Monlau et al., 2013), it also
the general case for WRF degradation (Chapter 1, 1.6.1). In the current study, S/G measured with pyrolysis-
GC-MS were between 0.5 and 0.6 in most samples (Table 5-2). Río et al. (2012) and Terrón et al. (1993)
found similar results after pyrolysis-GC-MS of wheat straw. There is a good reproducibility since slight
different analytical conditions were used (pyrolysis temperature, etc.) between studies.
The S/G ratios of lignin can be estimated by various methods, most usual are nitrobenzene oxidation (NBO),
cupric oxidation and thioacidolysis (Camarero et al., 1994; Hedges and Ertel, 1982; Lapierre, 2010). 13C
Nuclear Magnetic Resonance (NMR) can also be used but seems not well adapted for S/G determination in
wheat straw (Fidalgo et al., 1993). Chemical methods break uncondensed bonds, mainly β-O-4 ether bonds
that are the main linkages in lignin (Lapierre, 2010). By contrast, Py-GC-MS is able to break some C-C
bounds (condensed) between lignin units (Ralph and Hatfield, 1991; Tsuge and Matsubara, 1985). G-units
are more implied in condensed linkages than S-units (Lapierre, 2010; Monlau et al., 2013). Consequently,
G-units estimation with py-GC-MS increases compared to other methods, decreasing S/G ratio. S/G
obtained with py-GC-MS may be closer of the actual value (Ross and Mazza, 2011). For wheat straw, S/G
ratio reached 0.8 when measured with NBO or cupric oxidation (Sun et al., 1995); 0.9 with thioacidolysis
(Lapierre et al., 1988). To obtain similar results between chemical and py-GC-MS determinations of S/G
ratio, some specific pyrolysis compounds can be selected (Lima et al., 2008; Nunes et al., 2010) or alkaline
lignin extraction must be carried on before py-GC-MS (Terrón et al., 1993).
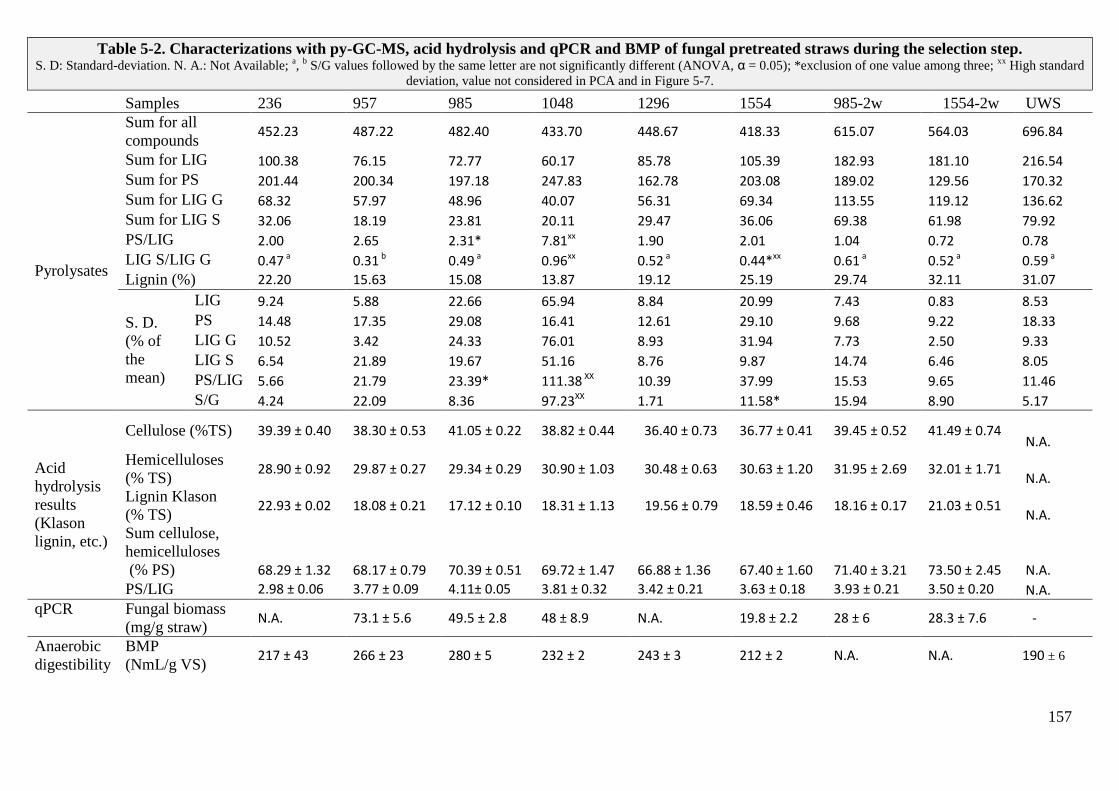
157
Table 5-2. Characterizations with py-GC-MS, acid hydrolysis and qPCR and BMP of fungal pretreated straws during the selection step. S. D: Standard-deviation. N. A.: Not Available;
a,
b S/G values followed by the same letter are not significantly different (ANOVA, α = 0.05); *exclusion of one value among three;
xx High standard
deviation, value not considered in PCA and in Figure 5-7.
Samples 236 957 985 1048 1296 1554 985-2w 1554-2w UWS
Pyrolysates
Sum for all
compounds 452.23 487.22 482.40 433.70 448.67 418.33 615.07 564.03 696.84
Sum for LIG 100.38 76.15 72.77 60.17 85.78 105.39 182.93 181.10 216.54
Sum for PS 201.44 200.34 197.18 247.83 162.78 203.08 189.02 129.56 170.32
Sum for LIG G 68.32 57.97 48.96 40.07 56.31 69.34 113.55 119.12 136.62
Sum for LIG S 32.06 18.19 23.81 20.11 29.47 36.06 69.38 61.98 79.92
PS/LIG 2.00 2.65 2.31* 7.81xx 1.90 2.01 1.04 0.72 0.78
LIG S/LIG G 0.47 a 0.31 b 0.49 a 0.96xx 0.52 a 0.44*xx 0.61 a 0.52 a 0.59 a
Lignin (%) 22.20 15.63 15.08 13.87 19.12 25.19 29.74 32.11 31.07
S. D.
(% of
the
mean)
LIG 9.24 5.88 22.66 65.94 8.84 20.99 7.43 0.83 8.53
PS 14.48 17.35 29.08 16.41 12.61 29.10 9.68 9.22 18.33
LIG G 10.52 3.42 24.33 76.01 8.93 31.94 7.73 2.50 9.33
LIG S 6.54 21.89 19.67 51.16 8.76 9.87 14.74 6.46 8.05
PS/LIG 5.66 21.79 23.39* 111.38 XX 10.39 37.99 15.53 9.65 11.46
S/G 4.24 22.09 8.36 97.23XX 1.71 11.58* 15.94 8.90 5.17
Acid
hydrolysis
results
(Klason
lignin, etc.)
Cellulose (%TS) 39.39 ± 0.40 38.30 ± 0.53 41.05 ± 0.22 38.82 ± 0.44 36.40 ± 0.73 36.77 ± 0.41 39.45 ± 0.52 41.49 ± 0.74 N.A.
Hemicelluloses
(% TS) 28.90 ± 0.92 29.87 ± 0.27 29.34 ± 0.29 30.90 ± 1.03 30.48 ± 0.63 30.63 ± 1.20 31.95 ± 2.69 32.01 ± 1.71
N.A.
Lignin Klason
(% TS) 22.93 ± 0.02 18.08 ± 0.21 17.12 ± 0.10 18.31 ± 1.13 19.56 ± 0.79 18.59 ± 0.46 18.16 ± 0.17 21.03 ± 0.51
N.A.
Sum cellulose,
hemicelluloses
(% PS) 68.29 ± 1.32 68.17 ± 0.79 70.39 ± 0.51 69.72 ± 1.47 66.88 ± 1.36 67.40 ± 1.60 71.40 ± 3.21 73.50 ± 2.45 N.A.
PS/LIG 2.98 ± 0.06 3.77 ± 0.09 4.11± 0.05 3.81 ± 0.32 3.42 ± 0.21 3.63 ± 0.18 3.93 ± 0.21 3.50 ± 0.20 N.A.
qPCR Fungal biomass
(mg/g straw) N.A. 73.1 ± 5.6 49.5 ± 2.8 48 ± 8.9 N.A. 19.8 ± 2.2 28 ± 6 28.3 ± 7.6 -
Anaerobic
digestibility
BMP
(NmL/g VS) 217 ± 43 266 ± 23 280 ± 5 232 ± 2 243 ± 3 212 ± 2 N.A. N.A. 190 ± 6

Results and discussion: py-GC-MS study (Chapter 5)
158
In the current study (Table 5-2), most samples have a similar S/G ratios, it may show no preferential
consumption for G-units or for S-units in the tested conditions of fungal pretreatments. In contrast, the
sample treated with BRFM 957 has a lower S/G ratio (S/G = 0.31) than the one of untreated samples (S/G =
0.59). This suggests an increased consumption of S-units compared to G-units for BRFM 957. Straw
pretreated with BRFM 957 was extensively degraded (high masses losses, as discussed in Chapter 7, 7.3).
This degradation explains the particularly low S/G and concerns both carbohydrates and lignin as it can be
observed with acid hydrolysis results. In literature, Substrate, strains and culture conditions influence
remaining S/G ratio in substrate (Chapter 1, 1.6.1). Backa et al. (2001) suggested that fungi may first
degrade S-units. By contrast, Agosin et al. (1985) observed a consumption of G units before S units by
WRF. In the current study, similar S/G ratios between samples pretreated two weeks or three weeks did not
allow concluding on this topic.
5.4.2 PCA to study relationships between samples characteristics
A Principal Component Analysis (PCA) was built to investigate relationships between BMP, variables
measured with py-GC-MS and with other methods (acid hydrolysis, qPCR…). Moreover, this PCA would
allow identifying supplementary compounds of interest in pyrolysates since small peaks are frequently
important in making discriminations between samples (Wampler, 1999). To increase samples variability and
so to obtain a more robust statistical analysis, the mycelium sample was added to straws samples (Table 5-2
and Table 5-3) to carry out the PCA. Due to numerous missing values, only pyrolysis compounds which had
a value of relative area for more than the half of the samples were taken into account. Several variables
influencing the BMP were studied: fungal biomass determined by qPCR (qPCR on PCA, expressed in mg/g
straw), Klason lignin (LIG), hemicelluloses (HEMI) and cellulose (CEL) determined by NREL method
(expressed in % TS) and the resulting PS/LIG (PS/LIG NREL) and finally, PS/LIG obtained with py-GC-
MS (PS/LIG-pyr). BMP was also included as variables to build the PCA (expressed in NmL/g VS).
On three axes, PCA contains 75% of the whole information contained in data. The plan defined by axis one
and two (plan 1-2, Figure 5-4) and the one defined by axis one and three (plan 1-3, Figure 5-5) will be
further described; except for variables that are not well represented in the plans (both coordinates close to or
inferior to 0.5). Plan 2-3 is not presented as no additional information can be obtained from this plan.
Samples are well represented according to the criteria DmodX (see 5.2.4.2).

Results and discussion: py-GC-MS study (Chapter 5)
159
5.4.2.1 qPCR variable opposed to straw composition variables in the plan 1-2
l
Figure 5-4. Plan 1-2 of the PCA with pyrolysis and other characterization variables.
In plan 1-2, axis 1 is defined by qPCR variable (left) that is opposed to the content of LIG, HEMI and CEL
(right). This opposition is explained because maximal amounts of LIG, CEL and HEMI correspond to a
minimal amount of qPCR variable (equals to zero for UWS sample) and vice versa (CEL, HEMI and LIG
equals to zero for fungus sample).
There is a correlation between PS/LIG-pyr and BMP. This observation suggests that py-GC-MS may be
used as pre-selecting technic in anaerobic digestion studies (almost on wheat straw). BMP variable is
opposed to the recalcitrant LIG. Surprisingly, BMP is opposed and poorly linked to CEL and HEMI that
constitute the substrate for anaerobic digestion. It may be due to little variation between samples for HEMI
and CEL content (Table 5-2). qPCR variable is positively and poorly linked to BMP on the plan 1-2.
Concerning pyrolysate compounds, when LIG6-S, LIG1-G, and UN13 are high, lignin amount is also high,
as expected (major peaks in straws pyrolysates). The control sample UWS is the one having the highest
lignin content. It is, thus, the closest sample to lignin-related variables. PS16, also major in straw
pyrolysates, is high when HEMI and CEL are high. PS21 and PS35 are anti-correlated to HEMI and CEL
and correlated to qPCR variable. In this study, they may represent more fungal biomass than straw: they are
Axis 1 (44% of total information)
Axis
2 (
20%
of
tota
l in
form
atio
n)

Results and discussion: py-GC-MS study (Chapter 5)
160
major peaks of fungus pyrolysate and minor ones on straws pyrolysates. UN1 and UN2 are correlated to
qPCR variable since they are major peaks in fungus pyrolysate.
5.4.2.2 Correlation between BMP and PS/LIG-pyr or PS/LIG NREL in the plan 1-3
Figure 5-5. Plan 1-3 of the PCA with pyrolysis and other characterization variables.
On plan 1-3 (Figure 5-5), PS/LIG NREL is well represented compared to the projection in plan 1-2. On plan
1-3, PS/LIG NREL is slightly positively correlated to PS/LIG pyr and BMP. PS/LIG pyr and BMP are
highly correlated as in the plan 1-2. This relationship suggests that py-GC-MS would allow classifying
pretreated wheat straws according to their anaerobic digestibility. As previously observed, PS35, PS21, UN1
and UN2 were correlated to fungus sample and qPCR variable; BMP is almost independent from qPCR
variable, CEL and HEMI.
Axis 1 (44% of total information)
Axis
3 (
11%
of
tota
l in
form
atio
n)

Results and discussion: py-GC-MS study (Chapter 5)
161
Table 5-3. Pyrolysis and characterization data used for PCA for samples from the optimization step. xx
High standard deviation, value not considered in PCA and in Figure 5-7.
C17 C15 C13 C9 C2 C1 fungus
Average relative areas per thousand for triplicates
LIG1-G 14.02 22.94 16.24 24.61 21.98 17.34 4.92
LIG22-G 3.18 10.82 4.99 10.38 8.28 6.43 LIG2-G 2.81 5.77 2.72 2.43 4.56 2.15 LIM 1.43 3.86 1.90 2.28 3.36 1.92 PS21 3.64 1.69 1.48 4.69 4.79 4.94 23.73
PS28
18.81
PS3
3.97
PS30 6.00 6.31 4.53 15.01 9.67 8.43 PS35 2.03 0.00 2.28 0.00 1.07 5.80 16.58
PS42
3.04
PS46
3.03
PS6
5.76
PS7
8.85
PS8
5.00
PS9
2.29 6.10
UN1 23.93 13.50 19.10 12.96 14.49 22.75 58.11
UN2 17.79 8.83 9.03 10.99 9.90 9.52 13.29
UN5
28.84
UN6
39.68
64 6.06 3.05 4.80 3.62 4.18 4.83 66 11.42 7.59 8.46 7.58 9.21 11.89 11.33
Main characteristics
LIG (% TS)
21.8 ± 0.1 22.5 ± 0.7 20.1 ± 0.2 19.0 ± 0.2 22.5 ± 0.1 17.6 ± 0.3 0.00
HEMI (%TS)
28.9 ± 1.0 25.5 ± 0.9 27.7 ± 0.9 27.9 ± 0.0 31.1 ± 0.9 31.4 ± 1.9 0.00
CEL (%TS)
39.2 ± 0.7 34.9 ± 0.5 39.4 ± 0.6 37.8 ± 0.7 35.2 ± 0.8 38.5 ± 1.1 0.00
qPCR variable (mg/g straw) N.A. N.A. N.A. 48.1 38.38 63.4 1000.00
PS/LIG nrel 3.1 ± 0.1 2.7 ± 0.1 3.3 ± 0.1 3.4 ± 0.1 2.9 ± 0.1 4.0 ± 0.2
PS/LIG pyr 1.47 ± 0.32 0.78 ± 0.11 2.64 ± 1.66
xx 1.51 ± 0.07 1.29 ± 0.37 2.01 ± 1.01
xx -
BMP 194 ± 13 176 ± 12 205 ± 17 268 ± 16 183 ± 3 247 ± 14 281±31

Results and discussion: py-GC-MS study (Chapter 5)
162
5.4.3 Fungal biomass (qPCR variable)
Fungal biomass determination with qPCR was not carried out for the sole brown-rot fungus of this study
(BRFM 236). As explained previously (in 5.3.1.1), high amount of phenylalanine in the mycelium of BRFM
985 is suspected because of high peaks of UN1, UN2 and small one of 64 on fungus pyrolysate. UN1 and
UN2 relative peak areas for fungal pretreated samples are well correlated to fungus samples and qPCR
variable (plan 1-2 and 1-3). They may be good indicators of fungal development as they are correlated to
fungal biomass, whether separately (R²=0. 72 for UN1 and R²=0.68for UN2, Annex 11) or in addition with
compound 64 (R²=0.81, n=8, Figure 5-6). UN1 and UN2 seem preferable to study fungal biomass than PS35
and PS21 also correlated to qPCR variable (plan 1-2 and 1-3) because carbohydrates are less stable during
pyrolysis. Thus, pyrolysis would allow monitoring WRF growth during pretreatment of wheat straw.
j
Figure 5-6. Correlation between Toluene (UN1), Styrene (UN2) and ethylbenzene (64) (Py-GC-MS)
and fungal biomass (qPCR) for straws pretreated with WRF.
To finish, in the pyrogram of the stone deteriorating fungi Ulocladium atrum (not WRF), diverse
compounds found in P. brumalis pyrolysate were also in high amount: toluene (UN1), methylfuran (PS28),
alpha-d-glucopyranose (PS21), dimethylfuran (PS35). Styrene (UN2) and phenol (UN5) were also in
moderate amount (Gutierrez et al., 1995). Thereby, some properties of P. brumalis pyrolysate might also be
valid for other fungal groups. High presence of toluene (UN1) and styrene (UN2) in mycelium pyrolysate of
non WRF is encouraging to investigate the possibility to quantify fungal biomass amount with py-GC-MS
for other kind of fungi, such as BRF.
y = 0.476x + 7.8274 R² = 0.8117
0
10
20
30
40
50
60
0 20 40 60 80
A
vera
ge p
er
tho
usa
nd
re
lati
ve a
rea
for
UN
1+U
N2
+64
Fungal biomass (mg/g pretreated straw)

Results and discussion: py-GC-MS study (Chapter 5)
163
5.4.4 Polysaccharides (PS)/Lignin (LIG) ratio determined by py-GC-MS
Whereas no linear correlation exists between PS/LIG-pyr and PS/LIG determined with NREL method
((hemicelluloses + cellulose)/lignin Klason) (Annex 10). A correlation between BMP and PS/LIG-pyr or
PS/LIG NREL was revealed by the PCA (plan1-3). This correlation was drawn (Figure 5-7). Samples with
particularly high standard-deviations (>50% of the triplicate average) for PS/LIG pyr (C1, C2 and 1048 in
Table 5-2and Table 5-3) were excluded from the plotted correlation (Figure 5-7).
Figure 5-7. Correlation between PS/LIG determined with Py-GC-MS or NREL method and BMP.
Correlations from Figure 5-7 highlight the interest of PS/LIG ratio to compare fungal pretreated straws for
anaerobic digestion application and the possibility to use pyrolysis to investigate pretreatment efficiency
thanks to PS/LIG pyr.
Since different culture conditions were used in this study, it seems possible to use PS/LIG pyr to access
anaerobic degradability of wheat straw samples obtained with slight different fungal pretreatments (such as
culture temperature varying between 25-30°C or culture duration between 12.5 and 21days).
Notwithstanding, it cannot be excluded that classification of fungal treated samples based on their PS/LIG
pyr ratio would be more precise using the same pretreatment condition. Major compounds released and
information they contain can be variable because not only dependent on analytical conditions (especially
pyrolysis temperature and chromatographic separation conditions) but also on fungal culture parameters
(strain, substrate, aeration, moisture…) (Carlos Amen-Chen et al., 2001; Wan and Li, 2012). Finally, it
seems possible to compare straws pretreated with different WRF strains with py-GC-MS to access
pretreatment efficiency. The comparison might also include Brown-Rot Fungi (BRF) but more data are
required to conclude (only one BRF strain tested in this study, G. trabeum BRFM 236).
R² = 0.6422 R² = 0.6223
0
50
100
150
200
250
300
0 1 2 3 4 5
BM
P (
Nm
L/gV
S p
retr
eat
ed
)
PS/LIG
NREL
py-GC-MS

Results and discussion: py-GC-MS study (Chapter 5)
164
5.5 Conclusion
Interestingly, a correlation was found between fungal biomass amount determined by qPCR and peaks areas
of few compounds released by py-GC-MS of pretreated wheat straws. These compounds were notably
toluene and styrene, present in high amount in mycelium pyrolysate. Thus, py-GC-MS allows the estimation
of WRF biomass amount on pretreated wheat straws.
Anaerobic digestibility of fungal pretreated wheat straws can be accessed by the determination of the
PS/LIG ratio with py-GC-MS. Slight variations in fungal pretreatments did not seem to alter the relationship
between BMP and PS/LIG determined with py-GC-MS. However, PS/LIG ratios measured with py-GC-MS
were not related to PS/LIG determined with usual chemical method (acid hydrolysis). Thus, py-GC-MS
would be useful only to pre-select strains for fungal pretreatment of wheat straw for anaerobic digestion.

165
Chapter 6.
Solid-State Anaerobic Digestion of wheat straw:
impact of substrate/inoculum ratio and of fungal
pretreatment
Objectives
To study the impact of S/I ratio in batch SSAD of wheat straw in order to obtain an efficient start-up
phase
To investigate the fungal pretreated substrate behavior in SSAD reactors with leachate recycle
To characterize and to explain mechanisms observed during SSAD
Table of content
6.1 INTRODUCTION ..................................................................................................................................................................... 166 6.2 MATERIAL AND METHODS SPECIFIC TO SSAD IN BATCH REACTORS (CHAPTER 6) ................................................................................ 166
6.2.1 Wheat straw pretreatment in a pilot-reactor ......................................................................................................... 166 6.2.2 Solid state Anerobic Digestion in batch ................................................................................................................... 167 6.2.3 Experiment II: fungal pretreatment for SSAD .......................................................................................................... 168 6.2.4 Analytical methods .................................................................................................................................................. 169
6.3 EXPERIMENT I: TESTS OF SEVERAL S/I ........................................................................................................................................ 172 6.3.1 Anaerobic digestion of wheat straw: start-up phase progress ............................................................................... 172 6.3.2 TVFA/alkalinity as process stability indicator .......................................................................................................... 174
6.4 EXPERIMENT II: FUNGAL PRETREATMENT FOR SSAD ..................................................................................................................... 177 6.4.1 Substrates anaerobic digestibility ........................................................................................................................... 177 6.4.2 SSAD start-up phase ................................................................................................................................................ 178 6.4.3 Methane production of fungal pretreated straw in SSAD ....................................................................................... 180
6.5 CONCLUSION ........................................................................................................................................................................ 183
Highlights
Requirement of S/I ratio between 2-3 (VS basis) to digest wheat straw in batch SSAD reactors with
leachate recycle
Capacity to recover from acidification for batch SSAD process having a TVFA/alkalinity ratio < 2
and VFA peak concentrations < 10 g/L
Fungal pretreatment at pilot-scale with inoculation in non-sterile conditions
Improvement of biodegradability (/g VS pretreated) with inefficient pretreatment in SSAD reactor
Facilitation of start-up phase for SSAD of fungal pretreated straw leading to good methane
production
Necessity to optimize pretreatment to improve global efficiency of methane production (/g TS initial)
Results and discussion: SSAD (Chapter 6)
166
6.1 Introduction
High substrate loadings allow a higher methane production per reactor but also increase the risk of
imbalance and acidification. A sufficient amount of methanogens that convert VFA into methane must be
provided to avoid VFA accumulation during the start-up phase. Otherwise, anaerobic digestion can be
inhibited. Thus, the determination of the optimum Substrate (S)/Inoculum (I) ratio for SSAD of a given
substrate is of first interest.
The goals of this chapter were: (1) to investigate S/I ratio for batch SSAD of wheat straw during
experiment I; (2) to investigate SSAD of pretreated wheat straw with P. brumalis BRFM 985 with an
appropriate S/I ratio with experiment II.
The experimental design retained for reactors was one stage batch with leachate recycle. Indeed, batches
require less capital cost and are relatively simpler (Li et al., 2011). For solid substrate with low degradability
and/or C/N ratio higher than 15, one stage processes are recommended (Kusch et al., 2008; Weiland, 1993).
Leachate recycle favors homogenization which facilitates the complete degradation of the substrate
(Brummeler et al., 1992). Continuous watering bears the risk to spread acidification during process initiation
whereas discontinuous leachate recycle is assumed to expand methanogenic areas (Kusch et al., 2012).
6.2 Material and methods specific to SSAD in batch reactors (Chapter 6)
6.2.1 Wheat straw pretreatment in a pilot-reactor
To inoculate wheat straw, Polyporus brumalis BRFM 985 was cultivated on pellets of miscanthus
(Terr’nova ®: 48% cellulose, 27% hemicelluloses, 24% lignin). Those pellets were inoculated with
mycelium from a sterile liquid culture (see 2.1.3). The mycelium was harvested, mixed with 25 mL sterile
mQ water and ground one minute with Ultra-Turrax T25 Blender at 9500 rpm. Then, 50 g autoclaved
miscanthus pellets were inoculated with a solution composed of 10 mL of previous crushed mycelium and
40 mL sterile mQ water. Miscanthus pellets were incubated for 24 h at 30°C before the addition of 25 mL
sterile mQ water. Culture on miscanthus lasted from 7 to 10 days. Flasks, closed with cotton plugs, were
manually agitated every day to favor the colonization.
One Roux flasks of colonized miscanthus pellets were used to inoculate 200 g of sterile straw. Straw was
autoclaved in a bag with around 113 mL of mQ water/100 g straw. Then, 255 mL sterile mQ water/100 g
straw and a metal solution filtered at 0.2 µm were added to the straw under sterile conditions: 5 mL of
CuSO4 and FeSO4 at 18 mM for 100 g of straw. Bags were manually agitated to ensure a good repartition of
fungal inoculum. Finally, seeded straw was putted in a 40 L aerobic reactor (Figure 6-1) in clean conditions.
Before inoculation, the reactor was washed with a kärcher during 20 min at 120°C. The aerobic reactor
contained two trays, the first one received 200 g of straw with a size of around 10 cm and the second one

Results and discussion: SSAD (Chapter 6)
167
received cut straw with scissors (1-5 cm). Fungal cultivation on straw lasted 13 days in the aerated reactor
under high moisture content (≈90%). Pretreated straw was freeze-dried before further utilization.
Figure 6-1. Aerobic pilot-reactor design for wheat straw pretreatment with Polyporus brumalis,
BRFM 985. MC: Moisture Content.
6.2.2 Solid state Anerobic Digestion in batch
6.2.2.1 SSAD reactors design
Experiments were performed using four 6-L glass reactors (head-space≈1L, leachate tank≈1.5L), water-
jacketed to 37 °C (Figure 6-2). Leachate was collected in a liquid-phase reservoir at the base of reactors.
Liquid pumps were set with timers to sprinkle the whole leachate volume over the biomass bed
automatically every 2 hours. Biogas production was continuously measured using a mass flowmeter (Milli
Gas counter-1V3.0 PMMA, Ritter Inc., Germany). Gas flow rate was acquired every 2 min by a computer.
M
Figure 6-2. Schematic diagram of laboratory-scale SSAD digesters.
Results and discussion: SSAD (Chapter 6)
168
6.2.2.2 Experiment I: tests of several S/I
6.2.2.2.1 Inoculum
Inoculum used in this experiment came from a stable full-scale SSAD process fed with bull manure
(containing high proportion of straw). The plant operates in batch at 41°C with leachate recycle and reaction
duration of two months. To reduce the inoculum methane production, 1.7 kg was let for one month in 6-L
batch reactors with 1.5 L of tap water in duplicates. A part of these leachates were used as liquid inoculum
for Experiment I (nutrients, buffering capacity…). TS and VS of the inoculum are reported in Table 6-1.
6.2.2.2.2 Experimental configuration
Four reactors were carried on in parallel with different S/I ratios (VS basis): 1, 2, 4 and 11 (Table 6-2).
Wheat straw and solid inoculum were mixed manually in a bag, transferred in a reactor and pressed one
minute with 8 kg to mimic the compaction occurring in plants. Then, total liquid (tap water and liquid
inoculum) were buffered with NaHCO3 to the medium concentration of 1.3 g/L. TS content was between 15
and 17% within reactors. Head spaces were flushed with nitrogen gas. Measurements were stopped after the
VFA peak.
6.2.3 Experiment II: fungal pretreatment for SSAD
6.2.3.1 Substrates and inoculum
Colonized miscanthus with Polyporus brumalis BRFM 985 was prepared in the same way as for the
inoculation of wheat straw (see 6.2.1). Pretreated straw corresponded to the tray with cut straw (1-5 cm) of
the pilot-reactor. To better compare all reactors and as pretreated straw was freeze-dried, untreated wheat
straw used in Experiment II was cut (1-5 cm), autoclaved and freeze-dried. Uncolonized miscanthus pellets
were also autoclaved and freeze-dried. After a sufficient duration, leachates of Experiment I did not contain
VFA. They were used as liquid inoculum for Experiment II. Solid inoculum was constituted by a mixture
between reactors with S/I = 1 and 2 of experiment I after two months of SSAD and a part of starved
inoculum prepared in the same way as for experiment I. Substrates and inoculum TS and VS are reported in
Table 6-1.
6.2.3.2 Experimental configuration
Three reactors were used to investigate the SSAD of pretreated wheat straw (Table 6-2). As pretreated straw
contained colonized miscanthus, two reactors were prepared to measure the influence of miscanthus on
SSAD. The first one contained raw straw and raw miscanthus (reactor MWS), and the second one raw straw
and colonized miscanthus (reactor cMWS). The amount of miscanthus per reactor was representative of the
proportion used for straw pretreatment. Proportion of straw in reactor MWS was chosen to obtain the same
VS amount between reactor MWS and reactor with fungal pretreated straw (reactor FWS). Straw amount
was the same between cMWS and MWS but substrate VS (miscanthus and straw) was slightly lower in

Results and discussion: SSAD (Chapter 6)
169
cMWS than in MWS. Finally, another reactor was prepared to estimate the endogenous production of the
inoculum, it contained only inoculum and liquid. Amount of inoculum in this reactor was higher than for
reactors with substrate (Table 6-2) in order to have the same %TS content in each reactor. Added tap water
was buffered with NaHCO3 to the average concentration of 1.3 g/L.
6.2.4 Analytical methods
6.2.4.1 SSAD monitoring parameters: leachate pH, VFA, alkalinity and biogas composition
On leachate samples, pH and VFA were measured regularly (daily at the beginning, weekly at the end).
After a centrifugation step (20 min at 13 400 rpm in a micro-spin), VFA concentrations were quantified by
gas chromatography using a Clarus GC 580 (PerkinElmer, USA) equipped with an auto-sampler and
coupled to flame ionization detection (250°C) with H2 and air as burning gas. Injector temperature was
220°C. Elite FFAP (PerkinElmer, USA) column (15 m long, 0.53 mm i.d., 1 µm thickness) was used with
nitrogen (Nitrogen gas 5.0) as carrier gas at a flow of 7 mL/min. The GC oven temperature was programmed
to increase from 80 to 120°C (hold time 6.5 min) and from 120°C to 140°C (hold time 3 min). Acid acetic
equivalents of VFA used to calculate the ratio TVFA/alkalinity were: 1.0 (C2), 0.818 (C3), 0.682 (C4), 0.588
(C5) and 0.515 (C6). These coefficients correspond to the ratio between molar mass of acid acetic and of the
concerned VFA. Some alkalinity measurements were realized on leachate with pH titration using 0.1M HCl
to endpoint of 4.3 (Ripley et al., 1986).
Biogas composition in the head space was also analyzed with a Clarus GC 480 at the same frequency than
leachate sampling and in the same way as already described for BMP assays (see 2.1.5).
6.2.4.2 BMP-tests
BMP of miscanthus and colonized miscanthus were measured in the same BMP-tests series whereas wheat
straw and pretreated wheat straws were measured in another BMP-tests series. All samples were freeze-
dried and ground to 1 mm (using Retsch® SM100). Concentration of the anaerobic inoculum in flasks was
5 g VS/L. Biogas composition was followed with Clarus GC 480 (PerkinElmer, USA).

Results and discussion: SSAD (Chapter 6)
170
6.2.4.3 Total Kjeldahl Nitrogen (TKN)
Kjeldahl nitrogen (TKN) was titrated using a Buchi 370-K distillater/titrator after mineralization of samples
with Buchi digestion unit K438. A positive control, with known nitrogen concentration, and a blank were
also measured.
Samples mineralization transformed sample nitrogen to ammonium in presence of H2SO4 (96%) and a
catalyzer (Copper selenite). The color change of the sample solution from dark to clear or colorless meant a
total mineralization of the sample. This process lasted from three to five hours depending on samples. The
second step was performed with a distillater/titrator equipped with an auto-sampling system. Ammonium is
converted to ammonia by adding sodium hydroxide (32%). Ammonia was then trapped into a boric acid
solution (4%, at pH 4.65), to be converted to ammonium: NH4+ + OH
- NH3 + H2O. The weak acid
boric does not react with formed hydroxide ions that were titrated with the strong HCl acid (0.02 N).
6.2.4.4 Ammonium concentration in final leachate
Ammonium (NH4+) concentrations were determined with an ion chromatography system (ICS 3000 Dionex,
USA) equipped with two pre-columns (NG1-2mm and CG16-2mm) and a separation column CS16-3mm.
The detection was done by conductivity after the passage in a Cation Self-Regenerating Suppressor (CSRS-
300-2mm). Eluent was hydroxymethanesulfonic acid (HMSA) with a concentration gradient between 25 and
40 mM and a flow rate of 0.3 mL min-1
.
6.2.4.5 Final Total Carbon (TC) in digestate
TC was measured as indicated in 3.2.2.1 with a carbon analyzer (TOC-V CSN, Shimadzu and Solid Sample
Module-5000A).
6.2.4.6 Analysis of Variances (ANOVA)
As reported in 5.2.4.1, ANOVA, α = 0.1, was realized with R software (version 3.2.1).

171
Table 6-1. Characteristics of substrates and inocula for Experiment I and II.
Experiment I Experiment II
TS (% wet w)
VS (% TS)
VS (% wet w)
TS (% wet w)
VS (% TS)
VS (% wet w)
BMP (NmL/g VS)
TKN (%TS)
Wheat straw 91.1 95.2 86.7 97.3 94.2 88.1 247± 8 0.504
Fungal pretreated wheat straw 96.1 94.6 91 222 ± 8 0.765
Solid inoculum 13.7 76.3 10.5 11.7 73.6 8.6
Liquid inoculum 2.1 51.5 1.1 1.4 43.2 0.6
Miscanthus pellets 96.5 97.2 93.8 197 ± 4 0.128
Colonized miscanthus 36.7 96.5 35.4 185 ± 3 0.164
Table 6-2. Experimental set-up for Experiment I and II.
Experiment I Experiment II
Solid inoculum
Miscanthus + Straw
(MWS)
Colonized Miscanthus + Straw (cMWS)
Fungal pretreated
straw (FWS)
S/I (VS basis) 1 2 4 11 3 3 3
Solid inoculum
(g wet w) 1015 750 475 205 1695 630 630 630
(g VS) 106.4 78.8 49.7 21.3 146 54 54 54
Wheat straw
(g wet w) 155 200 240 280 0 155 155 195
(g VS) 130 168 202 236 141 141 178
Miscanthus (g wet w) 0 39.2 83.5 0
(g VS) 36.7 29.7
%TS of water saturated substrate 15.5 16.3 16.8 17.3 17.7 18.4 18.3 17.9
Total added liquid including liquid inoculum (mL)
2180 2350 2535 2720 1480 2360 2360 2360
600 600 600 600 1200 1200 1200 1200

Results and discussion: SSAD (Chapter 6)
172
6.3 Experiment I: tests of several S/I
6.3.1 Anaerobic digestion of wheat straw: start-up phase progress
The start-up period of SSAD batch is considered as the most critical (Brown and Li, 2013) that is why only
the start-up phase was studied to choose the adequate S/I in Experiment I. Some lignocellulosic residues are
rich in soluble compounds, e. g. wheat straw contains 12% soluble compounds (Sun, 2010). Those
compounds are quickly converted to VFA. If methanogens are not in sufficient amount in the inoculum to
convert those VFA into methane, a VFA accumulation can occur because methanogens growth is quite slow
(Vavilin and Angelidaki, 2005). This accumulation can lead to detrimental pH drop that can sometimes stop
anaerobic digestion (inhibition or death of methanogens).
For reactors with S/I of 1 and 2 (VS basis), cumulated methane yield always increased (Figure 6-3A).
Methane yield is expressed per amount of total VS (VSsubstrate + VSinoculum) since this quantity is
approximately the same between reactors and because endogenous production from inoculum was not
monitored. VS from the inoculum were quite stable and little degraded during Experiment I whereas VS
from the substrate were extensively degraded. For S/I=1 and S/I=2, pH stayed near the neutrality during all
start-up phase (Figure 6-3B). There was a production peak in daily methane production that reached almost
8 NmL/g VStotal (Figure 6-3D). These elements correspond to healthy reactors.
Notwithstanding, for S/I=2, the smallest pH was 6.5 on day 5 at the VFA peak (Figure 6-3C) and it
corresponded to a decrease in daily methane production (Figure 6-3D). The peak in daily methane
production occurring at day 9 was delayed compared to the one of S/I=1 occurring at day 4. This peak was
concomitant to VFA peak for S/I=1 whereas it happened after the VFA peak for S/I=2 showing the necessity
for methanogens to adapt. VFA peak reached 5 g/L for S/I=1 and 7 g/L for S/I=2 due to highest substrate
amount (Figure 6-3C). Methane yield was a bit lower for S/I=2 than for S/I=1 (Figure 6-3A), even if values
between these reactors were close (difference ≈ 10 NmL/g VStotal for the last measurement at day 15).
However, values were identical until day 4, when pH was close to 6.5 for S/I=2 and where daily methane
yield slightly decreased to increase again with pH (day 6-7). Moreover, VFA peak was large and their
concentrations were almost identical between day 4 and 8 showing that this reactor had been close to
instability (Figure 6-3).

Results and discussion: SSAD (Chapter 6)
173
0
2
4
6
8
10
12
0 10 20 30 40
VFA
(g/
L)
S/I = 11
S/I = 4
S/I = 2
S/I = 1
0
20
40
60
80
100
120
0 10 20 30 40
Me
than
e y
ield
(N
mL
CH
4/g
VS t
ota
l)
S/I = 1
S/I = 2
S/I = 4
S/I = 11
Figure 6-3. Main parameters of anaerobic digestion in function of time for Experiment I testing
several S/I ratio. A. Methane yield. B. Leachate pH. C. Leachate global VFA concentration. D. Daily methane production.
4.5
5
5.5
6
6.5
7
7.5
8
0 5 10 15 20 25 30 35 40
pH
S/I = 1
S/I = 2
S/I = 4
S/I = 11
B
C
0
2
4
6
8
10
12
0 10 20 30 40
Dai
ly m
eth
ane
yie
ld
(Nm
L/g
VS t
ota
l/d
)
Days
S/I = 1
S/I = 2
S/I = 4
S/I = 11
D
A

Results and discussion: SSAD (Chapter 6)
174
With S/I = 4, acidosis occurred during almost ten days (pH ≈ 5.5 from day 5 to 15). Daily methane
production decreased and even stopped on day 8. Then, it steadily increased after day 15 (Figure 6-3D) but
never exceeded 5 NmL/g VStotal/d during the experimentation. During acidosis, a plateau is observed for
cumulated methane yield (Figure 6-3A) reflecting the small daily methane production and the instability of
anaerobic digestion. From day 6 to 10, the concentration of total VFA was the same (10 g/L) for S/I = 4 and
11 (Figure 6-3C) whereas a small difference in pH was observed (0.2 more for S/I = 4). Despite similarity
for some parameters, one reactor recovered and the other failed. Indeed, between day 20 and 30, a decrease
of VFA concentration occurred concomitantly to a pH increase and to a moderate methane production. pH
for S/I = 4 was always higher than pH in S/I = 11 (Figure 6-3B). The difference of alkalinity between the
two reactors on day 10 probably explains this phenomenon: 0.8 g CaCO3/L more for S/I = 4 (Table 6-3).
Alkalinity is related to the buffer capacity of the medium and must be sufficient. In stable reactor, alkalinity
is frequently between 2 and 4 g CaCO3/L (APHA, 1998). Alkalinity measurements in this study fitted with
expected values (Table 6-3).
6.3.2 TVFA/alkalinity as process stability indicator
Acid pH can inhibit methanogens or even kill them, leading to reactor failure. To better control the process,
indicators are required to detect imbalanced reactions before a too detrimental pH drop. In this way,
alkalinity is a crucial parameter. However, there are lots of different methodologies with different accuracy
and suitability. Thus, a sufficiently accurate method must be used such as Ripley et al. (1986) technic, used
in the current study (Lahav and Morgan, 2004). VFA, main responsible of pH drop must also be measured to
detect imbalanced process. Several authors have suggested to study reactor stability using VFA but it
appears that each reactor have its own “normal” levels of VFA (Ahring et al., 1995). Notwithstanding, with
liquid continuous stirred tank fed with Chinese cabbage silage and swine manure, reactors were stable with
TVFA/alkalinity close to 1 but with VFA below 10 g/L (Kim and Kafle, 2010). Even if configuration of
Experiment I was very different from this case, the limit of 10 g/L for VFA was also observed since above
this limit reactor failed (S/I = 11) In the same way, with wheat straw and batch SSAD (22 % TS), reactor
failure was also observed with VFA final level of 12.4 g/kg (Cui et al., 2011).
Table 6-3. Alkalinity and TVFA/alkalinity with TVFA in g HAc eq/L on day 1 and 10 of the
Experiment I.
Day 1 Day 10
S/I VS basis
Alkalinity (TA) g CaCO3/L
TVFA/alkalinity
Alkalinity (TA) g CaCO3/L
TVFA/ alkalinity
11 4.24 0.36 3.28 2.46
4 3.87 0.33 4.12 1.95
2 4.67 0.22 4.57 0.59
1 4.40 0.27 4.83 0.40

Results and discussion: SSAD (Chapter 6)
175
Several studies highlighted the ratio between VFA and alkalinity as an efficient way to control an anaerobic
digestion plant. It is considered that if TVFA (Total VFA in g HAc eq/L)/alkalinity (g CaCO3/L) is between
0.3 and 0.4, anaerobic digestion process is stable (Lili et al., 2011; Lossie and Pütz, 2008; Raposo et al.,
2006). This ratio is also referenced as FOS/TAC (derived from German language). Originally used in
sewage sludge plant, this indicator has been successfully applied to control several liquid fermenters
(Ehimen et al., 2011; Raposo et al., 2006). If some authors consider the limit of 0.6 as critical (Lossie and
Pütz, 2008) others gave a limit at 0.8 (Callaghan et al., 2002). Thereby, stable reactors were observed at 0.7
(Callaghan et al., 2002; Kim and Kafle, 2010). However, several precautions must be taken to ensure a
viable measurement (sample preparation, alkalinity measurement method…). Good initial and final
TVFA/alkalinity ratio are not sufficient to indicate the absence of acidification period since this ratio must
be observed in a dynamic way during anaerobic digestion; a high increase meaning a potential instability of
the reaction (Kim and Kafle, 2010; E. Voß et al., 2009) . The evaluation of the stability of the process must
be completed by the methane yield because of the existence of inhibited steady state (Chen et al., 2008; Kim
and Kafle, 2010).
Without pretreatment, 49% of the BMP value can be expected after 26 days of wheat straw anaerobic
digestion (Kusch et al., 2011). Similar results were obtained after only 15 days for (without correction from
methane inoculum production). S/I = 1 and 2 reached, respectively, 43% and 39% of the BMP value (247± 8
NmL/g VS). Thus, in the current study, inhibited steady-state is unlikely.
Most measured TVFA/alkalinity ratios in Experiment I (Table 6-3) were in the range of stable process (0.22
to 0.36 on day 1). On day 10, S/I = 2, with TVFA/alkalinity of 0.59 would be considered as instable with
conventional limits. However, it was observed that anaerobic digestion was almost not affected.
Moreover, for S/I = 4 and 11, with TVFA/alkalinity near to 2 or higher, processes could be considered as
highly instable with usual limits. It must be noticed that S/I = 4 was able to recover with a TVFA/alkalinity
of 1.95 whereas S/I = 11 failed with TVFA/alkalinity of 2.46. In this experiment, a threshold of 2 for
TVFA/alkalinity ratio was found to differentiate failure and SSAD able to recover.
Diverse studies with SSAD recorded very high TVFA/alkalinity ratio without instability or at least the
possibility for the process to recover (Table 6-4). Thus, it seems that further studies are required to
determine if usual limits fixed for TVFA/alkalinity ratio (in liquid process) are adapted to SSAD. pH and
VFA measurements are generally carried out in leachate. However, SSAD is a very heterogeneous reaction
therefore a neutral pH in leachate does not mean that no acidic areas exist in the substrate (Staley et al.,
2011). Martin (2001) hypothesed “acid-protected” areas for methanogens due to a biofilm structuration in
SSAD process. This might be an explanation for higher observed ratios in SSAD. Staley et al. (2011)
showed that if existing, such areas would be smaller than 3 cm diameter. Moreover, they pointed out the
importance of acid-tolerant methanogens (i. e. Methanosarcina bakeri) to overcome acidification period.
Methanosarcina bakeri is active at pH 5.7. In pure culture its optimum pH range is between 5 and 7. When

Results and discussion: SSAD (Chapter 6)
176
pH recovers the neutrality, metabolic activity is substantially enhanced, increasing methane production.
Acid-tolerant methanogens certainly played a role in the recovery of the reactor with S/I=4. After their
experiment (Table 6-4), Duan et al. (2012) considered without drastic pH drop, VFA accumulation would
help the multiplication of methanogens.
Table 6-4. Stability limits for SSAD process with high TVFA/alkalinity ratios.
TVFA/alkalinity Anaerobic digestion
process
Substrate
(composition in %TS)
Additional
information
References
Final ratio at 1.6 or above for
healthy reactors
Mesophilic batch at
20%TS at S/I (VS basis)
ratio of 4.1 or 6.2 for 30
d, no shaking
Fallen leaves
(11.1% CEL, 11.5% Hemi,
22.7% LIG)
0, 2, 3.5 or 5%
NaOH addition at
the inoculation step
(Liew et al.,
2011)
Ratio followed during the
whole process:
Stable SSAD when < 0.9
Acidification and recovery
when > 1.25 and < 5.4
Satisfactory methane
production even with a peak
between 3 and 4
Mesophilic batch at
20%TS at S/I of 2.2 (VS
basis) for 48 d, slow
shaking
Single or co-digestion of
distiller’s grain (22.9%
Hemi, 19.9% Cel, 13.8%
LIG) and food waste
(12.3% Hemi, 4.4% Cel,
2.8% LIG) with several
proportions tested
Initial alkalinity of
10 g/L CaCO3
thanks to NaHCO3
and KHCO3
addition
(L. H. Wang
et al., 2012)
Initial ratio between 0.9 and
1.2 and:
Final ratio < 3 for reactors
producing satisfactory
methane
Final ratio > 3 for acidified
reactor with no or very low
methane production
Mesophilic batch at
20%TS for 30 d at S/I
(VS basis) of 1, 2 or 3
Mix of yard (24.3% Cel,
23% LIG, 9.7% Hemi) and
food wastes (0, 10 or 20%
VS) with several
proportions tested
(Brown and
Li, 2013)
Peak around 3, average value
of 2, stable process (methane
production and pH)
Thermophilic
continuous process
(stirred tank reactor,
leachate recycle) at
20%TS and 30% (w/w)
inoculum for 60 d
Food Wastes from
restaurant
(Forster-
Carneiro et
al., 2008)
A decrease of organic loading
rate allowed the recovery of
stable process with
satisfactory methane
production after a peak
between 0.8 and 1.1
Mesophilic semi-
continuous process
(stirred tank reactor) at
15% or 20% TS
Dewatered sewage sludge (Duan et al.,
2012)
Possible recovery with a peak
value of 1.95
Failure with a peak at 2.49
Mesophilic batch with
leachate recycle at 17-
18%TS S/I (VS basis) of
3, 4 or 11
Wheat straw inoculated
with manure digestate
Current
study
Peak value at 1.94 with a
satisfactory methane
production
Fungal colonized
miscanthus and wheat straw
For Liew et al. (2012), S/I =2 to 4 allowed similar methane production with wheat straw in 30 days batch
SSAD (22% TS). With higher S/I a drastic diminution of methane production was observed. In mesophilic
liquid batch reactors with wheat straw, high reduction of methane yield occurred also with S/I ratio greater
than 4. In the current study (Experiment I), it was confirmed that S/I between 2 and 4 can be used for SSAD
of wheat straw and that higher ratios seem inappropriate.
With wheat straw, some authors obtained low daily methane production (less than 1L/kg VS/day) during
almost the 4 first days for S/I = 2 (Cui et al., 2011; Liew et al., 2012). In contrast, daily methane production
was better in Experiment I with the same S/I ratio (Figure 6-3D). Leachate recycle can explain this result
Results and discussion: SSAD (Chapter 6)
177
because biological activities are limited by low moisture and nutrients. Leachate recycle favors also the
mobility and repartition of degrading microorganisms (Kusch et al., 2008). Methane production in
Experiment I with S/I =2 reached 97 NL/kg at day 15, it was slightly better than the 90 L CH4/kg VS (final
production at day 30) obtained by Cui et al. (2011) or the 66 L CH4/kg VS obtained by Liew et al. (2012)
with 22% TS content. In Experiment I, correction of methane production by removing the endogenous
production of inoculum was not done. However, differences with other studies seem too high to be only
explained by this fact. More performant inoculum or more degradable substrate in Experiment I are a
possible explanation for better production but it can also be due to leachate recycle and/or lower TS content
used in Experiment I. The higher is the TS content, the lower is the methane conversion rate of the substrate
and digestion duration are longer; as observed by Motte et al. (2013) with very high S/I (> 28) and small
particles size (< 1.4 mm).
Even if leachate recycle can enhance acidification and must be reduced in the initial stage (Kusch et al.,
2008), Li et al. (2011) considered that some areas receive less acidic leachate and thus can regenerate the
process. For S/I = 4, a lower recycling rate in initial stage would allow to limit acidification. In the same
way, sequential batch reactors that recycle leachate between new and mature reactors allow more stable
reactions. VFA produced during start-up of a new reactor are re-circulated via leachate to an older reactor
for methanogenesis. Leachate of older reactor, acid free and with enough alkalinity is recirculated to the new
reactor.
6.4 Experiment II: fungal pretreatment for SSAD
As reactor with S/I = 2 seemed to start easily (in contrast to the one with S/I = 4), as S/I = 4 had recovered
and since productivity per reactor is improved with substrate amount; it was chosen to use a S/I ratio of 3 for
Experiment II. In this experiment a fungal pretreated straw was used (reactor FWS). This one was inoculated
with fungal colonized miscanthus pellets, thus a control reactor with raw straw and fungal colonized
miscanthus (reactor cMWS) was carried out. Finally, a reactor with miscanthus pellets and wheat straw
constituted another control (reactor MWS).
6.4.1 Substrates anaerobic digestibility
Few studies reported methane production improvement after fungal pretreatment of lignocellulosic substrate
(Chapter 1, Table 1-4) but they are generally led sterilely at lab-scale whereas in the current study, fungal
pretreatment was realized at pilot-scale with 400 g of wheat straw. Wheat straw used in Experiment II and
Experiment I was the same. The greater TS content in Experiment II was due to freeze-drying (Table 6-1).
Fungal growth on wheat straw was successful, with lot of white areas corresponding to mycelium of P.
brumalis BRFM 985. However, fungal growth was not homogeneous (pictures in Annex 12) and a longer
pretreatment time seemed to be required in order to pretreat all the straw. Large untreated areas can explain
why TS and VS were similar for pretreated and untreated straws (Table 6-1). BMP of pretreated straw was a

Results and discussion: SSAD (Chapter 6)
178
bit lower than for untreated straw (25 NmL/g VS less, Table 6-1) whereas up to 40% methane yield
improvement can be expected with Polyporus brumalis BRFM 985 pretreatment (Chapter 1). Culture
conditions, in this study, were not enough optimized to increase straw BMP. Culture conditions cannot be
compared to those obtained in the optimization step (Chapter 4) since they are lot of differences between the
two processes (as further discussed later, Chapter 7). BMP increase can be obtained when lignin is
sufficiently attacked and when carbohydrates losses are small. Pretreatment conditions are as important as
an efficient fungal strain to improve substrate digestibility (Wan and Li, 2012). Despite the BMP decreased,
if fungal pretreatment enhances sufficiently the methane production rate for a given anaerobic digestion
duration, methane production would be increased. Since hydrolysis is the limiting step for lignocellulosic
substrates when anaerobic digestion is stable (Bertrand et al., 2006), improvement of methane production
rate must be due to hydrolysis enhancement after fungal pretreatment (lignin removal, etc.). Methane
production rate was investigated in Experiment II for FWS compared to controls. Controls contained
miscanthus pellets. BMP of colonized miscanthus was also lower than uncolonized miscanthus (12 NmL/g
VS less, as further discussed) probably due to carbohydrates consumption to ensure fungal growth. In this
case, the goal was the obtaining of healthy and consequent fungal mycelium able to colonized wheat straw,
an improvement of the miscanthus BMP was not expected. There was a small decrease in VS for colonized
miscanthus that explained the slightly lower VS content of the corresponding batch reactor (6 g, Table 6-2).
6.4.2 SSAD start-up phase
During start-up phase all reactors experienced acidic pH (<6.5) but the harshness of acidification varied
among reactors (Figure 6-4B). The most affected batch was cMWS with the most acidic pH (near 5.5) and
the longer period under low pH (6 days). Batch which encountered the least difficulties was FWS, with
higher pH and the shortest period under acidic conditions. Low pH directly affected daily methane
production (Figure 6-4C). Each time pH felt under 6.5 (day 1 for cMWS, day 2 for MWS and day 4 for
FWS), a stop or a decrease in daily methane production occurred (Figure 6-4C). VFA production peaks
were observed around day 5 for all reactors (Figure 6-4A). After this day, daily methane production and
pH increased thanks to the consumption of VFA. cMWS alkalinity was measured on day 5 at the VFA
peak, leading to a TVFA/alkalinity ratio of 1.94 (< 2, critical value in Experiment I). A rapid recovery was
observed since the critical value differentiating recovery from failure was not reached. Total VFA
concentrations in leachate were lower than 10 g/L that appeared as a possible other critical value in
Experiment I.
During the first two days, daily methane production was maximal for cMWS, followed by MWS and then
by FWS. This production is very likely due to compounds with no (or very small) need of hydrolysis to be
converted into methane. Those compounds were more present in cMWS because fungi hydrolyzed
lignocellulosic polymers. They were the less numerous on FWS, probably because fungi had more time to
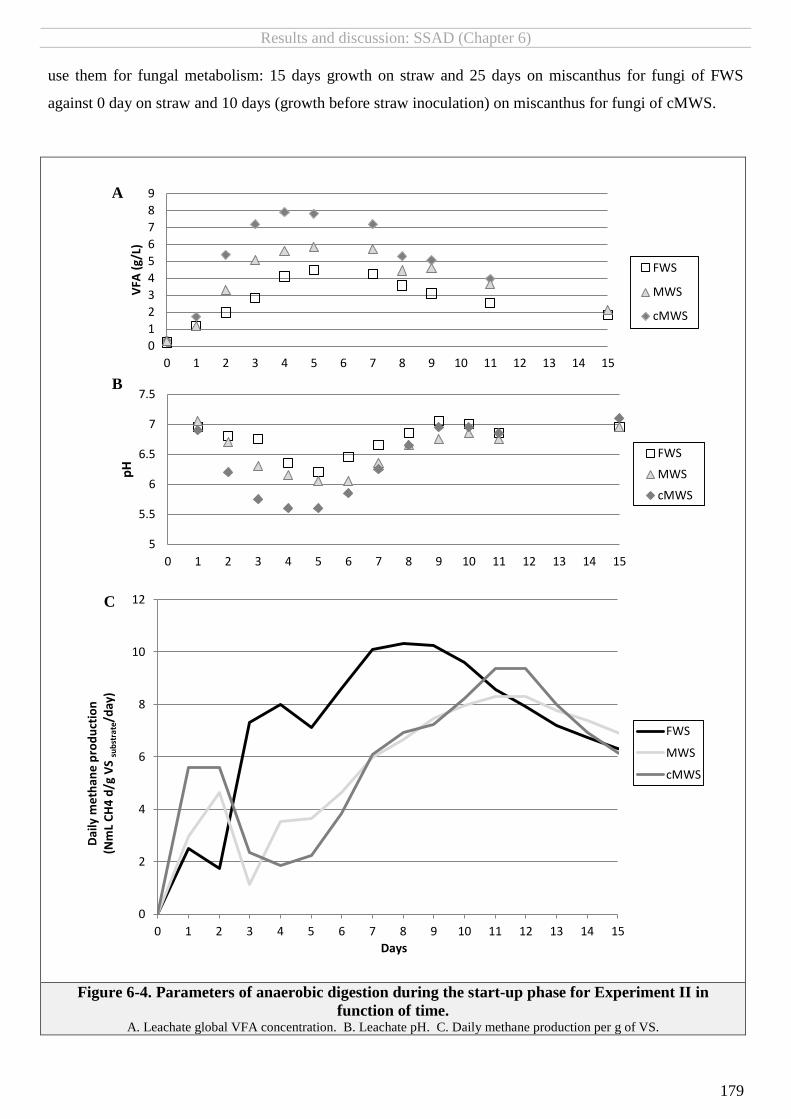
Results and discussion: SSAD (Chapter 6)
179
0
1
2
3
4
5
6
7
8
9
0 1 2 3 4 5 6 7 8 9 10 11 12 13 14 15
VFA
(g/
L)
FWS
MWS
cMWS
0
2
4
6
8
10
12
0 1 2 3 4 5 6 7 8 9 10 11 12 13 14 15
Dai
ly m
eth
ane
pro
du
ctio
n
(Nm
L C
H4
d/g
VS
sub
stra
te/d
ay)
Days
FWS
MWS
cMWS
5
5.5
6
6.5
7
7.5
0 1 2 3 4 5 6 7 8 9 10 11 12 13 14 15
pH
FWS
MWS
cMWS
use them for fungal metabolism: 15 days growth on straw and 25 days on miscanthus for fungi of FWS
against 0 day on straw and 10 days (growth before straw inoculation) on miscanthus for fungi of cMWS.
Figure 6-4. Parameters of anaerobic digestion during the start-up phase for Experiment II in
function of time. A. Leachate global VFA concentration. B. Leachate pH. C. Daily methane production per g of VS.
C
A
B

Results and discussion: SSAD (Chapter 6)
180
Maximum daily methane production was a bit highest for FWS than for other reactors. Moreover,
production peak occurred on day 8 for FWS whereas the peak was on day 12 for cMWS and MWS (Figure
6-5A). Thus, methane production rate was enhanced for FWS. However, no conclusion can be drawn about
the influence of fungal pretreatment on hydrolysis rate during anaerobic digestion since it was not the rate
limiting-step. Differences between reactors are principally due to acidification period (methanogenesis
limiting) for cMWS and MWS. Methane content of the biogas during steady production stage was similar
between reactors and reached 55-60% that is in accordance with reported values in literature for SSAD of
wheat straw (Cui et al., 2011). Methane yield reported to pretreated VS was also better for FWS (Figure
6-5). Therefore, FWS is more biodegradable than controls (MWS and cMWS). The increase
biodegradability and the effect of fungal pretreatment had led to a slight decrease in final total carbon for
FWS compared to controls (Table 6-5).
6.4.3 Methane production of fungal pretreated straw in SSAD
Despite acidification period, overall methane productions were not affected (Figure 6-5): at day 127
(experiment stopping), they are very close to expected values (based on BMP reported in Table 6-1).
However, during fungal pretreatment mass losses occurred (≈20% TS for FWS in this study) and must be
considered to evaluate the global efficiency of the process. This mass loss can be taken into account
expressing methane production per g of initial TS (before pretreatment TS): at day 127, methane yield
(NmL/g TS initial) is similar between reactors cMWS and FWS (Figure 6-5).
Table 6-5. Methane production and final nitrogen amount for Experiment II. a, b, c
samples followed by the same letter are not significantly different (ANOVA with α = 0.1).
Solid
inoculum Miscanthus
+ Straw (MWS)
Colonized Miscanthus + Straw (cMWS)
Fungal pretreated straw (FWS)
Expected yield calculated with BMP values (CH4/g VS)
237 236 222
Methane production at day 60
(CH4/g VS) 181 181 204
(% of final expected value)
76.4 76.7 91.9
Yield at day 127, experimentation stopping
(CH4/g VS) 230 215 254
(CH4/g TS initial) 219 203 203
Final TKN for solid digestate (%TS) 2.37 2.40 2.44 2.36
Final NH4+ in leachate (mg/L) 9.53 5.52 9.20 18.26
Final TC for solid digestate (%TS) 37.61a 44.93b 44.88b 42.97c
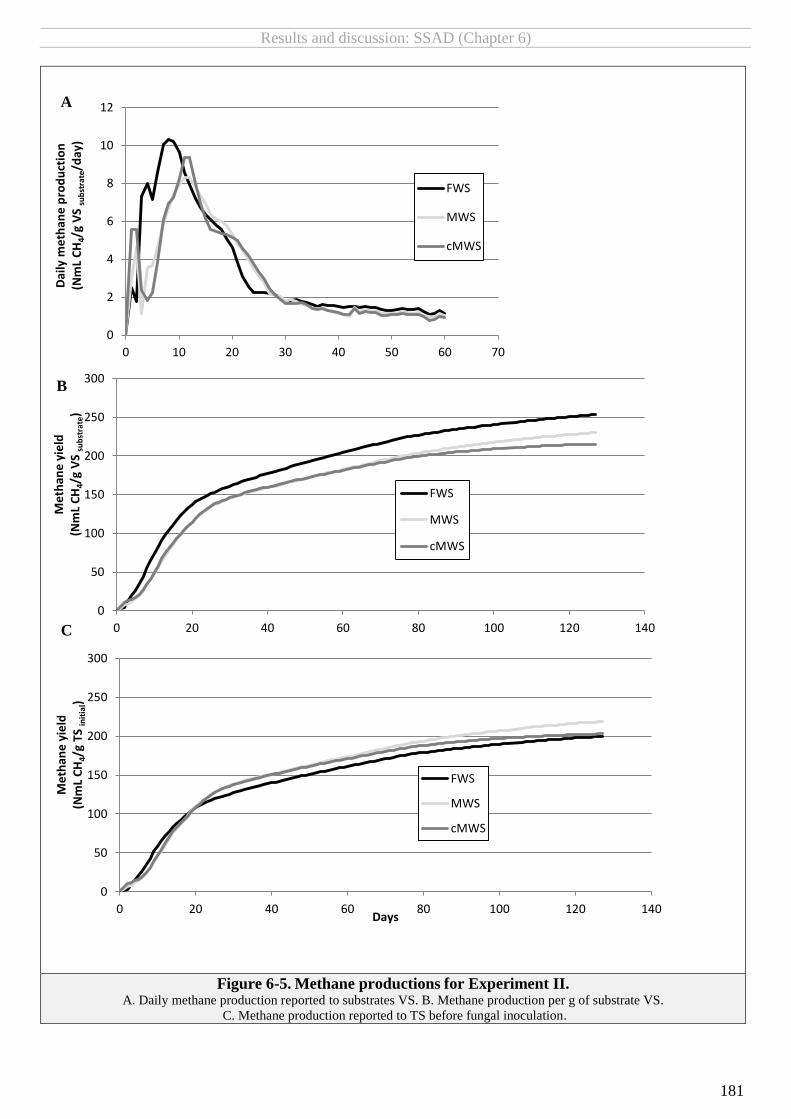
Results and discussion: SSAD (Chapter 6)
181
Figure 6-5. Methane productions for Experiment II. A. Daily methane production reported to substrates VS. B. Methane production per g of substrate VS.
C. Methane production reported to TS before fungal inoculation.
0
50
100
150
200
250
300
0 20 40 60 80 100 120 140
Me
than
e y
ield
(N
mL
CH
4/g
VS
sub
stra
te)
FWS
MWS
cMWS
0
50
100
150
200
250
300
0 20 40 60 80 100 120 140
Me
than
e y
ield
(N
mL
CH
4/g
TS in
itia
l)
Days
FWS
MWS
cMWS
B
C
0
2
4
6
8
10
12
0 10 20 30 40 50 60 70
Dai
ly m
eth
ane
pro
du
ctio
n
(Nm
L C
H4/
g V
S su
bst
rate
/day
)
FWS
MWS
cMWS
A

Results and discussion: SSAD (Chapter 6)
182
Reaction duration of 60 days seems adapted to SSAD of wheat straw in batch. If substrate amount is not
limited, considering a reaction duration of 60 days and the same amount of straw (pretreated or not), 12.6%
more methane (/ g VS) can be obtained with pretreated straw compared to untreated substrate (Table 6-5). In
this configuration, fungal pretreatment may allow an additional income. Even with suboptimal pretreatment
conditions, results of the current study are encouraging. With methane yield per g of initial TS, a bit less
methane (10 NmL/g TS initial) is obtained for FWS than for controls in 60 days (Figure 6-5C). During the
first twenty days, methane production per g of initial TS is nevertheless better for FWS owing to a better
start-up phase. An efficient start-up phase corresponds to a more rapid CH4 production that will reduce
quickly concentrations of undesirable compounds such as explosive oxygen. In this way, the possibility to
valorize methane by injection into grid arrives earlier. Moreover, start-up phase can last until 250 days (with
certain couple process/substrate) (Karthikeyan and Visvanathan, 2013). Thus, the reduction of this period
can really have an economical attractiveness. Pretreatment would be useful for reactor with short reaction
duration (< 20 d) or to favor good reactor start-up.
If wheat straw amount is limited and with a given size of reactor, longer reaction duration can be applied for
pretreated straw owing to mass losses during pretreatment. Considering same conditions as in Experiment II,
with a reactor size of 4.7 t wet weight (inoculum + substrate), and 6 t TS wheat straw that can be pretreated
or not, annual methane production is similar per VS amount whether substrate is pretreated or not (Table
6-6). However, total methane production per year (i. e. not reported to substrate amount) would be lower of
around 1300 Nm3 for FWS because pretreatment conditions were not optimal in Experiment II. If pretreated
straw was compared to untreated one, higher methane production loss would have been reported since BMP
of miscanthus (colonized or not) is lower than the one of wheat straw (Table 6-1). Optimization of
pretreatment conditions is primordial, notably to limit mass losses.
Table 6-6. Estimation of annual methane production in the case of limited straw amount.
Untreated Fungal treated
Wheat straw (t TS) 6 4.86
Solid inoculum (t wet weight) 21.9 17.8
Batchs/year 6.1 4.8
Average reaction duration (d) 60 75
Annual methane production (m3) 6302* 4998 *based on methane production at day 60 for MWS and cMWS
In addition to the better start-up phase and the biodegradability improvement, another interest of fungal
pretreatment for lignocellulosic biomass is the diminishing of C/N by the consumption of carbon and the
conservation of nitrogen during pre-treatment. This reaction combined with N input by fungal inoculum
leads to an increase TKN content for colonised substrate (Table 6-1), as also observed by Bisaria et al.
(1983) and Zeng et al.(2011). C/N optimal ratio for anaerobic digestion is between 20 and 35 and is
dependent of the feedstock. Higher ratio can lead to nitrogen limitations, increased VFA accumulation and
decrease of process stability and biogas yield (Li et al., 2011; Sialve et al., 2009). Wheat straw generally

Results and discussion: SSAD (Chapter 6)
183
requires co-substrate to decrease its C/N ratio as its C/N can reach value as high as 161 (McKendry, 2002b).
If co-substrates rich in nitrogen are not available on site, N supplementation can constitute an additional cost
that would be reduced if fungal pretreatment is carried out. At the end of the SSAD, solid digestates have a
similar NTK content but NH4+ concentrations in leachate reflect the N content of initial substrate: FWS >
cMWS > MWS (Table 6-5). Leachates coming from SSAD of fungal pretreated straw have potentially a
better fertilizing value since available nitrogen is a primary need for plants growth.
6.5 Conclusion
Firstly, this study confirmed that S/I equal to 2-3 are required for wheat straw SSAD. Moreover, SSAD
processes that experienced a TVFA/alkalinity lower than two and VFA concentrations lower than 10 g/L
were able to recover from acidification. Studies with other substrates and inocula would allow to
determinate if such limits can be generalized to SSAD batch with leachate recycle.
Secondly, fungal pretreatment wheat straw led to small methane production losses, after taking into account
substrate mass losses during the pretreatment. However, pretreatment conditions were suboptimal. Thus,
fungal pretreatment may be still interesting for biogas plants; notably if its cost is controlled (possibility to
produce fungal inoculum on site…). Research efforts must continue to propose an optimized fungal
pretreatment at pilot-scale: cheap, with low mass losses (especially of carbohydrates) and high
delignification.


185
Chapter 7.
Results overview and general discussion
Objective
To compare results obtained in the different chapters results between them and with other
information generated by partner projects
Table of content
7.1 AN EFFICIENT PRETREATMENT .................................................................................................................................................. 186 7.2 WRF PRETREATMENT SCALE-UP: THE CONTAMINATIONS CHALLENGE ............................................................................................... 190 7.3 WRF PRETREATMENT FOR ETHANOL AND METHANE PRODUCTION ................................................................................................... 194 7.4 FURTHER RELATIONSHIPS BETWEEN BMP AND SUBSTRATE CHARACTERISTICS..................................................................................... 199
7.4.1 Samples from the optimization step ....................................................................................................................... 199 7.4.2 Samples from the selection step ............................................................................................................................. 201
7.5 OTHER EXPERIMENTAL PROSPECTS ............................................................................................................................................ 207 7.6 CONCLUSION ........................................................................................................................................................................ 209

186
7.1 An efficient pretreatment
Among pretreatments used to improve digestibility of lignocellulose, biological pretreatments are largely
under investigated and often represent few lines in dedicated review (e. g. Carvalheiro et al. 2008; Talebnia
et al. 2010; Monlau et al. 2013). WRF appear as the most promising among biological pretreatments. If their
advantages are easily recognized (low energy consumption, safety of use, environmental friendly), their long
reaction time puts a brake on their development as pretreatment. However, lignocellulose is frequently
stored and it can be taken advantages of this period. The second inconvenient of WRF is the consumption of
cellulose and hemicelluloses whereas these polymers are converted to biogas during anaerobic digestion. For
this reason, Zheng et al. (2009) even considered biological pretreatment as less attractive commercially.
However, the lack of data concerning costs of these pretreatments does not allow concluding about their
feasibility.
In the current work best result after WRF pretreatment corresponds to 44% more methane (/g VS
pretreated) than control straw (uninoculated straw in glass columns). This improvement was obtained for P.
brumalis pretreated straw during 21 days in glass columns at 28°C (Chapter 1). It is similar to the
improvement reported on wheat straw with other pretreatments that could be easily applied to full-scale
(Chapter 1): 53% enhancement for grinding (0.4 mm), 43% and 67% increase with NaOH (10% at 40°C for
24 h and 10% at 100°C for 30 min, respectively) (C. Sambusiti et al., 2013; Sharma et al., 1988). Moreover,
as less inputs are required (energy, water and chemicals), WRF may be more interesting economically.
Finally, they are environmental friendly (no sodium addition which may be detrimental for digestate
valorization…). WRF and grinding pretreatments can be realised on solid substrates without or with limited
addition of water. However, grinding can enhance reactors acidification in SSAD (Motte et al., 2014b).
Chemical pretreatments generally require important addition of water amount even if investigations about
dry chemical pretreatment are beginning (Abdellatif Barakat et al., 2014a). In those conditions, WRF
pretreatments fit particularly to SSAD that allows higher substrate loading.
However, taking into account mass losses the efficiency of P. brumalis BRFM 985 best pretreatment felt
to 21% more methane per gram of initial TS (Chapter 1). This amount is still quite interesting, especially if
input requirement are low (Berglund and Börjesson, 2006). Mass losses are rarely reported in the few studies
dealing with WRF pretreated lignocellulose for anaerobic digestion (Chapter 1) even if they are necessary to
evaluate pretreatment performances. To our knowledge, only one study was realized on wheat straw with
fungal pretreatment for biogas production. Among 22 basidiomycetes, Pleurotus florida was chosen to
pretreat sterilized wheat straw for 90 days with 75% moisture content at 25°C. After batch anaerobic
digestion, 27.9% more methane was obtained (v/w pretreated TS). The overall pretreatment efficiency was
negative since 42.5% of mass losses occurred during pretreatment (Müller and Trösch, 1986). Results of the
current study are far better. Furthermore, mass losses is not only a concern for WRF pretreatments since
organic matter losses between 1 and 13% have been reported for diverse silage technics (Herrmann et al.,
2011). Losses during the storage are frequent but generally not quantified. With grass, mass losses (water
and organic matter) were estimated at 14% during wilting in the field and storage (Blokhina et al., 2011). As

187
water losses are also included, this study cannot be directly compared to the 20% TS losses often observed
with WRF pretreatments (Chapter 1, and observed in Chapter 6).
Among the 63 screened strains by Zhou et al. (2015b), P. brumalis was one of the most interesting strains to
improve sugars yield 72 h enzymatic hydrolysis. In literature, P. brumalis was little investigated compared
to other WRF such as Phanerochaete chrysosporium or Pleurotus ostreatus, especially if mycelial growth
on substrate is considered rather than application of enzymes extracts. Some studies reported the
pretreatment of lignocellulosic biomass with P. brumalis to improve enzymatic hydrolysis of cellulose
(saccharification, first step for ethanol production). However, those studies compared several WRF and
considered P. brumalis as less efficient than other tested strains (Hatakka, 1983 on wheat straw; Lee et
al., 2007 on Pinus densiflora). It is possible that P. brumalis BRFM 985 is more effective than other tested
P. brumalis which originated from other strains banks. Another possibility is inadequate culture conditions
for P. brumalis since they really influence pretreatment (Chapter 1, 3, 4 and 6). In this sense, the screening
led for STOCKACTIF project was realized with all strains in the same conditions. Thus, strains considered
as effective were efficient in these screening conditions. With other culture conditions and with the same
strains, it is strongly possible that other strains would have been considered as interesting to pretreat
lignocellulose. When the goal is to identify the best strains, screening with several culture conditions
must be carried out even if tested strains would be less numerous. This methodology was notably followed
by Zadražil (1985) who studied in vitro dry matter digestibility for ruminants feed treated with hundreds
strains grown at 22, 25 and 30°C during 30 and 60 days. Due to lack of time, it was not possible, in the
project, to test different culture conditions on the large number of strains. The priority was put on the
exploration of the diversity of the CIRM-CF bank (“Centre International de Ressources Microbiennes-
Champignons Filamenteux”). For this reason some Brown-Rot Fungi (BRF) were included in the screening
although BRF are known to little modify lignin and to attack carbohydrates. Consequently, BRF are globally
less effective than WRF for lignocellulose pretreatment even if one screened BRF strains was efficient
(Antrodia malicola BRFM 1200) (Zhou et al., 2015b). In addition, retained inoculation technique for
screening was using mycelia disc that consists to cut agar plug on the periphery of a petri dish where fungus
had actively grown. This technique might not be suitable for strains comparative studies because of the
different growth rates. Mycelia density on the agar plug is dependent of fungal strain and thus inoculum
amount is not standardized. Mycelia suspension or Cellophane Film Culture (CFC) technique (agar plate
overlaid with cellophane film to ease the separation) should be preferred as they allow the quantification of
fungal biomass in the inoculum (Yoon et al., 2014).
Despite these observations, P. brumalis BRFM 985 has a lot of advantages since this strain was not only
efficient to pretreat wheat straw (for anaerobic digestion applications) but also miscanthus (for ethanol
production applications) (Zhou et al., 2015b). This efficiency on both lignocellulosic biomasses let assume
the possibility to pretreat other substrates as results would not be too dependent of the couple
substrate/fungus used. The screening was carried out in deep-well with addition of starter solution before
fungal inoculation (200 mg glucose/g dry straw and 18.4 mg of tartrate diammonium/g TS). In order to

188
measure the BMP of pretreated substrates, interesting strains were cultivated once again in deep-well. Some
of them received four times less starter amount than for the screening, notably because this addition can
decrease the efficiency of the pretreatment and represent a supplementary cost for industrial scale. In these
conditions, certain strains were unable to grow. In contrast, P. brumalis BRFM 985 can be cultivated
without starter addition that constitutes a competitive advantage for this strain. P. brumalis BRFM 985
seems ubiquitous as it can also be reflected by the large range of usable growth temperature (at least 8-35°C)
or the capacity to grow with low moisture content (1.9 WW/TS i, Chapter 4). Its rapid growth is also
interesting (personal communication from S. Zhou). Finally, it is probably not a coincidence if P. brumalis
will be the first fungus to be cultivated in space (NASA, 2015; Valley Christian Schools, 2014).
It is very likely that the maximum methane improvement for P. brumalis BRFM 985 treated straw was
not reached. In the current work (Table 7-1), best measured improvement (44% CH4 more/g VS pretreated
and 21% CH4 more/g TS initial) are expressed by comparison to control straw (uninoculated straw in glass
columns: NIC). Slight starter amounts were added for these measurements (25 mg of glucose/g TS and 2.5
mg of tartrate diammonium/g TS). As remaining starter after pretreatment can be converted into methane
with anaerobic digestion, the comparison to control straw whether than untreated straw (UWS) is relevant.
Moreover, UWS was not available for this series of BMP-tests. From an industrial point of view, results
must be compared to UWS when possible. During the optimization of pretreatment with P. brumalis BRFM
985, best measured improvement compared to control straw (NIC) were smaller (20% CH4 more/g VS
pretreated and only 5% CH4 more/g TS initial) as shown in Chapter 4 and Table 7-1. The comparison with
biological control (NIC) allows quantifying fungal action. Pretreatment process (glass column) even without
fungal inoculation increases straw BMP (Chapter 4). To evaluate all aspects of the pretreatment (physico-
chemical and fungal) a comparison to untreated straw is possible since no starter were added: 43% CH4
more/g VS pretreated were obtained compared to UWS instead of 20% CH4 more compared to NIC. Taking
into account mass losses, best BMP obtained during optimization step (206 NmL/g TSi for sample 9, Table
4-3) corresponded to 13% more methane compared to UWS. In this case, the pretreatment can be considered
as efficient but it would not be mainly due to fungal inoculation.
Finally, a negative impact of starter addition regarding pretreatment efficiency was observed in Chapter 1.
However, in Chapter 1, effects of glucose addition were investigated for pretreatment in deep-well during 14
days with 0 or 50 mg glucose/g straw whereas best methane improvement was observed for pretreatment in
Table 7-1.Variation of methane production from P. brumalis BRFM 985 pretreated wheat straws
compared to control according pretreatment conditions. Selection step:
Chapter 1
Optimization step:
Chapter 4
SSAD reactors:
Chapter 6
Pretreatment system Deep-well Glass column Pilot-reactor Added glucose amount with starter
solution (mg/g straw)
200 25 0 0
Anaerobic digestion system BMP tests BMP tests Batch reactors
SSAD
Control considered Improvement TSinit or
VSpretr (for starter
amount correction)
NIC
UWS MWS
CH4 reported to pretreated VS - 16% + 44% + 20% - 10% + 10%
CH4 Reported to initial TS - 30% +21% + 5% - 29% - 8%

189
glass columns with culture duration of 21 days and 25 mg glucose/g straw (and slight nitrogen addition). In
literature, it was already explained (Chapter 1) that there is a controverse about the impact of glucose on
pretreatment since both positive and negative effects were observed. With moderate addition of glucose in
pulp mill wastewaters containing lignin and slight nitrogen amount, Wu et al. (2005) observed an increased
secretion of ligninolytic enzymes by P. oestreatus and a faster delignification whereas high glucose amounts
decreased ligninolytic enzymes and β-glucosidase activities and thus the COD removal from liquid medium.
Consequently, lower results obtained for the optimization step compared to selection step might be due to
the different starter amount between those steps (no starter addition for optimization). To check this point, a
repetition of the best pretreatment (21 days in glass columns with slight starter amount) and the same
pretreatment without starter must be carried out followed by anaerobic digestion.
In the experiment design, the maximum calculated BMP for treated straw (with metals addition) was
obtained for longest fungal culture duration (≈ 20 days). Optimum methane production was not reached in
the experimental domain whereas maximum dry matter losses would have been obtained (Annex 4). It can
also be noticed that 21 days culture duration were required to obtain the maximum methane improvement of
the current work (Chapter 1). For these reasons, culture duration longer than 20 days may lead to consequent
methane improvement (per g of initial TS). To obtain the optimum value for BMP, especially regarding the
pretreatment duration, few more experiments can be carried out since the chosen experimental design allows
the addition of new experimental data points. However, for anaerobic digestion step, anaerobic inoculum
would be slightly different of the one used in Chapter 4 and it is not sure that supplemental measurements
would allow a good extrapolation of data. Since maximum calculated BMP in the experimental domain does
not correspond to highest tested temperature or moisture content, it would not be necessary to increase the
experimental domain for those variables.
During the optimization of pretreatment, other culture conditions could have been tested such as aeration. In
literature review (Chapter 1), it was discussed that oxygenation led to a more rapid delignification for P.
brumalis but selective delignification was not necessarily improved. However, more culture conditions
tested would require numerous experimental points that are difficult to manage with limited time and
materials. Moreover, such a work would lead to a better characterization only at lab-scale (culture in glass
columns with 20 g straw). With another SSF system, optimum culture conditions to improve BMP of
pretreated straw would be different than in glass columns. Pretreated straw was obtained in a pilot-reactor
(Table 7-1) but the pretreatment was not optimized and was inefficient: large uncolonized areas and
diminishing of the straw BMP after pretreatment (Chapter 6).
Finally, to fully access the efficiency of fungal pretreatment for anaerobic digestion, it is also important to
have an efficient SSAD. Anaerobic digestion in reactor is necessary to investigate pretreatment
efficiencyfor full-scale plants (Chapter 6). It can notably allow studying anaerobic digestion rate since its
improvement would be another interest of WRF pretreatment. It can be interesting from an industrial point
of view, especially because some lignocellulosic residues require a long time to be transformed by anaerobic

190
digestion. Müller & Trösch (1986) observed the maximum daily methane production for untreated samples
two days after the one for treated samples (90 d pretreatment of wheat straw with Pleurotus florida). An
increment of the initial hydrolysis rate for fungal treated poplar was measured by Yang et al. (2013). It can
lead to a better methane production rate as hydrolysis is often the limiting step of anaerobic digestion (Yang
et al., 2007). The acceleration of the hydrolysis can be caused by the enhanced surface exposure of fungal
treated material. To have an economic interest, improvement of methane production rate must occur for
anaerobic digestion duration shorter than solid-retention time of full-scale plants. Otherwise, no
improvement of methane production is obtained. In the current study (Chapter 6), methane production rate
was improved for anaerobic digestion duration lower than twenty days but it was due to acidification in
controls rather than hydrolysis enhancement (increased porosity…) by fungal pretreatment. Another
experiment with better conditions in all reactors (methanogenesis not limiting) is required in order to
study the possible enhancement of hydrolysis step of anaerobic digestion with fungal pretreatment.
Such an improvement can lead to higher methane production rate. Moreover, around 200 g of wheat straw
efficiently fungal pretreated, i. e. with an improved BMP compared to UWS, are necessary for further
experiment (as it was not the case in Chapter 6).
To carry out an efficient SSAD, the main parameter to determine is S/I in batch systems but diverse
strategies can also be tested, e. g. optimum leachate recycle rate (Chapter 6), thermophilic temperatures or
even studies in continuous reactors. Co-digestion strategies must especially be explored as an improved
methane yield can be obtained due to synergisms (better C/N, nutrients supply…) (Mata-Alvarez et al.,
2000). It is very likely that C/N for fungal pretreated straw is still too elevated for an optimum anaerobic
digestion. The lowest measured C/N with straws issued from selection step was 68 with straw pretreated in
glass columns with BRFM 1048 (Annex 13) whereas optimum C/N for anaerobic digestion is between 20
and 35. In SSAD reactors (Chapter 6), the amount of substrate TS corresponded to more than 2/3 of the
whole TS content (substrate + inoculum). Considering these proportions and a C/N equals to 68 for
pretreated straw, a C/N inferior or equal to 35 cannot be reached whatever the C/N of the inoculum
(68 ×2
3+
1
3𝑥 ≤ 35).
Evaluation of pretreatment economic feasibility is dependent on increase output (methane yield) and input
(additional cost due to pretreatment). Lab-scale data fail to evaluate full-scale costs (Carlsson et al., 2012)
and pretreatment feasibility cannot be fully assessed without certain details about the context of the process
application (Chapter 6). The industrial trial of the STOCKACTIF project will certainly provide useful data
to better characterize a full-scale process, especially from a technico-economic point of view. The anaerobic
digestion of the industrial trial is scheduled between January and March 2016.
7.2 WRF pretreatment scale-up: the contaminations challenge
With thirteen days of pretreatment at pilot-scale (200 g straw * 2), large areas without fungal colonization
were reported on pretreated straw (Chapter 6, pictures in Annex 12) whereas colonization in glass columns

191
was more homogeneous (pictures in Annex 14). This phenomenon can illustrate the necessity to find optimal
culture conditions for each culture system. The principal difference between the two processes is that one
was sterile (glass columns) whereas the other was not (pilot-scale). Straw particles size, another parameter
influencing SSF, was different between pilot-scale (few centimeters) and lab-scale (4 mm). This experiment
(August 2014) was carried out before the obtaining of optimization step results (November 2014) and
parameters (WW/TS = 4.7 and temperature = 30°C) were chosen a priori. Metals addition was used but
without MnSO4 (not available at this time). The major problem encountered during the project to cultivate
P. brumalis on hundreds grams of wheat straw was a fungal contamination (picture without magnification
in Annex 15). The contaminant fungus is white (as P. brumalis) at the beginning of its growth then hundreds
of black spores are scattered into the substrate and the mycelium takes a grayish aspect (Figure 7-1). Those
phenotypic characteristics suggest an Aspergillus contamination, which will be confirmed (or not) by
sequencing (still on-going). Thus, it was not possible to study influence of culture conditions in another SSF
system such as the pilot-reactor.
g
Figure 7-1. Stereomicroscopic observations of the fungal contaminant in the pilot-scale pretreatment. A. Grayish aspect of the contaminant on wheat straw (magnification x 27.4). B. Numerous black spores scattered by the
contaminant (magnification x 101). C. Spore of the fungal contaminant (magnification x 101).
Contaminations occurred on autoclaved straw cultivated under clean but not sterile conditions (as described
Chapter 26, 6.2.1). More than ten experimentations failed in two years. A pretreatment at pilot-scale takes
approximately one month (17 days for inoculum cultivation and 15 days of wheat straw pretreatment). Once,
almost no contamination occurred (Chapter 6, pictures in Annex 12), this pretreated straw was used for
SSAD in reactors. It is interesting to note that contaminations were observed whatever the origin of wheat
straw (different harvested years or fields). As return of experience on the LBE pilot concerning
contaminations, several observations must be highlighted. It can be difficult to maintain moisture content
during the pretreatment but it is essential to succeed. Moreover, free water may favor growth and spore
germination of the contaminant (Gil-Serna et al., 2014). Pretreatment reactor design must be though to avoid
areas difficult to clean that can host contaminants between two experimentations. In the same way, large
pipes must be preferred to small ones and reactor parts must be easy to change. A particular attention must
be provided to inputs (water, air), and to strategies to ensure their cleanliness (bleach in water, air filtering
471 µm 134 µm 225 µm A
A
B
A
C
A

192
with sterile filters…). Effective means of disinfection must be implemented in case of contamination but
also before each pretreatment. At the LBE, kärcher cleaning and sometimes fumigation with a fungicide
were used (Fumispore® OPP). Kärcher cleaning allows a mechanical action to take ofF impurities and the
heating action (120°C almost 20 min) is potentially effective to kill contaminants.
A certain trend for P. brumalis BRFM 985 to grow on peripheral straw and with small height of straw pile
evokes a high oxygen need. However, increase oxygen intake is not sufficient to succeed since multi-criteria
are implied in fungal growth and pretreatment. High amount of fungal inoculum helps to have a rapid fungal
development limiting contaminations. To facilitate inoculation, INRA of Marseille (BBF) advocated
inoculum cultivation on miscanthus pellets. Low contamination level was observed with very high inoculum
amount (one unit for two units wheat straw). At industrial scale, more inoculum would mean more
miscanthus pellets, higher cost and more difficulties to handle it. Thus, adequate inoculum amount must be
found. Finally, it was also tried once to use starter (glucose + N) for cultivation at pilot-scale of P. brumalis
BRFM 985. Starter addition has probably favored contaminations as numerous ones were observed after this
pretreatment. In test tubes, it was checked that the contaminant was not present in straw with a culture under
sterile conditions on autoclaved straw. It was also noticed with autoclaved contaminated straw that the
contaminant can grow and sporulate after autoclaving. Sometimes, the cleanliness of the pretreatment
system was checked before inoculation using petri dishes in the reactor and swabbing (wall, water…).
In literature, it is advised to decontaminate the substrate with a short anaerobic fermentation step before
inoculation. Dilute aromatic fungicide or moderate acidic pH during culture would be helpful to favor WRF
which are able to digest aromatic structures and to acidify the substrate (Chapter 1, 1.3.2). Those strategies
were not tried but dilute fungicide seems not environmental friendly and acid pH would be more adapted to
limit microbial contaminations than fungal ones. Even if the presence of the contaminant in wheat straw was
not turned out; a particular attention must be paid to wheat straw decontamination, especially because the
contaminants can grow after autoclaving step. Trials of straw thyndallization could have been carried out.
This technic is especially adapted to fight against microbial spores and consists in several cycles of moderate
heating (e. g. 30 min at 60°C) each 24 hours. The principle is based on spore germination followed by their
elimination when they are in a less resistant form. This technic is probably also efficient against fungal
contaminations as successful subsequent fungal culture were reported (Meier et al., 2011; Rehbein and
Koch, 2011). For industrial scale trials, Soufflet partner will try soon to cultivate P. brumalis BRFM 985 on
ionized, pasteurized and raw wheat straw under sterile conditions. In most studies, substrates are sterilized
but to a larger scale, it can be costly and not very easy to handle (notably because of pressure). In contrast,
Akin et al. (1995) succeeded to obtain similar biodegradability improvement for grass digested with ruminal
microorganisms and pretreated with three different fungi whether it was on sterile or unsterilized Bermuda
grass stems. With unsterilized yard trimmings treated with Cyathus stercoreus, Zhao et al. (2014a) obtained
the same methane production as with sterilized material. In their study, unsterilized substrate was inoculated
with sterile pre-colonized material (one unit for 4 or 9 units of dry matter unsterile substrate). In the current
study, inoculation was done with sterile material with one unit for four units dry matter sterile substrate, in

193
the general case. The degree of disinfection required is fungi dependent and substrate dependent (nature and
amount of endogenous flora). It may be useful to keep microorganisms that do not compete with WRF
development but disturb colonization by harmful microorganisms (Ficior et al., 2006). However, it seems
not easy to carry out without carbohydrates consumption.
For further investigations on fungal pretreatment, the tolerance of WRF to contamination must be
considered in strain screening or selection steps (e. g. with a culture on pasteurized straw whether than
autoclaved…). The capacity to grow quickly is also important since once the substrate is colonized,
contaminations have some difficulties to implement. Finally, one pretreatment trial was carried out in the
LBE’s pilot with miscanthus straw. The growth was successful as large areas with dense white mycelium (P.
brumalis BRFM 985) were observed without black spores from contaminant (picture in Annex 16). In the
same way, other project partners did not have difficulties for P. brumalis BRFM 985 culture on miscanthus.
Thus, miscanthus appears as a more adapted substrate for this fungal strain. Methane improvement is
possible since in literature, 5% more methane (NmL/g TSi) were obtained with miscanthus pretreated with
C. subvermispora (Vasco-correa and Li, 2015). Differences between wheat and miscanthus straws (chemical
composition…) exist but crops technical itineraries are also different. Contrary to wheat straw, miscanthus
does not spend several days on soil that can potentially contaminate it. However, it is an energy crop whose
use is regulated in France, especially for anaerobic digestion application, due to ethical problems raised by
energy crops (Art. L. 541-39., 2015).
Wheat straw contaminations led to a decrease in BMP (Figure 7-2), probably due to carbohydrates
consumption. Whatever the contamination levels BMP (NmL/g VS pretreated) was similar and slightly
lower than the one of raw straw (Figure 7-2). Taking into account mass losses, differences between raw and
contaminated straws would be higher. Mass loss was only measured for straw without contamination and
estimated at 20% (Chapter 6); they may be higher for contaminated straw. Pretreatment conditions were
inadequate since non contaminated treated straw had a slightly lower BMP compared to raw straw (UWS).
Only fungal contamination was visible (to the naked eye) at pilot scale but a consumption of carbohydrates
by bacteria is also a possibility to explain similar BMP whatever fungal contamination level at pilot-scale.
Finally, the heterogeneity of the substrate (Chapter 6) would also explain those results. To avoid this
problem, straw was ground to 1 mm before BMP measurements but sample portions taken before grinding
can have been not sufficiently colonized by fungi. The impact of contamination in SSAD reactor may be
different since BMP tests are not sufficient to predict full-scale performance (Carlsson et al. 2012 and
Chapter 6).

194
Figure 7-2. BMP of straws (1mm) pretreated in the LBE pilot-reactor with different level of
contaminations and compared to BMP of raw straw (1mm).
7.3 WRF pretreatment for ethanol and methane production
In STOCKACTIF project, S. Zhou studied the interest of the WRF pretreatment for ethanol
production. For this purpose, delignification is required to maximize glucose yield after hydrolysis. Ethanol
is presently produced from glucose issued from cellulose, even if efficient xylose fermenting strains are
emerging (Kuyper et al., 2005). To recognize the fitness of WRF for ethanol production, Lignin
Decomposing Selectivity (LDS) ratio can be used. It is defined as the ratio of lignin degradation over
cellulose loss (Tian et al., 2012).
There were diverse concordant observations between the present work and the one of S. Zhou (BBF
laboratory). A patent was deposited in France by BBF and LBE laboratories about fungal pretreatment of
lignocellulosic biomass for bioenergy production (Gimbert et al., 2014). It is based on results obtained in
glass columns with five different WRF strains for a 3-weeks pretreatment duration (samples from selection
steps, without T. cingulata BRFM 1296 excluded for intellectual property reason). On these pretreated
wheat straws, S. Zhou studied fungal biomass, mass losses, straws composition and enzymatic hydrolysis
(digestibility) of cellulose. Fungal enzymatic activities at the end of the pretreatment were also measured.
They concerned both the hydrolytic system (glucosides hydrolases on xylan, Avicel, pectines…) and the
ligninolytic one (Laccases, MnP…). Finally, BMP of pretreated straws, measured at the LBE (Chapter 1),
are also included in the patent (Gimbert et al. 2014; Zhou et al. 2016, under writing).
0
50
100
150
200
250
300BMP (NmL/g VS)
Raw straw
No contamination
Moderate contamination
Highly contaminated

195
For all tested strains, S. Zhou found an efficient delignification that increased cellulose digestibility (except
for T. pavonia BRFM 1554) compared to control (Table 7-2). Digestibility of cellulose is the percentage of
glucose released after enzymatic hydrolysis reported to whole glucose contained in tested straw. P. brumalis
BRFM 985 and Leiotrametes sp. BRFM 1048 were the most selective strains regarding LDS, attacking
lignin and preserving cellulose (Table 7-2). With limited mass losses, P. brumalis BRFM 985 appeared as
the most interesting strain to pretreat wheat straw for ethanol production since remaining cellulose is
highly digestible (more than 20% increase compared to NIC) (Table 7-2). Enzymatic activities vary a lot
during fungal culture (Gutierrez et al., 1995). However, at the end of the pretreatment, P. brumalis
BRFM 985 produced higher ligninolytic enzymes along with lower glucosides hydrolases activities as
compared to other fungi (Figure 7-3). Moreover, whereas tested strains consumed similar cellulose and
hemicelluloses amounts, P. brumalis BRFM 985 had a slight preference for hemicelluloses consumption in
those culture conditions (Table 7-2). T. ljubarskii BRFM 957 degraded extensively all polymers from
lignocellulose leading to higher mass losses than for other strains (33% against 20% in average). Culture
duration for T. ljubarskii BRFM 957 was probably too long. In accordance with the significant degradation
of holocelluloses, glucosides hydrolases activities at the end of the pretreatement were the highest for this
fungus (Figure 7-3). Concerning the Brown-Rot G. trabeum BRFM 236, as expected it attacks less the
matter (11% mass losses) with a preferential consumption of carbohydrates marked by a low LDS (Table
7-2), high glucose hydrolases and low ligninolytic activities at the end of the pretreatment (Figure 7-3).
Table 7-2. Composition changes of pretreated wheat straws compared to control. Loss values are calculated taking into account the initial content of each component in WS.
Fungal Strains
Mass losses
(%)
Fungal biomass
(mg/g)
Component loss (%) Selectivity
LDS*
Cellulose
digestibility
(%) Cellulose Hemicelluloses Lignin
T. ljubarskii
BRFM 957
33 ± 3 73 ± 6 40 ± 1 44 ± 1 51 ± 1 1,3 40.8 ± 1.2
P.brumalis
BRFM 985
19 ± 1 50 ± 3 16 ± 2 28 ± 2 40 ± 1 2,5 54.3 ± 2.0
Leiotrametes sp.
BRFM 1048
20 ± 2 48 ± 9 18 ± 2 22 ± 2 35 ± 2 2 36.3 ± 1.6
T. menziesii
BRFM 1369
25 ± 2 64 ± 4 28 ± 2 30± 2 37 ± 1 1,3 36.5 ± 1.7
T.pavonia
BRFM 1554
21.5 ± 0.9 20 ± 2 25 ± 1 25 ± 2 34 ± 1 1,4 29.8 ± 0.9
G. trabeum
BRFM 236
11.2 N. A. 11 19 8 0.7 N. A.
Control
NIC
3.5 ± 0.7 - - - - - 32.6 ± 1.4
N. A.: Not Available; * Selectivity LDS: Lignin losses (%)/Cellulose losses (%) (Zhou et al., 2016, in preparation)

196
K
Figure 7-3. Enzymatic assays after 21 days of pretreatment for samples from the selection step. A. Glucosides Hydrolases activities on various substrates. CMC: Carboxymethyl cellulose; X: Xylan; XI: Insoluble Xylan; Man:
Mannan, GalMan: GalactoMannan. B. Ligninolytic enzymes activities: LAC, laccases; Mip, Manganese independent peroxidase;
Mnp, Manganese peroxidase.(Gimbert et al., 2014).
U/g
TS
U/g
TS
B
A
U
/g T
S
U/g
TS
Substrates
Enzymes

197
R² = 0.8477
0
50
100
150
200
250
300
350
0 2 4 6 8
BM
P (
Nm
L/g
VS
pre
tre
ate
d)
LDS
R² = 0.7542
0
50
100
150
200
250
300
350
0 10 20 30 40 50 60
BM
P (
Nm
L/g
VS
pre
tre
ate
d)
Cellulose digestibility (%)
Cellulose digestibility was related to BMP (R² = 0.7542, n=6, Figure 7-4A) even if BMP is also issued of
hemicelluloses degradation that is not quantify with enzymatic cellulose hydrolysis.
l
Figure 7-4. Correlations between BMP and substrate characterizations for non inoculated wheat
straw and WRF pretreated straws from Table 7-2 (selection step). A. BMP versus cellulose digestibility. B. BMP versus Lignin Decomposing Selectivity (LDS).
Cellulose digestibilities were similar to the one of NIC for most samples except for T. ljubarskii BRFM 957
and P. brumalis BRFM 985 that were higher (Figure 7-4A and Table 7-2). In accordance, with those results
BMP (NmL/g VS pretreated) for pretreated straws were not very different from the one of NIC (Figure
7-4A, Table 3-2), except for T. ljubarskii BRFM 957 and P. brumalis BRFM 985.
As already evoked, T. ljubarskii BRFM 957 led to an extensive degradation. The remaining straw had
consequently a high BMP per g of pretreated VS reflecting the accessibility of the substrate but after taking
into account high mass losses (33%), impact of pretreatment on BMP is negative (lower than for control
straw). Taking into account mass losses thanks to the BMP expressed per gram of initial TS, P. brumalis
BRFM 985 was also found to be the best strain (21% more methane than NIC). With LDS and mass losses,
S. Zhou observed that the second most selective strain was Leiotrametes sp. BRFM 1048. This strain led
to a poor improvement of cellulose digestibility comparable to the one obtained with the inefficient T.
menziesii BRFM 1369 but hemicelluloses losses were highest for T. menziesii BRFM 1369. The second
best BMP (NmL/TS i) was obtained for pretreated straw with Leiotrametes sp. BRFM 1048 (Table 3-2,
Chapter 1). However, this BMP was not significantly different from the one of control straw.
The correspondence between BMP and LDS (R²=0.8477, n=5, Figure 7-4B) is not surprising even if BMP
are also function of hemicelluloses (not considered with LDS) since a correlation seems to exist between
cellulose and hemicelluloses losses (R² = 0.76, Figure 7-5A). The LDS ratio is reminiscent of PS/LIG ratio
used to evaluate impact of fungal pretreatment with pyrolysis and that was correlated to BMP for straws
B
A

198
R² = 0.1641
0
50
100
150
200
250
300
0 20 40 60 80
BM
P (
Nm
L/g
VS
pre
tre
ate
d)
Fungal biomass amount (mg/g pretreated straw)
BRFM 985
y = 0.781x + 9.9882 R² = 0.7643
y = 1.0372x + 1.4735 R² = 0.9656
20
25
30
35
40
45
50
10 20 30 40 50
He
mic
ellu
lose
s lo
sse
s (%
)
Cellulose losses (%)
from the selection step (Chapter 5). Without P. brumalis BRFM 985 pretreated samples, the correlation
between cellulose and hemicelluloses losses and its slope is improved (R² = 0.96, Figure 7-5A) that can
reflect the slight preference for hemicelluloses consumption compared to cellulose in those culture
conditions. The low consumption of cellulose is also illustrated (Figure 7-5B) by the sharp decline of the
existing correlation between cellulose and lignin losses and of its slope when BRFM 985 is included in data
(R² = 0.56 against R² = 0.97 without BRFM 985). Lignin selective degradation is linked to a certain
cellulose conservation in the tested conditions since the behavior of BRFM 985 is not different from other
strains concerning the concomitant attack of hemicelluloses with lignin (Figure 7-5C).
H
Figure 7-5. Characterizations of pretreated straws used for the patent deposit. A. Correlation between hemicelluloses and cellulose losses compared to untreated straw. B. Correlation between lignin and
cellulose losses compared to untreated straw. D. Absence of correlation between BMP and fungal amount for straw pretreated
with different strains.
Moreover, it was shown that the amount of fungal biomass on wheat straw contribute slightly to BMP
improvement (Chapter 4). However, BMP is also function of substrate modifications that are more important
for long culture duration (Chapter 4) and dependent of fungal strain (Chapter 1). Furthermore, different
fungal biomasses had different BMP reflecting their different composition. Consequently, BMP (NmL/g VS
pretreated) is not correlated to fungal biomass amount (R²=0.16, Figure 7-5D) for straws treated 21 d with
different strains.
A
B
A
D
B
A
B
B
A
BRFM 985
y = 0.5414x + 25.982 R² = 0.56
y = 0.7809x + 18.022 R² = 0.8284
20
25
30
35
40
45
50
55
10 20 30 40 50
Lign
in lo
sse
s (%
)
Cellulose losses (%)
A
A
BRFM 985
R² = 0.9253
20
25
30
35
40
45
50
55
10 20 30 40 50
Lign
in lo
sse
s (%
)
Hemicelluloses losses (%)
C
A

199
y = 0.7995x + 9.8016 R² = 0.7408
y = 0.7455x + 3.3058 R² = 0.6377
-
5
10
15
20
25
30
35
40
- 10 20 30 40
Car
bo
hyd
rate
s lo
sse
s (%
)
Lignin losses (%)
Cellulose
Hemicelluloses
7.4 Further relationships between BMP and substrate characteristics
7.4.1 Samples from the optimization step
Concerning the optimization of P. brumalis BRFM 985 pretreatment in glass columns, the link between
BBF’s characterization work was already exposed since it can explain the degradability of pretreated straw
in anaerobic digestion (Chapter 4). To go further, the existing correlation (R² = 0.82) between
hemicelluloses and cellulose losses for P. brumalis BRFM 985 pretreated straw in several conditions was
plotted (Figure 7-6A). The slight preference for hemicelluloses consumption observed in the selection step
(Figure 7-5A) and in deep-well with different starter amounts (Chapter 1) is no more observable in those
conditions since cellulose losses are generally higher than hemicelluloses losses (Figure 7-6A). Correlations
between carbohydrates losses and lignin losses (Figure 7-6B) reveal a non-selective lignin attack during
the optimization step and explain low BMP values for pretreated straws.
One of the main differences between selection step and optimization step was the use of a slight starter
amount for selection steps (25 mg glucose/g straw). In Chapter 1, few samples were cultivated in deep-well
with different glucose amounts (0; 50; 200 and 400 mg glucose/g straw). It was concluded that starter
addition would have a negative impact on the pretreatment, especially by limiting the delignification, in a
strain dependent way. For BRFM 985 in deep-well, lignin amount in pretreated substrates was not
significantly different without glucose or with an addition of 50 mg glucose/g straw (Figure 3-3, Chapter 1).
In glass columns with slight glucose amount (25 mg/g), S. Zhou found insignificant cellulases activities after
pretreatment with P. brumalis BRFM 985 (activities on CMC and Avicel in Figure 7-3A). It is possibly due
to an inhibition of cellulases activities caused by glucose (as it was suggested for P. brumalis BRFM 985
behavior in deep-well, Chapter 1). BRFM 985’s cellulases were probably more active in the optimization
step (not measured) since cellulose consumption was emphasized. This increase of cellulases activities
might be due to the absence of starter in the optimization step. However, lot of other culture parameters
M
Figure 7-6. Correlations between cellulose, hemicelluloses and lignin losses for samples from the
optimization step. A. Hemicelluloses losses versus cellulose losses. B. Lignin losses versus carbohydrates losses.
0
A 0
A
A
B
B
A
y = 0.9354x - 5.9038 R² = 0.8663
-
5
10
15
20
25
30
35
- 10 20 30 40
He
mic
ellu
lose
s lo
sse
s (%
)
Cellulose losses (%)
0
A
0
A
A
B
A

200
(culture duration…) could have played a role on cellulose consumption. Lignocellulosic composition and
cellulases activities for straw pretreated without and with slight starter amount are required to conclude.
Correlations between hemicellulloses losses and celluloses losses do not exist for all WRF as observed by
Salvachúa et al. (2013) with Irpex lacteus. This fungus seems to consume preferentially cellulose
concomitantly with lignin rather than hemicelluloses (absence of correlation between hemicelluloses and
lignin losses). Carbohydrates losses seem unavoidable during pretreatment. It would be interesting to
determine among lignin selective strains which co-substrate to lignin consumption is preferable among
cellulose or hemicelluloses for BMP improvement of the pretreated substrate. In the current study, strains
that do not consume hemicelluloses concomitantly to lignin were not observed that is why no conclusion can
be drawn about this point.
The relationship between cellulose digestibility and BMP (NmL/g VS pretreated) was investigated using
optimization step data since a correlation between the two parameters was found for straws from the
selection step (Figure 7-4A, R² = 0.7542). The correlation exists also for samples from the optimization step
(R² = 0.7233, n=18, Figure 7-7A). Cellulose digestibility determined in 72 hours would be an efficient way
to explore quickly anaerobic degradability of fungal pretreated substrate. In this study, six months were
required to reach BMP values. Cellulose digestibility is notably dependent of lignin (Figure 7-7B) and
cellulose crystallinity (not measured for optimization step) that both influence BMP (Monlau et al., 2012b).
Holocelluloses digestibility would be of even greater interest to explore pretreatment efficiency for
anaerobic digestion.
k
Figure 7-7. Correlations with cellulose digestibility for samples pretreated in the optimization step. A. Cellulose digestibility versus BMP. B. Cellulose digestibility versus lignin losses (%).
In Chapter 5, a correlation between PS/LIG determined with pyrolysis (PS/LIG-pyr) or NREL method (acid
hydrolysis) was found with BMP (NmL/g VS) of pretreated straws from selection step and few samples
from the optimization step. In the optimization step, a poor correlation was observed between PS/LIG
determined with NREL (PS/LIG NREL) and BMP values (R² = 0.42, n=18, Figure 7-8). The separation of
0
A
A
A
B
A R² = 0.7233
0
50
100
150
200
250
300
350
0 20 40 60
BM
P (
Nm
L/g
VS
pre
tre
ate
d)
Cellulose digestibility (%)
R² = 0.7568
-
5
10
15
20
25
30
35
40
0 20 40 60
Lign
in lo
sse
s (%
)
Cellulose digestibility (%)
B
A
0
A

201
samples pretreated with or without metals addition only slightly improved correlation for samples with
metals (R² = 0.5, n=10, Figure 7-8) and an absence of correlation was observed for samples pretreated
without metals. Such a distinction seemed relevant since metals addition significantly increase lignin losses
and consequently the BMP values. PS/LIG ratio would perhaps be more adapted to compare pretreated
samples in the same conditions but with different strains (as it was mostly the case for Chapter 5).
However, for pyrolysis study (Chapter 5), no correlation was observed between PS/LIG-pyr and PS/LIG
NREL. Thus, a correlation between PS/LIG-pyr and BMP values for samples from the optimization step
would be still possible. Unfortunately, only few samples from the optimization step were available for py-
GC-MS measurements (as explained later). With py-GC-MS studies, a particular attention must be paid to
improve the measurement repeatability for heterogeneous samples (milling, replicates, etc.).
L
Figure 7-8. Relationship between BMP and PS/LIG NREL for samples pretreated in the optimization
step.
7.4.2 Samples from the selection step
Characterizations are essential to understand pretreatment mechanisms in order to evaluate the efficiency of
the reaction and finally to try to control it. Various characteristics are known to influence BMP of
lignocellulosic biomass (Chapter 1). Among them, lignin amount and S/G were determined for samples from
the selection step. Moreover, TKN content, also measured, can be linked to protein content (Li et al., 2001)
that is known to influence BMP values. Finally, cellulose crystallinity is equally an important parameter
impacting BMP values. It was assessed using the widespread Fourier-Transform InfraRed (FTIR)
spectroscopy. In addition, to evaluate compositional changes between samples, the relative areas of
carbohydrate peaks at 1375 and 1158 cm-1
against lignin peak at 1512 cm-1
(aromatic C=C) were calculated
to obtain ratios called PS1/ LIG and PS2/ LIG, respectively. In carbohydrate peaks there is no significant
contribution from lignin (Yang et al., 2009), they correspond to hemicelluloses and cellulose (C-H group at
R² = 0.4175
R² = 0.0005
R² = 0.4961
0
50
100
150
200
250
300
0 1 2 3 4 5
BM
P (
Nm
L/g
VS)
PS/LIG NREL
Optimization step
Without metals

202
1375 cm-1
and C-O-C at 1158 cm-1
). Crystallinity determination with FTIR is based on the measurement of
Lateral Order Index (LOI) that corresponds to areas ratio of peak at 1430 cm-1
(CH2 of crystalline cellulose)
on peak at 898 cm-1
(amorphous cellulose) (Spiridon, 2011).
Impact of fungal pretreatment on substrate parameters that are susceptible to modify its BMP was studied on
straws pretreated with several strains in glass columns (selection step). Some characterizations were carried
out and used to build a Principal Component Analysis (PCA): BMP; PS/LIG and S/G determined with py-
GC-MS; PS1/LIG, PS2/LIG and LOI determined with FTIR; Total Carbon (TC) and Total Kjeldahl
Nitrogen (TKN) both expressed in percentage of pretreated TS. Several data from S. Zhou (BBF laboratory)
were also included to PCA: lignocellulosic composition reported of the pretreated matter, lignocellulosic
components losses compared to NIC, fungal biomass amount (fungi on the PCA) and matter yield
considering no mass losses for control. The PCA concerned samples pretreated with different strains
(identified with their BRFM number on PCA plans: Figure 7-9, Figure 7-10 and Figure 7-11) during three
weeks and two samples pretreated two weeks (1554-2w and 985-2w) as it was the case for pyrolysis study
(Chapter 5). Except non dimensionless variables, all variables (Data table in Annex 17) are expressed per
amount of pretreated VS (for BMP) or TS (other variables). Expression of BMP in VS is relevant because
only organic matter is used during anaerobic digestion. The comparison with variables expressed in TS is
possible since BMP in pretreated VS are correlated to the BMP in pretreated TS (Annex 18) due to similar
VS amounts (/g TS) between samples.
Simca software considered three axes for this PCA. In the plan defined by axis 1 and 2, 73% of the
information contained in data can be found (Figure 7-9). The proximity between yield and lignin in the plan
1-2 shows that the more lignin remained the less matter was attacked; and obviously, the losses were lower
since lignin (LIG), cellulose (Cel) and hemicelluloses (Hemi) losses are anti-correlated to lignin and yield
variables. As previously observed for selection and optimization steps, LIG, Cel and Hemi losses compared
to NIC are also correlated (Figure 7-5 and Figure 7-6), it can show the impossibility to consume only
lignin for fungi (Kirk and Farrell, 1987). In Figure 7-9, fungal biomass amount (Fungi) is linked to TKN,
notably because it is mainly constituted by proteins (Chapter 6). Fungi protein content can be approximated
using TKN analysis (Li et al., 2001) but a part of TKN results is due to chitin (glucose-like fungal polymer)
(Díez and Alvarez, 2001). Thus, fungal protein amount determination with TKN is not precise. Increased in
TKN content is linked to fungal biomass and fungal biomass improves slightly BMP (Chapter 4). The
correlation between BMP and Fungi is slight as the one between DML and BMP for samples from the
optimization step (DML was supposed related to fungal biomass amount).

203
Figure 7-9. Plan 1-2 of PCA for characterizations of pretreated staws with several strains.
Moreover, with samples from the selection steps, it was highlighted that the use of different fungal strains
with different compositions (and different BMP) limits the potential correlations (Figure 7-5D). TKN
content is not linked to BMP probably because nutritive medium used for BMP tests provides all necessary
nitrogen to microorganisms. LIG, Cel and Hemi losses are also correlated to TKN and anti-correlated to TC.
It reflects the decrease of C/N (Annex 13) by consumption of carbon and conservation of nitrogen in fungal
pretreated samples. High carbon contents correspond also to high lignin contents and high matter yields. In
those conditions, BMP have a tendency to decrease but it is little correlated to lignin content in the plan 1-2.
Hemicelluloses content is poorly correlated to BMP. The slight anti-correlation between hemicelluloses and
BMP may be due to an increased recalcitrance of remaining hemicelluloses (as observed by others after
fungal pretreatment, Chapter 1, 1.6.6.2). Concerning cellulose, it is not well represented in the plan 1-2
(||cellulose|| ≤ 0.5), thus it cannot be discussed. A correlation exists between BMP and PS/LIG determined
with pyrolysis (as observed in Chapter 5). For straws pretreated with different strains, the more PS/LIG-pyr
is high, the more BMP of the substrate increases. PS/LIG determined with NREL method (acid hydrolysis)
is slightly correlated to BMP but the quality of representation of PS/LIG NREL is poor. If PS1/LIG and
PS2/LIG both determined with FTIR are highly correlated, they are independent of BMP variable in the plan
Axis
2 (
18%
of
tota
l in
form
atio
n)
Axis 1 (55% of total information)

204
1-2. They are opposed to LOI, it can reveal a low contribution of crystalline cellulose to PS1/LIG and
PS2/LIG. LOI is poorly or not linked to other variables. Its slight link with PS/LIG-pyr would perhaps
indicate the higher contribution of crystalline structure in PS determined with pyrolysis. Crystallinity of
cellulose can influence cellulose behavior under pyrolysis (Zhang et al., 2010). Amorphous regions are
earlier attacked than crystalline ones under pyrolysis (Zhu et al., 2004), thus they are probably more
degraded and lead to less characteristic fragments. S/G-pyr is anti-correlated to BMP whereas the contrary is
expected (Monlau et al., 2013). It was already explained that S/G-pyr variations are small among samples
(Chapter 5). Rather than representing lignin structure, high S/G-pyr would be more reflective of high lignin
amount determined with pyrolysis that is anti-correlated to BMP (through the ratio PS/LIG-pyr).
Concerning samples representation, there are all well represented in the space defined by the three
components and in resulting plans since DmodX values are below the critical value (Dcrit) (Annex 19).
Samples 957 and 985 are the most linked to BMP, these two strains effectively improved BMP (NmL/g
pretreated VS) of pretreated straws. Sample 957, corresponding to straw pretreated with BRFM 957, is also
the most degraded sample (high losses) and the one with the highest fungal biomass as it is well shown on
the plan1-2. NIC, 236 and 2-weeks pretreated samples are situated on the right of axis 1 (except 985-2w in
the middle). They correspond to no or little degraded samples (close of high yield and lignin, low BMP and
fungal amount). Sample 236 corresponds to straw pretreated with the Brown-Rot Fungus (BRF), G. trabeum
BRFM 236. BRF are known to attack carbohydrates and to little modify lignin, it is logical to observe less
degradation for 236 as it is shown by the proximity with NIC on the plan 1-2. The comparison between
samples pretreated two weeks and three weeks shows that two weeks are not enough to obtain an efficient
pretreatment since 985-2w and 1554-2w are closer to NIC samples and farther from BMP variable. A
direct comparison of BMP is not possible since they were measured using different anaerobic inocula.
Moreover, samples pretreated two weeks were inoculated with 10 mg TS fungal biomass more than those
pretreated three weeks. For those reasons, BMP of samples pretreated two weeks were not included in
plotted PCA (Data table in Annex 17). The lowest BMP obtained after pretreatment of two weeks compared
to three weeks was largely discussed for BRFM 985 (Chapter 4). It also seems that two weeks pretreatment
is too short with the strain BRFM 1554. Finally, it can be noticed that all samples have a medium value for
LOI, except NIC-2w that seems to have a high LOI (Figure 7-9, Annex 17). 236, NIC and 985 have a LOI
slightly higher than other samples. The lack of diversity in data may explain why BMP and LOI are not
correlated on plan 1-2.
In the plan defined by axes 1 and 3 (Figure 7-10), 66% of total information is represented, and new
correlations appeared compared to plan 1-2. Various known relations (from literature or current work)
between BMP and chemical composition can be observed (Figure 7-10): PS/LIG NREL is correlated to
BMP (as observed in Chapter 5), lignin is anti-correlated to BMP, and cellulose amount is poorly but
positively correlated to BMP. For plotted samples, increase PS/LIG corresponds to BMP improvement and
to a decrease lignin amount. Moreover, a slight tendency to BMP improvement corresponds to high

205
cellulose amounts. Some existing relationship in the plan 1-2 still exists in the plan 1-3, such as positive
correlations between CT and Yield; between Cel, Hemi and LIG losses, Fungi and TKN and between
PS1/LIG and PS2/LIG. Interestingly, PS1/LIG is rather positively related to BMP and rather negatively
correlated to lignin, and may give interesting information to study anaerobic biodegradability of
pretreated straws (contrary to PS2/LIG). In the plan 1-3 pyrolysis data, LOI and Hemicelluloses are not
well represented.
Figure 7-10. Plan 1-3 of PCA for characterizations of pretreated staws with several strains.
K
In the plan 2-3 (Figure 7-11), 29% of the total information can be found. In this plan, sample 985 is highly
linked to the BMP variable, this sample corresponds to Polyporus brumalis and leads to the best methane
improvement observed in this PhD thesis. There is a positive correlation between cellulose and PS/LIG
NREL that reflects the higher contribution of cellulose in PS/LIG NREL since cellulose is present in higher
amount in straws (pretreated or not) compared to hemicelluloses (Annex 17). Hemicelluloses and PS/LIG-
pyr are anti-correlated that may reflect the absence of compounds representative of hemicelluloses in
pyrolysates (Chapter 5), notably owing to the facility to degrade this compounds and thus to product
unspecific compounds with pyrolysis.
Axis
3 (
11%
of
tota
l in
form
atio
n)
Axis 1 (55% of total information)

206
Figure 7-11. Plan 2-3 of PCA for characterizations of pretreated staws with several strains.
The LOI is positively correlated to BMP whereas the contrary is expected (according literature). The lack of
variability between samples was already evoked but the measurement of cellulose crystallinity index with
FTIR is perhaps also not relevant. Cellulose crystallinity index is usually measured with X-Ray
Diffractometry (XRD) but the simplest and most affordable method to assess it is using FTIR. FTIR only
provides relative values since spectra always contain contributions from both crystalline and amorphous
regions. However, many studies compared successfully FTIR and XRD cellulose crystallinity (Park et al.,
2010). To better understand the effect of fungal pretreatment on cellulose crystallinity, four samples were
measured by A. Barakat from the IATE UMR (project partner) with the XRD technic (Table 7-3). Monlau et
al. (2012b) succeeded to correlate Crystalline Index determined with FTIR and with XRD on diverse
lignocellulosic biomass. Using the same methodology (except grinding technic) as Monlau et al. (2012b), no
correlation was found between FTIR and XRD measurements for measured samples. The difference in
grinding method can perhaps explain the absence of correlation since grinding can change cellulose
crystallinity (Mihranyan et al., 2004). The small number of samples for XRD measurements is another
possible explanation for the absence of correlation. However, crystallinity index was higher for NIC than for
measured fungal treated samples (Table 7-3), it confirms the fungal capacity to attack crystalline cellulose
reported in literature (Chapter 1). It can be noticed that P. brumalis BRFM 985 allowed to reduce crystalline
Axis
3 (
11%
of
tota
l in
form
atio
n)
Axis 2 (18% of total information)

207
cellulose by half (%TS) compared to NIC. This capacity had contributed to the efficiency of this strain for
ethanol or biogas production. As expected, fungal pretreatment decrease cellulose crystallinity (Table 7-3).
Only few data are available in literature concerning modifications of cellulose crystallinity by WRF
pretreatment (Chapter 1, 1.6.2). XRD measurements show that important decrease of crystallinity can be
obtained with WRF pretreatment even without metals addition (shown efficient in literature), it was not
demonstrated to our knowledge.
Table 7-3. Crystalline cellulose measured with XRD and FTIR for few samples from the selection
step.
Crystallinity Index or CrI (% TS Cellulose)
Crystalline cellulose with DRX (%TS)
Crystalline cellulose with FTIR (%TS)
T. ljubarskii BRFM 957 26.85 14.45 20.09
T. cingulata BRFM 1296 39.70 14.89 18.68
P. brumalis BRFM 985 36.27 10.28 21.62
NIC 51.09 20.84 21.95
More samples would have helped to find significant correlations in the PCA (e.g. for S/G) and perhaps to
build a predictive model. At the LBE, straws issued from optimization step were only used for BMP tests
and few samples were measured in pyr-GC-MS. Further characterizations of these straws were not possible
due to the limited available amount. Taking into account 20% mass loss, around 16 g were available per
tested condition. This amount was shared between different partners (4.5 to 6 g for the LBE). Moreover, one
month and a half was necessary to pretreat all samples for optimization step at BBF lab by S. Zhou.
7.5 Other experimental prospects
Lignin amount is a good indicator of lignin degradation but cleavage of bounds between lignin and
carbohydrates would be sufficient to improve biodegradability (Chapter 1). Thus, study of lignin structure
can be interesting to explain anaerobic digestion of a substrate. Moreover, it can be useful to follow fungal
degradation such as cleavage of ester links and consumption of ferrulic (FA) and p-coumaric acid (PCA).
Diverse technics exist to study lignin structure such as NMR or a methylation step before py-GC-MS
(Chapter 5) but they were difficult of access in the current work and project. However, a two-step protocol
could have been used. Amount of ester bonds (links inside hemicelluloses) can be assessed after 24h at
25°C in a 1M NaOH solution; then, 2h at 170°C in 4M NaOH is required to assess ether links (links between
hemicelluloses and lignin and inside lignin). FA and PCA ester-linked are generally lower in fungal treated
substrate than in untreated control (Akin et al., 1993b). Phenolic compounds are then identified and
quantified with GC-MS (Yosef and Ben-Ghedalia, 2000) but quantification can also be assessed using
coloration with Folin-Ciocalteu and spectrophotometry (Boizot and Charpentier, 2006). This quite simple
analysis can be envisaged in further studies.

208
In literature review (Chapter 1), the difficulty for anaerobic microorganisms to attack epidermis cells in
plant was exposed. It is notably due to a lipid layer (cutin, waxes). In contrast, fungi can degrade this layer.
Thus, lipids released by fungal attack can present an interest to follow fungal degradation for anaerobic
digestion. Such a study would have been possible with Py-GC-MS but with another kind of column that the
one used in Chapter 5 (that was polar whereas apolar one is required). Moreover, an extraction step can be
necessary to better visualize minor compounds of plants epidermis (Nip et al., 1986).
Porosity is another important parameter impacting BMP that can be modified by fungal pretreatment. Some
porosity measurements are in process at IATE UMR (A. Barakat, STOCKACTIF partner). Fungi increase
the porosity of plant cells by the hyphal penetration and notably the attack of epidermis cells. The usual
degradation from the center (vacuole) to the outer during subsequent anaerobic digestion is possibly
modified due to new accessible surfaces. A digestion with ruminal microorganisms observed under
microscope seems to confirm this assumption (Akin et al., 1995). Anaerobic digestion of wheat straw was
studied at a microscopic scale and it was concluded that substrate accessibility is the main limitation factor
of SSAD degradation (Motte, 2013). To our knowledge, microscopic observations of anaerobic digestion
of a fungal treated substrate have not yet been realized. It would allow checking if outer surfaces can be
attack from the beginning of anaerobic digestion of fungal pretreated substrate.
Impact of fungal pretreatments can also be evaluated regarding their influence on quality of digestate
issued from anaerobic digestion of a WRF pretreated substrate but further studies are required to answer this
problematic. As WRF can also be used for their depolluting role towards aromatic molecules, they would
improve digestate quality in this way. Besides P. brumalis is known to degrade micropollutants such as
dibutyl phthalate (DBP), this kind of pollutants has a huge environmental impact (Pinedo-Rivilla et al.,
2009). In the current study, major fertilizing elements (N, P, K) of digestate were not fully studied after
SSAD in batch since it was not the goal of the study. Moreover, pretreatment was not optimal and would not
allow a sufficient characterization of fungal pretreatment impact on digestate. No difference in nitrogen
content was found on solid digestate after fungal pretreatment (Chapter 6). Increase of nitrogen amount was
found in leachate but they are generally recirculated whether than spreading in fields. In general, there is a
lack of knowledge about digestates impacts on the environment or human health and there is even a debate
about their effectiveness as amendment or fertilizer (Nkoa, 2014).
Spectrophotometry with Folin-Ciocalteu and 3D-fluorescence spectroscopy can be used to characterize
clean-up water from fungal treated straws, especially phenols issued from lignin degradation. It would allow
to investigate fungal degradation of lignin and to study an eventual link with BMP of the substrate.
Moreover, phenols can have a high commercial value. A better knowledge of phenols easily released by
fungal pretreatment is required for their potential valorization. Phenols could be a co-product of fungal
pretreatment. 3D-fluorescence spectroscopy allows the visualization of fluorescent compounds (aromatic)
such as those contained in protein, lignin and phenols (Jimenez et al., 2015). It provides notably some
information about the polymerization degree of molecules in extracted samples. Spectrophotometry with

209
Folin-Ciocalteu allows to estimate total phenolic content (Boizot and Charpentier, 2006). Diverse project
partners were concerned by phenols availability experiments namely, LBE, Envolure company and BBF.
Some characterizations are still in process and expected to draw conclusions on this point.
7.6 Conclusion
In summary, taking into account mass losses more than 20% methane improvement compared to control
straw were obtained with P. brumalis BRFM 985. It is very possible that even greater value can be obtained.
To our knowledge, it is the best improvement observed on pretreated grasses and straws but there are very
few studies available to compare. It cannot be excluded that slight starter addition allowed such an
improvement. Notwithstanding, P. brumalis BRFM 985 seems to have very interesting properties. Further
investigations are required to improve SSAD of fungal pretreated straws (not only on fungal pretreatment
but also on SSAD processes). For both optimization and selection steps, there were a correlation between
BMP and cellulose digestibility and a slight positive influence of fungal biomass on BMP. Carbohydrates
losses were generally correlated to lignin losses. Finally, important decreases of cellulose crystallinity were
measured on few pretreated samples from the selection step.


Expanded prospects and conclusion
211
Chapter 8. Expanded prospects about aerobic fungi and
anaerobic digestion and conclusion
Difficulties encountered during the STOCKACTIF project, proposed improvements and additional
experimentations were already discussed, especially in the previous chapter. However, in a broader context
diverse prospects can be considered for fungal pretreatments.
Table of content
8.1 COMBINATION OF PRETREATMENTS ........................................................................................................................................... 212 8.2 USE OF OTHER SUBSTRATES ..................................................................................................................................................... 212 8.3 MIXED CULTURE AND STRAIN ENGINEERING ................................................................................................................................ 213 8.4 FUNGAL CULTURE ON DIGESTATE .............................................................................................................................................. 213 8.5 BIOHYDROGEN PRODUCTION .................................................................................................................................................... 214 8.6 PRODUCTION OF EDIBLE MUSHROOMS ....................................................................................................................................... 214 8.7 OTHER APPLICATIONS OF WRF ................................................................................................................................................. 215 8.8 CONCLUSION ........................................................................................................................................................................ 215

212
8.1 Combination of pretreatments
White-rot pretreatment in combination with physical or chemical pretreatments can reduce the harshness of
the pretreatment leading to environmental and economic gain compared to pretreatment without WRF.
Moreover, the long period required by fungi would be reduced. Pretreatments combination is little
investigated for anaerobic digestion application but some studies for bioethanol application were reported.
They can furnish useful information for further study of anaerobic digestibility (BMP), e. g. delignification
with low sugar loss may lead to increased BMP. Effects of some pretreatments combination on the
composition of resulting lignocellulosic biomass are resumed in Table 8-1. Good results were reported for
fungal treatment followed by NaOH, acid or steam explosion step and also for H2O2, hot water and
ultrasound treatment followed by fungal step (Wan and Li, 2012). A two-step fungal and alkali treatment led
to an increased dry mass loss (more reactive sites) but it was compensated by an increased conversion of
cellulose to glucose. Accessibility to cellulose was improved because fungal pretreatment facilitated the
removal of hemicelluloses and lignin during alkaline fractionation. Thus, a synergetic effect occurred on
cellulose digestibility (Yang et al., 2013).
Table 8-1. Combined white rot fungal pretreatment and physical/chemical pretreatment. (Adapted from Wan and Li, 2012)
j
8.2 Use of other substrates
In literature, diverse lignocellulosic biomasses were pretreated with WRF for anaerobic digestion. A
particular efficiency on woody biomasses is reported (Chapter 1, Table 4-3). Wood has low BMP value and
is little used in anaerobic digestion plants but with fungal pretreatment new substrate such as sawdust would
be usable.
The improvement of anaerobic digestibility of manure and/or spent straw (bedding material) using WRF
would be of great interest. High microorganism amount in such substrates could constitute a difficulty for

213
pretreatment in non-sterile conditions. It was reported that urea on forage is converted to ammonia by
autochthonous flora. This phenomenon leads to pH increase resulting in the inhibition of many putrefying
organisms. WRF able to grow at elevated pH such as Coprinus fungi can consequently delignify the
substrate in the absence of putrefying organisms (Krause et al., 2003). Horse manure, in particular, contains
great quantity of bedding material (generally straw) and have a low fertilizing value which predestines it to
the anaerobic digestion alternative. With SSAD, it was shown that spent straw from horse stall was more
biodegradable than raw wheat straw (Cui et al., 2011). With a full-scale wet plant (continuous process),
anaerobic digestion of horse manure without pretreatment was not feasible for practical application: low
degradation and increase risk of mechanical problem linked to high viscosity or floating layers (Mönch-
Tegeder et al., 2014b). Horse manure is difficult to store without uncontrolled degradations (and loss of
subsequent methane production) that is why a WRF pretreatment would be interesting.
8.3 Mixed culture and strain engineering
One of the difficulties to study fungal pretreatment lies in multiple interactions between fungal strain,
substrate and culture conditions. Thus, it would become harder using combination of two or more strains
belonging to BRF and WRF. Notwithstanding, such combinations can be synergistic on pretreatment. An
enhanced ligninolytic activity was observed with the combination of P. brumalis and T. versicolor on
synthetic agar medium (Sundman and Näse, 1972). With SSF on oat straw, fungi in pair-wise combinations
were found to slightly improve cellulose digestibility of pretreated substrate (Levonen-Munoz et al., 1983).
The synergistic effect can be caused by a complementarity of enzymatic materials. Another application can
be envisaged combining a fast growing strain to limit contamination and a selective delignifying one to
pretreat efficiently the substrate.
Another possibility to increase fungal pretreatment efficiency is the recourse to genetic transformations.
Overexpression of the laccase gene from P. brumalis lead to 1.6-fold higher sugar yield than with wild strain
after the hydrolysis of pretreated wood chips (Ryu et al., 2013). However, increased knowledge would be
required. A central role of MnP enzyme in delignification is highlighted but diverse conclusions can be
found in literature concerning best enzymatic equipment to delignify and lignin selective attack is rarely
considered (Hatakka, 1994; Moreira et al., 1997). Furthermore, possible risks for the introduction of
genetically modified organisms in the environment, such as impact on biodiversity and ecosystem function,
are not fully assessed (Wolfenbarger and Phifer, 2000). The whole natural existing potential of WRF strains
is still not completely explored. Thus, this exploration would be preferable to strain engineering.
8.4 Fungal culture on digestate
Residual organic matter in digestate and the resulting biomethane can be economically attractive (Singh et
al., 2007). An original study failed to obtain more biogas by treating lignocellulosic digestate (from wheat
straw, corn stover or grass) with WRF. The goal was to degrade carbohydrates with anaerobic digestion and
then, to alter the remaining lignin with WRF in order to digest it anaerobically again (López et al., 2013).

214
Digestates are rich in NH4-N (Singh et al., 2007) and N starvation is generally required for delignification
by WRF. Thus, it is possible that too available nitrogen had limited the delignification of the digestate by
WRF. Fungi from other phylum (Ascomycota) (Singh et al., 2007) could be more able to degrade lignin in
digestate.
It seems possible to treat digestate with ligninolytic fungi when the goal is a reduction of waste amount
(without energetic valorization). López-Abelairas et al. (2013) obtained a reduction of around 45% for
resulting hemicelluloses. After a centrifugation step, around 30% VS degradation were observed on
autoclaved digestate of kitchen refuse with fungal pretreatment with the soft-rot Chaetomium cellulolyticum
or with the WRF P. chrysosporium. Best lignin reductions in digestate were between 29% (for P.
chrysosporium BKM YM 125) and 45% (for C. cellulolyticum) (Schober and Trösch, 2000). This lignin
reduction may lead to increase residual methane production but it was not studied.
With another goal than delignification or methane production, it was suggested to use certain fungi able to
produce lipid in order to produce biodiesel, those fungi would be able to grow on digestate (Zhong et al.,
2015). Fungal lipids are likely to increase the BMP of fungal biomass but production of biodiesel with them
is likely more remunerative than methane production.
8.5 Biohydrogen production
Hydrogen which is not at present commercialized as an energy source but widely used as a chemical
reactant, can be produced biologically with dark fermentation. This process is similar to anaerobic digestion
but with an inhibition of methanogenesis. The metabolic pathways leading to hydrogen production must also
be favored. However, dark fermentation also requires an efficient hydrolysis step and the problem of lignin
recalcitrance must be circumvented (Guo et al., 2010). WRF pretreatments can be interesting to improve
biohydrogen production. Zhao et al. (2012) used a pretreatment of cornstalks with Phanerochaete
chrysosporium to enhance enzymatic saccharification and hydrogen production.
8.6 Production of edible mushrooms
One way to increase the economic efficiency would be the cultivation of edible WRF (like Pleurotus)
concomitantly to the delignification process followed by energy valorization. Mushrooms are more valuable
(Tsang et al., 1987) and delignification can be used to diminish cultivation wastes. The resulting energy
production can be used, for example, to maintain a good temperature for mushrooms cultivation. The
mycelial colonization allowing delignification and the formation of edible fruiting bodies are different stages
in the life cycle with lots of functional differences (Kalmış and Sargın, 2004). The concomitant
optimization of these two mechanisms is difficult. Authors who tried, obtained poor results regarding the
delignification or in vitro degradation of spent substrates (Tsang et al., 1987; Zhang et al., 2002).

215
8.7 Other applications of WRF
Possible applications for WRF are huge: sewage treatment, biopulping, conversion to animal feeds, compost
inoculants, production of medicinal mushrooms (Isroi et al., 2011; Tian et al., 2012). Increase knowledge on
WRF mechanisms can thus sometimes serve several applications. Finally, some more original uses are
reported such as coal extraction after its liquefaction with T. versicolor. After drying Pleurotus tuber-regium
can even be a weapon (bludgeon) as reported in Papua New Guinea (Fourré et al., 1990).
8.8 Conclusion
To face current global challenges, economic growth must not be at the expense of the environment and of
the human being. With this in mind, second generation biorefineries based on non-edible lignocellulosic
substrates are necessary. The costly pretreatment step required to sufficiently valorize those substrates, is
currently a major limitation to the development of second generation biorefineries. Consequently,
pretreatments represent huge commercial and industrial opportunities, as it can be attested by recent patents
on lignocellulosic pretreatments (Bule et al., 2013; Gimbert et al., 2014).
In this context, white-rot fungi pretreatments, requiring little inputs, arise a growing interest. Diverse studies
investigated the possibility for WRF to improve cellulose hydrolysis for ethanol application. However, WRF
were little investigated for anaerobic digestion purpose, although it is a very efficient way to produce
energy. Moreover, diversity of studied strains for pretreatment is weak (Ceriporiopsis subvermispora,
Pleurotus florida, Phanerochaete chrysosporium…). Pretreatment conditions constitute a central point for
the efficiency of a couple strain/substrate but they are often not discussed in WRF pretreatment for
anaerobic digestion studies.
The current study investigated WRF pretreatments of wheat straw for anaerobic digestion. Firstly, there
were two applied objectives consisting to select an efficient strain and to optimize its culture conditions. The
common goal consisted to maximize methane production of pretreated straws. After a screening step, P.
brumalis BRFM 985 was chosen. For the first time, an attempt to optimize pretreatment conditions for
anaerobic digestion was carried out. Best pretreatment conditions were not reached in the experimental
domain but maximum values were observed with almost 25°C and 3.5 initial wet weight/TS. Metals addition
during the pretreatment significantly enhanced methane production from pretreated straw, notably by
increasing lignin losses. After metals addition, culture duration was the most impacting parameter. To obtain
the maximum BMP values, ten days were required to pretreat the substrate without metals addition whereas
twenty days were necessary with metals addition (with far better BMP values). Those results were obtained
with BMP-tests that are not sufficient to predict full-scale performance. Thus, the third applied objective
was to investigate fungal treated straw in batch Solid-State Anaerobic Digestion reactors. SSAD is
particularly adapted for wheat straw valorization but during start-up phase, there is a high risk of
acidification that can inhibit methanogenesis. However, it was shown that fungal pretreatment can facilitate
the start-up of batch SSAD reactors (likely due to consumption of soluble compounds) and that
substrate/inoculum must be between 2 and 3 (VS basis).

216
Scientific objectives were to quantify and to understand mechanisms implied by the fungal pretreatment of
wheat straw in anaerobic digestion. Taking into account mass losses, more than 20% increase in methane
yield were obtained in the best case. To our knowledge, it constitutes the best anaerobic digestion
improvement for grasses or straws pretreated by fungi. In tested culture conditions, this improvement was
notably due to the selective consumption of lignin by P. brumalis BRFM 985 along with a conservation of
cellulose and a decrease of cellulose crystallinity. Such a selectivity seems primordial for pretreatment
efficiency. Selectivity would notably decrease with glucose addition at the fungal inoculation time (in a
strain dependent way, for a fixed culture duration and with at least 50 mg glucose/g straw). By contrast,
metals addition increased the selectivity for lignin consumption.
The negative impact of lignin on methane production from lignocellulosic substrate was already known but
this impact was observed even after only 6 days of BMP-tests. Improvement of methane production with
fungal pretreatment would not be due to soluble sugars increase whereas the high degradability of fungal
mycelium would improved methane production-rate in BMP-tests, especially during the first 30 days. Best
calculated methane production during the optimization step, was obtained with 25% of dry matter losses and
30% of lignin losses (compared to lignin amount in NIC). It corresponded to 31% improvement (NmL/g
TSi) compared to untreated wheat straw but only to 5% compared to non inoculated controls (NIC).
To finish, Py-GC-MS would allow to pre-select strains based on anaerobic degradability of fungal pretreated
wheat straws since it allowed an estimation of fungal biomass amount. Moreover, polysaccharides/lignin
ratios determined with Py-GC-MS were correlated to BMP of straws pretreated with several strains.
The necessity of adequate monitoring parameters for SSAD was also highlighted. In the current study, batch
SSAD reactors were able to recover from acidification phase when TVFA/alkalinity was lower than 2 and
with VFA concentrations inferior to 10 g/L in leachate.
To conclude, fungal pretreatments for anaerobic digestion were not yet fully exploited. There is notably a
real need to increase the studied scale principally to quantify fungal pretreatment costs and to conclude
about their industrial feasibility (such data are expected from the STOCKACTIF industrial trial).
Results from this work have highlighted fungal pretreatment potential and have raised awareness about: (i)
the necessity to take into account mass losses during pretreatment to evaluate its efficiency; (ii) the
importance to study pretreatment conditions in strain efficiency evaluation; (iii) the necessity to find ways to
pretreat substrates under non sterile conditions.

217
References
Abbassi-Guendouz, A., Brockmann, D., Trably, E., Dumas, C., Delgenès, J.-P., Steyer, J.-P., Escudié, R., 2012. Total solids content drives high solid anaerobic digestion via mass transfer limitation. Bioresource Technology 111, 55–61.
ADEME, 2011. Méthanisation agricole.
Adesogan, a. T., Owen, E., Givens, D.I., 1998. Prediction of the in vivo digestibility of whole crop wheat from in vitro digestibility, chemical composition, in situ rumen degradability, in vitro gas production and near infrared reflectance spectroscopy. Animal Feed Science and Technology 74, 259–272.
Agosin, E., Monties, B., Odier, E., 1985. Structural Changes in wheat straw components during decay by lignin-degrading white-rot fungi in relation to improvement of digestibility for ruminants. Journal of the Science of Food and Agriculture 36, 925–935.
Agosin, E., Odier, E., 1985. Solid-state fermentation, lignin degradation and resulting digestibility of wheat straw fermented by selected white-rot fungi. Applied Microbiology and Biotechnology 21, 397–403. doi:10.1007/BF00249988
Ahring, B.K., Sandberg, M., Angelidaki, I., 1995. Volatile Fatty Acids as Indicators of process imbalance in anerobic digestors. Applied Microbiology and Biotechnology 43, 559–565.
Akhtar, M., Blanchette, R.A., Kirk, T.K., 1997. Fungal delignification and biomechanical pulping of wood, in: Biotechnology in the Pulp and Paper Industry. Springer, pp. 159–195.
Akin, D.E., 1989. Histological and Physical Factors Affecting Digestibility of Forages. Agronomy Journal 81, 17–25.
Akin, D.E., Borneman, W.S., Rigsby, L.L., Martin, S. a, 1993a. p-Coumaroyl and feruloyl arabinoxylans from plant cell walls as substrates for ruminal bacteria. Applied and environmental microbiology 59, 644–7.
Akin, D.E., Burdick, D., Michaels, G.E., 1974. Rumen Bacterial Interrelationships with Plant Tissue During Degradation Revealed by Transmission Electron Microscopy. Applied and environmental microbiology 27, 1149–1156.
Akin, D.E., Rigsby, L.L., Sethuraman, A., Morrison, W.H., 1995. Alterations in structure, chemistry, and biodegradability of grass lignocellulose treated with the white rot fungi Ceriporiopsis subvermispora and Cyathus stercoreus. Applied and Environmental Microbiology 61, 1591–1598.
Akin, D.E., Sethuraman, a, Morrison, W.H., Martin, S. a, Eriksson, K.E., 1993b. Microbial delignification with white rot fungi improves forage digestibility. Applied and environmental microbiology 59, 4274–82.
Alvarado, A., Montañez-Hernández, L.E., Palacio-Molina, S.L., Oropeza-Navarro, R., Luévanos-Escareño, M.P., Balagurusamy, N., 2014. Microbial trophic interactions and mcrA gene expression in monitoring of anaerobic digesters. Frontiers in Microbiology 5, 1–14. doi:10.3389/fmicb.2014.00597
Alves, A., Schwanninger, M., Pereira, H., Rodrigues, J., 2006. Analytical pyrolysis as a direct method to determine the lignin content in wood: Part 1: Comparison of pyrolysis lignin with Klason lignin. Journal of Analytical and Applied Pyrolysis 76, 209–213. doi:10.1016/j.jaap.2005.11.004
Amen-Chen, C., Pakdel, H., Roy, C., 2001. Production of monomeric phenols by thermochemical conversion of biomass: a review. Bioresource technology 79, 277–99.
Amen-Chen, C., Pakdel, H., Roy, C., 2001. Production of monomeric phenols by thermochemical conversion of biomass: A review. Bioresource Technology 79, 277–299. doi:10.1016/S0960-8524(00)00180-2
Amirta, R., Tanabe, T., Watanabe, T., Honda, Y., Kuwahara, M., Watanabe, T., 2006. Methane fermentation of Japanese cedar wood pretreated with a white rot fungus, Ceriporiopsis subvermispora. Journal of biotechnology 123, 71–7. doi:10.1016/j.jbiotec.2005.10.004
Amon, T., Amon, B., Kryvoruchko, V., Machmüller, A., Hopfner-Sixt, K., Bodiroza, V., Hrbek, R., Friedel, J., Pötsch, E., Wagentristl, H., Schreiner, M., Zollitsch, W., 2007. Methane production through anaerobic digestion of various energy crops grown in sustainable crop rotations. Bioresource technology 98, 3204–12. doi:10.1016/j.biortech.2006.07.007

218
Angelidaki, I., Alves, M., Bolzonella, D., Borzacconi, L., Campos, J.L., Guwy, a. J., Kalyuzhnyi, S., Jenicek, P., van Lier, J.B., 2009. Defining the biomethane potential (BMP) of solid organic wastes and energy crops: a proposed protocol for batch assays. Water Science & Technology 59, 927. doi:10.2166/wst.2009.040
Angelidaki, I., Ellegaard, L., Ahring, B.K., 2003. Applications of the anaerobic digestion process. Advances in biochemical engineering/biotechnology 82, 1–33.
Angelidaki, I., Sanders, W., 2004. Assessment of the anaerobic biodegradability of macropollutants. Reviews in Environmental Science and Biotechnology 3, 117–129. doi:10.1007/s11157-004-2502-3
APHA, 1998. Standard methods for examination of water and wastewater, APHA, American Public Health Association, Washington, DC.
Art. L. 541-39., 2015. LOI n° 2015-992 du 17 août 2015 relative à la transition énergétique pour la croissance verte [WWW Document]. JOURNAL OFFICIEL DE LA RÉPUBLIQUE FRANÇAISE. URL http://www.developpement-durable.gouv.fr/IMG/pdf/joe_20150818_0189_0001_1_-2.pdf (accessed 8.25.15).
Bachmann, N., Deront, M., Fruteau, H., Holliger, C., Membrez, Y., Wellinger, A., 2011. Optimisation des tests standardisés de digestibilité dans des réacteurs batch.
Backa, S., Brolin, a., Nilsson, T., 2001. Characterisation of fungal degraded birch wood by FTIR and Py-GC. Holzforschung 55, 225–232. doi:10.1515/HF.2001.037
Barakat, A., Chuetor, S., Monlau, F., Solhy, A., Rouau, X., 2014a. Eco-friendly dry chemo-mechanical pretreatments of lignocellulosic biomass : Impact on energy and yield of the enzymatic hydrolysis. Applied Energy 113, 97–105. doi:10.1016/j.apenergy.2013.07.015
Barakat, A., Gaillard, C., Steyer, J., Carrere, H., 2014b. Anaerobic Biodegradation of Cellulose– Xylan–Lignin Nanocomposites as Model Assemblies of Lignocellulosic Biomass. Waste and Biomass Valorization 5, 293–304. doi:10.1007/s12649-013-9245-8
Barakat, A., Kadimi, A., Steyer, J.P., Carrère, H., 2014. Impact of xylan structure and lignin-xylan association on methane production from C5-sugars. Biomass and Bioenergy 63, 33–45.
Barakat, A., Monlau, F., Steyer, J.P., Carrere, H., 2012. Effect of lignin-derived and furan compounds found in lignocellulosic hydrolysates on biomethane production. Bioresource technology 104, 90–9. doi:10.1016/j.biortech.2011.10.060
Baroutian, S., Robinson, M., Smit, A.-M., Wijeyekoon, S., Gapes, D., 2013. Transformation and removal of wood extractives from pulp mill sludge using wet oxidation and thermal hydrolysis. Bioresource technology 146, 294–300. doi:10.1016/j.biortech.2013.07.098
Ben-Ghedalia, D., Miron, J., 1984. The digestion of total and cell wall monosaccharides of alfalfa by sheep. The Journal of nutrition 114, 880–887.
Benner, R., Hodson, R.E., 1985. Thermophilic Anaerobic Biodegradation of [14C] Lignin , [14C] Cellulose , and [14C] Lignocellulose Preparations. Applied and Environmental Microbiology 50, 971–976.
Berglund, M., Börjesson, P., 2006. Assessment of energy performance in the life-cycle of biogas production. Biomass and Bioenergy 30, 254–266. doi:10.1016/j.biombioe.2005.11.011
Bertrand, I., Chabbert, B., Kurek, B., Recous, S., 2006. Can the Biochemical Features and Histology of Wheat Residues Explain their Decomposition in Soil? Plant and Soil 281, 291–307. doi:10.1007/s11104-005-4628-7
Besle, J.M., Ramihone, B., Gochard, O., Tollier, M.T., Chenost, M., 1986. Disparition des acides phénoliques de la paille de blé en fermenteur semi- continu ; influence de l’acide p coumarique sur la dégradation des glucides pariétaux. Reprod. Nutr. Dévelop. 28, 155–156.
Bey, M., Berrin, J., Poidevin, L., Sigoillot, J., 2011. Heterologous expression of Pycnoporus cinnabarinus cellobiose dehydrogenase in Pichia pastoris and involvement in saccharification processes. Microbial Cell Factories 10, 113. doi:10.1186/1475-2859-10-113
Bidlack, J., Malone, M., Benson, R., 1992. Molecular Structure and Component Integration of Secondary Cell Walls in Plants. Proc. Okla. Acad. Sci. 72, 51–56.

219
BiogasSystems, 2015. Economizer SE [WWW Document]. URL http://www.biogas-systems.com/economizer_EN.html (accessed 9.1.15).
Bisaria, R., Madan, M., Mukhopadhyay, S.N., 1983. PRODUCTION OF BIOGAS FROM RESIDUES FROM MUSHROOM CULTIVATION. Biotechnology Letters 5, 811–812.
Blokhina, Y.N., Prochnow, A., Plöchl, M., Luckhaus, C., Heiermann, M., 2011. Concepts and profitability of biogas production from landscape management grass. Bioresource Technology 102, 2086–2092. doi:10.1016/j.biortech.2010.08.002
Blümmel, M., Ørskov, E.R., 1993. Comparison of in vitro gas production and nylon bag degradability of roughages in predicting feed intake in cattle. Animal Feed Science and Technology 40, 109–119.
Boizot, N., Charpentier, J.-P., 2006. Méthode rapide d’évaluation du contenu en composés phénoliques des organes d’un arbre forestier. Les cahiers techniques de l’INRA 79–82.
Börjesson, P., Mattiasson, B., 2008. Biogas as a resource-efficient vehicle fuel. Trends in biotechnology 26, 7–13. doi:10.1016/j.tibtech.2007.09.007
Borneman, W.S., Akin, D.E., VanEseltine, W.P., 1986. Effect of phenolic monomers on ruminal bacteria. Applied and environmental microbiology 52, 1331–9.
Boukari, I., Putaux, J.-L., Cathala, B., Barakat, A., Saake, B., Rémond, C., O’Donohue, M., Chabbert, B., 2009. In vitro model assemblies to study the impact of lignin-carbohydrate interactions on the enzymatic conversion of xylan. Biomacromolecules 10, 2489–98. doi:10.1021/bm9004518
Branca, C., Giudicianni, P., Di Blasi, C., 2003. GC/MS characterization of liquids generated from low-temperature pyrolysis of wood. Industrial & engineering chemistry research 42, 3190–3202. doi:10.1021/ie030066d
Broust, F., Girard, P., Van de Steen, L., 2008. Biocarburants de seconde génération. Techniques de l’ingénieur 110, 1–13.
Brown, D., Li, Y., 2013. Solid state anaerobic co-digestion of yard waste and food waste for biogas production. Bioresource Technology 127, 275–280. doi:10.1016/j.biortech.2012.09.081
Brudecki, G., Cybulska, I., Rosentrater, K., 2013. Integration of extrusion and clean fractionation processes as a pre-treatment technology for prairie cordgrass. Bioresource technology 135, 672–682.
Brulé, M., 2014. The effect of enzyme additives on the anaerobic digestion of energy crops. Universität Hohenheim Landesanstalt für Agrartechnik und Bioenergie.
Brummeler, E. te., Koster, I.W., 1990. Enhancement of dry anaerobic batch digestion of the organic fraction of municipal solid waste by an aerobic pretreatment step. Biological Wastes 31, 199–210. doi:10.1016/0269-7483(90)90159-P
Brummeler, E.T., Aarnink, M.M.J., Koster, I.W., 1992. Dry anaerobic digestion of solid organic waste in a biocel reactor at pilot-plant scale. Water Science and Technology 25, 301–310.
Buffière, P., Bayard, R., Germain, P., 2009. Freins et développements de la filière biogaz : les besoins en recherche et développement 1–135.
Bule, M., Gao, A., Chen, S., 2013. Advanced Methods for Sugar Production from Lignocellulosic Biomass and Fermenting Sugars to Microbial Lipids.
Burlat, V., Ambert, K., Ruel, K., Joseleau, J.-P., 1997. Relationship between the nature of lignin and the morphology of degradation performed by white-rot fungi. Plant physiology and biochemistry 35, 645–654.
Butler, E., Devlin, G., Meier, D., McDonnell, K., 2013. Characterisation of spruce, salix, miscanthus and wheat straw for pyrolysis applications. Bioresource Technology 131, 202–209. doi:10.1016/j.biortech.2012.12.013
Buurman, P., Peterse, F., Martin, G.A., 2007. Soil organic matter chemistry in allophanic soils : a pyrolysis-GC / MS study of a Costa Rican Andosol catena. European Journal of Soil Science 1330–1347. doi:10.1111/j.1365-2389.2007.00925.x
Callaghan, F.J., Wase, D. a J., Thayanithy, K., Forster, C.F., 2002. Continuous co-digestion of cattle slurry with fruit and vegetable wastes and chicken manure. Biomass and Bioenergy 22, 71–77. doi:10.1016/S0961-9534(01)00057-5

220
Camarero, S., Bocchini, P., Galletti, G.., Martınez, M.J., Martınez, A.T., 2001. Compositional changes of wheat lignin by a fungal peroxidase analyzed by pyrolysis-GC-MS. Journal of Analytical and Applied Pyrolysis 58-59, 413–423. doi:10.1016/S0165-2370(00)00115-7
Camarero, S., Bocchini, P., Galletti, G.C., Martínez, A.T., 1999. Pyrolysis-gas chromatography/mass spectrometry analysis of phenolic and etherified units in natural and industrial lignins. Rapid Communications in Mass Spectrometry 13, 630–636. doi:10.1002/(SICI)1097-0231(19990415)13:7<630::AID-RCM535>3.0.CO;2-5
Camarero, S., Galletti, G.C., Martinez, a. T., 1994. Preferential degradation of phenolic lignin units by two white rot fungi. Applied and Environmental Microbiology 60, 4509–4516.
Cangelosi, G. a, Meschke, J.S., 2014. Dead or Alive: Molecular Assessment of Microbial Viability. Applied and environmental microbiology 80, 5884–5891. doi:10.1128/AEM.01763-14
Capelari, M., Zadražil, F., 1997. Lignin degradation and In vitro digestibility of wheat straw treated with Brazilian tropical species of white rot fungi. Folia Microbiologica 42, 481–487. doi:10.1007/BF02826558
Carlson, T.R., Tompsett, G.A., Conner, W.C., Huber, G.W., 2009. Aromatic Production from Catalytic Fast Pyrolysis of Biomass-Derived Feedstocks. Top Catal 52, 241–252. doi:10.1007/s11244-008-9160-6
Carlsson, M., Lagerkvist, A., Morgan-sagastume, F., 2012. The effects of substrate pre-treatment on anaerobic digestion systems : A review. Waste Management 32, 1634–1650. doi:10.1016/j.wasman.2012.04.016
Carrere, H., Passos, F., Antonopoulou, G., Rouches, E., Affes, R., Battimelli, A., Ferrer, I., Steyer, J.P., Lyberatos, G., 2014. Enhancement of anaerobic digestion performance: which pretreatment for which waste?, in: 5th International Conference on Engineering for Waste and Biomass Valorisation (WasteEng14). Rio de Janeiro.
Carvalheiro, F., Duarte, L.C., Gírio, F.M., 2008. Hemicellulose biorefineries : a review on biomass pretreatments. Journal of Scientific and Industrial Research 67, 849–864.
Castillon, P., Colomb, B., Decroux, J., Diab, M., Fardeau, J.C., Laurent, F., Masse, J., Plet, P., Villemin, P., 1993. Aide au diagnostic et à la prescription de la fertilisation phosphatée et potassique des grandes cultures, Comité Français d’Etude et de Developpement de la Fertilisation Raisonnée (COMIFER), Paris.
Ceres, I., 2007. CARBOHYDRATES: The More Carbs the Better [WWW Document]. URL http://www.ceres.net/aboutus/AboutUs-Biofuels-Carbo.html (accessed 2.1.13).
Chandler, J.A., Jewell, W.J., 1980. Predicting methane fermentation biodegradability. Solar Energy Research Institute.
Chang, V.S., Nagwani, M., Holtzapple, M.T., 1998. Lime Pretreatment of Crop Residues Bagasse and Wheat Straw. Applied Biochemistry and Biotechnology 74, 135–159.
Chavez-Vazquez, M., Bagley, D.M., 2002. Evaluation of the performance of different anaerobic digestion technologies for solid waste treatment, in: ASCE Environmental Engineering.
Chen, G.C., Johnson, B.R., 1983. Improved colorimetric determination of cell wall chitin in wood decay fungi. Applied and environmental microbiology 46, 13–16.
Chen, X., Yan, W., Sheng, K., Sanati, M., 2014. Comparison of high-solids to liquid anaerobic co-digestion of food waste and green waste. Bioresource Technology 154, 215–221. doi:10.1016/j.biortech.2013.12.054
Chen, Y., Cheng, J.J., Creamer, K.S., 2008. Inhibition of anaerobic digestion process: A review. Bioresource Technology 99, 4044–4064. doi:10.1016/j.biortech.2007.01.057
Cheung, P.C.K., 1997. Dietary fibre content and composition of some edible fungi determined by two methods of analysis. Journal of the Science of Food and Agriculture 73, 255–260. doi:10.1002/(SICI)1097-0010(199702)73:2<255::AID-JSFA723>3.0.CO;2-U
Chiavari, G., Galletti, G., 1992. Pyrolysis-gas chromatography / mass spectrometry of amino acids. Journal of analytical and applied pyrolysis 24, 123–137.
Chimphango, A.F. a, van Zyl, W.H., Görgens, J.F., 2012. Isolation, characterization and enzymatic modification of water soluble xylans from Eucalyptus grandis wood and sugarcane bagasse. Journal of Chemical Technology and Biotechnology 87, 1419–1429. doi:10.1002/jctb.3761
221
Chynoweth, D.P., Turick, C.E., Owens, J.M., Jerger, D.E., Peck, M.W., 1993. Biochemical methane potential of biomass and waste feedstocks. Biomass and Bioenergy 5, 95–111.
Cohen, R., Persky, L., Hadar, Y., 2002. Biotechnological applications and potential of wood-degrading mushrooms of the genus Pleurotus. Applied microbiology and biotechnology 58, 582–94. doi:10.1007/s00253-002-0930-y
Cosgrove, D.J., 2005. Growth of the plant cell wall. Nature reviews molecular cell biology 6, 850–61. doi:10.1038/nrm1746
Cui, Z., Shi, J., Li, Y., 2011. Solid-state anaerobic digestion of spent wheat straw from horse stall. Bioresource Technology 102, 9432–9437. doi:10.1016/j.biortech.2011.07.062
Cui, Z., Shi, J., Wan, C., Li, Y., 2012. Comparison of alkaline- and fungi-assisted wet-storage of corn stover. Bioresource technology 109, 98–104. doi:10.1016/j.biortech.2012.01.037
Currie, H. a, Perry, C.C., 2007. Silica in plants: biological, biochemical and chemical studies. Annals of botany 100, 1383–9. doi:10.1093/aob/mcm247
D’Annibale, A., Crestini, C., Vinciguerra, V., Sermanni, G.G., 1998. The biodegradation of recalcitrant effluents from an olive mill by a white-rot fungus 61, 209–218.
Dashtban, M., Schraft, H., Syed, T. a, Qin, W., 2010. Fungal biodegradation and enzymatic modification of lignin. International journal of biochemistry and molecular biology 1, 36–50.
De Baere, L., 2000. Worldwide state-of-the-art of anaerobic digestion of solid waste. Water Science & Technology 41, 283–290.
De la Rosa, J.M., González-Pérez, J. a., González-Vázquez, R., Knicker, H., López-Capel, E., Manning, D. a C., González-Vila, F.J., 2008. Use of pyrolysis/GC-MS combined with thermal analysis to monitor C and N changes in soil organic matter from a Mediterranean fire affected forest. Catena 74, 296–303. doi:10.1016/j.catena.2008.03.004
De Souza, D.F., Tychanowicz, G.K., De Souza, C.G.M., Peralta, R.M., 2006. Co-production of ligninolytic enzymes by Pleurotus pulmonarius on wheat bran solid state cultures. Journal of Basic Microbiology 46, 126–134. doi:10.1002/jobm.200510014
del Río, J.C., Gutiérrez, A., Martínez, A.T., 2004. Identifying acetylated lignin units in non-wood fibers using pyrolysis-gas chromatography/mass spectrometry. Rapid communications in mass spectrometry : RCM 18, 1181–1185. doi:10.1002/rcm.1457
del Río, J.C., Rencoret, J., Marques, G., Gutiérrez, A., Ibarra, D., Santos, J.I., Jiménez-Barbero, J., Zhang, L., Martínez, A.T., 2008. Highly acylated (acetylated and/or p-coumaroylated) native lignins from diverse herbaceous plants. Journal of agricultural and food chemistry 56, 9525–34. doi:10.1021/jf800806h
Dhouib, A., Aloui, F., Hamad, N., Sayadi, S., 2006. Pilot-plant treatment of olive mill wastewaters by Phanerochaete chrysosporium coupled to anaerobic digestion and ultrafiltration. Process Biochemistry 41, 159–167. doi:10.1016/j.procbio.2005.06.008
Díez, V.A., Alvarez, A., 2001. Compositional and nutritional studies on two wild edible mushrooms from northwest Spain. Food Chemistry 75, 417–422.
Dignac, M.F., Houot, S., Derenne, S., 2006. How the polarity of the separation column may influence the characterization of compost organic matter by pyrolysis-GC/MS. Journal of Analytical and Applied Pyrolysis 75, 128–139. doi:10.1016/j.jaap.2005.05.001
Dignac, M.-F., Houot, S., Francou, C., Derenne, S., 2005. Pyrolytic study of compost and waste organic matter. Organic Geochemistry 36, 1054–1071. doi:10.1016/j.orggeochem.2005.02.007
Dinis, M. j, 2009. Modification of wheat straw lignin by solid state fermentation with white-rot fungi. doi:10.1016/j.biortech.2009.04.036
Dinis, M.J., Bezerra, R.M.F., Nunes, F., Dias, A. a, Guedes, C. V, Ferreira, L.M.M., Cone, J.W., Marques, G.S.M., Barros, A.R.N., Rodrigues, M. a M., 2009. Modification of wheat straw lignin by solid state fermentation with white-rot fungi. Bioresource technology 100, 4829–35. doi:10.1016/j.biortech.2009.04.036

222
Dongyan, Y., Xiujin, L., Zhijian, G., YongWu, W., 2003. Improving biogas production of corn stalk through chemical and biological pretreatment : a preliminary comparison study. Transactions of the Chinese Society of Agricultural Engineering 16, 209–213.
Dorado, J., van Beek, T.A., Claassen, F.W., Sierra-Alvarez, R., 2001. Degradation of lipophilic wood extractive constituents in Pinus sylvestris by the white-rot fungi Bjerkandera sp. and Trametes versicolor. Wood Science and Technology 35, 117–125. doi:10.1007/s002260000077
Duan, N., Dong, B., Wu, B., Dai, X., 2012. High-solid anaerobic digestion of sewage sludge under mesophilic conditions: Feasibility study. Bioresource Technology 104, 150–156. doi:10.1016/j.biortech.2011.10.090
Duménil, G., Mattei, G., Sergent, M., Bertrand, J.C., Laget, M., Phan-Tan-Luu, R., 1988. Application of a Doehlert experimental design to the optimization of microbial degradation of crude oil in sea water by continuous culture. Applied Microbiology and Biotechnology 27, 405–409. doi:10.1007/BF00251777
Eggeling, L., 1983. Lignin - an exceptional biopolymer. . . and a rich resource? Trends in biotechnology 1, 123–127.
Ehimen, E. a., Sun, Z.F., Carrington, C.G., Birch, E.J., Eaton-Rye, J.J., 2011. Anaerobic digestion of microalgae residues resulting from the biodiesel production process. Applied Energy 88, 3454–3463. doi:10.1016/j.apenergy.2010.10.020
Ehrlich, P.R., Ehrlich, A.H., Daily, G.C., 1993. Food security, population and environment. Population and development review 1–32.
Eikenes, M., Hietala, A.M., Alfredsen, G., Fossdal, C.G., Solheim, H., 2005. Comparison of quantitative real-time PCR, chitin and ergosterol assays for monitoring colonization of Trametes versicolor in birch wood. Holzforschung 59, 568–573. doi:10.1515/HF.2005.093
Engels, F.M., 1989. Some properties of cell wall layers determining ruminant digestion, in: Physico-Chemical Characterisation of Plant Residues for Industrial and Feed Use. Springer, pp. 80–87.
Eriksson, K.-E.L., Blanchette, R.A., Ander, P., 1990. Microbial and enzymatic degradation of wood and wood components. Springer-Verlag.
Fahmi, R., Bridgwater, a. V., Thain, S.C., Donnison, I.S., Morris, P.M., Yates, N., 2007. Prediction of Klason lignin and lignin thermal degradation products by Py-GC/MS in a collection of Lolium and Festuca grasses. Journal of Analytical and Applied Pyrolysis 80, 16–23. doi:10.1016/j.jaap.2006.12.018
Fdez-Güelfo, L. a., Álvarez-Gallego, C., Sales Márquez, D., Romero García, L.I., 2011. Biological pretreatment applied to industrial organic fraction of municipal solid wastes (OFMSW): Effect on anaerobic digestion. Chemical Engineering Journal 172, 321–325. doi:10.1016/j.cej.2011.06.010
Feijoo, G., Vidal, G., Moreira, M.T., Méndez, R., Lema, J.M., 1995. Degradation of high molecular weight compounds of Kraft pulp mill effluents by a combined treatment with fungi and bacteria. Biotechnology Letters 17, 1261–1266. doi:10.1007/BF00128398
Ficior, D., Indrea, D., Apahidean, A.S., Apahidean, M., Rodica, P., Moldovan, Z., Măniuţiu, D., Rodica, G., Paven, I., 2006. Importance of substrat dizinfection on oyster mushroom (Pleurotus sp.) culture. Notulae Botanicae Horti Agrobotanici Cluj-Napoca 34, 48–53.
Fidalgo, M.L., Terron, M.C., Martinez, A.T., Gonzalez, A.E., Gonzalez-Vila, F.J., Galletti, G.C., 1993. Comparative study of fractions from alkaline extraction of wheat straw through chemical degradation, analytical pyrolysis, and spectroscopic techniques. Journal of Agricultural and Food Chemistry 41, 1621–1626. doi:10.1021/jf00034a019
Forster-Carneiro, T., Pérez, M., Romero, L.I., 2008. Influence of total solid and inoculum contents on performance of anaerobic reactors treating food waste. Bioresource Technology 99, 6994–7002. doi:10.1016/j.biortech.2008.01.018
Fountoulakis, M.S., Dokianakis, S.N., Kornaros, M.E., Aggelis, G.G., Lyberatos, G., 2002. Removal of phenolics in olive mill wastewaters using the white-rot fungus Pleurotus ostreatus. Water research 36, 4735–44.
Fourré, G., Sabatier, R., Sabatier, R., 1990. Dernières nouvelles des champignons. G. Fourré.
FranceAgrimer, 2012. L’oservatoire national des ressources en biomasse - Évaluation des ressources disponibles en France. Les Etudes de FranceAgriMer 92.

223
Frigon, J.-C., Guiot, S.R., 2010. Biomethane production from starch and lignocellulosic crops: a comparative review. Biofuels, Bioproducts and Biorefining 4, 447–458. doi:10.1002/bbb
Frigon, J.-C., Mehta, P., Guiot, S.R., 2012. Impact of mechanical, chemical and enzymatic pre-treatments on the methane yield from the anaerobic digestion of switchgrass. Biomass and Bioenergy 36, 1–11. doi:10.1016/j.biombioe.2011.02.013
Galletti, G.C., Bocchini, P., 1995. Pyrolysis/gas chromatography/mass spectrometry in lignocellulose. Rapid Communication in Mass Spectrometry 9, 815–26.
Gamble, G.R., Akin, D.E., Makkar, H.P., Becker, K., 1996. Biological degradation of tannins in sericea lespedeza ( Lespedeza cuneata) by the white rot fungi Ceriporiopsis subvermispora and Cyathus stercoreus analyzed by solid-state 13C nuclear magnetic resonance spectroscopy . Applied and environmental microbiology 62, 3600–3604.
Gaunt, J.L., Lehmann, J., 2008. Energy balance and emissions associated with biochar sequestration and pyrolysis bioenergy production. Environmental Science and Technology 42, 4152–4158. doi:10.1021/es071361i
Ge, X., Matsumoto, T., Keith, L., Li, Y., 2015. Fungal Pretreatment of Albizia Chips for Enhanced Biogas Production by Solid-State Anaerobic Digestion.
Ghosh, A., Bhattacharyya, B.C., 1999. Biomethanation of white rotted and brown rotted rice straw. Bioprocess Engineering 20, 297. doi:10.1007/s004490050594
Ghosh, S., Henry, M.P., Christopher, R.W., 1985. Hemicellulose Conversion by Anaerobic Digestion. Biomass 6, 257–269.
Giger S., 1985. Revue sur les méthodes de dosage de la lignine utilisées en alimentation animale. Annales de Zootechnie 34, 85–122.
Gil-Serna, J., Vázquez, C., García Sandino, F., Márquez Valle, A., González-Jaén, M.T., Patiño, B., 2014. Evaluation of growth and ochratoxin A production by Aspergillus steynii and Aspergillus westerdijkiae in green-coffee based medium under different environmental conditions. Food Research International 61, 127–131. doi:10.1016/j.foodres.2014.01.058
Gimbert, I., Raouche, S., Sigoillot, J.-C., Zhou, S., Carrere, H., Rouches, E., 2014. Brevet FR 1460472 : Prétraitement de biomasses lignocellulosiques par des champignons filamenteux pour la production de bioénergies.
Goff, B.M., Murphy, T., Moore, K.J., 2012. Comparison of common lignin methods and modifications on forage and lignocellulosic biomass materials. Journal of the Science of Food and Agriculture 91, 751–758. doi:10.1002/jsfa.4637
Gómez, X., Cuetos, M.J., Cara, J., Morán, a., García, a. I., 2006. Anaerobic co-digestion of primary sludge and the fruit and vegetable fraction of the municipal solid wastes. Conditions for mixing and evaluation of the organic loading rate. Renewable Energy 31, 2017–2024. doi:10.1016/j.renene.2005.09.029
Grabber, J.H., 2005. How Do Lignin Composition, Structure, and Cross-Linking Affect Degradability? A Review of Cell Wall Model Studies. Crop Science 45, 820. doi:10.2135/cropsci2004.0191
Guo, X.M., Trably, E., Latrille, E., Carrere, H., Steyer, J., 2010. Hydrogen production from agricultural waste by dark fermentation : A review. International Journal of Hydrogen Energy 35, 10660–10670. doi:10.1016/j.ijhydene.2010.03.008
Gutiérrez, A., del Río, J.C., Rencoret, J., Ibarra, D., Martínez, A.T., 2006. Main lipophilic extractives in different paper pulp types can be removed using the laccase-mediator system. Applied microbiology and biotechnology 72, 845–51. doi:10.1007/s00253-006-0346-1
Gutierrez, A., Martinez, M.J., Almendros, G., Gonzalezvila, F.J., Martinez, a T., 1995. Hyphal-Sheath Polysaccharides in Fungal Deterioration. Science of the Total Environment 167, 315–328. doi:10.1016/0048-9697(95)04592-O
Gutiérrez, A., Río, J.C., Martínez, M.J., Martínez, A.T., 1999. Fungal Degradation of Lipophilic Extractives in Eucalyptus globulus Wood. Applied and environmental microbiology 65, 1367–1371.

224
Ha, H.-C., Honda, Y., Watanabe, T., Kuwahara, M., 2001. Production of manganese peroxidase by pellet culture of the lignin-degrading basidiomycete, Pleurotus ostreatus. Applied Microbiology and Biotechnology 55, 704–711. doi:10.1007/s002530100653
Hadar, Y., Cohen-arazi, E., 1986. Chemical Composition of the Edible Mushroom Pleurotus ostreatus Produced by Fermentation. Applied and environmental microbiology 51, 1352–1354.
Hadar, Y., Kerem, Z., Gorodecki, B., Ardon, O., 1992. Utilization of lignocellulosic waste by the edible mushroom, Pleurotus. Biodegradation 3, 189–205. doi:10.1007/BF00129083
Hallac, B.B., Sannigrahi, P., Pu, Y., Ray, M., Murphy, R.J., Ragauskas, A.J., 2009. Biomass characterization of Buddleja davidii: a potential feedstock for biofuel production. Journal of agricultural and food chemistry 57, 1275–1281.
Hammel, K.E., 1997. Fungal Degradation of Lignin, in: Cadisch, G., Giller, K. (Eds.), Plant Litter Quality and Decomposition. pp. 33–47.
Han, G., Deng, J., Zhang, S., Bicho, P., Wu, Q., 2010. Effect of steam explosion treatment on characteristics of wheat straw. Industrial Crops and Products 31, 28–33. doi:10.1016/j.indcrop.2009.08.003
Han, Y.W., Lee, J.S., Anderson, a W., 1975. Chemical composition and digestibility of ryegrass straw. Journal of agricultural and food chemistry 23, 928–41.
Hatakka, A., 1983. Pretreatment of Wheat Straw by White-Rot Fungi for Enzymic Saccharification of Cellulose. European Journal of Applied Microbiology and Biotechnology 18, 350–357.
Hatakka, A., 1994. Lignin-modifying enzymes from selected white-rot fungi: production and role from in lignin degradation. FEMS Microbiology Reviews 13, 125–135. doi:10.1111/j.1574-6976.1994.tb00039.x
Hatakka, A.I., Uusi-Rauva, A.K., 1983. Degradation of 14C-labelled poplar wood lignin by selected white-rot fungi. European Journal of Applied Microbiology and Biotechnology 17, 235–242. doi:10.1007/BF00510422
Hatfield, R.D., Jung, H.G., Ralph, J., Buxton, D.R., Weimer, P.J., 1994. A Comparison of the Insoluble Residues Produced by the Klason Lignin and Acid Detergent Lignin Procedures. Journal of the Science of Food and Agriculture 65, 51–58.
Healy, J.B., Young, L.Y., 1979. Anaerobic Biodegradation of Eleven Aromatic Compounds Anaerobic to Methane. Applied and environmental microbiology 38, 84–89.
Hedges, J.I., Ertel, J.R., 1982. Characterization of lignin by gas capillary chromatography of cupric oxide oxidation products. Analytical Chemistry 54, 174–178.
Hendriks, A.T.W.M., Zeeman, G., 2009. Pretreatments to enhance the digestibility of lignocellulosic biomass. Bioresource Technology 100, 10–18. doi:10.1016/j.biortech.2008.05.027
Hernandez, J.E., Edyvean, R.G.J., 2008. Inhibition of biogas production and biodegradability by substituted phenolic compounds in anaerobic sludge. Journal of hazardous materials 160, 20–8. doi:10.1016/j.jhazmat.2008.02.075
Herrmann, C., Heiermann, M., Idler, C., 2011. Effects of ensiling, silage additives and storage period on methane formation of biogas crops. Bioresource technology 102, 5153–61. doi:10.1016/j.biortech.2011.01.012
Hölker, U., Höfer, M., Lenz, J., 2004. Biotechnological advantages of laboratory-scale solid-state fermentation with fungi. Applied Microbiology and Biotechnology 64, 175–186. doi:10.1007/s00253-003-1504-3
Hu, Z.-H., Yu, H.-Q., 2006. Anaerobic digestion of cattail by rumen cultures. Waste management 26, 1222–8. doi:10.1016/j.wasman.2005.08.003
Imamura, H., 1989. Contribution of Extractives to Wood Characteristics, in: Rowe, J. (Ed.), Natural Products of Woody Plants SE - 21, Springer Series in Wood Science. Springer Berlin Heidelberg, pp. 843–860. doi:10.1007/978-3-642-74075-6_21
INRA, 2013. Ressources génétiques et biologiques [WWW Document]. Microorganismes : centre de ressources biologiques et collections. URL http://www.inra.fr/crb-cirm/ (accessed 1.1.15).
Isroi, Millati, R., Syamsiah, S., Niklasson, C., Cahyanto, M.N., Lundquist, K., Taherzadeh, M.J., 2011. Biological pretreatment of lignocelluloses with white-rot fungi and its applications: a review. BioResources 6, 5224–5259.

225
Jalč, D., 2002. Straw enrichment for fodder production by fungi, in: Kempken, F., Bennet, J.W. (Eds.), The Mycota. Berlin, pp. 19–38.
Jalč, D., Siroka, P., Ceresnakova, Z., 1997. Effect of six species of white-rot basidiomycetes on the chemical composition and rumen degradability of wheat straw. Journal of General and Applied Microbiology 43, 133–137.
Jȩdrczak, A., Królik, D., 2007. Influence of paper particle size on the efficiency of digestion process. Environment Protection Engineering 33, 147–155.
Jeffries, T.W., 1987. Physical , chemical and biochemical considerations in the biological degradation of wood, in: Kennedy, J.F., Phillips, G.O., William, P.A. (Eds.), Wood and Cellulosics: Industrial Utilisation, Biotechnology, Structure and Properties. pp. 213–230.
Jeffries, T.W., Choi, S., Kirk, T.K., 1981. Nutritional Regulation of Lignin Degradation by Phanerochaete chrysosporium. Appl. Envir. Microbiol. 42, 290–296.
Jha, A.K., Li, J., Nies, L., Zhang, L., 2011. Research advances in dry anaerobic digestion process of solid organic wastes. African Journal of Biotechnology 10, 14242–14253. doi:10.5897/AJB11.1277
Jimenez, J., Aemig, Q., Doussiet, N., Steyer, J., Patureau, D., 2015. A new organic matter fractionation methodology for organic wastes : bioaccessibility and complexity characterization for treatment optimization. BIORESOURCE TECHNOLOGY. doi:10.1016/j.biortech.2015.07.037
Jimenez, J., Gonidec, E., Cacho Rivero, J.A., Latrille, E., Vedrenne, F., Steyer, J.-P., 2014. Prediction of anaerobic biodegradability and bioaccessibility of municipal sludge by coupling sequential extractions with fluorescence spectroscopy: towards ADM1 variables characterization. Water research 50, 359–72. doi:10.1016/j.watres.2013.10.048
Jong, E. De, Field, J.A., Bent, J.A.M. De, 1992. Manganese-inhibited peroxidase from the white-rot fungus Bjerkandera sp . BOS 55 299, 107–110.
Jung, H.G., Ralph, J., Hatfield, R.D., 1991. Degradability of phenolic acid-hemicellulose esters: A model system. Journal of the Science of Food and Agriculture 56, 469–478. doi:10.1002/jsfa.2740560407
Jung, H.G., Valdez, F.R.J., Abad, A.R., Blanchette, R.A., Hatfield, R., 1992. Effect of White Rot Basidiomycetes on Chemical Composition and In Vitro Digestibility of Oat Straw and Alfalfa Stems. Journal of Animal Science 70, 1928–1935.
Kalač, P., 2009. Chemical composition and nutritional value of European species of wild growing mushrooms: A review. Food Chemistry 113, 9–16. doi:10.1016/j.foodchem.2008.07.077
Kalmış, E., Sargın, S., 2004. Cultivation of two Pleurotus species on wheat straw substrates containing olive mill waste water. International Biodeterioration & Biodegradation 53, 43–47. doi:10.1016/j.ibiod.2003.08.002
Kalyuzhnyi, S., Veeken, A., Hamelers, B., 2000. Two-particle model of anaerobic solid state fermentation. Water Science & Technology 41, 43–50.
Kamra, D.N., Zadražil, F., 1986. Influence of Gaseous Phase , Light and Substrate Pretreatment on Fruit-Body Formation, Lignin Degradation and In Vitro Digestibility of Wheat Straw Fermented with Pleurotus spp . Agricultural wastes 18, 1–17.
Kaparaju, P., Serrano, M., Thomsen, A.B., Kongjan, P., Angelidaki, I., 2009. Bioethanol, biohydrogen and biogas production from wheat straw in a biorefinery concept. Bioresource technology 100, 2562–8. doi:10.1016/j.biortech.2008.11.011
Karim, K., Hoffmann, R., Klasson, K.T., Al-Dahhan, M.H., 2005. Anaerobic digestion of animal waste: Effect of mode of mixing. Water Research 39, 3597–3606. doi:10.1016/j.watres.2005.06.019
Karthikeyan, O.P., Visvanathan, C., 2013. Bio-energy recovery from high-solid organic substrates by dry anaerobic bio-conversion processes: A review. Reviews in Environmental Science and Biotechnology 12, 257–284. doi:10.1007/s11157-012-9304-9
226
Karunanandaa, K., Fales, S.L., Varga, G.A., Royse, D.J., 1992. Chemical composition and biodegradability of crop residues colonized by white-rot fungi. Journal of the Science of Food and Agriculture 60, 105–112. doi:10.1002/jsfa.2740600117
Karunanandaa, K., Varga, G.A., 1996a. Colonization of rice straw by white-rot fungi (Cyathus stercoreus): Effect on ruminal fermentation pattern, nitrogen metabolism, and fiber utilization during continuous culture. Animal Feed Science and Technology 61, 1–16. doi:10.1016/0377-8401(96)00958-3
Karunanandaa, K., Varga, G.A., 1996b. Colonization of crop residues by white-rot fungi : cell wall monosaccharides, phenolic acids, ruminal fermentation characteristics and digestibility of cell wall fiber components in vitro. Animal Feed Science and Technology 63, 273–288.
Karunanandaa, K., Varga, G.A., Akin, D.E., Rigsby, L.L., Royse, D.J., 1995. Botanical fractions of rice straw colonized by white-rot fungi: changes in chemical composition and structure. Animal Feed Science and Technology 55, 179–199. doi:10.1016/0377-8401(95)00805-W
Khazaal, K., Dentinho, M.T., Ribeiro, J.M., Ørskov, E.R., 2010. A comparison of gas production during incubation with rumen contents in vitro and nylon bag degradability as predictors of the apparent digestibility in vivo and the voluntary intake of hays. Animal Production 57, 105–112. doi:10.1017/S0003356100006668
Khiyami, M. a, Pometto, A.L., Kennedy, W.J., 2006. Ligninolytic enzyme production by Phanerochaete chrysosporium in plastic composite support biofilm stirred tank bioreactors. Journal of agricultural and food chemistry 54, 1693–8. doi:10.1021/jf051424l
Kim, S.H., Kafle, G.K., 2010. Effective Treatment of Swine Manure with Chinese Cabbage Silage through Two Serial Anaerobic Digestion. Journal of Biosystems Engineering 35, 53–63.
Kirk, T.K., Farrell, R.L., 1987. Enzymatic “combustion”: the microbial degradation of lignin. Annual review of microbiology 41, 465–505. doi:10.1146/annurev.mi.41.100187.002341
Kirk, T.K., Schultz, E., Connors, W.J., Lorenz, L.F., Zeikus, J.G., 1978. Influence of Culture Parameters on Lignin Metabolism by Phanerochaete chrysosporium. Archives of Microbiology 285, 277–285.
Kishimoto, T., Chiba, W., Saito, K., Fukushima, K., Uraki, Y., Ubukata, M., 2010. Influence of syringyl to guaiacyl ratio on the structure of natural and synthetic lignins. Journal of Agricultural and Food Chemistry 58, 895–901. doi:10.1021/jf9035172
Kong, F., Engler, C., Soltes, E., 1992. Effects of cell-wall acetate, xylan backbone, and lignin on enzymatic hydrolysis of aspen wood. Applied Biochemistry and Biotechnology 34-35, 23–35. doi:10.1007/BF02920531
Krause, D.O., Denman, S.E., Mackie, R.I., Morrison, M., Rae, A.L., Attwood, G.T., McSweeney, C.S., 2003. Opportunities to improve fiber degradation in the rumen: microbiology, ecology, and genomics. FEMS Microbiology Reviews 27, 663–693. doi:10.1016/S0168-6445(03)00072-X
Kubikova, J., Zemann, A., Krkoska, P., Bobleter, O., 1996. ABSTRACT Application : TAPPI JOURNAL 79, 163–169.
Kuroda, K.I., Nishimura, N., Izumi, A., Dimmel, D.R., 2002. Pyrolysis of lignin in the presence of tetramethylammonium hydroxide: A convenient method for S/G ratio determination. Journal of Agricultural and Food Chemistry 50, 1022–1027. doi:10.1021/jf011198p
Kusch, S., Oechsner, H., Jungbluth, T., 2008. Biogas production with horse dung in solid-phase digestion systems. Bioresource Technology 99, 1280–1292. doi:10.1016/j.biortech.2007.02.008
Kusch, S., Oechsner, H., Jungbluth, T., 2012. Effect of various leachate recirculation strategies on batch anaerobic digestion of solid substrates. International Journal of Environment and Waste Management 9, 69. doi:10.1504/IJEWM.2012.044161
Kusch, S., Schäfer, W., Kranert, M., 2011. Dry digestion of organic residues, in: Integrated Waste Management - Volume I. pp. 115–134. doi:10.5772/16398
Kuyper, M., Toirkens, M.J., Diderich, J.A., Winkler, A.A., Dijken, J.P. Van, Pronk, J.T., 2005. Evolutionary engineering of mixed-sugar utilization by a xylose-fermenting Saccharomyces cerevisiae strain. FEMS Yeast Research 5, 925–934. doi:10.1016/j.femsyr.2005.04.004

227
Lahav, O., Morgan, B.E., 2004. Titration methodologies for monitoring of anaerobic digestion in developing countries - A review. Journal of Chemical Technology and Biotechnology 79, 1331–1341. doi:10.1002/jctb.1143
Lapierre, C., 2010. Determining Lignin Structure by Chemical Degradations, in: ‘�ƒLignin and Lignans: Advances in Chemistry. Heitner, Cyril Dimmel, Donald R. Schimidt, John a., p. 629.
Lapierre, C., Monties, B., Rolando, C., 1988. Thioacidolysis of diazomethane-methylated Pine compression wood and Wheat straw in situ lignins 42, 409–411.
Laskin, A.I., Bennett, W.J., Gadd, G.M., 1992. ADVANCES IN APPLIED MICROBIOLOGY, Volume 37.
Le Troedec, M., Sedan, D., Peyratout, C., Bonnet, J.P., Smith, A., Guinebretiere, R., Gloaguen, V., Krausz, P., 2008. Influence of various chemical treatments on the composition and structure of hemp fibres. Composites Part A: Applied Science and Manufacturing 39, 514–522.
Lechner, B.E., Papinutti, V.L., 2006. Production of lignocellulosic enzymes during growth and fruiting of the edible fungus Lentinus tigrinus on wheat straw. Process Biochemistry 41, 594–598. doi:10.1016/j.procbio.2005.08.004
Lee, J., 1997. Biological conversion of lignocellulosic biomass to ethanol. Journal of biotechnology 56, 1–24.
Lee, J.-W., Gwak, K.-S., Park, J.-Y., Park, M.-J., Choi, D.-H., Kwon, M., Choi, I.-G., 2007. Biological pretreatment of softwood Pinus densiflora by three white rot fungi. Journal of microbiology (Seoul, Korea) 45, 485–91.
Lehtomaki, A., Viinikainen, T., Ronkainen, O., Alen, R., Rintala, J., 2004. Effects of pre-treatments on methane production potential of energy crops and crop residues, in: 10th IWA World Congress on Anaerobic Digestion, Montreal, Canada.
Leonowicz, a, Matuszewska, a, Luterek, J., Ziegenhagen, D., Wojtaś-Wasilewska, M., Cho, N.S., Hofrichter, M., Rogalski, J., 1999. Biodegradation of lignin by white rot fungi. Fungal genetics and biology : FG & B 27, 175–185. doi:10.1006/fgbi.1999.1150
Lesteur, M., Bellon-Maurel, V., Gonzalez, C., Latrille, E., Roger, J.M., Junqua, G., Steyer, J.P., 2010. Alternative methods for determining anaerobic biodegradability: A review. Process Biochemistry 45, 431–440. doi:10.1016/j.procbio.2009.11.018
Lettinga, G., Rebac, S., Zeeman, G., 2001. Challenge of psychrophilic anaerobic wastewater treatment. Trends in Biotechnology 19, 363–370. doi:10.1016/S0167-7799(01)01701-2
Levonen-Munoz, E., Derek, H.B., Daugulis, A.J., 1983. Solid State Fermentation and Fractionation of Oat Straw by Basidiomycetes. European Journal of Applied Microbiology and Biotechnology 18, 120–123.
Li, X., Pang, Y., Zhang, R., 2001. Compositional changes of cottonseed hull substrate during P. ostreatus growth and the effects on the feeding value of the spent substrate. Bioresource Technology 80, 157–161. doi:10.1016/S0960-8524(00)00170-X
Li, Y., Park, S.Y., Zhu, J., 2011. Solid-state anaerobic digestion for methane production from organic waste. Renewable and Sustainable Energy Reviews 15, 821–826. doi:10.1016/j.rser.2010.07.042
Liao, P.H., Lo, K.V., Chieng, S.T., 1984. Effect of liquid—solids separation on biogas production from dairy manure. Energy in Agriculture 3, 61–69. doi:10.1016/0167-5826(84)90005-6
Liers, C., Arnstadt, T., Ullrich, R., Hofrichter, M., 2011. Patterns of lignin degradation and oxidative enzyme secretion by different wood- and litter-colonizing basidiomycetes and ascomycetes grown on beech-wood. FEMS microbiology ecology 78, 91–102. doi:10.1111/j.1574-6941.2011.01144.x
Liew, L.N., Shi, J., Li, Y., 2011. Enhancing the solid-state anaerobic digestion of fallen leaves through simultaneous alkaline treatment. Bioresource Technology 102, 8828–8834. doi:10.1016/j.biortech.2011.07.005
Liew, L.N., Shi, J., Li, Y., 2012. Methane production from solid-state anaerobic digestion of lignocellulosic biomass. Biomass and Bioenergy 46, 125–132. doi:10.1016/j.biombioe.2012.09.014
Lili, M., Biró, G., Sulyok, E., Petis, M., Borbély, J., Tamás, J., 2011. Novel approach on the basis of fos/tac method. Risk Factors for Environment and Food Safety XVII, 713–718.

228
Lim, J.W., Wang, J.-Y., 2013. Enhanced hydrolysis and methane yield by applying microaeration pretreatment to the anaerobic co-digestion of brown water and food waste. Waste management 33, 813–9. doi:10.1016/j.wasman.2012.11.013
Lima, C.F., Barbosa, L.C. a, Marcelo, C.R., Silvério, F.O., Colodette, J.L., 2008. Comparison between analytical pyrolysis and nitrobenzene oxidation for determination of syringyl/guaiacyl ratio in Eucalyptus spp. Lignin. BioResources 3, 701–712.
Lin, C.-Y., 1992. Effect of heavy metals on volatile fatty acid degradation in anaerobic digestion. Water research 26, 177–183.
Lissens, G., Vandevivere, P., De Baere, L., Biey, E.M., Verstrae, W., 2001. Solid waste digestors: process performance and practice for municipal solid waste digestion. Water science and technology : a journal of the International Association on Water Pollution Research 44, 91–102.
Liu, L., Qian, C., Jiang, L., Yu, H., 2014. Direct Three-Dimensional Characterization and Multiscale Visualization of Wheat Straw Deconstruction by White Rot Fungus. Environmental science & technology 48, 9819–9825.
Liyanapathirana, C., Shahidi, F., 2005. Optimization of extraction of phenolic compounds from wheat using response surface methodology. Food Chemistry 93, 47–56. doi:10.1016/j.foodchem.2004.08.050
López, M.J., Elorrieta, M. a, Vargas-García, M.C., Suárez-Estrella, F., Moreno, J., 2002. The effect of aeration on the biotransformation of lignocellulosic wastes by white-rot fungi. Bioresource technology 81, 123–9.
López, M.J., Suárez-Estrella, F., Vargas-García, M.C., López-González, J. a., Verstichel, S., Debeer, L., Wierinck, I., Moreno, J., 2013. Biodelignification of agricultural and forest wastes: Effect on anaerobic digestion. Biomass and Bioenergy 58, 343–349. doi:10.1016/j.biombioe.2013.10.021
López-Abelairas, M., Álvarez Pallín, M., Salvachúa, D., Lú-Chau, T., Martínez, M.J., Lema, J.M., 2013. Optimisation of the biological pretreatment of wheat straw with white-rot fungi for ethanol production. Bioprocess and biosystems engineering 36, 1251–60. doi:10.1007/s00449-012-0869-z
Lossie, U., Pütz, P., 2008. Targeted control of biogas plants with the help of FOS/TAC: Reliable assessment of the fermentation process.
Lu, Q., Li, W.Z., Zhu, X.F., 2009. Overview of fuel properties of biomass fast pyrolysis oils. Energy Conversion and Management 50, 1376–1383. doi:10.1016/j.enconman.2009.01.001
Lu, S.G., Imai, T., Ukita, M., Sekine, M., 2007. Start-up performances of dry anaerobic mesophilic and thermophilic digestions of organic solid wastes. Journal of Environmental Sciences 19, 416–420. doi:10.1016/S1001-0742(07)60069-2
Lu, Y., Wei, X.-Y., Cao, J.-P., Li, P., Liu, F.-J., Zhao, Y.-P., Fan, X., Zhao, W., Rong, L.-C., Wei, Y.-B., Wang, S.-Z., Zhou, J., Zong, Z.-M., 2012. Characterization of a bio-oil from pyrolysis of rice husk by detailed compositional analysis and structural investigation of lignin. Bioresource technology 116, 114–9. doi:10.1016/j.biortech.2012.04.006
Lv, G., Wu, S., 2012. Analytical pyrolysis studies of corn stalk and its three main components by TG-MS and Py-GC/MS. Journal of Analytical and Applied Pyrolysis 97, 11–18. doi:10.1016/j.jaap.2012.04.010
Mackuľak, T., Prousek, J., Švorc, Ľ., Drtil, M., 2012. Increase of biogas production from pretreated hay and leaves using wood-rotting fungi. Chemical Papers 66, 649–653.
Mahinpey, N., Murugan, P., Mani, T., Raina, R., 2009. Analysis of bio-oil, biogas, and biochar from pressurized pyrolysis of wheat straw using a tubular reactor. Energy and Fuels 23, 2736–2742. doi:10.1021/ef8010959
Manu-Tawiah, W., Martin, a M., 1987. Chemical composition of Pleurotus ostreatus mycelial biomass. Food Microbiology 4, 303–310.
Marten, G.C., Barnes, R.F., 1980. Prediction of energy digestibility of forages with in vitro rumen fermentation and fungal enzyme systems. Standardization of analytical methodology for feeds 61–71.
Martin, D.J., 2001. The Site of Reaction in Solid-State Digestion. Process Safety and Environmental Protection 79, 29–37. doi:10.1205/095758201531112

229
Martínez, A.T., Speranza, M., Ruiz-Dueñas, F., Ferreira, P., Camarero, S., Guillén, F., Martínez, M.J., Gutiérrez, A., del Río, J.C., 2005. Biodegradation of lignocellulosics: microbial, chemical, and enzymatic aspects of the fungal attack of lignin. International microbiology : the official journal of the Spanish Society for Microbiology 8, 195–204.
Martinez-Inigo, M.J., Kurek, B., 1997. Oxidative Degradation of Alkali Wheat Straw Lignin by Fungal Lignin Peroxidase, Manganese Peroxidase and Laccase: A Comparative Study. Holzforschung 51, 543–548. doi:10.1515/hfsg.1997.51.6.543
Mata-Alvarez, J., Macé, S., LLabrés, P., 2000. Anaerobic digestion of organic solid wastes. An overview of research achievements and perspectives. Bioresource Technology 74, 3–16.
McAllister, T. a, Bae, H.D., Jones, G. a, Cheng, K.J., 1994. Microbial attachment and feed digestion in the rumen. Journal of animal science 72, 3004–18.
McKendry, P., 2002a. Energy production from biomass (part 2): Conversion technologies. Bioresource Technology 83, 47–54. doi:10.1016/S0960-8524(01)00119-5
McKendry, P., 2002b. Energy production from biomass (part 1): Overview of biomass. Bioresource Technology 83, 37–46. doi:10.1016/S0960-8524(01)00118-3
McSweeney, C.S., Dulieu, A., Bunch, R., 1998. Butyrivibriospp. and Other Xylanolytic Microorganisms From the Rumen have Cinnamoyl Esterase Activity. Anaerobe 4, 57–65. doi:http://dx.doi.org/10.1006/anae.1997.0130
Meier, S., Azcón, R., Cartes, P., Borie, F., Cornejo, P., 2011. Alleviation of Cu toxicity in Oenothera picensis by copper-adapted arbuscular mycorrhizal fungi and treated agrowaste residue. Applied Soil Ecology 48, 117–124. doi:10.1016/j.apsoil.2011.04.005
Menke, K.H., Raab, L., Salewski, A., Steingass, H., Fritz, D., Schneider, W., 1979. The estimation of the digestibility and metabolizable energy content of ruminant feedingstuffs from the gas production when they are incubated with rumen liquor in vitro. The Journal of Agricultural Science 93, 217–222.
Merlin Christy, P., Gopinath, L.R., Divya, D., 2013. A REVIEW ON DECOMPOSITION AS A TECHNOLOGY FOR SUSTAINABLE ENERGY MANAGEMENT. International Journal of Plant, Animal and Environmental sciences 3, 44–50.
Messner, K., Koller, K., Wall, M.B., Akhtar, M., Scott, G.M., 1998. Fungal Treatment of Wood Chips for Chemical Pulping, in: Young, R.A., Akhtar, M. (Eds.), ENVIRONMENTALLY FRIENDLY TECHNOLOGIES FOR THE PULP AND PAPER INDUSTRY. pp. 385–419.
Mester, T., Peña, M., Field, J. a., 1996. Nutrient regulation of extracellular peroxidases in the white rot fungus,Bjerkandera sp. strain BOS55. Applied Microbiology and Biotechnology 44, 778–784. doi:10.1007/BF00178618
Mészáros, E., Jakab, E., Várhegyi, G., 2007. TG/MS, Py-GC/MS and THM-GC/MS study of the composition and thermal behavior of extractive components of Robinia pseudoacacia. Journal of Analytical and Applied Pyrolysis 79, 61–70. doi:10.1016/j.jaap.2006.12.007
Meza, J.C., Sigoillot, J.-C., Lomascolo, A., Navarro, D., Auria, R., 2006. New process for fungal delignification of sugar-cane bagasse and simultaneous production of laccase in a vapor phase bioreactor. Journal of agricultural and food chemistry 54, 3852–8. doi:10.1021/jf053057j
Mihranyan, A., Piñas Llagostera, A., Karmhag, R., Strømme, M., Ek, R., 2004. Moisture sorption by cellulose powders of varying crystallinity. International Journal of Pharmaceutics 269, 433–442. doi:10.1016/j.ijpharm.2003.09.030
Mikiashvili, N., Wasser, S., Nevo, E., Elisashvili, V., 2006. Effects of carbon and nitrogen sources on Pleurotus ostreatus ligninolytic enzyme activity. World Journal of Microbiology and Biotechnology 22, 999–1002. doi:10.1007/s11274-006-9132-6
Mitz, M.A., 1969. The detection of bacteria and viruses in liquids. Annals of the New York Academy of Sciences 158, 651–664.

230
Mohaček-Grošev, V., Božac, R., Puppels, G.J., 2001. Vibrational spectroscopic characterization of wild growing mushrooms and toadstools. Spectrochimica Acta - Part A: Molecular and Biomolecular Spectroscopy 57, 2815–2829. doi:10.1016/S1386-1425(01)00584-4
Mohan, D., Pittman, C.U., Steele, P.H., 2006. Pyrolysis of Wood / Biomass for Bio-oil : A Critical Review. Energy & Fuesl 20, 848–889. doi:10.1021/ef0502397
Moldoveanu, S.C., 1998. Analytical pyrolysis of natural organic polymers. Elsevier.
Moldoveanu, S.C., 2001. Pyrolysis GC/MS, present and future (recent past and present needs). Journal of Microcolumn Separations 13, 102–125. doi:10.1002/mcs.1028
Moletta, R., 2008. La méthanisation, Tec & Doc. ed. Paris.
Möller, K., Müller, T., 2012. Effects of anaerobic digestion on digestate nutrient availability and crop growth: A review. Engineering in Life Sciences 12, 242–257. doi:10.1002/elsc.201100085
Mönch-Tegeder, M., Lemmer, A., Jungbluth, T., Oechsner, H., 2014a. Effects of full-scale substrate pretreatment with a cross-flow grinder on biogas production. Agricultural Engineering International: CIGR Journal 16, 138–147.
Mönch-Tegeder, M., Lemmer, A., Oechsner, H., 2014b. Enhancement of methane production with horse manure supplement and pretreatment in a full-scale biogas process. Energy 73, 523–530. doi:10.1016/j.energy.2014.06.051
Monlau, F., Barakat, A., Steyer, J.P., Carrere, H., 2012a. Comparison of seven types of thermo-chemical pretreatments on the structural features and anaerobic digestion of sunflower stalks. Bioresource technology 120, 241–7. doi:10.1016/j.biortech.2012.06.040
Monlau, F., Barakat, A., Trably, E., Dumas, C., Steyer, J.P., Carrère, H., 2013. Lignocellulosic Materials Into Biohydrogen and Biomethane: Impact of Structural Features and Pretreatment. Critical Reviews in Environmental Science and Technology 43, 260–322.
Monlau, F., Sambusiti, C., Barakat, A., Guo, X.M., Latrille, E., Trably, E., Steyer, J.P., Carrere, H., 2012b. Predictive models of biohydrogen and biomethane production based on the compositional and structural features of lignocellulosic materials. Environmental science & technology 46, 12217–25. doi:10.1021/es303132t
Monlau, F., Sambusiti, C., Barakat, A., Quéméneur, M., Trably, E., Steyer, J.-P., Carrère, H., 2014. Do furanic and phenolic compounds of lignocellulosic and algae biomass hydrolyzate inhibit anaerobic mixed cultures? A comprehensive review. Biotechnology advances 32, 934–951. doi:10.1016/j.biotechadv.2014.04.007
Moreira, M.T., Feijoo, G., Sierra-Alvarez, R., Lema, J., Field, J. a, 1997. Biobleaching of oxygen delignified kraft pulp by several white rot fungal strains. Journal of Biotechnology 53, 237–251. doi:10.1016/S0168-1656(97)01676-3
Moreno-Andrade, I., Buitron, G., 1995. Influence of the origin of the inoculum on the anaerobic biodegradability test. Water Science & Technology 1, 53–59.
Mosier, N., Wyman, C., Dale, B., Elander, R., Lee, Y.Y., Holtzapple, M., Ladisch, M., 2005. Features of promising technologies for pretreatment of lignocellulosic biomass. Bioresource technology 96, 673–86. doi:10.1016/j.biortech.2004.06.025
Motte, J.C., 2013. Digestion anaérobie par voie sèche de résidus lignocellulosiques : Etude dynamique des relations entre paramètres de procédés, caractéristiques du substrat et écosystème microbien. Université de Montpelier II.
Motte, J.-C., Escudié, R., Beaufils, N., Steyer, J.P., Bernet, N., Delgenès, J.-P., Dumas, C., 2014a. Morphological structures of wheat straw strongly impacts its anaerobic digestion. Industrial Crops and Products 52, 695–701. doi:10.1016/j.indcrop.2013.11.038
Motte, J.C., Escudié, R., Bernet, N., Delgenes, J.P., Steyer, J.P., Dumas, C., 2013. Dynamic effect of total solid content, low substrate/inoculum ratio and particle size on solid-state anaerobic digestion. Bioresource Technology 144, 141–148. doi:10.1016/j.biortech.2013.06.057
Motte, J.-C., Escudié, R., Hamelin, J., Steyer, J.-P., Bernet, N., Delgenes, J.-P., Dumas, C., 2014b. Substrate milling pretreatment as a key parameter for Solid-State Anaerobic Digestion optimization. Bioresource Technology 173, 185–192. doi:10.1016/j.biortech.2014.09.015
231
Motte, J.-C., Trably, E., Escudié, R., Hamelin, J., Steyer, J.-P., Bernet, N., Delgenes, J.-P., Dumas, C., 2013. Total solids content: a key parameter of metabolic pathways in dry anaerobic digestion. Biotechnology for biofuels 6, 164. doi:10.1186/1754-6834-6-164
Motte, J.-C., Watteau, F., Escudié, R., Steyer, J.-P., Bernet, N., Delgenes, J.-P., Dumas, C., 2015. Dynamic observation of the biodegradation of lignocellulosic tissue under solid-state anaerobic conditions. Bioresource Technology.
Mshandete, A., Björnsson, L., Kivaisi, A.K., Rubindamayugi, S.T., Mattiasson, B., 2005. Enhancement of anaerobic batch digestion of sisal pulp waste by mesophilic aerobic pre-treatment. Water research 39, 1569–75. doi:10.1016/j.watres.2004.11.037
Mshandete, A., Kivaisi, A., Rubindamayugi, M., Mattiasson, B., 2004. Anaerobic batch co-digestion of sisal pulp and fish wastes. Bioresource technology 95, 19–24. doi:10.1016/j.biortech.2004.01.011
Müller, H.W., Trösch, W., 1986. Screening of white-rot fungi for biological pretreatment of wheat straw for biogas production. Applied microbiology and biotechnology 24, 180–185.
Muthangya, M., Mshandete, A.M., Kivaisi, A.K., 2009. Two-stage fungal pre-treatment for improved biogas production from sisal leaf decortication residues. International journal of molecular sciences 10, 4805–15. doi:10.3390/ijms10114805
NASA, 2015. NanoRacks-Espoo Christian School-Fungus Mycelium Growth Research Comparison in Microgravity and on Earth (NanoRacks-ECS-Fungus Growth ) - 08.27.15 [WWW Document]. URL http://www.nasa.gov/mission_pages/station/research/experiments/1939.html#top
Neves, L., Oliveira, R., Alves, M.M., 2004. Influence of inoculum activity on the bio-methanization of a kitchen waste under different waste / inoculum ratios. Process Biochemistry 39, 2019–2024. doi:10.1016/j.procbio.2003.10.002
Nguyen, T.L.T., Hermansen, J.E., Nielsen, R.G., 2013. Environmental assessment of gasification technology for biomass conversion to energy in comparison with other alternatives: The case of wheat straw. Journal of Cleaner Production 53, 138–148. doi:10.1016/j.jclepro.2013.04.004
Nip, M., Tegelaar, E.W., Brinkhuis, H., De Leeuw, J.W., Schenck, P.A., Holloway, P.J., 1986. Analysis of modern and fossil plant cuticles by Curie point Py-GC and Curie point Py-GC-MS : Recognition of a new , highly aliphatic and resistant biopolymer. Organic Geochemistry 10, 769–778.
Nkoa, R., 2014. Agricultural benefits and environmental risks of soil fertilization with anaerobic digestates: a review. Agronomy for Sustainable Development 34, 473–492. doi:10.1007/s13593-013-0196-z
Nordmann, V., 2013. Caractérisation et impact des différentes fractions d’une biomasse lignocellulosique pour améliorer les prétraitements favorisant sa méthanisation. Université Bordeaux 1.
Nowakowski, D.J., Jones, J.M., 2008. Uncatalysed and potassium-catalysed pyrolysis of the cell-wall constituents of biomass and their model compounds. Journal of Analytical and Applied Pyrolysis 83, 12–25. doi:10.1016/j.jaap.2008.05.007
Nunes, C.A., Lima, C.F., Barbosa, L.C.A., Colodette, J.L., Gouveia, A.F.G., Silvério, F.O., 2010. Determination of Eucalyptus spp lignin S / G ratio : A comparison between methods. Bioresource Technology 101, 4056–4061. doi:10.1016/j.biortech.2010.01.012
Obatake, Y., 1998. Changes in low molecular weight carbohydrates composition and chitin throughout the cultivation stages of Pleurotus ostreatus. Mycoscience 39, 481–485.
Ohra-Aho, T., Gomes, F.J.B., Colodette, J.L., Tamminen, T., 2013. S/G ratio and lignin structure among Eucalyptus hybrids determined by Py-GC/MS and nitrobenzene oxidation. Journal of Analytical and Applied Pyrolysis 101, 166–171. doi:10.1016/j.jaap.2013.01.015
Ohra-aho, T., Gomes, F.J.B., Colodette, J.L., Tamminen, T., 2013. Simultaneous detection of lignin structure , S / G ratio and carbohydrate composition from Eucalyptus hybrids by analytical pyrolysis-GC / MS, in: 6th International Colloquium on Eucalyptus Pulp. pp. 1–8.
Pachauri, R.K., Allen, M.R., Barros, V.R., Broome, J., Cramer, W., Christ, R., Church, J.A., Clarke, L., Dahe, Q., Dasgupta, P., 2014. Climate Change 2014: Synthesis Report. Contribution of Working Groups I, II and III to the Fifth Assessment Report of the Intergovernmental Panel on Climate Change.
232
Pakarinen, a, Zhang, J., Brock, T., Maijala, P., Viikari, L., 2012. Enzymatic accessibility of fiber hemp is enhanced by enzymatic or chemical removal of pectin. Bioresource technology 107, 275–81. doi:10.1016/j.biortech.2011.12.101
Pakarinen, A., Kymalainen, M., Stoddard, F.L., Viikari, L., 2012. Conversion of Carbohydrates in Herbaceous Crops during Anaerobic Digestion. Journal of agricultural and food chemistry 60, 7934–7940.
Pakarinen, A., Maijala, P., Jaakkola, S., Stoddard, F.L., Kymäläinen, M., Viikari, L., 2011. Evaluation of preservation methods for improving biogas production and enzymatic conversion yields of annual crops. Biotechnology for biofuels 4. doi:10.1186/1754-6834-4-20
Pakarinen, O., Lehtomäki, A., Rissanen, S., Rintala, J., 2008. Storing energy crops for methane production: effects of solids content and biological additive. Bioresource technology 99, 7074–82. doi:10.1016/j.biortech.2008.01.007
Palmowski, L., Muller, J., 2000. Influence of the size reduction of organic waste on their anaerobic digestion. Water Science and Technology 41, 155–162.
Park, S., Baker, J.O., Himmel, M.E., Parilla, P.A., Johnson, D.K., 2010. Cellulose crystallinity index : measurement techniques and their impact on interpreting cellulase performance. Biotechnology for biofuels 3, 1–10.
Pepper, J.M., Casselman, B.W., Karapally, J.C., 1967. Lignin oxidation. Preferential use of cupric oxide. Canadian Journal of Chemistry 45, 3009.
Pérez, J., Muñoz-Dorado, J., de la Rubia, T., Martínez, J., 2002. Biodegradation and biological treatments of cellulose, hemicellulose and lignin: an overview. International microbiology : the official journal of the Spanish Society for Microbiology 5, 53–63. doi:10.1007/s10123-002-0062-3
Phutela, U.G., Sahni, N., Sooch, S.D., 2011. Fungal degradation of paddy straw for enhancing biogas production. Indian Journal of Science and Technology 4, 660–665.
Pinedo-Rivilla, C., Aleu, J., Collado, I.G., 2009. Pollutants Biodegradation by Fungi. Current Organic Chemistry 13, 1194–1214. doi:10.2174/138527209788921774
Platt, M.W., Hadar, Y., Henis, Y., Chet, I., 1983. Increased degradation of straw by Pleurotus ostreatus sp. “florida.” European journal of applied microbiology and biotechnology 17, 140–142. doi:10.1007/BF00499867
Pohl, M., Mumme, J., Heeg, K., Nettmann, E., 2012. Thermo- and mesophilic anaerobic digestion of wheat straw by the upflow anaerobic solid-state ( UASS ) process. Bioresource Technology 124, 321–327. doi:10.1016/j.biortech.2012.08.063
Pointing, S.B., 2001. Feasibility of bioremediation by white-rot fungi. Applied Microbiology and Biotechnology 57, 20–33. doi:10.1007/s002530100745
Pointing, S.B., Parungao, M.M., Hyde, K.D., 2003. Production of wood-decay enzymes, mass loss and lignin solubilization in wood by tropical Xylariaceae. Mycological Research 107, 231–235. doi:10.1017/S0953756203007329
Ponsá, S., Gea, T., Alerm, L., Cerezo, J., Sánchez, A., 2008. Comparison of aerobic and anaerobic stability indices through a MSW biological treatment process. Waste Management 28, 2735–2742. doi:10.1016/j.wasman.2007.12.002
Pouwels, A.D., Tom, A., Eijkel, G.B., Boon, J.J., 1987. Characterisation of beech wood and its holocellulose and xylan fractions by pyrolysis-gas-chromatography-mass spectrometry. Journal of Analytical and Applied Pyrolysis 11, 417–436.
Qin, M.H., Xu, Q.H., Shao, Z.Y., Gao, Y., Fu, Y.J., Lu, X.M., Gao, P.J., Holmbom, B., 2009. Effect of bio-treatment on the lipophilic and hydrophilic extractives of wheat straw. Bioresource technology 100, 3082–7. doi:10.1016/j.biortech.2009.01.055
Quéméneur, M., Bittel, M., Trably, E., Dumas, C., Fourage, L., Ravot, G., Steyer, J.-P., Carrère, H., 2012. Effect of enzyme addition on fermentative hydrogen production from wheat straw. International Journal of Hydrogen Energy 37, 10639–10647. doi:10.1016/j.ijhydene.2012.04.083
Ragunathan, R., Swaminathan, K., 2003. Nutritional status of Pleurotus spp. grown on various agro-wastes. Food Chemistry 80, 371–375. doi:10.1016/S0308-8146(02)00275-3
233
Raju, C.S., Ward, A.J., Nielsen, L., Møller, H.B., 2011. Comparison of near infra-red spectroscopy, neutral detergent fibre assay and in-vitro organic matter digestibility assay for rapid determination of the biochemical methane potential of meadow grasses. Bioresource technology 102, 7835–9. doi:10.1016/j.biortech.2011.05.049
Ralph, J., Hatfield, R.D., 1991. Pyrolysis-GC-MS characterization of forage materials. Journal of Agricultural and Food Chemistry 39, 1426–1437. doi:10.1021/jf00008a014
Raposo, F., Banks, C.J., Siegert, I., Heaven, S., Borja, R., 2006. Influence of inoculum to substrate ratio on the biochemical methane potential of maize in batch tests. Process Biochemistry 41, 1444–1450. doi:10.1016/j.procbio.2006.01.012
Raposo, F., De La Rubia, M. a., Fernández-Cegrí, V., Borja, R., 2012. Anaerobic digestion of solid organic substrates in batch mode: An overview relating to methane yields and experimental procedures. Renewable and Sustainable Energy Reviews 16, 861–877. doi:10.1016/j.rser.2011.09.008
Raposo, F., Fernández-Cegrí, V., de la Rubia, M. a., Borja, R., Béline, F., Cavinato, C., Demirer, G., Fernández, B., Fernández-Polanco, M., Frigon, J.C., Ganesh, R., Kaparaju, P., Koubova, J., Méndez, R., Menin, G., Peene, a., Scherer, P., Torrijos, M., Uellendahl, H., Wierinck, I., de Wilde, V., 2011. Biochemical methane potential (BMP) of solid organic substrates: Evaluation of anaerobic biodegradability using data from an international interlaboratory study. Journal of Chemical Technology and Biotechnology 86, 1088–1098. doi:10.1002/jctb.2622
Rapport, J., Zhang, R., Jenkins, B.M., Williams, R.B., 2008. Current Anaerobic Digestion Technologies Used for Treatment of Municipal Organic Solid Waste.
Ravalason, H., Grisel, S., Chevret, D., Favel, A., Berrin, J., Sigoillot, J.-C., Herpoël-Gimbert, I., 2012. Fusarium verticillioides secretome as a source of auxiliary enzymes to enhance saccharification of wheat straw. Bioresource Technology 114, 589–596. doi:10.1016/j.biortech.2012.03.009
Reeves, J.B., Francis, B. a., 1997. Pyrolysis-gas-chromatography-mass-spectrometry for the analysis of forages and by-products. Journal of Analytical and Applied Pyrolysis 40-41, 243–266. doi:10.1016/S0165-2370(97)00010-7
Reeves, J.B., Galletti, G.C., 1993. Use of pyrolysis—gas chromatography/mass spectrometry in the study of lignin assays. Journal of Analytical and Applied Pyrolysis 24, 243–255. doi:10.1016/0165-2370(93)85004-I
Rehbein, M., Koch, G., 2011. Topochemical investigation of early stages of lignin modification within individual cell wall layers of Scots pine (Pinus sylvestris L.) sapwood infected by the brown-rot fungus Antrodia vaillantii (DC.: Fr.) Ryv. International Biodeterioration and Biodegradation 65, 913–920. doi:10.1016/j.ibiod.2011.04.009
Reid, I.D., 1989. Solid-state fermentations for biological delignification. Enzyme and Microbial Technology 11, 786–803.
Reid, I.D., Deschamps, A.M., 1991. Nutritional regulation of synthetic lignin (DHP) degradation by the selective white-rot fungus Phlebia (Merulius) tremellosa : effects of glucose and other cosubstrates. Canadian journal of botany 69, 147–155.
Reid, I.D., Paice, M.G., 1994. Biological bleaching of kraft pulps by white-rot fungi and their enzymes. FEMS Microbiology Reviews 13, 369–375. doi:10.1111/j.1574-6976.1994.tb00056.x
Ren, H., Richard, T.L., Chen, Z., Kuo, M., Bian, Y., Moore, K.J., Patrick, P., 2006. Ensiling Corn Stover: Effect of Feedstock Preservation on Particleboard Performance. Biotechnology Progress 22, 78–85. doi:10.1021/bp050174q
Río, J.C. Del, Rencoret, J., Prinsen, P., Martinéz, Á.T., Ralph, J., Gutiérrez, A., 2012. Structural Characterization of Wheat Straw Lignin as Revealed by Analytical Pyrolysis, 2D-NMR, and Reductive Cleavage Methods. J. Agric. Food Chem. 5922–5935.
Ripley, L.E., Boyle, W.C., Converse, J.C., 1986. Improved alkalimetric monitoring for anaerobic digestion of high-strength wastes. Journal (Water Pollution Control Federation) 406–411.
Rodrigues, M. a. M., Pinto, P., Bezerra, R.M.F., Dias, A. a., Guedes, C.V.M., Cardoso, V.M.G., Cone, J.W., Ferreira, L.M.M., Colaço, J., Sequeira, C. a., 2008. Effect of enzyme extracts isolated from white-rot fungi on chemical composition and in vitro digestibility of wheat straw. Animal Feed Science and Technology 141, 326–338. doi:10.1016/j.anifeedsci.2007.06.015

234
Rodriguez, J., Hernández-Coronado, M.J., Hernandez, M., Bocchini, P., Galletti, G.C., Arias, M.E., 1997. Chemical characterization by pyrolysis/gas chromatography/mass spectrometry of acid-precipitable polymeric lignin (APPL) from wheat straw transformed by selected Streptomyces strains. Analytica chimica acta 345, 121–129.
Ross, a. B., Anastasakis, K., Kubacki, M., Jones, J.M., 2009. Investigation of the pyrolysis behaviour of brown algae before and after pre-treatment using PY-GC/MS and TGA. Journal of Analytical and Applied Pyrolysis 85, 3–10. doi:10.1016/j.jaap.2008.11.004
Ross, K., Mazza, G., 2011. Comparative Analysis of Pyrolysis Products from a Variety of Herbaceous Canadian Crop Residues 7, 763–776.
Rouches, E., Herpoël-Gimbert, I., Steyer, J.P., Carrere, H., 2016. Improvement of anaerobic degradation by white-rot fungi pretreatment of lignocellulosic biomass: A review. Renewable & Sustainable Energy Reviews 59, 179–198.
Ryu, S.H., Cho, M.K., Kim, M., Jung, S.M., Seo, J.H., 2013. Enhanced lignin biodegradation by a laccase-overexpressed white-rot fungus polyporus brumalis in the pretreatment of wood chips. Applied Biochemistry and Biotechnology 171, 1525–1534. doi:10.1007/s12010-013-0412-y
Saiz-Jimenez, C., De Leeuw, J.W., 1986. Lignin pyrolysis products: Their structures and their significance as biomarkers. Organic Geochemistry 10, 869–876. doi:10.1016/S0146-6380(86)80024-9
Salvachúa, D., Prieto, A., López-Abelairas, M., Lu-Chau, T., Martínez, Á.T., Martínez, M.J., 2011. Fungal pretreatment: An alternative in second-generation ethanol from wheat straw. Bioresource Technology 102, 7500–7506. doi:10.1016/j.biortech.2011.05.027
Salvachúa, D., Prieto, A., Vaquero, M.E., Martínez, A.T., Martínez, M.J., 2013. Sugar recoveries from wheat straw following treatments with the fungus Irpex lacteus. Bioresource technology 131, 218–25. doi:10.1016/j.biortech.2012.11.089
Sambusiti, C., Ficara, E., Malpei, F., Steyer, J.P., Carrère, H., 2013. Benefit of sodium hydroxide pretreatment of ensiled sorghum forage on the anaerobic reactor stability and methane production. Bioresource Technology 144, 149–155. doi:10.1016/j.biortech.2013.06.095
Sambusiti, C., Monlau, F., Ficara, E., Carrère, H., Malpei, F., 2013. A comparison of different pre-treatments to increase methane production from two agricultural substrates. Applied Energy 104, 62–70.
Sánchez, C., 2009. Lignocellulosic residues: Biodegradation and bioconversion by fungi. Biotechnology Advances 27, 185–194. doi:10.1016/j.biotechadv.2008.11.001
Scherer, P., 2007. Operating Analytics of Biogas Plants to Improve Efficiency and to Ensure Process Stability 2007, 77–84.
Schlosberg, R.H., Szajowski, P.F., Dupre, G.D., Danik, J. a., Kurs, A., Ashe, T.R., Olmstead, W.I., 1983. Pyrolysis studies of organic oxygenates. Fuel 62, 690–694. doi:10.1016/0016-2361(83)90308-3
Schober, G., Trösch, W., 2000. Degradation of digestion residues by lignolytic fungi. Water research 34, 3424–3430.
Shafiei, M., Karimi, K., Taherzadeh, M.J., 2010. Palm date fibers: analysis and enzymatic hydrolysis. International journal of molecular sciences 11, 4285–4296. doi:10.3390/ijms11114285
Shah, F.A., Mahmood, Q., Rashid, N., Pervez, A., Raja, I.A., Shah, M.M., 2015. Co-digestion , pretreatment and digester design for enhanced methanogenesis. Renewable and Sustainable Energy Reviews 42, 627–642. doi:10.1016/j.rser.2014.10.053
Shah, V., Dobiásová, P., Baldrian, P., Nerud, F., Kumar, A., Seal, S., 2010. Influence of iron and copper nanoparticle powder on the production of lignocellulose degrading enzymes in the fungus Trametes versicolor. Journal of hazardous materials 178, 1141–5. doi:10.1016/j.jhazmat.2010.01.141
Sharma, S.K., Mishra, I.M., Sharma, M.P., Saini, J.S., 1988. Effect of Particle Size on Biogas Generation from Biomass Residues. Biomass 17, 251–263.
Shi, J., Chinn, M.S., Sharma-Shivappa, R.R., 2014a. Interactions between fungal growth, substrate utilization , and enzyme production during solid substrate cultivation of Phanerochaete chrysosporium on cotton stalks. Bioprocess and biosystems engineering 37, 2463–2473. doi:10.1007/s00449-014-1224-3

235
Shi, J., Wang, Z., Stiverson, J. a., Yu, Z., Li, Y., 2013. Reactor performance and microbial community dynamics during solid-state anaerobic digestion of corn stover at mesophilic and thermophilic conditions. Bioresource Technology 136, 574–581. doi:10.1016/j.biortech.2013.02.073
Shi, J., Xu, F., Wang, Z., Stiverson, J. a., Yu, Z., Li, Y., 2014b. Effects of microbial and non-microbial factors of liquid anaerobic digestion effluent as inoculum on solid-state anaerobic digestion of corn stover. Bioresource Technology 157, 188–196. doi:10.1016/j.biortech.2014.01.089
Shrestha, P., Rasmussen, M., Khanal, S.K., Pometto, A.L., Van Leeuwen, J., 2008a. Solid-substrate fermentation of corn fiber by Phanerochaete chrysosporium and subsequent fermentation of hydrolysate into ethanol. Journal of Agricultural and Food Chemistry 56, 3918–3924. doi:10.1021/jf0728404
Shrestha, P., Rasmussen, M., Khanal, S.K., Pometto, A.L., van Leeuwen, J.H., 2008b. Solid-substrate fermentation of corn fiber by Phanerochaete chrysosporium and subsequent fermentation of hydrolysate into ethanol. Journal of agricultural and food chemistry 56, 3918–24. doi:10.1021/jf0728404
Sialve, B., Bernet, N., Bernard, O., 2009. Anaerobic digestion of microalgae as a necessary step to make microalgal biodiesel sustainable. Biotechnology advances 27, 409–16. doi:10.1016/j.biotechadv.2009.03.001
Simoneit, B.R.., 2002. Biomass burning — a review of organic tracers for smoke from incomplete combustion, Applied Geochemistry. doi:10.1016/S0883-2927(01)00061-0
Singh, P., Suman, A., Tiwari, P., Arya, N., Gaur, A., Shrivastava, a. K., 2007. Biological pretreatment of sugarcane trash for its conversion to fermentable sugars. World Journal of Microbiology and Biotechnology 24, 667–673. doi:10.1007/s11274-007-9522-4
Singhvi, M.S., Chaudhari, S., Gokhale, D. V., 2014. Lignocellulose processing: a current challenge. RSC Advances 4, 8271. doi:10.1039/c3ra46112b
Sleat, R., Robinson, J.P., 1984. The bacteriology of anaerobic degradation of aromatic compounds. Journal of Applied Bacteriology 57, 381–394.
Sluiter, A., Hames, B., Ruiz, R., Scarlata, C., Sluiter, J., Templeton, D., Crocker, D., 2011. Determination of Structural Carbohydrates and Lignin in Biomass.
Somayaji, D., Khanna, S., 1994. Biomethanation of rice and wheat straw. World Journal of Microbiology and Biotechnology 10, 521–523.
Spiridon, I., 2011. STRUCTURAL CHANGES EVIDENCED BY FTIR PRE-TREATMENT WITH IONIC LIQUID AND ENZYMATIC 6, 400–413.
Staley, B.F., de los Reyes, F.L., Barlaz, M. a., 2011. Effect of spatial differences in microbial activity, pH, and substrate levels on methanogenesis initiation in refuse. Applied and Environmental Microbiology 77, 2381–2391. doi:10.1128/AEM.02349-10
Sun, R., 2010. Cereal straw as a resource for sustainable biomaterials and biofuels: chemistry, extractives, lignins, hemicelluloses and cellulose. Access Online via Elsevier.
Sun, R., Lawther, J.M., Banks, W.B., 1995. The effect of alkaline nitrobenzene oxidation conditions on the yield and components of phenolic monomers in wheat straw lignin and compared to cupric(II) oxidation. Industrial Crops and Products 4, 241–254. doi:10.1016/0926-6690(95)00038-0
Sundman, V., Näse, L., 1972. The synergistic ability of some wood-degrading fungi to transform lignins and lignosulfonates on various media. Archiv für Mikrobiologie 86, 339–348. doi:10.1007/BF00424990
Taherzadeh, M.J., Karimi, K., 2008. Pretreatment of lignocellulosic wastes to improve ethanol and biogas production: a review., International journal of molecular sciences. doi:10.3390/ijms9091621
Take, H., Andou, Y., Nakamura, Y., Kobayashi, F., Kurimoto, Y., Kuwahara, M., 2006. Production of methane gas from Japanese cedar chips pretreated by various delignification methods. Biochemical Engineering Journal 28, 30–35. doi:10.1016/j.bej.2005.08.036
Talebnia, F., Karakashev, D., Angelidaki, I., 2010. Production of bioethanol from wheat straw: An overview on pretreatment, hydrolysis and fermentation. Bioresource technology 101, 4744–53. doi:10.1016/j.biortech.2009.11.080

236
Tambone, F., Scaglia, B., D’Imporzano, G., Schievano, A., Orzi, V., Salati, S., Adani, F., 2010. Assessing amendment and fertilizing properties of digestates from anaerobic digestion through a comparative study with digested sludge and compost. Chemosphere 81, 577–583. doi:10.1016/j.chemosphere.2010.08.034
Taniguchi, M., Suzuki, H., Watanabe, D., Sakai, K., Hoshino, K., Tanaka, T., 2005. Evaluation of pretreatment with Pleurotus ostreatus for enzymatic hydrolysis of rice straw. Journal of bioscience and bioengineering 100, 637–43. doi:10.1263/jbb.100.637
Terrón, M.C., Fidalgo, M.L., Galletti, G.C., González, A.E., 1995. Pyrolysis-gas chromatography/mass spectrometry of milled wood lignin of two Chilean woods naturally decayed by Ganoderma australe, Phlebia chrysocrea and a brown-rot fungus. Journal of Analytical and Applied Pyrolysis 33, 61–75. doi:10.1016/0165-2370(94)00861-T
Terrón, M.C., Fidalgo, M.L., González, A.E., Almendros, G., Galletti, G.C., 1993. Pyrolysis-gas chromatography / mass spectrometry of wheat straw fractions obtained by alkaline treatments used in pulping processes. Journal of analytical and applied pyrolysis 27, 57–71.
Theuretzbacher, F., Lizasoain, J., Lefever, C., Saylor, M.K., Enguidanos, R., Weran, N., Gronauer, A., Bauer, A., 2015. Steam explosion pretreatment of wheat straw to improve methane yields: Investigation of the degradation kinetics of structural compounds during anaerobic digestion. Bioresource Technology 179, 299–305. doi:10.1016/j.biortech.2014.12.008
Thompson, D.N., Barnes, J.M., Houghton, T.P., 2005. Effect of Additions on Ensiling and Microbial Community of Senesced Wheat Straw. Applied Biochemistry and Biotechnology 121, 21–46.
Tian, X.-F., Fang, Z., Guo, F., 2012. Impact and prospective of fungal pre-treatment of lignocellulosic biomass for enzymatic hydrolysis. Biofuels Bioproducts and Biorefining 6, 335–350. doi:10.1002/bbb
Tilley, J.M.A., Terry, R.A., 1963. A two-stage technique for the in vitro digestion of forage crops. Grass and Forage Science 18, 104–111.
Tomis, V., Duparque, A., Damay, N., Mary, B., Ancelin, O., Dersigny, C., Duranel, J., Fleutry, L., Bertrand, C., 2009. Valorisation énergétique des pailles de céréales et préservation de l’état organique des sols agricoles, in: Journées D’étude Des Sols. AGRO-TRANSFERT, RESSOURCES ET TERRITOIRES.
Tsang, L.J., Reid, I.D., Coxworth, E.C., 1987. Delignification of Wheat Straw by Pleurotus spp. under Mushroom-Growing Conditions. Applied and environmental microbiology 53, 1304–6.
Tsuge, S., Matsubara, H., 1985. High-resolution pyrolysis-gas chromatography of proteins and related materials. Journal of Analytical and Applied Pyrolysis 8, 49–64.
Tuor, U., Winterhalter, K., Fiechter, a., 1995. Enzymes of white-rot fungi involved in lignin degradation and ecological determinants for wood decay. Journal of Biotechnology 41, 1–17. doi:10.1016/0168-1656(95)00042-O
Valley Christian Schools, 2014. Espoo Christian School, Finland - Fungus growth project [WWW Document]. URL https://vimeo.com/97941112
Valmaseda, M., Almendros, G., Martinez, T., 1991. Chemical transformation of wheat straw constituents after solid-state fermentation with selected lignocellulose-degrading fungi. Biomass and Bioenergy 1, 261–266.
van der Kaaden, a, Boon, J.J., Haverkamp, J., 1984. The Analytical Pyrolysis of Carbohydrates 2. Biomedical Mass Spectrometry, Vol. 11, No. 9 11, 486–493.
Van Soest, P.J., Jones, L.H.P., 1968. Effect of silica in forages upon digestibility. Journal of Dairy Science 51, 1644–1648.
Vandevivere, P., Baere, L. De, Verstraete, W., 2003. Types of anaerobic digesters for solid wastes. Biomethanization of OFMSW 1–31.
Varel, V.H., Jung, H.G., 1986. Influence of Forage Phenolics on Ruminal Degradation Influence of Forage Phenolics on Ruminal Fibrolytic Bacteria and In Vitro Fiber Degradation. Applied and environmental microbiology 52, 275–280.
Vasco-correa, J., Li, Y., 2015. Solid-state anaerobic digestion of fungal pretreated Miscanthus sinensis harvested in two different seasons. Bioresource Technology In the pre, 211–217. doi:10.1016/j.biortech.2015.02.099

237
Vassilev, S. V, Baxter, D., Andersen, L.K., Vassileva, C.G., Morgan, T.J., 2012. An overview of the organic and inorganic phase composition of biomass. Fuel 94, 1–33. doi:10.1016/j.fuel.2011.09.030
Vavilin, V. a., Angelidaki, I., 2005. Anaerobic degradation of solid material: Importance of initiation centers for methanogenesis, mixing intensity, and 2D distributed model. Biotechnology and Bioengineering 89, 113–122. doi:10.1002/bit.20323
Velez, A., Garcia, L., De Rozo, M., 1985. Interacion in vitro entre los polifenoles de la pulpa de café y algunas proteinas. Arch. latinoam. nutr. 35, 297–305.
Vidal, G., Becerra, J., Hernández, V., Decap, J., Xavier, C.R., 2007. Anaerobic biodegradation of sterols contained in kraft mill effluents. Journal of bioscience and bioengineering 104, 476–80. doi:10.1263/jbb.104.476
Voß, E., Weichgrebe, D., H.-H., R., 2009. Internationale Wissenschaftstagung Biogas Science 2009 Band 3. Internationale Wissenschaftstagung Biogas Science Band 3 675–683.
Voß, E., Weichgrebe, D., Rosenwinkel, K.H., 2009. FOS/TAC: Herleitung, Methodik, Anwendung und Aussage-kraft, in: Internationale Wissenschaftstagung Biogas Science 2009 Band 3. pp. 675–682.
Walker, G.M., White, N.A., 2005. Introduction to fungal physiology. Wiley.
Wampler, T.P., 1999. Introduction to Capillary Gas Chromatography. Journal of chromatography. A 842, 207–220.
Wan, C., Li, Y., 2010. Microbial pretreatment of corn stover with Ceriporiopsis subvermispora for enzymatic hydrolysis and ethanol production. Bioresource technology 101, 6398–403. doi:10.1016/j.biortech.2010.03.070
Wan, C., Li, Y., 2012. Fungal pretreatment of lignocellulosic biomass. Biotechnology advances 30, 1447–57. doi:10.1016/j.biotechadv.2012.03.003
Wang, L.H., Wang, Q., Cai, W., Sun, X., 2012. Influence of mixing proportion on the solid-state anaerobic co-digestion of distiller’s grains and food waste. Biosystems Engineering 112, 130–137. doi:10.1016/j.biosystemseng.2012.03.006
Wang, S., Guo, X., Liang, T., Zhou, Y., Luo, Z., 2012a. Mechanism research on cellulose pyrolysis by Py-GC/MS and subsequent density functional theory studies. Bioresource Technology 104, 722–728. doi:10.1016/j.biortech.2011.10.078
Wang, S., Guo, Z., Cai, Q., Guo, L., 2012b. Catalytic conversion of carboxylic acids in bio-oil for liquid hydrocarbons production. Biomass and Bioenergy 45, 138–143. doi:10.1016/j.biombioe.2012.05.023
Ward, A.J., Hobbs, P.J., Holliman, P.J., Jones, D.L., 2008. Optimisation of the anaerobic digestion of agricultural resources. Bioresource Technology 99, 7928–7940. doi:10.1016/j.biortech.2008.02.044
Ware, A.E., 2013. APPLICATION OF PYROLYSIS-GC / MS TO THE STUDY OF BIOMASS AND BIOMASS CONSTITUENTS. University of Kentucky.
Weiland, P., 1993. One-and two-step anaerobic digestion of solid agroindustrial residues. Water Science & Technology 27, 145–151.
Wikstrom, C., Rannar, S., Johansson, E., Sandberg, M., 1998. Multivariate process and quality monitoring applied to an electrolysis process Part I. Process supervision with multivariate control charts. Chemometrics and intelligent laboratory systems 221–231.
Wolfenbarger, L.L., Phifer, P.R., 2000. The Ecological Risks and Benefits of. Science 290, 2088–2094. doi:10.1126/science.290.5499.2088
Wood, T.M., McCrae, S.I., Wilson, C.A., Bhat, K.M., Gow, L.A., 1988. Aerobic and anaerobic fungal cellulases, with special reference to their mode of attack on crystalline cellulose, in: FEMS SYMPOSIUM. PLENUM PRESS, p. 31.
Wu, J., Xiao, Y.Z., Yu, H.Q., 2005. Degradation of lignin in pulp mill wastewaters by white-rot fungi on biofilm. Bioresource Technology 96, 1357–1363. doi:10.1016/j.biortech.2004.11.019
Xu, F., Wang, Z.W., Tang, L., Li, Y., 2014. A mass diffusion-based interpretation of the effect of total solids content on solid-state anaerobic digestion of cellulosic biomass. Bioresource Technology 167, 178–185. doi:10.1016/j.biortech.2014.05.114

238
Yan, L., Gao, Y., Wang, Y., Liu, Q., Sun, Z., Fu, B., Wen, X., Cui, Z., Wang, W., 2012. Diversity of a mesophilic lignocellulolytic microbial consortium which is useful for enhancement of biogas production. Bioresource technology 111, 49–54. doi:10.1016/j.biortech.2012.01.173
Yang, H., Wang, K., Wang, W., Sun, R.-C., 2013. Improved bioconversion of poplar by synergistic treatments with white-rot fungus Trametes velutina D10149 pretreatment and alkaline fractionation. Bioresource technology 130, 578–83. doi:10.1016/j.biortech.2012.12.103
Yang, S., Li, J., Zheng, Z., Meng, Z., 2009. Lignocellulosic structural changes of Spartina alterniflora after anaerobic mono- and co-digestion. International Biodeterioration & Biodegradation 63, 569–575. doi:10.1016/j.ibiod.2009.02.007
Yang, Y., Chen, Y., Yang, M., 2007. Methane production from anaerobic fermentation of straw enhanced by biological pretreatment with white-rot fungi. Journal of Agro-Environment Science 5, 78.
Yoon, L.W., Ang, T.N., Ngoh, G.C., Chua, A.S.M., 2014. Fungal solid-state fermentation and various methods of enhancement in cellulase production. Biomass and Bioenergy 67, 319–338. doi:10.1016/j.biombioe.2014.05.013
Yosef, E., Ben-Ghedalia, D., 2000. Changes in the alkaline-labile phenolic compounds of wheat straw cell walls as affected by SO2 treatment and passage through the gastro-intestine of sheep. Animal Feed Science and Technology 83, 115–126. doi:10.1016/S0377-8401(99)00124-8
Zadražil, F., 1977. The Conversion of Straw into Feed by Basidiomycetes. European Journal of Applied Microbiology 4, 273–281.
Zadražil, F., 1980. Conversion of different plant waste into feed by basidiomycetes. European journal of applied microbiology and biotechnology 9, 243–248. doi:10.1007/BF00504491
Zadražil, F., 1985. Screening of fungi for lignin decomposition and conversion of straw into feed. Angewandte Botanik 59, 433–452.
Zadražil, F., 1993. Conversion of Lignocellulosics into Animal Feed with White-rot Fungi, in: Chang, S., Buswel, J.A., Chiu, S. (Eds.), Mushroom Biology and Mushroom Products. The Chinese University Press, pp. 151–162.
Zadražil, F., Brunnert, H., 1981. Investigation of Physical Parameters Important for the Solid State Fermentation of Straw by White Rot Fungi. Applied Microbiology and Biotechnology 11, 183–188.
Zadražil, F., Brunnert, H., 1982. Solid State Fermentation of Lignocellulose Containing Plant Residues with Sporotrichum pulverulentum Nov. and Dichomitus squalens (Karst.) Reid. European Journal of Applied Microbiology and Biotechnology 16, 45–51.
Zadražil, F., Peerally, A., 1986. Effects of heat and microbiological pretreatments of wheat straw substrate on the initial phase of solid state fermentation (SSF) by white rot fungi. Biotechnology Letters 8, 663–666. doi:10.1007/BF01025978
Zadražil, F., Puniya, A.K., 1995. Influence of Carbon Dioxide on Lignin Degradation and Digestibility of Lignocellulosics Treated with Pleurotus sajor-caju. International Biodeterioration & Biodegradation 237–244.
Zeitoun, R., 2011. Procédés de fractionnement de la matière végétale: application à la production des polysaccharides du son et de la paille de blé. ED Sciences De la Matiere.
Zeng, J., Singh, D., Chen, S., 2011. Biological pretreatment of wheat straw by Phanerochaete chrysosporium supplemented with inorganic salts. Bioresource technology 102, 3206–14. doi:10.1016/j.biortech.2010.11.008
Zhang, J., Luo, J., Tong, D., Zhu, L., Dong, L., Hu, C., 2010. The dependence of pyrolysis behavior on the crystal state of cellulose. Carbohydrate Polymers 79, 164–169. doi:10.1016/j.carbpol.2009.07.038
Zhang, J., Siika-aho, M., Tenkanen, M., Viikari, L., 2011. The role of acetyl xylan esterase in the solubilization of xylan and enzymatic hydrolysis of wheat straw and giant reed. Biotechnology for biofuels 4, 1–10.
Zhang, R., Li, X., Fadel, J.G., 2002. Oyster mushroom cultivation with rice and wheat straw. Bioresource technology 82, 277–84.

239
Zhao, J., Ge, X., Vasco-Correa, J., Li, Y., 2014a. Fungal pretreatment of unsterilized yard trimmings for enhanced methane production by solid-state anaerobic digestion. Bioresource technology 158, 248–52. doi:10.1016/j.biortech.2014.02.029
Zhao, J., Zheng, Y., Li, Y., 2014b. Fungal pretreatment of yard trimmings for enhancement of methane yield from solid-state anaerobic digestion. Bioresource technology 156, 176–81. doi:10.1016/j.biortech.2014.01.011
Zhao, L., Cao, G., Wang, A., Ren, H., Dong, D., Liu, Z., Guan, X., 2012. Bioresource Technology Fungal pretreatment of cornstalk with Phanerochaete chrysosporium for enhancing enzymatic saccharification and hydrogen production. Bioresource Technology 114, 365–369. doi:10.1016/j.biortech.2012.03.076
Zheng, Y., Pan, Z., Zhang, R., 2009. Overview of biomass pretreatment for cellulosic ethanol production. International Journal of Agricultural and Biological Engineering 2, 51–68. doi:10.3965/j.issn.1934-6344.2009.03.051-068
Zheng, Y., Zhao, J., Xu, F., Li, Y., 2014. Pretreatment of lignocellulosic biomass for enhanced biogas production. Progress in Energy and Combustion Science 42, 35–53. doi:10.1016/j.pecs.2014.01.001
Zhong, W., Zhang, Z., Luo, Y., Sun, S., Qiao, W., Xiao, M., 2011. Effect of biological pretreatments in enhancing corn straw biogas production. Bioresource technology 102, 11177–82. doi:10.1016/j.biortech.2011.09.077
Zhong, Y., Ruan, Z., Zhong, Y., Archer, S., Liu, Y., Liao, W., 2015. A self-sustaining advanced lignocellulosic biofuel production by integration of anaerobic digestion and aerobic fungal fermentation. Bioresource Technology 179, 173–179. doi:10.1016/j.biortech.2014.12.013
Zhou, S., Grisel, S., Herpoël-Gimbert, I., Rosso, M.-N., 2015a. A PCR-based method to quantify fungal growth during pretreatment of lignocellulosic biomass. Journal of Microbiological Methods 115, 67–70. doi:10.1016/j.mimet.2015.05.024
Zhou, S., Raouche, S., Grisel, S., Navarro, D., Sigoillot, J., Herpoël-gimbert, I., 2015b. Solid-state fermentation in multi-well plates to assess pretreatment efficiency of rot fungi on lignocellulose biomass. Microbial Biotechnology. doi:10.1111/1751-7915.12307
Zhou, S., Rouches, E., ..., 2016. Biological pretreatment of wheat straw with five Wood Decay Fungi using a controlled SSF system for ethanol and biogas production. In preparation.
Zhou, S., Zhang, Y., Dong, Y., 2012. Pretreatment for biogas production by anaerobic fermentation of mixed corn stover and cow dung. Energy 46, 644–648. doi:10.1016/j.energy.2012.07.017
Zhu, P., Sui, S., Wang, B., Sun, K., Sun, G., 2004. A study of pyrolysis and pyrolysis products of flame-retardant cotton fabrics by DSC, TGA, and PY – GC – MS. Journal of Analytical and Applied Pyrolysis 71, 645–655. doi:10.1016/j.jaap.2003.09.005

240
List of annexes
ANNEX 1. CHARACTERIZATION OF WHEAT STRAWS IN LITERATURE. ..................................................................................................... 241
ANNEX 2. CULTURAL ROUTE OF WHEAT STRAW USED IN THIS STUDY. ................................................................................................... 242
ANNEX 3. RESPONSE SURFACES FOR LIGNIN LOSSES FROM OPTIMIZATION STEP. ..................................................................................... 243
ANNEX 4. RESPONSE SURFACES FOR DRY MATTER LOSSES (DML) FROM OPTIMIZATION STEP. .................................................................. 244
ANNEX 5. TABLE OF MODEL COEFFICIENTS FOR STUDIED RESPONSE SURFACES. ...................................................................................... 245
ANNEX 6. RELATIONSHIPS BETWEEN SOLUBLE SUGARS AND GLUCOSE YIELD AFTER HYDROLYSIS, DRY MATTER LOSSES AND FUNGAL BIOMASS AND
CORRELATION BETWEEN LIGNIN AND GLUCOSE YIELD AFTER HYDROLYSIS FOR SAMPLES FROM THE OPTIMIZATION STEP. ....................... 246
ANNEX 7. RESPONSE SURFACES FOR GLUCOSE YIELD AFTER HYDROLYSIS FROM OPTIMIZATION STEP. .......................................................... 247
ANNEX 8 (PART 1/2). PYROLYSIS COMPOUNDS OF FUNGAL PRETREATED STRAWS AND OF P. BRUMALIS BRFM 985: PS-CLASS, LIG-CLASS, N-
CLASS AND UN-CLASS....................................................................................................................................................... 248
ANNEX 9. PRODUCTS IDENTIFICATION FROM UNTREATED WHEAT STRAW (UWS) AND FUNGAL PRETREATED STRAWS WITH SEVERAL STRAINS
(IDENTIFIED BY THEIR BRFM NUMBER) AND THEIR AVERAGE RELATIVE AREAS PER THOUSAND, RANGED BY INCREASED RETENTION TIME (RT).
.................................................................................................................................................................................... 250
ANNEX 10. RELATIONSHIP BETWEEN PYROLYSIS-GC-MS DATA AND NREL (ACID HYDROLYSIS) MEASUREMENTS FOR STRAWS FROM TABLE 5-2. 254
ANNEX 11. CORRELATIONS BETWEEN FUNGAL BIOMASS DETERMINED BY QPCR AND TOLUENE (UN1) AND STYRENE (UN2) RELATIVE AREAS IN
PYROGRAMS OF FUNGAL PRETREATED WHEAT STRAWS. ........................................................................................................... 254
ANNEX 12. P. BRUMALIS BRFM 985 GROWTH IN PILOT-REACTOR ON WHEAT STRAW (TWO TRAYS WITH DIFFERENT PARTICLE SIZES) WHITOUT
FUNGAL CONTAMINATION. ................................................................................................................................................ 255
ANNEX 13. C/N OF PRETREATED STRAWS DURING THE SELECTION STEP. .............................................................................................. 255
ANNEX 14. HOMOGENEOUS FUNGAL GROWTH IN GLASS COLUMNS. ................................................................................................... 256
ANNEX 15. FUNGAL CONTAMINATION AFTER TRIAL OF WHEAT STRAW PRETREATMENT WITH P. BRUMALIS BRFM 985 IN THE LBE PILOT-REACTOR.
.................................................................................................................................................................................... 256
ANNEX 16. SUCCESSFULL GROWTH OF P. BRUMALIS BRFM 985 ON MISCANTHUS STRAW PRETREATED IN PILOT-REACTOR. .......................... 257
ANNEX 17. DATA USED TO PLOT THE PCA IN CHAPTER 7. ................................................................................................................. 258
ANNEX 18. CORRELATION BETWEEN BMP VALUES IN NML/G VS PRETREATED AND BMP VALUES IN NML/G TS PRETREATED FROM SAMPLES
FROM THE SELECTION STEP. ............................................................................................................................................... 259
ANNEX 19. DMODX VALUES IN THE SPACE DEFINED BY THREE COMPONENTS FOR SAMPLES FROM THE PCA PRESENTED IN CHAPTER 7. ........... 259
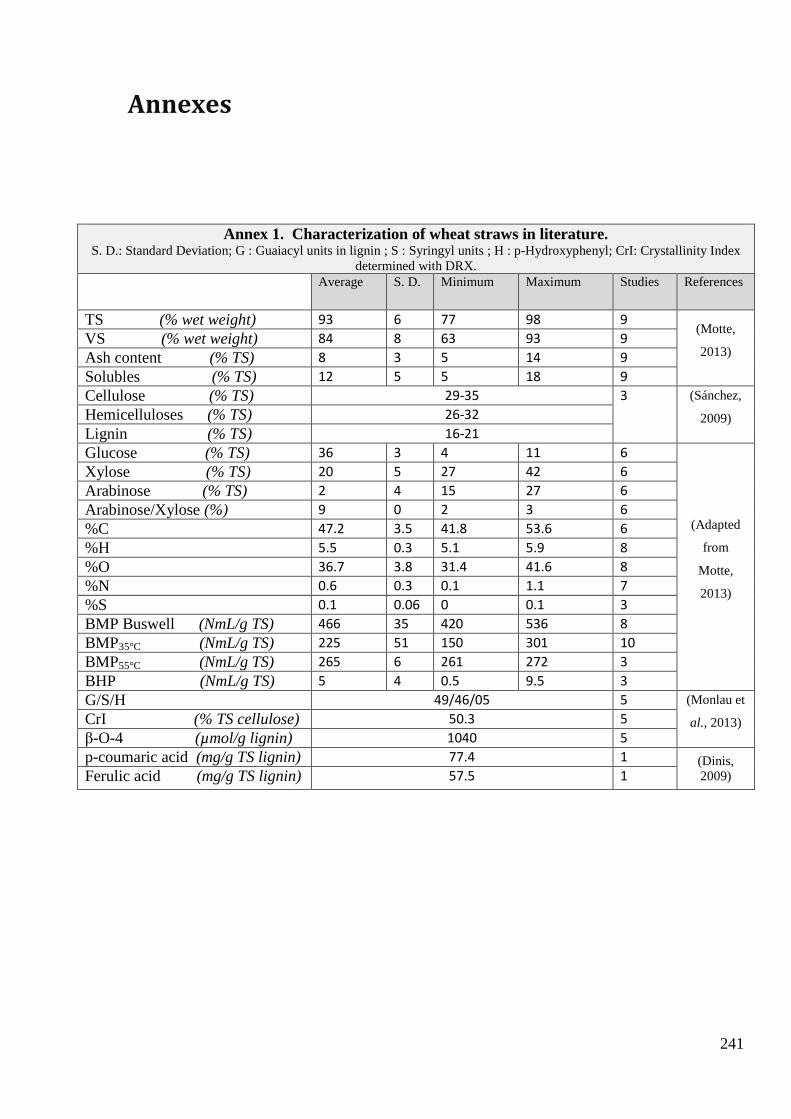
241
Annexes
Annex 1. Characterization of wheat straws in literature. S. D.: Standard Deviation; G : Guaiacyl units in lignin ; S : Syringyl units ; H : p-Hydroxyphenyl; CrI: Crystallinity Index
determined with DRX.
Average S. D. Minimum Maximum Studies References
TS (% wet weight) 93 6 77 98 9 (Motte,
2013) VS (% wet weight) 84 8 63 93 9
Ash content (% TS) 8 3 5 14 9
Solubles (% TS) 12 5 5 18 9
Cellulose (% TS) 29-35 3 (Sánchez,
2009) Hemicelluloses (% TS) 26-32
Lignin (% TS) 16-21
Glucose (% TS) 36 3 4 11 6
(Adapted
from
Motte,
2013)
Xylose (% TS) 20 5 27 42 6
Arabinose (% TS) 2 4 15 27 6
Arabinose/Xylose (%) 9 0 2 3 6
%C 47.2 3.5 41.8 53.6 6
%H 5.5 0.3 5.1 5.9 8
%O 36.7 3.8 31.4 41.6 8
%N 0.6 0.3 0.1 1.1 7
%S 0.1 0.06 0 0.1 3
BMP Buswell (NmL/g TS) 466 35 420 536 8
BMP35°C (NmL/g TS) 225 51 150 301 10
BMP55°C (NmL/g TS) 265 6 261 272 3
BHP (NmL/g TS) 5 4 0.5 9.5 3
G/S/H 49/46/05 5 (Monlau et
al., 2013) CrI (% TS cellulose) 50.3 5
β-O-4 (µmol/g lignin) 1040 5
p-coumaric acid (mg/g TS lignin) 77.4 1 (Dinis,
2009) Ferulic acid (mg/g TS lignin) 57.5 1
TS (% wet weight)
VS (% wet weight)
Ashes (% wet weight)
Solubles (% TS)
Ash content (% TS)
Glucose (% TS)
Xylose (% TS)
Arabinose (% TS)
Ara/Xyl
%C
%H
%O
%N
%S
Equivalente COD
Theorical BMP (Buwell)
BMP35°C
BMP55°C
BHP
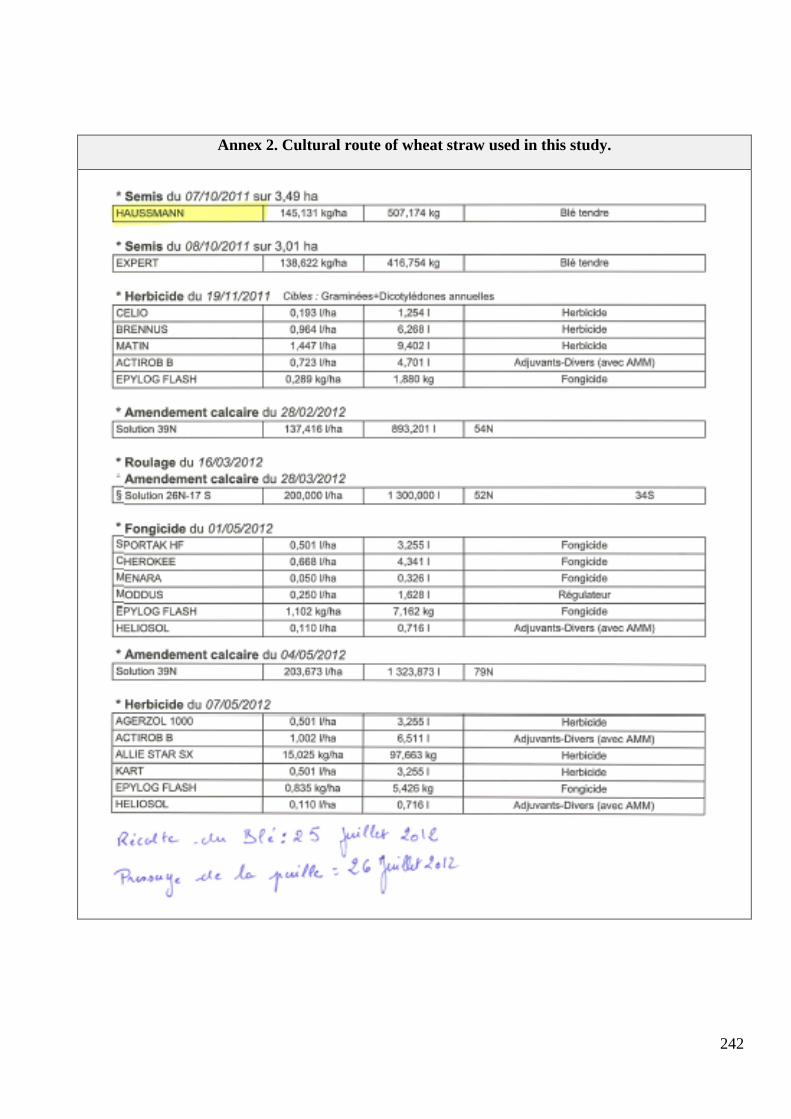
242
Annex 2. Cultural route of wheat straw used in this study.
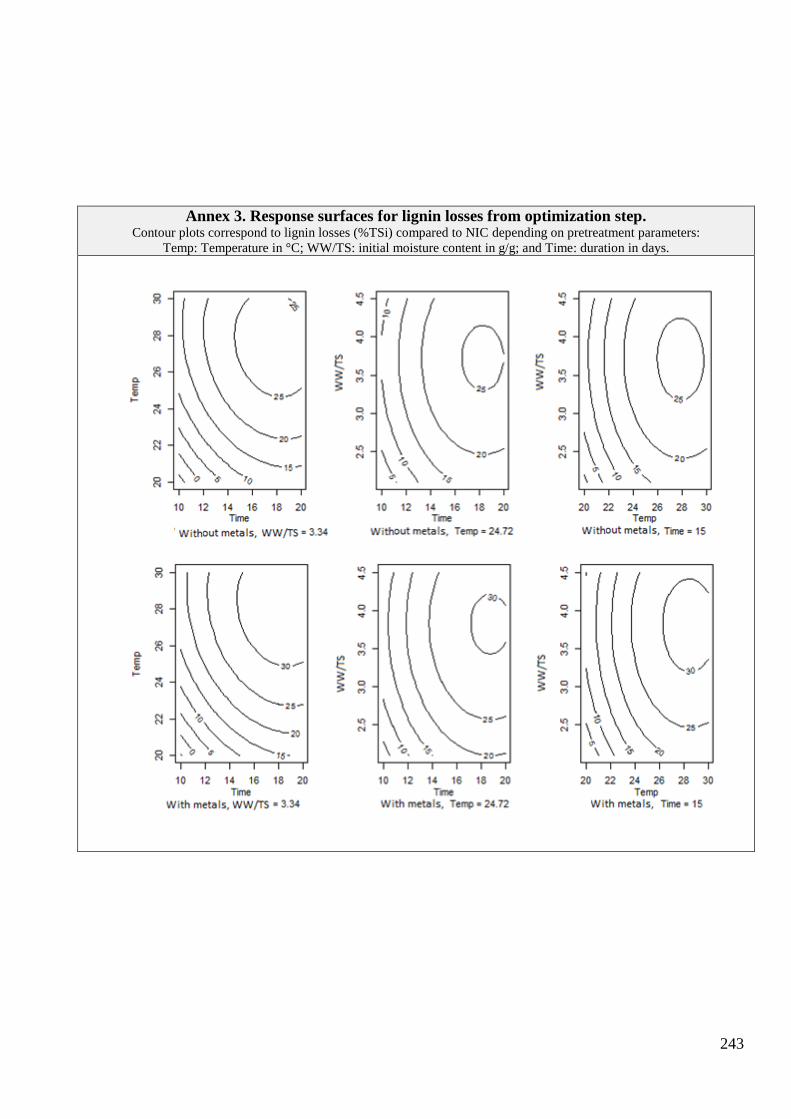
243
Annex 3. Response surfaces for lignin losses from optimization step. Contour plots correspond to lignin losses (%TSi) compared to NIC depending on pretreatment parameters:
Temp: Temperature in °C; WW/TS: initial moisture content in g/g; and Time: duration in days.

244
Annex 4. Response surfaces for dry matter losses (DML) from optimization step. Contour plots correspond to DML (%TS) depending on pretreatment parameters:
Temp: Temperature in °C; WW/TS: initial moisture content in g/g; and Time: duration in days.

245
Annex 5. Table of model coefficients for studied response surfaces.
BMP
(NmL/g TS i)
CH4
production
at day 57
(NmL/g TS i)
CH4
production
at day 6
(NmL/g TS i)
Lignin losses
(%)
Glucose
yield
(%)
Dry Matter
Losses
(DML)
(%)
b0 Constant 160.75 139.19 66.23 25.03 18.70 22.80
b1 Metals (met) -14.42 -13.09 -2.79 -1.98 -3.40 -0.26
b2 Duration 1.51 2.57 4.76 7.75 3.12 5.50
b3 WW/TS 8.90 11.34 9.74 4.73 8.05 1.78
b4 Temperature 5.37 8.39 10.30 8.98 6.87 10.30
b21 Duration x Metals -10.47 -5.53 0.25 -0.50 -1.26 -0.23
b31 WW/TS i x Metals -2.75 -3.15 -3.14 -0.50 -0.37 0.96
b41 Temperature x Metals -12.53 -11.65 -3.19 -0.81 -2.82 0.52
b22 Duration ² 25.60 19.56 -11.79 -5.55 0.26 -4.11
b33 WW/TS i² -1.27 -7.88 -9.87 -6.98 1.58 -7.73
b44 Temperature² -10.65 -9.32 -6.88 -6.98 -1.76 -8.55
b23 Duration x WW/TS i -15.44 -11.33 -8.36 -0.03 1.16 -0.83
b24 Duration x Temperature -16.64 -7.60 9.21 -1.97 3.42 0.46
b34 WW/TS i x Temperature 13.35 14.45 12.43 -0.27 10.85 -2.01

246
R² = 0.5928
0
5
10
15
20
25
30
35
40
45
0 50 100
Glu
cose
yie
ld (
%)
Sugars water extracted (mg/g TS pretreated)
R² = 0.9971
0
20
40
60
80
100
120
140
0 50 100
Fun
gal b
iom
ass
de
term
ine
d w
ith
qP
CR
(m
g/g
TS p
retr
eat
ed
)
Sugars water extracted (mg/g TS pretreated)
R² = 0.9461
0
5
10
15
20
25
30
0 10 20 30 40
Lign
in (
% p
retr
eat
ed
TS)
Glucose yield (%)
Annex 6. Relationships between soluble sugars and glucose yield after hydrolysis, dry matter
losses and fungal biomass and correlation between lignin and glucose yield after hydrolysis for
samples from the optimization step. H
H
R² = 0.5403
0
5
10
15
20
25
30
35
0 50 100
Dry
Mat
ter
Loss
es
(%TS
)
Sugars water extracted (mg/g TS pretreated)
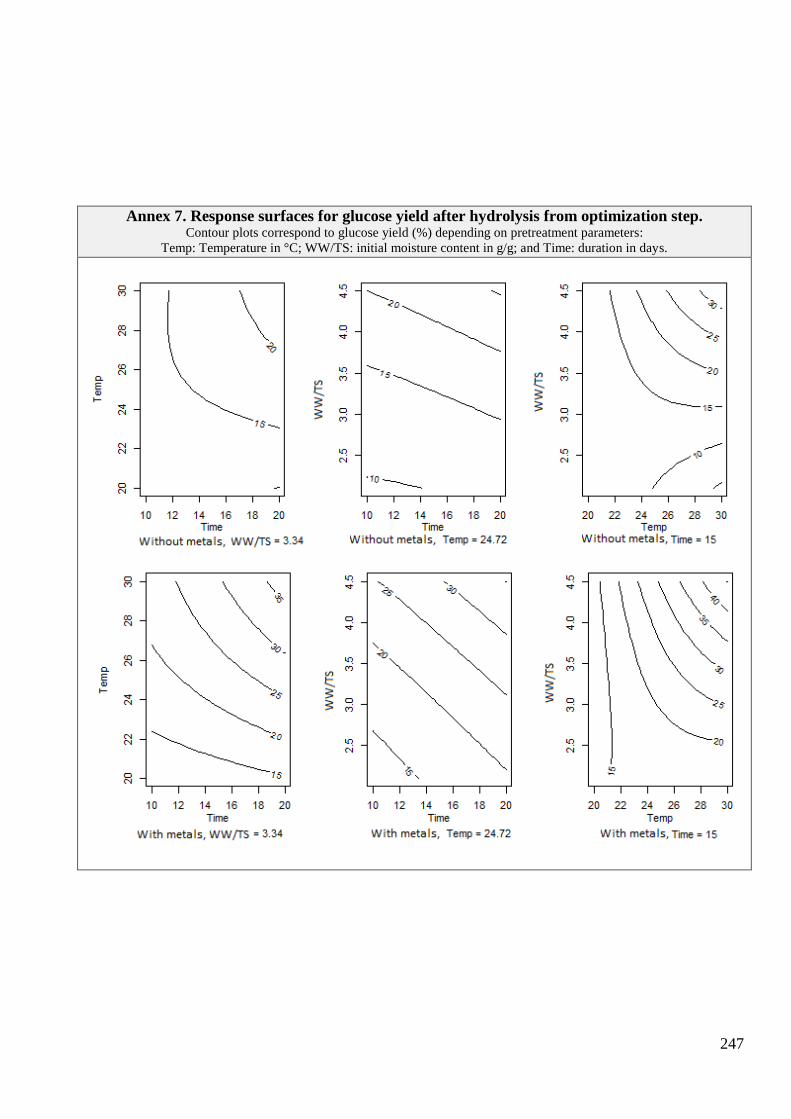
247
Annex 7. Response surfaces for glucose yield after hydrolysis from optimization step. Contour plots correspond to glucose yield (%) depending on pretreatment parameters:
Temp: Temperature in °C; WW/TS: initial moisture content in g/g; and Time: duration in days.
j

248
Annex 8 (Part 1/2). Pyrolysis compounds of fungal pretreated straws and of P. brumalis BRFM 985: PS-class, LIG-class, N-class and UN-class. PS: Polysaccharide origin; LIG: lignin origin; N: N-containing compounds; UN: Unspecific origin.
Code Compound Reference Code Compound Reference
PS3 2-Cyclopenten-1-one, 2-methyl-
(Dignac et al., 2005)
PS30 1,2-Cyclopentanedione (Mészáros et al., 2007)
PS6 Ethanone, 1-(2-furanyl)- PS31 2-Cyclopenten-1-one, 3-ethyl-2-
hydroxy-
(Nowakowski and Jones,
2008)
PS7 2-Cyclopenten-1-one, 3-methyl- PS33 1,3-Cyclopentanedione, 2,2-dimethyl-
PS8 2-Cyclopenten-1-one, 2,3-dimethyl- PS34 2-Cyclopenten-1-one, 2-hydroxy-3-
methyl-
(Nowakowski and Jones,
2008)
PS9 2-Furancarboxaldehyde, 5-methyl- PS35 Furan, 2,5-dimethyl- (Buurman et al., 2007)
PS12 2-Furanmethanol PS36 Maltol (Pouwels et al., 1987)
PS16 1,2-Cyclopentanedione, 3-methyl- PS37 3-Furaldehyde
PS18 Levoglucosenone PS38 2-Cyclopentene-1,4-dione (Ross and Mazza, 2011)
PS21 1,4:3,6-Dianhydro-.alpha.-d-glucopyranose (Ross and Mazza, 2011) PS40 2-Methyl-5-hydroxybenzofuran
PS24 1,6-Anhydro-.beta.-D-glucopyranose (levoglucosan) (Dignac et al., 2005) PS42 Benzofuran, 2-methyl- (De la Rosa et al., 2008)
PS25 Furfural (Nowakowski and Jones,
2008) PS43' Anhydro-d-mannosan (Nowakowski and Jones,
2008)
PS26 2-Furancarboxaldehyde, 5-(hydroxymethyl)- (Ross and Mazza, 2011)
PS44 D-allose (Ross and Mazza, 2011
PS28 Furan, 2-methyl- PS46 1,3-Cyclopentadiene (Pouwels et al., 1987)
PS29 2(5H)-Furanone (Lv and Wu, 2012)

249
Annex (Part 2/2). Pyrolysis compounds of fungal pretreated straws and of P. brumalis BRFM 985: PS-class, LIG-class, N-class and UN-class. PS: Polysaccharide origin; LIG: lignin origin; N: N-containing compounds; UN: Unspecific origin.
Code Compound Current name Reference
Code Compound Reference
N1 Indole
(Dignac et al.,
2005)
N2 Indole, methyl
N4 Pyridine
N5 Pyridine, 3-methyl-
N6 Pyridine, 2-methyl-
N8 1H-Pyrrole, 2-methyl-
LIM Limonene
UN1 Toluene
UN2 Styrene
UN5 Phenol
UN6 Phenol, 4-methyl-
UN7 Phenol, 3-methyl-
UN8 Phenol, 4-ethyl-
UN10 1,2-Benzenediol
UN13 2-Methoxy-4-vinylphenol (Nowakowski
and Jones, 2008) UN14 1,2-Benzenediol, 3-methoxy- (Ross and
Mazza, 2011) UN15 3-Methoxy-5-methylphenol
LIG1-G Phenol, 2-methoxy- (guaiacol)
(Dignac et al.,
2005)
LIG2-G Phenol, 2-methoxy-4-methyl- (Me-guaiacol)
LIG4-G (2-Methoxy-4-(2-propenyl)-phenol) (eugenol)
LIG5-G Phenol, 2-methoxy-4-(1-propenyl)- (isoeugenol)
LIG-6S Phenol, 2,6-dimethoxy-
LIG9-G Ethanone, 1-(4-hydroxy-3-methoxyphenyl)-
LIG12-S Ethanone, 1-(4-hydroxy-3,5-dimethoxyphenyl)-
LIG13-S Phenol, 2,6-dimethoxy-4-(2-propenyl)-
LIG14-G Phenol, 4-ethyl-2-methoxy- (Nowakowski
and Jones, 2008)
LIG16-S Phenol, 3,4-dimethoxy-
LIG17-G Phenol, 3-methoxy-
LIG18-G Phenol, 3-methoxy-2-methyl-
LIG19-G Phenol, 2-methoxy-3-methyl-
LIG22-G 4-Hydroxy-2-methoxybenzaldehyde (vanillin) (Nowakowski
and Jones, 2008)
LIG26-S Benzaldehyde, 4-hydroxy-3,5-dimethoxy- (syringaldehyde) (Ross and
Mazza, 2011) LIG27-G Homovanillyl alcohol

250
Annex 9. Products identification from untreated wheat straw (UWS) and fungal pretreated straws with several strains (identified by their
BRFM number) and their average relative areas per thousand, ranged by increased retention time (RT). In this table, only an area equal to zero represents the absence of a compound, empty cells only mean a difficulty to find the compound (co-elution, peak too small or absent).
RT Compound Code 236 957 985 1048 1296 1554 985-2w 1554-2w UWS Mean SD
SD
(%
mean)
Empty
6 1,3-Cyclopentadiene PS46 1.7 15.0 9.0 5.0 11.8 1.8 3.7 0.0 0.0 5.3 5.4 101.3 0
6.2 Furan, 2-methyl- PS28 6.6
5.2 5.0 23.9 9.3 19.4 9.1 11.2 7.4 66.2 2
7.6 Benzene 61
8.4
24.5
4.7
12.5 10.5 84.2 6
8 1-Heptene 62
2.4
2.4
8
8.5 Furan, 2,5-dimethyl- PS35 3.1 8.8 4.2 3.3 5.7 6.4 3.0 1.8 5.7 4.7 2.2 46.5 0
9.4 1,3,5-Hexatriene, 2-methyl- 63
1.4
1.4
8
10 Toluene UN1 5.6 28.9 15.7 11.9 20.4 12.2 12.5 10.8 12.2 14.5 6.7 46.2 0
10.2 Pyridine N4
4.1
4.1
8
11.4 3-Furaldehyde PS37
5.4 4.3
6.0
5.2 0.9 16.7 6
12 Furfural PS25 138.3 41.5
61.2 46.8 129.9 33.1 26.3 37.3 64.3 44.3 68.9 1
12.3 2-Furanmethanol PS12
1.9
1.9
8
12.5 Ethylbenzene 64 1.1 5.4 4.2 4.0 4.6 2.0
3.6 1.6 46.1 3
12.5 5,9-Dodecadien-2-one, 6,10-dimethyl-,
(E,E))- 65
2.1
2.1
8
12.7 Xylene (o or p) 66 3.8 12.0 13.0 13.8 11.2
10.0 10.7 8.4 10.3 3.2 30.5 1
12.9 1-Nonene 67
2.0 2.4
2.2 0.2 11.2 7
13.3 Styrene UN2
17.7 10.5
9.6 7.7
5.8 10.3 4.5 44.2 4
13.3 1,3,5,7-Cyclooctatetraene 68
6.4 4.6
5.5 1.3 22.9 7
13.4 2-Cyclopentene-1,4-dione PS38 0.0 5.5 1.0 4.2 2.6
2.1
5.2 2.9 2.1 71.5 2
13.8 2-Cyclopenten-1-one, 2-methyl- PS3 1.7 3.8 3.9 4.5 3.7 2.3 6.8 6.3 7.2 4.5 2.0 43.8 0
13.9 Ethanone, 1-(2-furanyl)- PS6 2.5 3.4 3.3 3.5 3.3 2.6 5.3 5.2 4.9 3.8 1.1 28.8 0
14.1 2(5H)-Furanone PS29
7.4 12.6
15.5
11.8 4.1 34.8 6
14.6 1,2-Cyclopentanedione PS30 0.0 10.8 22.7 26.5 12.0
24.8 20.3 25.3 17.8 9.3 52.5 1
14.7 Benzene, 2-propenyl- 69
2.2
2.2
8
15 Benzene, 1-ethyl-3-methyl- 70
4.0
2.1
3.0 1.3 43.9 7
15 Benzene, 1-ethyl-2-methyl- 71
2.8
2.8
8
15.2 2-Furancarboxaldehyde, 5-methyl- PS9 8.6 9.7 8.2 8.6 7.4 16.9 6.5 5.3 6.8 8.7 3.3 38.6 0
15.4 Benzaldehyde 72
11.0
3.9
7.5 5.0 67.1 7

251
15.5 2-Cyclopenten-1-one, 3-methyl- PS7 3.8
6.1 10.3
3.6 9.0 9.3 9.1 7.3 2.8 37.8 2
15.5 1-Decene 73
4.0 9.8
2.7
5.5 3.8 68.9 6
15.7 Phenol UN5 13.2 23.9 17.6 14.2 18.0 22.1 28.8 26.6 25.9 21.1 5.6 26.6 0
15.9 Benzene, 1-methoxy-4-methyl- 74
3.1
3.1
8
15.9 Benzene, 1-ethenyl-3-methyl- 75
3.9 2.6
1.9
2.8 1.0 36.6 6
15.9 Benzene, 1,3,5-trimethyl- 76
4.6
4.2
4.4 0.3 6.7 7
16.1 Benzofuran 77
5.0 2.2
4.5
3.9 1.5 37.9 6
16.7 Limonene LIM
1.3 2.6 2.5
6.1 6.3 8.4 4.5 2.8 61.0 3
16.9 1,2-Cyclopentanedione, 3-methyl- PS16 9.2 8.3 12.8 11.6 9.1
28.7 20.5 32.5 16.6 9.5 57.3 1
17 2-Cyclopenten-1-one, 2,3-dimethyl- PS8
6.2 3.9 4.0 4.0
8.0 6.9 6.8 5.7 1.7 29.7 2
17.1 2-Cyclopenten-1-one, 2-hydroxy-3-
methyl- PS34
6.2
6.2
8
17.4 Indene 78
3.1 3.0 3.8 2.4
4.0
3.3 0.6 19.5 4
17.5 Phenol, 4-methyl- UN6
23.5 16.8 19.3 30.5
28.7
23.8 5.9 24.7 4
17.5 Phenol, 2-methyl- 79
15.0 11.2 12.1
18.1 15.3 17.0 14.8 2.7 18.2 3
17.9 Phenol, 3-methyl- UN7 14.8 32.6
34.1
34.0 28.9 9.4 32.5 5
18.3 Phenol, 2-methoxy- LIG1-G 24.6 24.5 19.4 20.8 11.1 21.2 51.4 40.0 63.5 30.7 17.2 56.0 0
18.8 Benzofuran, 2-methyl- PS42 3.6 7.1 6.3
6.1 11.2
4.5
6.5 2.6 41.0 3
19 2-Cyclopenten-1-one, 3-ethyl-2-hydroxy- PS31
9.2 9.2
8
19 1,3-Cyclopentanedione, 2,2-dimethyl- PS33
10.5
10.5
8
19 Maltol PS36
6.4
6.4
8
19.1 Levoglucosenone PS18 0.0 8.4 5.3 15.0 13.5
5.8 PS31 3.5 7.4 5.4 72.9 1
19.3 Phenol, 2-ethyl- 80
2.6 1.5
2.8
2.3 0.7 31.3 6
19.6 Phenol, 2,4-dimethyl- 81
9.3 9.0 5.9 8.8 2.9
13.1
8.2 3.5 42.3 3
19.6 Phenol, 2,5-dimethyl- 82 7.3
3.9 3.9 9.2
6.1 2.6 43.7 5
19.7 1H-Indene, 1-methyl- 83
4.1 4.4
3.7
4.0 0.3 8.4 6
20 Phenol, 4-ethyl- UN8 5.3 7.5 7.9 5.4 4.7
9.6 11.1 7.4 2.4 32.9 2
20.4 Phenol, 3-methoxy-2-methyl- LIG18-G
7.1
7.1
8
20.6 Phenol, 2-methoxy-4-methyl- LIG2-G 15.2 8.2 8.1 5.2 6.0 12.3 14.0 18.4 19.3 11.9 5.3 44.4 0
20.6 Phenol, 3,5-dimethyl- 85
9.7
22.6 16.2 9.1 56.5 7
20.7 1,2-Benzenediol UN10 48.6
36.1
31.3 32.5 16.9 33.1 11.3 34.3 4
20.8 Azulene 86
3.8
3.8
8
21.2 Benzofuran, 2,3-dihydro- 87
11.6
7.9 13.3 8.6 18.2 11.9 4.1 34.7 4
21.5 Phenol, 3-methoxy- LIG17-G
2.2
2.2
8

252
21.5 1,4:3,6-Dianhydro-.alpha.-d-
glucopyranose PS21 16.8 14.5 13.1 14.0 5.9
9.2 6.0 12.3 11.5 4.0 34.9 1
21.7 2-Furancarboxaldehyde, 5-
(hydroxymethyl)- PS26
6.7 8.6 8.7
8.0 1.1 13.9 6
21.7 Anhydro-d-mannosan PS43'
8.3
8.3
8
22.2 1,2-Benzenediol, 3-methoxy- UN14
23.8 37.0 29.0 18.6 27.1 7.8 28.9 5
22.3 Hydroquinone 88
10.3
10.3
8
22.4 Phenol, 4-ethyl-2-methoxy- LIG14-G
10.7 9.3 7.5 11.1
12.5
18.8 11.6 3.9 33.5 3
22.7 4-Hydroxy-2,4,5-trimethyl-2,5-
cyclohexadien-1-one 89 7.5
7.5
8
22.8 Bicyclo[4.2.0]octa-1,3,5-triene 90
6.0
6.0
8
22.9 1,2-Benzenediol, 4-methyl- 91 20.9
11.9 10.9 14.6 5.5 38.0 6
23 5-Acetoxymethyl-2-furaldehyde PS45
2.1
2.1
8
23 Naphthalene, 1-methyl- 92
4.3
4.3
8
23.1 Naphthalene, 2-methyl- 93
7.9
3.0
5.4 3.5 64.2 7
23.1 Benzocycloheptatriene 95
3.3
1.8
2.6 1.1 41.8 7
23.4 3-Methoxy-5-methylphenol UN15
4.3
4.3
8
23.4 2-Methoxy-4-vinylphenol UN13 19.1 5.6 8.7 10.9 11.3
31.0 21.0 61.8 21.2 18.3 86.6 1
23.6 Phthalic anhydride 96
6.7
6.7
8
24 Phenol, 2,6-dimethoxy- LIG6-S 21.6 13.6 16.9 12.3 13.6 23.5 49.4 42.0 60.1 28.1 17.8 63.3 0
24.2 Tetradecane 97
2.3 1.6
5.6
3.2 2.1 66.7 6
24.2 1-Tetradecene 98
5.4
5.4
8
24.3 Phenol, 3,4-dimethoxy- LIG16-S
7.0
7.0
8
24.4 N-Benzyl-2-[1-(4-methoxy-phenyl)-1H-
tetrazol-5-ylsulfanyl]-acetamide 99
3.0
3.0
8
24.6 1,3-Benzenediol, 4-ethyl- 100
8.1 11.4 9.8 2.4 24.2 7
24.7 Phenol, 2-methoxy-3-methyl- LIG19-G 3.5
3.5
8
25 Eugenol LIG4-G
3.6 5.6 9.3 6.2 2.9 46.8 6
25.1 Vanillin LIG22-G 11.1 4.7 7.8 8.7 8.9 7.6 8.7 8.9 9.1 7.9 2.5 31.5 0
25.4 2-Methyl-5-hydroxybenzofuran PS40
5.8 3.1
4.4 1.9 43.9 7
25.7 4-Methoxy-2-methyl-1-
(methylthio)benzene 101
6.9
14.4
10.7 5.3 49.7 7
25.7 2H-Pyran-2-one, 3-acetyl-4-hydroxy-6-
methyl- 102
7.2
15.5 11.3 5.9 51.7 7
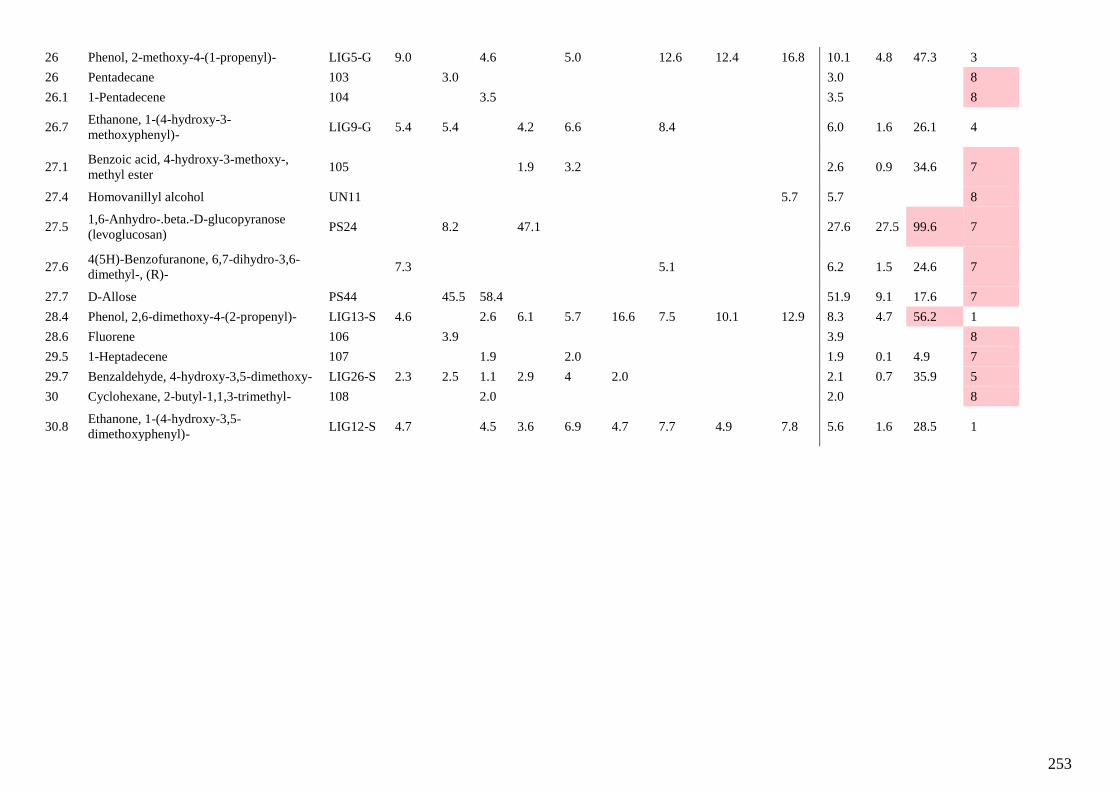
253
26 Phenol, 2-methoxy-4-(1-propenyl)- LIG5-G 9.0
4.6
5.0
12.6 12.4 16.8 10.1 4.8 47.3 3
26 Pentadecane 103
3.0
3.0
8
26.1 1-Pentadecene 104
3.5
3.5
8
26.7 Ethanone, 1-(4-hydroxy-3-
methoxyphenyl)- LIG9-G 5.4 5.4
4.2 6.6
8.4
6.0 1.6 26.1 4
27.1 Benzoic acid, 4-hydroxy-3-methoxy-,
methyl ester 105
1.9 3.2
2.6 0.9 34.6 7
27.4 Homovanillyl alcohol UN11
5.7 5.7
8
27.5 1,6-Anhydro-.beta.-D-glucopyranose
(levoglucosan) PS24
8.2
47.1
27.6 27.5 99.6 7
27.6 4(5H)-Benzofuranone, 6,7-dihydro-3,6-
dimethyl-, (R)- 7.3
5.1
6.2 1.5 24.6 7
27.7 D-Allose PS44
45.5 58.4
51.9 9.1 17.6 7
28.4 Phenol, 2,6-dimethoxy-4-(2-propenyl)- LIG13-S 4.6
2.6 6.1 5.7 16.6 7.5 10.1 12.9 8.3 4.7 56.2 1
28.6 Fluorene 106
3.9
3.9
8
29.5 1-Heptadecene 107
1.9
2.0
1.9 0.1 4.9 7
29.7 Benzaldehyde, 4-hydroxy-3,5-dimethoxy- LIG26-S 2.3 2.5 1.1 2.9 4 2.0
2.1 0.7 35.9 5
30 Cyclohexane, 2-butyl-1,1,3-trimethyl- 108
2.0
2.0
8
30.8 Ethanone, 1-(4-hydroxy-3,5-
dimethoxyphenyl)- LIG12-S 4.7
4.5 3.6 6.9 4.7 7.7 4.9 7.8 5.6 1.6 28.5 1

254
R² = 0.0068
0
0.5
1
1.5
2
2.5
3
0 2 4 6
PS/
LIG
pyr
PS/LIG NREL
Annex 11. Correlations between fungal biomass determined by qPCR and Toluene (UN1) and Styrene
(UN2) relative areas in pyrograms of fungal pretreated wheat straws.
Annex 10. Relationship between pyrolysis-GC-MS data and NREL (acid hydrolysis) measurements for
straws from Table 5-2.
R² = 0.5565
0
5
10
15
20
25
30
35
0 5 10 15 20 25
Lign
in (
py-
GC
-MS)
(%
)
Lignin Klason (NREL) (%)
Straws and mycelium
Straws
y = 0.2959x + 2.7571 R² = 0.7208
0
5
10
15
20
25
30
35
0 20 40 60 80
A
vera
ge p
er
tho
usa
nd
re
lati
ve a
rea
for
Tolu
en
e (
UN
1)
Fungal biomass (mg/g pretreated straw)
y = 0.1234x + 3.7551 R² = 0.6812
0
2
4
6
8
10
12
14
16
18
20
0 20 40 60 80
A
vera
ge p
er
tho
usa
nd
re
lati
ve a
rea
for
Styr
en
e (
UN
2)
Fungal biomass (mg/g pretreated straw)

255
Annex 12. P. brumalis BRFM 985 growth in pilot-reactor on wheat straw (two trays with different
particle sizes) whitout fungal contamination.
m m
Annex 13. C/N of pretreated straws during the selection step. w:weeks
0
20
40
60
80
100
120
140
160
C/N
in p
retr
eat
ed
TS
Preatreated straws in SSF columns identified by their BRFM number
Optimium for anaerobic digestion

256
Annex 14. Homogeneous fungal growth in glass columns. From S. Zhou.
Annex 15. Fungal contamination after trial of wheat straw pretreatment with P. brumalis BRFM 985
in the LBE pilot-reactor.

257
Annex 16. Successfull growth of P. brumalis BRFM 985 on miscanthus straw pretreated in pilot-
reactor.

258
Annex 17. Data used to plot the PCA in Chapter 7. As mentioned in chapter 7, units are in %TS for non dimensionless variables and BMP is expressed in NmL/g VS pretreated. N. A.: Not Available.
TC TKN
PS/LIG -pyr
PS/LIG NREL
S/G -pyr
PS1/ LIG
PS2/ LIG
BMP Fungi Yield Cellulose Hemi Lignin
Cel Loss
Hemi Loss
LIG Loss LOI
236 46.31 0.410 1.84 2.98 0.49 1.81 1.75 216.64
92.27 39.39 28.90 22.93 10.49 18.92 7.83 1.10
957 43.91 0.57 2.74 3.77 0.36 2.18 2.06 266.10 73.10 71.22 38.30 29.87 18.08 39.90 43.98 51.40 1.10
985 44.93 0.53 2.11 4.11 0.38 2.09 1.93 279.52 49.50 86.34 41.05 29.34 17.12 16.10 28.34 40.10 1.11
1048 43.81 0.64 N. A. 3.81 1.96 1.87 232.22 48.00 85.13 38.82 30.90 18.31 17.60 21.62 35.20 1.06
1296 44.26 0.64 2.01 3.42 0.52 2.16 2.06 243.43
84.37 36.40 30.48 19.56 24.94 25.18 30.92 1.05
1369 44.35 0.46 N. A. 3.54 2.08 2.02 209.96 63.50 79.28 37.47 30.73 19.29 28.10 37.30 29.63 1.04
1554 44.34 0.56 0.69 3.62 0.44 2.08 2.03 211.57 19.80 84.79 36.77 30.63 18.59 24.80 25.17 34.40 1.08
NIC 46.01 0.40 1.57 3.15 0.40 N. A. N. A. 194.42 0.00 100.00 37.48 31.45 21.90 0.00 0.00 0.00 N. A.
985-2w 45.31 0.48 0.83 3.93 0.57 2.17 1.98 _ 28.00 87.40 39.45 31.95 18.16 15.50 5.24 24.04 1.04
1554-2w 45.85 0.48 0.69 3.50 0.44 2.15 2.02 _ 28.30 85.60 41.49 32.01 21.03 12.95 5.28 13.87 1.06
NIC-2w 47.11 0.33 1.84 3.35 N. A. 1.81 1.64 _ 0.00 100.00 40.80 29.30 20.90 0.00 0.00 0.00 1.16

259
Annex 18. Correlation between BMP values in NmL/g VS pretreated and BMP values in NmL/g TS
pretreated from samples from the selection step.
Annex 19. DmodX values in the space defined by three components for samples from the PCA
presented in Chapter 7. G
R² = 0.9932
0
50
100
150
200
250
300
0 50 100 150 200 250 300
BM
P (
Nm
L/g
VS
pre
tre
ate
d)
BMP (NmL/g TS pretreated)