Anaerobic Bioconversion of Carbon Dioxide to Biogas in an Upflow Anaerobic Sludge Blanket Reactor
9
Anaerobic Bioconversion of Carbon Dioxide to Biogas in an Upflow Anaerobic Sludge Blanket Reactor Mahmood Alimahmoodi and Catherine N. Mulligan Department of Building, Civil and Environmental Engineering, Concordia University, Montreal, Quebec, Canada ABSTRACT The increasing concentration of carbon dioxide (CO 2 )— the most dominant component of greenhouse gases—in the atmosphere has been of growing concern for many years. Many methods focus on CO 2 capture and storage and there is always the risk of CO 2 release to the environ- ment. In this study, a new method to convert CO 2 to biogas with a high content of methane (CH 4 ) in an an- aerobic system with a lab-scale upflow anaerobic sludge blanket reactor at 35 °C was developed. In a series of experiments, the reactor was run with and without CO 2 - saturated solutions including volatile fatty acids (VFAs) as sources of hydrogen. The concentration of dissolved CO 2 in the influent solutions was 2.2– 6.1 g/L, with corre- sponding chemical oxygen demand (COD) values of 2.6 – 8.4 g/L for the solutions. Overall CO 2 removal values of 2.7–20 g/day (49 – 88% conversion) were obtained for the organic loading rates (OLR) and CO 2 loading rates of 8 –36 gCOD/L day and 6–26 gCO 2 /L day, respectively with CH 4 purity of above 70%. Also, VFA and COD removal were in the range of 79 –95% and 75–90%, respectively. Methanogenic activities of the cultures with the concen- trations measured as volatile suspended solids (VSSs) were 0.12–0.40 L CH 4 /gVSS d with the highest value for the system containing acetic acid. This anaerobic method can be applied to reduce CO 2 emitted to the atmosphere from a wide variety of industrial point sources with a value- added product, CH 4 . INTRODUCTION According to the U.S. Environmental Protection Agency (EPA), 1 since the beginning of the industrial revolution, atmospheric concentrations of carbon dioxide (CO 2 ) have increased nearly 30%. The mean annual concentration of CO 2 in the atmosphere has increased from 315.98 ppmv of dry air in 1959 to approximately 375.64 ppmv in 2003. 2 There have been many attempts aimed at reducing CO 2 emissions in the form of CO 2 sequestration through its injection in the underground waters, e.g., saline wa- ters, aquifers, or deep oceans. 3–5 However, in all of these processes, CO 2 is transferred from one place to another and there is always the risk of CO 2 release to the atmo- sphere again. CO 2 can be converted to methane (CH 4 ) either chem- ically or biologically. Some experiments in microchemical catalytic reactors at 250 °C have reached 90% CO 2 con- version. 6 Biological conversion of CO 2 into sparingly sol- uble carbonate minerals such as calcite (CaCO 3 ) and si- derite (FeCO 3 ) has been studied using Fe(III)-reducing bacteria in conjunction with metal containing fly ash and lime. 7 In this process, fly ash is stabilized into carbonate solid conglomerates that could potentially be useful as fill materials or road construction aggregates. Examples of biological methods to reduce CO 2 emissions in power plants have been photosynthetic systems with cyanobac- teria or microalgae 8,9 and bioelectro methods. 10 In the method developed by Otaguchi et al., 9 CO 2 was converted to biofuel, H 2 , and ethanol with different cultures. They used a strain of cyanobacteria cultivated on 6% CO 2 in an air stream and obtained a maximum H 2 production rate of 0.13 mmol/dm 3 hr at 35 °C. Lombardi 11 compared three CO 2 low-emission power cycles using a life cycle assessment procedure. These com- bined cycles include application of chemical methods, e.g. chemical absorption, synthesis gas treatment, or the use of gas liquefaction units. For these systems, values of 85% CO 2 removal efficiency have been reported. In an- other study, efficiency values of 85–99.5% were reported for CO 2 removal in iron and steel industry 12 using special absorbents like Selexol (dimethylether of polyethylene glycol), in which the captured CO 2 was then compressed and transferred for storage, e.g., to aquifers or oceans. Another biological process with the potential to re- move CO 2 is anaerobic treatment. In the final step (methanogenesis), simple organic molecules including short-chain fatty acids along with CO 2 and hydrogen are converted to biogas. Therefore, it is possible to simulate this step and provide conditions to convert CO 2 to biogas using methanogens. Methanogenic archaea are obligate anaerobes. In fact, they are the strictest anaerobes discov- ered. 13 Most methanogens can grow using hydrogen as a source of electrons via hydrogenase. In many methano- genic environments, H 2 is utilized rapidly even when it is present at very low concentrations. 14 IMPLICATIONS CO 2 is the major contributor to the greenhouse gas effect and global warming. In this study a new approach was developed to convert CO 2 to CH 4 , which in addition to reducing its emission provides CH 4 as a clean source of energy. Air and energy management sections would benefit from the application of this method and in the long term, it could have a major impact on reduction of atmospheric levels of this greenhouse gas. TECHNICAL PAPER ISSN:1047-3289 J. Air & Waste Manage. Assoc. 58:95–103 DOI:10.3155/1047-3289.58.1.95 Copyright 2008 Air & Waste Management Association Volume 58 January 2008 Journal of the Air & Waste Management Association 95
-
Upload
independent -
Category
Documents
-
view
0 -
download
0
Transcript of Anaerobic Bioconversion of Carbon Dioxide to Biogas in an Upflow Anaerobic Sludge Blanket Reactor

Anaerobic Bioconversion of Carbon Dioxide to Biogas in anUpflow Anaerobic Sludge Blanket Reactor
Mahmood Alimahmoodi and Catherine N. MulliganDepartment of Building, Civil and Environmental Engineering, Concordia University, Montreal,Quebec, Canada
ABSTRACTThe increasing concentration of carbon dioxide (CO2)—the most dominant component of greenhouse gases—inthe atmosphere has been of growing concern for manyyears. Many methods focus on CO2 capture and storageand there is always the risk of CO2 release to the environ-ment. In this study, a new method to convert CO2 tobiogas with a high content of methane (CH4) in an an-aerobic system with a lab-scale upflow anaerobic sludgeblanket reactor at 35 °C was developed. In a series ofexperiments, the reactor was run with and without CO2-saturated solutions including volatile fatty acids (VFAs) assources of hydrogen. The concentration of dissolved CO2
in the influent solutions was 2.2–6.1 g/L, with corre-sponding chemical oxygen demand (COD) values of 2.6–8.4 g/L for the solutions. Overall CO2 removal values of2.7–20 g/day (49–88% conversion) were obtained for theorganic loading rates (OLR) and CO2 loading rates of 8–36gCOD/L � day and 6–26 gCO2/L � day, respectively withCH4 purity of above 70%. Also, VFA and COD removalwere in the range of 79–95% and 75–90%, respectively.Methanogenic activities of the cultures with the concen-trations measured as volatile suspended solids (VSSs) were0.12–0.40 L CH4/gVSS � d with the highest value for thesystem containing acetic acid. This anaerobic method canbe applied to reduce CO2 emitted to the atmosphere froma wide variety of industrial point sources with a value-added product, CH4.
INTRODUCTIONAccording to the U.S. Environmental Protection Agency(EPA),1 since the beginning of the industrial revolution,atmospheric concentrations of carbon dioxide (CO2) haveincreased nearly 30%. The mean annual concentration ofCO2 in the atmosphere has increased from 315.98 ppmvof dry air in 1959 to approximately 375.64 ppmv in2003.2
There have been many attempts aimed at reducingCO2 emissions in the form of CO2 sequestration throughits injection in the underground waters, e.g., saline wa-ters, aquifers, or deep oceans.3–5 However, in all of theseprocesses, CO2 is transferred from one place to anotherand there is always the risk of CO2 release to the atmo-sphere again.
CO2 can be converted to methane (CH4) either chem-ically or biologically. Some experiments in microchemicalcatalytic reactors at 250 °C have reached 90% CO2 con-version.6 Biological conversion of CO2 into sparingly sol-uble carbonate minerals such as calcite (CaCO3) and si-derite (FeCO3) has been studied using Fe(III)-reducingbacteria in conjunction with metal containing fly ash andlime.7 In this process, fly ash is stabilized into carbonatesolid conglomerates that could potentially be useful as fillmaterials or road construction aggregates. Examples ofbiological methods to reduce CO2 emissions in powerplants have been photosynthetic systems with cyanobac-teria or microalgae8,9 and bioelectro methods.10 In themethod developed by Otaguchi et al.,9 CO2 was convertedto biofuel, H2, and ethanol with different cultures. Theyused a strain of cyanobacteria cultivated on 6% CO2 in anair stream and obtained a maximum H2 production rateof 0.13 mmol/dm3 � hr at 35 °C.
Lombardi11 compared three CO2 low-emission powercycles using a life cycle assessment procedure. These com-bined cycles include application of chemical methods,e.g. chemical absorption, synthesis gas treatment, or theuse of gas liquefaction units. For these systems, values of85% CO2 removal efficiency have been reported. In an-other study, efficiency values of 85–99.5% were reportedfor CO2 removal in iron and steel industry12 using specialabsorbents like Selexol (dimethylether of polyethyleneglycol), in which the captured CO2 was then compressedand transferred for storage, e.g., to aquifers or oceans.
Another biological process with the potential to re-move CO2 is anaerobic treatment. In the final step(methanogenesis), simple organic molecules includingshort-chain fatty acids along with CO2 and hydrogen areconverted to biogas. Therefore, it is possible to simulatethis step and provide conditions to convert CO2 to biogasusing methanogens. Methanogenic archaea are obligateanaerobes. In fact, they are the strictest anaerobes discov-ered.13 Most methanogens can grow using hydrogen as asource of electrons via hydrogenase. In many methano-genic environments, H2 is utilized rapidly even when it ispresent at very low concentrations.14
IMPLICATIONSCO2 is the major contributor to the greenhouse gas effectand global warming. In this study a new approach wasdeveloped to convert CO2 to CH4, which in addition toreducing its emission provides CH4 as a clean source ofenergy. Air and energy management sections would benefitfrom the application of this method and in the long term, itcould have a major impact on reduction of atmosphericlevels of this greenhouse gas.
TECHNICAL PAPER ISSN:1047-3289 J. Air & Waste Manage. Assoc. 58:95–103DOI:10.3155/1047-3289.58.1.95Copyright 2008 Air & Waste Management Association
Volume 58 January 2008 Journal of the Air & Waste Management Association 95

Developed at Wageningen Agricultural University,The Netherlands,15 an upflow anaerobic sludge blanket(UASB) reactor uses anaerobic bacteria, especially meth-anogens, which form self-immobilized granular structuresin a “blanket” with good settling properties inside thereactor. These anaerobic bacteria granules form a blanketthrough which the effluent flows up through the reactor.Because of the high biomass concentrations of these re-actors, they can achieve conversions higher than possibleby conventional anaerobic processes and can toleratefluctuations in influent feed, temperature and pH.16
Moreover, because no support medium is required for thebiomass, it decreases the capital cost and minimizes thepossibility of plugging. The energy requirement also issmall because there is no mechanical mixing within thereactor, no recirculation of sludge, and no recirculation ofthe effluent.17
The main objective of this study was to develop a newbiological method to convert gaseous CO2 to biogas witha high- CH4 content using a wastewater treatment tech-nology. For this purpose, gaseous CO2 was first dissolvedin a medium. The CO2 substrate was then treated anaer-obically in a UASB reactor in combination with fatty acidsas sources of hydrogen to convert to biogas. Parameterssuch as dissolved and removed CO2 and biogas purity andrate were measured for two sets of experiments: with andwithout CO2 using acetic, propionic, and butyric acids.
MATERIALS AND METHODSInoculum
The granulated biomass used in the system was collectedfrom the multiplate anaerobic reactor that was developedby SNC-Lavalin (Montreal, Canada) for the treatment ofcheese water at a cheese factory in Chambord, Quebec.18
The sludge was first kept in the incubator at 35 °C fortemperature acclimation. Subsequently, it was acclimatedin the reactor with solutions including acetic acid andsodium acetate.
MaterialsA CO2 gas tank purchased from Praxair Inc. with an in-dustrial purity of 99% was used as the source of CO2.
Before making the substrates, the water was purged withnitrogen to minimize dissolved oxygen and chlorine.
Substrate solutions were made based on methano-genic media,19 and volatile fatty acids (VFAs) composedthe main constituents of the solutions. CO2 was injected
into the influent storage tank using a gas sparger. Toachieve the maximum dissolved CO2, alkalinity wasadded using a 1 N KOH solution and a positive pressure ofCO2 (1.01 � 105 Pa) was maintained in the tank to keepthe saturation condition.
The necessary components and elements for the cellgrowth were included in the solutions. Ammonium chlo-ride (crystalline 99.5%) and potassium hydrogen phos-phate (100% dry basis), purchased from Fisher ScientificLtd., served as the source of nutrients, and other inorganiccomponents and trace mineral solutions were alsoincluded.
Table 1 shows the amounts of these components per1 L of solution (all chemicals were supplied from FisherScientific Ltd.). The composition of the solution contain-ing trace elements necessary for bacterial growth is shownin Table 2. This solution was made in 1-L quantities andeach time a certain amount (10 mL) was added to themain solution according to Table 1. Other componentsused in the solutions were peptone and yeast extract thatcontained vitamins, amino acids, and coenzymes.
The amounts of the acids, sodium acetate, peptone,and yeast extract (supplied from Fisher Scientific Ltd.) andthe approximate chemical oxygen demand (COD) valuesof the solutions are shown in Table 3. The adjustmentswere made for the flow rate and concentration for eachloading rate to avoid possible channeling in the reactorand maintaining recommended upflow velocities.20,21 A 1N KOH solution (from 86.9% solid KOH) was preparedand added to adjust the pH of the solutions.
ANALYTICAL METHODSDissolved CO2 concentration in the reactor influent andeffluent was measured using the alkalinity and pH valuesbased on the equilibrium relationships among carbonatespecies, hydrogen, and hydroxyl ions. It was also mea-sured in the influent by measuring the amount of injectedCO2 using a gas-flow meter and the injection time toreach a constant pH.
For dissolved CO2(aq), the equilibrium reactions areas follows:
H2O � CO2�aq�N H� � HCO3�
K1 �[H�][HCO3
�][CO2�aq�]
� 4.47 � 10�7 M(1)
Table 1. Composition of the inorganic materials used in the experiments.
ComponentPurity
(%)Amount
(g/L)
Sodium chloride 99.7 0.6Potassium phosphate 100 0.44Magnesium chloride 99.8 0.2Calcium chloride 98.6 0.2Ammonium chloride 99.5 1.2Trace mineral solution – 10 mL
Table 2. Composition of the trace minerals used in the experiments.
MineralsPurity
(%)Amount
(g/L)
Manganese (II) sulfate hydrate 98.0 0.1Cobalt chloride 97.0 0.013Calcium chloride 98.6 0.076Copper chloride 99.0 0.02Zinc chloride 97–100.5 0.1Sodium chloride 99.7 1.0Nickel (II) chloride hexahydrate 99.9 0.12Iron (III) chloride hexahydrate 100.0 1.34
Alimahmoodi and Mulligan
96 Journal of the Air & Waste Management Association Volume 58 January 2008

HCO3� N H� � CO3
2�
K2 �[H�][CO3
2�][HCO3
�]� 4.68 � 10�11 M
(2)
By combining two equations, the following is obtained:
K1K2 �[H�]2[CO3
2�][CO2�aq�]
� 2.1 � 10�17 (3)
Other equations for pH, alkalinity, and water dissociationare as follows:
[H�] � 10�pH (4)
Alkalinity � [OH�] � [HCO3�] � 2[CO3
2�] � [H�] (5)
Kw � [H�][OH�] (6)
Using the above equations and measuring the alka-linity and pH, the concentrations of species CO3
2� andHCO3
�, and then CO2(aq) were calculated.The mass balance for CO2 (in g/day) was calculated as
follows:
CO2�aq�i � CO2�aq�e � �CO2�b � �CO2�rem
� �CO2�p � �CO2�m
(7)
where: CO2(aq)i represents dissolved CO2 in the influent,CO2(aq)e represents the dissolved CO2 in the effluent,(CO2)b is the CO2 in the biogas, (CO2)p is the CO2 pre-cipitated in the reactor, (CO2)rem is the removed CO2, and(CO2)m is the CO2 converted to CH4.
Fatty acid concentrations were determined by aBeckman-Coulter high-performance liquid chromato-graph using a YMC 8476 column with ultraviolet (UV)detection (Model 166 Programmable Detector Module) ata wavelength of 210 nm. The mobile phase was a 50-mMsolution of ammonium phosphate (pH 2.4). Solutions of0.25, 0.5, 1, 2, and 3 g/L VFAs were used to make thereference curve.
The CH4 concentration of the biogas was determinedby a gas chromatography ([GC] VARIAN CP 3800 with athermal conductivity detector [TCD]) using a Carboxen
1010 plot (30 � 0.53 mm) capillary column from SU-PELCO. Helium was the carrier gas with a 225 °C inlettemperature, TCD, a column oven temperature of 50–100 °C (ramped at 5 °C/min), an injection flow of 5 mL/min, and a run time of 15 min. Gas samples of 40, 50, 60,70, 80, 90, and 100% (vol/vol) CH4 were used to make thereference curve.
The COD was measured according to a colorimetricmethod (standard method22 5220B) using a Perkin-ElmerLambda Model 40 UV/visible spectrometer at 600-nmwavelength. For this purpose, twist-cap vials (purchasedfrom Bioscience Inc.) were used and a standard potassiumhydrogen phthalate (KHP) solution with 500 g/L CODwas prepared. The COD balance for the system can bewritten as follows:
CODrem.�CODi�CODe�CODm�CODb�CODloss (8)
where: CODrem is the COD removed, CODi is the influentCOD, CODe is the effluent COD, CODm is the COD con-verted to CH4, CODb is the COD converted to microbialbiomass, and CODloss represents the COD loss from the
Figure 1. Schematic of the experimental setup.
Table 3. COD values and concentration of the basic components used (g/L) in the three systems for each run of the reactor (indicated by 1– 4).
Parameter/Substance
System 1 System 2 System 3
1 2 3 4 1 2 3 4 1 2 3 4
COD 2.7 2.8 5.2 8.3 3.2 3.4 5.8 8.2 3.5 3.6 6.1 8.3Sodium acetate 1.5 1.5 2.5 4.0 1.5 1.5 2.5 4.0 1.5 1.5 2.5 4.0Acetic acid 0.7 0.7 1.3 2.0 0.25 0.25 0.5 0.7 – – – –Propionic acid – – – – 0.25 0.25 0.5 0.7 0.5 0.5 0.75 1.1Butyric acid – – – – 0.25 0.25 0.5 0.7 0.5 0.5 0.75 1.1Peptone 0.4 0.4 0.75 1.0 0.4 0.4 0.75 1.0 0.4 0.4 0.75 1.0Yeast extract 0.8 0.8 1.5 2.0 0.8 0.8 1.5 2.0 0.8 0.8 1.5 2.0
Alimahmoodi and Mulligan
Volume 58 January 2008 Journal of the Air & Waste Management Association 97
reactor in the form of leaking biogas through the reactorfittings and connections. All values are in g/day.
Other parameters such as volatile suspended solids(VSS) were determined according to standard methods.22
EXPERIMENTAL SETUPAs shown in Figure 1, the experimental setup used hadseveral sections that can be described as follows:
(1) A translucent graduated plastic cylinder with40-cm height, 7-cm diameter, and 1-L workingvolume was used as an UASB reactor. It had a flowdistributor at the inlet and a layer of glass beads atthe bottom for a uniform distribution of the in-fluent and to avoid no-flow zones.
(2) A warm-water, closed-circulation coil around thereactor vessel to maintain the operating temper-ature of the reactor at 35 °C. A thermometer wasinstalled in the reactor above the gas-liquid-solid(GSL) separator to monitor the temperature.
(3) Internal GSL separator to separate sludge particlesfrom the upflow of liquid and gas streams andreturn them to the sludge zone, which was madeusing two plastic funnels specially cut for thispurpose and were installed in the upper section ofthe reactor. The upper funnel served as a gascollector and the lower one as a side-baffle toconduct liquid and gas streams.
(4) A pH-measuring and control unit with peristalticpumps.
The reactor vessel had an efficient design with a uni-form influent distributor, which is an important factor foreven distribution of the flow through the reactor. Thereactor was tested with dye solutions before the experi-ments and it was observed that for a wide range of influ-ent flow rates, the dye was distributed with a uniformplug-flow pattern in the reactor and no disturbance orchanneling was observed.
During this work, it was observed that maintaining acontinuous and steady condition of the reactor operationregarding organic load, flow rate, and feed compositionplays an important role in the system efficiency. Theliquid and gas samples were taken in at least duplicates(mostly triplicates) for each run of the reactor and theresults were reported at the steady state. The steady-statecondition was based on the data analysis for the inputand output (the effluent and biogas) streams. If there werenegligible differences between two consecutive sets ofexperimental data (which was considered to be a maxi-mum difference of 5% or less), it was assumed that thesteady state had been reached.
Table 4. Comparison of specific methanogenic activity (SMA) for severalstudies and this work.
SMAL(CH4)/gVSS � d Test Conditions Reference
0.2–0.4 Respirometer at 35 °C, acetic acid James et al.24
0.42–0.5 Individual and mixed VFAsa, 37 °C Soto et al.25
0.072 (max) SMA test reactors, acetic acid, 35 °C Ince et al.26
0.44 (max) SMA test, acetate, 31 °C Gonzalez et al.27
0.40 (max) Batch tests, acetic acid, and mixedVFAsa, 35 °C
This study
Notes: aVFAs included acetic, propionic, and butyric acids
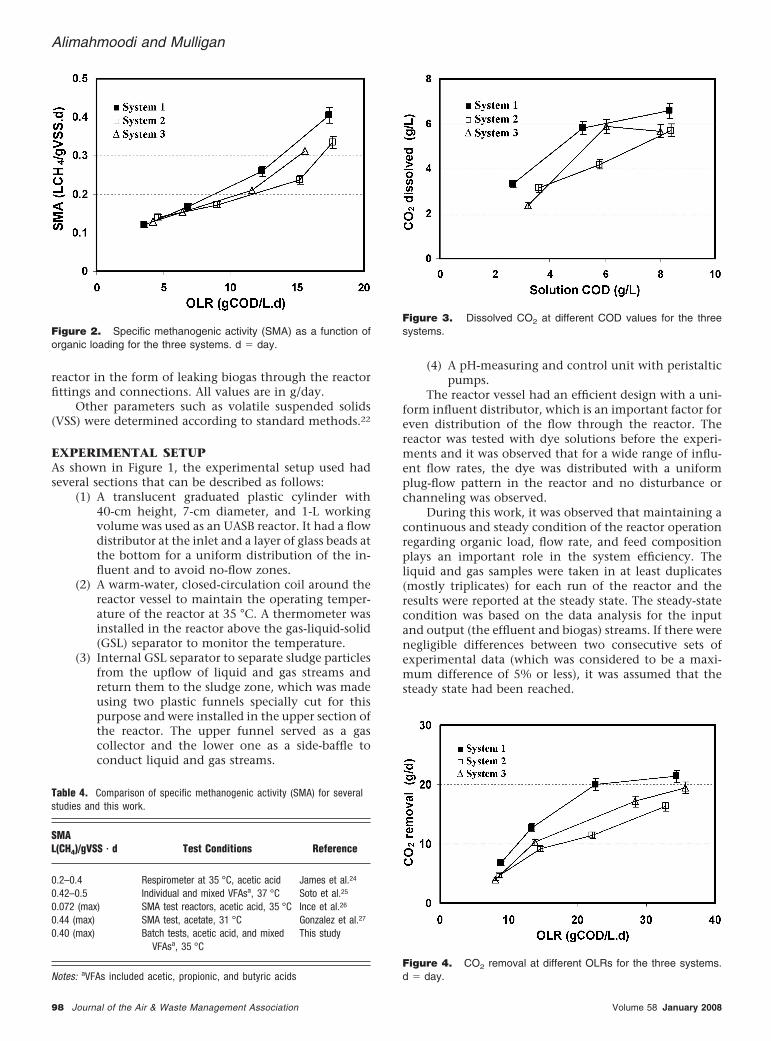
Figure 2. Specific methanogenic activity (SMA) as a function oforganic loading for the three systems. d � day.
Figure 3. Dissolved CO2 at different COD values for the threesystems.
Figure 4. CO2 removal at different OLRs for the three systems.d � day.
Alimahmoodi and Mulligan
98 Journal of the Air & Waste Management Association Volume 58 January 2008

A 4-L dark glass bottle was used to store the influentsolutions and pure CO2 was injected into it during con-tinuous operation to ensure the saturation condition andto keep a positive pressure of CO2 (1.01 � 105 Pa) toprevent aerobic conditions. A peristaltic pump was usedas the reactor feed pump and the effluent was collected ina separate tank. A special syringe was used to collect thegas samples from the reactor headspace.
RESULTS AND DISCUSSIONThree systems with solutions including acetic acid and/ordifferent mixtures of short-chain fatty acids (acetic, pro-pionic, and butyric acids) were used to study the effect ofacetic acid as the simplest fatty acid and other fatty acidson the system performance:
(1) System 1, with solutions including acetic acid;(2) System 2, with solutions including acetic � pro-
pionic � butyric acids; and(3) System 3, with solutions including propionic and
butyric acidsThe COD and VFA concentrations used in each run of
the reactor are shown in Table 3. The reactor was first runwithout CO2 injection in the solutions and the methano-genic activity23–27 of the biomass for the three systemswas measured to evaluate the ability of the biomass fordecomposition of fatty acids. The results are shown inFigure 2 and compared with other previous research inTable 4. Maximum values of 0.12 and 0.40 L CH4/gVSS � day were obtained for methanogenic activity of thesystems containing mixed VFAs and acetic acid, respec-tively, showing the highest activity for system 1. In an-other set of experiments, the performance of the systemswas assessed using CO2-saturated influents, and the sys-tems were compared in terms of CO2 removal as well asCH4 production and purity.
Dissolved and Removed CO2
The influent solutions were saturated with gaseous CO2
and, as shown in Figure 3, it was observed that the valuesof dissolved CO2 increased with solution concentration(shown as COD). When compared with the dilute solu-tions, it was observed that the pH drop (as a result of CO2
injection) for the concentrated solutions happened over alonger period of time. This could be due to higher initialalkalinity and buffering capacity of the concentrated so-lutions, which increased their absorption capacity. Theconcentration of dissolved CO2 was 2–6.8 g/L for theCOD values of 2.6–8.4 g/L for the three systems.
Results for overall CO2 removal are shown in Figure 4for the three systems. The values of 3.6–21 g/day for theorganic loading rates (OLRs) and CO2 loading rates of 8–36gCOD/L � day and 6–27 gCO2/L � day were obtained, respec-tively, with higher removal values for system 1, which in-cluded acetic acid as the sole fatty acid. This could be due tosimilarities between methanogenic pathways from H2 andacetic acid. Some of the intermediate reactions and reactionproducts in methanogenenic pathways from CO2 and ace-tate are the same, such as formation of CH3-H4MPT (meth-yltetrahydromethanopterin) and CH3-S-CoM (CoenzymeM), which lead to CH4 in both pathways.28 Also, system 1showed higher methanogenic activity due to better acclima-tion of the biomass to acetate, as shown in Figure 2.
Because dissolved CO2 can take part in different re-actions in a system containing VFAs (i.e., its consumptionby hydrogentrophic methanogens), the reactions amongthe inorganic species (i.e., Ca�2 and Mg�2) and the pres-ence of other sources of CO2 production (i.e., degradationproducts of VFAs mentioned in Table 5),28 the contribu-tions of each part were not clear. However, the overallremoval of CO2 was determined using the mass balanceequation (eq 7) and the results obtained from the exper-iments without dissolved CO2. Table 6 shows the valuesof CO2 balance and Figure 5 shows the removal percent-age of 69–86% for CO2 removal for the three systems.
Figures 4 and 5 show that the rate of CO2 removaldecreased as the COD loading rates increased. This couldpartly be due to decreased retention time in the reactorand lack of enough population of hydrogentrophic meth-anogens to process the higher loading rates. If the equiv-alent amount of CO2 removal in CH4 (energy units) isdrawn against the COD input rate, then Figure 6 will beobtained, which suggests that the best loading range forthe three systems is 10–20 gCOD/L � day.
Figure 7 shows the CH4 production rate (in CODequivalents) for the two sets of experiments with and
Table 5. Anaerobic degradation reactions of VFAs.28
Reaction� G0
(kJ/mole CH4)
Methanogenic reaction of acetate:Acetate� � H2O 3 HCO3
�� CH4 �31.0Syntrophic (net) reactions with H2 use by methanogens:
4 Propionate� � 3H2O 3 4Acetate� � HCO3� � H�
� 3CH4
�34.0
2 Butyrate� � HCO3� �H2O 3 4Acetate� � CH4 � H� �39.4
Table 6. Values of CO2 balance (in g/d) for the three systems.
Parameter
System 1 System 2 System 3
OLR(gCOD/L � day) 8.8 13.3 22.6 34.4 8.6 14.6 22.1 32.9 8.0 13.8 28.4 35.7(CO2)i 8.6 15.4 23.3 25.1 6.4 11.7 14.7 20.6 5.4 12.3 20.3 23.3(CO2)e 0.5 0.7 0.7 0.3 0.2 0.5 0.3 0.3 0.5 0.4 0.5 0.4(CO2)b 1.3 1.9 2.6 3.3 1.5 2.1 2.9 4.0 1.0 1.7 2.6 3.4(CO2)rem. 6.7 12.8 19.9 21.4 4.7 9.1 11.4 16.3 3.9 10.2 17.2 19.4
Alimahmoodi and Mulligan
Volume 58 January 2008 Journal of the Air & Waste Management Association 99

without dissolved CO2 in the influent solutions. It wasobserved that dissolved CO2 improved the net rate of CH4
production in the systems with the highest rate for system1. This is also in accordance with the result of the highestrate of CO2 removal for this system in Figure 4. Thisbehavior in system 1 can be explained as follows:
(1) As already mentioned, it could be the result ofsimilarities of the methanogenic pathways fromacetate and hydrogen and the fact that the influ-ent acidic condition makes the hydrogen ion anddissolved CO2 readily available for CO2 reductionto CH4. Also, this reaction is highly favorable,with the overall energy release of �G0 � �131kJ/mole.28
(2) Regarding the VFAs used, system 1 only con-tained acetic acid and most likely, methanogen-esis is the only reaction in this system with pos-sibly a larger population of methanogenscompared with the two other systems. In thosesystems, a symbiosis of acid-generating andmethanogenic bacteria (a multiculture) is re-quired to break down the heavier fatty acids, thusreducing the population of methanogens.
Degradation of VFAsVFA analysis of the reactor samples was performed todetermine the rate of VFA degradation and effect of addi-tion of higher molecular weight fatty acids in the systems.The results are shown in Figure 8 in COD equivalents.Although the individual analysis of VFA samples showedhigher removal rates for acetic acid, the results of overallVFA removal were similar for the three systems. However,as mentioned before in Figure 7, the addition of heavierfatty acids seemed to reduce the CH4 production rate,probably because the culture was previously acclimatedon acetate, which is easier to degrade. Also, the effect ofsyntrophic metabolism (occurring for the systems withheavier fatty acids) was less likely to occur for system 1.
COD Removal and CH4 ProductionCOD removal values of 75–90% were calculated for thethree systems, with higher values for system 1 with aceticacid. This is because it is easier to cleave by acetoclasticmethanogens than the two other systems with heavierfatty acids. Also, the actual CH4 production based on
Figure 5. CO2 removal efficiency as a function of OLR for the threesystems. d � day.
Figure 6. CO2 removal (as CH4) per unit COD added as a functionof OLR for the three systems. d � day.
Figure 7. Comparison of CH4 production rate for the three systemswith and without CO2 injection (upper and lower trend, respectively).d � day.
Figure 8. VFA removal trends as a function of OLR for the threesystems. d � day.
Alimahmoodi and Mulligan
100 Journal of the Air & Waste Management Association Volume 58 January 2008

COD removal was determined for the three systems (with-out CO2) and the results were compared with the theo-retical value of 0.395 at the mesophilic temperature of35 °C. Figure 9 shows these results, in which COD con-version was higher for system 1 with only acetic acidcompared with the two other systems.
Variations of pH and AlkalinityThe influent pH and alkalinity were found to be importantoperating parameters of the reactor operation. Because ofthe reactions that involved consumption of hydrogen andCO2, pH and alkalinity increased during the operation. Hav-ing a high concentration of VFAs in the influent as sourcesof hydrogen was favorable but it lowered the influent pH,which was not in favor of the methanogenic condition. Onthe other hand, it was observed that the amount of dis-solved CO2 increased with initial alkalinity of the influentsolutions. Therefore, there was a trade-off between the in-fluent pH and alkalinity. Figures 10 and 11 show the varia-tion of these two parameters for the three systems.
The influent pH after CO2 injection into the influentstorage tank, was found to be approximately 5.5 � 0.1. Asmentioned before, the injection was continuous to main-tain a positive pressure in the tank and also a constantinfluent pH. Under these conditions, the effluent pH was6.7–7.6, which is within the optimum pH range of mostmethanogenic bacteria.28 Under these conditions, the val-ues of initial alkalinity for the influent solutions weremeasured between 1.2 and 3 gCaCO3/L, for which thecorresponding values for the effluent streams were 2–4.2gCaCO3/L.
In many existing wastewater treatment plants usinganaerobic treatment, medium- to high-COD wastewaterstreams consisting of complex organic compounds andinorganic species are processed in UASB reactors. Thesemedia, as a result of this study, have the capacity tocapture gaseous CO2, which can be further converted toCH4 using a source of hydrogen. Also, in the case ofCO2-containing aqueous streams, it is possible to mixthem with the main wastewater streams before treatmentand it probably requires only a preadjustment of the pH.
Therefore, no additional reactor is required for each caseand because for most anaerobic treatments the tempera-ture is in the mesophilic range (35 °C), no additionalheating is needed. Moreover, if a new facility is to beestablished for this purpose, part of the produced CH4 canbe used to provide the energy requirement of the process.All these considerations make this technique feasible andcost-effective.
Microscopic ObservationsTo monitor the structural changes of the bacteria com-pared with the original culture, morphological structureand size of the bacteria were observed during the work bytaking samples of the biomass from both reactors andtaking microscopic pictures. Fang et al.29 suggested thatthe microstructure of bacteria depends on the concentra-tion profile of the substrates and metabolites, such as VFA,acetate, hydrogen, etc. He proposed a multilayer structurefor biomass particles, treating soluble hydrocarbons withacidogens and syntrophic microcolonies in the outer lay-ers (grayish color) and methanogens being in the corelayer (a dark layer).
Figure 9. Comparison of theoretical and actual CH4 production perunit of COD removal as a function of OLR for the three systems. d �day.
Figure 10. Variation of the pH as a function of OLR for the threesystems in each run (lower trends � influent; upper trends � efflu-ent). d � day.
Figure 11. Variation of the alkalinity as a function of OLR for thethree systems in each run (lower trends � influent, upper trends �effluent). d � day.
Alimahmoodi and Mulligan
Volume 58 January 2008 Journal of the Air & Waste Management Association 101

Figure 12, a and b, shows the pictures taken fromthe original biomass and the reactor biomass for system1, respectively. The original bacteria that were used totreat cheese water had grayish particles, mostly in thesize range of 2.5–3.5 mm, resembling the above-mentioned multilayer structure for a multiculture bio-mass. However, the biomass particles observed in sys-tem 1 after a long run of the reactor were darker in colorand smaller in diameter (mostly in the size range of1.5–2 mm). The population density of the darker parti-cles were more for system 1 compared with systems 2and 3, which suggests an increased population of meth-anogens in this system.
CONCLUSIONSA new method to microbially convert gaseous CO2 to CH4
with a high purity (70%) was developed in the meso-philic range. It was demonstrated that VFAs can serve assources of hydrogen for hydrogentrophic methanogensand can be the basic constituents of media with high CO2
absorption capacity. Better removal efficiency of CO2 inthe system including acetic acid suggests that it can beused as an alternative source of hydrogen for CO2 reduc-tion to CH4. Methanogenic activity of the anaerobic cul-ture was found to be a useful parameter to evaluate theCH4-generating potential and acclimation of the cultureto different fatty acids as well as loading characteristic ofthe reactor. The experiments also demonstrated the abil-ity of a UASB reactor to handle high OLRs under con-trolled and steady operating conditions. The method isapplicable to a variety of point sources of gaseous CO2
emissions and also to process CO2-containing aqueousstreams, e.g., from CO2 scrubbers.
For future work, the application of this method canbe investigated for the CO2 removal from other aqueousand also nonaqueous media. This can include simulationof the actual conditions for on-site applications (e.g., en-hancement of coal-bed CH4, or recovery of the wastestream that is generated during the process of enhancedoil extraction from oil wells and contains dissolved CO2).For each case, a certain acclimation condition is requiredto grow a specific culture and the operating conditionsshould be optimized to achieve the maximum CO2
removal.
ACKNOWLEDGMENTSThe authors thank Mr. Parisella for his assistance in thelaboratory. The authors also acknowledge the financialsupport provided by Concordia University to do thiswork.
REFERENCES1. Samenow, J. U.S. Environmental Protection Agency Global Warming
Site; available at http://yosemite.epa.gov/oar/globalwarming.nsf/content/Climate.html (accessed 2007).
2. Keeling, C.D.; Whorf T.P. Carbon Dioxide Research Group, ScrippsInstitution of Oceanography, University of California, La Jolla, CA;available at http://cdiac.esd.ornl.gov/trends/co2/sio-mlo.htm (accessed2007).
3. Hitchon, B. Aquifer Disposal of Carbon Dioxide: Pilot Experiment forGeological Sequestration of Carbon Dioxide in Saline Aquifer Brine Forma-tions Hydrodynamic and Mineral Trapping–Proof of Concept; GeosciencePublishing: Sherwood Park, Alberta, Canada, 1998.
4. Reeve, D.A. The Capture and Storage of Carbon Dioxide Emissions; Officeof Energy Research and Development Natural Resources: Ottawa, On-tario, Canada, 2000.
5. Herzog, H.; Caldeira, K.; Reilly, J. An Issue of Permanence: Assessingthe Effectiveness of Temporary Carbon Storage; Climatic Change 2003,59, 293-310.
6. VanderWiel, D.P.; Zilka-Marco, J.L.; Wang, Y.; Tonkovich, A.Y.; We-geng, R.S. Carbon Dioxide Conversions in Microreactors; Pacific North-west National Laboratory: Richland, WA, 1999.
7. Roh, Y.; McMillan A.D.; Lauf, R.J.; Phelps T.J. Utilization of Biomin-eralization Processes for Carbon Sequestration; Abstract for AnnualMeeting American Geophysical Union, December 15–19, San Fran-cisco, CA, 2000.
8. Maeda, K.; Owada, M.; Kimura, N.; Omata, K.; Karube, I. CO2 Fixationfrom the Flue Gas on Coal-Fired Thermal Power Plant by Microalgae;Energy Convers. Mgmt. 1995, 36, 717-720.
9. Otaguchi, K.; Kajiwara, S.; Mustaqim, D.; Takahashi, N. CyanobacterialBioconversion of Carbon Dioxide for Fuel Productions; Energy Convers.Mgmt. 1997, 38, S523-S528.
10. Kuroda, M.; Watanabe, T. CO2 Reduction to Methane and AcetateUsing a Bio-Electro Reactor with Immobilized Methanogens and Ho-moacetogens on Electrodes; Energy Convers. Mgmt. 1995, 36, 787-790.
11. Lombardi, L. Life Cycle Assessment Comparison of Technical Solu-tions for CO2 Emissions Reduction in Power Generation; Energy Con-vers. Mgmt. 2003, 44, 93-108.
12. Gielden, D. CO2 Removal in Iron and Steel Industry; Energy Convers.Mgmt. 2003, 44, 1027-1037.
13. Harley, J.P.D.; Klein, A.; Prescott, L.M. Microbiology; William C. Brown:Dubuque, IA, 1990.
14. Wolin, M.J. In Microbial Production and Utilization of Gases (H2, CH4,CO), Sclegel H.G., Gottsschalk G., Pfennig N., Eds.; E. Goltze Verlag:Gottingen, Germany, 1976, pp 141-150.
15. Lettinga, G. In Proceedings of the 4th European Sewage and Refuge Sym-posium, Munich, Germany, 1978.
16. Sreekrishnan, T.R.; Ali, M. New Developments in Bioreactor Design forBiomethanation Process, United Nations Development Program;Bioenergy News 1999, 3, 20-23.
17. Praveen, V.V.; Ramachandran, K.B. In Proceedings of the Ninth NationalConvention of Institution of Engineers; Ayyanna, C., Ed.; Vishakhapat-nam, India, 1993.
18. Mulligan, C.N.; Safi, B.; Mercier, P.; Chebib, J. In Environmental Bio-technology: Principles and Applications; Moo-Young, M., Anderson W.A.,
Figure 12. Biomass particles from (a) the cheese water treatment plant and (b) in system 1 (magnification, �50).
Alimahmoodi and Mulligan
102 Journal of the Air & Waste Management Association Volume 58 January 2008
Chakrabarty, A.M., Eds.; Kluwer: Dordrecht, the Netherlands, 1996;pp 544-566.
19. Atlas, M. Handbook of Microbiological Media; CRC: Boca Raton, FL,1997; pp 898-901, 911.
20. Kleerebezem R.; Macarie H. Anaerobic Digestion Comes of Age; Chem.Eng. 2003, 110, 56-64.
21. Tchobanoglous G.; Burton, F.L.; Stensel, D.H.; Metcalf and Eddy Inc.Wastewater Engineering; Treatment and Reuse, 4th ed.; McGraw-Hill:New York, 2003.
22. Clescerl, L.S.; Greenberg, A.E.; Eaton, A.D. Standard Methods for theExamination of Water and Wastewater, 20th ed.; American PublicHealth Association, American Water Works Association, and the Wa-ter Environment Federation: Washington, DC, 1998.
23. Dolfing, J.; Bloemen, W. Activity Measurement as a Tool to Charac-terize the Microbial Composition of Methanogenic Environments; J.Microbial. Methods 1985, 4, 1-12.
24. James, A.; Chernicaro, C.A.L., Campos, C.M.M. The Development of aNew Methodology for the Assessment of Specific Methanogenic Ac-tivity; Water Res. 1990, 24, 813-825.
25. Soto, M.; Mendez, R.; Lema, J.M. Methanogenic and Non-Methano-genic Activity Tests. Theoretical Basis and Experimental Setup; WaterRes. 1993, 27, 1361-1376.
26. Ince, O.; Kasapgil, B.; Yenigun, O. Determination of Potential Meth-ane Production Capacity of a Granular Sludge from a Pilot-Scale Up-flow Anaerobic Sludge Blanket Reactor Using a Specific MethanogenicActivity; J. Chem. Technol. Biotechnol. 2001, 76, 573-578.
27. Gonzalez-Gil, G.H.; Lenz, P.N.L.; Van Aelst, A.; Van As, H.; Versprille,A.I.; Lettinga, G. Cluster Structure of Anaerobic Aggregates of anExpanded Granular Sludge Bed Reactor; Appl. Environ. Microbiol. 2001,67, 3683-3692.
28. Ferry, J.G. Methanogenesis: Ecology, Physiology, Biochemistry & Genetics;Chapman and Hall: New York, 1993.
29. Fang, H.H.P.; Chui, H.K.; Li, Y.Y. Effect of Degradation Kinetics on theMicrostructure of Anaerobic Biogranules; Water Sci. Technol. 1995, 32,165-172.
About the AuthorsMahmood Alimahmoodi is a Ph.D. student in the Depart-ment of Building, Civil, and Environmental Engineering atConcordia University. Catherine N. Mulligan is an associateprofessor and research chair in environmental engineeringin the Department of Building, Civil, and EnvironmentalEngineering at Concordia University. Please address cor-respondence to: Catherine N. Mulligan, Department ofBuilding, Civil, and Environmental Engineering, ConcordiaUniversity, 1455 de Maisonneuve Boulevard West, Mon-treal, Quebec, Canada H3G 2W1; phone: �1-514-848-2424ext. 7925; fax: �1-514-848-7965; e-mail: [email protected].
Alimahmoodi and Mulligan
Volume 58 January 2008 Journal of the Air & Waste Management Association 103