
v-12-n-25-abr-jun-2008.pdf - Interface – Comunicação Saúde ...
Upload
khangminh22Category
view
0download
0
Application of Anaerobic Baffled Reactor (ABR) for treatment of
Raw Palm Oil Mill Effluent (POME)
by
Arizwan B. Abd Aziz
Dissertation submitted in partial fulfillment of
the requirements for the
Bachelor ofEngineering (Hons)
(CIVIL ENGINEERING)
JUNE 2011
Supervised by: Dr. Amirhossein Malakahmad
Universiti Teknologi PETRONAS
Bandar Seri Iskandar
31750 Tronoh
Perak Darul Ridzuan

CERTIFICATION OF APPROVAL
Application of Anaerobic Baffled Reactor (ABR) for treatment of
Raw Palm Oil Mill Effluent (POME)
by
Arizwan B. Abd Aziz
A project dissertation submitted to the
Civil Engineering Programme
Universiti Teknologi PETRONAS
in partial fulfillment of the requirements for the
BACHELOR OF ENGINEERiNG (Hons)
(CIVIL ENGINEERiNG)
(Dr. Amirhossein Malakahmad)
Universiti Teknologi PETRONAS
Tronoh, Perak
JUNE 2011

CERTIFICATION OF ORIGINALITY
This is to certifY that I am responsible for the work submitted in this project, that the original work is my own expect as specified in the references and acknowledgements, and that original work contained herein have not been undertaken or done by unspecified sources or persons. I am also already doing the cleaning process in the laboratory and submit all the apparatus that I use for my final year project.
ARIZWAN B. ABD AZIZ
Zaaba Bin Mohammad Lab Technologist · Civil Engineering Department Universiti Teknologi PETRONAS BandarSeri Iskandar, 31750 Tronoh Perak Darul Ridzuan, MALAYSIA Ema~: [email protected]

ABSTRACT
Palm Oil Mill Effluent (POME) is considered to be one of the most polluting wastewater
in Malaysia due to its high concentration in chemical oxygen demand (COD) and
biochemical oxygen demand (BOD). Discharge of this wastewater will increase the
oxygen demand in water bodies and endanger the aquatic life and therefore interrupting
the ecosystem in the river. The biogas produced during treatment using conventional
stabilization anaerobic pond is released to the atmosphere and not utilized. This project is
to study the application of anaerobic baffled reactor (ABR) for treatment of raw POME.
Samples were taken from Nasaruddin Palm Oil Mill, located at Bota District in Perak. An
ABR was constructed using a flexi glass sheets with the dimension of (0.48m x 0.2m x
0.29) and divided into 6 compartments. The ABR system was equipped with influent,
effluent tank, stirrer, water pump and methane gas collection chamber. Collected sludge
from the same treatment facility was used in the ABR system as seeding material. The
ABR system was initially operated with diluted factor of I :25 of the samples in order to
decrease the high value of COD with 4 days HRT and the dilution factor was continuous
decreasing by factor of 19, 15, 8, 5, 2 and lastly without any dilution. The effluent of the
system was monitored daily for pH, COD, temperature, TSS, MLSS and biogas
production. From the results, the highest percentage of COD removal was found to be at
dilution factor of 8 where 34,000 mg!L of COD influent with 98% of COD removal and
methane gas production of 941 Llday. The result shows that the ABR system has a high
potential of treating POME in short HRT because presence of baffles in the system.

ACKNOWLEDGEMENT
The author would like to express his appreciation to his supervisor, Dr. Amirhossein
Malakahmad whose encouragement, guidance and support from the initial to the final
level enabled the author to develop an understanding of the subject. His tolerance and
willingness to motivate has positively influenced in the success of this project. He
inspired the author to work harder not only in this particular project, but life in general.
To the entire Environmental Laboratory staff, Mr. Zaaba B Mohammad, Mr M Khairul
Anuar B Jamaludin and Yusyawati Bt Yahya for giving the great assistance in doing
laboratory works in completing the project. To the Final Year Research Project
Coordinator, and Ms. Husna Bt Takaijudin for coordinating and providing resources in
the early stage of the project. Furthermore, the author would like to thank the authority of
Universiti Teknologi Petronas (UTP) for providing its student with a facilities and
environment to complete this project. Finally, an honorable mention goes to my family
and friends for their understandings, supports and encouragement during the process of
this project. With the help that the author received, all difficulties and obstacles have
been overcome.
ii

TABLE OF CONTENT
1. Introduction .................................................................................. 1
1.1 Background of Study ............................................................... .1
1.2 Problem Statement .................................................................. 2
1.3 Objectives ........................................................................... 3
1.4 Scope of study ..................................................................... 3
2. Literature Review ........................................................................... 4
2.1 Anaerobic Treatment ............................................................. 4
2.2 Application of Anaerobic Treatment. .......................................... 5
2.2.1 Stabilization Ponds ...................................................... 5
2.2.2 Application of (UASB) reactor. ......................................... 8
2.2.3 Anaerobic Baffled Reactor (ABR) .................................... 10
3. Methodology .............................................................................. l4
3.1 Project Activities ................................................................ .14
3.2 Wastewater Samples ............................................................ 16
3.2.1 pH determination ....................................................... .16
3.2.2 COD determination ..................................................... 16
3 .2.3 TKN determination ..................................................... 17
3.2.4 Total Solid determination .............................................. 17
3.2.5 BOD determination ..................................................... l8
3.3 Seeding ........................................................................... .19
3.4 Reactor Characteristics and Operation ........................................ 20
iii

3.5 Sampling and analysis ........................................................... 21
4. Results and discussion .................................................................... 22
5. Economic benefits ........................................................................ 28
6. Conclusion and Recommendation ...................................................... 31
6.1 Conclusion ........................................................................ 31
6.2 Recommendations ............................................................... 31
7. References ................................................................................. 32
APPENDIX 1 ...................................................................................... 34
APPENDIX 2 ..................................................................................... .35
APPENDIX 3 .................................................................................................................. 36
APPENDIX 4 ......... ............................................................................ .37
APPENDIX 5 ........................ ............................................................. .39
APPENDIX 6 ................................................................................... ... 40
APPENDIX 7 ..................................................................................... .42
APPENDIX 8 ............... ....................................................................... 43
APPENDIX 9 ..................................................................................... .44
LIST OF TABLE
Table 2.1: Adantages and disadvanteges of the Stabilization ponds, UASB and
ABR ................................................................................................. .12
Table 2.2: The perfomance of an anaerobic treatment of raw POME ...................... 13
Table 4.1: Characteristic ofPOME .............................................................. 22
Table 4.2: Comparative analysis of performance of anaerobic baffled reactors ........... 27
iv

Table 5.1: Design criteria for ABRreactor ............................................................. 29
Table 5.2: Comparison cost of the construction between ABR and AP's system ......... 30
Table 5.3: Comparison of energy recovery between ABR and AP's system ............. .30
Table A4-l: COD content ......................................................................... .37
Table A5-l: TSS content. ......................................................................... .39
Table A6-l: pH ..................................................................................... .40
Table A7-1: Methane gas produced .............................................................. .42
LIST OF FIGURE.
Figure 2.1: Anaerobic Stabilization Ponds System ............................................. 7
Figure 2.2: Two-stage UASB system .............................................................. 9
Figure 3.1: Project Process Flow ................................................................ 15
Figure 3.2: Laboratory Scale Anaerobic Baffled Reactor. ................................... 21
Figure 4.1: Graph of COD ........................................................................ 23
Figure 4.2: Graph ofTSS ......................................................................... 24
Figure 4.3: Graph ofpH ........................................................................... 25
Figure 4.4: Graph of methane produce ......................................................... 26
Figure 5.1: ABR reactor. .......................................................................... 29
Figure A8-1: Reactor. ............................................................................ .43
Figure A8-2-ABR system ........................................................................ .43
Figure A9-Design Gas collection chamber .................................................... .44
v

ABBREVIATIONS & NOMENCLATURES
ABR Anaerobic Baffled Reactor
BOD Biochemical Oxygen Demand
COD Chemical Oxygen Demand
HRT Hydraulic Retention Time
OLR Organic Loading Rate
POME Palm Oil Mill effluent
TKN Total Kjeldahl Nitrogen
TSS Total Suspended Solids
vi

CHAPTER I
INTRODUCTION
1.1 Background of Study
Anaerobic treatment of wastewater is receiving more attention in recent year throughout
the world because the biomethanogenesis process decomposes organic matter to produce
methane gas. There are three clear advantages of anaerobic treatment over aerobic
degradation, the high product and low biomass yield resulting in a limited generation of
waste sludge as an unwanted side product, the in-situ separation of the product as biogas
and limiting costs for product separation [1 ]. Anaerobic processes have wide application
in the treatment of sewage sludge and high-strength industrial wastewater treatment.
The Anaerobic Baffled Reactor (ABR) includes a series of vertical baffles to forces the
wastewater to flow under and over them as it passes from inlet to outlet, the wastewater
comes into contact with a large active biological mass [2]. This type of reactor system has
been reported to have many advantages over other well established reactor system. It is
simple design and requires no gas separation system. Moreover, the over and underflow
of liquid reduces bacterial washout and enables it to retain active biological solids
without the use of any fixed media [3]. An anaerobic baffled reactor operates with a
combination of several anaerobic process principles, the three basic steps involved are
hydrolysis, fermentation and methanogenesis [2].
In Malaysia, palm oil is very productive industry where palm oil mills are operated at
least 300 days per year. An estimated 30 million tons of pahn oil mill effluent (POME)
are produced annually from more than 300 pahn oil mills in Malaysia. Based on the
process of oil extraction and the properties of Fresh Fruit Bunch (FFB), POME is made
up by 95%-96% of water, 0.6%-0.7% oil, and 4%-5% of total solid including 2%-4%
suspended solids, which are mainly debris from palm mesocarp [4]. Malaysia is the
largest producer and exporter of crude palm oil (CPO). Although the palm oil industry is
the major revenue earner for our country but it has also been identified as the single
1

largest sources of water pollution sources due to palm oil mill effluent (POME)
characteristic with high organic content and acidic nature [ 5].
1.2 Problem Statement
In palm oil mills, liquid effluent is mainly generated from sterilization and clarification
processes in which large amounts of steam and hot water are used. For every ton of palm
oil fresh fruit bunch, it was estimated that 0.5-0.75 tones ofPOME will be discharged. In
general appearance, palm oil effluent (POME) is a yellowish acidic wastewater with
fairly high polluting properties, with average of 25,000 mg/1 biochemical oxygen demand
(BOD), 55,250 mg/1 chemical oxygen demand (COD) and 19,610 mg/1 suspended solids
(SS). This highly polluting wastewater can cause several pollution problems and also
create other problems to the neighborhoods of the mills such as a nuisance to the passers
by or local residents and river pollution [5].
A study of high rate anaerobic treatment of palm oil mill effluent (POME) was achieved
in a two-stage up-flow anaerobic sludge blanket (UASB) reactor, achieving COD
removal efficiency up to 98.4% with the highest operating OLR of 10.63 kg COD/m3 day
(Borja and Banks, 1994c ). However, the reactor operated under overload condition with
high volatile fatty acid content became unstable after 15 days. This is due to granulation
inhibition in the reactor at high volatile fatty acid concentration. The others disadvantages
are the reactor performance is depending on the sludge settleability and this reactor might
face long start-up period if seeded sludge is not granulated [6].
A study of high rate anaerobic digestion of palm oil mill effluent (POME) was also
achieved in an up-flow anaerobic sludge-fixed film bioreactor (Najafpour, 2006). In this
study, a UASFF bioreactor with tubular flow behavior was developed in order to shorten
the start-up period at low hydraulic retention time (HRT). The reactor was operated at
38 'C and HRT of 1.5 and 3 days achieving COD removals of 89% and 97% respectively.
The problem with this reactor is the stability of the reactor is very depending on the
internal packing, high ratio of effluent recycling, feed flow rate and the up-flow velocity
[13].
2

1.3 Objectives
This project is to study the application of ABR in different COD influent
concentration for raw Palm Oil Mill Effluent (POME) taken from the factory and to
investigate the best percentage of COD reduction and biogas production.
1.4 Scope of study
In this study, the application of ABR is to reduce the amount of pollutant content in a
POME. A sample of untreated POME and sludge from anaerobic ponds was collected
from Nasaruddin Palm Oil Mill located at Bota District in Perak. Laboratory scale of
ABR was run with the real sample and sludge as seeding materials. POME samples were
collects for a few times and store in a cold room at 4 'C before use. A dilution of POME
was prepared using tap water. A sample was analysis for the pH, COD, Total solids and
MLSS. A methane gas was collected by gas collection chamber and the volume of gas is
measured using water displacement method.
3

CHAPTER2
LITERATURE REVIEW
2.1 Anaerobic Treatment
Anaerobic digestion is the degradation of complex organic matters under the absence of
oxygen. This process is time consuming as bacterial consortia responsible for the
degradation process requires time to adapt to the new environment before they start to
consume on organic matters to grow [ 6]. In the anaerobic process, the decomposition of
organic and inorganic substrate is carried out in absence of molecular oxygen. The
biological conversion of the organic substrate occur in the mixtures of primary settled
and biological sludge under anaerobic condition followed by hydrolysis, acidogenesis
and methanogenesis to convert the intermediate compounds into simpler end product as
methane (CH4) and carbon dioxide (C02) [5). Hydrolysis is where complex molecules
(i.e. lipids, protein, and carbohydrates) are converted into sugar and amino acid. In the
step acidogenesis, acidogenic bacteria will break down these sugars, fatty acid and amino
acids into organic acids which mainly consist of acetic acids (from acetogenesis) together
with hydrogen and carbon dioxide. Hydrogen and carbon dioxide will be utilized by
hydrogenotropic methanogens while acetic acid and carbon dioxide will be utilized by
acetoclastic methanogens to give methane as a final product [ 6].
Probably the most significant advantage of anaerobic treatment IS good removal
efficiency can be achieved in the system, even at high loading rates and low
temperatures. The construction and operation of these reactors is relatively simple.
Anaerobic treatment can easily be applied on either a very large or very small scale. Also,
when high loading rates are accommodated, the area needed for the reactor is small. In
anaerobic treatment, the sludge production is low due to the slow growth rates of
anaerobic bacteria [7].
4

2.2 Application of Anaerobic Treatment on POME
Due to highly polluting properties of POME, with average values of 25 000 mg/1
biochemical oxygen demand (BOD) and 50 000 mg/1 chemical oxygen demand (COD),
the most cost effective technology to treat it is anaerobic treatment [8].
POME can be easily treated using a biological treatment because of its high organic and
mineral content which is suitable for microorganism to thrive. The microorganism will
consume and break down the pollutant, turning it into harmless byproduct. In some cases,
this byproduct can potentially be use as a renewable source of energy and have a high
economic value. In order to achieve such goal, a suitable mixed population of
microorganism must be introduced and the process should be optimized. The major
reduction ofPOME polluting strength occurs during anaerobic treatment [4]. There are a
few type of anaerobic treatment including Anaerobic Stabilization Pond, Anaerobic
digestion and ABR. POME is currently using stabilization pond and anaerobic digestion
method.
2.2.1 Stabilization Ponds
Ponding system is the most current treatment system that is employed in pahn oil mills to
treat POME with more than 85% of the mills having adopted this method. Ponding
system comprises of de-oiling tank, acidification ponds, anaerobic ponds and facultative.
Stabilization pond system has high efficiency on removing COD content from POME,
because the long retention time [6].
However, the stabilization pond system didn't have facilities to capture the methane gas
and the open surface of the pond also contributes to the foul smell that could disturb the
surrounding community [ 6]. One of the palm oil factories that are using this type of
wastewater treatment is Nasaruddin Palm Oil Mill. The application of anaerobic
stabilization ponds is preferred because of its low capital cost, operating and maintenance
cost [6]. However, it consumes a large area to operate and the foul smell generated from
the system will disturb the surrounding community.
5

The ponding system is a series of 12 ponds which consisted of 2 cooling pond, a mixing
pond, 4 anaerobic ponds, 2 facultative anaerobic ponds and 4 algae ponds. The influent
POME is discharged through the cooling ponds for a 3 days and then kept in the
anaerobic ponds for 40 days of retention time. The wastewater will then be oxidized in
the oxidation ponds for 8 days retention time. The oxidized wastewater will be settled in
the settling ponds for a day and finally discharged into the stream. The sludge from
anaerobic pond will be sent into a dislodging pond.
6

.
I (3
I I Cl
I •
•
I C4
I I C2
I •
Treated POME outlets Raw POME inlets
J JArea of active GHG emision ---~ I !static collection chambers I
J JArea of minimal GHG emission J
Figure 2.1: Anaerobic Stabilization Ponds System
7

2.2.2 Application of Two-Stage Up-flow anaerobic Sludge Blanket (UASB)
reactor.
The diagram two-stage UASB shown in Figure 2.2. A 12-1 UASB reactor (A) with 13
em dia. and a 5-1 UASB reactor (M) with 9 em dia. were used for the acidogenic and
methanogenic reaction of a two-stage process. The reactors were separated by a 2.5-1
balancing tank receiving the effluent from reactor (A) and providing the feed reservoir
for reactor (M). The reactor and balancing tank were maintained at a constant
temperature of 35°C in an insulated cabinet. Each reactor was of a typical UASB design
having a gas-biomass-liquid separator at the head of the column and an influent liquid
distributor at the base. Each column was connected to a water displacement type
gasometer filled with an acidified brine solution to prevent C02 dissolution. The reactor
content could be sampled at various heights along the column by means of a series of six
sampling ports along its length [9].
The acidogenic reactor acclimated rapidly to the wastewater and was tolerant to the
suspended solids (SS) concentration of 5.4 g/1 in the effluent wastewater. Loading was
gradually increased over a period of 100 days resulting in a satisfactory hydrolysis and
acidification giving a maximum rate of acid production of 4.1 g/ld acetic acid at a loading
rate of 16.6 gild COD at a hydraulic retention time of 0.9 days. An increase in alkalinity
throughout the acclimatization maintained the effluent from the reactor at around pH 5.8.
The methanogenic reactor was initially fed on dilution of the effluent from the first stage
reactor after pH adjustment. The loading was gradually increased, and then stepwise, to
60g/ld at which point COD removal efficiency had declined significantly and an
accumulation of long-chain volatile fatty acids was observed. It was concluded that the
reactor could work efficiently up to loading of 30 gild COD, which producing a good
methane yield and a COD reduction of greater than 90%. Effluent recirculation alleviated
the need for alkali additions to the feed of the methanogenic reactor and a direct coupling
of the two reactors was achieved towards the end of the experimental run of 17 5 days.
8

·[] [] I • I
n I EFFLUENT
A I I
[VI
l D ... I p I
D I p I ... RECIRCULATION
A Acidogenic UASB reator 5 Separation tank M Methanogenic UASB reactor p Peristaltic pump R Refrigerated feed tank G Gas collector
Figure 2.2: Two-stage UASB system
9

2.2.3 Anaerobic Baffied Reactor (ABR)
The ABR is a reactor design which uses a series of vertical baffles to force a wastewater
containing organic pollutants to flow under and over (or through) the baffles as it passes
from the inlet to outlet. Bacteria within the reactor gently rise and settle due to flow
characteristics and gas production, but move down the reactor at a slow rate [1 0].
Probably the most significant advantages of the ABR is its ability to separate
acidogenesis and methanogenesis longitudinally down the reactor, allowing the reactor to
behave as a two-phase system without the associated controls problems and high costs.
Two-phase operation can increase acidogenic and methanogenic activity by a factor of up
to four as acidogenic bacteria accumulate within the first stage and different group can
develop under more favorable condition [10].
The main problems associated with the treatment of high strength material in a baffled
reactor is the inability to produce a floating sludge layer which would enhance solids
retention and the high velocities associated with the baffles causes a significant washout
of solid material [2].
A study on performance of a modified anaerobic baffled reactor to treat high strength
wastewater was conducted by Malakahmad, [2009]. A modified ABR with a working
volume 50 liter was designed to determine the treatment efficiency and methane
production rate of high strength wastewater at different hydraulic retention time and
organic loading rate (OLR). A mixture of 62% kitchen waste and 38% sewage sludge
was used as substrate. A rectangular reactor of 75 em in length, 27 em width and 25 em
height was used. The baffled reactor was modified to reduce up-flow liquid velocities and
to accept the whole substrate [2].
Initially the characteristics of kitchen waste were measured. Next the effect of different
HRT and OLR were evaluated in the reactor. The continuous operation of ABR was
started using an initial COD concentration of 25g/L at HRT 5 days. The ABR was run
continuously and observations were made for 20 days at a particular HRT. Result show
that the highest COD removals (74.5% and 75.4%) were observed at 3 days HRT and
10

OLR of 2 kg/m3d, respectively. While the best production of biogas (7.4 and 9.10 Lid)
was observed at 5 days HRT and OLR of 6 kg/m3 d respectively [2].
The comparison of advantages and disadvantages between these three types of treatment
are summarized in the Table 2.1 and the performance of an anaerobic treatment to treat
raw POME which done in previous works are summarized in the Table 2.2.
11

Table 2.1: Adantages and disadvanteges of the Stabilization ponds, UASB and ABR [11].
Treatment processes
Stabilization Ponds
UASB
ABR
Advantages
Reliable and stable. Anerobically digested POME from the ponds could be used to culture algae. Cheap, simple to construct and has low maintenance costs. The energy needed to operate a ponding system is minimal. Recovered sludge cake from pond can be sold as fertilizer.
High organic loading, short HRT and has a low energy demand. High removal of COD for POME treatment. High concentration of boimass as granular sludge retained in the
Simple and inexpensive to construct. Stability to shock loading and a capability of achieving high volumetric rate. With proper modification of ABR, high retentation times of the cells and efficient treatment ofPOME could be maintened.
Disadvantages
Large areas of land required,making it unsuitable for factories located in the near urban and other developed areas. The removal of nitrogen and solids are usually unsatisfactory. Dead spots or short circulation with island of floating solids can be found in anaerobic ponds due to an inadequate mixing by the envolved biogas. Difficult to control and monitor in view of sizes and configuration. Sludge accumulation is usually high. Perfomance depending on the sludge settleability. Longer development times for anaerobic sludge granular. Foaming and flotation of granular sludge at high organic loading rate.
Sufficient recycling needed to maintain the reactor stability when treating POME. Occurrence of fouling due to the long solid retention time of the system, which allow the decomposition of the suspended solids on the membrane.
12
References
Ta Yeong Wu(2010) Abdul Wahab Mohammad(2010) Jamaliah Md. jahim (201 0); Nurina Anuar
Ta Yeong Wu(2010) Abdul Wahab Mohammad (2010) Jamaliah Md. Jahim (20 I 0); Nurina Anuar
Ta Yeong Wu(2010) Abdul Wahab Mohammad(20 1 0) Jamaliah Md. Jahim (2010); Nurina Anuar

Treatment processes
Upflow anaerobic filter
Complex mixed reactors
Membrane anaerobic system
Anaerobic hybrid digester
Modified anaerobic baffled reactor
Table 2.2: The perfomance of an anaerobic treatment of raw POME [11].
Operational condition
Retention Temperature Organic
time ('C)
(day)
6
35
3.15
3.5
10
35
55
35
loading
rate (g COD/l day)
11.4
21.7
16.2
1.6
Parameters
COD TSS Oil and grease
Influent Overall Influent Overall Influent Overall
(mg/1) reduction ( mg/1) reduction (mg/1) reduction
(%) (%) (%)
69000 91
67000 95.6 31800 81.8
68310 92.1
56700 92.3
16000 95.3 410 91.3
13
Reference
Borja and Banks (1994c)
Chin and Wong (1983)
Fakhru'l Razi and Noor (1999)
Borja et al. (1996a)
Faisal and Unno (2001)

CHAPTER3
METHODOLOGY
3.1 Project Activities
The project is dividing into two phases, which are FYP I that was conducted in the first
semester and FYP II that was carried out in the second semester. In FYP I, activities done
basically are research and information collection on the anaerobic treatment system and
its application in POME, especially the performance of ABR to treat high strength
wastewater. The sample of POME was being taken from Nasaruddin Palm Oil Mill and
the sample was analyzed to identifY the characteristic of the POME before it can be used
in the second phase of the project. Design and fabrication of the ABR was done based on
the literature and the installment and troubleshooting was done to ensure the system is
operating without any defect that will lead to further complication.
The operation of the anaerobic baffled reactor system was conducted in FYP II. The
efficiency of the anaerobic treatment was measured based on the COD removal efficiency
and biogas production by taking the best HRT of 4 days or 6.74 Lid that gives the
maximum COD content reduction and methane gas production based on the previous
work that was done by UTP student on the application of ABR for polishing of treated
POME [12]. The project process flow is shown in Figure 3.1.
14

r-----------------~ 1 FYP I I
I I I L-
Start
/
Research v/
ABR system Design 1-'/
1 I Wastewater Sampling
W a.o;;tewater Analysis e-·
-------- 1--------
I I I I /? I / f./
1 I
Collection Information 1. Anaerobic treatment 2. POME treatment 3. Anaerobic Baftled Reactor
J . .1 Designing oftbe ABR system I / 1,/ ... I Selecting the suitable wastewater I ;. supplier and sampling of I / I / I/
wastewater
.r I 1 Analysis of wastewater to I ;·.::::, detennine the characteristics I _ __.
... / I I I
J
r- , I F I
-------- r--------yp II
I I -·~
ABR system setup 1-·-·-t-·-· ., I I I I
Wastewater Sampling & analysis
ABR system operation
Data collection and analysis
Final Repnrt & Oral Presentation
·-
r·
l-.-·- 3 I I I I I }---,) I I I I
-.t._ I ---
~.
1 ~
I I I I I _________________ J
I. ABR system setup 2. Troubleshooting of the system
I. Sampling ofPOME at Nasaruddin Palm Oil Mill 2. Charateristic determination of POME
1. Varying hydraulic retention time(HRT) 2. COD removal
Collecting and analysing the COD removal e:ffiency for every HRT
Figure 3.1: Project Process Flow
15
I

3.2 Wastewater samples
The wastewater samples used in the project was the raw Palm Oil Mill Eflluent (POME)
taken from one of the palm oil mill that practices anaerobic pond system to treat its
wastewater, which is Nasaruddin Palm Oil Mill located in Bota District, in Perak.
After sampling, the wastewater sample were directly placed in the cool storage at
temperature of 4 'C to stop any microorganism reaction therefore no composition changes
will happen in the samples. The pH was never adjusted and no chemicals were added to
the wastewater.
The characteristics of the wastewater were determined before it was used in the ABR
system. The wastewater was analyzed for the parameters of pH, BOD, COD, TSS and
TKN.
3.2.1 pH determination
For the reactor, the pH measurement was done for each compartment, influent sample
that coming from 1st compartment and finally samples from the eflluent tank. pH of the
wastewater sample was determined using a digital pH meter based on the HACH method.
In order to getting the more accurate results, a digital pH meter was calibrated and
washes by distilled water before using it.
3.2.2 COD determination
The palm oil mill eflluent (POME) sample was being diluted before proceeding with the
COD test to make sure it's not will given a negative or over range result for the COD.
The high range of the vial COD was used for this test and the COD was measured using
the spectrophotometer based on the APHA method.
16

3.2.3 TKN determination
The TKN value is measure based on the formula;
TKN
V1- VZ --:-:---- X C X F X 1000
Vo
Where:
V1 ~mL of standard 0.2N H2S04 solution used in titrating sample.
V2 ~ mL of standard 0.2N HzS04 solution used in titrating blank.
N = normality of sulfuric acid solution.
F =milliequivalent weight to nitrogen (14mg)
V0 = mL of sample digested.
3.2.4 Total Suspended Solid determination
Total suspended solid (TSS) is measure by filtering the 40 ml of wastewater samples
using a 4 7 mm filter disc. The filter paper then dries in a drying oven 105 ° C for 1 hour.
After the filter paper is cool off in desiccators. the filter paper is weighed to determine the
suspended solids of the wastewater. The TSS is measure by the following formula:
Total suspended solid (TSS)
(Weight of pan+ filter paper after drying)- (Weight of pan+ filter paper before drying) = (Sample size (L))
17
(Eq. 1)
(Eq. 2)
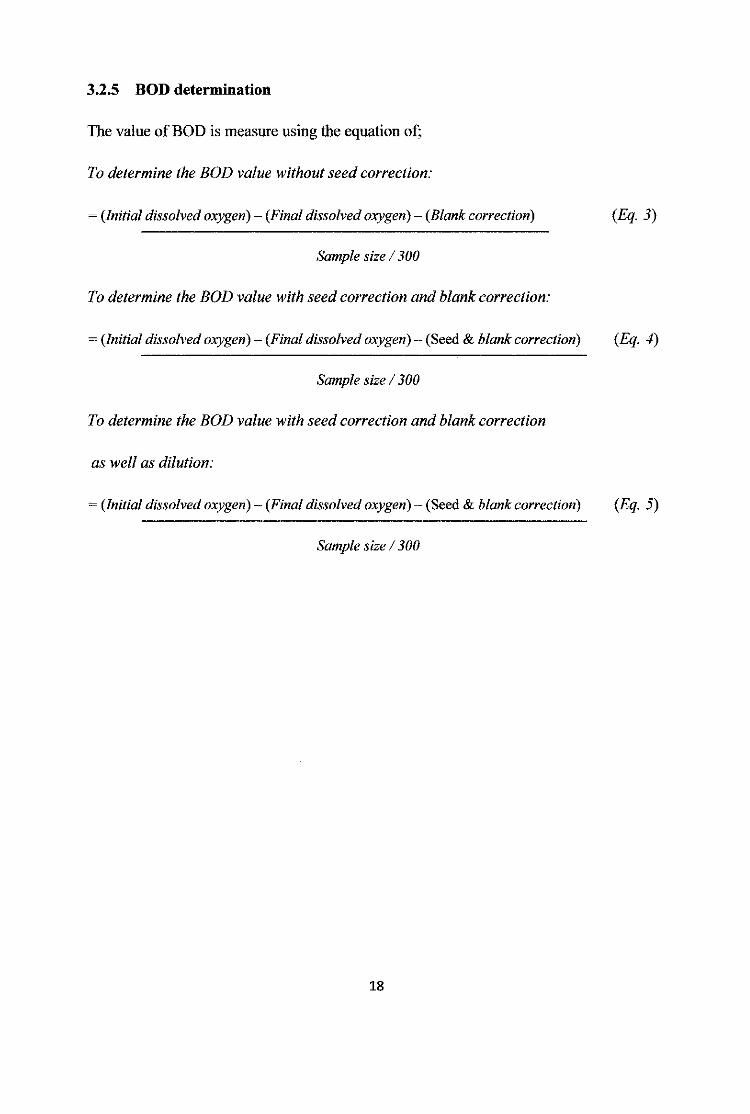
3.2.5 BOD determination
The value of BOD is measure using the equation of;
To determine the BOD value without seed correction:
~(Initial dissolved oxygen)- (Final dissolved oxygen)- (Blank correction)
Sample size I 300
To determine the BOD value with seed correction and blank correction:
~ (Initial dissolved oxygen) - (Final dissolved oxygen)- (Seed & blank correction)
Sample size I 300
To determine the BOD value with seed correction and blank correction
as well as dilution:
~ (Initial dissolved oxygen) - (Final dissolved oxygen)- (Seed & blank correction)
Sample size I 300
18
(Eq. 3)
(Eq. 4)
(Eq. 5)

3.3 Seeding
Sludge was taken from the Anaerobic Pond No.3 from Nasaruddin Palm Oil Mill. The
sludge is taken from the same source of treatment facility to ensure that the
microorganisms are familiar with the enviromnent and characteristic of wastewater that it
will encounter to shorten the duration for acclimatization of the system. The large
particles and debris from the sludge were removed by passing it through American
Society of Testing Materials (ASTM) sieve. The sludge then introduce equally to all 6
compartments of the ABR. Amount of sludge needed in the system is calculate using Eq.
6. The calculations of amount of sludge are shown in the Appendix I.
F So =
M 0x (Eq.6)
Where:
F=Food
M = Microorganism
So= Influent BOD and COD concentration, mg/L (g/m3)
e = hydraulic detention time (day)
8= Volume
Flow rate
X= concentration of volatile suspended solids in tank, mg/L (g/m3)
19

3.4 Reactor Characteristic and Operation
The reactor use in the experiment is a flexi glass cubic tank with 0.48 m in length, 0.2 m
in depth and 0.29 min height and divided into 6 compartments. The volume of the first
compartment is 0.0048 m3, the next 4 compartments each having 0.0044 m3 of volume
and the last compartment with volume 0.0054 m3. The last compartment is designed with
bigger volume compared to other 5 compartments to provide longer solid retention time
and superior performance as compared to reactor with similar sized compartments. The
larger compartment acts as a natural fl!ter and provides superior solid retention for the
small particles. This configuration will collect more solid materials than having 6 equally
divided compartments [1].
Two tanks both with the volume of 0.027 m3 were designed for the system, which is the
influent tank has the function of feeding wastewater to the reactor and effluent tank for
the purpose of retaining the wastewater from the reactor. Stirrer is adding in the effluent
tank to stir the wastewater in order to prevent sedimentation of particulate. Pump is use to
keep a constant flow rate of feeding to the system. The design of the laboratory scale
reactor is depicted in Figure 3.2.
A tube is installing at the middle elevation of the reactor in each compartment. The
installation of the tube is for the purpose of taking the samples in every compartment.
The ABR system that used in the laboratory is shown in Appendix 7.
A cylinder shaped gas collection camber was design to collect and measure the volume
of methane gas produce from the system. Water displacement method is use to collect
and determine the volume of methane gas produce by the system. The collection chamber
will be filling with solution of Sodium Hydroxide (NaOH) in order to dissolve and
separate the C02 in the biogas produce, leaving only the methane gas. The design of the
gas collection chamber is depicted in Appendix 8.
20

6
5 1
Figure 3.2: Laboratory Scale Anaerobic Baffled Reactor (1: Influent Tank, 2: Stirrer, 3: Water
Pump, 4: ABR System, 4-1 to 4-6: Sampling points, 5: Effluent Tank, 6: Collection Chamber, 7:
NaOH discharge)
3.5 Sampling and analysis
The effluent of the system was monitored daily for pH, COD, TSS and biogas
production. Samples were taken from the effluent tank and from each compartment of the
reactor to monitor behavior of the treatment system. The sampling is starting from the
last compartment toward the first to prevent air intrusion and to maintain the anaerobic
condition in the reactor.
21

CHAPTER4
RESULTS AND DISCUSSION
Before the POME samples were used in the ABR system, it was analyzed to identify its
characteristic by conducting experiments. Table 4.1 shows the identified characteristic of
the POME sample. The COD and BOD content of the POME sample are 45,450 mg/l
and 27,200 mg/1 which are highly polluted to be discharged into the water. The discharge
of this type of wastewater will affect the ecosystem of the water bodies as it will reduce
the dissolved oxygen content in the water, leaving not enough oxygen for the aquatic life
to live.
Table 4.1: Characteristic ofPOME
Parameters Concentration pH 4.65 BOD(mg/L) 27,200 COD(mg/L) 45,450 TKN (mg/L) 757 TSS (mg/L) 24,400
The ABR system was monitored daily by taking samples of the POME from each
compartment and also the influent and effluent of the system. Figure 4.1 shows the
percentage of COD removal. The TSS results of the effluent samples are depicted in
Figure 4.2. Figure 4.3 shows the pH profile of the reactor. The methane gas produced by
the ABR system is illustrated in Figure 4.4 and Table 4.2 show the comparative analysis
of performance of anaerobic baffles reactor.
22

COD removal
Figure 4.1 shows the COD content in reduction of the effiuent POME from the ABR
system. From the graph it is shown that in the early operation of the ABR system,
fluctuation of COD content in effluent sample happened. This is due to the adaption of
the microorganism with the new environment of the ABR system especially the cooler
temperature in the laboratory which is around 24-25 ° C compared to its original treatment
facility which has higher temperature. In the early phase, the percentage of COD
reduction was in the range of 40-70%, but at the day of 15, the percentage was increase
until reach 95% of reduction. This is because of the microorganism in the reactor become
stronger as the increases of the concentration of the sample.
,---------- ------------ -- ---- -------------------------- ------------------
:; ba
-- E I-
Q
8
20400
18400
16400
14400
12400
10400
8400
6400
4400
2400
400
I
I f
{1:8) (1:5)
100
90
80
,- 70
60
~· 50
40
,- 30
c 20 I
i·- 10 '
0
0 3 6 9 u ~ ~ 21 M n ~ ~ ~ ~
Time(Day) ..... Effluent -+-COD reduction (%)
~ -"' 0 :;::; u :I ... ~ Q 0 u
·--------------- ---------- ----·· ---------------------------------------------------------·----------------- ----------------- ----- --- ---------- ----
Figure 4.1: Graph of COD
23

TSS effluent reduction
The ISS of effluent sample was observed to be fluctuating in the beginning of the ABR
system operation. This is due to the adaption period of the system to the new nature of
enviromnent By passing the time, the ISS concentration in the wastewater was found to
be decreasing and the fluctuation of ISS is slowly lessened.
;"·-------·-~~--~--~·-·----··-·---~-~~ -~-
1.00 ., - ·---~~--~------~-----------------,
0.90
0.80
0.70
0.60 '] -..... ...... .!!!! 0.50 Ill Ill
;I-0.40
0.30
0.20 -
0.10
0.00
0 10 20 30 40
Time (Day)
Figure 4.2: Graph ofTSS
24

Volatile fatty acid profile and pH
Figure 4.3 show the pH profile of the 4 day ofHRT used in the project. The graph shows
the difference of pH in every compartment of the reactor which can demonstrate the
behavior of anaerobic digestion in the ABR system. pH is decreasing as the POME flows
from compartment 1 to compartment 2 which is illustrate the high development rate of
volatile fatty acid by the microorganism. As the POME flows from compartment 3 to
compartment 5, the pH rises as methanogenesis phase is taken place in the system. In this
phase, the development of C03HNf4 from COz and NH3, which produce during the
anaerobic process, had caused the increase alkalinity of the system. All this result
indicates growth of microorganism happened inside the reactor according to its function
in each compartment.
J: Q.
7.50 '
7.00 .:
6.50
6.00 -:
' 5.00 l
4.50 -:
4.00 -~---~---------
1 2
----,----------,----------,--
3 4 5 6 Effluent
Compartment
1 -+-1:25 ....... 1:19 ..,.,._1:15 ..-1:s -.1:5 -"" 1:2 - 1:1 1
Figure4.3: GraphofpH
25

Gas methane production
In the initial stage of operation, the methane gas produce was very high. This is due to the
aggressive consumption on organic matter by the microorganism after being put into
storage area for several days. The rapidly decrease and increase pattern of methane
production is due to changes of the dilution factor of the samples. The methane gas
production then become more stabilized and it slowly decreased by time. This behavior is
caused by the fact that the microorganism in the ABR system has became more familiar
with the wastewater.
1400
1300
1200
1100 ~ -<II c:
1000 "' ..r:: ti ~
900
800
700
600
.. , I
--~----
0 10 20 Time (Day)
Figure 4.4: Graph of methane produce
26
-~----"-~
30 40

The Comparative analysis of performance of anaerobic baffled reactors
Table 4.2: Comparative analysis of performance of anaerobic baffled reactors.
Malakahmad et al.,2011 Faisal and Hajime Unno, Bodkhe, 2009 [21 2001 [14] ns1 This study
Type of wastewater Kitchen waste PO MEa Municioal waste POME Influent COD (mg/L) 25100 16000 400 45450 COD removal(%) 74.5 77.31 84 84.06 HRT (d) 3 3 6 4 Reactor volume (L) 85 20 32 ' 28
a: Palm Oil Mill Effluent
Table 4.2 show the comparative analysis of performance of anaerobic baffled reactors. From that, it show that the ABR system for this
study is achieve the higher percentage of COD removal even the influent of COD is higher compare to others study. Also the ABR
system for this study can achieve a better performance in the short of hydraulic retention time which is 4 days.
27

CHAPTERS
ECONOMIC BENEFITS
In this project, the cost spent in constructing the anaerobic baffied reactor system is
involving construction of the laboratory scaled reactor, methane gas collection chamber,
the influent and effluent tank. The total cost was undetectable as most of the other's
material and equipment was already available in the laboratory.
In general, construction of a full scale anaerobic baffled reactor system include the
construction of the reactor, biogas collection chamber, influent and effluent tank. The
additional mechanical equipment such as the pump can be eliminated by applies the
concept of gravity force to flow the POME through the system thus eliminating the cost
for energy consumption.
In comparison with the current treatment application, anaerobic pond treatment will need
a large area of land to operate. Acquisition of land area is very costly especially with the
current rapidly growing development industry in Malaysia. The methane gas capture
from ABR system is an excellent energy source as fuel in combined heat and power unit.
The calculation of the construction cost and energy recovers for ABR and AP's has been
determined. Tables 5.1 show the design criteria for the ABR system. Table 5.2 show
comparison cost of the construction between ABR and AP's system which show the
construction cost of the treatment and Table 5.3 show comparison of energy recovery
between ABR and AP's system.
28

2m
I ~4m 6m
Figure 5 .I: ABR reactor
Table 5.1: Design criteria for ABR reactor
Parameter Flowrate, Q (m,/day) 10 Velocity in, V ( m/h) 2 Number of up-flow chamber (No.) 6 HRT (day) 5 Volume of ABR reactor (m3
) 48 Material Concrete
29

Table 5.2: Comparison cost of the construction between ABR and AP's system.
Anaerobic baffles reactor Anaerobic pond
Item Descriptions Unit Quantity Unit rate Total Quantity Unit rate Total
I (RM) (RM) (RM) (RM) • 1 Concrete brick wall No. 1500 9.00/ unit a 13 500.00 500 9.001 unit 4500.00 .
i
2 Land area m" 50 15.00/m20 750.00 600 15.00/m" 9000.00
Total cost 14 250.00 13 500.00
a: http://www.demxx.com/index.php/product-catalogue/commercia1industrial
b: http:/ /www.iproperty .com.my/property1isting/1 0113 7 /Pusing_ Agricultural_ Land _ForSale
Table 5.3: Comparison of the energy recovers between ABR and AP's system.
Anaerobic baffles reactor Anaerobic pond
Item Descriptions Unit Quantity Unit rate Total Quantity Unit rate Total
(RM) (RM) (RM) (RM).
1 Biogas L 80 Llday 20.00/25 L 64.00/day - - -
Total cost 64.00
30

CHAPTER6
CONCLUSION AND RECOMMENDATIONS
6.1 CONCLUSION
The results obtained in this project indicate that the ABR system has the high potential in
treating palm oil wastewater. The characteristics of ABR reactor that has baffles to direct
the wastewater flow up and down maximize the contact time of wastewater and
microorganism thus increase the rate of biological digestion in the system. The baffles
also act as divider of the microorganism in the anaerobic process, allocating them
according to its characteristics. This can prevent the wastewater to have a contact with
different types of microorganism and reduce the efficiency of the treatment system. From
the data analysis, the highest percentage of COD removal was found to be at dilution
factor of 8 where 34,000 mg/L of COD influent with 98% of COD removal and methane
gas production of 941 Llday. This shows that the ABR treatment system has a high
potential in the Palm Oil industry as it can treat POME in short HRT compared to the
stabilization pond that requires long periods oftime to operate.
6.2 RECOMMENDATION
Based on the achieve result, the recommendation are:
1. Study on the effect shock loads on the performance of an anaerobic baffles
reactor.
11. Study on performance of anaerobic baffles reactor treating wastewater influenced
by decreasing COD/S04ratios.
31

REFERENCES
[I] A. Malakahmad, N. Ahmad Basri & S. Md. Zain, 2008, An application of Anaerobic
Baffled Reactor to Produce Biogas from Kitchen Waste, Waste Management and the
Environment (IV) 655-664.
[2] A. Malakahmad, Noor Ezlin. A.B, Shahrom. Md. Z, 2011, An Application of Modified
Anaerobic Baffled Reactor (ABR) to Treatment of High Strength Wastewater, Journal
of Applied Science, 11(7)1449-1452.
[3] R. Grover, S. S. Marwaha, J. F. Kennedy, Studies on the use of an Anaerobic Baffled
Reactor for the Continuous Anaerobic Digestion of Pulp and Paper Mill Black
Liquors, Process Biochemistry 34 (1999) 653-657.
[4] Mohd Ali Hassan, Yoshihito Shirai, Yung-Tse Hung & Shahrakbah, Treatment of
Palm Oil Wastewater, Handbook of industrial and hazardous wastes treatment (2006)
719-735.
[5) Yee Shian Wong, Mohd Omar A.B kadir, Tjoon Tow Teng, Biological Kinetics
Evaluation of Anaerobic Stabilization Pond Treatment of Palm Oil mill Effluent,
Bioresource Technology 100 (2009) 4969-4975.
[6] P. E. Poh, M. F. Chong, Development of Anaerobic digestion methodfor Palm Oil
Mill Effluent (POME) treatment, Bioresource Technology 100 (2009) 1-9.
[7] Lucas Seghezzo, Grietje Zeeman, Jules B. Van Lier, H. M. Hamelers & Gatze
Lettinga, The Anaerobic treatment of Sewage in UASB and EGSB Reactors, A
review: PII : S0960-8524 (98) 175-190.
[8] Shahrakbah Yacob, Mohd Ali Hassan, Yoshihito Shirai, Minato Wakisaka &
Sunderaj Subash, Baseline Study of Methane Emission from Anaerobic Ponds of Palm
Oil Mill Ejjluent Treatment, Science of the Total Environment 366 (2006) 1878-196.
[9] Rafael Bmja, Charles J. Banks & Enrique Sanchez, Anaerobic Treatment of Palm Oil
Mill Effluent in a Two-stage Upjlow Anaerobic Sludge Blanket (UASB) System,
Journal of Biotechnology 45 (1996) 125-135.
[10] Barber, W. P & Stuckey D. C, The use of Anaerobic Baffled Reactor (ABR) for
Wastewater Treatment: A Review, Water Resource 33 (1999) 1559-1578.
32

[11] Ta Yeong Wu, Abdul Wahab Mohammad, Jamaliah Md. Jahim & Nurina Anuar,
Pollution Control Technologies for the treatment of Palm Oil Mill Effluent (POME)
through end-of-pipe process :A Review, Journal of Environmental Management 91
(2010) 1467-1490.
[12] Farhana Abd Lahin, June 2010, Application of Anaerobic Baffled Reactor (ABR) for
Polishing of Treated Palm Oil Mill Effluent (POME).
[13] G.D Najafpour, A.A.L Zinatizadeh, A.R Mohamed, M. Hasnain Isa, H.
Nasrollahzadeh, 2006, High-rate Anaerobic Digestion of Palm Oil Mill (POME) in
an upjlow Anaerobic Sludge-fixed Film Biorector. Process Biochemistry 41 370-
379.
[14] M. Faisal, Hajime Unno, 2001, Kinetic analysis of Palm Oil Mill wastewater
treatment by a modified Anaerobic Baffled Reactor, Biochemical Engineering
Journal9, (2001) 25-31.
[15] S.Y. Bodkhe, 2009, A Modified Anaerobic Baffled Reactor for Municipal
wastewater treatment, Journal of Environmental Management 90 (2009) 2488-2493.
33

APPENDIX 1: CALCULATION OF FOOD-TO-MICROORGANISM RATIO
The determination of the food-to-microorganism is done by the following equation:
F So =
M 0x (Eq.6)
Where:
F=Food
M = Microorganism
S o = Influent BOD and COD concentration, mg!L (g/m3)
e =hydraulic detention time (day)
8= Volume
Flow rate
X= concentration of volatile suspended solids in tank, mg/L (g!m3)
Data obtained from experiments;
ML VSS = 32560 mg!L
COD = 31433 mg!L
F 3143.3 M (4x32560) = O.OZ4 jday
34

APPENDIX 2: PREPARATION OF NaOH SOLUTION
Preparation of the NaOH solution used in the methane gas collection chamber was done
diluting NaOH of 47% concentration to 2.5%. The volume ofNaOH with concentration
of 47% needed for the dilution was calculated using the following equation:
47(v1) = 2.5(1)
VJ=2.5(J)/47
Vj = 0.053L
From the calculation it is determined that, in prepanng lL of NaOH with the
concentration of 2.5%, 0.053 L of NaOH with the concentration of 47% is needed.
Bromothymol Blue was added into the solution of NaOH to determine the pH of the
solution. Blue colour in the solution indicates that the solution has the pH of 7.6 and
above, change in colour of the solution indicate that solution do not have the ability to
dissolve C02 anymore and need to be changed.
35

APPENDIX 3: DESIGN CALCULATION OF ABR SYSTEM
Calculation for HRT:
Flowrate, Q =10m3/day
Volume of ABR reactor = 48 m3
HRT=48!10
= 4.8 days~ 5 days
36

APPENDIX 4: COD CONTENT
Table A4-1: COD content
HRT DAY INFLUENT (mg/L) EFFLUENT (mg/L) COD REMOVAL(%)
4 1 1150 675 41.30
4 2 1000 550 45.00
4 3 1350 825 38.89
4 4 1750 600 65.71
4 5 1800 875 51.39 4 6 1575 925 41.27
4 7 1620 830 48.77
4 8 1730 730 57.80 4 9 980 730 25.51 4 10 940 525 44.15 4 11 1400 610 56.43 4 12 2100 760 63.81 4 13 4200 820 80.48 4 14 3200 820 74.38
4 15 20200 945 95.32 4 16 43400 832.5 98.08 4 17 34600 1237 96.42 4 18 40875 945 97.69
4 19 37400 840 97.75 4 20 38850 1830 95.29 4 21 33150 1950 94.12
4 22 19250 2025 89.48 4 23 11000 1110 89.91 4 24 34000 555 98.37 4 25 52350 2010 96.16 4 26 38350 3450 91.00 4 27 41450 4275 89.69 4 28 41050 5610 86.33 4 29 38950 4725 87.87 4 30 44000 4110 90.66 4 31 44950 4530 89.92 4 32 35800 3750 89.53 4 33 52150 4185 91.98
4 34 37800 7470 80.24
4 35 38000 18375 51.64
37

HRT DAY INFLUENT (mg/l) EFFLUENT (mg/l) COD REMOVAL(%)
4 36 40600 18000 55.67
4 37 39500 17500 55.70
4 38 38750 17070 55.95
4 39 45450 7245 84.06
38

APPENDfXS:TSSCONTENT
Table AS-1: TSS
HRT DAY EFFLUENT (g/L)
4 7 0.43
4 8 0.28
4 9 0.53
4 10 0.16
4 11 0.94
4 12 0.37
4 13 0.10
4 14 0.11
4 15 0.04
4 16 0.06
4 17 0.10
4 18 0.23
4 19 0.06
4 20 0.04
4 21 0.29
4 22 0.26
4 23 0.05
4 24 0.22
4 25 0.18
4 26 0.08
4 27 0.15
4 28 0.21
4 29 0.19
4 30 0.14
4 31 0.17
4 32 0.22
4 33 0.25
4 34 0.29
4 35 0.24
4 36 0.15
4 37 0.17
4 38 0.20
4 39 0.14
39

APPENDIX 6: pH
Table A6-1: pH
HRT DAY 1 2 3 4 5 6 7
4 1 6.53 5.23 5.51 5.45 5.72 5.24 5.83
4 2 4.99 4.74 4.95 4.95 6.68 6.35 6.87
4 3 4.82 4.73 4.77 4.84 6.62 6.41 6.55
4 4 4.97 4.86 4.93 5.03 6.44 6.27 6.44
4 5 5.41 5.28 5.27 5.20 6.52 6.39 7.02
4 6 4.81 4.84 4.85 4.88 6.20 6.00 6.55
4 7 5.81 5.78 5.81 5.73 6.56 6.37 6.58
4 8 4.94 4.87 4.85 4.87 6.56 6.48 6.88
4 9 4.74 4.89 4.78 4.83 6.42 6.42 6.73
4 10 4.76 4.71 4.68 4.68 6.21 6.21 6.79
4 11 4.68 4.72 4.71 4.69 6.25 6.26 6.60
4 12 5.24 4.82 4.83 4.80 6.21 6.25 6.79
4 13 4.91 4.71 4.48 4.57 6.07 5.87 6.77
4 14 5.98 4.79 4.82 4.77 5.95 5.96 6.18
4 15 5.23 4.62 4.61 4.61 5.77 5.73 6.17
4 16 5.01 4.63 4.62 4.64 5.28 5.28 5.98
4 17 4.72 4.7 4.71 4.65 5.67 5.66 7.5
4 18 5.07 4.80 4.80 4.73 5.92 5.89 7.69
4 19 5.01 4.67 4.66 4.65 5.32 5.31 6.50
4 20 4.77 4.62 4.79 4.63 4.63 4.84 5.31
4 21 5.01 4.66 4.70 4.58 4.98 4.97 5.10
4 22 5.19 4.57 4.69 3.40 4.78 4.77 5.15
4 23 5.12 4.57 4.62 4.55 4.80 4.77 4.76
4 24 5.02 4.52 4.51 4.50 4.89 4.76 4.91
4 25 5.10 4.44 4.42 4.33 5.77 4.95 4.72
4 26 5.52 4.88 4.74 4.64 5.63 5.32 5.70
4 27 5.28 4.67 4.59 4.47 5.69 4.96 5.30
4 28 5.46 4.72 4.46 4.52 5.47 5.02 5.50
4 29 4.98 4.66 4.68 4.57 5.80 5.02 4.65
4 30 5.13 4.61 4.63 4.57 6.03 5.25 4.69
4 31 5.26 4.70 4.58 4.60 5.89 5.23 4.87
4 32 5.33 4.75 4.78 4.72 5.37 5.27 5.14
4 33 5.30 4.60 4.69 4.72 4.58 5.11 5.16
4 34 5.26 4.57 4.66 4.55 5.51 4.78 4.55
4 35 4.55 4.53 4.56 4.51 5.23 4.82 4.60
4 36 4.65 4.43 4.45 4.52 4.81 4.87 4.73
40

HRT DAY 1 2 3 4 5 6 7
4 37 4.91 4.90 4.88 4.87 4.94 5.03 4.98
4 38 5.01 4.98 4.86 4.89 4.95 5.05 5.06
4 39 5.12 5.03 4.98 4.92 4.97 5.09 5.05
41

APPENDIX 7: METHANE GAS PRODUCED
Table A7-1: Methane gas produced
HRT DAY METHANE (L/day)
4 7 1321
4 8 1108 4 9 1029 4 10 929 4 11 947 4 12 1014
4 13 966 4 14 716 4 15 993 4 16 993 4 17 973 4 18 929
4 19 670 4 20 682 4 21 941
4 22 993 4 23 960 4 24 941 4 25 986 4 26 960 4 27 929 4 28 941 4 29 960 4 30 679 4 31 929 4 32 911 4 33 906 4 34 960 4 35 953 4 36 659 4 37 966 4 38 941 4 39 939
42

APPENDIX 8: LADORA TORY SCALE OF REACTOR
Figure A8-1: Reactor
Figure A8-2: ABR system
43

APPENDIX 9: GAS COLLECTION CHAMBER
•
• 5.7 inch • • 5.5 inch •
; 0.2 inch
0.21nch 1.5 inch
Figure A9-Design Gas collection chamber
44
Copyright © 2022 FDOKUMEN