Performance of TCP/IP over ABR service on ATM networks
17
-
Upload
independent -
Category
Documents
-
view
1 -
download
0
Transcript of Performance of TCP/IP over ABR service on ATM networks
Shiv Kalyanaraman, Performance of TCP/IP over ABR 1Performance of TCP/IP over ABR 1Shiv Kalyanaraman, Raj Jain, Sonia Fahmy, Rohit Goyal, Fang Lu and Saragur SrinidhiCorrespondence Address: Department of Computer and Information ScienceThe Ohio State UniversityColumbus, OH 43210-1277E-mail: fshivkuma, jain, fahmy, goyal, [email protected]: +1 614 292 3989 FAX: +1 614 292 2911AbstractThe Available Bit Rate (ABR) service has been developed to support data applications overAsynchronous Transfer Mode (ATM). It is hence interesting to study the performance ofreliable data transport protocols like TCP over ABR. We study the e�ect of running largeunidirectional �le transfer applications on TCP over ABR with an explicit rate algorithm(ERICA) implemented at the ATM switches. The study shows that it is possible to getmaximum TCP throughput when there are enough bu�ers at the switches and the sourcesare rate-limited by ABR. However, when the number of bu�ers is smaller, there is a largereduction in throughput even though the Cell Loss Ratio (CLR) is very small and the sourcesare window-limited by TCP. The primary reason for the large throughput degradation is theTCP timer granularity (which a�ects the timeout interval) and retransmission of duplicatepackets which are discarded at the destination. We show that switch bu�ers should not bedimensioned based on the ABR Source parameter Transient Bu�er Exposure (TBE). WhenABR capacity is varied, we �nd that CLR exhibits high variance and is not a good indicatorof TCP performance. Further, larger bu�ers and a larger number of TCP sources increaseTCP throughput. Even when bu�ers are small, dropping of End of Message (EOM) cellsshould be avoided. This avoids merging of packets at the destination AAL5 and improvesfairness.1 IntroductionATM networks provide four classes of service: constant bit rate (CBR), variable bit rate(VBR), available bit rate (ABR), and unspeci�ed bit rate (UBR). Data tra�c in ATM isexpected to be transported by the ABR service. Link bandwidth is �rst allocated to the VBRand CBR classes. The remaining bandwidth, if any, is given to ABR and UBR tra�c. ABRmechanism rapidly allocates this bandwidth among active ABR sources. The introductionof this class is expected to yield high overall link utilization and e�cient and fair support ofdata tra�c.1OSU CIS Technical Report. Available from http://www.cis.ohio-state.edu/~ jain/papers/TR TCPABR.ps
Shiv Kalyanaraman, Performance of TCP/IP over ABR 2The ATM Forum Tra�c Management group has standardized a rate-based closed-loop owcontrol model for this class of tra�c [3]. In this model, the ATM switches give feedback(explicit rate (ER) or binary (EFCI)) in Resource Management (RM) cells and the sourcesadjust their transmission rates appropriately.TCP is the most popular transport protocol for data transfer. It provides a reliable transferof data using a window-based ow and error control algorithm [4]. TCP runs over IP whichin turn can run over ATM [5]. Hence, when TCP runs over ABR, there are two controlalgorithms active: the TCP window-based control running on top of the ABR rate-basedcontrol. It is, hence, important to verify that the ABR control performs satisfactorily forTCP/IP tra�c.Since the ABR control was recently standardized, it has not been extensively studied. Thereare studies for TCP over the Unspeci�ed Bit Rate (UBR) service class [6, 7, 8, 9]. TheUBR class [3] is the lowest priority class in ATM. UBR does not include ow control andhence depends upon transport layers to provide ow control. The only degree of freedom tocontrol tra�c in UBR is through bu�er allocation (which includes cell drop policies). ABRhas additional degrees of freedom in the switch schemes and source parameters. These arediscussed in Section 3.The studies previously mentioned also compare UBR performance with ABR. This compari-son shows that ABR has better performance due to its ow control mechanisms. References[6, 7] study ABR with EFCI switches and stress the importance of the ABR source parametersettings. Reference [8] studies ABR with explicit rate switches for local area network (LAN)topologies. Since LANs have short feedback loops, some properties of the ABR controlmechanisms may not be clearly observed.This paper studies the e�ect of unidirectional TCP tra�c over ABR with Explicit Rate (ER)switches running the ERICA algorithm [2]. We use wide area network (WAN) con�gurationswith �nite bu�ers at the switches. Local area networks (LANs) have short feedback loopsand the ABR control is found to be e�ective in LAN cases. We study the e�ect of timergranularity, switch bu�er capacity, tail drop at switches, variable capacity of the links andthe e�ect of the source end system (SES) parameter \Transient Bu�er Exposure" (TBE).The e�ect of fast retransmit and recovery, early packet discard [10], ack compression [11]and delay-ack timer will be studied in future papers.2 TCP Congestion MechanismsTCP is one of the few transport protocols that has its own congestion control mechanisms.The key TCP congestion mechanism is the so called "Slow start." TCP connections use anend-to-end ow control window to limit the number of packets that the source sends. Thesender window is the minimum of the receiver window (Wrcvr) and a congestion windowvariable (CWND).Whenever a TCP connection loses a packet, the source does not receive an acknowledgment
Shiv Kalyanaraman, Performance of TCP/IP over ABR 3
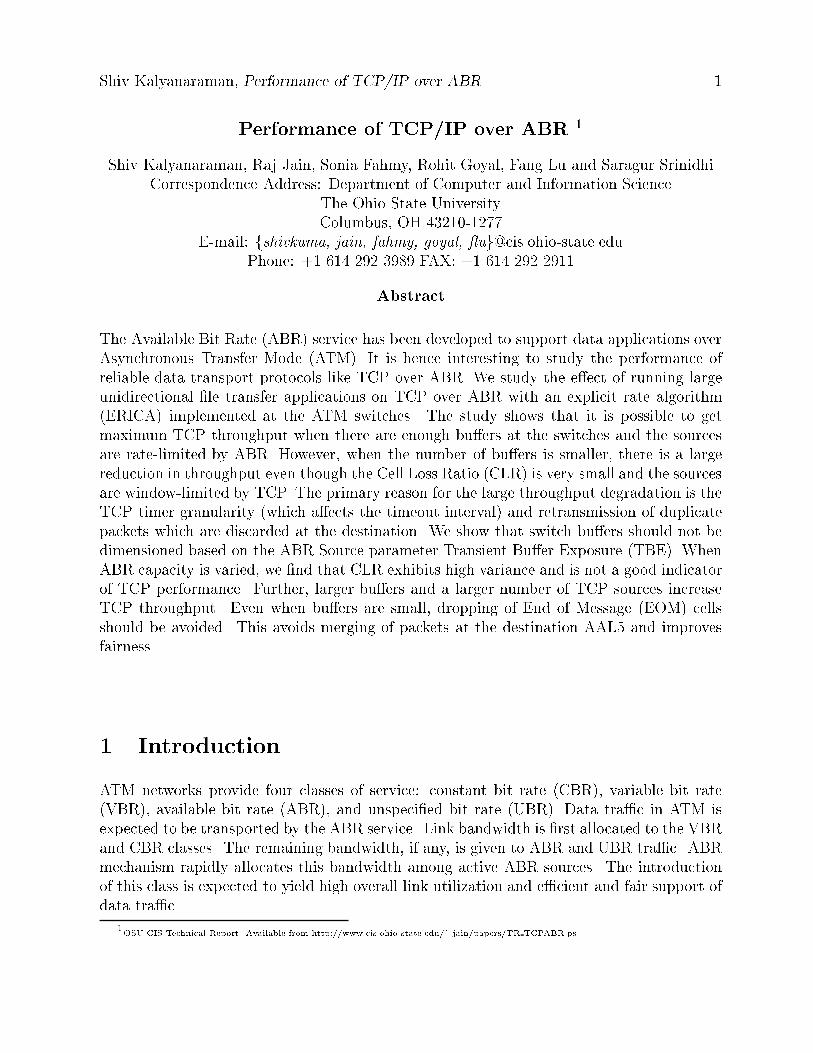
Figure 1: TCP Window vs Time using Slow Start
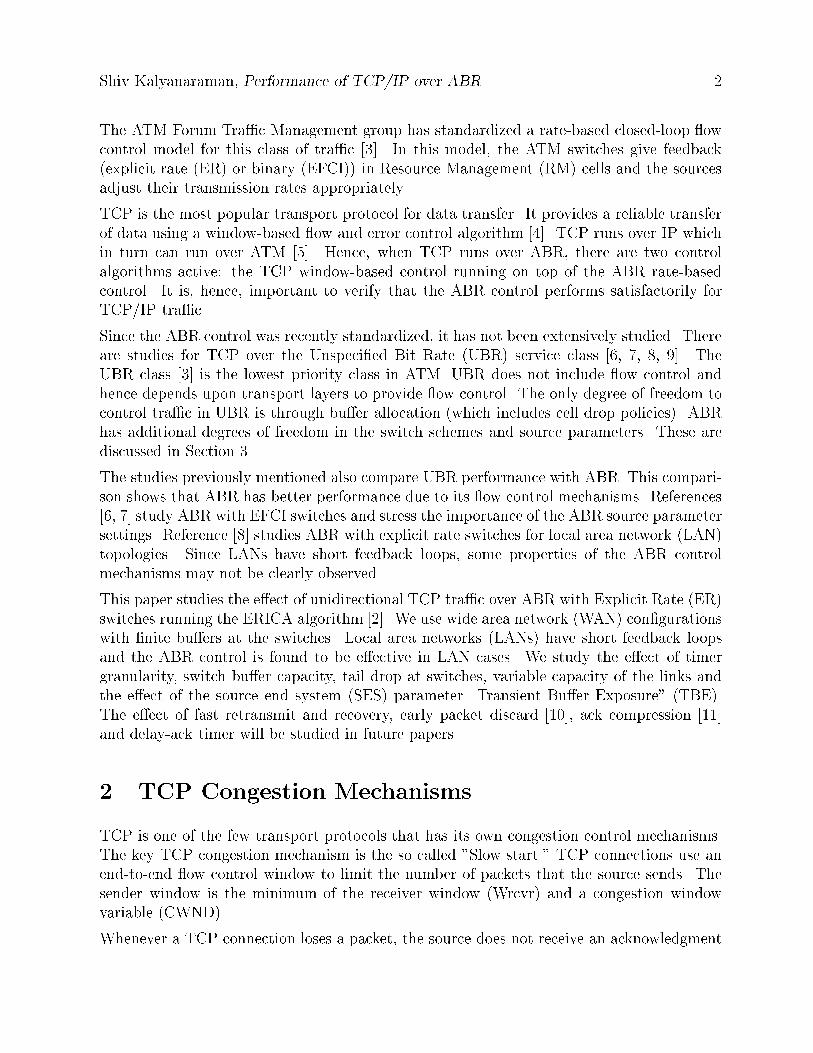
Figure 2: Timeout and Duplicate Packets in Slow Startand it times out. The source remembers the congestion window (CWND) value at whichit lost the packet by setting a threshold variable SSTHRESH at half the window. Moreprecisely, SSTHRESH is set to maxf2, minfCWND/2, Wrcvrgg and CWND is set to one.The source then retransmits the lost packet and increases its CWND by one every timea packet is acknowledged. We call this phase the \exponential increase phase" since thewindow when plotted as a function of time increases exponentially. This continues until thewindow is equal to SSTHRESH. After that, the window w is increased by 1/w for everypacket that is acked. This is called the "linear increase phase" since the window graph as afunction of time is approximately a straight line. Note that although the congestion windowmay increase beyond the advertised receiver window, the source window is limited by thatvalue. The typical changes in the source window plotted against time are shown in Figure 1.Note that TCP's congestion control mechanism does not respond if there is no packet loss(assuming that the RTT estimators don't trigger false timeouts). The retransmission al-gorithm retransmits all the packets starting from the lost packet. That is, TCP uses ago-back-N retransmission policy.When there is a bursty loss due to congestion, time is lost due to timeouts and the receivermay receive duplicate packets as a result of the go-back-N retransmission strategy. Thisis illustrated in Figure 2. Packets 1 and 2 are lost but packets 3 and 4 make it to thedestination are are stored there. After the timeout, the source sets its window to 1 andretransmits packet 1. When that packet is acknowledged, the source increases its window
Shiv Kalyanaraman, Performance of TCP/IP over ABR 4to 2 and sends packets 2 and 3. As soon as the destination receives packet 2, it delivers allpackets upto 4 to the application and sends an ack (asking for packet 5) to the source. The2nd copy of packet 3, which arrives a bit later is discarded at the destination since it is aduplicate.3 ABR Rate-based Flow Control MechanismThe ABR service uses a closed-loop rate-based tra�c management model. We describe therelevant parts of the model brie y in this section. The Source End System (SES) is allowedto send data at the Available Cell Rate (ACR) which is less than a negotiated Peak CellRate (PCR). Immediately after establishing a connection, ACR is set to an Initial Cell Rate(ICR), which is also negotiated with the network. The source sends a Resource Management(RM) cell after transmitting every Nrm-1 cells (default Nrm value is 32). The RM cellcontains a Current Cell Rate (CCR) �eld initialized with the current ACR, an Explicit Rate(ER) �eld where the network gives its feedback and a few other �elds that are not relevantto our discussion here.Based on their load, switches set the ER �eld in the RM cell. The RM cells return tothe source carrying the minimum value of ER set by all the switches on the path. Whenthe source receives the RM cell (feedback) from the network, it adjusts its ACR to the ERvalue in the RM cell. When there is a steady ow of RM cells in the forward and reversedirections, there is a steady ow of feedback from the network. In this state, we say thatthe ABR control loop has been established and the source rates are primarily controlled bythe network feedback (closed-loop control).When the source transmits data after an idle period, there is no reliable feedback from thenetwork and, hence for one round-trip, the the source rates are primarily controlled by theABR SES rules (open-loop control). The open-loop control is replaced by the closed-loopcontrol once the control loop is established. Since bursty tra�c consists of bursty and idleperiods, open-loop control may be used at the beginning of every burst. Hence, the SESrules assume considerable importance in ABR ow control.3.1 ABR Source End System RulesOne of the key parameters of this study was \transient bu�er exposure" (TBE), which isused to limit the number of cells outstanding in the network. This in turn limits the numberof cells lost if any link or switch in the path fails. The standard requires that the sourcesreduce their ACR if they have sent TBE cells and have not received a feedback from thenetwork. The goal of this rule (known as SES Rule 6) is to avoid cell loss in the open-loopphase. It turns out that during closed-loop phase the number of cells in the network can bemuch larger and so the number of cells that may be lost due to congestion can be severalorder of magnitude larger than TBE. Rule 6 is rarely triggered during closed loop phase,even if the tra�c is bursty.
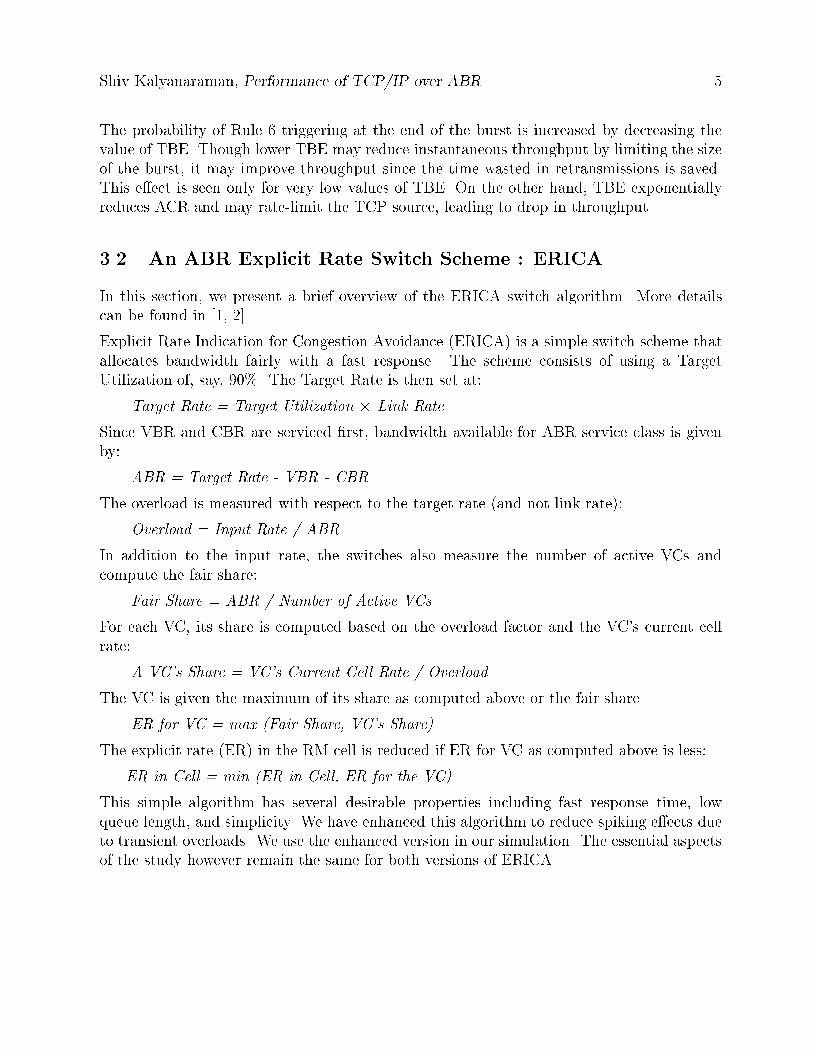
Shiv Kalyanaraman, Performance of TCP/IP over ABR 5The probability of Rule 6 triggering at the end of the burst is increased by decreasing thevalue of TBE. Though lower TBE may reduce instantaneous throughput by limiting the sizeof the burst, it may improve throughput since the time wasted in retransmissions is saved.This e�ect is seen only for very low values of TBE. On the other hand, TBE exponentiallyreduces ACR and may rate-limit the TCP source, leading to drop in throughput.3.2 An ABR Explicit Rate Switch Scheme : ERICAIn this section, we present a brief overview of the ERICA switch algorithm. More detailscan be found in [1, 2].Explicit Rate Indication for Congestion Avoidance (ERICA) is a simple switch scheme thatallocates bandwidth fairly with a fast response. The scheme consists of using a TargetUtilization of, say, 90%. The Target Rate is then set at:Target Rate = Target Utilization � Link RateSince VBR and CBR are serviced �rst, bandwidth available for ABR service class is givenby: ABR = Target Rate - VBR - CBRThe overload is measured with respect to the target rate (and not link rate):Overload = Input Rate / ABRIn addition to the input rate, the switches also measure the number of active VCs andcompute the fair share:Fair Share = ABR / Number of Active VCsFor each VC, its share is computed based on the overload factor and the VC's current cellrate:A VC's Share = VC's Current Cell Rate / OverloadThe VC is given the maximum of its share as computed above or the fair share.ER for VC = max (Fair Share, VC's Share)The explicit rate (ER) in the RM cell is reduced if ER for VC as computed above is less:ER in Cell = min (ER in Cell, ER for the VC)This simple algorithm has several desirable properties including fast response time, lowqueue length, and simplicity. We have enhanced this algorithm to reduce spiking e�ects dueto transient overloads. We use the enhanced version in our simulation. The essential aspectsof the study however remain the same for both versions of ERICA.
Shiv Kalyanaraman, Performance of TCP/IP over ABR 64 Source Model and TCP Options UsedWe use an in�nite source model at the application layer running on top of TCP. This impliesthat TCP always has a packet to send as long as its window will permit it. Other parametersvalues used are:TCP maximum segment size MSS=512 bytesIP MTU size = 9180 bytes (so there is no segmentation caused by IP)TCP timer granularity = 100msDelay-ack timer=0 (disabled)Packet processing time at the destination=0We implemented the window scaling option so that the throughput is not limited by pathlength. Without the window scaling option, the maximum window size is 2**16 bytes or64 kB. We use a window of 16 � 64 kB or 1024 kB. The network consists of three links of1000 km each and therefore has a one-way delay of 15 ms (or 291 kB at 155 Mbps). In oursimulations, we have not used "fast retransmit and recovery" which is a subject for futurestudy.5 ABR Source End System and ERICA ParametersThe source end system (SES) parameters of ABR are selected to maximize the AvailableCell Rate (ACR). The values of SES parameters are:TBE = 128, 512ICR = 10 MbpsADTF = 0.5 secCDF (XDF) = 0.5, CRM (Xrm) = TBE/NrmPCR = 155.52 Mbps, MCR = 0, RIF (AIR) = 1Nrm = 32, Mrm = 2, RDF = 1/512, Trm = 100 ms, TCR = 10 c/sThese SES parameters are de�ned and explained in Reference [3].The target utilization for ERICA is chosen to be 90%. The overload and ABR capacity aremeasured at the switch over an interval of 100 cells or 1 ms (whichever is smaller). Thebu�er size at the bottleneck link is sized as TBE �n� 1, 2, or 4, where n is the number ofABR sources.6 The n Source + VBR Con�gurationThe general con�guration we analyze is, what we call \the n Source + VBR con�guration."This con�guration has a single bottleneck link (LINK1) shared by the n ABR sources andpossibly a VBR source. All links run at 155 Mbps and are 1000 km long.The VBR background is optional. When present, it is an ON-OFF source with a 100 ms
Shiv Kalyanaraman, Performance of TCP/IP over ABR 7
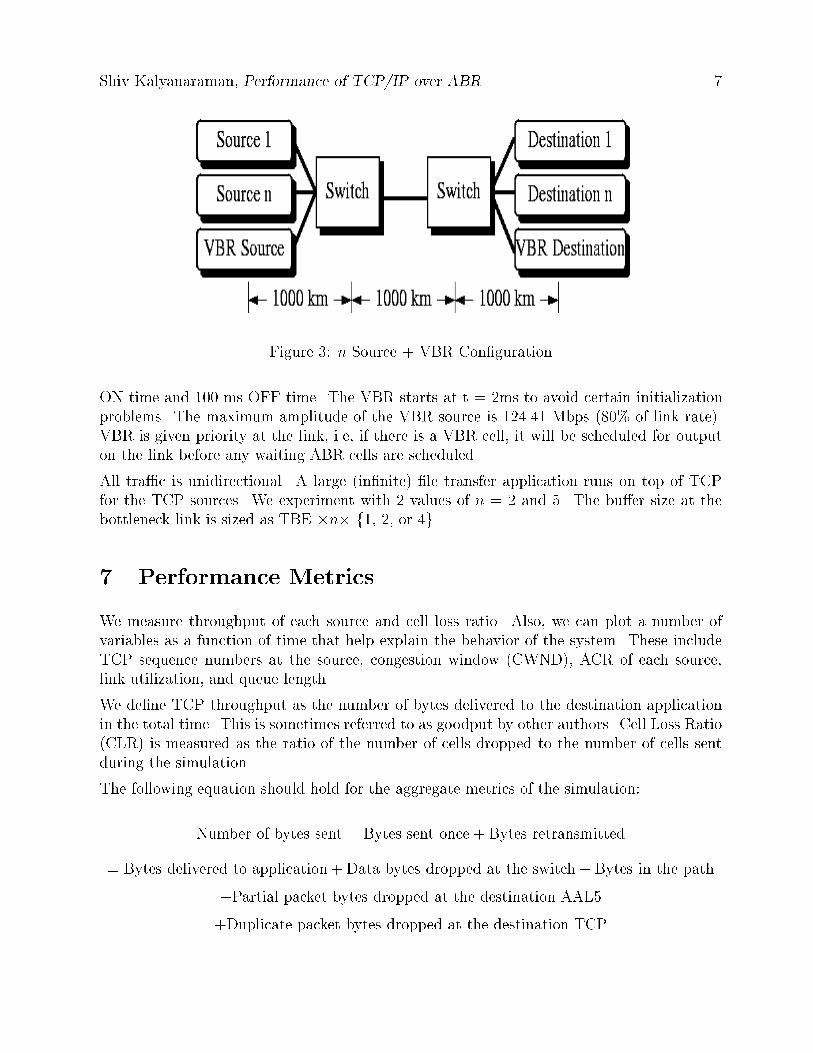
Figure 3: n Source + VBR Con�gurationON time and 100 ms OFF time. The VBR starts at t = 2ms to avoid certain initializationproblems. The maximum amplitude of the VBR source is 124.41 Mbps (80% of link rate).VBR is given priority at the link, i.e, if there is a VBR cell, it will be scheduled for outputon the link before any waiting ABR cells are scheduled.All tra�c is unidirectional. A large (in�nite) �le transfer application runs on top of TCPfor the TCP sources. We experiment with 2 values of n = 2 and 5. The bu�er size at thebottleneck link is sized as TBE �n� f1, 2, or 4g.7 Performance MetricsWe measure throughput of each source and cell loss ratio. Also, we can plot a number ofvariables as a function of time that help explain the behavior of the system. These includeTCP sequence numbers at the source, congestion window (CWND), ACR of each source,link utilization, and queue length.We de�ne TCP throughput as the number of bytes delivered to the destination applicationin the total time. This is sometimes referred to as goodput by other authors. Cell Loss Ratio(CLR) is measured as the ratio of the number of cells dropped to the number of cells sentduring the simulation.The following equation should hold for the aggregate metrics of the simulation:Number of bytes sent = Bytes sent once + Bytes retransmitted= Bytes delivered to application + Data bytes dropped at the switch + Bytes in the path+Partial packet bytes dropped at the destination AAL5+Duplicate packet bytes dropped at the destination TCP

Shiv Kalyanaraman, Performance of TCP/IP over ABR 8
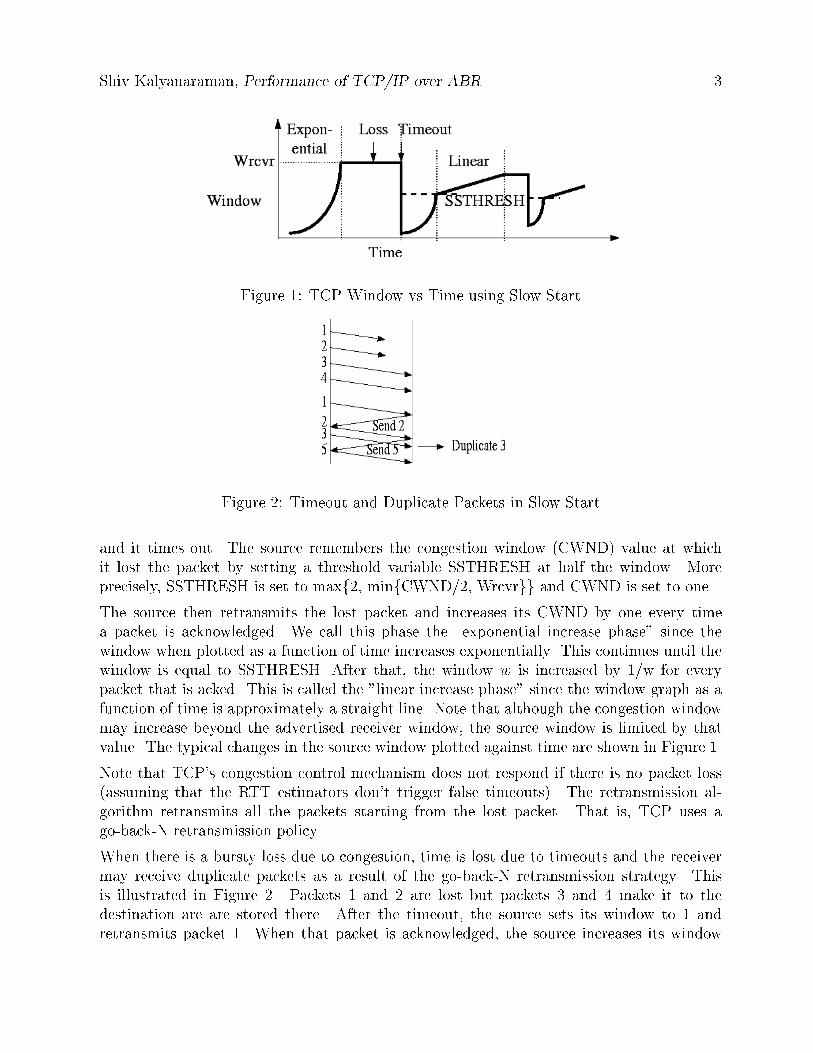
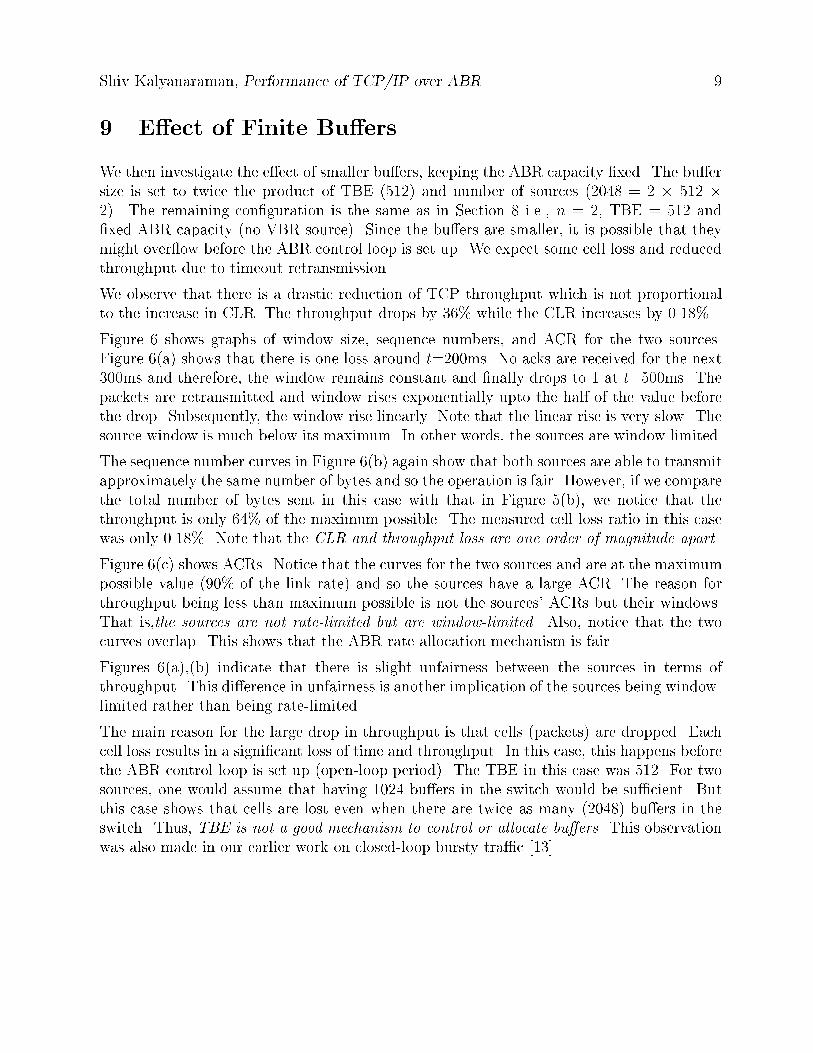
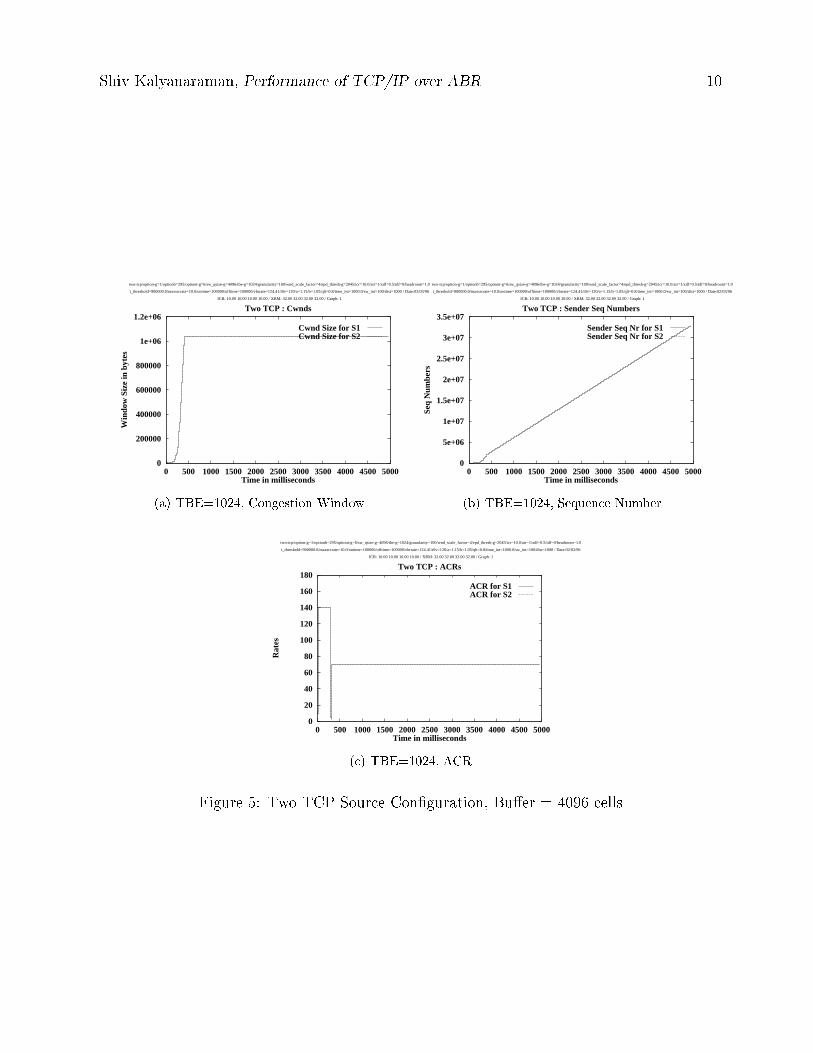
Figure 4: Cell/Packet Drop Points on a TCP/ATM connectionThat is, the total number of bytes sent should equal sum of the number of bytes delivered toapplication, the number of data bytes dropped in the switch, number of bytes in the path,number of partial packet bytes dropped at the destination AAL5 and the duplicate packetbytes dropped at the destination TCP. The places where cells or packets are dropped areillustrated in Figure 4.8 Peak TCP ThroughputIn order to measure the best possible throughput of TCP over ABR, we �rst present theresults of a case with in�nite bu�ers and �xed ABR capacity. With �nite bu�ers or variableABR capacity, it is possible that some cells are lost, which may result in unnecessary timeoutsand retransmissions leading to reduced throughput. Fixed ABR capacity is achieved by nothaving any VBR source in this case.We simulate the con�guration with n = 2, bu�er size = 4096 and TBE = 512. In this case,no cells are lost, the CLR is zero and the throughput is 103.32 Mbps. This is the maximumTCP throughput with two sources in this con�guration. It can be approximately veri�ed asfollows:Throughput = 155 Mbps� 0.9 for ERICA Target Utilization� 48/53 for ATM payload� 512/568 for protocol headers(20 TCP + 20 IP + 8 RFC1577 + 8 AAL5 = 56 bytes)� 31/32 for ABR RM cell overhead� 0.9 TCP window startup period=103.32 MbpsFigure 5 shows graphs of window size, sequence numbers, and ACR for the two sources.Note that the curves for the two sources completely overlap indicating that the performanceis fair. Also, the sources use the entire ACR allocated to them. In other words,the TCPsources are rate-limited and not window-limited.
Shiv Kalyanaraman, Performance of TCP/IP over ABR 99 E�ect of Finite Bu�ersWe then investigate the e�ect of smaller bu�ers, keeping the ABR capacity �xed. The bu�ersize is set to twice the product of TBE (512) and number of sources (2048 = 2 � 512 �2). The remaining con�guration is the same as in Section 8 i.e., n = 2, TBE = 512 and�xed ABR capacity (no VBR source). Since the bu�ers are smaller, it is possible that theymight over ow before the ABR control loop is set up. We expect some cell loss and reducedthroughput due to timeout retransmission.We observe that there is a drastic reduction of TCP throughput which is not proportionalto the increase in CLR. The throughput drops by 36% while the CLR increases by 0.18%.Figure 6 shows graphs of window size, sequence numbers, and ACR for the two sources.Figure 6(a) shows that there is one loss around t=200ms. No acks are received for the next300ms and therefore, the window remains constant and �nally drops to 1 at t=500ms. Thepackets are retransmitted and window rises exponentially upto the half of the value beforethe drop. Subsequently, the window rise linearly. Note that the linear rise is very slow. Thesource window is much below its maximum. In other words, the sources are window limited.The sequence number curves in Figure 6(b) again show that both sources are able to transmitapproximately the same number of bytes and so the operation is fair. However, if we comparethe total number of bytes sent in this case with that in Figure 5(b), we notice that thethroughput is only 64% of the maximum possible. The measured cell loss ratio in this casewas only 0.18%. Note that the CLR and throughput loss are one order of magnitude apart.Figure 6(c) shows ACRs. Notice that the curves for the two sources and are at the maximumpossible value (90% of the link rate) and so the sources have a large ACR. The reason forthroughput being less than maximum possible is not the sources' ACRs but their windows.That is,the sources are not rate-limited but are window-limited. Also, notice that the twocurves overlap. This shows that the ABR rate allocation mechanism is fair.Figures 6(a),(b) indicate that there is slight unfairness between the sources in terms ofthroughput. This di�erence in unfairness is another implication of the sources being window-limited rather than being rate-limited.The main reason for the large drop in throughput is that cells (packets) are dropped. Eachcell loss results in a signi�cant loss of time and throughput. In this case, this happens beforethe ABR control loop is set up (open-loop period). The TBE in this case was 512. For twosources, one would assume that having 1024 bu�ers in the switch would be su�cient. Butthis case shows that cells are lost even when there are twice as many (2048) bu�ers in theswitch. Thus, TBE is not a good mechanism to control or allocate bu�ers. This observationwas also made in our earlier work on closed-loop bursty tra�c [13].
Shiv Kalyanaraman, Performance of TCP/IP over ABR 10
ICR: 10.00 10.00 10.00 10.00 / XRM: 32.00 32.00 32.00 32.00 / Graph: 1
two-tcp/option-g=1/optionb=295/optiont-g=6/sw_qsize-g=4096/tbe-g=1024/granularity=100/wnd_scale_factor=4/epd_thresh-g=2045/icr=10.0/air=1/xdf=0.5/tdf=0/headroom=1.0
t_threshold=900000.0/maxsrcrate=10.0/ontime=100000/offtime=100000/vbrrate=124.41/t0v=120/a=1.15/b=1.05/qlt=0.8/time_int=1000.0/sw_int=100/dist=1000 / Date:02/03/96
0
200000
400000
600000
800000
1e+06
1.2e+06
0 500 1000 1500 2000 2500 3000 3500 4000 4500 5000
Win
dow
Siz
e in
byt
es
Time in milliseconds
Two TCP : Cwnds
Cwnd Size for S1 Cwnd Size for S2
(a) TBE=1024, Congestion Window
ICR: 10.00 10.00 10.00 10.00 / XRM: 32.00 32.00 32.00 32.00 / Graph: 1
two-tcp/option-g=1/optionb=295/optiont-g=6/sw_qsize-g=4096/tbe-g=1024/granularity=100/wnd_scale_factor=4/epd_thresh-g=2045/icr=10.0/air=1/xdf=0.5/tdf=0/headroom=1.0
t_threshold=900000.0/maxsrcrate=10.0/ontime=100000/offtime=100000/vbrrate=124.41/t0v=120/a=1.15/b=1.05/qlt=0.8/time_int=1000.0/sw_int=100/dist=1000 / Date:02/03/96
0
5e+06
1e+07
1.5e+07
2e+07
2.5e+07
3e+07
3.5e+07
0 500 1000 1500 2000 2500 3000 3500 4000 4500 5000
Seq
Num
bers
Time in milliseconds
Two TCP : Sender Seq Numbers
Sender Seq Nr for S1 Sender Seq Nr for S2
(b) TBE=1024, Sequence NumberICR: 10.00 10.00 10.00 10.00 / XRM: 32.00 32.00 32.00 32.00 / Graph: 1
two-tcp/option-g=1/optionb=295/optiont-g=6/sw_qsize-g=4096/tbe-g=1024/granularity=100/wnd_scale_factor=4/epd_thresh-g=2045/icr=10.0/air=1/xdf=0.5/tdf=0/headroom=1.0
t_threshold=900000.0/maxsrcrate=10.0/ontime=100000/offtime=100000/vbrrate=124.41/t0v=120/a=1.15/b=1.05/qlt=0.8/time_int=1000.0/sw_int=100/dist=1000 / Date:02/03/96
0
20
40
60
80
100
120
140
160
180
0 500 1000 1500 2000 2500 3000 3500 4000 4500 5000
Rat
es
Time in milliseconds
Two TCP : ACRs
ACR for S1 ACR for S2
(c) TBE=1024, ACRFigure 5: Two TCP Source Con�guration, Bu�er = 4096 cells

Shiv Kalyanaraman, Performance of TCP/IP over ABR 11
ICR: 10.00 10.00 10.00 10.00 / XRM: 16.00 16.00 16.00 16.00 / Graph: 1
two-tcp/option=1/optionb=295/optiont=6/sw_qsize=2048/tbe=512/granularity=100/wnd_scale_factor=4/epd_thresh=2045/icr=10.0/air=1/xdf=0.5/tdf=0/headroom=1.0
t_threshold=900000.0/maxsrcrate=10.0/ontime=100000/offtime=100000/vbrrate=124.41/t0v=120/a=1.15/b=1.05/qlt=0.8/time_int=1000.0/sw_int=100/dist=1000 / Date:02/03/96
0
50000
100000
150000
200000
250000
300000
0 500 1000 1500 2000 2500 3000 3500 4000 4500 5000
Win
dow
Siz
e in
byt
es
Time in milliseconds
Two TCP : Cwnds
Cwnd Size for S1 Cwnd Size for S2
(a) TBE=512, Congestion Window
ICR: 10.00 10.00 10.00 10.00 / XRM: 16.00 16.00 16.00 16.00 / Graph: 1
two-tcp/option=1/optionb=295/optiont=6/sw_qsize=2048/tbe=512/granularity=100/wnd_scale_factor=4/epd_thresh=2045/icr=10.0/air=1/xdf=0.5/tdf=0/headroom=1.0
t_threshold=900000.0/maxsrcrate=10.0/ontime=100000/offtime=100000/vbrrate=124.41/t0v=120/a=1.15/b=1.05/qlt=0.8/time_int=1000.0/sw_int=100/dist=1000 / Date:02/03/96
0
5e+06
1e+07
1.5e+07
2e+07
2.5e+07
0 500 1000 1500 2000 2500 3000 3500 4000 4500 5000
Seq
Num
bers
Time in milliseconds
Two TCP : Sender Seq Numbers
Sender Seq Nr for S1 Sender Seq Nr for S2
(b) TBE=512, Sequence NumberICR: 10.00 10.00 10.00 10.00 / XRM: 16.00 16.00 16.00 16.00 / Graph: 1
two-tcp/option=1/optionb=295/optiont=6/sw_qsize=2048/tbe=512/granularity=100/wnd_scale_factor=4/epd_thresh=2045/icr=10.0/air=1/xdf=0.5/tdf=0/headroom=1.0
t_threshold=900000.0/maxsrcrate=10.0/ontime=100000/offtime=100000/vbrrate=124.41/t0v=120/a=1.15/b=1.05/qlt=0.8/time_int=1000.0/sw_int=100/dist=1000 / Date:02/03/96
0
20
40
60
80
100
120
140
160
180
0 500 1000 1500 2000 2500 3000 3500 4000 4500 5000
Rat
es
Time in milliseconds
Two TCP : ACRs
ACR for S1 ACR for S2
(c) TBE=512, ACRFigure 6: Two TCP Source Con�guration, Bu�er = 2048 cells
Shiv Kalyanaraman, Performance of TCP/IP over ABR 12ICR: 10.00 10.00 10.00 10.00 / XRM: 4.00 4.00 4.00 4.00 / Graph: 1
vtwo-tcp/option-g=1/optionb=295/optiont-g=6/sw_qsize-g=256/tbe-g=128/granularity=100/wnd_scale_factor=4/epd_thresh-g=2045/icr=10.0/air=1/xdf=0.5/tdf=0/headroom=1.0
t_threshold=900000.0/maxsrcrate=10.0/ontime=100000/offtime=100000/vbrrate=124.41/t0v=120/a=1.15/b=1.05/qlt=0.8/time_int=1000.0/sw_int=100/dist=1000 / Date:02/03/96
0
5000
10000
15000
20000
25000
30000
35000
40000
45000
50000
0 500 1000 1500 2000 2500 3000 3500 4000 4500 5000
Win
dow
Siz
e in
byt
es
Time in milliseconds
Two TCP + One VBR : Cwnds
Cwnd Size for S1 Cwnd Size for S2
(a) bu�er=256, TBE=128, Congestion Window
ICR: 10.00 10.00 10.00 10.00 / XRM: 4.00 4.00 4.00 4.00 / Graph: 2
vtwo-tcp/option-g=1/optionb=295/optiont-g=6/sw_qsize-g=1024/tbe-g=128/granularity=100/wnd_scale_factor=4/epd_thresh-g=2045/icr=10.0/air=1/xdf=0.5/tdf=0/headroom=1.0
t_threshold=900000.0/maxsrcrate=10.0/ontime=100000/offtime=100000/vbrrate=124.41/t0v=120/a=1.15/b=1.05/qlt=0.8/time_int=1000.0/sw_int=100/dist=1000 / Date:02/03/96
0
100000
200000
300000
400000
500000
600000
700000
800000
0 500 1000 1500 2000 2500 3000 3500 4000 4500 5000
Win
dow
Siz
e in
byt
es
Time in milliseconds
Two TCP + One VBR : Cwnds
Cwnd Size for S1 Cwnd Size for S2
(b) bu�er=1024, TBE=128, Congestion Win-dowICR: 10.00 10.00 10.00 10.00 / XRM: 16.00 16.00 16.00 16.00 / Graph: 3
vtwo-tcp/option=1/optionb=295/optiont=6/sw_qsize=1024/tbe=512/granularity=100/wnd_scale_factor=4/epd_thresh=1020/icr=10.0/air=1/xdf=0.5/tdf=0/headroom=1.0
t_threshold=900000.0/maxsrcrate=10.0/ontime=100000/offtime=100000/vbrrate=124.41/t0v=120/a=1.15/b=1.05/qlt=0.8/time_int=1000.0/sw_int=100/dist=1000 / Date:02/03/96
0
50000
100000
150000
200000
250000
300000
350000
400000
0 500 1000 1500 2000 2500 3000 3500 4000 4500 5000
Win
dow
Siz
e in
byt
es
Time in milliseconds
Two TCP + One VBR : Cwnds
Cwnd Size for S1 Cwnd Size for S2
(c) bu�er=1024, TBE=512, Congestion Win-dow
ICR: 10.00 10.00 10.00 10.00 / XRM: 16.00 16.00 16.00 16.00 / Graph: 2
vtwo-tcp/option=1/optionb=295/optiont=6/sw_qsize=2048/tbe=512/granularity=100/wnd_scale_factor=4/epd_thresh=2045/icr=10.0/air=1/xdf=0.5/tdf=0/headroom=1.0
t_threshold=900000.0/maxsrcrate=10.0/ontime=100000/offtime=100000/vbrrate=124.41/t0v=120/a=1.15/b=1.05/qlt=0.8/time_int=1000.0/sw_int=100/dist=1000 / Date:02/03/96
0
50000
100000
150000
200000
250000
300000
350000
400000
450000
0 500 1000 1500 2000 2500 3000 3500 4000 4500 5000
Win
dow
Siz
e in
byt
es
Time in milliseconds
Two TCP + One VBR : Cwnds
Cwnd Size for S1 Cwnd Size for S2
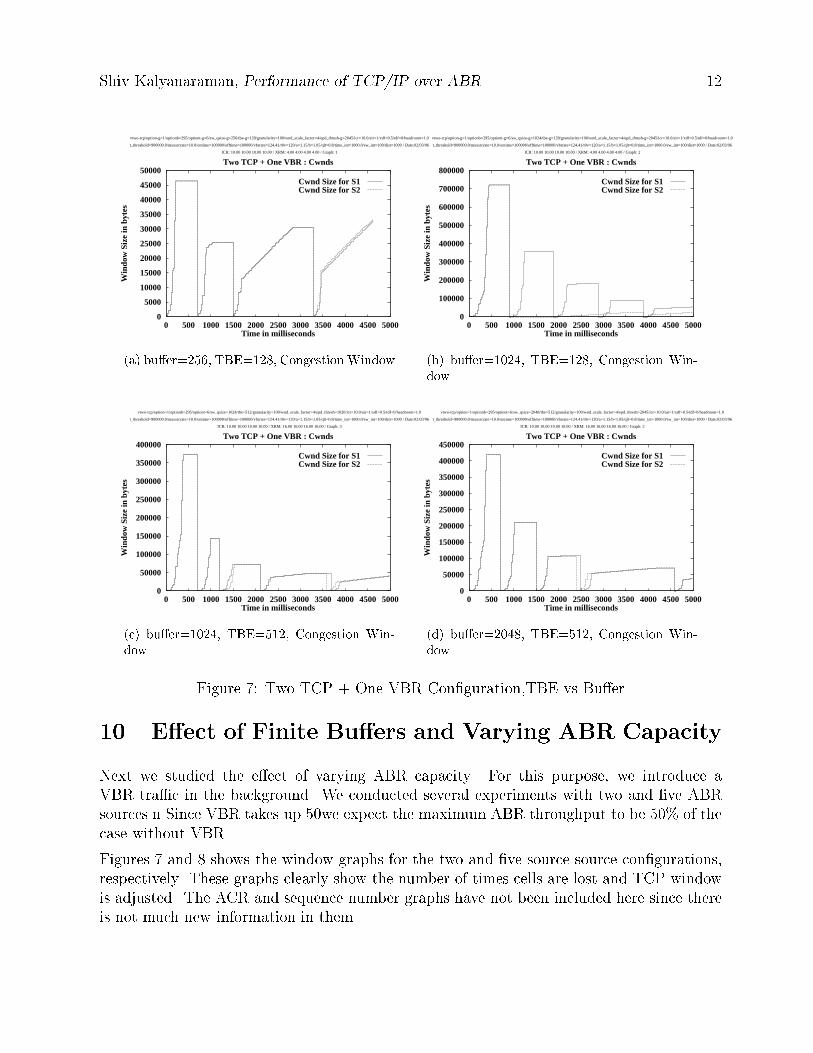
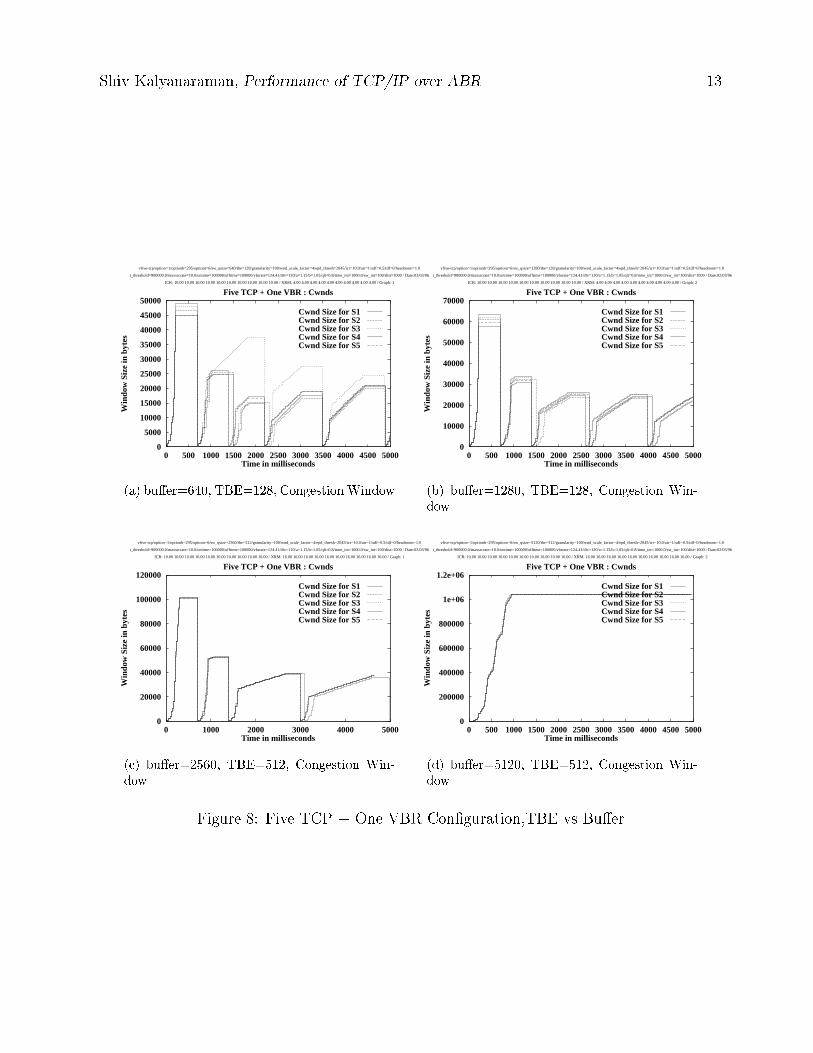
(d) bu�er=2048, TBE=512, Congestion Win-dowFigure 7: Two TCP + One VBR Con�guration,TBE vs Bu�er10 E�ect of Finite Bu�ers and Varying ABR CapacityNext we studied the e�ect of varying ABR capacity. For this purpose, we introduce aVBR tra�c in the background. We conducted several experiments with two and �ve ABRsources.n Since VBR takes up 50we expect the maximum ABR throughput to be 50% of thecase without VBR.Figures 7 and 8 shows the window graphs for the two and �ve source source con�gurations,respectively. These graphs clearly show the number of times cells are lost and TCP windowis adjusted. The ACR and sequence number graphs have not been included here since thereis not much new information in them.
Shiv Kalyanaraman, Performance of TCP/IP over ABR 13ICR: 10.00 10.00 10.00 10.00 10.00 10.00 10.00 10.00 10.00 10.00 / XRM: 4.00 4.00 4.00 4.00 4.00 4.00 4.00 4.00 4.00 4.00 / Graph: 1
vfive-tcp/option=1/optionb=295/optiont=6/sw_qsize=640/tbe=128/granularity=100/wnd_scale_factor=4/epd_thresh=2045/icr=10.0/air=1/xdf=0.5/tdf=0/headroom=1.0
t_threshold=900000.0/maxsrcrate=10.0/ontime=100000/offtime=100000/vbrrate=124.41/t0v=120/a=1.15/b=1.05/qlt=0.8/time_int=1000.0/sw_int=100/dist=1000 / Date:02/03/96
0
5000
10000
15000
20000
25000
30000
35000
40000
45000
50000
0 500 1000 1500 2000 2500 3000 3500 4000 4500 5000
Win
dow
Siz
e in
byt
es
Time in milliseconds
Five TCP + One VBR : Cwnds
Cwnd Size for S1 Cwnd Size for S2 Cwnd Size for S3 Cwnd Size for S4 Cwnd Size for S5
(a) bu�er=640, TBE=128, Congestion Window
ICR: 10.00 10.00 10.00 10.00 10.00 10.00 10.00 10.00 10.00 10.00 / XRM: 4.00 4.00 4.00 4.00 4.00 4.00 4.00 4.00 4.00 4.00 / Graph: 2
vfive-tcp/option=1/optionb=295/optiont=6/sw_qsize=1280/tbe=128/granularity=100/wnd_scale_factor=4/epd_thresh=2045/icr=10.0/air=1/xdf=0.5/tdf=0/headroom=1.0
t_threshold=900000.0/maxsrcrate=10.0/ontime=100000/offtime=100000/vbrrate=124.41/t0v=120/a=1.15/b=1.05/qlt=0.8/time_int=1000.0/sw_int=100/dist=1000 / Date:02/03/96
0
10000
20000
30000
40000
50000
60000
70000
0 500 1000 1500 2000 2500 3000 3500 4000 4500 5000
Win
dow
Siz
e in
byt
es
Time in milliseconds
Five TCP + One VBR : Cwnds
Cwnd Size for S1 Cwnd Size for S2 Cwnd Size for S3 Cwnd Size for S4 Cwnd Size for S5
(b) bu�er=1280, TBE=128, Congestion Win-dowICR: 10.00 10.00 10.00 10.00 10.00 10.00 10.00 10.00 10.00 10.00 / XRM: 16.00 16.00 16.00 16.00 16.00 16.00 16.00 16.00 16.00 16.00 / Graph: 1
vfive-tcp/option=1/optionb=295/optiont=6/sw_qsize=2560/tbe=512/granularity=100/wnd_scale_factor=4/epd_thresh=2045/icr=10.0/air=1/xdf=0.5/tdf=0/headroom=1.0
t_threshold=900000.0/maxsrcrate=10.0/ontime=100000/offtime=100000/vbrrate=124.41/t0v=120/a=1.15/b=1.05/qlt=0.8/time_int=1000.0/sw_int=100/dist=1000 / Date:02/03/96
0
20000
40000
60000
80000
100000
120000
0 1000 2000 3000 4000 5000
Win
dow
Siz
e in
byt
es
Time in milliseconds
Five TCP + One VBR : Cwnds
Cwnd Size for S1 Cwnd Size for S2 Cwnd Size for S3 Cwnd Size for S4 Cwnd Size for S5
(c) bu�er=2560, TBE=512, Congestion Win-dow
ICR: 10.00 10.00 10.00 10.00 10.00 10.00 10.00 10.00 10.00 10.00 / XRM: 16.00 16.00 16.00 16.00 16.00 16.00 16.00 16.00 16.00 16.00 / Graph: 2
vfive-tcp/option=1/optionb=295/optiont=6/sw_qsize=5120/tbe=512/granularity=100/wnd_scale_factor=4/epd_thresh=2045/icr=10.0/air=1/xdf=0.5/tdf=0/headroom=1.0
t_threshold=900000.0/maxsrcrate=10.0/ontime=100000/offtime=100000/vbrrate=124.41/t0v=120/a=1.15/b=1.05/qlt=0.8/time_int=1000.0/sw_int=100/dist=1000 / Date:02/03/96
0
200000
400000
600000
800000
1e+06
1.2e+06
0 500 1000 1500 2000 2500 3000 3500 4000 4500 5000
Win
dow
Siz
e in
byt
es
Time in milliseconds
Five TCP + One VBR : Cwnds
Cwnd Size for S1 Cwnd Size for S2 Cwnd Size for S3 Cwnd Size for S4 Cwnd Size for S5
(d) bu�er=5120, TBE=512, Congestion Win-dowFigure 8: Five TCP + One VBR Con�guration,TBE vs Bu�er
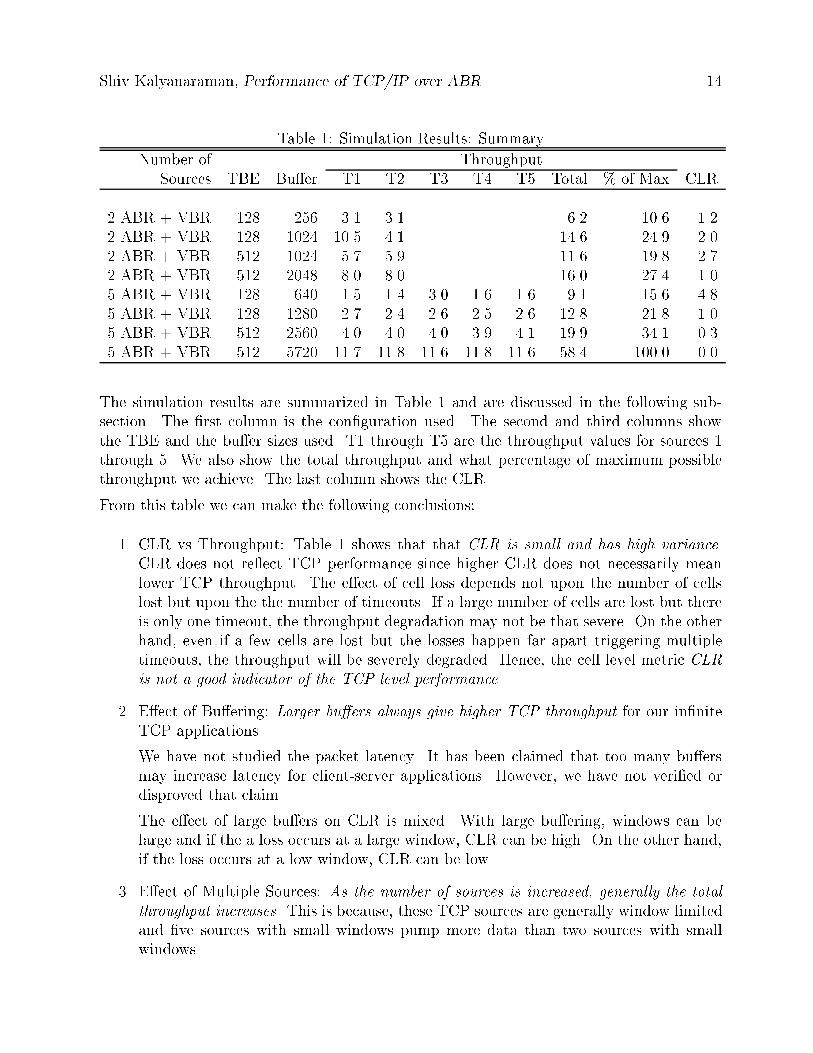
Shiv Kalyanaraman, Performance of TCP/IP over ABR 14Table 1: Simulation Results: SummaryNumber of ThroughputSources TBE Bu�er T1 T2 T3 T4 T5 Total % of Max CLR2 ABR + VBR 128 256 3.1 3.1 6.2 10.6 1.22 ABR + VBR 128 1024 10.5 4.1 14.6 24.9 2.02 ABR + VBR 512 1024 5.7 5.9 11.6 19.8 2.72 ABR + VBR 512 2048 8.0 8.0 16.0 27.4 1.05 ABR + VBR 128 640 1.5 1.4 3.0 1.6 1.6 9.1 15.6 4.85 ABR + VBR 128 1280 2.7 2.4 2.6 2.5 2.6 12.8 21.8 1.05 ABR + VBR 512 2560 4.0 4.0 4.0 3.9 4.1 19.9 34.1 0.35 ABR + VBR 512 5720 11.7 11.8 11.6 11.8 11.6 58.4 100.0 0.0The simulation results are summarized in Table 1 and are discussed in the following sub-section. The �rst column is the con�guration used. The second and third columns showthe TBE and the bu�er sizes used. T1 through T5 are the throughput values for sources 1through 5. We also show the total throughput and what percentage of maximum possiblethroughput we achieve. The last column shows the CLR.From this table we can make the following conclusions:1. CLR vs Throughput: Table 1 shows that that CLR is small and has high variance.CLR does not re ect TCP performance since higher CLR does not necessarily meanlower TCP throughput. The e�ect of cell loss depends not upon the number of cellslost but upon the the number of timeouts. If a large number of cells are lost but thereis only one timeout, the throughput degradation may not be that severe. On the otherhand, even if a few cells are lost but the losses happen far apart triggering multipletimeouts, the throughput will be severely degraded. Hence, the cell level metric CLRis not a good indicator of the TCP level performance.2. E�ect of Bu�ering: Larger bu�ers always give higher TCP throughput for our in�niteTCP applications.We have not studied the packet latency. It has been claimed that too many bu�ersmay increase latency for client-server applications. However, we have not veri�ed ordisproved that claim.The e�ect of large bu�ers on CLR is mixed. With large bu�ering, windows can belarge and if the a loss occurs at a large window, CLR can be high. On the other hand,if the loss occurs at a low window, CLR can be low.3. E�ect of Multiple Sources: As the number of sources is increased, generally the totalthroughput increases. This is because, these TCP sources are generally window limitedand �ve sources with small windows pump more data than two sources with smallwindows.
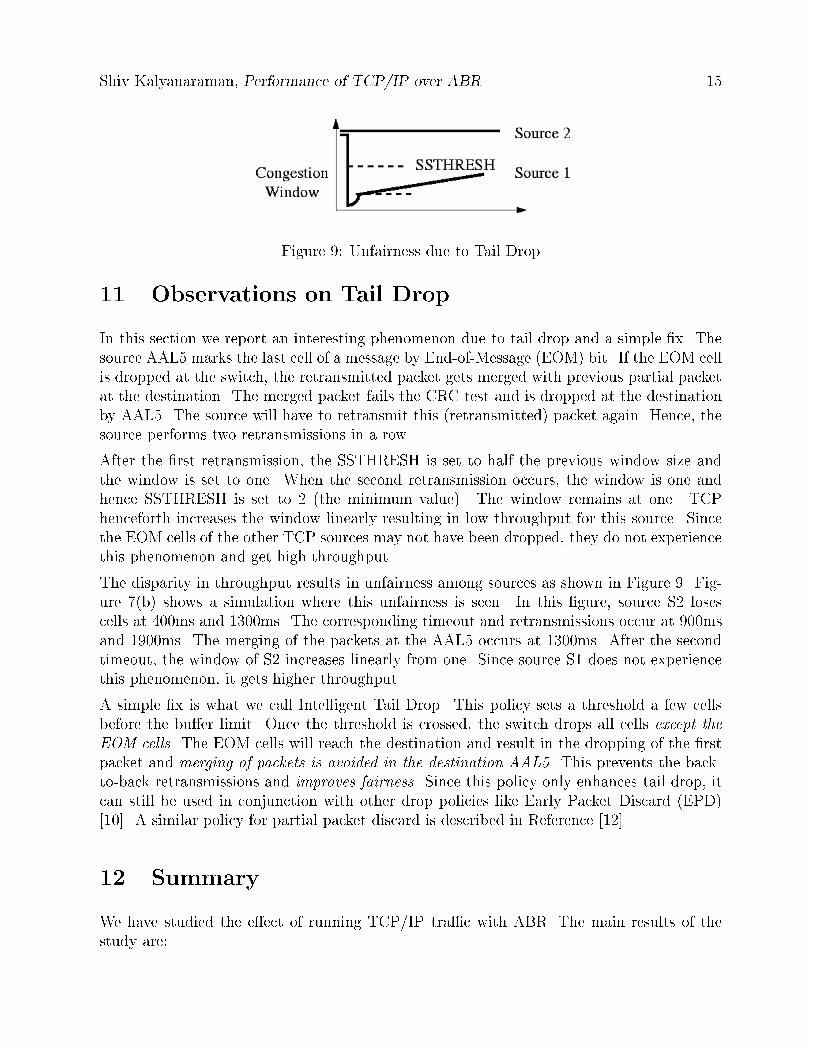
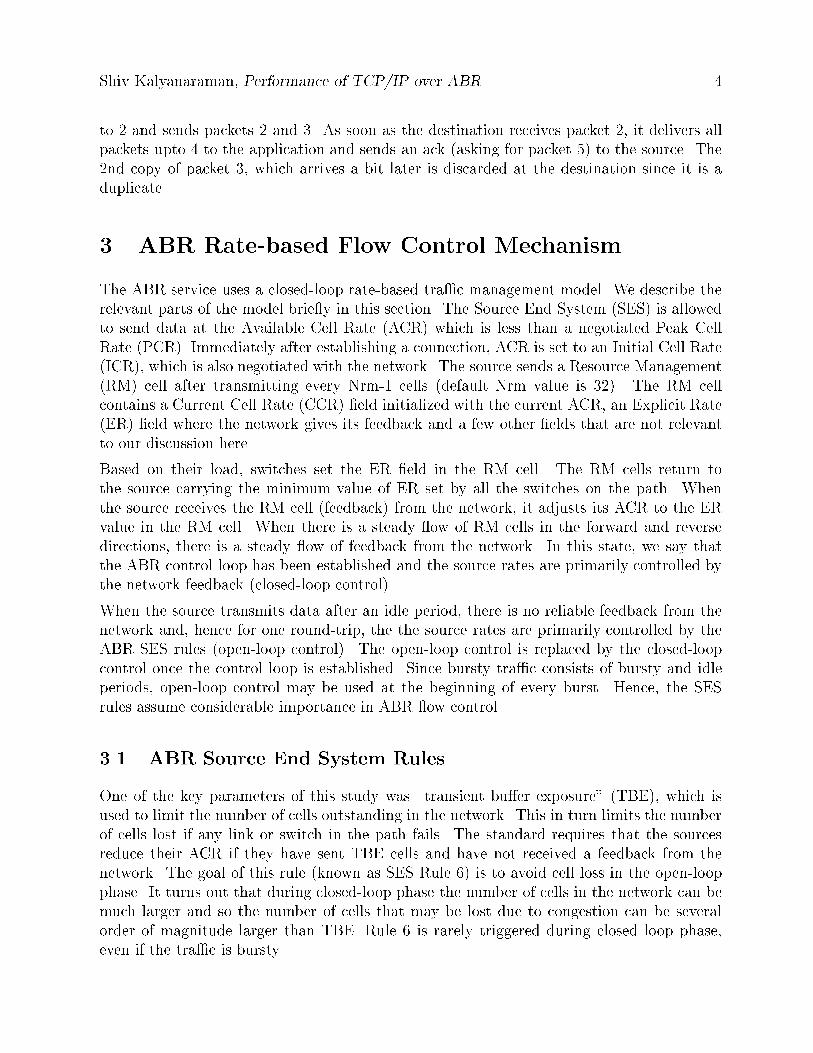
Shiv Kalyanaraman, Performance of TCP/IP over ABR 15Figure 9: Unfairness due to Tail Drop11 Observations on Tail DropIn this section we report an interesting phenomenon due to tail drop and a simple �x. Thesource AAL5 marks the last cell of a message by End-of-Message (EOM) bit. If the EOM cellis dropped at the switch, the retransmitted packet gets merged with previous partial packetat the destination. The merged packet fails the CRC test and is dropped at the destinationby AAL5. The source will have to retransmit this (retransmitted) packet again. Hence, thesource performs two retransmissions in a row.After the �rst retransmission, the SSTHRESH is set to half the previous window size andthe window is set to one. When the second retransmission occurs, the window is one andhence SSTHRESH is set to 2 (the minimum value). The window remains at one. TCPhenceforth increases the window linearly resulting in low throughput for this source. Sincethe EOM cells of the other TCP sources may not have been dropped, they do not experiencethis phenomenon and get high throughput.The disparity in throughput results in unfairness among sources as shown in Figure 9. Fig-ure 7(b) shows a simulation where this unfairness is seen. In this �gure, source S2 losescells at 400ms and 1300ms. The corresponding timeout and retransmissions occur at 900msand 1900ms. The merging of the packets at the AAL5 occurs at 1300ms. After the secondtimeout, the window of S2 increases linearly from one. Since source S1 does not experiencethis phenomenon, it gets higher throughput.A simple �x is what we call Intelligent Tail Drop. This policy sets a threshold a few cellsbefore the bu�er limit. Once the threshold is crossed, the switch drops all cells except theEOM cells. The EOM cells will reach the destination and result in the dropping of the �rstpacket and merging of packets is avoided in the destination AAL5. This prevents the back-to-back retransmissions and improves fairness. Since this policy only enhances tail drop, itcan still be used in conjunction with other drop policies like Early Packet Discard (EPD)[10]. A similar policy for partial packet discard is described in Reference [12].12 SummaryWe have studied the e�ect of running TCP/IP tra�c with ABR. The main results of thestudy are:
Shiv Kalyanaraman, Performance of TCP/IP over ABR 161. TCP achieves maximum throughput when there are enough bu�ers at the switches.2. When maximum throughput is achieved, the TCP sources are rate-limited by ABRrather than window-limited by TCP.3. When the number of bu�ers is smaller, there is a large reduction in throughput eventhough CLR is very small.4. The reduction in throughput is due to loss of time during timeouts (large timer gran-ularity), and transmission of duplicate packets which are dropped at the destination.5. When throughput is reduced, the TCP sources are window-limited by TCP rather thanrate-limited by ABR.6. Switch bu�ers should not be dimensioned based on the ABR Source parameter TBE.7. When ABR capacity is varied, CLR exhibits high variance and is not related to TCPthroughput. In general, CLR is not a good indicator of TCP level performance.8. Larger bu�ers increase TCP throughput.9. Larger number of window-limited sources increase TCP throughput. This is because,the sum of the windows is larger when there are more sources.10. Even when the bu�ers are small, dropping of EOM cells should be avoided. This avoidsmerging of packets at the destination AAL5 and improves fairness.References[1] R. Jain, S. Kalyanaraman, R. Viswanathan, and R. Goyal, \ERICA: Explicit RateIndication for Congestion Avoidance in ATM Networks," Technical Report, Dept ofCIS, Ohio State University, March 1996. preprint[2] R. Jain, S. Kalyanaraman, R. Viswanathan, and R. Goyal, \A Sample Switch Algo-rithm," ATM Forum 95-0178R1, February 1995.[3] Shirish S. Sathaye, \ATM Tra�c Management Speci�cation Version 4.0," ATMForum/95-0013R10, February 1996.[4] V. Jacobson, \Congestion Avoidance and Control," Proceedings of the SIGCOMM'88Symposium, pp. 314-32, August 1988.[5] M. Laubach, \Classical IP and ARP over ATM", Internet Request For Comments, 1994.[6] Chien Fang, Arthur Lin, \On TCP Performance of UBR with EPD and UBR-EPD witha Fair Bu�er Allocation Scheme," ATM Forum/95-1645, December 1995.
Shiv Kalyanaraman, Performance of TCP/IP over ABR 17[7] Chien Fang, Arthur Lin, \A Simulation Study of ABR Robustness with Binary-ModeSwitches: Part II," ATM Forum/95-1328R1, October 1995.[8] Hongqing Li, Kai-Yeung Siu, Hong-Ti Tzeng, Chinatsu Ikeda and Hiroshi Suzuki \TCPover ABR and UBR Services in ATM," to appear in IPCCC'96, March 1996.[9] Hongqing Li, Kai-Yeung Siu, and Hong-Ti Tzeng, \TCP over ATM with ABR serviceversus UBR+EPD service," ATM Forum/95-0718, June 1995.[10] Allyn Romanov, Sally Floyd, \Dynamics of TCP Tra�c over ATM Networks," IEEEJSAC, May 1995.[11] Lixia Zhang, Scott Shenker, D.D.Clark, \Observations on the Dynamics of a CongestionControl Algorithm: The E�ects of Two-Way Tra�c," ACM SIGCOMM '91.[12] G.J. Armitage, K.M. Adams, \ATM Adaptation Layer Packet Reassembly during CellLoss", IEEE Network, September 1993.[13] R.Jain, S.Fahmy, S.Kalyanaraman, R. Goyal, F.Lu, "More Strawvote Comments: TBEvs Queue sizes," ATM Forum/95-1661, December 1995.All our past ATM forum contributions and presentations can be obtained on-line: http://www.cis.ohio-state.edu/~ jain/