ABR Doctoral Thesis - Archivo Digital UPM
299
DOCTORAL THESIS Design strategies for additive manufacturing using vat photopolymerization systems Submitted by Adrian de Blas Romero Department of Mechanical Engineering Universidad Politécnica de Madrid, Spain 2018 Supervisors: Advisor: Andrés Díaz Lantada Co-Advisor: Jürgen Stampfl
-
Upload
khangminh22 -
Category
Documents
-
view
2 -
download
0
Transcript of ABR Doctoral Thesis - Archivo Digital UPM

DOCTORAL THESIS
Design strategies for additive manufacturing using vat photopolymerization systems
Submitted by
Adrian de Blas Romero
Department of Mechanical Engineering
Universidad Politécnica de Madrid, Spain
2018
Supervisors:
Advisor: Andrés Díaz Lantada
Co-Advisor: Jürgen Stampfl


ACKNOWLEDGEMENTS
At this point I must thank every single person who in many different ways took part in the realization of this Thesis.
I am particularly grateful to my two great mentors, to Prof. Jürgen Stampfl who promoted the creation of the project, in which this Thesis is based on; and to Prof. Andrés Díaz Lantada, to whom I would like to express my sincere gratitude for the continuous support, offering me this opportunity, for his patience, motivation and guidance. I could not have imagined having a better advisor for my Ph.D. study.
A very special mention goes to my department colleagues and friends, Alex and Guillermo, who made this stage of my life easier and funnier. My sincere thanks also go to the always kind Ely, Marcos, Manu and Jose, because without them the DIM Team would not have been the same. To the young ones, Eduardo, María, Alvaro, Jesus and those who started this research and the one who will continue it. I am grateful to all the DIM colleagues, specially to Enrique and Juanma for enlightening me in several moments of my way. To Soqui and Silvia for saving me in many occasions and to the PDL.
My sincere thanks to my other colleagues and friends in Vienna, who made everything smoother along my stay and several visits there. I cannot be happier for having meet you all. Special regards to Bernhard and Hofi for supporting me inside and outside the lab.
To the people of the Tomax’ consortium, specially to Lithoz and Syalons which supported this research, with not only time, facilities and material, but also with the most valuable resource - brilliant people.
Por último, tengo que agradecer a toda mi familia, especialmente a mis padres porque ellos son los que han hecho que yo llegue a ser lo que soy y ese resultado se refleja sobre el papel de este trabajo. A mi media naranja Hermy, que ha vivido conmigo toda esta etapa desde el inicio y quien ha soportado mis momentos de caída para volver a levantarme. No me puedo olvidar de los de siempre, los del domingo de vermú, los de la media maratón, las barbacoas, los viajes, la popular, el entrenamiento, la mosca… esto también es gracias a vosotros. A mi hermano gallego, Jorge, el gran Dani y mis compañeros Rodri y Miguel, vosotros ya sabéis por qué.
This Ph.D. Thesis has been supported by the European Project “ToMax: Tool-less manufacture of complex geometries” funded by the Horizon 2020 Research Program, through the “Factories-of-the-Future” call (H2020-FoF-02-2014: Manufacturing processes for complex structures and geometries with efficient use of material), under Grant Agreement nº633192.


v
ABSTRACT
Additive Manufacturing (AM) technologies enable the fabrication of geometrically complex parts which promote the creative design and are starting to reshape the way products are conceived and designed. Given the capabilities of these technologies, specially the freedom in design, it is now possible to incorporate the most challenging demands of the industry into the product development. Nevertheless, in order to fully explore and take benefit of the remarkable possibilities of these technologies, innovative design approaches should be developed, so as to shift from traditional design processes, oriented to mass production and tooling, towards methods taking account of the potentials, the limitations and special features of additive technologies. This PhD Thesis explores and develops design strategies for providing a potential added value in the direct part production of applications for the energy, health and transport sectors, using vat photopolymerization systems. These systems lead to highly precise manufacturing in a wide set of photopolymers and high-performance ceramics, by resorting to additive photopolymerization of ceramic slurries. The strategies converge into an integrative Design for Additive Manufacturing (DfAM) methodology, specially developed and deployed for vat photopolymerization technologies, which in turn support: lightweight design and downsizing, through the use of metamaterials or topological optimization; integration of functionalities; incorporation of controlled surface properties; minimization of eco-impacts and enhancement of the mechanical, thermal and fluidic performance. Therefore, this research, performed with the support of the EU Horizon 2020 "ToMax: Toolless manufacture of complex structures" project, presents novel shape grammars, end-user parts and demonstrators in polymers and ceramics, which are supported by design guidelines resulting from experimental analysis and process modeling of the operated systems. Finally, systematic procedures for the assessment of the environmental issues are developed for promoting the industrial impact these technologies and related applications.
Keywords
Additive Manufacturing, DfAM, vat photopolymerization, design strategies, metamaterials, topology optimization, complex geometries, lightweight design, ceramics, polymers.


vii
RESUMEN
Las tecnologías de fabricación aditiva (AM) posibilitan la fabricación de piezas geométricamente complejas, las cuales promueven el diseño creativo y comienzan a dar una nueva visión de cómo los productos pueden ser concebidos y diseñados. Dadas las posibilidades que estas tecnologías ofrecen, especialmente la libertad a la hora de diseñar, es posible incorporar la demandas más exigentes de la industria en el desarrollo de producto. No obstante, para explorar y sacar ventaja de las posibilidades más remarcables de estas tecnologías, nuevos métodos para diseñar han de ser desarrollados, así como facilitar la transición de una mentalidad de producción en masa enfocada a la mecanización y la substracción de material. Esta Tesis explora y desarrolla estrategias de diseño que puedan potenciar la incorporación de valor añadido a la producción directa de aplicaciones en los sectores energético, salud y transporte, gracias a la utilización de sistemas de fabricación aditiva por fotopolimerización (vat photopolymerization). Dichos sistemas permiten una producción de gran precisión en un amplio rango de polímeros y cerámicos de alto rendimiento, estos últimos obtenidos mediante slurries fotopolimerizables. Las estrategias presentadas llevan a la creación de una metodología enfocada al diseño para la fabricación aditiva (DfAM), desarrollada especialmente para sistemas por fotopolimerización que definitiva resultan en: aligeramiento del producto y reducción de tamaño, a través del uso de meta-materiales o la aplicación de optimización topológica; integración de funcionalidades; incorporación de propiedades superficiales controlada; la minimización de impactos ambientales y la mejora de rendimiento operativos a nivel fluídico, térmico y mecánico. Por lo tanto, esta investigación, llevada a cabo con el apoyo del proyecto europeo ToMax “Tooles manufacture of complex structures”, presenta nuevas gramáticas espaciales, demostradores y productos finales para el consumidor en polímeros y cerámicos, basados en guías de diseño resultado de análisis experimental y la simulación de los procesos utilizados. Finalmente, se presentan en este trabajo procedimiento sistemáticos para la evaluación de los impactos medioambientales que permitan promover el impacto industrial de estas tecnologías y sus aplicaciones asociadas.


ix
CONTENTS
Acknowledgements ..................................................................................................................... iii
ABSTRACT v
RESUMEN vii
Scope and development framework ....................................................................... 15
1.1 Aim of the thesis ............................................................................................................... 15
1.2 Institutional framework .................................................................................................... 16
Introduction ............................................................................................................ 19
2.1 State of the art and trends in additive manufacturing for the industry ........................... 19
The global market of AM technologies: Current state and prospects. .................. 24
The development of additive manufacturing technologies in the industry: Benefits
and limitations. ....................................................................................................... 28
2.2 The design process towards additive manufactured products with enhanced
functionalities. .................................................................................................................. 31
2.3 Standardization in additive manufacturing field: current situation and challenges ........ 37
2.4 References in this chapter ................................................................................................ 40
Materials and experimental methods ...................................................................... 47
3.1 Additive manufacturing technologies ............................................................................... 47
Stereolithography ................................................................................................... 48
Lithography-based additive manufacturing of ceramics ........................................ 51
3.2 Machines ........................................................................................................................... 53
Lithography laser-based systems ........................................................................... 53
Digital light processing systems .............................................................................. 56
Fused deposition modelling systems...................................................................... 57

x
Other devices and resources .................................................................................. 57
3.3 Software resources ........................................................................................................... 58
Design ..................................................................................................................... 58
Modeling and simulation resources ....................................................................... 59
Slicers ...................................................................................................................... 60
3.4 Materials ........................................................................................................................... 61
Photocurable materials .......................................................................................... 61
Other materials ....................................................................................................... 63
3.5 Experimental methods ...................................................................................................... 65
Methods for obtaining high-precision microtextured materials ............................ 65
Determination of technology limits for the SLA® system ....................................... 72
Preparation of ceramic slurries for gel-casting ...................................................... 79
3.6 References of this chapter ................................................................................................ 81
Computational modeling of complex geometries for additive manufacturing
technologies ............................................................................................................ 85
Controlling bulk properties from the design stage: Design and modeling of lattice
and porous structures ............................................................................................ 86
Design and manufacture of homogeneous porous and lattice geometries ........... 87
Design and manufacture of functionally graded porous and lattice geometries .. 91
Design and manufacture of other mechanical metamaterials ............................... 97
4.2 Simulation and assessment of complex geometries ...................................................... 105
Mechanical performance of complex geometries: Characterization data for
applications .......................................................................................................... 106
4.3 Controlling surface properties from the design stage: Design and modelling of
microtextured surfaces ................................................................................................... 110
Strategies for surface texturing by means of CAD and boolean operations ........ 111
Strategies by means of multi-scale math-based approaches ............................... 112
Strategies based on bitmap images projection and patterning ........................... 115
4.4 Modeling the manufacturing process: Quality control from design in lithography-based
techniques ...................................................................................................................... 121
Phenomena under study ...................................................................................... 122
Hypotheses and process simulation ..................................................................... 124
Computational modelling and provided data ...................................................... 125
xi
4.5 Case of study: coupling of functionally graded materials and ‘ad-hoc’ supports structure
into an AM design ........................................................................................................... 130
4.6 Conclusions of this chapter ............................................................................................. 137
4.7 References of this chapter .............................................................................................. 138
Sustainable additive manufacturing and environmental impact ............................... 147
5.1 Review of the environmental aspects involved in additive manufacturing processes .. 147
5.2 Influence of design on the eco-efficient performance of products obtained by additive
manufacturing................................................................................................................. 149
Part integration .................................................................................................... 150
Bulk density modifications ................................................................................... 151
Support structures ................................................................................................ 155
Part orientation .................................................................................................... 159
Topology optimization for lightweight design ...................................................... 160
5.3 Case of study: Topology optimization of a motorbike brake lever................................. 162
5.4 Case of study: Optimization of support structures for eco-efficient additive manufacture
........................................................................................................................................ 170
5.5 Case of study: Efficient design of sacrificial molds for gelcasting .................................. 183
5.6 Conclusions of this chapter ............................................................................................. 190
5.7 References of this chapter .............................................................................................. 191
Industrial applications of complex geometries in eco-efficient and functionally
enhanced products ................................................................................................. 197
Lattice and porous structures in the development of functionally graded tissue
scaffolds and catalytic devices ............................................................................. 197
Tissue engineering scaffolds ................................................................................. 197
Catalytic devices ................................................................................................... 201
6.2 Surface functionalization for cell culture, enhanced contact phenomena and improved
ergonomics & aesthetics................................................................................................. 203
Cell interaction ..................................................................................................... 204
Surface contact phenomena ................................................................................ 209
Aesthetics, ergonomics and customization .......................................................... 219
6.3 Integral strategies for multi-functional engineering systems: Cases of success ............ 222
Design, modeling and manufacture of pneumatic actuator for soft robotics ..... 222
Design, modeling and manufacture of innovative solid oxide fuel cells .............. 226

xii
Design, modeling and manufacture of 3D-labs-on a chip .................................... 240
Design, modeling and manufacture of microstructures for desired mechanical
responses .............................................................................................................. 248
Design, modeling and manufacture of multi-functional heat exchangers and heat
sinks ...................................................................................................................... 255
6.4 Conclusions of this chapter ............................................................................................. 270
6.5 References of this chapter .............................................................................................. 271
Conclusions and future research lines ..................................................................... 277
7.1 Conclusions ..................................................................................................................... 277
7.2 Future research lines ...................................................................................................... 281
List of contributions .................................................................................................................. 283
list of figures ............................................................................................................................. 285
List of tables .............................................................................................................................. 296

Chapter 1 Scope and development framework


Chapter 1 Scope and development framework
15
SCOPE AND DEVELOPMENT FRAMEWORK
1.1 Aim of the thesis
The main aim of this thesis is the development and integration of new design strategies, which could promote the industrial and socioeconomic impact of the additive manufacturing technologies based on vat photopolymerization, by enhancing the functionalities and features of innovative applications across engineering, energy, medical and transport fields (via product integration, lightweighting of the parts and improvement regarding their eco-efficiency and performance), when they are compared to their similars made by traditional techniques. Thus, the primary objectives can be listed as follows:
� To develop and apply knowledge-based strategies, so as to carry out feasible designs that can be successfully obtained by additive manufacture and that improve design features such as the part weight, mechanical performance, ergonomics or aesthetics, among other functionalities.
� To provide a comparison of eco-efficiency among different strategies to generate support structures applied to diverse potential geometries, as basis for an eco-impact assessment of vat photopolymerization technologies.
� To illustrate, by means of real cases of study, how the design strategies, including topology optimization, lightweighting, texturing and bioinspired design for complex geometries, provide an added value into real end-user products.
� To elaborate a methodology which takes its foundation on the compiling of the strategies, the extracted `know-how’ from the experimental and the process modelling, for presenting a bottom-up design process that enables a reliable manufacturing of products by vat photopolymerization AM.
Nevertheless, to accomplish that achievement it is necessary to go through systematic steps and to complete parallel goals, which are also relevant for this research. Among these additional goals, it is important to cite:
- To evaluate the additive manufacturing processes based on vat photopolymerization, in order to correctly achieve information regarding the 3D building constrains, based on either experimental analyses and also analytical models that can predict the behavior of the material during the processing.
- The development of a library of predefined unit cells, with controlled mechanical properties, based on lattice and porous structures for the purpose of systematic generation of self-supported structures in vat photopolymerization systems.

16
- Incorporation of bioinspired design strategies for the generation of innovative support structures.
- The study of the existing methodologies and processes to create designs oriented for its additive manufacturing and the development of an integral process to generate optimized designs.
- The calibration and formulation of photo-reactive materials and additive manufacturing systems to obtain high precision design-controlled textures in additively manufactured parts.
1.2 Institutional framework
The research is performed within the European project ̀ `ToMax: Toolless Manufacturing of Complex Geometries’’ funded by the European Union’s Horizon 2020 Research and Innovation programme. The duration of the project is 36 months, and involves a consortium composed of private and public institutions. The companies are: Lithoz GmbH, Syalons International Ltd, Rauschert GmbH, Osram GmbH, Invision GmbH, R2M solutions Srl, Cycleco S.L., Deskartes Oy and the universities are: ‘Universidad Politécnica de Madrid’ and ‘Technische Universität Wien’, with a total fund for the project of €2.080.000
The focus of ToMax is to unite industrial know-how in the field of: software development, photopolymers and ceramics, high performance light-sources, system integration, life cycle analysis, industrial exploitation and rewarding end-user cases of success. Aiming to exploit disruptive applications of lithography based additive manufacturing technologies (L-AMT) by developing process chains beyond the current state of the art, targeting end-use applications of ceramics in aerospace engineering, transport, medical devices and energy efficient lighting devices.
In particular, this work is mostly developed as part of the Work Package number two (WP2), ‘Software framework for manufacturing of complex structures’, led by the ‘Universidad Politécnica de Madrid’. In charge, the principal investigator Prof. Dr. Andrés Díaz Lantada from the Mechanical Engineering Department and Head of the UPM’s Product Development Laboratory (PDL). Our involvement in WP6 and WP7, ‘End user applications’ and ‘Life cycle assessment’ respectively, allowed us to apply the studies performed within the WP2, regarding the use of efficient generation of support structures and computational modelling, to final designs of targeted sectors for the industry. The content of the WP2 is subdivide in 5 phases which are adequately scheduled to the rest of the consortium needs in order to provide useful data and documentation to the partners.
The bulk of the research was carried out at the PDL facilities within the Mechanical Engineering Department and complemented by an international stay of three months at the Technical University of Vienna under the supervision of the Ao. Prof. Dr. Jürgen Stampfl, Head of the Additive Manufacturing Technologies (AMT) Department and coordinator of the ToMax project. The continuous networking developed among the partners of the consortium allows the transfer of the gathered experience, as well as, the use of several technologies that are not present at UPM, which helped considerably to validate the improvements and methodology achieved during this Thesis.

Chapter 2 Introduction


Chapter 2 Introduction
19
INTRODUCTION
2.1 State of the art and trends in additive manufacturing for the industry
Additive Manufacturing (AM) is defined by the International Committee F42 on AM technologies as the ‘’process of joining materials to make objects from three-dimensional model data, layer by layer, as opposed to subtractive manufacturing methodologies.’’ This thesis is focused on the vat photopolymerization processes, ‘’in which a liquid photopolymer in a vat is selectively cured by light-activated polymerization’’ such as, stereolithography and lithography-based ceramic manufacturing (see Chapter 3) (ASTM, 2009). Along the research, we refer to the utilized technologies by the term AM. Although, it can be very open, the aim is to encompass all the steps that AM involves within a unique term: From the design stage to the final production of the part.
The direct creation of objects layer by layer using computer-aided design (CAD) has its beginning in the early 1980’s, when these techniques were introduced to the world as rapid prototyping (RP) technologies with the emergence of stereolithography (SLA)(Hull, 1986), helping designers and engineers to translate into a real object what they have in mind. This approach provided for of time and cost reductions (Wong & Hernandez, 2012) in product development.
Since then, the use of the name, as well as the techniques themselves, has been evolving through the emphasis of the different capabilities that the process present. For instance, the sometimes used solid freeform fabrication (SFF) term, regarding the capability of the process to fabricate complex geometric shapes that relates the independence of the form from the manufacturing (Gibson, Rosen, & Stucker, 2015). Additive fabrication term was popularized by Terry Wohlers, but many professionals of the industry prefer the term manufacturing, being additive manufacturing (AM), becoming widely used and spread. AM is largely used for production of short-term prototypes, starting from R&D at the academia and some industrial companies, but also for small-scale series production and tooling applications and it has become more and more popular in medical and dental applications, where the specific geometries from the patient are necessaries (Stampfl & Hatzenbichler, 2014). Nowadays, these technologies are also referred with other names such as 3D printing, additive layer manufacturing (ALM), direct digital manufacturing (DDM), and so forth, but they have the origin in RP (Gardan, 2016), although now focusing also on final parts. The result of the AM sector as is known nowadays must be understood as a result of developments in different sectors.
Beyond the direct or indirect use of AM to produce prototypes for conceptualization, such making tools, dies, molds, etc. Currently, the production of end-user applications, for volume production, is becoming a trend of AM metal technologies, increasing considerably the manufacture of parts in small or medium sets (Huang, Leu, Mazumder, & Donmez, 2015; Shafter, Clarke, & Mitchell,

20
2014). The industry efforts are focusing on the introduction of AM into their production lines, for promoting the efficiency of the process (Wohlers, 2017). In the report by Gartner (2017), the evolution through the hype curve of the 3D printing sector into the supply chain can be seen, passing the peak of the curve, although still far from the situation of other trends like the big data or digital manufacturing that are close to their plateau of activity.
Figure 2.1 shows the continuity of the AM different applications, comparing the evolution of their expectation from 2015 to 2017, positioning one of the branches of vat photopolymerization better industrialized, the stereolithography, at the moment through of disillusionment, but moving forward the application of AM of dental devices, which is mainly achieved by using such systems.
Figure 2.1. Hype curves of the main technological transformations in the 21th century for the AM field, 2015 (up) and 2017 (bottom) (Gartner, 2015, 2017).
Many manufacturers in the aerospace, defense and automotive sectors are using these techniques for equipment, positioning tools (Jackson, 2017) and ultimately parts that help the workers to make time efficient, reducing lead time during the production.

Chapter 2 Introduction
21
Moreover, small quantities of structural and functional components such as, car interior lightweight components, metallic structural parts for airplanes, engine exhausts, drive shafts, gear box components and braking systems for luxury, low-volume vehicles (Niaki & Nonino, 2017). Fashion, jewelry, robotics and toys are areas of interest, as well (Thompson et al., 2016). The capability of integrating mechanical functionalities into the designs, for instance conformal cooling channels, has promoted the fabrication of casting molds or cores (Figure 2.2) enhancing the production by injection molding with different materials (ceramics, plastics, polymers, etc.). Embedded objects, wiring conducts (Materialise NV, 2015), complex internal pathways for acoustic damping devices (Setaki et al., 2014) and optimized fluid channels are some examples of the functionalities that AM supports.
Figure 2.2. Casting core demonstrator for turbine blades by LCM, made in Alumina (Image credit: Lithoz GmbH).
Famous cases of success presented by the large industry leaders, has turn into the increase of the demand of AM systems, investing considerable amounts in AM facilities at the R&D headquarters worldwide, looking for fishing the key application that breaks the market and inflate the margins. For example, the most illustrative case of the General Electric Aviation that started producing with metal AM technologies the 19 fuel nozzles for its LEAP engines (Figure 2.3)(Kellner, 2014). GE has been able to realize a weight reduction of 25% relative to the existing nozzle.
Figure 2.3. Picture of the AM part which combines 20 components into a single unit and 25 percent lighter (Image credit: GE Aviation).

22
Companies even from the apparel and shoe sector has made their appearance in the media with novel challenges as the case of Adidas© partnering together with Materialise NV and Carbon3D for the Futurecraft® sneakers that present a groundbreaking sole by AM continuous liquid interface production (CLIP) technologies. Medical industries are often the most interested in AM because of the ease to translate 3D imaging data into solid parts.
Furthermore, the current situation of the AM sector is already wide and competitive. Plenty of companies have been lately whether started up or launched, taking advantage of the expiry of the existing patents, developing innovative ‘low-cost’ techniques and increasing significantly the volume of the market and the provided offer to both the industrial and the private consumers (Wohlers, 2017).
Since the vast reduction of the technology costs, the sector is providing solutions affordable for individuals for their personal use. Vendors find themselves in competition, although the variety of machines which exhibit different strengths and weakness creates differing markets (Gibson et al., 2015). This competitive market has direct effect on profit margins, nevertheless we will discuss it further in the following section. Low-cost AM has brought the technology into the public domain, getting that the possibilities that the technology provides have increased exponentially for the last years, giving a new portfolio of potential solutions and applications by using AM technologies.
Figure 2.4. Photo of the Adidas’Futurecraft sneakers with a lattice-based sole made by AM using the DLS technology (Image credit: Adidas).
Therefore, the diverse array that the systems present, available materials and manufacturers is quite complex and extensive to represent within a unique chart, attempting to encompass all the existing techniques. However, given the centralization of this Thesis into the vat photopolymerization AM processes, an overview of this sector is provided (Table 2.1), in order to give to the reader a context of the current market for both industrial and desktop machines (those below €5,000). The reader shall assume that due to the rapidity at which the sector is growing, this humble summary might not include some systems, either because they are already old fashion or brand new.

Chapter 2 Introduction
23
This branch of the AM technologies provides of solutions, starting from photosensitive polymeric material and building models highly accurate, with surface finishes comparable to injection-molding, although more expensive and with the disadvantages of a material becoming brittle with the pass of the time and a low heat distortion temperature. Vat photopolymerization systems based might differ from their 5 main subsystems: recoating system, platform system, vat system, laser and optics system and control system (Gibson et al., 2015). However, the main concept of the technology is common for:
� Vector scan or point-wise: stereolithography (SL), hot lithography (HL), micro-stereolithography (MSL), scan-spin and selectively photocuring (3SP).
� Mask projection: dynamic light scattering (DLS) or continuous digital light manufacturing (CDLM) and digital light processing (DLP), lithography-based ceramic manufacturing (LCM).
� Two photon polymerization (2PP).
Table 2.1. Overview of vat photopolymerization commercially available systems.
Technology Precision Material Manufacturer Machine
SL 30-200 µm Photocurable resins ((metha)acrylate and epoxide based) and
waxes
Formlabs Form 1
Form1+
Form 2
3D Systems iPro 9000 XL
ProJet HD series
ProJet 1200
ProX series
SLA 3500
SLA 5000
Viper Si2
DWS Systems Digitalwax
XFAB®
020X/D
029X/D
030X/D
Nyomo Minny
HL 10 µm Thermoplastic-like photopolymers
Cubicure Caligma 200
MSL 10-25 µm Photocurable resin Unirapid URM-HP301
2PP 200-400 nm Photocurable resin Nanoscribe Photonic prof GT
Tetra MBZ-2PP
3SPTM 50-100 µm Photocurable resin EnvisionTEC Vector
Xtreme
Ultra
LCM 40-100 µm Ceramics and photopolymer resins
Lithoz CeraFab7500
CDLM/DLS 40-80 µm Photocurable resin Carbon3D M1/M2
EnvisionTEC MicroPlus
VIDA
VIDA HD
24
DLP 30-100 µm Photocurable resin B9 Creations B9 core series
Sprintray MoonRay
EnvisionTEC P3/P4 series
ARIA
AUREUS plus APOLLO plus
MicroPlus DDSP series
Kudo3D Titan
Titan 2 HR
Wanhao Duplicator 7
The global market of AM technologies: Current state and prospects.
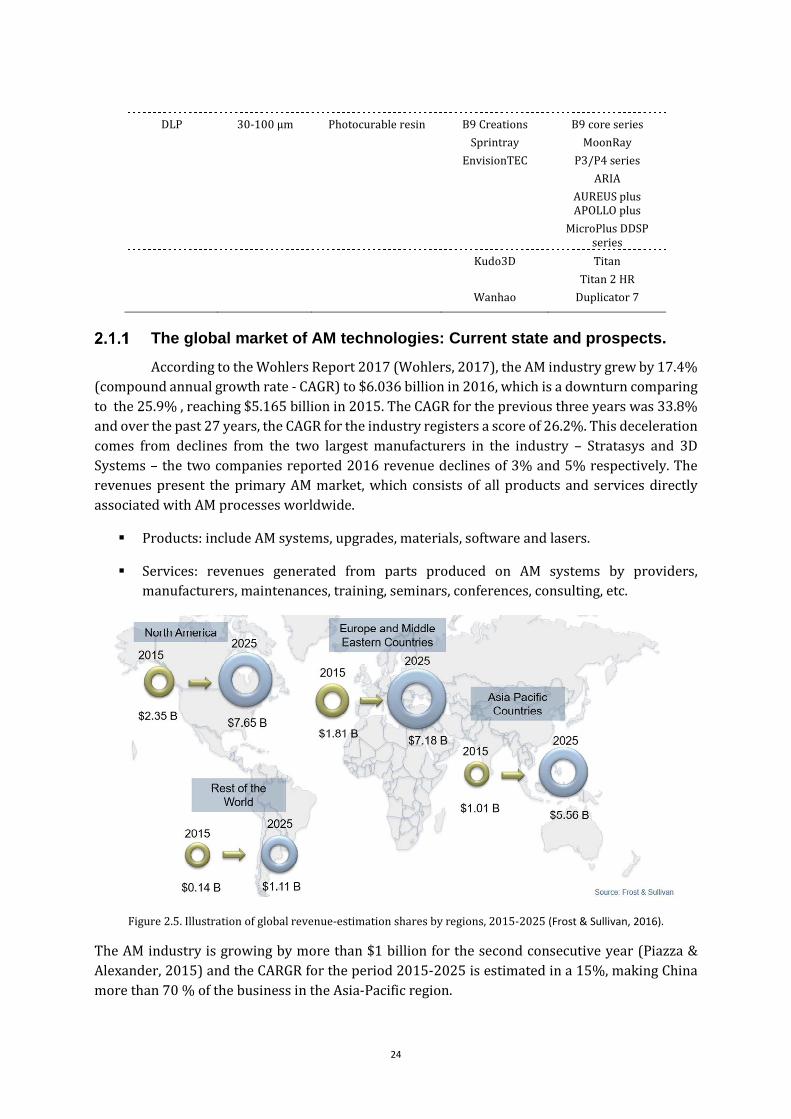
According to the Wohlers Report 2017 (Wohlers, 2017), the AM industry grew by 17.4% (compound annual growth rate - CAGR) to $6.036 billion in 2016, which is a downturn comparing to the 25.9% , reaching $5.165 billion in 2015. The CAGR for the previous three years was 33.8% and over the past 27 years, the CAGR for the industry registers a score of 26.2%. This deceleration comes from declines from the two largest manufacturers in the industry – Stratasys and 3D Systems – the two companies reported 2016 revenue declines of 3% and 5% respectively. The revenues present the primary AM market, which consists of all products and services directly associated with AM processes worldwide.
� Products: include AM systems, upgrades, materials, software and lasers.
� Services: revenues generated from parts produced on AM systems by providers, manufacturers, maintenances, training, seminars, conferences, consulting, etc.
Figure 2.5. Illustration of global revenue-estimation shares by regions, 2015-2025 (Frost & Sullivan, 2016).
The AM industry is growing by more than $1 billion for the second consecutive year (Piazza & Alexander, 2015) and the CARGR for the period 2015-2025 is estimated in a 15%, making China more than 70 % of the business in the Asia-Pacific region.

Chapter 2 Introduction
25
The value of the market is worth $3,471.9 million by 2017 (M&Markets, 2017). In Figure 2.5, the revenues from 2015 and the estimated for 2025 are represented for the world market. The division for the sector shows a faster growth of the direct part production and services, while the systems’ share grows in an organic way (Figure 2.6). The increasing trend towards a cost-effective production reducing lead times to market, is making this tendency to appear more significant.
According to the growth percentages of industrial AM systems sold the past years (2013 - 2016), which averaged 14.6% and reaching the 13,058 industrial systems sold, it can be noted that there is a noticeable trend of the industry to promote the transition in favor of AM for the production of highly customizable products.
Figure 2.6. Primary AM global market revenues divided into markets: services, production, materials and systems (US$ in Millions) (Shafter et al., 2014).
Regarding the AM technology types, in 2016 the most used technique was the SLS, although in 2017 the situation has changed and FDM takes the first place, closely followed by SLA (SL by standard terminology) which has a large growth the last year. Nevertheless, Figure 2.7 shows the percentage of use for the types of AM, which is not proportionally related to the market share. In order to have an overview of how important the vat photopolymerization market is, within the global AM market, an estimation based on the data obtained from the Wohlers in terms of systems installed and Sculpteo’s report on material share market is provided (Sculpteo, 2017).
Figure 2.7. Use of the different existing AM technologies in 2016 and 2017 (adapted from Sculpteo, 2017).
- 5 10 15 20 25 30 35 40
FDMSLSSLA
PolyjetDLP
DMLSSDL
Binder JettingElectron beam melting
Laminated object manufacturingSelective laser melting
CLIPFusion jet
Percent of use for each technology
2017 2016

26
The market shares for the different materials provided using AM systems differs depending on from where the data is collected, as it is shown in the following tables:
Table 2.2. AM share market by materials for all users 2015 (Sculpteo, 2017)
Plastics Resins Metals Multicolor sandstone Ceramics Wax Other
88% 35% 28% 15% 9% 11% 4%
Table 2.3. The $768.5 million AM materials market segmented by material type (Wohlers, 2017)
Photopolymers LS polymer powders Filaments Metals Others
39% 25% 20.4% 14% 1.6%
Although difficult to provide the right estimation, the $352.2 spent on photopolymers for vat photopolymerization systems reached last 2016 denotates the importance of this technology within the industrial sector. The market shares for the main equipment installed in the industry, according the survey provided by Wohler in which they ask to 100 companies from 26 countries is shown in Figure 2.8.a and the 2016 market share of unit sales for industrial AM systems, positioning the vat photopolymerization companies such as, 3D systems and EnvisionTEC with the largest pieces of the market.
Figure 2.8. Charts a) representing the installed equipment for the survey respondents’ operations in 2016 and b) the 2016-unit sales market share among manufactures of industrial AM systems (Wohlers, 2017).
According to the previous figures and given the estimation in which the SL systems are the most significant in the vat photopolymerization branch of the AM market, the fact that the major agent is 3D systems with a 11.4 % of the market for their SL systems and the ‘’Other’’ category includes machines from other vat photopolymerization systems such as, Lithoz or Envisiontec (see Table 2.1), we can conclude that estimated market share for the vat photopolymerization technologies (services, material, systems and parts) is about a 30 %. Although the metal AM derives a much larger proportion of its revenue from the systems, about a 50 % (Shafter et al., 2014).
When talking about the distribution of final part production into the industry of the AM (estimations for the 2025), these are quite promising for the AM sector, prompting an interesting increase of this processes into important sectors such as automotive and aerospace and including an important emerging sector, the consumer electronics with a 28 % estimated for the revenues generated for the AM market (Table 2.4).
35,56%
12,59%9,39%
2,90%2,70%
3,10%2,50%
3,80%
27,47%
Stratasys
3D Systems
Envisiontec
DWS
UnionTech
EOS
Carima
Mcor
Others
a) b)
Chapter 2 Introduction
27
Table 2.4. Estimation of the revenue generation by AM in the main industry sectors in 2025 (Frost & Sullivan,
2016)
Consumer electronics
Automotive Medical and dental
Aerospace Industrial goods
Architecture Other
28 % 20 % 16 % 15 % 12 % 4 % 5 %
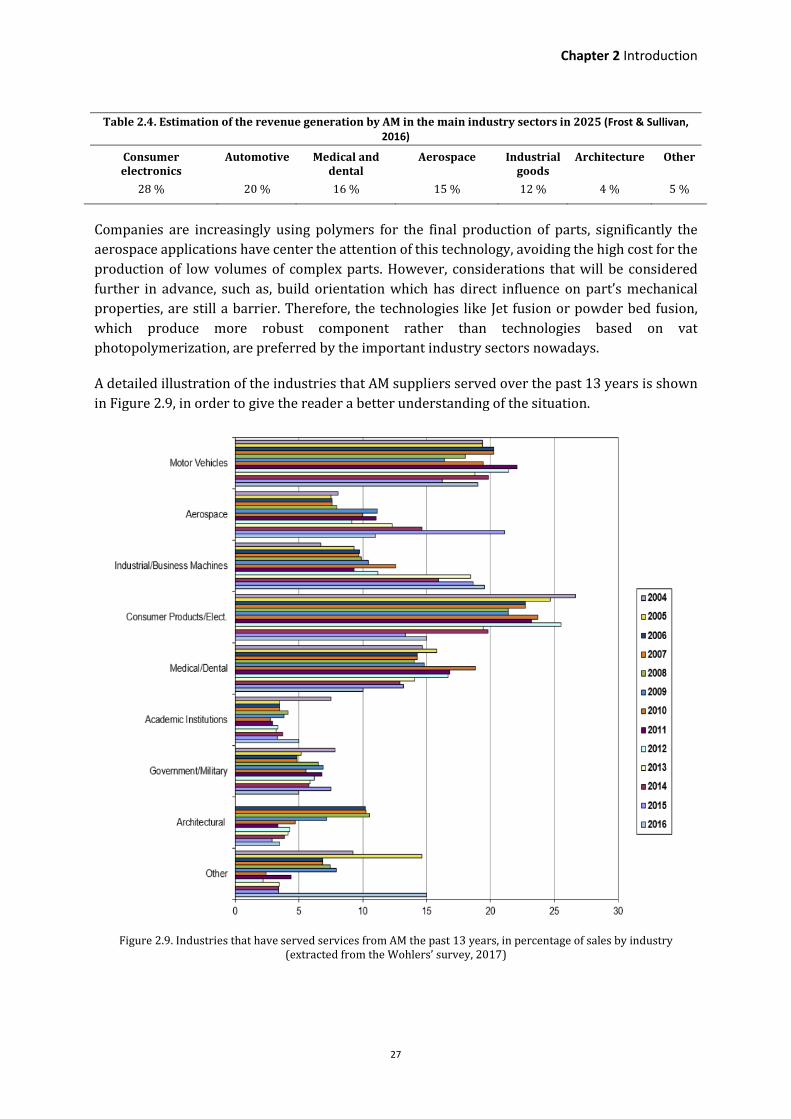
Companies are increasingly using polymers for the final production of parts, significantly the aerospace applications have center the attention of this technology, avoiding the high cost for the production of low volumes of complex parts. However, considerations that will be considered further in advance, such as, build orientation which has direct influence on part’s mechanical properties, are still a barrier. Therefore, the technologies like Jet fusion or powder bed fusion, which produce more robust component rather than technologies based on vat photopolymerization, are preferred by the important industry sectors nowadays.
A detailed illustration of the industries that AM suppliers served over the past 13 years is shown in Figure 2.9, in order to give the reader a better understanding of the situation.
Figure 2.9. Industries that have served services from AM the past 13 years, in percentage of sales by industry (extracted from the Wohlers’ survey, 2017)
28
The development of additive manufacturing technologies in the industry: Benefits and limitations.
From the disruptive perspective of the technology, AM provides an unprecedented control of the geometry, material, and functionalities of a manufactured product that other methods had not provided until the moment. However, the most highlighted skill of AM is the capability of obtaining, in a direct process, such complex designs that are not feasible by conventional methods. This advantage has become so relevant that is even changing the way that new products are conceived.
AM processes have the potential to dominate the market of those products that are not fabricated in an effective manner using conventional techniques, leading to a revolution of an eco-efficient mass production in the field of customized products (Quinlan, Hasan, Jaddou, & Hart, 2017). AM has allowed to the health sector to be benefited of advanced solutions that provide physical models starting from scans of the patient. Thus, orthopedics, prostheses, implants, tissue engineering solutions or drug-screening models are just some examples of the consumer goods that have been made thanks to AM. Since the beginning, the dental sector was the most interested on AM, investing on SL systems for providing solutions for surgical procedure, such as drill guides, implants, covers and developing novel methods of orthodontics.
The rising of functionally graded materials with different material properties, not only by the ability to build components with different feeding units but also with different macro and micro structures (e.g. the lattice structures), has lead both to the obtaining of multifunctional products and to boost the performance of conventional ones. This merging of abilities and properties makes possible the integration of part’s components, successfully achieving the downsizing of complex engineering systems (see examples of part integration in Chapter 6).
From the point of view of research and educational purposes, AM is taking a significant role in engineering education, helping to the students to accomplish a further step in the product development and to understand the difficulties occurred during the design step. As it happens in the case of the Technical School of Industrial Engineers (ETSII) from the UPM, where the students can develop their product’s prototypes at the lectures called INGENIA, thanks to the employment of techniques such as, SL or FDM (Lumbreras et al., 2016).
AM holds a vast potential for promoting science, technology, engineering and mathematics education since it can embrace a broad population (Huang et al., 2015). The availability of low-cost 3D printing is creating opportunities worldwide, as the EU project UBORA attempts to promote in Africa (Ahluwalia et al., 2017) with the manufacturing of useful medical goods in an easy and tangible manner.
Chapter 2 Introduction
29
Regarding the sustainability of the manufacturing process, the efficiency of the conversion from raw material into goods is a key determinant of the environmental impact associated with AM. Thus, the advantages can be classified in (Gutowski et al., 2009):
� Product redesign.
� Material input processing.
� Component and product manufacturing.
� Product use.
� Repair and remanufacturing.
� Recycling.
On the one hand, AM enables the design of complex and optimized parts by means of its freedom in shape and geometries, simplifying assembling and helping to lightweight. Thus, there is an inherent economic and environmental impact on the design itself, due to the way of manufacturing and the product life performance, leading to for instance lower energy consumption. But also on the other hand, material and energy efficiency can be improved through energy consumption during processing (Ford & Despeisse, 2016): material recycling, impacts on logistics simplifying the supply chain by a decentralized systems with lower transportation impacts (Holmström & Gutowski, 2017), maintenance, reduced assembly, improved resource
efficiency of raw material, etc. More information can be found about this research in the special issue -Environmental Dimensions of Additive Manufacturing and 3D Printing- (Reid, 2017), published in the Journal of Industrial Ecology, together with the team’s paper (Diaz Lantada, De Blas Romero, Sánchez Isasi, & Garrido Bellido, 2017).
In terms of the social impact the most detailed study (Huang, Liu, Mokasdar, & Liang, 2012) indicates some health benefits when its compared to conventional manufacturing methods such as, the long-term exposure to hazardous environments, healthcare products customized to the needs of individual consumers improving population’s wellbeing. AM technology can also be used to produce custom-fit safety equipment using light- weight materials, tissue engineering and drug delivery devices, etc.
Nevertheless, in spite of the unquestionable benefits of the AM technologies, still numerous limitations or challenges exist such as, the higher percentages of recycled materials (i.e. EKOCYCLE Cube desktop printer with a 25 % of recycled PET), lack of standardization for material and processes to facilitate repeatability, services are segmented, intellectual properties protection and recognizing, high capital and material cost, exposure to potential hazards for polymeric AM systems (laser and materials in case of desktop printers) (Bours, Adzima, Gladwin, Cabral, & Mau, 2017), etc. The clear disadvantage facing the conventional techniques is represented by the fact that still AM technologies cannot compete in terms of mass production cost and times.
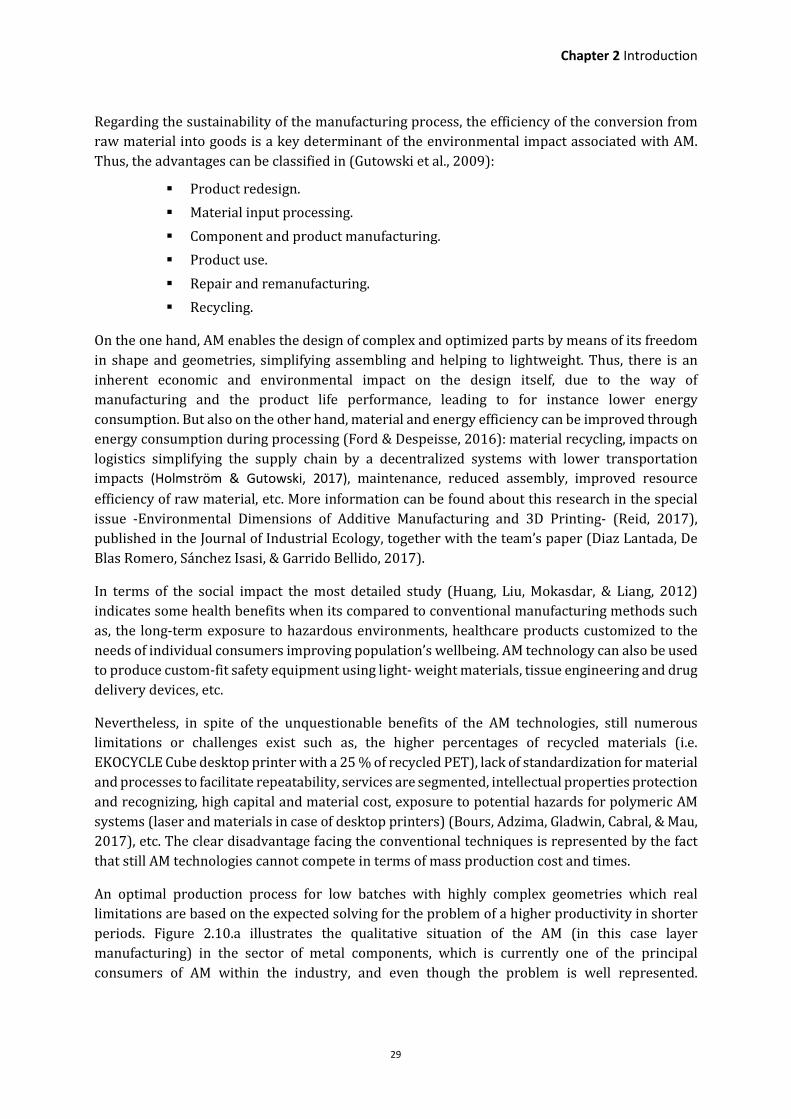
An optimal production process for low batches with highly complex geometries which real limitations are based on the expected solving for the problem of a higher productivity in shorter periods. Figure 2.10.a illustrates the qualitative situation of the AM (in this case layer manufacturing) in the sector of metal components, which is currently one of the principal consumers of AM within the industry, and even though the problem is well represented.
30
Moreover, AM processes according to the study under the ATKINS project, the energy consumption still exceeds from techniques of metal fabrication such casting (see Table 2.5).
Table 2.5. Comparison of energy use and material consumption of different manufacturing techniques (Huang et al., 2012).
Energy use (kg CO2 per component)
Landfill waste (kg) Virgin material use (kg per component)
Casting 1.9 N/A 2
Flexline machining 2.4 1.512 (recyclable) 2 (from casting)
Clean machining N/A N/A N/A
AM 13.15 0 0.65
This issue is a matter of concern for most of the AM suppliers which attempt to irrupt the sector like the injection molding (see Figure 2.10.b), and plenty of them are focus on increasing the building envelopes, either increasing number of units manufactured per job or obtaining larger parts, as the case of the project Infinite-Build 3D from Stratasys Ltd. as part of its SHAPING WHAT’S NEXT™ vision for manufacturing. Although, it is still in a demonstrator stage (Abuelsamid, 2017; Vurpillat, 2016), it has enrolled Ford Motor Company for thinking laterally. Besides the size limitations, the surface finish is another milestone for AM processes that often cannot produce large parts of relatively high quality, in contrast to conventional ones (Fera et al., 2016).
Figure 2.10.Comparison of AM processes to conventional: a) Cost versus complexity for parts with identical bounding box; b) cost versus quantity for an exemplary polymer component, comparing injection molding (IM), fused filament
fabrication (FFF), and selective laser sintering (SLS) (extracted and adapted from (Quinlan et al., 2017).
However, in spite of the significance of the mentioned challenges, the most influential factor to address is the lack of training or education for a design oriented for additive manufacturing which can boost the benefits of these technologies. Moreover, there is a need for novel design tools that better represent AM possibilities and material interactions. Traditional CAD software resources shall be reinvented, allowing designers to explore new routes of design space, and for that purpose is necessary to train them in order to overcome with new spontaneous ideas, free of conventionalisms that engineers and designers already have because of a deep traditional training and constrains. The following section will discuss further in detail about this issue, the design for additive manufacturing (DfAM), trying to give an overview of the situation and the arising needs.
a) b)

Chapter 2 Introduction
31
To conclude the Table 2.6 gives an overview of the commented points during the section which have been evaluated in further literature review, observing an agreement among several authors (Huang et al., 2012; Ford & Despeisse, 2016; Quinlan et al., 2017)
Table 2.6. Summary of commented advantages and challenges for the AM sector
Advantages Challenges
Fabrication of novel, complex structures: lattices, internal geometries, etc.
Changing the designer’s conception of product design
Direct manufacturing of 3D CAD models To expand the utilization of AM for direct component and product manufacture
Easy customization of products Production of larger parts and profitable process for mass production
Economical solution for prototypes and small batches Support structures cannot be recycled
Material savings in terms of recyclability, waste material.
Intellectual property issues
Light-weighted parts and optimization for downsizing Continuous entrance of competitors
Functionalization of products To educated traditional manufacturers to understand the potential uses of AM
Integration of components in design Lack of standardization and certification of materials and processes
Energy efficient production systems Reliability and repeatability issues.
Improved durability of products Most of the services offered are lower-end consumer 3D printers
Simplified supply chain
Inventory reduction and part consolidation
Limited integration to other manufacturing techniques
Lower transportation related expenses Potential hazards for materials
Sustainability and environmental impacts High rate investment for the metal AM systems
2.2 The design process towards additive manufactured products with enhanced functionalities.
``Design for manufacture and assembly (DfMA) has typically meant that designers should tailor their designs to eliminate manufacturing difficulties and minimize manufacturing, assembly and logistic cost’’(Gibson et al., 2015). The emergence of AM processes overtakes the knowledge of design, that has been put into practice for conventional manufacturing methods. It is for that reason that a new way of design is being emerging lately, the Design for Additive Manufacturing (DfAM)(Gebisa & Lemu, 2017; Rosen, 2007.a; Rosen, 2007.b). The DfAM term involves a series of knowledge, tools, rules, processes, guides and methodologies cited (Feenstra et al., 2014), which drive to the subsequent potential of fabricating by using AM technologies. The insufficient understanding and application of DfAM is probably the reason why the penetration of AMT into the industry is being held up for the production of end-use parts (Adam & Zimmer, 2014; Thompson et al., 2016). A product development and manufacturing company may spend 5-10 % on the design and prototyping for a given product development program and the remaining is spent on production (Wohlers, 2017). Here, it resides the importance and novelty presented in this Thesis.
32
To understand DfAM, it is necessary to present the core concepts and objectives that designers have in mind, following summarized (Gibson et al., 2015):
� AM enables the usage of complex geometries and provides of a freedom inherent to the design.
� The integration of components to consolidate parts, avoiding assembly issues.
� Enabling the customization and functionalization of consolidated products.
� Combination of materials within a unique geometry.
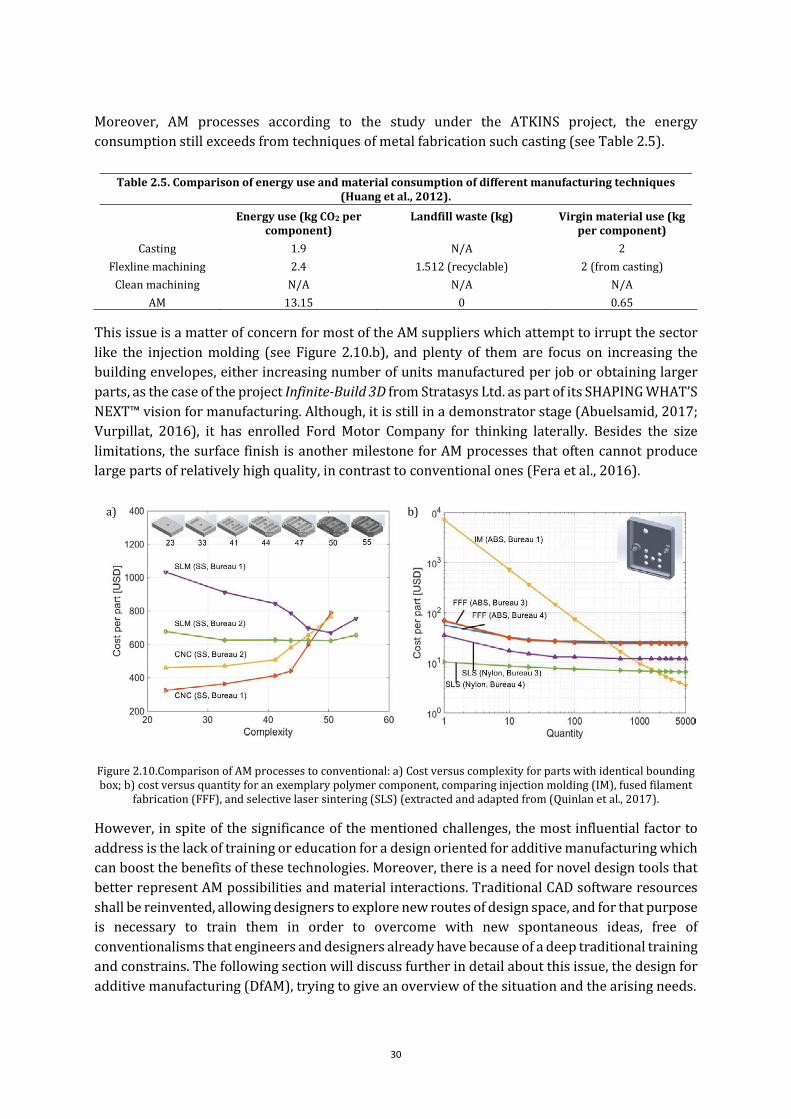
The current design workflow for AM products is well defined within the framework of the AM process (in Figure 2.11 colored in grey). It can usually begin from three sources: A product idea starting from scratch, from a 2D image or a set of them, or a 3D object by applying reverse engineering (commonly a 3D scan). In this Thesis, we want to focus on the first approach, starting an idea from zero (in Figure 2.11 in green), which presents the larger benefits of creating a new product oriented to its additive manufacturing. Therefore, DfAM requires different process-design rules, than usually considered (Hague, Campbell, & Dickens, 2003). It involves the designing and optimizing a product together with its production system to reduce lead time and cost, increasing the efficiency, quality and performance. This way of design implies a certain level of abstraction, that helps to overtake the limits that education has imposed to engineers and designers.
Figure 2.11. Digital and physical workflow of a product obtained by using AM processes. (adapted from (Thompson et al., 2016).

Chapter 2 Introduction
33
However, to reach this new approach is not easy for trained minds and the time that designer spend along the design process. A survey conducted by Fictiv (Fictiv, 2017) to designers and engineers has shed light on what they dedicate most time during the design of a new product: 5 % choosing the appropriate software tool, 20 % thinking a solution and 75 % modelling the 3D CAD object. It is here where the DfAM shall enter for changing the conception of this.
The specific design of a product oriented to its additive manufacturing must invest the maximum of the human resources into the `thinking’ step. Given the nature of AM and the lower constrains and freedom in design that it presents, designers and engineers should focus their forces in achieving that the product development (at the design stage) encompass the benefits which DfAM provides (see previous section 2.1.2). Is for that reason that the current design strategies for the process of AM are lately being well established (Klahn, Leutenecker, & Meboldt, 2015):
� Manufacturing driven design strategy: AM is used only as the media to obtain a product which could be processed by another conventional technique, but in this case, it is intended to benefit from AM advantages for lead time or cost. In this event, the design is similar to a conventional approach.
� Function driven design strategy: It exploits the benefits of AM enhancing the functionalization of a determined product which can already exists or not. These designs can result on complex geometries or internal features impossible to fabricate conventionally.
� Simulation driven design strategy: The design process is based on the results obtained from simulations of current products, which are looking for an optimization of performance, part weight, cost effectiveness, etc.
Figure 2.12. Three main design strategies for DfAM used for designer when starting a new idea (De Blas Romero, 2017).
Thanks to the absence of constrains in terms of complexity for the parts obtained by AM, several groundbreaking approaches and concepts are being applied into DfAM, for the cases of function and simulation driven strategies further presented in the following scheme (Figure 2.13). Creating intriguing, unique, appealing geometries that can provide a variety of aesthetic, functional, economic, emotional and ergonomic benefits.
At the same time, DfAM allows designers to vary and combine materials, create new structures at material level, creating new material properties in terms of mechanical, fluid, and thermal functionalities and in short adding a value to the design itself (Abdul Kudus, Campbell, & Bibb, 2016; Campbell, Jee, & Kim, 2013).

34
The variation through the wide set of processing parameters makes the use of traditional design of experiment approaches both expensive and time consuming. Despite, the use of process modelling and subsequent data science based analyses offer a significant opportunity for the acceleration of process development and microstructural estimating in AM (Rodgers, Madison, & Tikare, 2017). Thus, helping to overcome the obstacles for the commercial or industrial implementation: Repeatability, reproducibility, quality and process speed. However, the current process modeling is nowadays focus on powder based technologies (Popova et al., 2017) and many resources commercially available such as 3DSim®, SimufactTM or even the AM module from ANSYS® ,only provide solutions for SLS, SLM technologies in which the thermal distortion is an important factor to evaluate.
Nevertheless, the process modelling impact in vat photopolymerization systems is not sufficiently studied, although the direct impact on part quality is identical than in metal AM or sintering processes. It is for that reason that this Thesis will shed light on an important stage of the design workflow for the vat photopolymerization processes (see Chapter 5).
The benefits of DfAM allows new part to incorporate features such as light-weight design and avoiding manufacturing steps thanks to the integration of components obtaining highly complex geometries far from those available with conventional fabrication methods. Typically, these opportunities are classified within the group of the macroscale level and examples of them can be found at the Chapter 6, Section 6.3.
On the other hand, DfAM allows designers to modify and combine materials, micro and meso-structures to create new properties, forms, etc. AM processes with micro or even nano-resolution can provide to DfAM incorporate functionally graded properties, controlled porosity, improve fixation and osseointegration of biomedical implants or prosthetics. These opportunities are referred to the microscale level and can be subdivided in other two categories, those which refer to structural characteristics or to a surface functionalization. Examples of this, can be found at the Chapters 4, as basis for application examples at the Chapter 5 and 6.
Furthermore, to strengthen the benefits that DfAM can offer to a final product, it is mandatory that the designer knows and understand by heart the vat photopolymerization key considerations: The generation of supports for those vat photopolymerization systems that need and a deeply understanding of how the AM system, which is used, performs. Evaluating the critical stages that the manufactured part goes through (Table 2.7).

Chapter 2 Introduction
35
Figure 2.13. Scheme of the benefits that AM offer classifying them in both part and microscale levels.
Table 2.7. Key considerations for the designer previous to start applying DfAM for a novel product using vat photopolymerization systems
Smart generation of supports Understanding of the AM-system’s process � Eco-efficient fabrication. � Adequate surface finish. � Minimum contact. � Holding part. � Enable desired part orientation. � First layer attachment. � Make it easy to remove. � Recycling. � Solving structures. � Simplicity.
� Separation forces. � Re-coating (peeling). � Shrinkage. � Bottom-Up or vice versa. � Hanging/Holding stress on supports. � Maximum cantilever. � Building angles. � Curing thickness. � Laser strategies. � Part placing.
Mechanical properties
Customization
Performance
AM Freedom in design
Macroscale Microscale
Topology optimization
Integration Geometrical complexity
Internal freeform
Structural Surf. Functionalization
Functionally graded materials
Cantilevers Meta-materials Lattice
Contact interaction
Aesthetics Controlled porosity
Cellular interaction
Lightweighting
36
Apart from the presented workflow for designing an AM part, there are three aspects that come to mind before, during and after producing the product: The reliability, the software utilized and standardization. Regarding the reliability, it comprehends the repeatability, the metrology and quality control (Mellor, Hao, & Zhang, 2014; Rüsenberg, Josupeit, & Schmid, 2014) or the light engine source control. One of the current industry’s concerns is focus on the possibility to obtain a manufacturing process able to produce with a high level of replicability, thus they must take early stage decisions for enabling a correct quality control of the part and considering the complexity that this sort of designs include, it sometimes can derive to a problem. Inner channels, lattice structures or enclosed surfaces are main challenges to research in a future (Tarbutton & Villarraga-Gómez, 2015).
The selection of the suitable software for each step of the design process plays an important role as well. Due to the lack of connectivity among software resources, usually the conversion to standard file extensions such as: STEP, IGES or STL; is the most recurrent solution for the designers. Since every software may be specialized on a specific operation needed for the design (e.g. creation of lattice structures in defined region, generation of surface textures, topology optimization, generative design with NURBS®, etc.), it usually takes more than 4 or 5 time exporting and converting files to another extension, in order to sequentially include the modifications and optimizations to the digital model. Therefore, the decisions made at the first stage, selecting the software resources involved must not be taken carelessly, but investing a fair amount of time which will help later on for achieving adequate lead times. Thanks to the emergence of this sector in terms of AM systems sales each year, materials and final parts, also the branch which provides to the industry with the tools for designing is exponentially growing as well.
That growth has allowed to big forces (e.g. Materialise® or Autodesk®) to invest in new tools that facilitate the creation of new concepts for new manufacturing processes, with new algorithms that are close to AI (artificial intelligence), in order to boost and reduce designing times and in a trend, that remembers to the bionic design, trying to mimic the nature and the ergonomics from it. In the Chapter 3, the resources employed during the development of this Thesis are shown, classifying them on groups by its main functionalities and characteristics: modelling, optimization, design and distinguishing them from commercial software usually employed in conventional manufacturing and those that are leading now the market in the AM field. Some existing current attempts of research in that areas, have been reached by Andres Diaz Lantada (biomedical devices(Diaz Lantada, 2013)) Richard Bibb (AM design of medical applications), David Rosen (Process modelling (Zhao & Rosen, 2017)) and Carolynn Conner Seepersad (Multiscale materials). This Thesis’ aim is to collect and extend that knowledge into a unique methodology useful for a determined manufacturing process (vat photopolymerization).
Finally, the significance of standardization in design for additive manufacturing is presented on the following Section 2.4, as a part of the already existing ISO/ASTM standards that are present within the whole value chain of the sector.

Chapter 2 Introduction
37
2.3 Standardization in additive manufacturing field: current situation and challenges
After presenting the global market and leaving clear the accelerated growth of this sector, now is necessary to introduce the terms that will make that this raise does not stop and that it make it in an organic way, standardization (Monzón et al., 2015). That means, for the existing disarray, in which the leaders for each over-competitive category of AM (systems, materials, software and producers) are ``imposing’’ their own rules in terms of data formats, test methods, processes and control; there is a need to promote the standardization. Given the ease that the technology evolves, creating new companies which at the same time give birth to new methods, software, parts, etc. this chaotic increase can lead to a future deceleration of the sector due to an overdemand. It is for that reason that the first step to achieve a fruitful development is to grow in the same direction, pushing all the stakeholders at the same time.
Several institutions have already realized of that term, and their efforts and focus on promoting that both public and private organizations go on the same track. This is the case of the European Technology Platform in AM (AM Platform), which helps to contribute to a coherent strategy, understanding, development, dissemination, and exploitation of AM, among others, with the creation of new standards for AM.
The roadmap presented for the standardization of AM encompass the general concepts of AM and then it goes deeper for each specific aspect (Figure 2.14). This roadmap is elaborated by the SASAM project (2015) and shows the cooperation between ISO TC261, CEN&TC 438 and ASTM F42. It shows a defined structure with several levels and a hierarchy of AM standards, based on three levels: general, category and specialized. The main intention for this structure is to achieve modularized standards and to reduce the risk of overlapping and duplication of efforts and possible risk of contradiction between standards.
Current standards that are applied to conventional manufacturing processes or materials are not always appropriate for AM technologies, since particular material properties and operational parameters might differ, having a great influence on the final quality and properties of the part (Monzón et al., 2015).
In case that the reader might be interested in the situation of the approved standards by ISO, ASTM, AFNOR, AENOR, etc. we refer to the document from Monzón et al. as a clear document where those are properly referenced.

38
Figure 2.14. The structure for AM standard development (Feenstra et al., 2014).
The requirements of the customer are the main driver for implementing standards and the basis for the upcoming. As a result, the reliability of machines and processes is then expected to increase. In order to ensure high quality products in the most critical sectors (automotive, aerospace and medical), it would require of careful process control, only achievable if either raw materials and procedures are standardized (Huang et al., 2012). Following the Table 2.8 shows, as a summary, the existing deficiencies in the process and the priority that experts assign to them (NIST workshop, December 2012).
Table 2.8. Challenges and rate of priority for the aspects that involves AM standardization (adapted from: Monzón et al., 2015).
Materials Medium priority � Lack of microstructure standards to enable evaluative criteria/judgments. � Limited certified measurement methods/specifications for powder chemistry and size distribution.
Process and equipment High priority � Lack of metrics and standards for measuring and characterizing AM processes and artifacts � Lack of standards for machine-to-machine consistency, measurement test pieces, sensors.
AM modeling and simulation High priority � Lack of standards to support consistent data inputs to modeling and simulation, such as dimensional
accuracy, process capabilities, distortion and surface finish modeling to optimize build orientation, criteria for convergence time, accuracy. calibration, comparison of machine performance, etc.
� Lack of validation and verification metrics for models and simulation tools.
Qualification and certification High priority � Non-standard guidelines for qualification and certification

Chapter 2 Introduction
39
In addition, ISO/TC261 and ASTM F42 have agreed a list of high priority items to pursue: a) Terminology (ASTM F2792); b) standard test artefacts; c) requirements for purchased AM parts and d) the design guidelines. Regarding the last one, which is directly related to the topic of this Thesis, some approached have been already done. The lately published document ISO/ASTM 52910:2017(E) is a standard guideline for DfAM, in fact. From this document, it can be extracted not only an overview of the proposed strategy to follow to successfully achieve a design for AM, but also how to decide whether use of an AM technology or on the contrary to opt for conventional design and manufacturing processes. This aspect, perhaps, is one of the most interesting point that an engineer or designer must aboard, before starting the laborious work. AM has come to empower and it is important not to make the mistake of forcing the use of this technology only because is the trend of the industry. As AM experts, we must know where the process is convenient for a determined purpose. Moreover ISO/ASTM 52910:2017(E) guides in the suitable AM process selection for the project, shows the opportunities in design (as shown in Section 2.2) and provides with considerations and definitions for material properties, part geometry terms and concepts related to the mesh generation for the printing files (STL or AMF). However, it is still missed some design guidelines referring to real design aspects such as ``advices when designing’’ (part orientation, infill density, supports, etc..). Also in reference to this category we can mention the ISO/NP TR 52912 ``Design of functionally graded additive manufactured parts’’, but again it is missed bullets that can serve as real tips, instead of definitions.
One of the major disadvantages for designers is the lack of standardization for the data formats. Although ASTM F2915-12 calls for AMF file extension to play the role of unique file format, the strength that STL has in the sector is far from being eliminated from the game board. The interest of the major players of the sector to continue using this type of extensions delimit the development of AM at the design stage, since most of the barriers we can find at this level are facts that ``day-to-day’’, designers have to face (file export and import through different software). Given the evolution, the introduction of complex geometries, surface textures lattices and so on. All this is making the files heavier, obtaining files with even more than 6 million-triangles file weights of GB, meaning among other the following issues:
� Design processing (editing, formatting, repairing, modeling, etc.).
� File transferring between provider and client or even within the same cloud, thinking in a digital manufacturing organization, for instance.
� In some cases, the AM systems’ software cannot even process that large files and it can lead to printing errors, lack of geometry information, etc.
� Increasing lead time and slowing down the iteration process in design which allows to optimize the final product.
For all that, to conclude the first challenge of this standardization process is to stablish the real needs of the industry avoiding those standards which are not required, increasing the costs. Secondly, the coordination between committees for AM should be formed by experts that allow connectivity, not only within the sector of AM, but also with other committees, in order to avoid the overlap of activities focused on materials and industrial sectors. Last but not least, a further effort on design and data formats would be fruitful in order to make AM production more efficient and allowing great ideas to become drivers of application and change.
40
2.4 References in this chapter
A
ASTM, 2009, ASTM International Committee F42 on Additive Manufacturing Technologies, ASTM F2792-10 Standard
Terminology for Additive Manufacturing Technologies, ASTM, West Conshohocken, PA.
Abdul Kudus, S. I., Campbell, R. I., & Bibb, R. (2016). Customer Perceived Value for Self-designed Personalised Products
Made Using Additive Manufacturing (Vol. 7).
Abuelsamid, S. (2017). Ford Starts Pilot Testing Stratasys Infinite Build 3D Printer. Retrieved December 11, 2017, from
https://www.forbes.com/sites/samabuelsamid/2017/03/06/ford-starts-pilot-testing-stratasys-infinite-
build-3d-printer/
Adam, G. A. O., & Zimmer, D. (2014). Design for Additive Manufacturing—Element transitions and aggregated
structures. CIRP Journal of Manufacturing Science and Technology, 7(1), 20–28.
https://doi.org/10.1016/j.cirpj.2013.10.001
Ahluwalia, A., De Maria, C., Diaz Lantada, A., Mridha, M., Ngaju Makobore, P., Madete, J., … Leibovits, A. (2017). THE
UBORA PROJECT: Euro-African Open Biomedical Engineering e-Platform for Innovation through Education.
B
De Blas Romero, A. (2017). Design for Additive Manufacturing (DfAM): General view, trends and discussion. AM Ceramics,
Vienna.
Bours, J., Adzima, B., Gladwin, S., Cabral, J., & Mau, S. (2017). Addressing Hazardous Implications of Additive
Manufacturing: Complementing Life Cycle Assessment with a Framework for Evaluating Direct Human Health
and Environmental Impacts. Journal of Industrial Ecology, 21(S1), S25–S36.
https://doi.org/10.1111/jiec.12587
C
Campbell, R. I., Jee, H., & Kim, Y. (2013). Adding product value through additive manufacturing (Vol. 4).
D
Diaz Lantada, A. (2013). Handbook of Advanced Design and Manufacturing Technologies for Biodevices.
https://doi.org/10.1007/978-1-4614-6789-2
Diaz Lantada, A., De Blas Romero, A., Sánchez Isasi, Á., & Garrido Bellido, D. (2017). Design and Performance Assessment
of Innovative Eco-Efficient Support Structures for Additive Manufacturing by Photopolymerization: Eco-Efficient
Supports for Additive Manufacturing.
F
Feenstra, F., Boivie, K., Verquin, B., Spierings, A., Buining, H., & Schaefer, M. (2014). Road map for additive manufacturing
(SASAM project FP7– NMP–2012-CSA-6-319167). Retrieved from Dec 2017
Fera, M., Fruggiero, F., Lambiase, A., & Macchiaroli, R. (2016). State of the art of additive manufacturing: Review for
tolerances, mechanical resistance and production costs. Cogent Engineering, 3(1), 1261503.
https://doi.org/10.1080/23311916.2016.1261503
Fictiv. (2017). 2017 State of Hardware Report. Retrieved December 15, 2017, from https://www.fictiv.com/blog/2017-
state-of-hardware-
report?utm_source=social&utm_medium=facebook&utm_content=soh17&utm_campaign=lp

Chapter 2 Introduction
41
Ford, S., & Despeisse, M. (2016). Additive manufacturing and sustainability: an exploratory study of the advantages and
challenges. Journal of Cleaner Production, 137, 1573–1587. https://doi.org/10.1016/j.jclepro.2016.04.150
Frost & Sullivan. (2016). Global Additive Manufacturing Market, Forecast to 2025 - Buscar con Google. Retrieved
December 11, 2017, from:
https://www.google.es/search?q=Global+Additive+Manufacturing+Market%2C+Forecast+to+2025&rlz=1C
1MSNA_enES678ES678&oq=Global+Additive+Manufacturing+Market%2C+Forecast+to+2025&aqs=chrome.
.69i57.918j0j1&sourceid=chrome&ie=UTF-8
G
Gardan, J. (2016). Additive manufacturing technologies: state of the art and trends. International Journal of Production
Research, 54(10), 3118–3132. https://doi.org/10.1080/00207543.2015.1115909
Gebisa, A. W., & Lemu, H. G. (2017). Design for manufacturing to design for Additive Manufacturing: Analysis of
implications for design optimality and product sustainability. Procedia Manufacturing, 13(Supplement C),
724–731. https://doi.org/10.1016/j.promfg.2017.09.120
Gibson, I., Rosen, D., & Stucker, B. (2015). Additive Manufacturing Technologies. New York, NY: Springer New York.
https://doi.org/10.1007/978-1-4939-2113-3
Gutowski, T. G., Branham, M. S., Dahmus, J. B., Jones, A. J., Thiriez, A., & Sekulic, D. P. (2009). Thermodynamic Analysis of
Resources Used in Manufacturing Processes. Environmental Science & Technology, 43(5), 1584–1590.
https://doi.org/10.1021/es8016655
H
Hague, I Campbell, & P Dickens. (2003). Implications on design of rapid manufacturing. Proceedings of the Institution of
Mechanical Engineers, Part C: Journal of Mechanical Engineering Science, 217(1), 25–30.
https://doi.org/10.1243/095440603762554587
Holmström, J., & Gutowski, T. (2017). Additive Manufacturing in Operations and Supply Chain Management: No
Sustainability Benefit or Virtuous Knock-On Opportunities? Journal of Industrial Ecology, 21(S1), S21–S24.
https://doi.org/10.1111/jiec.12580
Huang, Leu, M. C., Mazumder, J., & Donmez, A. (2015). Additive manufacturing: current state, future potential, gaps and
needs, and recommendations. Journal of Manufacturing Science and Engineering, 137(1), 014001.
Huang, S., Liu, P., Mokasdar, A., & Liang, H. (2012). Additive manufacturing and its societal impact: A literature review
(Vol. 67). https://doi.org/10.1007/s00170-012-4558-5
Hull, C. W. (1986). Apparatus for production of three-dimensional objects by stereolithography. Google Patents. Retrieved
from https://www.google.com/patents/US4575330
J
Jackson, B. (2017). Indaero lands major Airbus suppliers using Stratasys 3D printed ULTEM. Retrieved December 12,
2017, from https://3dprintingindustry.com/news/indaero-lands-major-airbus-suppliers-using-stratasys-
3d-printed-ultem-125980/
K
Kellner, T. (2014, June 23). Fit to Print: New Plant Will Assemble World’s First Passenger Jet Engine With 3D Printed
Fuel Nozzles, Next-Gen Materials. Retrieved December 5, 2017, from
https://www.ge.com/reports/post/80701924024/fit-to-print/

42
Klahn, C., Leutenecker, B., & Meboldt, M. (2015). Design Strategies for the Process of Additive Manufacturing. Procedia
CIRP, 36, 230–235. https://doi.org/10.1016/j.procir.2015.01.082
L
Lumbreras, J., Moreno, A., Chacón Tanarro, E., Diaz Lantada, A., García-Sánchez, Á., Bayo, A., … Mínguez Torres, E. (2016).
THE " INGENIA " INITIATIVE FOR PROMOTING CDIO AT TU MADRID: LESSONS LEARNED FOR ENHANCED
PERFORMANCE.
M
Materialise NV. (2015). Keeping intrion Robots Up to Speed. Retrieved December 5, 2017, from
http://www.materialise.com/en/cases/keeping-intrion-robots-up-to-speed
Mellor, S., Hao, L., & Zhang, D. (2014). Additive manufacturing: A framework for implementation. International Journal
of Production Economics, 149(Supplement C), 194–201. https://doi.org/10.1016/j.ijpe.2013.07.008
M&Markets. (2017). Global Additive Manufacturing Market worth $3.5 Billion by 2017. Retrieved December 12, 2017,
from https://www.marketsandmarkets.com/PressReleases/additive-manufacturing.asp
Monzón, M. D., Ortega, Z., Martínez, A., & Ortega, F. (2015). Standardization in additive manufacturing: activities carried
out by international organizations and projects. The International Journal of Advanced Manufacturing
Technology, 76(5–8), 1111–1121. https://doi.org/10.1007/s00170-014-6334-1
N
Niaki, M. K., & Nonino, F. (2017). The Management of Additive Manufacturing: Enhancing Business Value. Springer.
P
Piazza, M., & Alexander, S. (2015). Additive Manufacturing: A Summary of the Literature. Urban Publications. Retrieved
from http://engagedscholarship.csuohio.edu/urban_facpub/1319
Popova, E., Rodgers, T. M., Gong, X., Cecen, A., Madison, J. D., & Kalidindi, S. R. (2017). Process-Structure Linkages Using
a Data Science Approach: Application to Simulated Additive Manufacturing Data. Integrating Materials and
Manufacturing Innovation, 6(1), 54–68. https://doi.org/10.1007/s40192-017-0088-1
Q
Quinlan, H. E., Hasan, T., Jaddou, J., & Hart, A. J. (2017). Industrial and Consumer Uses of Additive Manufacturing: A
Discussion of Capabilities, Trajectories, and Challenges. Journal of Industrial Ecology, 21(S1), S15–S20.
https://doi.org/10.1111/jiec.12609
Reid, L. (2017). Environmental Dimensions of Additive Manufacturing and 3D Printing [Special issue]. Journal of
Industrial Ecology, 21(S1), S1–S36. https://doi.org/10.1111/jiec.12587
Rodgers, T. M., Madison, J. D., & Tikare, V. (2017). Simulation of metal additive manufacturing microstructures using
kinetic Monte Carlo. Computational Materials Science, 135(Supplement C), 78–89.
https://doi.org/10.1016/j.commatsci.2017.03.053
Rosen, D. W. (2007). Computer-aided design for additive manufacturing of cellular structures. Computer-Aided Design
and Applications, 4(5), 585–594.
Rosen, D. W. (2007). Design for additive manufacturing: A method to explore unexplored regions of the design space.
Sculpteo. (2017). The State of 3D Printing 2017 by Sculpteo. Retrieved December 12, 2017, from
https://www.sculpteo.com/en/get/report/state_of_3D_printing_2017/

Chapter 2 Introduction
43
Setaki, F., Tenpierik, M., Turrin, M., & van Timmeren, A. (2014). Acoustic absorbers by additive manufacturing. Building
and Environment, 72(Supplement C), 188–200. https://doi.org/10.1016/j.buildenv.2013.10.010
Shafter, Clarke, & Mitchell. (2014). Credit Suisse report on Additive Manufacturing. Retrieved December 11, 2017, from
https://research-doc.credit-suisse.com/
Stampfl, J. & Hatzenbichler, M. (2014). Additive Manufacturing Technologies. In L. Laperrière, G. Reinhart, & T. I. A. for
P. Engineering (Eds.), CIRP Encyclopedia of Production Engineering (pp. 20–27). Springer Berlin Heidelberg.
https://doi.org/10.1007/978-3-642-20617-7_6492
Stefan Rüsenberg, Stefan Josupeit, & Hans-Joachim Schmid. (2014). A Method to Characterize the Quality of a Polymer
Laser Sintering Process. Advances in Mechanical Engineering, 6, 185374.
https://doi.org/10.1155/2014/185374
T
Tarbutton, J., & Villarraga-Gómez, H. (2015). Dimensional Metrology of Complex Inner Geometries Built by Additive
Manufacturing. Retrieved from
http://www.academia.edu/27598277/Dimensional_Metrology_of_Complex_Inner_Geometries_Built_by_Add
itive_Manufacturing
Thompson, M. K., Moroni, G., Vaneker, T., Fadel, G., Campbell, R. I., Gibson, I., … Martina, F. (2016). Design for Additive
Manufacturing: Trends, opportunities, considerations, and constraints. CIRP Annals - Manufacturing
Technology, 65(2), 737–760. https://doi.org/10.1016/j.cirp.2016.05.004
V
Vurpillat, J. (2016, August 24). 3D Demonstrators Designed for Bigger, Lighter Auto and Aerospace Parts. Retrieved
December 11, 2017, from http://blog.stratasys.com/2016/08/24/infinite-build-robotic-composite-3d-
demonstrator
W
Wohlers. (2017). Additive Manufacturing State of the Industry Reports | Wohlers Associates. Retrieved December 12,
2017, from https://wohlersassociates.com/state-of-the-industry-reports.html
Wong, K. V., & Hernandez, A. (2012). A Review of Additive Manufacturing. ISRN Mechanical Engineering, 2012, 1–10.
https://doi.org/10.5402/2012/208760
Z
Zhao, X., & Rosen, D. (2017). Real-time interferometric monitoring and measuring of photopolymerization based
stereolithographic additive manufacturing process: Sensor model and algorithm (Vol. 28).
https://doi.org/10.1088/0957-0233/28/1/015001


Chapter 3
Materials and experimental methods


Chapter 3 Materials and experimental methods
47
MATERIALS AND EXPERIMENTAL METHODS
3.1 Additive manufacturing technologies
Among the several alternatives, currently available, to produce three-dimensional objects layer by layer following the geometries from computer aided designs (Table 3.1), this Thesis is focused on the technologies which processes are based on vat photopolymerization. These processes, also called lithography-based manufacturing techniques (L-AMT), have become for the production of small part series that require a high level of precision. Using photochemical reactions triggered by light for the geometrical representation of the part, instead of thermal energy or binding process. The use of vat photopolymerization offer benefits in terms of surface quality and feature resolution (Mitteramskogler et al. 2014).
Table 3.1. Technologies and materials matrix currently available in the additive manufacturing industry
Technology AM Process Polymers Metals Ceramics Composites
Stereolithography
Vat photopolymerization
O O
Digital light processing O
Hot lithography O O
Lithography-based ceramic manufacturing
O O
Continuous liquid interface production
O
Two photon polymerization O
Multi-jet modeling Material jetting O O
Fused deposition modeling Material extrusion O O
Electron beam melting
Powder bed fusion
O
Selective laser sintering O O O O
Selective heat sintering O
Direct metal laser sintering O
Powder bed and inkjet head printing Binder jetting
O O O O
Plaster-based 3D printing O O
Laminated object manufacturing Sheet lamination
O
Ultrasonic consolidation O
Laser metal deposition Direct energy deposition
O
The stages involved to the manufacturing process by any of these technologies are common, starting from a physical object and subsequent reverse engineering by means of a 3D scanning or with the use of CAD software to design a three-dimensional model.

48
After treating this model through iterations that allow designers to optimize the pretending 3D object, the design is exported to a specific software, which cuts the object in slices to get a new file containing data for each layer (Gardan, 2016). Then, the information is sent to the AM system,
obtaining a part that needs of a post-processing, such as the removal of exceed material and supporting structures, washing or post-curing (SLA, DLP, CLIP) or even thermal treatments (FDM, SLS, SLM, etc..).
Figure 3.1. Scheme of AM stages (extracted from: Gardan, 2016).
The following sections provide a brief overview of the software resources employed during the development of the Thesis, so for the generation of the CAD model, the optimization of that object and the slicers used for the manufacturing of the parts. Moreover, a technical explanation for the systems that the team has been working with along the project, is also provided. Finalizing, a description of the experimental methods carried out for the achievements of the objectives proposed at the beginning of the Thesis, is given. For more information regarding details of the technologies and the AM manufacturing process, it is suggested to follow the references cited within the sections.
Stereolithography
The first AM method developed in the 1980s, as a rapid prototyping technique, was the stereolithography (SLA), coined by Chuck Hull when he applied for the patent of the process, granted in 1986 (US Patent No. 4575330, 1984) who co-founded the first 3D printing company 3D Systems Inc. The SLA is defined as a technology which cures or solidifies a liquid photosensitive polymer through the use of a light source (laser) that supplies the energy to induce the chemical reaction of photopolymerization, forming a cross-linked polymer (Bártolo, 2011; Jacobs, 1992) shaping the cross section of the active layer. Afterwards, the platform where the job takes place is displaced to the new position along the z axis according to the desired layer thickness.

Chapter 3 Materials and experimental methods
49
Depending on the process (see Table 3.2), the recoating will be based on a blade, spreading the material and leaving a uniform layer of material into the vat for the subsequent polymerization, in a layer-upon-layer basis methodology (see Figure 3.4)
Prior to the manufacturing process it is necessary to start off from a CAD design that is transformed into STL format (standard tessellation language or STereoLithography), which specifies both ASCII or binary files, in which the 3D model is then represented by a finite number of three-sided elements (triangles) that make up the outer surface of the figure (Figure 3.2).
Figure 3.2. Example of STL approximation (black) for a torus geometry from a CAD representation (red), formed by STL triangles of edges a, b, c and vertex ABC. Normal file structure for an ASCII format. (Adapted from: (Gardan, 2016)
and torus example under CC license by BY-SA).
Depending on the position of the light source and the exposure, we can classify the SL-systems in:
Table 3.2. Classification of SL-systems regarding the source of the light
Process Advantages Disadvantages
Top-bottom or free surface (Figure 3.3.a)
Maximum building volume for production of large parts.
Due to the high volume of resin into the vat is not feasible the material change.
Bottom-up or restricted surface (Figure 3.3.b)
Easy removal of material vat for changing between different
configurations. The envelope volume for printing is reduced.
The invention of bottom-up processes (Figure 3.3) has helped to develop an industry of ‘’new generation’’ SL desktop 3D printers at lower prices than the conventional industrial standards commercialized by 3D Systems®, based on top-bottom approaches. During this Thesis, both approaches are useded for the manufacturing of prototypes in polymeric-based materials, before trials in ceramics. The following Section 1.2 describes in deeper detail the specifications of the industrial system SLA-3500 (3D Systems), and as a way of testing alternatives and obtaining proof-of-concept devices the desktop system Form1+ (Formlabs).

50
Figure 3.3. Illustration for the different exposure sources: a) Top-bottom and b) bottom-top (images extracted from (Waheed et al., 2016)).
After the objects are printed, it is necessary to carry out a post-treatment to the parts, since on the one hand there are supporting structures to remove, which do not form the bulk of the part and on the second hand, there is an exceed of non-polymerized resin adhered to the surface that must be washed out in order to obtain the right geometry. For that purpose, the parts are commonly sunk into a vat that contain a suitable solvent for the material and usually an ultrasonic bath is applied to adequately eliminate that resin. Depending on the need, the washing step is repeated to get a more adequate surface finish, free of fresh material. Once the part is clean, this is taken to an UV-chamber for a finally post-curing step, obtaining then a part fully cured with the final mechanical properties of the polymerized material (see properties of the material used for the development of the Thesis in the Section 1.4).
Figure 3.4. Scheme summarizing the manufacturing process based on the layer-upon-layer approach.
Preparation
Re-coating
Positioning
Exposure
Separation
Job finished

Chapter 3 Materials and experimental methods
51
Lithography-based additive manufacturing of ceramics
The lithography-based ceramic manufacturing (LCM), is a technology developed at TU Wien (Felzmann et al., 2012; J Homa, Zellhofer, & Stampfl, 2009; Johannes Homa & Schwentenwein, 2014; Mitteramskogler et al., 2014) , originally based on the patent from TU Wien and the company Ivoclar Vivadent AG (WO Patent No. 045951, 2010) for light polymerizable material, further particularized for ceramic-filled materials and currently industrialized by Lithoz GmbH.
Figure 3.5. Illustration of the operating principle of the ceramic DLP-system (image courtesy of TU Wien Institute of Material Science and Technology).
The master models or green parts are manufactured, with previously prepared slurries, by digital light processing (DLP) (schematically presented in Figure 3.5. The slurries are prepared with commercially available ceramic powders. These powders are homogeneously dispersed, with the help of a dispersing agent that is dependent on the matrix utilized, in a formulation containing a reactive mix of mono and di-functional monomers (usually acrylates and methacrylates) and a suitable solvent to obtain the dispersion. In addition, the formulation contains a photo-initiator (typically less than 1 wt.%). The photoinitiator reacts under an external energy source, in this case a LED emitting at a determined wave length, which excites the initiator creating radicals that chemically react with the monomers included in the mixture (see reactions 1-4). The chain reaction forms the desired matrix of (meth)acrylate monomers that bind together the ceramic particles in the shape of the original part. The reaction occurs in a brief lapse of time, while a determinate section of the part is being projected with the specific intensity and exposure time parameters. DLP uses dynamic masks, which represent an individual cross section of the part being manufactured. The light engine uses high performance LEDs engine as light source and a DMD chip (digital mirror device) as dynamic mask with a specific resolution. The fabrication of the part is done in sequential layer-by-layer manner. For each individual layer, fresh slurry is applied on the building envelope. Depending on the system used, the slurry is spread with a blade, by means of a tilting movement of the vat or thanks to its rotation. Afterwards, the building platform is lowered into the slurry to a distance pre-defined by the layer thickness set up, to the bottom of the vat, which equals the thickness of an individual layer in the green body. Then the space-resolved exposure of the slurry is done by the projection of an image. In a similar way, as in the SL technique, the non-cured slurry that remains attached to the surface of the part or internally stuck in cavities or channels is removed by the same process used for the SL, with a
1. Tilting mechanism 2. Rotating mechanism 3. Coating blade 4. Exposed slurry 5. LED light source 6. DMD chip 7. Optics 8. Green part 9. Z-stage

52
suitable solvent that does not swell the polymeric matrix, for a determined time sink into the ultrasonic bath. In some cases, the parts are also cleaned by using a compressed air system in order to flow out any remain of resin or even dust. The final treatment of the green parts is also the post curing in a UV chamber, achieving the fully curing of the polymeric matrix for the subsequent burning process.
PI 2 (1)
(2)
(3)
(4)
recombination
disproportionation
initiator radicalshν
RCH2
R
RR
C·R
C ·
R
X C ·H RRX ·
X ·
+
+
+
Figure 3.6. Schematic representation of the chemical reaction of free radical photopolymerization (extracted from: Stampfl and Liska, 2011).
The polymeric masters, once the part is free of non-cured slurry, are subjected to a thermal treatment with the aim of obtaining a final ceramic solid part, free of any organic material. In addition, as the ceramic particles are separated, green parts have lower density and mechanical properties than compact alumina. The elimination of the organic components for achieving final composition and properties is carried out as described in previous research. In short, the thermal variation is controlled inside a high-temperature chamber furnace from 30ºC up to 400ºC.
Figure 3.7. Steps of thermal treatment from the ceramic green body to the sintered dense ceramic (Image courtesy of
Lithoz GmbH).
Firstly, the solvent included in the slurry is evaporated. Subsequently, a slow temperature variation is provided, so as to get an adequate decomposition of the binder, without causing internal stresses due to the formation of gas at high temperature. In a second step, the Al2O3 particles are sintered. The part, already free of any organic component surrounding the ceramic particles, is raised up to the sintering temperatures, dependent of the ceramic powders selected for the slurry, hence achieving sintering and resulting in a final dense part, with material properties being equal to serial parts from conventional manufacturing techniques. The whole process is schematized in Figure 3.7.

Chapter 3 Materials and experimental methods
53
3.2 Machines
Following, the systems utilized for the different stages along the development of the Thesis are described with their specifications, classified in four groups. This related to the laser-based printers (SL-systems), the approaches based on light curing by means of a digital light processing method (DLP-systems), the 3D printers that have been used for secondary works like sealing covers for the applications, adapters for the intakes in the cases that compressed air or water circuits are involved. Finally, the devices that are surrounding the process for the fabrication of parts via additive manufacturing approaches such as: UV chambers, ultrasonic devices, sintering furnaces and in conclusion these machines necessary for a suitable post-processing, obtaining the right prototypes and final parts.
Lithography laser-based systems
SLA® 3500
This lithography-based system from 3D Systems (3D Systems Inc., Rock Hill, SC 29730 USA) is an industrial standard high-resolution machine, working in wave length of λ = 354.7 nm and 160 mW, that allows to work with a wide range of SL materials. In our case, the selected material is the epoxide-based material Accura 60® (see section 1.4). This up-bottom approach has a unique and not interchangeable vat with a volume of 99.3 dm3 and requires of a power input of 3.3 kW, with a building platform made of aluminum (Figure 3.8.). The recoating process is based on: Sinking the platform and a ZephyrTM recoating system moving from one side of the vat to the other, creating a homogenous free surface to be exposed to the laser. The main specifications are shown in Table 3.3.
Table 3.3. Specification of the SLA® 3500 from 3D Systems®
XY resolution 0.25-0.2 mm spot size
Layer thickness resolution 0.05-0.1 mm
Building envelope 350 x 350 x 400 mm3
Processing speed 2.54 m/s
Figure 3.8. Images of the SLATM 3500 system, detail of building platform (right) from LDP-UPM’s machine.
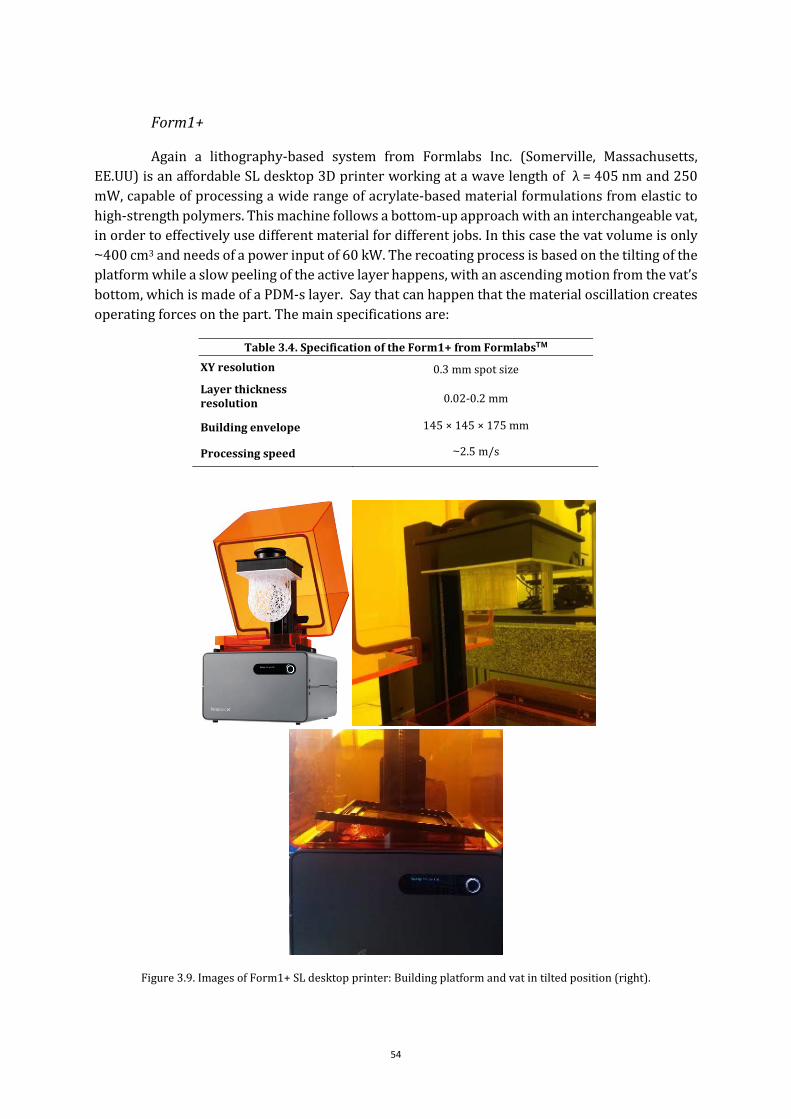
54
Form1+
Again a lithography-based system from Formlabs Inc. (Somerville, Massachusetts, EE.UU) is an affordable SL desktop 3D printer working at a wave length of λ = 405 nm and 250 mW, capable of processing a wide range of acrylate-based material formulations from elastic to high-strength polymers. This machine follows a bottom-up approach with an interchangeable vat, in order to effectively use different material for different jobs. In this case the vat volume is only ~400 cm3 and needs of a power input of 60 kW. The recoating process is based on the tilting of the platform while a slow peeling of the active layer happens, with an ascending motion from the vat’s bottom, which is made of a PDM-s layer. Say that can happen that the material oscillation creates operating forces on the part. The main specifications are:
Table 3.4. Specification of the Form1+ from FormlabsTM
XY resolution 0.3 mm spot size
Layer thickness resolution 0.02-0.2 mm
Building envelope 145 × 145 × 175 mm
Processing speed ~2.5 m/s
Figure 3.9. Images of Form1+ SL desktop printer: Building platform and vat in tilted position (right).
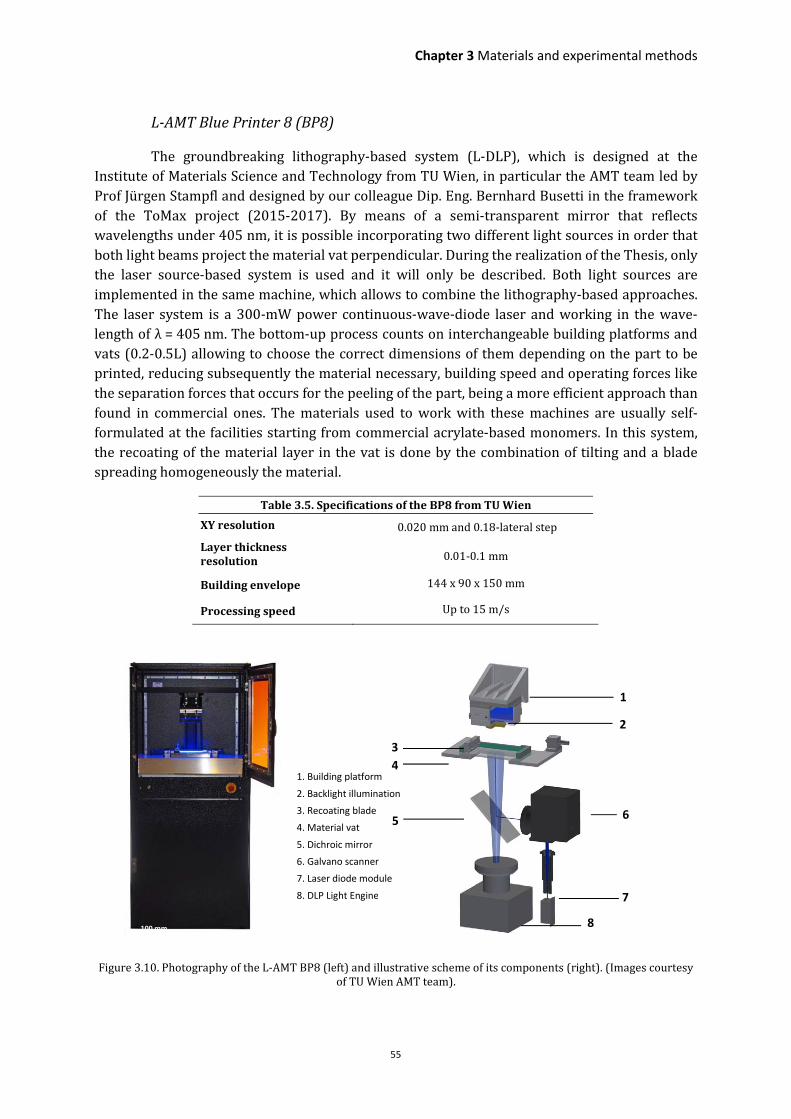
Chapter 3 Materials and experimental methods
55
L-AMT Blue Printer 8 (BP8)
The groundbreaking lithography-based system (L-DLP), which is designed at the Institute of Materials Science and Technology from TU Wien, in particular the AMT team led by Prof Jürgen Stampfl and designed by our colleague Dip. Eng. Bernhard Busetti in the framework of the ToMax project (2015-2017). By means of a semi-transparent mirror that reflects wavelengths under 405 nm, it is possible incorporating two different light sources in order that both light beams project the material vat perpendicular. During the realization of the Thesis, only the laser source-based system is used and it will only be described. Both light sources are implemented in the same machine, which allows to combine the lithography-based approaches. The laser system is a 300-mW power continuous-wave-diode laser and working in the wave-length of λ = 405 nm. The bottom-up process counts on interchangeable building platforms and vats (0.2-0.5L) allowing to choose the correct dimensions of them depending on the part to be printed, reducing subsequently the material necessary, building speed and operating forces like the separation forces that occurs for the peeling of the part, being a more efficient approach than found in commercial ones. The materials used to work with these machines are usually self-formulated at the facilities starting from commercial acrylate-based monomers. In this system, the recoating of the material layer in the vat is done by the combination of tilting and a blade spreading homogeneously the material.
Table 3.5. Specifications of the BP8 from TU Wien
XY resolution 0.020 mm and 0.18-lateral step
Layer thickness resolution 0.01-0.1 mm
Building envelope 144 x 90 x 150 mm
Processing speed Up to 15 m/s
Figure 3.10. Photography of the L-AMT BP8 (left) and illustrative scheme of its components (right). (Images courtesy of TU Wien AMT team).
1. Building platform
2. Backlight illumination
3. Recoating blade
4. Material vat
5. Dichroic mirror
6. Galvano scanner
7. Laser diode module
8. DLP Light Engine
8
3
4
5 6
7
1
100 mm
2

56
Digital light processing systems
CeraFab 7500
This LCM system from Lithoz GmbH, based on the lithography-additive manufacturing (L-AM) patented technology (WO Patent No. 045951, 2010), provides high-performance ceramics through the method based on digital light processing (DLP) described in the previous section 1.1. A bottom-up procedure that places at the bottom the light engine, which uses high performance LEDs as light source and a DMD chip (digital mirror device) as dynamic mask with a resolution of 1920 x 1080 pixels. It works with a wide range of developed ceramic materials such as alumina (Al2O3), zirconia (ZrO2), SiAlONs or hydroxyapatite, among others.
The operating principle is equal to the BP8, however in this case the recoating is carried out by the spinning of the vat that contains the slurry, made of glass, silicon and PDM-film layer. The position of the called wiped blade remains static, ensuring a homogenous thickness of material layer on the whole vat.
Figure 3.11. Photographs of the CeraFab7500. Frame (left), building platform (center) and vat with the wiped blade (right). (Images courtesy of Lithoz GmbH).
Table 3.6. Specifications of the CeraFab from Lithoz GmbH
XY resolution 0.04 mm
Layer thickness resolution
0.025-0.1 mm
Building envelope 76 x 43 x 150 mm
Processing speed 5 mm/h (in z direction)

Chapter 3 Materials and experimental methods
57
Fused deposition modelling systems
Prusa i3 Hephestos
The FDM 3D printer from BQ (Mundo Reader S.L, Madrid, Spain) is based on the extrusion of a thermoplastic filament (1.75 mm). The material is deposited on the building plate that moves horizontally in the y direction, by beans of the extruder head which moves in both horizontal (x) and vertical (z) directions. The filament is heated inside the nozzle well past the glass transition temperature. The motion along the axis is accomplished by the use of servo motors, belts and smooth rods as guides. The materials employed in the Thesis are the acrylonitrile butadiene styrene (ABS), polylactic acid (PLA) and flexible polyurethane-based filaments. The 100 W-power system is an economic method to obtain rapid prototypes in a medium quality, working with STL files as well as for the stereolithography-based systems. It is used in the Thesis for obtaining supporting elements and parts for testing benches, which help to validate several of the proposed applications.
Table 3.7. Specifications of the Prusa i3 Hephestos from BQ
XY resolution 0.3 mm
Layer thickness resolution
0.06-0.3 mm
Building envelope 215 x 210 x 180 mm
Processing speed 40-100 mm/s
Figure 3.12. Components description of Prusa i3 Hephestos from BQ
Other devices and resources
In the table below, the rest of the devices employed for the correct accomplishment of the Thesis are briefly presented. These are important not only for the final post-treatment to the parts but also for the experimental trials carried out to the applications (e.g. the trials for the applications of the heat exchangers of Chapter 6, section 1.3).
Filament coil
Extrusion head
Servo y
Servo z
Belts (x,y)
Building plate
Guideway x

58
Table 3.8. Other devices utilized during the Thesis.
Device Name Specs
UV chamber ProCure 350, 3D systems Inc. Equipped with 10 actinic fluorescent bulbs (Philips TL-K 40 W/05) emitting from 320 to 420 nm, with a maximum between 355 and 365 nm.
Precision scale Kern PCB 100-3, Kern & Sohn GmbH. Maximum weight 100 g and readability of 0.001 g.
Opto-digital microscope Olympus DSX100.
High dynamic range and extended focal range enable 2D and 3D measurements and representation. Magnification 10x and 40x.
Stereomicroscope Nikon SMZ800.
Zoom range: 1x to 6.3x.
Parallel Optical Zoom System Binocular eyepiece yube, 20° Inclination. Interpupilary Distance: 48-75mm.
Objective WD 32.5 2x.
Vacuum Mixer MCP 004ST, HEK GmbH Lübeck, Germany.
Vacuum system provided with a mixing system which allow the tilting and the use of a spinning tool at three r.p.m levels.
Magnetic stirrer SOA1020B Barstead Int. USA. Hot plate up to 150° C and regulable
spinner.
Ultrasonic cleaning equipment Ultrawave, Wentloog Avenue, Cardiff. -
Furnace Thermo ScientificTM C129627 Fisher Scientific. -
Hot plate Thermo Fisher Scientific, 81 Wyman Street, Waltham, MA 02451, USA.
-
Thermometer Cambridge Instruments & Engineering Co., Kolkata, India. -
3.3 Software resources
Following subsections give an overview of the software resources that are used during the Thesis. They are classified in 3 groups, depending on the stage of the manufacturing process that we focus on: i) Design, those referred to the creation of the three-dimensional model; ii) simulation, the software employed for the optimization and validation of the design; iii) slicing, involving the tools necessaries for the preparation of the printing job.
Design
This group encompass the software necessary for the conception of the virtual object. Although the aim is common to all the resources, the methods to achieve it can vary in several aspects. In fact, the well-known commercial and conventional CAD software are lately being replaced by novel creative software resources that allow to generate models in an easier and more organic mode, working with sculpting approaches, class-A surfaces and non-uniform rational

Chapter 3 Materials and experimental methods
59
B-spline (NURBS) generation methods. Thus, we subdivide the group in conventional solid design software (Table 3.8) and the new 3D modelling approaches (Table 3.10). Following, the list of the employed software resources is shown:
Table 3.9. Conventional solid design software
Software Company Description
CATIATM V5 Dassault Systèmes, 10 rue Marcel Dassault, CS 40501, 78946 Vélizy-Villacoublay Cedex, France.
Solid-based design.
NXTM-8.5 Siemens AG, Wittelsbacherplatz 2, 80333 Munich, Germany
Solid-based design and product life cycle assessment.
Autodesk® Fusion 360
Autodesk Inc. 111 McInnis Parkway San Rafael, CA 94903 USA
Solid-based design on the cloud, free license for students and an effective communication between modules. [Student license]
Table 3.10 New 3D modelling approaches
Software Company Description
3-maticTM 12.0 Materialise NV, Technologielaan 15 3001 Leuven, Belgium.
It is considered a STL editor as well as modeler based on surface modelling. However, the difference resides in the special modules, for the generation of lattice structures and for the generation of textures on three dimensional surfaces.
VectaryTM Vectary, Inc. Oskorusova 11 Bratislava, 841 02Slovakia.
It is a 3D online modeler based on generative design and nodes processing of triangle mesh for, dragging and dropping points or surfaces.
Autodesk® Meshmixer
Autodesk, Inc. 111 McInnis Parkway San Rafael, CA 94903 USA.
It allows to work with triangular meshes, editing, combining, remeshing and working in basis of 3D sculpting and B-spline (NURBS) design.
Evolve Solid thinking, Inc. 1820 East Big Beaver Rd Troy, MI 48083 USA.
3D sculpting software based on generative design, incorporating class A surfaces and B-spline (NURBS) design.
Modeling and simulation resources
Modeling is a very supportive and valuable tool for manufacturing. These resources allow designers to evaluate the performance of a model object by means of finite element method. In the specific way of additive manufacturing, the simulation software helps to study not only the behavior of the part under operating conditions, but also to predict the printability of the design in a step previous to its manufacturing, aiming to achieve an efficient AM fabrication of the part. This is accomplished by the modelling of the materials involved in the process (see Chapter 4, section 1.4)
In this Thesis, the simulation software resources are employed for both purposes, helping to develop the strategies further explained in Chapter 4. Thanks to that, it is possible to achieve

60
complex geometries that in some cases work on the limits of the technology, in terms of printability, due to the inclusion of large overhanging structures, building angles or wall thickness. On the other hand, the utilization of FEM software helps to develop a new AM product in a simulation driven strategy (SDS), focusing in a solution for the product based only on the performance. Chapter 5 and 6 show in what way these software are integrated into the design iteration, achieving novel concepts that are validated via simulation and afterwards evaluated again by means of their printability.
Table 3.11. Finite-element-based software for the simulation stage
Software Company Description
COMSOL Multiphysics 5.3
COMSOL AB Tegnérgatan 23 SE-111 40 Stockholm Sweden.
Works with applications in different physics, being suitable for cases in which is necessary the coupling of several phenomena, as it is the case of the fuel cells.
HyperworksTM 2017 Altair Engineering, Inc 1820 E.Big Beaver Rd. Troy MI 48083 USA.
It is formed by a powerful finite element pre-processor (Hypermesh), which helps with the meshing of complex geometries with homogeneous meshes. Moreover, it has available several solvers such as Nastran or Optistruct that helps with the topology optimization of the designs.
INSPIRETM Solid thinking, Inc. 1820 East Big Beaver Rd Troy, MI 48083 USA.
Topology optimization software that allows both static and dynamic analysis, reducing part weight while focus on the object compliance
NXTM FEM module Siemens AG, Wittelsbacherplatz 2, 80333 Munich, Germany.
It is used in this research, when the design is created with NX 8.5 solid design module, communicating in a faster way the FEM with the CAD for structural mechanics, fluid and thermal simulations.
CATIATM FEM module Dassault Systèmes, 10 rue Marcel Dassault, CS 40501, 78946 Vélizy-Villacoublay Cedex, France.
It is used in this research, when the design is created with CATIA v5 solid design module, giving a fast response to the designer for evaluating the concept.
Slicers
In this group, we will include the resources that allow us to send a code file from the computer to the desired AM system (file preparation software), preparing the file for the printing job in terms of translating the model into individual layer and also the programs called ‘Interface/control software’ that combine the functionality of the slicer itself plus the possibility of editing the STL files, repairing, applying Booleans and generate supports structures. In addition, the programs allow to change parameter on run time (e.g speed, flow, temperature, energy intensity, etc.).

Chapter 3 Materials and experimental methods
61
Table 3.12. Programs for the preparation of the 3D printing job
Software Company Description
3Data Expert® 11.0 Deskartes Oy, Pihlajatie 28 Helsinki, Finland.
Data Expert includes commands for manipulation of both 3D surface models and 3D faceted models. These commands include surface triangulation, STL verification and repair, STL offsetting, splitting, connecting, decimation, smoothing, shrink wrap, nesting and Boolean as well as STL coloring and texturing. Basic supports can be generated for both Stereolithography, DLP and metal processes.
NetfabbTM 2017 Autodesk®, Inc. 111 McInnis Parkway San Rafael, CA 94903 USA.
Interface/control software that allows to work with the geometries, edit and repair meshes in its free version. [Trial version]
PreForm Open GL. Formabs, Inc. Somerville, Massachusetts, USA.
It is a specific slicer for the SL-systems from Formlabs. The code for the version Open GL allows the user to modifiy the internal settings of the job, such as: hatching speed, intensity or tilting speed.
3D LightyearTM 3D Systems, Inc., Rock Hill, SC 29730 USA. Only available for 3D Systems® SLA® systems, works as a slicer translating the STL info to laser trajectories and also generating the specific supports for the specific machine.
Ultimaker Cura 3.0 Ultimaker B.V Watermolenweg 2 Geldermalsen, 4191 PN, Netherlands.
It is an open source program that allow user to slice the SLT models and translate them to g-code for FDM-based 3D printers.
3.4 Materials
Photocurable materials
Along the development of the Thesis, different materials oriented to its additive manufacturing are employed in order to study novel solutions for the industry. However, mostly all of them are polymer-based materials, since the aim of the research points out the systems that work by means of vat photopolymerization system. Though the working principles are the same, based on free radical polymerization, the polymeric matrix are different and final properties as well. Following, the list of photocurable materials is shown:
Table 3.13. Photocurable materials for additive manufacturing
Name Material type Appearance after curing
Feature Company
Accura® 60 Epoxide-based resin and photoinitiator
Clear and stiff High-precision 3D Systems Inc., 333 Three D Systems Circle Rock Hill, USA.

62
FLGPCL01/02 (Clear resin)
Mixture of methacrylated oligomers and photoinitiator
Clear and stiff High-precision Formlabs, Inc. Somerville, Massachusetts, USA.
FLFLGR01 (Flexible)
Mixture of methacrylated oligomers and photoinitiator
Flexible and glossy
Elastic applications Formlabs, Inc. Somerville, Massachusetts, USA.
FLCABL (Castable)
Methacrylate monomers, pigment and photoinitiator
Opaque blue and stiff
High-temperature Formlabs, Inc. Somerville, Massachusetts, USA.
LithaLox 350D
Slurry 49 vol% Al2O3
powders, mix of monomers, solvent and photoinitiator
White ceramic 1.6% porosity Ra of 0.9 µm
High biocompatibility and
bioinertness
Lithoz GmbH Mollardgasse 1060 Vienna, Austria.
LithaLox HP500
Slurry 49 vol% Al2O3
powders, mix of monomers, solvent and photoinitiator
White ceramic 0.6% porosity Ra of 0.4 µm
hardness, corrosion and temperature
resistance
Lithoz GmbH Mollardgasse 1060 Vienna, Austria.
LithaNit 720
Slurry 40 vol% β-SiAlON powders, mix of monomers, solvent and photoinitiator
Grey ceramic 0% porosity Ra of 0.65 µm
high strength, thermal shock and
corrosion resistance up to 1200 °C
Lithoz GmbH Mollardgasse 1060 Vienna, Austria.
For these materials, the mechanical properties that have been considered for the simulations are the following:
Table 3.14. Final mechanical properties of the initially photocurable materials1
Name
Solid density (g/cm3)
Resin viscosity
(Pa·s)
Young’s modulus
(GPa)
Elongation at failure
(%)
Tensile strength
(MPa)
Max. working
temp. (°C)
Thermal conductivity
(W/m·K)
Flexural strength
(MPa)
Flexural modulus
(GPa)
Accura® 60 1.21 0.18 3.1 5 68 53 0.18 101 -
FLGPCL01/02 (Clear
resin)
- 0.9 2.8 6.2 65 58.4 - - 2.2
FLFLGR01 (Flexible)
- 4.5 - 75 8.5 230 (VSP)2 - - -
FLCABL (Castable)
0.33 0.22 13 11.6 - - - -
LithaLox 350D
3.99 8.5 - - - 1650 37 - -
LithaLox HP500
3.99 11.5 - - - 1650 37 430 -
LithaNit 7203
3.23 5 288 - 400 1200 28 760 -
1 Values of the properties corresponding to post-cured conditions for each material. For more info regarding these conditions: DS for the commercial resins (www.lithoz.com and www.formlabs.com).
2 Thermal testing was performed after 40+ hours with a 10 N loading at 50 °C/hour. Cracks formed in samples during testing 3 Material properties for Syalon 101 silicon nitride powders after sintering from Syalons International Limited Stephenson Street, Willington Quay, Newcastle, UK.

Chapter 3 Materials and experimental methods
63
In spite of the necessary materials for manufacturing or prototyping being commercially available, the case of AM parts with enhanced surface texturing (see Chapter 6, Subsection 1.2.2) differs, since we use only the SL-system BP8 from TU Wien (see subsection 1.2.1). Although the system could work with several commercial resins, we look for a material formulation that allow to make use of the maximum precision that the machine can support. For that reason, a self-developed photocurable material was researched during the development of the Thesis. This material attempt to provide better results working with the laser system for obtaining high precision features.
This material, which we would call ‘’self-developed resin’’, was achieved by experimental methods explained in the following section 1.5. and is specifically created to cover the needs of ToMax project and TU Wien AMT team for testing the high-resolution features that could be achievable with the novel SL-system such the added textures to a 3D model (see examples provides in Chapter 6). In Table 3.5, we present the materials used to formulate it.
Table 3.15. Material list for the formulation of the self-developed photocurable resin for surface texturing
Name Material type Structure Feature Company wt.%
SR 348L Ethoxylated (2) bisphenol A dimethacrylate
Low viscosity, highly
reactive (difunctional)
Sartomer Americas, Arkema, Inc. 502 Thomas Jones way, Exton, USA.
99%
Sudan® Yellow
UV Light Absorber (UVA)
- Dark red pigment.
John Hogg Technical Solutions Mellors Road Manchester UK
<1%
Irgacure® 819
Phosphine oxide, phenyl bis (2,4,6-trimethyl benzoyl)
Light yellow powder
absorption peak at 370
nm
Ciba Specialty Chemicals, Inc. Klybeckstrasse 141 Basel Switzerland.
<0.5%
Other materials
Furthermore, in relation to the development of secondary objectives, other materials were employed, which are not directly used in the evaluated applications. These, for instance, have been applied for the fabrication of tools or equipment necessary for the testing of the manufactured designs such connectors, adapters, clamps, etc. (Table 3.17) or for the development of gel-casting slurries (alumina or hydroxyapatite, see Section 3.5) which are formulated at the laboratory facilities for the evaluation of novel design for the sacrificial molds (see Chapter 5, section 5.5). In the following Table 3.16, the formulation for the HA slurry is presented.
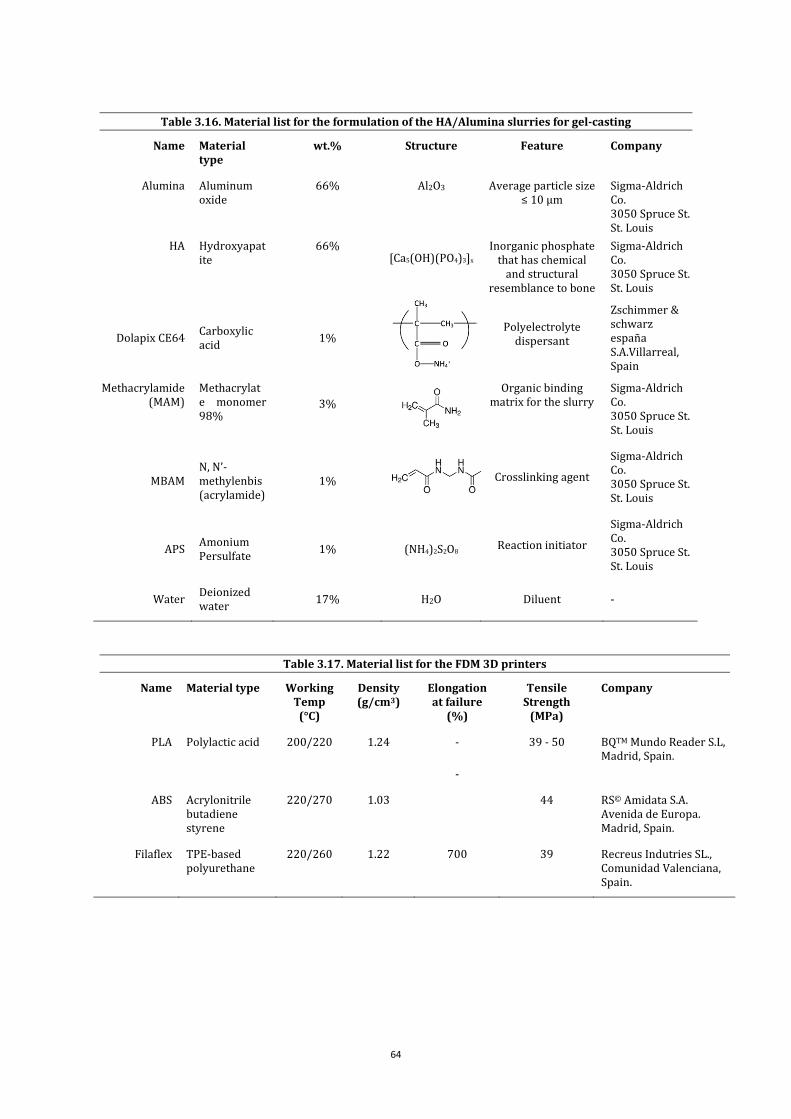
64
Table 3.16. Material list for the formulation of the HA/Alumina slurries for gel-casting
Name Material type
wt.% Structure Feature Company
Alumina Aluminum oxide
66% Al2O3 Average particle size ≤ 10 µm
Sigma-Aldrich Co. 3050 Spruce St. St. Louis
HA Hydroxyapatite
66% [Ca5(OH)(PO4)3]x
Inorganic phosphate that has chemical
and structural resemblance to bone
Sigma-Aldrich Co. 3050 Spruce St. St. Louis
Dolapix CE64 Carboxylic acid
1%
Polyelectrolyte dispersant
Zschimmer & schwarz españa S.A.Villarreal, Spain
Methacrylamide (MAM)
Methacrylate monomer 98%
3%
Organic binding matrix for the slurry
Sigma-Aldrich Co. 3050 Spruce St. St. Louis
MBAM N, N’-methylenbis(acrylamide)
1% Crosslinking agent
Sigma-Aldrich Co. 3050 Spruce St. St. Louis
APS Amonium Persulfate
1% (NH4)2S2O8 Reaction initiator
Sigma-Aldrich Co. 3050 Spruce St. St. Louis
Water Deionized water
17% H2O Diluent -
Table 3.17. Material list for the FDM 3D printers
Name Material type Working Temp
(°C)
Density (g/cm3)
Elongation at failure
(%)
Tensile Strength
(MPa)
Company
PLA Polylactic acid 200/220 1.24 - 39 - 50 BQTM Mundo Reader S.L, Madrid, Spain.
-
ABS Acrylonitrile butadiene styrene
220/270 1.03 44 RS© Amidata S.A. Avenida de Europa. Madrid, Spain.
Filaflex TPE-based polyurethane
220/260 1.22 700 39 Recreus Indutries SL., Comunidad Valenciana, Spain.

Chapter 3 Materials and experimental methods
65
3.5 Experimental methods
Methods for obtaining high-precision microtextured materials
For this study, an unfilled photopolymer resin is used, which its main component is a commercially available difunctional methacrylate (see Table 3.15) together with the BP8 lithography-based machine developed at TU Wien, using its SLA system (Section 1.1). Since the spot size can be focused with a f-theta lens down to ds= 20 µm, the level of precision offered by using this technology shall be adjusted by choosing the suitable combination of printing parameters and material factors.
On the one hand, we refer as printing parameters to those values that can be set up through the use of a custom-made software provided by Lithoz GmbH and which controls the movement of the mechanical components of the system, by means of a programmable PLC and the galvano-scanner unit, in this case IntelliSCAN14SE (Scanlab GmbH, Puchheim, Germany). These inputs can refer to:
a) Scanner: scanning speed of infill and contour (SI/SO), scanning strategy (SS), offsets, jump, poly and marks which are internal parameters from the RTC®5 PCI Board and refer to delays which are applied when the laser is jumping in/out from one point to the next, creating geometrical polylines or marking the contour (Figure 3.13.a).
b) Laser: laser on (lon), laser off (loff) delays, synchronizing the scanning head and laser control (Figure 3.13.b) and percentage of power (PP).
c) Mechanics: z axis, tilting, calibrating, separation and positioning speed of the building platform and material vat.
Figure 3.13. Example of the parameters involved in the laser scanning (extracted from RTC®5 PCI Board installation and operation guide).
On the other hand, the material factors are those which refer to the adequate formulation of the components that form the photocurable material. In this case, the wt.% in the mixture for the photoinitiator (PI) and the light or photo absorber (LA) needed to ensure a suitable curing depth, from a 100 % of raw methacrylate-based polymer.
a) b)

66
Here, we present just a brief sample of the wide range of control parameters that can be adjusted and which modifications will result on direct quality of the resulted part. Due to the large number of them, we proceed to evaluate only 18 out of them (Table 3.18), by experimenting those parameters which have a remarkable influence on the final result when replicating three dimensional models of microtextures and these effects are easier to quantify.
Table 3.18. Evaluated parameters that have direct influence on the quality of the textures by using BP8 SL-system
Scanner Laser Mechanics Material
Scanning strategy Laser on Z axis speed Photoinitiator (wt.%)
Scanning speed Laser off Tilting speed Light absorber (wt.%)
Offset Power percentage Positioning speed
Jump Beam compensation Calibrating vat speed
Poly Separation speed
Mark
Number of scanners per layer
Regarding the mechanical parameters, the suitable speed for the movements of building platform and vat is set up according the TU Wien AMT laboratory’s criteria, since these values allow to have a reliable printing while maintaining assumable time lapses for an efficient manufacturing. It has to be considered that main effects have direct impact on part stress/strain during the separation of the polymerized layer from the PDMS layer of the vat’s bottom, which can lead to delamination.
Given the interrelation of the parameters, is important to methodically isolate each parameter to adequately quantify the effect and research on the followings according to this fixed point. For that reason, it is prepared a primary formulation with SR 248L as raw material (MSF01) and including PI (0.75 wt.%) and LA (0.20wt.%) that leads to curing depths thicker than 150 µm. This value, based on experience, promotes to an adequate polymerization through adjoining layers and assuring the correct bonding of them when the layer thickness established is 50 µm. Once the material is prepared, we can proceed to set up the values for the scanner and laser by measuring and evaluating controlled test samples in only one layer printed.
In order to illustrate the problem, shows a single layer-exposure (20% PP) of circular sections of different diameters with uniform separation between their centers. From this micrograph, it can be extracted some of the usual effects of a wrong setup of printing parameters: a) Over-polymerization around the contour, b) laser mark due to a not adjusted delay laser on, off and jump parameters and c) distortion of the geometry caused by an inappropriate setting of poly, mark, hatching strategy and/or laser power parameters.

Chapter 3 Materials and experimental methods
67
Figure 3.14. Detail of a single layer-exposure micrograph of circular sections of different diameters (left image) and single-laser hatching-strand (right) of 20 and 100 µm by SL-system of BP8 using a 20% laser-power.
A test sample (Figure 3.15) of 10 mm x 10 mm x 0.8 mm, representative of the main aspects that considered while scanning a layer, was designed to gauge the geometrical fidelity of the resulting single layer-exposure comparing to the corresponding section of the three-dimensional model aimed to replicate depending on the settings. This controlled design includes strands of several lengths (300 - 800 µm) and thicknesses (20 – 180 µm), moreover of properly choose gaps (50 – 300 µm) in between them, that help to check the influence of each parameter and adjust them to get the most precise approximation to the geometry. The upper layer of the test sample is then printed using the MSFO1 in one single exposure and the results are compared with the digital model. When the geometry of the strands is precise enough to consider the validation of that parameter, subsequently the whole part is printed and then the shape and thickness are measured as well. The preliminary studies shed light on the major influences existing between parameters and set the basis of the concepts to follow:
� Laser delays depend directly on the laser speed.
� To facilitate the study the laser speed for the contour and the infill is the same.
� It is desirable to apply a beam compensation for such tiny features.
� The scanning strategies evaluated were: WEAVE, STAR-WEAVE and ACES (Jacobs,
1992), finally setting up the WEAVE scan pattern, drawing vectors in both x (0°)
and y (90°) axis with a hatching separation of 0.020 mm.
� Scanning strategy plays a significant role for higher laser speeds.
It can be seen an example of the evolution achieved by selecting the right values of the mentioned parameters in the Figure 3.16 , starting from a very rough geometrical representation of the test sample full of over-polymerized spots when the parameters are selected by default (Figure 3.16.a), to the refined version obtained for the suitable settings (Figure 3.16.b). Although the figures below are not taken with the same scale and position, the improvement of the geometrical fidelity can be compared. The actual intention here resides in getting an overview and understanding the importance of the selecting the values to the final design of microtextures, rather than a visual inspection of the differences.
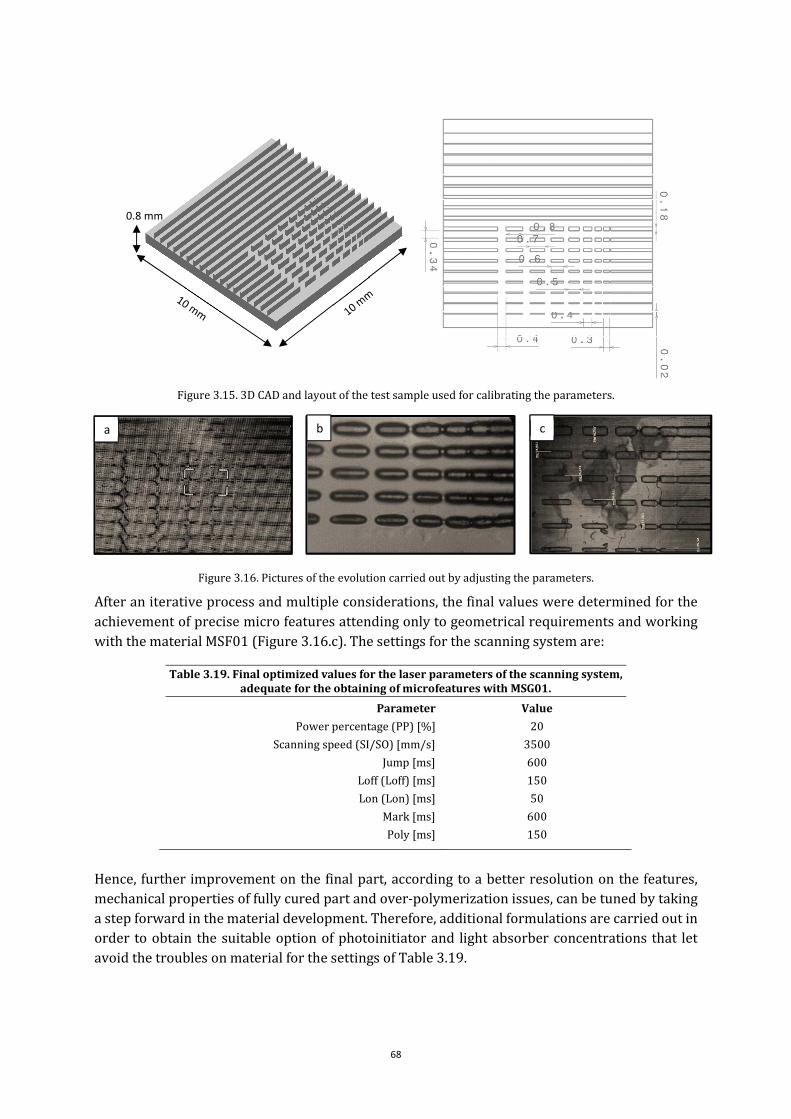
68
Figure 3.15. 3D CAD and layout of the test sample used for calibrating the parameters.
Figure 3.16. Pictures of the evolution carried out by adjusting the parameters.
After an iterative process and multiple considerations, the final values were determined for the achievement of precise micro features attending only to geometrical requirements and working with the material MSF01 (Figure 3.16.c). The settings for the scanning system are:
Table 3.19. Final optimized values for the laser parameters of the scanning system, adequate for the obtaining of microfeatures with MSG01.
Parameter Value
Power percentage (PP) [%] 20
Scanning speed (SI/SO) [mm/s] 3500
Jump [ms] 600
Loff (Loff) [ms] 150
Lon (Lon) [ms] 50
Mark [ms] 600
Poly [ms] 150
Hence, further improvement on the final part, according to a better resolution on the features, mechanical properties of fully cured part and over-polymerization issues, can be tuned by taking a step forward in the material development. Therefore, additional formulations are carried out in order to obtain the suitable option of photoinitiator and light absorber concentrations that let avoid the troubles on material for the settings of Table 3.19.
0.8 mm
a b c

Chapter 3 Materials and experimental methods
69
The variables evaluated are the final shape of the part (dimensions, lengths, thickness, etc.), the state of the material, whether the part is gel or solid, the exceed of resin can be wash out and the microfeatures do not break or detach, the test sample is stiff enough to carry it, clean it and measure it. Given this, it is then created an evaluation based on the researcher experience and resolution expressed in Table 3.20.
Table 3.20. Material formulations evaluated in the study.
Formulation MSF01 MSF02 MSF03 MSF04 MSF05 MSF06 MSF07
Photoinitiator (wt.%) 0.75 0.5 0.5 0.2 0.225 0.75 0.3
Light absorber (wt.%) 2 2 0.2 0.35 0.15 0.5 0.2
Suitable No Yes Yes No Yes No Yes
Evaluation - - * - ** - ***
According to the power dosage, the first formulations include a high amount of LA. However, given the reactivity of the di-functional monomer SR248 L (Table 3.15), the following experiments reduce it 10 times since the polymerization occurs successfully. Thus, the PI wt.% must be adjusted in order to fit the requirements but always with values lower than 1 wt.%. To avoid over-polymerization that can distort the shape of the microfeatures we cannot have geometrical distortion larger than the beam spot, since the dimensions that we present are in the order of microns. For that reason, we look for relatively low reactive formulations that produce highly precise figures while obtaining properties of a fully cured material with enough stiff to handle it, remove it and wash away the exceed of resin. From Table 3.20, it is extracted that the most suitable formulation is MSF07, combining the desired response of the material according to the aforementioned requirements.
Following to the correct mixing of the components that form the ‘self-developed’ material, it is mandatory to study the correct proceeding for the part cleaning, which attempts to obtain a cleaned part and does not be invasive due to the extremely fragility of the microfeatures, moreover if these have a considerable height, to break before the post-curing treatment (Figure 3.17).
Figure 3.17. Micrographs of a textured part with cilindric features of φ150 µm, before (left) and after cleaning (right). Procedure carried for the adequate wash out of exceed resin from the textured surface (up).

70
Below, the results for the test sample using the formulation MSF07 are shown:
Base-plate geometry Strand thickness
Gap lengths Strand lengths
Strand height Base-plate thickness
Figure 3.18. Micrographs of the test sample printed using BP8 laser system and the material MSF07, showing the accurate measure for the features, baseplate, length.
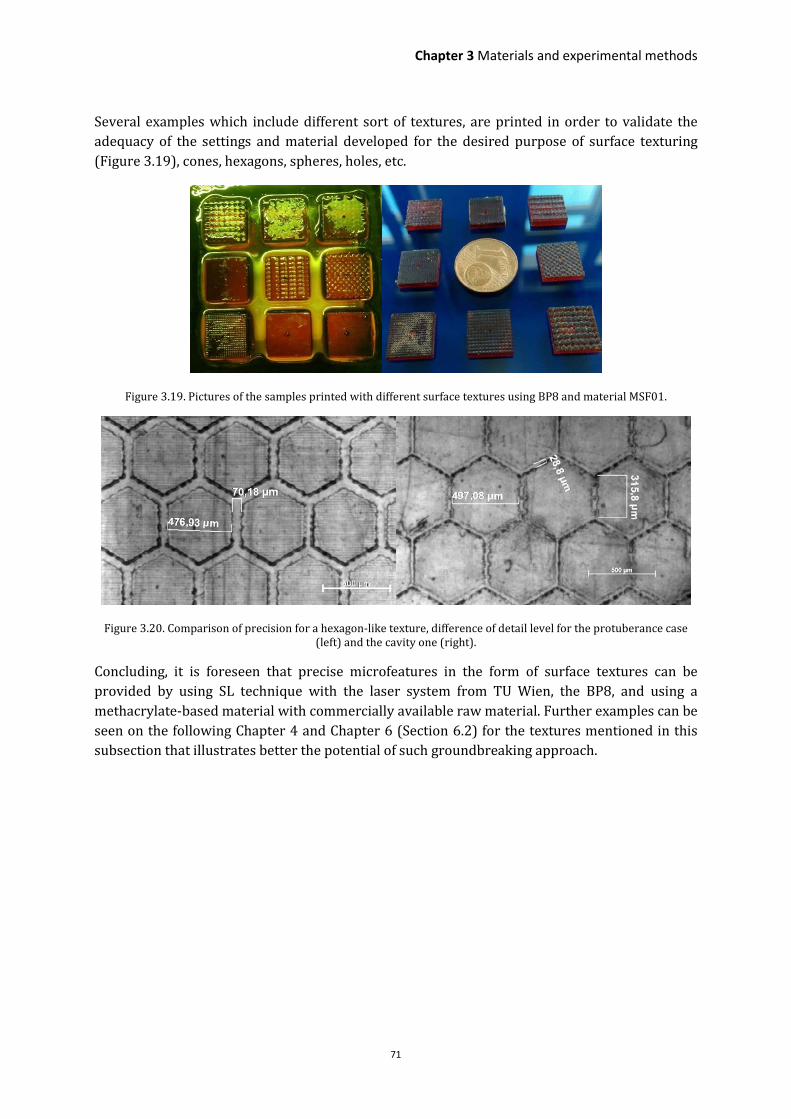
Chapter 3 Materials and experimental methods
71
Several examples which include different sort of textures, are printed in order to validate the adequacy of the settings and material developed for the desired purpose of surface texturing (Figure 3.19), cones, hexagons, spheres, holes, etc.
Figure 3.19. Pictures of the samples printed with different surface textures using BP8 and material MSF01.
Figure 3.20. Comparison of precision for a hexagon-like texture, difference of detail level for the protuberance case (left) and the cavity one (right).
Concluding, it is foreseen that precise microfeatures in the form of surface textures can be provided by using SL technique with the laser system from TU Wien, the BP8, and using a methacrylate-based material with commercially available raw material. Further examples can be seen on the following Chapter 4 and Chapter 6 (Section 6.2) for the textures mentioned in this subsection that illustrates better the potential of such groundbreaking approach.

72
Figure 3.21. Micrographs showing the measured details of cones (up), sphere of different sizes (middle) and holes (bottom).
Determination of technology limits for the SLA ® system
DfAM is one of the most remarkable steps to consider during the manufacturing of a part by additive manufacturing. Each different AM system has its own different parameters and variables to consider. Each AM technology has different processing times, part orientation and building direction which are quite different and they are the most important factors.
Most of the times, the companies prepare their own guidelines in which they notice the possibilities during the printing of the part. This evaluation is related to the maximum cantilever supported, minimum angle from the vertical, minimum thickness (self-supported), etc. Thus, the design is always following the line previously described as a result of the experience.
When new supports structures that optimize the material saving are being designed, it is looked for the manufacturing of lattice structures, microfeatures, internal channels or complex

Chapter 3 Materials and experimental methods
73
geometries, it is necessary to understand which the limits are during the manufacturing of those structures, in order to take the maximum of the technology, making of this approach an efficient in both environmental and economic scopes.
As it is mentioned, each different combination of system and material will suggest different limits. We have to consider factors such as the state of the material used, the building direction (bottom-up vs. up-bottom] and technology (FDM, stereolithography, DLP, SLS, etc.). Those factors in some cases are reflected to the customer as a design guide which allows to know the physical limitation of the process. (i.e. companies like FormlabsTM provide of such guide to allow designers to reach that limit). However, in most of the cases these advices are quite conservative, thus they do not help to reach actual limits. For the case of UPM’s SLA3500 SLA system, we are not provided with a design guide and the study presented in this subsection aims to shed light on the limitations that this ‘up-bottom’ approach has and therefore make an efficient manufacturing of the parts by supporting on the gathered data.
Cantilevers, minimum supporting section and angles.
For that purpose, calibration parts were designed (CP01 and CP02). We have to understand ‘calibration parts’ as simple CAD models that will help us to understand the behaviour during and post manufacturing. In a first approximation, the variable which are more interesting to evaluate are related to the minimum support thickness, angle (α) and maximum area (effect of gravity on the self-part weight). On this way, simple designs which will include supports and supported parts are created by CAD software. As easier the parts are, fewer conditions have to be considered.
Therefore, the supported parts will be squares with known dimensions (x). Currently, is considered (as a rule of thumb) that the surface that can be non-supported is around 20-30 mm2, depending on the thickness which is also tested by comparing different values. It should be case of study, the influence of the thickness when those are quite thin, considering the structural stiffness too weak to get a suitable adhesion to the pillars and subsequently collapse of the structure. However, the effect of the own weight is remarkable for the structures and the volumetric forces are also considered depending on the construction technique. Thereby, we build squares of 10x10, 12x12 and 15mm side whose side will also the way to measure maximum cantilever between two contact points. Then 100/144/225mm2 have to be supported by 4 cylinders in the corners in angle which are attached to the bottom in the same spot. Therefore, the efforts are shared with the 4 structures, supporting a quarter of the part.
Two models were created (CP01 and CP02), these models are assembly parts which include calibration parts, varying one variable each prototype. On this way, it is possible to control the variable that could fail during manufacturing. First, CP01 was printed and it could be appreciated how the calibration parts with smaller areas and cantilevers did not show any failure, supporting the cylinder the whole weight without deformation. Diameters of 1 mm were far way to collapse and structures with 800 µm and area of 144 mm2 presented slight concavity that can be considered due to the light refraction and the bubble effect on the surface.
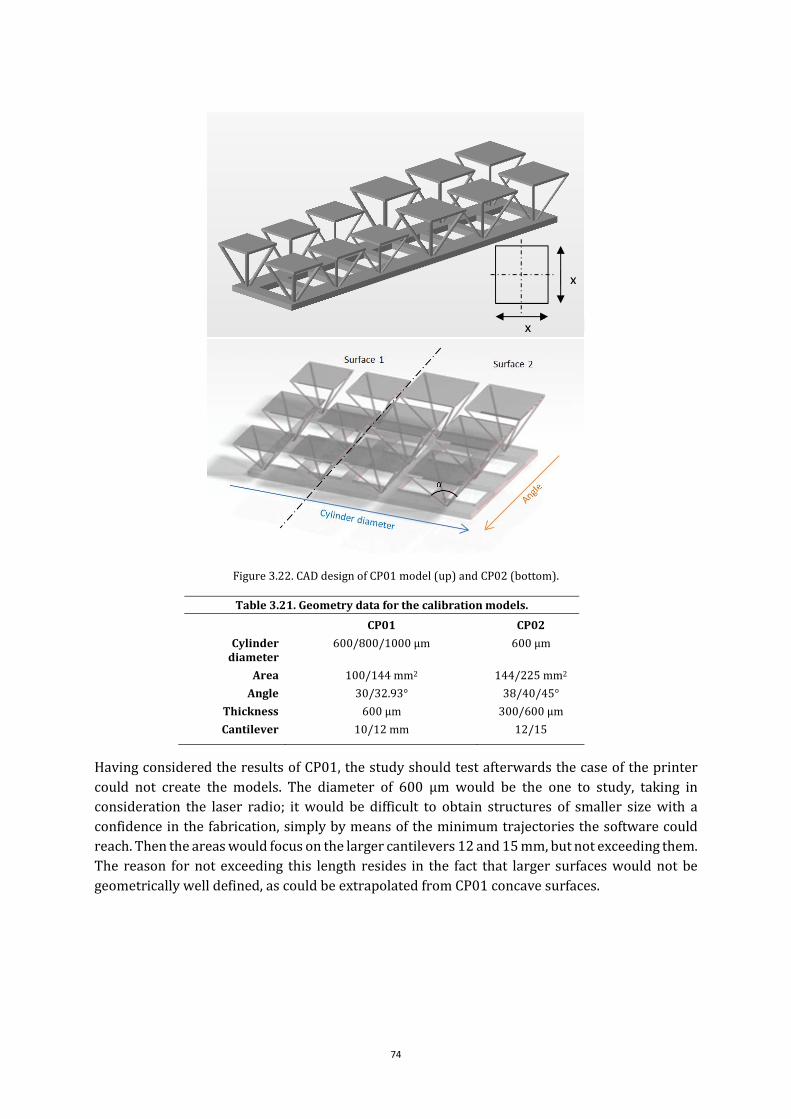
74
Figure 3.22. CAD design of CP01 model (up) and CP02 (bottom).
Table 3.21. Geometry data for the calibration models.
CP01 CP02
Cylinder diameter
600/800/1000 µm 600 µm
Area 100/144 mm2 144/225 mm2
Angle 30/32.93° 38/40/45°
Thickness 600 µm 300/600 µm
Cantilever 10/12 mm 12/15
Having considered the results of CP01, the study should test afterwards the case of the printer could not create the models. The diameter of 600 µm would be the one to study, taking in consideration the laser radio; it would be difficult to obtain structures of smaller size with a confidence in the fabrication, simply by means of the minimum trajectories the software could reach. Then the areas would focus on the larger cantilevers 12 and 15 mm, but not exceeding them. The reason for not exceeding this length resides in the fact that larger surfaces would not be geometrically well defined, as could be extrapolated from CP01 concave surfaces.
x
x

Chapter 3 Materials and experimental methods
75
Figure 3.23. CP01 part printed using SLA3500 and Accura 60®.
The calibration model CP02 was also printed and how it could be expected some figures collapsed. Those were the parts with 300 µm thickness and a surface area of 225 mm2, thus a cantilever of 15 mm. The layers of the square were not even attached to the support structures. However, the next row to the right with 600 microns although they have completely lost the shape and geometry, at least they are still attached to the structure after manufacturing. Possibly, these last keep on the structure due to a lighter contribution over the same zone and higher weight that helps to the layer to be seated on the support points.
For the rest of calibration parts, it could be extrapolated that angles of 45° keeps the shape and its functionality when they support areas of 144 mm2. When supports form 38° with the vertical axis the reliability increases for smaller areas and they even can support difficultly the larger ones but the shape is as shown in Figure. X not correct due to efforts on it.
Figure 3.24. CP01 part printed using SLA3500 and Accura 60®.
To conclude the Table 3.22 summarizes the effect studied during the research is provided. Although, it cannot be taken as definitive the results here presented, since they are not based on a large sample, we can provide of some guidance upon the preparation of designs like those presented in the study which include weak structures standing as cantilevers.

76
Table 3.22. Summary of the data gathered regarding the manufacturing of parts CP01 and CP02 by the SLA3500 system
CP01 Surface area of 100 mm2 Surface area of 144 mm2
Diameter Φ 600 µm
Φ 800 µm
Φ 1000 µm
Φ 600 µm Φ 800 µm Φ
1000 µm
Angle 30° ⃝ X ⃝ 30° X ⃝ X
32,9° ⃝ ⃝ X 32,9° ⃝ ⃝ ⃝
Thickness 600 µm 600 µm
CP02 Surface area of 144 mm2 Surface area of 225 mm2
Diameter Φ 600 µm Φ 600 µm
Angle
38° X ≈ 38° X X
40° ⃝ ⃝ 40° X X
45° ⃝ ⃝ 45° X X
Thickness 300 µm 600 µm 300 µm 600 µm
Evaluation of internal channels
Since many studies have been done for µSL-manufactured parts we present now a new study that shed light on the printing of microchannels by stereolithography (SLA). The geometries are embedded microchannels of 400 µm, 600 µm, 800 µm, 1000 µm and 1200 µm.
Two types of embedded micro-channels are tested. A) Are channels in a test part of rectangular section. B) The test parts have less material due to the cross section keeps the shape of the channels seeming wave structures. The reason why two prototypes were studied is because of the need to understand the influence of the excess of material during the definition of such smaller geometries.
Figure 3.25. Pictures of the test sample with different section approaches.
A)
B)
A)
B)
Building direction
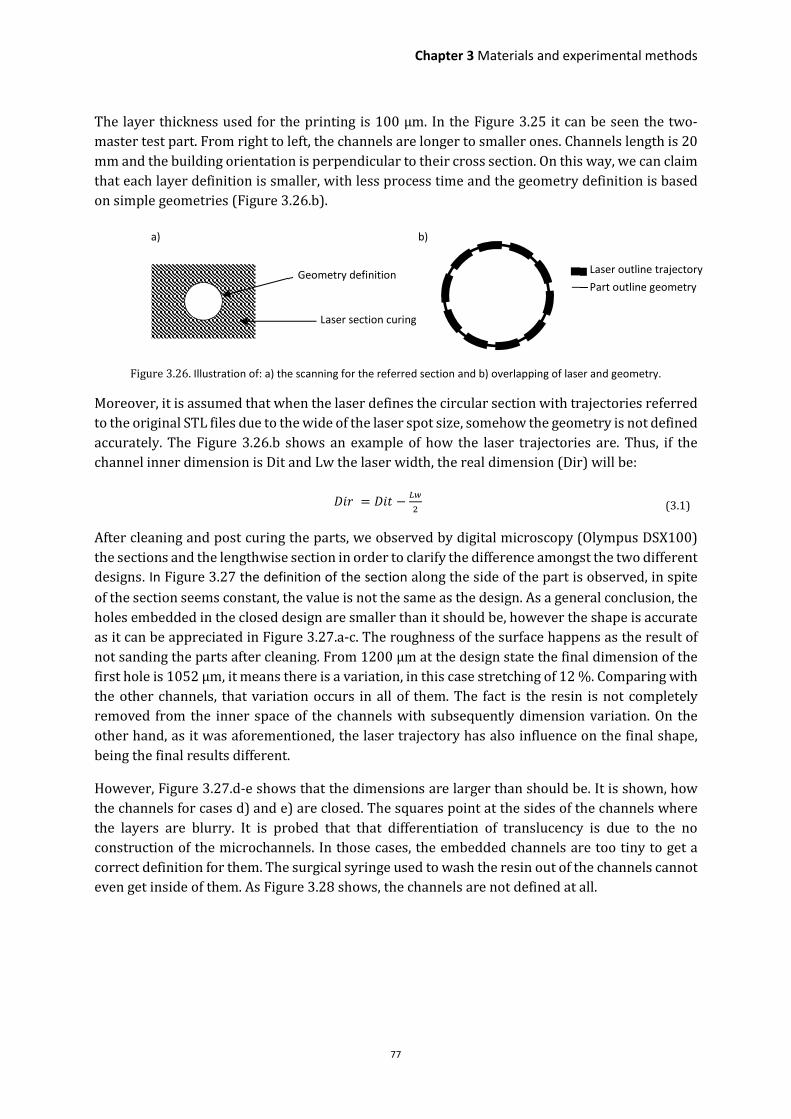
Chapter 3 Materials and experimental methods
77
The layer thickness used for the printing is 100 µm. In the Figure 3.25 it can be seen the two-master test part. From right to left, the channels are longer to smaller ones. Channels length is 20 mm and the building orientation is perpendicular to their cross section. On this way, we can claim that each layer definition is smaller, with less process time and the geometry definition is based on simple geometries (Figure 3.26.b).
Figure 3.26. Illustration of: a) the scanning for the referred section and b) overlapping of laser and geometry.
Moreover, it is assumed that when the laser defines the circular section with trajectories referred to the original STL files due to the wide of the laser spot size, somehow the geometry is not defined accurately. The Figure 3.26.b shows an example of how the laser trajectories are. Thus, if the channel inner dimension is Dit and Lw the laser width, the real dimension (Dir) will be:
��� � ��� � � (3.1)
After cleaning and post curing the parts, we observed by digital microscopy (Olympus DSX100) the sections and the lengthwise section in order to clarify the difference amongst the two different designs. In Figure 3.27 the definition of the section along the side of the part is observed, in spite
of the section seems constant, the value is not the same as the design. As a general conclusion, the holes embedded in the closed design are smaller than it should be, however the shape is accurate as it can be appreciated in Figure 3.27.a-c. The roughness of the surface happens as the result of not sanding the parts after cleaning. From 1200 µm at the design state the final dimension of the first hole is 1052 µm, it means there is a variation, in this case stretching of 12 %. Comparing with the other channels, that variation occurs in all of them. The fact is the resin is not completely removed from the inner space of the channels with subsequently dimension variation. On the other hand, as it was aforementioned, the laser trajectory has also influence on the final shape, being the final results different.
However, Figure 3.27.d-e shows that the dimensions are larger than should be. It is shown, how the channels for cases d) and e) are closed. The squares point at the sides of the channels where the layers are blurry. It is probed that that differentiation of translucency is due to the no construction of the microchannels. In those cases, the embedded channels are too tiny to get a correct definition for them. The surgical syringe used to wash the resin out of the channels cannot even get inside of them. As Figure 3.28 shows, the channels are not defined at all.
Geometry definition
Laser section curing
Laser outline trajectory Part outline geometry
a) b)

78
Figure 3.27. Micrographs of the inner channels for the closed sample fabricated using SLA3500 and Accura®60, profile (upper images) and top face (bottom images).
Figure 3.28. Picture of both samples after manufacturing.
Same steps to check the opened design (wave shape). In this case, as the figure above shows, the smaller channels are neither defined. In Figure 3.29 there are some bubbles trapped. The opened one has a better definition of the bigger channels; it means that 1200 µm, 1000 µm are more precise than the first case. The cross section is more constant along the length of the channels with less blurred layers. However, in spite of those advantages, there is an issue when smaller channels are created. The thinner thickness of the design which is above the channel cannot be auto-supported. Thus, after some layers, the arch collapses and this resin goes to the inside section. Therefore, the bubbles trapped in Figure 3.29 for the smaller channels appear. Nevertheless, in the second case all the channels entrances are perfectly defined and the syringe can even get inside at least 500 µm.
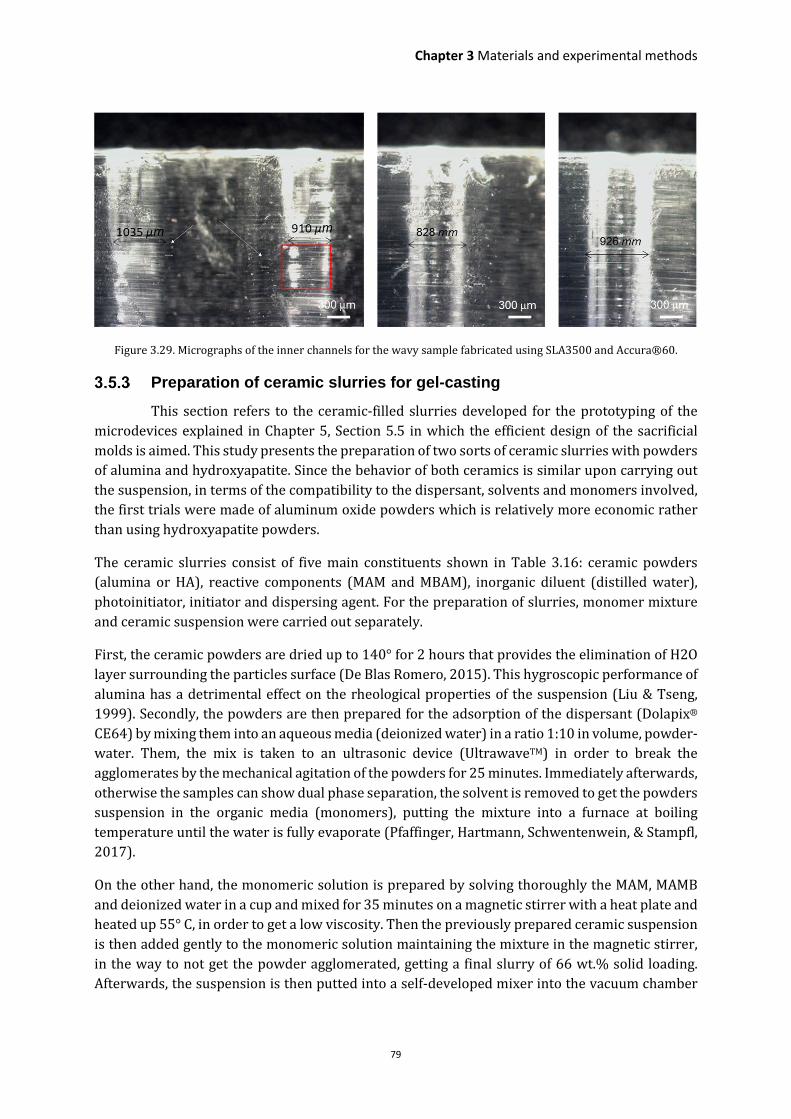
Chapter 3 Materials and experimental methods
79
Figure 3.29. Micrographs of the inner channels for the wavy sample fabricated using SLA3500 and Accura®60.
Preparation of ceramic slurries for gel-casting
This section refers to the ceramic-filled slurries developed for the prototyping of the microdevices explained in Chapter 5, Section 5.5 in which the efficient design of the sacrificial molds is aimed. This study presents the preparation of two sorts of ceramic slurries with powders of alumina and hydroxyapatite. Since the behavior of both ceramics is similar upon carrying out the suspension, in terms of the compatibility to the dispersant, solvents and monomers involved, the first trials were made of aluminum oxide powders which is relatively more economic rather than using hydroxyapatite powders.
The ceramic slurries consist of five main constituents shown in Table 3.16: ceramic powders (alumina or HA), reactive components (MAM and MBAM), inorganic diluent (distilled water), photoinitiator, initiator and dispersing agent. For the preparation of slurries, monomer mixture and ceramic suspension were carried out separately.
First, the ceramic powders are dried up to 140° for 2 hours that provides the elimination of H2O layer surrounding the particles surface (De Blas Romero, 2015). This hygroscopic performance of alumina has a detrimental effect on the rheological properties of the suspension (Liu & Tseng, 1999). Secondly, the powders are then prepared for the adsorption of the dispersant (Dolapix® CE64) by mixing them into an aqueous media (deionized water) in a ratio 1:10 in volume, powder-water. Them, the mix is taken to an ultrasonic device (UltrawaveTM) in order to break the agglomerates by the mechanical agitation of the powders for 25 minutes. Immediately afterwards, otherwise the samples can show dual phase separation, the solvent is removed to get the powders suspension in the organic media (monomers), putting the mixture into a furnace at boiling temperature until the water is fully evaporate (Pfaffinger, Hartmann, Schwentenwein, & Stampfl, 2017).
On the other hand, the monomeric solution is prepared by solving thoroughly the MAM, MAMB and deionized water in a cup and mixed for 35 minutes on a magnetic stirrer with a heat plate and heated up 55° C, in order to get a low viscosity. Then the previously prepared ceramic suspension is then added gently to the monomeric solution maintaining the mixture in the magnetic stirrer, in the way to not get the powder agglomerated, getting a final slurry of 66 wt.% solid loading. Afterwards, the suspension is then putted into a self-developed mixer into the vacuum chamber

80
(MCP vacuum casting system) to deair it for other 20 minutes, otherwise the bubbles lead to form internal defects in the final part. The initiator is then added and the mix is again mixed for another 20 minutes more. After the ceramic suspensions are prepared, these are dropped in the sacrificial molds (see Chapter 5, Section 5.5) and then finally deaired in the same system for 2 minutes. Hence, the suspension is heated in the molds and kept into the furnace (TOP 60, Babertherm®, Germany) for an hour at 60° C, in order to polymerize the monomers and the left it to reach room temperature. Once the green body is stabilized the only the molds which contain HA slurry are then move to a step further for debinding and sintering. Here, the importance of a slow treatment in order to avoid thermal expansion mismatch of material is critical. Therefore, the temperature is elevated very slowly in the range between the room temperature and 730° C, which is the burning temperature of the CastableTM resin from Formlabs (see Section 1.4). Given that the ramps for debinding the mold burning and organic matrix differ, it is developed a third graph that combines the required ramps for different materials. Since the debinding curve is highly more restrictive, because it presents a slower heating ramp, this is taken for the range up to 385° C, point at which the organic binding matrix is fully burnt after keeping it at this temperature for two hours. Then, the curve takes the ramp of the CastableTM resin and the mold is kept for 2 hours at 732° C. After this step the mold is burnt out and the remaining material is only ceramic. Thus, the sintering temperature must be reached quickly, in this case at maximum furnace ramp of 7.63° C/min up to 1100° C for 2 hours. Finally, the cooling process is accomplished slowly and carefully.
Figure 3.30. Temperature profile for debinding and sintering of the hydroxyapatite green bodies
In the Figure 3.30, the curve used for the debinding and sintering the of HA-green body is presented (optimized slow curve). It is based on a sintering ramp for an alumina slurry of approximately 45 % solid loadings (Al2O3) and the firing curve for the CastableTM resin. Also, another variation which was attempted is presented (fast optimized curve reaching 1000°C). This alternative was considered in order to reduce dramatically the time and energy employed for the firing process. However, the resulting part show larger crack and deformation due to the high impact of thermal distortion and gas evacuation. The results of the HA part can be checked in Chapter 5, Section 5.5.
0
400
800
1200
1600
0 5 10 15 20 25 30 35
Tem
pe
ratu
re (
°C)
Time (h)
Castable
Al2O3
Optimized fast
Optimized slow

Chapter 3 Materials and experimental methods
81
3.6 References of this chapter
B
Bártolo, P. J. (2011). Stereolithography: Materials, Processes and Applications. Springer Science & Business Media.
De Blas Romero, A. (2015). Optimization of photocurable zirconia slurries (J. Stampfl & A. Díaz Lantada (advisors))). TU
Wien & Technical University of Madrid.
F
Felzmann, R., Gruber, S., Mitteramskogler, G., Tesavibul, P., Boccaccini, A. R., Liska, R., & Stampfl, J. (2012). Lithography-
Based Additive Manufacturing of Cellular Ceramic Structures. Advanced Engineering Materials, 14(12), 1052–
1058.
G
Gardan, J. (2016). Additive manufacturing technologies: state of the art and trends. International Journal of Production
Research, 54(10), 3118–3132.
H
Homa, J, Zellhofer, S., & Stampfl, J. (2009). Solid free form fabrication of silicon carbide cross flow filters. Journal of
Ceramic Processing Research, 10, 25–32.
Homa, Johannes, & Schwentenwein, M. (2014). A Novel Additive Manufacturing Technology for High-Performance
Ceramics. In T. Ohji, M. Singh, & Sanjaythur (Eds.), Advanced Processing and Manufacturing Technologies for
Nanostructured and Multifunctional Materials (pp. 33–40). John Wiley & Sons, Inc.
Hull C. W. (1984, August 8). US4575330.
J
Jacobs, P. F. (1992). Rapid Prototyping & Manufacturing: Fundamentals of Stereolithography. Society of Manufacturing
Engineers.
L
Liska, R., Patzer, J., Stampfl, J., Wachter, W., & Appert, C. (2010, April 30). WO2010045951.
Liu, D.-M., & Tseng, W. J. (1999). Influence of Powder Agglomerates on the Structure and Rheological Behavior of
Injection-Molded Zirconia–Wax Suspensions. Journal of the American Ceramic Society, 82(10), 2647–2652.
M
Mitteramskogler, G., Gmeiner, R., Felzmann, R., Gruber, S., Hofstetter, C., Stampfl, J., … Laubersheimer, J. (2014). Light
curing strategies for lithography-based additive manufacturing of customized ceramics. Additive
Manufacturing, 1–4, 110–118.
82
P
Pfaffinger, M., Hartmann, M., Schwentenwein, M., & Stampfl, J. (2017). Stabilization of tricalcium phosphate slurries
against sedimentation for stereolithographic additive manufacturing and influence on the final mechanical
properties. International Journal of Applied Ceramic Technology, 14(4), 499–506.
S
Stampfl, J., & Liska, R. (2011). Polymerizable Hydrogels for Rapid Prototyping: Chemistry, Photolithography, and
Mechanical Properties. In Stereolithography (pp. 161–182). Springer, Boston, MA.
https://doi.org/10.1007/978-0-387-92904-0_7
w
Waheed, S., M. Cabot, J., P. Macdonald, N., Lewis, T., M. Guijt, R., Paull, B., & C. Breadmore, M. (2016). 3D printed
microfluidic devices: enablers and barriers. Lab on a Chip, 16(11), 1993–2013.

Chapter 4 Computational modeling of complex geometries for additive
manufacturing technologies


Chapter 4 Computational modeling of complex geometries
85
COMPUTATIONAL MODELING OF COMPLEX GEOMETRIES FOR ADDITIVE MANUFACTURING TECHNOLOGIES
The possibility of designing and additively manufacturing products with porous or lattice structures, with inner details, with intricate surface topographies, with cantilevers and other extremely complex (or even impossible) features, from the perspective of traditional subtractive manufacturing approaches, is reshaping product design. Such complex shapes help to incorporate new functionalities, to optimize the strength-density ratio, to adjust the mechanical, thermal and fluidic performances, to modify aesthetic and ergonomic aspects and to personalize products. There is also a clear potential in terms of applying AM to the promotion of eco-efficient product development. These AM resources are promoting a gradual shift from mass-production to mass-customization and opening new horizons in fundamental fields including: transport and aerospace industries, energy and environmental engineering, automation and production technologies, biomedical engineering and health, architecture and art, conventional product development among others. In the different stages of the presented research, the designs of porous and lattice geometries, of textured surfaces, of support geometries, of test probes and of final applications are obtained in different materials using the different technologies available within the ToMax project consortium. Typically, in a first approach, low-cost (Form1+) and production printer (SLA-3500) laser stereolithography systems are used for rapidly manufacturing sets of polymeric (epoxy/acrylates-based resin) parts with systematic design variations for validation purposes. Once a design process or potential application is successfully validated, more precise ceramic parts for enhanced performance are manufactured by means of LCM (using the CeraFab 7500).
The use of different materials and processes helps to methodically characterize, assess and compare relevant engineering properties and features attainable with some of the more advanced geometry-material-technology triads available in the field of lithography-/laser-based additive manufacturing. Laser stereolithography is used as a possible viable industrial option and lithography-based ceramic manufacture as the more relevant technology to the purposes of ToMax project. The limits of both technologies are explored and compared, as well as expanded thanks to special design and modeling procedures, which constitutes the main purpose of UPM’s participation in the “Toolless manufacture of complex geometries” EU Horizon 2020 Project.
Computer-aided design, initially developed for architecture, the automobile industry and aeronautics, is currently an essential resource in any product development project and very valuable for the current advances in several industries. The math-based curves and surfaces typical of CAD software (planes, cylinders, spheres, prisms, splines, Bezier curves and surfaces, among others) can be combined using Boolean operations for constructing complex geometries, even though sometimes it is challenging to model the complexity of novel products with

86
integrated functionalities, with improved ergonomics and aesthetics and even with bioinspired designs. In spite of their limitations for the design of complex geometries, which they have been tried to overcome within ToMax project, CAD resources are now widely used for the development of advanced products, as they enhance communication among the research teams developing novel products, promote in silico validation, by means of multi-physical simulations, encourage automated manufacture approaches and help with production setup. Attention-grabbing designs with the incorporation of systematic variations for methodical assessments can be obtained, thanks to the use of parameter-based operations, of combinations of solid- and surface-based tools, of pattern operations and of Boolean tools, in just some hours.
Controlling bulk properties from the design stage: Design and modeling of lattice and porous structures
Designing porous and lattice structures using CAD software resources can be a straightforward and basic task, since the operations needed for such aim are not complicate if they arere adequately combined. These geometries can lead to: a) optimize the mechanical performance of materials, structures and devices by means of a controlled design of the mechanical, thermal, fluidic and density properties and of their mutual relations; b) improve eco-efficient design approaches by achievement of an optimal ratio between mechanical performance and part mass; c) advance in the fields of smart materials and structures and of mechanical metamaterials, by designing mass distribution at the micro- and even nano-metric level for special interactions with matter and energy (Lantada, 2016). The process, for the design of lattice structures, normally includes combination of solid operations (cylinders, piles…) for obtaining a unit cell and pattern or periodic replication of such solids and unit cells. Intersecting the obtained lattice with the more conventional solid geometries of existing or new designs leads to final device. In the case of porous structures, the process could turn to subtractive. From the basis of a determined volume (e.g. cubic cell) some other geometries which will be the porous are added to the design, as cubes or spheres. In some cases, it is necessary to design a network of interconnecting channels between such pores (in case they do not intersect), so as to enable their manufacture and inner material removal following additive manufacturing procedures. The porous structure (or even the metamaterial) obtained can additionally be intersected with the geometry of a solid object, for finally obtaining a porous geometry. Both processes are schematized in Figure 4.1 included below.
Although modules that incorporate patterned truss and lattice-like geometries exists already in the conventional CAD software resources, and for applying pores to solid objects, as well as Boolean operations for applying an outer geometry to a lattice structure, novel CAD resources are being specifically developed for promoting the application of metamaterials to product development. Among ad hoc CAD software oriented to the design of lattice and porous structures, for improved control of aspects such as density, stiffness and resistance of final geometries, recent advances in topological optimization, a mathematical approach that optimizes material layout within a given design space, for a defined set of loads and boundary conditions, are also helpful for deriving into lattice and porous structures and progressively being incorporated to conventional CAD resources (Bendsoe, 2003, Schramm, 2006).

Chapter 4 Computational modeling of complex geometries
87
Figure 4.1. Schematic processes for designing devices with lattice and porous structures (adapted from: (Diaz Lantada,
A. 2016).
Design and manufacture of homogeneous porous and lattice geometries
Focusing on the more industrially available (when compared to specific solutions such as NetFabb® or 3-Matic®) step-by-step CAD process, Figure 4.2 shows a lattice structure design example starting from a cylinder, which is replicated several times for obtaining a layer of cylinders, layer that is subsequently rotated, translated and copied for constructing a solid lattice or porous structure. Final combination of the geometries by means of a Boolean operation leads to a unique solid part, which can be modelled for in silico assessment (typically employing finite-element method) and converted into universal (i.e. STL, AMF, etc.) files for direct manufacturing using additive approaches. In fact, the design obtained here is very similar to some commercial solutions from manufacturers such as 3D Biotek, with application in the field of tissue engineering and regenerative medicine and obtained using rapid prototyping approaches based on additive manufacturing technologies. It is important to remark that such a design can be created in with state-of-the-art CAD resources and, if the parametric design tools available in most of these resources are used, a whole series of designs, with different pore sizes, distributions and mechanical features, can be achieved in just some hours. Such efficiency illustrates of the importance and versatility of these computer-aided technologies for promoting all kind of projects linked to the development of novel devices with complex geometries.
Figure 4.2. Three-dimensional lattice structure obtained using an additive design procedure.
Figure 4.3 shows an alternative option for porous structures, in this case again oriented to obtaining complex geometries for enhanced performance in fields such as transport, energy and health. In this case, the design process starts from a simple sphere replicated in normal directions forming a grid on the XY plane, thus obtaining a layer of spheres, which is subsequently copied and replicated several times along the vertical direction, for obtaining a 3D cube full of spheres. Final part is achieved by subtracting the set of spheres from a cube directly using a Booleans.
Design of unit cell
Periodic replication
Design of solid object
Boolean operation
Solid object Type of pore Periodic pore distribution
Boolean operation
PATH A)
PATH B)
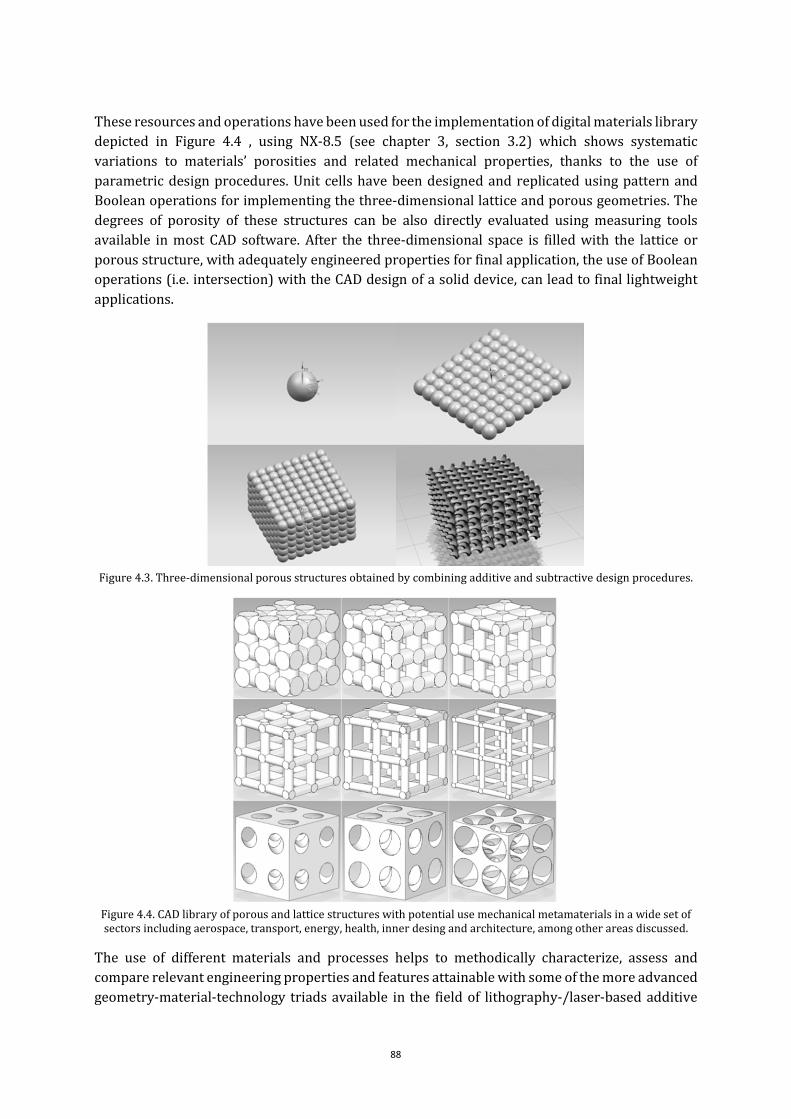
88
These resources and operations have been used for the implementation of digital materials library depicted in Figure 4.4 , using NX-8.5 (see chapter 3, section 3.2) which shows systematic variations to materials’ porosities and related mechanical properties, thanks to the use of parametric design procedures. Unit cells have been designed and replicated using pattern and Boolean operations for implementing the three-dimensional lattice and porous geometries. The degrees of porosity of these structures can be also directly evaluated using measuring tools available in most CAD software. After the three-dimensional space is filled with the lattice or porous structure, with adequately engineered properties for final application, the use of Boolean operations (i.e. intersection) with the CAD design of a solid device, can lead to final lightweight applications.
Figure 4.3. Three-dimensional porous structures obtained by combining additive and subtractive design procedures.
Figure 4.4. CAD library of porous and lattice structures with potential use mechanical metamaterials in a wide set of sectors including aerospace, transport, energy, health, inner desing and architecture, among other areas discussed.
The use of different materials and processes helps to methodically characterize, assess and compare relevant engineering properties and features attainable with some of the more advanced geometry-material-technology triads available in the field of lithography-/laser-based additive

Chapter 4 Computational modeling of complex geometries
89
manufacturing. Laser stereolithography is used as industrial option for mass production and lithography-based ceramic manufacture (LCM from Lithoz GmbH) as the more relevant technology to the purposes of ToMax project. The limits of both technologies are explored and compared, as well as expanded thanks to special design and modeling procedures. Figure 4.5 shows the rapid prototypes of porous and lattice structures obtained in epoxy resin by the reference additive manufacturing process of laser stereolithography (Form1+ - Formlabs), which is used to check printability before proceeding with LCM.
Figure 4.5. Rapid prototypes of porous and lattice structures obtained in epoxy resin by the reference additive manufacturing process of laser stereolithography Form1+ (Images courtesy of PDL).
More systematic libraries can be accomplished by methodical variations of the sizes of the different unit cells, of the thicknesses of the different trusses and of the pore distributions, as shown in the following Table 4.1, which contain examples of same truss thickness for three different sizes of the unit cell, 10mm, 20mm and 30 mm respectively.
Figure 4.6 shows the influence of unit cell size and bar thickness on the porosity of the lattice structures from Table 4.1, after carrying out such evaluations with the help of length, area and volume measurement. These graphical representations of relevant properties may help to select the most satisfactory lattice geometries for repairing or regenerating the different portions and tissues of interest. They are also helping to encourage the use of biomimetic design strategies and selection tasks.
The systematic CAD libraries of porous geometries and lattice networks can be further developed by changing the types of structures used, the pore distributions, the angles between the trusses conforming the lattices, the complexity of unit cells, among other options. Table 4 shows some alternatives, just as an example of the endless design strategies available towards isotropic lattice networks and porous geometries. Anisotropic structures are also possible as discussed in following subsection 4.1.2. Such control of matter in a complex and precise way is enabled by means of advanced additive manufacturing resources and promotes additional applications in numerous fields and the use of biomimetic or bioinspired design approaches, as the materials and structures from biological origin clearly benefit from their functional gradients of properties, thanks to their optimal distributions of density and to their being structured following multi-scale approaches (i.e. from cells to tissues, from tissues to organs, from organs to systems, from systems to life), driven by evolution as manager of multi-objective optimizations (Dawkins, 2015).
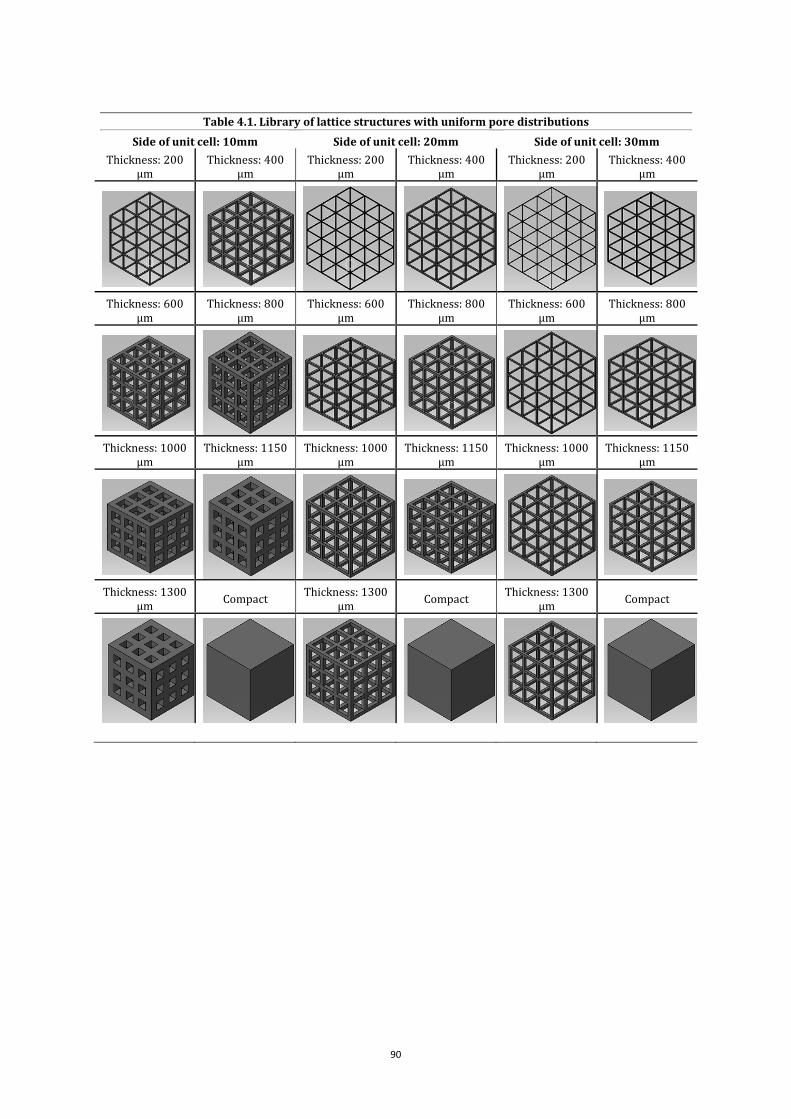
90
Table 4.1. Library of lattice structures with uniform pore distributions
Side of unit cell: 10mm Side of unit cell: 20mm Side of unit cell: 30mm
Thickness: 200 μm
Thickness: 400 μm
Thickness: 200 μm
Thickness: 400 μm
Thickness: 200 μm
Thickness: 400 μm
Thickness: 600 μm
Thickness: 800 μm
Thickness: 600 μm
Thickness: 800 μm
Thickness: 600 μm
Thickness: 800 μm
Thickness: 1000 μm
Thickness: 1150 μm
Thickness: 1000 μm
Thickness: 1150 μm
Thickness: 1000 μm
Thickness: 1150 μm
Thickness: 1300 μm
Compact Thickness: 1300
μm Compact
Thickness: 1300 μm
Compact

Chapter 4 Computational modeling of complex geometries
91
Figure 4.6. Influence of cell size and bar thickness on the porosity of lattice structures.
Table 4.2. Library of lattice structures with different morphologies for additional versatility (Unit cell side: 30mm)
Structure with spherical pores Lattice with crossed trusses
Lattice made of truncated hexahedrons Lattice made of triangular trusses
Design and manufacture of functionally graded porous and lattice geometries
The structure and density distribution of advanced materials and structures, with application to the development of novel devices for innovating in several industrial sectors, can be controlled with the use of state of the art computer-aided design resources. The process, for designing lattice and porous structures has been previously detailed and normally includes combination of solid operations (cylinders, piles, spheres…) for obtaining a unit cell. Subsequently, a pattern operation or a periodic replication of such solids and unit cells leads to a 3D portion of the space being filled with the desired lattice structure. Intersecting the obtained lattice with a solid device leads to the final appliance with controlled inner structure. In the case of porous structures, the process instead of additive it can be performed in a subtractive way. It
10
20
30
75,0077,0079,0081,0083,0085,0087,0089,0091,0093,0095,0097,0099,00
0,200
0,400
0,600
0,800
Cell size (mm)
Por
osit
y (%
)
Truss thickness (mm)
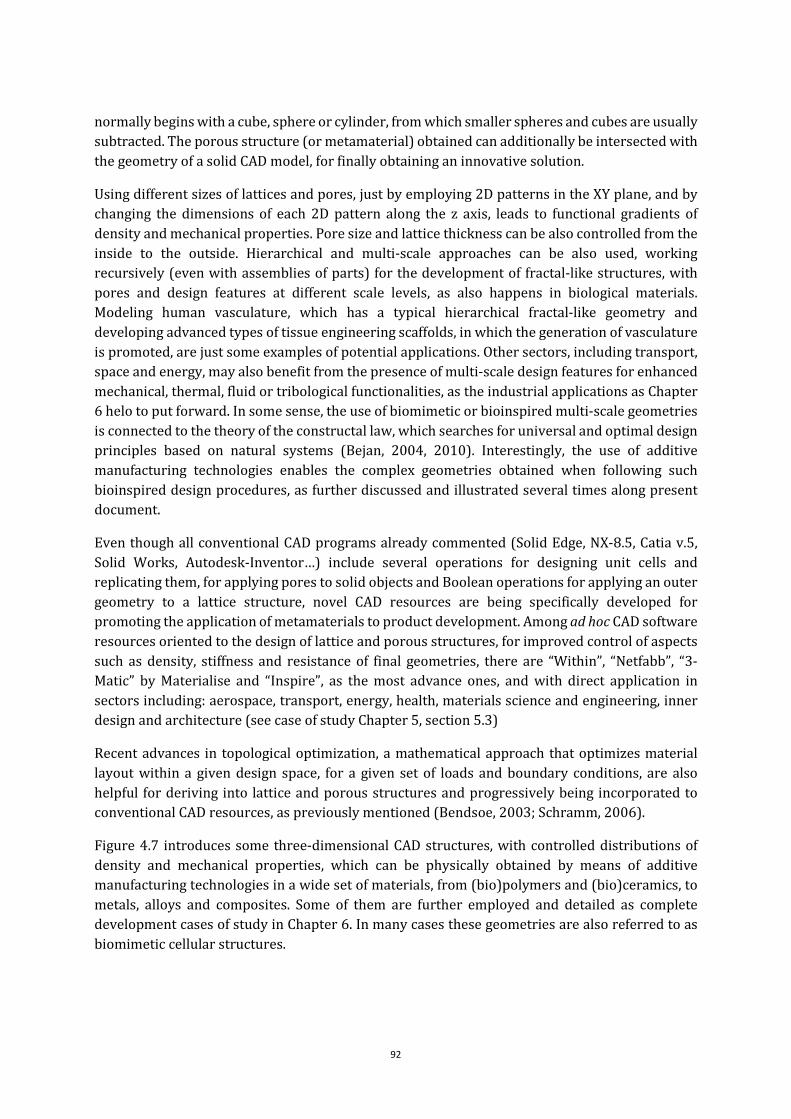
92
normally begins with a cube, sphere or cylinder, from which smaller spheres and cubes are usually subtracted. The porous structure (or metamaterial) obtained can additionally be intersected with the geometry of a solid CAD model, for finally obtaining an innovative solution.
Using different sizes of lattices and pores, just by employing 2D patterns in the XY plane, and by changing the dimensions of each 2D pattern along the z axis, leads to functional gradients of density and mechanical properties. Pore size and lattice thickness can be also controlled from the inside to the outside. Hierarchical and multi-scale approaches can be also used, working recursively (even with assemblies of parts) for the development of fractal-like structures, with pores and design features at different scale levels, as also happens in biological materials. Modeling human vasculature, which has a typical hierarchical fractal-like geometry and developing advanced types of tissue engineering scaffolds, in which the generation of vasculature is promoted, are just some examples of potential applications. Other sectors, including transport, space and energy, may also benefit from the presence of multi-scale design features for enhanced mechanical, thermal, fluid or tribological functionalities, as the industrial applications as Chapter 6 helo to put forward. In some sense, the use of biomimetic or bioinspired multi-scale geometries is connected to the theory of the constructal law, which searches for universal and optimal design principles based on natural systems (Bejan, 2004, 2010). Interestingly, the use of additive manufacturing technologies enables the complex geometries obtained when following such bioinspired design procedures, as further discussed and illustrated several times along present document.
Even though all conventional CAD programs already commented (Solid Edge, NX-8.5, Catia v.5, Solid Works, Autodesk-Inventor…) include several operations for designing unit cells and replicating them, for applying pores to solid objects and Boolean operations for applying an outer geometry to a lattice structure, novel CAD resources are being specifically developed for promoting the application of metamaterials to product development. Among ad hoc CAD software resources oriented to the design of lattice and porous structures, for improved control of aspects such as density, stiffness and resistance of final geometries, there are “Within”, “Netfabb”, “3-Matic” by Materialise and “Inspire”, as the most advance ones, and with direct application in sectors including: aerospace, transport, energy, health, materials science and engineering, inner design and architecture (see case of study Chapter 5, section 5.3)
Recent advances in topological optimization, a mathematical approach that optimizes material layout within a given design space, for a given set of loads and boundary conditions, are also helpful for deriving into lattice and porous structures and progressively being incorporated to conventional CAD resources, as previously mentioned (Bendsoe, 2003; Schramm, 2006).
Figure 4.7 introduces some three-dimensional CAD structures, with controlled distributions of density and mechanical properties, which can be physically obtained by means of additive manufacturing technologies in a wide set of materials, from (bio)polymers and (bio)ceramics, to metals, alloys and composites. Some of them are further employed and detailed as complete development cases of study in Chapter 6. In many cases these geometries are also referred to as biomimetic cellular structures.

Chapter 4 Computational modeling of complex geometries
93
Figure 4.7. Examples of three-dimensional structures, with controlled distributions of density and of mechanical,
thermal and fluidic properties (extracted from: Lantada et al. 2016)
These complex lattice structures and functionally graded materials can be defined from the design stage, with the help of state-of-the-art computer-aided design resources, and directly obtained, even in one step, thanks to recent advances in the field of additive manufacturing technologies, as already exposed with examples linked to the more homogeneous porous structures and lattice geometries from previous subsection. Several strategies can be applied to the generation of these functionally graded, sometimes even “bioinspired” or biomimetic, structures and present subsection details some cases of study.
In this case, computer-aided design of the different geometries is carried out with the help of NX-8.5, mainly using combinations of parametric and matrix-based features and Boolean operations, as well as using convergent / divergent trusses for the incorporation of gradual variations to the values of density and mechanical properties. Figure 4.8 to 4.10 show different lattices and porous structures of biomimetic lattice structures and functionally graded networks for subsequent solid freeform fabrication for potential applications in fields including: aerospace, energy, transport, biomedical engineering and health, materials science and engineering, inner design and architecture and even textile industry and fashion. In the different designs included, density, stiffness, thermal conductivity and resistance to flow vary along their thickness in a way that can be controlled and defined from the design stage, if adequate modeling strategies are used.
Figure 4.8. Different computer-aided design approaches for the design of tissue engineering scaffolds with functional gradients of mechanical properties (extracted from: A Díaz Lantada, De Blas Romero, Valido Moreno, Curras, & Tellez,
2016).
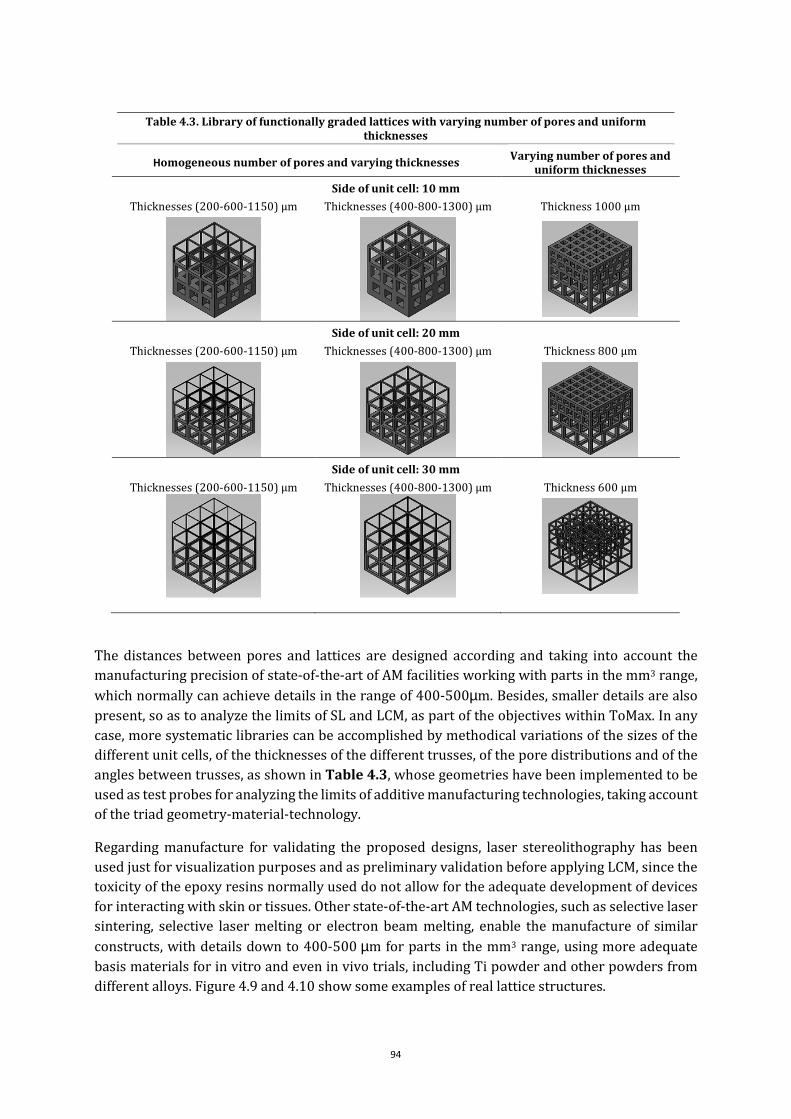
94
Table 4.3. Library of functionally graded lattices with varying number of pores and uniform thicknesses
Homogeneous number of pores and varying thicknesses Varying number of pores and
uniform thicknesses
Side of unit cell: 10 mm
Thicknesses (200-600-1150) μm Thicknesses (400-800-1300) μm Thickness 1000 μm
Side of unit cell: 20 mm
Thicknesses (200-600-1150) μm Thicknesses (400-800-1300) μm Thickness 800 μm
Side of unit cell: 30 mm
Thicknesses (200-600-1150) μm Thicknesses (400-800-1300) μm Thickness 600 μm
The distances between pores and lattices are designed according and taking into account the manufacturing precision of state-of-the-art of AM facilities working with parts in the mm3 range,
which normally can achieve details in the range of 400-500µm. Besides, smaller details are also present, so as to analyze the limits of SL and LCM, as part of the objectives within ToMax. In any case, more systematic libraries can be accomplished by methodical variations of the sizes of the different unit cells, of the thicknesses of the different trusses, of the pore distributions and of the angles between trusses, as shown in Table 4.3, whose geometries have been implemented to be used as test probes for analyzing the limits of additive manufacturing technologies, taking account of the triad geometry-material-technology.
Regarding manufacture for validating the proposed designs, laser stereolithography has been used just for visualization purposes and as preliminary validation before applying LCM, since the toxicity of the epoxy resins normally used do not allow for the adequate development of devices for interacting with skin or tissues. Other state-of-the-art AM technologies, such as selective laser sintering, selective laser melting or electron beam melting, enable the manufacture of similar
constructs, with details down to 400-500 µm for parts in the mm3 range, using more adequate basis materials for in vitro and even in vivo trials, including Ti powder and other powders from different alloys. Figure 4.9 and 4.10 show some examples of real lattice structures.

Chapter 4 Computational modeling of complex geometries
95
Figure 4.9. Computer-aided designs and rapid prototypes obtained by laser stereolithography of biomimetic
functionally graded lat-tices.
Figure 4.10. Computer-aided designs and rapid prototypes obtained by laser stereolithography of functionally graded
structures and of a biomimetic tree-like or vascular structures (A. Díaz Lantada et al., 2016, Chapter 16).
An additional degree of precision, even down to details of hundreds of nanometers, can be
obtained by using two-photon polymerization, but usually only for parts in the µm3 range. The promotion of final part size is challenging but necessary for applications in the industries already cited. Companies such as Stratasys, Realizer GmbH, SLM Solutions GmbH and Arcam provide some of the most interesting machines for metallic additive manufacturing based on different approaches and energy sources. In fact, concerning the manufacture of design-driven knowledge-based tissue engineering scaffolds, lattice structures and functionally graded structures, lithography-based ceramic manufacture provides a high available degree of precision for the manufacture of highly complex geometries, using a wide set of (bio-)ceramic materials. The examples described further on, help to put forward the precision and quality of this approach.
Precision is remarkable indeed and trusses with thicknesses down to 150 µm can be obtained, reaching the level of precision required for several industrial applications, as detailed in Chapter 6, and allowing for the possibility of promoting multi-scale and functional gradients of density, porosity and mechanical, thermal and fluidic properties controlled from the design stage.
Once the functionally graded designs are obtained and optimized for 3D printing, manufacture is accomplished by means of lithography-based ceramic manufacturing (LCM). The master models or green parts are manufactured, with previously prepared alumina Al2O3 slurries, by digital light

96
processing (DLP) using the CeraFab® 7500 machine. The libraries developed and the first prototypes obtained as test probes of porous and lattice structures with functional gradients of density and mechanical properties, help to validate the design and manufacturability of such complex geometries and to assess and compare the performance of the different technologies and materials. In any case, once assessed the performance of the different machines, even more complex functionally graded networks can be designed and manufactured with confidence, if adequately understanding the limits imposed by the combination material-technology-geometry. Figure 4.11-13 provides a nice example of a more complex lattice designed on the basis of the knowledge acquired with the first test probes from the systematic libraries of lattice geometries and porous structures.
Figure 4.11. Epoxy (transparent-white) and titanium (grey) functionally graded “knowledge-based” lattice structures.
The titanium prototype is obtained by selective laser sintering of titanium powder (i-materialise) as example of a high-performance engineering material usable with additive manufacturing approaches.
Within the framework of the ToMax project, a novel technology developed by the AMT department from the Technical University of Vienna, is also available: the new generation of lithography-based printers ‘BP8’ (see chapter 3). In this case the precision is down to the 30 µm of the laser-beam width. To test the viability to print cantilevers and truss diameter of them, the same replicas of the mentioned design were printed, with a layer thickness of 50 µm and the material developed for the purpose described in the Chapter 3.
Figure 4.12. Functionally graded structures printed by the SLA BP8 machine with a non comercial and self-developed material formulation for a specific purpose of high geometry definition.
STIFNNESS POROSITY

Chapter 4 Computational modeling of complex geometries
97
Quantitative comparative data is included in Table 4.4, which provides a summary of our results with these preliminary test geometries focusing on the comparative performance of lithography-based ceramic manufacture (LCM) and SLA techniques for the different building processes ‘Up-Bottom’ and ‘Bottom-Up’.
Design and manufacture of other mechanical metamaterials
The following information included in this subsection was presented as a research paper in the magazine Smart Materials and Structures and is open to the public under the title: Lithography-based ceramic manufacture (LCM) of auxetic structures: present capabilities and challenges. (Diaz Lantada, De Blas Romero, Schwentenwein, Jellinek, & Homa, 2016).
Metamaterials are artificial materials engineered to have properties that may not be found in nature or only in strange and expensive materials. Metamaterials usually gain their properties from their structure rather than from their composition, using small in homogeneities or based on the periodic repetition of a unit cell, to create special macroscopic behaviors (Capolino, 2009, a). Most current applications of metamaterials are oriented to the development of devices for controlling electromagnetic (and also acoustic) waves in the fields of optoelectronics and electronic engineering and, to some extent, mechanical engineering. Photonic crystals, plasmonic structures and sensors, superlenses, light cloaks and frequency selective surfaces, among other applications, benefit from ad hoc designed or engineered metamaterials, whose performance depends on the designed periodic structure, much more than on their chemical composition. (Capolino, 2009, b).
In more traditional engineering fields, such as mechanical and aeronautical engineering, as well as architecture, metamaterials are used of improving mechanical characteristics, by adequately designing and manufacturing porous or lattice structures, what results also highly beneficial for the development of several biodevices linked to biomedical engineering. For instance, the use of porous materials for product design and the use of lattice structures in architecture are normally aimed at obtaining much lighter structures, with remarkable relationships between Young’s modulus and overall density and between resistance and weight, either for less energy consumption during performance or for enhancing long-term performance. In a similar way the biological systems, as they have to manufacture their own materials and structures and
Table 4.4. Comparative performance of lithography-based ceramic manufacture and photopolymerization processes, such as laser stereolithography
Form1+
(Low-cost laser stereolithography)
SLA-3500 (Industrial laser
stereolithography)
CeraFab 7500
(Lithography-based ceramic manufacture)
Minimum pore size 800 µm 600 µm 180 µm
Maximum truss cantilever
1200 µm 3000 µm 1000 µm
Minimum truss diameter
800 µm 400 µm 130 µm
Resolution 300 µm 300 µm 40 µm
Maximum solid part
60 mm x 60 mm 76 mm x 43 mm Φ 12 mm x 12 mm

98
subsequently endure their weight, both tasks being highly expensive in energetic terms, tend to optimize the relationship between resistance and weight and porous materials structures (trabecular bone, natural foams) and lattice structures (supporting skeletons or exoskeletons) provide very often optimal solutions.
The development of additive manufacturing offers designers and engineers the possibility of constructing a wide set of cell units for subsequent periodical reproduction, so as to obtain all kinds of imaginable metamaterials, with mechanical properties tailored to the requirements of final applications. In fact, the porous and lattice structures from previous subsections can be perceived and referred to as mechanical metamaterials and can be applied for the promotion of radical innovation in all the sectors already mentioned.
Apart from conventional CAD resources and related design strategies, as detailed in previous subsections, more specific ad hoc tools can be applied for the design of more special networks and for the incorporation of mechanical metamaterials within solid designs. One of the more interesting available options is the 3-Matic suite by Materialise (see Chapter 3, software resources). 3-matic enables design modification on STL level, using CAD designs, scanned data and topology optimized models as a starting point. Designers can clean up rough data for simulation or even converting their meshes back to CAD. In addition, this software allows design enhancement by employment of lightweight models and by using conformal structures, reaching models ready for additive manufacturing.
Figure 4.13 and 15 show different models and prototypes of mechanical metamaterials obtained with the help of 3-Matic by Materialise. The variation of element for the mesh-based concept is 3.5 mm to 5 mm. In the case of the pattern-based designs the inner sections are 3.5 mm graph size and the outer section 5 mm.
Figure 4.13. Funcitonaly graded porous designs; a) mesh based lattice sandwich; b) pattern-based sandwich with different unit cell size; c) mesh-based cube with gradient from inner to outer part; d) pattern-based cube.

Chapter 4 Computational modeling of complex geometries
99
Figure 4.14. Functionally graded porous prototypes manufactured using the a) Formlabs castable resin and the Form 1+ low cost laser stereolithography machine and b) using the Accura® 60 epoxy resin and the SLA-3500 industrial
stereolithography.
Auxetics constitute another type of interesting metamaterials, which may benefit from the paradigm of additive manufacturing. Conventional materials experiment a typical reduction in width when stretched. A quantitative measure of this dimensional change can be defined by a
relevant property called “Poisson’s ratio” and defined as: ν = −dεtrans / dεaxial, being εtrans and εaxial the transverse and axial strains when the material is stretched or compressed in the axial direction. In a more general case, νij is the Poisson’s ratio that corresponds to a contraction in direction “j” when an extension is applied in direction “i”. For most materials (and structures) the value of Poisson’s ratio is positive and reflects a tendency to conserve volume.
Auxetic materials (or metamaterials) are those with a negative Poisson’s ratio, i.e. for displaying the unexpected property of lateral expansion when stretched, as well as a counterintuitive shrinking when compressed (Lakes, 1987, Evans, 1991, He, 2005, Liu, 2010). Natural auxetics (including some minerals, furs, skins…) and man-made ones (Gore-Tex®, polymeric foams) have been described and very special attention has been paid, since their discovery, to the search and development of auxetic structures designed and controlled even down to molecular scale levels (Wojciechowski, 1987, Evans, 1991, Griffin, 2005).
It is important to highlight that auxetics, understood as materials and structures with a negative value of Poisson’s ratio, are not only based on special geometries but also on special interactions with external and boundary conditions, including: negative pressure, proximity of certain phase transitions, specially inter-woven materials, living tissues and their extra-cellular environment, polydispersions, among other possibilities described in the seminal papers of this field (Wojciechowski, 1989, Hirotsu, 1991, Wojciechowski, 2003, Narojczyk, 2010). In any case, materials and structures leading to auxetic behaviour are being progressively employed in the design of new products with interesting functionalities, especially in the area of shape morphing structures, expandable actuators and minimally invasive surgical tools and implantable devices.
Regarding smart actuators based on an auxetic structure (Diaz Lantada et al., 2016), it is important
to cite some recent advances linked to auxetic shape-memory alloys (SMA) for developing deployable satellite antennas (Scarpa, 2010) and some experiences linked to the characterization of polyurethane foams, with shape-memory behaviour and auxetic properties, promoted thanks

100
to several post-processing stages (Bianchi, 2009). In the area of medical devices, recent studies have also assessed the behaviour of a few auxetic structures for designing expandable stents (Tan, 2011, Gatt, 2014, Mizzi, 2014) and their application to other surgical and implantable biodevices is clearly a matter of investigation. Several auxetic materials and potentially auxetic structures, normally grouped under the terms “re-entrant” (Almgren, 1985), “chiral” (Prall, 1997) and “rotating” (Grima, 2000) in relation to the characteristics that promote the auxetic behaviour, have been also summarized in previous comprehensive reviews.
In some studies, just a scheme of their expected behavior and folding process, when submitted to uniaxial stresses, is drafted and provided, which proves to be limited for subsequent design activities. Recent comparative studies have tried to provide additional information of the more relevant properties of a wide set of auxetic structures, in order to assist with material / structure selection tasks for the development of novel auxetic-based smart structures and devices (Álvarez Elipe, 2012).
More recently, a comprehensive monograph, covering aspects linked to the micro-mechanical modeling of auxetics, to the elasticity of auxetic solids, to stress concentration, fracture and damage in auxetics, to contact and indentation mechanics of auxetic materials, and to overall mechanical, thermal and dynamic behavior of auxetics, has been published (Lim, 2015).
Regarding the micro-manufacture of auxetic metamaterials, the first successful endeavor to obtain such geometries in the micro-scale, for achieving metamaterials with negative Poisson’s ratio, was performed using soft lithography, leading to details in the 100µm range (Xu, 1999). The lithographic process explained in such reference is interesting indeed and has helped to promote some appliances (i.e. micro-tubular structures as potential stents were analyzed).
However, for adequately exploiting the potential of these auxetic metamaterials, an additional degree of precision is required. For instance, the manufacture of polymeric sheets with auxetic nano-structures can be useful indeed for the development of selective active membranes, whose pore sizes can be real-time controlled, just by applying uniaxial loads. Applications in areas including health (i.e. dialysis) and energy (i.e. membranes for catalytic reactors) are worth of investigation. By rolling such micro- / nano-auxetic sheets even easy-implantable devices (i.e. vascular stents) for minimally invasive surgery procedures can be obtained (Xu, 1999).
The fields of tissue engineering and biofabrication, with typical interactions at cellular and even molecular levels, can also clearly take advantage from auxetic metamaterials (Soman, 2012), especially if the preliminary experiences are further improved with the help of more micro- or nano-auxetics for obtaining even smaller clearances between the cells under culture. During cell culture, uniaxial excitations of an auxetic scaffold (or extra-cellular matrix) lead to biaxial expansions and compressions of the tissue being developed, which optimizes the control upon cell differentiation and promotes final tissue viability.
Nevertheless, of the use of conventional micro-manufacturing resources for the development of quasi-2D auxetics and 3D auxetics, with typical distances between the lattices of the auxetic structure of more than 300 microns, leaves important clearances between cells and prevents interactions at cellular level.

Chapter 4 Computational modeling of complex geometries
101
Not just mechanical applications benefit from the special properties of auxetic metamaterials and take advantage from recently developed micro-manufacturing resources, but also auxetic-based systems for areas including optoelectronics and telecommunications require greater degrees of precision, than those achievable by traditional micro-machining facilities. Some additional remarkable procedures for developing real physical prototypes of mechanical metamaterials, with the finest details reaching hundreds of microns, include both subtractive approaches, i.e. laser ablation (Alderson, 1999), and additive manufacturing (or 3D printing) procedures, such as laser stereolithography, digital light processing (DLP) or direct laser writing (DLW) (Kadic, 2012, Bückmann, 2012). Usually, quasi-2D auxetic structures are manufactured resorting to surface micro-machining, laser ablation chemical etching, and other common mass-production processes imported from the electronic industry; while 3D auxetics, with more intricate geometries and inner details, can only be obtained by means of three-dimensional additive manufacturing or “layer-by-layer” processes, including laser stereolithography, selective laser sintering or selective laser melting, among others.
Promising approaches for the development of three-dimensional auxetic metamaterials and devices based on the use of direct laser writing have been previously presented (Hengsbach and Díaz Lantada, 2014). However, in spite of the attainable precision, the overall part size is still very limited for real-life and industrial applications and such process works more adequately just with polymers, which also limits the development of appliances for high-temperature environments.
Towards a more optimal compromise between part size, degree of precision and mechanical and thermal performance, shifting to high precision additive manufacturing technologies capable of working with ceramic materials seems to be an appropriate approach. In this section, it is present a very promising approach for the development of auxetic metamaterials and devices based on the use of lithography-based ceramic manufacturing (LCM). The process stands out for its precision and complex three-dimensional geometries attainable, without the need of supporting structures, and for enabling the manufacture of ceramic auxetics with their geometry controlled from the design stage with micrometric precision
The auxetic structure, used as case of study in this work, is designed using NX-8.5 (Siemens Product Life-cycle Management Solutions). First of all, a unit cell is obtained and, subsequently, the use of Boolean operations and a three-dimensional matrix replication allow for the generation of a complete structure. In our case the cell unit is repeated four times in the x and y directions and three times in the z (vertical) direction, in order to obtain an almost cubic geometry. The repetitions are aimed at providing a clearer visual impression of the aspect of the auxetic structure or metamaterial, as sometimes, if using only one-unit cell, it might be not so easy to visualize the global aspect. This three-dimensional auxetic is intended to experiment transversal contractions along x and y axes, when compressed along the z direction. In a similar way, tractions along the z direction may lead to transversal expansions.
Figure 4.15 shows the computer-aided design of the three-dimensional auxetic structure. The structure has been selected due its highly negative value of Poisson’s ratio, which was previously reported (Álvarez Elipe, 2012). In addition, due to having an intricate three-dimensional geometry, it can only be obtained using additive manufacturing technologies, which proves interesting for the technology being evaluated in this study. For this structure, the expected

102
Poisson’s ratio reaches a value of νzx ≈ νzy ≈ -1.7, when compressed along the z axis, which is perpendicular to the construction plane. The maximum geometrical volume reduction is around 17%, after application of the uniaxial loading levels that lead to the beginning of contacts between inner features, thus also promoting the beginning of buckling and structure collapse.
Figure 4.15. Three dimensional auxetic structure selected for present study.
Figure 4.16. Some images from the mask-layers at various position during the DLP printing
Figure 4.17 shows the obtained auxetic model of 14mm x 14mm x 12mm. Figure 4.17.a shows the green parts or master models, just after the digital light processing photo-polymerization, while Figure 4.17.b shows the final sintered and compact ceramic structure. Details down to 20 microns and thicknesses lower than 200 microns can be appreciated in Figure 4.17.c. Layers of 20 microns can be perceived. The models stand out for their symmetry and for the absence of inhomogeneous shrinking or structure collapse, which has been reported when using other high precision additive manufacturing procedures applied to auxetics (Hengsbach and Díaz Lantada, 2014).

Chapter 4 Computational modeling of complex geometries
103
Regarding the additive manufacture of auxetic materials previous pioneering studies have focused on the 3D printing, using fused-deposition modeling of thermoplastic polymers, of auxetic foams (Critchley, 2013) and the use of additive manufacturing processes (laser stereolithography) for obtaining a mold for subsequent casting of silicone towards a final auxetic structure with very remarkable flexibility (Babaee, 2013). In terms of flexibility and attainable deformations of the auxetic structures, both approaches provide very interesting results and show potential for a wide set of applications. However, the use of conventional 3D printing, typically based on fused deposition modeling, or even the use of two-step processes combining a high precision technology and a subsequent casting procedure, are a bit more limited than our approach in terms of precision.
While previous 3D printed examples provide truss thicknesses down to 300-400 microns, the process used in this thesis leads to details smaller than 200 microns. In terms of the precision attainable, our previous experience with two-photon lithography (Hengsbach and Díaz Lantada, 2014) and that of colleagues with dip-in direct laser writing (Bückmann, 2014) provide the highest level of detail attainable so far, although the overall size of the auxetic structure is compromised, which limits applicability. In fact, the structure by Bückmann and colleagues presents the important advantage of having the same Poisson’s ratio along the three main directions, which converts it into a real three-dimensional dilational metamaterial (Bückmann, 2014), while the auxecticity of our structure is only remarkable when compressed or stretched along the direction perpendicular to the construction plane. However, to our knowledge, the presented auxetic structures, obtained by lithography-based ceramic manufacture, provide the best relationship between part size and degree of detail in the field of additive manufactured metamaterials.
Furthermore, although the deformations attainable with auxetic ceramics are much more limited, than using previously 3D printing approaches based on polymers, these ceramic metamaterials may be very interesting for a wide set of potential applications. First of all, many applications of auxetic materials may require only micrometric displacements and the additional stiffness of the base ceramic material used may be a positive property. For instance, for the development of high-frequency resonant structures (i.e. for antennae and telecommunication applications) or for interacting with micrometric precision (i.e. in cell culture processes and tissue engineering processes), the use of ceramic auxetics may be very appropriate, taking account of the fact that the material is osteoconductive and better in terms of biocompatibility, than most materials used for 3D printing. Furthermore, ceramics are much more resistant to higher temperatures, which may be of help for energy-related applications (i.e. in the development of active filters for turbomachinery). Their resistance to high temperatures, linked to their low thermal and electrical conductivities, may be useful for recently proposed applications of auxetics aimed at the control of deformations induced by gradients of temperature in shells, cylinders, spheres and plates (Lim, 2013). The control of stiffness, especially in sandwich structures (Grima, 2010), is also noteworthy. In fact, focusing on the control of thermal-induced deformations and of structure stiffness are some of the main keys for enabling additional specific applications of auxetics in several fields. Furthermore, three-dimensional auxetic structures have the potential to impact on a wide range of applications, from deployable and morphing structures to space-filling composites and medical treatments, and the properties of ceramics may benefit many of them.

104
However, the development of mechanical metamaterials, including auxetics, based on the combined use of computer-aided engineering resources and high-precision additive manufacturing resources has important advantages, which can outperform other development processes, at least in some aspects. For instance, the possibility of defining concrete cell unit geometries and of replicating them to fill three-dimensional spaces is quite remarkable, especially taking into account that the finally manufactured prototypes exactly resemble the original design. Consequently, results can be controlled from the design stage.
In addition, the use of Boolean operations for intersecting a designed metamaterial with an existing solid geometry, so as to manufacture a porous or lattice structure benefiting from the properties of the metamaterial, but with a pre-defined external geometry, constitutes a breakthrough with respect to mass produced foams. The use of computer-aided designs may even help to incorporate the metamaterial (or the auxetic) to a certain zone of a predesigned component, in order to incorporate some functionality to a concrete region of a device. Such knowledge-based designs, which may include gradients of mechanical, thermal, electrical and even optical properties, can be then obtained in a single step thanks to additive manufacturing resources.
Figure 4.17. a) Green part or master model just after digital light processing of the slurry. b) Final result after
sintering: Auxetic ceramic structure with micrometric details obtained by means of lithography-based ceramic manufacture (LCM). c) Detail of layers and unit cell.

Chapter 4 Computational modeling of complex geometries
105
The described process stands out for its precision and for the complex three-dimensional geometries (in fact real mechanical metamaterials) attainable, without the need of supporting structures, and for enabling the manufacture of ceramic auxetics with their geometry controlled from the design stage with micrometric precision.
Even though the progressive size reduction of artificially obtained auxetic geometries leads to real mechanical metamaterials and can promote novel applications, other difficulties linked to manipulation and integration into complex devices arise and further research is needed for taking advantage of these geometries. Future studies can be focused on the development of characterization procedures and support devices for addressing the actual auxetic behavior of the geometries obtained and for assessing the performance of ceramic auxetics.
We foresee relevant applications in several fields, such as biomedical and tissue engineering, i.e. for the development of active implantable medical devices, minimally invasive surgical actuators or active scaffolds for dynamic cell culture; aerospace and aeronautics, i.e. for the development of micro-actuators and highly accurate deployable structures; telecommunications and optoelectronics, i.e. for novel antennae designs, special photonic crystals and stress-strain electromechanical micro-sensors, among other interesting areas. Their use for controlling deformations induced by thermal gradients and for controlling stiffness of materials and structures is also noteworthy and may promote new applications in the already described fields of research.
Present section has described some of the more novel and remarkable strategies for the development of porous structures, lattice geometries and several types of mechanical metamaterials, as well as validated their manufacturability using different materials and technologies, whose precision and properties have been compared.
4.2 Simulation and assessment of complex geometries
Stress calculation modules are the most used for solving static problems, as loads (forces, pressures, torques, accelerations) and boundary conditions (clamped, fixed displacements, fixed rotations) can be defined and final results provide information on stress & strain fields, displacements and even security factors if materials strength is defined properly. Dynamic response calculations are also possible, as most FEM-based simulation software include modules for studying natural vibration modes and related frequencies of parts and structures, so as to analyze which kinds of cyclic loads may promote resonance phenomena and improve servicel life of structures and mechanical systems. Thermal phenomena and fluidic studies can be also performed, as detailed in the following sub-sections. Other more specific modules include impact and fatigue calculations, for assessing part life and unexpected phenomena; topological optimization tools, for optimizing geometries; electromagnetic simulations, more linked to telecommunications and electronics and some additional resources focused on micro- and nano-technologies.

106
Mechanical performance of complex geometries: Characterization data for applications
The use of FEM-based simulations, in our case resorting to the “advanced simulation” module available in the computer-aided design and engineering software used (NX-8.5, see Chapter 3), can be also applied to analyzing the mechanical performance and properties of the lattice and porous constructs object of design and for optimizing aspects of the geometries involved, such as truss thickness, cantilever lengths, pore sizes, blend radii, influence of fillets, among others.
By means of example, Figure 4.18 shows detailed images of the stress fields obtained under loading for different lattice geometries. The impact of porosity and the presence of stress concentration can be easily appreciated.
If the process is applied to the geometries of a complete library of porous or lattice structures, after an adequate evaluation, it helps to obtain graphs for helping with (meta-)materials selection tasks. For instance, Figure 4.19 shows the influence of unit cell size and bar thickness on structures’ elasticity. The obtained values are dimensionless and shows the relative Young’s Modulus (Erelative), which then can be used with the value of the selected material for obtaining the final real Young’s Modulus (Ereal)(4.1)
�� �� � �� ����� ����� ���� (4.1)
These graphical summaries of relevant mechanical properties may help to select the most satisfactory lattice or porous geometries, for the purposes of the final mechanical application. These resources help with material selection tasks and complement current available methodologies, which provide data regarding common engineering materials (Ashby, 2005), with relevant information regarding mechanical porous materials or lattices (in fact mechanical metamaterials) only attainable by additive procedures. Such data, if adequately combined with volume measuring tools from CAD files, are very adequate for assessing the eco-impact of different lattices and for selecting those with optimal relation between stiffness and apparent density or between mechanical strength and apparent density.
The apparent stiffness of such lattice structures can be also obtained and the different structures represented in form of Ashby’s diagrams showing, for instance, adimensional apparent Young’s modulus (effective Young’s modulus / Young’s modulus of the bulk material) vs. adimensional apparent density (effective density / density of the bulk material). Such graphics or diagrams (grouping materials by families and subfamilies) provide a very useful tool for material selection processes, in parallel to the whole product development, helping to consider different factor to be optimized, such as stiffness, resistance, weight, cost, manufacturability, among others (Ashby, 1996, 1998, 2005).
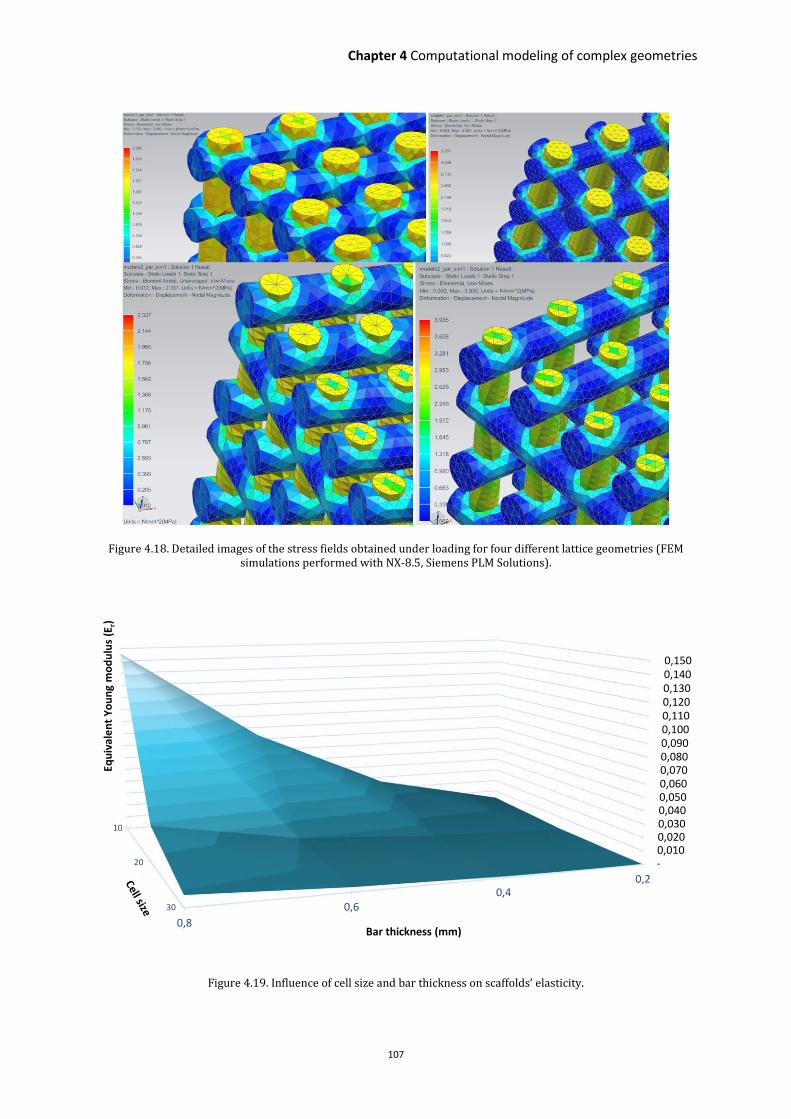
Chapter 4 Computational modeling of complex geometries
107
Figure 4.18. Detailed images of the stress fields obtained under loading for four different lattice geometries (FEM simulations performed with NX-8.5, Siemens PLM Solutions).
Figure 4.19. Influence of cell size and bar thickness on scaffolds’ elasticity.
10
20
30
- 0,010 0,020 0,030 0,040 0,050 0,060 0,070 0,080 0,090 0,100 0,110 0,120 0,130 0,140 0,150
0,20,4
0,6
0,8
Eq
uiv
ale
nt
Yo
un
g m
od
ulu
s (E
r)
Bar thickness (mm)

108
Regarding the previous study of section 1.3 for the metamaterials design, further simulations are carried out to evaluate the normalized Young’s modulus (Young’s modulus of the lattice structure / Young’s modulus of the bulk material), using the finite element method. They correspond also to values previously reported when testing upon macroscopic rapid prototypes obtained by laser stereolithography, although the ideal boundary conditions of the simulations are impossible to obtain in the real tests and the actual Poisson’s ratios measured are typically around a 20-25% lower than ideally expected (Álvarez Elipe, 2012).
As the mentioned properties (Poisson’s ratio, maximum volume reduction and normalized Young’s modulus) are, in principle, scale-independent (Lakes, 1987, Grima, 2004). The mechanical performance of the structure is evaluated with the help of FEM-based simulations and using the advanced simulation module of NX-8.5. From the different possibilities of NX-8.5 for carrying out FEM simulations, NX-Nastran solver and structural static analysis type (SESTATIC101) are selected. We apply alumina properties from the material library with a Young’s modulus of 350GPa, with a density of 3900kg/m3, with a compressive strength of 2200MPa and with a bulk Poisson ratio of 0.27.
The structure is meshed using 4-node tetrahedral elements with at least 2 elements through thickness. The displacement along the vertical z-axis of the nodes at the base of the structure (corresponding to the XY construction plane) is fixed, leaving the lateral displacements free, so as to model an ideal auxetic performance. Increasing vertical displacements, along -z direction, are applied to the upper nodes of the structure.
Four simulation cases are performed, with increasing values of applied deformation, including
values of εz = 0.325%; 0.65%; 0.975 and 1.3%, so as to evaluate the corresponding levels of stress and the attainable deformations and displacements. Convergence analyses are carried out using
the h-method and the p-method. In the first case, the mesh is refined down to 0.5µm size elements, thus adding more elements. In the second case, the complexity of the shape functions is increased by changing from 4-node tetrahedral elements to 10–node tetrahedral ones.
Figure 4.20 shows the finite-element method simulation results, which help us to quantify the Poisson’s ratio of the structure, which corresponds to previously studied values (Álvarez Elipe and Díaz Lantada, 2014), and to evaluate the attainable deformation levels, taking into account that the auxetic structure is obtained in a rigid ceramic. Figure 4.20.a presents the displacements
results for verification of a Poisson’s ratio νzx = νzy = -1.7. They are represented in color-maps
corresponding, respectively, to displacements along z, x and y axes to highlight the symmetry present in the XY plane. Figure 4.20.b presents the stresses results corresponding to increasing levels of applied strain, so as to analyze the attainable degree of deformation before material’s failure. According to the results, the maximum level of deformation does not correspond to the geometrical limit, in which the trusses of the structure would start touching each other, but is
limited to the stiffness and brittleness of the ceramic material. For deformation values of εz = 1.3%, compressive stress values of 1900MPa, just at the limit of the ceramic material, are obtained. The allowable deformations are clearly smaller than in auxetic foams manufactured using polymers, but still allow for displacements of 180 microns in our ceramic structures, which may be very appropriate for several application fields, as discussed towards the end of present section.

Chapter 4 Computational modeling of complex geometries
109
Figure 4.20. Finite-element method simulation results: a) Displacements results for verification of the Poisson’s ratio. Represented in color-maps corresponding to displacements along z, x and y axes to highlight the symmetry present in
the XY plane. b) Stresses results corresponding to increasing levels of applied strain, so as to analyze the attainable degree of deformation before material’s failure.
While present section has dealt with the bulk properties, the following section deals with the surface properties, which are also fundamental in terms of tribological performance, optical properties, aesthetic aspect and ergonomic response. Main alternatives linked to the design and manufacture of textured and patterned surfaces, in fact to the control of device surface topography from the design stage, will be covered, explored and applied to the development of libraries of micro-textured or micro-patterned probes.
The use of different geometries, materials and technologies for their manufacture, will help us to validate and to assess the viability of the provided strategies and to provide data from systematic characterization trials, which may be useful for developing the final applications, as detailed in Chapter 6.
110
4.3 Controlling surface properties from the design stage: Design and modelling of microtextured surfaces
Material (and consequently device) surface topography has a direct influence on several relevant properties, linked to its final performance, such as friction (Archard, 1974) , wear resistance (Bushand et al., 1995), self-cleaning ability (Barthlott et al. 1997; Lafuma and Quere et al. 2003), biocompatibility (Buxboim, 2010), capability of driving cell fate (Yao et al. 2013 ; Jeon et al. 2015) , optical response (Jeon et al. 2015), touch perception and ergonomics, overall aesthetic aspect and even flavor (Berginski et al. 2007). Therefore, it also plays a determinant role in material selection in engineering design, especially in the field of micro- and nano-system development, in which the effects of topography on the incorporation of advanced properties are even more remarkable.
Normally a device surface topography is a direct consequence of its material’s natural state or the result of machining processes, chemical attacks or post-processes used for the manufacture of a device or product. Several strategies for modifying material topographies and surface properties have taken advantage of conventional surface micro-machining (Madou, 2002), laser ablation (Chandra et al. 2010), micro-molding (Martin, 2005), biomimetic templating (Pulsifier and Lakhatakia, 2011), physical and chemical vapor deposition processes (Kwasny, 2009), sol-gel procedures (Jedlicka et al. 2007) and molecular self-assembly (Rahmawan et al. 2013).
All these processes require enormous hands-on expertise and final result depends on several control parameters, whose interdependencies are normally complex to understand, characterize, model and master (Gad-el-Hak, 2003). As can be seen from the previously cited documents, top-down and bottom-up approaches for controlling surface properties co-exist and in many cases complement each other (Naik et al. 2009), the former being more focused on mass-production (as they derive from the micro-electronic industry), the latter providing remarkable geometrical versatility. Combinations of top-down and bottom-up approaches are frequent and have usually focused on manufacturing the larger micro-metric features by means of top-down processes (micro-machining, etching…) and the smaller nano-metric details by using bottom-up techniques (CVD, PVD, sol-gel…).
Advances in computer-aided design and in AMT are opening new horizons for controlling surface topography, of materials and devices, from the design stage and in a very straight-forward and rapid way. Even though conventional computer-aided design software is only capable of handling Euclidean geometries and mainly relies on simple operations (sketch based operations, extrusions, pads, holes, circular grooves…) for obtaining “soft” solids and surfaces, recent approaches based on the use of matrix-based programming have already proved to be useful for designing rough surfaces and textured objects adequately described by fractal geometries (Mandelbrot, 1982; Falconer, 2003). In parallel, the continued progress in additive manufacturing technologies especially during the last decade, has increased the range of materials capable of being additively processed and greatly promoted their precision, even down to nano-metric features, with implications in the development of advanced and bioinspired materials, metamaterials and devices based on them (Buckman et al. 2012; Rohrig et al. 2012).

Chapter 4 Computational modeling of complex geometries
111
In spite of the aforementioned potentials, the more common additive manufacturing technologies aimed at the production of final parts for demanding applications, normally based on layer-by-layer melting or sintering ceramic or metallic powders, do not provide the required degree of precision for obtaining controlled micro-textures and thus enabling related advanced functionalities. In addition, ultra-high precision additive manufacturing technologies, mainly direct laser writing based on two-photon polymerization, even if adequate for controlling surface features at micrometric level for micro-texturing (Hengsbach and Diaz, 2014) and micro-structuring (Hengsbach and Diaz, 2015) materials and devices, are very limited in terms of working space. Therefore, such fine control at the micro-scale cannot be applied to macroscopic (i.e. larger than 1mm3) objects, which greatly limits their industrial application. Although recently validated combinations of technologies enable multi-scale approaches (Hengsbach and Diaz, 2014), the final results lack from a real freedom of design, as expected from additive manufacturing technologies aimed at solid freeform fabrication. At present, lithography-based ceramic manufacture, provides an interesting compromise between degree of precision and attainable part size [27-30]. Nevertheless, towards an increased degree of precision, throughput and final performance, which places additive manufacturing in concurrence with mass-production of micro-textured materials and devices for relevant industries, technological breakthroughs are still needed.
This section presents the combination of different design strategies, which enable geometrical freedom and promote bioinspired approaches, together with the benefits from a recently enhanced version of laser stereolithograpy technology (TU Wien, within ToMax), which combines the advantages of improved laser-unit precision and incorporates noteworthy software-based scanning strategies. Results show a remarkable control of the surface topography of polymeric probes and devices, as well as the possibility of obtaining design-controlled micro-structured surfaces upon macroscopic probes and devices. The synergies between the presented design strategies and the developed technology constitute a relevant step forward towards materials and devices with design-controlled multi-scale and micro-structured surfaces for advanced functionalities.
Strategies for surface texturing by means of CAD and boolean operations
Conventional computer-aided design programs usually handle Euclidean geometries and mainly rely on simple operations (sketch based operations, extrusions, pads, holes, circular grooves…) for obtaining softsurfaces, materials and devices. However, the use of conventional CAD tools and of the mentioned simple operations, including holes, extrusions, grooves and combinations thereof by using pattern- or matrix-based features and Boolean procedures, is an interesting approach to modifying the surfaces of designed solids.
By means of example, Figure 4.21. Example of the 3D CAD design of micro-textured materials with micro-wells and micro-pillars for design-defined surface properties. Multi-chamber micro-fluidic system with design-controlled surfaces. shows a computer-aided design library of different microtextured surfaces with functional gradients of porosities obtained by means of CAD Boolean and pattern operations. It is important to highlight, that even using conventional CAD resources, multi-scale fractal-like designs of textured materials and devices can be obtained. The benefits of

112
using parametric design tools, typical of any CAD program, are evident, as just by changing the value of one parameter the whole structure and properties of a textured material or design can be changed, an even linked to more general control parameters like the fractal dimension (Soo and Yu, 2013). Nevertheless, in some cases it is necessary to resort to alternative strategies, as described in the following sub-sections, for an additional degree of versatility and control when pursuing biomimetic designs.
Figure 4.21. Example of the 3D CAD design of micro-textured materials with micro-wells and micro-pillars for design-defined surface properties. Multi-chamber micro-fluidic system with design-controlled surfaces.
Strategies by means of multi-scale math-based approaches
In fact, as an alternative or complement to conventional computer-aided design processes, math-based approaches, including the use of mathematical fractal models for designing the complex and highly irregular surfaces of biomimetic objects, constitute also interesting and versatile strategies towards materials and devices with design-controlled micro-textured and even nano-textured surfaces. UPM’s product development laboratory has researched the use of math-based approaches, although until recent advances in terms of precision of AMTs, their impact was limited (ES2372343 (B2), 2012)
In this way, some parameters including roughness, waviness, skewness, among others, can be defined from the design stage and adapted in a more efficient way to the requirements of the final applications. The final multi-scale (in many cases bioinspired) surfaces z(x,y) can be considered
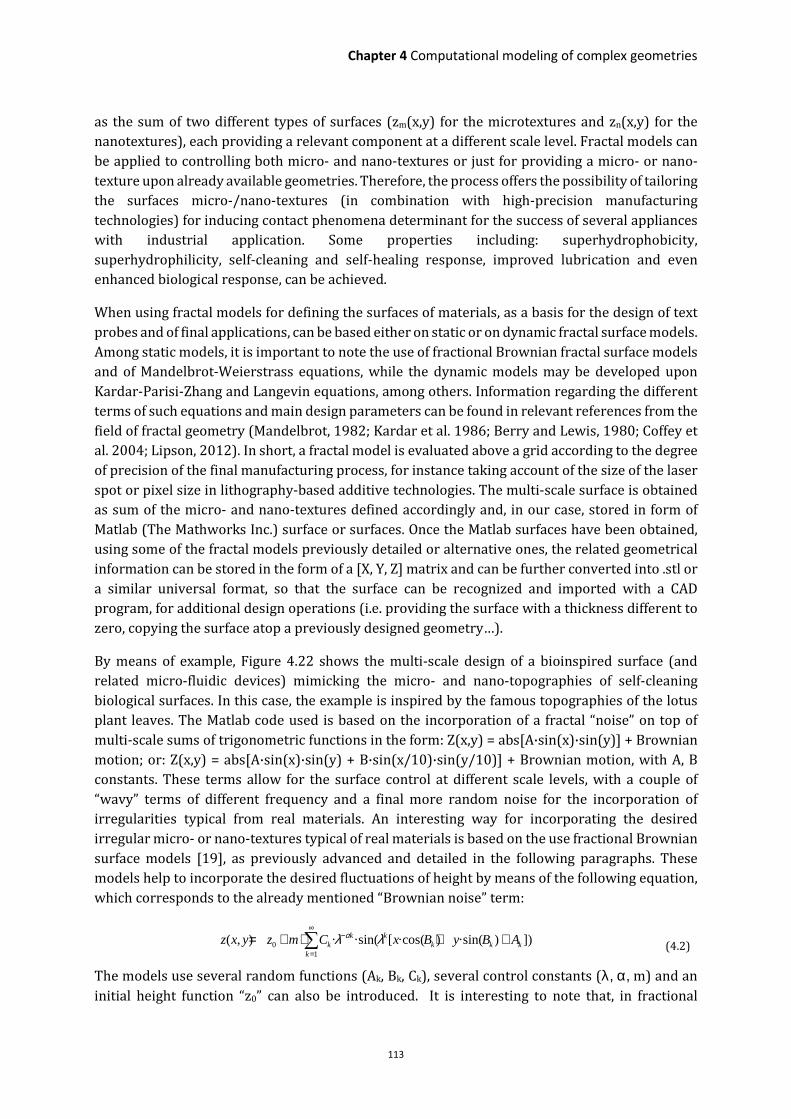
Chapter 4 Computational modeling of complex geometries
113
as the sum of two different types of surfaces (zm(x,y) for the microtextures and zn(x,y) for the nanotextures), each providing a relevant component at a different scale level. Fractal models can be applied to controlling both micro- and nano-textures or just for providing a micro- or nano-texture upon already available geometries. Therefore, the process offers the possibility of tailoring the surfaces micro-/nano-textures (in combination with high-precision manufacturing technologies) for inducing contact phenomena determinant for the success of several appliances with industrial application. Some properties including: superhydrophobicity, superhydrophilicity, self-cleaning and self-healing response, improved lubrication and even enhanced biological response, can be achieved.
When using fractal models for defining the surfaces of materials, as a basis for the design of text probes and of final applications, can be based either on static or on dynamic fractal surface models. Among static models, it is important to note the use of fractional Brownian fractal surface models and of Mandelbrot-Weierstrass equations, while the dynamic models may be developed upon Kardar-Parisi-Zhang and Langevin equations, among others. Information regarding the different terms of such equations and main design parameters can be found in relevant references from the field of fractal geometry (Mandelbrot, 1982; Kardar et al. 1986; Berry and Lewis, 1980; Coffey et al. 2004; Lipson, 2012). In short, a fractal model is evaluated above a grid according to the degree of precision of the final manufacturing process, for instance taking account of the size of the laser spot or pixel size in lithography-based additive technologies. The multi-scale surface is obtained as sum of the micro- and nano-textures defined accordingly and, in our case, stored in form of Matlab (The Mathworks Inc.) surface or surfaces. Once the Matlab surfaces have been obtained, using some of the fractal models previously detailed or alternative ones, the related geometrical information can be stored in the form of a [X, Y, Z] matrix and can be further converted into .stl or a similar universal format, so that the surface can be recognized and imported with a CAD program, for additional design operations (i.e. providing the surface with a thickness different to zero, copying the surface atop a previously designed geometry…).
By means of example, Figure 4.22 shows the multi-scale design of a bioinspired surface (and related micro-fluidic devices) mimicking the micro- and nano-topographies of self-cleaning biological surfaces. In this case, the example is inspired by the famous topographies of the lotus plant leaves. The Matlab code used is based on the incorporation of a fractal “noise” on top of multi-scale sums of trigonometric functions in the form: Z(x,y) = abs[A·sin(x)·sin(y)] + Brownian motion; or: Z(x,y) = abs[A·sin(x)·sin(y) + B·sin(x/10)·sin(y/10)] + Brownian motion, with A, B constants. These terms allow for the surface control at different scale levels, with a couple of “wavy” terms of different frequency and a final more random noise for the incorporation of irregularities typical from real materials. An interesting way for incorporating the desired irregular micro- or nano-textures typical of real materials is based on the use fractional Brownian surface models [19], as previously advanced and detailed in the following paragraphs. These models help to incorporate the desired fluctuations of height by means of the following equation, which corresponds to the already mentioned “Brownian noise” term:
∑∞
=
− ++⋅+=1
0 ]))·sin()·cos([·sin(·),(k
kkkkk
k AByBxCmzyxz λλ α (4.2)
The models use several random functions (Ak, Bk, Ck), several control constants (λ, α, m) and an initial height function “z0” can also be introduced. It is interesting to note that, in fractional

114
Brownian models, fractal dimension can be related to the exponent α, being D = 3 - α, with 0 <α<
1. Therefore, higher values of α lead to more “planar” surfaces and lower values of α lead to more “three-dimensional” or spiky surfaces. The random functions proposed by Falconer, being Ck a normal distribution with mean = 0 and standard deviation = 1 and being Akand Bk uniform distributions in the interval (0,1), can be used. For the examples of Figure 4.2, the control
constants λ = 1 and m = 1 are used, α is set to 0.5 and z0 = abs[A·sin(x)·sin(y)], with A adjusted to
machine’s precision, is used. Adequately assessing the most beneficial values of α for different of the previously discussed applications is still matter of research and out of the scope of present study. Additionally, towards final applications, the height of some zones of the surface can be set to zero, as in the lower images of Figure 4.2. This may help with the development of microfluidic systems with design-controlled wells, chambers and channels, surrounded by textures aimed at controlling the wettability of such device surfaces. By truncating the aforementioned sum of infinite terms, basic fractal geometries can be obtained in matrix form (Matlab, The Mathworks Inc., has been used for such purpose) and further converted into recognizable CAD formats, typically STL, IGS or DWX. The use of additional “mesh to solid” converters leads to final solid files, which can be used as normal CAD parts for further design, simulation and computer-aided manufacturing tasks.
Figure 4.22. Example of the math-based design of a biomimetic material with self-cleaning potentials and impact of
using multi-scale design approaches. Microfluidic devices inspired on the possible control of surface-hydrophobicity by incorporating desired material (image courtesy of the PDL team)
A main problem linked to the incorporation of micrometric textures and microstructures to computer-aided designs is linked to final file size. For instance, a micrometric grid of 300 x 300 point, with clearance between points of 1micron, leads to a STL file of around 10MB and to a DXF file of around 35MB. In the case of a useful part (with a size of several mm³) the incorporation of a micrometric texture can lead to file sizes of several hundreds of MB or even a few GB, what is currently very difficult to manage with computer-aided design resources. The fact is that the “universal” STL, IGS, DXF, etc. formats are not optimal, especially for fractal-based designs, as such features can be described and programmed in just one code line, while their conventional CAD geometrical description unnecessarily increases file size. The shift to algorithmic, rather than

Chapter 4 Computational modeling of complex geometries
115
descriptive, geometry is a key factor to promote material properties and structure by design and to further apply such knowledge-based materials to product development. Once the designs of microtextured probes are prepared and optimized for 3D printing, manufacture can be accomplished by means of additive manufacturing technologies, which allow for the direct manufacture of these complex geometries.
Strategies based on bitmap images projection and patterning
The surface topography of materials and devices can be also modified and even controlled from the design stage by using specific software resources developed ad hoc for incorporating textures upon the surfaces of already designed soft geometries, more typical of CAD tools (Yean, Kai, Ong, & Feng, 1998). In the digital computer-graphics field the textures are added to simple and complex surface to make the part appear for instance more realistic, but these resources can be also applied for incorporating topographies with important impact on final functionality, affecting the tribological, optical, ergonomic and of course aesthetic performance of a material or device. Perhaps, as a possibility to solve the current issues of final part-quality -surface, the application of controlled roughness or irregular textures can help to dissimulate supports contact point in the printed part.
In the last decade, some conventional open-access 3D printing software, such as Cura, have incorporated design tools for creating new surfaces based on the projection of a 2D image with a color scale on the Z axis. The most common option is linked to the incorporation of engravings with the name of the designer or including some texture by means of projecting the image, such as those from Figure 4.23, upon a surface and creating a height map according to the colors of the surface. Other CAD resources also use to include an option for projecting images upon design planes or surfaces (i.e. the “raster image“ command in NX-8.5, Siemens PLM Solutions), which may serve as basis for subsequent operations linked to the projected image. The process is illustrated, which includes some examples of three-dimensional patterns generated with the open-access Cura 3D Printing Slicing software by assignment of height to the different values of a color chart or grayscale.
Figure 4.23. Examples of black-white and grayscale images, which can be used as masks for traditional lithographic
processes or applied to CAD models of materials and devices for texturing their surfaces.

116
Another example of texturing software is 3-matic by Materialise. In its texturing module, it is possible to apply an image on a three-dimensional modeled surface unlike in the approach illustrated previously. This method is based on the two-dimensional polyhedron decomposition that the tessellated surface forms with the triangles of the STL mesh. The algorithm allows the projection of a digital image onto the surface of the object transferring the bitmap into the desired space for the texture. In a simple way to explain the procedure of projecting such image, it can be explain as four steps (Leeb, Radetzky, & Auer, 2001): 1) determination of the corresponding triangles on the desired space for the determination of the pixel position in relation to the vertices; 2) calculation of the each pixel related position on the surface; 3) scanline along the inverse direction; 4) to assign a color estimation based on the surrounding colors of the pixel for its corresponding point on the element of the 3D surface allowing the implementation of antialiasing filters.
An important consideration is to appropriately avoid the distortion that could appear when the proper texture is applied on a complex surface. Plenty of times it is necessary to have, as a first step, an open surface as desired area to avoid such troubles. For instance, the texturing of a cylinder would need as previous operation of splitting cutting the closed surface by its generatrix. Later, the same previously commented procedure is used to assign the height (z) value to a grey code range, creating a 3D tessellated model, in a similar fashion to that performed by Cura software, but with the possibility of applying it to curved surfaces.
From the wide set of libraries with textured images (usually in .png, .jpeg and .bmp formats) freely available from internet under Creative Commons licenses, it is possible to turn a soft surface into patterned, cellular (Figure 4.24a, microtextured surface. In the case of study shown in Figure 4.25, different textures are applied to a miniature replica of Mount Everest to illustrate the versatility of this approach for the development of aesthetic and ergonomic micro-textured materials and final parts with a high degree of complexity.
Figure 4.24. Examples of three-dimensional patterns generated from 2D images: a) 3-matic by Materialise and b) Cura 3D Printing Slicing software
a
b

Chapter 4 Computational modeling of complex geometries
117
Figure 4.25. Biomimetic micro-textures applied to complex geometries and obtained by additive photo-
polymerization (Blueprinter 8 developed by TU-Wien within ToMaX).
In other cases, it is also possible to generate a mesh of control points for additional versatility towards design-controlled topographies or textures upon the surfaces of materials. Such meshes can be regular or random (Figure 4.27) and the nodes can serve as the origins for creating new compositions using pattern-based operations applying tools typical from all 3D CAD software, such as extrusions, subtractions, Boolean operations, holes, grooves, among others.
Furthermore, it is also possible to apply these textures upon 3D areas or curved surfaces instead of just upon planar surfaces. For example, in the case of Figure 4.26, a 2D pattern is projected upon a non-planar surface. The pattern is based on square cells (black and white) similar to those from a chess board. The dimension of these squares, their rotation and their displacements have to be defined in order to get them adequately displayed upon the surface. The borders of the region should be well defined for avoiding troubles during the subsequent iterations of the software when computing the 2D patterned texture. The next step is to define the geometry (sphere, hole, cube...) which should be repeated within the gap of the squares previously defined. Repeated copies of the desired geometry, placed upon the defined nodes and joined to or subtracted from the surface lead to the 3D textured material or device.

118
Figure 4.26. Texture applied on 3D surface based on a patterned structure. 3-matic by Materialise
Mesh based points is another further advanced process to get an additional control of any topography or texture upon a surface. From a randomized mesh surface of the part, we are able to create control nodes. These nodes can serve as the origins for creating new compositions using pattern-based operations using tools typical from all 3D CAD software, such as extrusions, subtractions, Boolean operations, holes, grooves, among others. In Figure 4.27, the process is presented. Firstly, a randomized mesh is created with a graded distribution of elements from the inner to the outer side. Subsequently, we the nodes of the mesh are mapped and used to generate a set of micropillars, which act as texture.
Figure 4.27 Surface texturing based on random patterning with cylinders obtained from a graded mesh of the surface
Chapter 4 Computational modeling of complex geometries
119
The Everest prototype is obtained with a photo-polymer resin using the Blue Printer 8 machine developed by TU Wien within ToMax. Different micro-textures, designed following biomimetic principles and aimed at improving contact phenomena and overall ergonomics and aesthetics, are obtained with a remarkable degree of precision. In fact, for these large-sized objects this thesis shows that current technology provides the best surface precision and quality ever obtained with additive manufacturing resources.
A comparative study with other additive manufacturing technologies is included in Table 4.5. Comparative summary of technologies for developing micro-textured materials and devices, so as to highlight the relevance of the results obtained. It is important to mention that going down to details below 50 microns normally leads to working areas of less than 10x10mm2 and to overall part sizes of less than 1cm3. With the developed technology, the working area and overall size of the attainable objects are at least one order of magnitude larger, as the prototypes included in present Thesis help to put forward.
This thesis presents the combination of different design strategies, which enable geometrical freedom and promote bioinspired approaches, together with the benefits from a recently developed additive manufacturing technology, which combines the advantages of digital light processing and laser stereolithography and incorporates noteworthy hardware and software innovations. Results have shown a remarkable control of the surface topography of polymeric probes and devices, as well as the possibility of obtaining design-controlled micro-structured surfaces upon macroscopic probes and devices.
The mentioned design strategies promote freedom of design and can be combined towards the development of knowledge-based multi-scale and micro-structured materials and devices with design-controlled features, which out for the attainable degree of detail, for the high aspect ratios, for the manufacturing speed and for the possibility of obtaining microtextured materials and devices in complex shapes and macroscopic sizes, which are quite difficult or even impossible to manufacture using conventional micromachining technologies or previously available high-precision additive manufacturing resources.
Regarding future studies, it will be important to focus on exploring in depth the possible applications of design-controlled textured materials and related devices. It is foreseen relevant implications for areas including: tribology, due to the potential promotion of adhesion or lubrication by using the adequate textures; micro-fluidics, due to the possibility of controlling the hydro-phobicity and hydro-philicity of materials by acting on their topography; optics, due to the option of changing surface reflection properties; overall aesthetics and ergonomics, for industries that may benefit from micro-textured surfaces for self-cleaning and nice-touch effects, and biomedical engineering, for the promotion of biomimetic or bioinspired designs of materials and devices with special functionalities. Some applications in such fields are detailed in the following chapter.
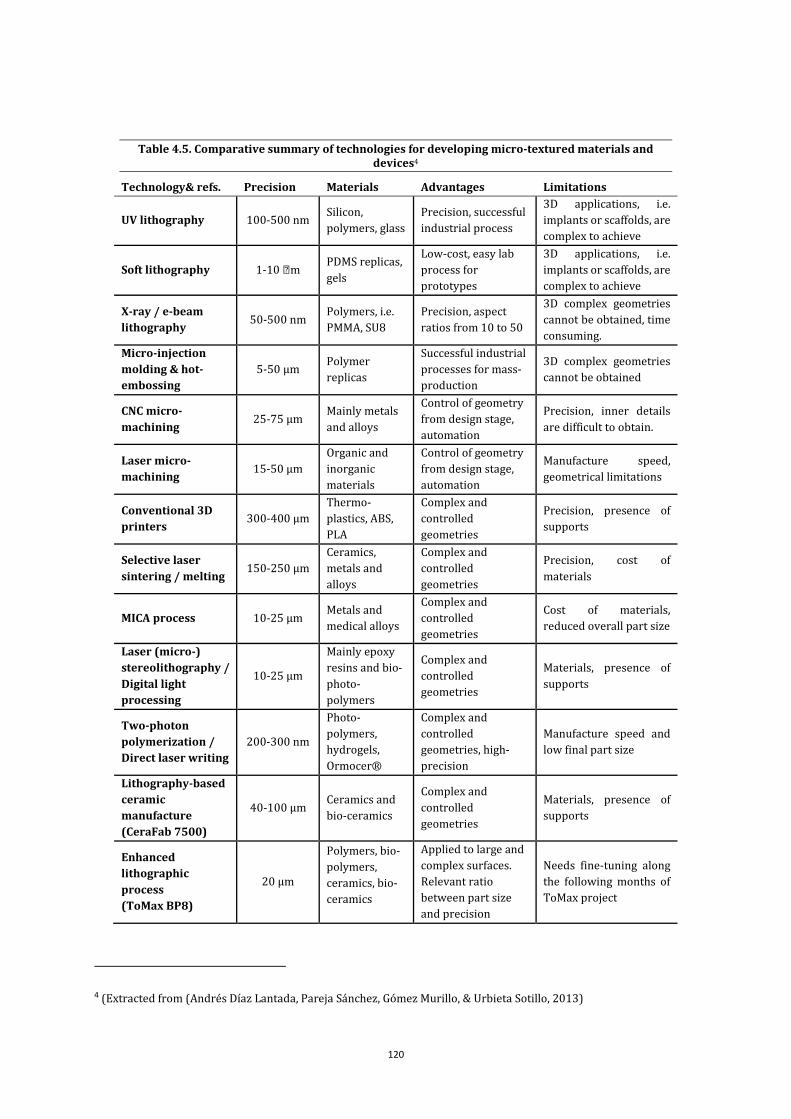
120
Table 4.5. Comparative summary of technologies for developing micro-textured materials and devices4
Technology& refs. Precision Materials Advantages Limitations
UV lithography 100-500 nm Silicon, polymers, glass
Precision, successful industrial process
3D applications, i.e. implants or scaffolds, are complex to achieve
Soft lithography 1-10 m PDMS replicas, gels
Low-cost, easy lab process for prototypes
3D applications, i.e. implants or scaffolds, are complex to achieve
X-ray / e-beam
lithography 50-500 nm
Polymers, i.e. PMMA, SU8
Precision, aspect ratios from 10 to 50
3D complex geometries cannot be obtained, time consuming.
Micro-injection
molding & hot-
embossing 5-50 µm
Polymer replicas
Successful industrial processes for mass-production
3D complex geometries cannot be obtained
CNC micro-
machining 25-75 µm
Mainly metals and alloys
Control of geometry from design stage, automation
Precision, inner details are difficult to obtain.
Laser micro-
machining 15-50 µm
Organic and inorganic materials
Control of geometry from design stage, automation
Manufacture speed, geometrical limitations
Conventional 3D
printers 300-400 µm
Thermo-plastics, ABS, PLA
Complex and controlled geometries
Precision, presence of supports
Selective laser
sintering / melting 150-250 µm
Ceramics, metals and alloys
Complex and controlled geometries
Precision, cost of materials
MICA process 10-25 µm Metals and medical alloys
Complex and controlled geometries
Cost of materials, reduced overall part size
Laser (micro-)
stereolithography /
Digital light
processing
10-25 µm
Mainly epoxy resins and bio-photo-polymers
Complex and controlled geometries
Materials, presence of supports
Two-photon
polymerization /
Direct laser writing 200-300 nm
Photo-polymers, hydrogels, Ormocer®
Complex and controlled geometries, high-precision
Manufacture speed and low final part size
Lithography-based
ceramic
manufacture
(CeraFab 7500)
40-100 µm Ceramics and bio-ceramics
Complex and
controlled geometries
Materials, presence of supports
Enhanced
lithographic
process (ToMax BP8)
20 µm
Polymers, bio-polymers, ceramics, bio-ceramics
Applied to large and complex surfaces. Relevant ratio between part size and precision
Needs fine-tuning along the following months of ToMax project
4 (Extracted from (Andrés Díaz Lantada, Pareja Sánchez, Gómez Murillo, & Urbieta Sotillo, 2013)

Chapter 4 Computational modeling of complex geometries
121
4.4 Modeling the manufacturing process: Quality control from design in lithography-based techniques
This section is an improved and updated version of our paper presented at the National Congress of Mechanical Engineering CNIM 2016 in Elche, which received the recognition of the best applied research.
When making a design, the main criteria to follow is the know-how of the manufacturing technique to be used. As in traditional processes, additive manufacturing methods must also bear in mind these aspects. In the case of SLA, the main factor to be considered is the variations in the mechanical properties of the material during manufacture. Due to the polymerization reaction, the state of the material undergoes a transition from liquid to solid passing through an interim state prior to its glass transition called ‘gelation’ (Figure 4.28). In addition, the density varies over time and there are two dimensional variation effects: i) thermal dilation due to the laser energy action on the resin; ii) volumetric creep due to polymerization (Y.-M. Huang & Jiang, 2003).
In the a)‘free surface’ processes as well as in the b)‘restricted surface’ processes, the recently polymerized parts are subject to external forces, either momentary ones such as that of the action of the brush that levels the surface of the liquid resin (a), the adhesion forces at the bottom of the tank (Kovalenko, Garan, Shynkarenko, Zelený, & Šafka, 2016) (b) or the action of gravity (a,b).
This is why, if possible, it is convenient to know the properties of the material in its ‘gelation’ state, which we may assume to be the critical point since the mechanical properties are not definitive. Thus, we could orientate the part design by limiting the geometries to be made and use safety factors to calculate the thicknesses, etc. In this way, the chances of success in the 3D printing could be increased and the final finish of the part would be improved. Also, the redesign times would be eliminated and material cost through repeating the process would decrease.
Figure 4.28. Photopolymerization process for a photoreactive base material (left) a representative layout of the photopolymerization of a layer using a laser beam for the stereolithography process (right): ‘free surface’.
The development of the processes in parallel that help understand and optimize these Additive Manufacturing techniques is therefore innate. In the same way that the traditional manufacturing processes have been modelled to obtain simulations prior to the process, the various additive manufacturing techniques are also being modelled for quality predictions from the design stage+
Since 1994, (Guess & Chambers, 1995) it has been attempted to create a numerical model that would model the behaviour during polymerization and compare it to the results obtained through experimentation.

122
The main cause of dimensional variation in SLA was caused by the linear creep effect (ε) during polymerization. Nahara et al. (Narahara H., Kishimani, Igarashi, & Saito, 1997) set up an experiment to clarify the solidification phenomenon. Bugeda et al. (Bugeda, Cervera, Lombera, & Onate, 1995) developed a finite element program that simulated the mechanical behaviour of the resin using a constant Young’s modulus elastic model and constant Poisson ratio. Tanaka et al. proposed a model in which the resin properties were based on the properties of the resin itself, after polymerization. Huang et al. (You-Min Huang & Lan, 2005) proposed a complex dynamic finite element model to simulate the polymerization process. However, in spite of over twenty years of study of the photopolymerization process in stereolithography, there is still no simple model tabulated for each material and printer to simplify the limiting factors to be taken into account when manufacturing a part using SLA technique.
The rise in production using SLA printers has proportionally led to the need to find a simple method to allow the user to know the feasibility of manufacturing the end part, and should it not be feasible, to reconsider the design and apply corrective factors to the thickness and reduce critical stress situations as already shown in previous publications Stava et al. (Stava, Vanek, Benes, Carr, & Měch, 2012).
Therefore, it is proposed a model that simplifies the epoxy resin polymerization photoelastic process (Dulieu-Barton & Fulton, 2000) and the dependency on the time slope of the mechanical
properties of the material to be used in the simulation (E(dt), ν(dt))(Guess & Chambers, 1995) for a constant value of these properties in its gelation state (E(tg), ν(tg)), the point at which theoretically the material reaches a critical situation (breaking strain). Being E the Young’s Modulus and ν the Poisson’s ratio for the material
We can then use these parameters to carry out a simplified FEM study of the part to be printed by applying a linear elastic model and observing which areas of the part to be printed might be critical areas (Figure 3).
Figure 4.29. Example of FEM applied to a part to be manufactured by SLA and critical area. Image source: (Stava et al. 2012)
Phenomena under study
By making two calibration test pieces CP01 and CP02 (Figure 4.30.c) printed with SLA-3500 and Accura® 60 epoxy resin (see Chapter 3, materials section), to enable the team to create a database of critical situations or dimensional errors in the manufacture of the parts by SLA ‘free surface’, it was possible to observe a phenomenon that up to now has not been recorded in the literature to the team’s knowledge.

Chapter 4 Computational modeling of complex geometries
123
The case in question is a is a square section layer constructed as a cantilever with constraints at the corners (Figure 3.c). Moreover, the direction of construction is XYX/Y, that is, layers formed on the XY plane alternating the directions of the vector at X and Y. Immediately after manufacturing this test piece, photos were taken of it where a concavity could be seen in the centre of the section, which was proportional to the size of the section. It was decided to find out if the deformation was due to the part being manipulated after manufacture, as is the case of parts diagnosed as ‘CreepBar’ types (Figure 4.30.b), where the intention is to study the stability of SLA parts in their recent polymerized state after the manufacturing process (Pang, 1994). Therefore, the same test was repeated on 6 different occasions and the result was the same.
To measure this deformation, it was decided to use an Olympus DSX100 optical-digital microscope which generates HDR images, then process the shots taken a different range of depth and generate a 3D model of the deformation. The method used to calculate the maximum deformation (dmax) at the centre of the section is based on taking the average distance to points (z1, z2, z3, z4) of the corner sections of the part (Table 4.6). Once the position of these points is known, the plane п(z1, z2 , z3,
z4 ) of the section is calculated in such a way as to correct any possible deviations (inclination) caused during the manufacture of the test piece, that could interfere in the measurement. Then, the same measurement is taken at the mid-point of section Zm and dmax is calculated by diagonals (4.3), with a final result: dmax= 240 µm.
max
( )
2
zi zjd zj zm
− = + −
(4.3)
Table 4.6. Measurements taken at the reference points of the square section using an Olympus DSX100 for element E11 of the test piece CP01
Element Microscope depth Position (µm)
z1 -3575 429 z2 -3501 499 z3 -3648 352 z4 -3599 401 zm -3820 180
Figure 4.30. a) Typically called ‘Curling’ effect of a cantilever beam due to creep through ‘free surface’ polymerization processes; b) calibration test piece and deformation observed.
a)
c)
b)
CP01 CP02 E11
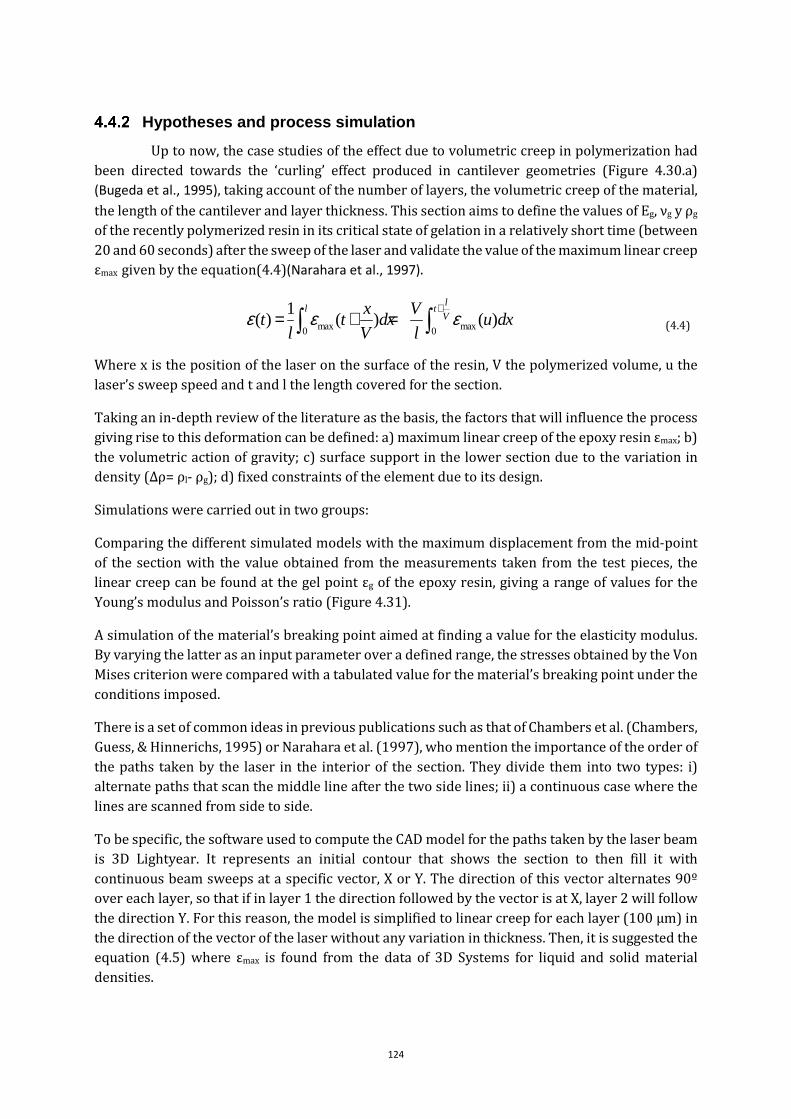
124
Hypotheses and process simulation
Up to now, the case studies of the effect due to volumetric creep in polymerization had been directed towards the ‘curling’ effect produced in cantilever geometries (Figure 4.30.a) (Bugeda et al., 1995), taking account of the number of layers, the volumetric creep of the material,
the length of the cantilever and layer thickness. This section aims to define the values of Eg, νg y ρg
of the recently polymerized resin in its critical state of gelation in a relatively short time (between 20 and 60 seconds) after the sweep of the laser and validate the value of the maximum linear creep εmax given by the equation(4.4)(Narahara et al., 1997).
max max0 0
1( ) ( ) ( )
ll t
Vx V
t t dx u dxl V l
ε ε ε+
= + =∫ ∫ (4.4)
Where x is the position of the laser on the surface of the resin, V the polymerized volume, u the laser’s sweep speed and t and l the length covered for the section.
Taking an in-depth review of the literature as the basis, the factors that will influence the process giving rise to this deformation can be defined: a) maximum linear creep of the epoxy resin εmax; b) the volumetric action of gravity; c) surface support in the lower section due to the variation in density (∆ρ= ρl- ρg); d) fixed constraints of the element due to its design.
Simulations were carried out in two groups:
Comparing the different simulated models with the maximum displacement from the mid-point of the section with the value obtained from the measurements taken from the test pieces, the linear creep can be found at the gel point εg of the epoxy resin, giving a range of values for the Young’s modulus and Poisson’s ratio (Figure 4.31).
A simulation of the material’s breaking point aimed at finding a value for the elasticity modulus. By varying the latter as an input parameter over a defined range, the stresses obtained by the Von Mises criterion were compared with a tabulated value for the material’s breaking point under the conditions imposed.
There is a set of common ideas in previous publications such as that of Chambers et al. (Chambers, Guess, & Hinnerichs, 1995) or Narahara et al. (1997), who mention the importance of the order of the paths taken by the laser in the interior of the section. They divide them into two types: i) alternate paths that scan the middle line after the two side lines; ii) a continuous case where the lines are scanned from side to side.
To be specific, the software used to compute the CAD model for the paths taken by the laser beam is 3D Lightyear. It represents an initial contour that shows the section to then fill it with continuous beam sweeps at a specific vector, X or Y. The direction of this vector alternates 90º over each layer, so that if in layer 1 the direction followed by the vector is at X, layer 2 will follow the direction Y. For this reason, the model is simplified to linear creep for each layer (100 µm) in the direction of the vector of the laser without any variation in thickness. Then, it is suggested the equation (4.5) where εmax is found from the data of 3D Systems for liquid and solid material densities.
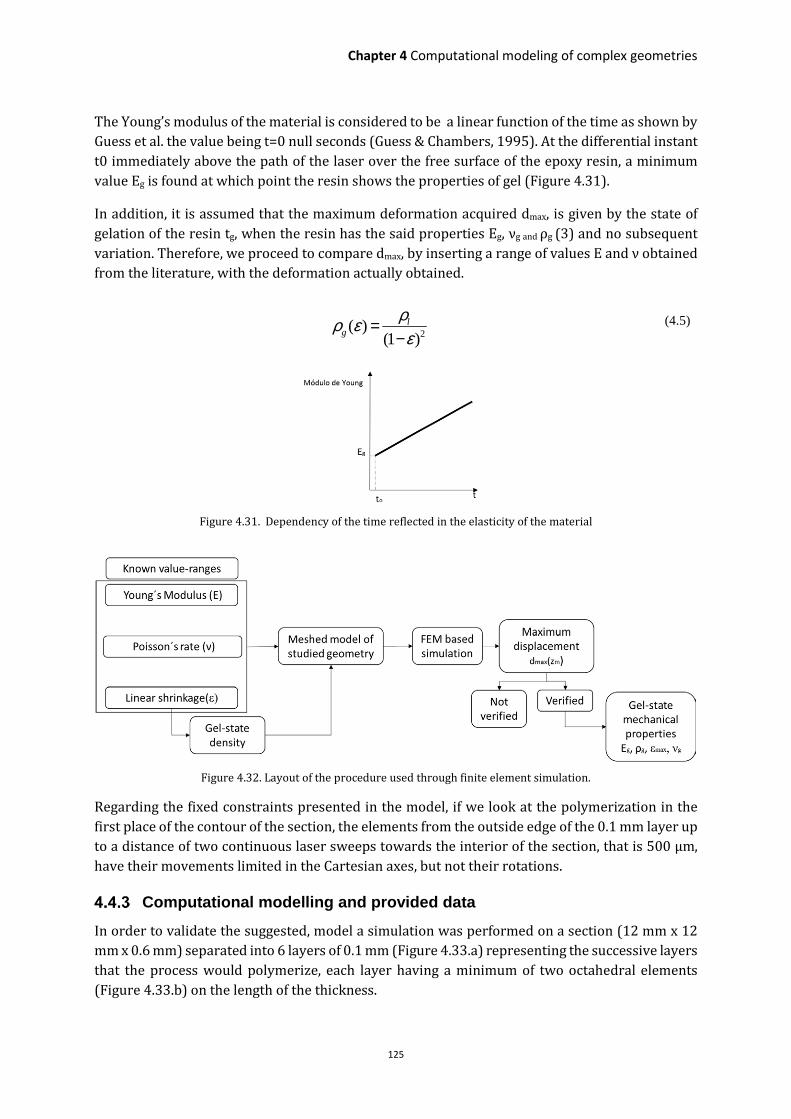
Chapter 4 Computational modeling of complex geometries
125
The Young’s modulus of the material is considered to be a linear function of the time as shown by Guess et al. the value being t=0 null seconds (Guess & Chambers, 1995). At the differential instant t0 immediately above the path of the laser over the free surface of the epoxy resin, a minimum value Eg is found at which point the resin shows the properties of gel (Figure 4.31).
In addition, it is assumed that the maximum deformation acquired dmax, is given by the state of gelation of the resin tg, when the resin has the said properties Eg, νg and ρg (3) and no subsequent variation. Therefore, we proceed to compare dmax, by inserting a range of values E and ν obtained from the literature, with the deformation actually obtained.
2( )
(1 )l
g
ρρ εε
=−
(4.5)
Figure 4.31. Dependency of the time reflected in the elasticity of the material
Figure 4.32. Layout of the procedure used through finite element simulation.
Regarding the fixed constraints presented in the model, if we look at the polymerization in the first place of the contour of the section, the elements from the outside edge of the 0.1 mm layer up to a distance of two continuous laser sweeps towards the interior of the section, that is 500 µm, have their movements limited in the Cartesian axes, but not their rotations.
Computational modelling and provided data
In order to validate the suggested, model a simulation was performed on a section (12 mm x 12 mm x 0.6 mm) separated into 6 layers of 0.1 mm (Figure 4.33.a) representing the successive layers that the process would polymerize, each layer having a minimum of two octahedral elements (Figure 4.33.b) on the length of the thickness.

126
The successive layers were modelled with a solid joint while the fixed displacements were applied to the opposite sides of the sections, the same being applied to the fixed constraint. Gravity is taken into account (9.81 m/s2), as well as the flotation effect due to the difference in densities between the epoxy resin and the six polymerized layers. The result illustrated in Figure 4.33.c shows the value of the deformity in the Z axis and coincides with what was observed in the test pieces, with the maximum displacement at the centre.
After completing the validation, we proceeded to simulate the element E11 (10mm x 10mm x 0.6mm). Due to the model proposed having prescribed displacements, the value of the Young’s modulus has an influence of the order of 10-8 on the maximum displacement value, using a neutral value at the beginning. Thus, in the first simulation group only Poisson’s ratio (ν) varies in a range of [0.2 – 0.45] and the linear creep (εg) varies for values between [0.5% – 4%].
In Figure 4.36Figure 4.35 (left), it can be appreciated the initial range of study and the band shown in the section with the diagonal plot, which represents the area of influence with values close to the measured dmax (110µm). On the other hand, it can be seen that Poisson’s ratio has a low influence on the displacement. However, with values higher than this ratio, the absolute value of dmax diminishes, with this relationship being linearly proportional to the imposed linear creep. With a more detailed range for ε, in the indicated band [1.4%-2.2%], it can be finished up with the values in Table 4.7. Values selected for Poisson’s ratio and linear creep, revealing the least relative error compared to the maximum displacement (dmax)., which shows the values with least error with respect to the maximum displacement value measured.
Figure 4.33. a) Representation of the geometric model to be studied: interspersed displacements imposed on the layers; b) symmetric meshed model; c) deformation of the model through the action of the loads and imposed
constraints.
Taking the values obtained (Figure 4.35) and the proposed hypothesis, it can be pointed out that εg = εmax = 1.6%. where the value of the material’s maximum creep only varies by 0.1% compared to an epoxy resin of the same base (SL 5170) obtained by actual in-situ measurements (Guess &
Chambers, 1995)) with the previous generation SLA-250 machine from 3D systems.
a) b)
c)

Chapter 4 Computational modeling of complex geometries
127
Substituting in the proposed equation (2), gives ρg= 1.17 kg/m3. Now, since we know from the Accura®60 resin specification sheet that ρs= 1.21 kg/m3, we test the hypothesis of a situation in which the resin shows some intermediate properties, although close to those of a solid. Moreover, the value found for Poisson’s ratio (0.3) corresponds to that found by Chambers et al. (Chambers et al., 1995) in 1995, by an analytical application of a linear elastic model. For that reason, the parameter values obtained to carry out the second group of simulation were verified.
For the second simulation group, it was proposed to use the parameters and thus simulate the same conditions with the element E11 of test piece CP02 (15 mm x 15 mm x 0.1 mm). However, in this case the boundary conditions imposed were not simplified. The study elements were tetrahedral. Therefore, the lower supports of the parts that hold the first layer in a cantilever on four points were included (Figure 4.33.a), with solid properties being applied to them (E=2000 MPa, ν=0.43 y ρ=1.21 Kg/m3).
Since this element could not be manufactured due to an excessive accumulation of stress at its corners (Figure 4.33.c), that exceeded the material’s breaking point, it was attempted to parameterize the model’s Young’s modulus and make it run a limited range of the values known in the literature. The ensuing results are the maximum Von Mises σvm strains in the geometry. In this way, the value of E can be found and in addition the breaking strain under the conditions described.
The limiting value considered for the breaking strain of a recently polymerized section of epoxy resin is: 0.45MPa, obtained in the in-situ tests by Guess et al. in tensile tests. To find the Young’s modulus we evaluated the range [0.1-35] MPa with the maximum of 35 MPa obtained from tests on polymerized layers after 3 minutes with a single laser sweep (Guess & Chambers, 1995). Figure 4.36. Graphs of the values found after the finite element simulation for the values of maximum strain following the Von Mises criterion in the geometry studied. shows two graphs in which the elasticity modulus is varied, including the order of magnitude of elasticity modulus E and by being more specific we can obtain a constant value to obtain braking strain values at the points in the test where the breakage was seen to occur.
As can be observed in Figure 4.36. Graphs of the values found after the finite element simulation for the values of maximum strain following the Von Mises criterion in the geometry studied. left, the range used for the first study showed too wide a spectrum since the maximum values of the Von Mises strain in the geometry exceeded the imposed limit. For that reason, the model was repeated to obtain a defined value for E=2.1 MPa.
To again validate this parameter, it is evaluated the tendency measured in the experiments of Guess et al. for the initial modulus of an SL 5170 epoxy resin fiber as a function of the time taken after the laser sweep over the resin. A fitted function was obtained (4) with an R2=0.9979 (Figure 4.37). Thus, we find that the value of the initial modulus obtained through the analytical procedure would correspond to a time tg of 49 seconds, which perfectly fitted the initial hypothesis of some of the properties of the resin at the instant after polymerization, without it having acquired the properties of a solid.
���� � 14.401� � 9.7363 (MPa) (4.6)

128
Figure 4.34. a) Meshed geometry with tetrahedral elements; b) maximum strains in the geometry obtained with the Von Mises criteria; c) detail of the CP02 test piece and the breaking of the elements at their points of
support.
Table 4.7. Values selected for Poisson’s ratio and linear creep, revealing the least relative error compared to the maximum displacement (dmax).
ν ε dmax Err.
(dmax)
0.2 0.015 0.1058 3.81%
0.2 0.016 0.1128 2.55%
0.25 0.015 0.1048 4.72%
0.25 0.016 0.1117 1.54%
0.3 0.016 0.1105 0.45%
0.35 0.016 0.1091 0.81%
0.4 0.016 0.1075 2.72%
0.4 0.017 0.1142 3.81%
0.45 0.016 0.1056 4%
0.45 0.017 0.1122 2%
Below, the guide values obtained from the proposed analytical model are shown:
Table 4.8. Results obtained from the simulation of the mechanical properties of the photo curable epoxy resin and line-ar creep during the during the laser stereolithography additive
manufacturing process.
Parameter Value Units
Еg 2.1 MPa
νg 0.3 -
ρg 1.17 Kg/m3
εg 0.016 -
tg 49 s
a)
b) c)

Chapter 4 Computational modeling of complex geometries
129
Figure 4.35. Graph of the maximum displacement in absolute values on the Z axis, obtained from the variation in the linear creep parameters and Poisson’s ratio.
Figure 4.36. Graphs of the values found after the finite element simulation for the values of maximum strain following the Von Mises criterion in the geometry studied.
Figure 4.37. Initial epoxy resin modulus as a function of time after the sweep of the laser beam. Trend line obtained for the range of values of influence in the study.
0
0,05
0,1
0,15
0,2
0,25
0,3
0,005 0,01 0,02 0,03 0,04
zm (
mm
)
ε
V=0.2 v=0.25
v=0.3 v=0.35
V=0.4 v=0.45
0,08
0,1
0,12
0,14
0,16
0,014 0,016 0,018 0,02 0,022
zm (
mm
)
ε
v=0.2v=0.25v=0.3v=0.35v=0.4v=0.45
0
1
2
3
4
5
6
2 6 10 14 18 22 26 30 34
σv
m (
MP
a)
Young´s Modulus E (MPa)
0,4
0,45
0,5
0,55
0,6
2 2,2 2,4 2,6 2,8 3
σv
m (
MP
a)
Young´s Modulus E (MPa)
0
200
400
600
800
1000
1200
1400
1600
0 100 200 300
Init
ial
Mo
du
lus,
Ei
(MP
a)
Time (minutes)
0
50
100
150
200
250
300
0 10 20 30
Init
ial
Mo
du
lus,
Ei
(MP
a)
Time (minutes)
Influence
range

130
4.5 Case of study: coupling of functionally graded materials and ‘ad-hoc’ supports structure into an AM design
The manufacturing of complex structures as the presented in the previous sections, for controlling bulk material properties, may affect part manufacturability. Due to the complexity of the geometries, several difficulties may appear into scene: cantilevers, thin vertical walls, the need of draining holes or the separation forces in the constrained surface processing are main factors to consider as they may prevent from obtaining a final product. Regarding that, we introduce a case of study presented at the MSE congress in 2016 in Darmstadt (Germany) under the title ‘Design strategies for functionally graded materials towards reliable and eco-sustainable additive
manufacturing’. This subsection provides an improved, updated and more detailed version of that study, which is written down for the first time.
In this context, the model suggested for the mechanical properties of a generic polymer-based resin can be useful for obtaining designs which take advance of the benefits that to manufacture in an additive method can offer. Besides, when introducing the concept of controlling the properties from the design state at such level of complexity, it makes sense to evaluate the viability of production by means of computational modeling, thus avoiding non-useful trials of potential printed parts and the subsequent material wasted. Based on the model presented in the Section 4.4, it is introduced a process which implicates certain degree of iteration with the designer to allow a more effective, costless and that can aim to reduce the lead time of the industrial production in additive manufacturing of polymer-based materials with slight modifications, the procedure can be adapted to LCM.
Figure 4.38 presents a case of study for the SLA-printing of a ‘L’ figure, where the designer must incorporate support structures to an overhanging surface parallel to the plane of the building platform. Moreover, the overhanging section has only one point of connection with the base of the part and it is heavier than this. Additionally, the section of the pole that stands in the building direction has a rectangular section in the XY plane been the short side of it perpendicular to the cross section of the overhanging block. As a result, the stiffness of the bar with indeed a considerable length in contrast with its cross section, is smaller and it could lead to the bending of the overhanging section and thus to produce geometrical differences.
Figure 4.38.Representative design of an overhanging surface obtained by SLA ‘bottom-up’ case of study for the incorporation of computational modelling in AM design
Overhanging
Building
platform XY Pole
x
z
y Support volume
Building direction

Chapter 4 Computational modeling of complex geometries
131
In a common case, the design would be placed in the platform with another building orientation rather than the presented in the Figure 4.38. However, for the purpose it is intended an evaluation case which requires that specific orientation being the Z axis longitudinal to the pole of the part. Following the sequence of printing preparation, the support structures would be generated according to the cantilever area and the support volume. In Chapter 5 the direct relation is explained of a sustainable manufacturing and the environmental impact with the generation of the mentioned supports. From that, the strategy comes to reduce the need of mass support and to reduce the contact points of the generated support structures with the cantilever surface, improving the surface quality of the part which presents less defects due to the removal of the supports afterwards. As the building direction is not a parameter to modify, it is not possible to play with the colocation of the part on the building platform to optimize a minimum support volume (Ezair, Massarwi, & Elber, 2015).
Therefore, at the same area of the part to be supported during printing the only way to considerably decrease the material wasted as supports is to minimize the amount of material used for such purpose. Based on the active learning, the help of the process modeling of photopolymeric material previously described and the database developed during the project that encompass the main criteria of different technologies to be hold for ‘pushing-to-the-limit’ AM design, it is feasible to plan tiny geometries with enough stiffness to be self-supported, to serve as contact points and to have a proper geometrical definition.
If the case of study concerned was prepared for printing, generating ‘by default’ supports the scenario could be like it is shown in the Figure 4.39, where the whole support volume is mainly occupied by supporting material. Although, offsets of 3mm to the external and internal edges are setup and a web-chain with a side of 5mm is defined for the main body of the block, the mass used in this case is still high. Consequently, this Thesis arranges a new plan for reducing the material towards more eco-efficient processes.
Figure 4.39. Default supports: a) example of supports structures generated with the help of 3D Data Experte from Deskartes. b) detail of teeth contacts between support block and part.
In Figure 4.40, it is shown the suggested solution (in yellow), which the support structures are vertical poles of φ 1mm and contact section of φ 0,2mm which include a small crisscross framework (φ 0.8mm) to add stiffness to the supporting block.
a)
b

132
It must be pointed out that the weight of the total supporting framework is 10 times lighter than the part itself. The red layer represents the backlayer exposure necessary to assure the standing of the first layers to the building platform, only 200 µm-thick.
From the premise of the solution suggested which is based on the experience collected in the database, we proceed to evaluate via finite element method the suitability of the structure during the printing process. For that, two important situations which appear during the printing must be considered as a milestone for the job: i) first scanning layer (Figure 4.41.b) immediately after the last generated for the supports (Figure 4.41.a) and ii) the part is already printed, the supports must hold the total weight of the cantilever section of the ‘L’ (Figure 4.41.c). Given the attending case, the first scenario is skipped as it is considered the contact points section and their distribution are strong enough to handle the separation forces that occur during the recoating process in the surface-constrained SLA. Therefore, we move forward to the study of a part completely holding by the supports.
Figure 4.40. ‘Ad-hoc’ support structures defined for the case of study reducing material waste; a) Supports in yellow attached to the backlayer (red) and part (blue); b) contact points distribution on the cantilever surface; c) contact
point cross section for the supports of the part.
Figure 4.41. Screenshots of the slicing by PreForm showing the time lapses referred: a) Last layer of supports section; b) first layer of cantilever section right after the supports and c) end result of the printed part holding attached to the
platform.
The pertinent verifications are carried out to the model considering an infinitesimal delta of time δ, when the complete laser scanning of the layer has taken place and the whole cross section is already fully cured but in its ‘gelation’ state.
a)
b
c)
Φ 200µm
7mm
a) c) b

Chapter 4 Computational modeling of complex geometries
133
The dynamic finite element simulation (Y.-M. Huang & Jiang, 2003) is then avoided, studying a
static (4.7), linear and elastic case to simplify considerably the model, according to the described one.
0 � " ∙ S % &' (4.7)
Being Fv the volumetric forces and "( the superficial forces.
The cured part is meshed with solid volumetric elements (Figure 4.42), in this case quadratic tetrahedral elements are chosen for the purpose. The element size varies from 0.1mm up to 4mm, refining the elements in the transition from the rectangular layer to the contact of the supports, where the maximum stress is expected to be detected (Figure 4.42.b). Although the mesh does not present symmetry or the use of homogenous elements (e.g. cubic), the main reason of generating a physics-based mesh is to obtain a smooth transition between elements of different printed blocks (support, part and backlayer) in the way that it can be considered as a ‘one-solid’ rigid join, to reduce mesh-computing time and ,in the end, to provide to the end-user (designer) with a simple procedure to follow up, not only for industrial applications but also daily manufacturing of common products, a rapid way to verify the feasibility of the proposed jobs before launching the printing.
Figure 4.42. Images of the mesh applied to the part for its study by FEM: a) Assembly of part, supports and backplate; b) detail of the mesh elements at the contact points transition and c) backlayer fixed constrain to the top face.
To solve the system for the final printed part scenario, the boundary conditions shall be defined. No imposed forces loads are evaluated and the case is summarized on the effect of permanent loads acting on the object standing on the building platform. The more relevant force affecting the part is gravity, the default value is g_const which is the physical constant having the value 9.8066 m/s2 acting in the negative z direction. The contact between backlayer and the flat surface of the building contact is therefore modelled as a prescribed fixed constrain where the nodes on the top face of the backlayer have none displacement (u=0) The complete object is considered as one solid component.
Given that the object is imported in one file non-distinguishing the differences of laser scanning properties between the part itself and the supports structures, the material properties definition is the same for every element of the mesh. The material applied is isotropic and the model is a discrete linear elastic avoiding non-linearity and large strains.
Gravity
a) b c)

134
An approximate solution is given by the characterization of the polymeric material based on the Young’s modulus, the Poisson’s ratio and the density of the resin. The material formulation (Chapter 3) for this job is a non-commercial and experimental mixture based on acrylates, thus the mechanical properties are not indeed rated which complicates the process to simulate the scenario. For that reason, it is considered a proper approach to use a range of properties defined previously for the commercial polymeric material in its gelation state (Table 4.9) and it contrast with the results published for the constrained surface SLA models (Liravi, Das, & Zhou, 2015) and the measurements for SL 5149 acrylate (Leeb et al. 2011).
Table 4.9. Material properties for the polymeric material
Name Value Unit
Young's modulus 1.6e9 Pa
Poisson's ratio 0.38 1
Density 1120 kg/m³
Although the values are not representatives of the material properties at the moment while standing downwards, it is imposed a ‘safety factor’, being these values the most critical situation, in which the polymerization of the whole part would not be satisfactory and the part is not fully cured but in a gelation state. Even though, if the object can stand in its weakest state, it would do when the material is fully polymerized.
The simulation runs in a single step with a relative tolerance of 0.001, the step size 0.778 and only one iteration is required to solve the load case. As a result, the values for the Von Mises stress are plotted and a thorough examination of the elements at the contact point between support structures and block was carried out. As expected there is a linear relation of stress at the contact from the respective vertical of the pole, no critical values are reached being the maximum stress σm 0.25MPa, considering a σc of 0.45MPa (section 4.4.3), subsequently verifying the job for its printing.
Figure 4.43. Von Mises stress (MPa) at the contact point between the backplate and the cantilever block.

Chapter 4 Computational modeling of complex geometries
135
In addition, the influence on the stress level is evaluated when it is considered the incorporation into the design of lattice structures like the presented in the section 4.1.2. Beyond the lightweight of the object and the consequent material saved, it is very interesting to evaluate for the first time the implications that concerns the use of such strategy.
Getting a porous structure with a relative density from the bulk lower than 60%, means that the truss diameter of the lattices goes down to the millimeters, which implies a significant degree of complexity to the geometry. For the laser unit of the SLA printers, this complexity increases considerably the number of jump-ins and outs necessaries for each laser scanning of layer, including the related delay to avoid divergences of the geometry computed. Thus, the processing time for the part shall be longer. Essentially, the next research wants to set a basic approach for the study of the effects when a higher level of complexity is added to the design because of the freedom in the fabrication process. Consequently, a lattice structure is integrated to the inner surface of the cantilever section to the original design of the ‘L’ figure, as is represented in the Figure 4.44. According to the observed linear relation of stresses with respect to the middle plane of the pole, a gradient of thickness for the truss that built the lattice structure is applied from 800 µm starting from the side closer to that plane and decreasing almost linearly down to 200 µm. The calculated porosity regarding the volume modified is 70%, the material saved in comparison with the original design is 35%. Applying the same load case for the finite element analysis, the results show that σm decreases to 20% at the same critical points. In short, the integration of such structure would add value to the design in certain way. However, to validate these theoretical results it is proceed to the practice and put into the trials the manufacturing of the object. First the original model and followed by the complex one. That way, it can be tested the feasibility of the design for its printing, as well as, to observe if the new version is time consuming. In short, a design modification, as the presented, could not be optimum or actually beneficial for the final purpose when its repercussion on other manufacturing variables as processing time and energy consuming result unfavorable in terms of sustainability.
Figure 4.44. a) Images of the inner lattice structure integrated to the 'L' object, b) the detail of the functionally graded thickness of the truss and c) Von Mises stress in the contact points.

136
Both designs are carried out for an academic purpose validating the suitability of the ‘ad-hoc’ supports and the deviation in time processing of the derived design. The printer used was the prototype machine developed under ToMax by the AMT department of the Technical University of Vienna, the BP8 (see Chapter 3, machines). The whole model was scaled down (0.3) to fit the building dimensions of the smaller platform (50 * 50 ++) which in this case was used to reduce the separation forces. The final dimensions of the surrounding box are 6mm x 15 mm x 30mm.
Figure 4.45 shows the object standing on the platform during the process and how the support structures hold without bending or failing. The aimed structures performed successfully the requirement of standing and supporting appropriately the cantilever structure avoiding a possible deviation produced by the shrinkage and the effect of the gravity on the part.
The final results illustrate a printed part (Figure 4.46), which supports are easily removed, not leaving considerable marks on the contact points of the cantilever section. Moreover, the version of the original was printed (including a draining hole) obtaining a lighter object, but only a reduction of 25%. This fact can be related to trapped resin in the inner volume where the lattice was applied, showing that the solution must consider the evacuation of that during the process. The processing time of the version takes 1 minute longer.
Figure 4.45. Pictures of the printing process for the case of study standing on the platform.
The gathered conclusions of this first approach reside on the evidence that an ‘ad-hoc’ design for the supports structures in the constrained surface process, based on computational modeling to reach almost the limit of printability, provides an effective solution for additive manufacturing production, regarding zero-defect production and inline quality, plus the general product reliability concept. Thus, the consequent material saved and energy wasted on a first attempt is avoided, and replaced by an investment on design, modeling and the necessary iteration for the optimization. Besides, the stress at the critical points which could lead to failure or possible deviation of angle due to the viscosity which presents the material in its gelation state is considerably reduce, with this simple approach up to 20%, The processing time increases insignificantly comparing to the initial by-default-case making this concept at first sight affordable and efficient.
After 200 layers After 600 layers (Finished)
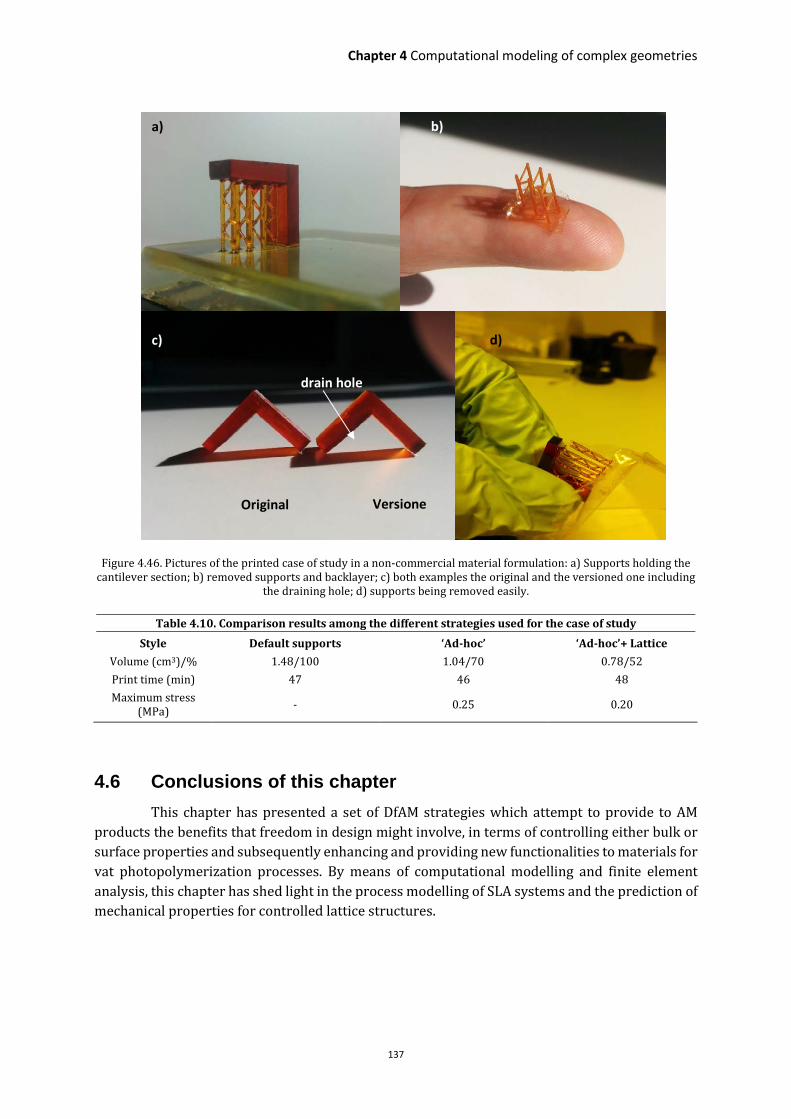
Chapter 4 Computational modeling of complex geometries
137
Figure 4.46. Pictures of the printed case of study in a non-commercial material formulation: a) Supports holding the cantilever section; b) removed supports and backlayer; c) both examples the original and the versioned one including
the draining hole; d) supports being removed easily.
Table 4.10. Comparison results among the different strategies used for the case of study
Style Default supports ‘Ad-hoc’ ‘Ad-hoc’+ Lattice
Volume (cm3)/% 1.48/100 1.04/70 0.78/52
Print time (min) 47 46 48
Maximum stress (MPa)
- 0.25 0.20
4.6 Conclusions of this chapter
This chapter has presented a set of DfAM strategies which attempt to provide to AM products the benefits that freedom in design might involve, in terms of controlling either bulk or surface properties and subsequently enhancing and providing new functionalities to materials for vat photopolymerization processes. By means of computational modelling and finite element analysis, this chapter has shed light in the process modelling of SLA systems and the prediction of mechanical properties for controlled lattice structures.
a) b)
c) d)
Original Versione
drain hole
138
4.7 References of this chapter
A Alderson, A., Rasburn,J., Ameer-Beg, S., Mullarkey, PG., Perrie, W. & Evans, KE. (1999). An auxetic filter: A tuneable filter
displaying enhanced size selectivity or defouling properties. Industrial & Engineering Chemistry Research,
39(3), 654-665.
Álvarez Elipe, JC. & Díaz Lantada, A. (2012). Comparative study of auxetic geometries by means of computer-aided design
and engineering. Smart Materials and Structures, 21(10), 105004.
Archard, J. (1974). Surface topography and tribology. Tribology 7(5), 213-220.
B
Babaee, S., Shim, J., Weaver, JC., Chen, ER., Patel, N. & Bertoldi K. (2013). 3D soft metamaterials with negative Poisson’s
ratio. Advanced Materials, 25(36), 5044-5049.
Barthlott, W. & Neinhuis, C. (1997). Purity of the sacred lotus, or escape from contamination in biological surfaces. Planta,
202, 1-8.
Bejan, A., Lorente, S. (2004). The constructal law and the thermodynamics of flow systems with configuration.
International Journal of Heat and Mass Transfer, 47, 3202-3214.
Bejan, A., Lorente, S. (2010). The constructal law of design and evolution in Nature. Philosophical Transactions of The
Royal Society B: Biological Sciences, 365, 1335-1347.
Berginski, M., Hüpkes, J., Schulte, M., Schöpe, G., Stiebig, H. & Rech, B. (2007). The effect of front ZnO:Al surface texture
and optical transparencyon efficient light trapping in silicon thin-film solar cells. Journal of Applied Physics, 101,
074903.
Berry, MV. & Lewis ZV. (1980). On the Mandelbrot-Weierstrass function. Proceedings of the Royal Society of London A,
370, 459-484.
Bianchi, M., Scarpa, F.& Smith, CW. (2010). Shape memory behaviour in auxetic foams: Mechanical properties. Acta
Materialia, 58(3) 858-865.
De Blas Romero A., Fernandez Zapico, G. Díaz Lantada A. (2016). Simulación del comportamiento mecánico de los
procesos por fotopolimerización de resinas destinadas a la fabricación aditiva mediante estereolitografía láser:
Influencia en la calidad de la pieza. Congreso Nacional de Ingeniería Mecánica CNIM conference paper, Elche.
De Blas Romero A., Díaz Lantada A. (2016). Design strategies for functionally graded materials towards reliable and
eco-sustainable additive manufacturing. MSE conference. Technical University of Darmstadt, Germany.
Briones, V., Aguilera, JM. & Brown, C. (2006). The effect of surface topography on color and gloss of chocolate samples.
Journal of Food Engineering, 77(4), 776-783.
Bückmann, T., Schittny, R., Thiel, M., Kadic, M., Milton, GM.& Wegener, M. (2014). On three-dimensional dilational elastic
metamaterials. New Journal of Physics, 16, 033032.
Bückmann, T., Stenger, N., Kadic, M., Kaschke, J., Frölich, A., Kennerknecht, T., Eberl, C., Thiel, M.& Wegener, M. (2012).
Tailored 3D mechanical metamaterials made by dip-in direct-laser-writing optical lithography. Advanced
Materials, 24(20), 2710-2714.
Bugeda, G., Cervera, M., Lombera, G., & Onate, E. (1995). Numerical analysis of stereolithography processes using the finite
element method. Rapid Prototyping Journal, 1(2), 13–23.

Chapter 4 Computational modeling of complex geometries
139
Bushan, B., Israelachvili, J. & Landman, U. (1995). Nanotribology: friction, wear and lubrication at the atomic scale.
Nature, 374, 607-616.
Buxboim, A. & Discher, DE. (2010). Stem cells feel the difference. Nature Methods 7(9), 695-697.
C
Capolino, F. (2009). Metamaterials Handbook. Vol. I: Theory and phenomena of metamaterials. Taylor and Francis.
Capolino, F. (2009). Metamaterials Handbook. Vol. II: Applications of metamaterials. Taylor and Francis.
Chambers, R. S., Guess, T. R., & Hinnerichs, T. D. (1995). A Phenomenological Finite Element Model of Part Building in the
Stereolithography Process (No. SAND--94-2565C; CONF-9506149--2). Sandia National Labs., Albuquerque, NM
(United States).
Chandra, P. Lai, K., Sunj, HJ., Murthy, NS. & Kohn, J. (2010). UV laser-ablated surface textures as potential regulator of
cellular response. Biointerphases, 5(2), 53-59.
Coffey, WT., Kalmykov, YP. & Waldron JT. (2004). The Langevin equation: With applications to stochastical problems in
Physics, Chemistry and Electrical Engineering. 2nd Edition, World Scientific Publishing Co.
Critchley, R., Corni, I., Wharton, JA., Walsh, FC., Wood, RJ. & Stokes, KR. (2013). The preparation of 3D auxetic foams by
3D printing and their characteristics. Advanced Engineering Materials, 15(10), 980-985.
D
Dawkins, R. (2015). The Blind Watchmaker: Why the Evidence of Evolution Reveals a Universe without Design. W. W.
Norton & Company.
Diaz, L., Lafont, M., Ortego, G., Munoz, S., Munoz, G., Echavarri, O., Endrino, A. (2012, July 25). ES2372343 (B2).
Diaz Lantada, A., De Blas Romero, A., Schwentenwein, M., Jellinek, C., & Homa, J. (2016). Lithography-based ceramic
manufacture (LCM) of auxetic structures: present capabilities and challenges (Vol. 25).
Díaz Lantada, A., Pareja Sánchez, B., Gómez Murillo, C., & Urbieta Sotillo, J. (2013). Fractals in tissue engineering: toward
biomimetic cell-culture matrices, microsystems and microstructured implants. Expert Review of Medical
Devices, 10(5), 629–648.
Díaz Lantada, A. (2016). Microsystems for Enhanced Control of Cell Behavior: Fundamentals, Design and Manufacturing
Strategies, Applications and Challenges. Springer International Publishing.
Dulieu-Barton, J. M., & Fulton, M. C. (2000). Mechanical properties of a typical stereolithography resin. Strain, 36(2), 81–
87.
E
Evans, KE. (2004). Auxetic polymers: a new range of materials. Endeavour, 15(4) 170-174 1991.
Evans, KE., Nkansah, MA., Hutchinson, IJ. & Rogers, SC. (1991). Molecular network design. Nature, 353, 124-124.
Ezair, B., Massarwi, F., & Elber, G. (2015). Orientation analysis of 3D objects toward minimal support volume in 3D-
printing. Computers & Graphics, 51, 117–124.
F
Falconer, K. (2003). Fractal Geometry: Mathematical Foundations and Applications. John Wiley & Sons Ltd..
Felzmann, R., Gruber S, Mitteramskogler G, Tesavibul P, Boccaccini AR, Liska R. & Stampfl J. (2012). Lithography-Based
Additive Manufacturing of Cellular Ceramic Structures. Advanced Engineering Materials, 14(12), 1052–1058.

140
G
Gad-el-Hak M. (2003). The MEMS Handbook. CRC Press, New York.
Gatt, R., Brincat, JP. & Keith, A. (2015). On the effect of the mode of connection between the nodes and the ligaments in
anti-tetra-chiral systems. Advanced Engineering Materials, 17(2), 189-198.
Gatt, R., Caruana-Gauci, R., Attard, D., Casha, AR., Wolak, W., Dudek, K., Mizzi, L. & Grima JN. (2014). On the properties of
real finite-sized planar and tubular stent-like auxetic structures. Physica Status Solidi B, 251(2), 321-327.
Griffin, AC., Kumar, S. & Mullan, PJ. (2005). Textile fibers engineered from molecular auxetic polymers. National Textile
Center Research Briefs – Materials Competency, 1-2.
Grima, JN., Alderson, A., Evans, KE. (2004). Negative Poisson’s ratios from rotating rectangles. Computational Methods in
Science and Technology, 10(2), 137-145.
Grima, JN., Evans, KE. (2000). Auxetic behaviour from rotating squares. Journal of Materials Science Letters, 19, 1563-
1565.
Grima, JN., Oliveri, L., Attard, D., Ellul, B., Gatt, R., Cicala, G. & Recca, G. (2010). Hexagonal honeycombs with zero Poisson’s
ratio and enhanced stiffness. Advanced Engineering Materials, 12(9), 855-862.
Gruber, H. (2006). Rapid-prototyping method and radiation-hardenable composition of application thereto.
PCT/AT2006/000271, WO 2007002965 B1.
Guess, T. R., & Chambers, R. S. (1995). In Situ property measurement on laser-drawn strands of SL 5170 epoxy and SL 5149
acrylate. In Proc Solid Freeform Fabrication Symposium. Univ of Texas, Austin, TX (pp. 134–141).
H
He, C., Liu, P., McMullan, PJ. & Griffin, AC. (2005). Toward molecular auxetics: Main chain liquid crystalline polymers
consisting of laterally attached para-quaterphenyls. Physica Status SolidiB, 242 576-584.
Hengsbach, S. & Díaz Lantada, A. (2014). Direct laser writing of auxetic structures: Present capabilities and challenges.
Smart Materials and Structures, 23, 085033.
Hengsbach, S. & Díaz Lantada, A. (2014). Direct laser writing of fractal surfaces: Strategy to design and manufacture
textured materials. Advanced Engineering Materials, 17(2), 172-180.
Hengsbach, S. & Díaz Lantada, A. (2014). Rapid prototyping of multi-scale biomedical microdevices by combining additive
manufacturing technologies. Biomedical Microdevices, 16(4), 617-627.
Hirotsu, S. (1991). Softening of bulk modulus and negative Poisson’s ratio near the volume phase transition of polymer
gels. Journal of Chemical Physics, 94, 3949-3957.
Huang, Y.-M., & Jiang, C.-P. (2003). Curl Distortion Analysis During Photopolymerisation of Stereolithography Using
Dynamic Finite Element Method. The International Journal of Advanced Manufacturing Technology, 21(8),
586–595.
Huang, You-Min, & Lan, H.-Y. (2005). Compensation of distortion in the bottom exposure of stereolithography process. The
International Journal of Advanced Manufacturing Technology, 27(11–12), 1101–1112
J
Jedlicka, SS., McKenzie, JL., Leavesley, SL., Little, KM., Webster, TJ., Robinson, JP., Nivens, DE. & Rickus JL. (2007). Sol-gel
derived materials as substrates for neuronal differentiation: effects of surface features and protein conformation.
Journal of Materials Chemistry, 16(31), 3221-3230.

Chapter 4 Computational modeling of complex geometries
141
Jeon, H., Koo, S., Reese, WM., Loskills, P., Grigoropoulos, CP. &Healy, KE. (2015). Directing cell migration and organization
via nanocrater-patterned cell-repellent interfaces. Nature Materials 14, 918–923.
K
Kadic, M., Bückmann, T., Stenger, N., Thiel, M. & Wegener, M. (2012). On the practicability of pentamode mechanical
metamaterials. Applied Physics Letters, 100(19) 191901
Kardar, M., Parisi, G. & Zhang YC. (1986). Dynamic Scaling of Growing Interfaces. Physical Review Letters, 56, 889-892.
Kovalenko, I., Garan, M., Shynkarenko, A., Zelený, P., & Šafka, J. (2016). Examining the Relationship between Forces During
Stereolithography 3D Printing and Geometric Parameters of the Model. MATEC Web of Conferences, 40, 02005.
Kwasny W. (2009). Predicting properties of PVD and CVD coatings based on fractal quantitiesdescribing their surface.
Journal of Achievements in Materials and Manufacturing Engineering, 37(2), 125-192.
L
Lafuma, A. & Quere, D. (2003). Superhydrophobic states. Nature Materials 2, 457-460.
Lakes, RS. (1987). Foam structures with a negative Poisson’s ratio. Science, 235(4792) 1038-1040.
Leeb, V., Radetzky, A., & Auer, L. M. (2001). Interactive texturing by polyhedron decomposition. In Proceedings IEEE
Virtual Reality 2001 (pp. 165–171).
Li, D., Dong, L. & Lakes, RS. (2013). The properties of copper foams with negative Poisson's ratio via resonant ultrasound
spectroscopy. Physica Status Solidi, 250(10), 1983-1987.
Lim, TC. (2015). Auxetic Materials and Structures. Springer, DOI: 10.1007/978-981-287-275-3, 2015.
Lim, TC. (2015). Thermal stresses in auxetic plates and shells. Mechanics of Advanced Materials and Structures, 22(3),
205-212, DOI: 10.1080/15376494.2012.727203.
Lipson, H. (2012). Frontiers in additive manufacturing, the shape of things to come. The Bridge, 42(1), 5-12.
Liu, Y. & Hu, H. (2010). A review on auxetic structures and polymeric materials. Scientific Research and Essays, 5(10)
1052-1063.
M
Madou, MJ. (2002). Fundamentals of microfabrication: The Science of miniaturization. CRC Press, 2nd Edition, New York.
Mandelbrot, B. (1982). The Fractal Geometry of Nature. W.H. Freeman, San Francisco.
Mandelbrot, BB. & Van Ness JW. (1968). Fractional Brownian motions, fractional noises and applications. SIAM Review
.422-437.
Mandelbrot, BB. (1982). Weierstrass functions and kin. Ultraviolet and infrared catastrophe. In: The Fractal Geometry of
Nature. W.H. Freeman and Company.
Martin, CR. & Aksay, IA. (2005). Microchannel molding: A soft lithography-inspired approachto micrometer-scale
patterning. Journal of Materials Research, 20(8), 1995-2003.
Mizzi, L., Attard, D. & Gatt, R. (2015). Influence of translational disorder on the mechanical properties of hexachiral
honeycomb systems. Composites Part B-Engineering, 80, 84-91.
Mizzi, L., Attard, D., Casha, AR., Grima JN & Gatt, R. (2014). Physica Status Solidi B, 251(2), 328-337.
N
Naik, VM., Mukherjee, R., Majumder, A. & Sharma, A. (2009). Super functional materials: Creation and control of
wettability, adhesion and optical effectsbymeso-texturing of surfaces. Current Trends in Science, Platinum
Jubilee Special, 129-148.

142
Narahara H, T. F., Kishimani, T., Igarashi, S., & Saito, K. (1997). Reaction heat effect on initial linear shrinkage of
stereolithography resins. In Proceedings of Solid Freeform Fabrication Symposium (pp. 733–740).
Narojczyk, JW. & Wojciechowski, KW. (2010). Elastic properties of degenerate f.c.c. crystal of polydisperse soft dimers at
zero temperature. Journal of Non-Crystalline Solids, 356, 2026-2032.
P
Pang, T. H. (1994). Stereolithography epoxy resin development: accuracy and dimensional stability. 3D Systems Inc.
Patzer, JF. (2011). Generative Fertigung von keramischenBauteilenfürdentaleAnwendungen. Dissertation. TU Wien.
Pozniak, A. & Wojciechowski, KW. (2014). Poisson’s ratio of rectangular anti-chiral structures with size dispersion of
circular nodes. Physica Status Solidi, B-Basic Solid State Physics, 251(2), 367-374.
Pozniak. AA., Smardzewski, J. & Wojciechowski, KW. (2013). Computer simulations of auxetic foams in two dimensions.
Smart Materials and Structures, 22(8).
Prall, D. & Lakes, RS. (1997). Properties of a chiral honeycomb with a Poisson’s ratio of −1. International Journal of
Mechanical Science, 39(3), 305-314.
Pulsifier, DP. & Lakhtakia, A. (2011). Background and survey of bioreplication techniques. Bioinspiration and Biomimetics,
6(3), 031001.
R
Rahmawan, Y., Xu, L. & Yang, S. (2013). Self-assembly of nanostructures towards transparent, superhydrophobic surfaces.
Journal of Materials Chemistry A, 1(9), 2955-2969.
Röhrig, M., Thiel, M., Worgull, M. & Hölscher H. (2012). Hierarchical structures: 3D direct laser writing of nano-
microstructured hierarchical gecko-mimicking surface. Small, 8(19), 3009-3015.
S
Scarpa, F., Jacobs, S., Coconnier, C., Toso, M. & Di Maio, D. (2010). Auxetic shape memory alloy cellular structures for
deployable satellite antennas: design, manufacture and testing. EPJ Web of Conferences, 6 27001.
Schwentenwein, M. & Homa J. (2015). Additive manufacture of dense alumina ceramics. Applied Ceramic Technology.
Soman, P., Lee, JW., Phadke, A., Varghese, S. & Chen, S. (2012). Spatial tuning of negative and positive Poisson’s ratio in a
multilayer scaffold. Acta Biomaterialia, 8(7), 2587-2594.
Soo, SC., Yu, KM. (2013). Rapid prototyping for self-similarity design. Journal of Materials Processing Technology,139,
219-225.
Stava, O., Vanek, J., Benes, B., Carr, N., & Měch, R. (2012). Stress relief: improving structural strength of 3D printable
objects. ACM Transactions on Graphics, 31(4), 1–11.
T
Tan, TW., Douglas, GR., Bond, T. & Phani, AS. (2011). Compliance and longitudinal strain of cardiovascular stents:
Influence of cell geometry. Journal of Medical Devices,5 041002.
W
Wegst UGK, Bai, H., Saiz E, Tomsia AP, Ritchie RO. (2015). Bioinspired structural materials. Nature Materials, 14, 23-36.
Wojciechowski, KW. (1987). Constant thermodynamic tension Monte Carlo studies of elastic properties of a two-
dimensional system of hard cyclic hexamers. Molecular Physics, 61(5), 1247-1258.
Wojciechowski, KW. (1989) Two-dimensional isotropic system with a negative Poisson’s ratio. Physics Letters A,
137, 60-64.

Chapter 4 Computational modeling of complex geometries
143
Wojciechowski, KW. (2003) Non-chiral, molecular model of negative Poisson’s ratio in two dimensions. Journal of Physics
A: Mathematical and General, 36(47), 11765.
X
Xu, B., Arias, F., Brittain, ST., Zhao, XM., Grzybowski, B., Torquato, S. & Whitesides, GM. (1999). Making negative Poisson’s
ratio microstructures by soft-lithography. Advanced Materials, 11(14), 1186-1189.
Y
Yao, X., Peng, R. & Ding, J. (2013). Cell-material interactions revealed via material techniques of surface patterning.
Materials Views, 25, 5257-5286.
Yean, C. K., Kai, C. C., Ong, T., & Feng, L. (1998). Creating machinable textures for CAD/CAM systems. The International
Journal of Advanced Manufacturing Technology, 14(4), 269–279.


Chapter 5 Sustainable additive manufacturing and environmental impact

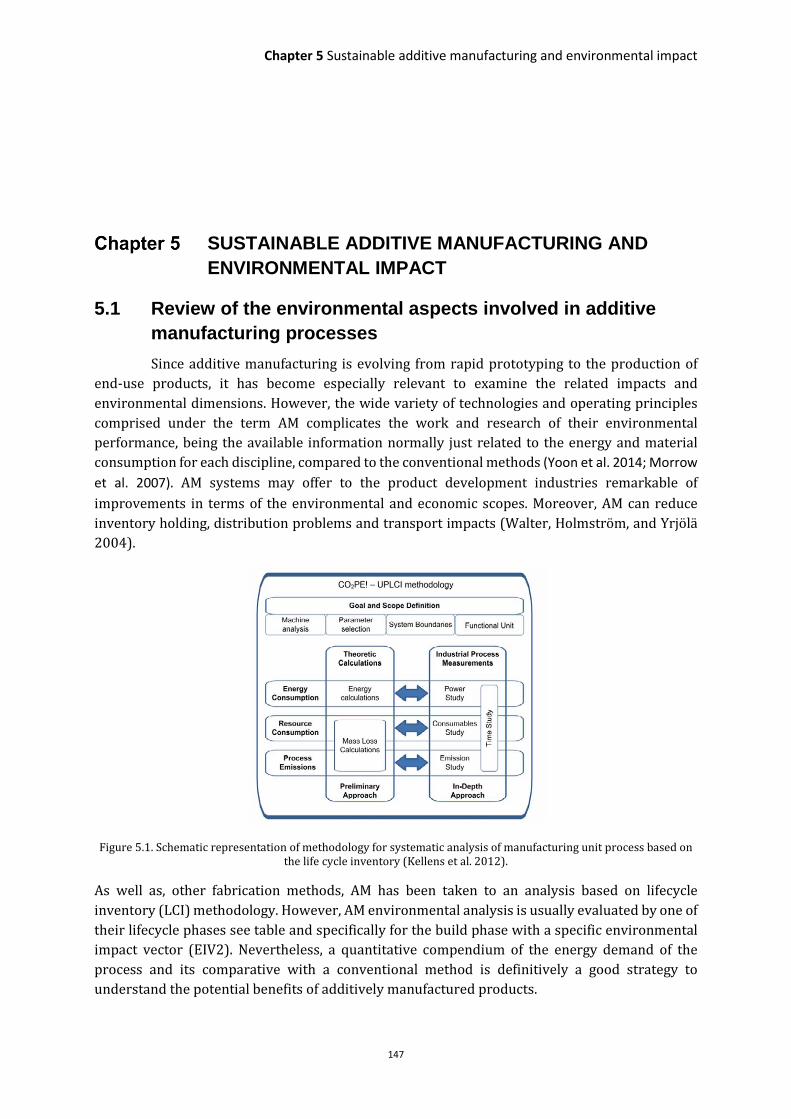
Chapter 5 Sustainable additive manufacturing and environmental impact
147
SUSTAINABLE ADDITIVE MANUFACTURING AND ENVIRONMENTAL IMPACT
5.1 Review of the environmental aspects involved in additive manufacturing processes
Since additive manufacturing is evolving from rapid prototyping to the production of end-use products, it has become especially relevant to examine the related impacts and environmental dimensions. However, the wide variety of technologies and operating principles comprised under the term AM complicates the work and research of their environmental performance, being the available information normally just related to the energy and material consumption for each discipline, compared to the conventional methods (Yoon et al. 2014; Morrow
et al. 2007). AM systems may offer to the product development industries remarkable of
improvements in terms of the environmental and economic scopes. Moreover, AM can reduce inventory holding, distribution problems and transport impacts (Walter, Holmström, and Yrjölä 2004).
Figure 5.1. Schematic representation of methodology for systematic analysis of manufacturing unit process based on the life cycle inventory (Kellens et al. 2012).
As well as, other fabrication methods, AM has been taken to an analysis based on lifecycle inventory (LCI) methodology. However, AM environmental analysis is usually evaluated by one of their lifecycle phases see table and specifically for the build phase with a specific environmental impact vector (EIV2). Nevertheless, a quantitative compendium of the energy demand of the process and its comparative with a conventional method is definitively a good strategy to understand the potential benefits of additively manufactured products.

148
A generic methodology for LCI summarized in Figure 5.1 was developed by Kellens and colleagues (Karel Kellens et al. 2012).
Table 5.1. LC phases of an AM part (adapted from Luo et al. 1999)
Life phase
Name Environmental impact vector
1 Material preparation EIV1 2 Build EIV2 3 Post-process EIV3 4 Use EIV4 5 Disposal EIV5
As the AM’s beginning were oriented to prototyping, the commercially available AM systems have not been designed with environmental efficiency in mind. Thus, many of these systems present significant energy consumption rates (heating, cooling, laser sources…), as well as, material loses in terms of degradation and wastage.
Existing literature on AM consumption is focused on the process parameters selection (Kellens et
al. 2013a) such as: the process duration, layer thickness , packing or part orientation among others
and giving data regarding raw material used in the form of standardized indicators or ratios. Resulting in final reviews of a generic process consumption dependent on mass of utilized material. It is available research on the environmental impact of AM feedstock materials, as it can be the supply chain for powder materials (Dawes, Bowerman, and Trepleton 2015). However, LC data on the production of polymeric resins for SLA or thermoplastic filaments for FDM could not be identified in the research. This fact is perceptible on the overview ( Figure 5.2) of available environmental analyses in the literature, prepared by Kellens (Karel Kellens et al. 2017). Only a few indicator are found in Luo et al. (1999) regarding the material preparation of SLA 5170 epoxy resin, a parametric process model to estimate the environmental footprint PA3200GF glass-filled polyamide (Kellens, K. 2013b) or consumption results for LS600M material (Yang et al. 2017).
Figure 5.2. Scheme of the overview for the available literature of environmental analyses for different AM techniques (extracted from: Kellens et al. 2017).
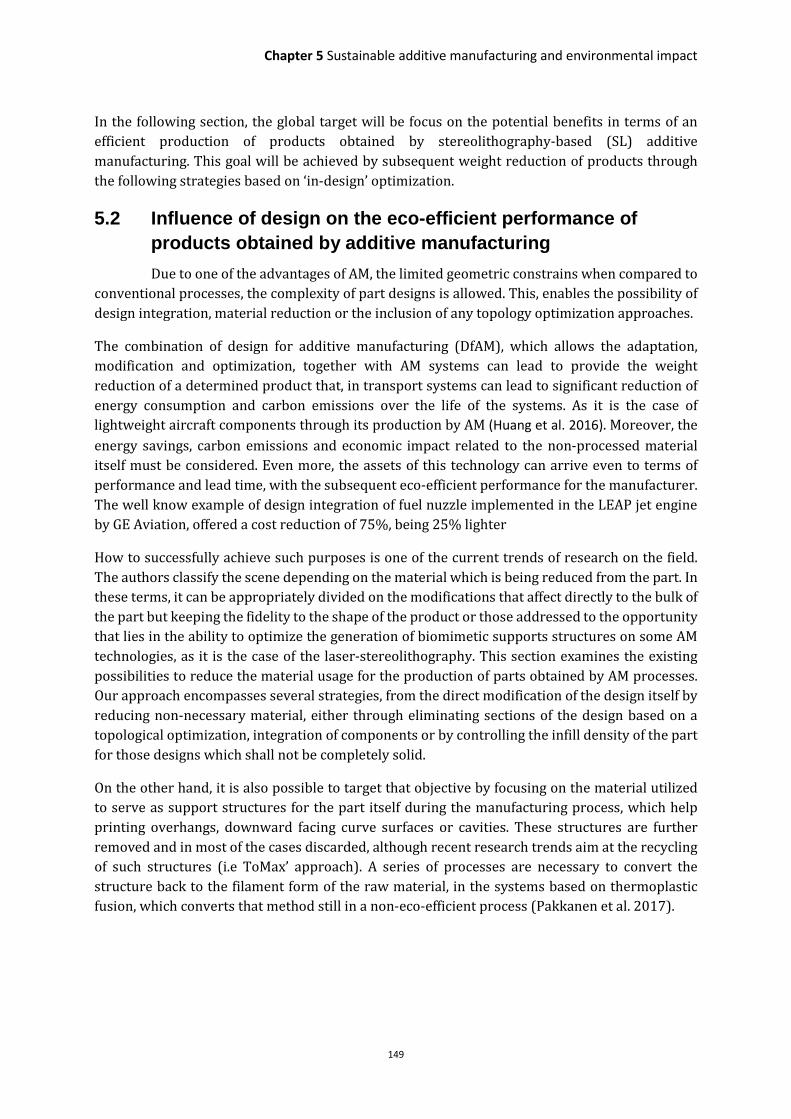
Chapter 5 Sustainable additive manufacturing and environmental impact
149
In the following section, the global target will be focus on the potential benefits in terms of an efficient production of products obtained by stereolithography-based (SL) additive manufacturing. This goal will be achieved by subsequent weight reduction of products through the following strategies based on ‘in-design’ optimization.
5.2 Influence of design on the eco-efficient performance of products obtained by additive manufacturing
Due to one of the advantages of AM, the limited geometric constrains when compared to conventional processes, the complexity of part designs is allowed. This, enables the possibility of design integration, material reduction or the inclusion of any topology optimization approaches.
The combination of design for additive manufacturing (DfAM), which allows the adaptation, modification and optimization, together with AM systems can lead to provide the weight reduction of a determined product that, in transport systems can lead to significant reduction of energy consumption and carbon emissions over the life of the systems. As it is the case of lightweight aircraft components through its production by AM (Huang et al. 2016). Moreover, the
energy savings, carbon emissions and economic impact related to the non-processed material itself must be considered. Even more, the assets of this technology can arrive even to terms of performance and lead time, with the subsequent eco-efficient performance for the manufacturer. The well know example of design integration of fuel nuzzle implemented in the LEAP jet engine by GE Aviation, offered a cost reduction of 75%, being 25% lighter
How to successfully achieve such purposes is one of the current trends of research on the field. The authors classify the scene depending on the material which is being reduced from the part. In these terms, it can be appropriately divided on the modifications that affect directly to the bulk of the part but keeping the fidelity to the shape of the product or those addressed to the opportunity that lies in the ability to optimize the generation of biomimetic supports structures on some AM technologies, as it is the case of the laser-stereolithography. This section examines the existing possibilities to reduce the material usage for the production of parts obtained by AM processes. Our approach encompasses several strategies, from the direct modification of the design itself by reducing non-necessary material, either through eliminating sections of the design based on a topological optimization, integration of components or by controlling the infill density of the part for those designs which shall not be completely solid.
On the other hand, it is also possible to target that objective by focusing on the material utilized to serve as support structures for the part itself during the manufacturing process, which help printing overhangs, downward facing curve surfaces or cavities. These structures are further removed and in most of the cases discarded, although recent research trends aim at the recycling of such structures (i.e ToMax’ approach). A series of processes are necessary to convert the structure back to the filament form of the raw material, in the systems based on thermoplastic fusion, which converts that method still in a non-eco-efficient process (Pakkanen et al. 2017).

150
However, if the strategy is based on limiting the material necessary to support, reducing this amount to the minimum essential to be functional for its purpose we may lead to material savings up to 80 % (as further analyzed), regarding the supporting material. In the following section, we focus on the development of ‘ad-hoc’ solutions based on computational modelling to accomplish that aim. Quite related to the aforementioned solution, it is also interesting for reducing the material waste to carefully evaluate the part orientation during manufacturing in order to minimize the surface of the part to be supported.
Part integration
DfAM allows designers to integrate the parts of an assembled product into a single printable object. This avoids extra manufacturing steps and assembly processes, while minimizing the subsequent time, operator cost and inventory costs. At the same time, it can also improve the performance of a part by reducing losses at the joins, avoiding sealing problems or even fatigue and stress problems. In these cases, the durability of the product may be greatly promoted, reporting directly to an economic impact. Furthermore, the redesign packaging can result into downsizing, obtaining a final product lighter and more compact than its similar manufactured by a conventional method.
Figure 5.3.a provides an example of integration, showing a biomedical device designed and manufactured as a monolithic part in Alumina by LCM, explained in Chapter 6, section 3. This device is usually manufactured in several steps with different material to obtain its functionality, whereas here the team achieves the same solution using as single technique thanks to design integration, in this case was achieved the same solution. Also, the concept design for a heat sink shown in Figure 5.3.b, which does not present sealing problems, since the whole part, from the intake and exhaust to the inner chambers and channels are part of a single and monolithic product.
Figure 5.3. Examples of part integration for a monolithic product. a) Biomedical device and b) Heat sink concept.
Finally, AM allows that some objects, such as cooling channels, any sort of join, small metal parts or memory alloys, may be embedded in the printed part, helping to enhance functionalities and improve performances. Sensors, batteries or conductive track can be embedded as well to produce complete products and mechatronic devices (Thompson et al. 2016). The benefits of part integration are further discussed in the cases of study of Chapter 6.
a
)
b
)

Chapter 5 Sustainable additive manufacturing and environmental impact
151
Bulk density modifications
Reduction of material usage
DfAM may also benefit from the use of a uniform infill with an adjustable density instead of manufacturing the object with a solid interior. The purpose is to reduce material usage while maintaining the mechanical quality for the part. This reduction can reach even up to 80 % of material savings when compared to the original massive part. In many cases, in parallel to the improved mechanical performance of these lattice or porous geometries, a minimized eco-impact is obtained, as a reduced amount of material is used and manufactured is typically achieved using less machine working time. This has a clear impact in the environmental performance of additively manufacturing parts, either for polymers, ceramics or metals, given that the environmental impact of the extraction, manufacturing and transport of the material used for the part.
In some cases, the printed part has no loading requirements and the infill can be simply formed by a patterned self-supported cell within the enclosed surface that forms the model (Figure 5.4). In this case, the main concern resides in creating a highly porous structure, while keeping a feasible part to be manufactured. For that, the porosity usually works as the key control parameter.
In other cases, the slicing software (such the open-source solution Cura 2.5.0) used for preparing the printing jobs, count with an automatic incorporation of crisscross structures for the infill, which helps to control the bulk density. In Figure 5.5, it can be seen an example of an elephant figure with a 50 % infill density. These structures are basic extruder trajectories. Usually the contour of the corresponding layer is set up and subsequently the infill is accomplished by overlapping perpendicular trajectories with a homogenous gap between them, as it can be perceived in the detail of Figure 5.5, which illustrates the infill difference for the case of 25 %, 50 % and 75 % of infill density, being the outer shell a wall thickness of 1 mm.
Figure 5.4. Example of infill of a cubic part by using a uniform pattern of a random unit cell with a final porosity of a 45%.
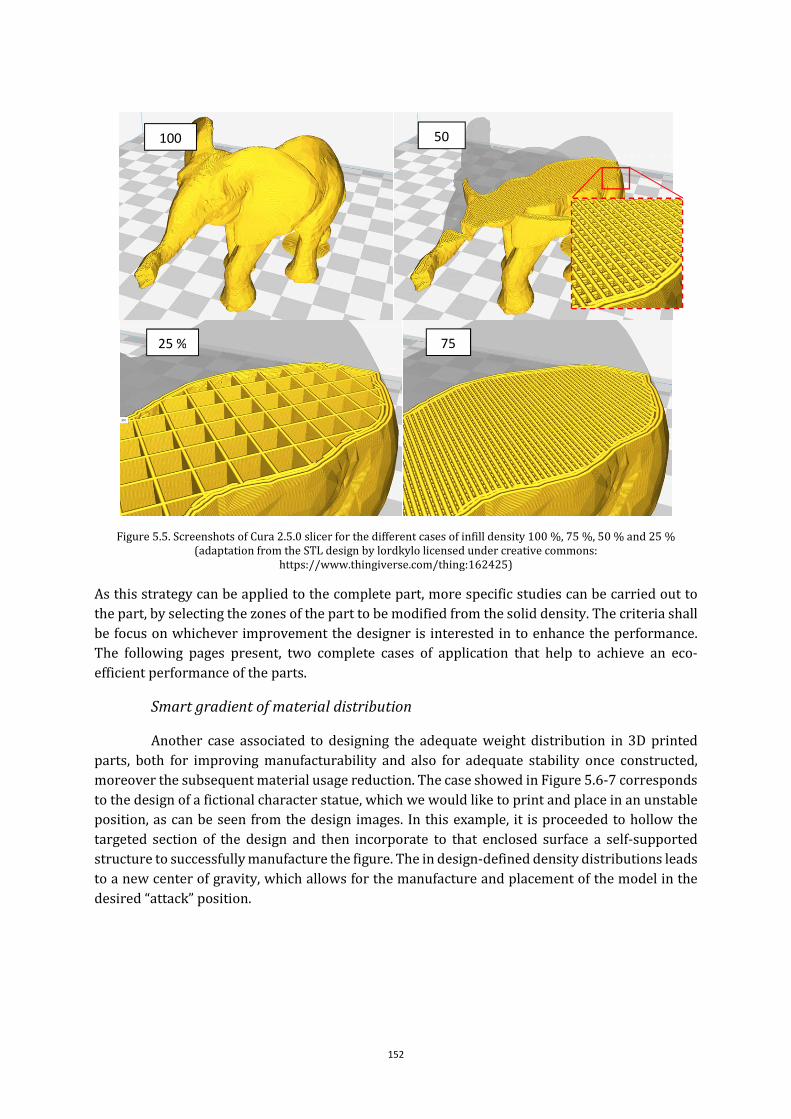
152
Figure 5.5. Screenshots of Cura 2.5.0 slicer for the different cases of infill density 100 %, 75 %, 50 % and 25 % (adaptation from the STL design by lordkylo licensed under creative commons:
https://www.thingiverse.com/thing:162425)
As this strategy can be applied to the complete part, more specific studies can be carried out to the part, by selecting the zones of the part to be modified from the solid density. The criteria shall be focus on whichever improvement the designer is interested in to enhance the performance. The following pages present, two complete cases of application that help to achieve an eco-efficient performance of the parts.
Smart gradient of material distribution
Another case associated to designing the adequate weight distribution in 3D printed parts, both for improving manufacturability and also for adequate stability once constructed, moreover the subsequent material usage reduction. The case showed in Figure 5.6-7 corresponds to the design of a fictional character statue, which we would like to print and place in an unstable position, as can be seen from the design images. In this example, it is proceeded to hollow the targeted section of the design and then incorporate to that enclosed surface a self-supported structure to successfully manufacture the figure. The in design-defined density distributions leads to a new center of gravity, which allows for the manufacture and placement of the model in the desired “attack” position.
100 50
25 % 75
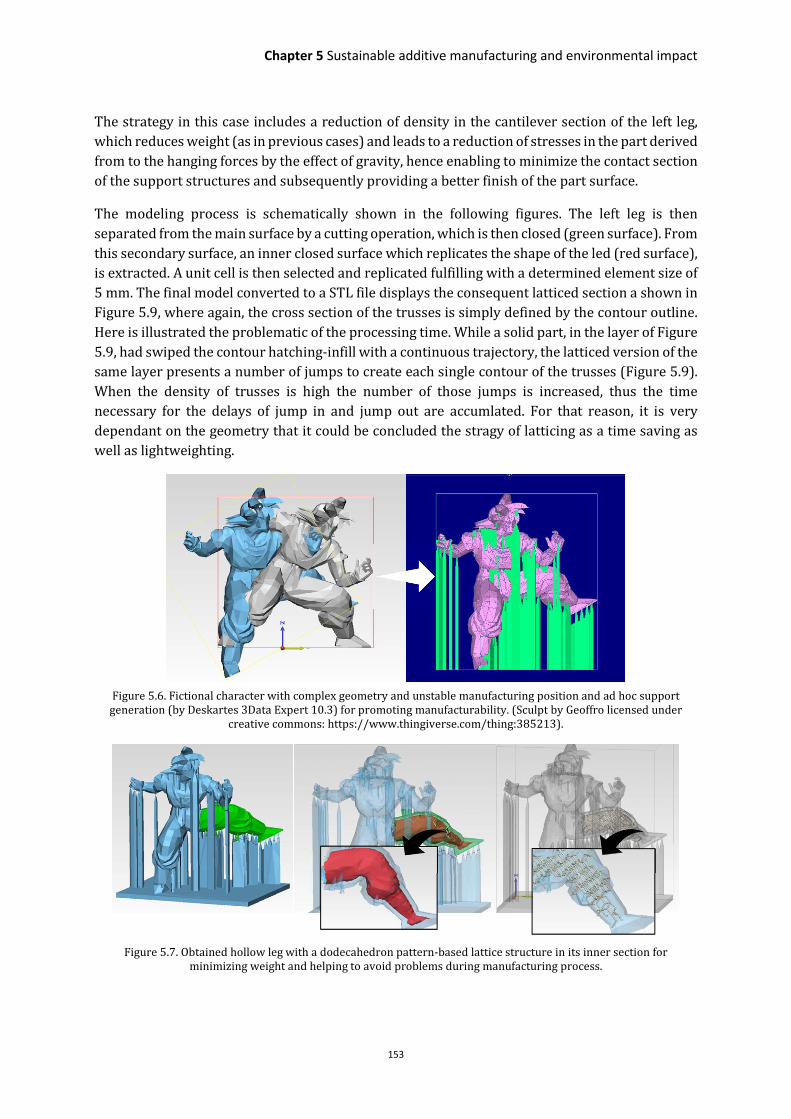
Chapter 5 Sustainable additive manufacturing and environmental impact
153
The strategy in this case includes a reduction of density in the cantilever section of the left leg, which reduces weight (as in previous cases) and leads to a reduction of stresses in the part derived from to the hanging forces by the effect of gravity, hence enabling to minimize the contact section of the support structures and subsequently providing a better finish of the part surface.
The modeling process is schematically shown in the following figures. The left leg is then separated from the main surface by a cutting operation, which is then closed (green surface). From this secondary surface, an inner closed surface which replicates the shape of the led (red surface), is extracted. A unit cell is then selected and replicated fulfilling with a determined element size of 5 mm. The final model converted to a STL file displays the consequent latticed section a shown in Figure 5.9, where again, the cross section of the trusses is simply defined by the contour outline. Here is illustrated the problematic of the processing time. While a solid part, in the layer of Figure 5.9, had swiped the contour hatching-infill with a continuous trajectory, the latticed version of the same layer presents a number of jumps to create each single contour of the trusses (Figure 5.9). When the density of trusses is high the number of those jumps is increased, thus the time necessary for the delays of jump in and jump out are accumlated. For that reason, it is very dependant on the geometry that it could be concluded the stragy of latticing as a time saving as well as lightweighting.
Figure 5.6. Fictional character with complex geometry and unstable manufacturing position and ad hoc support
generation (by Deskartes 3Data Expert 10.3) for promoting manufacturability. (Sculpt by Geoffro licensed under creative commons: https://www.thingiverse.com/thing:385213).
Figure 5.7. Obtained hollow leg with a dodecahedron pattern-based lattice structure in its inner section for minimizing weight and helping to avoid problems during manufacturing process.

154
The team could model the process when the part is hanging downwards on the building platform after the job has finished and the part is hanged to remove the excess of non-polymerized resin stuck on the part. The material was modelled as it were not fully cured polymeric Clear® resin FLGLP01 from Formlabs®. The most unfavorable case when the resin has the gel-point properties and the job has ended, and the support structures must resist the whole weight of the corresponding cantilever areas. The results for the maximum value of the Von Misses’ stresses shed light on the stress reduction achieved for the same supporting structures applied to the part, when the controlled porous section is included to the left leg.
Figure 5.8. Images of Von Misses’ stress for the static case of optimized part hanging on the building platform.
Figure 5.9. Screenshot from Preform® of the sliced figure at the targeted cross section of the left leg.
Controlled infill for sacrificial parts
Although the most promising aspect to evaluate the efficiency of the AM technologies resides in the ability of lightweighting of products, that are commonly manufactured with traditional techniques, other aspects are also significant in such similar way. The technique of high performance ceramics manufacturing based on near-net shaping forming (Young et al. 1991) makes use of molded materials to achieve a final dense part. These, are sacrificial molds which must be evaporated before the burnout of the cross linked polymerized AM network occurs (Huang and Yang 2011). In this way, the geometry of the green ceramic part is well preserved during
this step, avoiding that to suffer from the flow or deformation of the polymeric mold. Even though the low temperature of mass loss of the mold, it is important that it present a porous structure.
σVM
(Pa)

Chapter 5 Sustainable additive manufacturing and environmental impact
155
AM allows to obtain whichever complex geometry is necessary as sacrificial mold and for that reason it has been extremely bounded to the use of additively manufactured molds for gel casting (Woesz et al. 2005; Homa, Zellhofer, and Stampfl 2009). However, and in spite this is already an improvement, that allow the industry to expand the use of ceramics to any imaginable application and shape. There is also an extra motivation to further promote the use of AM in lost casting, which has direct influence on eco-impact of the product, especially when the idea of introducing AM of mass customization is striking harder nowadays in every sector of the industry.
A case of success for such application is further explained in the section 4 of this chapter. The sacrificial material is for a gel casting mold and its evaluated quantitatively the main differences of its production by AM in a SL-system by controlling the density of the bulk.
Support structures
In several AM processes, the use of support structures is required to sustain overhanging parts (Figure 5.10). These structures are geometries which respond to the following main functionalities: Adequately support the operation forces, serve as sustain for the cantilevers and minimize the distortion of the part. This material is sacrificed after the object is built, thus representing a waste in the AM process.
Figure 5.10. Example of face and point overhangs in a bottom-up process.
The common method or design rules to consider when it is necessary the use of support structures is the evaluation of the angle α, defined by the part’s face and the printing direction. If α is higher than the critical angle αc , then it is determined that the face f is an overhang (Vanek, Galicia, and Benes 2014) or maximum support span (. Then in Figure 5.10, the angle α1 illustrates a face that can be self-supported and no additional structures are necessary. On the other hand, α2 would exceed the critical angle and the corresponding face is then considered an overhang. In other cases, a point can be positioned lower than the surrounding points, thus being necessary to attach that point to the building platform by support structures. In whichever case of overhanging, one of the key factors to take into account is the design of the contact point, attempting to minimize the contact area with the part, which will affect directly on the part surface quality and post-processing simplicity.

156
Typically, support structures have been oriented towards a reliable fabrication of the part by using versatile simply geometries that can be easily defined, such as straight rectangular solid walls or bocks. However, these are unsuitable for removal the raw material trapped during the manufacturing process. Besides, they are not the real functional part of the built component (see examples of Figure 5.11):
Figure 5.11. Different examples of conventional support geometries in AM processes (Krol et al. 2012).
The accurate selection of the geometry for the support structures is important for the viability of the manufacturing process and has a direct influence on production time and cost. Different software resources present common strategies for generating the supports and in some cases, those present some level of setting or adjustment of the parameter for the geometries involved. In the figure below, we present an example of a pump prototype accomplished by the printing preparation module of Deskartes® 3Data Expert, using crisscross geometries in a web-style display.
Figure 5.12. Screenshot of print preparation in Deskartes® 3Data Expert of support structures for a pump system (right) and manufactured part (by SL-system Form1+) hanging on the building platform.
In spite of the mandatory use of supporting structures in some AM procedures such as, SLA, FDM or SLM, they are often massive and require additional work to remove. Thus, the topology for the supports is being evaluated by different alternatives to optimize them, in order to obtain more efficient structures. These approaches are focus on investing time in design for a subsequent reduction of environmental impacts and for promoting time savings in the production stage (build and removal).
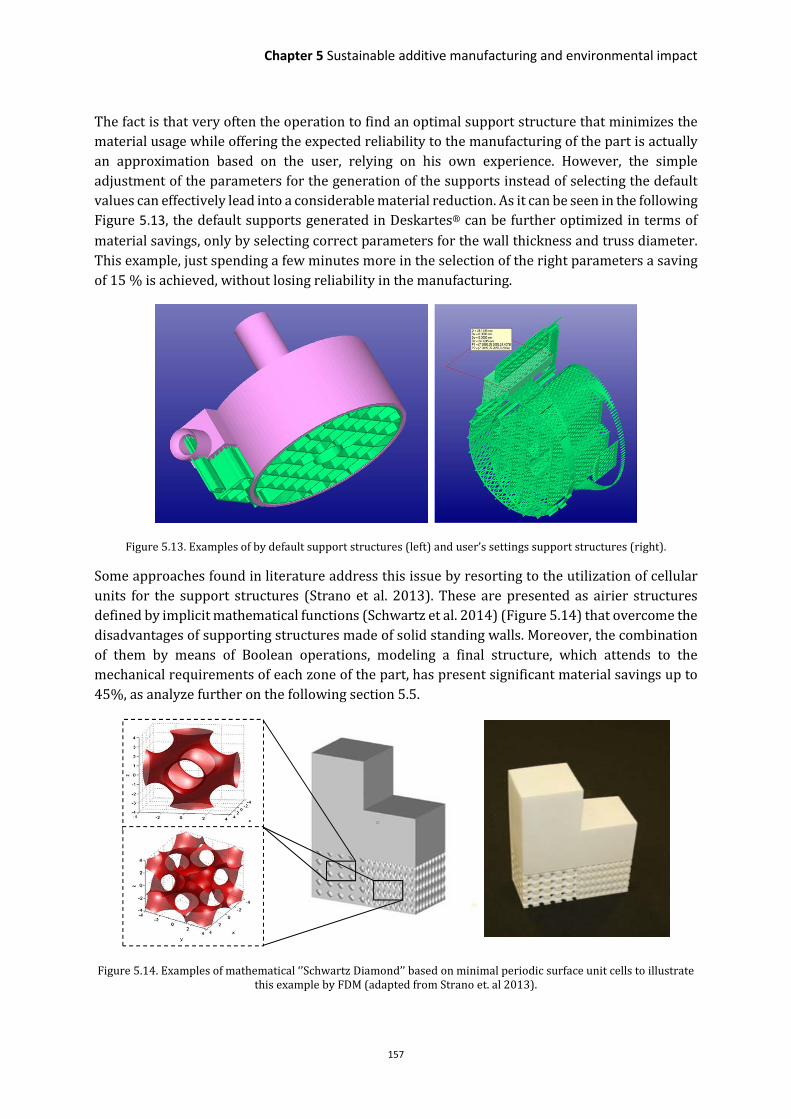
Chapter 5 Sustainable additive manufacturing and environmental impact
157
The fact is that very often the operation to find an optimal support structure that minimizes the material usage while offering the expected reliability to the manufacturing of the part is actually an approximation based on the user, relying on his own experience. However, the simple adjustment of the parameters for the generation of the supports instead of selecting the default values can effectively lead into a considerable material reduction. As it can be seen in the following Figure 5.13, the default supports generated in Deskartes® can be further optimized in terms of
material savings, only by selecting correct parameters for the wall thickness and truss diameter. This example, just spending a few minutes more in the selection of the right parameters a saving of 15 % is achieved, without losing reliability in the manufacturing.
Figure 5.13. Examples of by default support structures (left) and user’s settings support structures (right).
Some approaches found in literature address this issue by resorting to the utilization of cellular units for the support structures (Strano et al. 2013). These are presented as airier structures defined by implicit mathematical functions (Schwartz et al. 2014) (Figure 5.14) that overcome the disadvantages of supporting structures made of solid standing walls. Moreover, the combination of them by means of Boolean operations, modeling a final structure, which attends to the mechanical requirements of each zone of the part, has present significant material savings up to 45%, as analyze further on the following section 5.5.
Figure 5.14. Examples of mathematical ‘’Schwartz Diamond’’ based on minimal periodic surface unit cells to illustrate this example by FDM (adapted from Strano et. al 2013).

158
Other alternatives have highlighted the use of the lattice-like structures described in Chapter 4 as supports structures, which serve as lightweight structures and are easier to remove than those generated following conventional strategies based on block supports. Hussein and colleagues probed that. thanks to these approaches it was possible to manufacture gyroid-like lattice structures with 8% of relative volume. Moreover, the geometrical design helps to prevent curling or distortion resulting from thermal stresses by dissipating efficiently the heat away (Hussein et
al. 2013).
The flexibility that AM processes offer to produce a wide variety of complex geometries enables the development of new strategies to generate optimized supports, stiffening the areas which have higher requirements. The method of fractal support geometries suggested by Krol et al., for instance, allows to develop structures which can be stiffened based on the related forces of the process by means of finite element simulations (Krol et al. 2012). Also, methods resulting from the use of topological optimization algorithms starting from a control volume (block) have had success in the progress of lightweighted support volumes.
Figure 5.15. Example of tree-like supports used for the pump example (left) and printed part in SL-Form1+ system using the strategy.
More advanced approaches that attempt to minimize the amount of material wasted in supports without compromising the printability of the model, are the tree-like structures. The branches are progressively merged until one column is reached (Vanek, Galicia, and Benes 2014; Diaz Lantada et al. 2017). This method can be used for both processes, bottom-up or up-bottom and for several technologies (SL, FDM, SLM, etc.) The approach reduces considerably the material usage, length and contact points to the part.
These bioinspired designs of supports help to easily remove these elements from the building platform, as well as, the part itself. Moreover, structural constrains can be added to them and their performance can be optimized by means of FE structural analysis, modifying the shape, quantity and contact points. This is further explained in the Section 4 with a case of study presenting self-developed strategy to functionally generate supports that minimize the economic and environmental impact of functional units.

Chapter 5 Sustainable additive manufacturing and environmental impact
159
Part orientation
The direction in which the 3D model is placed in the slicer to prepare the manufacture of the part whichever system correspond to manufacture the part, has direct influence on the one hand in part quality, but also in the efficiency of the process in many ways, such as, printing time and the amount of material needed for the support structure (Das et al. 2015; Alexander, Allen, and
Dutta 1998) (Figure 5.16) .
Figure 5.16. Illustrative scheme of support volume (extracted from Ezair, Massarwi and Elber 2015).
,(-) � ,(.) % ,(() (5.1)
Taking the example from Ezair and colleagues to illustrate the subject (Figure 5.16), it can be denoted the volume of support V(S) necessary for the part M. The value for V(S) is directly related to its position determined by the three degrees of rotation φx, φy and φz; since the position of T is determined by them (5.1).
,(() � /�φx, φy, φz) (5.2)
The following case (Figure 5.17) illustrate the dependence of the printing orientation to the amount of supports volume. The slicer software used is Preform (Formlabs®) and the model is oriented in three different positions only varying the angle φx. Table 5.2 shows the value of V(S) for each orientation of the part suggested for supports, by means of automatic generation. Therefore, the aim is to focus on the optimal orientation of the part, by choosing the right angles in each axis, that allows to minimize V(S) and therefore the direct environmental impact related to the material waste in support structures (5.3).
+�0,�(� � /�φx, φy, φz) (5.3)
However, although here the main concern is the environmental scope, printability (P), processing time (t), finish quality of the surface (Q) and economic impact (EI) are also matters of concern for designers. Thus, the final objective resides in finding the correct values for φi, that can satisfy the equation for the designer’s choice (DC):
�1 � /�minV(s), t, EI, Q, P) (5.4)

160
Figure 5.17. Different orientations for the pump system for φx: 0°, 20° and 70° and its respective generated supports.
Table 5.2. Results for the material, processing time and number of layers for the different orientations of the part
Angle V(T) (mL) V(S) (mL) Layers Time (min)
0° 14.37 8.14 478 98
20° 31.48 25.25 545 109
70° 13.80 7.57 558 107
To conclude, it is probed that part orientation plays a fundamental role in the production of AM parts and that finding out an optimal orientation which not only help to reduce the necessary volume of supports but also to achieve compromise of an eco-efficient manufacturing and enhancing part quality.
Topology optimization for lightweight design
The suitable shape optimization of a design is a concept that appeared some decades ago (Haftka and Grandhi, 1986) and it has been progressing since then thanks to the evolution of the
computational methods (Bendsoe 1989; Bletzinger, Kimmich, and Ramm 1991; Maute and Ramm 1995).
Typically, the shape optimization or topology optimization consist of a determination for a point in space whether there is material in that point or not. The discretization of the design space is referred as a void (cubic, tetrakaidekahedral, octahedral and diamond) or structural (Bernouilli-Euler or Timoshenko beam theories) members and then, the problem is described as a density distribution in a domain. This model is defined as a rigid body (design space), delimited by the sections that will not take part of the optimization since they are necessary for the design (constrained section), with its corresponding boundary conditions and loads.
For instance, the optimal shape design, from a material point of view, of linearly elastic structures (Ωm) in R2, contained in a larger domain (Ω) was defined by Bendsoe (1989) as:
��23��*� � 4�*��563�777777 (5.5)
where �563�777777 is the rigidity tensor of the material utilized for the manufacturing of the part and X
(x) is an indicator function of the part Ωm of Ω that is occupied by the material:
0° 20° 70°

Chapter 5 Sustainable additive manufacturing and environmental impact
161
4(*) � 8 1�/* ∈ Ω�0�/* ∈ Ω\Ω�<
(5.6)
The discrete structures such as trusses, can be understood as a case of continuous structures. In these terms, the optimization comes from the adequate connectivity of the elements removing and generating new to analogously to the case of continuous space, get an efficient approach in terms of mass for the part (Maute and Ramm 1995).
Figure 5.18. Example of envelope solid with boundary conditions and loads, discretization in cubic voids and further refinement of elements by means of density distribytion and minimum compliance (adapted from Bertsch et al. 2008).
This method is being employed by many designers coinciding with the rise of the AM processes which allow to reach the complexity of the shapes that are the result of the optimization. It has become popular in the field of AM that designers optimize conventional designs in terms of mass, creating lightweight products for an efficient production and performance (Leary et al. 2014; Hällgren, Pejryd, and Ekengren 2016; Zhu, Zhang, and Xia 2015), since less constrains have to be considered during design to ensure the manufacturing of the part, for instance the tool access in the case of machining.
Lattice structures are frequently incorporated in the areas where the mass results is a zero (see equation 1.6), since there is not a structural necessity for material but aesthetic, ergonomic or an added mechanical compromise (Brackett, Ashcroft, and Hague 2011; Hällgren, Pejryd, and Ekengren 2016). Also the generation of lightweight structures by means of lattice or beam elements and subsequent validation with numerical methods that predict the mechanical behavior of the complex geometry (Terriault and Brailovski 2017).
Figure 5.19. Example of envelope (a), discretization (b) and lattice structure (c) (extracted from Terriault and Brailovski 2017).
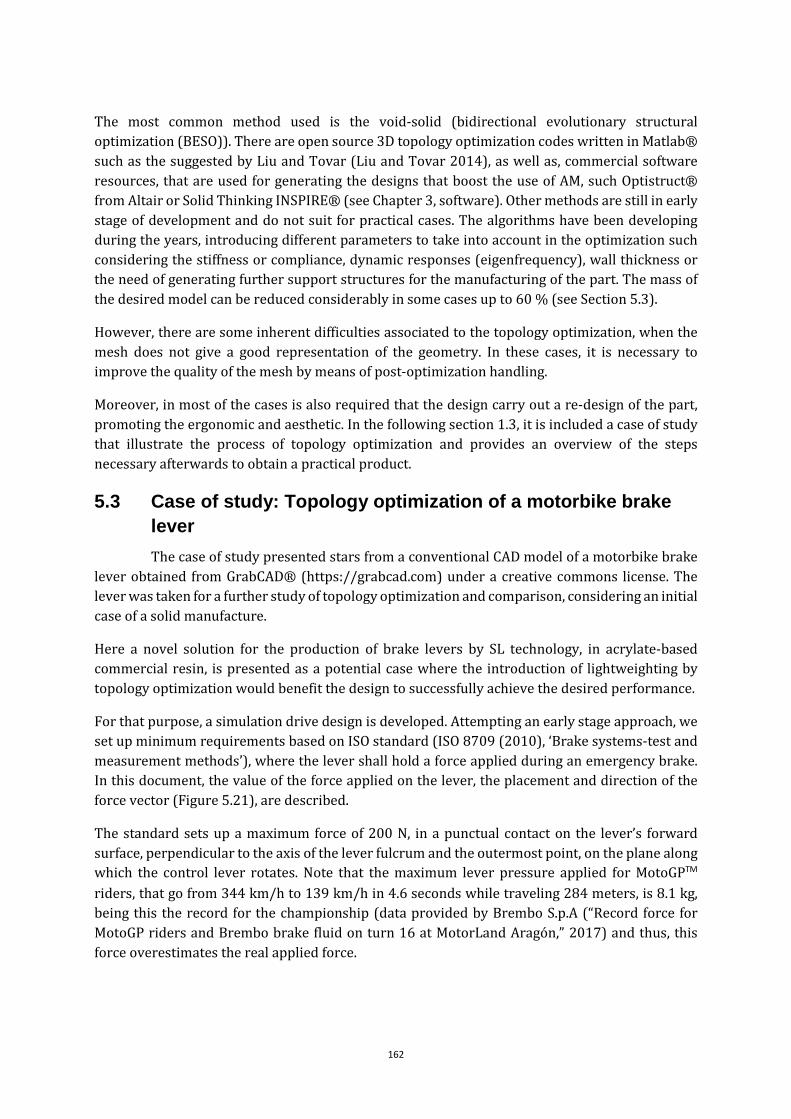
162
The most common method used is the void-solid (bidirectional evolutionary structural optimization (BESO)). There are open source 3D topology optimization codes written in Matlab® such as the suggested by Liu and Tovar (Liu and Tovar 2014), as well as, commercial software resources, that are used for generating the designs that boost the use of AM, such Optistruct® from Altair or Solid Thinking INSPIRE® (see Chapter 3, software). Other methods are still in early stage of development and do not suit for practical cases. The algorithms have been developing during the years, introducing different parameters to take into account in the optimization such considering the stiffness or compliance, dynamic responses (eigenfrequency), wall thickness or the need of generating further support structures for the manufacturing of the part. The mass of the desired model can be reduced considerably in some cases up to 60 % (see Section 5.3).
However, there are some inherent difficulties associated to the topology optimization, when the mesh does not give a good representation of the geometry. In these cases, it is necessary to improve the quality of the mesh by means of post-optimization handling.
Moreover, in most of the cases is also required that the design carry out a re-design of the part, promoting the ergonomic and aesthetic. In the following section 1.3, it is included a case of study that illustrate the process of topology optimization and provides an overview of the steps necessary afterwards to obtain a practical product.
5.3 Case of study: Topology optimization of a motorbike brake lever
The case of study presented stars from a conventional CAD model of a motorbike brake lever obtained from GrabCAD® (https://grabcad.com) under a creative commons license. The lever was taken for a further study of topology optimization and comparison, considering an initial case of a solid manufacture.
Here a novel solution for the production of brake levers by SL technology, in acrylate-based commercial resin, is presented as a potential case where the introduction of lightweighting by topology optimization would benefit the design to successfully achieve the desired performance.
For that purpose, a simulation drive design is developed. Attempting an early stage approach, we set up minimum requirements based on ISO standard (ISO 8709 (2010), ‘Brake systems-test and measurement methods’), where the lever shall hold a force applied during an emergency brake. In this document, the value of the force applied on the lever, the placement and direction of the force vector (Figure 5.21), are described.
The standard sets up a maximum force of 200 N, in a punctual contact on the lever’s forward surface, perpendicular to the axis of the lever fulcrum and the outermost point, on the plane along which the control lever rotates. Note that the maximum lever pressure applied for MotoGPTM
riders, that go from 344 km/h to 139 km/h in 4.6 seconds while traveling 284 meters, is 8.1 kg, being this the record for the championship (data provided by Brembo S.p.A (“Record force for MotoGP riders and Brembo brake fluid on turn 16 at MotorLand Aragón,” 2017) and thus, this force overestimates the real applied force.

Chapter 5 Sustainable additive manufacturing and environmental impact
163
Figure 5.20. 3D CAD model of the motorbike brake system (left) and the lever taken for optimization (right) (model with C.C license by Victor Bonavarte 6779, website: https://grabcad.com/library/right-lever-for-harley-motorcycle-
1)
Thus, for all intents and purposes this design will not consider the mandatory study for a product development which would consider the performance under fatigue of the material and dynamic responses. It should be considered as a first approach to what could lead in a manufacturing transformation and hence a case of design for AMT.
Figure 5.21. Extract of ISO 8709 (2010), ‘Mopeds-Brake and brake system-test and measurement methods.
Therefore, the first step is to adequately define the correct placement of application for the loads. For that, some secondary lines are drawn on a sketch plane (YZ) that is transversal to the middle plane of the lever. Then, it is traced the line that join the fulcrum and the outer point. Afterwards the boundary conditions and load are applied to the model.
For the fulcrum is applied a bolt-joint constrain which allows the free spin in the YZ plane but not displacement in x, y or z axis, neither the rest of the rotation degrees. In the case of the anchor with the piston actuator of the master cylinder, the applied constrain is defined as a rigid constrain, modeling the response that would offer the master in the case of locking the wheels (Figure 5.22).

164
Figure 5.22. Process of preparation for the topology optimization of the brake lever, using Solid Thinking INSPIRE©.
The input data of the material is the referred to Clear02 resin from Formlabs® (see Chapter 3, materials):
Table 5.3. Material properties of resin Clear 02
Ultimate tensile strength (MPa) 65
Young’s Modulus (GPa) 2.8
Elongation at failure (%) 6.2
Flexural modulus (GPa) 2.2
Heat deflection 264 psi (°C) 58,4
The optimization is set under maximum stiffness, no gravity effect, it is not considered the dynamic response and the objective of mass reduction is a 60%. With these parameters, it is then carried out the FEM simulation of the lever with the case of maximum load 200 N, as mention before according the ISO normative. Figure 5.23 displays the results of tension/compression stress for the lever under maximum force, with a maximum stress of 182 MPa (in traction) and deflection of 1.92 mm, factor of safety 6x.
Figure 5.23. Tension/results for the loading case of maximum force.

Chapter 5 Sustainable additive manufacturing and environmental impact
165
Then, the solution to the load case is computed to obtain the following result (Figure 5.24), where the proportional material that belongs to the tail and the fulcrum’s end is completely removed and some cavities appear as a consequence of the density distribution.
Figure 5.24. Result of the topology optimization with a 40% of mass from the original design.
The basic built is then exported as STL file, generating an automatic superficial mesh for the model. In this occasion, the intermediate densities are not evaluated. It creates a penalization in the design which is not practical for a real use, since the lever does not present an end which would physically block the hand in a situation that it could slice. Moreover, the hole where the bolt is located, now is halved. For that reason, it is proceeded to merge the design space obtained from the topology optimization with both important sections of the lever (Figure 5.26).
Figure 5.25. STL surface mesh generated when exporting the file in INSPIRE®.

166
The re-design, in order to get an integration of the sections, is a must-to-do for the application engineers in the AM field, nowadays. Consequently, the next step in the design process comes from the not that trivial merge of the sections, succeeding in the accuracy and ergonomics of the final shape.
Given that a direct Boolean operation joining the three components is not the effective approach expected for the study (Figure 5.26), the geometry obtained from the optimization process is quite basic, presenting many sharp edges and a bumpy surface and the quality of the part, in general terms, is poor. The use of redesign based on the PolyNURBS tool (SolidThing®, INPIRE) is then introduced to the methodology of the case (see chapter 3, software). This tool that helps to convert the triangulated polymeshes to NURBS and obtaining a resulting model which can be exported to other software resources.
Figure 5.26. Optimized design space together with the tail of the lever and the fulcrum section (in pink color).
From the basic optimized model, is then traced another geometry or body which recreates faithfully the same shapes but in a smoother and watertight way. The figures are more rounded and ergonomic, with class A surfaces, soft edges and ends based on basis splines. Besides, the tail of the lever is also created in order to obtain a final design that can be useful. The result can be seen in the following Figure 5.27, which accomplishes the recommendation obtained from the topology optimization, while maintaining dimensions and cavities.
The model already satisfies the requirements, however far from a final concept, it is research into the incorporation of lattice structures in those sections where the algorithm found intermediate densities. In that way, it is possible to obtain a concept that has been lightweighted but keeps the functionality of the original design. The suggested solution is illustrated in Figure 5.28, presenting two regions of lattice structures based on dodecahedrane unit cells, with element size of 6 mm in the three directions. Additionally, since the thickness of the lattice-like structures can be modified, it is introduced a functional gradient from 1.2 mm thick (the elements that contact with the optimized space) to 0.5mm (the outer elements), as the Figure 5.28 shows. To open that structures, to be able to see them, instead of keeping enclosed inside the part, a wavy cutting operation was performed to the tail surface.

Chapter 5 Sustainable additive manufacturing and environmental impact
167
Figure 5.27. Recreating the geometry by means of Polynurbs© (module from INSPIRE) method (upper image) and final bionic redesign (bottom).
Finally, pretending to enclose the studied strategies in the design it is also added to the forward surface of the lever a functional texture that enhance the gripping of the lever under conditions of rain, sweat in summer and gives an added value to the manufacturing of such part by AM processes, as AMT allow for the creation of the object in a single step, thus avoiding costly post-processes.
Figure 5.28.. Combined strategy of solid, topology optimized and latticed sections for the brake lever and detail of the functional thickness gradient applied to the lattices of the lever’s tail.
1.2 mm
0.5 mm

168
Then final design is then exported to STL mesh for the subsequent manufacturing using the SL printer Form1+ with the mentioned clear acrylate-based material. The file is repaired, eliminating overlapping triangles and replicated shells using Deskartes® 3DataExpert software for the purpose.
The part is oriented adequately to reduce the section of the model to the minimum, decreasing considerably the separation forces and the distortion due to the polymeric shrinkage (Figure 5.31). The supports are automatically generated by the slicer software PreForm, being these rather massive. However, it was searched for an optimal print job at the first trial, for that the generation of supports was very conservative, with contact points over the 400 µm and the density of them 1.5 according to the software’s parameters.
Figure 5.29. Render of the final optimized design for the brake lever and detail of the texture applied on the forward surface.
The part was then washed with IPA as normally is done for the acrylate-based materials for 20 minutes immerse in a vat and using the ultrasonic device (see Chapter 3, materials). The part is afterwards, washed again in a second vat with IPA as well. The support structures are then removed and weighted, with a mass of 16,602 g (Figure 5.30), being this not a very efficient approach but very effective in this case to ensure a fine printability for the first attempt, thus they are considered an acceptable waste.
The final mass of the brake lever is 40 gr. Comparing this result to the average weight of an aluminum front brake lever of the commercially available racing suppliers (e.g Brembo SpA, Curno (Italy) models that are about 300 g), it is clearly added a lightweight value to a conventional product and also, among other benefits, the design is able to improve ergonomics of the driver, making the actuation of the lever more effective. Although it cannot be concluded, it is devised and illustrated an example of potential applications into the market that could be successfully covered by AM processes, being this structural approach among others.

Chapter 5 Sustainable additive manufacturing and environmental impact
169
Figure 5.30. Photographs of the brake lever after its printing (left), weight of the supports (center) ant the part respectively (right).
Figure 5.31. Pictures of the manufactured part hanging down in the building platform of the Form1+ printer (upper right), detail of lattice elements of 1.2 mm (upper left), brake lever in Clear02 resin (bottom) and detail of lever’s tail
latticed elements of 0.5 mm.

170
5.4 Case of study: Optimization of support structures for eco-ef-ficient additive manufacture
In this section, we summarize a recently developed methodology for the generation of bioinspired fractal or tree-like support structures and provide six application examples, starting with very simple geometries and generalizing the process for more complex parts. Eco-efficiency is assessed by a final comparative study with supports obtained with conventional CAD software. These results were presented in the research published in the Journal of Industrial Ecology as part of a Special Issue for studying the environmental impacts of additive manufacturing focusing on design strategies (Diaz Lantada et al. 2017)
In the search for an optimized support generation strategy for additive manufacturing, it is useful to start with some simple geometries. Such geometries do not benefit from the obvious advantages of using additive manufacturing technologies, i.e., the generation of complex forms one of the most remarkable. However, simple geometries are useful for the initial development stages of a new procedure. Our first optimization attempts are linked to a couple of examples, for which different types of supports are constructed, trying to spare material and to use biomimetic strategies. The first application example is a lintel structure, shown in Figure 5.32, and the second one is a semi-sphere, shown in Figure 5.33. The support structure design process begins with two main design parameters dependent on the material and technology being used: a) the largest obtainable cantilever or the largest distance between two supporting points, so that the surface being constructed may not collapse, and b) the allowable overhang angle or deviation from the vertical for an unsupported line.
Figure 5.32. Examples of different fractal or tree-like support structures for a lintel structure.

Chapter 5 Sustainable additive manufacturing and environmental impact
171
Design guides for additive manufacturing technologies (AMT) typically name them “maximum horizontal support span” or “maximum overhang angle” respectively. In principle, larger values of both parameters would allow for the generation of lighter support structures and related material savings. In our case, working with laser stereolithography, more specifically the free-surface process and based on the knowledge-based database, we work with a maximum horizontal support span of 8-9 mm and with a maximum overhang angle of 30º. Having these values in mind, we design different “fractal” and “tree-like” supports for both structures. Figure 5.32 shows several fractal or tree-like support structures for the lintel structure. Figure 5.33 shows bioinspired support structures for the additive manufacture of a semi-sphere, including a parametric tree-like structure with potential as mechanically optimized support geometry, a semi-sphere supported by a tree-like structure, and an alternative support structure combining two concentric rings of columns and a central “tree-like” geometry.
Figure 5.33. Bioinspired support structures for the additive manufacture of a semi-sphere. a) Parametric tree-like structure with potential as mechanically optimized support geometry. b) Semi-sphere supported by the mentioned
tree-like structure of the upper image.

172
These initial design trials and the prototypes obtained allowed us to select the more adequate features and develop a more versatile process adapted to more complex geometries. For instance, the fractal tree-like structure used as support for the semi-sphere is valid only for simple and spherical structures and is difficult to adapt to more complex geometries. In the case of the lintel structure, parallel fractal-like geometries are adequate, but the distance between them can be again optimized taking account of the maximum horizontal support span. It is interesting to evaluate if the fractal-like support can be adapted to more complex geometries, such as the ones included in Figure 5.34.
In order to make the process more versatile and functional for more complex geometries, we can start from a reference plane, the more parallel to the regression plane, the better. In the reference plane, we construct a grid, with points separated a distance shorter than the maximum horizontal support span (in our case approximately 7mm).
Following a direction perpendicular to the reference plane (vertical direction), we project the point of the grid onto the surface intended for manufacture. The projected points are the contact points between the support structure being designed and the surface to support. Taking the points in groups of four, starting from one extreme of the surface, we start to construct the support lines. The reference plane, with height z = 0, acts as the horizontal construction platform of the additive manufacturing machine. Each group of four points upon the surface has four reference points, the vertexes of a square, upon the horizontal reference plane.
From the lowest height point of each group of four points upon the surface, we generate a line intersecting and forming 30° with a vertical reference line constructed on the center of the reference square upon the plane. We join the intersection point with the three remaining points of the group upon the surface, hence obtaining the first four support lines. Repeating the process for the different groups of four points upon the surface, we obtain a first support layer starting from the surface and ending in the intersection points, which constitute a new theoretical surface. Repeating the process, we obtain the complete support structure. The whole support generation process is schematized in and applied in the following sections to alternative design.
Although the proposed process artificially increases the building height and related building time, in the case of applying it to single surfaces, it may be perfectly suited for cage-like structures, complete housings, 3D machine parts or objects with overhanging features with roof and walls to cite a more common example. We provide and discuss additional examples dealing with more complex geometries in the results section. The eco-efficiency of the approach is also analyzed, comparing the proposed process with more conventional supports generated by state-of-the-art additive manufacturing software.

Chapter 5 Sustainable additive manufacturing and environmental impact
173
Figure 5.34. Systematic generation of supports for the additive manufacture of a complex surface. The supporting lines are generated so as to avoid deviations from the vertical larger than 30º and following bioinspired processes
leading to tree-like structures.
Computer-aided designs of eco-efficient support structures
The optimized support generation process, described earlier and shown schematically in Figure 5.34. Systematic generation of supports for the additive manufacture of a complex surface. The supporting lines are generated so as to avoid deviations from the vertical larger than 30º and following bioinspired processes leading to tree-like structures, is further applied to more complex geometries including: a wavy structure and a geometry resembling a hat, like typical exotic and eye-catching roofs and covered surfaces from modern buildings, and a sensor housing aimed at applications linked to industrial engineering. Figure 5.35 shows the systematic generation of

174
supports for the additive manufacture of the mentioned wavy structure and the final optimization of support structures by elimination of coincident supports, which constitutes an additional improvement to the previously described process and leads to geometries with supports ready for their fabrication using additive manufacturing approaches.
Prototypes obtained using eco-efficient and traditional support structures
Figure 5.36¡Error! No se encuentra el origen de la referencia.a provides some examples of different additively manufactured prototypes showing traditional lattice structures and mesh-like supports, together with the optimized bioinspired support structures. They have been manufactured with the laser stereolithography system SLA-3500 and epoxy resin Accura® 60 is used. Clear differences can be appreciated between the conventional support structures generated with the help of 3D LightyearTM file preparation software and the optimized support structures 3D LightyearTM software receives STL or SLC files as inputs and prepares them for part building on any of 3D Systems’ SLA systems. The described stereolithography machine, material and software constituted industrial references in the field of AM production by free surface SLA. The branched supports from Figure 5.36.b are obtained using commercial software (by Formlabs®) and are more massive and difficult to remove than those designed and manufactured as explained in present work. The impact of support mass is analyzed and detailed further on. Regarding support removal -also a relevant procedure for both part quality and the environmental impact of additive manufacturing by photopolymerization- it is important to include some considerations.
Figure 5.35. Systematic generation of supports for the additive manufacture of a complex surface and final optimization by elimination of unnecessary and coincident support.
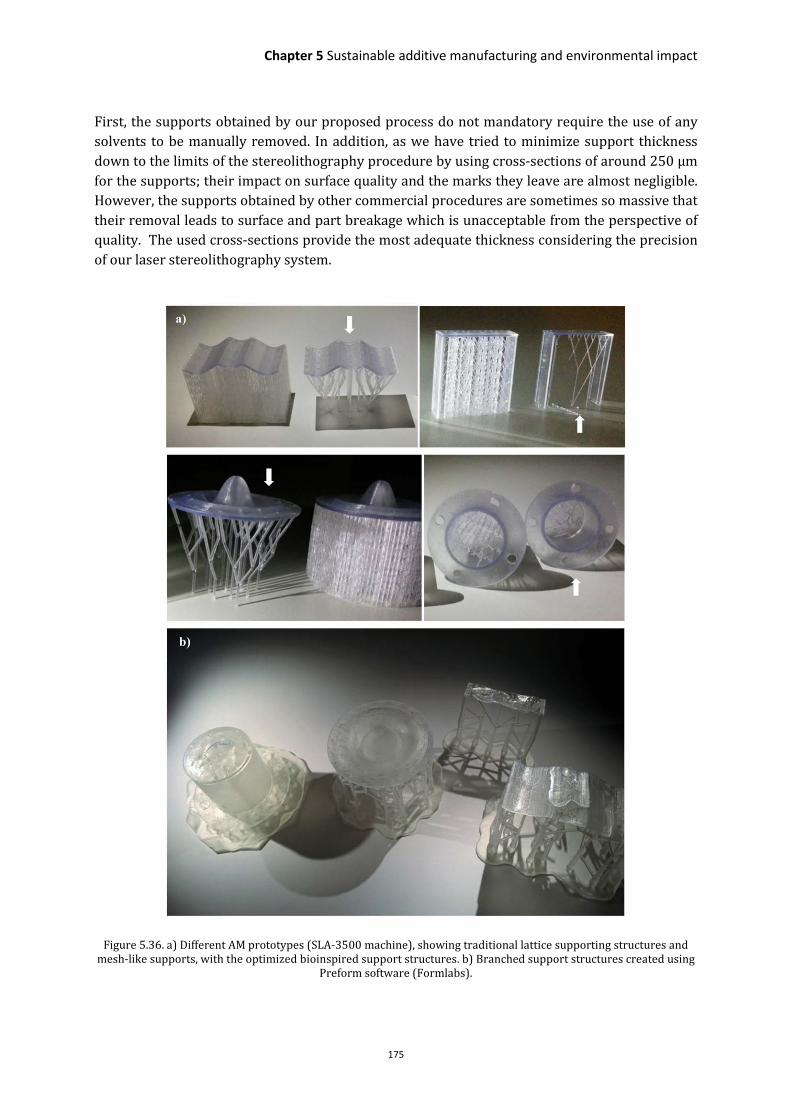
Chapter 5 Sustainable additive manufacturing and environmental impact
175
First, the supports obtained by our proposed process do not mandatory require the use of any solvents to be manually removed. In addition, as we have tried to minimize support thickness down to the limits of the stereolithography procedure by using cross-sections of around 250 µm for the supports; their impact on surface quality and the marks they leave are almost negligible. However, the supports obtained by other commercial procedures are sometimes so massive that their removal leads to surface and part breakage which is unacceptable from the perspective of quality. The used cross-sections provide the most adequate thickness considering the precision of our laser stereolithography system.
Figure 5.36. a) Different AM prototypes (SLA-3500 machine), showing traditional lattice supporting structures and mesh-like supports, with the optimized bioinspired support structures. b) Branched support structures created using
Preform software (Formlabs).
176
Regarding additional improvements to the supporting structures, it is important to mention the potential use of teeth support links as a means of simplifying the manual process for extracting the supports from the final part and to optimize part surface quality. However, the impact of reducing the contacts between the support structures and the geometries being constructed should be additionally addressed, as overly light contacts may promote in some cases part collapse. It is also important to highlight that, even if the process of bioinspired or tree-like support generation artificially increases the construction height of single surfaces, when applied to conventional objects with side walls or cage-like structures, the construction height may remain almost the same. Consequently, when comparing different support generation processes and the eco-efficiency of additive manufacturing in the following sections, the construction height of the test surfaces has been set to the same building position.
Finally, a preliminary comparative study, including eco-efficiency measurements, has been conducted and is presented by using volume and manufacturing time measurement tools (Faludi et al. 2015; Yoon et al. 2014), available within the CAD resources used for designing the different geometries and for preparing the manufacturing processes. The assessment is presented in the following section and includes some measurements carried out upon already manufactured geometries by weighing on a precision scale, as well as some evaluations done with the help of CAD resources. The study is intended to complement previous groundbreaking studies in the field of additive manufacturing, regarding the assessment of sustainability and eco-efficiency for additive manufacturing (Kellens et al. 2013) of the photo-polymerization based procedures. Four different geometries printed (wavy membrane, lintel, hat and sensor case) are shown in Figure 5.36, which are representatives of the complexity achievable using SLA additive manufacturing technology in terms of shapes, over-hanged areas, flat and curve faces, etc.
Eco-efficiency analysis
In this section, it is presented an evaluation of the eco-efficiency of the design strategy, based on an environmental and economic score at a micro-level. For that purpose, we compare it with other potential alternatives to generate support structures for the previously shown figures, but within the same optimal domain to obtain such products via stereolithography (SLA) technique and removing previously the irrelevant options. The three different alternatives studied to generate supports are: (1) using the proposed optimized procedure, (2) by 3D-Lightyear software from 3D Systems and (3) Preform software from Formlabs. The environmental aspects of SLA processes include resource consumption and emissions (Huppes and Ishikawa 2005) in each phase of the life cycle: material extraction / production, energy consumption, residue, material toxicity, landfill, waste processing and recycling. The analysis presented here, however, encompasses only the following stages in one phase of the life cycle of the part: (a) loading material into the printer which can vary depending on the SLA manufacturing process from milliliters up to dozens of liters, (b) proper building the part layer by layer, (c) cleaning and (d) post-processing. Since the aim of the strategy lies in reducing material consumption and printing time, the output data used for the evaluation is: part weight, manufacture time, and number of layers (calculated by using Formlabs® software: Preform 1.8.2).

Chapter 5 Sustainable additive manufacturing and environmental impact
177
Evaluation of the environmental performance
Evaluation of the environmental performance of the alternatives presented in this paper ideally should encompass the entire lifecycle but in this analysis, we focus only on the material and energy consumption (EC) (5.7) and on the CO2 emissions arising from manufacturing of a part. The EC impact of the manufacturing step is estimated, in a simple approach, by taking account of the power rate (PR) (kWh/h) of the SLA-3500 machine and of the process time to produce a part (t), since the total power consumed by the modules that constitute the machine is obtained from a unique power supply (as in Luo et al. 1999). Given that the research is focused on three specific parts produced using AM, the results are reported as energy consumption and material saved per part (for alternative approaches to measure energy indicators, see Luo et al. 1999, or Kellens et al. (2011, 2013)). In short, we resort to calculating energy consumption (EC in kWh) for each of the four parts as:
�1 � => · � (5.7)
Where t is the processing time of the part polymerization inside the printer, for each different part studied.
An estimation of the CO2 emissions (CE) in grams is calculated to reflect the influence on the environmental impact of the production of a part. Equation (5.8) is a function of two different factors (Table 5.4). This refers to: 1) the CO2 emissions related only to the energy consumed during processing (Cfe); and 2) the production of the epoxy resin used for the complete part, including not only the mass of the bulk parts but also of the support structures (Cfm) (Morrow et al. 2007; Ang and Su 2016; Hammond and Jones 2008). The emission analysis excludes coverage of other life-cycle emissions (e.g. production of the printing machine and waste). Accordingly:
1� � 1/@ · => · � % 1/+ · + (5.8)
Table 5.4. CO2 emissions per quantity of epoxy resin used and standard power consumed
Cfe [kg CO2/kWh] 0.4
Cfm ([kg CO2/kg] 5.7
Where Cfe is the aggregate carbon intensity (ACI) of electricity associated to Spain in 2013. It is defined as the total CO2 emissions from fossil fuels in the electricity production of a country (Ang and Su 2016). Cfm is the embodied carbon emissions factor for the epoxy resin, taken from the ICE database. ‘‘Embodied carbon is defined as the total primary carbon released from direct and
indirect processes. This includes all activities from material extraction, manufacturing until the
product is ready (Hammond and Jones 2008).’’
Evaluation of costs
The analysis of the economic performance relies on the cost of operating hours, related to the machine’s energy consumption and to machine’s amortization. Further study should be carried out to assess a full cycle of the product and to determine standardized values. Nevertheless, the data shown can be considered as an initial approximation since the main difference among the alternatives reside in the manufacturing phase and it can be assumed that rest of the impacts are

178
negligible or identical. Thus, the assessed parameter for the cost of energy consumption (CEC) depends on several factors obtained from the price list (Table 5.5) of 2015 from the main power supplier in Spain, such as: the Pw (power prices), the power factor Pf, which is related to the electric power contracted, and the At (access toll), which refers to the price for the transport of the energy (Ghenai 2012).
Table 5.5. Factors used for the estimation of the cost of energy consumption
Pw [€/kWh] 44.027E-03
Pf [€/kWh] 38.044E-03
At [€/kWh] 4E-03
Considering an estimated work time of 1,000 hours and a hypothetical case of 365 days per year, the mean daily work time is 2.74 hours. The final equation to estimate the CEC in Euros (€) is:
1�1 � �1 · (=A % =/ % B�) (5.9)
The cost of the machine is approximately 300,000€, amortized over ten years. With the previously mentioned 1,000 hours per year, the coefficient of reference for this factor per hour worked is 30€/h (A). The price of the Accura® 60 is 300€/kg (Mp). Therefore, the final equation to represent an estimation of the total cost (TC) in Euros involved in the manufacturing of one part is:
-1 � 1�1 % B · � % + · .C [€] (5.10)
Experimental measurement of the part weight was carried out after performing all the manufacturing steps and the post-processing. The weight measurements were taken using a precision scale (Kern PCB 100-3, Kern & Sohn GmbH) with a readability of 0.001 g and measuring range of 100 g. The parts including the support structures were measured and afterwards a second measurement was made for only the bulk-part and another for the supports already removed. The processing time was controlled manually by a chronometer, and the printer timing was previously evaluated with a time estimation provided by Preform software.
Results
The main results from current research are summarized above, and are shown graphically in Figure 5.37 using the previously described equations and measurements and applying them to the different part and support geometries. We compare the different support generation processes in terms of material used, CO2 emissions and cost. The ratios of material saved, CO2 emissions reduction and cost savings are calculated by applying the proposed support generation process for the different parts under study and are shown in Table 5.6. The table presents the ratios of actual values using our bioinspired supports structures, when compared to those obtained by using commercial software (Formlabs® and Lightyear). In order to give the readers an overall view of the eco-efficiency linked to the use of the new strategy for support generation, Table 4 gives the ratios for material, energy and emissions regarding their eco-efficiency. These ratios compare the three different methods considered in this research per monetary cost of each representative part.
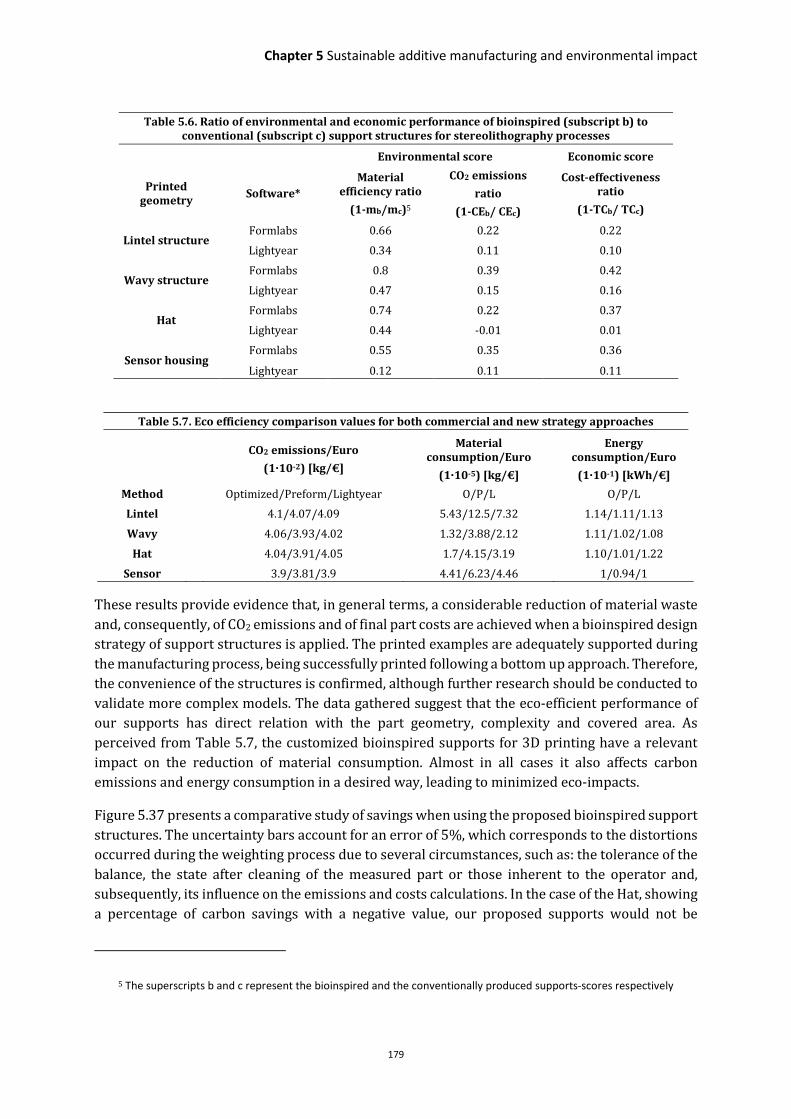
Chapter 5 Sustainable additive manufacturing and environmental impact
179
Table 5.6. Ratio of environmental and economic performance of bioinspired (subscript b) to conventional (subscript c) support structures for stereolithography processes
Environmental score Economic score
Printed geometry
Software*
Material efficiency ratio
(1-mb/mc)5
CO2 emissions
ratio
(1-CEb/ CEc)
Cost-effectiveness ratio
(1-TCb/ TCc)
Lintel structure Formlabs 0.66 0.22 0.22
Lightyear 0.34 0.11 0.10
Wavy structure Formlabs 0.8 0.39 0.42
Lightyear 0.47 0.15 0.16
Hat Formlabs 0.74 0.22 0.37
Lightyear 0.44 -0.01 0.01
Sensor housing Formlabs 0.55 0.35 0.36
Lightyear 0.12 0.11 0.11
Table 5.7. Eco efficiency comparison values for both commercial and new strategy approaches
CO2 emissions/Euro
(1·10-2) [kg/€]
Material consumption/Euro
(1·10-5) [kg/€]
Energy consumption/Euro
(1·10-1) [kWh/€]
Method Optimized/Preform/Lightyear O/P/L O/P/L
Lintel 4.1/4.07/4.09 5.43/12.5/7.32 1.14/1.11/1.13
Wavy 4.06/3.93/4.02 1.32/3.88/2.12 1.11/1.02/1.08
Hat 4.04/3.91/4.05 1.7/4.15/3.19 1.10/1.01/1.22
Sensor 3.9/3.81/3.9 4.41/6.23/4.46 1/0.94/1
These results provide evidence that, in general terms, a considerable reduction of material waste and, consequently, of CO2 emissions and of final part costs are achieved when a bioinspired design strategy of support structures is applied. The printed examples are adequately supported during the manufacturing process, being successfully printed following a bottom up approach. Therefore, the convenience of the structures is confirmed, although further research should be conducted to validate more complex models. The data gathered suggest that the eco-efficient performance of our supports has direct relation with the part geometry, complexity and covered area. As perceived from Table 5.7, the customized bioinspired supports for 3D printing have a relevant impact on the reduction of material consumption. Almost in all cases it also affects carbon emissions and energy consumption in a desired way, leading to minimized eco-impacts.
Figure 5.37 presents a comparative study of savings when using the proposed bioinspired support structures. The uncertainty bars account for an error of 5%, which corresponds to the distortions occurred during the weighting process due to several circumstances, such as: the tolerance of the balance, the state after cleaning of the measured part or those inherent to the operator and, subsequently, its influence on the emissions and costs calculations. In the case of the Hat, showing a percentage of carbon savings with a negative value, our proposed supports would not be
5 The superscripts b and c represent the bioinspired and the conventionally produced supports-scores respectively

180
adequate for promoting an eco-efficiency performance. However, in all other cases our support generation strategy provides better behaviors, even up to values around 80%, in terms of material savings and minimization of impacts. Additional data regarding CO2 emissions, material use, manufacturing time, manufacturing layers and weight details for parts and support structures are provided in the Annex. In any case, we believe that the study is suggestive of the potential for eco-efficiency in additive manufacturing.
Figure 5.37. a) Percentage of material savings using the proposed supports structures, when compared with those obtained using commercial software resources. b) Percentage of CO2 emissions savings using the proposed supports
structures, when compared with commercial resources. c) Economic impact of part manufacturing.
The stability of the presented support structures is remarkable, especially when considering their reduced mass in comparison with conventional support structures. Depending on part geometry, support material savings reach values typically ranging from 40% to almost 80%, accounting for an overall material savings from around 10% to around 50% considering the complete parts. Related cost reductions typically reach values from around 10% to around 40%. We expect that the incorporation of the proposed procedure to additive manufacturing software for promoting the automated generation of bioinspired supports may improve final part quality and eco-efficiency of several additive manufacturing procedures. Future studies will be devoted to assessing the viability of similar supports for other additive manufacturing technologies based on photopolymerization working with an additional degree of precision and a wider range of materials.
All this leads to summaries of manufacturing costs and equivalent CO2 emissions used for the analyses described in the body of the article. The values where obtained either by experimental measurements and analytical calculations, except for the printing time and the number of layers calculated by the mentioned software visualizer, which prepares the jobs sent to the printer. The information regarding detailed information of the geometries under study it is shown as follows in the ensuing tables.
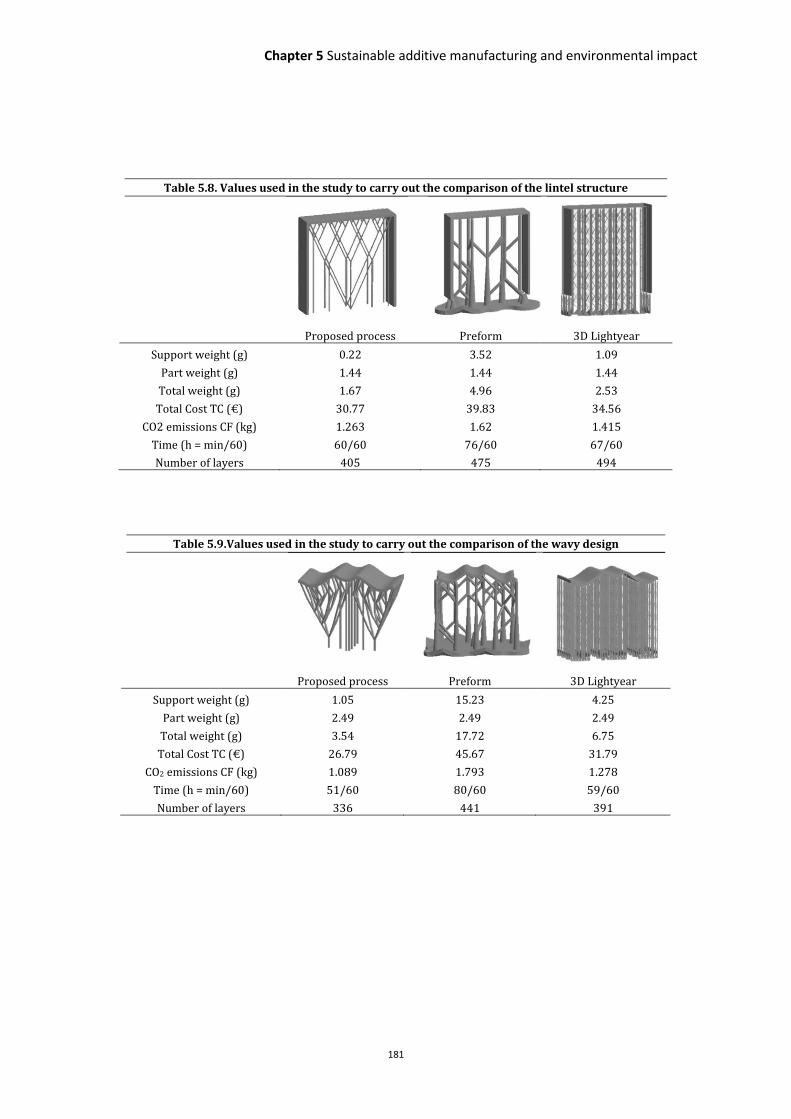
Chapter 5 Sustainable additive manufacturing and environmental impact
181
Table 5.8. Values used in the study to carry out the comparison of the lintel structure
Proposed process Preform 3D Lightyear
Support weight (g) 0.22 3.52 1.09
Part weight (g) 1.44 1.44 1.44
Total weight (g) 1.67 4.96 2.53
Total Cost TC (€) 30.77 39.83 34.56
CO2 emissions CF (kg) 1.263 1.62 1.415
Time (h = min/60) 60/60 76/60 67/60
Number of layers 405 475 494
Table 5.9.Values used in the study to carry out the comparison of the wavy design
Proposed process Preform 3D Lightyear
Support weight (g) 1.05 15.23 4.25
Part weight (g) 2.49 2.49 2.49
Total weight (g) 3.54 17.72 6.75
Total Cost TC (€) 26.79 45.67 31.79
CO2 emissions CF (kg) 1.089 1.793 1.278
Time (h = min/60) 51/60 80/60 59/60
Number of layers 336 441 391

182
Table 5.10. Values used in the study to carry out the comparison of the Hat design
Proposed process Preform 3D Lightyear
Support weight (g) 0.94 15.66 5.58
Part weight (g) 4.2 4.2 4.2
Total weight (g) 5.14 19.85 9.78
Total Cost TC (€) 30.29 47.83 30.68
CO2 emissions CF (kg) 1.225 1.871 1.216
Time (h = min/60) 57/60 83/60 55/60
Number of layers 373 443 374
Table 5.11.Values used in the study to carry out the comparison of the sensor case design
Proposed process Preform 3D Lightyear
Support weight (g) 0.56 18.53 2.56
Part weight (g) 14.32 14.32 14.32
Total weight (g) 14.89 32.85 16.88
Total Cost TC (€) 33.73 52.73 37.86
CO2 emissions CF (kg) 1.315 2.01 1.475
Time (h = min/60) 58/60 85/60 65/60
Number of layers 296 366 386

Chapter 5 Sustainable additive manufacturing and environmental impact
183
5.5 Case of study: Efficient design of sacrificial molds for gelcasting
When using additively manufactured prototypes as supporting elements for other manufacturing techniques (typically as rapid sacrificial molds), the use of hollow geometries helps to minimize eco-impacts, and save wasted material. For instance, regarding the life-cycle of a prototype built by gel-casting technique, for a quantitative assessment of eco-impacts, it is necessary to consider the emission of further residues due to the burning out of binder in the mixture. Moreover, when rising the temperature in order to burn out the mold, which works as structural part of the green body, reaction residues such as CO, CO2 and several organic components are emitted. These issues can be considerably reduced by increasing the porosity of the solid mold, thus reaching two milestones: On the one hand, we can save material wasted during the process and therefore energy necessary to burn out the parts; on the other hand, subsequently to the porosity of the mold, gasses are easier to leak and emissions of contaminant products are reduced.
In this section, we present a comparative study of a specific sacrificial mold for gel-casting of a device for studying cell-to-cell interactions and communications (Figure 5.38). The same mold is additively manufactured by SL-technique but including a major difference. The first one is a master mold, solid, with a bulk 100% material density. The second one, is specially designed to have minimum material and higher porosity, pursuing either to decrease the influence of possible deformation due to the burning out and decrease the material burnt and subsequently the gas emissions that affects to the greenhouse effect (Figure 5.39).
Figure 5.38. CAD model of the casting mold for a medical device (lab-on-a-chip with interconnected micro-chambers for studying cell-to-cell interactions).
Considering, the file weight is an important matter to evaluate the suitability of including such modifications in the design of the mold, moreover when the balance between the advantages reached, regarding the environmental impact, may not enough justified in contrast with the cost for obtaining these abovementioned structures, in terms of human resources, design and machine-time.

184
Figure 5.39. Sequence of the steps given using 3-matic software to obtain a lattice bulk of the mold. 1) Regular mesh projection; 2) generating graphs for the elements selected; 3) Combining the inner and outer surface; 4) Merging and
creating STL part.
The previsualization software Preforms is used to get the estimation information about the printing job, in terms of result file weight, printing time and material. The data are shown in the table below (Table 5.12. Comparison in terms of time, material and file weight for both full density and 75 % infill molds), where the mold is the design commented and difference of the infill porosity are 100% and 75%. In order, to get an approximation for the printing values, the chosen building orientation is defined identical for both designs with the inferior face as first layer in contact with the building platform. Material selection is the Formlabs Castable resin FLCABL01 and layer thickness of 50µm.
Table 5.12. Comparison in terms of time, material and file weight for both full density and 75 % infill molds
STL File weight (kB) Estimated printing time (min)
Material (mL)
Mold 100% infill 11 35 2,12 mL
Mold 75% infill 9.772 36 1,76 mL
Therefore, final study shows that even though the controlled porosity applied for the inner surface of the design, when the Boolean operation of union is carried out between the hollowed design with a wall thickness of 800µm, considerations of intersection must be considered, thus the resulting space is considerably lower than expected. However, a material reduction of 16%, increasing the print time only in 1 minute is valuable, considering the level of complexity added to the design which can be appreciated for instance in the weight of the file (Table 5.12) which is more than 800 times heavier than the original file. In the it can be seen the difference of layer layout and laser trajectories for the layer number 20 of the job, where barely it can be appreciated that lattice truss are defined by only a contour line and minimum infill trajectories, which multiplies considerably the number of steps, jump in and jump out of the laser in the same time.

Chapter 5 Sustainable additive manufacturing and environmental impact
185
Figure 5.40. Laser trajectories for the base plate of the mold (left), latticed infill (center) and its detail.
To minimize the modifications of the original surface design no apertures were addressed to the outer wall connecting with the latticed infill, which could help the resin to flow out of the part, but would significantly impoverish the main task of the mold replicating the geometry
For that purpose, the mold was printed in different orientations (Figure 5.41): A) with the back face of the design attached to the building platform and B) with an angle of 17° on the Y axis and rotation of 45° on the X axis, as it can be seen in the Figure below. The model B will allow to evacuate the resin until the last layers as this orientation minimizes the section of them, thus the hollow is open most of the print time.
In opposition, the models printed in the A disposition do not guarantee the flow of the resin more than partially and the last layers are closing the inside with the outer surface of the part. The parts were weighed with the precision scale - Kern PCB 100-3, Kern & Sohn GmbH)- with a readability of 0.001 g and measuring range of 100 g in the after print exposing the following results
Table 5.13. Weight of SL-printed molds in castable resin FLCABL01
Sample 1 % Sample 2 % Mold 100% infill 2,631 g - - Mold 75% infill A 2,115 g 80 2,082 g 79 Mold 75% infill B 1,973 g 75 1,984 g 75
In view of the measurements, the team conclude that the part orientation B does not contribute significantly to the flow of the resin. The 4 % difference in weight that is achieved by placing the part in this orientation is not productive, since the supports necessary to accomplish it are massive and counter-productive to the efficient performance of the manufacturing (Figure 5.41). Importance of orientation during print was explained in Chapter 2. In addition, this case is a prominent premise to discuss the effects of resin evacuation, the surface finishing and geometrical accuracy of the parts. Some measurements are carried out to the printed parts in order to get a better understanding of finish quality of the part depending on the building direction

186
Figure 5.41. Printed molds after a first washing of the resin on the building platform.
Figure 5.42. Layout of measurements carried out to the molds with 75% density for the infill.
Table 5.14. Measured distance for the printed parts at the control points
a b c d e f
Mold A - - 24,4±0,05 24,05±0,05 1,95±0,05 - Mold B 24,3 ±0,05 24,7±0,1 - - - 1,95±0,5
Wall thickness Height Support marks Channel
width
Channel
length
Mold4 A 2±0,01 6,1±0,01 - 551± 1um 1,89± 0.01 Mold4 B 2,23±0,02 6±0,01 0,6 324± 1um 1,97± 0.01
In the following pictures of Figure 5.43, the difference of the back face of the prototype can be seen, resulting in straight lines for the mold A (left), a coarse surface for the mold B and the contact point, as a defect of the part, due the supports necessaries for the mold B (right).
a
B
A
d
b
A B
c
e
f

Chapter 5 Sustainable additive manufacturing and environmental impact
187
Figure 5.43. Micrographs of the back face of the mold A (left), detail (center) and defects (right) in mold B because of the support structures (the bar scales are 400, 400 and 500 µm respectively).
Finally, to accomplish an evaluation of the complete fabrication process for the biomedical device targeted, it is developed the gel-casting technique of a ceramic slurry, based on hydroxyapatite (HA) powders. The proceed to obtain the slurry is explained in the methodology chapter 3, material section. The slurry is then casted in a vacuum chamber, fulfilling the shape of the mold and achieving the material flow in between the channel geometries ( Figure 5.44).
Figure 5.44. Casting of HA slurry in the mold (left) and 20x micrography of the green body surface (right).
The mold is the taken to the furnace for the corresponding, drying, burning, debinding and sintering the HA up to 1100° C for 2 hours, with the corresponding ramps for each step (see chapter 3, materials section). The final sintered part is then obtained after 26 hours inside the furnace. Although the geometry, as it can be seen in Figure 5.45 does not satisfy the fidelity of the 3D original model, some cracks appeared in the part and the channels were not built, it is an important step forward for the final application of the sacrificial mold. The defects in the part are related to the debinding and drying ramps which are not precise enough to the requirements of the material and they should be further adjusted to increase the final sintered ceramic parts. However, since this is not the final aim of the thesis and considering the difficulty for obtaining sintered ceramics through this process (words according to the specialist on the field in the consortium Syalons® Ltd.), it is valued the approach as a case of potential impact.

188
Figure 5.45. Final sintered HA part at 1100° C made by the gel-casting technique and the sacrificial mold with a 75% infill (left) and fracture micrograph 10X of the same (right).
Furthermore, attending to the potential of the approach, it was evaluated more alternatives for the design of the sacrificial mold. As the most important here is to maintain the geometry during the drying process, it was suggested a model alike the one of the Figure 5.46 . In this design, it is intended to keep the surface in contact with the slurry, which will appropriately transfer it the desired shape, but minimizing it to a wall thickness of 1mm, surrounded by a lattice structure which will give it the structural strength necessary.
Figure 5.46. 3D CAD model of the alternative design for the efficient version of the mold
Compared to the previous design, this presents some defects in relation to its aspect. As it can be seen in the figure below, the more porous version has a substantial buckling defect. The wall thickness is prone to crack at some points but the trusses of the lattice structure look well defined. Although the volume in terms of the bounding box is larger than the previous model, the material usage decrease to 1,14 mL. Thus, the material savings are approximately a 50 %, with the subsequent reduction of burning emissions.

Chapter 5 Sustainable additive manufacturing and environmental impact
189
Figure 5.47. Pictures of the two suggested variations for the efficient gel-casting molds.
The same process developed for the previous sample was carried out for this model. Casting the slurry and burning to get a sintered HA part at 1100° C. The corresponding sintered part and fracture micrograph are displayed below. The part was better sintered, since it was the only sample that was not cracked after its manipulation. Although, the geometry has not a significant improvement with the fidelity of the part, the sintering process was enhanced and the final microstructure is more homogeneous.
In Figure 5.49, the fracture micrograph show a typical structure of HA well disperse, which sintering temperature has been 1100° C, if it is taken a look to the literature (Muralithran and Ramesh 2000).
The samples sintered exhibit some kind of porosity but not in a high proportion. The grain size is then measured with the assistance of the Olympus DSX100 optical-digital microscope (Figure 5.50) presenting considerable grain growth comparing to right samples fired above the 1250° C from the literature.
Figure 5.48. Gel-casting molds of ceramic made in a castable photo-polymeric resin with Formlabs Form1+ machine: 3D printed molds with a ceramic slurry (left); Porous design of the same mold by inclusion of latticed structures
(right).

190
Figure 5.49. Final sintered HA part at 1100° C made by the gelcasting technique and the sacrificial mold with a 50 % of material (left) and fracture micrograph 10X of the same (right).
Figure 5.50. Histogram of grain size for the fracture micrograph of the sintered HA part in the 50 % mold.
In this study, the results show attempt to give an approach to a potential application and should not to be taken as definitive ones. In general terms, it was studied an alternative to improve the environmental impacts of the sacrificial mold for gelcasting has been presented. The results display clear advantages, when compared to the design of solid molds. However, since the gelcasting technique is not properly developed at the facilities of the department, it cannot be concluded that the benefit of saving material usage is enough and we suggest following this groundbreaking line of research to consecutively achieve quantitative data to back this study (see Chapter 7, future research lines).
5.6 Conclusions of this chapter
This chapter has presented a review on the environmental aspects that AM involves, for subsequently presenting strategies in design that attempt to improve the eco-efficiency of the products by additive manufacturing using vat photopolymerization systems. The chapter completes the theme by introducing three cases of study which involves separately the strategies assessed and gives output novel data in terms of eco-efficiency analysis and environmental impacts of stereolithography by optimizing the necessary support structures.
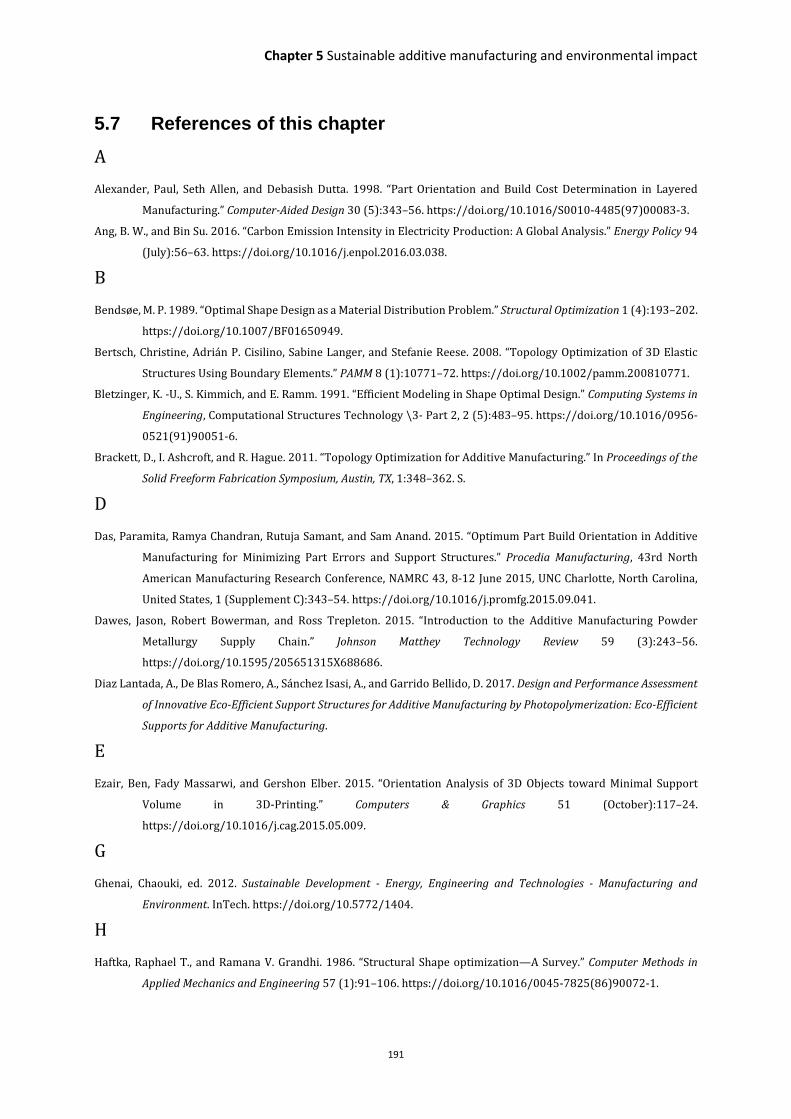
Chapter 5 Sustainable additive manufacturing and environmental impact
191
5.7 References of this chapter
A
Alexander, Paul, Seth Allen, and Debasish Dutta. 1998. “Part Orientation and Build Cost Determination in Layered
Manufacturing.” Computer-Aided Design 30 (5):343–56. https://doi.org/10.1016/S0010-4485(97)00083-3.
Ang, B. W., and Bin Su. 2016. “Carbon Emission Intensity in Electricity Production: A Global Analysis.” Energy Policy 94
(July):56–63. https://doi.org/10.1016/j.enpol.2016.03.038.
B
Bendsøe, M. P. 1989. “Optimal Shape Design as a Material Distribution Problem.” Structural Optimization 1 (4):193–202.
https://doi.org/10.1007/BF01650949.
Bertsch, Christine, Adrián P. Cisilino, Sabine Langer, and Stefanie Reese. 2008. “Topology Optimization of 3D Elastic
Structures Using Boundary Elements.” PAMM 8 (1):10771–72. https://doi.org/10.1002/pamm.200810771.
Bletzinger, K. -U., S. Kimmich, and E. Ramm. 1991. “Efficient Modeling in Shape Optimal Design.” Computing Systems in
Engineering, Computational Structures Technology \3- Part 2, 2 (5):483–95. https://doi.org/10.1016/0956-
0521(91)90051-6.
Brackett, D., I. Ashcroft, and R. Hague. 2011. “Topology Optimization for Additive Manufacturing.” In Proceedings of the
Solid Freeform Fabrication Symposium, Austin, TX, 1:348–362. S.
D
Das, Paramita, Ramya Chandran, Rutuja Samant, and Sam Anand. 2015. “Optimum Part Build Orientation in Additive
Manufacturing for Minimizing Part Errors and Support Structures.” Procedia Manufacturing, 43rd North
American Manufacturing Research Conference, NAMRC 43, 8-12 June 2015, UNC Charlotte, North Carolina,
United States, 1 (Supplement C):343–54. https://doi.org/10.1016/j.promfg.2015.09.041.
Dawes, Jason, Robert Bowerman, and Ross Trepleton. 2015. “Introduction to the Additive Manufacturing Powder
Metallurgy Supply Chain.” Johnson Matthey Technology Review 59 (3):243–56.
https://doi.org/10.1595/205651315X688686.
Diaz Lantada, A., De Blas Romero, A., Sánchez Isasi, A., and Garrido Bellido, D. 2017. Design and Performance Assessment
of Innovative Eco-Efficient Support Structures for Additive Manufacturing by Photopolymerization: Eco-Efficient
Supports for Additive Manufacturing.
E
Ezair, Ben, Fady Massarwi, and Gershon Elber. 2015. “Orientation Analysis of 3D Objects toward Minimal Support
Volume in 3D-Printing.” Computers & Graphics 51 (October):117–24.
https://doi.org/10.1016/j.cag.2015.05.009.
G
Ghenai, Chaouki, ed. 2012. Sustainable Development - Energy, Engineering and Technologies - Manufacturing and
Environment. InTech. https://doi.org/10.5772/1404.
H
Haftka, Raphael T., and Ramana V. Grandhi. 1986. “Structural Shape optimization—A Survey.” Computer Methods in
Applied Mechanics and Engineering 57 (1):91–106. https://doi.org/10.1016/0045-7825(86)90072-1.

192
Hällgren, Sebastian, Lars Pejryd, and Jens Ekengren. 2016. “(Re)Design for Additive Manufacturing.” Procedia CIRP
50:246–51. https://doi.org/10.1016/j.procir.2016.04.150.
Hammond, Geoffrey P., and Craig I. Jones. 2008. “Embodied Energy and Carbon in Construction Materials.” Proceedings
of the Institution of Civil Engineers-Energy 161 (2):87–98.
Homa, J, S Zellhofer, and Stampfl, J. 2009. “Solid Free Form Fabrication of Silicon Carbide Cross Flow Filters.” Journal of
Ceramic Processing Research 10 (February):25–32.
Huang, Runze, Matthew Riddle, Diane Graziano, Joshua Warren, Sujit Das, Sachin Nimbalkar, Joe Cresko, and Eric
Masanet. 2016. “Energy and Emissions Saving Potential of Additive Manufacturing: The Case of Lightweight
Aircraft Components.” Journal of Cleaner Production 135 (November):1559–70.
https://doi.org/10.1016/j.jclepro.2015.04.109.
Huppes, Gjalt, and Masanobu Ishikawa. 2005. “A Framework for Quantified Eco-Efficiency Analysis.” Journal of
Industrial Ecology 9 (4):25–41. https://doi.org/10.1162/108819805775247882.
Hussein, Ahmed, Liang Hao, Chunze Yan, Richard Everson, and Philippe Young. 2013. “Advanced Lattice Support
Structures for Metal Additive Manufacturing.” Journal of Materials Processing Technology 213 (7):1019–26.
https://doi.org/10.1016/j.jmatprotec.2013.01.020.
K
Kellens, K. 2013. “Energy and Resource Efficient Manufacturing. Ph.D. Thesis,.” KU Leuven, Leuven, Belgium.
Kellens, K., W. Dewulf, B. Lauwers, J. -P. Kruth, and J. R. Duflou. 2013. “Environmental Impact Reduction in Discrete
Manufacturing: Examples for Non-Conventional Processes.” Procedia CIRP, Proceedings of the Seventeenth
CIRP Conference on Electro Physical and Chemical Machining (ISEM), 6 (January):27–34.
https://doi.org/10.1016/j.procir.2013.03.003.
Kellens, Karel, Martin Baumers, Timothy G. Gutowski, William Flanagan, Reid Lifset, and Joost R. Duflou. 2017.
“Environmental Dimensions of Additive Manufacturing: Mapping Application Domains and Their
Environmental Implications.” Journal of Industrial Ecology, n/a-n/a. https://doi.org/10.1111/jiec.12629.
Kellens, Karel, Wim Dewulf, Michael Overcash, Michael Z. Hauschild, and Joost R. Duflou. 2012. “Methodology for
Systematic Analysis and Improvement of Manufacturing Unit Process Life-Cycle Inventory (UPLCI)—CO2PE!
Initiative (Cooperative Effort on Process Emissions in Manufacturing). Part 1: Methodology Description.” The
International Journal of Life Cycle Assessment 17 (1):69–78. https://doi.org/10.1007/s11367-011-0340-4.
Krol, T.A., M.F. Zaeh, and C Seidel. 2012. “Optimization of Supports in Metal-Based Additive Manufacturing by Means of
Finite Element Models.” 23rd Annual International Solid Freeform Fabrication Symposium - An Additive
Manufacturing Conference, SFF 2012, January, 707–18.
L
Leary, Martin, Luigi Merli, Federico Torti, Maciej Mazur, and Milan Brandt. 2014. “Optimal Topology for Additive
Manufacture: A Method for Enabling Additive Manufacture of Support-Free Optimal Structures.” Materials &
Design 63 (Supplement C):678–90. https://doi.org/10.1016/j.matdes.2014.06.015.
Liu, Kai, and Andrés Tovar. 2014. “An Efficient 3D Topology Optimization Code Written in Matlab.” Structural and
Multidisciplinary Optimization 50 (6):1175–96. https://doi.org/10.1007/s00158-014-1107-x.
Luo, Yanchun, Zhiming Ji, Ming C. Leu, and Reggie Caudill. 1999. “Environmental Performance Analysis of Solid Freedom
Fabrication Processes.” In Electronics and the Environment, 1999. ISEE-1999. Proceedings of the 1999 IEEE
International Symposium on, 1–6. IEEE. http://ieeexplore.ieee.org/abstract/document/765837/.

Chapter 5 Sustainable additive manufacturing and environmental impact
193
M
Maute, K., and E. Ramm. 1995. “Adaptive Topology Optimization.” Structural Optimization 10 (2):100–112.
https://doi.org/10.1007/BF01743537.
Morrow, W. R., H. Qi, I. Kim, J. Mazumder, and S. J. Skerlos. 2007. “Environmental Aspects of Laser-Based and
Conventional Tool and Die Manufacturing.” Journal of Cleaner Production 15 (10):932–43.
https://doi.org/10.1016/j.jclepro.2005.11.030.
Muralithran, G, and S Ramesh. 2000. “The Effects of Sintering Temperature on the Properties of Hydroxyapatite.”
Ceramics International 26 (2):221–30. https://doi.org/10.1016/S0272-8842(99)00046-2.
P
Pakkanen, Jukka, Diego Manfredi, Paolo Minetola, and Luca Iuliano. 2017. “About the Use of Recycled or Biodegradable
Filaments for Sustainability of 3D Printing.” In Sustainable Design and Manufacturing 2017, 776–85. Smart
Innovation, Systems and Technologies. Springer, Cham. https://doi.org/10.1007/978-3-319-57078-5_73.
S
Schwartz, Steven D., Carolyn K. Pan, Irina Klimanskaya, and Robert Lanza. 2014. “Chapter 68 - Retinal Degeneration.”
In Principles of Tissue Engineering (Fourth Edition), 1427–40. Boston: Academic Press.
https://doi.org/10.1016/B978-0-12-398358-9.00068-9.
Strano, G., L. Hao, R. M. Everson, and K. E. Evans. 2013. “A New Approach to the Design and Optimisation of Support
Structures in Additive Manufacturing.” The International Journal of Advanced Manufacturing Technology 66
(9–12):1247–54. https://doi.org/10.1007/s00170-012-4403-x.
T
Terriault, Patrick, and Vladimir Brailovski. 2018. “Modeling and Simulation of Large, Conformal, Porosity-Graded and
Lightweight Lattice Structures Made by Additive Manufacturing.” Finite Elements in Analysis and Design 138
(January):1–11. https://doi.org/10.1016/j.finel.2017.09.005.
Thompson, Mary Kathryn, Giovanni Moroni, Tom Vaneker, Georges Fadel, R. Ian Campbell, Ian Gibson, Alain Bernard,
et al. 2016. “Design for Additive Manufacturing: Trends, Opportunities, Considerations, and Constraints.” CIRP
Annals - Manufacturing Technology 65 (2):737–60. https://doi.org/10.1016/j.cirp.2016.05.004.
V
Vanek, J., J. a. G. Galicia, and B. Benes. 2014. “Clever Support: Efficient Support Structure Generation for Digital
Fabrication.” Computer Graphics Forum 33 (5):117–25. https://doi.org/10.1111/cgf.12437.
W
Walter, Manfred, Jan Holmström, and Hannu Yrjölä. 2004. “Rapid Manufacturing and Its Impact on Supply Chain
Management.” Proceedings of Logistics Research Network Annual Conference, Dublin, Ireland, January.
Woesz, A, M Rumpler, Jurgen Stampfl, F Varga, Nadja Fratzl-Zelman, P Roschger, K Klaushofer, and Peter Fratzl. 2005.
“Towards Bone Replacement Materials from Calcium Phosphates via Rapid Prototyping and Ceramic
Gelcasting.” Materials Science and Engineering: C 25 (April):181–86.
https://doi.org/10.1016/j.msec.2005.01.014.

194
Y
Yang, Yiran, Lin Li, Yayue Pan, and Zeyi Sun. 2017. “Energy Consumption Modeling of Stereolithography-Based Additive
Manufacturing Toward Environmental Sustainability.” Journal of Industrial Ecology, n/a-n/a.
https://doi.org/10.1111/jiec.12589.
Yoon, Hae-Sung, Jang-Yeob Lee, Hyung-Soo Kim, Min-Soo Kim, Eun-Seob Kim, Yong-Jun Shin, Won-Shik Chu, and Sung-
Hoon Ahn. 2014. “A Comparison of Energy Consumption in Bulk Forming, Subtractive, and Additive Processes:
Review and Case Study.” International Journal of Precision Engineering and Manufacturing-Green Technology
1 (3):261–79. https://doi.org/10.1007/s40684-014-0033-0.
Young, Albert C., Ogbemi O. Omatete, Mark A. Janney, and Paul A. Menchhofer. 1991. “Gelcasting of Alumina.” Journal of
the American Ceramic Society 74 (3):612–18. https://doi.org/10.1111/j.1151-2916.1991.tb04068.x.
Z
Zhu, Jihong, Weihong Zhang, and Liang Xia. 2015. “Topology Optimization in Aircraft and Aerospace Structures Design.”
Archives of Computational Methods in Engineering, April. https://doi.org/10.1007/s11831-015-9151-2.

195
Chapter 6 Industrial applications of complex geometries in eco efficient and
functionally enhanced products


Chapter 6 Industrial applications of complex structures
197
INDUSTRIAL APPLICATIONS OF COMPLEX GEOMETRIES IN ECO-EFFICIENT AND FUNCTIONALLY ENHANCED PRODUCTS
Lattice and porous structures in the development of functionally graded tissue scaffolds and catalytic devices
Some of the geometries already presented in Chapter 4, as examples of porous and lattice structures, are in fact direct applications for the materials science and technology or for the biomedical fields. For instance, the following Figure 6.1 and 6.2 present examples of functionally graded “knowledge-based” lattice structures, which can be perceived as examples of metamaterials, but which can be also used as biomimetic models for the tissue engineering and regeneration fields as they can be seen as scaffolds for tissue repair with bioinspired gradients of mechanical properties and with controlled variations of density, as happens in human tissues. Their controlled porosities may be also of interest for energy applications (Mirzaeian & Hall, 2009), including the development of special filters (WO Patent No.106179, 2016; Withell et al., 2011) or the manufacture of sponges for catalysis, if the adequate materials and technologies are used for their manufacture. In all these cases, the mechanical performance is also modified and can be even controlled from the design stage, according to the desired specifications and minimizing the use of material and the manufacturing time. These applications are discussed in following subsections.
Tissue engineering scaffolds
The combination of the design three-dimensional structures with controlled porosity, together with its manufacturing in a biomimetic material, such ceramics, leads to an optimal osseo-intregration. Since the porous size and regularity are critical factors in the design of ceramic implants for clinical use, in order to allow tissue penetration and bone formation (Uchida, Nade, McCartney, & Ching, 1984), the advantages of advanced design and manufacturing of these structures in several materials, optimal for tissue compatibility such as: Alumina, hydroxyapatite and tricalcium phosphate is a niche for the LCM technology. Figure 6.2 shows an excellent interaction and attachment of the composite part for potential tissue repair strategies.
The additive manufacturing of scaffolds for tissue engineering is not a brand new topic and it has been matter of study since the first SL machines were launched to the market back in the 1980s. (Deng & Kuiper, 2017; Ma & Elisseeff, 2005; Zein, Hutmacher, Tan, & Teoh, 2002). As a matter of fact, regarding the fabrication of scaffolds for drug delivery in hard and soft tissues, most is already reflected in the literature. Further improvements can only be achieved on the fields of material development, in terms of biocompatibility, and design customization, taking advantage of new possibilities offered by the DFAM. The incorporation of unit cells, such those shown in the

198
previous figures to real scanned models of human bones, for prosthetics, dental implants or in vivo testing of tissues on scaffold that present the same geometry than the targeted, can be easily done with the use of the specialized software resources already mentioned throughout this thesis.
Figure 6.1. Functionally graded “knowledge-based” lattice structures manufactured in ceramic material (Al2O3). Green parts just after photopolymerization (courtesy of Lithoz GmbH) of a slurry with high content of ceramic power (left)
and final sintered and compact ceramic parts (center and right images).
Figure 6.2. Functionally graded lattice structures with design based on convergent trusses. Comparison of precision
between LCM and epoxy SLA manufacturing (left); Sintered Alumina parts and measurements (center and right). Porous control examples of dental implants made in zirconia by DLP photopolymerization.
As illustrated by the next example, the design driven by 3-matic 11.0 shows a meaningful case, representative of the incorporation of trabecular structures at a macro and micro level (pore size greater than 50 µm) to improve the bio-functionality in prosthetic bone replacement. The peculiarity in this case resides in the modification of a scanned model of a human lumbar vertebra to apply a distribution of tiny pores that inspired by the natural porosity gradient of the vertebral body or centrum and the intervertebral surface. Figure 6.3 avoids Boolean operations with existing libraries, which may prevent a biomimetic design. However, in this case, it is used a non-regular porous distribution which emulates better the intrinsic randomness formed by the nature.
CeraFab 7500 SLA 3500

Chapter 6 Industrial applications of complex structures
199
Figure 6.3. Explanation of the choosen model for the demonstrator. Clasification of vertebrae and its segments distribution on the spinal cord (left) (source: freepik.com under C.C rights); Cross section of a lumbar vertebra and
main regions (right) (source: www.healthpages.org, author: Cindy Schmidler).
The result, here presented, stands out as an alternative method to the commonly design strategy starting from a regular unit cell with a determined constant spatial distribution of trusses and then applied by Boolean operations to the main body. In this occasion, the starting point is to determine the targeted porosity of a region of the model to operate (vertebral body), defining minimal and maximum element sizes, to subsequently generate the lattice structure.
Firstly, the model is scaled down to define an inner region of the vertebra with the same outer contour that the external surface has, as the shape of the vertebral body is (Figure 6.4.a). Making use of the model mesh itself, the new second inner surface presents the same mesh of the original model but scaled down. Instead, this closed surface is remeshed to a larger element size Figure 6.4.b with a maximum edge length of 2mm and minimum 0.2mm. The edges that form this new mesh are then converted to graph elements, shown in red, and the closed surface is then separated from this object, hence these elements will be used as the structure of the new porous material. Focusing on a pore distribution that try to emulate the natural distribution, it is applied afterwards a gradient of thickness for the diameter of the trusses that create the porous structure, so that the element spacing (tetrahedron) decreases while increasing the thickness (2mm) at the borders and increasing at the middle section since the truss diameter is 0.6mm (Figure 6.4.c).
Figure 6.4. Design steps for obtaining a porous structure that represents the vertebral body of a lumbar vertebra. a) Definition of a closed inner surface. b) Remeshing to larger elements in order to use the mesh elements as porous
structure. c) Gradient of thickness applied to the structure, varying from the inner to the outer sections.
a)
b)
c)

200
Once the porous region is defined, the next step is to embed the new inner surface to the original model, but with the normal direction of the surface opposite to the initial direction and then delimiting a hollowed space inside the vertebra. Consequently, such closed region is free of material and it will be placed with the porous structure created with the graphs. Those graphs are converted to surface STL elements, which means that every truss is then translated to 2D triangle elements and thereby a fine mesh is added to the file. Finally, both separated surfaces are merged together by means of a Boolean union (Figure 6.5), thus the final STL file is defined by a unique shell, where all the elements are connected and avoiding troubles of self-intersection or element node coincidence in the coordinates, that will cause bad edges and further difficulties for the part slicing and machine understanding of the file, in terms of contours and infill information.
With the aim of having relevant data regarding the fabrication issues, before moving forward to the manufacturing in a ceramic material by LCM, the concept is first validated, by using the same ‘bottom-up’ process with Form1+ and standard CLPG01 acrylate material. In this case, the most important bullets to check are part orientation and resin evacuation, achieved with the incorporation in the design of a hole that can provide of an exit to the liquid resin which is constantly in contact with last layers polymerized during the approaching of the building platform to the vat. Inevitably, as the inner trabecular structure presents the branching of the pores when the machine takes the recoating step (tilting and moving z axis), the resin trapped in between these space is difficultly fully removed. Repeating the process layer upon layer, it does no take enough time to flow the resin because of the high viscosity and necessarily some non-polymerized resin remains inside the hollow.
In Figure 6.5 (right) the draining hole added to the last layers of the design is shown (only affecting to the external surface of the vertebra). Although this represents a modification of the original geometry, it is presented as a possible solution for the case that the part is manufactured without any support structure and the part is placed as in Figure 6.5 (bottom left), with the intervertebral surface in contact with the plane of the building platform. Even though the cross section is not reduced to the minimum, as it is commonly set in SLA manufacturing, it is considered, based on experience, that the better results for the truss definition would be achieved with this model orientation.
Despite this being only a probe of concept, the methodology can be followed and applied to many cases of study, giving and added value to the implant or prosthesis, accomplishing a better finishing from the integration point of view, rather than the direct application of Boolean solid operations to the original design. Moreover, these solid operations are time consuming in the design process as they have to be applied as patterns, multiplying per each operation, while working on the STL file, the operations are based on coordinates, splines, points and edges directly managed by the construction algorithm.

Chapter 6 Industrial applications of complex structures
201
Figure 6.5. Cross sectional view of the final design including the inner structure (top left); Model slicing with preform software showing the contours and infill of porous and main body (bottom left); Manufactured part in Clear 01 resin
and detail of the draining hole.
Figure 6.6. Different examples of applied porosity on prosthetics, human-ear ossicles (left) and right clavicle (right), for different methodologies: By means of Boolean operations (left) and a trabecular structure using lattices based on
mesh element (right).
The result difference of porous application can be observed in the next capture, for the case of the human-ear ossicles, to which Boolean subtraction operations have been applied Figure 6.6 (left), in contrast to the design, in which is added a trabecular structure by means of mesh based lattice structures to a human right clavicle Figure 6.6 (right),
Catalytic devices
Figure 6.7 shows a concept for a functionally graded sponge, based on concentric semi-spheres and the intersections between its parallels, meridians and radius, which has been specifically sketched to achieve a self-supported structure, considering the knowledge database collected in the previous Chapter 4. Such is the level of integrity that the design itself allows to be manufactured in both SLA processes, constrained (CeraFab7500) and free surface (SLA-3500), handling their respective loading forces that appear during its manufacturing. The truss diameter for the parallels and meridians vary from 0.4 to 1 mm in the range of 0.1 mm for each truss from the inner part to the outer surface of the theoretical sphere, thus creating a figure that presents spatially variant lattices in a multi-scale at macro-level, while the radios are 0.6 mm in diameter.
4mm
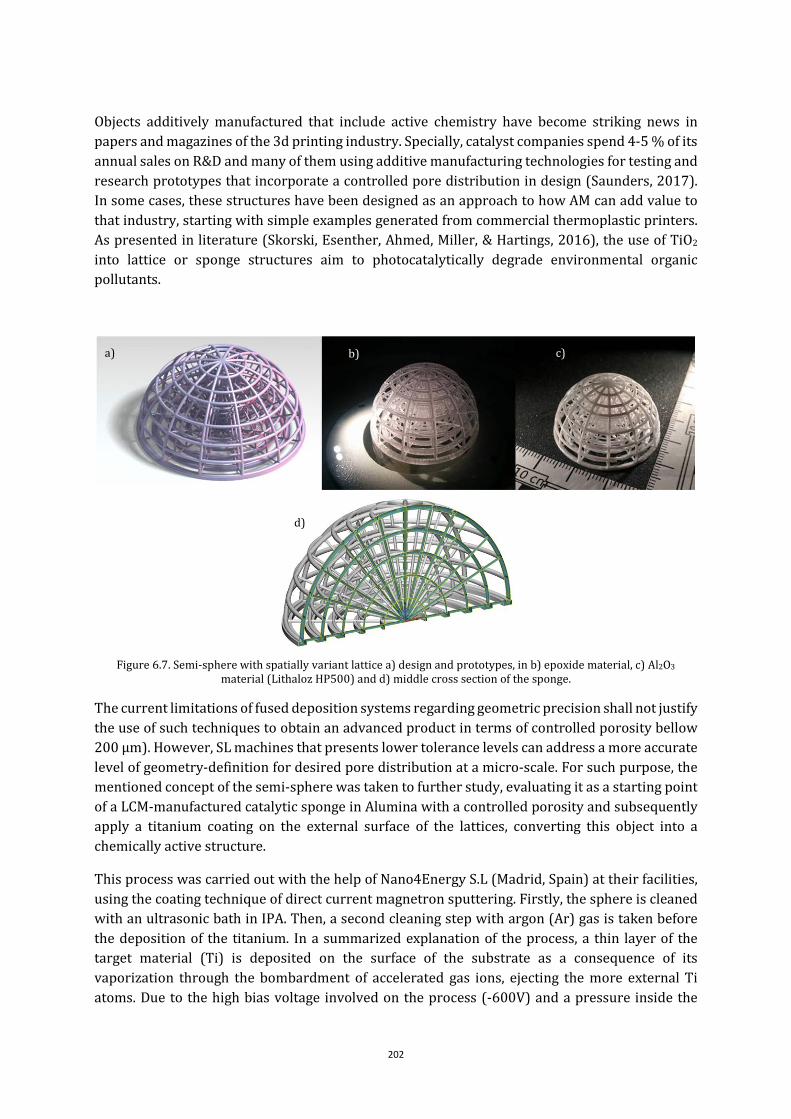
202
Objects additively manufactured that include active chemistry have become striking news in papers and magazines of the 3d printing industry. Specially, catalyst companies spend 4-5 % of its annual sales on R&D and many of them using additive manufacturing technologies for testing and research prototypes that incorporate a controlled pore distribution in design (Saunders, 2017). In some cases, these structures have been designed as an approach to how AM can add value to that industry, starting with simple examples generated from commercial thermoplastic printers. As presented in literature (Skorski, Esenther, Ahmed, Miller, & Hartings, 2016), the use of TiO2
into lattice or sponge structures aim to photocatalytically degrade environmental organic pollutants.
Figure 6.7. Semi-sphere with spatially variant lattice a) design and prototypes, in b) epoxide material, c) Al2O3 material (Lithaloz HP500) and d) middle cross section of the sponge.
The current limitations of fused deposition systems regarding geometric precision shall not justify the use of such techniques to obtain an advanced product in terms of controlled porosity bellow 200 µm). However, SL machines that presents lower tolerance levels can address a more accurate level of geometry-definition for desired pore distribution at a micro-scale. For such purpose, the mentioned concept of the semi-sphere was taken to further study, evaluating it as a starting point of a LCM-manufactured catalytic sponge in Alumina with a controlled porosity and subsequently apply a titanium coating on the external surface of the lattices, converting this object into a chemically active structure.
This process was carried out with the help of Nano4Energy S.L (Madrid, Spain) at their facilities, using the coating technique of direct current magnetron sputtering. Firstly, the sphere is cleaned with an ultrasonic bath in IPA. Then, a second cleaning step with argon (Ar) gas is taken before the deposition of the titanium. In a summarized explanation of the process, a thin layer of the target material (Ti) is deposited on the surface of the substrate as a consequence of its vaporization through the bombardment of accelerated gas ions, ejecting the more external Ti atoms. Due to the high bias voltage involved on the process (-600V) and a pressure inside the
a) b) c)
d)

Chapter 6 Industrial applications of complex structures
203
magnetron chamber 5.1·10-3mbar, it is created a plasma near to the cathode that ejects the target atoms towards the substrate (Moorthy, 2015). The number of target atoms deposited decides the sputtering yield. The final layer estimated on the sphere surface, after a constant flow of 150 scm for 15 minutes, was 200 nm. In the Figure 6.8, it is shown the catalytic sphere after the coating treatment. Although, the titanium thin layer at first sight looks indeed fully attached to even the insider lattices, even covering the physical steps that the layer form on the surface of the AM part (Figure 6.8b), there are some cracks that can be observed by micrograph of digital microscope (Figure 6.8c), moreover the aspect of not a fully dense and homogeneous layer at a micro/nano scale, presenting disperse pores on the layer.
Figure 6.8. Titanium coating by DC Magetron Sputtering applied to the catalytic sponge design: a) picture of the
sponge with the Ti coating; b) micrograph of the dome on top of the sphere; c) node detail of the external trusses.
Further research could shed light on the development of a new commercially available technique to obtain a highly precise catalytic geometry in which the desired porosity can be controlled from the design state, obtaining results qualitative more significant, rather than the use of FDM printers. Having validate the lead process from the design state, manufacturing of the substrate and its coating in Ti, this approach could be arisen by early adopter of the chemical industry as a method to obtain highly precise catalytic structures for advanced application, where the unitary increase of cost is not a bullet to check for the designer.
6.2 Surface functionalization for cell culture, enhanced contact phenomena and improved ergonomics & aesthetics
This section presents the combination of different design strategies, which enable geometrical freedom and promote bioinspired approaches, together with the benefits from a recently enhanced version of laser stereolithography technology (TU Wien, within ToMax), which combines the advantages of improved laser-unit precision and incorporates noteworthy software-based scanning strategies and the use of Lithography-based manufacturing. Results show a remarkable control of the surface topography of polymeric parts, as well as the possibility of obtaining design-controlled micro-structured surfaces upon macroscopic probes and devices. The synergies between the presented design strategies and the developed technology constitute a relevant step forward towards materials and devices with design-controlled multi-scale and micro-structured surfaces for advanced functionalities.
a)
b)
c)

204
It is foreseen relevant implications for areas including: tribology, due to the potential promotion of adhesion using fractal textures; micro-fluidics, due to the possibility of controlling the hydrophobicity and hydrophilicity of surfaces by acting on their topography; optics, due to the option of changing surface reflection properties and overall aesthetic, and biomedical engineering, for the promotion of biomimetic designs.
Cell interaction
The polymers used in lithography-based AMT, are frequently of limited biocompatibility or inadequate for biomedical applications, what limits enormously the span of final applications. For instance, common thermoplastics used for the mass production of medical devices, including poly(methyl methacrylate) (PMMA) or polycarbonate (PC), cannot be processed using conventional additive manufacturing technologies and multi-stage processes are required for linking free-form fabrication with mass production (Diaz Lantada et al., 2015). Recent research has also achieved groundbreaking improvements in the bio-compatibility of AM materials (Baudis et al., 2009, 2010) and dramatically helped to increase the manufacture speed and the attainable precision of these technologies (Stampfl et al., 2008). On the other hand, additive manufacturing technologies aimed at the production of final parts for demanding applications, normally based on layer-by-layer melting or sintering ceramic or metallic powders, do not provide the required precision for obtaining controlled microtextures and for enabling related advanced functionalities.
In this study, the development of two different microtextured biodevices manufactured by the LCM technique is presented: a textured cell culture platform and a textured microdevice for studying cell motility. Final parts can be directly used for cell cultures purposes, due to the adequate properties of the ceramic materials used, without requiring post-processes such as CVD-PVD depositions for promoting biocompatibility or additional replications steps using biomaterials. The strength, toughness and hardness of the additively-obtained ceramic parts make them even candidates for the manufacture of mold inserts for mass production.
The first application example is a set of microtextured fractal surface-based cell culture platforms, with an improved level of detail, for more adequate interactions at a cellular level than previous preliminary prototypes (Díaz Lantada, Mosquera, Endrino, & Lafont, 2010). The discs of Figure 6.9 show a couple of microtextured platforms with different roughness levels. In both cases the upper surfaces include a fractal texture. Typical peak heights lay between 50 µm and 250 µm for the left model and between 350 µm and 550 µm for the right model.
The second application example (shown in the right image of Figure 6.9) corresponds to a microsystem for studying cell motility and addressing the effect of surface texture on cell migration and overall behavior, as previously detailed (De Blas Romero et al., 2016; A. Diaz Lantada, Morgado, & Stampfl, 2013). The system includes a couple of microchambers connected by several microchannels, for guiding cell movement, each of them with a different texture at its bottom. A typical cell motility experiment should begin with the incorporation of cells to one of the chambers and of growth factors to the other one, so as to promote cell movement from one chamber to another. Channels are 200 µm in width and 6 mm in length. The roughness of the different channels (maximum peak height) reaches values around 5 µm, 50 µm, 100 µm and 150 µm, respectively.

Chapter 6 Industrial applications of complex structures
205
Figure 6.9. Computer-aided designs of micro-textured micro-systems. Micro-textured cell culture platforms with controlled surface topographies dimension 2.1 (left) and dimension 2.9 (center). Biodevice for studying cell motility
along different micro-textured channels (right) (De Blas Romero et al., 2016).
Both microsystems are based on a design procedure firstly described by the Product Development Laboratory team at the Mechanical Engineering Department of the UPM (Díaz Lantada et al., 2010)6
combining different steps, including: a) the generation of fractal textures using fractional Brownian surface models with the help of Matlab® b) the conversion of the fractal surfaces into STL format for further manipulation with computer-aided design programs; c) the incorporation of thickness to the fractal surfaces using conventional CAD modeling tools; and d) the combination, by means of Boolean operations, of the textured zones with other solids previously designed, in order to obtain more complex microsystems or to adjust final size and external shape. Our preliminary in vitro trials with both microsystems were carried upon rapid prototypes adequately coated with diamond-like carbon, to avoid the toxic effects of the acrylic resin, and upon some rapid copies obtained using PDMS casting, as previously detailed (Diaz Lantada et al., 2013; Díaz Lantada et al., 2010), and showed promising results.
Figure 6.10 shows a design adaptation, eliminating the excess of material in the lateral walls of the microsystem by means of Boolean operations, for controlling over-exposure to blue light, which may limit precision, and for minimizing material contraction and related stresses during sintering, as further discussed in the manufacturing section.
Figure 6.10. Design adaptation for enhanced manufacture: Elimination of mass from outer walls to avoid over-
exposure and minimize material contraction (left). Rendered and shaded image for improved visualization of the micro-textured channels (right)(De Blas Romero et al., 2016).
6 Additional details can be found at the publication on the International Journal of Advance Manufacturing
Technology De Blas Romero et al. (2016).

206
The manufacture of the micro-textured platforms with different surface topographies shed light on the feasibility of obtaining those complex geometries in ceramic materials using the DLP technology. Figure 6.11, taken after sintering, includes an image of the micro-textured ceramic platforms magnified with higher micro-texture (2.9 fractal dimension dependent on) in order to observe the spiky features in greater detail and the layer which forms the macro-figures. At first glance, the textures adequately reproduce the designs and clear differences can be appreciated between the platform with higher roughness and the platform with lower roughness.
When a deeper observation is carried out, 3D representation Olympus DSX-CB tool, the layers conforming the spiky features (and consequence of the additive manufacturing process) can be appreciated. The shape and dimensions are quite similar to the model. Since the chosen layer thickness was 25μm, the height they could reach is within the range of 150-500 μm, as it was expected previously by the fractal model. In right image of the Figure 5.22, even 19 layers can be
appreciated, corresponding to a Rt value of 475µm. In the case of the more planar platform, shown in the left image of Figure 6.12, around 10 layers can be counted, corresponding to a Rt value of 250 µm. These results correspond to the designed values.
After carrying out a final more detailed topographic analysis with Nikon SMZ80C and a digital camera (Imaging Source DFK 72AUCO2) (Figures 5.22, 24), some interesting issues are found, especially in the upper layers. Those differences could be related to a non-homogeneous slurry layer deposition during the building process, also to a not effective polymerization and to the contraction during the sintering process.
A direct consequence of the additive manufacture machine precision is the obtaining of master prototypes, in which the last 25 μm of the spiky textures are lost, thus leading to somewhat softer surfaces than those from the original CAD files as it can be appreciated in Figure 6.11, being the shape even softer for the part of higher dimension, due to more material and layers needed. This effect, is shown (Figure 6.12) and measured by the size of the ‘islands’ created which are longer in the case of the 2.9 fractal dimension. For most applications of micro-textured surfaces, such softer results may even be positive, as the devices will be a bit softer to the tact and more resistant, as fine needle-like details of 25 μm would normally break down under the slightest mechanical request.
Figure 6.11. Sintered parts of micro-textured platforms (dim 2.9) and magnified image of the platform with higher
micro-texture for appreciating the spiky feature (De Blas Romero et al., 2016).

Chapter 6 Industrial applications of complex structures
207
The micro-device was also checked by digital microscopy. First results helped us to discover some slight flaws in the micro-chambers, possibly as a result of residual material polymerized inside the batch, which can be appreciated in Figure 6.14. After sintering, some contraction is appreciated, but no cracks appear, hence helping us to validate the whole process for the development of micro-textured biomedical microdevices.
Figure 6.12. 3D representation of surface topographies for the different cell culture platforms and micrographs:
dimension 2.1 (up) and dimension 2.9 (bottom). Images taken with Olympus DSX-CB tool (De Blas Romero et al., 2016).
The dimensional variations can be considered from the design stage. Having a look at Figure 6.13, the differences can be understood: the original size of the green part has a length of 16 mm, while the sintered part is 13.5 mm in length. These results account for a global volume variation of 19 %, which is in accordance with the theoretical results for obtaining a relative density of around 99 %. The final lateral dimension (width) of 6.6 mm, when compared with the original dimension of 8 mm, also accounts for around an 18 % of volume variation, which helps to highlight the homogeneity of material contraction. Geometries are in accordance with the original CAD model. The dimension of channels and baths is checked by Imaging Source IC measure software resulting: 203 µm in width and 1863 mm in length respectively Figure 6.13.
In any case, the overall fractal aspect of the surfaces is maintained from the design stage, through the prototyping, to the final sintering step and the whole process is adequate for obtaining micro-textured devices, apt for in vitro trials, and with controlled modifications of surface topography. The last trial over the device was carried out by using the Olympus profile-generator tool, which leads to a 3D representation of the object by overlapping a set of images taken with a determinate pitch. As the result of this procedure, the final dimension could be slightly different, for that reason is understood that the heights given by the profiler are not exactly precise. However, the measurements performed help to validate the proposed approach and allow us to check that the fractal peaks manufactured with differences in height and width of less than 19% when compared with the original model.
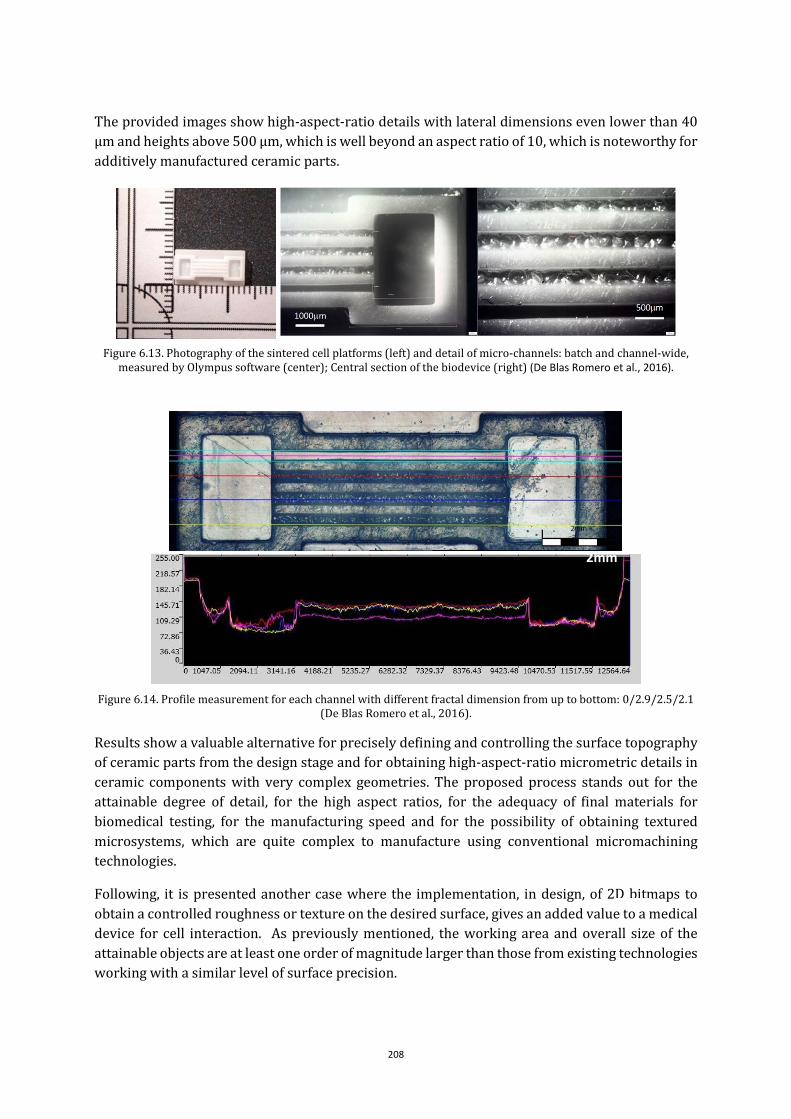
208
The provided images show high-aspect-ratio details with lateral dimensions even lower than 40 µm and heights above 500 µm, which is well beyond an aspect ratio of 10, which is noteworthy for additively manufactured ceramic parts.
Figure 6.13. Photography of the sintered cell platforms (left) and detail of micro-channels: batch and channel-wide,
measured by Olympus software (center); Central section of the biodevice (right) (De Blas Romero et al., 2016).
Figure 6.14. Profile measurement for each channel with different fractal dimension from up to bottom: 0/2.9/2.5/2.1
(De Blas Romero et al., 2016).
Results show a valuable alternative for precisely defining and controlling the surface topography of ceramic parts from the design stage and for obtaining high-aspect-ratio micrometric details in ceramic components with very complex geometries. The proposed process stands out for the attainable degree of detail, for the high aspect ratios, for the adequacy of final materials for biomedical testing, for the manufacturing speed and for the possibility of obtaining textured microsystems, which are quite complex to manufacture using conventional micromachining technologies.
Following, it is presented another case where the implementation, in design, of 2D bitmaps to obtain a controlled roughness or texture on the desired surface, gives an added value to a medical device for cell interaction. As previously mentioned, the working area and overall size of the attainable objects are at least one order of magnitude larger than those from existing technologies working with a similar level of surface precision.
2mm

Chapter 6 Industrial applications of complex structures
209
The design has 6 cylindrical chambers of Ø6 mm and 2 mm-depth which all them communicate to a central chamber of Ø12 mm and same depth. Individually each chamber has a ‘first-room’ in which the cells objective of the study may be place. For each chamber, a different texture was added, in order to research about the cell motility regarding the roughness of the environment. These textures are based on concentric circles with different heights of 0.2 and 0.8 mm respectively, the same with squared wells and two chambers with a controlled porosity equal for the rest of the couples.
The medical microsystem for interacting with cells (Figure 6.15) still needs to be tested, but we expect to use it for analyzing the impact of surface texturing on the promotion of special cell-material interactions. Even if the material is not adequate for biological interactions, it is possible to improve its biological performance by applying surface coatings for enhanced in vitro testing. An alternative would be able to design and manufacture the negative geometry of the part, hence obtaining a rapid micro-textured master for casting PDMS or other material adequate for cell culture tests.
Figure 6.15. Medical microsystem for studying cell-material interactions with different micro-textured chambers.
Surface contact phenomena
Hydrophobic polymeric devices
The combined application of projecting a 2D bit mapping onto a determined surface, together with the potentials provided by additive manufacturing technologies and the related freedom of design, opens new horizons in the field of tribology and in applications including: improving contacts in machine elements, developing materials and devices with special self-cleaning properties for improved corrosion resistance, controlling cell behavior and fate, by promoting special cell-surface and cell-material interactions and among many other potentials.
The use of the SLA technique to obtain low cost surfaces which present a hydrophobic performance, avoiding the use of sacrificial parts, highly sophisticated equipment or post treatment for the surface (e.g. coatings), has not been deeper studied, since the structures necessaries to create such effect are in the order of the micro and nano-scale. SLA capabilities present a precision limited by the size of its laser spot and this effect is more remarkable for the high-aspect-ratio tiny features needed to enable hydrophobic properties to a surface.

210
However, the use of techniques which allow to reach microstructures down to such level of definition as soft-lithography (SL)(Lyons et al. 2013) or laser ablation (Tang, 2011), lack the
platform dimensions to generate large scale parts (Andres Diaz Lantada, Hengsbach, & Bade, 2017) or geometries different to flat surfaces, being this process time consuming and expensive, reaching to results of the even a single micron.
Current advances have gone in the direction of creating microtextured masters by SL in a UV-curing material, for a subsequent replication in PDMS. Lyons et al. suggested the fabrication of direct masters with commercially available multi-jet methods or the approach by means of robotic dispensing tools (Lyons, Mullins, Barahman, Erlich, & Salamon, 2013), obtaining large complex polymer objects which incorporate micro features in the range of ~ 200-1000 µm and exhibiting superhydrophobic behavior.
The attainable surface precision and the possibility of using bioinspired design principles is validated and can be understood by looking at the manufactured surfaces in acrylate-based formulated resin and at the optical microscopy images (Chapter 3, materials section). Following the steps of the previous work developed by the PDL team (Diaz Lantada et al., 2015; Diaz Lantada et al., 2017; Hengsbach & Díaz Lantada, 2014), it is put into practice the strategy described in Chapter 4, section 3.2 (math based approaches), using the approach developed in Matlab® to obtain STL models with a bioinspired textured-surface that mimics superhydrophobicity features of the lotus leaf. Making use of the high precision SLA system ‘BP8’ from TU Wien and the self-developed formulation of an acrylate-based photopolymeric resin, it is intended to evaluate this process as a low-cost alternative with a good final performance that allow to the end user obtain options in other materials.
The original design is a square flat platform 10 mm x 10 mm x 1.5 mm-thick that incorporates the aforementioned texture, showing an array distribution with a distance between peaks (pitch) and features with an aspect ratio 1:1 of 670 µm and the model labeled as LT2 (Figure 6.16); being the reason of this unusual value that for the last layer printed of the spike features, the cross section diameter will coincide to the 31 µm of the laser spot width, so that the last layer is only points and the CAD design is not limited by the technology (Figure 6.17). The layer thickness selected for the case is 25 µm, as well as, the slicing thickness carried out with the help of Deskartes® 3Data Expert 11.0. The parameters for the running job are those defined in Chapter 3, section 3.3 for the proper set up of the printer.
Next, the design is scaled to different dimensions from the original 6:5, 4:5, 3:5 and 2:5, obtaining respectively the samples LT1, LT3, LT4 and LT5 (in Figure 6.16, it can be seen the five samples labeled with their respective pitch distance.). These test samples help to evaluate the viability of manufacturing such features, looking for the compromise between a good geometrical definition and the desired performance; observing possible issues such as the lack of information due to the limiting conditions of the printer, or the repeatability of the features inside the same array.
To check the structural fidelity, as well as the structural differences of the profiles SEM images were taken to show the level of detail attainable using the acrylate-based material, which is intended to be highly stable at low intensity values for its use in ‘BP8’. Figure 6.17 is a sequence of images zooming to one of the peaks that form the texture of the sample LT3.
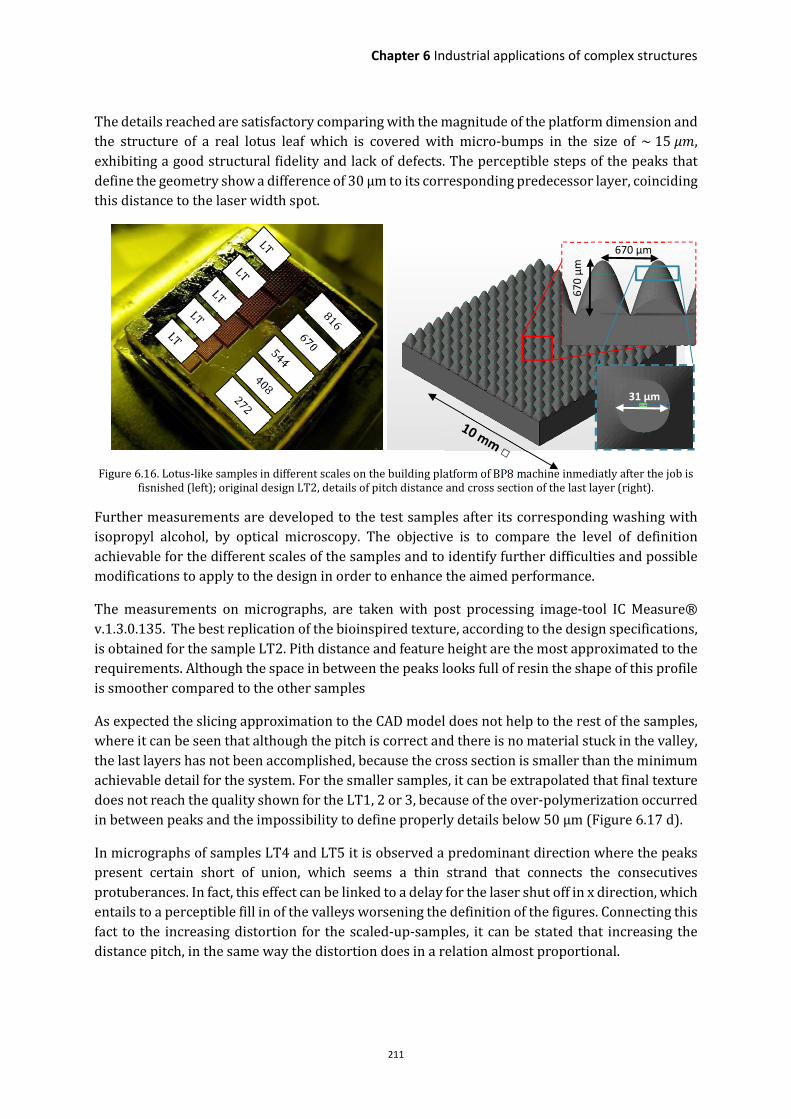
Chapter 6 Industrial applications of complex structures
211
The details reached are satisfactory comparing with the magnitude of the platform dimension and the structure of a real lotus leaf which is covered with micro-bumps in the size of ~15H+, exhibiting a good structural fidelity and lack of defects. The perceptible steps of the peaks that define the geometry show a difference of 30 µm to its corresponding predecessor layer, coinciding this distance to the laser width spot.
Figure 6.16. Lotus-like samples in different scales on the building platform of BP8 machine inmediatly after the job is fisnished (left); original design LT2, details of pitch distance and cross section of the last layer (right).
Further measurements are developed to the test samples after its corresponding washing with isopropyl alcohol, by optical microscopy. The objective is to compare the level of definition achievable for the different scales of the samples and to identify further difficulties and possible modifications to apply to the design in order to enhance the aimed performance.
The measurements on micrographs, are taken with post processing image-tool IC Measure® v.1.3.0.135. The best replication of the bioinspired texture, according to the design specifications, is obtained for the sample LT2. Pith distance and feature height are the most approximated to the requirements. Although the space in between the peaks looks full of resin the shape of this profile is smoother compared to the other samples
As expected the slicing approximation to the CAD model does not help to the rest of the samples, where it can be seen that although the pitch is correct and there is no material stuck in the valley, the last layers has not been accomplished, because the cross section is smaller than the minimum achievable detail for the system. For the smaller samples, it can be extrapolated that final texture does not reach the quality shown for the LT1, 2 or 3, because of the over-polymerization occurred in between peaks and the impossibility to define properly details below 50 µm (Figure 6.17 d).
In micrographs of samples LT4 and LT5 it is observed a predominant direction where the peaks present certain short of union, which seems a thin strand that connects the consecutives protuberances. In fact, this effect can be linked to a delay for the laser shut off in x direction, which entails to a perceptible fill in of the valleys worsening the definition of the figures. Connecting this fact to the increasing distortion for the scaled-up-samples, it can be stated that increasing the distance pitch, in the same way the distortion does in a relation almost proportional.
670 µm
67
0 µ
m
31 µm

212
It can be extracted from the measurements that for such technology the better compromise between geometry definition, accuracy and smaller details are obtained in the range ~(50 - 800) µm. This is not only as a direct consequence of the photopolymerization process but also for the post processing, cleaning and UV curing. The viscosity of the material used for the case is high, so that the spaces in between of peaks are significantly smaller (LT5) or narrow (valleys of LT1 sample), it is difficult for the resin to flow during the recoating process and peeling, thus after consecutive exposure of the laser some over-polymerization occurs, making this excess of resin to get stuck, reducing the distance peak-bottom of the protuberances (as it can be seen in the bottom image of Figure 6.18).
Figure 6.17. SEM image of a real lotus leaf (a) (image copyright: Wilhelm Barthlott); SEM sequence of images of the LT4 sample, zooming in to one feature (b, c) (courtesy of the TU Wien); level of minimum detail achieved by using BP8
(d).
So as to demonstrate the impact of the achieved biomimetic texture, a further experiment was performed where a water droplet interacts with the substrate. The size of the droplet is 3 mm and it is dropped by using a syringe above 30 mm, being the angle that substrates form with the plane 0°. The results differed for the different samples, showing contrasting behavior for each sample (Figure 6.19). While LT1 and LT3 exhibit, at least in appearance, a hydrophobic behavior with water static contact angles higher than 70°. For the case of LT1, which presents the best performance the contact angle is ~120°. However, the samples LT2 and LT5 present the same wettability than a flat surface, although scarcely improved. It has to be considered that photographs are taken at same optical distance and resolution, but these are trimmed to fit the caption and adapted for the reader, such that proportion for them are slightly to the real parts.
a) b)
c) d)

Chapter 6 Industrial applications of complex structures
213
LT5
LT4
LT3
LT2
LT1
Figure 6.18. Micrographs of test samples including the ‘lotus leaf’-like texture. From up to bottom samples: LT4, LT2 and LT1.
26
3,8
4 µ
m
500 µm

214
Figure 6.19. Images of substrates LT1, LT2, LT3 and LT5 (from left to right) with a 2mm droplet posed atop demonstrating different behavior for the scaled features.
In conclusion, the viability of creating surfaces by means of SL has been studied, in an acrylate-based material which exhibit a hydrophobic performance due to the incorporation of a texture that mimics the surface of a lotus leaf, at least in one order of magnitude higher than the real dimensions. The results show wettability properties for this texture in the case of features with dimension of 816 µm. The process provides a textured surface with a good fidelity of the arrays comparing with the original design and high repeatability. Although, the performed experiments do not show hydrophobicity for the rest of the cases, this study cannot conclude that the other studied dimension are not adequate for such purpose and we encourage further studies on the field.
Improved contact phenomena in machine elements
Transport is another sector that is starting to benefit from the possibilities provided by the combined use of computer-aided design & engineering resources and additive manufacturing technologies, especially for enhancing the design and production of innovative systems, which require the support of rapid prototypes along the development stages. However, it is necessary an additional turn of the screw towards an increased impact of additive technologies in the transport field, aiming at the substitution of mass-produced components obtained with traditional methods, by innovative components with improved functionalities or pursuing mass-personalization.
This promotion of additive manufacturing resources for transport applications may rely on: The incorporation of special surface functionalities to the components or production tools, including surface textures for enhanced ergonomics, aesthetics or tribological properties. It is difficult to replace conventional manufacturing of components such as bearing, because the running cost are not possible to equate when talking about AM.
However, the utilization of this technique can be justified in special cases that do not require of a mass production but the inclusion of alternative requirements to the standards. The following images show an interesting case of study, linked to the incorporation of inner surfaces on ball bearings for improved tribological response (Echávarri Otero, De la Guerra, Bellón Vallinot, & Chacón Tanarro, 2016). The micro-wells are aimed at oil retention according to experiences from our team, which have validated the benefits in terms of friction reduction of incorporating textures upon planar surfaces. In previous studies, it has been obtained the micro-wells by UV-
Chapter 6 Industrial applications of complex structures
215
photolithography and chemical etching, but this approach is limited in terms of geometrical freedom (as it must be applied to planar surfaces). The forthcoming manufacture of test probes and prototypes will allow to test the impact of these special surfaces upon more complex geometries, such as those from the bearing.
Figure 6.20 show the sequence to apply the desired textured on the inside and external bearing tracks based on 2D bitmapping projection approaches (see Chapter 4 section 3.3). In this case, wells are Ø 700 µm and 250 µm-depth with a regular separation distance of 180 µm, according to the geometries test by the team. However, these could run into difficulties while printing the design in a vat photopolymerization process since the wells can be obstructed and contours of the well are significantly near to each other, thus the jump in and out of the laser are quite short and finally possibly promoting to over-polymerization troubles. The bounding box of the bearing is Ø 60 mm x 2 mm-height.
The idea of the team is to shed light on new approaches of ball bearing in ceramics, as it is already happening in the metal additive manufacture sector. Rolls-Royce® has used additive layer manufacturing (ALM) for the bearing housing of the aero engine Trent-XWB©, improving the lead time. Nevertheless, in the field of ceramics there have been no approaches yet to bearings, although interesting opportunities are presented, thanks to the easy functionalization by AM. For that, it was set up this case where it was suggested the manufacturing in one job of the whole component, including the desired texture on the tracks. Advance testing of feasibility was carried out through SLA-manufacturing to obtain a prototype, and even though it is a simple concept, it will help to understand the possibility of fabrication for a ball bearing with LCM technologies.
Figure 6.21 shows the 3D printed bearing obtained in one job. To properly achieve such groundbreaking application it was necessary to apply all the knowledge-based information collected during the realization of this thesis, which lead to implement the minimum and necessaries modifications to the original model, such as, scaling down the bearing balls, and the inclusion of supports with minimum thickness (0.1 mm limited by the layers of SLA-3500, thus the compliance between ball and housing is that) and minimum section to get the built up inside the housing as can be observed in the figure.
The building orientation is the same than placed for the photograph. It can be seen the surface roughness due to the layering steps during fabrication, since the technologies is not that precise as the LCM would be, eliminating such steps that have not place for such application. Placing the part in that way, it is necessary also the incorporation of supports to the bottom of the part, since the process require them, but the benefits of such direction will directly influence on the quality of the texture which is in the z direction and so that the cross section of the layer for the texture are the profile of the wells, reducing the problems of over-polymerization.

216
Figure 6.20. Texturing of inner surfaces on ball bearings for improved tribological response. The forthcoming manufacture of test probes and prototypes will allow us to test the impact of the special surfaces.
Regarding the manufacture of the wells that form the textured added to the design, it is observed that the dimension are reliable features comparing with the requirements of the CAD model. The measured depth of the wells in the prototype is the maximum distance calculated from one valley to the reference surface, which is 240 µm, quite near to the aimed depth, being the diameter of the wells about 680 µm. The details can be observer in the Figure 6.21.
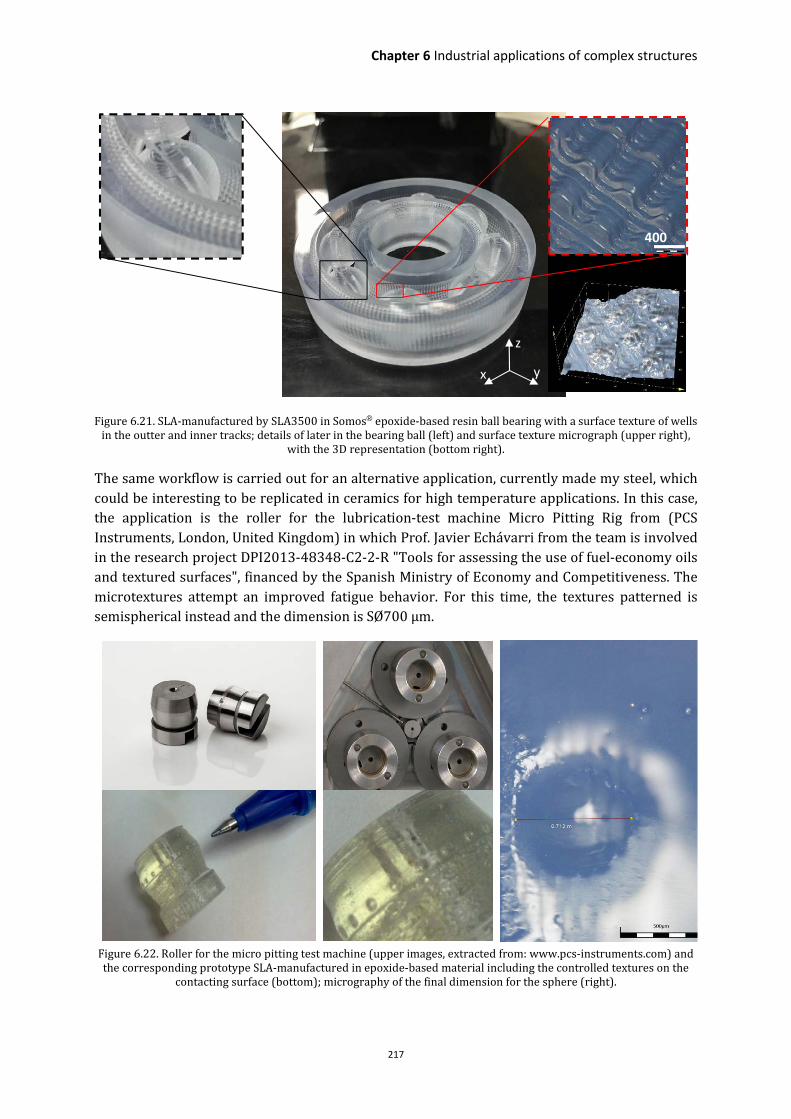
Chapter 6 Industrial applications of complex structures
217
Figure 6.21. SLA-manufactured by SLA3500 in Somos® epoxide-based resin ball bearing with a surface texture of wells in the outter and inner tracks; details of later in the bearing ball (left) and surface texture micrograph (upper right),
with the 3D representation (bottom right).
The same workflow is carried out for an alternative application, currently made my steel, which could be interesting to be replicated in ceramics for high temperature applications. In this case, the application is the roller for the lubrication-test machine Micro Pitting Rig from (PCS Instruments, London, United Kingdom) in which Prof. Javier Echávarri from the team is involved in the research project DPI2013-48348-C2-2-R "Tools for assessing the use of fuel-economy oils and textured surfaces", financed by the Spanish Ministry of Economy and Competitiveness. The microtextures attempt an improved fatigue behavior. For this time, the textures patterned is semispherical instead and the dimension is SØ700 µm.
Figure 6.22. Roller for the micro pitting test machine (upper images, extracted from: www.pcs-instruments.com) and the corresponding prototype SLA-manufactured in epoxide-based material including the controlled textures on the
contacting surface (bottom); micrography of the final dimension for the sphere (right).
z
x y
400
µm

218
Enhanced gripping functionality
In contrast to the hydrophobic case, it was also conceived in a very low stage of development, a concept of an additively manufactured Velcro, which could provide to two independent surfaces the ability to join and separate according to the desire of the user. Moreover, it is intended that this union can resist a separation force. For that purpose, it was developed two test samples (male and female connectors) on a flat surface thanks to the use of pattern-based surface texturing (see Chapter 4, section 3.3).
First, it is designed both union connectors (Figure 6.23) starting from a CAD model. The male figure has the shape of a micro-hook, which is thicker from the base and thinner at the end. The female connector in inspired on a pyramid which is only formed by its edges, thus it allows to be hooked by the male connector in four directions. The difficulty in design comes from the need of being self-supported micro-structures, (0.8 mm-high and 0.4 mm-thick) and both designs present cantilevers. Therefore, the angles required for the design are higher angles than 30°.
Figure 6.23. Optical microscopy of Velcro connectors, female (left) and male (right).
The concept was printed by SL-BP8 using the same acrylate-based polymeric resin self-developed than for the case of the hydrophobic samples. The connectors were fabricated in the same job, the building orientation was the z axis placing the base of the rectangular platform on x, y axis of the building platform, so that the layers of the micro-connectors were perpendicular to their peaks, as it can be seen in Figure 6.23.
Figure 6.24. Photographs of the Velcro (male and female connectors) distributed in equal patterning on rectangular surfaces.
2mm
2mm

Chapter 6 Industrial applications of complex structures
219
Although all the features are successfully printed, it is observed that because of the thickness of the platforms, a curling effect was developed on the parts which made both concave. This fact, challenge the put into practice of the Velcro. However, it must be point out that the features coincide and the attachment male-female is achieved. Looking at the pictures, it can be appreciated how tiny the features are, being difficult to check at first sight.
This first approach was oriented to a flat surface but it could be extrapolated to more complex surfaces, such as, spheres, internal or irregular ones. This concept would help to open a new wide range of potential application that are only feasible thanks to additive manufacturing.
Aesthetics, ergonomics and customization
High precision additive manufacturing working with transparent resins is already providing interesting optical applications even linked to the development of monolithic microsystems incorporating lenses directly manufactured together with the devices’ structures. In connection with this field of research and application of additive technologies, the use of surface textures may constitute an interesting approach towards the development of Fresnel lenses, directly manufactured in an additive way in polymeric materials or injected within additively manufactured injection molds including such textures and complex networks of cooling channels for improved production.
In addition, recently, the use of additive manufacturing technologies as the best solution for the promotion of customized designs is increasing considerably, even aiming at shifting from the more traditional mass-production, to mass-personalization approaches. In some cases, the application of textures upon of the surfaces of devices, not only adds an extra value to the final design, but also create an optical effect that can be beneficial for the end user, mainly in terms of aesthetics.
Towards additional versatility, the combination of complex geometries and surface textures, attainable by using additive manufacturing technologies, with surface coatings based on the use of thin-film technologies, such as physical-vapor deposition and chemical-vapor deposition, is a remarkable strategy. Using these combinations, it is possible to modify surface brightness and color, to obtain polymeric objects with metallic appearance, to protect the obtained geometries, while also producing nice optical effects, among other possibilities, all of which is beneficial for the field of industrial design and has implications even in inner-decoration and art.
Figure 6.25 shows an example of surface texture applied to an initial flat surface with a bioinspired pattern. In this case, the prototype is obtained by laser stereolithography using epoxy resin and a plasma-assisted physical vapor deposition process is finally applied to modify the optical properties of the part. However, when the part is observed from different angles (Figure 4.10) the visual perceptions of the textures vary. In order to avoid that variation, the surface is coated with a titanium plasma layer, which micrograph can be seen in Figure 6.26, which shows a well attached coating with some minor porosity and slight cracks.

220
Figure 6.25. Test probes with biomimetic textures. Ti-coated (left) and uncoated (right) prototypes. Acknowledgement: Coating process tested by Nano4Energy (www.nano4energy.eu/), UPM spin-off.
Figure 6.26. Micrographs of two different coatings applied to the already existing surface textures of prototypes obtained by laser stereolithography: a) 3D geometry, b) flat geometry. Acknowledgement: Coating process tested by
Nano4Energy, UPM spin-off.
A key aspect in modern product development, together with functional excellence and safety issues, is the promotion of overall aesthetic aspect and ergonomic performance (Figure 6.27). Additive manufacturing, allowing for the development of complex structures and geometries, constitutes a fundamental set of resources for progressing in these directions. For instance, improved ergonomics means interacting in better ways with our corporal geometries, which are complex, and consequently leads in many cases to products with intricate structures and geometries. In addition, such aesthetic and ergonomic performances depend importantly on the surface topographies of the systems being developed and the use of surface texturing strategies combined with additive manufacturing tools may be a very appropriate way for advancing in these directions.
As final demonstrator of the wide variety for applications that AM offers in this field. It was developed a customized design for a BIC®-like pen case. Together with the help of the TU Wien team and printed in a new formulation of an acrylate-based material different to the use in this Thesis (Figure 6.28).
a) b)
Titanium Epoxy

Chapter 6 Industrial applications of complex structures
221
Figure 6.27. Examples of application for enhanced grip and mass customization by texture projection on the surface
and 3D textures: Steering wheel with leather-like texture incorporated to the grip (upper left); customization of textures for a computer mouse (upper right) and phone case including an elephant with detailed texture. The designs
are obtained using 3-matic 11.0 from Materialise®. (iPhone® 7 Case www.thingiverse.com/thing:2190155) by mcnultynoah is licensed under the Creative Commons).
Figure 6.28. BIC®-like pen case manufactured with ‘BP8’ machine, which includes customized textured for gripping and the external tube is made of lattice structures.

222
6.3 Integral strategies for multi-functional engineering systems: Cases of success
Design, modeling and manufacture of pneumatic actuator for soft robotics
State-of-the-art actuators represent a relevant bottleneck in many industrial applications, including most fields of robotics, transport, energy engineering systems, biomedical engineering, among other areas. Among important limitations it is necessary to note: inertia and back-drivability, stiffness control, power consumption and environmental safety. The development of innovative soft-actuators able in some cases to mimic the performance of biological actuators (muscles), which stand out for the capability of reaching high-deformations during their actuation and for their low energetic consumption, is starting to constitute a relevant breakthrough.
As such soft actuators are normally based on complex geometries, which help to apply inner pressure gradients for their operation; additive manufacture constitutes again a fundamental tool for promoting research and development activities. Here it is presented preliminary developments linked to a new type of actuator with controlled inner geometries, which can only be obtained thanks to an ad hoc design of support structures and to the use of an elastomeric photo-polymer for their additive manufacture.
The design is inspired by previous work developed by the Whitesides’ team (Mosadegh et al., 2014), which proposed the use finger-like geometries with lateral bellows. However, such developments required the use of several manufacturing steps, including an additive manufacture of master molds for subsequently casting PDMS and obtaining the bellows and a final closing or sewing step for obtaining a closed hollowed geometry.
Previously to opt for a specific design, the behavior of the desired elastic material was modeled by means of FEM simulations, in order to study the material performance, pressure necessary to act the device and to start evaluating possible options for the design. For that, some concepts were drawn and obtained 3D CAD models (Figure 6.29).
One design was chosen to carry out the respective simulation of maximum elongation under maximum stress. The actuator of the upper right part of Figure 6.29 , ‘’balloon’’ was the selected for that purpose, with a wall thickness that varies from 1.2 mm at the sides and is 0.5 mm-thick in the middle section. The load was an internal pressure of ∆== 8 MPa, resulting in a maximum displacement of 1.32 mm and Von Misses maximum stress of 3.9 MPa, very low to the 5.9 MPa of the tensile strength for the material FLGR01®, being the value of the pressure higher than the estimated to be necessary for the actuator.
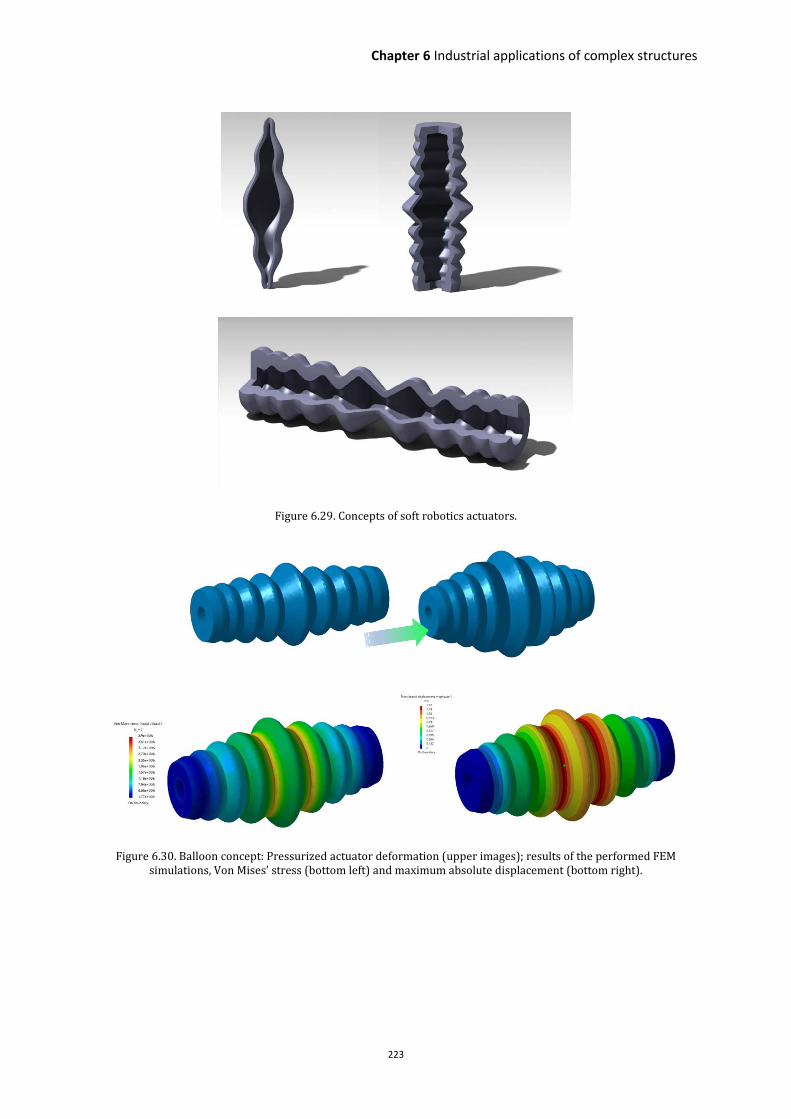
Chapter 6 Industrial applications of complex structures
223
Figure 6.29. Concepts of soft robotics actuators.
Figure 6.30. Balloon concept: Pressurized actuator deformation (upper images); results of the performed FEM simulations, Von Mises’ stress (bottom left) and maximum absolute displacement (bottom right).

224
Figure 6.31. a) Design evolution (simulation driven) from the concept state to the re-design for manufacturability,
including the ‘ad-hoc’ supports that improve the performance: b) Conceptual explanation of working principle.
a)
b)

Chapter 6 Industrial applications of complex structures
225
Opting for a complex geometry, which helps to integrate functionalities and to reach the desired prototypes of soft actuators in a single manufacturing step, thanks to the use of one of the SL-system (Form1+) with the acrylate-based elastic material (FLGR01©, Formlabs flexible resin). It has been suggested the design of a clamp which is pneumatically activated for its motion. Very close to this approach Peele et al. already published a case of an artificial muscle by using a DLP-system and elastic photopolymer (Peele, Wallin, Zhao, & Shepherd, 2015).
Figure 6.31 schematically help to understand the complete conceive-design-implement-operate cycle, showing the design evolution of the actuator, from the concept state and re-design for manufacturability to the final stereolithography printed part. The need to incorporate a support structure to the internal channel for improving the manufacturing is trivial. However, it is important that those do not obstruct the air flow into the geometry.
For that purpose, instead of the typical cylindrical structures, it is opted to include structures with an elliptical cross section, like an aerodynamic part which induce to a laminar flow not creating turbulences inside the part.
The wall thickness of the channeled actuator is 0.5 mm and the distance between these walls 0.45 mm. The design is conceived to have an inlet section of Ø2 mm, which presents a softened opening to subsequently split in both channels. Bounding box of the design is 18.7 mm x 17.5 mmx 11 mm. The supports section is an ellipse of 0.6 x 0.3 mm and 3 mm-large.
As the maximum elongation of the FLGR01© material is 90% it is studied a concept of motion very under maximum stress of 5.9 MPa (see Chapter 3, materials). Thus, it is conceived to work for a not quite demanding pressure of 500 kPa in the way it can be considered an application easily obtainable for the average end-user.
In Figure 6.32, it is included the FEM based simulations for the geometrical optimization of the actuator, aiming always at improved performance and manufacturability; and, finally, showing the validation of the working principle by application of compressed air to the geometrically complex and additively obtained soft-actuators.
Figure 6.32. Finite element analysis for design optimization. Absolut displacement of the elements (left) and the Von
Misses strain of the actuator pressurized to ΔP= 500 kPa (right).

226
Conclusions to the case of study
Finally, in the Figure 6.33 the actuator is taken to validation experiments using a pneumatic system to get the desired pressurization in the inside channels, producing the expected deformation of them, as predicted in the simulation. The FEA simulation with the material properties announced a maximum displacement for each pincer of 7.6 mm and the final tested result gave a maximum displacement of 9 mm, considering that the divergence can be due to measurement error and or the different final properties of the manufactured part, corresponding to those tabulated by the authorized distributor. Nevertheless, the results are optimistic and suggest the proper use of commercial material to obtain for such sort of applications.
Figure 6.33. Validation of working principle by means of additively manufactured prototypes, using pneumatic system with a regulation valve to limit the maximum ΔP to 500 kPa. Initial state of the actuator (left) and pressurized actuator
(right).
Design, modeling and manufacture of innovative solid oxide fuel cells
The hybrid and electrical vehicles have become an attractive alternative to the internal-combustion engines in urban areas. However, due to its low autonomy and loading times of the batteries, it was necessary to invest in new solutions to complement them, like the use of fuel cells. These, in contrast to the batteries can provide of energy by themselves resulting the residue of the converting reactions in water, being refuel similar to the traditional fuels.
The fuel cells are electrochemical devices that convert the energy produced during chemical reaction of Hydrogen and oxygen to electric power , being the residues water and heat (Appleby
& Foulkes, 1988).
The main assets of these devices are the direct conversion of electrochemical energy in a continuous current, the speed and ease of refuel the lack of movable elements and the high efficiency of them, which are higher than internal-combustion engines. A unit-cell of a fuel cell is typically formed by the following components: the electrolyte, the electrodes (cathode and anode), the flow channels and the interconnector material.
L %1
2N → LN % �0@�PQ
(6.1)

Chapter 6 Industrial applications of complex structures
227
In function of the material selected for the electrolyte, the working temperature and fuel used for the case, the type of fuel cells are different. When the operating temperature is higher than 600 °C and up to 1000 °C, it is necessary to use electrolytes that can resist the operation conditions, not only temperature but also corrosion. Moreover, working at such level of temperature, it increases the efficiency of the chemical conversion (Janardhanan, Heuveline, & Deutschmann, 2007).
In this case, the material for oxygen ion conduction in the cells must be a ceramic. This short of fuel cells is classified within the group of the Solid Oxide Fuel Cells (SOFC).
As a summary, the functioning of a SOFC is based on the transport of oxygen ions from the cathode to the anode (Figure 6.34).
Figure 6.34. Scheme of working principles for a SOFC (Muruzabal M. & de Blas A., 2017).
The materials used for each part are:
Table 6.1. Materials commonly used for each component of a SOFC unit cell
Component Material
Electrolyte YSZ ((R�N)S.T(UNV)S.SW)
Cathode LSM (XYR�NZ)
Anode YSZ + NiO
Interconnector Cermets
Typically, these devices are form by stacks of unit cells, which are at the same time formed by overlapped components (electrolyte, electrodes, interconnector and sealing material). Depending on the geometry, they are classified in two types: planar or tubular. In the Figure 6.62, it can be observed the scheme of the stack for the case of a planar style and the size of 5 kW unit comparing with a pen.
Main efforts regarding the improvement of SOFC efficiency are related to the use of novel materials for the components, micro-porosity of electrolytes and the sealing systems but not that much linked to the optimization of the geometry in the design. On the search for such sort of improvements, it was found that the attempts on that direction are related to the study of flow channels(Kapadia, Anderson, & Burdyshaw, 2011) and their customization to improve the transport of species inside, maximizing the percentage of reacted fuel and oxygen and facilitating

228
the flow out of the. The flow channels distribute the concentrated species to react, promoting the contact with their respective electrodes. The fuel and water goes through the channel in contact with the anode and oxygen plus nitrogen through the channel in contact with the cathode. It is demonstrated that channels distribution, cross section, dimension and shapes and length have direct influence on the cell performances residues (Mushtaq et al., 2015; Wang, Duan, Yan, & Peng, 2008).
Figure 6.35. Structure scheme of planar SOFC-conversion module stack (left) (Wen et al., 2002) and picture of a 5 kW SOFC stack (right) [source: Research Centre Jülich]
For all that, the team considered this as a potential application to research. The conventional design has been maintained since the beginning of the technology and it has not evolved during these years, although there is a huge potential with a width range of improvement by optimizing the geometry. Furthermore, the integration in design of the units could lead to reduce manufacturing steps, converting the serial production of these cells profitable.
Although current technologies in additive manufacturing are not that advance to obtain multi-material products, as it would be for this case, the combination of ceramics, metals and alloys to get in one manufacturing step a monolithic cell, avoiding the stacks. However, current LCM technology allow to manufacture in YSZ material. Thus, a first approach can be settle for future lines of investigation and validate concepts of design in advanced prototypes.
The objective in this study was to propose a novel design of a SOFC conversion module with a high level of integration of the components for its subsequent fabrication by additive manufacturing techniques, in particular oriented to vat-photopolymerization LCM systems. Moreover, taking advantage of the freedom in design of manufacturing additively, it is pretended to incorporate optimizations of the design, although they make more complex the final geometry, in order to enhance the power density and the efficiency comparing with a reference model. The study sets out the plan schematized in Figure 6.36 to build a solution that upgrades the reference model. Starting with the search on literature for information on channels distribution and geometries, it is looked for a design based on computational modelling. Studying the possible modifications to add in a reference model of planar SOFC; by means of computational fluid dynamics (CFD);

Chapter 6 Industrial applications of complex structures
229
transport of concentrated species (tcs); free and porous media flow (fp) and secondary current distribution (siec); to afterwards apply them to the design. After several iterations is then found out a model of unit cell and then exported to a whole conversion system (unit cells in parallel) to obtain a final model, which is properly modelled again in order to check the theoretical operating performance. Finally, the monolithic design is then verified for its additive manufacture.
Figure 6.36. Scheme of the workflow followed during the consecution of the study to obtain a final design.
Computational modeling
The analytical model is based on ‘a current density distribution model for a SOFC’ from COMSOL®, batteries and fuel cells module (Application ID: 514). Then a three-dimensional model is developed and implemented in the commercial software (Multiphysics 5.3). The governing equations for the following physics are solved simultaneously and coupled to kinetics:
� Mass transfer in the flow channels
� Fuel and oxygen flow in a porous media
� Ionic current balance
� Electrical current balances
SEARCH ON LITERATURE
UNIT CELL DESIGN AND
SIMULATION
IMPROVEMENT?
NEW REFERENCE MODEL FOR
THE CONVERSION MODULE
CONVERSION MODULE DESIGN
BETTER
PERFORMANCE?
NO
NO
YE
S
YE
ACHIEVABLE BY AM?
ADAPT DESIGN TO AM
NO
YE
FINAL DESIGN
MANUFACTURING

230
The reference model (Figure 6.37) is a standard geometry for a planar unit cell (Khazaee & Rava, 2017) with dimensions 6 x 6.3 x 40 mm3 and aspect ratio of the flow channels 1:1. The model of the unit cell includes the anode/cathode gas channels, gas diffusion electrodes and the electrolyte. The geometry and material parameters are based on the work by Khazaee et al. (Khazaee & Rava, 2017) and it supposed a hypothetical case of the inlet cathode being fueled by pure H2, instead of a hydrocarbon, with the input data of oxygen speed and H2 pressure drop (ΔPH2).
Figure 6.37. Reference model of SOFC-planar unit cell.
The results which are interesting to evaluate the grade of progress achieved in consecutive alternatives will be collected as:
� Output power.
� Oxygen/Hydrogen mole fraction (Figure 6.38).
� Current distribution.
� Total efficiency.
Regarding the modifications, object of the study, incorporated to the reference model that will provide information about geometrical influence of the channels on cell performance, the were classified by:
� Channels aspect ratio.
� Channels distribution.
� Channels curvature.
� Channel cross section (dimension and shape).
� Integration of channels into the electrodes.
The mentioned modifications make sense, after a complete understanding of the theoretical behavior and deeper knowledge of the working principles of SOFCs and its review on literature.

Chapter 6 Industrial applications of complex structures
231
Figure 6.38. Case of variation of hydrogen and oxygen mole fraction along the flow channels for the reference unit cell of SOFC.
An overview of the modifications studied for the research, which have direct influence on the active area and flow distribution, are explained in the following figures (all the measurements are in millimeters):
Figure 6.39. Modification of aspect ratio for the cross section of both channels (left) and dimension (right).
Figure 6.40. Rippling effect applied on active surface of the flow channels in the three main directions.
Cathode
Anode
L
N

232
Figure 6.41. Inclusion of flow channels inside the electrodes maximizing the active area in contact with the gas (right) and avoiding the interconnector material, in comparison to the reference model (left).
Figure 6.42. Schematic of different cross section shape.
Figure 6.43. Conventional stack of unit cells, which are physically separated and sealed (left). Introduction of an extra electrolyte in between two consecutives unit cells to leverage the flow distribution (left).
The simulations carried out, are dependent of the operation voltage which range is set up within (0.3-0.8), selecting then the results to display for a maximum output power 0.5 V. Below, the results of the current distribution at the operation voltage 0.5 V (maximum power), for the middle cross section, are displayed. The color-bar scale stablishes a range of (0-40,000) A/m2. These results helped to the team to go through the development of the geometries, according to the suitable corrections.

Chapter 6 Industrial applications of complex structures
233
Figure 6.44. Results of current distributions at operation voltage 0.5 V on the electrodes after the CFD-based simulations for: a) Channels included into the electrodes; b) different cross section shape; c) parallel disposition of the
channels; d) rippling shape; e) intermediate unit-shared cell.
The final study shed light on the combination of alternatives to maximize the effects of geometry on cell performance. In that direction, the modifications selected where implemented to a final model of 40 x 40 x 40 mm3:
� Inner channels to the electrode.
� Parallel disposition of channels.
� Channel cross section shape in ‘I’ style.
� Aspect ratio and channel distance ratio 1:1.
� Extra electrolyte in between consecutives unit cells.
� Rippling in X and Y directions.
a)
c)
d)
e)
b)

234
The resulting design depicted in Figure 6.45 shows the proposed conversion module for the SOFC. It includes all the variations studied with upgraded performance above mentioned. In this case, each row is formed by four unit-cells connected in parallel, sharing a same electrolyte, but separated by interconnector material
Figure 6.45. Optimized design of conversion modulo for a planar SOFC.
The following table exhibit the performance of the final model, comparing these results with the obtained by modeling the reference one for the operating voltage of 0.5 V.
Table 6.2. Final values for the control parameters of the reference and optimized models
Where the total efficiency is the product of the electric, mass and thermal efficiency, calculated according to equations (6.2),(6.3) and (6.4), being the thermal efficiency a constant parameter for such fuel cells of 80,3%.
Output power
(W) Current
(A) Electric efficiency
(%) Mass
efficiency (%) Total efficiency
(%)
Reference model
15.91 31.8 92,23 45.64 33.80
Optimized 42.08 84.17 99.55 90.28 74.18
[�\��� � []^ � · [ � _���_ · [�` ���� (6.2)
[ � _���_ �,a_
� (6.3)

Chapter 6 Industrial applications of complex structures
235
Thus, the design which incorporates all the modifications evaluated, improves the output power and the efficiency of the process, increasing a 40 % the efficiency of the initial model. The power density obtained for the module by the simulations is 0.654 kW/L. The more significant differences, in comparison to the reference model, come from the current distribution, improving considerably the ionic transfer at the electrodes; moreover, the enhanced flow distribution at the anode and cathode channels allows a better fuel and oxygen transport and chemical reaction.
Thus, this effect is depicted in Figure 6.46, where it is clear that the hydrogen mole fraction gradually decreases with increasing the length because of the hydrogen gas consumption. It is this outcome which totally add value and distinguish the optimized version to currently commercial geometries and the available published data, which lower hydrogen mole fractions are in the range of (0.5-0.6).
Figure 6.46. Hydrogen mole fraction along the anode channel for the reference model in blue and the optimized one (green).
After considering the optimal modifications which would theoretically enhance the performance of a conventional design for a planar concept of SOFC and obtaining a three-dimensional model of the conversion module, a first concept of product is then generated. Starting for the geometry exposed in the Figure 6.45, it is look for an optimal integration to the rest of the components necessary for operating the system such as, the output electrical connections, the manifolds and exhaust or evacuation channels (Figure 6.47).
[]^ � �bcd
�
bcd,fgfhi
�j/0&
bcd�\���
(6.4)
Reference model
Optimized model

236
Figure 6.47. Scheme of the proposed design for the SOFC.
The first approach was oriented to adequate the design for future coupling to the rest of components which compound the complete system. These parts could be manufactured as well via additive manufacturing, allowing the customization of them for the required cases, in terms of flow volume for fuel and oxygen. In that way, the conversion module was adapted for further usage. Main objectives are oriented to add stiffness to the basic design of Figure 6.45, thus thickening the external walls and connecting the cantilever edges of the ‘interconnector’ material at the sides of the module. For the connection to the intake systems and exhaust, it is considered to use the same method that is currently practiced for the SOFC, a threaded rod along the length of the unit. The dimension selected for that, it is a M3 threaded rod. For the future, thinking in its manufacturing, it is left a radial gap 0.3 mm in such a way that the fitting rod-hole is movable (Figure 6.48).
To evaluate the feasibility of its potential manufacturing by means of LCM systems, which present a bottom-up procedure, the final design of the adapted conversion module was SL-printed by using the Form1+ system and the material FLGPCL02. Thanks to this prototype the team would be able to inspect the difficulties during the process and to visualize the geometrical limitations linked to the methodology itself.
Figure 6.48. Plan of the adapted design.
Output connectivity
Intake and exhaust manifolds
CONVERSION MODULE

Chapter 6 Industrial applications of complex structures
237
Previously mentioned, the structures are aimed to be printed without the need of any other supporting structure that could distort the geometry and its internal surfaces. Since the required precision for replicating the curvature of the applied rippled channels is high, we opt to orient the part with the channels length along the z axis. In that way, the curvatures are outlined by the laser trajectories and the ‘stairs’ effect is the avoided, as it can be seen in Figure 6.49.
Figure 6.49. Part placing on the building platform and detail of middle-cross section.
As well, in Figure 6.49 is perceptible how the dimension for the electrolyte and electrodes that separate the flow channels is adjusted to the contour lines of the laser, which means the thickness is formed by only two hatches of the laser, in total 300 µm plus the over-polymerization occurred. Indeed, such effect is afterwards confirmed, resulting in some minor defects in the thin walls. Printing time was 2 hours and 50 minutes; the volume of material required for the job 52.19 mL. The same washing process followed during the thesis for such acrylate-based materials was carried out (Chapter 3, section 4). The non-polymerized-material stuck in the inner channel is then removed by consecutives steps of injecting isopropyl alcohol with the help of a Ø3 mm syringe and air compressed (Figure 6.50).
The final prototype is then photographed and the threaded rods are checked to correctly fit in the designed holes, with a successful fitment of them. Furthermore, in order to evaluate the geometrical distortion during the process, the part was carefully measured by its two faces, the layer attached to the building platform (1) and the latest (400), not constrained at the surface and compared them to the original dimension in the design.
In spite of the separation forces due to the size of the cross section for each polymerized layer, the results are promising, since the thin layer that represent the electrolyte present integral functionality Figure 6.50
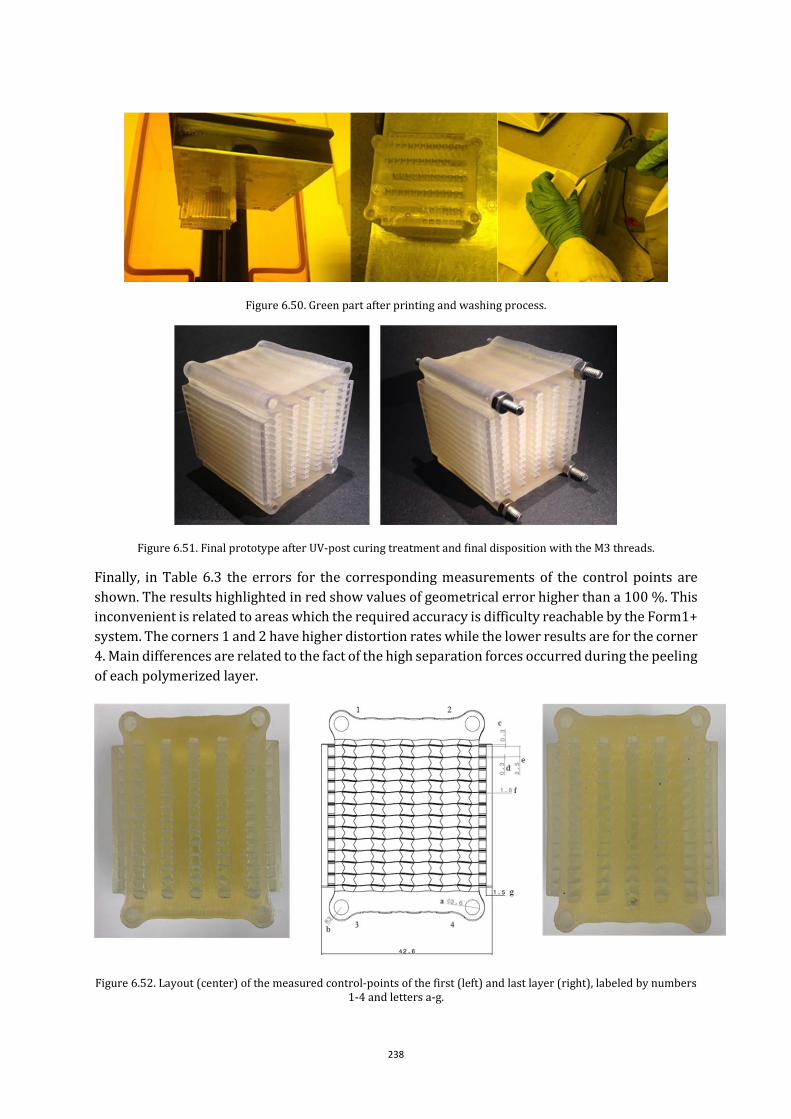
238
Figure 6.50. Green part after printing and washing process.
Figure 6.51. Final prototype after UV-post curing treatment and final disposition with the M3 threads.
Finally, in Table 6.3 the errors for the corresponding measurements of the control points are shown. The results highlighted in red show values of geometrical error higher than a 100 %. This inconvenient is related to areas which the required accuracy is difficulty reachable by the Form1+ system. The corners 1 and 2 have higher distortion rates while the lower results are for the corner 4. Main differences are related to the fact of the high separation forces occurred during the peeling of each polymerized layer.
Figure 6.52. Layout (center) of the measured control-points of the first (left) and last layer (right), labeled by numbers 1-4 and letters a-g.

Chapter 6 Industrial applications of complex structures
239
Conclusions to the case of study
To summarize, the research is based on the understanding of the operating procedures. For that, we achieve a deep search on the literature about SOFC functioning. Moreover, a plan for the procedure of design of an optimized version for planar SOFC was carried out. Then, we outline a scheme to achieve, in a systematic way, a coherent study for improving the design of SOFCs by means of geometrical modifications that can enhance the performance in terms of power density and efficiency.
A model for a SOFC is successfully obtained, by means of CFD simulation and coupling of physics that model the ionic and mass transfer for the electrochemical reactions. Then, the optimizations were applied to different models, once each time, achieving a database of success modifications to apply in the geometry of those. The obtained numerical results are in agreement with the available data.
Afterwards, the combination of the validated parameters is studied, applying them to a single model of a conversion unit for a SOFC. The obtained theoretical results show that a high performance was observed by modifying the channels geometry and by using ‘I’ shape for the channels cross section for both anode and cathode. Moreover, the integration of channels into the electrodes and the parallel disposition of unit cells resulted favorable, perceiving a hydrogen mole fraction reduction that boost the performance of the geometry. Finally, the geometry was then prototyped by means of SL-systems in acrylate-based material, in order to check as a first approach the feasibility of the additive manufacturing of such sort of fuel cells.
Table 6.3. Control of geometrical distortion for different points of the first and last layer of the prototype.
Design Layer 1 (mm)
Layer 400
(mm)
Err.1 [%]
Err.2 [%]
Design (mm)
Layer 1 (mm)
Layer 400
(mm)
Err.1 [%]
Err.2 [%]
1.a 3.6 3.28 2.98 8.89 -17.22 2.a 3.6 3.28 2.92 -8.89 -18.89
1.b 3 2.91 3.35 -3.00 11.67 2.b 3 2.92 3.35 -2.67 11.67
1.c 0.3 0.57 0.59 90.00 96.67 2.c 0.3 0.61 1.06 103.33 253.33
1.d 0.3 0.47 0.88 56.67 193.33 2.d 0.3 0.5 1.09 66.67 263.33
1.e 2.5 2.27 2.4 -9.20 -4.00 2.e 2.5 2.27 1.86 -9.20 -25.60
1.f 1.8 1.8 1.43 0.00 -20.56 2.f 1.8 1.66 1.27 -7.78 -29.44
1.g 1.5 1.56 1.93 4.00 28.67 2.g 1.5 1.66 1.76 10.67 17.33
Design Layer 1 (mm)
Layer 400
(mm)
Err.1 [%]
Err.2 [%]
Design Layer 1 (mm)
Layer 400
(mm)
Err.1 [%]
Err.2 [%]
3.a 3.6 3.31 3.64 -8.06 1.11 4.a 3.6 3.3 3.54 -8.33 -1.67
3.b 3 2.97 2.9 -1.00 -3.33 4.b 3 3.05 3.09 1.67 3.00
3.c 0.3 0.88 0.4 193.33 33.33 4.c 0.3 0.78 0.3 160.00 0
3.d 0.3 0.74 0.65 146.67 116.67 4.d 0.3 0.71 0.37 136.67 23.33
3.e 2.5 2.2 2.63 -12.00 5.20 4.e 2.5 2.25 2.66 -10.00 6.40
3.f 1.8 1.57 2.07 -12.78 15.00 4.f 1.8 1.61 1.98 -10.56 10
3.g 1.5 1.8 1.43 20.00 -4.67 4.g 1.5 1.69 1.46 12.67 -2.67

240
Design, modeling and manufacture of 3D-labs-on a chip
The following results have been published in open-access in the International Journal of Advance Manufacturing Technology and here are only presented those related to the design modification for the additive manufacturing of the device. An extended information can be obtained directly on the paper (Andres Diaz Lantada, De Blas Romero, et al., 2017).
Recent advances, challenges and needs, in the fields of tissue engineering and biofabrication, have promoted a growing demand of biomedical microdevices for culturing different cell types, learning from their mutual interactions and applying such knowledge to the development of more efficient and realistic biomimetic platforms for drug testing and disease modeling (Furth & Atala, 2014). The continued development and improvement of micro- and nano-manufacturing technologies is enabling the manufacture of such biomimetic microdevices, micro electromechanical systems (MEMS) and biological MEMS (or bio-MEMS), using adequate materials and geometries for high throughput, for answering the aforementioned challenges. State-of-the-art cell co-culture devices and platforms include: modified Petri dishes with some areas prepared for locating a cell-loaded gel amidst a fluid bath; “Flocell®” devices with micro-perforated tubes placed in a bottle loaded with saline solution; and, more frequently, “Transwell®” devices, consisting of a glass with a membrane bottom placed inside a larger glass filled again with saline solution. In a conventional “Transwell®” device one type of cells is typically cultured upon the bottom of the larger glass and another type of cells is grown upon the membrane of the smaller glass. Cells interact through the pores of the membrane, as also happens in flocell devices through the pores of the micro-perforated tubes. Flocell devices allow for dynamic culture, as a fluid can be moved through the microtubes, but are much more complex and expensive to obtain than transwell devices. On the other hand, transwell devices are simpler but the promotion of biomimetic dynamic cell culture conditions is still an unsolved issue. Regarding modified Petri dishes, obtaining 3D cell culture conditions is still a challenge difficult to overcome using planar geometries (Díaz Lantada, 2016).
In addition, the already mentioned devices are in many cases excessively ‘’clumsy’’, made of several parts manufactured separately, too large for the phenomena being studied and inadequate from the perspective of eco-efficient product development, making them more “chips-on-a-lab” than “labs-on-a-chip”. Their sizes promote the use of high quantities of cells and reagents, many of which are extremely difficult and expensive to obtain, hence limiting the implementation of systematic studies that require culturing cells in a wide set of different conditions. In the present study, an alternative approach is suggested towards eco-efficient and biomimetic 3D cell co-culture, based on the development of a novel and versatile design of a micro-transwell device, which is obtained as a monolithic multi-scale device, following recent trends (Preechaburana & Filippini, 2011) in a ceramic material adequate for cell culture trials.
Monolithic microsystems are of interest, especially for handling fluids, as leakage is prevented thanks to the promotion of device integration, to the reduction of components and to the consequent elimination of joints between parts. As perceived from the aforementioned references, there is a growing concern towards more integrated design and manufacturing procedures linked to these engineering systems.

Chapter 6 Industrial applications of complex structures
241
Additive manufacturing, working on a layer-by-layer approach and promoting “freedom of design”, thanks to the complex geometries typically attainable using these additive strategies, seems to be an interesting option towards three-dimensional complex microfluidic systems, labs-on-chips and organs-on-chips with a reduced number of components and manufacturing steps, as well as for the development of new concepts based on more sophisticated geometries, which may turn out to promote efficiency, compactness and integration of functionalities.
Design process
Figure 6.53 shows the final CAD design of a versatile biomedical microsystem, lab-on-chip device or organ-on-chip platform, aimed at enhanced cell co-culture strategies, object of present study. The inlets may allow for the incorporation of different cell types and growth or trophic factors (for instance endothelial cells, pericytes and vascular endothelial growth factor “VEGF”), which would be physically separated from other cells cultured upon the cantilever membrane (for instance adipose tissue cells, neurons, among other possibilities). Such a design may enable the in vitro development of several types of tissue models or physiological interactions using just a single and versatile multi-well, multi-channel and multi-layer microfluidic platform. The channels and lower chamber may help researchers to develop the vasculature, which may in turn potentially interact with specific cells from different tissues placed upon the cantilever membrane. The use of Boolean and pattern CAD operations may be used to develop, as a single macro-device, several of the proposed micro-platforms or micro-transwell devices, so as to help with experimental design and with the evaluation of potential factors of influence on cellular behavior and fate. The inlets and outlets may help researchers to culture under dynamic conditions.
Figure 6.53. Schematic CAD design of a biomedical microsystem for cell co-culture. The sectioned view (left) help to show the inner features of the microsystem object of present study.
Previously to the trials with ceramics, it was studied the feasibility to obtain a monolithic structure with the cantilever membrane in a surface constrained process. For that, the first original design Figure 6.54 with a thicker membrane (1 x 1 mm2 pore and 350 µm truss-thickness) and non-reinforced structures for the cantilevers was tested on Form 1+, using the elastic material FLGP01. Thus, subsequent modifications of this design could lead to obtain a final product additively manufactured by photopolymerization techniques.
15 mm
Inlets
Membrane
Channels

242
As it can be observed in the Figure 6.54, the first concept did not even include a crossbar that unify the cantilevers and strong the structures hanging on the building platform. However, even though the cantilever measured is 1.2 mm for a truss of 0.3 mm, the part resisted and the final part was successfully printed. Fact that gave green light to the team to move forward to its manufacturing in a biocompatible material.
Figure 6.54. Picture of the initial concept of the design (right) and micrograph of the cantilever membrane in the section near the channels.
Main critical dimensions, designed according the manufacturing precision of LCM (CeraFab 7500)
include 2mm-wide channels and 8 x 8 mm2 cantilever membrane with 350 x 350 µm2 pores. In
order to promote the stability of the cantilever, a thickness of 200µm (corresponding to eight manufacturing layers) is applied to the central cantilever membrane.
After several trials, it was sightseen that to adequately run the job to 3D print the part would be necessary the inclusion of several supports to the design. However, these structures should check both requirements of supporting the membrane and minimize the impact of them to the final application in terms of efficiency during manufacturing and subsequent performance with the cells. Evaluating such compromise, it was studied the behavior of the critical layer during its polymerization attending to the modeling explained in Chapter 4, section 4. In that way, the team skipped to manufacture different prototypes, each one including a strategy for the layout of the supports and the thickness of them to directly select the satisfactory solution, avoiding the convexity during the whole manufacture (3D printing, cleaning and sintering). In Figure 6.55, the different alternatives considered for supporting the membrane are schematized.
1 mm

Chapter 6 Industrial applications of complex structures
243
Figure 6.55. Schematic representation designs incorporating different networks of supports under the cantilever
membrane for promoting manufacture viability. Yellow points mark the position of supports in different zones of the membrane. The real supports have a 200 µm diameter and are not appreciated from above the membrane, so in this
representation we scaled them.
According to the detailed dimensions and to previous successful experiences, it is understood this is the most adequate micro-manufacturing technology for the development of the proposed biomedical microsystem in an additive way and using ceramic materials. The materials used in the process have also proved excellent for in vitro trials with cells. The inlets connecting with the lower chamber would allow for the incorporation of different cell types and growth factors (for instance endothelial cells, pericytes and VEGF), which would be physically separated from other cells cultured the cantilever membrane and introduced through the inlets connecting with the upper chamber (for instance adipose tissue cells, neurons), or viceversa.
The proposed geometry is quite a versatile one for several lab-on-chip and organ-on-chip biomedical applications. For instance, the separation of a lower and an upper chamber by a cantilever porous membrane, which is inspired on the typical structure of transwell assays, may promote cell co-culture applications aimed at reproducing the physiological interactions of different cell types within human organs in a biomimetic way. The circular inlets and outlets may also be used for obtaining dynamic cell culture conditions by connecting to adequate tubing and pumping networks, which can be of interest for promoting cell differentiation into different relevant tissues and for enhancing vascularization within in vitro models (Hasan et al., 2014).
Figure 6.56. Selected strategy for the layout of the supports. The who consecutive cross sections of supports and first
cantilever layer.

244
Results and discussion
The manufacture of the three-dimensional microsystems shown in Figure 6.57, taken after sintering, sheds light about the feasibility of obtaining these complex geometries and biomedical microdevices in ceramic materials using the lithography-based manufacture technology. Some preliminary prototyping examples at scales 1:1 and 2:1 are included in Figure 6.57a, obtained after the initial design from Figure 6.53. These images show deflection (left) and collapse (right) of the cantilever membrane and highlight the importance of performing a re-design. The larger thickness of the membrane at scale 2:1 (Figure 6.57a, left image) prevents collapse, when compared to the thinner membrane at scale 1:1 (Figure 6.57a, right image). Figure 6.57b shows the improved results, associated to the redesign presented schematically as the third solution of Figure 6.55, towards the final 100% functional monolithic ceramic microsystem. Indeed, the use of ad hoc supports (Figure 6.56) is a correct solution for achieving the desired geometry without compromising the expected performance of the microsystem. Generating the supports with conventional 3D printing slicing software would suppose filling the lower chamber with a dense network of columns, which would prevent the cells from freely colonizing the chamber, entering to it through the lower channels. The proposed solution, as further appreciated from the cell trials, mimics the performance of transwell assays, but is obtained as a single monolithic device in a straightforward process. The final model stands out for its similarity to the computer-aided design, for its symmetry, for the prevention of deflection in the re-designed cantilever micro-porous membrane and for the absence of inhomogeneous shrinking or structure collapse. After sintering, some contraction is appreciated, but no cracks appear, hence helping us to validate the whole process for the development of three-dimensional biomedical microdevices, labs- & organs-on-chips using ceramic materials. The dimensional variations can be taken into account from the design stage. The original size of the green part, obtained directly from the 3D printing machine, has a length of 35mm, while the debinded and sintered part is 29.5mm-long. Volumetric contraction is homogeneous in the three Cartesian axes. These results account for a global volume variation of 19%, which is in accordance with the theoretical results for obtaining a relative density of around 99%.
To the team’s knowledge, the presented microsystem, obtained by lithography-based ceramic manufacture, provides the best compromise between part size, degree of detail and compactness in the field of additive manufactured ceramic labs- & organs-on-chips currently available. It is also important to highlight that the obtained geometry, although being quite versatile for cell culture applications, is just a conceptual example of the potential of the proposed design and manufacturing approach. More complex geometries, intricate networks of channels, additional layers and cantilever membranes, among other features and details, can be obtained following similar computer-aided design procedures, incorporating ad hoc support structures, leaving enough space for resin or slurry evacuation and applying lithography-based ceramic manufacture, either to ceramic and bioceramic slurries and to polymers and biopolymers, which constitutes and additional very unique feature of the technology used in this study.
Additional studies will be carried out using improved confocal microscopy facilities and performing osteochondral differentiation, which may let the team provide more details about the three-dimensional configuration of the cells within the whole microsystem and it potential for modeling complex physiological interactions, but we understand that the provided validation

Chapter 6 Industrial applications of complex structures
245
shows promising results. In short, our results show that the cells and the monolithic ceramic microsystems are excellent companions for potential organ-on-chip developments. The hMCSs-seeded microsystem and its channel configuration and lower and upper chambers separated by the micro-porous cantilever membrane, may result very adequate in order to allow the permeation of nutrients and debris, to promote oxygenation, to enable adaptation and to provide cellular communication systems, capable of locally inhibiting the immune system and of activating tissue repair, following the surrounding fluid dynamics, although additional assessments, both in vitro and in vivo, need to be performed.
Figure 6.57. a) Preliminary prototyping examples at scales 1:1 and 2:1 showing deflection (left) and collapse (right) of the cantilever membrane as designed initially; b) Improved results: Final monolithic ceramic microsystem after
adequate redesign.
Regarding cell culture trials, results from hMSCs interacting within the monolithic ceramic microsystem are shown in the images of Figure 6.58. Figure 6a shows an overall view of the microsystem and marks the zones magnified in Figure 6.58b-e. Figure 6.58b shows cells adhered to the inlet well. Figure 6.58c and d focus more on the perpendicular channels of the microsystem, showing cells on the upper and lower levels of the microsystem. Figure 6.58e focuses on a pore of the cantilever membrane, showing cells reaching such pore and interacting through it. The nuclei are stained in blue (DAPI) and their rounded forms without blebs indicate that the cells are in healthy conditions and well adhered to the porous scaffold. It is important to note that more than 20 cells/mm2 can be appreciated. The images also help to show the good energetic behavior of the cells, both in the upper and lower levels of the microsystem, as more than 80 expanded active cells can be appreciated in images Figure 6.58b-d.

246
Figure 6.58. Results from hMSCs interacting within the monolithic ceramic microsystem. a) Overall description of the microsystem and magnified zones. b) Cells within the inlet well. c), d) Cells growing and crawling along the upper and lower channels. e) Cells reaching a pore of the cantilever membrane. Fluorescent dyes: DAPI (blue for the nuclei), α-
Tubulin- Ph488 (green for the cytoskeleton). 7
7 Images courtesy of Prf. Dr. Josefa Predestinación García Ruíz from Universidad Autónoma de Madrid
Chapter 6 Industrial applications of complex structures
247
Conclusions of the case of study
This section presents a very promising approach for the design and development of three-dimensional monolithic ceramic biomedical microsystems with complex geometries and with potential applications in fields linked to labs-on-chips and organs-on-chips. The microsystem object of study stands out for its having a complex three-dimensional geometry, for being obtained as a single integrated element, hence reducing components, preventing leakage and avoiding post-processes, and for having a cantilever porous ceramic membrane aimed at separating cell culture chambers at different levels, which imitates the typical configuration of transwell assays.
The design has been performed taking account of the special features of the manufacturing technology and includes ad hoc incorporated supporting elements, which do not affect overall performance, for avoiding collapse of the cantilever ceramic membrane during debinding and sintering. The manufacture of the complex three-dimensional microsystem has been accomplished by means of lithography-based ceramic manufacture, the additive manufacturing technology which currently provides the most appealing compromises between overall part size (up to several centimeters) and precision (down to details of around 50 microns) when working with ceramic materials. The microsystem obtained provides one of the most remarkable examples of monolithic bio-MEMS and, to our knowledge, a step forward in the field of ceramic MEMS with complex geometries for lab-on-chip and organ-on-chip applications. Cell culture results help to highlight the potential of the proposed approach and the adequacy of using ceramic materials for biological applications and for interacting at a cellular level, if the manufacturing process provides enough precision, as is our case thanks to the use of lithography-based ceramic manufacture.
The hMCSs-seeded monolithic ceramic microsystem may offer interesting possibilities to study cellular mechanisms present in different types of tissues, specially the interactions between bone and cartilage, although they may well be useful for studying other types of tissues, including adipose, endothelial and neuronal cell types and interactions thereof, in devices with additional levels or with a higher degree of geometrical complexity aimed at promoting biomimicry. The use of other ceramic materials for the monolithic microsystem, such as zirconia, tricalcium phosphate and hydroxyapatite, which can be also processed using lithography-based ceramic manufacture, may be another interesting line for continuation, but the first trials using alumina have provided remarkable insights.
We aim to continue our research searching for new appliances based on these geometries, design procedures and additive ceramic manufacturing technologies. Our computer-aided designs are placed at the disposal of colleagues who would like to further explore with us the potentials of these monolithic biomedical microsystems. The described lithography-based ceramic manufacturing process can be used for many other fields, which may benefit from the use of microdevices with complex geometries, including energy engineering, transport applications and aerospace solutions, in which the use of ceramics is of interest due to the high environmental temperatures involved.

248
Design, modeling and manufacture of microstructures for desired mechanical responses
One of the most interesting advantages of additive manufacturing resides in the fact that it is possible to combine the use of a specific material but tailoring the mechanical properties, achieving certain functionalities, by controlling the microstructure of the part from the design stage.
The already mentioned (see chapter 4, section 1.3) lattice structures help the designer to play around with the final part mechanical properties, by patterning unit cells, which performances has been previously studied, in a desired geometry. In this direction, it has been already published studies about the mechanical performance of different unit cells. In some cases, these approaches are based on voxel decomposition for further topological optimization (Schumacher et al., 2015).
In the other hand, as the explained in chapter 4, section 1.3, the patterned microstructures can also be recreated by the use of graph elements. With this approach, the form of the elemental structure has all the freedom that designer desires to employ, as can be seen in Figure 6.59 (left). However, the assets for this work resides in the obtaining of ‘extremal’ effective properties for a given material and for that purpose in necessary to search for structures already reported on literature with such performance or initiate a self-study evaluating different alternatives which can provided to the design of isotropic or anisotropic behavior, targeting to prescribed scenarios (Panetta et al., 2015).
Figure 6.59. Examples of geometries generated by graph elements and illustration of distribution for Young’s modulus in according to the porosity of the element.
This section tries to provide of productive employment for such approaches to functional applications that can solve current dilemmas into the industry. In this case, an ongoing case, as is the search for elastic structures that can act as energy absorbers but at the same time be able to operate in harsh working conditions (Loginkin, Schlier, Harris, Travitzky, & Greil, 2016). Typically, this problem has been resolve by using representative coil springs, although not many references on coil or helical springs are available in literature and the investigation on the mechanical performance is still of a matter of concern for many companies (Hamilton, Gopal, Atchley, & Smith, 2003).

Chapter 6 Industrial applications of complex structures
249
Major manufacturing directions of ceramic springs involve shaping the green body followed by sintering or hipping. The mechanical assessment showed that ceramic springs are quite sensitive to microstructural defects (Barbieri, Perottoni, & Zorzi, 2012). In this work, the LCM technique (see Chapter 3) is used for that purpose, taking advantage of the high precision of the additive manufacturing technology to reduce these microdefects. So that a solution to the dilemma for energy absorber structures in ceramics is presented next.
The following case present a case of study of a spring-like structure for an automotive application developed together with Syalons International® (Newcastle, United Kingdom). Although the current research and literature is focus on Alumina (Al2O3) springs or polymer-derived ceramics based on polymethylsilsequioxane (PMS) loaded with FeSiCr as reactive filler feedstocks (Loginking et al.), it is suggested a groundbreaking alternative based on Silicon Nitride (SiAlON) ceramic which will provide of higher strength with low thermal expansion and good oxidation resistance up to above ~ 1000 °1 (Ekström & Nygren, 1992).
Thanks to development of a new photopolymeric-based SiAlON material developed within the framework of WP3 of ToMax project, in collaboration with Lithoz® GmbH and Syalons® for the Cerafab7500 DLP-systems, it is possible now to obtain an advance silicon nitride part additively manufactured with a precision, level of detail and resolution not comparable up to day, as far as the knowledge of the team.
However, due to the geometrical requirements provided by the customer from the automotive sector, the respective design of the solution cannot be summarized as a simple model of a conventional design of a spring (e.g. coils or helical structures). The customer already provided illustrative information regarding previous trials with conventional coil designs, not obtaining promising results, but used as a basis to start the design and a subject to compare. Thus, combining the benefits of the freeform manufacturing the team started a research to figure out a possible design which would fit the restrictions imposed.
Linking the possibilities offered by lithography-based manufacturing in the design, the team suggested the incorporation of the microstructures with a validated elastic performance aforementioned. The design space is a cylinder and customer’s requirements are defined by: the diameter ∅m of the cylinder, Xm the limiting length, &n� the pre-load that must stand, om the targeted compression.
∅p < ∅m (6.5)
Xp ≤ Xm (6.6)
Where ∅p and Xp are the dimensions of the hypothetical solution for design that fulfill the requirements. The design must stand a pre-load &n� and satisfy that under compressive stress, the displacement in direction z was om .For the part, the maximum Von Mises stress sm cannot reach the tensile strength -(t�p�uv for the material at room temperature for the first stage. Therefore:
sm ∙ w ≤ -(t�p�uv (6.7)
Being the parameter w the confidence factor for the design.
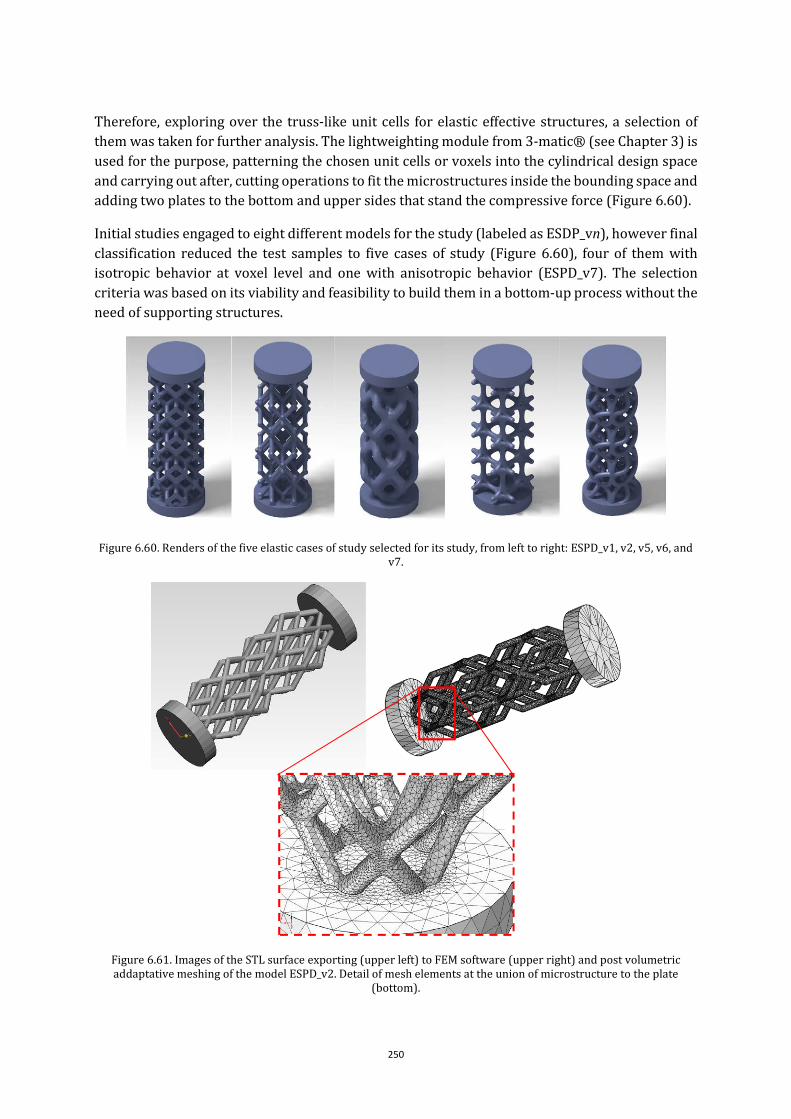
250
Therefore, exploring over the truss-like unit cells for elastic effective structures, a selection of them was taken for further analysis. The lightweighting module from 3-matic® (see Chapter 3) is used for the purpose, patterning the chosen unit cells or voxels into the cylindrical design space and carrying out after, cutting operations to fit the microstructures inside the bounding space and adding two plates to the bottom and upper sides that stand the compressive force (Figure 6.60).
Initial studies engaged to eight different models for the study (labeled as ESDP_vn), however final classification reduced the test samples to five cases of study (Figure 6.60), four of them with isotropic behavior at voxel level and one with anisotropic behavior (ESPD_v7). The selection criteria was based on its viability and feasibility to build them in a bottom-up process without the need of supporting structures.
Figure 6.60. Renders of the five elastic cases of study selected for its study, from left to right: ESPD_v1, v2, v5, v6, and v7.
Figure 6.61. Images of the STL surface exporting (upper left) to FEM software (upper right) and post volumetric addaptative meshing of the model ESPD_v2. Detail of mesh elements at the union of microstructure to the plate
(bottom).
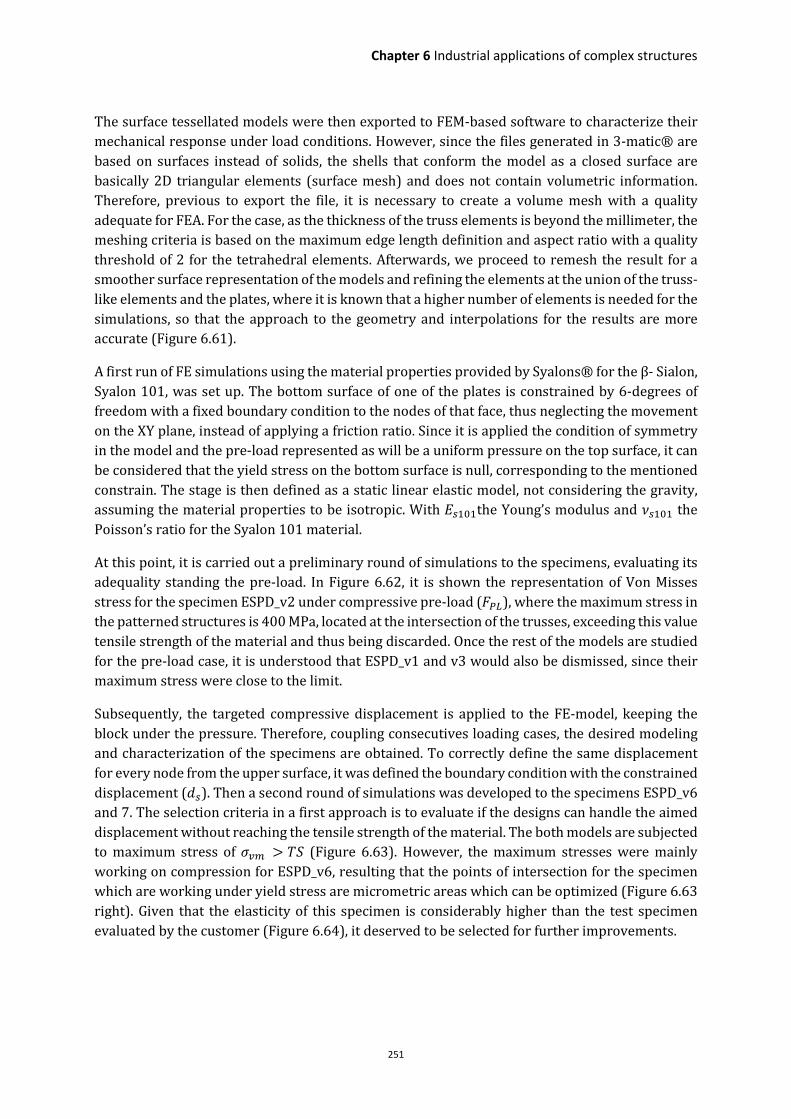
Chapter 6 Industrial applications of complex structures
251
The surface tessellated models were then exported to FEM-based software to characterize their mechanical response under load conditions. However, since the files generated in 3-matic® are based on surfaces instead of solids, the shells that conform the model as a closed surface are basically 2D triangular elements (surface mesh) and does not contain volumetric information. Therefore, previous to export the file, it is necessary to create a volume mesh with a quality adequate for FEA. For the case, as the thickness of the truss elements is beyond the millimeter, the meshing criteria is based on the maximum edge length definition and aspect ratio with a quality threshold of 2 for the tetrahedral elements. Afterwards, we proceed to remesh the result for a smoother surface representation of the models and refining the elements at the union of the truss-like elements and the plates, where it is known that a higher number of elements is needed for the simulations, so that the approach to the geometry and interpolations for the results are more accurate (Figure 6.61).
A first run of FE simulations using the material properties provided by Syalons® for the β- Sialon, Syalon 101, was set up. The bottom surface of one of the plates is constrained by 6-degrees of freedom with a fixed boundary condition to the nodes of that face, thus neglecting the movement on the XY plane, instead of applying a friction ratio. Since it is applied the condition of symmetry in the model and the pre-load represented as will be a uniform pressure on the top surface, it can be considered that the yield stress on the bottom surface is null, corresponding to the mentioned constrain. The stage is then defined as a static linear elastic model, not considering the gravity, assuming the material properties to be isotropic. With �mxSxthe Young’s modulus and ymxSx the Poisson’s ratio for the Syalon 101 material.
At this point, it is carried out a preliminary round of simulations to the specimens, evaluating its adequality standing the pre-load. In Figure 6.62, it is shown the representation of Von Misses stress for the specimen ESPD_v2 under compressive pre-load (&n�), where the maximum stress in the patterned structures is 400 MPa, located at the intersection of the trusses, exceeding this value tensile strength of the material and thus being discarded. Once the rest of the models are studied for the pre-load case, it is understood that ESPD_v1 and v3 would also be dismissed, since their maximum stress were close to the limit.
Subsequently, the targeted compressive displacement is applied to the FE-model, keeping the block under the pressure. Therefore, coupling consecutives loading cases, the desired modeling and characterization of the specimens are obtained. To correctly define the same displacement for every node from the upper surface, it was defined the boundary condition with the constrained displacement (om). Then a second round of simulations was developed to the specimens ESPD_v6 and 7. The selection criteria in a first approach is to evaluate if the designs can handle the aimed displacement without reaching the tensile strength of the material. The both models are subjected to maximum stress of s�� > -( (Figure 6.63). However, the maximum stresses were mainly working on compression for ESPD_v6, resulting that the points of intersection for the specimen which are working under yield stress are micrometric areas which can be optimized (Figure 6.63 right). Given that the elasticity of this specimen is considerably higher than the test specimen evaluated by the customer (Figure 6.64), it deserved to be selected for further improvements.

252
Figure 6.62. Result of FEA-based simulation (Von Mises stress in MPa) for the compression test modeling carried out to the specimen ESPD_v2 and detail of critical area at one node.
Figure 6.63. Von Mises stress for the specimens ESPDv_7 (left), ESPDv_6 (middle) under loading conditions and yield stress on specimen ESPDv_6 higher than the Tensile strength of Syalon 101 material.
Figure 6.64. Graphic comparing elasticity of the customer specimen and ESPDv_6
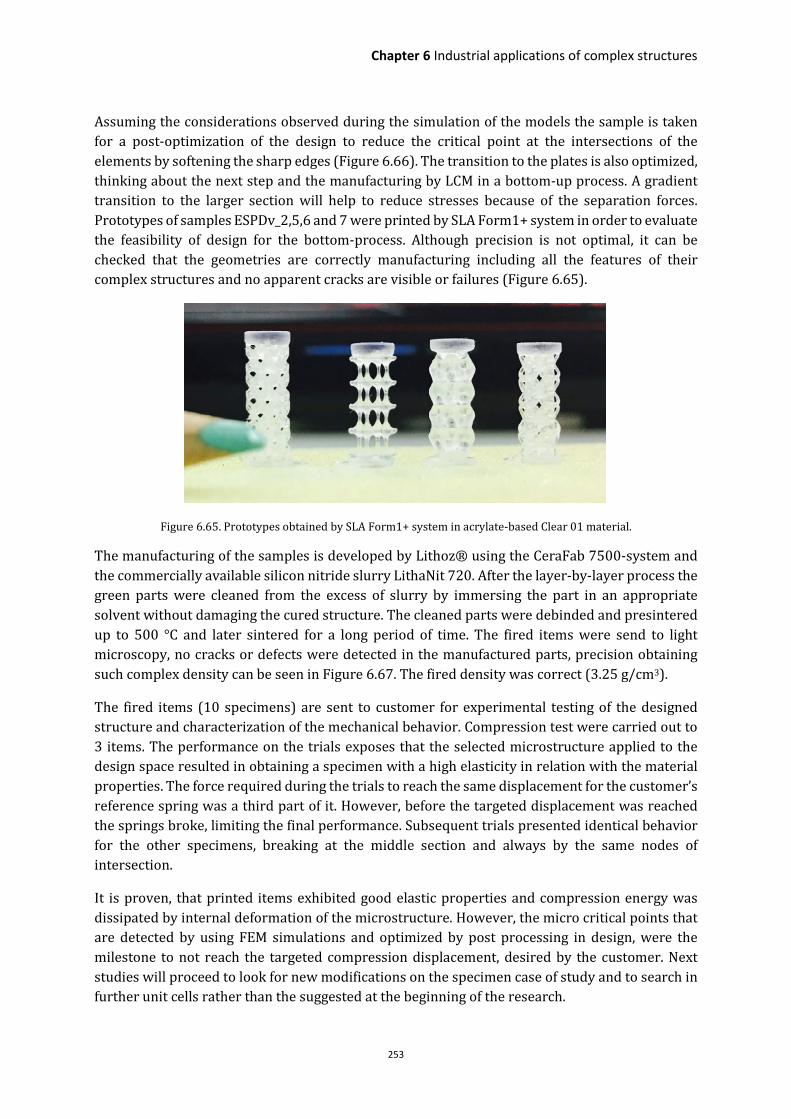
Chapter 6 Industrial applications of complex structures
253
Assuming the considerations observed during the simulation of the models the sample is taken for a post-optimization of the design to reduce the critical point at the intersections of the elements by softening the sharp edges (Figure 6.66). The transition to the plates is also optimized, thinking about the next step and the manufacturing by LCM in a bottom-up process. A gradient transition to the larger section will help to reduce stresses because of the separation forces. Prototypes of samples ESPDv_2,5,6 and 7 were printed by SLA Form1+ system in order to evaluate the feasibility of design for the bottom-process. Although precision is not optimal, it can be checked that the geometries are correctly manufacturing including all the features of their complex structures and no apparent cracks are visible or failures (Figure 6.65).
Figure 6.65. Prototypes obtained by SLA Form1+ system in acrylate-based Clear 01 material.
The manufacturing of the samples is developed by Lithoz® using the CeraFab 7500-system and the commercially available silicon nitride slurry LithaNit 720. After the layer-by-layer process the green parts were cleaned from the excess of slurry by immersing the part in an appropriate solvent without damaging the cured structure. The cleaned parts were debinded and presintered up to 500 °C and later sintered for a long period of time. The fired items were send to light microscopy, no cracks or defects were detected in the manufactured parts, precision obtaining such complex density can be seen in Figure 6.67. The fired density was correct (3.25 g/cm3).
The fired items (10 specimens) are sent to customer for experimental testing of the designed structure and characterization of the mechanical behavior. Compression test were carried out to 3 items. The performance on the trials exposes that the selected microstructure applied to the design space resulted in obtaining a specimen with a high elasticity in relation with the material properties. The force required during the trials to reach the same displacement for the customer’s reference spring was a third part of it. However, before the targeted displacement was reached the springs broke, limiting the final performance. Subsequent trials presented identical behavior for the other specimens, breaking at the middle section and always by the same nodes of intersection.
It is proven, that printed items exhibited good elastic properties and compression energy was dissipated by internal deformation of the microstructure. However, the micro critical points that are detected by using FEM simulations and optimized by post processing in design, were the milestone to not reach the targeted compression displacement, desired by the customer. Next studies will proceed to look for new modifications on the specimen case of study and to search in further unit cells rather than the suggested at the beginning of the research.
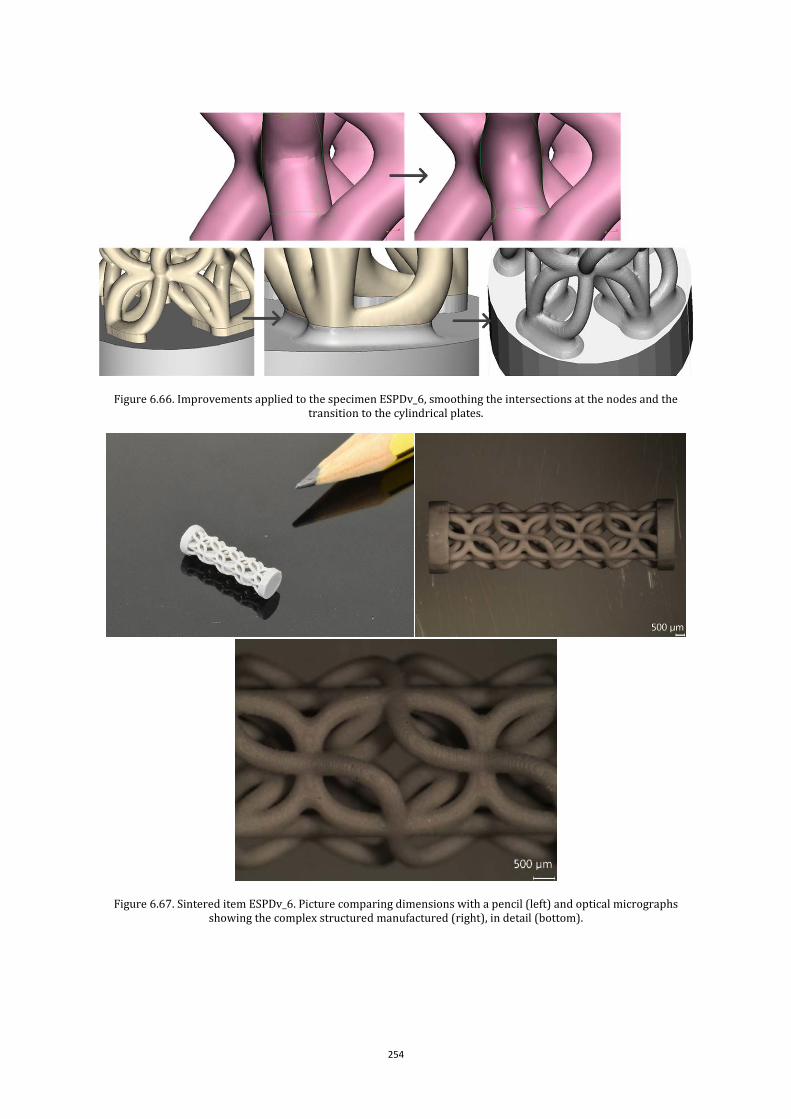
254
Figure 6.66. Improvements applied to the specimen ESPDv_6, smoothing the intersections at the nodes and the transition to the cylindrical plates.
Figure 6.67. Sintered item ESPDv_6. Picture comparing dimensions with a pencil (left) and optical micrographs showing the complex structured manufactured (right), in detail (bottom).

Chapter 6 Industrial applications of complex structures
255
Design, modeling and manufacture of multi-functional heat exchangers and heat sinks
Additive manufacturing technologies, supported by advanced design and simulation resources, constitute very interesting tools for research, development and innovation tasks linked to energy applications. In energy engineering systems complexity is always present, as mechanical, thermal and fluidic phenomena are involved and due to the number of components and intricate arrangements of tubes, plates, fins, among other elements, involved. Designs oriented to additive manufacturing can help with systemic and functional integration, as we explain along the developments detailed in the following sub-sections.
Firstly, the complete development of innovative micro-heat exchangers, which benefit from the geometrical complexity attainable for promoting special channel configurations, for enhancing heat transfer, for reaching more compact solutions and for promoting integration by reducing the number of components, it is obtained. Such integration, which leads even to monolithic devices, helps to simplify post-processes and to promote productivity, when compared with traditional processes relying on several mountings, soldering, joining and connecting stages. The ad hoc design of support structures helps to maximize the space for heat transfer and to minimize the use of material, which has also a positive environmental effect.
Secondly, the complete development process of different types of heat-sinks, which are applied to optimizing the performance of high-concentration solar photo-voltaic cells by means of examples, but which can be adapted to other energy engineering systems requiring heat dissipation, is detailed. Similar benefits as in the aforementioned developments of micro-heat exchangers are obtained. In addition, structural and thermal functions are integrated in single monolithic elements additively obtained, what constitutes another relevant advantage of using additively manufactured complex structures.
These cases of study are described in detail in the following pages, which cover the materials and methods used, analyze the results obtained and present some ideas for future directions. Such cases of study aim at the progressive incorporation of additive manufacturing to mass-production combined with mass-personalization in different sectors. The process applied shows an innovative methodology for the complete development of advanced products based on the use of complex geometries for enhanced functionality, including aspects linked to design and modeling of such geometries and to their manufacture supported by additive manufacturing processes.
Engineering design of micro-heat exchangers with complex geometries
Heat exchangers are engineering devices used to transfer heat, typically from one fluid to another and with applications including space heating, air conditioning, refrigeration and support to several processes of industrial plants. The typical designs of heat exchangers include complex arrangements of: tubes within a shell, plates supported by a framework, tubes surrounded by fins and plates, among other options almost always involving numerous parts and manufacturing steps.
256
Micro heat exchangers (also micro-structured heat exchangers) are heat exchangers involving at least one fluid flowing through or interacting with components of dimensions below 1 mm, normally channels with hydraulic diameter of hundreds of microns, which benefit from their reduced size and weight and help to apply the benefits of heat transfer in complex engineering systems for energy sustainability and economic (G. Khan & Fartaj, 2011).
The manufacture of heat exchangers and micro heat exchangers is usually a complex process, due to the number of parts and to the intricate geometries involved, which prevents in most cases full automation and requires trained professionals for operations such as soldering, joining and mounting. Additional details regarding the manufacture of conventional heat exchangers can be found elsewhere (Kundnaney & Kushwaha, 2015).
Regarding micro heat exchangers, their designs usually involves simpler geometries, which in some cases affect overall efficiency, for enabling mass-production micro-manufacturing procedures
In any case, there is a growing concern towards more integrated design and manufacturing procedures linked to these engineering systems. Additive manufacturing, working on a layer-by-layer approach and promoting “freedom of design”, thanks to the complex geometries typically attainable using these additive strategies, seems to be an interesting option towards heat exchangers and micro heat exchangers with a reduced number of components and manufacturing steps, as well as for the development of new concepts based on more complex arrangements of tubes and elements, which may turn out to promote efficiency and compactness.
Some interesting and recent applications of these additive manufacturing technologies have been linked to the development of new concepts of heat exchangers and of complex geometrical systems including heat pipes (Thompson, Aspin, Shamsaei, Elwany, & Bian, 2015), normally resorting to selective laser sintering for a final metallic device, although polymeric, ceramic and composite powders can be also three-dimensionally sintered. In spite of the attainable degree of complexity and integration, the use of solid state additive manufacturing technologies, normally working from powder, limits the miniaturization possibilities, down to hydraulic diameters of around 1.5mm with state-of-the-art resources, as enough space has to be left in order to remove the powder from the inside of the channel networks
In consequence, its application to the development of micro heat exchangers may well constitute a very promising approach towards new concepts of heat-management systems, which can be obtained as single part fully integrated devices and in just one manufacturing step, hence promoting process automation and leading to more compact and robust systems.
However, working additively upon a liquid entails also relevant challenges, including the need of a supporting structure to avoid device collapse during manufacturing, the need to perform post-processing support removal steps and the need of well-trained designers to understand the limits of the technology and to design according to them.

Chapter 6 Industrial applications of complex structures
257
In order to analyze further on such limits and to expand the applications of the complex and detailed geometries attainable by means of additive photo-polymerization, this study is focused on the complete engineering design process of two micro heat exchangers with atypical complex geometries and obtained as single part fully integrated devices in just one manufacturing step.
The followed procedure provides two examples of systematic developments of micro heat exchangers using the CDIO (conceive, design, implement, and operate) methodology, in which design strategies oriented to additive manufacturing by photo-polymerization play a fundamental role. Aspects such as the ad hoc design of support structures, the use of supporting structures as active elements for device integration (instead of being just useless material to be removed) and the incorporation of other complex geometries for more efficient performance, among other details, are discussed in detail along the study.
Even though the cases of study are obtained by additive photo-polymerization in epoxy resin, a similar procedure may be applied to the development of micro heat exchangers using alternative liquid phase additive procedures, including lithography based ceramic manufacture, as a very remarkable way of obtaining ceramic devices for energy engineering. After experimental testing for validation with the obtained prototypes, main results and potential of the presented approach are discussed.
Design and modeling processes
The designs are aimed at single step manufacture and at final micro heat exchangers manufactured as single parts and we take into account the particular features of the process for obtaining computer-aided designs oriented to manufacture. According to the knowledge-bases data the laser stereolithography system, cantilevers and over-hanging elements up to 9-10 mm can be constructed.
Therefore, we design the supports trying to obtain a maximum separation between them of 7-8 mm for obtaining feasible geometries. Apart from the special design of support structures, the designs must count with exits for the un-polymerized trapped resin. In these devices, we take advantage of the inlets and outlets for extracting the mentioned trapped resin after manufacture.
Regarding modeling, we have combined the number of transfer units “NTU” method , which can be even applied for complex geometries (Gorman, Krautbauer, & Sparrow, 2016), for designing main features of the micro heat exchangers and assessing overall expected performance and FEM-based simulations for optimizing the geometries and flow within the micro heat exchangers, for evaluating the heat transfer process and for detailed in silico performance assessment.
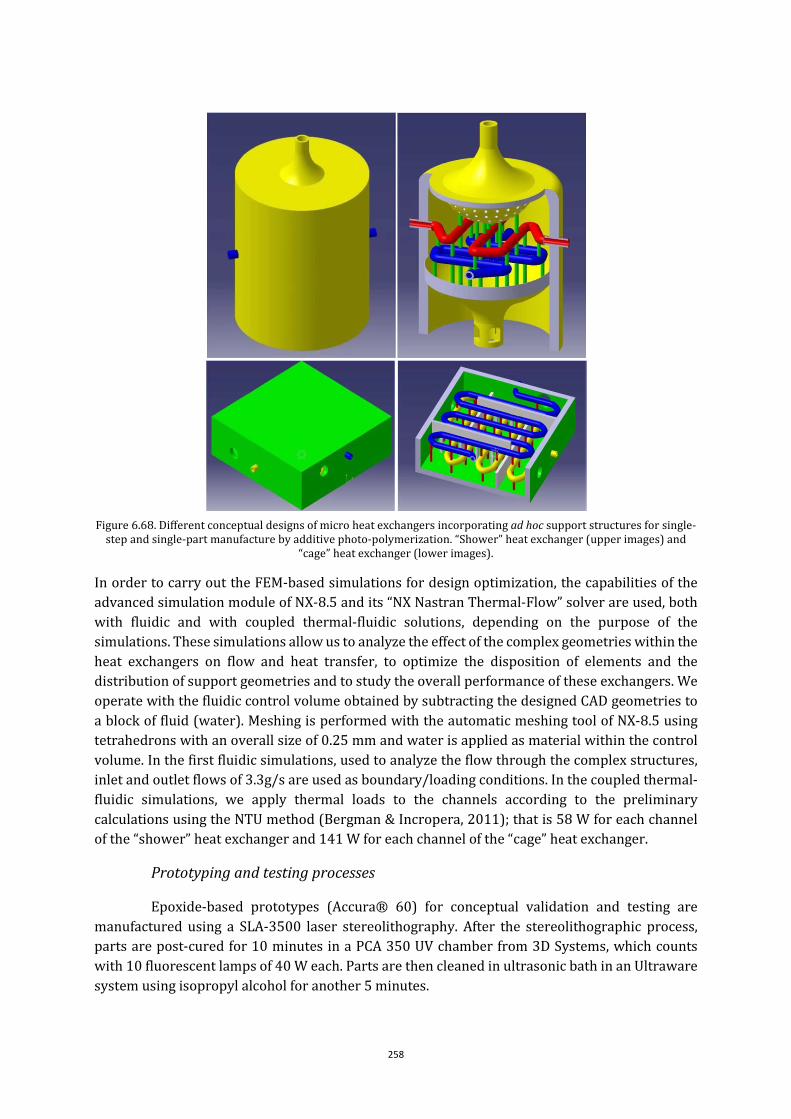
258
Figure 6.68. Different conceptual designs of micro heat exchangers incorporating ad hoc support structures for single-
step and single-part manufacture by additive photo-polymerization. “Shower” heat exchanger (upper images) and “cage” heat exchanger (lower images).
In order to carry out the FEM-based simulations for design optimization, the capabilities of the advanced simulation module of NX-8.5 and its “NX Nastran Thermal-Flow” solver are used, both with fluidic and with coupled thermal-fluidic solutions, depending on the purpose of the simulations. These simulations allow us to analyze the effect of the complex geometries within the heat exchangers on flow and heat transfer, to optimize the disposition of elements and the distribution of support geometries and to study the overall performance of these exchangers. We operate with the fluidic control volume obtained by subtracting the designed CAD geometries to a block of fluid (water). Meshing is performed with the automatic meshing tool of NX-8.5 using tetrahedrons with an overall size of 0.25 mm and water is applied as material within the control volume. In the first fluidic simulations, used to analyze the flow through the complex structures, inlet and outlet flows of 3.3g/s are used as boundary/loading conditions. In the coupled thermal-fluidic simulations, we apply thermal loads to the channels according to the preliminary calculations using the NTU method (Bergman & Incropera, 2011); that is 58 W for each channel of the “shower” heat exchanger and 141 W for each channel of the “cage” heat exchanger.
Prototyping and testing processes
Epoxide-based prototypes (Accura® 60) for conceptual validation and testing are manufactured using a SLA-3500 laser stereolithography. After the stereolithographic process, parts are post-cured for 10 minutes in a PCA 350 UV chamber from 3D Systems, which counts with 10 fluorescent lamps of 40 W each. Parts are then cleaned in ultrasonic bath in an Ultraware system using isopropyl alcohol for another 5 minutes.

Chapter 6 Industrial applications of complex structures
259
Regarding testing of the micro heat exchangers, it was opted for a simplified experimental set-up due to the available resources in the lab and considering that it is aimed at a preliminary conceptual validation of the possibility of exchanging heat using additively manufactured micro-devices obtained in epoxy resin. First of all, syringes with colored water are used to inject fluid going through the channels and surrounding them, so as to validate the prototyping procedure and the possibility of obtaining the micro-heat exchangers in a single manufacturing step and as single parts without reaching channels collapsed or blocked by the resin being additively processed. Avoiding blockage with un-polymerized or partially polymerized resin is challenging but it is possible to handle complex and functional channel networks with inner diameters of 0.6 mm with confidence using laser stereolithography.
Then, two functional validations are performed for the designs suggested:
a) The “cage” micro-heat exchanger is filled with water and heated up to 50 °C by placing it upon a heating plate. Once a homogeneous temperature is reached, cold water at 21 °C is injected through the inlets of the channel networks (3.3 g/s) to analyze the possibility of extracting heat from the hot water surrounding the channels. Temperatures are also measured at the outlets using calibrated Mastech® thermocouples.
b) The “shower” micro-heat exchanger is filled with cold water through the upper inlet with shower cup geometry. Then hot water at 80 °C is injected through the inlets of the channel networks (3.3 g/s) to analyze the possibility of cooling them down. Channels are tested separately to simplify the testing procedure. Again, thermocouples are used to measure temperatures. We also counted with an IR thermography equipment from Flyr® Systems, as support procedure to analyze temperature variations and to double check the measurements from the thermocouples. Filling the heat exchangers with water and then injecting through the micro-channels is a simplified procedure. Ideally, the experiments should be run water surrounding the channels, but we consider it a nice approximation to the real performance during the first seconds of operation as we are injecting small amounts of fluid.
Some connecting elements, micro-flanges and lids were designed (again counting with the help of NX-8.5 CAD software, this time combined with the open-source slicing Cura software for the preparation of the additive process) and printed with a Prusa Hephestos fused deposition modeling machine (BQ) in ABS to support the development of trials and the arrangement of the test benches. Conventional elastomeric tubes and syringes were used for handling fluids. Main results, concerning design, modeling, prototyping, testing and overall viability of the proposed systems are presented and discussed further on.
Design and modeling results
Figure 6.68 shows the different conceptual CAD designs of the desired micro heat exchangers incorporating ad hoc support structures for single-step and single-part manufacture by additive photo-polymerization. Upper images show the “shower” model and lower images show the “cage” model. Supporting structures for enabling the additive manufacture of complex channel networks and for fixing the channel networks to the structures of the exchangers, hence enabling single-part and single-step manufacture are highlighted in green for the “shower” model and in red for the “cage” model.

260
The initial conceptual designs from Figure 6.68 are further improved towards the results shown in Figure 6.69, which include more adequate distribution of support structures, as obtained from simulation results, incorporate inner fins for improved flow and include modified flow inlets and outlets for testing purposes.
Such incorporation of fins and inner panels has been also performed as a consequence of simulation results, so as to promote a more homogeneous flow within the control volume and to consequently enhance heat transfer by avoiding zones with almost null fluid speed (and heat transfer) in the preliminary conceptual designs. In the “shower” micro-heat exchanger the inner geometry of the shower cup is modified, in a similar way to the modified piston heads of internal combustion engines, so as to promote a more homogeneous irrigation of the network of channels placed below the shower cup.
Figure 6.69. “Shower” heat exchanger optimized design. Modification of supports’ position and geometry for additive
manufacture, incorporation of inner fins for improved flow and modified flow inlets (left). “Cage” modification of supports’ position and geometry for additive manufacture, incorporation of inner fins for improved flow and modified
flow inlets (right).
Figure 6.70 shows CFD-based simulation results aimed at design optimization and at modeling the performance of the “shower” micro-heat exchanger concept designed for additive photo-polymerization. The images from the two upper rows show velocity distributions and help to compare different distributions of support structures and different geometries of the shower cup, so as to select the more adequate for a symmetric and more homogeneous flow aimed at promoting heat transfer.
The images from the two lower rows include results from coupled fluid-thermal simulations and help to analyze the performance of the micro-heat exchanger by providing different views of the permanent temperature field, showing the cooling effect of the fluid projected from the shower cup upon the channels.
Figure 6.71 shows CFD-based simulation results aimed at design optimization and at modeling the performance of the “cage” micro-heat exchanger concept designed for additive photo-polymerization. The images from the two upper rows show velocity distributions and help to compare different distributions of support structures and different geometries of the incorporated fins and panels, so as to select the more adequate flow aimed at promoting heat transfer.

Chapter 6 Industrial applications of complex structures
261
Figure 6.70. CFD simulation results aimed at design optimization and at modeling the performance of the first micro heat exchanger concept designed for additive photo-polymerization (above and bottom of previous page).
The images from the lower row include results from coupled fluid-thermal simulations and help to analyze the performance of the micro-heat exchanger by providing different views of the permanent temperature field. The cooling effect of the water surrounding the channels can be appreciated. Simulations have helped to optimize the designs, now let us concentrate on prototyping results and trials aimed at conceptual validation of the proposed systems.

262
Figure 6.71. CFD simulation results aimed at design optimization and at modeling the performance of the second micro heat exchanger concept designed for additive photo-polymerization (above and bottom of previous page).
Prototyping and testing results
After design optimization, prototypes are manufactured using the SLA-3500 machine by 3D Systems as previously detailed. It is important to highlight that the possibility of using laser stereolithography is excellent in terms of precision, manufacturing speed (as in the 350mm x 350mm vat more than 50 devices can be manufactured at once) and, very specially, as regards geometrical complexity and integration of functions. A direct visual appreciation (see the prototypes of Figure 6.72) helps to check the geometrical complexity attainable with the proposed approach and to assess the level of detail achieved, with micro-channels of inner cross-section diameters down to around 600 microns. It is also necessary to highlight the adequate performance of the ad hoc designed support structures. In fact, the designed supports allow for stable cantilever micro-channels and domed structures, while saving material and production time by avoiding the intricate meshes of supports typically generated automatically using state-of-the-art slicing

Chapter 6 Industrial applications of complex structures
263
software, which could lead to inefficient flow and heat exchange within the proposed devices. Open prototypes are manufactured for visual purposes (mainly for the inspection of the inner networks and details) and closed prototypes are manufactured for the validation trials.
In short, complexity of geometries can be achieved and these design and manufacturing procedures can be linked to the development of similar heat transfer and energy-related devices based on the usual bioinspired and organic forms consequence, for instance, of design procedures based on the constructal law (Bejan & Lorente, 2007; Song, Asadi, Xie, & Rocha, 2015).
As regards a preliminary fluid flow validation, Figure 6.73 shows the testing of fluid flow through the additively manufactured and spatially distributed micro channels of the different concepts of micro heat exchangers, which helps to confirm that no resin remains trapped within the micro channels and that the proposed cleaning process is adequate towards functional prototypes, otherwise the eventually trapped resin could block the micro channels and prevent flow. This first trial helps also to evaluate the benefits and performance of the 3D printed auxiliary elements (in red and blue ABS), which are used as connecting elements, as elements of test benches and as plugs for helping with test preparation and final functional validation. Red-colored water is used for showing the fluid flow through the channels and blue-colored water helps to show both micro heat exchangers completely filled with fluid surrounding the micro channels. Another relevant result is that the surfaces of the devices are completely solid, without the presence of eventual pores due to manufacturing errors or limitations, which would lead to leakages. This can be also put forward as additional benefit of photopolymerization-based additive manufacturing, when compared with the porous structures of many AM-processes, such as selective laser sintering, fused deposition modeling, layered object manufacture or Z-printing.
Functional validation is achieved by the proof-of-concept tests detailed in the methods Section, whose results are detailed further on. Figure 6.74 schematically shows the experimental set-ups and testing sequences of the different concepts of additively manufactured micro heat exchangers for design validation. In the case of the “shower” micro heat exchanger, being filled with cold water (20 °C), the fluid injected through the micro channels enters the device at a temperature of 80° C and exits the heat exchanger at a temperature of 68 °C, which validates the device. In the case of the “cage” micro heat exchanger, which is filled with hot water at 50 °C, the fluid injected enters the micro system at a temperature of 20° C and exits at a temperature of 24.5 °C, which is in accordance with the simulation results and helps to validate the device functionality.
Figure 6.72. Prototypes of different micro heat exchanger concepts obtained by laser stereolithography (additive
photo-polymerization) using a SLA-3500 machine by 3D systems.

264
Figure 6.73. Testing of fluid flow through the additively manufactured and spatially distributed micro channels of the different concepts of micro heat exchangers. Red-colored water for highlighting the micro channels and validating the
flow through them. Blue-colored water for showing both micro heat exchangers filled with fluid surrounding the micro channels.
Figure 6.75 includes a quantitative summary with comparative graphs showing modeling and preliminary testing results for the first (shower type) concept of additively manufactured micro heat exchanger. It can be appreciated that model and test agree, especially regarding the behavior of the cold flow, and that the device in fact performs as expected from a real micro heat exchanger, with a cold flow increasing its temperature from the inlet to the outlet (in this case around 4-5 °C) and with a hot flow decreasing its temperature from the inlet to the outlet (in this case around 4-5 °C). Probably the length of the outlet tube from the micro heat exchanger to the vase where the measurement is carried accounts for the extra temperature decrease of the hot line during the actual testing, as compared with the modeling results.
Figure 6.74. Experimental set-ups and testing sequences of the different concepts of additively manufactured micro
heat exchangers for design validation.

Chapter 6 Industrial applications of complex structures
265
Figure 6.75. Results summary: temperature in (°C) curves showing modeling and testing results for the first concept
(“shower” type) of additively manufactured micro heat exchanger.
Conclusions of the case of study
Even though the cases of study have been obtained by additive photo-polymerization in epoxy resin, similar procedures and design considerations may be applied to the development of micro heat exchangers using alternative liquid phase additive procedures, including lithography based ceramic manufacture, as a very remarkable way of obtaining ceramic devices for energy engineering, or even two-photon polymerization, as an alternative for even reaching the nano-scale. The use of other fluids for enhancing heat exchange or the combination with heat pipes may be also an interesting approach.
Engineering design of heat-sinks with complex geometries
Heat sinks are a type of heat exchangers that transfer the heat generated by an electronic source or by a mechanical system to a surrounding fluid medium (either gas or liquid), hence helping to dissipate it away from the device, which allows for temperature regulation. Typically heat sinks are designed to maximize the surface area in contact with the cooling fluid. The more basic heat sinks include a plate fixed to the heat source and a set of pins or fins place in normal direction to the plate and in contact with the coolant. Solutions based on unforced convection and on forced convection co-exist, depending on the desired dissipation power. The continuous development of high-powered integrated circuits, aimed at electronic components performing at faster rates, and the demand of more compact and powerful mechanical systems have led to increasing heat dissipation requirements in the last three decades (Hirasawa & Oomi, 2005).
Consequently, forced-convection heat sinks have been progressively more employed and new heat sink concepts, based on alternative working principles and on the use of micrometric features towards higher surface to volume ratios and dissipation rates, have been developed. Micro-channel heat sinks, heat sinks with micro-injectors and micro-pin-fin heat sinks with forced convection through the pins and fins were proposed in the eighties (Tuckerman & Pease, 1983).
Such concepts, using both single-phase flow and two-phase flow, have been constantly developed in recent years, as previously reviewed (Hassan, Phutthavong, & Abdelgawad, 2004).

266
Next, the aspects such as the ad hoc design of support structures, the use of supporting structures as active elements for device integration (instead of being just useless material to be removed) and the incorporation of other complex geometries for more efficient performance and with structural function, among other details, are discussed in detail along the study. Even though the following cases of study are obtained by additive photo-polymerization in epoxy resin, a similar procedure may be applied to the development of micro heat exchangers using alternative liquid phase additive procedures, including lithography based ceramic manufacture, as a very remarkable way of obtaining ceramic devices for energy engineering. After experimental testing for validation with the obtained prototypes, main results and potential of the presented approach are discussed.
Meshing is performed with the automatic meshing tool of NX-8.5 using tetrahedrons with an overall size of 0.25 mm and water is applied as material within the control volume. In the first fluidic simulations, used to analyze the flow through the complex structures, inlet and outlet flows of 750 g/min are used as boundary/loading conditions. In the coupled thermal-fluidic simulations, we apply thermal loads to the surfaces in contact with the high-concentration photovoltaic cell, according to its nominal power (30 W). Epoxy is used as material of the heat sinks, as correspond to the prototypes obtained and tested, silicon is used as material for the high-concentration photovoltaic cell, perfect thermal contacts are considered and a convection coefficient hair = 5 W/m2·K and hwater, as calculated by Zhukauskas correlation, are used respectively for the surfaces in contact with air and water, as obtained from Chapman’s textbook (Chapman, 1984). We select
epoxy, as in some of the previously detailed examples and applications, for the manufacturing precision and speed of the available laser stereolithography system and for its being adequate as initial technology for validating geometries and, to some extent, functionalities, before resorting to the use of technologies capable of manufacturing with high-performance engineering materials (i.e. lithography-based ceramic manufacture).
Design and modeling results
Figure 6.76 shows the different conceptual CAD designs of the desired heat sinks incorporating ad hoc support structures for single-step and single-part manufacture by additive photo-polymerization and including structural support elements for multi-functional performance and easier integration within the pre-existing high-concentration solar energy systems. Micro-pin-fin heat sink (upper images), micro-channel heat sink (middle images) and micro-injector heat sink (lower images) are shown and provide a comprehensive set of examples for heat management using the complex geometries attainable by additive manufacturing. Among interesting features, it is important to highlight: i) the lateral legs with structural function of the micro-pin-fin and micro-channel heat sinks, ii) the concentric inlet-outlet of the micro-channel heat sink, iii) the different layers aimed at promotion of recirculation of the micro-channel and micro-injector heat sinks and iv) the complex overall structures and inner networks, which can only be obtained as single parts in a single step when using additive manufacturing procedures.

Chapter 6 Industrial applications of complex structures
267
Figure 6.76. Different conceptual designs of multi-functional forced-convection heat sinks with complex geometries
for improved performance and aimed at single-step and single-part manufacture by vat-polymerization (images a and b); Micro-pin-fin heat sink (b), micro-channel heat sink (d) and micro-injector heat sink with lens and electronics (d
and e).
The initial conceptual designs from Figure 6.76 are further improved for better performance and manufacturability by means of modifications, which include more adequate distribution of support structures, as obtained from simulation results, incorporate inner fins for improved flow and include modified flow inlets and outlets for testing purposes. Such incorporation of fins and inner panels has been also performed as a consequence of simulation results, so as to promote a more homogeneous flow within the control volume and to consequently enhance heat transfer by avoiding zones with almost null fluid speed (and heat transfer) in the preliminary conceptual designs.
Figure 6.77 shows, by means of example, some results of the performed CFD-based simulations in order to study a possible design optimization and modeling the performance of the different heat-sink models. The material properties selected for such purpose are those for the commercial epoxy resin Accura 60®
In the cases of the micro-pin-fin and of the micro-channel heat sinks, velocity, pressure and temperature fields help to verify the adequacy of the final distribution of pins, fins and channels, which promote homogeneous fields and prevent zones with very low velocities and, consequently, heat dissipation properties. The cooling effect of the water surrounding the channels can be appreciated. In the case of the micro-injector heat sink, the modeling help to check the capability
a)
b)
c)
e) d)

268
of the micro-injectors for projecting the fluid and letting it reach all corners of the heat sink for enhanced heat transfer (upper images from Figure 6.78). The performance of the micro-injector heat sink is additionally checked by means of coupled thermal-fluidic simulations incorporating not just the heat sink, but also the geometry of the cell being refrigerated (and not just its effect as boundary condition). Its influence on the temperature of the high-concentration photovoltaic cell is shown. In addition, the lower images from Figure 6.78 compare the performance of an additively manufactured epoxy heat sink (for further validation of the FEM-based simulations by comparing with the real tests upon prototypes) and the potential performance of a heat sink made of a material with higher thermal conductivity (i.e. aluminum).
Figure 6.77. Flow-thermal coupling results of the simulations for the micro-pin-fin heat sink concept;pressure,
temperature and velocity fields (left, middle, right respectively).
Prototyping and testing results
A direct visual appreciation (see the prototypes of Figure 6.78) helps to check the geometrical complexity attainable with the proposed approach and to assess the level of detail achieved, with micro-channel networks, fins and pins of inner cross-section diameters and of sections down to around 600 microns. It is also necessary to highlight the adequate performance of the ad hoc designed support structures. In fact, the designed supports allow for stable cantilever lids integrated to allow for single-step and single-part manufacture. The personalized design of support structures also promotes material savings and production time reductions by avoiding the intricate meshes of supports typically generated automatically using state-of-the-art slicing software, which could lead to inefficient flow and heat transfer within the proposed heat sinks. Open prototypes are manufactured for visual purposes (mainly for the inspection of the inner pins, fins, channels and details) and closed prototypes are manufactured for the validation trials.
The preliminary fluid flow validation with syringes injecting fluid through the devices helps to confirm that no resin remains trapped within the micro channels or between pins and fins and that the proposed cleaning process is adequate towards functional prototypes; otherwise the eventually trapped resin could block the micro channels and prevent flow. This first trial helps also to evaluate the benefits and performance of the 3D printed auxiliary elements (in red ABS), which are used as connecting elements, as elements of test benches and as plugs for helping with test preparation and final functional validation.

Chapter 6 Industrial applications of complex structures
269
Another relevant result is that the surfaces of the devices are completely solid, without the presence of eventual pores due to manufacturing errors or limitations, which would lead to leakages. This can be also put forward as additional benefit of photopolymerization-based additive manufacturing, when compared with the porous structures of many AM-processes, such as selective laser sintering, fused deposition modeling, layered object manufacture or Z-printing. Another important validation is linked to mounting the high-concentration photovoltaic cells upon the heat-sinks, which leads to checking the adequate dimensional tolerances of the designed and manufactured systems.
Functional validation is achieved by the proof-of-concept tests detailed in the “methods” Section, whose results are detailed further on. Figure 6.79 schematically shows the experimental set-ups and testing sequences of the different concepts of additively manufactured (micro) heat sinks for design validation.
The obtained temperature fields are in accordance with the simulation results, which helps to validate the functionality of the different systems and the accuracy of the FEM-based simulations performed. Thermocouples and IR-thermography have been used for improved testing.
Figure 6.78. Prototypes of different forced-convection multi-functional heat sink concepts obtained by laser
stereolithography (additive photo-polymerization) using the SLA-3500 by 3D systems.

270
Figure 6.79. Experimental set-ups and testing sequences of the different prototypes of additively manufactured
forced-convection multi-functional heat sinks for design validation.
Conclusions of the case of study
Thus, it is presented a very promising approach for the development of heat sinks using liquid-phase additive photo-polymerization as technologies for the fully automated one-step manufacture of single part energy engineering systems. The procedure followed has provided three detailed examples of systematic developments of heat sinks using the CDIO -conceive, design, implement, and operate- methodology, in which design strategies oriented to additive manufacturing by photo-polymerization have played a basic role. Aspects such as the ad hoc
design of support structures, the use of supporting structures as active elements for device integration (instead of being just useless material to be removed) and the incorporation of other complex geometries for more efficient performance and for the incorporation of structural functions, among other details, have been discussed in detail along the study.
6.4 Conclusions of this chapter
In this chapter, we have introduced examples of application for the different strategies presented through the Thesis, dividing the concepts in those related to the creation of lattice and porous structures leading to functional graded and meta-materials, and those referred to the surface functionalization of existing products and the innovation of concepts that can promote the incorporation of surface texturing in AM products, improving the surface finish, making them competitive to conventional injection molding and providing of an added value in terms of product functionalization. Moreover, five cases of success in which the developed methodology, the ̀ know-how’, the formulated materials and software resources, have been put into practice, giving original engineering application at low and medium technology-readiness levels. These cases provide the best examples of the benefits for the further research in DfAM to boost the introduction of the AM technologies in the value chains of the health, transport and energy sectors of the industry.

Chapter 6 Industrial applications of complex structures
271
6.5 References of this chapter
A
Appleby, A. J. (Texas A. and M. U. (US)), & (Foulkes, F. R. (Univ of T. (CA))). (1988). Fuel cell handbook.
B
Barbieri, R. A., Perottoni, C. A., & Zorzi, J. E. (2012). Influence of Sintering Temperature on the Mechanical Properties of
Alumina Springs. International Journal of Applied Ceramic Technology, 9(3), 599–605.
Baudis, S., Heller, C., Liska, R., Stampfl, J., Bergmeister, H., & Weigel, G. (2009). (Meth)acrylate-based photoelastomers
as tailored biomaterials for artificial vascular grafts. Journal of Polymer Science A Polymer Chemistry, 47, 2664–
2676.
Baudis, S., Steyrer, B., Pulka, T., Wilhelm, H., Weigel, G., Bergmeister, H., … Liska, R. (2010). Photopolymerizable
Elastomers for Vascular Tissue Regeneration. Macromolecular Symposia, 296(1), 121–126.
Bejan, A., & Lorente, S. (2007). Constructal tree-shaped flow structures. Applied Thermal Engineering, 27(4), 755–761.
Bergman, T. L., & Incropera, F. P. (2011). Fundamentals of Heat and Mass Transfer. John Wiley & Sons.
De Blas Romero, A., Pfaffinger, M., Mitteramskogler, G., Schwentenwein, M., Jellinek, C., Homa, J., Stampfl, J. (2016).
Lithography-based additive manufacture of ceramic biodevices with design-controlled surface topographies.
The International Journal of Advanced Manufacturing Technology, 88.
C
Chapman, A. J. (1984). Heat Transfer. Macmillan Publishers Limited.
D
Deng, Y., & Kuiper, J. (2017). Functional 3D Tissue Engineering Scaffolds: Materials, Technologies and Applications.
Woodhead Publishing.
Díaz Lantada, A. (2016). Microsystems for Enhanced Control of Cell Behavior: Fundamentals, Design and Manufacturing
Strategies, Applications and Challenges. Springer.
Diaz Lantada, A., Morgado, P. L., & Stampfl, J. (2013). Additive Manufacturing Technologies for Enhancing the
Development Process of Biodevices. In Handbook on Advanced Design and Manufacturing Technologies for
Biomedical Devices (pp. 181–205). Springer, Boston, MA.
Díaz Lantada, A., Mosquera, A., Endrino, J. L., & Lafont, P. (2010). Design and rapid prototyping of DLC coated fractal
surfaces for tissue engineering applications. Journal of Physics: Conference Series, 252(1), 012003.
Diaz Lantada, Andres, De Blas Romero, A., Schwentenwein, M., Jellinek, C., Homa, J., & Predestinacion Garcia Ruiz, J.
(2017). Monolithic 3D labs- and organs-on-chips obtained by lithography-based ceramic manufacture.
Diaz Lantada, Andres, Hengsbach, S., & Bade, K. (2017). Lotus-on-chip: computer-aided design and 3D direct laser
writing of bioinspired surfaces for controlling the wettability of materials and devices. Bioinspiration &
Biomimetics.
Diaz Lantada, Andres, Piotter, V., Plewa, K., Barie, N., Guttmann, M., & Wissmann, M. (2015). Toward mass production
of microtextured microdevices: linking rapid prototyping with microinjection molding. International Journal
of Advanced Manufacturing Technology, 76(5), 1011–1020.

272
E
Echávarri Otero, J., De la Guerra, E., Bellón Vallinot, I., & Chacón Tanarro, E. (2016). Optimising the design of textured
surfaces for reducing lubricated friction coefficient. Lubrication Science, 29.
Ekström, T., & Nygren, M. (1992). SiAION Ceramics. Journal of the American Ceramic Society, 75(2), 259–276.
F
Furth, M. E., & Atala, A. (2014). Chapter 6 - Tissue Engineering: Future Perspectives A2 - Lanza, Robert. In R. Langer &
J. Vacanti (Eds.), Principles of Tissue Engineering (Fourth Edition) (pp. 83–123). Boston: Academic Press.
G
Gorman, J. M., Krautbauer, K. R., & Sparrow, E. M. (2016). Thermal and fluid flow first-principles numerical design of an
enhanced double pipe heat exchanger. Applied Thermal Engineering, 107(Supplement C), 194–206.
H
Hamilton, T., Gopal, M., Atchley, E., & Smith, J. E. (2003). Experimental investigation on the mechanical performance of
helical ceramic springs. Journal of Materials Science, 38(15), 3331–3335.
Hasan, A., Paul, A., Vrana, N. E., Zhao, X., Memic, A., Hwang, Y.-S., … Khademhosseini, A. (2014). Microfluidic techniques
for development of 3D vascularized tissue. Biomaterials, 35(26), 7308–7325.
Hassan, I., Phutthavong, P., & Abdelgawad, M. (2004). Microchannel Heat Sinks: An Overview of the State-of-the-Art.
Microscale Thermophysical Engineering, 8(3), 183–205.
Hengsbach, S., & Lantada, A. D. (2014). Rapid prototyping of multi-scale biomedical microdevices by combining additive
manufacturing technologies. Biomedical Microdevices, 16(4), 617–627.
Hirasawa, T., & Oomi, M. (2005). Evolution of the Heatsink Technology.
J
Janardhanan, V. M., Heuveline, V., & Deutschmann, O. (2007). Performance analysis of a SOFC under direct internal
reforming conditions. Journal of Power Sources, 172(1), 296–307.
K
Kapadia, S., Anderson, W. K., & Burdyshaw, C. (2011). Channel shape optimization of solid oxide fuel cells using
advanced numerical techniques. Computers & Fluids, 41(1), 41–50.
Khazaee, I., & Rava, A. (2017). Numerical simulation of the performance of solid oxide fuel cell with different flow
channel geometries. Energy, 119, 235–244.
Khan, M., & Fartaj, A. (2011). A review on microchannel heat exchangers and potential applications. International
Journal of Energy Research, 35, 553–582.
Kundnaney, N. D., & Kushwaha, D. K. (2015). A Critical Review on Heat Exchangers used in Oil Refinery.
L
Loginkin, S., Schlier, L., Harris, J., Travitzky, N., & Greil, P. (2016). Polymer-Derived Ceramic Coil Springs. Advanced
Engineering Materials, 18(1), 70–75.
Lyons, A. M., Mullins, J., Barahman, M., Erlich, I., & Salamon, T. (2013). Three-dimensional superhydrophobic structures
printed using solid freeform fabrication tools. International Journal of Rapid Manufacturing, 3(2–3), 89–104.

Chapter 6 Industrial applications of complex structures
273
M
Ma, P. X., & Elisseeff, J. (2005). Scaffolding In Tissue Engineering. CRC Press.
Mirzaeian, M., & Hall, P. J. (2009). Preparation of controlled porosity carbon aerogels for energy storage in rechargeable
lithium oxygen batteries. Electrochimica Acta, 54(28), 7444–7451.
Moorthy, S. B. K. (2015). Thin Film Structures in Energy Applications. Springer.
Mosadegh, B., Polygerinos, P., Keplinger, C., Wennstedt, S., Shepherd, R. F., Gupta, U., … Whitesides, G. M. (2014).
Pneumatic Networks for Soft Robotics that Actuate Rapidly. Advanced Functional Materials, 24(15), 2163–
2170.
Muruzabal M., & de Blas A. (2017). Diseño y optimización de nuevos conceptos de pilas de combustible de óxido sólido
orientados a su fabricación aditiva por fotolitografía de slurries cerámicas. Master Thesis.
Mushtaq, U., Kim, D.-W., Yun, U.-J., Lee, J.-W., Lee, S.-B., Park, S.-J., … Lim, T.-H. (2015). Effect of cathode geometry on the
electrochemical performance of flat tubular segmented-in-series(SIS) solid oxide fuel cell. International
Journal of Hydrogen Energy, 40(18), 6207–6215.
O
Olson, R., Willer, M., & Jackson, K. (2016, July 1). WO/2016/106179. R
P
Panetta, J., Zhou, Q., Malomo, L., Pietroni, N., Cignoni, P., & Zorin, D. (2015). Elastic Textures for Additive Fabrication.
ACM Trans. Graph., 34(4), 135:1–135:12.
Peele, B. N., Wallin, T. J., Zhao, H., & Shepherd, R. F. (2015). 3D printing antagonistic systems of artificial muscle using
projection stereolithography. Bioinspiration & Biomimetics, 10(5), 055003.
Preechaburana, P., & Filippini, D. (2011). Fabrication of monolithic 3D micro-systems. Lab on a Chip, 11(2), 288–295.
S
Saunders, S. (2017, March 28). Swiss Chemical Company Uses 3D Printing for Catalyst R&D, Seeks to Expand North
American Footprint. Retrieved August 21, 2017, from
Schumacher, C., Bickel, B., Rys, J., Marschner, S., Daraio, C., & Gross, M. (2015). Microstructures to control elasticity in
3D printing. ACM Transactions on Graphics (TOG), 34(4), 136.
Skorski, M. R., Esenther, J. M., Ahmed, Z., Miller, A. E., & Hartings, M. R. (2016). The chemical, mechanical, and physical
properties of 3D printed materials composed of TiO2-ABS nanocomposites. Science and Technology of
Advanced Materials, 17(1), 89–97.
Song, Y., Asadi, M., Xie, G., & Rocha, L. A. O. (2015). Constructal wavy-fin channels of a compact heat exchanger with heat
transfer rate maximization and pressure losses minimization. Applied Thermal Engineering, 75(Supplement
C), 24–32.
Stampfl, J., Baudis, S., Heller, C., Liska, R., Neumeister, A., Kling, R., … Spitzbart, M. (2008). Photopolymers with tunable
mechanical properties processed by laser-based high-resolution stereolithography. Journal of Micromechanics
and Microengineering, 18(12), 125014.
T
Tang, M. (2011). Laser Ablation of Metal Substrates for Super-hydrophobic Effect. Journal of Laser
Micro/Nanoengineering, 6(1), 6–9.
274
Thompson, S. M., Aspin, Z. S., Shamsaei, N., Elwany, A., & Bian, L. (2015). Additive manufacturing of heat exchangers: A
case study on a multi-layered Ti–6Al–4V oscillating heat pipe. Additive Manufacturing, 8, 163–174.
Tuckerman, D., & Pease, F. (1983). Microcapiliary Thermal Interface Technology for VLSI Packaging.
U
Uchida, A., Nade, S. M., McCartney, E. R., & Ching, W. (1984). The use of ceramics for bone replacement. A comparative
study of three different porous ceramics. The Journal of Bone and Joint Surgery. British Volume, 66(2), 269–
275.
W
Wang, X.-D., Duan, Y.-Y., Yan, W.-M., & Peng, X.-F. (2008). Effects of flow channel geometry on cell performance for PEM
fuel cells with parallel and interdigitated flow fields. Electrochimica Acta, 53(16), 5334–5343.
Wen, T.-L., Wang, D., Tu, H. ., Chen, M., Lu, Z., Zhang, Z., … Huang, W. (2002). Research on planar SOFC stack. Solid State
Ionics, s 152–153, 399–404.
Withell, A., Diegel, O., Grupp, I., Reay, S., de Beer, D., & Potgieter, J. (2011). Porous ceramic filters through 3D printing. In
Innovative Developments in Virtual and Physical Prototyping (Vols. 1–0, pp. 313–318). CRC Press.
Z
Zein, I., Hutmacher, D. W., Tan, K. C., & Teoh, S. H. (2002). Fused deposition modeling of novel scaffold architectures for
tissue engineering applications. Biomaterials, 23(4), 1169–1185.

Chapter 7 Conclusions and future research lines


277
CONCLUSIONS AND FUTURE RESEARCH LINES
7.1 Conclusions
In accordance with the proposed aims, this PhD Thesis has focused on the development and integration of design strategies which lead to the design-oriented manufacturing of innovative applications across industrial fields linked to energy, transport, robotics and health fields, by means of lithography-based systems, which could promote the industrial and socioeconomic impact of the additive manufacturing technologies based on vat photopolymerization. For that purpose, we go through systematic steps: i) The evaluation of different software resources for design and process modelling; ii) considering and evaluating the prevailing trends in design strategies for additive manufacturing; iii) developing new strategies that promote the generation of eco-efficient parts and iv) providing original concepts of application for the implementation of the assessed approaches. This Thesis provides a whole overview of the DfAM process and encompass the experimental and analytical knowledge in a bottom-up methodology,
Furthermore, as a subsequent consequence of the labor carried out during the development of the Thesis, further steps in the improvement of photopolymeric materials, research of process modelling for vat photopolymerization systems and methodic assessment of eco-impacts in stereolithography, have been developed.
We conclude that the use of DfAM strategies, which are applied following a systematic methodology and evaluating several considerations, can provide remarkable benefits for the straightforward product development of ceramic and polymeric products in the aforementioned industrial sectors. They can lead to optimized products in terms of: mechanical performance and weight reduction, integration of components and functionalities, enhancement of operating performance and environmental impacts.
The novelties which have been obtained through the development of this Thesis can be listed as follows:
� A novel library of porous, lattice and functionally gradient structures that can only be obtained by AM processes has been provided. This approach has helped a European software supplier, DeskArtes Oy., to develop such geometries in their software for AM files preparation (DeskArtes 3Data Expert), in order to generate support structures and to control infill density of designs to be obtained by means of AM technologies.
� A knowledge-based database with information regarding the parameters and guidelines to consider for obtaining feasible designs that can be further implemented by AM technologies, taking the advantage of the process, and pushing to the limits the

278
technologies, for providing the highest detailed precision and complex geometries, avoiding printing jobs as previous trials with the subsequent eco-efficient performance.
� The development of a library of features that can functionalize the AM designs by means of surface texturing, based on three different approaches: 2D image patterning and projection, mathematical approaches and Boolean operations.
� Functionally graded scaffolding structures have been manufactured, using lithography- based ceramic manufacture (Lithoz GmbH) after some designs from the libraries developed in WP2, and constitute nice examples of micro-structures with biomimetic features with potential as tissue engineering scaffolds and in vitro models for studying bone. Among these scaffolding structures, it is also important to cite the first-ever additively manufactured auxetic meta-material, with potential also for the development of active filters and of resonant devices.
� An ad-hoc solution for the design of support structures for vat photopolymerization processes, based on the knowledge-based collected and the models carried out, has been assessed. Comparing the strategy with commercially available software resources which generate such structures and providing fundament data for an eco-efficient analysis of the different approaches, this Thesis has shed light on design methodology for supports and assessment of impacts. The research has shown that by investing time in the design stage the material savings can be up to 80 %.
� Manufacturing of surfaces, bioinspired in the lotus-leaf texture and designed by using a PDL’s process, which exhibit hydrophobic behavior have been successfully achieved by using a L-AMT system and its laser unit, which provides features down to 20 µm via a self-developed methacrylate-based formulation for the purpose. For the team, these surfaces report the larger areas currently obtained by additive manufacturing vat photopolymerization processes, providing of such contact conduct.
� Conceiving, design, and simulation of the first-ever-made energy absorber in silicon nitride for its replicable and reliable additive manufacturing by means of LCM technology using the CeraFab7500 DLP system, providing a design that implements all the stages of the methodology developed.
� Innovative concepts, design and prototypes of heat exchanger and heat pipes for industry real applications, which use the benefits of the freedom in DfAM with complex geometries and distinctive internal structures, have been carried out. In order to test their novel working layout with the digital models developed by finite element analysis, the models were evaluated in laboratory trials under constrained conditions, providing quite optimistic results regarding the influence of design geometry to final performance.
� A design of a solid oxide fuel cell conversion module oriented to its manufacturing by means of vat photopolymerization multi-material systems, which promotes the final performance of the SOFC unit by implementing DfAM strategies in a design that has been simulated by means of Multiphysics modelers. The final 3D model may increase 40% the efficiency, according to the modelling results, comparing to the conventional designs and
279
it integrates the several components of the unit into a unique monolithic part, reducing manufacturing steps and leading to higher power densities.
� A motorbike brake lever has been obtained following a generative design technique, as final case of study linked to showcasing how the combination of topology optimization processes and topography modification strategies lead to eco-efficient and mechanically optimized components, while also overall aesthetics and ergonomic performance are improved. It constitutes an integral example of how the developed design strategies for additive manufacturing can reshape product design and help AMT make a real transformative impact.
� Monolithic micro-reactors with cantilever membranes separating different reaction chambers linked to complex networks of channels have been designed, modeled for evaluating the potential manufacture of cantilever membranes within complex devices and manufactured using conventional laser stereolithography and epoxy resin in a preliminary approach and lithography-based ceramic manufacture with the help of Lithoz GmbH, as final validation.
In addition, this Thesis has put into practice the methodology defined. Such methodology has been schematically summarized and classified as a final diagram in the following page (Figure 7.1) with a top-bottom workflow, in order to facilitate the reader to understand the overview of the presented work and to help further engineers and designers to follow a specific design guideline, that encompass all the stages and considerations needed for obtaining final parts using AM vat photopolymerization systems in an efficient and reliable manner.
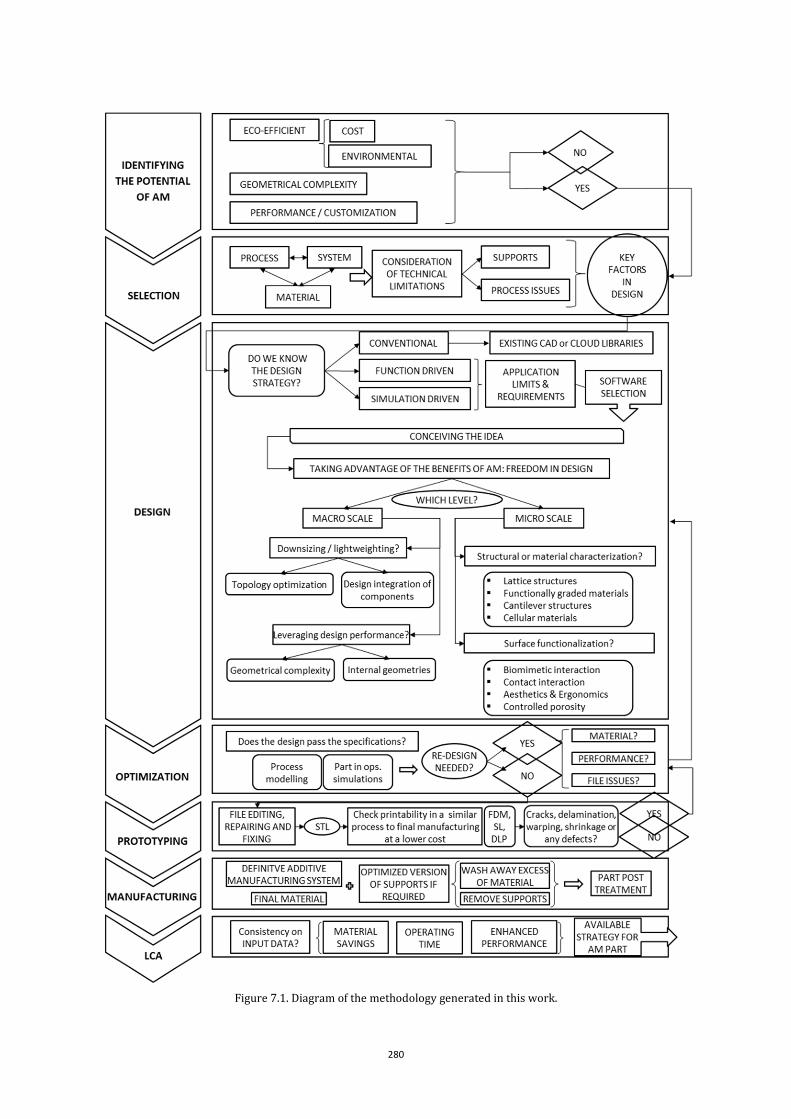
280
Figure 7.1. Diagram of the methodology generated in this work.

281
Figure 7.2. Final explanatory scheme of the added value generated in this Thesis.
7.2 Future research lines
A plan for the future research which could complement the body of this work should be divided in three main lines – a first research line that focuses on the search and compiling of latest trends and strategies in DfAM, thus completing and updating the methodology here presented; a second research line oriented to further development of the applications conceived during the Thesis, progressing the products through their technology readiness level (TRL) until the complete deployment in the final market; and a third research line that covers the promotion of social awareness.
282
Completing the methodology
Given the frenetic and continuous transition of the whole AM sector, the development of software resources, the discovering of novel strategies and the evolution of the designer’s mind, looking for innovative ways to traduce the ideas into virtual objects, the appearance of new suggested solutions to what it is presented in this work is relatively easy to occur. It is for that reason that the `know-how’, the collected data and the guidelines must be updated, improving therefore the applied to the final design of a certain AM product. As it happens with any other technology, the development of specialized software will make the difference and the search for a method that could combine the knowledge generated by the experience and the expected by simulations into a unique database, accessible through a universal cloud, it is the key of the further improvement in DfAM methodology.
Progressing the TRL of the applications presented
The novel areas of application here exposed for additive manufacturing using vat photopolymerization systems can give cause for new research teams, centers, institutes, or even private companies to work on further studies which can mean the creation of commercial products. For that purpose, it is mandatory to invest resources – time and economical efforts – in advanced approaches for developing the necessary trials that can validate the prototypes, moreover of the application of standards and regularization, especially regarding to the medical devices and their corresponding FDA regulations to pass in order to become final products.
In addition, there is the case when the manufacturing technology is still not developed to the point, that the proposed concept requires for being manufactured and the future lines derived from that fall back into the advance of processes and multimaterial systems that can offer the opportunity to carry out the parts.
Education, training and technology transfer
Frequently, the concepts still have not a defined application and the challenging work is to find out an industrial need in which they can be applied. Many times, the main barrier resides in getting professionals from different fields to get in contact, to search for synergies. In that direction, perhaps it is still necessary to educate and translate to the society the benefits of AM, incorporating DfAM to engineering programs or creating international training networks. Therefore, the value chains from the most interesting sectors for AM could take advantage of it, leveraging AM to its plateau of productivity
Finally, there have been several attempts of the academic community to provide a set of design guidelines for AM, covering available AM processes and materials. However, these guidelines typically presented in academic papers are not easily accessible to every designer and engineer. Thus, further research can be carried out for the dissemination of the results of this work. The introduction of the internet of things (IoT), the artificial intelligence or the cloud computing are developing the new industrial revolution which will link the digital manufacturing directly to AM and in its early steps with the possibilities offered within the design stage and the need for an era of mass customization of products.

283
LIST OF CONTRIBUTIONS
Articles in JCR-indexed journals
1. Díaz Lantada, A.; De Blas Romero, A.; Sánchez Isasi, A., Garrido Bellido, D.- “Design and performance assessment of innovative eco-efficient support structures for additive manufacturing by photopolymerization”. Journal of Industrial Ecology, July 2017.
2. Díaz Lantada, A.; De Blas Romero, A.; Schwentenwein, M.; Jelinek, C.; Homa, J.; García-Ruíz, J.P.- “Monolithic 3D labs- & organs-on-chips obtained by lithography-based ceramic manufacture”. International Journal of Advanced Manufacturing Technologies, (accepted for publication), March 2017.
3. De Blas Romero, A.; Pfaffinger, M.; Mitteramskogler, G.; Schwentenwein, M.; Jellinek, C.; Homa, J.; Díaz Lantada, A.; Stampfl, J.- “Lithography-based additive manufacture of ceramic biodevices with design-controlled surface topographies”. International Journal of Advanced Manufacturing Technologies, May (Online first), 1-9, 2016.
4. Díaz Lantada, A.; De Blas Romero, A.; Chacón Tanarro, E.- “Micro-vascular shape-memory polymer actuators obtained by laser stereolithography”. Smart Materials and Structures, 25, 065018, 2016.
5. Díaz Lantada, A.; De Blas Romero, A.; Schwentenwein, M.; Jelinek, C.; Homa, J.- “Lithography-based ceramic manufacture of auxetic structures: Present capabilities and challenges”. Smart Materials and Structures, 25(5), 2016.
Book Chapters:
6. Díaz Lantada, A.; De Blas Romero, A.; Valido Moreno, S.; Curras, D.; Téllez, M.; Schwentenwein, M.; Jelinek, C.; Homa, J.- “Chapter 16 - Tissue engineering scaffolds for bone repair: General aspects”. In: Díaz Lantada, A. “Handbook on Microsystems for Enhanced Control of Cell Behavior”. Springer, 2016
Works presented in congresses and conferences:
7. De Blas Romero, A.; Fernández Zapico, G.; Díaz Lantada, A.- “Simuliación del comportamiento mecánico de los procesos de fotopolimerización de resinas destinadas a la fabricación aditiva mediante estereolitografía láser: Influencia en la calidad de la pieza”. XXI Congreso Nacional de Ingeniería Mecánica, Elche, Spain, November 2016. Award to “Best applied research” among more than 200 studies.
8. Chacón Tanarro, E., De Blas Romero, A.; Díaz Lantada, A.- “Design and additive manufacture of complex geometries for heat transfer management in energy engineering”. Materials Science and Engineering Congress MSE 2016, Darmstadt, 26-29 de September 2016. (Highlight lecture).
284
9. De Blas Romero, A.; Díaz Lantada, A.- “Design strategies of functionally graded materials: towards reliable and eco-sustainable additive manufacturing”. Materials Science and Engineering Congress MSE 2016, Darmstadt, September 2016.
10. Díaz Lantada, A.; De Blas Romero, A.- “Design and additive manufacture of advanced geometries with functional gradients of mechanical properties and controlled surface topographies”. Materials Science and Engineering Congress MSE 2016, Darmstadt, September 2016.
11. Díaz Lantada, A.; Valbuena Niño, E.D.; Fernández Martínez, I.; García-Ruíz, J.P.- “Surface biofunctionalization of rapid prototyped microsystems for cell culture applications”. Materials Science and Engineering Congress MSE 2016, Darmstadt, September 2016.
12. De Blas Romero, A.; Díaz Lantada, A.- “Modeling photopolymerization processes for enhanced part quality”. Industriales Research Meeting, Madrid, April 2016.
13. De Blas Romero, A.; Díaz Lantada, A.- “Design and manufacture of complex geometries towards products with advanced functionalities”. Industriales Research Meeting, Madrid, April 2016.
14. De Blas Romero, A.; Díaz Lantada, A.- “Modeling the mechanical behavior of photo-polymerized epoxy resin during additive manufacture by laser stereolithography: Influence on part quality”. 5th KMM-VIN Industrial Workshop: Multi-Scale and Multi-Physics Materials Modeling for Advanced Industries, Madrid, January 2016.
15. Díaz Lantada, A.; De Blas Romero, A.; Schwentenwein, M.; Jelinek, C.; Homa, J.- “Multi-scale design and manufacturing strategies towards biomimetic cell culture platforms and tissue engineering scaffolds”. Biobone Symposium, Santiago de Compostela, October 2015.
16. De Blas Romero, A.; Díaz Lantada, A.; Schwentenwein, M.; Jelinek, C.; Homa, J.- “Functionally graded tissue engineering scaffolds obtained by lithography-based ceramic manufacture”. Biobone Symposium, Santiago de Compostela, October 2015.

285
LIST OF FIGURES
Chapter 2
Figure 2.1. Hype curves of the main technological transformations in the 21th century for the AM field, 2015 (up) and 2017 (bottom) (Gartner, 2015, 2017). ............................................................................................... 20
Figure 2.2. Casting core desmonstrator for turbine blades by LCM, made in Alumina (Image credit: Lithoz
GmbH). ............................................................................................................................................................................................. 21 Figure 2.3. Picture of the AM part which combines 20 components into a single unit and 25 percent lighter
(Image credit: GE Aviation). ................................................................................................................................................... 21 Figure 2.4. Photo of the Adidas’Futurecraft sneakers with a lattice-based sole made by AM using the DLS
technology (Image credit: Adidas). ..................................................................................................................................... 22
Figure 2.5. Illustration of global revenue-estimation shares by regions, 2015-2025 (Frost & Sullivan, 2016).
............................................................................................................................................................................................................. 24 Figure 2.6. Primary AM global market revenues divided into markets: services, production, materials and
systems (US$ in Millions) (Shafter et al., 2014). ............................................................................................................. 25
Figure 2.7. Use of the different existing AM technologies in 2016 and 2017 (adapted from (Sculpteo, 2017)).
............................................................................................................................................................................................................. 25 Figure 2.8. Charts a) representing the installed equipment for the survey respondents’ operations in 2016
and b) the 2016-unit sales market share among manufactures of industrial AM systems (Wohlers, 2017). ............................................................................................................................................................................................... 26
Figure 2.9. Industries that have served services from AM the past 13 years, in percentage of sales by industry (extracted from the Wohlers’ survey, 2017) ............................................................................................... 27
Figure 2.10.Comparison of AM processes to conventional: a) Cost versus complexity for parts with
identical bounding box; b) cost versus quantity for an exemplary polymer component, comparing injection molding (IM), fused filament fabrication (FFF), and selective laser sintering (SLS) (extracted
and adapted from (Quinlan et al., 2017). ............................................................................................................................ 30
Figure 2.11. Digital and physical workflow of a product obtained by using AM processes. (adapted from
(Thompson et al., 2016). ............................................................................................................................................................. 32
Figure 2.12. Three main design strategies for DfAM used for designer when starting a new idea (De Blas
Romero, 2017). .............................................................................................................................................................................. 33
Figure 2.13. Scheme of the benefits that AM offer classifying them in both part and microscale levels. ....... 35 Figure 2.14. The structure for AM standard development (Feenstra et al., 2014). .................................................... 38
Chapter 3
Figure 3.1. Scheme of AM stages (extracted from: Gardan, 2016). ................................................................................... 48
Figure 3.2. Example of STL approximation (black) for a torus geometry from a CAD representation (red), formed by STL triangles of edges a, b, c and vertex ABC. Normal file structure for an ASCII format.
(Adapted from: (Gardan, 2016) and torus example under CC license by BY-SA). ........................................... 49
Figure 3.3. Illustration for the different exposure sources: a) Top-bottom and b) bottom-top (images
extracted from (Waheed et al., 2016)). ............................................................................................................................... 50
Figure 3.4. Scheme summarizing the manufacturing process based on the layer-upon-layer approach. ..... 50 Figure 3.5. Illustration of the operating principle of the ceramic DLP-system (image courtesy of TU Wien
Institute of Material Science and Technology). .................................................................................................................. 51
Figure 3.6. Schematic representation of the chemical reaction of free radical photopolymerization (extracted from: Stampfl&Liska, 2011). ........................................................................................................................... 52
Figure 3.7. Steps of thermal treatment from the ceramic green body to the sintered dense ceramic (Image courtesy of Lithoz GmbH). ...................................................................................................................................................... 52

286
Figure 3.8. Images of the SLATM 3500 system, detail of building platform (right) from LDP-UPM’s machine. ............................................................................................................................................................................................................. 53
Figure 3.9. Images of Form1+ SL desktop printer: Building platform and vat in tilted position (right). ....... 54 Figure 3.10. Photography of the L-AMT BP8 (left) and illustrative scheme of its components (right).
(Images courtesy of TU Wien AMT team). ....................................................................................................................... 55 Figure 3.11. Photographs of the CeraFab7500. Frame (left), building platform (center) and vat with the
wiped blade (right). (Images courtesy of Lithoz GmbH). .......................................................................................... 56 Figure 3.12. Components description of Prusa i3 Hephestos from BQ ......................................................................... 57 Figure 3.13. Example of the parameters involved in the laser scanning (extracted from RTC®5 PCI Board
installation and operation guide). ....................................................................................................................................... 65 Figure 3.14. Detail of a single layer-exposure micrograph of circular sections of different diameters (left
image) and single-laser hatching-strand (right) of 20 and 100 µm by SL-system of BP8 using a 20% laser-power. ................................................................................................................................................................................... 67
Figure 3.15. 3D CAD and layout of the test sample used for calibrating the parameters. ..................................... 68 Figure 3.16. Pictures of the evolution carried out by adjusting the parameters. ...................................................... 68 Figure 3.17. Micrographs of a textured part with cilindric features of φ150 µm, before (left) and after
cleaning (right). Procedure carried for the adequate wash out of exceed resin from the textured
surface (up). .................................................................................................................................................................................. 69 Figure 3.18. Micrographs of the test sample printed using BP8 laser system and the material MSF07,
showing the accurate measure for the features, baseplate, length....................................................................... 70 Figure 3.19. Pictures of the samples printed with different surface textures using BP8 and material MSF01.
............................................................................................................................................................................................................. 71 Figure 3.20. Comparison of precision for a hexagon-like texture, difference of detail level for the
protuberance case (left) and the cavity one (right)..................................................................................................... 71 Figure 3.21. Micrographs showing the measured details of cones (up), sphere of different sizes (middle)
and holes (bottom). .................................................................................................................................................................... 72 Figure 3.22. CAD design of CP01 model (up) and CP02 (bottom). .................................................................................. 74 Figure 3.23. CP01 part printed using SLA3500 and Accura 60®. .................................................................................... 75 Figure 3.24. CP01 part printed using SLA3500 and Accura 60®. ..................................................................................... 75 Figure 3.25. Pictures of the test sample with different section approaches. .............................................................. 76 Figure 3.26. Illustration of: a) the scanning for the referred section and b) overlapping of laser and
geometry. ........................................................................................................................................................................................ 77 Figure 3.27. Micrographs of the inner channels for the closed sample fabricated using SLA3500 and
Accura®60, profile (upper images) and top face (bottom images). .................................................................... 78 Figure 3.28. Picture of both samples after manufacturing. ................................................................................................. 78 Figure 3.29. Micrographs of the inner channels for the wavy sample fabricated using SLA3500 and
Accura®60. .................................................................................................................................................................................... 79 Figure 3.30. Temperature profile for debinding and sintering of the hydroxyapatite green bodies ............... 80
Chapter 4
Figure 4.1. Schematic processes for designing devices with lattice and porous structures (adapted from:
(Diaz Lantada, A. 2016). .............................................................................................................................................................. 87
Figure 4.2. Three-dimensional lattice structure obtained using an additive design procedure. ....................... 87 Figure 4.3. Three-dimensional porous structures obtained by combining additive and subtractive design
procedures. .................................................................................................................................................................................... 88 Figure 4.4. CAD library of porous and lattice structures with potential use mechanical metamaterials in a
wide set of sectors including aerospace, transport, energy, health, inner desing and architecture, among other areas discussed. ............................................................................................................................................... 88

287
Figure 4.5. Rapid prototypes of porous and lattice structures obtained in epoxy resin by the reference additive manufacturing process of laser stereolithography Form1+ (Images courtesy of PDL). ........... 89
Figure 4.6. Influence of cell size and bar thickness on the porosity of lattice structures. ..................................... 91 Figure 4.7. Examples of three-dimensional structures, with controlled distributions of density and of
mechanical, thermal and fluidic properties (extracted from: Lantada et al. 2016) .......................................... 93
Figure 4.8. Different computer-aided design approaches for the design of tissue engineering scaffolds with
functional gradients of mechanical properties (extracted from: A Díaz Lantada, De Blas Romero, Valido
Moreno, Curras, & Tellez, 2016). ............................................................................................................................................. 93
Figure 4.9. Computer-aided designs and rapid prototypes obtained by laser stereolithography of
biomimetic functionally graded lat-tices. ......................................................................................................................... 95 Figure 4.10. Computer-aided designs and rapid prototypes obtained by laser stereolithography of
functionally graded structures and of a biomimetic tree-like or vascular structures (A. Díaz Lantada et
al., 2016, Chapter 16). ................................................................................................................................................................. 95
Figure 4.11. Epoxy (transparent-white) and titanium (grey) functionally graded “knowledge-based” lattice
structures. The titanium prototype is obtained by selective laser sintering of titanium powder (i-materialise) as example of a high-performance engineering material usable with additive
manufacturing approaches. .................................................................................................................................................... 96 Figure 4.12. Functionally graded structures printed by the SLA BP8 machine with a non comercial and
self-developed material formulation for a specific purpose of high geometry definition. ......................... 96 Figure 4.13. Funcitonaly graded porous designs; a) mesh based lattice sandwich; b) pattern-based
sandwich with different unit cell size; c) mesh-based cube with gradient from inner to outer part; d) pattern-based cube. ................................................................................................................................................................... 98
Figure 4.14. Functionally graded porous prototypes manufactured using the a) Formlabs castable resin and the Form 1+ low cost laser stereolithography machine and b) using the Accura® 60 epoxy resin and the SLA-3500 industrial stereolithography. .......................................................................................................... 99
Figure 4.15. Three dimensional auxetic structure selected for present study. ....................................................... 102 Figure 4.16. Some images from the mask-layers at various position during the DLP printing ....................... 102 Figure 4.17. a) Green part or master model just after digital light processing of the slurry. b) Final result
after sintering: Auxetic ceramic structure with micrometric details obtained by means of lithography-based ceramic manufacture (LCM). c) Detail of layers and unit cell. ...................................... 104
Figure 4.18. Detailed images of the stress fields obtained under loading for four different lattice
geometries (FEM simulations performed with NX-8.5, Siemens PLM Solutions). ...................................... 107 Figure 4.19. Influence of cell size and bar thickness on scaffolds’ elasticity. ........................................................... 107 Figure 4.20. Finite-element method simulation results: a) Displacements results for verification of the
Poisson’s ratio. Represented in color-maps corresponding to displacements along z, x and y axes to highlight the symmetry present in the XY plane. b) Stresses results corresponding to increasing
levels of applied strain, so as to analyze the attainable degree of deformation before material’s failure. ........................................................................................................................................................................................... 109
Figure 4.21. Example of the 3D CAD design of micro-textured materials with micro-wells and micro-pillars
for design-defined surface properties. Multi-chamber micro-fluidic system with design-controlled surfaces. ........................................................................................................................................................................................ 112
Figure 4.22. Example of the math-based design of a biomimetic material with self-cleaning potentials and
impact of using multi-scale design approaches. Microfluidic devices inspired on the possible control of surface-hydrophobicity by incorporating desired material (image courtesy of the PDL team) ..... 114
Figure 4.23. Examples of black-white and grayscale images, which can be used as masks for traditional
lithographic processes or applied to CAD models of materials and devices for texturing their surfaces. .......................................................................................................................................................................................................... 115
Figure 4.24. Examples of three-dimensional patterns generated from 2D images: a) 3-matic by Materialise
and b) Cura 3D Printing Slicing software ...................................................................................................................... 116
288
Figure 4.25. Biomimetic micro-textures applied to complex geometries and obtained by additive photo-polymerization (Blueprinter 8 developed by TU-Wien within ToMaX). ......................................................... 117
Figure 4.26. Texture applied on 3D surface based on a patterned structure. 3-matic by Materialise .......... 118 Figure 4.27 Surface texturing based on random patterning obtained from a graded mesh of the surface 118 Figure 4.28. Photopolymerization process for a photoreactive base material (left) a representative layout
of the photopolymerization of a layer using a laser beam for the stereolithography process (right): ‘free surface’. .............................................................................................................................................................................. 121
Figure 4.29. Example of FEM applied to a part to be manufactured by SLA and critical area. Image source:
(Stava et al. 2012) .................................................................................................................................................................... 122 Figure 4.30. a) Typically called ‘Curling’ effect of a cantilever beam due to creep through ‘free surface’
polymerization processes; b) calibration test piece and deformation observed. ....................................... 123 Figure 4.31. Dependency of the time reflected in the elasticity of the material .................................................... 125 Figure 4.32. Layout of the procedure used through finite element simulation. ..................................................... 125 Figure 4.33. a) Representation of the geometric model to be studied: interspersed displacements imposed
on the layers; b) symmetric meshed model; c) deformation of the model through the action of the loads and imposed constraints. ......................................................................................................................................... 126
Figure 4.34. a) Meshed geometry with tetrahedral elements; b) maximum strains in the geometry
obtained with the Von Mises criteria; c) detail of the CP02 test piece and the breaking of the elements at their points of support. ..................................................................................................................................................... 128
Figure 4.35. Graph of the maximum displacement in absolute values on the Z axis, obtained from the
variation in the linear creep parameters and Poisson’s ratio. ............................................................................. 129 Figure 4.36. Graphs of the values found after the finite element simulation for the values of maximum
strain following the Von Mises criterion in the geometry studied. ................................................................... 129 Figure 4.37. Initial epoxy resin modulus as a function of time after the sweep of the laser beam. Trend line
obtained for the range of values of influence in the study. ................................................................................... 129 Figure 4.38.Representative design of an overhanging surface obtained by SLA ‘bottom-up’ case of study for
the incorporation of computational modelling in AM design .............................................................................. 130 Figure 4.39. Default supports: a) example of supports structures generated with the help of 3D Data
Experte from Deskartes. b) detail of teeth contacts between support block and part. ............................ 131 Figure 4.40. ‘Ad-hoc’ support structures defined for the case of study reducing material waste; a) Supports
in yellow attached to the backlayer (red) and part (blue); b) contact points distribution on the
cantilever surface; c) contact point cross section for the supports of the part. ........................................... 132 Figure 4.41. Screenshots of the slicing by PreForm showing the time lapses referred: a) Last layer of
supports section; b) first layer of cantilever section right after the supports and c) end result of the
printed part holding attached to the platform. ........................................................................................................... 132 Figure 4.42. Images of the mesh applied to the part for its study by FEM: a) Assembly of part, supports and
backplate; b) detail of the mesh elements at the contact points transition and c) backlayer fixed
constrain to the top face. ...................................................................................................................................................... 133 Figure 4.43. Von Mises stress (MPa) at the contact point between the backplate and the cantilever block.
.......................................................................................................................................................................................................... 134 Figure 4.44. a) Images of the inner lattice structure integrated to the 'L' object, b) the detail of the
functionally graded thickness of the truss and c) Von Mises stress in the contact points. ..................... 135 Figure 4.45. Pictures of the printing process for the case of study standing on the platform ......................... 136 Figure 4.46. Pictures of the printed case of study in a non-commercial material formulation: a) Supports
holding the cantilever section; b) removed supports and backlayer; c) both examples the original and
the versioned one including the draining hole; d) supports being removed easily. .................................. 137
289
Chapter 5
Figure 5.1. Schematic representation of methodology for systematic analysis of manufacturing unit process based on the life cycle inventory (Kellens et al. 2012). ......................................................................... 147
Figure 5.2. Scheme of the overview for the available literature of environmental analyses for different AM
techniques (Karel Kellens et al. 2017). ........................................................................................................................... 148 Figure 5.3. Examples of part integration for a monolithic product. a) Biomedical device and b) Heat sink
concept.......................................................................................................................................................................................... 150 Figure 5.4. Example of infill of a cubic part by using a uniform pattern of a random unit cell with a final
porosity of a 45%. .................................................................................................................................................................... 151 Figure 5.5. Screenshots of Cura 2.5.0 slicer for the different cases of infill density 100 %, 75 %, 50 % and
25 % (adaptation from the STL design by lordkylo licensed under creative commons: https://www.thingiverse.com/thing:162425) .......................................................................................................... 152
Figure 5.6. Fictional character with complex geometry and unstable manufacturing position and ad hoc
support generation (by Deskartes 3Data Expert 10.3) for promoting manufacturability. (Sculpt by Geoffro licensed under creative commons: https://www.thingiverse.com/thing:385213). ................ 153
Figure 5.7. Obtained hollow leg with a dodecahedron pattern-based lattice structure in its inner section
for minimizing weight and helping to avoid problems during manufacturing process. .......................... 153 Figure 5.8. Images of Von Misses’ stress for the static case of optimized part hanging on the building
platform. ....................................................................................................................................................................................... 154 Figure 5.9. Screenshot from Preform® of the sliced figure at the targeted cross section of the left leg. .... 154 Figure 5.10. Example of face and point overhangs in a bottom-up proccess. .......................................................... 155
Figure 5.11. Different examples of conventional support geometries in AM processes (Krol et al. 2012). .. 156
Figure 5.12. Screenshot of print preparation in Deskartes® 3Data Expert of support structures for a pump system (right) and manufactured part (by SL-system Form1+) hanging on the building platform... 156
Figure 5.13. Examples of by default support structures (left) and user’s settings support structures (right).
.......................................................................................................................................................................................................... 157 Figure 5.14. Examples of mathematical ‘’Schwartz Diamond’’ based on minimal periodic surface unit cells
to illustrate this example by FDM (adapted from Strano et. al 2013). ............................................................. 157 Figure 5.15. Example of tree-like supports used for the pump example (left) and printed part in SL-
Form1+ system using the strategy. .................................................................................................................................. 158 Figure 5.16. Illustrative scheme of support volume (extracted from Ezair, Massarwi and Elber 2015). ........ 159
Figure 5.17. Different orientations for the pump system for φx: 0°, 20° and 70° and its respective
generated supports. ................................................................................................................................................................ 160 Figure 5.18. Example of envelope solid with boundary conditions and loads, discretization in cubic voids
and further refinement of elements by means of density distribytion and minimum compliance
(adapted from Bertsch et al. 2008). ................................................................................................................................. 161 Figure 5.19. Example of envelope (a), discretization (b) and lattice structure (c) (extracted from Terriault
and Brailovski 2017). ................................................................................................................................................................. 161
Figure 5.20. 3D CAD model of the motorbike brake system (left) and the lever taken for optimization (right) (model with C.C license by Victor Bonavarte 6779, website:
https://grabcad.com/library/right-lever-for-harley-motorcycle-1) ............................................................... 163 Figure 5.21. Extract from ISO 8709 (2010), ‘Mopeds-Brake and brake system-test and measurement
methods. ....................................................................................................................................................................................... 163 Figure 5.22. Process of preparation for the topology optimization of the brake lever, usign Solid Thinking
INSPIRE©. .................................................................................................................................................................................... 164 Figure 5.23. Tension/results for the loading case of maximum force......................................................................... 164 Figure 5.24. Result of the topology optimization with a 40% of mass from the original design. ................... 165 Figure 5.25. STL surface mesh generated when exporting the file in INSPIRE®. ................................................. 165

290
Figure 5.26. Optimized design space together with the tail of the lever and the fulcrum section (in pink color). ............................................................................................................................................................................................ 166
Figure 5.27. Recreating the geometry by means of Polynurbs© (module from INSPIRE) method (upper
image) and final bionic redesign (bottom). .................................................................................................................. 167 Figure 5.28.. Combined strategy of solid, topology optimized and latticed sections for the brake lever and
detail of the functional thickness gradient applied to the lattices of the lever’s tail. ................................ 167 Figure 5.29. Render of the final optimized design for the brake lever and detail of the texture applied on
the forward surface. ................................................................................................................................................................ 168 Figure 5.30. Photographs of the lever after its printing, weight of the supports (center) ant the part
respectively (right).................................................................................................................................................................. 169 Figure 5.31. Manufactured part hanging down in the building platform of the Form1+ printer (upper
right), detail of lattice elements of 1.2 mm (upper left), brake lever in Clear02 resin (bottom) and detail of lever’s tail latticed elements of 0.5 mm. ...................................................................................................... 169
Figure 5.32. Examples of different fractal or tree-like support structures for a lintel structure. ................... 170 Figure 5.33. Bioinspired support structures for the additive manufacture of a semi-sphere. a) Parametric
tree-like structure with potential as mechanically optimized support geometry. b) Semi-sphere supported by the mentioned tree-like structure of the upper image. .............................................................. 171
Figure 5.34. Systematic generation of supports for the additive manufacture of a complex surface. The supporting lines are generated so as to avoid deviations from the vertical larger than 30º and following bioinspired processes leading to tree-like structures. ....................................................................... 173
Figure 5.35. Systematic generation of supports for the additive manufacture of a complex surface and final optimization by elimination of unnecessary and coincident support. ............................................................. 174
Figure 5.36. a) Different AM prototypes (SLA-3500 machine), showing traditional lattice supporting
structures and mesh-like supports, with the optimized bioinspired support structures. b) Branched support structures created using Preform software (Formlabs). ...................................................................... 175
Figure 5.37. a) Percentage of material savings using the proposed supports structures, when compared with those obtained using commercial software resources. b) Percentage of CO2 emissions savings using the proposed supports structures, when compared with commercial resources. c) Economic
impact of part manufacturing. ............................................................................................................................................ 180 Figure 5.38. CAD model of the casting mold for a medical device (lab-on-a-chip with interconnected micro-
chambers for studying cell-to-cell interactions). ....................................................................................................... 183 Figure 5.39. Gel-casting molds of ceramic made in a castable photo-polymeric resin with Formlabs
Form1+ machine. a) 3D printed molds with a ceramic slurry; b) Porous design of the same mold by inclusion of latticed structures. ......................................................................................................................................... 184
Figure 5.40. Laser trajectories for the base plate of the mold (left), latticed infill (center) and its detail. . 185 Figure 5.41. Printed molds after a first washing of the resin on the building platform. ..................................... 186 Figure 5.42. Layout of measurements carried out to the molds with 75% density for the infill. ................... 186 Figure 5.43. Micrographs of the back face of the mold A (left), detail (center) and defects (right) in mold B
because of the support structures (the bar scales are 400, 400 and 500 µm respectively). .................. 187 Figure 5.44. Casting of HA slurry in the mold (left) and 20x micrography of the green body surface (right).
.......................................................................................................................................................................................................... 187 Figure 5.45. Final sintered HA part at 1100° C made by the gel-casting technique and the sacrificial mold
with a 75% infill (left) and fracture micrograph 10X of the same (right). ..................................................... 188 Figure 5.46. 3D CAD model of the alternative design for the efficient version of the mold .............................. 188 Figure 5.47. Pictures of the two suggested variations for the efficient gel-casting molds. ................................ 189 Figure 5.48. Casting the HA slurry into both molds. ........................................................................................................... 189 Figure 5.49. Final sintered HA part at 1100° C made by the gelcasting technique and the sacrificial mold
with a 50 % of material (left) and fracture micrograph 10X of the same (right). ....................................... 190

291
Figure 5.50. Histogram of grain size for the fracture micrograph of the sintered HA part in the 50 % mold. .......................................................................................................................................................................................................... 190
Chapter 6
Figure 6.1. Functionally graded “knowledge-based” lattice structures manufactured in ceramic material
(Al2O3). Green parts just after photopolymerization (courtesy of Lithoz GmbH) of a slurry with high content of ceramic power (left) and final sintered and compact ceramic parts (center and right images). ........................................................................................................................................................................................ 198
Figure 6.2. Functionally graded lattice structures with design based on convergent trusses. Comparison of precision between LCM and epoxy SLA manufacturing (left); Sintered Alumina parts and measurements (center and right). Porous control examples of dental implants made in zirconia by
DLP photopolymerization. ................................................................................................................................................... 198 Figure 6.3. Explanation of the choosen model for the demonstrator. Clasification of vertebrae and its
segments distribution on the spinal cord (left) (source: freepik.com under C.C rights); Cross section
of a lumbar vertebra and main regions (right) ( source: www.healthpages.org, author: Cindy Schmidler). .................................................................................................................................................................................. 199
Figure 6.4. Design steps for obtaining a porous structure that represents the vertebral body of a lumbar
vertebra. a) Definition of a closed inner surface. b) Remeshing to larger elements in order to use the mesh elements as porous structure. c) Gradient of thickness applied to the structure, varying from the inner to the outer sections. .......................................................................................................................................... 199
Figure 6.5. Cross sectional view of the final design including the inner structure (top left); Model slicing with preform software showing the contours and infill of porous and main body (bottom left);
Manufactured part in Clear 01 resin and detail of the draining hole................................................................ 201 Figure 6.6. Different examples of applied porosity on prosthetics, human-ear ossicles (left) and right
clavicle (right), for different methodologies: By means of Boolean operations (left) and a trabecular
structure using lattices based on mesh element (right). ........................................................................................ 201 Figure 6.7. Semi-sphere with spatially variant lattice a) design and prototypes, in b) epoxide material, c)
Al2O3 material (Lithaloz HP500) and d) middle cross section of the sponge................................................ 202 Figure 6.8. Titanium coating by DC Magetron Sputtering applied to the catalytic sponge design: a) picture
of the sponge with the Ti coating; b) micrograph of the dome on top of the sphere; c) node detail of the external trusses. ................................................................................................................................................................ 203
Figure 6.9. Computer-aided designs of micro-textured micro-systems. Micro-textured cell culture platforms with controlled surface topographies dimension 2.1 (left) and dimension 2.9 (center). Biodevice for studying cell motility along different micro-textured channels (right) (De Blas Romero
et al., 2016). ................................................................................................................................................................................ 205 Figure 6.10. Design adaptation for enhanced manufacture: Elimination of mass from outer walls to avoid
over-exposure and minimize material contraction (left). Rendered and shaded image for improved
visualization of the micro-textured channels (right)(De Blas Romero et al., 2016). .................................... 205
Figure 6.11. Sintered parts of micro-textured platforms (dim 2.9) and magnified image of the platform
with higher micro-texture for appreciating the spiky feature (De Blas Romero et al., 2016). ................. 206
Figure 6.12. 3D representation of surface topographies for the different cell culture platforms and micrographs: dimension 2.1 (up) and dimension 2.9 (bottom). Images taken with Olympus DSX-CB
tool (De Blas Romero et al., 2016). ...................................................................................................................................... 207
Figure 6.13. Photography of the sintered cell platforms (left) and detail of micro-channels: batch and
channel-wide, measured by Olympus software (center); Central section of the biodevice (right) (De
Blas Romero et al., 2016). ....................................................................................................................................................... 208
Figure 6.14. Profile measurement for each channel with different fractal dimension from up to bottom: 0/2.9/2.5/2.1 (De Blas Romero et al., 2016). .............................................................................................................. 208

292
Figure 6.15. Medical microsystem for studying cell-material interactions with different micro-textured chambers. .................................................................................................................................................................................... 209
Figure 6.16. Lotus-like samples in different scales on the building platform of BP8 machine inmediatly
after the job is fisnished (left); original design LT2, details of pitch distance and cross section of the last layer (right). ....................................................................................................................................................................... 211
Figure 6.17. SEM image of a real lotus leaf (a) (image copyright: Wilhelm Barthlott); SEM sequence of images of the LT4 sample, zooming in to one feature (b,c) (courtesy of the TU Wien); level of minimum detail achieved by using BP8 (d). ................................................................................................................ 212
Figure 6.18. Images of substrates LT1, LT2, LT3 and LT5 (from left to right) with a 2mm droplet posed atop demonstrating different behavior for the scaled features. ......................................................................... 214
Figure 6.19. Micrographs of test samples including the ‘lotus leaf’-like texture. From up to bottom samples:
LT4, LT2 and LT1. .................................................................................................................................................................... 213 Figure 6.20. Texturing of inner surfaces on ball bearings for improved tribological response. The
forthcoming manufacture of test probes and prototypes will allow us to test the impact of the special
surfaces. ........................................................................................................................................................................................ 216 Figure 6.21. SLA-manufactured by SLA3500 in Somos® epoxide-based resin ball bearing with a surface
texture of wells in the externenal and internal tracks; details of later in the bearing ball (left) and
surface texture microgrphy (upper right), with the 3D representation (bottom right). ......................... 217 Figure 6.22. Roller for the micro pitting test machine (upper images)(extracted from: www.pcs-
instruments.com) and the corresponding prototype SLA-manufactured in epoxide-based material
including the controlled textures on the contacting surface (bottom); micrography of the final dimension for the sphere (right). ..................................................................................................................................... 217
Figure 6.23. Optical microscopy of Velcro connectors, female (left) and male (right). ....................................... 218 Figure 6.24. Photographs of the Velcro (male and female connectors) distributed in equal patterning on
rectangular surfaces. .............................................................................................................................................................. 218 Figure 6.25. Test probes with biomimetic textures. Ti-coated (left) and uncoated (right) prototypes.
Acknowledgement: Coating process tested by Nano4Energy (www.nano4energy.eu/), UPM spin-off. .......................................................................................................................................................................................................... 220
Figure 6.26. Micrographs of two different coatings applied to the already existing surface textures of prototypes obtained by laser stereolithography: a) 3D geometry, b) flat geometry. Acknowledgement: Coating process tested by Nano4Energy, UPM spin-off. ............................................... 220
Figure 6.27. Examples of application for enhanced grip and mass customizatio’ texture projection on the surface and 3D textures: Steering wheel with leather-like texture incorporated to the grip (upper left); customization of textures for a computer mouse (upper right) and phone case including an
elephant with detailed texture. The designs are obtained using 3-matic 11.0 from Materialise®. (iPhone® 7 Case www.thingiverse.com/thing:2190155) by mcnultynoah is licensed under the Creative Commons). ................................................................................................................................................................ 221
Figure 6.28. BIC®-like pen case manufactured with ‘BP8’ machine, which includes customized textured for gripping and the external tube is made of lattice structures. .............................................................................. 221
Figure 6.29. Concepts of soft robotics actuators. .................................................................................................................. 223 Figure 6.30. Balloon concept: Pressurized actuator deformation (upper images); results of the performed
FEM simulations, Von Mises’ stress (bottom left) and maximum absolute displacement (bottom
right). ............................................................................................................................................................................................. 223 Figure 6.31. a) Design evolution (simulation driven) from the concept state to the re-design for
manufacturability, including the ‘ad-hoc’ supports that improve the performance: b) Conceptual
explanation of working principle. ..................................................................................................................................... 224 Figure 6.32. Finite element analysis for design optimization. Absolut displacement of the elements (left)
and the Von Misses strain of the actuator pressurized to ΔP= 500 kPa (right). .......................................... 225

293
Figure 6.33. Validation of working principle by means of additively manufactured prototypes, using pneumatic system with a regulation valve to limit the maximum ΔP to 500 kPa. Initial state of the actuator (left) and pressurized actuator (right). ....................................................................................................... 226
Figure 6.34. Scheme of working principles for a SOFC (Muruzabal M. & de Blas A., 2017). ................................ 227
Figure 6.35. Structure scheme of planar SOFC-conversion mudule stack (left) (Wen et al., 2002) and picture
of a 5 kW SOFC stack (right) [source: Research Centre Jülich] ........................................................................... 228 Figure 6.36. Scheme of the workflow followed during the consecution of the study to obtain a final design.
.......................................................................................................................................................................................................... 229 Figure 6.37. Reference model of SOFC-planar unit cell. .................................................................................................... 230 Figure 6.38. Case of variation of hydrogen and oxygen mole fraction along the flow channels for the
reference unit cell of SOFC. .................................................................................................................................................. 231 Figure 6.39. Modification of aspect ratio for the cross section of both channels (left) and dimension (right).
.......................................................................................................................................................................................................... 231 Figure 6.40. Rippling effect applied on active surface of the flow channels in the three main directions. 231 Figure 6.41. Inclusion of flow channels inside the electrodes maximizing the active area in contact with the
gas (right) and avoiding the interconnector material, in comparison to the reference model (left). 232 Figure 6.42. Schematic of different cross section shape. .................................................................................................. 232 Figure 6.43. Conventional stack of unit cells, which are physically separated and sealed (left). Introduction
of an extra electrolyte in between two consecutives unit cells to leverage the flow distribution (left).
.......................................................................................................................................................................................................... 232 Figure 6.44. Results of current distributions at operation voltage 0.5 V on the electrodes after the CFD-
based simulations for: a) Channels included into the electrodes; b) different cross section shape; c)
parallel disposition of the channels; d) rippling shape; e) intermediate unit-shared cell. ..................... 233 Figure 6.45. Optimized design of conversion modulo for a planar SOFC. ................................................................. 234 Figure 6.46. Hydrogen mole fraction along the anode channel for the reference model in blue and the
optimized one (green). .......................................................................................................................................................... 235 Figure 6.47. Scheme of the proposed design for the SOFC. .............................................................................................. 236 Figure 6.48. Plan of the adapted design. ................................................................................................................................... 236 Figure 6.49. Part placing on the building platform and detail of middle-cross section. ..................................... 237 Figure 6.50. Green part after printing and washing process. .......................................................................................... 238 Figure 6.51. Final prototype after UV-post curing treatment and final disposition with the M3 threads. . 238 Figure 6.52. Layout (center) of the measured control-points of the first (left) and last layer (right), labeled
by numbers 1-4 and letters a-g. ......................................................................................................................................... 238 Figure 6.53. Schematic CAD design of a biomedical microsystem for cell co-culture. The sectioned view
(left) help to show the inner features of the microsystem object of present study. .................................. 241 Figure 6.54. Picture of the initial concept of the design (right) and micrograph of the cantilever membrane
in the section near the channels. ....................................................................................................................................... 242 Figure 6.55. Schematic representation designs incorporating different networks of supports under the
cantilever membrane for promoting manufacture viability. Yellow points mark the position of
supports in different zones of the membrane. The real supports have a 200 µm diameter and are not appreciated from above the membrane, so in this representation we scaled them. ................................. 243
Figure 6.56. Selected strategy for the layout of the supports. The who consecutive cross sections of
supports and first cantilever layer. .................................................................................................................................. 243 Figure 6.57. a) Preliminary prototyping examples at scales 1:1 and 2:1 showing deflection (left) and
collapse (right) of the cantilever membrane as designed initially; b) Improved results: Final
monolithic ceramic microsystem after adequate redesign. .................................................................................. 245 Figure 6.58. Results from hMSCs interacting within the monolithic ceramic microsystem. a) Overall
description of the microsystem and magnified zones. b) Cells within the inlet well. c), d) Cells growing and crawling along the upper and lower channels. e) Cells reaching a pore of the cantilever

294
membrane. Fluorescent dyes: DAPI (blue for the nuclei), α-Tubulin- Ph488 (green for the cytoskeleton). ........................................................................................................................................................................... 246
Figure 6.59. Examples of geometries generated by graph elements and illustration of distribution for
Young’s modulus in according to the porosity of the element. ........................................................................... 248 Figure 6.60. Renders of the five elastic cases of study selected for its study, from left to right: ESPD_v1, v2,
v5, v6, and v7. ............................................................................................................................................................................ 250 Figure 6.61. Images of the STL surface exporting (upper left) to FEM software (upper right) and post
volumetric addaptative meshing of the model ESPD_v2. Detail of mesh elements at the union of
microstructure to the plate (bottom). ............................................................................................................................ 250 Figure 6.62. Result of FEA-based simulation (Von Mises stress in MPa) for the compression test modeling
carried out to the specimen ESPD_v2 and detail of critical area at one node. .............................................. 252 Figure 6.63. Von Mises stress for the specimens ESPDv_7 (left), ESPDv_6 (middle) under loading
conditions and yield stress on specimen ESPDv_6 higher than the Tensile strength of Syalon 101 material. ....................................................................................................................................................................................... 252
Figure 6.64. Graphic comparing elasticity of the customer specimen and ESPDv_6 ............................................ 252 Figure 6.65. Prototypes obtained by SLA Form1+ system in acrylate-based Clear 01 material. .................... 253 Figure 6.66. Improvements applied to the specimen ESPDv_6, smoothing the intersections at the nodes
and the transition to the cylindrical plates. .................................................................................................................. 254 Figure 6.67. Sintered item ESPDv_6. Picture comparing dimensions with a pencil (left) and optical
micrographs showing the complex structured manufactured (right), in detail (bottom). ..................... 254 Figure 6.68. Different conceptual designs of micro heat exchangers incorporating ad hoc support
structures for single-step and single-part manufacture by additive photo-polymerization. “Shower” heat exchanger (upper images) and “cage” heat exchanger (lower images). ............................................... 258
Figure 6.69. “Shower” heat exchanger optimized design. Modification of supports’ position and geometry for additive manufacture, incorporation of inner fins for improved flow and modified flow inlets
(left). “Cage” modification of supports’ position and geometry for additive manufacture, incorporation of inner fins for improved flow and modified flow inlets (right). ........................................ 260
Figure 6.70. CFD simulation results aimed at design optimization and at modeling the performance of the
first micro heat exchanger concept designed for additive photo-polymerization. .................................... 261 Figure 6.71. CFD simulation results aimed at design optimization and at modeling the performance of the
second micro heat exchanger concept designed for additive photo-polymerization. Prototyping and
testing results ............................................................................................................................................................................ 262 Figure 6.72. Prototypes of different micro heat exchanger concepts obtained by laser stereolithography
(additive photo-polymerization) using a SLA-3500 machine by 3D systems. ............................................. 263 Figure 6.73. Testing of fluid flow through the additively manufactured and spatially distributed micro
channels of the different concepts of micro heat exchangers. Red-colored water for highlighting the micro channels and validating the flow through them. Blue-colored water for showing both micro
heat exchangers filled with fluid surrounding the micro channels. .................................................................. 264 Figure 6.74. Experimental set-ups and testing sequences of the different concepts of additively
manufactured micro heat exchangers for design validation. ............................................................................... 264 Figure 6.75. Results summary: temperature in (°C) curves showing modeling and testing results for the
first concept (“shower” type) of additively manufactured micro heat exchanger. .................................... 265 Figure 6.76. Different conceptual designs of multi-functional forced-convection heat sinks with complex
geometries for improved performance and aimed at single-step and single-part manufacture by vat-polymerization (images a and b); Micro-pin-fin heat sink (b), micro-channel heat sink (d) and micro-
injector heat sink with lens and electronics (d and e)............................................................................................. 267 Figure 6.77. Flow-thermal coupling results of the simulations for the micro-pin-fin heat sink
concept;pressure, temperature and velocity fields (left, middle, right respectively). .............................. 268

295
Figure 6.78. Prototypes of different forced-convection multi-functional heat sink concepts obtained by laser stereolithography (additive photo-polymerization) using the SLA-3500 by 3D systems. .......... 269
Figure 6.79. Experimental set-ups and testing sequences of the different prototypes of additively
manufactured forced-convection multi-functional heat sinks for design validation. ............................... 270
Chapter 7
Figure 7.1. Diagram of the methodology generated in this work. ................................................................................. 280 Figure 7.2. Final explanatory scheme of the added value generated in this Thesis. ............................................. 281

296
LIST OF TABLES
Chapter 2
Table 2.1. Overview of vat photopolymerization commercially available systems. ................................................ 23 Table 2.2. AM share market by materials for all users 2015 (Sculpteo, 2017) .................................................................. 26
Table 2.3. The $768.5 million AM materials market segmented by material type (Wohlers, 2017) ............... 26 Table 2.4. Estimation of the revenue generation by AM in the main industry sectors in 2025 (Frost &
Sullivan, 2016) ................................................................................................................................................................................ 27
Table 2.5. Comparison of energy use and material consumption of different manufacturing techniques
(Huang et al., 2012). ................................................................................................................................................................... 30 Table 2.6. Summary of commented advantages and challenges for the AM sector ................................................. 31 Table 2.7. Key considerations for the designer previous to start applying DfAM for a novel product using
vat photopolymerization systems ....................................................................................................................................... 35 Table 2.8. Challenges and rate of priority for the aspects that involves AM standardization (adapted from:
Monzón et al., 2015). ................................................................................................................................................................... 38
Chapter 3
Table 3.1. Technologies and materials matrix currently available in the additive manufacturing industry 47 Table 3.2. Classification of SL-systems regarding the source of the light ..................................................................... 49 Table 3.3. Specification of the SLA® 3500 from 3D Systems® ........................................................................................... 53 Table 3.4. Specification of the Form1+ from FormlabsTM .................................................................................................... 54 Table 3.5. Specifications of the BP8 from TU Wien ................................................................................................................ 55 Table 3.6. Specifications of the CeraFab from Lithoz GmbH .............................................................................................. 56 Table 3.7. Specifications of the Prusa i3 Hephestos from BQ ............................................................................................. 57 Table 3.8. Other devices utilized during the Thesis. .............................................................................................................. 58 Table 3.9. Conventional solid design software ......................................................................................................................... 59 Table 3.10 New 3D modelling approaches ................................................................................................................................. 59 Table 3.11. Finite-element-based software for the simulation stage ............................................................................. 60 Table 3.12. Programs for the preparation of the 3D printing job .................................................................................... 61 Table 3.13. Photocurable materials for additive manufacturing ...................................................................................... 61 Table 3.14. Mechanical properties of the photocurable materials .................................................................................. 62 Table 3.15. Material list for the formulation of the self-developed photocurable resin for surface texturing
............................................................................................................................................................................................................. 63 Table 3.16. Material list for the formulation of the HA/Alumina slurries for gel-casting ..................................... 64 Table 3.17. Material list for the FDM 3D printers.................................................................................................................... 64 Table 3.18. Evaluated parameters that have direct influence on the quality of the textures by using BP8 SL-
system .............................................................................................................................................................................................. 66 Table 3.19. Final optimized values for the laser parameters of the scanning system, adequated for the
obtaining of microfeatures with MSG01. .......................................................................................................................... 68 Table 3.20. Material formulations evaluated in the study. ................................................................................................. 69 Table 3.21. Geometry data for the calibration models. ......................................................................................................... 74 Table 3.22. Summary of the data gathered regarding the manufacturing of parts CP01 and CP02 by the
SLA3500 system .......................................................................................................................................................................... 76

297
Chapter 4
Table 4.1. Library of lattice structures with uniform pore distributions ..................................................................... 90 Table 4.2. Library of lattice structures with different morphologies for additional versatility (Unit cell side:
30mm).............................................................................................................................................................................................. 91 Table 4.3. Library of functionally graded lattices with varying number of pores and uniform thicknesses 94 Table 4.4. Comparative performance of lithography-based ceramic manufacture and photopolymerization
processes, such as laser stereolithography ..................................................................................................................... 97 Table 4.6. Comparative summary of technologies for developing micro-textured materials and devices 120 Table 4.7. Measurements taken at the reference points of the square section using an Olympus DSX100 for
element E11 of the test piece CP01 .................................................................................................................................. 123 Table 4.8. Values selected for Poisson’s ratio and linear creep, revealing the least relative error compared
to the maximum displacement (dmax). ......................................................................................................................... 128 Table 4.9. Results obtained from the simulation of the mechanical properties of the photo curable epoxy
resin and line-ar creep during the during the laser stereolithography additive manufacturing process. .......................................................................................................................................................................................................... 128
Table 4.10. Material properties for the polymeric material ............................................................................................ 134 Table 4.11. Comparison results among the different strategies used for the case of study .............................. 137
Chapter 5
Table 5.1. LC phases of an AM part (adapted from Luo et al. 1999) .............................................................................. 148
Table 5.2. Results for the material, processing time and number of layers for the different orientations of the part ......................................................................................................................................................................................... 160
Table 5.3. Material properties of resin Clear 02 ................................................................................................................... 164 Table 5.4. CO2 emissions per quantity of epoxy resin used and standard power consumed .......................... 177 Table 5.5. Factors used for the estimation of the cost of energy consumption ....................................................... 178 Table 5.6. Ratio of environmental and economic performance of bioinspired (subscript b) to conventional
(subscript c) support structures for stereolithography processes .................................................................... 179 Table 5.7. Eco efficiency comparison values for both commercial and new strategy approaches ................ 179 Table 5.8. Values used in the study to carry out the comparison of the lintel structure .................................... 181 Table 5.9.Values used in the study to carry out the comparison of the wavy design ........................................... 181 Table 5.10. Values used in the study to carry out the comparison of the Hat design........................................... 182 Table 5.11.Values used in the study to carry out the comparison of the sensor case design ........................... 182 Table 5.12. Comparison in terms of time, material and file weight for both full density and 75 % infill
molds ............................................................................................................................................................................................. 184 Table 5.13. Weight of SL-printed molds in castable resin FLCABL01 ......................................................................... 185 Table 5.14. Measured distance for the printed parts at the control points .............................................................. 186
Chapter 6
Table 6.1. Materials commonly used for each component of a SOFC unit cell ........................................................ 227 Table 6.2. Final values for the control parameters of the reference and optimized models ............................ 234 Table 6.3. Control of geometrical distortion for different points of the first and last layer of the prototype.
.......................................................................................................................................................................................................... 239