Modified Anaerobic Digestion Model No.1 for dry and semi-dry anaerobic digestion of solid organic...
27
This article was downloaded by: [Wageningen UR Library] On: 16 October 2014, At: 22:41 Publisher: Taylor & Francis Informa Ltd Registered in England and Wales Registered Number: 1072954 Registered office: Mortimer House, 37-41 Mortimer Street, London W1T 3JH, UK Environmental Technology Publication details, including instructions for authors and subscription information: http://www.tandfonline.com/loi/tent20 Modified ADM1 for dry and semi-dry anaerobic digestion of solid organic waste Flavia Liotta a , Patrice Chatellier b , Giovanni Esposito a , Massimiliano Fabbricino c , Luigi Frunzo d , Eric D. van Hullebusch e , Piet N. L. Lens f & Francesco Pirozzi c a Department of Civil and Mechanical Engineering, University of Cassino and the Southern Lazio, via Di Biasio 43, 03043 Cassino (FR), Italy. b Université Paris-Est, IFSTTAR, 14-20 Boulevard Newton Cité Descartes, Champs sur Marne F-77447 Marne la Vallée, Cedex 2, France. c Department of Civil, Architectural and Environmental Engineering, University of Naples Federico II, via Claudio 21, 80125 Naples, Italy. d Department of Mathematics and Applications Renato Caccioppoli, University of Naples Federico II, via Cintia, Monte S. Angelo, 80126 Naples, Italy e Université Paris-Est, Laboratoire Géomatériaux et Environnement, EA 4508, UPEM, 5 bd Descartes, 77454 Marne-la-Vallée, Cedex 2, France. f Core Pollution Prevention and Control, UNESCO-IHE, UNESCO-IHE, Institute for Water Education, PO Box 3015, 2601, DA Delft, The Netherlands. Accepted author version posted online: 14 Oct 2014. To cite this article: Flavia Liotta, Patrice Chatellier, Giovanni Esposito, Massimiliano Fabbricino, Luigi Frunzo, Eric D. van Hullebusch, Piet N. L. Lens & Francesco Pirozzi (2014): Modified ADM1 for dry and semi-dry anaerobic digestion of solid organic waste, Environmental Technology, DOI: 10.1080/09593330.2014.965226 To link to this article: http://dx.doi.org/10.1080/09593330.2014.965226 Disclaimer: This is a version of an unedited manuscript that has been accepted for publication. As a service to authors and researchers we are providing this version of the accepted manuscript (AM). Copyediting, typesetting, and review of the resulting proof will be undertaken on this manuscript before final publication of the Version of Record (VoR). During production and pre-press, errors may be discovered which could affect the content, and all legal disclaimers that apply to the journal relate to this version also. PLEASE SCROLL DOWN FOR ARTICLE Taylor & Francis makes every effort to ensure the accuracy of all the information (the “Content”) contained in the publications on our platform. However, Taylor & Francis, our agents, and our licensors make no representations or warranties whatsoever as to the accuracy, completeness, or suitability for any purpose of the Content. Any opinions and views expressed in this publication are the opinions and views of the authors, and are not the views of or endorsed by Taylor & Francis. The accuracy of the Content should not be relied upon and should be independently verified with primary sources of information. Taylor and Francis shall not be liable for any losses, actions, claims, proceedings, demands, costs, expenses, damages, and other liabilities whatsoever or howsoever caused arising directly or indirectly in connection with, in relation to or arising out of the use of the Content. This article may be used for research, teaching, and private study purposes. Any substantial or systematic reproduction, redistribution, reselling, loan, sub-licensing, systematic supply, or distribution in any
Transcript of Modified Anaerobic Digestion Model No.1 for dry and semi-dry anaerobic digestion of solid organic...

This article was downloaded by: [Wageningen UR Library]On: 16 October 2014, At: 22:41Publisher: Taylor & FrancisInforma Ltd Registered in England and Wales Registered Number: 1072954 Registered office: Mortimer House,37-41 Mortimer Street, London W1T 3JH, UK
Environmental TechnologyPublication details, including instructions for authors and subscription information:http://www.tandfonline.com/loi/tent20
Modified ADM1 for dry and semi-dry anaerobicdigestion of solid organic wasteFlavia Liottaa, Patrice Chatellierb, Giovanni Espositoa, Massimiliano Fabbricinoc, LuigiFrunzod, Eric D. van Hullebusche, Piet N. L. Lensf & Francesco Pirozzica Department of Civil and Mechanical Engineering, University of Cassino and the SouthernLazio, via Di Biasio 43, 03043 Cassino (FR), Italy.b Université Paris-Est, IFSTTAR, 14-20 Boulevard Newton Cité Descartes, Champs sur MarneF-77447 Marne la Vallée, Cedex 2, France.c Department of Civil, Architectural and Environmental Engineering, University of NaplesFederico II, via Claudio 21, 80125 Naples, Italy.d Department of Mathematics and Applications Renato Caccioppoli, University of NaplesFederico II, via Cintia, Monte S. Angelo, 80126 Naples, Italye Université Paris-Est, Laboratoire Géomatériaux et Environnement, EA 4508, UPEM, 5 bdDescartes, 77454 Marne-la-Vallée, Cedex 2, France.f Core Pollution Prevention and Control, UNESCO-IHE, UNESCO-IHE, Institute for WaterEducation, PO Box 3015, 2601, DA Delft, The Netherlands.Accepted author version posted online: 14 Oct 2014.
To cite this article: Flavia Liotta, Patrice Chatellier, Giovanni Esposito, Massimiliano Fabbricino, Luigi Frunzo, Eric D. vanHullebusch, Piet N. L. Lens & Francesco Pirozzi (2014): Modified ADM1 for dry and semi-dry anaerobic digestion of solidorganic waste, Environmental Technology, DOI: 10.1080/09593330.2014.965226
To link to this article: http://dx.doi.org/10.1080/09593330.2014.965226
Disclaimer: This is a version of an unedited manuscript that has been accepted for publication. As a serviceto authors and researchers we are providing this version of the accepted manuscript (AM). Copyediting,typesetting, and review of the resulting proof will be undertaken on this manuscript before final publication ofthe Version of Record (VoR). During production and pre-press, errors may be discovered which could affect thecontent, and all legal disclaimers that apply to the journal relate to this version also.
PLEASE SCROLL DOWN FOR ARTICLE
Taylor & Francis makes every effort to ensure the accuracy of all the information (the “Content”) containedin the publications on our platform. However, Taylor & Francis, our agents, and our licensors make norepresentations or warranties whatsoever as to the accuracy, completeness, or suitability for any purpose of theContent. Any opinions and views expressed in this publication are the opinions and views of the authors, andare not the views of or endorsed by Taylor & Francis. The accuracy of the Content should not be relied upon andshould be independently verified with primary sources of information. Taylor and Francis shall not be liable forany losses, actions, claims, proceedings, demands, costs, expenses, damages, and other liabilities whatsoeveror howsoever caused arising directly or indirectly in connection with, in relation to or arising out of the use ofthe Content.
This article may be used for research, teaching, and private study purposes. Any substantial or systematicreproduction, redistribution, reselling, loan, sub-licensing, systematic supply, or distribution in any

form to anyone is expressly forbidden. Terms & Conditions of access and use can be found at http://www.tandfonline.com/page/terms-and-conditions
Dow
nloa
ded
by [
Wag
enin
gen
UR
Lib
rary
] at
22:
41 1
6 O
ctob
er 2
014
1
Publisher: Taylor & Francis Journal: Environmental Technology DOI: 10.1080/09593330.2014.965226
Modified ADM1 for dry and semi-dry anaerobic digestion of solid organic
waste
Flavia Liotta*, Patrice Chatellier**, Giovanni Esposito*, Massimiliano Fabbricino***, Luigi
Frunzo**** , Eric D. van Hullebusch*****, Piet N. L. Lens******, Francesco Pirozzi***
*Department of Civil and Mechanical Engineering, University of Cassino and the Southern Lazio,
via Di Biasio 43, 03043 Cassino (FR), Italy.
**Université Paris-Est, IFSTTAR, 14-20 Boulevard Newton Cité Descartes, Champs sur Marne F-
77447 Marne la Vallée, Cedex 2, France.
*** Department of Civil, Architectural and Environmental Engineering, University of Naples
Federico II, via Claudio 21, 80125 Naples, Italy.
**** Department of Mathematics and Applications Renato Caccioppoli, University of Naples
Federico II, via Cintia, Monte S. Angelo, 80126 Naples, Italy
***** Université Paris-Est, Laboratoire Géomatériaux et Environnement, EA 4508, UPEM, 5 bd
Descartes, 77454 Marne-la-Vallée, Cedex 2, France.
******Core Pollution Prevention and Control, UNESCO-IHE, UNESCO-IHE, Institute for Water
Education, PO Box 3015, 2601, DA Delft, The Netherlands.
Accep
ted
Man
uscr
ipt
Dow
nloa
ded
by [
Wag
enin
gen
UR
Lib
rary
] at
22:
41 1
6 O
ctob
er 2
014

2
(*) Corresponding author
E-mail address: [email protected]
Tel: 0039. 0776. 299.4339
Fax: 0039. 0776. 299.3939
Abstract
The role of Total Solids (TS) content in anaerobic digestion of selected complex organic matter,
e.g. rice straw and food waste, was investigated. A range of TS from wet (4.5%) to dry (23%) was
evaluated. A modified version of the Anaerobic Digestion Model No.1 for complex organic
substrate is proposed to take into account the effect of the TS content on anaerobic digestion. A
linear function that correlates the kinetic constants of three specific processes (i.e. disintegration,
acetate and propionate up-take) was included in the model. Results of biomethanation and volatile
fatty acids production tests were used to calibrate the proposed model. Model simulations showed
a good agreement between numerical and observed data.
Keywords: dry anaerobic digestion; food waste; mathematical modelling; rice straw; total solids;
ADM1
Accep
ted
Man
uscr
ipt
Dow
nloa
ded
by [
Wag
enin
gen
UR
Lib
rary
] at
22:
41 1
6 O
ctob
er 2
014

3
1. Introduction
Experimental research carried out in recent years on AD has definitely established that the Total
Solids (TS) content plays an important role on process development [1-4]. As a consequence,
several studies have been carried out recently to adapt and calibrate the existing AD mathematical
models to take into account the effect of the TS content [4-7]. Le Hyaric et al. [4] and Lay et al.
[6] applied the Gompertz model to simulate the results of specific methanogenic activity tests and
found that a high TS content (15%-25%) reduces substrate degradation because of water and
nutrients limitation, resulting in a lower methanogenic activity. Brown et al. [7] used the first-
order kinetic models to characterize the methane production of lignocellulosic biomass and found
a linear relationship between logarithmic methane production and reaction time in both wet and
dry anaerobic digestion of switchgrass, corn stover, wheat straw, leaves, yard waste and maple.
Dry anaerobic digestion generally exhibits a poor startup performance, thus several models
assume the hydrolysis as a rate-limiting step of the process [2]. In particular, Abbassi-Guendouz et
al. [8] applying the Anaerobic Digestion Model N°1 (ADM1) [9] to cardboard treatment, found a
decreasing first-order hydrolysis rate constant for carbohydrates degradation when increasing the
TS content between 15-30%. Liotta et al. [3] also found a decreasing disintegration rate constant
when increasing the TS content in the range of wet digestion.
However all these models do not take into account the role of Volatile Fatty Acid (VFA) uptake
on the mathematical model of dry and semi-dry AD. Recent studies demonstrated the important
role of the mechanisms associated with VFA uptake on process performances [2, 3]. Moreover, for
easily biodegradable wastes such as Food Waste, hydrolysis can not necessarily be the rate-
limiting step of the process [10] As intermediate products, VFA have been treated as an indicator
of the digestion efficiency, but high concentrations of VFA can determine a decrease of pH
leading to performance failure of the digester [2, 7, 11]. An attempt was done by Guendouz [12],
who found a transitory accumulation of VFA during the batch tests, indicating that hydrolysis is
not the sole rate-limiting step of dry AD of organic solid wastes. Motte et al. [13] proposed a
Accep
ted
Man
uscr
ipt
Dow
nloa
ded
by [
Wag
enin
gen
UR
Lib
rary
] at
22:
41 1
6 O
ctob
er 2
014
4
quadratic model able to dynamically describe the effect of TS, particle size and substrate/inoculum
ratio on methane production, pH and VFA concentration. The model results were accurate (p-
value < 0.05) with a coefficient of determination of 80%. However this model does not take into
account the effect of TS on kinetic constants and it is not an ADM1-like model as it does not
consider all biochemical processes of AD.
The aim of the present article is to develop a kinetic model that can specifically characterize the
disintegration, the acetogenesis and methanogenis steps of selected complex organic substrates as
a function of TS content in order to predict and interpret results from anaerobic digesters in wet,
semi-dry and dry AD. In the following section, an overview of the model structure, assumptions
and main model parameters is presented. The proposed model is based on the cited ADM1 model
[9] as modified by Esposito et al. [14-16] for complex organic substrates. The kinetic equations
are reformulated to consider the direct effect of TS content and the effect of the intermediate
compounds, which can affect, as a function of the TS content, the whole process development.
The dynamics of acetate, propionate and methane production obtained from two different series of
batch tests on AD of food waste and rice straw were used to calibrate the proposed model. Food
waste was selected as a representative of easily, highly biodegradable and heterogeneous
substrates, while rice straw as representative of slowly biodegradable and models of
lignocellulosic residues.
2. Materials and Methods
2.1 Model description
The proposed model is based on a modified version of the ADM1 proposed by Esposito et al.
[14- 16] to take into account the presence of complex organic substrates in the feedstock and the
operation of the digester in semi-dry and dry conditions. It is applied to Completely Stirred Tank
Reactor (CSTR) with a constant feed and to batch systems.
The model proposed by Esposito et al. [14-16] is a structured biological model that simulates the
Accep
ted
Man
uscr
ipt
Dow
nloa
ded
by [
Wag
enin
gen
UR
Lib
rary
] at
22:
41 1
6 O
ctob
er 2
014

5
major conversion mechanisms of organic substrates into biogas and the degradation of by-
products. It assumes that composite materials are converted into carbohydrates, proteins and
lipids by a disintegration step [14, 17,18]. These components are further hydrolysed into simple
sugars, amino acids and long chain fatty acids. Then, during the acidogenic step, fermentative
micro-organisms convert these products into acetic, propionic, butyric and valeric acids,
hydrogen and carbon dioxide. The uptake of fatty acids yields acetate (acetogenic step), which is
converted into methane by methanogens.
The disintegration and hydrolysis steps are modelled by first-order kinetics. In particular, surface
based kinetics are used for disintegration and a classical first order kinetics for hydrolysis. All
the other transformations are classical biochemical transformations performed by specific
bacterial groups, and are described by a Monod-type equation, where the substrate uptake is
associated with the microbial growth. The kinetics of microbial growth and decay are also
included in the model.
The overall model consists of 28 mass balance equations [9] applied to the 28 state variables (13
substrates and 15 biomasses) summarized in Table 1. The kinetic constants and processes of the
modelled substrates are listed in Table 2. It is worth noting that, according to the model
proposed by Esposito et al. [14-16] only the parameter Ksbk, not included in the original version
of the ADM1, is a function of the substrate intrinsic characteristics, and therefore depends also
on the TS content of the substrate [3].
With respect to the model proposed by Esposito et al. [14-16], this model modifies some of the
kinetic equations listed in Tables A.1-A.2. The kinetic constants (Ksbk, Kac and Kpro) are
expressed as function of the TS content in order to take into account the TS effect on the rates of
substrate disintegration and acetate and propionate up-take. Assuming CSTR conditions and a
constant reactor Volume (V), for each state variable (Ci), the mass balance has the following
form
Accep
ted
Man
uscr
ipt
Dow
nloa
ded
by [
Wag
enin
gen
UR
Lib
rary
] at
22:
41 1
6 O
ctob
er 2
014

6
dCi
dt= qCi−in
V− qCi−out
V+ ν ijρ j
j=i
23
(1)
where:
the term qCi−in
V− qCi−out
V = 0 in batch conditions, where the flow rate (q) is assumed to be zero,
and the term ν ijρ j
j=i
23
is the overall reaction term expressed as a sum of specific kinetic rate for
the process j ( j) multiplied by the stoichiometric coefficients ( ij) that describes the influence of
the specific process j on the individual component i.
The specific kinetic rates and the stoichiometric coefficients used in the present model are strictly
equivalent to those used in the model proposed by Esposito et al. [14-16] and are listed in Tables
A.1-A.2.
The main originality of the proposed model is the capability to consider the variation of the
kinetic constants Ksbk, Kac and Kpro with the TS content. These constants are involved in the
following specific kinetic rates:
ρ i,1 = Ksbk ⋅C ⋅ a * (2)
ρ i,13 = Kpro ⋅Spro
Ks + Sbu
⋅ Xpro ⋅ I2 (3)
ρ i,14 = Kac ⋅ Sac
Ks + Sac
⋅ Xac ⋅ I3 (4)
These equations have been reformulated by substituting the kinetic constants Ksbk, Kac and Kpro
with the following functions:
Ksbk (TS) = a ⋅TS + b (5)
Kac,pro(TS) = c ⋅TS + d (6)
Accep
ted
Man
uscr
ipt
Dow
nloa
ded
by [
Wag
enin
gen
UR
Lib
rary
] at
22:
41 1
6 O
ctob
er 2
014

7
where the new parameters a, b, c and d need to be calibrated depending on the substrate type (in
this study rice straw and food waste) and the specific experimental conditions such as
temperature, pressure, pH, retention time and mixing conditions [4].
2.2. Model calibration
The proposed model was calibrated using the experimental data obtained during anaerobic
digestion of food waste and rice straw. The experimental tests were conducted in batch, at 32°C,
using two liter reactors. The following total solids concentrations were tested: 4.2%, 12.8% and
19.2% for the food waste, and 4.8%, 14.8% and 23.4% for the rice straw. The experimental
procedure and the obtained results are reported elsewhere [11,19].
The calibration was performed in two steps. In the first step, the simulated curves were plotted
for each value of Kac, Kpro and Ksbk, and the simulated results were compared with experimental
data by applying the Root Mean Square Error (RMSE) method, as usually done for the model
calibration [16, 20]. In the second step, the values of Kac, Kpro, Ksbk , associated with the lower
RMSE, that better fit the proposed equations (5, 6), were introduced in the model to perform a
second set of simulations. These modelling results were again compared with experimental data
by individuating the final RMSE values for each Kac, Kpro and Ksbk value. The final results of
calibration procedure are summarized in Figures 1-2 and Table 3. In particular the experimental
data were used for both substrates to calibrate the disintegration kinetic constant Kdis of the
ADM1, assuming it coincides with the constant Ksbk of the model proposed by Esposito et al.
[14-16] as the specific surface did not vary in the different tests. Acetic and propionic acid
productions were used to calibrate the constants Kac and Kpro. All the other constants and
parameters were set from literature data [9, 14-16].
Accep
ted
Man
uscr
ipt
Dow
nloa
ded
by [
Wag
enin
gen
UR
Lib
rary
] at
22:
41 1
6 O
ctob
er 2
014
8
3. Results and discussion
Table 3 and Figure 3a show that for both substrates the calibrated disintegration rate constant
linearly decreased with increasing TS concentration for both substrates. The linear function (5)
can be expressed in this case as follows:
for food waste: Kdis = −0.31⋅TS + 7.92 with r2 = 0.99 (7)
for rice straw: Kdis = −0.1⋅TS + 2.9 with r2 = 0.97 (8)
Where Kdis is assumed to be coincident with Ksbk.
The values of parameters a and b (5) that describe the specific experimental conditions are
different for the two tested substrates because of the specific characteristic of the initial substrate
to be hydrolysed. Food waste is a more easily biodegradable substrate compared to rice straw
that has a complex lignocellulosic structure that is more difficult to be disintegrated. The
structure of rice straw consists of different types of polymers that are difficult to degrade such
as: cellulose (37.4%), hemi-cellulose (44.9%), lignin (4.9%) and silicon ash (13,0%) [21]. In
particular the high lignin content makes the rice straw degradation very difficult as the ligno-
carbohydrate complexes form strong bonds and the plant cell wall is resistant to microbial attack
[22]. Thus for each TS the rice straw disintegration rate constant and the values a, b are lower
than the values of food waste. These results are consistent with results previously presented by
Liotta et al. [3], where a linear correlation with r2 = 0.99 was found between the carrot waste
disintegration rate constant and TS in the range of wet conditions.
The linear correlations (7, 8) describe the slowing-down of the disintegration process at higher
values of the TS content caused by the lack of water and the limited transfer of hydrolysis
products (and other intermediates) to bacterial sites [6, 23, 24]. This is in agreement with results
presented by Liotta et al. [3], Abbassi-Guendouz et al. [8], Pommier et al. [24], who observed a
strong impact of the total solids content on biodegradation kinetic rates and maximum methane
production in anaerobic digestion of different substrates.
Accep
ted
Man
uscr
ipt
Dow
nloa
ded
by [
Wag
enin
gen
UR
Lib
rary
] at
22:
41 1
6 O
ctob
er 2
014
9
Figure 3b shows that for both substrates, a linear and inverse correlation exists between the
values of the propionate and acetate up-take kinetic constants and the TS content. In this case, a
unique linear function, as reported in (6), can be expressed for acetate and propionate as follows:
for food waste: Kac/ pro = −0.41⋅TS +10.35 with r2 > 0.99 (9)
for rice straw: Kac/ pro = −0.28 ⋅TS +10.71 with r2 > 0.97 (10)
The values of parameters c and d (6) that describe the specific experimental conditions are the
same for acetate and propionate. This means that the kinetic rate constants for acetate and
propionate are equivalent for each TS content. Thus, it can be concluded that the effect of the
water content on propionate and acetate up-take is equal.
Also in this case the parameters c, d differ for different initial substrate types because of
different experimental conditions and biomass involved in the anaerobic degradation of food
waste and rice straw. Additionally there are larger differences between the values of Kac/pro for
rice straw and food waste when the TS is higher. Thus, the intrinsic characteristics of the
substrate type are more effective on the process development and biomass selection in the case
of lack of water.
This study shows that with a higher TS content lower values of Kac/pro are obtained that determine
higher concentrations of acetate and propionate during the whole process (Figures 1-2). This
means that a higher TS content can lead to process inhibition due to VFA accumulation, implying
lower process efficiency in terms of VS degradation, final methane yield and specific methane
production rate. Indeed, Figures 1 and 2 show a lower level of inhibition for the experiments under
wet digestion conditions (TS = 4.52% for food waste, and TS = 4.85% for rice straw), compared
to the experiments under semi-dry (TS = 12.87% and TS = 14.86%) or dry (TS = 19.2% and TS =
23.4%) anaerobic conditions. This is probably due to a reduction of the water content that implies
less contact with biomass because of the more heterogeneous conditions and less availability,
uptake and diffusion of nutrients through the porous medium to bacterial sites [3, 4, 6]. Moreover
Accep
ted
Man
uscr
ipt
Dow
nloa
ded
by [
Wag
enin
gen
UR
Lib
rary
] at
22:
41 1
6 O
ctob
er 2
014
10
the lower water content can increase the acetate concentration and inhibit methanogens, resulting
in accumulation of propionate and other VFA.
Despite the good fitting between simulated and experimental concentrations, showing the
capability of the model to simulate the AD process of the two substrates with different initial TS,
it is worth noting that the model fitting is of higher quality for the data obtained during rice
straw digestion. For food waste, Figures 1 c, g, k show that some points could not be fitted by
the simulated curves. This means that an inhibition phenomenon, related to the difficult
degradation of propionic acid and consequent formation of propionate isomers during the
process, not taken into account in the simulation, should be considered in the further
development of the kinetic equations of the model. This different behaviour can be related to the
nature of the substrate type. Food waste has a complex nature and contains many different
compounds that have different degradation kinetics [25-28]. In contrast, the kinetic degradation
of the mono-substrate rice straw is more easy to model.
4. Conclusions
A mathematical model capable to simulate semi-dry and dry AD of selected complex organic
substrates such as rice straw and food waste is proposed. Model calibration resulted in the
determination of the kinetic constants of disintegration, acetate and propionate up-take for
different TS contents in the range 4.5%-23%. The good fitting of the biomethanation data with
the model simulation results for both methane production and VFA concentrations confirms the
suitability of the model. Three linear equations that correlate the TS content with the
disintegration and the up-take kinetic constants for acetate and propionate were included in the
model.
Acknowledgements
The authors would like to thank the European Commission for providing financial support through
the Erasmus Mundus Joint Doctorate Programme ETeCoS3 (Environmental Technologies for
Accep
ted
Man
uscr
ipt
Dow
nloa
ded
by [
Wag
enin
gen
UR
Lib
rary
] at
22:
41 1
6 O
ctob
er 2
014
11
Contaminated Solids, Soils and Sediments) under the grant agreement FPA n°2010–0009. This
research is also in the framework of the project ‘Integrated system to treat buffalo slurry, aimed to
recover water and safe energy’—STABULUM—funded, in agreement with the Decision of the
European Commission No C(2010) 1261, 2 March 2010, by the Agriculture Department of the
Campania Region in the context of the Programme of Rural Development 2007–2013, Measure
124 ‘Cooperation for development of new products, processes and technologies in the agriculture
and food sectors’.
Accep
ted
Man
uscr
ipt
Dow
nloa
ded
by [
Wag
enin
gen
UR
Lib
rary
] at
22:
41 1
6 O
ctob
er 2
014

12
References
[1] J. Shi, F. Xu, Z. Wang, J.A. Stiverson, Z. Yu, Y. Li, Effects of microbial and non-
microbial factors of liquid anaerobic digestion effluent as inoculum for solid-state
anaerobic digestion of corn stover, Bioresour. Technol. 157 (2014), pp. 188-196.
[2] A. K. Jha, J. Li, L. Nies, and L. Zhang, Research advances in dry anaerobic digestion
process of solid organic wastes, Afr. J. Biotechnol. 10 (2013), pp. 14242-14253.
[3] F. Liotta, G. d’Antonio, G. Esposito, M. Fabbricino, L. Frunzo, E.D. van Hullebusch,
N.L. Lens, and F. Pirozzi, Effect of moisture on disintegration kinetics during anaerobic
digestion of complex organic substrates, Waste Manage. Res. 32 (2014), 40-48.
[4] R. Le Hyaric, H. Benbelkacem, J. Bollon, R. Bayard, R. Escudié and P. Buffière,
Influence of moisture content on the specific methanogenic activity of dry mesophilic
municipal solid waste digestate, J. of Chem. Technol. and Biotechnol. 87 (2012), 1032-
1035.
[5] F. Liotta, P. Chatellier, G. Esposito, M. Fabbricino, E.D. van Hullebusch and P.N.
Lens, Hydrodynamic mathematical modeling of aerobic plug flow and non-ideal flow
reactors: a critical and hystorical review. Crit. Rev. Env. Sci. Tec., (2014), DOI:
10.1080/10643389.2013.829768.
[6] J.J. Lay, YY. Li, T. Noike, Influences of pH and moisture content on the methane
production in high-solids sludge digestion, Water Res. 31 (1997), 1518–1524.
[7] D. Brown, J. Shi, Y. Li. Comparison of solid-state to liquid anaerobic digestion of
lignocellulosic feedstocks for biogas production, Bioresour. Technol. 124 (2012), 379–
386.
[8] A. Abbassi-Guendouz, D. Brockmann, E. Trably, C. Dumas, J.-P. Delgenès, J.-P.
Steyer, R. Escudié, Total solids content drives high solid anaerobic digestion via mass
Accep
ted
Man
uscr
ipt
Dow
nloa
ded
by [
Wag
enin
gen
UR
Lib
rary
] at
22:
41 1
6 O
ctob
er 2
014

13
transfer limitation, Bioresour. Technol. 111 (2012), 55–61.
[9] D. J. Batstone, J. Keller, I. Angelidaki, S.V. Kalyuzhnyi, S.V. Pavlostathis, A. Rozzi,
W.T.M. Sanders, H. Siegrist, V.A. Vavilin, Anaerobic digestion model no.1., Sci. Tech.
Rep. No. 13, IWA Publishing, London, 2002.
[10] J. Ariunbaatar, A. Panico, G. Esposito, F. Pirozzi, F. and P.N. Lens. Pretreatment
methods to enhance anaerobic digestion of organic solid waste. Appl. Energ., 123 (2014),
143-156.
[11] F. Liotta, Bio-Methanation tests and Mathematical Models to assess the effect of
moisture content on anaerobic digestion of complex organic substrates, Ph.D. diss.,
University of Cassino and Southern Lazio, Italy, 2014.
[12] J. Guendouz, P. Buffiere, J. Cacho, M. Carrere, J.P. Delgenes, Dry anaerobic
digestion in batch mode: design and operation of a laboratory-scale, completely mixed
reactor, Waste Manag. 30 (2010), 1768–1771.
[13] J.C. Motte, R. Escudié, N. Bernet, J.P. Delgenes, J.P. Steyer, C. Dumas, Dynamic
effect of total solid content, low substrate/inoculum ratio and particle size on solid-state
anaerobic digestion, Bioresour. Technol. 144 (2013), 141–148.
[14] Esposito, G., Frunzo, L., Panico A. & d’Antonio, G. (2008) Mathematical modelling
of disintegration - limited co-digestion of OFMSW and sewage sludge. Water Science
Technology. 58 (2008), 1513–1519.
[15] G. Esposito, L. Frunzo, A. Panico, F. Pirozzi, Modelling the effect of the OLR and
OFMSW particle size on the performances of an anaerobic co-digestion reactor, Process
Biochem. 46 (2011a), 557–565.
[16] G. Esposito, L. Frunzo, A. Panico, F. Pirozzi, Model calibration and validation for
OFMSW and sewage sludge co-digestion reactors, Waste Manage. 31 (2011b), 2527–
Accep
ted
Man
uscr
ipt
Dow
nloa
ded
by [
Wag
enin
gen
UR
Lib
rary
] at
22:
41 1
6 O
ctob
er 2
014

14
2535.
[17] G. Esposito, L. Frunzo, A. Panico, F. Pirozzi, Enhanced bio-methane production
from co-digestion of different organic wastes. Environ. technol., 33 (2012a), 2733-2740.
[18] G. Esposito, L. Frunzo, A. Giordano, F. Liotta, A. Panico and F. Pirozzi. Anaerobic
co-digestion of organic wastes. Rev. Environ. Sci. Biotechnol., 11 (2012b), 325–341.
[19] G. Esposito, L. Frunzo, F. Liotta, A. Panico, F. Pirozzi, Bio-methane potential tests
to measure the biogas production from the digestion and co-digestion of complex organic
substrates. Open Environ. Engine J. 5, (2012a), 1–8.
[20] P.H.M. Janssen, P.S.C. Heuberger, Calibration of process-oriented models, Ecol
Model. 83 (1993), 55–66.
[21] D.J. Hills and D.W. Roberts, Anaerobic digestion of dairy manure and field crop
residues. Agri. Wastes, 3, (1981), 179-189.
[22] W. Mussoline, G. Esposito, A. Giordano, P. Lens, The anaerobic digestion of rice
straw: A review. Crit. Rev. Env. Sci. Tec. 43, (2013), 895-915.
[23] N. Mora-Naranjo, J.A. Meima, A. Haarstrick, and DC. Hempel, Modelling and
experimental investigation of environmental influences on the acetate and methane
formation in solid waste, Waste Manage. 24 (2004), 763–773.
[24] S. Pommier, D. Chenu, M., Quintard, and X. Lefebvre, A logistic model for the
prediction of the influence of water on the solid waste methanization in landfills, Biotech.
Bioeng. 97 (2007), 473-482.
[25] D. Li, Y. Sun, Y. Guo, Z. Yuan, Y. Wang and F. Zhen, Continuous anaerobic
digestion of food waste and design of digester with lipid removal. Environ. Technol. 34
(2013), 2135-2143.
[26] Z. Bo, and H. Pin-Jing, Performance assessment of two-stage anaerobic digestion of
Accep
ted
Man
uscr
ipt
Dow
nloa
ded
by [
Wag
enin
gen
UR
Lib
rary
] at
22:
41 1
6 O
ctob
er 2
014

15
kitchen wastes. Environ. Technol. 35 (2014), 1277-1285.
[27] Y. Lin, D. Wang, J. Liang and G. Li, Mesophilic anaerobic co-digestion of pulp and
paper sludge and food waste for methane production in a fed-batch basis. Environ.
Technol. 33 (2012), 2627-2633.
[28] D.B. Smith and B.C. Almquist, The anaerobic co-digestion of fruit and vegetable
waste and horse manure mixtures in a bench-scale, two-phase anaerobic digestion
system. Environ. Technol. 35 (2014), 859-867.
Accep
ted
Man
uscr
ipt
Dow
nloa
ded
by [
Wag
enin
gen
UR
Lib
rary
] at
22:
41 1
6 O
ctob
er 2
014

16
Appendices
Table A.1
22,26,2013
23,26,2013
23,h2
,26,2013
22,26,2013
22,ac
,26,2013
21,26,2013
21,pro
44,26,2013
20,26,2013
20,C4
,26,2013
19,26,2013
19,fa
,26,2013
18,26,2013
18,aa
,26,2013
17,26,2013
17,su
122
22,2
28,119,116,2
3,28,119,1
15,
2,28,119,1
14,
244,444
244,4444
2,
1,28,119,1
10,,2,,,,
1,28,119,1
9,,2,,,
___,,
___,,
___
___
___
___
_
,
42
13
X ofDecay 23
X ofDecay 22
X ofDecay 21
X ofDecay 20
X ofDecay 19
X ofDecay 18
X ofDecay 17
)()1(1Hydrogen of Uptake16
)()1(1Acetate of Uptake15
)(43.0)1(57.0)1(1Propionate of Uptake14
1
1)(2.0)1(8.0)1(1Butyrate of Uptake13
1
1)(15.0)1(31.0)1(54.0)1(1Valerate of Uptake12
)(3.0)1(7.0)1(1LCFA of Uptake11
)()1()1()1()1()1(1Acids Amino of Uptake10
)()1()1()1()1(1Sugars of Uptake9
1(slowly) Lipids of Hydrolysis81(readily) Lipids of Hydrolysis7
1(slowly) Proteins of Hydrolysis61(readily) Proteins of Hydrolysis5
1(slowly) tesCarbohydra of Hydrolysis41(readily) tesCarbohydra of Hydrolysis3
Sludge oftion Disintegra2*OFMSW oftion Disintegra1
Process
][121110987654321Component
hXhdeci
iii
ii
acXacdeci
iii
ii
proXprodeci
iii
ii
cXcdeci
iii
ii
faXfadeci
iii
ii
aaXaadeci
iii
ii
suXsudeci
iii
ii
hhs
hhmbach
iiih
acacs
acacmbacac
iiiac
propros
proprombacpro
iiipropro
buvaC
bus
buCmbacCCC
vabuC
vas
vaCmbacCCCC
fafas
fafambacfafafa
aaaas
aaaambacaaaa
iiiaahaaaaacaaaaproaaaabuaaaavaaa
susus
susumbacsu
iiisuhsusuacsusuprosusubusu
SliSlihydlifalifa
RliRlihydlifalifa
SprSprhyd
RprRprhyd
SchSchhyd
RchRchhyd
SluSludis
sbkXcsI
IINICCHhacprobuvafaaasu
j
XKNC
XKNC
XKNC
XKNC
XKNC
XKNC
XKNC
IXSK
SKNYCY
IXSK
SKNYCY
IXSK
SKNYCYY
ISS
XSK
SKNYYY
ISS
XSK
SKNYYYY
IXSK
SKNYYY
IXSK
SKNYNCfYfYfYfYfY
IXSK
SKNYCfYfYfYfY
XKffXKffXKXKXKXK
XKaCKf
SSSSSSSSSSSS
dmkgCODrate
⋅−−
⋅−−
⋅−−
⋅−−
⋅−−
⋅−−
⋅−−
⋅⋅+
⋅−−−−
⋅⋅+
⋅−−−−
⋅⋅+
⋅−−−−−
⋅+
⋅⋅+
⋅−−−−
⋅+
⋅⋅+
⋅−−−−−
⋅⋅+
⋅−−−−
⋅⋅+
⋅−−−−−−−−
⋅⋅+
⋅−−−−−−−
⋅−⋅−⋅⋅⋅⋅
⋅⋅⋅
↓⋅⋅→
−=−=
−=−=
−=−=
−=−=
−=−=
−=−=
−=−=
−=
−=
−=
−=
−=
−−
Accep
ted
Man
uscr
ipt
Dow
nloa
ded
by [
Wag
enin
gen
UR
Lib
rary
] at
22:
41 1
6 O
ctob
er 2
014

17
Table A.2
322,h2
,ac
,pro
44,C4
,fa
,aa
,su
122
22,2
,
2,
244,4
244,4
2,
1,
1,
___
___
___
___
___
___
_,,Pr,Pr,,,
,,,Pr,Pr,,,
24__Pr_Pr___
13
11X ofDecay 2311X ofDecay 22
11X ofDecay 2111X ofDecay 20
11X ofDecay 1911X ofDecay 18
11X ofDecay 17
Hydrogen of Uptake16
Acetate of Uptake15
Propionate of Uptake14
1
1Butyrate of Uptake13
1
1Valerate of Uptake12
LCFA of Uptake11
Acids Amino of Uptake10
Sugars of Uptake9
1(slowly) Lipids f o Hydrolysis81(readily) Lipids f o Hydrolysis7
1(slowly) Proteins f o Hydrolysis61(readily) Proteins f o Hydrolysis5
1(slowly) tesCarbohydra f o Hydrolysis41(readily) tesCarbohydra f o Hydrolysis3
1Sludge f otion Disintegra2*1OFMSW f otion Disintegra1
Process
][28272625242322212019181716151413Component
hXhdec
acXacdec
proXprodec
cXcdec
faXfadec
aaXaadec
suXsudec
hhs
hhmh
acacs
acacmac
propros
proprompro
buvaC
bus
buCmC
buvaC
vas
vaCmC
fafas
fafamfa
aaaas
aaaamaa
susus
susumsu
SliSlihyd
RliRlihyd
SprSprhyd
RprRprhyd
SchSchhyd
RchRchhyd
SluSludissXsluLirXsluLisXcrXslusXsluChrXsluCh
sbkXcXsXcLirXcLisXcrXcsXcChrXcCh
SluIhacproCfaaasuSLiRLiSRSChRCh
j
XKXKXK
XKXKXKXK
IXSK
SKY
IXSK
SKY
IXSK
SKY
ISS
XSK
SKY
ISS
XSK
SKY
IXSK
SKY
IXSK
SKY
IXSK
SKY
XKXKXKXKXKXK
XKffffffffffffaCKfffffffffffff
XXXXXXXXXXXXXXXC
dmkgCODrate
I
⋅−⋅−⋅−
⋅−⋅−⋅−⋅−
⋅⋅+
⋅
⋅⋅+
⋅
⋅⋅+
⋅
⋅+
⋅⋅+
⋅
⋅+
⋅⋅+
⋅
⋅⋅+
⋅
⋅⋅+
⋅
⋅⋅+
⋅
⋅−⋅−⋅−⋅−⋅−⋅−
⋅−⋅⋅⋅⋅⋅⋅⋅⋅⋅⋅⋅⋅⋅⋅−
↓⋅⋅→ −−
Accep
ted
Man
uscr
ipt
Dow
nloa
ded
by [
Wag
enin
gen
UR
Lib
rary
] at
22:
41 1
6 O
ctob
er 2
014

18
Figure Captions
Figure 1. Comparison of measured (points) and simulated (continuous line) data for experiments
with food waste: TS = 4.52% (A-D); TS = 12.92% (E-H) and TS = 19.02% (I-K). Figure 2. Comparison of measured (points) and simulated (continuous line) data for experiments
with rice straw: TS = 4.85% (A-D); TS = 14.86% (E-H); TS = 23.4% (I-K).
Figure 3.a. Linear correlation between disintegration kinetic constant and TS for rice straw and
food waste; 3.b. Linear correlation between propionate and acetate kinetic constants and TS
content for rice straw and food waste
Accep
ted
Man
uscr
ipt
Dow
nloa
ded
by [
Wag
enin
gen
UR
Lib
rary
] at
22:
41 1
6 O
ctob
er 2
014

19
Table legends
Table 1. Substrate and Biomass variables in the model proposed by Esposito et al. (2011a, 2011b).
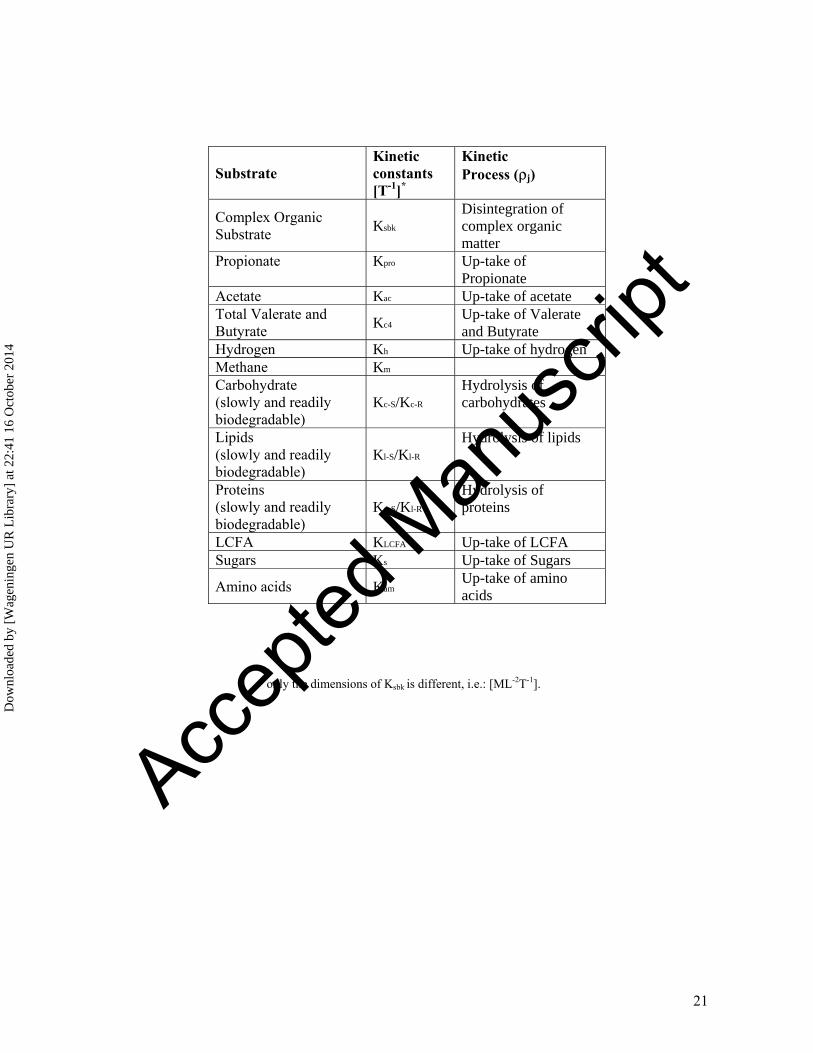
Table 2. Kinetic constants of the model proposed by Esposito et al. (2011a, 2011b).
Table 3. Calibrated kinetic constants for disintegration, acetate up-take and propionate up-take at
different TS concentrations for food waste and rice straw.
Accep
ted
Man
uscr
ipt
Dow
nloa
ded
by [
Wag
enin
gen
UR
Lib
rary
] at
22:
41 1
6 O
ctob
er 2
014

20
Substrate
variables [ML-3] Symbol
Biomass
variables [ML-3] Symbol
Initial Substrate C Particulate inert Xi
Soluble Inert Si Propionate degraders Xpro
Total Propionate Spro Acetate Degraders Xac
Total Acetate Sac Butyrate and Valerate degraders Xb/v
Total Butyrate Sb Hydrogen degraders Xh
Total Valerate Sv Readily and slowly degradable carbohydrates
Xcb-S/Xcb-R
Gaseous Hydrogen
Shg Readily and slowly degradable lipids Xl-S /Xl-R
Gaseous Methane
Shm Readily and slowly degradable protein Xp-S/Xp-R
Inorganic carbon Sc LCFA Degraders XLCFA
Nitrogen SN Sugar Degraders Xs
LCFA SLCFA Amminoacids Degraders Xam
Sugar SS Sludge concentration Xsl
Amino acids Sam
Accep
ted
Man
uscr
ipt
Dow
nloa
ded
by [
Wag
enin
gen
UR
Lib
rary
] at
22:
41 1
6 O
ctob
er 2
014
21
*only the dimensions of Ksbk is different, i.e.: [ML-2T-1].
Substrate Kinetic constants [T-1]*
Kinetic Process (ρj)
Complex Organic Substrate
Ksbk Disintegration of complex organic matter
Propionate Kpro Up-take of Propionate
Acetate Kac Up-take of acetate Total Valerate and Butyrate
Kc4 Up-take of Valerate and Butyrate
Hydrogen Kh Up-take of hydrogen Methane Km
Carbohydrate (slowly and readily biodegradable)
Kc-S/Kc-R Hydrolysis of carbohydrates
Lipids (slowly and readily biodegradable)
Kl-S/Kl-R
Hydrolysis of lipids
Proteins (slowly and readily biodegradable)
Kp-S/Kl-R Hydrolysis of proteins
LCFA KLCFA Up-take of LCFASugars Ks Up-take of Sugars
Amino acids Kam Up-take of amino acids
Accep
ted
Man
uscr
ipt
Dow
nloa
ded
by [
Wag
enin
gen
UR
Lib
rary
] at
22:
41 1
6 O
ctob
er 2
014

22
Substrate TS
[%]
Kdis
[d-1]
RMSE Kac
[d-1]
RMSE Kpro
[d-1]
Food Waste
4.52 6.5 0.0072 8.47 0.0076 8.47
12.8 4 0.01 5.08 0.019 5.08
19.02 2 0.0065 2.46 0.011 2.46
Rice Straw
4.85 2.5 0.01 8.79 0.005 8.79 14.86 1.25 0.009 5.94 0.001 5.94
23.40 0.65 0.0073 3.51 0.001 3.51
Accep
ted
Man
uscr
ipt
Dow
nloa
ded
by [
Wag
enin
gen
UR
Lib
rary
] at
22:
41 1
6 O
ctob
er 2
014

23
0 20 40 600
0.02
0.04
0.06
0.08
0.1
0.12
0.14
0.16
Time [d]
CH
4 [
mo
l]
(A)
0 0.05 0.1 0.15 0.20
0.02
0.04
0.06
0.08
0.1
0.12
0.14
0.16
Measured CH4 [mol]
Sim
ula
ted
CH
4 [
mo
l]
(B)
0 20 40 600
0.005
0.01
0.015
0.02
0.025
Time [d]
pro
pio
nat
e [m
ol]
(C)
0 20 40 600
0.005
0.01
0.015
0.02
0.025
0.03
0.035
Time [d]
acet
ate
[mo
l]
(D)
0 10 20 30 400
0.05
0.1
0.15
0.2
0.25
0.3
0.35
0.4
Time [d]
CH
4 [
mo
l]
(E)
0 20 40 600
0.005
0.01
0.015
0.02
0.025
0.03
0.035
0.04
0.045
Time [d]
pro
pio
nat
e [m
ol]
(G)
0 20 40 600
0.01
0.02
0.03
0.04
0.05
0.06
0.07
Time [d]
acet
ate
[mol
]
(H)
0 0.1 0.2 0.3 0.40
0.05
0.1
0.15
0.2
0.25
0.3
0.35
0.4
Measured CH4 [mol]
Sim
ula
ted
CH
4 [
mol
]
(F)
0 20 40 600
0.1
0.2
0.3
0.4
0.5
0.6
0.7
Time [d]
CH
4 [
mo
l]
(I)
0 0.2 0.4 0.6 0.80
0.1
0.2
0.3
0.4
0.5
0.6
0.7
Measured CH4 [mol]
Sim
ula
ted
CH
4 [
mo
l]
(J)
0 20 40 600
0.005
0.01
0.015
0.02
0.025
0.03
0.035
0.04
0.045
0.05
Time [d]
pro
pio
nat
e [m
ol]
(K)
0 20 40 600
0.01
0.02
0.03
0.04
0.05
0.06
0.07
Time [d]
acet
ate
[mo
l]
(L)
Accep
ted
Man
uscr
ipt
Dow
nloa
ded
by [
Wag
enin
gen
UR
Lib
rary
] at
22:
41 1
6 O
ctob
er 2
014

24
0 20 40 600
0.02
0.04
0.06
0.08
0.1
0.12
0.14
Time [d]
CH
4 [
mo
l]
(A)
0 0.05 0.1 0.15 0.20
0.02
0.04
0.06
0.08
0.1
0.12
0.14
Measured CH4 [mol]
Sim
ula
ted
CH
4 [
mol
]
(B)
0 20 40 600
0.2
0.4
0.6
0.8
1
1.2
1.4
1.6
1.8x 10
-3
Time [d]
pro
pion
ate
[mol
]
(C)
0 20 40 600
0.5
1
1.5
2
2.5
3x 10
-3
Time [d]
acet
ate
[mol
]
(D)
0 20 40 600
0.02
0.04
0.06
0.08
0.1
0.12
Time [d]
CH
4 [
mol
]
(E)
0 0.05 0.1 0.15 0.20
0.02
0.04
0.06
0.08
0.1
0.12
Measured CH4 [mol]
Sim
ula
ted
CH
4 [
mol
]
(F)
0 20 40 600
1
2
3
4
5
6
7x 10
-3
Time [d]
prop
iona
te [
mol]
(G)
0 20 40 600
1
2
3
4
5
6x 10
-3
Time [d]ac
etat
e [m
ol]
(H)
0 20 40 600
0.05
0.1
0.15
0.2
0.25
Time [d]
CH
4 [
mol
]
(I)
0 0.1 0.2 0.3 0.40
0.05
0.1
0.15
0.2
0.25
Measured CH4 [mol]
Sim
ula
ted C
H4 [
mol]
(J)
0 20 40 600
0.002
0.004
0.006
0.008
0.01
0.012
0.014
0.016
0.018
0.02
Time [d]
pro
pio
nat
e [m
ol]
(K)
0 20 40 600
1
2
3
4
5
6
7
8
9x 10
-3
Time [d]
acet
ate
[mol]
(L)
Accep
ted
Man
uscr
ipt
Dow
nloa
ded
by [
Wag
enin
gen
UR
Lib
rary
] at
22:
41 1
6 O
ctob
er 2
014

25
a)
b)
Accep
ted
Man
uscr
ipt
Dow
nloa
ded
by [
Wag
enin
gen
UR
Lib
rary
] at
22:
41 1
6 O
ctob
er 2
014