Co-Digestion Capacity Analysis - State Water Resources ...
125
California State Water Resources Control Board Co‐Digestion Capacity Analysis Summary Paper No. TASK ‐ "AS IS" SCENARIO ANALYSIS FINAL DRAFT | May ͵ Co‐Digestion Capacity Analysis Prepared for the California State Water Resources Control Board under Agreement #ͳ‐Ͱ‐Ͱ CO‐DIGESTION CAPACITY IN CALIFORNIA FINAL | June ͵
-
Upload
khangminh22 -
Category
Documents
-
view
2 -
download
0
Transcript of Co-Digestion Capacity Analysis - State Water Resources ...
California State Water Resources Control Board Co‐Digestion Capacity Analysis
Summary Paper No. TASK ‐ "AS IS" SCENARIO ANALYSIS
FINAL DRAFT | May
Co‐Digestion Capacity Analysis Prepared for the California State Water Resources Control Board under Agreement # ‐ ‐
CO‐DIGESTION CAPACITY IN CALIFORNIA
FINAL | June

Co‐Digestion Capacity Analysis Prepared for the California State Water Resources Control Board under
Agreement # ‐ ‐
CO‐DIGESTION CAPACITY IN CALIFORNIA
FINAL | June
/ / / /
/ / / /

INTRODUCTION | CO‐DIGESTION CAPACITY ANALYSIS | SWRCB
FINAL | JUNE | i
Disclaimer
Prepared for the California State Water Resources Control Board under Agreement # ‐ ‐
. The contents of this document do not necessarily reflect the views and policies of the State
Water Resources Control Board, nor does mention of trade names or commercial products
constitute endorsement or recommendation for use.
Acknowledgements
The State Water Resources Control Board provided the majority of funding for the project
( , ). Additional in‐kind support was provided by all of the participating agencies, the
California Association of Sanitation Agencies, and Carollo Engineers, Inc.
The team would like to thank Jelena Hartman, the project manager at the California State Water
Resources Control Board, as well as Charlotte Ely (U.S. Environmental Protection Agency) and
Max Gomberg (California State Water Resources Control Board) for guidance and steering on
this project.
The team would also like to thank the wastewater treatment agencies, listed in Appendix A,
who provided input through the Carollo survey. Additionally, special thanks is merited to
the Central Marin Sanitation Agency, Delta Diablo, East Bay Municipal Utility District, Sanitation
Districts of Los Angeles County, City of Manteca, and Silicon Valley Clean Water who are
included as case studies in this report.
The technical advisors for this project consisted of Greg Kester, PE (WI) (California Association of
Sanitation Agencies), Christian Tasser, PE (Carollo Engineers Inc.), Christine Polo, PE (Carollo
Engineers Inc.), Tom Mossinger, PE (Carollo Engineers Inc.), and Tyler Dougherty, PE (Carollo
Engineers Inc.).
Project Team
Project Manager
Rashi Gupta, PE
Carollo Engineers, Inc.
Assistant Project Manager
Sarah Deslauriers, PE, ENV SP
Carollo Engineers, Inc.
Team Leads
Elizabeth Charbonnet, PE
Carollo Engineers, Inc.
Chelsea Ransom, PE (MI), ENV SP
Carollo Engineers, Inc.
Robert Williams, PE
University of California at Davis
SWRCB | CO‐DIGESTION CAPACITY ANALYSIS | INTRODUCTION
ii | JUNE | FINAL
‐This Page Intentionally Left Blank‐
INTRODUCTION | CO‐DIGESTION CAPACITY ANALYSIS | SWRCB
FINAL | JUNE | iii
Contents
Introduction 1
Chapter 1 Food Waste Disposal Analysis
. Baseline Organic Waste Inventory ‐
. . County‐Specific Organic Waste Disposal ‐
. Projecting Food Waste Disposal in and ‐
. . Senate Bill Edible Food Rescue Goal ‐
. . Practical Food Waste Recovery Factors for Co‐Digestion at Municipal WWTPs ‐
. . Summary of Food Waste That Could be Diverted to Municipal WWTPs ‐
. Summary of Estimates and Recommendations ‐
. References ‐
Chapter 2 Analysis of Existing Capacity For Co-Digestion Of Food Waste
. Existing Infrastructure and Excess Capacity ‐
. . Solid Organic Waste Receiving Stations ‐
. . Anaerobic Digestion Capacity ‐
. . Biosolids Dewatering ‐
. . Biogas Conditioning, Use, and Flare ‐
. Extrapolated Statewide Capacity ‐
. Maximizing Co‐digestion Capacity at the Seven Facilities with Existing Infrastructure ‐
. Conclusion ‐
. References ‐
Chapter 3 Investments To Maximize Co-Digestion
. Additional Infrastructure Needed to Maximize Co‐Digestion ‐
. Economic Impact ‐
. . Capital Costs ‐
. . Operations and Maintenance Costs ‐
. . Revenue ‐
. Economic Analysis for an Illustrative WWTP ‐
. Statewide Investment Estimates ‐
. . Comparison to Recent Cost Estimates ‐
. Community Impacts ‐
SWRCB | CO‐DIGESTION CAPACITY ANALYSIS | INTRODUCTION
iv | JUNE | FINAL
. . Job Creation ‐
. . Truck Trips, Noise, and Odors ‐
. Regulatory Considerations ‐
. . Water Quality ‐
. . Air Quality ‐
. . Solids Management ‐
. Summary of Findings ‐
. References ‐
Greenhouse Gas Emissions Reductions From Co-Digestion of Food Waste
. Co‐Digestion Emission Reduction Factor ‐
. . Emissions ‐
. . Emission Reductions ‐
. GHG Emission Reduction Potential ‐
. References ‐
Chapter 5 Co-Digestion at Small to Medium Size Wastewater Treatment Plants
. Case Studies ‐
. . Central Marin Sanitation Agency ‐
. . Manteca Wastewater Quality Control Facility ‐
. . Delta Diablo ‐
. . Silicon Valley Clean Water ‐
. Conclusions ‐
. . Factors Facilitating Co‐Digestion ‐
. . Factors Impeding Co‐Digestion ‐
. Screening Questions for Co‐Digestion ‐
. References ‐
Chapter 6 Co-Digestion at Large Wastewater Treatment Plants
. East Bay Municipal Utility District ‐
. . Resource Recovery Program ‐
. . Effluent Impacts ‐
. . Biogas Benefits and Challenges ‐
. . Biosolids Benefits and Challenges ‐
. Sanitation Districts of Los Angeles County ‐
INTRODUCTION | CO‐DIGESTION CAPACITY ANALYSIS | SWRCB
FINAL | JUNE | v
. . Food Waste Project ‐
. . Biogas Benefits and Challenges ‐
. . Biosolids Benefits and Challenges ‐
. Summary ‐
. References ‐
Appendices
Appendix A Food Waste Disposal Inventories
Appendix B CalRecycle Waste Regions
Appendix C Per Capita Food Waste Disposal Estimates
Appendix D Baseline Organic Waste Disposal Inventory
Appendix E Total and Per Capita Solid Waste Disposal Trend
Appendix F Projected Food Waste Disposal Scenarios by County in Short Tons, &
Appendix G Recoverable Food Waste in Short Wet Tons as Diverted from a Landfill
Appendix A Survey and Extrapolation to All of California
Appendix B Excess Anaerobic Digestion and Biogas Capacity Analysis Methods
Appendix C Summary of Assumptions Used in Capacity Analysis
Appendix A Summary of Assumptions Used in Cost Analysis
Appendix B Summary of Capital Cost Basis
Appendix C Breakdown of Unit Capital Cost Components Used for Biogas Beneficial Use
Systems
Appendix D Summary of O&M Costs and Revenue Basis
Appendix E Capital Recovery Factor
Appendix F Optimization of Statewide Co‐digestion Implementation to Decrease Costs
Appendix G Funding Opportunities for Bioenergy and GHG Reducing Projects
Appendix A CMSA Presentation for CWEA Annual Conference
Appendix B CMSA MSS Feedstock Agreement
Appendix C CMSA Risk Analysis
Appendix D Screening Questions for Co‐Digestion
Tables
Table . Estimated Regional Food Waste Disposal ‐
Table . Projected Food Waste by Region (million short wet tons per year) ‐
SWRCB | CO‐DIGESTION CAPACITY ANALYSIS | INTRODUCTION
vi | JUNE | FINAL
Table . Potential Range of Recoverable and Digestible Food Waste by Region
(million short wet tons per year as diverted from a landfill) ‐
Table A. and Food Waste Disposal by Region Compared to LBNL
Estimates (million short wet tons) A‐
Table D. Total MSW and Food Waste Disposal and per‐capita estimates,
County of Origin (“disposed by”) D‐
Table D. Disposal by Facility in Short Wet Tons D‐
Table F. Projected Food Waste Disposal Scenarios by County in Short Wet Tons,
and (assumes no recovery or diversion) F‐
Table G. Recoverable Food Waste in Short Wet Tons as Diverted from a Landfill G‐
Table . Summary of Survey Results for Excess Capacity by Existing Processes at
Individual Facilities ‐
Table . Existing Solid Organic Waste Receiving Stations ‐ Excess Capacity at the
Seven WWTPs with Existing or Planned Solid Organic Waste Receiving
Stations ‐
Table . Existing Dewatering ‐ Excess Capacity at the Seven WWTPs with Existing
or Planned Solid Organic Waste Receiving Stations ‐
Table . Existing Biogas Handling Systems ‐ Excess Capacity at the Seven WWTPs
with Existing or Planned Solid Organic Waste Receiving Stations ‐
Table . Summary of the Existing Capacity Assessment Results for Facilities with
Existing or Planned Food Waste Receiving Stations ‐
Table A. Summary of the Four Data Sources Considered A‐
Table A. Breakdown of Flow by Facility Size and by Region for WWTPs in California A‐
Table A. Percentage of Design Flow Captured in the Carollo Survey A‐
Table A. Percentage Increase for Extrapolation A‐
Table B. Existing Anaerobic Digestion Systems for Facilities with Existing or
Planned Food Waste Receiving Stations ‐ Excess Capacity: Design SRT
Limit with Largest Unit Out of Service (LUOOS) B‐
Table B. Existing Anaerobic Digestion Systems for Facilities with Existing or
Planned Food Waste Receiving Stations ‐ Excess Capacity: ‐day SRT
Limit with All Units In Service (AUIS) B‐
Table B. Observed Change in Biogas Production with Addition of Non‐Municipal
Organic Feedstock B‐
Table B. Existing Biogas Handling Systems for Facilities with Existing or Planned
Food Waste Receiving Stations ‐ Excess Capacity B‐
Table C. Assumptions C‐
Table C. Typical Food Waste Characteristics C‐
INTRODUCTION | CO‐DIGESTION CAPACITY ANALYSIS | SWRCB
FINAL | JUNE | vii
Table C. Typical Biomethane Potential of Food Waste C‐
Table . Illustrative Facility ( , Short Wet Tons of Diverted Food Waste):
Percent Renewable CNG for Onsite Vehicle Fueling Station ‐
Table . Scenario ‐ Statewide Summary of Estimated Costs and Revenues for
Co‐Digestion of . Million Short Wet Tons Diverted from Landfills: Equal
Split of Biogas Beneficial Uses among Electricity Generation, Renewable
CNG for Onsite Vehicle Fueling, and Renewable CNG for Pipeline
Injection ‐
Table . Scenario ‐ Statewide Summary of Estimated Costs and Revenues for
Co‐Digestion of . Million Short Wet Tons Diverted from Landfills: Equal
split of Biogas Beneficial Uses among Electricity Generation, Renewable
CNG for Onsite Vehicle Fueling, and Renewable CNG for Pipeline
Injection ‐
Table . Estimated Job Creation by Region and by Scenario ‐
Table A. Co‐Digestion Cost Assumptions A‐
Table B. Percent Allocations and Cost Factors Used in Capital Cost Estimate B‐
Table B. Percent Change in ‐City Average ENR CCI for January of each Year
from through B‐
Table B. Percent Change in CPI for January of each Year from through B‐
Table F. Summary of Food Waste Allocation Methods to Minimize Estimated
Capital Costs while Co‐Digesting the Divertible and Digestible Food
Waste Projected for F‐
Table G. Programs that have Offered Funding for Co‐digestion Related Projects G‐
Table . Diverted Food Waste Transportation (Inbound) and Biosolids Delivery
(Outbound) Distances and Transportation Emission Factor ‐
Table . Process Emissions for Co‐Digestion per Short Wet Ton of Diverted Food
Waste ‐
Table . Breakdown of Co‐Digestion Emissions Reduction Factors per Wet Ton of
Diverted Food Waste ‐
Table . Summary of GHG Emissions Reduction Potential Associated with Co‐
Digesting Diverted Food Waste under the “As‐Is” and “Future
Investments” Scenarios ‐
Table . Case Study Facility Summary ‐
Table . Organic Waste Program Metrics ‐
Table . CMSA Facility Modifications and Design Criteria ‐
Table . CMSA Organic Waste Program Expenses ‐
Table . CMSA Organic Waste Program Revenues ‐
Table . CMSA Routine Maintenance Activities ‐
SWRCB | CO‐DIGESTION CAPACITY ANALYSIS | INTRODUCTION
viii | JUNE | FINAL
Table . Summary of Reported Organic Feedstocks Received by EBMUD in ‐
Table . Summary of Solid and Liquid Food Waste Types Received at EBMUD to
Date ‐
Table . Summary of EBMUD’s Reported Biosolids End Uses and Disposal in
‐
Table . Summary of JWPCP Reported Biosolids End Uses and Disposal ‐
Figures
Figure . Organic Waste Disposal Trends by Component from to ‐
Figure . Regional MSW Disposal and Population in ‐
Figure . County of Origin (short wet tons per year) ‐
Figure . Projected Food Waste Disposal without Actions to Divert From Landfills ‐
Figure . Food Waste Recovery Mass Balance Schematic ‐
Figure . Projected Food Waste Remaining after Recovery for Co‐digestion at
Municipal WWTPs ‐
Figure . Disposal and Recovery Scenarios to Determine the Range of Food Waste
Quantities that could be Diverted Statewide to Municipal WWTPs ‐
Figure . High and Low Recovery Projections with Total Food Waste Projections ‐
Figure . Spatial Distribution of Recoverable Food Waste by County ( , low
projection) ‐
Figure . Spatial Distribution of Recoverable Food Waste by County ( , low
projection) ‐
Figure B. CalRecycle Waste Regions at the County Level (Cascadia ) B‐
Figure C. Per Capita Food Waste Disposal Values from Literature Compared to
CalRecycle Characterization Data C‐
Figure E. Total and Per Capita Solid Waste Disposal Trend E‐
Figure . Typical Facilities Required for Food Waste Co‐Digestion at a WWTP ‐
Figure . Number of Facilities that Responded to the Survey by Permitted Flow
Capacity ‐
Figure . Inventory of Key Processes at WWTPs with Anaerobic Digestion by
CalRecycle Region ‐
Figure . Total Existing Excess Capacity of Key Systems at Facilities that
Responded to Survey in Short Wet Tons Per Year (TPY) of Diverted Food
Waste by Facility Size ‐
Figure . Total Existing Excess Digestion Capacity in Short Wet TPY of Diverted
Food Waste by Volatile Solids (VS) Loading Rate Limit ‐
INTRODUCTION | CO‐DIGESTION CAPACITY ANALYSIS | SWRCB
FINAL | JUNE | ix
Figure . Total Existing Excess Capacity per Required Process in Wet Short TPY of
Food Waste by Facility Size ‐
Figure . Total Existing Excess Capacity per Required Process in Short Wet TPY of
Food Waste ‐ Southern Region ‐
Figure . Total Existing Excess Capacity per Required Process in Short Wet TPY of
Food Waste ‐ Bay Area Region ‐
Figure . Total Existing Excess Capacity per Required Process in Short Wet TPY of
Food Waste ‐ Central Valley Region ‐
Figure . Total Existing Excess Capacity per Required Process in Short Wet TPY of
Food Waste ‐ Coastal Region ‐
Figure . Total Existing Excess Capacity per Required Process in Short Wet TPY of
Food Waste ‐ Mountain Region ‐
Figure . Spatial Distribution of Recoverable and Digestible Food Waste by County
( , low projection) ‐
Figure . Total Existing Excess Digestion Capacity of California WWTPs Under
Various Digester Operating Conditions ‐
Figure . Additional Capacity Needed by Process to Match Existing Excess Capacity
for Scenario ‐
Figure . Additional Capacity Needed by Process to Match Existing Excess Capacity
for Scenario ‐
Figure . Spread of Unit Cost Data Used to Determine Median Unit Project Costs ‐
Figure . Historical Value of LCFS Credits (NESTE ) ‐
Figure . Historical Value of RIN Credits (EPA ) ‐
Figure . Normalized (Costs) and Revenues per Short Wet Ton of Diverted Food
Waste by Biogas End‐Use for an Illustrative Facility Handling , Short
Wet Tons of Diverted Food Waste Per Year ‐
Figure . Normalized (Costs) or Revenues per Short Wet Ton of Diverted Food
Waste by Biogas End Use for Various Facility Sizes ‐
Figure . Normalized Value ( /wet ton diverted) for Scenario and Scenario as
Electricity and CNG Prices Vary ‐
Figure F. Percent Breakdown of Food Waste Co‐Digested by Location F‐
Figure F. Percent Breakdown of Food Waste Co‐Digested by WWTP Size F‐
Figure . Comparison of Emission Reduction Factors for Co‐digestion (Co‐DigERF)
and Composting (CERF) ‐
Figure . CMSA Food Waste and FOG Receiving and Polishing Process Flow
Diagram ‐
Figure . CMSA Food Waste Slurry as Delivered ‐
SWRCB | CO‐DIGESTION CAPACITY ANALYSIS | INTRODUCTION
x | JUNE | FINAL
Figure . CMSA Contaminants Removed by Paddle Finisher ‐
Figure . EBMUD Biogas Production Before and After Implementation of the R
Program ‐
Figure . LACSD JWPCP Comparison of Average Weekly Biogas Production, and
Biosolids Production from Control and Test Digesters (September‐
November Demonstration Project) ‐
INTRODUCTION | CO‐DIGESTION CAPACITY ANALYSIS | SWRCB
FINAL | JUNE | xi
Abbreviations
AB Assembly Bill
AD anaerobic digestion
ADC alternative daily cover
ADWF average dry weather flow
AUIS all units in service
BEAM Biosolids Emissions Assessment Model
BioMAT Bioenergy Market Adjusting Tariff
Board Board of Commissioners
Btu British thermal unit
Cal‐ARP California accidental release prevention
CalRecycle California's Department of Resources Recycling and Recovery
CARB California Air Resources Board
Carmel Carmel Area Wastewater District
Carollo Carollo Engineers, Inc.
CASA California Association of Sanitation Agencies
CCI construction cost index
CCR California Code of Regulations
CCST California Council on Science and Technology
CEC California Energy Commission
CERF compost emission reduction factor
cf cubic feet
CHP combined heat and power
CLEEN California Lending for Energy and Environmental Needs
CMSA Central Marin Sanitation Agency
CNG compressed natural gas
CO carbon monoxide
CO carbon dioxide
CO e carbon dioxide equivalence
COD chemical oxygen demand
CORe® Centralized Organic Recycling
CPI consumer price index
CPUC California Public Utilities Commission
CRF capital recovery factor
CSE Center for Sustainable Energy
DRU demographic research unit
EBMUD East Bay Municipal Utility District
EBS® Engineered Bioslurry
ECBP East County Bioenergy Project
EERE Energy Efficiency & Renewable Energy
EI&C electrical, instrumentation, and controls
ENR engineering news record

SWRCB | CO‐DIGESTION CAPACITY ANALYSIS | INTRODUCTION
xii | JUNE | FINAL
EPA United States Environmental Protection Agency
EREF Environmental Research and Education Foundation
ERS Economic Research Service
F E Food to Energy
FOG fats, oil, and grease
FTE full time equivalent
g grams
GGE gallon gas equivalent
GHG greenhouse gas
Goleta Goleta Sanitary District
gpd gallons per day
gpm gallons per minute
H S hydrogen sulfide
Hp horsepower
HVIP Hybrid and Zero‐Emission Truck and Bus Voucher Incentive Program
IBank California Infrastructure and Economic Development Bank
IC internal combustion
ISO Independent System Operator
JPA Joint Powers Agreement or Authority
JWPCP Joint Water Pollution Control Plant
kg kilogram
kWh kilowatt hour
LACSD Sanitation Districts of Los Angeles County
lb pound
LBNL Lawrence Berkeley National Lab
lbs pounds
lbs/p/week pounds per person per week
LCFS low carbon fuel standard
LHV low heating value
LNG liquefied natural gas
LUOOS largest unit out of service
MCE Marin Clean Energy
MDRR Mount Diablo Resource Recovery
MG million gallons
mg/L milligrams per liter
mgd million gallons per day
MJ mega joule
mm millimeter
MMBtu million British thermal units
MOA memorandum of agreement
MRF materials recovery facility
MSS Marin Sanitary Services
MSW municipal solid waste
INTRODUCTION | CO‐DIGESTION CAPACITY ANALYSIS | SWRCB
FINAL | JUNE | xiii
MT metric ton
MT CO e metric tons of carbon dioxide equivalent emissions
MW megawatt
MWh megawatt hour
NOx nitrogen oxides
NPDES National Pollutant Discharge Elimination System
NPV net present value
NRDC National Resource Defense Council
O&M operations and maintenance
OCSD Orange County Sanitation District
OREX™ Organics Extrusion Press
OSHA Occupational Safety and Health Administration
PG&E Pacific Gas and Electric
ppd pounds per day
PSM process safety management
R resource recovery
RCNG renewable compressed natural gas
ReFED Rethink Food Waste Through Economics and Data
Resolution Comprehensive Response on Climate Change
RFS Renewable Fuel Standard
RIN renewable identification number
RMP risk management plan
RNG renewable natural gas
SB Senate Bill
SBWMA South Bayside Waste Management Authority
SCAQMD South Coast Air Quality Management District
SCE Southern California Edison
scf standard cubic feet
scfd standard cubic feet per day
scfm standard cubic feet per minute
SCG SoCalGas
SGIP self‐generation incentive program
SJVAPCD San Joaquin Valley Air Pollution Control District
SOP standard operating procedures
SRT solids residence time
SSO source separated organics
SVCW Silicon Valley Clean Water
SWRCB State Water Resources Control Board
TPY tons per year
TS total solids
TWAS thickened waste activated sludge
USDA United States Department of Agriculture
VFD variable frequency drive
SWRCB | CO‐DIGESTION CAPACITY ANALYSIS | INTRODUCTION
xiv | JUNE | FINAL
VOC volatile organic carbon VS volatile solids VSLR volatile solids loading rate WMA Waste Management Agency WWTP wastewater treatment plant
INTRODUCTION | CO‐DIGESTION CAPACITY ANALYSIS | SWRCB
FINAL | JUNE |
INTRODUCTION
In , Senate Bill (SB ) was adopted requiring the reduction of short‐lived climate
pollutant emissions, including a percent reduction below levels in methane emissions
statewide by . Because landfills represent percent of the state's methane inventory, a key
strategy to achieve methane reduction is to divert organic waste from landfills to prevent the
degradation that leads to methane production and release. SB establishes targets to
achieve a percent reduction in the level of statewide disposal of organic waste from the
level by , and a percent reduction by .
In March of , the California State Water Resources Control Board adopted its
Comprehensive Response on Climate Change (Resolution) promoting measures taken by the
water industry that mitigate greenhouse gas emissions and adapt to the effects of climate
change. The Resolution directs the State Water Board staff to support the California Air
Resources Board’s Short‐Lived Climate Pollutant Reduction Strategy, which assesses
opportunities to reduce methane emissions from landfills through organic waste diversion.
Municipal wastewater treatment plants (WWTPs) are identified as part of the solution by
accepting food waste diverted from landfills and co‐digesting it with sewage sludge. Through
co‐digestion of diverted food waste in anaerobic digesters, municipal WWTPs can produce,
capture, and make beneficial use of biogas, which is a renewable source of methane.
The State Water Board received a multi‐purpose grant from the United States Environmental
Protection Agency (EPA) to analyze co‐digestion capacity at municipal WWTPs in California. The
State Water Board in turn issued a Request for Proposals for the project and awarded it to
Carollo Engineers, Inc. (Carollo). Carollo and the State Water Board are leading the Co‐Digestion
Capacity Analysis to determine the extent to which municipal WWTPs can support the
implementation of SB .
The chapters that summarize this Co‐Digestion Capacity Analysis include:
Chapter ‐ Food Waste Disposal Analysis
Chapter ‐ Analysis of Existing Capacity for Co‐Digestion of Food Waste
Chapter ‐ Investments to Maximize Co‐Digestion
Chapter ‐ Greenhouse Gas Emission Reductions from Co‐Digestion of Food Waste
Chapter ‐ Co‐Digestion at Small to Medium Size Wastewater Treatment Plants
Chapter ‐ Co‐Digestion at Large Wastewater Treatment Plants
Chapter describes the results of the food waste disposal analysis, in which we estimate the
amount and spatial distribution of food waste in and . We use the food waste
projections from this chapter in all subsequent analyses.
In Chapter , we analyze the excess capacity of municipal WWTPs in California to accept and co‐
digest food waste diverted from landfills, beneficially use the resulting biogas, and process
biosolids within existing onsite infrastructure. We base this analysis on a survey developed and
distributed to WWTPs for this project. We build on the capacity assessment from this chapter to
determine additional infrastructure needs in Chapter .
SWRCB | CO‐DIGESTION CAPACITY ANALYSIS | INTRODUCTION
| JUNE | FINAL
In Chapter , we estimate the infrastructure investments needed for WWTPs to fully utilize their
existing excess anaerobic digestion capacity to process food waste diverted from landfills. These
infrastructure investments include systems to accept food waste slurry, manage the resulting
biosolids, and beneficially use the produced biogas. Chapter additionally presents the costs,
benefits, and community impacts associated with maximizing co‐digestion of food waste at
California’s WWTPs. We summarize regulatory considerations that impact the feasibility of co‐
digestion in the state, and present funding opportunities for bioenergy and GHG‐reducing
projects. This analysis provides a comprehensive assessment of the infrastructure needs and
potential impacts of co‐digestion at WWTPs across the state. However, it is focused on WWTPs
and the upgrades required onsite. We assume that food waste will be collected and pre‐
processed offsite, and then delivered to WWTPs as a pumpable slurry. To develop a holistic
assessment of investment needs, we recommend additionally studying the investments required
for this offsite pre‐processing.
In Chapter we estimate the GHG emissions reduction potential associated with diverting food
waste from landfills to municipal WWTPs for co‐digestion. We first derive a co‐digestion
emissions reduction factor. Using information about the amount of projected divertible and
digestible food waste (Chapter ), the estimated existing capacity for co‐digestion (Chapter ),
and potential investments to maximize co‐digestion (Chapter ), we assess the possible GHG
emission reductions from co‐digestion of food waste.
Chapter presents case studies from four medium sized facilities in California that do or are
planning to receive food waste for co‐digestion: Central Marin Sanitation Agency, Manteca
Wastewater Quality Control Facility, Delta Diablo, and Silicon Valley Clean Water. The factors
that impede and facilitate co‐digestion at these facilities are unique, however the lessons learned
are relevant to facilities of all sizes throughout California.
Chapter describes the co‐digestion systems and operations of two large facilities: the East Bay
Municipal Utility District’s Main Wastewater Treatment Plant, and the Sanitation Districts of Los
Angeles County’s Joint Water Pollution Control Plant. We describe the digestion system at each
facility and highlight how co‐digestion of food waste has impacted biogas and biosolids
production.
Appendices associated with each chapter provide additional information on analyses,
assumptions, and references.
CHAPTER 1: FOOD WASTE DISPOSAL ANALYSIS | CO-DIGESTION CAPACITY ANALYSIS | SWRCB
FINAL | JUNE 2019 | 1-1
Chapter 1
FOOD WASTE DISPOSAL ANALYSIS
1.1 2016 Baseline Organic Waste Inventory
This project specifically focuses on co-digestion as an avenue for the state to meet its organic
waste diversion mandates. Substrates that would be suitable for co-digestion include high-moisture and/or low-fiber organic material. Food waste, properly collected and processed,
meets these suitability criteria and is thus a potential feedstock for co-digestion at wastewater
treatment plants (WWTPs). The other organic components of Municipal Solid Waste (MSW) such as paper and cardboard or grass and woody material, are not suitable for WWTP anaerobic
digesters because of their poor digestibility and are better handled in other ways (e.g.,
composting). When considering the current MSW disposal stream, we assume food waste is the only component suitable for co-digestion, which is the focus of this study.
California's Department of Resources Recycling and Recovery (CalRecycle) tracks total annual waste disposal in the State of California. In addition, CalRecycle has conducted four waste
characterization studies to assess the composition of the disposal stream (Table 1.1), with the
most recent done in 2014. For this project, we use the CalRecycle disposal data from 2017 and the 2014 Waste Characterization Study (Cascadia 2015) to estimate the baseline organic waste
disposal for 2017. From the 2017 baseline, we estimate the amount and spatial distribution of
food waste in 2025 and 2030.
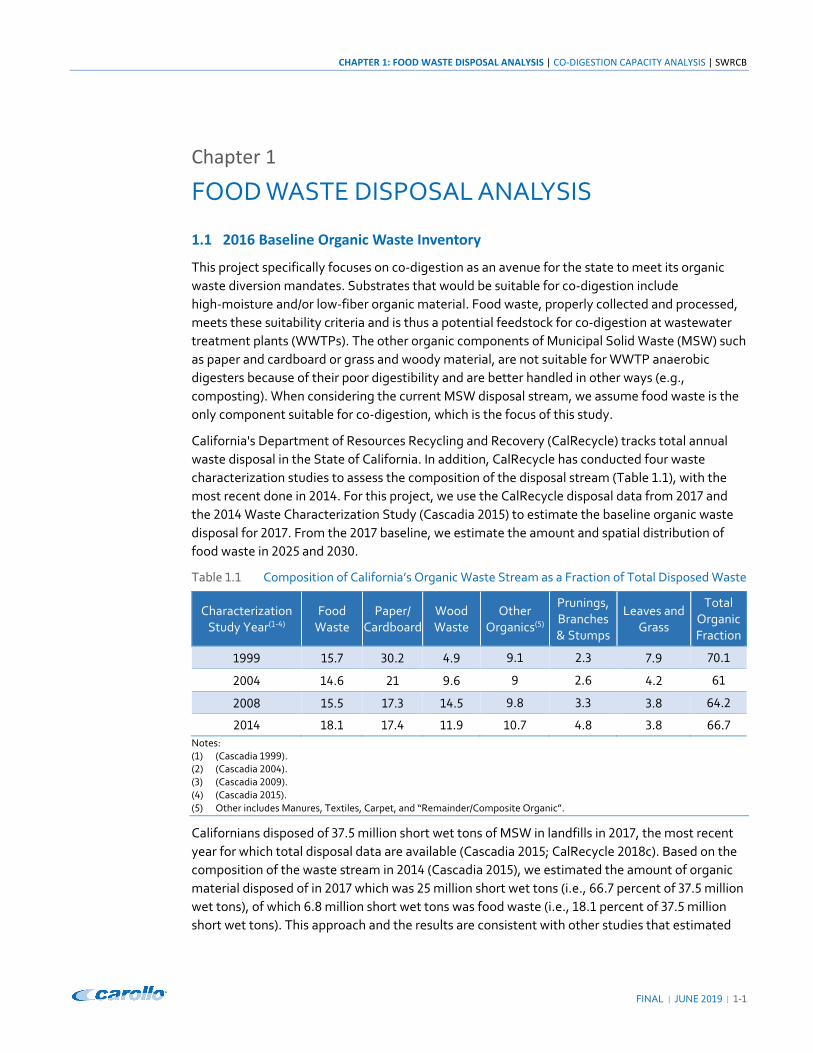
Table 1.1 Composition of California’s Organic Waste Stream as a Fraction of Total Disposed Waste
Characterization Study Year(1-4)
Food Waste
Paper/ Cardboard
Wood Waste
Other Organics(5)
Prunings, Branches & Stumps
Leaves and Grass
Total Organic Fraction
1999 15.7 30.2 4.9 9.1 2.3 7.9 70.1
2004 14.6 21 9.6 9 2.6 4.2 61
2008 15.5 17.3 14.5 9.8 3.3 3.8 64.2
2014 18.1 17.4 11.9 10.7 4.8 3.8 66.7 Notes: (1) (Cascadia 1999). (2) (Cascadia 2004). (3) (Cascadia 2009). (4) (Cascadia 2015). (5) Other includes Manures, Textiles, Carpet, and “Remainder/Composite Organic”.
Californians disposed of 37.5 million short wet tons of MSW in landfills in 2017, the most recent
year for which total disposal data are available (Cascadia 2015; CalRecycle 2018c). Based on the composition of the waste stream in 2014 (Cascadia 2015), we estimated the amount of organic material disposed of in 2017 which was 25 million short wet tons (i.e., 66.7 percent of 37.5 million wet tons), of which 6.8 million short wet tons was food waste (i.e., 18.1 percent of 37.5 million short wet tons). This approach and the results are consistent with other studies that estimated
SWRCB | CO-DIGESTION CAPACITY ANALYSIS | CHAPTER 1: FOOD WASTE DISPOSAL ANALYSIS
‐ | JUNE | FINAL
the quantity of food waste disposed of in California (Breunig, Jin et al. ) (Williams, Jenkins et
al. ) (see Appendix A).
The . million short wet tons of the total food waste is the gross amount of food waste
that is potentially available for co‐digestion if segregated and recovered from the MSW stream
(i.e., “diverted”). However, the amount that is recoverable with suitable quality at feasible costs
(i.e., “digestible”) is less than this gross quantity, as we discuss in the estimate of food waste
projections (Section . ).
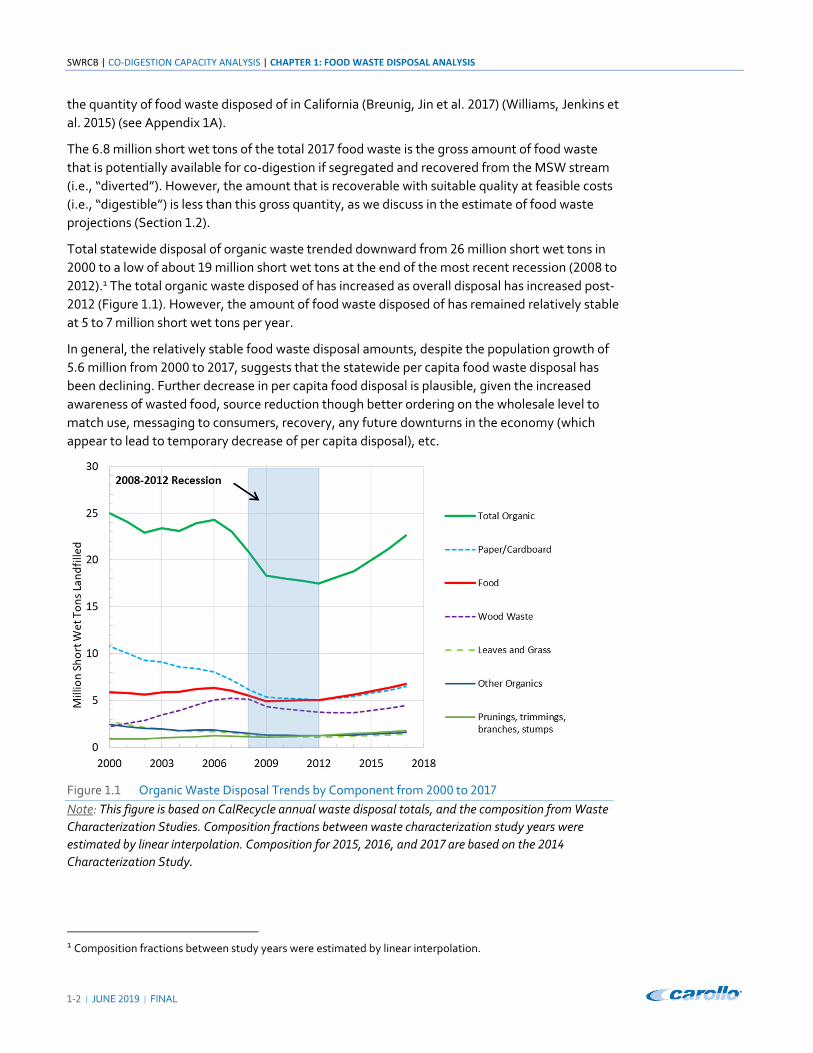
Total statewide disposal of organic waste trended downward from million short wet tons in
to a low of about million short wet tons at the end of the most recent recession ( to
).1 The total organic waste disposed of has increased as overall disposal has increased post‐
(Figure . ). However, the amount of food waste disposed of has remained relatively stable
at to million short wet tons per year.
In general, the relatively stable food waste disposal amounts, despite the population growth of
. million from to , suggests that the statewide per capita food waste disposal has
been declining. Further decrease in per capita food disposal is plausible, given the increased
awareness of wasted food, source reduction though better ordering on the wholesale level to
match use, messaging to consumers, recovery, any future downturns in the economy (which
appear to lead to temporary decrease of per capita disposal), etc.
Figure . Organic Waste Disposal Trends by Component from to
Note: This figure is based on CalRecycle annual waste disposal totals, and the composition from Waste
Characterization Studies. Composition fractions between waste characterization study years were
estimated by linear interpolation. Composition for , , and are based on the
Characterization Study.
1 Composition fractions between study years were estimated by linear interpolation.
CHAPTER 1: FOOD WASTE DISPOSAL ANALYSIS | CO-DIGESTION CAPACITY ANALYSIS | SWRCB
FINAL | JUNE 2019 | 1-3
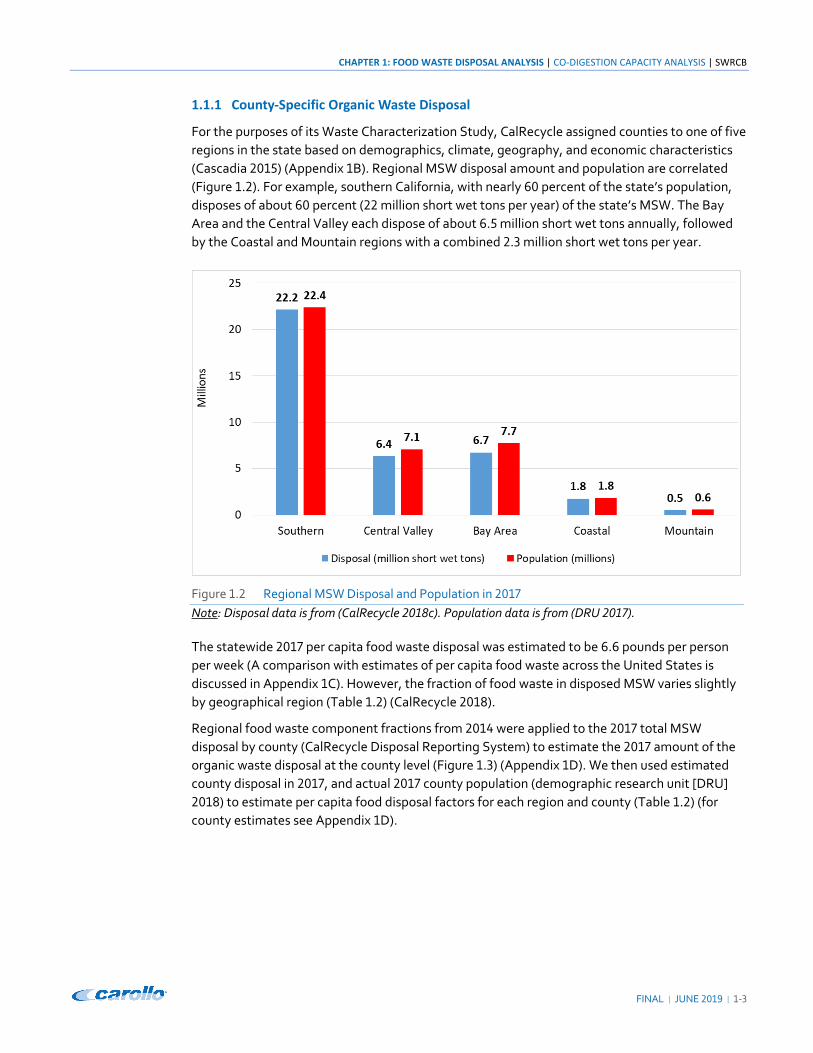
1.1.1 County-Specific Organic Waste Disposal
For the purposes of its Waste Characterization Study, CalRecycle assigned counties to one of five
regions in the state based on demographics, climate, geography, and economic characteristics (Cascadia 2015) (Appendix 1B). Regional MSW disposal amount and population are correlated (Figure 1.2). For example, southern California, with nearly 60 percent of the state’s population,
disposes of about 60 percent (22 million short wet tons per year) of the state’s MSW. The Bay
Area and the Central Valley each dispose of about 6.5 million short wet tons annually, followed
by the Coastal and Mountain regions with a combined 2.3 million short wet tons per year.
Figure 1.2 Regional MSW Disposal and Population in 2017 Note: Disposal data is from (CalRecycle 2018c). Population data is from (DRU 2017).
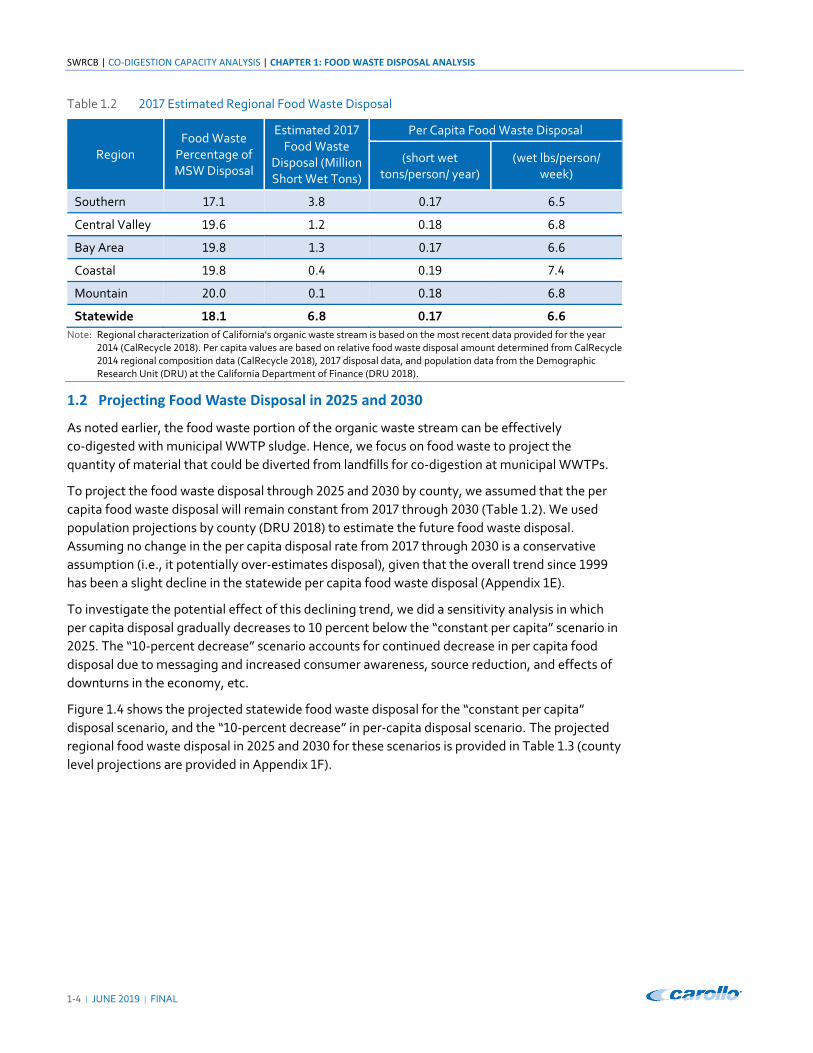
The statewide 2017 per capita food waste disposal was estimated to be 6.6 pounds per person per week (A comparison with estimates of per capita food waste across the United States is discussed in Appendix 1C). However, the fraction of food waste in disposed MSW varies slightly by geographical region (Table 1.2) (CalRecycle 2018).
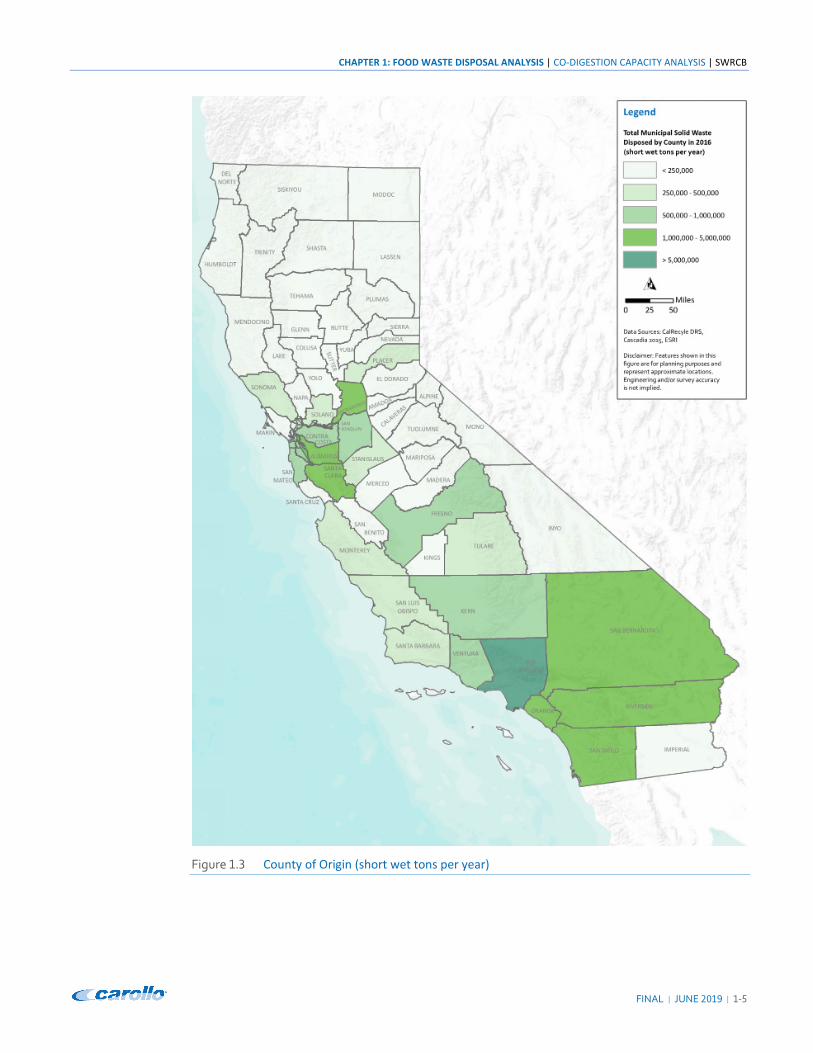
Regional food waste component fractions from 2014 were applied to the 2017 total MSW
disposal by county (CalRecycle Disposal Reporting System) to estimate the 2017 amount of the
organic waste disposal at the county level (Figure 1.3) (Appendix 1D). We then used estimated county disposal in 2017, and actual 2017 county population (demographic research unit [DRU] 2018) to estimate per capita food disposal factors for each region and county (Table 1.2) (for
county estimates see Appendix 1D).
SWRCB | CO-DIGESTION CAPACITY ANALYSIS | CHAPTER 1: FOOD WASTE DISPOSAL ANALYSIS
‐ | JUNE | FINAL
Table . Estimated Regional Food Waste Disposal
Region Food Waste
Percentage of MSW Disposal
Estimated Food Waste
Disposal (Million Short Wet Tons)
Per Capita Food Waste Disposal
(short wet tons/person/ year)
(wet lbs/person/ week)
Southern . . . .
Central Valley . . . .
Bay Area . . . .
Coastal . . . .
Mountain . . . .
Statewide . . . .
Note: Regional characterization of California's organic waste stream is based on the most recent data provided for the year (CalRecycle ). Per capita values are based on relative food waste disposal amount determined from CalRecycle regional composition data (CalRecycle ), disposal data, and population data from the Demographic
Research Unit (DRU) at the California Department of Finance (DRU ).
1.2 Projecting Food Waste Disposal in 2025 and 2030
As noted earlier, the food waste portion of the organic waste stream can be effectively
co‐digested with municipal WWTP sludge. Hence, we focus on food waste to project the
quantity of material that could be diverted from landfills for co‐digestion at municipal WWTPs.
To project the food waste disposal through and by county, we assumed that the per
capita food waste disposal will remain constant from through (Table . ). We used
population projections by county (DRU ) to estimate the future food waste disposal.
Assuming no change in the per capita disposal rate from through is a conservative
assumption (i.e., it potentially over‐estimates disposal), given that the overall trend since
has been a slight decline in the statewide per capita food waste disposal (Appendix E).
To investigate the potential effect of this declining trend, we did a sensitivity analysis in which
per capita disposal gradually decreases to percent below the “constant per capita” scenario in
. The “ ‐percent decrease” scenario accounts for continued decrease in per capita food
disposal due to messaging and increased consumer awareness, source reduction, and effects of
downturns in the economy, etc.
Figure . shows the projected statewide food waste disposal for the “constant per capita”
disposal scenario, and the “ ‐percent decrease” in per‐capita disposal scenario. The projected
regional food waste disposal in and for these scenarios is provided in Table . (county
level projections are provided in Appendix F).
CHAPTER 1: FOOD WASTE DISPOSAL ANALYSIS | CO-DIGESTION CAPACITY ANALYSIS | SWRCB
FINAL | JUNE 2019 | 1-5
Figure 1.3 County of Origin (short wet tons per year)
SWRCB | CO-DIGESTION CAPACITY ANALYSIS | CHAPTER 1: FOOD WASTE DISPOSAL ANALYSIS
1-6 | JUNE 2019 | FINAL
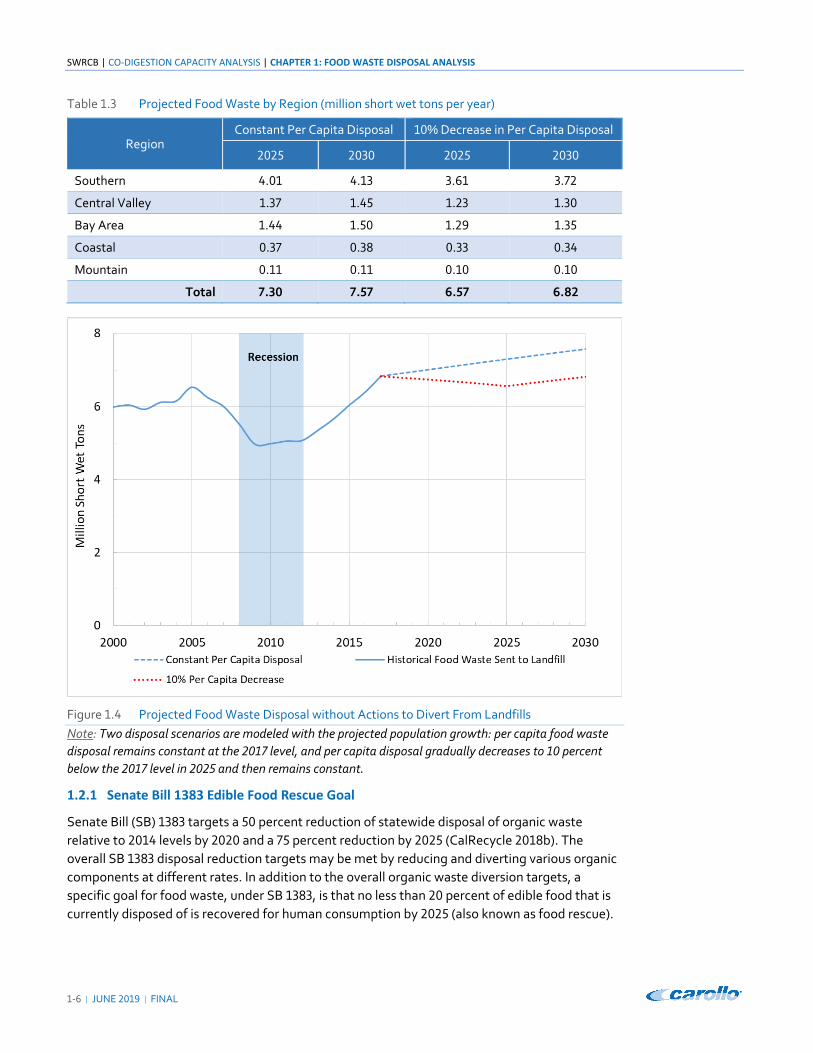
Table 1.3 Projected Food Waste by Region (million short wet tons per year)
Region Constant Per Capita Disposal 10% Decrease in Per Capita Disposal
2025 2030 2025 2030
Southern 4.01 4.13 3.61 3.72
Central Valley 1.37 1.45 1.23 1.30
Bay Area 1.44 1.50 1.29 1.35
Coastal 0.37 0.38 0.33 0.34
Mountain 0.11 0.11 0.10 0.10
Total 7.30 7.57 6.57 6.82
Figure 1.4 Projected Food Waste Disposal without Actions to Divert From Landfills Note: Two disposal scenarios are modeled with the projected population growth: per capita food waste disposal remains constant at the 2017 level, and per capita disposal gradually decreases to 10 percent below the 2017 level in 2025 and then remains constant.
1.2.1 Senate Bill 1383 Edible Food Rescue Goal
Senate Bill (SB) 1383 targets a 50 percent reduction of statewide disposal of organic waste
relative to 2014 levels by 2020 and a 75 percent reduction by 2025 (CalRecycle 2018b). The overall SB 1383 disposal reduction targets may be met by reducing and diverting various organic
components at different rates. In addition to the overall organic waste diversion targets, a specific goal for food waste, under SB 1383, is that no less than 20 percent of edible food that is
currently disposed of is recovered for human consumption by 2025 (also known as food rescue).
CHAPTER 1: FOOD WASTE DISPOSAL ANALYSIS | CO-DIGESTION CAPACITY ANALYSIS | SWRCB
FINAL | JUNE 2019 | 1-7
To account for edible food rescue, we considered the portion of the food waste stream that is
edible, and the source of the edible and rescuable food. Based on the wide range of edible
wasted food amounts reported in the literature, from about 5 to 50 percent of total food waste
sent to the landfill (TetraTech 2015) (Rethink Food Waste Through Economics and Data
[ReFED] 2016), we assumed 20 percent of the food waste stream is edible. Meeting the food rescue goal, the statewide food rescue would amount to 4 percent of the total disposed food waste (20% x 20% = 4%).
Additionally, we assume that the majority of recoverable edible food waste will come from the commercial sector, specifically the grocery and restaurant/food service entities (ReFED 2016). In
2014, 43 percent of the disposed food waste was from the commercial, and 57 percent was from residential sources (Cascadia 2015). Food waste from the residential sector is assumed to have
no rescuable edible portion as the majority of residential waste systems collect food waste in a
mixed waste bin or an organics bin.
Assuming that 20 percent of the food waste stream from the commercial sources (and zero percent of the residential food waste stream) is edible, we estimate that the fraction of edible and rescuable food statewide is 1.7 percent of the total disposed food waste (43% x 20%
x 20% = 1.7%). These assumptions are simplistic, and are meant to understand the potential magnitude of food rescue under SB 1383. Because it is a small fraction (1.7 percent), and
potentially highly variable (TetraTech 2015, ReFED, 2016), we do not account for food rescue
when estimating recoverable food waste for codigestion in the following analysis. For specific information, readers are directed to a forthcoming 2018 Waste Characterization Study that
CalRecycle is expected to release in 2019.
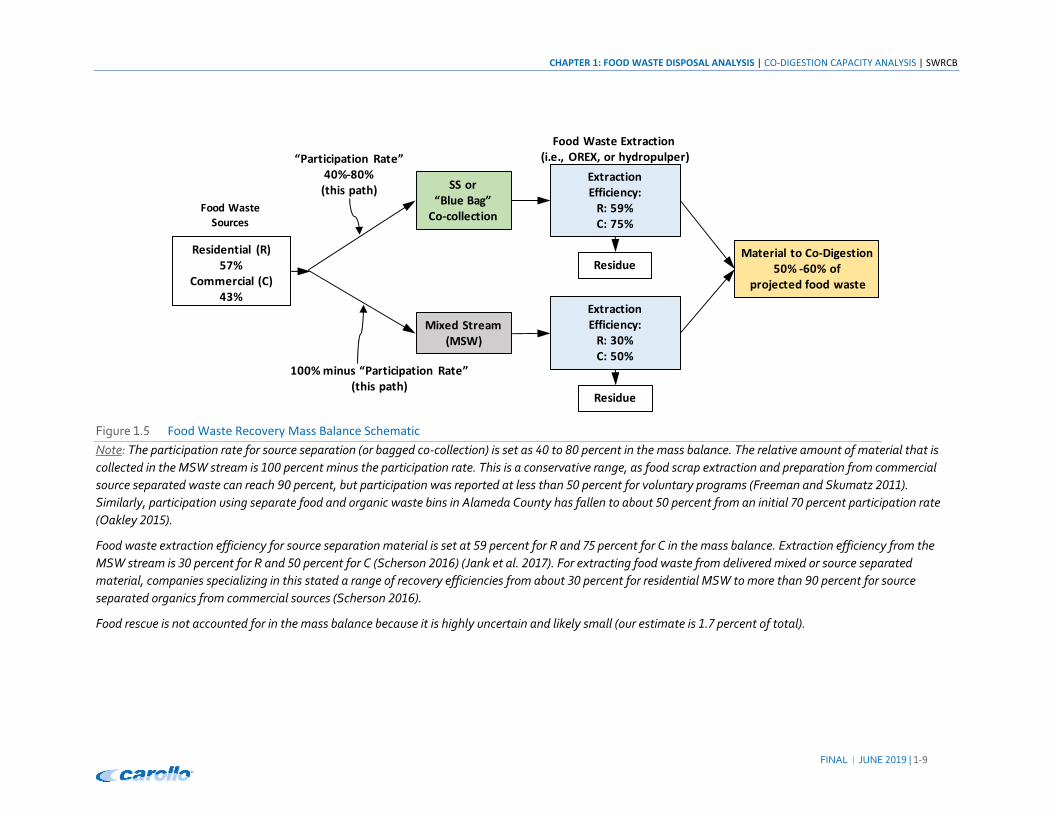
1.2.2 Practical Food Waste Recovery Factors for Co-Digestion at Municipal WWTPs
To be co-digested at municipal WWTPs, food waste needs to be separated from the mixed waste
stream or collected separately at the source (source separation), then processed to remove
contaminants (e.g., glass, plastics, grit, other inert material) and made into a pumpable slurry (Bernstad, Malmquist et al. 2013) (Edwards, Othman et al. 2017) (Nghiem, Koch et al. 2017).
To estimate an overall food waste recovery factor for co-digestion, a simple mass balance
exercise was done using the projected food waste disposal, a range of participation in source separation, and a range of food waste extraction rates (Figure 1.5). In the mass balance, the food
waste sources include both residential, and commercial sectors. Each source type is collected
either via source separation (or bagged co-collection)2 (Lo and Woon 2016) or mixed with other
waste as MSW. As practical food waste recovery factors and reported source separation participation rates vary, we conservatively assumed a mid-range from the literature (Oakley
2015) (Freeman and Skumatz 2011) (Scherson 2016). These assumptions yield an overall food
waste recovery rate of 50 to 60 percent.
2 For example, the “Blue Bag” co-collection model enables residential customers to bag food and kitchen waste in an issued colored bag which is put in the garbage (black) bin and collected with the rest of the trash. The bags are removed at a MRF via optic or manual sorting. After removal from the bags, the food waste has fewer contaminants than MSW, similar to results of source separation methods.
SWRCB | CO-DIGESTION CAPACITY ANALYSIS | CHAPTER 1: FOOD WASTE DISPOSAL ANALYSIS
1-8 | JUNE 2019 | FINAL
-This Page Intentionally Left Blank-
CHAPTER 1: FOOD WASTE DISPOSAL ANALYSIS | CO-DIGESTION CAPACITY ANALYSIS | SWRCB
FINAL | JUNE | ‐
Figure . Food Waste Recovery Mass Balance Schematic
Note: The participation rate for source separation (or bagged co‐collection) is set as to percent in the mass balance. The relative amount of material that is
collected in the MSW stream is percent minus the participation rate. This is a conservative range, as food scrap extraction and preparation from commercial
source separated waste can reach percent, but participation was reported at less than percent for voluntary programs (Freeman and Skumatz ).
Similarly, participation using separate food and organic waste bins in Alameda County has fallen to about percent from an initial percent participation rate
(Oakley ).
Food waste extraction efficiency for source separation material is set at percent for R and percent for C in the mass balance. Extraction efficiency from the
MSW stream is percent for R and percent for C (Scherson ) (Jank et al. ). For extracting food waste from delivered mixed or source separated
material, companies specializing in this stated a range of recovery efficiencies from about percent for residential MSW to more than percent for source
separated organics from commercial sources (Scherson ).
Food rescue is not accounted for in the mass balance because it is highly uncertain and likely small (our estimate is . percent of total).
SS or “Blue Bag”
Co‐collection
Extraction Efficiency:
R: 59%C: 75%
Mixed Stream(MSW)
“Participation Rate” 40%‐80%
(this path)
100% minus “Participation Rate”(this path)
ResidueMaterial to Co‐Digestion
50% ‐60% of projected food waste
Food Waste Extraction(i.e., OREX, or hydropulper)
Extraction Efficiency:
R: 30%C: 50%
Residue
Residential (R)57%
Commercial (C) 43%
Food Waste
Sources

SWRCB | CO-DIGESTION CAPACITY ANALYSIS | CHAPTER 1: FOOD WASTE DISPOSAL ANALYSIS
1-10 | JUNE 2019 | FINAL
-This Page Intentionally Left Blank-
CHAPTER 1: FOOD WASTE DISPOSAL ANALYSIS | CO-DIGESTION CAPACITY ANALYSIS | SWRCB
FINAL | JUNE 2019 | 1-11
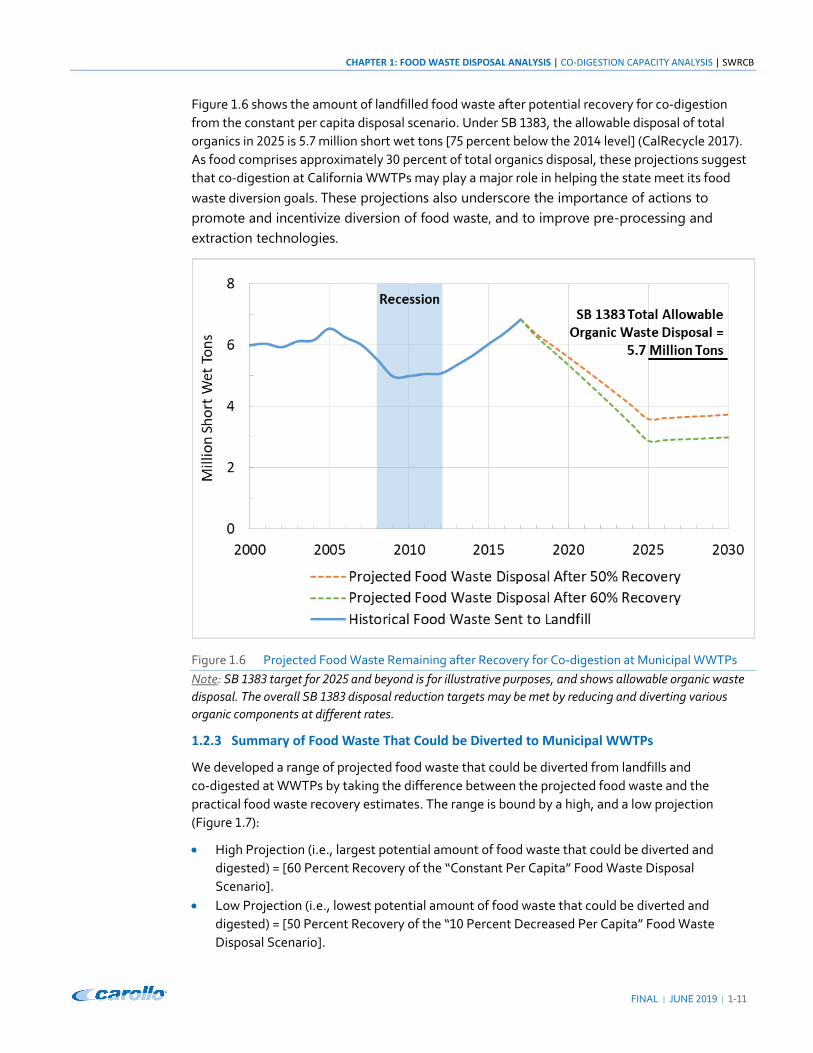
Figure 1.6 shows the amount of landfilled food waste after potential recovery for co-digestion from the constant per capita disposal scenario. Under SB 1383, the allowable disposal of total
organics in 2025 is 5.7 million short wet tons [75 percent below the 2014 level] (CalRecycle 2017).
As food comprises approximately 30 percent of total organics disposal, these projections suggest that co-digestion at California WWTPs may play a major role in helping the state meet its food
waste diversion goals. These projections also underscore the importance of actions to promote and incentivize diversion of food waste, and to improve pre-processing and extraction technologies.
Figure 1.6 Projected Food Waste Remaining after Recovery for Co-digestion at Municipal WWTPs Note: SB 1383 target for 2025 and beyond is for illustrative purposes, and shows allowable organic waste disposal. The overall SB 1383 disposal reduction targets may be met by reducing and diverting various organic components at different rates.
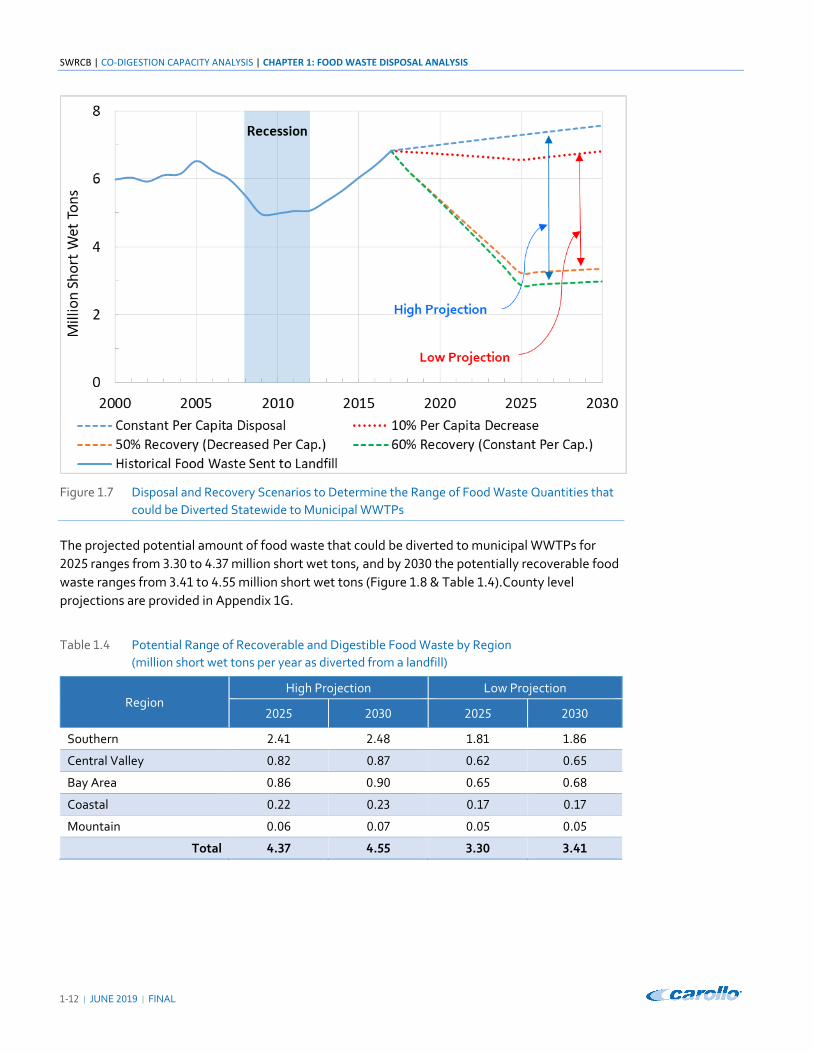
1.2.3 Summary of Food Waste That Could be Diverted to Municipal WWTPs
We developed a range of projected food waste that could be diverted from landfills and co-digested at WWTPs by taking the difference between the projected food waste and the practical food waste recovery estimates. The range is bound by a high, and a low projection (Figure 1.7):
• High Projection (i.e., largest potential amount of food waste that could be diverted and digested) = [60 Percent Recovery of the “Constant Per Capita” Food Waste Disposal Scenario].
• Low Projection (i.e., lowest potential amount of food waste that could be diverted and digested) = [50 Percent Recovery of the “10 Percent Decreased Per Capita” Food Waste Disposal Scenario].
SWRCB | CO-DIGESTION CAPACITY ANALYSIS | CHAPTER 1: FOOD WASTE DISPOSAL ANALYSIS
1-12 | JUNE 2019 | FINAL
Figure 1.7 Disposal and Recovery Scenarios to Determine the Range of Food Waste Quantities that could be Diverted Statewide to Municipal WWTPs
The projected potential amount of food waste that could be diverted to municipal WWTPs for 2025 ranges from 3.30 to 4.37 million short wet tons, and by 2030 the potentially recoverable food waste ranges from 3.41 to 4.55 million short wet tons (Figure 1.8 & Table 1.4).County level
projections are provided in Appendix 1G.
Table 1.4 Potential Range of Recoverable and Digestible Food Waste by Region (million short wet tons per year as diverted from a landfill)
Region High Projection Low Projection
2025 2030 2025 2030
Southern 2.41 2.48 1.81 1.86
Central Valley 0.82 0.87 0.62 0.65
Bay Area 0.86 0.90 0.65 0.68
Coastal 0.22 0.23 0.17 0.17
Mountain 0.06 0.07 0.05 0.05
Total 4.37 4.55 3.30 3.41
CHAPTER 1: FOOD WASTE DISPOSAL ANALYSIS | CO-DIGESTION CAPACITY ANALYSIS | SWRCB
FINAL | JUNE | ‐
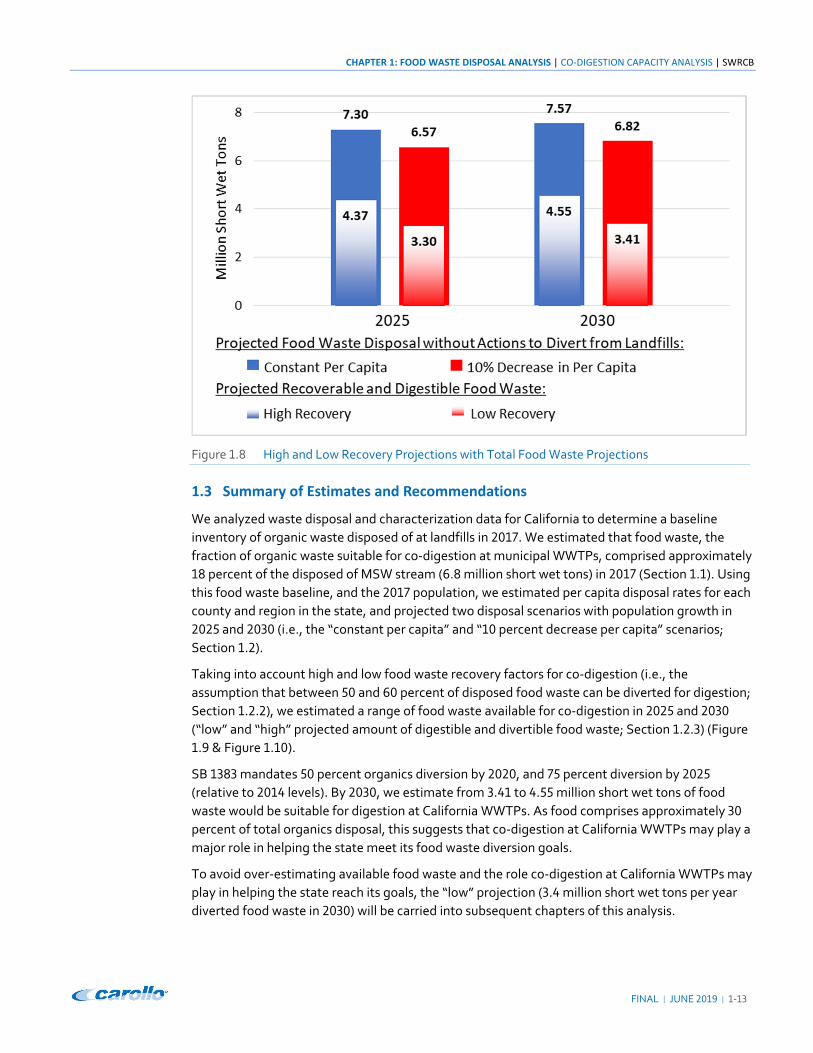
Figure . High and Low Recovery Projections with Total Food Waste Projections
1.3 Summary of Estimates and Recommendations
We analyzed waste disposal and characterization data for California to determine a baseline
inventory of organic waste disposed of at landfills in . We estimated that food waste, the
fraction of organic waste suitable for co‐digestion at municipal WWTPs, comprised approximately
percent of the disposed of MSW stream ( . million short wet tons) in (Section . ). Using
this food waste baseline, and the population, we estimated per capita disposal rates for each
county and region in the state, and projected two disposal scenarios with population growth in
and (i.e., the “constant per capita” and “ percent decrease per capita” scenarios;
Section . ).
Taking into account high and low food waste recovery factors for co‐digestion (i.e., the
assumption that between and percent of disposed food waste can be diverted for digestion;
Section . . ), we estimated a range of food waste available for co‐digestion in and
(“low” and “high” projected amount of digestible and divertible food waste; Section . . ) (Figure
. & Figure . ).
SB mandates percent organics diversion by , and percent diversion by
(relative to levels). By , we estimate from . to . million short wet tons of food
waste would be suitable for digestion at California WWTPs. As food comprises approximately
percent of total organics disposal, this suggests that co‐digestion at California WWTPs may play a
major role in helping the state meet its food waste diversion goals.
To avoid over‐estimating available food waste and the role co‐digestion at California WWTPs may
play in helping the state reach its goals, the “low” projection ( . million short wet tons per year
diverted food waste in ) will be carried into subsequent chapters of this analysis.
SWRCB | CO-DIGESTION CAPACITY ANALYSIS | CHAPTER 1: FOOD WASTE DISPOSAL ANALYSIS
1-14 | JUNE 2019 | FINAL
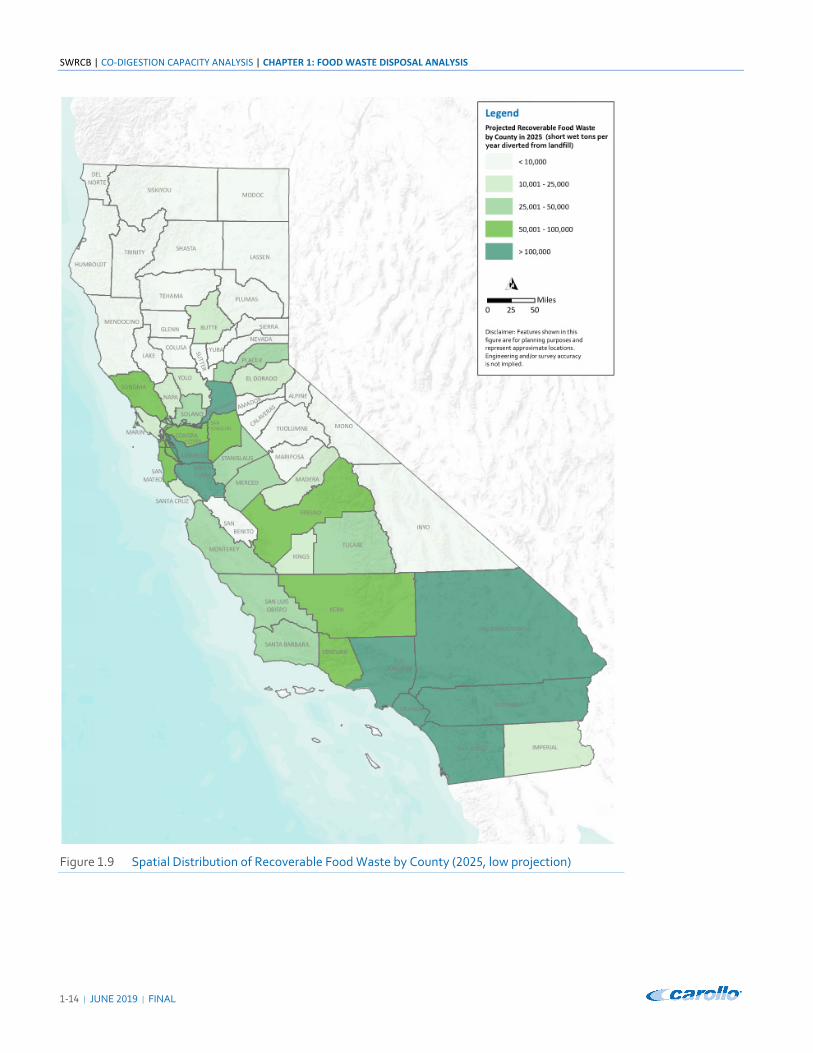
Figure 1.9 Spatial Distribution of Recoverable Food Waste by County (2025, low projection)
CHAPTER 1: FOOD WASTE DISPOSAL ANALYSIS | CO-DIGESTION CAPACITY ANALYSIS | SWRCB
FINAL | JUNE 2019 | 1-15
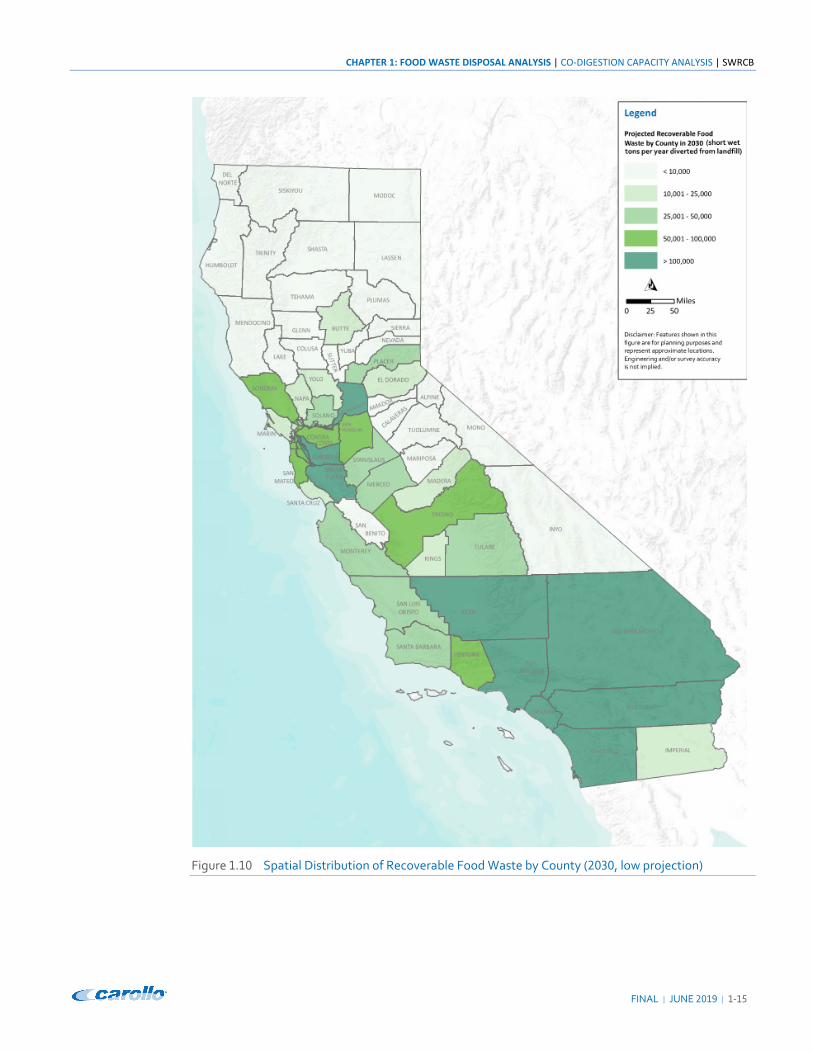
Figure 1.10 Spatial Distribution of Recoverable Food Waste by County (2030, low projection)
SWRCB | CO-DIGESTION CAPACITY ANALYSIS | CHAPTER 1: FOOD WASTE DISPOSAL ANALYSIS
1-16 | JUNE 2019 | FINAL
1.4 References
Bernstad, A., L. Malmquist, et al. (2013). Need for improvements in physical pretreatment of source-separated household food waste. Waste Management 33(3): 746-754.
Breunig, H. M., L. Jin, et al. (2017). Bioenergy Potential from Food Waste in California. Environmental Science & Technology 51(3): 1120-1128.
CalRecycle. (2017). SLCP: Organic Waste Methane Emissions Reductions. Presentation at SB 1383 Informal Rulemaking. https://www2.calrecycle.ca.gov/PublicNotices/Documents/8428.
CalRecycle (2018). Regional characterization of California disposed landfill waste- unpublished 2014 data.
CalRecycle. (2018b). Short-Lived Climate Pollutants (SLCP): Organic Waste Methane Emissions Reductions. Retrieved 2018, from http://www.calrecycle.ca.gov/climate/slcp/.
CalRecycle. (2018c). Disposal Reporting System (DRS): Annual California Solid Waste Disposal. Retrieved 2018, from http://www.calrecycle.ca.gov/LGCentral/Reports/DRS/Statewide/Disposal.aspx.
Carr, N. (2018). Personal Communication.
Cascadia (1999). Statewide Waste Characterization Study. Contractor's report to CIWMB. Publication #340-00-009.
Cascadia (2004). Statewide waste characterization study. From http://www.ciwmb.ca.gov/WasteChar/WasteStudies.htm#2004.
Cascadia (2009). California 2008 Statewide Waste Characterization Study. Contractor's report to CIWMB. Publication #IWMB-2009-023.
Cascadia (2015). 2014 Disposal-Facility-Based Characterization of Solid Waste in California. Contractor's report to CalRecycle. Publication #DRRR-2015-1546. http://www.calrecycle.ca.gov/Publications/Documents/1546/20151546.pdf.
DRU (2017). E-1 Population Estimates for Cities, Counties and the State with Annual Percent Change - January 1, 2016 and 2017. State of California, Department of Finance, Sacramento, California. http://www.dof.ca.gov/Forecasting/Demographics/Estimates/E-1/.
DRU (2018). P-1 Total Estimated and Projected Population for California and Counties: 2010 to2060 in 1-year Increments. Demographic Research Unit. California Department of Finance. Sacramento, California. http://www.dof.ca.gov/Forecasting/Demographics/Estimates/E-1/.
Edwards, J., M. Othman, et al. (2017). Anaerobic co-digestion of municipal food waste and sewage sludge: A comparative life cycle assessment in the context of a waste service provision. Bioresource Technology 223: 237-249.
Freeman, J. and L. Skumatz (2011). Best Management Practices in Food Scraps Programs. Prepared for US EPA Region 5. http://www.foodscrapsrecovery.com/EPA_FoodWasteReport_EI_Region5_v11_Final.pdf.
Jank, A., W. Muller, S. Waldhuber, F. Gerke, C. Ebner and A. Bockreis (2017). Hydrocyclones for the separation of impurities in pretreated biowaste. Waste Management 64: 12-19.
Lo, I. M. C. and K. S. Woon (2016). Food waste collection and recycling for value-added products: potential applications and challenges in Hong Kong. Environmental Science and Pollution Research 23(8): 7081-7091.

CHAPTER 1: FOOD WASTE DISPOSAL ANALYSIS | CO-DIGESTION CAPACITY ANALYSIS | SWRCB
FINAL | JUNE 2019 | 1-17
Nghiem, L. D., K. Koch, et al. (2017). Full scale co-digestion of wastewater sludge and food waste: Bottlenecks and possibilities. Renewable and Sustainable Energy Reviews 72: 354-362.
Oakley, D. (2015). Alameda County: Troubling trend in recycling food waste. East Bay Times.
ReFED (2016). A Roadmap to Reduce US Food Waste by 20%. www.refed.com/.
Scherson, Y. (2016). Mixed Waste Organics Extraction and Integrated Organics Management. Presentation by Anaergia to LA County Conversion Technology Task Force. http://dpw.lacounty.gov/epd/tf/Attachments/Minutes_Attachments/2016_Attachments/Anaergia_3_17_16.pdf.
TetraTech (2015). Residential Food Waste Composition Study. Report the British Columbia Ministry of Environment. https://www2.gov.bc.ca/assets/gov/environment/waste-management/organic-waste/residential_food_waste_composition_study_ifu.pdf.
USEPA (2015). Advancing Sustainable Materials Management: Facts and Figures 2013. United States Environmental Protection Agency. Office of Resource Conservation and Recovery (5306P). EPA530-R-15-002US EPA. https://www.epa.gov/sites/production/files/2015-09/documents/2013_advncng_smm_rpt.pdf.
USEPA (2016). Advancing Sustainable Materials Management: 2014 Fact Sheet. United States Environmental Protection Agency, Office of Resource Conservation and Recovery. https://www.epa.gov/sites/production/files/2016-11/documents/2014_smmfactsheet_508.pdf.
Williams, R. B., B. M. Jenkins, et al. (2015). An Assessment of Biomass Resources in California, 2013 Data. CEC PIER Contract 500-11-020, California Biomass Collaborative.

CHAPTER 2: ANALYSIS OF EXISTING CAPACITY FOR CO-DIGESTION OF FOOD WASTE | CO-DIGESTION CAPACITY ANALYSIS | SWRCB
FINAL | JUNE | ‐
Chapter 2
ANALYSIS OF EXISTING CAPACITY FOR
CO‐DIGESTION OF FOOD WASTE
2.1 Existing Infrastructure and Excess Capacity
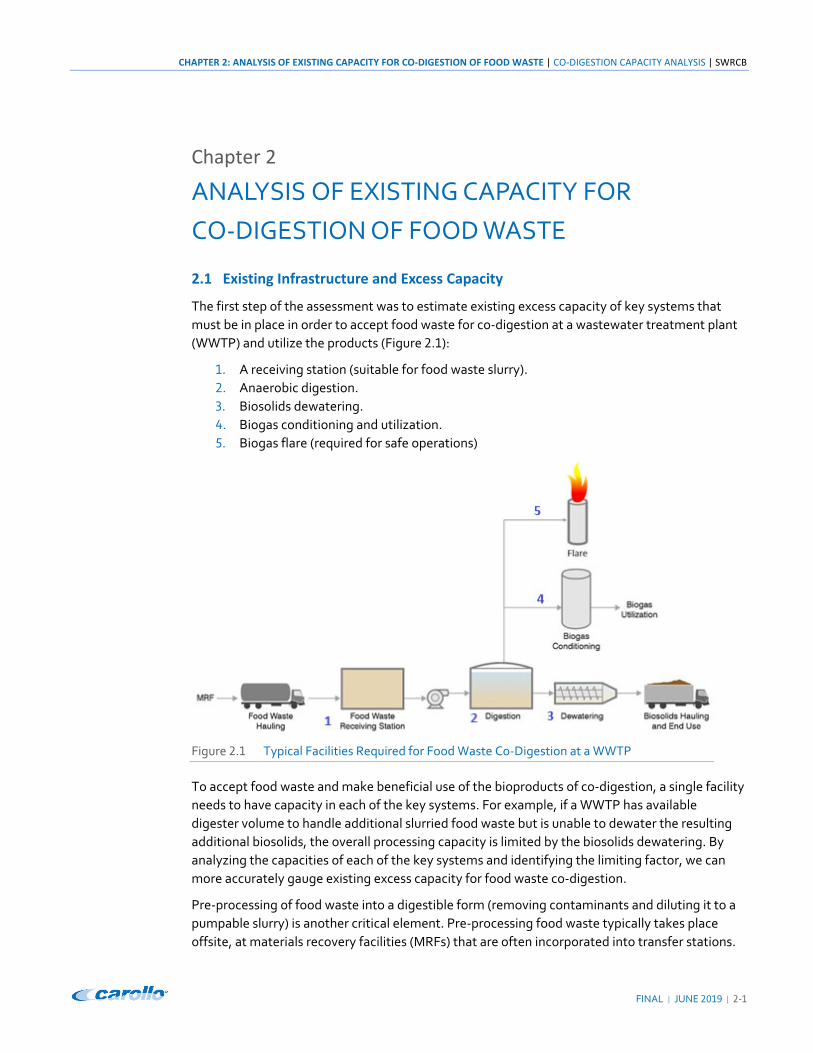
The first step of the assessment was to estimate existing excess capacity of key systems that
must be in place in order to accept food waste for co‐digestion at a wastewater treatment plant
(WWTP) and utilize the products (Figure . ):
. A receiving station (suitable for food waste slurry).
. Anaerobic digestion.
. Biosolids dewatering.
. Biogas conditioning and utilization.
. Biogas flare (required for safe operations)
Figure . Typical Facilities Required for Food Waste Co‐Digestion at a WWTP
To accept food waste and make beneficial use of the bioproducts of co‐digestion, a single facility
needs to have capacity in each of the key systems. For example, if a WWTP has available
digester volume to handle additional slurried food waste but is unable to dewater the resulting
additional biosolids, the overall processing capacity is limited by the biosolids dewatering. By
analyzing the capacities of each of the key systems and identifying the limiting factor, we can
more accurately gauge existing excess capacity for food waste co‐digestion.
Pre‐processing of food waste into a digestible form (removing contaminants and diluting it to a
pumpable slurry) is another critical element. Pre‐processing food waste typically takes place
offsite, at materials recovery facilities (MRFs) that are often incorporated into transfer stations.
SWRCB | CO-DIGESTION CAPACITY ANALYSIS | CHAPTER 2: ANALYSIS OF EXISTING CAPACITY FOR CO-DIGESTION OF FOOD WASTE
2-2 | JUNE 2019 | FINAL
According to CalRecycle’s Solid Waste Information System database, there are 20 transfer stations that currently accept food waste (CalRecycle 2019). These facilities have the capacity to
accept over 1 million tons per day of waste, with reported throughput less than 2 percent of that.
However, assessing whether the existing MRFs could accept additional food waste, and whether
the facilities possess the infrastructure needed to suitably process the food waste for co-digestion at a WWTP was beyond the scope of this study. This gap could be addressed in subsequent studies.
We report excess capacity of existing infrastructure in wet short tons of food waste per year, as
diverted from landfills. We assume typical solids content for food waste diverted from landfills is 30 percent. Most WWTPs could not accept food waste in this form. A MRF would first have to
pre-process the waste, removing contaminants and thinning it to produce a pumpable slurry of
15 percent solids. WWTPs can receive the slurried food waste and incorporate it into their
digester feed. Because the primary goal of this project is to determine how much food waste can
be diverted from landfills, we report excess processing capacity in existing infrastructure in wet
tons per year of diverted food waste (i.e., material at 30 percent solids). To convert into the quantity of slurried material as received at a WWTP (i.e., material at 15 percent solids), multiply
by two.
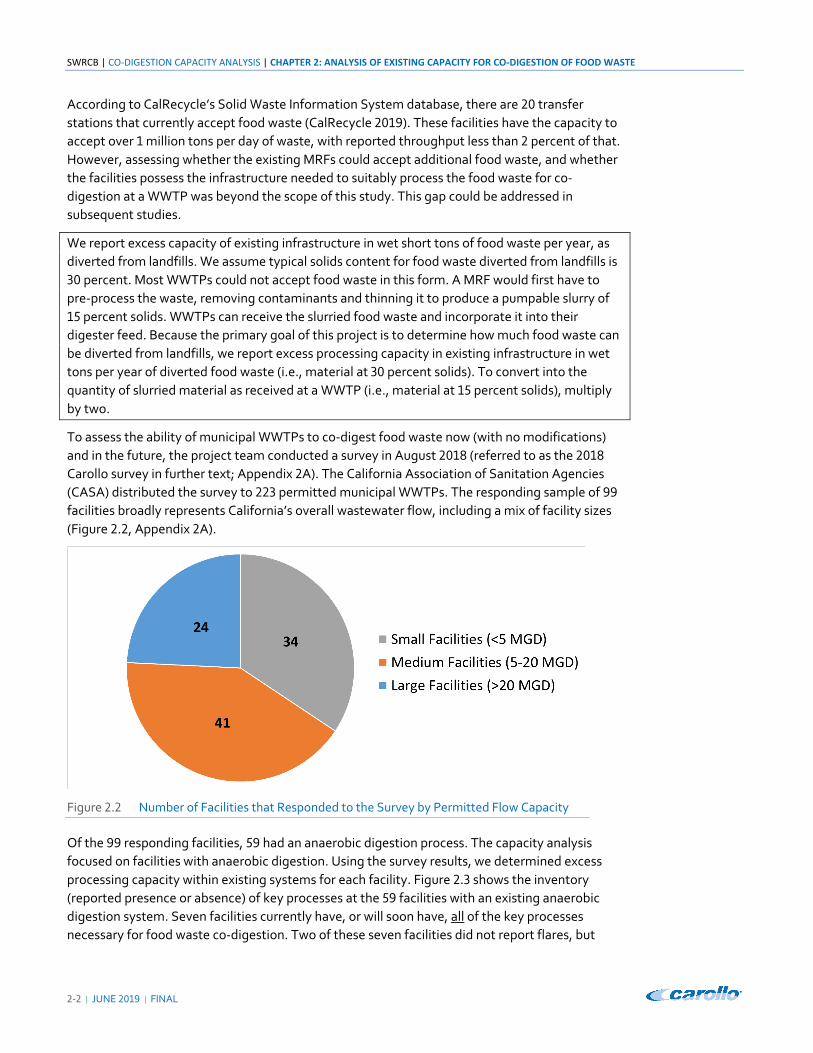
To assess the ability of municipal WWTPs to co-digest food waste now (with no modifications)
and in the future, the project team conducted a survey in August 2018 (referred to as the 2018
Carollo survey in further text; Appendix 2A). The California Association of Sanitation Agencies
(CASA) distributed the survey to 223 permitted municipal WWTPs. The responding sample of 99
facilities broadly represents California’s overall wastewater flow, including a mix of facility sizes
(Figure 2.2, Appendix 2A).
Figure 2.2 Number of Facilities that Responded to the Survey by Permitted Flow Capacity
Of the 99 responding facilities, 59 had an anaerobic digestion process. The capacity analysis focused on facilities with anaerobic digestion. Using the survey results, we determined excess
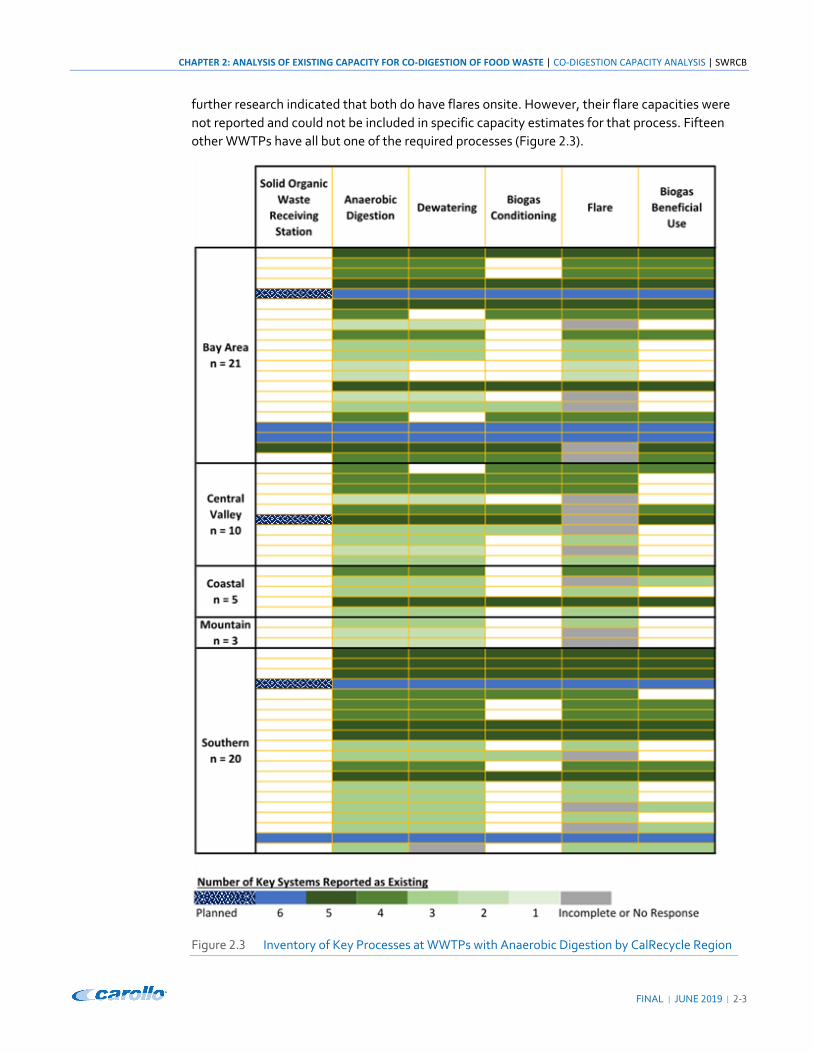
processing capacity within existing systems for each facility. Figure 2.3 shows the inventory
(reported presence or absence) of key processes at the 59 facilities with an existing anaerobic
digestion system. Seven facilities currently have, or will soon have, all of the key processes
necessary for food waste co-digestion. Two of these seven facilities did not report flares, but
CHAPTER 2: ANALYSIS OF EXISTING CAPACITY FOR CO-DIGESTION OF FOOD WASTE | CO-DIGESTION CAPACITY ANALYSIS | SWRCB
FINAL | JUNE 2019 | 2-3
further research indicated that both do have flares onsite. However, their flare capacities were
not reported and could not be included in specific capacity estimates for that process. Fifteen other WWTPs have all but one of the required processes (Figure 2.3).
Figure 2.3 Inventory of Key Processes at WWTPs with Anaerobic Digestion by CalRecycle Region

SWRCB | CO-DIGESTION CAPACITY ANALYSIS | CHAPTER 2: ANALYSIS OF EXISTING CAPACITY FOR CO-DIGESTION OF FOOD WASTE
2-4 | JUNE 2019 | FINAL
Figure 2.4 shows the estimated existing excess capacity by process and facility size for the 59
California WWTPs that responded to the survey and have anaerobic digestion onsite. The majority of excess capacity is at the large facilities rather than medium or small plants. The anaerobic digesters and dewatering generally have the most excess capacity of all the processes
considered. Summed across the state, the processes with the least excess capacity (i.e. those that place the most significant limitations for advancing co-digestion statewide) are the food waste receiving station and biogas beneficial use systems.
Figure 2.4 Total Existing Excess Capacity of Key Systems at Facilities that Responded to Survey in
Short Wet Tons Per Year (TPY) of Diverted Food Waste by Facility Size
Note: Digestion capacity is governed by solids retention time (SRT, also known as the mean cell residence time), number of units (digesters) in service, and organic loading rate. The anaerobic digester capacity estimates include various combinations of operating conditions: All Units in Service (AUIS), Largest Unit Out of Service (LUOOS), design SRT, and 15-day SRT (See Section 2.1.2 and Appendix 2B). Digestion capacities shown in this figure do not account for limits on organic loading.
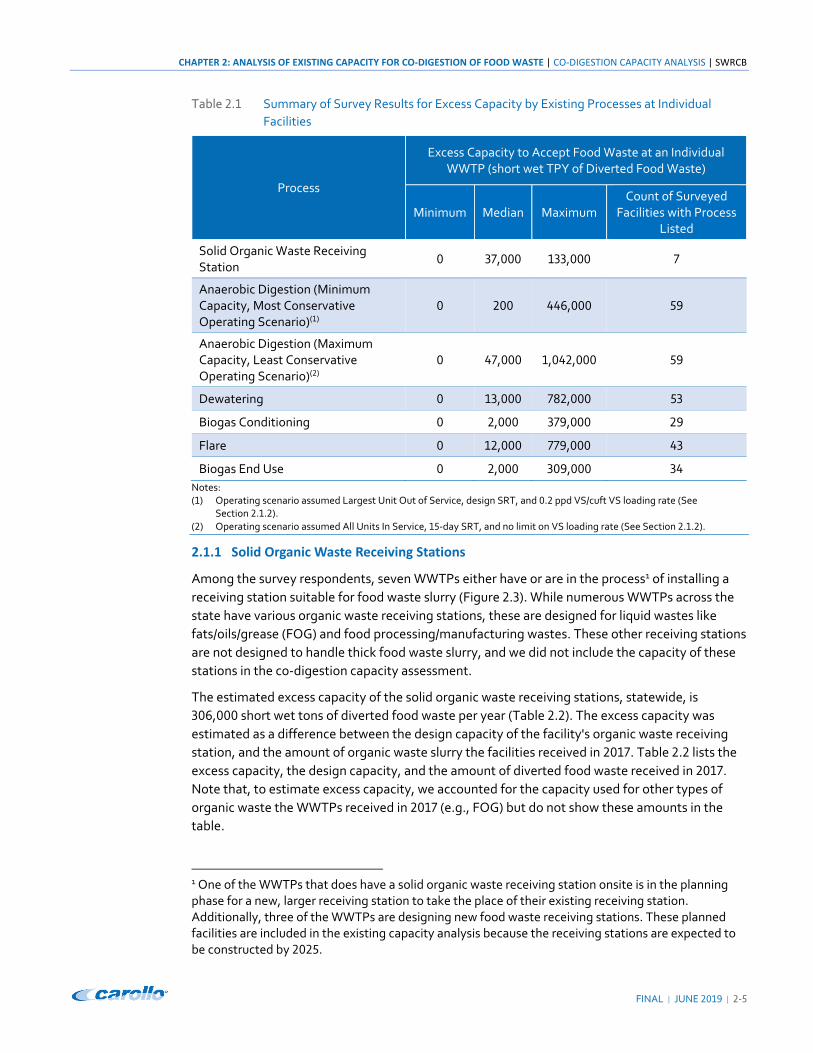
Table 2.1 summarizes the existing excess capacity to accept food waste at individual WWTPs by process, as determined from the survey results. For example, the table shows that 53 of the surveyed WWTPs with anaerobic digesters also have dewatering; the facility with the greatest
excess capacity in its dewatering process could dewater an additional 782,000 wet short tons of
diverted and co-digested food waste. Similarly, of the 53 surveyed WWTPs that have
dewatering, the facility with the least excess capacity in its dewatering process has no excess
capacity. Note, the results for anaerobic digestion capacity in Table 2.1 reflect two "bookend” scenarios of the digester operating parameters, representing the most and least conservative
conditions WWTPs may choose to operate under.
The sections below summarize the capacity findings for each of the key processes necessary for co-digestion of food waste.
CHAPTER 2: ANALYSIS OF EXISTING CAPACITY FOR CO-DIGESTION OF FOOD WASTE | CO-DIGESTION CAPACITY ANALYSIS | SWRCB
FINAL | JUNE | ‐
Table . Summary of Survey Results for Excess Capacity by Existing Processes at Individual
Facilities
Process
Excess Capacity to Accept Food Waste at an Individual WWTP (short wet TPY of Diverted Food Waste)
Minimum Median Maximum Count of Surveyed
Facilities with Process Listed
Solid Organic Waste Receiving Station
, ,
Anaerobic Digestion (Minimum Capacity, Most Conservative Operating Scenario)( )
,
Anaerobic Digestion (Maximum Capacity, Least Conservative Operating Scenario)( )
, , ,
Dewatering , ,
Biogas Conditioning , ,
Flare , ,
Biogas End Use , ,
Notes: ( ) Operating scenario assumed Largest Unit Out of Service, design SRT, and . ppd VS/cuft VS loading rate (See
Section . . ). ( ) Operating scenario assumed All Units In Service, ‐day SRT, and no limit on VS loading rate (See Section . . ).
2.1.1 Solid Organic Waste Receiving Stations
Among the survey respondents, seven WWTPs either have or are in the process1 of installing a
receiving station suitable for food waste slurry (Figure . ). While numerous WWTPs across the
state have various organic waste receiving stations, these are designed for liquid wastes like
fats/oils/grease (FOG) and food processing/manufacturing wastes. These other receiving stations
are not designed to handle thick food waste slurry, and we did not include the capacity of these
stations in the co‐digestion capacity assessment.
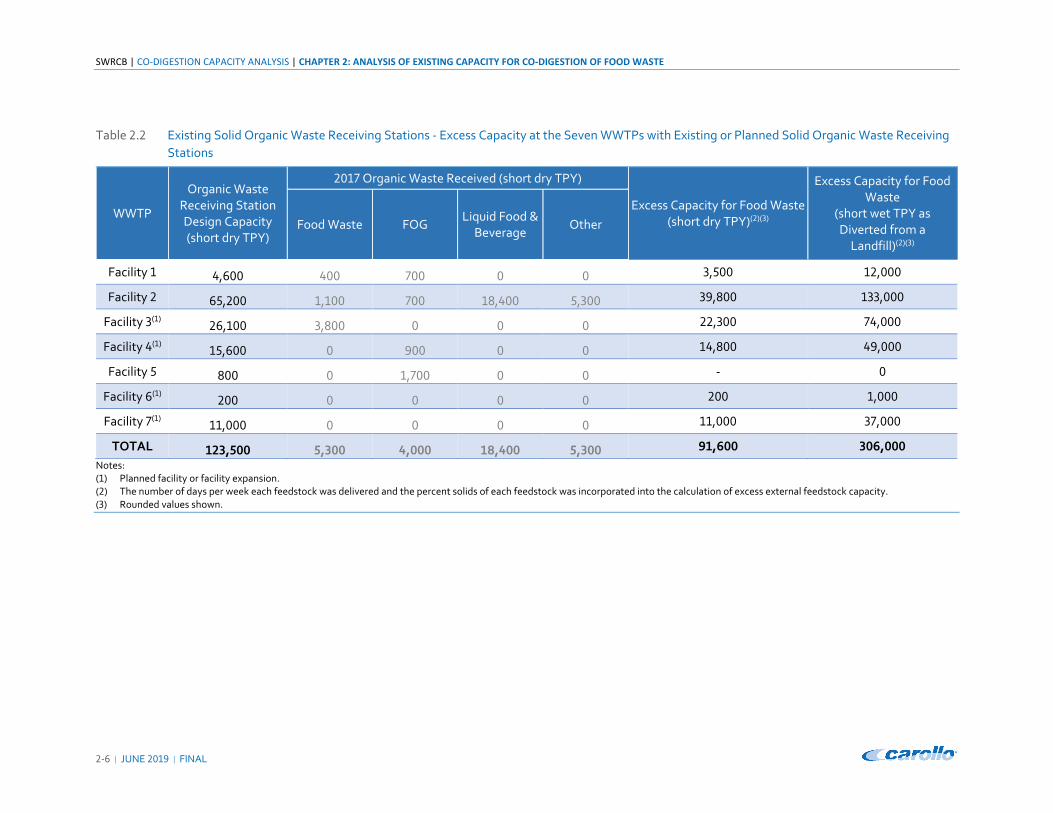
The estimated excess capacity of the solid organic waste receiving stations, statewide, is
, short wet tons of diverted food waste per year (Table . ). The excess capacity was
estimated as a difference between the design capacity of the facility's organic waste receiving
station, and the amount of organic waste slurry the facilities received in . Table . lists the
excess capacity, the design capacity, and the amount of diverted food waste received in .
Note that, to estimate excess capacity, we accounted for the capacity used for other types of
organic waste the WWTPs received in (e.g., FOG) but do not show these amounts in the
table.
1 One of the WWTPs that does have a solid organic waste receiving station onsite is in the planning phase for a new, larger receiving station to take the place of their existing receiving station. Additionally, three of the WWTPs are designing new food waste receiving stations. These planned facilities are included in the existing capacity analysis because the receiving stations are expected to be constructed by .
SWRCB | CO-DIGESTION CAPACITY ANALYSIS | CHAPTER 2: ANALYSIS OF EXISTING CAPACITY FOR CO-DIGESTION OF FOOD WASTE
2-6 | JUNE 2019 | FINAL
Table 2.2 Existing Solid Organic Waste Receiving Stations - Excess Capacity at the Seven WWTPs with Existing or Planned Solid Organic Waste Receiving
Stations
WWTP
Organic Waste Receiving Station Design Capacity (short dry TPY)
2017 Organic Waste Received (short dry TPY)
Excess Capacity for Food Waste (short dry TPY)(2)(3)
Excess Capacity for Food Waste
(short wet TPY as Diverted from a
Landfill)(2)(3)
Food Waste FOG Liquid Food &
Beverage Other
Facility 1 4,600 400 700 0 0 3,500 12,000
Facility 2 65,200 1,100 700 18,400 5,300 39,800 133,000
Facility 3(1) 26,100 3,800 0 0 0 22,300 74,000
Facility 4(1) 15,600 0 900 0 0 14,800 49,000
Facility 5 800 0 1,700 0 0 - 0
Facility 6(1) 200 0 0 0 0 200 1,000
Facility 7(1) 11,000 0 0 0 0 11,000 37,000
TOTAL 123,500 5,300 4,000 18,400 5,300 91,600 306,000 Notes: (1) Planned facility or facility expansion. (2) The number of days per week each feedstock was delivered and the percent solids of each feedstock was incorporated into the calculation of excess external feedstock capacity. (3) Rounded values shown.

CHAPTER 2: ANALYSIS OF EXISTING CAPACITY FOR CO-DIGESTION OF FOOD WASTE | CO-DIGESTION CAPACITY ANALYSIS | SWRCB
FINAL | JUNE | ‐
2.1.2 Anaerobic Digestion Capacity
The estimated existing excess anaerobic digestion capacity of the WWTPs that responded to the
survey ranges from million to . million short wet tons per year (TPY) of food waste diverted
from landfills (Figure . )2, depending on the conditions governing digestion capacity. Digestion
capacity is governed by solids retention time (also known as the mean cell residence time),
number of units (digesters) in service, and organic loading rate.
To determine excess capacity available for food waste co‐digestion, we compared the current
Solids Retention Time (SRT), the design SRT, and a ‐day SRT. The ‐day SRT is the minimum
required for Class B biosolids pathogen reduction from mesophilic digestion3. The design SRT
typically ranges from to days (WEF, MOP ). Facilities sometimes operate at different SRTs
from the design SRT based on experience, solids production rates, and facility characteristics.
In addition to digester capacity with All Units In Service, the project team analyzed digester
capacity with the Largest Unit Out of Service, a planning strategy used to maintain operational
redundancy during digester maintenance. The scenario using the design SRT and the Largest
Unit Out of Service is the minimum capacity scenario (most conservative operating scenario).
The scenario using a ‐day SRT and All Units In Service is the maximum capacity scenario
(Appendix B).
Figure . Total Existing Excess Digestion Capacity in Short Wet TPY of Diverted Food Waste by
Volatile Solids (VS) Loading Rate Limit
Note: The analysis assumes that all mixing, heating, and transfer equipment was adequately sized to
handle loads up to the ‐day SRT with All Units In Service.
2 This estimated range includes reserved digestion capacity to handle increased municipal solids commensurate with projected population growth by . 3 Part in Title of the Code of Federal Regulations (EPA ).

SWRCB | CO-DIGESTION CAPACITY ANALYSIS | CHAPTER 2: ANALYSIS OF EXISTING CAPACITY FOR CO-DIGESTION OF FOOD WASTE
‐ | JUNE | FINAL
Finally, for typical digestion capacity analyses, the organic loading rate is assessed in terms of
volatile solids (VS) fed to the digester. While some facilities have started assessing loading
relative to chemical oxygen demand, most facilities still track the VS loading rate, which is the
parameter used in this analysis. Acceptable VS loading rates for municipal sludge digestion
under mesophilic temperatures range from . pounds of VS per day per cubic foot (ppd VS/cf)
to . ppd VS/cf (WEF, MOP ). To analyze the possibility of stable operations at higher than
typical loading rates, we assessed digester capacity for this study for three VS loading rates:
. ppd VS/cf, . ppd VS/cf, and unlimited (Appendix B).
Previous analyses have estimated excess digester capacity. The U.S. Environmental Protection
Agency (EPA) cites an estimate of to percent excess capacity for digesters, based on an
analysis of wastewater treatment plants (EBMUD ),(Shang et al. ). CASA estimated
California’s WWTPs could co‐digest percent of the state’s food waste stream. To make this
estimate, CASA used data from the largest WWTPs in the state (representing percent of the
state’s wastewater flow) and assumed a ‐day SRT and no limit on VS loading rate. This is
similar to the light blue bar in Figure . representing ‐day SRT, All Units in Service, and
unlimited VS loading rate. CASA then extrapolated data for all California WWTPs and also
estimated the divertible food waste available in California (Barillo ). Our estimates suggest
that under many operating scenarios, the anaerobic digesters at California’s WWTP have even
greater excess capacity than these previous estimates.
2.1.3 Biosolids Dewatering
After solids are digested, the resulting biosolids are typically dewatered before being hauled
off‐site. Fifty‐three, out of survey respondents with anaerobic digestion, have biosolids
dewatering onsite. Based on the design capacity and actual use in , of these facilities
have excess dewatering capacity to accommodate biosolids from an estimated . million short
wet TPY diverted food waste accepted for co‐digestion.
In this analysis we assumed that the volume of liquid effluent from the digesters is equal to the
liquid volume fed to the digesters. Further, we did not account for the synergistic effects
observed by some co‐digesting WWTPs. Such effects could enhance overall solid digestion and
minimize biosolids production (Higgins et al. ). The digester effluent, or digestate, is fed to
the dewatering system and represents the current dewatering feed rate. We assumed that
digestate is dewatered from percent solids to percent solids.
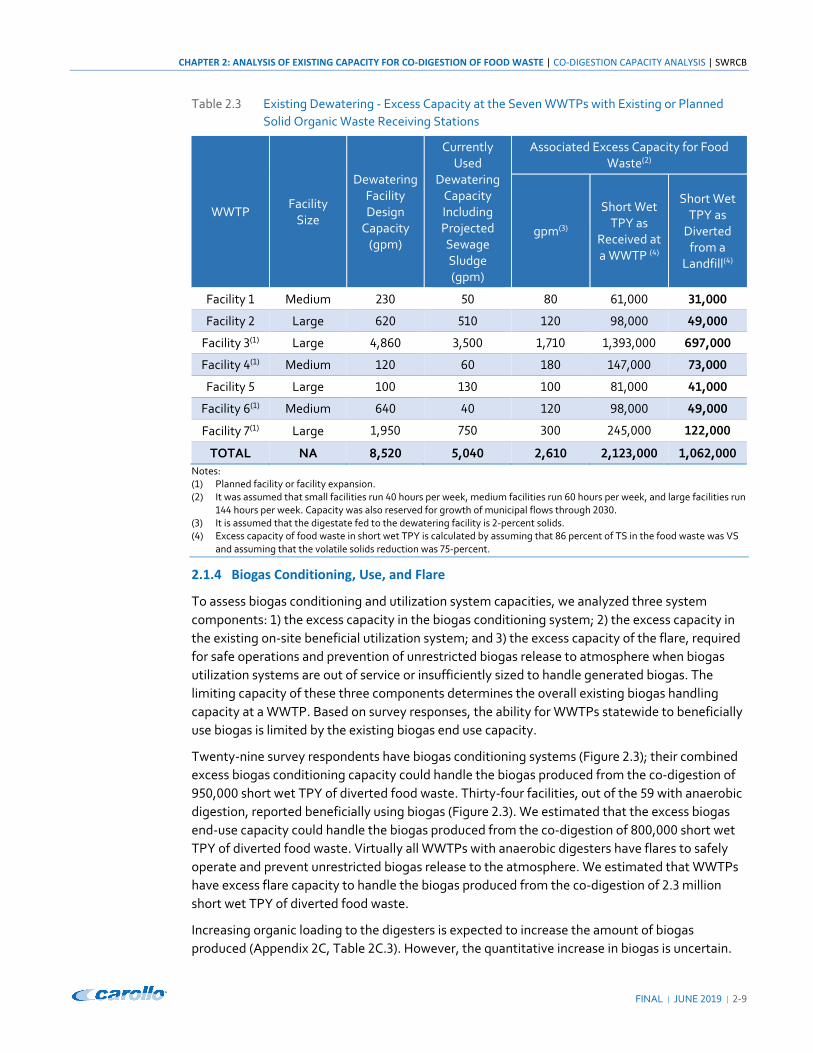
Table . shows the excess capacity of the dewatering systems estimated for the seven WWTPs
with existing or planned solid organic waste receiving stations.
CHAPTER 2: ANALYSIS OF EXISTING CAPACITY FOR CO-DIGESTION OF FOOD WASTE | CO-DIGESTION CAPACITY ANALYSIS | SWRCB
FINAL | JUNE 2019 | 2-9
Table 2.3 Existing Dewatering - Excess Capacity at the Seven WWTPs with Existing or Planned
Solid Organic Waste Receiving Stations
WWTP Facility
Size
Dewatering Facility Design
Capacity (gpm)
Currently Used
Dewatering Capacity Including Projected Sewage Sludge (gpm)
Associated Excess Capacity for Food Waste(2)
gpm(3)
Short Wet TPY as
Received at a WWTP (4)
Short Wet TPY as
Diverted from a
Landfill(4)
Facility 1 Medium 230 50 80 61,000 31,000
Facility 2 Large 620 510 120 98,000 49,000
Facility 3(1) Large 4,860 3,500 1,710 1,393,000 697,000
Facility 4(1) Medium 120 60 180 147,000 73,000
Facility 5 Large 100 130 100 81,000 41,000
Facility 6(1) Medium 640 40 120 98,000 49,000
Facility 7(1) Large 1,950 750 300 245,000 122,000
TOTAL NA 8,520 5,040 2,610 2,123,000 1,062,000 Notes: (1) Planned facility or facility expansion. (2) It was assumed that small facilities run 40 hours per week, medium facilities run 60 hours per week, and large facilities run
144 hours per week. Capacity was also reserved for growth of municipal flows through 2030. (3) It is assumed that the digestate fed to the dewatering facility is 2-percent solids. (4) Excess capacity of food waste in short wet TPY is calculated by assuming that 86 percent of TS in the food waste was VS
and assuming that the volatile solids reduction was 75-percent.
2.1.4 Biogas Conditioning, Use, and Flare
To assess biogas conditioning and utilization system capacities, we analyzed three system
components: 1) the excess capacity in the biogas conditioning system; 2) the excess capacity in
the existing on-site beneficial utilization system; and 3) the excess capacity of the flare, required for safe operations and prevention of unrestricted biogas release to atmosphere when biogas
utilization systems are out of service or insufficiently sized to handle generated biogas. The limiting capacity of these three components determines the overall existing biogas handling
capacity at a WWTP. Based on survey responses, the ability for WWTPs statewide to beneficially
use biogas is limited by the existing biogas end use capacity.
Twenty-nine survey respondents have biogas conditioning systems (Figure 2.3); their combined
excess biogas conditioning capacity could handle the biogas produced from the co-digestion of 950,000 short wet TPY of diverted food waste. Thirty-four facilities, out of the 59 with anaerobic
digestion, reported beneficially using biogas (Figure 2.3). We estimated that the excess biogas
end-use capacity could handle the biogas produced from the co-digestion of 800,000 short wet
TPY of diverted food waste. Virtually all WWTPs with anaerobic digesters have flares to safely operate and prevent unrestricted biogas release to the atmosphere. We estimated that WWTPs have excess flare capacity to handle the biogas produced from the co-digestion of 2.3 million
short wet TPY of diverted food waste.
Increasing organic loading to the digesters is expected to increase the amount of biogas produced (Appendix 2C, Table 2C.3). However, the quantitative increase in biogas is uncertain.
SWRCB | CO-DIGESTION CAPACITY ANALYSIS | CHAPTER 2: ANALYSIS OF EXISTING CAPACITY FOR CO-DIGESTION OF FOOD WASTE
‐ | JUNE | FINAL
We assume production of an additional , standard cubic feet (scf) biomethane per wet ton
of food waste fed to the digester for co‐digestion (Appendix C). Biogas yield represents gas
yield coming out of the digesters. Biomethane yield represents biogas yield at specified quality.
This report assumes that biomethane constitutes percent of biogas produced (Appendix C).
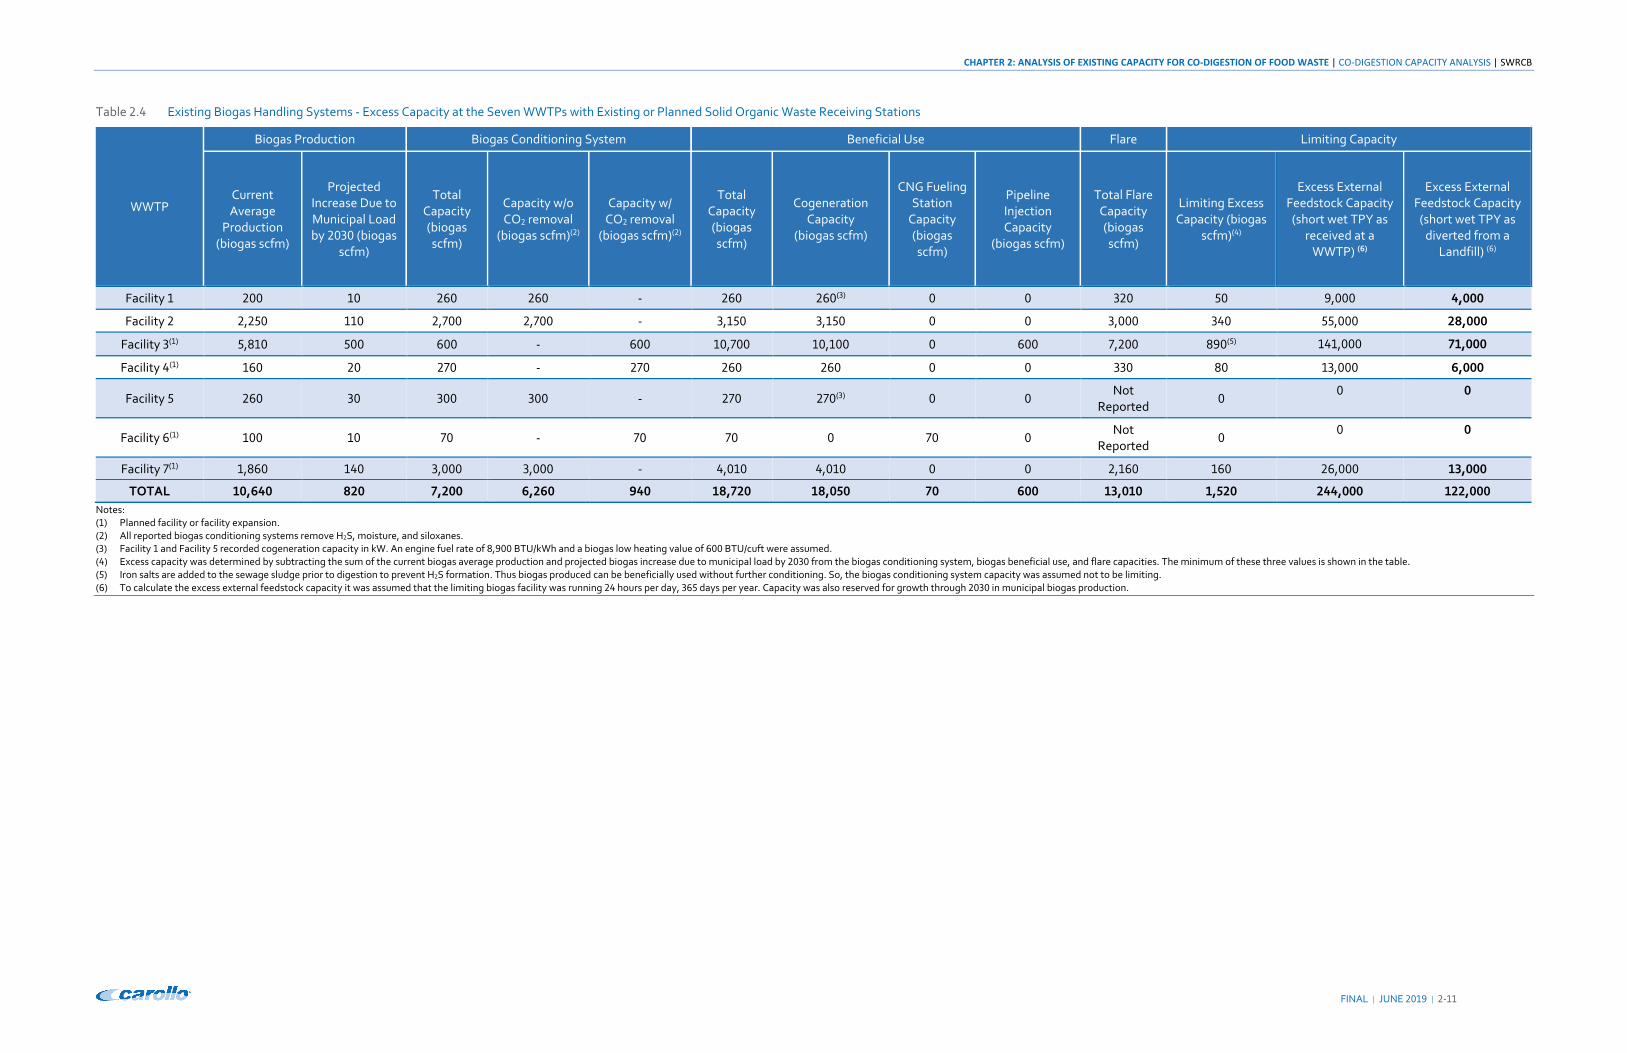
Table . and Appendix B detail the capacity for biogas conditioning, utilization, and flaring for
the seven WWTPs with all processes necessary for food waste co‐digestion.
CHAPTER 2: ANALYSIS OF EXISTING CAPACITY FOR CO-DIGESTION OF FOOD WASTE | CO-DIGESTION CAPACITY ANALYSIS | SWRCB
FINAL | JUNE 2019 | 2-11
Table 2.4 Existing Biogas Handling Systems - Excess Capacity at the Seven WWTPs with Existing or Planned Solid Organic Waste Receiving Stations
WWTP
Biogas Production Biogas Conditioning System Beneficial Use Flare Limiting Capacity
Current Average
Production (biogas scfm)
Projected Increase Due to Municipal Load by 2030 (biogas
scfm)
Total Capacity (biogas scfm)
Capacity w/o CO2 removal
(biogas scfm)(2)
Capacity w/ CO2 removal
(biogas scfm)(2)
Total Capacity (biogas scfm)
Cogeneration Capacity
(biogas scfm)
CNG Fueling Station
Capacity (biogas scfm)
Pipeline Injection Capacity
(biogas scfm)
Total Flare Capacity (biogas scfm)
Limiting Excess Capacity (biogas
scfm)(4)
Excess External Feedstock Capacity
(short wet TPY as received at a
WWTP) (6)
Excess External Feedstock Capacity
(short wet TPY as diverted from a
Landfill) (6)
Facility 1 200 10 260 260 - 260 260(3) 0 0 320 50 9,000 4,000
Facility 2 2,250 110 2,700 2,700 - 3,150 3,150 0 0 3,000 340 55,000 28,000
Facility 3(1) 5,810 500 600 - 600 10,700 10,100 0 600 7,200 890(5) 141,000 71,000
Facility 4(1) 160 20 270 - 270 260 260 0 0 330 80 13,000 6,000
Facility 5 260 30 300 300 - 270 270(3) 0 0 Not
Reported 0
0 0
Facility 6(1) 100 10 70 - 70 70 0 70 0 Not
Reported 0
0 0
Facility 7(1) 1,860 140 3,000 3,000 - 4,010 4,010 0 0 2,160 160 26,000 13,000
TOTAL 10,640 820 7,200 6,260 940 18,720 18,050 70 600 13,010 1,520 244,000 122,000 Notes: (1) Planned facility or facility expansion. (2) All reported biogas conditioning systems remove H2S, moisture, and siloxanes. (3) Facility 1 and Facility 5 recorded cogeneration capacity in kW. An engine fuel rate of 8,900 BTU/kWh and a biogas low heating value of 600 BTU/cuft were assumed. (4) Excess capacity was determined by subtracting the sum of the current biogas average production and projected biogas increase due to municipal load by 2030 from the biogas conditioning system, biogas beneficial use, and flare capacities. The minimum of these three values is shown in the table. (5) Iron salts are added to the sewage sludge prior to digestion to prevent H2S formation. Thus biogas produced can be beneficially used without further conditioning. So, the biogas conditioning system capacity was assumed not to be limiting. (6) To calculate the excess external feedstock capacity it was assumed that the limiting biogas facility was running 24 hours per day, 365 days per year. Capacity was also reserved for growth through 2030 in municipal biogas production.
SWRCB | CO-DIGESTION CAPACITY ANALYSIS | CHAPTER 2: ANALYSIS OF EXISTING CAPACITY FOR CO-DIGESTION OF FOOD WASTE
2-12 | JUNE 2019 | FINAL
-This Page Intentionally Left Blank-
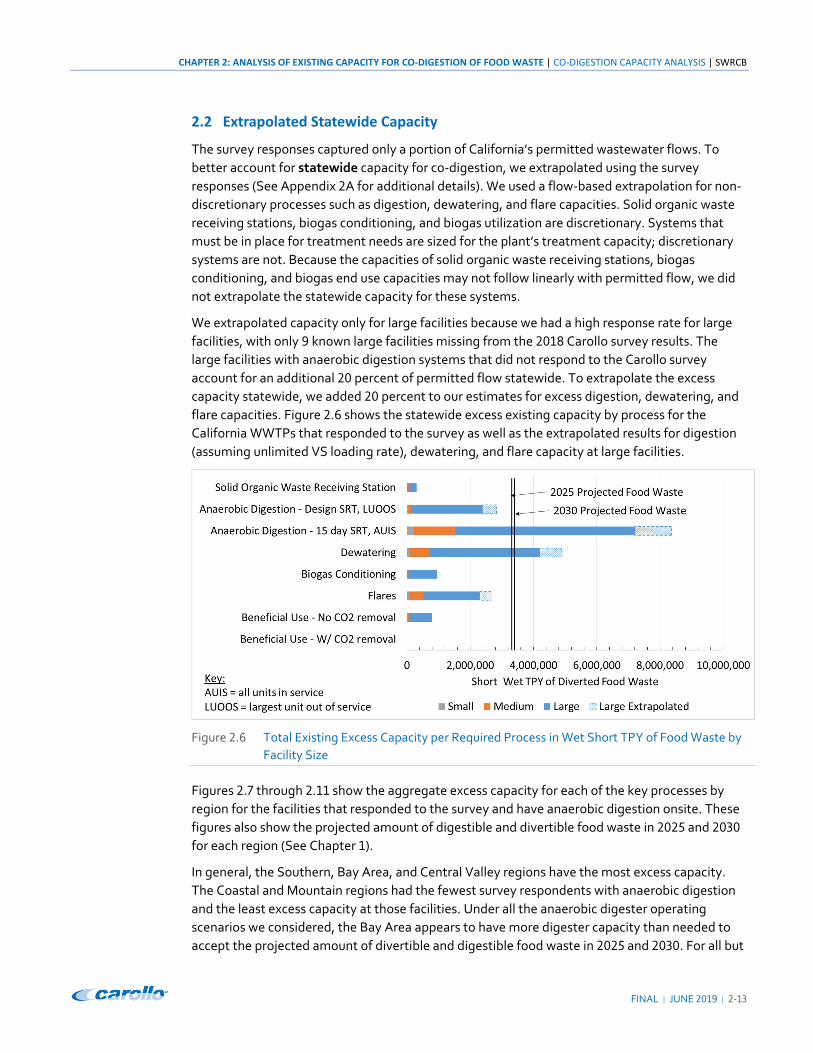
CHAPTER 2: ANALYSIS OF EXISTING CAPACITY FOR CO-DIGESTION OF FOOD WASTE | CO-DIGESTION CAPACITY ANALYSIS | SWRCB
FINAL | JUNE | ‐
2.2 Extrapolated Statewide Capacity
The survey responses captured only a portion of California’s permitted wastewater flows. To
better account for statewide capacity for co‐digestion, we extrapolated using the survey
responses (See Appendix A for additional details). We used a flow‐based extrapolation for non‐
discretionary processes such as digestion, dewatering, and flare capacities. Solid organic waste
receiving stations, biogas conditioning, and biogas utilization are discretionary. Systems that
must be in place for treatment needs are sized for the plant’s treatment capacity; discretionary
systems are not. Because the capacities of solid organic waste receiving stations, biogas
conditioning, and biogas end use capacities may not follow linearly with permitted flow, we did
not extrapolate the statewide capacity for these systems.
We extrapolated capacity only for large facilities because we had a high response rate for large
facilities, with only known large facilities missing from the Carollo survey results. The
large facilities with anaerobic digestion systems that did not respond to the Carollo survey
account for an additional percent of permitted flow statewide. To extrapolate the excess
capacity statewide, we added percent to our estimates for excess digestion, dewatering, and
flare capacities. Figure . shows the statewide excess existing capacity by process for the
California WWTPs that responded to the survey as well as the extrapolated results for digestion
(assuming unlimited VS loading rate), dewatering, and flare capacity at large facilities.
Figure . Total Existing Excess Capacity per Required Process in Wet Short TPY of Food Waste by
Facility Size
Figures . through . show the aggregate excess capacity for each of the key processes by
region for the facilities that responded to the survey and have anaerobic digestion onsite. These
figures also show the projected amount of digestible and divertible food waste in and
for each region (See Chapter ).
In general, the Southern, Bay Area, and Central Valley regions have the most excess capacity.
The Coastal and Mountain regions had the fewest survey respondents with anaerobic digestion
and the least excess capacity at those facilities. Under all the anaerobic digester operating
scenarios we considered, the Bay Area appears to have more digester capacity than needed to
accept the projected amount of divertible and digestible food waste in and . For all but
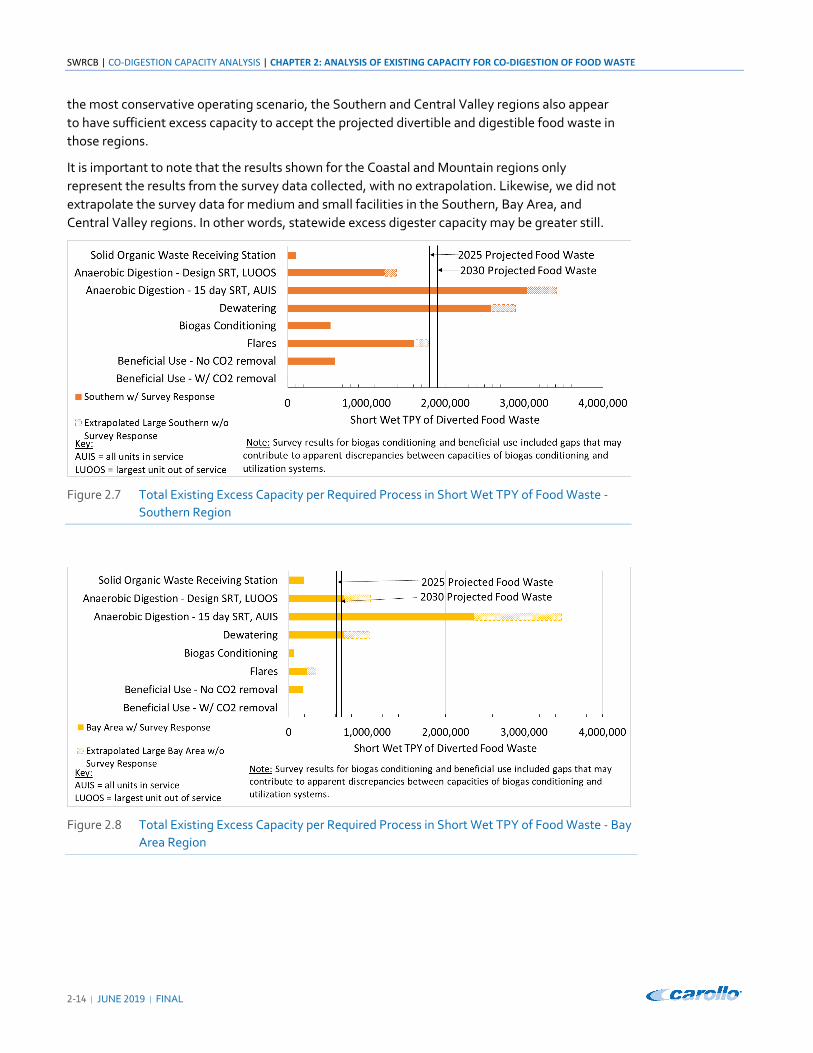
SWRCB | CO-DIGESTION CAPACITY ANALYSIS | CHAPTER 2: ANALYSIS OF EXISTING CAPACITY FOR CO-DIGESTION OF FOOD WASTE
2-14 | JUNE 2019 | FINAL
the most conservative operating scenario, the Southern and Central Valley regions also appear to have sufficient excess capacity to accept the projected divertible and digestible food waste in those regions.
It is important to note that the results shown for the Coastal and Mountain regions only represent the results from the survey data collected, with no extrapolation. Likewise, we did not
extrapolate the survey data for medium and small facilities in the Southern, Bay Area, and
Central Valley regions. In other words, statewide excess digester capacity may be greater still.
Figure 2.7 Total Existing Excess Capacity per Required Process in Short Wet TPY of Food Waste - Southern Region
Figure 2.8 Total Existing Excess Capacity per Required Process in Short Wet TPY of Food Waste - Bay Area Region
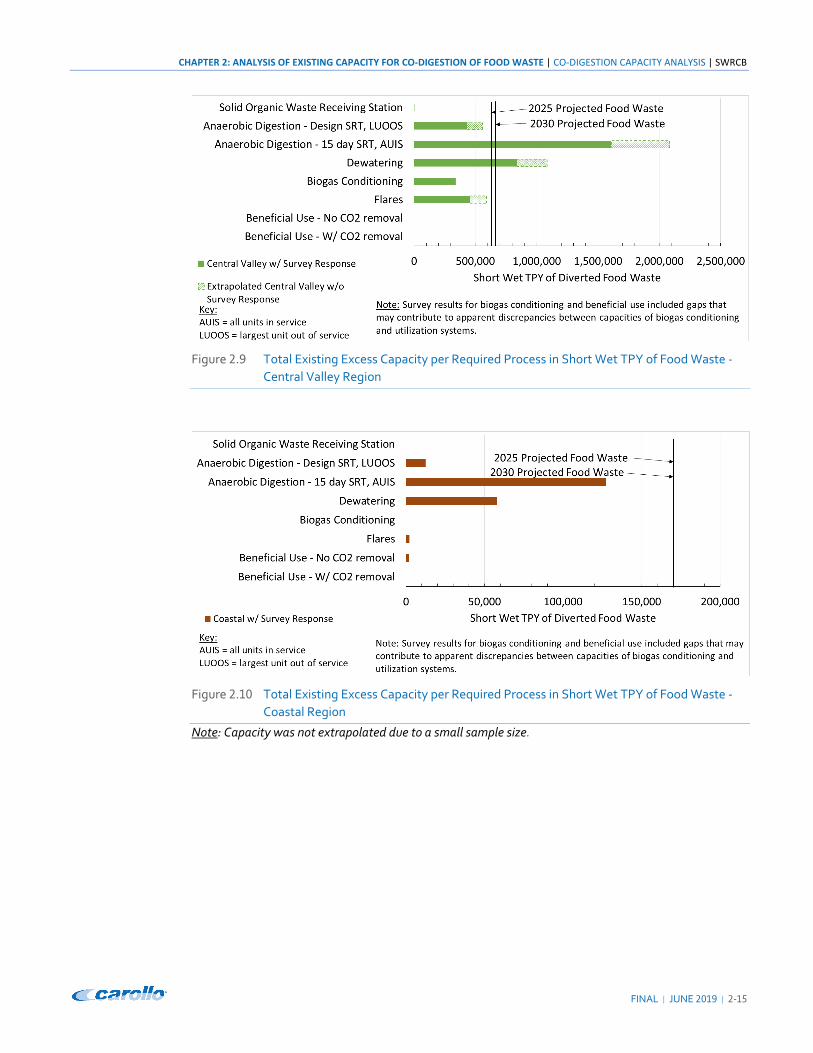
CHAPTER 2: ANALYSIS OF EXISTING CAPACITY FOR CO-DIGESTION OF FOOD WASTE | CO-DIGESTION CAPACITY ANALYSIS | SWRCB
FINAL | JUNE 2019 | 2-15
Figure 2.9 Total Existing Excess Capacity per Required Process in Short Wet TPY of Food Waste - Central Valley Region
Figure 2.10 Total Existing Excess Capacity per Required Process in Short Wet TPY of Food Waste - Coastal Region
Note: Capacity was not extrapolated due to a small sample size.
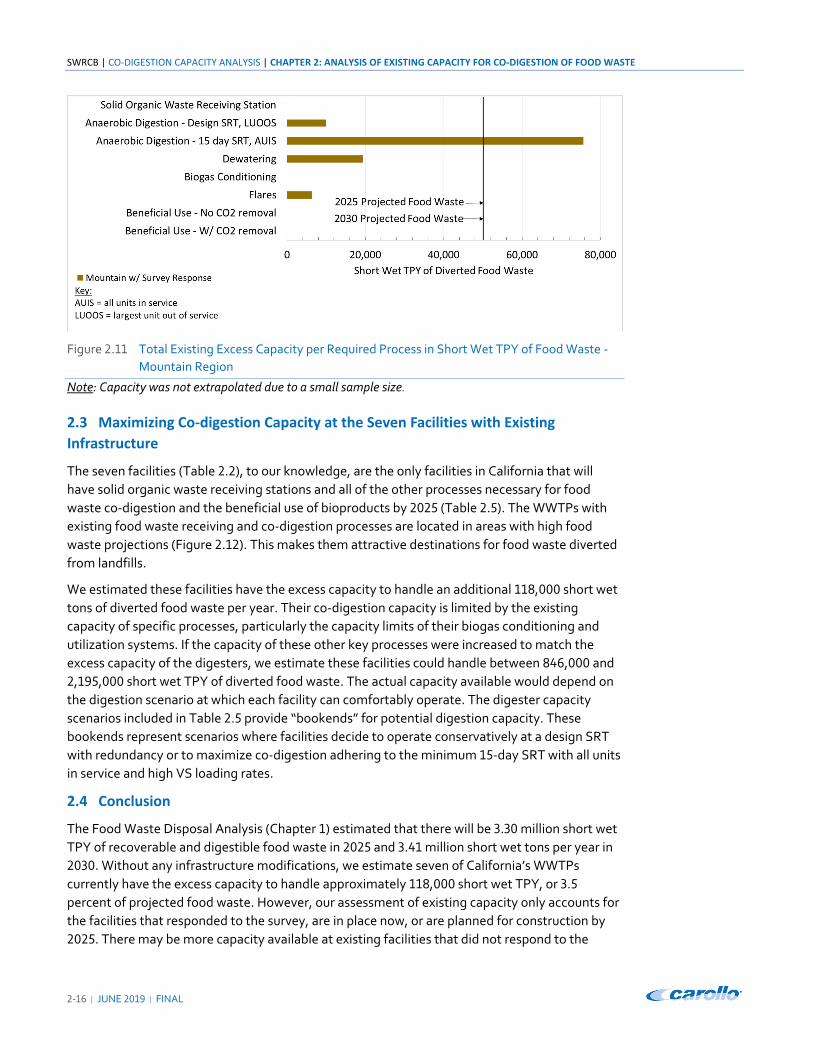
SWRCB | CO-DIGESTION CAPACITY ANALYSIS | CHAPTER 2: ANALYSIS OF EXISTING CAPACITY FOR CO-DIGESTION OF FOOD WASTE
‐ | JUNE | FINAL
Figure . Total Existing Excess Capacity per Required Process in Short Wet TPY of Food Waste ‐
Mountain Region
Note: Capacity was not extrapolated due to a small sample size.
2.3 Maximizing Co-digestion Capacity at the Seven Facilities with Existing
Infrastructure
The seven facilities (Table . ), to our knowledge, are the only facilities in California that will
have solid organic waste receiving stations and all of the other processes necessary for food
waste co‐digestion and the beneficial use of bioproducts by (Table . ). The WWTPs with
existing food waste receiving and co‐digestion processes are located in areas with high food
waste projections (Figure . ). This makes them attractive destinations for food waste diverted
from landfills.
We estimated these facilities have the excess capacity to handle an additional , short wet
tons of diverted food waste per year. Their co‐digestion capacity is limited by the existing
capacity of specific processes, particularly the capacity limits of their biogas conditioning and
utilization systems. If the capacity of these other key processes were increased to match the
excess capacity of the digesters, we estimate these facilities could handle between , and
, , short wet TPY of diverted food waste. The actual capacity available would depend on
the digestion scenario at which each facility can comfortably operate. The digester capacity
scenarios included in Table . provide “bookends” for potential digestion capacity. These
bookends represent scenarios where facilities decide to operate conservatively at a design SRT
with redundancy or to maximize co‐digestion adhering to the minimum ‐day SRT with all units
in service and high VS loading rates.
2.4 Conclusion
The Food Waste Disposal Analysis (Chapter ) estimated that there will be . million short wet
TPY of recoverable and digestible food waste in and . million short wet tons per year in
. Without any infrastructure modifications, we estimate seven of California’s WWTPs
currently have the excess capacity to handle approximately , short wet TPY, or .
percent of projected food waste. However, our assessment of existing capacity only accounts for
the facilities that responded to the survey, are in place now, or are planned for construction by
. There may be more capacity available at existing facilities that did not respond to the
CHAPTER 2: ANALYSIS OF EXISTING CAPACITY FOR CO-DIGESTION OF FOOD WASTE | CO-DIGESTION CAPACITY ANALYSIS | SWRCB
FINAL | JUNE | ‐
survey ‐ and there may be more facilities constructed before that could accept additional
recoverable and digestible food waste.
If just these seven facilities were modified such that the overall system capacity matched the
their excess digestion capacity, they would be able to annually handle between thousand
and . million additional short wet tons of food waste diverted from landfills. This represents
to percent of the recoverable and digestible food waste in .
We estimated the minimum statewide anaerobic digestion capacity (design SRT, largest unit out
of service, and . VS loading rate limit) for facilities that responded to the Carollo survey at
million short wet tons of diverted food waste. Extrapolated statewide (adding percent), the
minimum excess anaerobic digester capacity is sufficient to accommodate . million short wet
tons of diverted food waste. In Chapter ‐ "Investments to Maximize Co‐Digestion," we estimate
the infrastructure needed to maximize co‐digestion statewide.
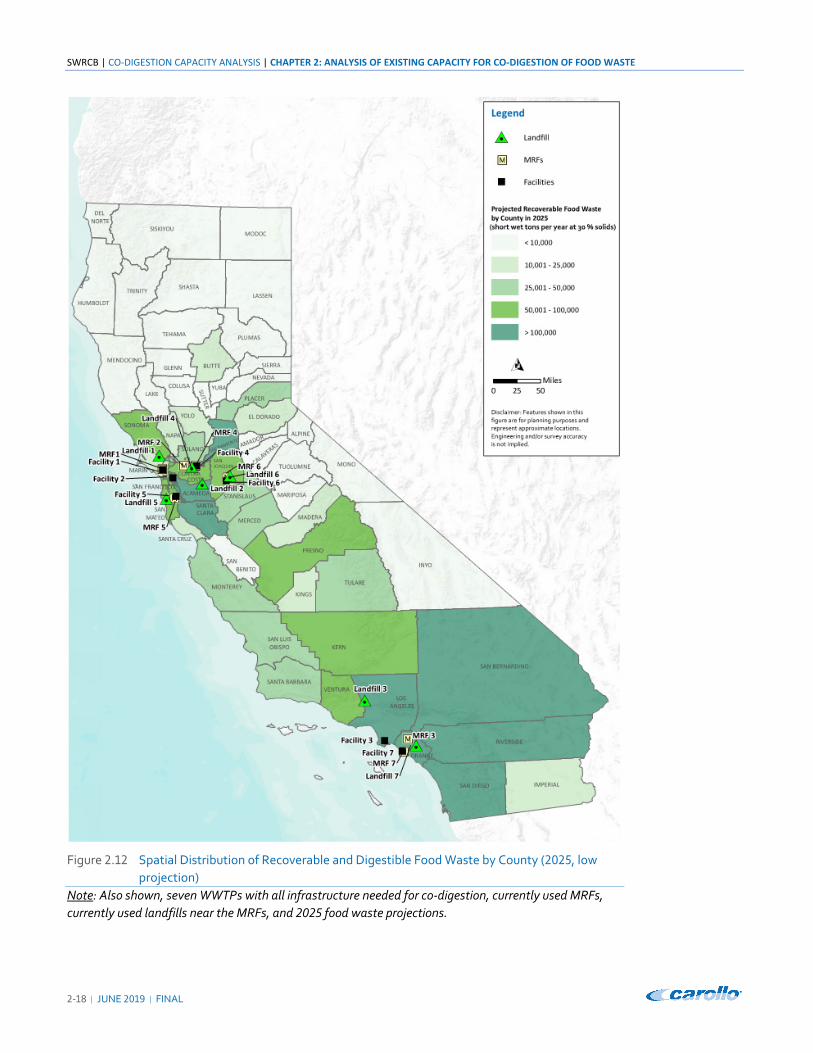
SWRCB | CO-DIGESTION CAPACITY ANALYSIS | CHAPTER 2: ANALYSIS OF EXISTING CAPACITY FOR CO-DIGESTION OF FOOD WASTE
2-18 | JUNE 2019 | FINAL
Figure 2.12 Spatial Distribution of Recoverable and Digestible Food Waste by County (2025, low
projection) Note: Also shown, seven WWTPs with all infrastructure needed for co-digestion, currently used MRFs, currently used landfills near the MRFs, and 2025 food waste projections.
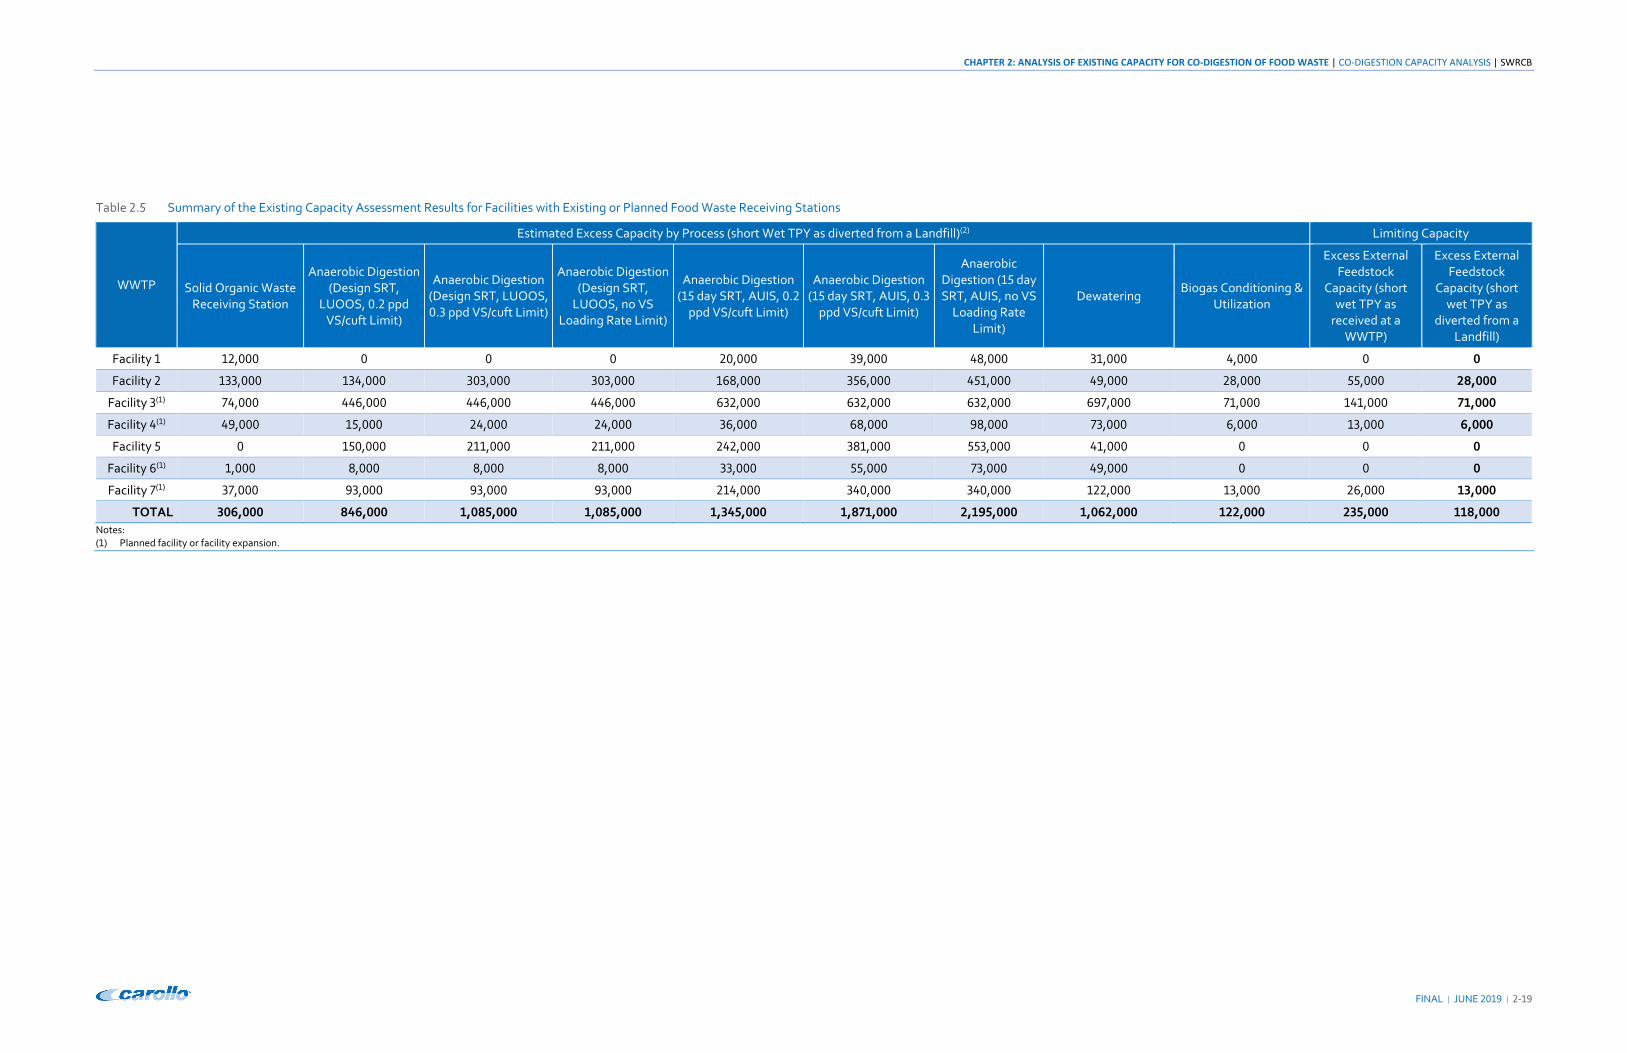
CHAPTER 2: ANALYSIS OF EXISTING CAPACITY FOR CO-DIGESTION OF FOOD WASTE | CO-DIGESTION CAPACITY ANALYSIS | SWRCB
FINAL | JUNE 2019 | 2-19
Table 2.5 Summary of the Existing Capacity Assessment Results for Facilities with Existing or Planned Food Waste Receiving Stations
WWTP
Estimated Excess Capacity by Process (short Wet TPY as diverted from a Landfill)(2) Limiting Capacity
Solid Organic Waste Receiving Station
Anaerobic Digestion (Design SRT,
LUOOS, 0.2 ppd VS/cuft Limit)
Anaerobic Digestion (Design SRT, LUOOS, 0.3 ppd VS/cuft Limit)
Anaerobic Digestion (Design SRT,
LUOOS, no VS Loading Rate Limit)
Anaerobic Digestion (15 day SRT, AUIS, 0.2
ppd VS/cuft Limit)
Anaerobic Digestion (15 day SRT, AUIS, 0.3
ppd VS/cuft Limit)
Anaerobic Digestion (15 day SRT, AUIS, no VS
Loading Rate Limit)
Dewatering Biogas Conditioning &
Utilization
Excess External Feedstock
Capacity (short wet TPY as
received at a WWTP)
Excess External Feedstock
Capacity (short wet TPY as
diverted from a Landfill)
Facility 1 12,000 0 0 0 20,000 39,000 48,000 31,000 4,000 0 0
Facility 2 133,000 134,000 303,000 303,000 168,000 356,000 451,000 49,000 28,000 55,000 28,000
Facility 3(1) 74,000 446,000 446,000 446,000 632,000 632,000 632,000 697,000 71,000 141,000 71,000
Facility 4(1) 49,000 15,000 24,000 24,000 36,000 68,000 98,000 73,000 6,000 13,000 6,000
Facility 5 0 150,000 211,000 211,000 242,000 381,000 553,000 41,000 0 0 0
Facility 6(1) 1,000 8,000 8,000 8,000 33,000 55,000 73,000 49,000 0 0 0
Facility 7(1) 37,000 93,000 93,000 93,000 214,000 340,000 340,000 122,000 13,000 26,000 13,000
TOTAL 306,000 846,000 1,085,000 1,085,000 1,345,000 1,871,000 2,195,000 1,062,000 122,000 235,000 118,000 Notes: (1) Planned facility or facility expansion.
SWRCB | CO-DIGESTION CAPACITY ANALYSIS | CHAPTER 2: ANALYSIS OF EXISTING CAPACITY FOR CO-DIGESTION OF FOOD WASTE
2-20 | JUNE 2019 | FINAL
-This Page Intentionally Left Blank-
CHAPTER 2: ANALYSIS OF EXISTING CAPACITY FOR CO-DIGESTION OF FOOD WASTE | CO-DIGESTION CAPACITY ANALYSIS | SWRCB
FINAL | JUNE | ‐
2.5 References
Ahuja, K.; Helmowski, B.; Ingram, W., ( ). LCFS Pathway for the Production of Biomethane
from High Solids Anaerobic Digestion (HSAD) of Organic (Food and Green) Wastes.
Staff Report. California Air Resources Board.
Appleton, R. and Rauch‐Williams, T., ( ) Co‐digestion of organic waste addressing operational side effects, WERF.
Barillo, M. ( ). Co‐digestion estimates at california water resource recovery facilities. CWEA E‐Bulletin. http://cweawaternews.org/co‐digestion‐estimates‐at‐california‐wastewater‐treatment‐plants/ Accessed June .
Borowski, S., Boniecki, P., Kubacki, P., & Czyżowska, A. ( ). Food waste co‐digestion with slaughterhouse waste and sewage sludge: Digestate conditioning and supernatant quality. Waste Management, , ‐ . https://doi.org/ . /j.wasman. . .
CalRecycle ( ). Solid Waste Information System Facility Database. https://www .calrecycle.ca.gov/SWFacilities/Directory/ Accessed January .
CASA ( ). Estimate of Excess Capacity at Existing Anaerobic Digesters for Co‐Digestion at Wastewater Treatmetn Facilities in California. Correspondance with CalRecycle, State Water Board and CARB.
Di Maria, F., Gigliotti, G., Sordi, A., Micale, C., Zadra, C., & Massaccesi, L. ( ). Hybrid solid anaerobic digestion batch: Biomethane production and mass recovery from the organic fraction of solid waste. Waste Management and Research, ( ), ‐ . https://doi.org/ . / X
DOE ( ). Combined Heat and Power Technology Fact Sheet Series. U.S. Department of Energy: Energy Effciency and Renewable Energy.
EBMUD ( ). Anaerobic digestion of food waste. Final report prepared by East Bay Municipal Utility District for Funding Opportunity No. EPA‐R ‐WST‐ ‐ , March. http://www.epa.gov/region /organics/ad/EBMUDFinalReport.pdf
Ecker, J. ( ). A “Hauler’s” Perspective. Waste Management Organics ‐ CWEA Co‐Digestion Workshop.
Edelmann, W., Engeli, H., & Gradenecker, M. ( ). Co‐digestion of organic solid waste and sludge from sewage treatment. Water Science & Technology, ( ), ‐ .
El‐Mashad, H. M., & Zhang, R. ( ). Biogas production from co‐digestion of dairy manure and food waste. Bioresource Technology, ( ), ‐ . https://doi.org/http://dx.doi.org/ . /j.biortech. . .
EPA ( ). Clean Watershed Needs Survey. https://ofmpub.epa.gov/apex/cwns /f?p=cwns : : :
EPA ( ). Evaluating the Air Quality, Climate & Economic Impacts of Biogas Management Technologies. Office of Research and Development. EPA /R‐ / .
EPA ( ). Part ‐ Standards for the Use or Disposal of Sewage Sludge. Title ‐ Protection of Environment. Chapter , Subchapter O ‐ Sewage Sludge. Code of Federal Regulations. https://www.govinfo.gov/content/pkg/CFR‐ ‐title ‐vol /xml/CFR‐ ‐title ‐vol ‐part .xml
SWRCB | CO-DIGESTION CAPACITY ANALYSIS | CHAPTER 2: ANALYSIS OF EXISTING CAPACITY FOR CO-DIGESTION OF FOOD WASTE
‐ | JUNE | FINAL
Fondahl, L. ( ). Personal Communication via email. Biosolids Coordiator for the US EPA Region .
Gray, D., Suto, P., & Peck, C. ( ). Anaerobic Digestion of Food Waste. EBMUD Report to EPA, Contract EPA‐R ‐WST‐ ‐ .
Higgins, M., Rajagopalan G. ( ). Understanding Impacts of Co‐Digestion: Digester Chemistry, Gas Production, Dewaterability, Solids Production, Cake Quality, and Economics. WE&RF.
Heo, N. H., Park, S. C., & Kang, H. ( ). Effects of mixture ratio and hydraulic retention time on single‐stage anaerobic co‐digestion of food waste and waste activated sludge. Journal of Environmental Science and Health Part A‐Toxic/Hazardous Substances & Environmental Engineering, ( ), ‐ . https://doi.org/ . /ese‐
Kuo, J., & Dow, J. ( ). Biogas production from anaerobic digestion of food waste and relevant air quality implications. Journal of the Air & Waste Management Association, ( ), ‐
. https://doi.org/ . / . .
Liu, G., Zhang, R., El‐Mashad, H. M., & Dong, R. ( ). Effect of feed to inoculum ratios on biogas yields of food and green wastes. Bioresource Technology, ( ), ‐ . https://doi.org/ . /j.biortech. . .
Shang, Y., Soroushian, F., Whitman, E.J., and Zhang, Z. ( ). Co‐digestion Potential Increase of Renewable Energy Production from Waste for California. Presented at the Annual California Water Environment Association Conference, Sacramento, CA.
State Water Board ( ). State Fiscal Year ‐ Wastewater User Charge Survey Report. https://www.waterboards.ca.gov/publications_forms/publications/general/docs/wastewater_user_charge_survey_fy _ .xls
Tchobanoglous, G., Theisen, H., and Vigil, S. ( ). Integrated Solid Waste Management‐ Engineering Principles and Management Issues, McGraw‐Hill, Inc, New York.
WEF Manual of Practice No. : Design of Water Resource Recovery Facilities. ASCE Manuals and Reports on Engineering No. , Sixth Edition, Alexandria, VA.
Williams, R. B.; Jenkins, B. M.; Kaffka, S. R., ( ): An Assessment of Biomass Resources in California, Data. CEC PIER Contract ‐ ‐ , California Biomass Collaborative.
Zhang, R. H., El‐Mashad, H. M., Hartman, K., Wang, F. Y., Liu, G. Q., Choate, C., & Gamble, P. ( ). Characterization of food waste as feedstock for anaerobic digestion. Bioresource Technology, ( ), ‐ . https://doi.org/ . /j.biortech. . .
CHAPTER 3: INVESTMENTS TO MAXIMIZE CO-DIGESTION | CO-DIGESTION CAPACITY ANALYSIS | SWRCB
FINAL | JUNE | ‐
Chapter 3
INVESTMENTS TO MAXIMIZE CO‐DIGESTION
3.1 Additional Infrastructure Needed to Maximize Co-Digestion
In Chapter , we projected the amount of food waste that would be generated in and
and then estimated how much of it could be diverted from landfills and co‐digested at municipal
wastewater treatment plants (WWTPs). To avoid overestimating the amount of food waste
available for co‐digestion and the role California WWTPs may play in achieving the State’s waste
diversion and greenhouse gas emission reduction goals, we carried forward the lower‐range
estimate (vertical lines in Figure . ).
In Chapter we summarized and extrapolated the results of a survey to assess the ability of
California WWTPs to co‐digest food waste ( Carollo survey). In estimating excess capacity,
we considered various anaerobic digester operating conditions, governed by the solids retention
time (SRT), number of units (digesters) in service, and the organic loading rate (Figures . and
. ). Under most combinations of operating conditions we considered, the State’s WWTPs have
adequate excess anaerobic digestion capacity to accommodate all of the estimated divertible
and digestible food waste in and .
In Chapter , we evaluate what infrastructure investments would be needed to maximize co‐
digestion at California’s WWTPs. We assumed no new digesters would be built. Rather, we
considered what additional capacity would be needed in each of the other key processes (food
waste receiving station, biosolids dewatering, biogas conditioning, biogas use, and flares) to fully
utilize existing excess anaerobic digestion capacity. We completed the analysis for two
“bookend” scenarios of digester capacity:
The conservative scenario, Scenario , assumed all WWTPs operate digesters at design
SRT, the largest digester at each WWTP is out of service, and the organic loading rate is
restricted to . pound of volatile solids per cubic feet per day (Figure . ). Under this
scenario and extrapolated statewide by adding percent, California WWTP could
accommodate . million wet tons of diverted food waste ( percent and percent of
divertible and digestible food waste in and , respectively).
The more optimistic scenario, Scenario , represents multiple combinations of digester
operating conditions in which California’s WWTPs have more than enough excess
digester capacity to accommodate digestible and divertible food waste. For the purpose
of this analysis, we constrained the digestion capacity by the estimated amount of
digestible and divertible food waste available in : . million wet tons (Table . and
Figure . ).
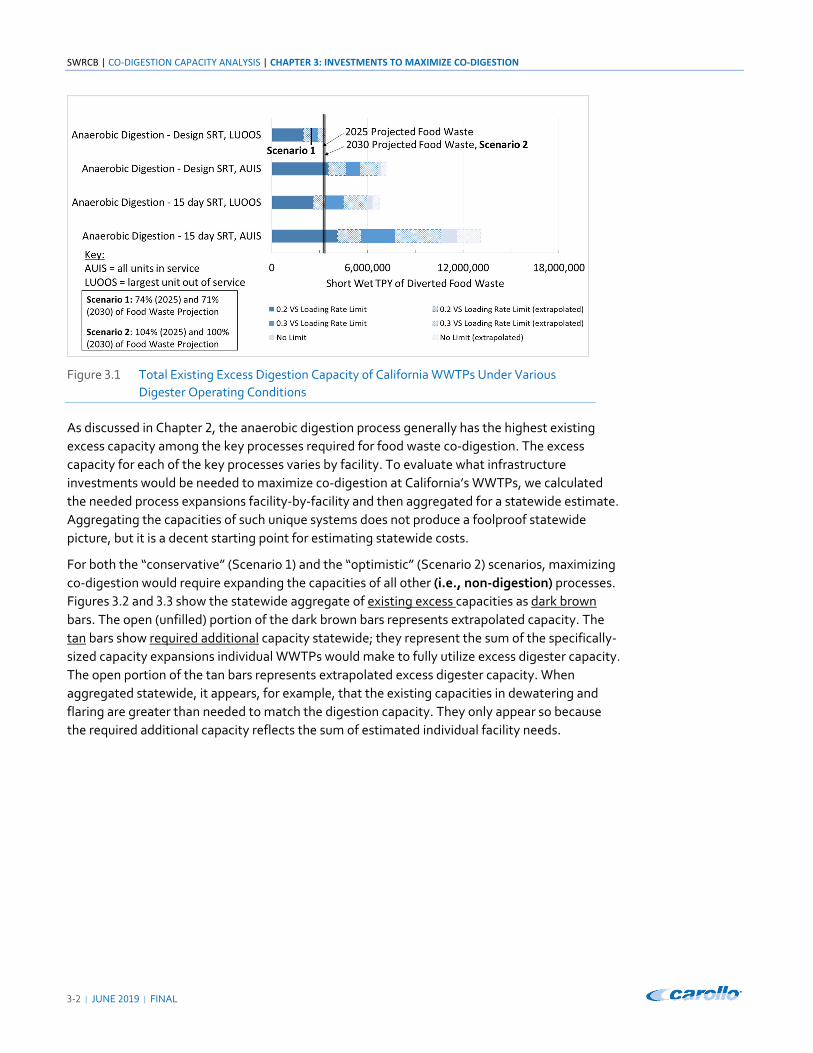
SWRCB | CO-DIGESTION CAPACITY ANALYSIS | CHAPTER 3: INVESTMENTS TO MAXIMIZE CO-DIGESTION
‐ | JUNE | FINAL
Figure . Total Existing Excess Digestion Capacity of California WWTPs Under Various
Digester Operating Conditions
As discussed in Chapter , the anaerobic digestion process generally has the highest existing
excess capacity among the key processes required for food waste co‐digestion. The excess
capacity for each of the key processes varies by facility. To evaluate what infrastructure
investments would be needed to maximize co‐digestion at California’s WWTPs, we calculated
the needed process expansions facility‐by‐facility and then aggregated for a statewide estimate.
Aggregating the capacities of such unique systems does not produce a foolproof statewide
picture, but it is a decent starting point for estimating statewide costs.
For both the “conservative” (Scenario ) and the “optimistic” (Scenario ) scenarios, maximizing
co‐digestion would require expanding the capacities of all other (i.e., non‐digestion) processes.
Figures . and . show the statewide aggregate of existing excess capacities as dark brown
bars. The open (unfilled) portion of the dark brown bars represents extrapolated capacity. The
tan bars show required additional capacity statewide; they represent the sum of the specifically‐
sized capacity expansions individual WWTPs would make to fully utilize excess digester capacity.
The open portion of the tan bars represents extrapolated excess digester capacity. When
aggregated statewide, it appears, for example, that the existing capacities in dewatering and
flaring are greater than needed to match the digestion capacity. They only appear so because
the required additional capacity reflects the sum of estimated individual facility needs.
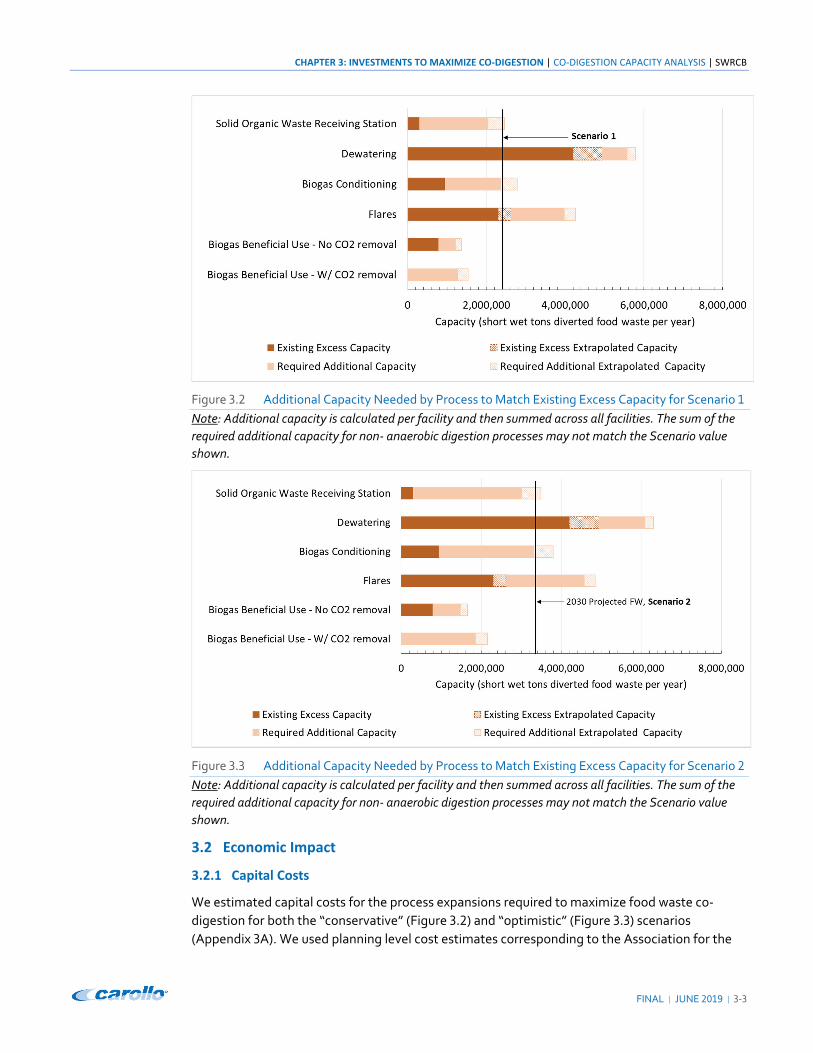
CHAPTER 3: INVESTMENTS TO MAXIMIZE CO-DIGESTION | CO-DIGESTION CAPACITY ANALYSIS | SWRCB
FINAL | JUNE | ‐
Figure . Additional Capacity Needed by Process to Match Existing Excess Capacity for Scenario
Note: Additional capacity is calculated per facility and then summed across all facilities. The sum of the
required additional capacity for non‐ anaerobic digestion processes may not match the Scenario value
shown.
3.2 Economic Impact
3.2.1 Capital Costs
We estimated capital costs for the process expansions required to maximize food waste co‐
digestion for both the “conservative” (Figure . ) and “optimistic” (Figure . ) scenarios
(Appendix A). We used planning level cost estimates corresponding to the Association for the

SWRCB | CO-DIGESTION CAPACITY ANALYSIS | CHAPTER 3: INVESTMENTS TO MAXIMIZE CO-DIGESTION
3-4 | JUNE 2019 | FINAL
Advancement of Cost Engineering Class 5 estimate, which can range from -50 percent to + 100
percent of the actual bid cost. The cost estimates reflect full project costs typically incurred in a municipal bid process: costs for structures, civil work, mechanical and electrical equipment,
process piping, controls and instrumentation, installation, 30 percent contingency, taxes,
insurance and bonds, general contractor overhead and profit, and engineering, legal, and
administration fees (Appendix 3B).
For most of the processes, we estimated the costs of capital investments using a unit cost approach. The unit cost approach assumed capital costs scale with flows or loads, a reasonable assumption for a planning-stage, statewide analysis. We used the median unit cost based on vendor quotes, constructed facilities at WWTPs, engineering estimates from multiple consulting
firms, and contractor guaranteed maximum prices (Figure 3.4). For some processes, we had
limited cost data (pipeline injection systems); for others (fueling stations), costs varied
considerably. Note that we assumed that all biogas conditioning and upgrading would take place
on-site (Appendix 3C provides additional details and compares the costs associated with biogas conditioning and beneficial uses). Finally, using the unit cost-based approach, we do not account
for some economies of scale that might otherwise be considered to compare projects and
estimate costs. Costs for specific projects at unique facilities would differ from the median values
presented here.
For solid organic waste receiving facilities, we developed costs for three different sized “typical” solid organic waste receiving stations: one for small facilities, one for medium facilities, and one
for large facilities. We used this approach rather than unit costs to reflect differences in system automation, redundancy, and operational use of storage tanks at small, medium, and large
facilities.
For the required pipeline interconnection costs, we assumed a flat fee of $2 million per
interconnection.
Figure 3.4 Spread of Unit Cost Data Used to Determine Median Unit Project Costs Note: Unit costs reflect a full project cost, including equipment and installation, mechanical and electrical equipment, process piping, controls and instrumentation, contingency, taxes, insurance and bonds, general contractor overhead and profit, and engineering, legal, and administration fees.
CHAPTER 3: INVESTMENTS TO MAXIMIZE CO-DIGESTION | CO-DIGESTION CAPACITY ANALYSIS | SWRCB
FINAL | JUNE 2019 | 3-5
3.2.2 Operations and Maintenance Costs
For the annual Operations and Maintenance (O&M) costs and revenues, we estimated only incremental additional costs and revenues associated with food waste co-digestion (Appendix 3D). For each of the key processes, we assumed annual maintenance costs (including labor and parts) are equal to two percent of the estimated capital costs (Appendix 3A). While we excluded the annual maintenance required for baseline municipal sewage sludge digestion and
processing, we did include the maintenance costs associated with utilizing existing excess capacity in those key processes needed for co-digestion. To do this, we estimated the value of
the existing excess capacity using the same approach as for new infrastructure described above
(e.g., Figure 3.4), and assumed two percent of that value was the maintenance cost.
We also accounted for increased operating costs associated with food waste co-digestion. We estimated the additional energy needs to heat, pump, and dewater the additional feedstock and
determined that these energy demands could be met by using approximately 5 percent of the
additional biogas produced. We assumed digester mixing energy would not increase significantly
with food waste addition relative to the energy required to mix municipal sludge, so no additional costs for mixing energy were included. In addition to increases in energy costs, we accounted for polymer consumed in dewatering and the cost of hauling additional biosolids generated from food waste co-digestion. Finally, we also estimated the annual cost of operations and administrative labor by assuming one full time equivalent (FTE) for each small
and medium facility and two FTEs for large facilities (EDD 2018).
3.2.3 Revenue
Revenue from Tipping Fees
We assumed that WWTPs would charge $20 per wet ton of pre-processed food waste (at
15 percent solids) delivered to their plant. This value is at the low end of the $20 - $65 per wet ton
range reported by the Environmental Protection Agency (EPA) (2014). While some WWTPs may
be able to negotiate higher tipping fees within that range (e.g., OCSD Biosolids Master Plan [2017]), some may not and could even receive less than $20 per wet ton.
Revenue from Electricity and Natural Gas
Biogas end use is the other major revenue source for co-digesting at WWTPs. The type and value
of this potential revenue stream depends on how the biogas is used. These biogas utilization
pathways offer differing advantages and disadvantages.
If a WWTP converts biogas to electricity, the facility can generate revenue by using it onsite to
offset purchased power or by selling it, either to the power utility or another power user. The
main difference between these two electricity end uses is the monetary value assumed for the
electricity produced. We assumed an electricity price of $0.08 per kilowatt hour (kWh). This price
is in line, on average, with what power utilities currently pay to buy electricity generated at a
WWTP. This price is also in line with the effective offset value of using the electricity onsite. When used onsite, WWTPs can offset power purchases and we assumed the same value
($0.08/kwh) for selling or offsetting electricity use onsite. However, this rate does not include
demand- and standby charges, which are costs incurred regardless of offsets. These fixed charges must still be paid to the utility.
WWTPs can also use biogas onsite for digester heating or they can convert it to renewable
compressed natural gas (CNG). If used to heat digesters, WWTPs may offset the cost of natural
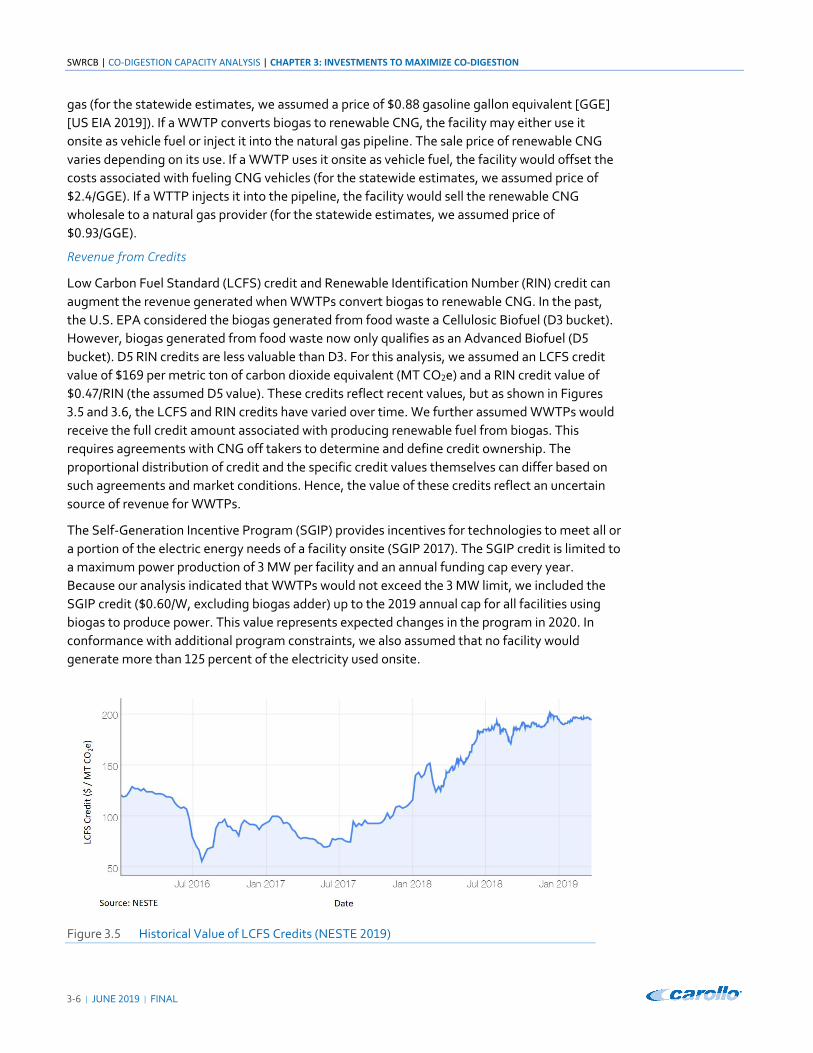
SWRCB | CO-DIGESTION CAPACITY ANALYSIS | CHAPTER 3: INVESTMENTS TO MAXIMIZE CO-DIGESTION
3-6 | JUNE 2019 | FINAL
gas (for the statewide estimates, we assumed a price of $0.88 gasoline gallon equivalent [GGE]
[US EIA 2019]). If a WWTP converts biogas to renewable CNG, the facility may either use it
onsite as vehicle fuel or inject it into the natural gas pipeline. The sale price of renewable CNG
varies depending on its use. If a WWTP uses it onsite as vehicle fuel, the facility would offset the
costs associated with fueling CNG vehicles (for the statewide estimates, we assumed price of
$2.4/GGE). If a WTTP injects it into the pipeline, the facility would sell the renewable CNG wholesale to a natural gas provider (for the statewide estimates, we assumed price of
$0.93/GGE).
Revenue from Credits
Low Carbon Fuel Standard (LCFS) credit and Renewable Identification Number (RIN) credit can augment the revenue generated when WWTPs convert biogas to renewable CNG. In the past,
the U.S. EPA considered the biogas generated from food waste a Cellulosic Biofuel (D3 bucket).
However, biogas generated from food waste now only qualifies as an Advanced Biofuel (D5
bucket). D5 RIN credits are less valuable than D3. For this analysis, we assumed an LCFS credit
value of $169 per metric ton of carbon dioxide equivalent (MT CO2e) and a RIN credit value of
$0.47/RIN (the assumed D5 value). These credits reflect recent values, but as shown in Figures
3.5 and 3.6, the LCFS and RIN credits have varied over time. We further assumed WWTPs would
receive the full credit amount associated with producing renewable fuel from biogas. This requires agreements with CNG off takers to determine and define credit ownership. The proportional distribution of credit and the specific credit values themselves can differ based on
such agreements and market conditions. Hence, the value of these credits reflect an uncertain source of revenue for WWTPs.
The Self-Generation Incentive Program (SGIP) provides incentives for technologies to meet all or
a portion of the electric energy needs of a facility onsite (SGIP 2017). The SGIP credit is limited to a maximum power production of 3 MW per facility and an annual funding cap every year.
Because our analysis indicated that WWTPs would not exceed the 3 MW limit, we included the SGIP credit ($0.60/W, excluding biogas adder) up to the 2019 annual cap for all facilities using biogas to produce power. This value represents expected changes in the program in 2020. In conformance with additional program constraints, we also assumed that no facility would
generate more than 125 percent of the electricity used onsite.
Figure 3.5 Historical Value of LCFS Credits (NESTE 2019)
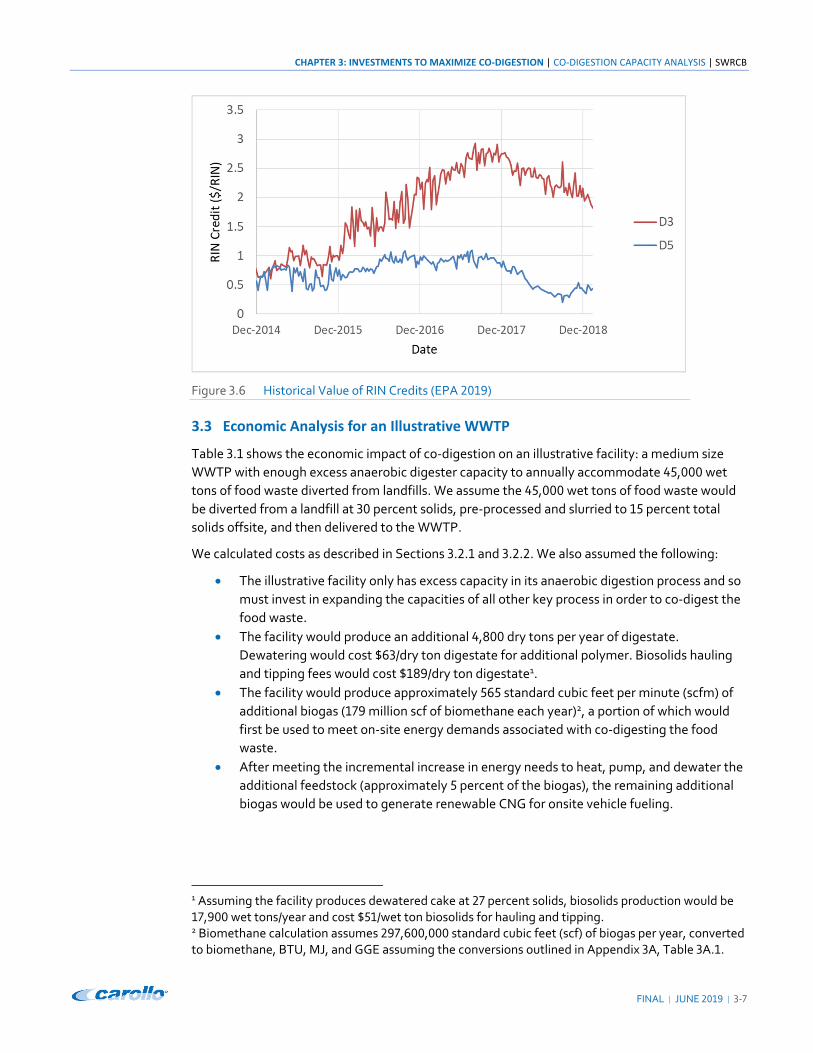
CHAPTER 3: INVESTMENTS TO MAXIMIZE CO-DIGESTION | CO-DIGESTION CAPACITY ANALYSIS | SWRCB
FINAL | JUNE | ‐
Figure . Historical Value of RIN Credits (EPA )
3.3 Economic Analysis for an Illustrative WWTP
Table . shows the economic impact of co‐digestion on an illustrative facility: a medium size
WWTP with enough excess anaerobic digester capacity to annually accommodate , wet
tons of food waste diverted from landfills. We assume the , wet tons of food waste would
be diverted from a landfill at percent solids, pre‐processed and slurried to percent total
solids offsite, and then delivered to the WWTP.
We calculated costs as described in Sections . . and . . . We also assumed the following:
The illustrative facility only has excess capacity in its anaerobic digestion process and so
must invest in expanding the capacities of all other key process in order to co‐digest the
food waste.
The facility would produce an additional , dry tons per year of digestate.
Dewatering would cost /dry ton digestate for additional polymer. Biosolids hauling
and tipping fees would cost /dry ton digestate1.
The facility would produce approximately standard cubic feet per minute (scfm) of
additional biogas ( million scf of biomethane each year)2, a portion of which would
first be used to meet on‐site energy demands associated with co‐digesting the food
waste.
After meeting the incremental increase in energy needs to heat, pump, and dewater the
additional feedstock (approximately percent of the biogas), the remaining additional
biogas would be used to generate renewable CNG for onsite vehicle fueling.
1 Assuming the facility produces dewatered cake at percent solids, biosolids production would be
, wet tons/year and cost /wet ton biosolids for hauling and tipping. 2 Biomethane calculation assumes , , standard cubic feet (scf) of biogas per year, converted to biomethane, BTU, MJ, and GGE assuming the conversions outlined in Appendix A, Table A. .

SWRCB | CO-DIGESTION CAPACITY ANALYSIS | CHAPTER 3: INVESTMENTS TO MAXIMIZE CO-DIGESTION
‐ | JUNE | FINAL
The normalized unit value is per wet ton diverted food waste. However, the economic
impact on an actual facility would vary based on the capacity of existing systems, facility size,
and biogas end‐uses. Additionally, this report assumes biogas upgrading would take place at
each WWTP instead of at a centralized system.
Figure . summarizes the estimated costs and revenues for the illustrative facility, assuming
different biogas end‐uses. As shown in this figure, renewable CNG for transportation via an
onsite fueling station appears to be the most cost effective due to the associated revenue
streams. However, the costs presented do not include the costs associated with converting a
vehicle fleet to CNG. Such a cost may add considerable capital expense to a biogas‐to‐vehicle
fuel project.
Table . Illustrative Facility ( , Short Wet Tons of Diverted Food Waste): Percent
Renewable CNG for Onsite Vehicle Fueling Station
Component Median
Capital Cost Average Annual
O&M Cost
Average Annual
Revenue
Solid Organic Waste Receiving Station ( , , ) ( , )
Dewatering ( , , ) ( , )
Biogas Conditioning | Cogeneration ( , ) ( , )
Biogas Conditioning | Vehicle Fuel ( , , ) ( , )
Flares ( , , ) ( , )
Biogas Beneficial Use | Cogeneration ( , ) ( , )
Biogas Beneficial Use | Vehicle Fuel( ) ( , , ) ( , )
Overall Labor ( , )
Additional Polymer ( , )
Biosolids Hauling and Tipping ( , )
Food Waste Tipping , ,
Renewable CNG Produced , ,
SGIP Credit ,
LCFS Credits (CNG ) , ,
RINs ,
Total (Cost) or Revenue ( , , ) ( , , ) , ,
Normalized (Cost) or Revenue( )( ) , ,
(Cost) or Revenue per Wet Short Ton of Food Waste at % Solids
(Cost) or Revenue per Wet Short Ton of Food Waste at % Solids
Notes: ( ) The costs for new vehicles, new trucks, or vehicle fleet fuel conversion are not included in the costs shown. ( ) A Capital Recovery Factor (CRF) of . is assumed. This CRF is calculated using a borrowing cost of . percent (CA
State Treasurer ) and a project lifetime of years. See Appendix E for a description of how the CRF was calculated and a ‘normalized’ cost was determined.
( ) To compare to other studies, we also calculated a ‐year net present value of , , . We assumed an O&M cost and revenue inflation rate of percent per year and a discount rate of . percent per year. The normalized costs and revenues used in this report do not assume an inflation or discount rate for ongoing costs and revenues because these values will fluctuate over time as the price of power / polymer / labor / etc. change. Such a nuanced analysis was beyond this project’s scope.

CHAPTER 3: INVESTMENTS TO MAXIMIZE CO-DIGESTION | CO-DIGESTION CAPACITY ANALYSIS | SWRCB
FINAL | JUNE | ‐
Figure . Normalized (Costs) and Revenues per Short Wet Ton of Diverted Food Waste by Biogas
End‐Use for an Illustrative Facility Handling , Short Wet Tons of Diverted Food
Waste Per Year
Finally, we examined how the normalized unit value per wet ton of diverted food waste
fluctuates depending on the facility size and biogas end use (Figure . ). Assuming the
illustrative facility only has existing excess capacity in its anaerobic digester, dedicating the
additional biogas to onsite electricity use appears revenue negative ‐ for a range of facility sizes.
For a facility that also has capacity in other key‐processes, co‐digesting food waste and
dedicating the additional biogas to electricity may appear more cost‐effective. This analysis also
assumes . /kWh as the value for electricity. Higher unit values for power would also make
electricity generation more favorable.
While the use of renewable CNG for vehicle fuel may be the most beneficial biogas use relative
to the State’s LCFS goals and available credits, the feasibility of this option requires proximity to
a large demand base and vehicle fleets that can use CNG. The use of renewable CNG for pipeline
injection also requires proximity to a sufficiently sized utility gas pipeline and overcoming current
barriers like high interconnect fees and gas quality standards. Based on these conditions and
constraints, electricity production has historically been the most viable biogas utilization option
for most facilities (EPA ). Chapter and Chapter discuss non‐economic factors that both
impede and facilitate various biogas end uses in further detail.
Today, most WWTPs dedicate biogas to combined heat and power (CHP) systems for on‐site use
(EPA ).
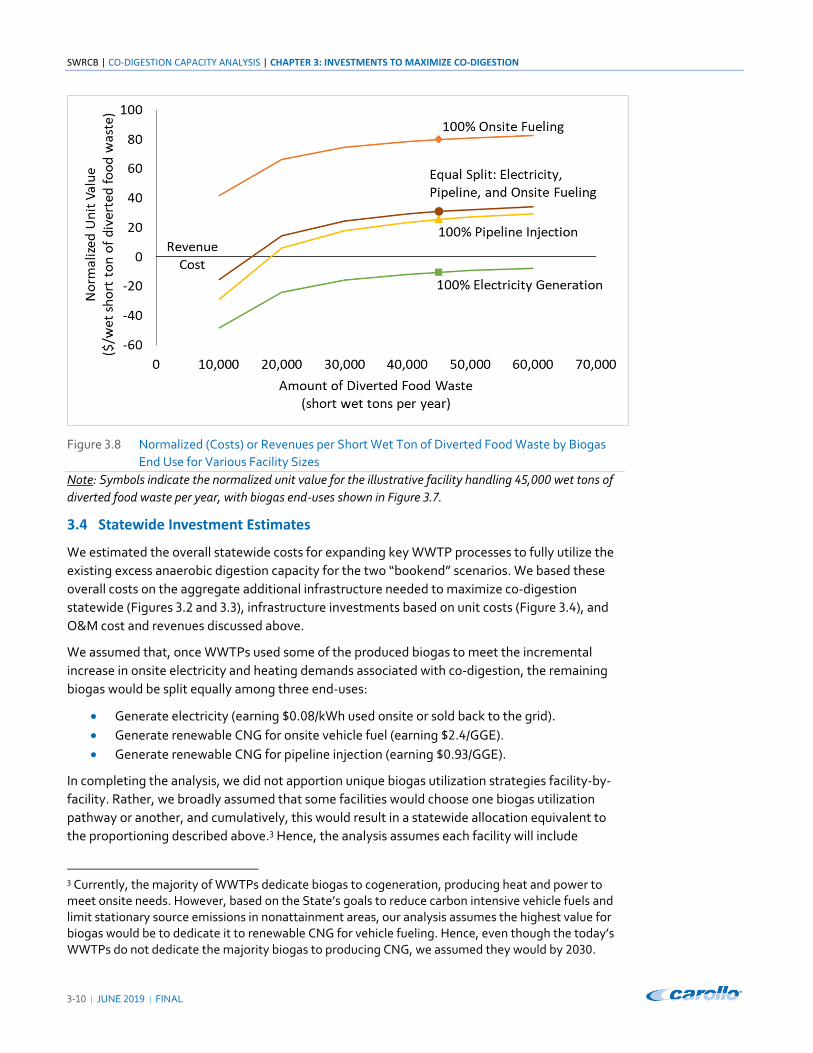
SWRCB | CO-DIGESTION CAPACITY ANALYSIS | CHAPTER 3: INVESTMENTS TO MAXIMIZE CO-DIGESTION
‐ | JUNE | FINAL
Figure . Normalized (Costs) or Revenues per Short Wet Ton of Diverted Food Waste by Biogas
End Use for Various Facility Sizes
Note: Symbols indicate the normalized unit value for the illustrative facility handling , wet tons of
diverted food waste per year, with biogas end‐uses shown in Figure . .
3.4 Statewide Investment Estimates
We estimated the overall statewide costs for expanding key WWTP processes to fully utilize the
existing excess anaerobic digestion capacity for the two “bookend” scenarios. We based these
overall costs on the aggregate additional infrastructure needed to maximize co‐digestion
statewide (Figures . and . ), infrastructure investments based on unit costs (Figure . ), and
O&M cost and revenues discussed above.
We assumed that, once WWTPs used some of the produced biogas to meet the incremental
increase in onsite electricity and heating demands associated with co‐digestion, the remaining
biogas would be split equally among three end‐uses:
Generate electricity (earning . /kWh used onsite or sold back to the grid).
Generate renewable CNG for onsite vehicle fuel (earning . /GGE).
Generate renewable CNG for pipeline injection (earning . /GGE).
In completing the analysis, we did not apportion unique biogas utilization strategies facility‐by‐
facility. Rather, we broadly assumed that some facilities would choose one biogas utilization
pathway or another, and cumulatively, this would result in a statewide allocation equivalent to
the proportioning described above.3 Hence, the analysis assumes each facility will include
3 Currently, the majority of WWTPs dedicate biogas to cogeneration, producing heat and power to meet onsite needs. However, based on the State’s goals to reduce carbon intensive vehicle fuels and limit stationary source emissions in nonattainment areas, our analysis assumes the highest value for biogas would be to dedicate it to renewable CNG for vehicle fueling. Hence, even though the today’s WWTPs do not dedicate the majority biogas to producing CNG, we assumed they would by .
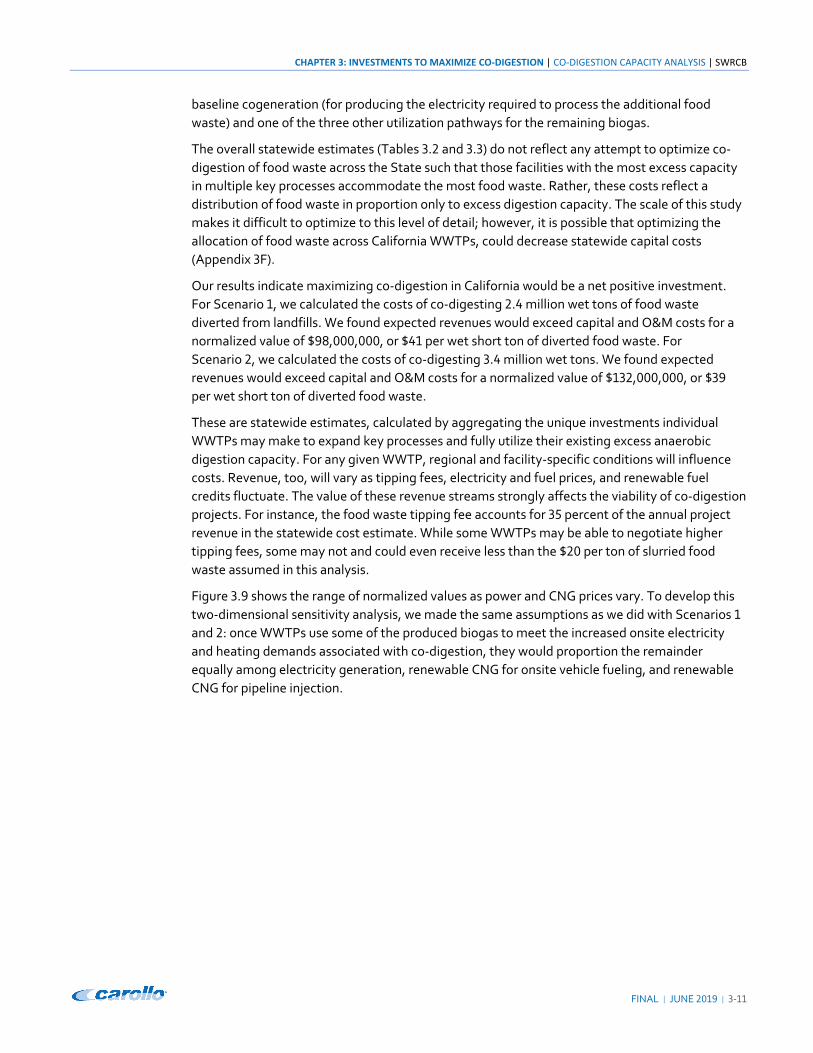
CHAPTER 3: INVESTMENTS TO MAXIMIZE CO-DIGESTION | CO-DIGESTION CAPACITY ANALYSIS | SWRCB
FINAL | JUNE 2019 | 3-11
baseline cogeneration (for producing the electricity required to process the additional food
waste) and one of the three other utilization pathways for the remaining biogas.
The overall statewide estimates (Tables 3.2 and 3.3) do not reflect any attempt to optimize co-digestion of food waste across the State such that those facilities with the most excess capacity
in multiple key processes accommodate the most food waste. Rather, these costs reflect a distribution of food waste in proportion only to excess digestion capacity. The scale of this study makes it difficult to optimize to this level of detail; however, it is possible that optimizing the allocation of food waste across California WWTPs, could decrease statewide capital costs (Appendix 3F).
Our results indicate maximizing co-digestion in California would be a net positive investment.
For Scenario 1, we calculated the costs of co-digesting 2.4 million wet tons of food waste
diverted from landfills. We found expected revenues would exceed capital and O&M costs for a
normalized value of $98,000,000, or $41 per wet short ton of diverted food waste. For
Scenario 2, we calculated the costs of co-digesting 3.4 million wet tons. We found expected
revenues would exceed capital and O&M costs for a normalized value of $132,000,000, or $39
per wet short ton of diverted food waste.
These are statewide estimates, calculated by aggregating the unique investments individual
WWTPs may make to expand key processes and fully utilize their existing excess anaerobic digestion capacity. For any given WWTP, regional and facility-specific conditions will influence
costs. Revenue, too, will vary as tipping fees, electricity and fuel prices, and renewable fuel
credits fluctuate. The value of these revenue streams strongly affects the viability of co-digestion projects. For instance, the food waste tipping fee accounts for 35 percent of the annual project
revenue in the statewide cost estimate. While some WWTPs may be able to negotiate higher
tipping fees, some may not and could even receive less than the $20 per ton of slurried food
waste assumed in this analysis.
Figure 3.9 shows the range of normalized values as power and CNG prices vary. To develop this
two-dimensional sensitivity analysis, we made the same assumptions as we did with Scenarios 1
and 2: once WWTPs use some of the produced biogas to meet the increased onsite electricity
and heating demands associated with co-digestion, they would proportion the remainder
equally among electricity generation, renewable CNG for onsite vehicle fueling, and renewable
CNG for pipeline injection.
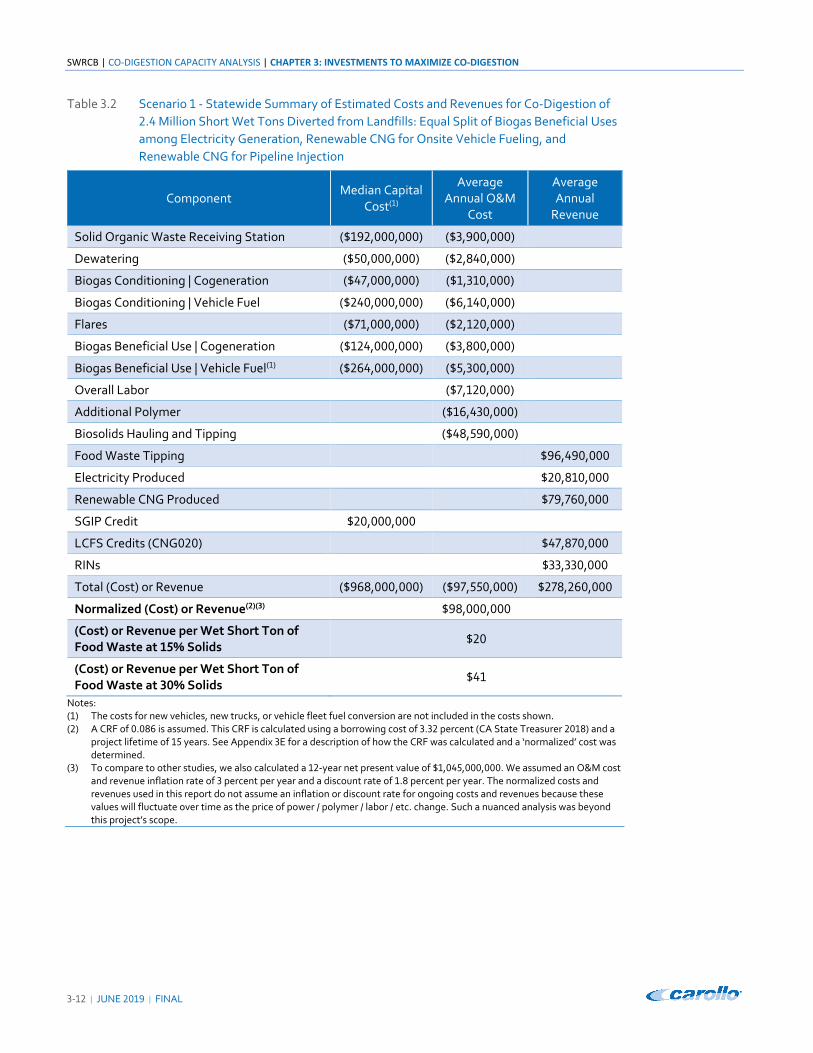
SWRCB | CO-DIGESTION CAPACITY ANALYSIS | CHAPTER 3: INVESTMENTS TO MAXIMIZE CO-DIGESTION
3-12 | JUNE 2019 | FINAL
Table 3.2 Scenario 1 - Statewide Summary of Estimated Costs and Revenues for Co-Digestion of 2.4 Million Short Wet Tons Diverted from Landfills: Equal Split of Biogas Beneficial Uses among Electricity Generation, Renewable CNG for Onsite Vehicle Fueling, and
Renewable CNG for Pipeline Injection
Component Median Capital
Cost(1)
Average Annual O&M
Cost
Average Annual
Revenue
Solid Organic Waste Receiving Station ($192,000,000) ($3,900,000)
Dewatering ($50,000,000) ($2,840,000)
Biogas Conditioning | Cogeneration ($47,000,000) ($1,310,000)
Biogas Conditioning | Vehicle Fuel ($240,000,000) ($6,140,000)
Flares ($71,000,000) ($2,120,000)
Biogas Beneficial Use | Cogeneration ($124,000,000) ($3,800,000)
Biogas Beneficial Use | Vehicle Fuel(1) ($264,000,000) ($5,300,000)
Overall Labor ($7,120,000)
Additional Polymer ($16,430,000)
Biosolids Hauling and Tipping ($48,590,000)
Food Waste Tipping $96,490,000
Electricity Produced $20,810,000
Renewable CNG Produced $79,760,000
SGIP Credit $20,000,000
LCFS Credits (CNG020) $47,870,000
RINs $33,330,000
Total (Cost) or Revenue ($968,000,000) ($97,550,000) $278,260,000
Normalized (Cost) or Revenue(2)(3) $98,000,000
(Cost) or Revenue per Wet Short Ton of Food Waste at 15% Solids
$20
(Cost) or Revenue per Wet Short Ton of Food Waste at 30% Solids
$41
Notes: (1) The costs for new vehicles, new trucks, or vehicle fleet fuel conversion are not included in the costs shown. (2) A CRF of 0.086 is assumed. This CRF is calculated using a borrowing cost of 3.32 percent (CA State Treasurer 2018) and a
project lifetime of 15 years. See Appendix 3E for a description of how the CRF was calculated and a ‘normalized’ cost was determined.
(3) To compare to other studies, we also calculated a 12-year net present value of $1,045,000,000. We assumed an O&M cost and revenue inflation rate of 3 percent per year and a discount rate of 1.8 percent per year. The normalized costs and revenues used in this report do not assume an inflation or discount rate for ongoing costs and revenues because these values will fluctuate over time as the price of power / polymer / labor / etc. change. Such a nuanced analysis was beyond this project’s scope.
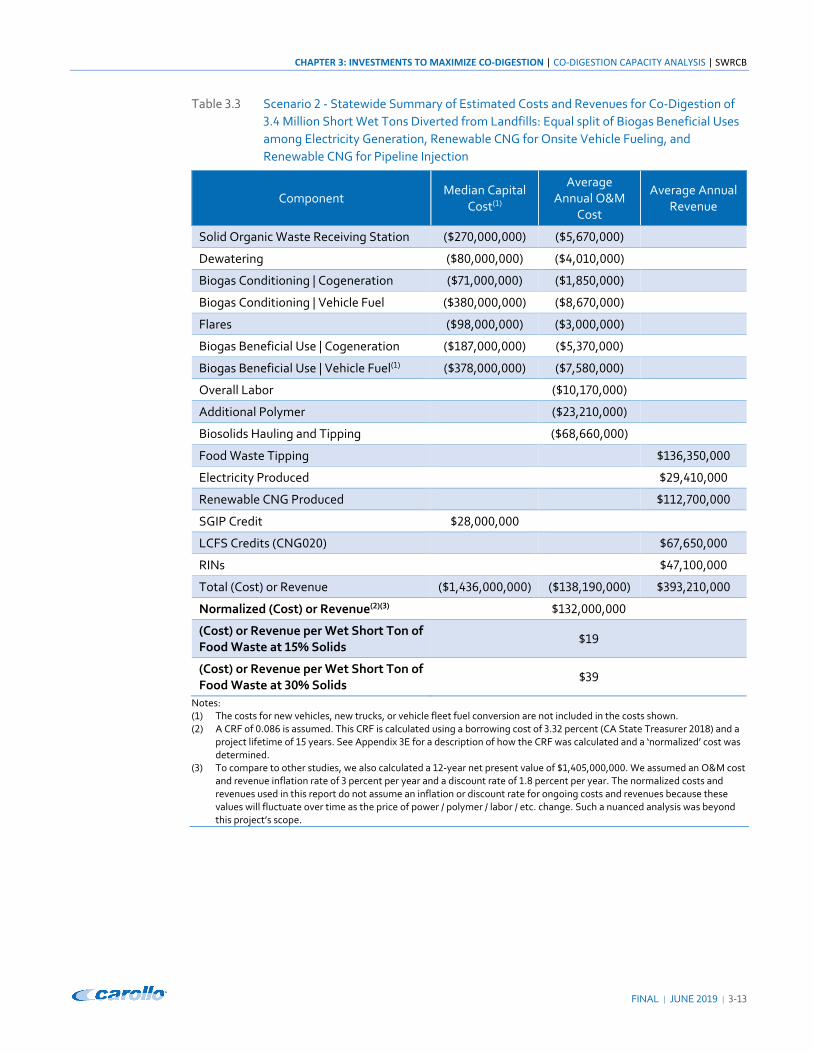
CHAPTER 3: INVESTMENTS TO MAXIMIZE CO-DIGESTION | CO-DIGESTION CAPACITY ANALYSIS | SWRCB
FINAL | JUNE 2019 | 3-13
Table 3.3 Scenario 2 - Statewide Summary of Estimated Costs and Revenues for Co-Digestion of 3.4 Million Short Wet Tons Diverted from Landfills: Equal split of Biogas Beneficial Uses among Electricity Generation, Renewable CNG for Onsite Vehicle Fueling, and
Renewable CNG for Pipeline Injection
Component Median Capital
Cost(1)
Average Annual O&M
Cost
Average Annual Revenue
Solid Organic Waste Receiving Station ($270,000,000) ($5,670,000)
Dewatering ($80,000,000) ($4,010,000)
Biogas Conditioning | Cogeneration ($71,000,000) ($1,850,000)
Biogas Conditioning | Vehicle Fuel ($380,000,000) ($8,670,000)
Flares ($98,000,000) ($3,000,000)
Biogas Beneficial Use | Cogeneration ($187,000,000) ($5,370,000)
Biogas Beneficial Use | Vehicle Fuel(1) ($378,000,000) ($7,580,000)
Overall Labor ($10,170,000)
Additional Polymer ($23,210,000)
Biosolids Hauling and Tipping ($68,660,000)
Food Waste Tipping $136,350,000
Electricity Produced $29,410,000
Renewable CNG Produced $112,700,000
SGIP Credit $28,000,000
LCFS Credits (CNG020) $67,650,000
RINs $47,100,000
Total (Cost) or Revenue ($1,436,000,000) ($138,190,000) $393,210,000
Normalized (Cost) or Revenue(2)(3) $132,000,000
(Cost) or Revenue per Wet Short Ton of Food Waste at 15% Solids
$19
(Cost) or Revenue per Wet Short Ton of Food Waste at 30% Solids
$39
Notes: (1) The costs for new vehicles, new trucks, or vehicle fleet fuel conversion are not included in the costs shown. (2) A CRF of 0.086 is assumed. This CRF is calculated using a borrowing cost of 3.32 percent (CA State Treasurer 2018) and a
project lifetime of 15 years. See Appendix 3E for a description of how the CRF was calculated and a ‘normalized’ cost was determined.
(3) To compare to other studies, we also calculated a 12-year net present value of $1,405,000,000. We assumed an O&M cost and revenue inflation rate of 3 percent per year and a discount rate of 1.8 percent per year. The normalized costs and revenues used in this report do not assume an inflation or discount rate for ongoing costs and revenues because these values will fluctuate over time as the price of power / polymer / labor / etc. change. Such a nuanced analysis was beyond this project’s scope.
SWRCB | CO-DIGESTION CAPACITY ANALYSIS | CHAPTER 3: INVESTMENTS TO MAXIMIZE CO-DIGESTION
3-14 | JUNE 2019 | FINAL
Scenario 1 Scenario 2
CN
G P
rice
($/G
GE
)
Electricity Price ($/kWh)
CN
G P
rice
($/G
GE
)
Electricity Price ($/kWh)
0.00 0.04 0.08 0.12 0.16 0.00 -$1 $3 $7 $12 $16 0.75 $14 $18 $22 $27 $31
1.50 $29 $33 $37 $41 $46 2.25 $44 $48 $52 $56 $61 3.00 $58 $63 $67 $71 $75
0.00 0.04 0.08 0.12 0.16 0.00 -$3 $1 $6 $10 $14 0.75 $12 $16 $21 $25 $29
1.50 $27 $31 $35 $40 $44 2.25 $42 $46 $50 $55 $59 3.00 $57 $61 $65 $70 $74
Figure 3.9 Normalized Value ($/wet ton diverted) for Scenario 1 and Scenario 2 as Electricity and CNG Prices Vary
3.4.1 Comparison to Recent Cost Estimates
The CalRecycle’s Standardized Regulatory Impact Assessment for the Proposed Regulation for Short-Lived Climate Pollutants: Organic Waste Methane Emissions considered the expected cumulative costs and revenues associated with implementing Senate Bill (SB) 1383 (CalRecycle,
2018). CalRecycle analyzed the economic impact of a scenario in which a combination of new
compost and anaerobic digestion facilities would handle the food waste diverted from landfills.
CalRecycle estimated a 12-year Net Present Value (NPV) of $528 Million for 60 compost facilities
and $3,177 Million for 26 new stand-alone anaerobic digestion facilities. The 26 new stand-alone anaerobic digestion facilities would accept 2.6 million wet tons per year of diverted food waste4.
The NPV values for compost are likely lower than those for co-digestion (Tables 3.2 and 3.3) because co-digestion provides benefits that compost does not, i.e., renewable energy and low-carbon fuel use. On the other hand, the estimated NPV values for stand-alone digesters appear higher than those for co-digestion. It is important to emphasize that our analysis provides a more comprehensive picture of the expected capital costs than previous estimates that focused
on individual components of the overall system.
The California Energy Commission (CEC)’s Renewable Energy Resource, Technology, and Economic Assessments: Appendix H presents levelized cost of energy for biogas distributed power
generation that range from $51/MWh to $76/MWh for wastewater facilities (CEC, 2017b). The CEC analysis was not specifically for co-digestion and only accounted for the capital and O&M costs associated with biogas distributed power generation. Only accounting for the total capital and O&M costs, we estimate Scenario 1 would cost $59/MWh and Scenario 2 would cost
$58/MWh. These values fall within the range of those estimated in the CEC report.
3.5 Community Impacts
In addition to supporting the State’s organic waste diversion goals and greenhouse gas emission reduction targets, co-digestion of diverted food waste at WWTPs could have impacts on surrounding communities. The impacts - which include job creation, truck trips, noise, and odors - are described in the sections that follow.
4 Each facility would have a throughput of 100,000 wet tons per year (CalRecycle 2018).
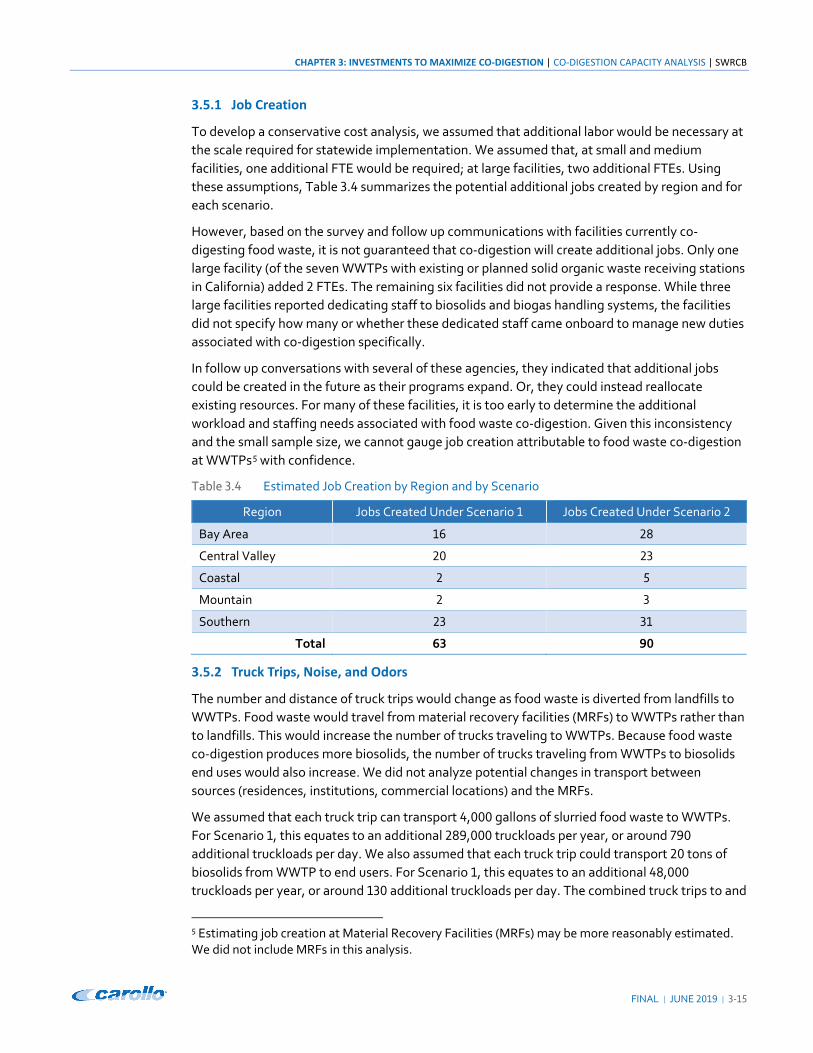
CHAPTER 3: INVESTMENTS TO MAXIMIZE CO-DIGESTION | CO-DIGESTION CAPACITY ANALYSIS | SWRCB
FINAL | JUNE 2019 | 3-15
3.5.1 Job Creation
To develop a conservative cost analysis, we assumed that additional labor would be necessary at
the scale required for statewide implementation. We assumed that, at small and medium facilities, one additional FTE would be required; at large facilities, two additional FTEs. Using these assumptions, Table 3.4 summarizes the potential additional jobs created by region and for each scenario.
However, based on the survey and follow up communications with facilities currently co-digesting food waste, it is not guaranteed that co-digestion will create additional jobs. Only one
large facility (of the seven WWTPs with existing or planned solid organic waste receiving stations
in California) added 2 FTEs. The remaining six facilities did not provide a response. While three large facilities reported dedicating staff to biosolids and biogas handling systems, the facilities
did not specify how many or whether these dedicated staff came onboard to manage new duties
associated with co-digestion specifically.
In follow up conversations with several of these agencies, they indicated that additional jobs
could be created in the future as their programs expand. Or, they could instead reallocate existing resources. For many of these facilities, it is too early to determine the additional
workload and staffing needs associated with food waste co-digestion. Given this inconsistency
and the small sample size, we cannot gauge job creation attributable to food waste co-digestion at WWTPs5 with confidence.
Table 3.4 Estimated Job Creation by Region and by Scenario
Region Jobs Created Under Scenario 1 Jobs Created Under Scenario 2
Bay Area 16 28
Central Valley 20 23
Coastal 2 5
Mountain 2 3
Southern 23 31
Total 63 90
3.5.2 Truck Trips, Noise, and Odors
The number and distance of truck trips would change as food waste is diverted from landfills to
WWTPs. Food waste would travel from material recovery facilities (MRFs) to WWTPs rather than to landfills. This would increase the number of trucks traveling to WWTPs. Because food waste
co-digestion produces more biosolids, the number of trucks traveling from WWTPs to biosolids
end uses would also increase. We did not analyze potential changes in transport between
sources (residences, institutions, commercial locations) and the MRFs.
We assumed that each truck trip can transport 4,000 gallons of slurried food waste to WWTPs.
For Scenario 1, this equates to an additional 289,000 truckloads per year, or around 790
additional truckloads per day. We also assumed that each truck trip could transport 20 tons of
biosolids from WWTP to end users. For Scenario 1, this equates to an additional 48,000
truckloads per year, or around 130 additional truckloads per day. The combined truck trips to and
5 Estimating job creation at Material Recovery Facilities (MRFs) may be more reasonably estimated. We did not include MRFs in this analysis.
SWRCB | CO-DIGESTION CAPACITY ANALYSIS | CHAPTER 3: INVESTMENTS TO MAXIMIZE CO-DIGESTION
3-16 | JUNE 2019 | FINAL
from the WWTPs for Scenario 1 would result in an additional 337,000 truckloads per year.
Similarly for Scenario 2, food waste co-digestion would result in an additional 477,000 truckloads
per year.
As the number of truck trips increase to and from WWTPs, the associated truck traffic noise
would increase. For instance, a diesel truck traveling at 50 miles per hour typically generates a
maximum instantaneous noise level of around 85 dBA at a distance of 50 feet. This is around 10
dBA louder than the noise generated during the day in an urban area, which is around 75 dBA
(California Department of Transportation 2013). However, this truck traffic is periodic. According
to the California Department of Transportation, the maximum allowable noise exposure over
15 minutes is 115 dBA (2013). The expected truck traffic noise is less than this threshold.
Food waste trucks are enclosed and should not cause additional odors during transport, but
odors may escape during offloading at the WWTP. Additional onsite odor control may be necessary at WWTPs to mitigate the risk of odor releases during offloading. We accounted for additional odor control in the capital and O&M cost estimates conducted for this study.
3.6 Regulatory Considerations
Maximizing co-digestion statewide will require complying with increasingly stringent regulations governing water quality, air quality, and solids management. Rather than incorporate potential compliance costs into the overall costs estimates, we identify a few potential regulatory obstacles and acknowledge overcoming them may increase the cost of co-digestion projects.
3.6.1 Water Quality
Co-digestion of diverted food waste increases nutrient loads in the digesters and the resulting biosolids. Upon dewatering biosolids, the liquid residue, centrate, which contains a high concentration of nutrients (e.g., nitrogen), is typically routed back to the headworks of a
wastewater treatment plant. Co-digestion can increase the nutrient concentration in the centrate, which, could, in turn, increase the nutrient concentration of discharged effluent. There are varying requirements, or limits, for effluent nutrient concentrations depending on where the
effluent is discharged or reused.
The State Water Resources Control Board and the Regional Water Quality Control Boards govern regulations related to effluent quality. At this time, those agencies are developing
regulations that will limit nutrient loading in effluent discharged to the San Francisco Bay. While
there are treatment processes capable of removing nutrients from wastewater to meet the
limits, these approaches can be costly. Generally, the stricter the effluent limit, the more costly
and energy intensive achieving it will be. If the wastewater sector begins implementing co-digestion projects more broadly, the cost of implementing nutrient removal processes should also be considered.
3.6.2 Air Quality
Air emission requirements can present barriers to beneficially using biogas. The regulatory bodies that govern regulations related to air emissions and biogas conditioning and utilization
(on or offsite) are the US EPA (Clean Air Act), Occupational Safety and Health Administration
(OSHA), California Air Resources Board (CARB), California Public Utilities Commission (CPUC),
and local air districts.
CHAPTER 3: INVESTMENTS TO MAXIMIZE CO-DIGESTION | CO-DIGESTION CAPACITY ANALYSIS | SWRCB
FINAL | JUNE | ‐
SCAQMD Rule 1110.2
The South Coast Air Quality Management District (SCAQMD) Rule . was first adopted in
, and significantly amended in and again in . These changes, which other local air
districts have followed, resulted in restrictive limits on nitrogen oxides (NOx) emissions from
engines. The air districts aim to achieve an percent reduction of NOx by in areas that are
in non‐attainment for ozone. Engine NOx limits dropped from ppmvd to ppmvd. To meet
this limit while continuing to generate power via biogas combustion requires costly air pollution
control equipment or an alternative to onsite combustion. Currently, these requirements impact
WWTPs in the South Coast and San Joaquin air basins, but may soon have more widespread
impact, as additional air districts are considering more stringent NOx limits for engines.
SCAQMD Rule 1118.1
The SCAQMD adopted Rule . on January , . This rule restricts NOx, volatile organic
compounds (VOCs), and carbon monoxide (CO) emissions from non‐refinery flares; it focuses on
maximizing emission reductions, minimizing routine flaring, and encouraging beneficial use of
gases that would otherwise be flared. This rule may impede co‐digestion at WWTPs because of
increased nitrogen loading (See Section . . ). Depending on digester operations, the additional
nitrogen load may increase free ammonia in the biogas, which, when combusted in a flare,
converts to NOx. The subsequent flare emissions may not comply with . ’s very restrictive
limits for NOx ( . pounds per million British thermal units [lbs/MMBtu] for major sources and
. lbs per MMBtu for minor sources). The Rule contains resolution language to evaluate best
available control technologies if NOx emissions exceed thresholds, which could be very costly
and diminish the economic feasibility of co‐digestion projects.
This rule also contains language requiring research be done by SCAQMD in to examine the
potential impact of SB (i.e., diverted food waste co‐digestion) on WWTPs. The goal of this
research is to determine if the NOx limit needs to be modified to reduce barriers to the
implementation of SB .
CPUC Standards for Biomethane Pipeline Injection
In addition to the high cost of interconnecting into a natural gas pipeline in California, the CPUC
biomethane standard (i.e., a required heat content of Btu/scf) for pipeline injection has been
difficult to achieve in a cost‐effective manner. These barriers have disincentivized projects that
aim to increase production of biogas for sale to local utilities. In , the California Council on
Science and Technology (CCST) released a comprehensive review of the technology and issues
concerning injecting renewable natural gas (RNG) into the natural gas pipeline. The study covers
the different sources of biomethane, difficulties meeting pipeline specifications, and concerns
that might arise with RNG deployment scenarios (CCST ).
As a result of CCST’s work, the CPUC opened proceedings in the fall of to adjust the
required heat content for biomethane pipeline injection to Btu/scf, which is attainable via
current biogas conditioning technology. It is anticipated that this proceeding will conclude by
, providing an alternative use of biogas in the event that meeting emissions limits for
stationary sources becomes too costly to satisfy.
Cal-ARP Risk Management Plans and OSHA Process Safety Management Procedures
In the Clean Air Act Amendments of , Congress required OSHA to adopt the Process Safety
Management (PSM) and required EPA to issue the Risk Management Plan Rule (RMP). These
SWRCB | CO-DIGESTION CAPACITY ANALYSIS | CHAPTER 3: INVESTMENTS TO MAXIMIZE CO-DIGESTION
‐ | JUNE | FINAL
regulations were developed to prevent the release of an extremely hazardous or flammable
substance such as the toxic gas release that occurred in Bhopal, India in . PSM and RMP
were written to complement each other in accomplishing these Congressional goals; they act in
parallel and have many similarities but also some key differences. Both regulations regulate the
owner or operator of a stationary source with more than a threshold quantity of a regulated
substance in a process. The threshold quantities differ slightly between PSM and RMP as do the
requirements and exceptions.
In the State of California, the “Risk Management Plan Program” is the California Accidental
Release Prevention Program, or CalARP. CalARP is the Federal Risk Management Plan Program
with additional state requirements, including an additional list of regulated substances and
thresholds (CCR, Title , Section . ).
While Federal OSHA does not have direct jurisdiction over employees of state and local
governments, twenty‐five States, including California, administer their own occupational safety
and health programs under plans approved by OSHA. These States are required to adopt and
enforce occupational safety and health standards which are at least as effective as those
promulgated by OSHA and must extend their coverage to public sector employees (OSHA Act of
, Section ). As a result, in California, POTWs must also comply with the PSM standard if
they exceed the threshold quantity of a regulated substance.
For both regulations, a stationary source can be a building, structure, or piece of equipment; and
the process is where the substance is stored, used, manufactured, or handled. Under OHSA,
flammable gas is a regulated substance with a threshold quantity of , lbs. If a facility
exceeds the threshold quantity of flammable gas, it must comply with the PSM standard for the
covered process.
In parallel, per the California Code of Regulations (CCR) Title Division , Chapter . (Cal‐ARP
Program), methane is a regulated substance with a threshold quantity of , lbs. If a facility
exceeds the threshold quantity of the regulated substance, the facility must prepare a RMP and
implement the risk management program. There are three program levels of RMPs, the most
stringent being Program Level , which has similar requirements as the OSHA PSM standard
(CCR, Title , Section ). Additionally, there is a guidance document by the EPA specifically
developed for WWTPs. It explains that the threshold applies to the total weight of the digester
gas mixture, not only the fraction of methane within that mixture, and also provides guidance on
how to determine whether a facility has , lbs of digester gas mixture onsite at any one time
(EPA ).
If a facility exceeds the methane/flammable gas threshold with its onsite biogas production
process AND uses all of it onsite, they are exempt from both the PSM standard and the Cal‐ARP
program. However, if all or even a small portion of that biogas is used offsite, then that facility
must comply with both regulations.
Implementing a RMP and PSM program proved too onerous for one Bay Area utility. Currently
this utility sells surplus electric power from onsite cogeneration to a wholesale customer. Onsite
cogeneration is exempt from PSM and RMP regulations. But the value of renewable electricity
has declined in California, making co‐digestion projects that use cogeneration less financially
attractive. To find greater value in biogas produced from co‐digestion, the facility had been
planning to interconnect to the local utility pipeline grid and deliver renewable natural gas for
CHAPTER 3: INVESTMENTS TO MAXIMIZE CO-DIGESTION | CO-DIGESTION CAPACITY ANALYSIS | SWRCB
FINAL | JUNE 2019 | 3-19
use as a transportation fuel. Faced with PSM and RMP requirements and their associated costs,
this facility abandoned the project, forfeiting a proposed grant award from the California Energy
Commission as well as the potential LCFS and RFS credits. Because of the relatively low value of renewable electricity, generating a renewable transportation fuel from biogas was a critical
factor in its plans to expand co-digestion and the utility is now uncertain if accepting additional
food waste will be financially viable.
3.6.3 Solids Management
The US EPA, the State Water Resources Control Board, and CalRecycle govern regulations
related to biosolids treatment and use. County jurisdictions across the state also play a role in
that some have limited the land application of Class B biosolids. While co-digestion may increase biosolids production at a WWTP, it does not affect a facility’s ability to meet regulatory requirements related to biosolids quality. Inasmuch, the state and local requirements pertaining
to biosolids use are what may increase co-digestion O&M costs beyond the estimates presented in Section 3.2.2.
The ordinances banning the land application of Class B biosolids have already compelled many WWTPs to haul solids great distances (even out of state6) or to landfills. Alternative biosolids treatments, ranging from composting to heat drying to gasification, could help WWTPs navigate
use restrictions; such treatments are, however, more expensive.
Currently, state law incentivizes using biosolids as alternative daily cover (ADC) at landfills. Jurisdictions sending biosolids to a landfill as ADC may count that as a diversion credit, helping them to reach AB 939 diversion goal mandates. However, the SB 1383 rulemaking may make
ADC a less attractive option for organic waste management. For the purposes of the SB 1383
regulation, using organic waste (including biosolids) as landfill cover will constitute disposal of organic waste.
On the other hand, the new regulation establishes procurement targets for the recovery of
organic waste products. The targets would require jurisdictions to procure a certain amount of
these products (e.g., compost and renewable fuel) on an annual basis. Renewable fuel produced
by WWTPs would be considered an eligible organic waste product if the WWTP co-digests with
diverted organic waste and recovers at least 75 percent of the biosolids it produces (i.e., no more
than 25 percent of biosolids could be landfilled, either as ADC or disposal). Biosolids composted
at a permitted compost facility would also be considered an eligible organic waste product.
To what extent SB 1383 incentivizes the land application of biosolids, prompts more expensive
treatments, or both is uncertain. For some WWTPs, being unable to estimate the costs of increased biosolids production with some certainty may make co-digestion appear too risky of an investment.
3.7 Summary of Findings In Chapter 1, we estimated there will be 3.41 million short wet tons per year of divertible and digestible food waste in 2030. In Chapter 2, we analyzed survey results to understand whether
6 About 70 percent of California's biosolids were land applied in 2018, 21 percent of which were land applied in Arizona.
SWRCB | CO-DIGESTION CAPACITY ANALYSIS | CHAPTER 3: INVESTMENTS TO MAXIMIZE CO-DIGESTION
3-20 | JUNE 2019 | FINAL
and to what extent California WWTPs have excess capacity in anaerobic digesters and other key
system processes to accommodate that food waste.
In Chapter 3, we considered what additional infrastructure would be needed to maximize co-digestion potential in California - and at what cost. We found that, if the capacity of key
processes were expanded to match the excess capacity of anaerobic digesters, California
WWTPs could accept from 71 percent (Scenario 1) to 100 percent (Scenario 2) of divertible and
digestible food waste.
Our results indicate maximizing co-digestion in California would be a net positive investment. For Scenario 1, we estimated the costs of co-digesting 2.4 million wet tons of food waste
diverted from landfills. We found expected revenues would exceed capital and O&M costs for a
normalized value of $41 per wet short ton of diverted food waste. For Scenario 2, we estimated the costs of co-digesting 3.4 million wet tons. We found expected revenues would exceed capital and O&M costs for a normalized value of $39 per wet short ton of diverted food waste.
While these estimates are more comprehensive than those provided in previous analyses, true statewide benefits could be lower for numerous reasons. For example, the revenue associated
with co-digested food waste may fall. Tipping fees could drop, as could the value of renewable
electricity, LCFS- and RIN credits. New regulatory pressures may also drive up costs.
Grants and loans could help WWTPs shoulder heavy costs. Appendix 3G lists some of the grant and loan programs that could support co-digestion projects. Multiple parties (MSW facilities,
WWTPs, 3rd parties, etc.) could come together to finance a co-digestion project, advancing an
effort that might otherwise be too burdensome for a WWTP. Especially with financial assistance,
statewide benefits could be higher.
Our capital unit costs are sometimes higher than those assumed in past analyses, in part because
our costs encompass those typically incurred for publicly bid municipal projects. If statewide
costs were lower, statewide benefits could be higher.
Whether higher or lower than presented here, statewide benefits would accrue based on the decisions of individual WWTPs. The amount of co-digested food waste, biogas and biosolids management strategies, and project economics will vary depending on site-specific conditions. While co-digestion may pencil out for one facility, it may not for another.
In addition to analyzing costs, Chapter 3 also considered some of the non-economic impacts of food waste co-digestion at WWTPs. In Chapter 4 we analyze the greenhouse gas emission
reduction potential associated with diverting food waste from landfills to WWTPs for co-digestion. Finally, in Chapters 5 and 6, we discuss the barriers and opportunities for food waste
co-digestion at specific facilities across the state.
CHAPTER 3: INVESTMENTS TO MAXIMIZE CO-DIGESTION | CO-DIGESTION CAPACITY ANALYSIS | SWRCB
FINAL | JUNE 2019 | 3-21
3.8 References
CARB (2017). Short-Lived Climate Pollutant Reduction Strategy Appendix F: Supporting Documentation for the Economic Assessment of Measures in the SLCP Strategy.
CARB (2018). Documentation of California’s Greenhouse Gas Inventory. http://www.arb.ca.gov/cc/inventory/doc/docs1/1a3b_onroad_fuelcombustion_naturalgas_ch4_2013.htm Accessed 5/16/19.
CARB (2019). Weekly LCFS Credit Transfer Activity Reports. https://www.arb.ca.gov/fuels/lcfs/credit/lrtweeklycreditreports.htm Accessed 3/19/19.
California Department of Transportation (2013). Technical Noise Supplement to the Caltrans Traffic Noise Analysis Protocol. September. Sacramento, CA.
California State Treasurer’s Office (2018). By the Numbers: California’s November Financial Health Report. https://medium.com/@catreasurer/by-the-numbers-californias-november-financial-health-report-bae00edced4e
CalRecycle (2018). Standardized Regulatory Impact Assessment. Proposed Regulation for Short-Lived Climate Pollutants: Organic Waste Methane Emissions. http://www.dof.ca.gov/Forecasting/Economics/Major_Regulations/Major_Regulations_Table/documents/Final_Sria_11-16%20.pdf
CCST (2018). Biomethane in California Common Carrier Pipelines: Assessing Heating Value and Maximum Heating Value and maximum Siloxane Specifications. https://ccst.us/wp-content/uploads/2018biomethane.pdf
CEC (2017a). Final 2017 Integrated Energy Policy Report.
CEC (2017b). Renewable Energy Resource, Technology, and Economoc Assessments: Appendix H – Task 8: Comparative Asessment of Technology Options for Biogas Clean-Up. Energy Research and Development Dicision. CEC-500-2017-007-APH. https://www.energy.ca.gov/2017publications/CEC-500-2017-007/CEC-500-2017-007-APH.pdf
CNGnow (2019). Average CNG Price by State. http://www.cngnow.com/average-cng-prices/pages/default.aspx Accessed 3/28/19.
DOE (2016). Combined Heat and Power Technology Fact Sheet Series. U.S. Department of Energy: Energy Efficiency and Renewable Energy.
EBMUD (2017). All’s Fair in Polymer and Bidding: Implementing Comprehensive Dewatering Protocols. Presenatation at CWEA’s Annual Conference. Palm Springs, CA.
Ecker, J. (2018). A “Hauler’s” Perspective. Waste Management Organics – CWEA Co-Digestion Workshop.
EDD (2018). Occupational Employment Statistics Survey. Enployment Development Department State of California. https://www.labormarketinfo.edd.ca.gov/OccGuides/detail.aspx?Soccode=518031&Geography=0601000000
Engineering News Record Construction Cost Index, ENR CCI.
EPA (2013). Appendix F: Supplemental Risk Management Program Guidance for Wastewater Treatment Plants. https://www.epa.gov/sites/production/files/2013-11/documents/appendix-f1.pdf Accessed 06/28/19.
SWRCB | CO-DIGESTION CAPACITY ANALYSIS | CHAPTER 3: INVESTMENTS TO MAXIMIZE CO-DIGESTION
3-22 | JUNE 2019 | FINAL
EPA (2014). Food Waste to Energy: How Six Water Resource Recovery Facilities are Boosting Biogas Production and the Bottom Line. EPA 600/R-14/240.
EPA (2016a). Evaluating the Air Quality, Climate & Economic Impacts of Biogas Management Technologies. Office of Research and Development. EPA 600/R-16/009.
EPA (2016b). Corganics: Co-Digestion Economic Analysis Tool (CoEAT). https://archive.epa.gov/region9/organics/web/html/index-2.html Accessed 5/16/19.
EPA (2018). Anaerobic Digestion Facilities Processing Food Waste in the United States in 2015. https://www.epa.gov/sites/production/files/2018-08/documents/ad_data_report_final_508_compliant_no_password.pdf Accessed 6/23/19.
EPA (2019). RIN Trades and Price Information. https://www.epa.gov/fuels-registration-reporting-and-compliance-help/rin-trades-and-price-information Accessed 3/25/19.
Mazanec, F. (2013). CEC Staff Biomethane Workshop. Presented at the Staff Workshop on Challenges to Procuring Biomethane in California, California Energy Commission, May 31. https://www.energy.ca.gov/2013_energypolicy/documents/2013-05-31_workshop/presentations/Frank-Mazanec_CEC_Staff_Biomethane_Workshop_2013-05-31.pdf
NESTE (2019). California Low Carbon Fuel Standard Credit Price. https://www.neste.com/corporate-info/investors/market-data/lcfs-credit-price Accessed 3/26/19.
OCSD (2017). Orange County Sanitation District Biosolids Master Plan. Prepared by Black and Veatch. https://www.ocsd.com/Home/ShowDocument?id=19468 Accessed 06/27/19.
PG&E (2019). Biomethane Frequently Asked Questions. https://www.pge.com/en_US/for-our-business-partners/interconnection-renewables/interconnections-renewables/biomethane-faq.page?ctx=large-business Accessed 05/29/19.
SGIP (2017). Self-Generation Incentive Program Handbook. December 18 2017. https://www.selfgenca.com/documents/handbook/
Tax Foundation (2019). State and Local Sales Tax Rates, 2019. https://taxfoundation.org/sales-tax-rates-2019/ Accessed 3/28/19/
US EIA (2019). Natural Gas Prices. https://www.eia.gov/dnav/ng/ng_pri_sum_dcu_SCA_m.htm Accessed 3/20/19.
U.S. Department of Labor, Bureau of Labor Statistics, Consumer Price Index, U.S. Cities Average.
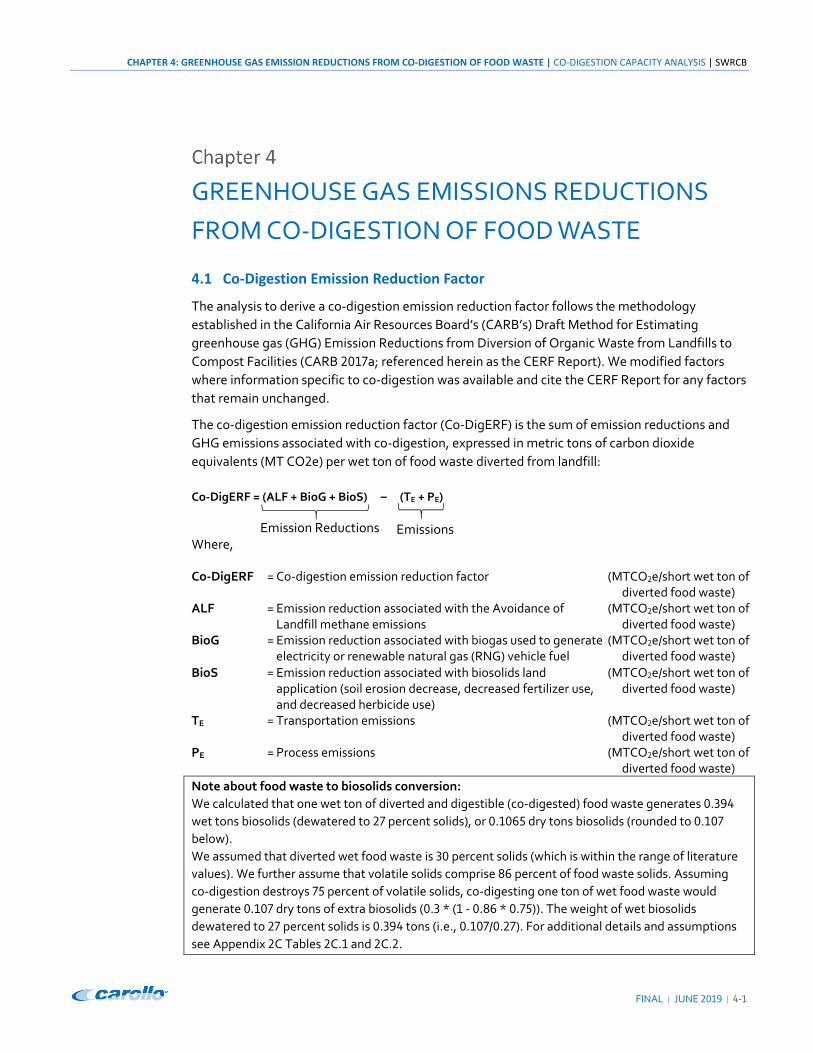
CHAPTER 4: GREENHOUSE GAS EMISSION REDUCTIONS FROM CO‐DIGESTION OF FOOD WASTE | CO‐DIGESTION CAPACITY ANALYSIS | SWRCB
FINAL | JUNE | ‐
GREENHOUSE GAS EMISSIONS REDUCTIONS
FROM CO‐DIGESTION OF FOOD WASTE
4.1 Co‐Digestion Emission Reduction Factor
The analysis to derive a co‐digestion emission reduction factor follows the methodology
established in the California Air Resources Board’s (CARB’s) Draft Method for Estimating
greenhouse gas (GHG) Emission Reductions from Diversion of Organic Waste from Landfills to
Compost Facilities (CARB a; referenced herein as the CERF Report). We modified factors
where information specific to co‐digestion was available and cite the CERF Report for any factors
that remain unchanged.
The co‐digestion emission reduction factor (Co‐DigERF) is the sum of emission reductions and
GHG emissions associated with co‐digestion, expressed in metric tons of carbon dioxide
equivalents (MT CO e) per wet ton of food waste diverted from landfill:
Co‐DigERF = (ALF + BioG + BioS) – (TE + PE) Where, Co‐DigERF = Co‐digestion emission reduction factor (MTCO e/short wet ton of
diverted food waste) ALF = Emission reduction associated with the Avoidance of
Landfill methane emissions (MTCO e/short wet ton of
diverted food waste) BioG = Emission reduction associated with biogas used to generate
electricity or renewable natural gas (RNG) vehicle fuel (MTCO e/short wet ton of
diverted food waste) BioS = Emission reduction associated with biosolids land
application (soil erosion decrease, decreased fertilizer use, and decreased herbicide use)
(MTCO e/short wet ton of diverted food waste)
TE = Transportation emissions (MTCO e/short wet ton of diverted food waste)
PE = Process emissions (MTCO e/short wet ton of diverted food waste)
Note about food waste to biosolids conversion:
We calculated that one wet ton of diverted and digestible (co‐digested) food waste generates .
wet tons biosolids (dewatered to percent solids), or . dry tons biosolids (rounded to .
below).
We assumed that diverted wet food waste is percent solids (which is within the range of literature
values). We further assume that volatile solids comprise percent of food waste solids. Assuming
co‐digestion destroys percent of volatile solids, co‐digesting one ton of wet food waste would
generate . dry tons of extra biosolids ( . * ( ‐ . * . )). The weight of wet biosolids
dewatered to percent solids is . tons (i.e., . / . ). For additional details and assumptions
see Appendix C Tables C. and C. .
Emission Reductions Emissions
SWRCB | CO-DIGESTION CAPACITY ANALYSIS | CHAPTER 4: GREENHOUSE GAS EMISSION REDUCTIONS FROM CO-DIGESTION OF FOOD WASTE
4-2 | JUNE 2019 | FINAL
4.1.1 Emissions
The main emissions sources associated with co-digestion of diverted food waste include those from transporting diverted food waste, pre-processing food waste, heating the digesters in proportion to the additional food waste, and dewatering the resulting biosolids.
4.1.1.1 Transportation Emissions
Transportation emissions (TE) associated with co-digestion of diverted food waste occur during 1) the transport of the diverted food waste to a materials recovery facility (MRF) to be separated and slurried and 2) the transport of food waste slurry to a municipal wastewater treatment plant (WWTP) for co-digestion. We consider this the “inbound” transportation distance. Transporting the resulting biosolids to end-users also results in emissions. We consider this the “outbound” distance.
We estimated representative inbound transportation distances based on the geo-spatial analysis of MRF and municipal WWTP locations in each of CalRecycle’s five Waste Regions: Southern,
Bay Area, Central Valley, Coastal, and Mountain (Table 4.1). Using a waste-by-region weighted average, we estimated the statewide average distance traveled for a ton of pre-processed food waste slurry (diluted to 15 percent solids) is 11.6 miles. To convert the distance traveled per short wet ton food waste slurried into distance traveled per short wet ton of food waste diverted, we
used a conversion factor of two (each one ton of diverted food waste is pre-processed and diluted into two tons of food waste slurry).
We estimated outbound transportation distances, i.e., hauling biosolids from municipal WWTPs to end-users, using the information collected in the 2018 Carollo survey (Chapter 2). Using a waste-by-region weighted average for outbound travel distance, we estimated the statewide average outbound distance traveled per short wet ton of biosolids (dewatered to 27 percent
solids) is 116.2 miles. To convert the distance traveled per short wet ton of biosolids into distance traveled per short wet ton of diverted food waste, we used a conversion factor of 0.394.
Using the total distance for the collection and processing of food waste and delivery of biosolids,
and the emission factor of 101 g CO2e/ton-mile (CERF Report), the resulting average transportation emissions for co-digestion are 0.008 MTCO2e/short wet ton of diverted food waste.
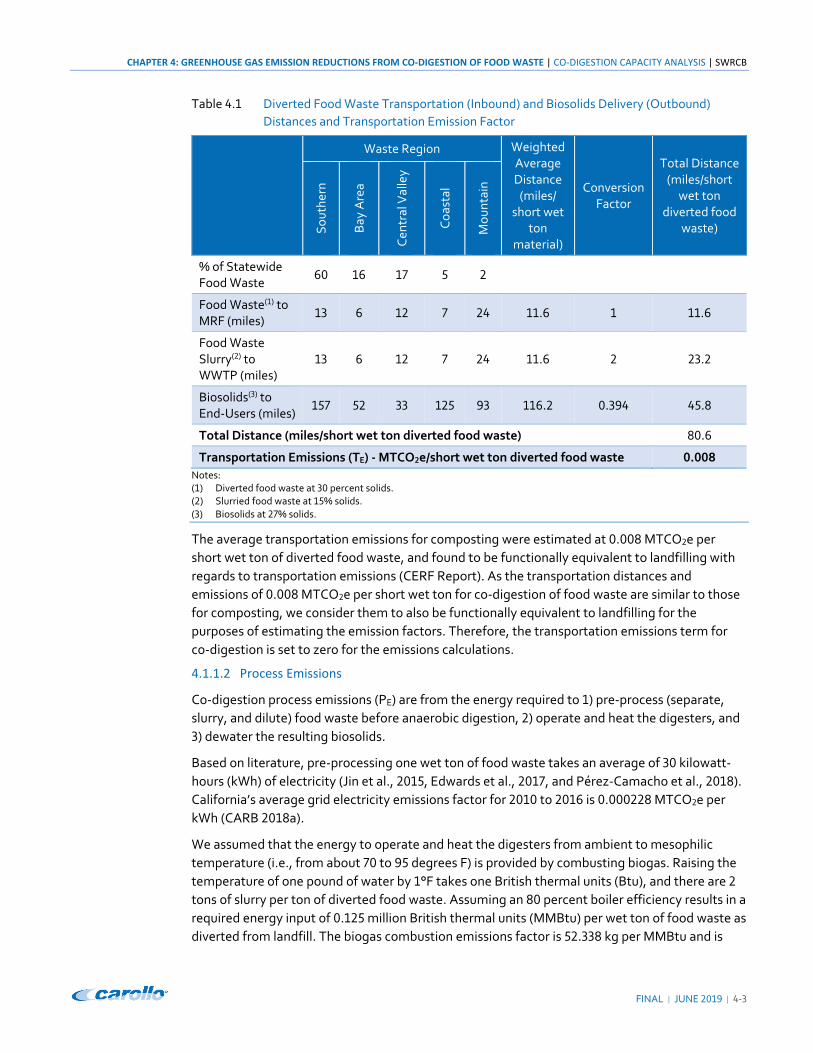
CHAPTER 4: GREENHOUSE GAS EMISSION REDUCTIONS FROM CO‐DIGESTION OF FOOD WASTE | CO‐DIGESTION CAPACITY ANALYSIS | SWRCB
FINAL | JUNE | ‐
Table . Diverted Food Waste Transportation (Inbound) and Biosolids Delivery (Outbound)
Distances and Transportation Emission Factor
Waste Region Weighted Average Distance
(miles/ short wet
ton material)
Conversion Factor
Total Distance (miles/short
wet ton diverted food
waste) So
uth
ern
Bay A
rea
Cen
tral V
alle
y
Co
asta
l
Mo
un
tain
% of Statewide Food Waste
Food Waste( ) to MRF (miles)
. .
Food Waste Slurry( ) to WWTP (miles)
. .
Biosolids( ) to End‐Users (miles)
. . .
Total Distance (miles/short wet ton diverted food waste) .
Transportation Emissions (TE) ‐ MTCO e/short wet ton diverted food waste .
Notes: ( ) Diverted food waste at percent solids. ( ) Slurried food waste at % solids. ( ) Biosolids at % solids.
The average transportation emissions for composting were estimated at . MTCO e per
short wet ton of diverted food waste, and found to be functionally equivalent to landfilling with
regards to transportation emissions (CERF Report). As the transportation distances and
emissions of . MTCO e per short wet ton for co‐digestion of food waste are similar to those
for composting, we consider them to also be functionally equivalent to landfilling for the
purposes of estimating the emission factors. Therefore, the transportation emissions term for
co‐digestion is set to zero for the emissions calculations.
4.1.1.2 Process Emissions
Co‐digestion process emissions (PE) are from the energy required to ) pre‐process (separate,
slurry, and dilute) food waste before anaerobic digestion, ) operate and heat the digesters, and
) dewater the resulting biosolids.
Based on literature, pre‐processing one wet ton of food waste takes an average of kilowatt‐
hours (kWh) of electricity (Jin et al., , Edwards et al., , and Pérez‐Camacho et al., ).
California’s average grid electricity emissions factor for to is . MTCO e per
kWh (CARB a).
We assumed that the energy to operate and heat the digesters from ambient to mesophilic
temperature (i.e., from about to degrees F) is provided by combusting biogas. Raising the
temperature of one pound of water by °F takes one British thermal units (Btu), and there are
tons of slurry per ton of diverted food waste. Assuming an percent boiler efficiency results in a
required energy input of . million British thermal units (MMBtu) per wet ton of food waste as
diverted from landfill. The biogas combustion emissions factor is . kg per MMBtu and is
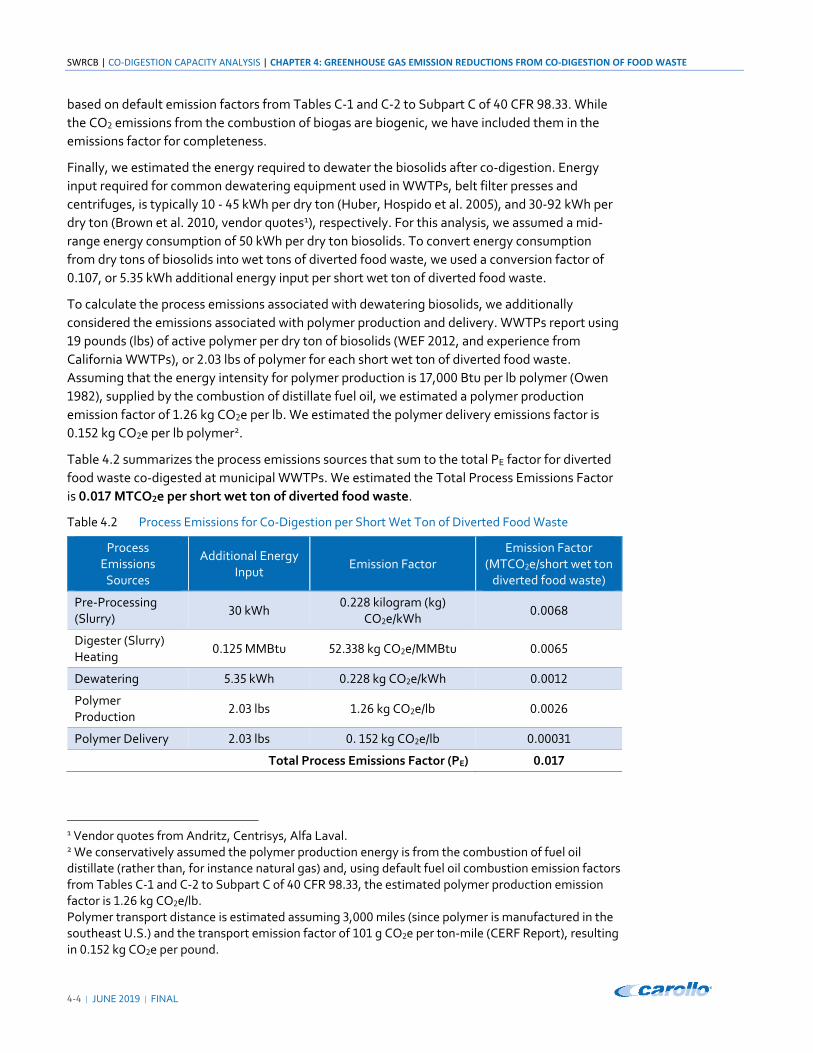
SWRCB | CO‐DIGESTION CAPACITY ANALYSIS | CHAPTER 4: GREENHOUSE GAS EMISSION REDUCTIONS FROM CO‐DIGESTION OF FOOD WASTE
‐ | JUNE | FINAL
based on default emission factors from Tables C‐ and C‐ to Subpart C of CFR . . While
the CO emissions from the combustion of biogas are biogenic, we have included them in the
emissions factor for completeness.
Finally, we estimated the energy required to dewater the biosolids after co‐digestion. Energy
input required for common dewatering equipment used in WWTPs, belt filter presses and
centrifuges, is typically ‐ kWh per dry ton (Huber, Hospido et al. ), and ‐ kWh per
dry ton (Brown et al. , vendor quotes1), respectively. For this analysis, we assumed a mid‐
range energy consumption of kWh per dry ton biosolids. To convert energy consumption
from dry tons of biosolids into wet tons of diverted food waste, we used a conversion factor of
. , or . kWh additional energy input per short wet ton of diverted food waste.
To calculate the process emissions associated with dewatering biosolids, we additionally
considered the emissions associated with polymer production and delivery. WWTPs report using
pounds (lbs) of active polymer per dry ton of biosolids (WEF , and experience from
California WWTPs), or . lbs of polymer for each short wet ton of diverted food waste.
Assuming that the energy intensity for polymer production is , Btu per lb polymer (Owen
), supplied by the combustion of distillate fuel oil, we estimated a polymer production
emission factor of . kg CO e per lb. We estimated the polymer delivery emissions factor is
. kg CO e per lb polymer2.
Table . summarizes the process emissions sources that sum to the total PE factor for diverted
food waste co‐digested at municipal WWTPs. We estimated the Total Process Emissions Factor
is . MTCO e per short wet ton of diverted food waste.
Table . Process Emissions for Co‐Digestion per Short Wet Ton of Diverted Food Waste
Process Emissions
Sources
Additional Energy Input
Emission Factor Emission Factor
(MTCO e/short wet ton diverted food waste)
Pre‐Processing (Slurry)
kWh . kilogram (kg)
CO e/kWh .
Digester (Slurry) Heating
. MMBtu . kg CO e/MMBtu .
Dewatering . kWh . kg CO e/kWh .
Polymer Production
. lbs . kg CO e/lb .
Polymer Delivery . lbs . kg CO e/lb .
Total Process Emissions Factor (PE) .
1 Vendor quotes from Andritz, Centrisys, Alfa Laval. 2 We conservatively assumed the polymer production energy is from the combustion of fuel oil distillate (rather than, for instance natural gas) and, using default fuel oil combustion emission factors from Tables C‐ and C‐ to Subpart C of CFR . , the estimated polymer production emission factor is . kg CO e/lb. Polymer transport distance is estimated assuming , miles (since polymer is manufactured in the southeast U.S.) and the transport emission factor of g CO e per ton‐mile (CERF Report), resulting in . kg CO e per pound.
CHAPTER 4: GREENHOUSE GAS EMISSION REDUCTIONS FROM CO‐DIGESTION OF FOOD WASTE | CO‐DIGESTION CAPACITY ANALYSIS | SWRCB
FINAL | JUNE | ‐
Estimates of landfill related process emissions range from . to . MTCO e per ton (CERF
Report). Because process emissions from co‐digestion fall within the same range as landfilling
process emissions, we set the process emissions term to zero for the co‐digestion related
process emissions.
4.1.2 Emission Reductions
The GHG emissions reductions associated with co‐digestion include the avoided emissions that
would otherwise occur if the food waste had been disposed of in a landfill, and the benefits
accrued by using the resulting products of the co‐digestion process: biosolids and biogas.
4.1.2.1 Net Avoided Emissions from Landfills
For the avoided emissions from landfilling, we used . MTCO e per short wet ton of
diverted food waste (CERF Report), which is conservatively based on decay rate representing
dry conditions found in Southern California landfills.
4.1.2.2 Biosolids Use
Land applying biosolids has similar benefits to applying compost (Mcivor et al., , Wang et
al., ), such as reducing soil erosion, reducing synthetic fertilizer use, and reducing herbicide
use. With respect to decreased soil erosion, we assume the same benefit as estimated in the
CERF Report ( . MTCO e/ ton land‐applied material) and assume negligible benefit associated
with reduced herbicide use.
To estimate the benefits related to reduced synthetic fertilizer use, we used the reduction factor
developed for and used in the Biosolids Emissions Assessment Model (BEAM)3. BEAM estimates
the avoided GHG emissions to be . MT CO e per wet ton land‐applied biosolids (Brown et
al., ). Since this emission reduction is small and the co‐benefits related to reduced synthetic
fertilizer use are uncertain at this time, we conservatively set this term to zero. However, there is
ongoing research demonstrating the usefulness of biosolids in replacing conventional sources of
nutrients and organic matter (Broderick , Sullivan et al ). Accounting for reduced
synthetic fertilizer use would have resulted in greater emission reductions and would require
further research.
The overall estimated benefit associated with land application of biosolids is . MTCO e per
wet ton land‐applied biosolids, or . MTCO e per short wet ton diverted food waste. While
this analysis evaluates the benefits from a GHG perspective, more benefits may result from land
application of biosolids (such as carbon sequestration, increased crop yield, increased soil
permeability, water retention, and organic content). More research is needed to quantify
additional GHG benefits resulting from biosolids land application.
4.1.2.3 Biogas Use
Through co‐digestion of diverted food waste in anaerobic digesters, municipal WWTPs can
produce, capture, and make beneficial use of biogas, which is a renewable source of methane.
This additional biogas produced via co‐digestion of the diverted food waste can be used either
for heat and power, and/or low‐carbon transportation fuel, displacing other sources of energy.
3 BEAM was developed by Sylvis Environmental for the Canadian Council of Ministers of the Environment to allow municipalities to estimate GHG emissions and benefits from biosolids management. The tool was developed using data from peer reviewed literature and municipalities (Sylvis Environmental, ).
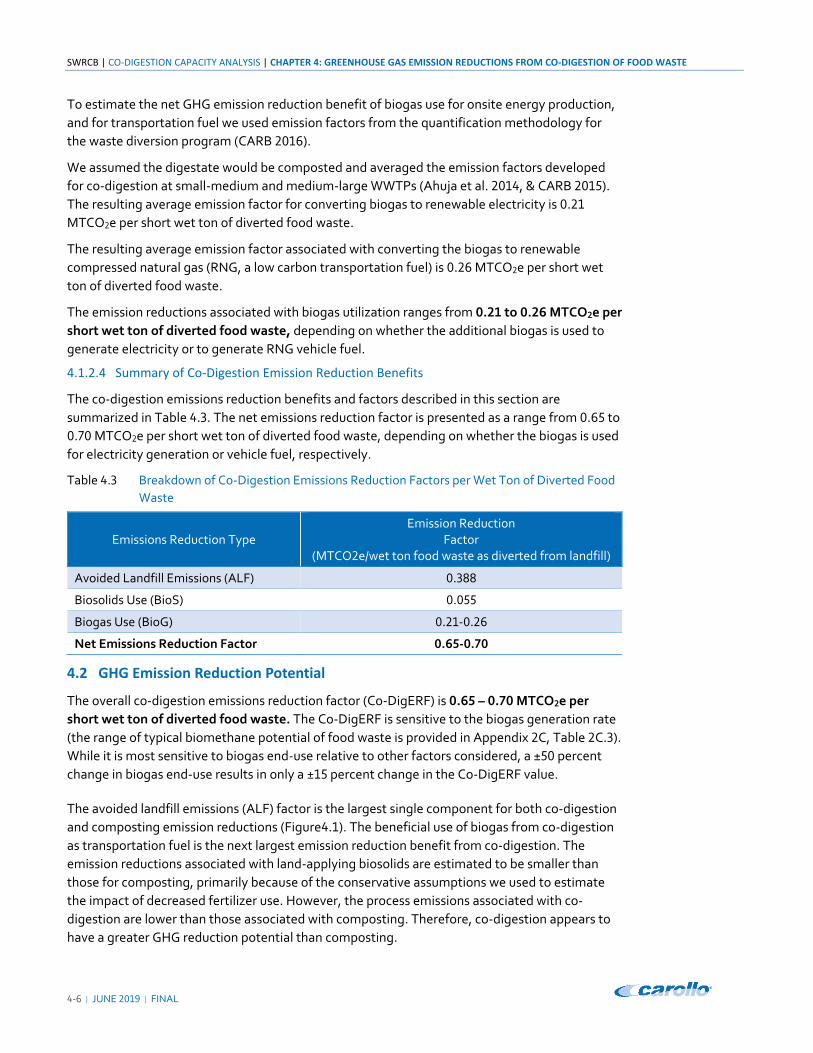
SWRCB | CO‐DIGESTION CAPACITY ANALYSIS | CHAPTER 4: GREENHOUSE GAS EMISSION REDUCTIONS FROM CO‐DIGESTION OF FOOD WASTE
‐ | JUNE | FINAL
To estimate the net GHG emission reduction benefit of biogas use for onsite energy production,
and for transportation fuel we used emission factors from the quantification methodology for
the waste diversion program (CARB ).
We assumed the digestate would be composted and averaged the emission factors developed
for co‐digestion at small‐medium and medium‐large WWTPs (Ahuja et al. , & CARB ).
The resulting average emission factor for converting biogas to renewable electricity is .
MTCO e per short wet ton of diverted food waste.
The resulting average emission factor associated with converting the biogas to renewable
compressed natural gas (RNG, a low carbon transportation fuel) is . MTCO e per short wet
ton of diverted food waste.
The emission reductions associated with biogas utilization ranges from . to . MTCO e per
short wet ton of diverted food waste, depending on whether the additional biogas is used to
generate electricity or to generate RNG vehicle fuel.
4.1.2.4 Summary of Co‐Digestion Emission Reduction Benefits
The co‐digestion emissions reduction benefits and factors described in this section are
summarized in Table . . The net emissions reduction factor is presented as a range from . to
. MTCO e per short wet ton of diverted food waste, depending on whether the biogas is used
for electricity generation or vehicle fuel, respectively.
Table . Breakdown of Co‐Digestion Emissions Reduction Factors per Wet Ton of Diverted Food
Waste
Emissions Reduction Type Emission Reduction
Factor (MTCO e/wet ton food waste as diverted from landfill)
Avoided Landfill Emissions (ALF) .
Biosolids Use (BioS) .
Biogas Use (BioG) . ‐ .
Net Emissions Reduction Factor . ‐ .
4.2 GHG Emission Reduction Potential
The overall co‐digestion emissions reduction factor (Co‐DigERF) is . – . MTCO e per
short wet ton of diverted food waste. The Co‐DigERF is sensitive to the biogas generation rate
(the range of typical biomethane potential of food waste is provided in Appendix C, Table C. ).
While it is most sensitive to biogas end‐use relative to other factors considered, a ± percent
change in biogas end‐use results in only a ± percent change in the Co‐DigERF value.
The avoided landfill emissions (ALF) factor is the largest single component for both co‐digestion
and composting emission reductions (Figure . ). The beneficial use of biogas from co‐digestion
as transportation fuel is the next largest emission reduction benefit from co‐digestion. The
emission reductions associated with land‐applying biosolids are estimated to be smaller than
those for composting, primarily because of the conservative assumptions we used to estimate
the impact of decreased fertilizer use. However, the process emissions associated with co‐
digestion are lower than those associated with composting. Therefore, co‐digestion appears to
have a greater GHG reduction potential than composting.
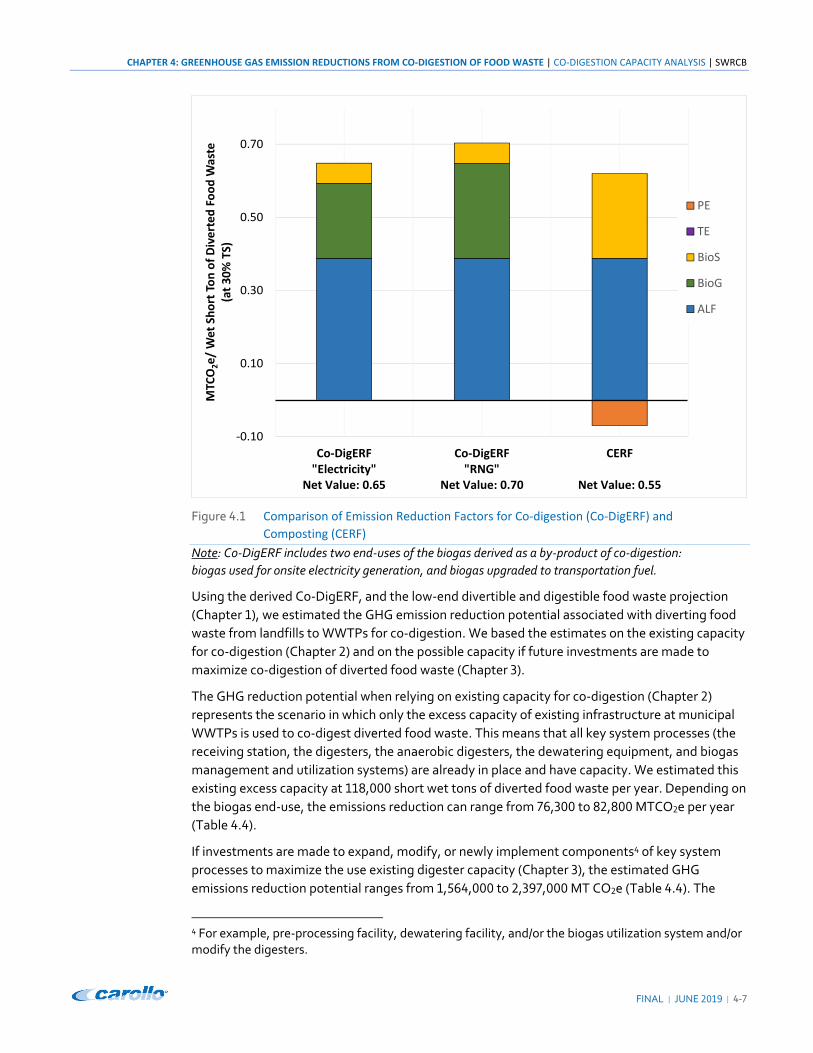
CHAPTER 4: GREENHOUSE GAS EMISSION REDUCTIONS FROM CO‐DIGESTION OF FOOD WASTE | CO‐DIGESTION CAPACITY ANALYSIS | SWRCB
FINAL | JUNE | ‐
Figure . Comparison of Emission Reduction Factors for Co‐digestion (Co‐DigERF) and
Composting (CERF)
Note: Co‐DigERF includes two end‐uses of the biogas derived as a by‐product of co‐digestion:
biogas used for onsite electricity generation, and biogas upgraded to transportation fuel.
Using the derived Co‐DigERF, and the low‐end divertible and digestible food waste projection
(Chapter ), we estimated the GHG emission reduction potential associated with diverting food
waste from landfills to WWTPs for co‐digestion. We based the estimates on the existing capacity
for co‐digestion (Chapter ) and on the possible capacity if future investments are made to
maximize co‐digestion of diverted food waste (Chapter ).
The GHG reduction potential when relying on existing capacity for co‐digestion (Chapter )
represents the scenario in which only the excess capacity of existing infrastructure at municipal
WWTPs is used to co‐digest diverted food waste. This means that all key system processes (the
receiving station, the digesters, the anaerobic digesters, the dewatering equipment, and biogas
management and utilization systems) are already in place and have capacity. We estimated this
existing excess capacity at , short wet tons of diverted food waste per year. Depending on
the biogas end‐use, the emissions reduction can range from , to , MTCO e per year
(Table . ).
If investments are made to expand, modify, or newly implement components4 of key system
processes to maximize the use existing digester capacity (Chapter ), the estimated GHG
emissions reduction potential ranges from , , to , , MT CO e (Table . ). The
4 For example, pre‐processing facility, dewatering facility, and/or the biogas utilization system and/or modify the digesters.
‐0.10
0.10
0.30
0.50
0.70
Co‐DigERF"Electricity"
Net Value: 0.65
Co‐DigERF"RNG"
Net Value: 0.70
CERF
Net Value: 0.55
MTC
O2e/ Wet Short Ton of Diverted Food W
aste
(at 30% TS)
PE
TE
BioS
BioG
ALF
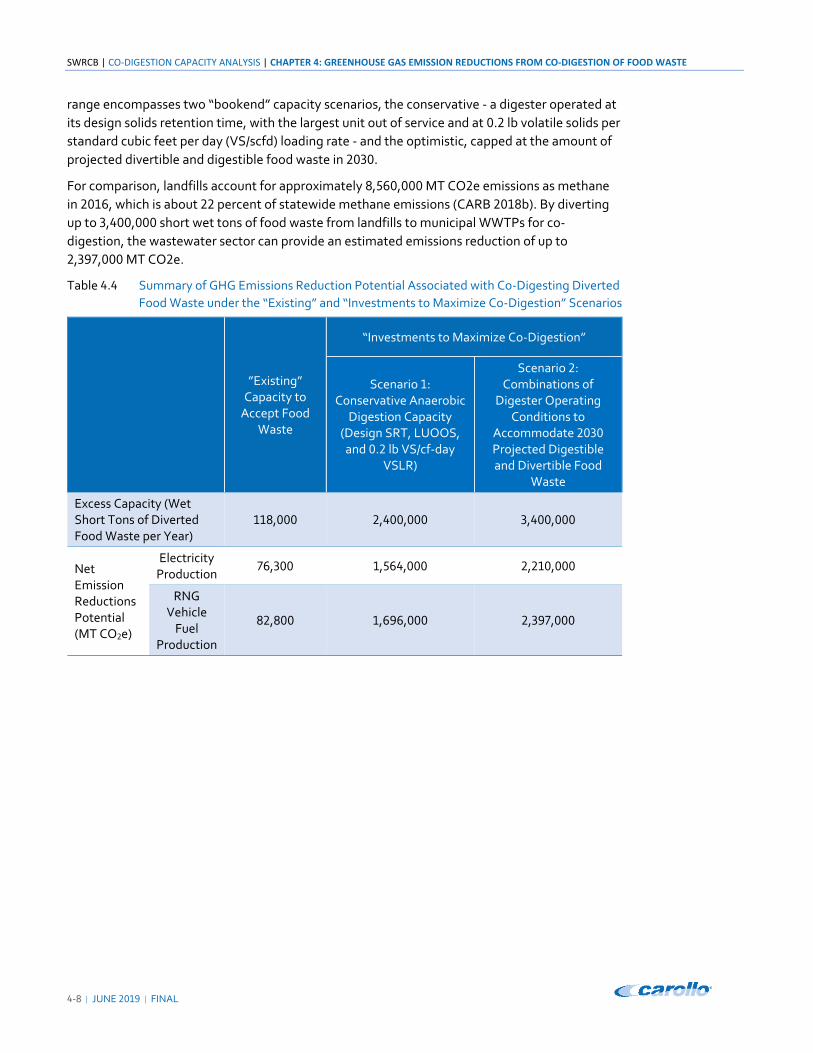
SWRCB | CO‐DIGESTION CAPACITY ANALYSIS | CHAPTER 4: GREENHOUSE GAS EMISSION REDUCTIONS FROM CO‐DIGESTION OF FOOD WASTE
‐ | JUNE | FINAL
range encompasses two “bookend” capacity scenarios, the conservative ‐ a digester operated at
its design solids retention time, with the largest unit out of service and at . lb volatile solids per
standard cubic feet per day (VS/scfd) loading rate ‐ and the optimistic, capped at the amount of
projected divertible and digestible food waste in .
For comparison, landfills account for approximately , , MT CO e emissions as methane
in , which is about percent of statewide methane emissions (CARB b). By diverting
up to , , short wet tons of food waste from landfills to municipal WWTPs for co‐
digestion, the wastewater sector can provide an estimated emissions reduction of up to
, , MT CO e.
Table . Summary of GHG Emissions Reduction Potential Associated with Co‐Digesting Diverted
Food Waste under the “Existing” and “Investments to Maximize Co‐Digestion” Scenarios
”Existing” Capacity to
Accept Food Waste
“Investments to Maximize Co‐Digestion”
Scenario : Conservative Anaerobic
Digestion Capacity (Design SRT, LUOOS, and . lb VS/cf‐day
VSLR)
Scenario : Combinations of
Digester Operating Conditions to
Accommodate Projected Digestible and Divertible Food
Waste
Excess Capacity (Wet Short Tons of Diverted Food Waste per Year)
, , , , ,
Net Emission Reductions Potential (MT CO e)
Electricity Production
, , , , ,
RNG Vehicle
Fuel Production
, , , , ,
CHAPTER 4: GREENHOUSE GAS EMISSION REDUCTIONS FROM CO‐DIGESTION OF FOOD WASTE | CO‐DIGESTION CAPACITY ANALYSIS | SWRCB
FINAL | JUNE | ‐
4.3 References
Ahuja, K.; Helmowski, B.; Ingram, W., ( ). LCFS Pathway for the Production of Biomethane
from High Solids Anaerobic Digestion (HSAD) of Organic (Food and Green) Wastes.
Staff Report. California Air Resources Board.
Broderick, S.; Evans, W., ( ). Biosolids Promote Similar Plant Growth and Quality Responses
as Conventional and Slow‐release Fertilizers. American Society of Horticulture Science,
Vol : Issue , ‐ .
Brown, S.; Beecher, N.; Carpenter, A., ( ). Calculator Tool for Determining Greenhouse Gas
Emissions for Biosolids Processing and End Use. Environmental Science & Technology.,
, – .
CARB, ( ). Regulation to Reduce Emissions of Diesel Particulate Matter, Oxides of Nitrogen and Other Criteria Pollutants from In‐Use Heavy‐Duty Diesel‐Fueled Vehicles. Title , California Code of Regulations, Division : Air Resources Board. Chapter : Motor Vehicle Pollution Control Devices. https://www.arb.ca.gov/msprog/onrdiesel/documents/tbfinalreg.pdf
CARB, ( ). LCFS Pathway for the Production of Biomethane from the Mesophilic Anaerobic Digestion of Wastewater Sludge at Publicly‐Owned Treatment Works. https://www.arb.ca.gov/fuels/lcfs/ a b/apps/wws bm‐ .pdf
CARB, ( ). Greenhouse Gas Reduction Calculator, Waste Diversion Grant and Loan Program, GGRF. California Air Resources Board. https://ww .arb.ca.gov/resources/documents/cci‐quantification‐benefits‐and‐reporting‐materials.
CARB, ( ). GHG Emission Reduction Factors. California Air Resources Control Board.
https://www.arb.ca.gov/cc/capandtrade/auctionproceeds/calrecycle_finalerfs_ ‐
& ‐ _final_ ‐ ‐ .xlsx.
CARB, ( a). Final Draft Method for Estimating Greenhouse Gas Emission Reductions from
Diversion of Organic Waste from Landfills to Compost Facilities. California Air Resources
Board. https://ww .arb.ca.gov/cc/waste/cerffinal.pdf
CARB, ( b). California Climate Investments Quantification Methodology Emission Factor Database. California Air Resources Board. https://ww .arb.ca.gov/resources/documents/cci‐quantification‐benefits‐and‐reporting‐materials.
CARB, ( a). CA Climate Investments Quantification Methodology ‐ Database (August , ): Emission factor based on data. https://www.arb.ca.gov/cc/capandtrade/auctionproceeds/cci_emissionfactordatabase.xlsx
CARB, ( b). Sources of Methane in California – Total CH Emissions. https://ww .arb.ca.gov/cc/inventory/background/ch .htm (Date accessed: June ,
)
CFR, ( ). Default CH and N O Emission Factors for Various Types of Fuel; CFR . and Subpart C Table C‐ . https://www.law.cornell.edu/cfr/text/ /appendix‐Table_C‐
_to_subpart_C_of_part_ #tab_default_ .

SWRCB | CO‐DIGESTION CAPACITY ANALYSIS | CHAPTER 4: GREENHOUSE GAS EMISSION REDUCTIONS FROM CO‐DIGESTION OF FOOD WASTE
‐ | JUNE | FINAL
Edwards, J.; Othman, M.; Crossin, E.; Burn, S., ( ). Anaerobic co‐digestion of municipal food waste and sewage sludge: A comparative life cycle assessment in the context of a waste service provision. Bioresource Technology., , – .
EPA, ( ). Evaluating the Air Quality, Climate & Economic Impacts of Biogas Management Technologies. Office of Research and Development. EPA /R‐ / .
Forster, P., V. Ramaswamy, P. Artaxo, T. Berntsen, R. Betts, D.W. Fahey, J. Haywood, J. Lean, D.C. Lowe, G. Myhre, J. Nganga, R. Prinn, G. Raga, M. Schulz and R. Van Dorland, : Changes in Atmospheric Constituents and in Radiative Forcing. In: Climate Change : The Physical Science Basis. Contribution of Working Group I to the Fourth Assessment Report of the Intergovernmental Panel on Climate Change [Solomon, S., D. Qin, M. Manning, Z. Chen, M. Marquis, K.B. Averyt, M.Tignor and H.L. Miller (eds.)]. Cambridge University Press, Cambridge, United Kingdom and New York, NY, USA.
Hospido, A.; Moreira, M. T.; Martín, M.; Rigola, M.; Feijoo, G., ( ): Environmental Evaluation of Different Treatment Processes for Sludge from Urban Wastewater Treatments: Anaerobic Digestion Versus Thermal Processes. International Journal of Life Cycle Assessment, , – .
Huber Technology. https://www.huber‐technology.com/solutions/energy‐efficiency/sludge‐treatment/dewatering.html (Date accessed: February , ).
Jin, Y.; Chen, T.; Chen, X.; Yu, Z., ( ). Life‐cycle assessment of energy consumption and environmental impact of an integrated food waste‐based biogas plant. Applied Energy.,
, – .
Mcivor, K.; Cogger, C.; Brown, S., ( ). Effects of Biosolids Based Soil Products on Soil Physical and Chemical Properties in Urban Gardens. Compost Science &Utilization., , – .
Owen, W.F., ( ). Energy in wastewater treatment. Prentice‐Hall, Inc., Englewood Cliffs, NJ.
Pérez‐Camacho, M. N.; Curry, R.; Cromie, T., ( ): Life cycle environmental impacts of substituting food wastes for traditional anaerobic digestion feedstocks. Waste management., , – .
Sullivan, D.; Cogger, C.; Bary, A., ( ). Fertilizing with Biosolids. A Pacific Northwest Extension Publication Oregon State University, Washington State University, University of Idaho.
Sylvis Environmental, ( ). The Biosolids Emissions Assessment Model (BEAM): A Method for Determining Greenhouse Gas Emissions from Canadian Biosolids Management Practices. Technical Report., – .
TCR, ( ). Default Emission Factors for the General Reporting Protocol Version . . The Climate Registry.
Wang, H.; Brown, S. L.; Magesan, G. N.; Slade, A. H.; Quintern, M.; Clinton, P. W.; Payn, T. W., ( ). Technological options for the management of biosolids. Environmental Science and Pollution Research., , – .
WEF, ( ). Solids Process Design and Management. Water Environment Federation. McGraw‐Hill.
Williams, R. B., Ely, C., Martynowicz, T., & Kosuko, M., ( ). Evaluating the Air Quality, Climate & Economic Impacts of Biogas Management Technologies. EPA Cooperative Agreement CR ; University of California, Davis: EPA /R‐ / . https://nepis.epa.gov/Exe/ZyPDF.cgi/P QCXZ.PDF?Dockey=P QCXZ.PDF
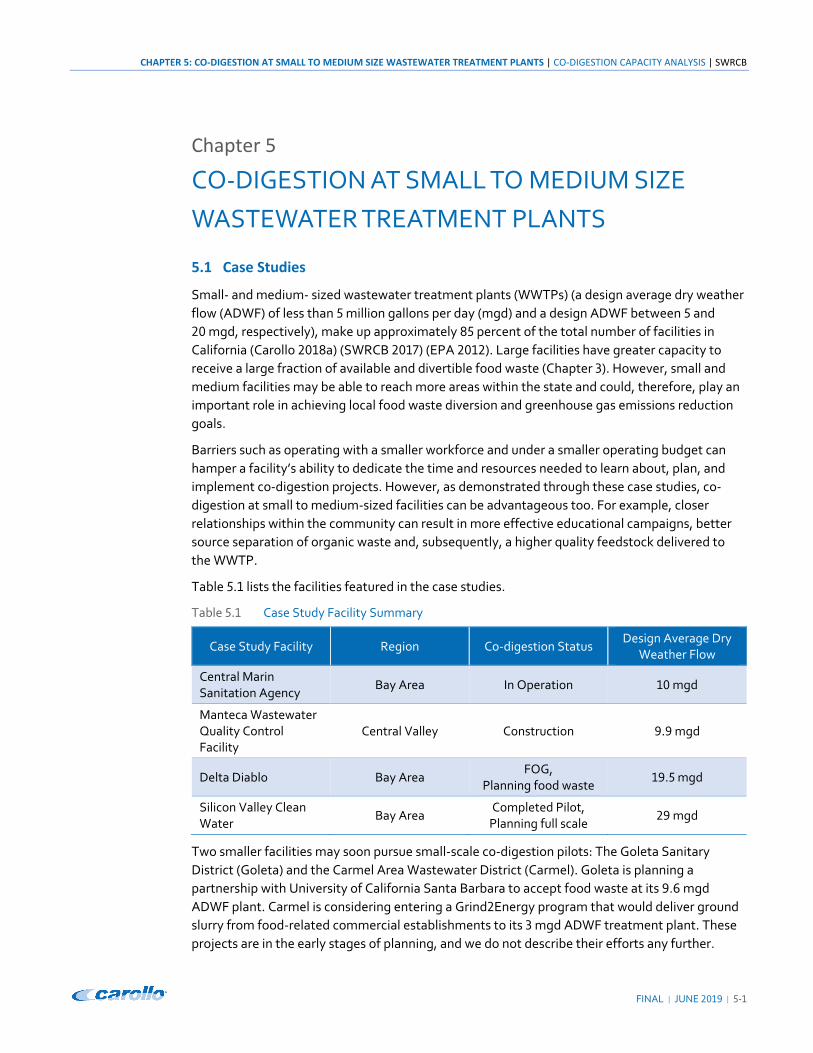
CHAPTER 5: CO-DIGESTION AT SMALL TO MEDIUM SIZE WASTEWATER TREATMENT PLANTS | CO-DIGESTION CAPACITY ANALYSIS | SWRCB
FINAL | JUNE 2019 | 5-1
Chapter 5
CO-DIGESTION AT SMALL TO MEDIUM SIZE WASTEWATER TREATMENT PLANTS
5.1 Case Studies
Small- and medium- sized wastewater treatment plants (WWTPs) (a design average dry weather
flow (ADWF) of less than 5 million gallons per day (mgd) and a design ADWF between 5 and
20 mgd, respectively), make up approximately 85 percent of the total number of facilities in
California (Carollo 2018a) (SWRCB 2017) (EPA 2012). Large facilities have greater capacity to
receive a large fraction of available and divertible food waste (Chapter 3). However, small and
medium facilities may be able to reach more areas within the state and could, therefore, play an
important role in achieving local food waste diversion and greenhouse gas emissions reduction goals.
Barriers such as operating with a smaller workforce and under a smaller operating budget can
hamper a facility’s ability to dedicate the time and resources needed to learn about, plan, and
implement co-digestion projects. However, as demonstrated through these case studies, co-digestion at small to medium-sized facilities can be advantageous too. For example, closer
relationships within the community can result in more effective educational campaigns, better
source separation of organic waste and, subsequently, a higher quality feedstock delivered to
the WWTP.
Table 5.1 lists the facilities featured in the case studies.
Table 5.1 Case Study Facility Summary
Case Study Facility Region Co-digestion Status Design Average Dry
Weather Flow
Central Marin Sanitation Agency
Bay Area In Operation 10 mgd
Manteca Wastewater Quality Control Facility
Central Valley Construction 9.9 mgd
Delta Diablo Bay Area FOG,
Planning food waste 19.5 mgd
Silicon Valley Clean Water
Bay Area Completed Pilot,
Planning full scale 29 mgd
Two smaller facilities may soon pursue small-scale co-digestion pilots: The Goleta Sanitary District (Goleta) and the Carmel Area Wastewater District (Carmel). Goleta is planning a partnership with University of California Santa Barbara to accept food waste at its 9.6 mgd
ADWF plant. Carmel is considering entering a Grind2Energy program that would deliver ground
slurry from food-related commercial establishments to its 3 mgd ADWF treatment plant. These projects are in the early stages of planning, and we do not describe their efforts any further.
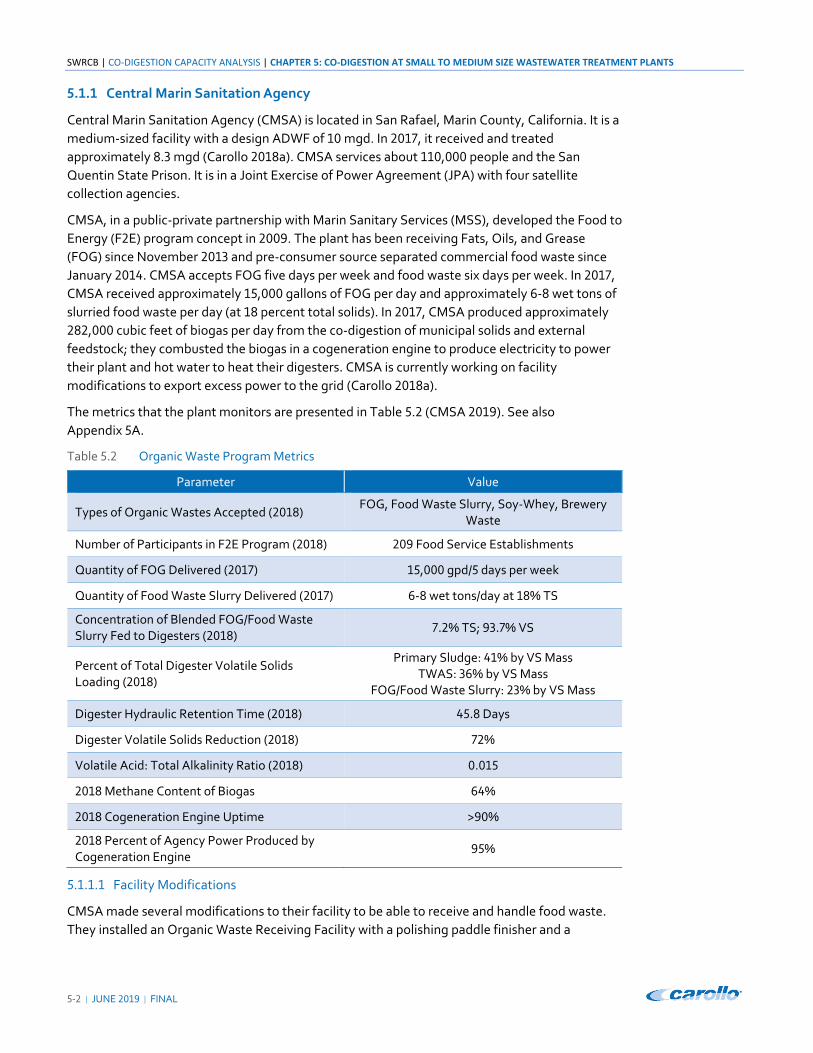
SWRCB | CO-DIGESTION CAPACITY ANALYSIS | CHAPTER 5: CO-DIGESTION AT SMALL TO MEDIUM SIZE WASTEWATER TREATMENT PLANTS
‐ | JUNE | FINAL
. . Central Marin Sanitation Agency
Central Marin Sanitation Agency (CMSA) is located in San Rafael, Marin County, California. It is a
medium‐sized facility with a design ADWF of mgd. In , it received and treated
approximately . mgd (Carollo a). CMSA services about , people and the San
Quentin State Prison. It is in a Joint Exercise of Power Agreement (JPA) with four satellite
collection agencies.
CMSA, in a public‐private partnership with Marin Sanitary Services (MSS), developed the Food to
Energy (F E) program concept in . The plant has been receiving Fats, Oils, and Grease
(FOG) since November and pre‐consumer source separated commercial food waste since
January . CMSA accepts FOG five days per week and food waste six days per week. In ,
CMSA received approximately , gallons of FOG per day and approximately ‐ wet tons of
slurried food waste per day (at percent total solids). In , CMSA produced approximately
, cubic feet of biogas per day from the co‐digestion of municipal solids and external
feedstock; they combusted the biogas in a cogeneration engine to produce electricity to power
their plant and hot water to heat their digesters. CMSA is currently working on facility
modifications to export excess power to the grid (Carollo a).
The metrics that the plant monitors are presented in Table . (CMSA ). See also
Appendix A.
Table . Organic Waste Program Metrics
Parameter Value
Types of Organic Wastes Accepted ( ) FOG, Food Waste Slurry, Soy‐Whey, Brewery
Waste
Number of Participants in F E Program ( ) Food Service Establishments
Quantity of FOG Delivered ( ) , gpd/ days per week
Quantity of Food Waste Slurry Delivered ( ) ‐ wet tons/day at % TS
Concentration of Blended FOG/Food Waste Slurry Fed to Digesters ( )
. % TS; . % VS
Percent of Total Digester Volatile Solids Loading ( )
Primary Sludge: % by VS Mass TWAS: % by VS Mass
FOG/Food Waste Slurry: % by VS Mass
Digester Hydraulic Retention Time ( ) . Days
Digester Volatile Solids Reduction ( ) %
Volatile Acid: Total Alkalinity Ratio ( ) .
Methane Content of Biogas %
Cogeneration Engine Uptime > %
Percent of Agency Power Produced by Cogeneration Engine
%
. . . Facility Modifications
CMSA made several modifications to their facility to be able to receive and handle food waste.
They installed an Organic Waste Receiving Facility with a polishing paddle finisher and a
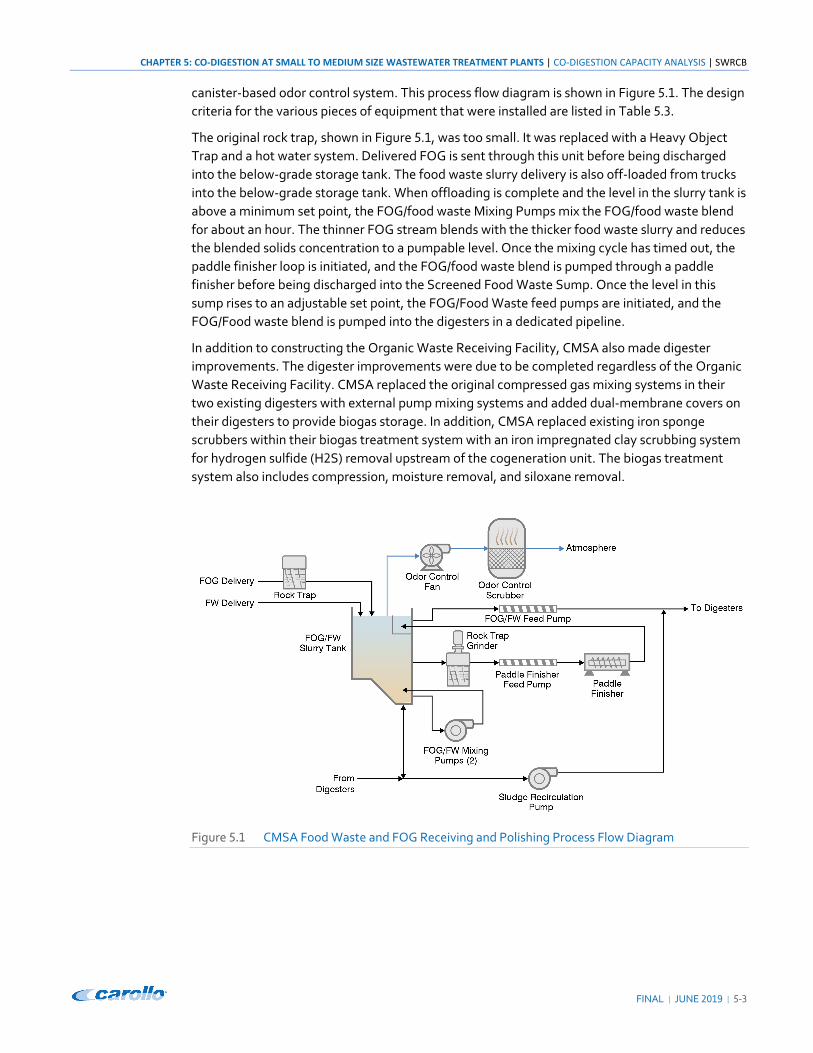
CHAPTER 5: CO-DIGESTION AT SMALL TO MEDIUM SIZE WASTEWATER TREATMENT PLANTS | CO-DIGESTION CAPACITY ANALYSIS | SWRCB
FINAL | JUNE 2019 | 5-3
canister-based odor control system. This process flow diagram is shown in Figure 5.1. The design
criteria for the various pieces of equipment that were installed are listed in Table 5.3.
The original rock trap, shown in Figure 5.1, was too small. It was replaced with a Heavy Object
Trap and a hot water system. Delivered FOG is sent through this unit before being discharged into the below-grade storage tank. The food waste slurry delivery is also off-loaded from trucks
into the below-grade storage tank. When offloading is complete and the level in the slurry tank is
above a minimum set point, the FOG/food waste Mixing Pumps mix the FOG/food waste blend
for about an hour. The thinner FOG stream blends with the thicker food waste slurry and reduces the blended solids concentration to a pumpable level. Once the mixing cycle has timed out, the
paddle finisher loop is initiated, and the FOG/food waste blend is pumped through a paddle
finisher before being discharged into the Screened Food Waste Sump. Once the level in this
sump rises to an adjustable set point, the FOG/Food Waste feed pumps are initiated, and the FOG/Food waste blend is pumped into the digesters in a dedicated pipeline.
In addition to constructing the Organic Waste Receiving Facility, CMSA also made digester
improvements. The digester improvements were due to be completed regardless of the Organic Waste Receiving Facility. CMSA replaced the original compressed gas mixing systems in their two existing digesters with external pump mixing systems and added dual-membrane covers on
their digesters to provide biogas storage. In addition, CMSA replaced existing iron sponge scrubbers within their biogas treatment system with an iron impregnated clay scrubbing system
for hydrogen sulfide (H2S) removal upstream of the cogeneration unit. The biogas treatment
system also includes compression, moisture removal, and siloxane removal.
Figure 5.1 CMSA Food Waste and FOG Receiving and Polishing Process Flow Diagram
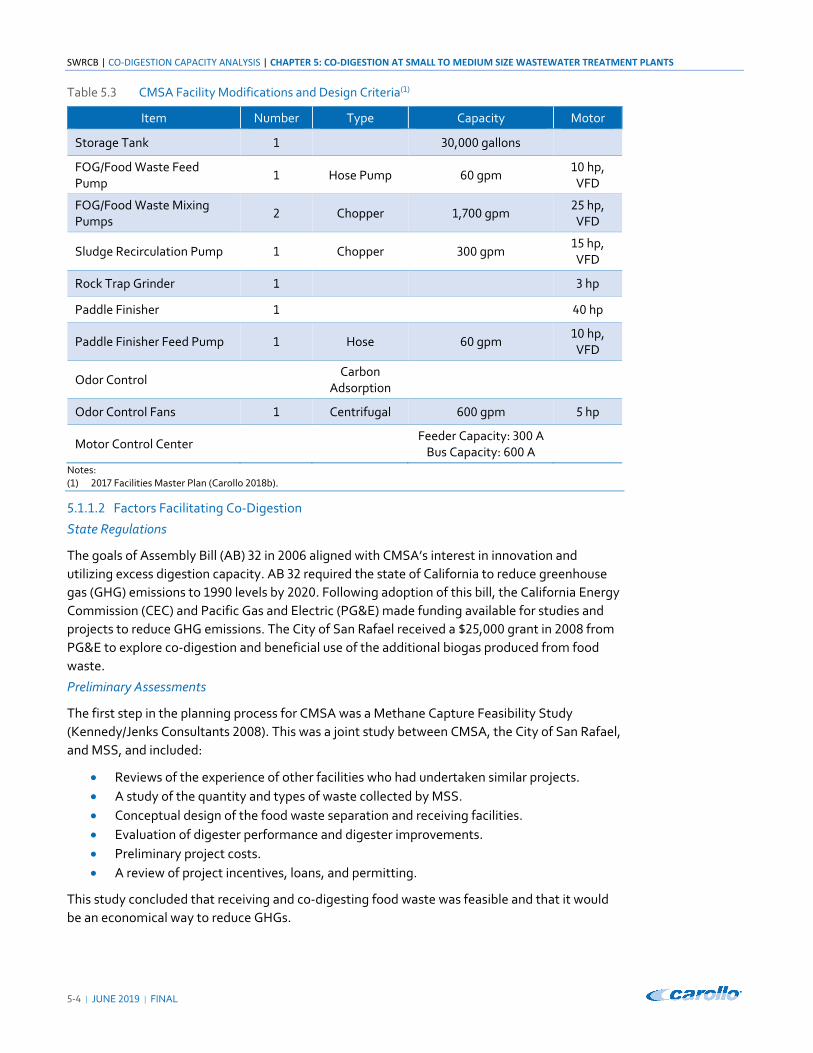
SWRCB | CO-DIGESTION CAPACITY ANALYSIS | CHAPTER 5: CO-DIGESTION AT SMALL TO MEDIUM SIZE WASTEWATER TREATMENT PLANTS
5-4 | JUNE 2019 | FINAL
Table 5.3 CMSA Facility Modifications and Design Criteria(1)
Item Number Type Capacity Motor
Storage Tank 1 30,000 gallons
FOG/Food Waste Feed Pump
1 Hose Pump 60 gpm 10 hp, VFD
FOG/Food Waste Mixing Pumps
2 Chopper 1,700 gpm 25 hp, VFD
Sludge Recirculation Pump 1 Chopper 300 gpm 15 hp, VFD
Rock Trap Grinder 1 3 hp
Paddle Finisher 1 40 hp
Paddle Finisher Feed Pump 1 Hose 60 gpm 10 hp, VFD
Odor Control Carbon
Adsorption
Odor Control Fans 1 Centrifugal 600 gpm 5 hp
Motor Control Center Feeder Capacity: 300 A
Bus Capacity: 600 A
Notes: (1) 2017 Facilities Master Plan (Carollo 2018b).
5.1.1.2 Factors Facilitating Co-Digestion
State Regulations
The goals of Assembly Bill (AB) 32 in 2006 aligned with CMSA’s interest in innovation and
utilizing excess digestion capacity. AB 32 required the state of California to reduce greenhouse
gas (GHG) emissions to 1990 levels by 2020. Following adoption of this bill, the California Energy
Commission (CEC) and Pacific Gas and Electric (PG&E) made funding available for studies and projects to reduce GHG emissions. The City of San Rafael received a $25,000 grant in 2008 from
PG&E to explore co-digestion and beneficial use of the additional biogas produced from food waste.
Preliminary Assessments
The first step in the planning process for CMSA was a Methane Capture Feasibility Study
(Kennedy/Jenks Consultants 2008). This was a joint study between CMSA, the City of San Rafael,
and MSS, and included:
• Reviews of the experience of other facilities who had undertaken similar projects. • A study of the quantity and types of waste collected by MSS. • Conceptual design of the food waste separation and receiving facilities. • Evaluation of digester performance and digester improvements. • Preliminary project costs. • A review of project incentives, loans, and permitting.
This study concluded that receiving and co-digesting food waste was feasible and that it would
be an economical way to reduce GHGs.
CHAPTER 5: CO-DIGESTION AT SMALL TO MEDIUM SIZE WASTEWATER TREATMENT PLANTS | CO-DIGESTION CAPACITY ANALYSIS | SWRCB
FINAL | JUNE 2019 | 5-5
To garner support for the potential co-digestion project, CMSA conducted outreach events to
convey the study results to the service area communities. Once the local town and city councils
officially indicated support of the potential project, CMSA asked for approval from its Board of
Commissioners (Board). These outreach events, the support of local government entities, and
Board approvals were critical to the implementation of the F2E project.
Following the Methane Capture Feasibility Study, a Food Waste Facility Predesign Report
(Kennedy/Jenks Consultants 2010) and a PG&E Interconnection Agreement Study (Michael D.
Brown Consulting Engineers 2016) were completed.
Supportive Partnerships
The success of the F2E program depended not only on support from the CMSA Board and local government entities, but also on the partnership with MSS. MSS helped fund the initial study and made infrastructure improvements to sort and process the waste into a food waste slurry
that could be trucked to the treatment plant. They conducted significant community outreach,
including the production of videos and trainings on how to source separate waste. These
outreach efforts resulted in a relatively clean feedstock for CMSA. The feedstock agreement is
included as Appendix 5B.
The proximity between CMSA and MSS also made co-digestion feasible. The MSS processing
center is less than 1 mile from the CMSA plant, which makes transporting the material very cost-effective. Furthermore, CMSA and MSS share visions for sustainability and environmental
stewardship. MSS sought to reuse or recycle all suitable material and strive for a 100 percent diversion rate. This vision, paired with the proximity of the treatment plant and shared interest in organics diversion, led to the partnership between CMSA and MSS.
Initially, MSS pursued the co-digestion project to be good environmental stewards and reduce GHG emissions in an economically viable manner. They now reportedly save about $30-40/ton
on tipping fees and have significantly reduced truck miles traveled compared to previous
disposal practices at the local landfill.
CMSA also has an interconnection agreement with PG&E and a power purchase agreement with
Marin Clean Energy (MCE). MCE is a community choice aggregation program that provides
renewable power to Marin County and surrounding communities. The MCE power purchase
agreement allows CMSA to sell excess power to the grid when they are producing more than
they require and allows them to purchase power back from the grid when needed. While MCE is
the power purchaser, PG&E owns the grid infrastructure and so CMSA had to enter into an interconnect agreement with PG&E to export power using their infrastructure. After a review of
the interconnect agreement, PG&E required CMSA to upgrade their relays to protect the grid
infrastructure from surges. They also performed other electrical system upgrades to allow their cogeneration engine to load share with the diesel engine when islanding in the event of a grid
power outage.
Financing
Co-digestion at CMSA has been a positive investment. Revenue and offsets exceed operating costs. CMSA’s Organic Waste Receiving Facility cost $1.9 million to build. The project was
funded with bond proceed investment earnings from a 2006 issuance. The cost for MSS’s equipment was $530,000, and their annual operating costs are $315,000 for collection,
processing, disposal, and outreach (MSS & CMSA 2018).

SWRCB | CO-DIGESTION CAPACITY ANALYSIS | CHAPTER 5: CO-DIGESTION AT SMALL TO MEDIUM SIZE WASTEWATER TREATMENT PLANTS
5-6 | JUNE 2019 | FINAL
The maintenance costs for CMSA were estimated to be $20,000 per year during the feasibility
study, but this estimate was found to be low. CMSA is currently spending $40,000 annually for
maintenance-related consumables.
A breakdown of CMSA’s 2018 operations and maintenance (O&M) costs and revenues is shown
in Tables 5.4 and 5.5, respectively. Based on the costs and revenues associated with the F2E
program and the current power agreement, CMSA reports more revenue (or savings) than costs.
They expect to save even more on power once they receive a CEC renewable power certification,
expand the organics program to receive more feedstocks, and begin exporting power.
Table 5.4 CMSA 2018 Organic Waste Program Expenses(1)
2018 Cost(2)
Maintenance Costs $89,000
Operations Labor Costs $90,000
Administration Costs $26,600
Supplies and Other Costs $10,000
Total Costs $215,600 Notes: (1) CMSA December 2018 Monthly Organic Waste Program and Digester Report. (2) Values are rounded.
Table 5.5 CMSA 2018 Organic Waste Program Revenues(1)
2018 Revenue(2)
FOG Revenue $89,500
Food Waste Revenue $55,700
Estimated Biogas Energy Value(3) $167,200
Total Revenue $312,400 Notes: (1) CMSA December 2018 Monthly Organic Waste Program and Digester Report. (2) Values are rounded. (3) Estimated based on avoided natural gas procurement costs when the cogeneration engine is in operation using biogas.
5.1.1.3 Factors Impeding Co-Digestion
CMSA did not encounter any insurmountable barriers to implementation, but they discovered a
barrier with state requirements on power forecasting. They are currently in the design phase of a new cogeneration engine project that would allow them to expand their F2E program. California
Independent System Operator (California ISO) maintains grid infrastructure reliability and
requires power generators with a nameplate capacity of 1 megawatt (MW) or greater to register with them. California ISO also requires all registered power generators to forecast their power a
day in advance. Wastewater facility loads and flows are dynamic; likewise, food waste and FOG
deliveries may change at any time. This causes substantial variability in digester gas production
that is difficult to predict. CMSA did not want to be burdened with forecasting their power
production or faced with a fine if they produced more or less than forecasted. Because of this
California ISO forecasting requirement, CMSA has opted to purchase a cogeneration engine that
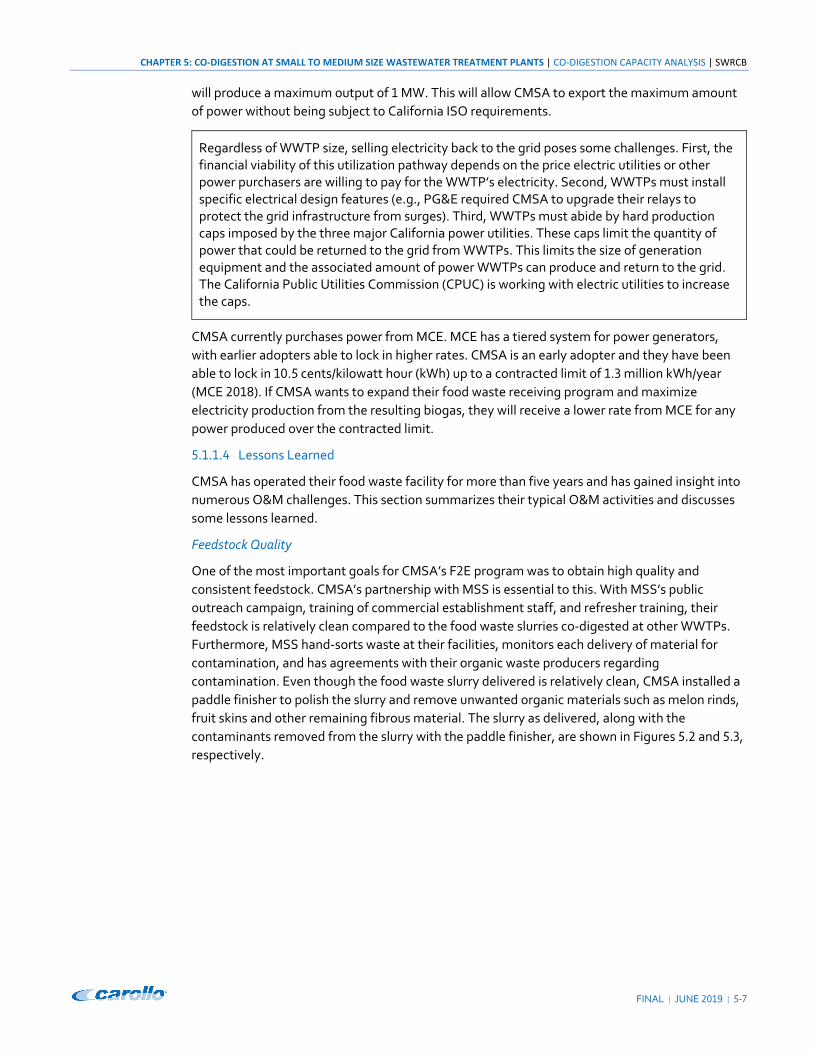
CHAPTER 5: CO-DIGESTION AT SMALL TO MEDIUM SIZE WASTEWATER TREATMENT PLANTS | CO-DIGESTION CAPACITY ANALYSIS | SWRCB
FINAL | JUNE 2019 | 5-7
will produce a maximum output of 1 MW. This will allow CMSA to export the maximum amount
of power without being subject to California ISO requirements.
Regardless of WWTP size, selling electricity back to the grid poses some challenges. First, the financial viability of this utilization pathway depends on the price electric utilities or other power purchasers are willing to pay for the WWTP’s electricity. Second, WWTPs must install specific electrical design features (e.g., PG&E required CMSA to upgrade their relays to protect the grid infrastructure from surges). Third, WWTPs must abide by hard production caps imposed by the three major California power utilities. These caps limit the quantity of power that could be returned to the grid from WWTPs. This limits the size of generation equipment and the associated amount of power WWTPs can produce and return to the grid. The California Public Utilities Commission (CPUC) is working with electric utilities to increase the caps.
CMSA currently purchases power from MCE. MCE has a tiered system for power generators,
with earlier adopters able to lock in higher rates. CMSA is an early adopter and they have been
able to lock in 10.5 cents/kilowatt hour (kWh) up to a contracted limit of 1.3 million kWh/year
(MCE 2018). If CMSA wants to expand their food waste receiving program and maximize
electricity production from the resulting biogas, they will receive a lower rate from MCE for any
power produced over the contracted limit.
5.1.1.4 Lessons Learned
CMSA has operated their food waste facility for more than five years and has gained insight into
numerous O&M challenges. This section summarizes their typical O&M activities and discusses
some lessons learned.
Feedstock Quality
One of the most important goals for CMSA’s F2E program was to obtain high quality and
consistent feedstock. CMSA’s partnership with MSS is essential to this. With MSS’s public outreach campaign, training of commercial establishment staff, and refresher training, their
feedstock is relatively clean compared to the food waste slurries co-digested at other WWTPs.
Furthermore, MSS hand-sorts waste at their facilities, monitors each delivery of material for
contamination, and has agreements with their organic waste producers regarding
contamination. Even though the food waste slurry delivered is relatively clean, CMSA installed a
paddle finisher to polish the slurry and remove unwanted organic materials such as melon rinds,
fruit skins and other remaining fibrous material. The slurry as delivered, along with the
contaminants removed from the slurry with the paddle finisher, are shown in Figures 5.2 and 5.3,
respectively.
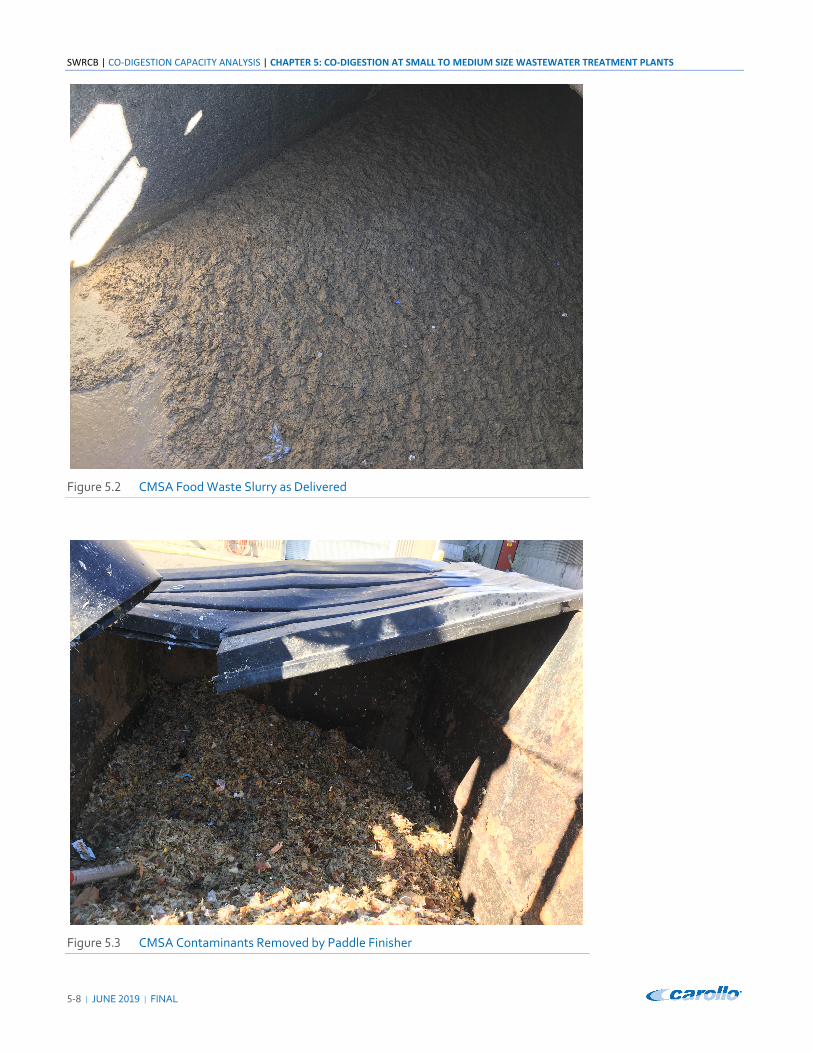
SWRCB | CO-DIGESTION CAPACITY ANALYSIS | CHAPTER 5: CO-DIGESTION AT SMALL TO MEDIUM SIZE WASTEWATER TREATMENT PLANTS
5-8 | JUNE 2019 | FINAL
Figure 5.2 CMSA Food Waste Slurry as Delivered
Figure 5.3 CMSA Contaminants Removed by Paddle Finisher
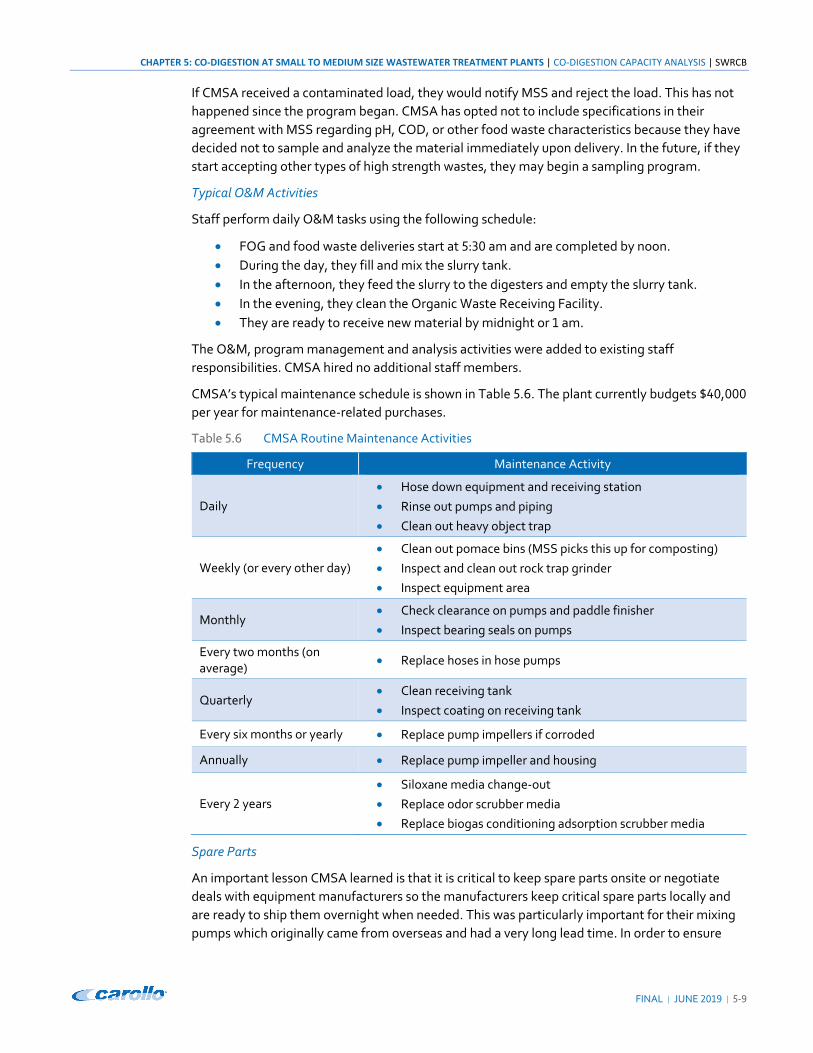
CHAPTER 5: CO-DIGESTION AT SMALL TO MEDIUM SIZE WASTEWATER TREATMENT PLANTS | CO-DIGESTION CAPACITY ANALYSIS | SWRCB
FINAL | JUNE 2019 | 5-9
If CMSA received a contaminated load, they would notify MSS and reject the load. This has not happened since the program began. CMSA has opted not to include specifications in their
agreement with MSS regarding pH, COD, or other food waste characteristics because they have
decided not to sample and analyze the material immediately upon delivery. In the future, if they
start accepting other types of high strength wastes, they may begin a sampling program.
Typical O&M Activities
Staff perform daily O&M tasks using the following schedule:
• FOG and food waste deliveries start at 5:30 am and are completed by noon. • During the day, they fill and mix the slurry tank. • In the afternoon, they feed the slurry to the digesters and empty the slurry tank. • In the evening, they clean the Organic Waste Receiving Facility. • They are ready to receive new material by midnight or 1 am.
The O&M, program management and analysis activities were added to existing staff
responsibilities. CMSA hired no additional staff members.
CMSA’s typical maintenance schedule is shown in Table 5.6. The plant currently budgets $40,000
per year for maintenance-related purchases.
Table 5.6 CMSA Routine Maintenance Activities
Frequency Maintenance Activity
Daily • Hose down equipment and receiving station • Rinse out pumps and piping • Clean out heavy object trap
Weekly (or every other day) • Clean out pomace bins (MSS picks this up for composting) • Inspect and clean out rock trap grinder • Inspect equipment area
Monthly • Check clearance on pumps and paddle finisher • Inspect bearing seals on pumps
Every two months (on average) • Replace hoses in hose pumps
Quarterly • Clean receiving tank • Inspect coating on receiving tank
Every six months or yearly • Replace pump impellers if corroded
Annually • Replace pump impeller and housing
Every 2 years • Siloxane media change-out • Replace odor scrubber media • Replace biogas conditioning adsorption scrubber media
Spare Parts
An important lesson CMSA learned is that it is critical to keep spare parts onsite or negotiate
deals with equipment manufacturers so the manufacturers keep critical spare parts locally and
are ready to ship them overnight when needed. This was particularly important for their mixing pumps which originally came from overseas and had a very long lead time. In order to ensure
SWRCB | CO-DIGESTION CAPACITY ANALYSIS | CHAPTER 5: CO-DIGESTION AT SMALL TO MEDIUM SIZE WASTEWATER TREATMENT PLANTS
5-10 | JUNE 2019 | FINAL
they have the critical spare parts needed, CMSA performed a risk analysis. This risk analysis,
included as Appendix 5C, helped them determine the consequences of equipment going out of service; other options they may have when a piece of equipment is out of service; the estimated lead time needed to replace the equipment; and parts they need to keep onsite.
Other Lessons Learned
CMSA learned that having the following made co-digestion successful at their facility:
• Organic waste coordinator: They needed someone with a versatile skill set, who could
perform administrative duties and communicate well with both field staff and operators.
CMSA relied on an existing staff person well versed in lab sampling and analysis, billing,
and operations and maintenance. • Receiving tank lid: They improved worker safety by adding a lever and chain to the lid;
with this addition, staff did not have to bend down to open the tank hatch cover. • Receiving tank coating: The original polyurethane tank coating failed soon after
installation, likely due to improper surface preparation. CMSA has since recoated the tank with an epoxy resin, which has lasted longer than the original coating system.
• Paddle finisher chute: To better direct material into the bin, CMSA extended the chute with a simple rubber section down into the receiving bin; this improved worker safety
and reduced cleaning efforts. • Ladder cleats: To stabilize the ladder that is lowered onto the slippery receiving tank
floor, CMSA added cleats; this improved worker safety. • Odor scrubber: The odor scrubber would draw grease into it from the foul air,
necessitating frequent media replacement. To mitigate this, they installed an
inexpensive filter upstream of the higher cost media, reducing the media replacement frequency. They also flush the media with hot water to remove the grease that builds up.
• H2S removal: CMSA no longer uses an iron sponge to remove H2S from the digester gas because they found the media to be dangerous and sometimes spontaneously combust.
They were required to keep the spent media onsite for a week until it was no longer
combustible, creating a risk for them. They have replaced this system with an iron
impregnated clay (Sulfatreat). This replacement happened as part of the broader digester rehabilitation project, i.e., not as a part of the co-digestion program.
• Dewatering: They initially found the co-digested sludge harder to dewater in the
centrifuges. To continue achieving at least 25 percent solids in the dewatered cake,
CMSA needed to increase the polymer dose. • Biogas production: Because CMSA sometimes produces more biogas than they can use,
they developed several strategies to avoid flaring. First, they modified upstream solids processes. Second, they modified boiler use. Third, they can store 374,000 cubic feet in
the double-membrane digester covers. Fourth, if they have exhausted the previous
three options, they stop pumping food waste to the digesters. This immediately reduces biogas production. With the addition of variable frequency drives, staff is also testing the impacts of varying mixing intensities, operating the digester mixing pumps at different speeds.
• Preparing the digesters: CMSA has not experienced issues with instability even though
they have experimented with a variety of feedstocks and loading rates. To prevent
instability, they load at higher rates with sludge before adding the organic waste.
CHAPTER 5: CO-DIGESTION AT SMALL TO MEDIUM SIZE WASTEWATER TREATMENT PLANTS | CO-DIGESTION CAPACITY ANALYSIS | SWRCB
FINAL | JUNE 2019 | 5-11
5.1.2 Manteca Wastewater Quality Control Facility
Located in San Joaquin County in California’s Central Valley, the City of Manteca’s Wastewater
Quality Control Facility is a medium-sized facility with a design capacity of 9.87 mgd, and a
reported flow of 6.7 mgd in 2017. The facility services a population of approximately 80,500.
5.1.2.1 Facility Modifications
The Waste to Fuel Program comprises five interrelated projects to allow Manteca to accept and
co-digest food waste and FOG, generate additional biogas, and utilize the biogas in new boilers
to produce heat for use onsite (including heating the digesters to offset purchased heating).
Biogas may also be conditioned and compressed for use as a transportation fuel by the City fleet.
The approach being considered would first provide Renewable Natural Gas (RNG) to meet the
needs of the City’s fleet; any remaining would be sold.
There are five projects underway for accepting food waste and FOG. The required facility modifications and components are summarized below (Manteca 2018):
Project 1: Digester and Digester Control Building Improvements Project
• Two new 65-foot diameter digesters with steel floating covers. • New sludge control system for feeding digesters. • New high efficiency digester mixing system with draft tube mixers. • New low-nitrous oxides (NOx) boilers and hot water heating system. • New biogas H2S removal system. • New biogas flare. • Rehabilitation of the two existing digesters including dome, lining, recirculation, and
biogas piping and pumping replacements. • New chemical facility and piping for ferric chloride for digester struvite and H2S control.
Project 2: Food Waste Receiving
• Concrete parking area for truck unloading. • Pumping and piping equipment to transfer food waste.
Project 3: FOG Receiving
• One above-ground 10,000-gallon stainless steel tank for FOG storage. • Associated mixing, heating, and pumping equipment. • Rock screen and crane. • High pressure cleaning equipment.
Project 4: Compressed Biogas Fueling Facilities
• New biogas conditioning system to remove carbon dioxide (CO2) and siloxanes from the biogas (BioCNG™).
• Two new boilers to produce digester heat from conditioned biogas. • A custom-built low British thermal unit (Btu) boiler used to produce waste heat from the
BioCNG™ waste gas stream. • New renewable compressed natural gas (RCNG) compression and high-pressure storage
system. • Intermediate pressure storage tanks.
SWRCB | CO-DIGESTION CAPACITY ANALYSIS | CHAPTER 5: CO-DIGESTION AT SMALL TO MEDIUM SIZE WASTEWATER TREATMENT PLANTS
5-12 | JUNE 2019 | FINAL
• New RCNG and compressed natural gas (CNG) fast filling station to allow quick filling of
vehicles. • New timed fill facility to allow overnight parking and filling of RCNG into the city fleet,
including a new parking field. • New vehicle wash facility to allow garbage fleet washing.
Project 5: Food Waste Separation Project
• Food waste separation device such as a turbo separator. • Two food waste transportation tankers that will double as food waste storage tanks.
Upon completion of the final project, the facility should be able to accept 3,400 wet tons of food
waste slurry annually. As the second and third projects are implemented, the plant hopes to accept increasing amounts of food waste slurry for co-digestion.
5.1.2.2 Factors Facilitating Co-digestion
State and Local Regulations
One significant driver for co-digestion is the state’s organic diversion goals, prompted by three
different bills. AB 341 sets a goal of 75 percent solid waste diversion by 2020; AB 1826 requires
organic waste diversion from certain residential and commercial entities by 2020; and Senate Bill (SB) 1383 requires 75 percent diversion of organic waste from landfills by 2025. For the purposes of the SB 1383 regulation, Manteca’s current practice of using Class B biosolids as alternative
daily cover (ADC) at the Forward Landfill will be considered disposal. Because Manteca operates
its digesters at capacity, they decided to evaluate 1) needed digestion capacity into the future and 2) the potential to co-digest diverted food waste and FOG, as this would help Manteca
achieve a higher organics diversion rate and produce a beneficially usable product for land application. As a result, Manteca decided to build two additional digesters.
Several state and local regulations pertaining to air quality necessitated a major overhaul of
Manteca’s biogas utilization infrastructure, including upgrading their boilers and flare and installing a new biogas conditioning system. These required changes also influenced Manteca’s decision to co-digest with high strength organic wastes. The boilers were manufactured in 1986
and had exceeded their useful lives. Furthermore, they could not meet the San Joaquin Valley Air
Pollution Control District (SJVAPCD) emissions regulations (Manteca & Waste Management 2015) (Manteca 2018). Additionally, potential changes in flare regulations1 and concerns about the plant’s flare capacity prompted the City to also replace its flare infrastructure. Lastly, to
protect utilization equipment and meet SJVAPCD regulations, Manteca decided to install a new
biogas conditioning system capable of removing H2S and other contaminants.
The California Air Resources Board (CARB) also recently adopted a regulation requiring that any
diesel truck engine older than 2010 be replaced by engines meeting EPA’s 2010 emission limits
by 2023 (SJVAPCD 2016). The City of Manteca had four such trucks that needed replacement. To
avoid risks associated with diesel price volatility and to leverage their proximity to a CNG fueling
station in Stockton, the City opted to purchase CNG trucks to replace the old diesel engine trucks.
1For a more detailed discussion about SCAQMD’s 1118.1, see the Regulatory Considerations Section in Chapter 3.
CHAPTER 5: CO-DIGESTION AT SMALL TO MEDIUM SIZE WASTEWATER TREATMENT PLANTS | CO-DIGESTION CAPACITY ANALYSIS | SWRCB
FINAL | JUNE | ‐
In summary, these state and local regulations played a part in Manteca’s decisions to accept food
waste and FOG for co‐digestion, improve their digestion system, and utilize biogas. Accepting
external feedstocks will increase biogas production, which they plan to compress and use in the
newly purchased CNG trucks. Manteca expects this approach to provide a long‐term solution
that meets local and state regulatory targets for organics diversion and low‐carbon fuels while
also shielding them from diesel price volatility in the future.
Supportive Partnerships
The City of Manteca owns the wastewater facility and the solid waste management fleet. San
Joaquin County owns and operates the Lovelace Materials Recovery Facility and Transfer
Station. The City of Manteca sends its biosolids to the privately‐owned Forward Landfill. With
the adoption of AB in , San Joaquin County began an outreach campaign to teach
restaurants and schools how to source‐separate organic waste so that it could be collected and
composted. AB and AB compelled the City and the County to work together. They
entered into a partnership whereby the food waste would first be processed by a turbo separator
at the County’s Lovelace Transfer Facility and then received at the City’s Wastewater Facility,
where it would be injected into their digesters.
Planning
In , Manteca commissioned two planning reports with the purpose of developing
conceptual projects that could benefit both the solid waste and wastewater sectors. During the
planning phase, Manteca and its consultant identified for consideration the development of a co‐
digestion facility that would convert the City’s wastewater sludge and food waste into biogas
and RCNG fuel. The planning reports are:
Biosolids and Biogas Utilization Plan (Herwit Engineering a).
Solid Waste Master Plan (Herwit Engineering, b).
Financing
The total project cost (to implement all five projects) is approximately . million (Manteca
):
. million for the Digester and Digester Control Building Improvements Project.
. million for the Compressed Biogas Fueling Facilities Project.
. million for the turbo separator at the Lovelace Facility.
, for the Food Waste Receiving Facility Project.
. million for the FOG Receiving Facility Project.
Because the City of Manteca had budget available at the time of the project, the project was
funded primarily by City funds. The City had bonds earmarked for the WWTP expansion with a
provision for green energy alternatives, and also received a million grant from the CEC for the
digester gas processing facility, and a . million grant from SJVAPCD for the fuel dispensing
facility. Their cost recovery calculations also relied on a continuous credit from Renewable
Identification Number (RIN)s from the United States Environmental Protection Agency’s (EPA)
Renewable Fuel Standard Program and the Low Carbon Fuel Standard.
. . . Factors Impeding Co‐digestion
Manteca has faced several barriers that have delayed food waste co‐digestion.
SWRCB | CO-DIGESTION CAPACITY ANALYSIS | CHAPTER 5: CO-DIGESTION AT SMALL TO MEDIUM SIZE WASTEWATER TREATMENT PLANTS
5-14 | JUNE 2019 | FINAL
Inadequate funding
The City of Manteca’s solid waste department has not obtained funding for the turbo separator that will be installed at the Lovelace Transfer Facility. Without this critical part of the food waste
processing system, Manteca has not been able to receive the food waste slurry for co-digestion at the WWTP.
Also, the change in the value of RIN credits has decreased Manteca’s revenue potential. In the
past, biogas generated from food waste qualified as Cellulosic Biofuel and was eligible for D3 RIN
credits (highest value RIN). However, biogas generated from co-digestion with food waste now
only qualifies as an Advanced Biofuel, which is eligible for a D5 RIN credit. While the value of all
RIN credit types has varied over time, D5 RIN credits over the past year have been worth about
one fourth the value of D3 RIN credits. This change from D3 to D5 RIN credits significantly
impacts Manteca’s plans to recover costs.
Regulatory Hurdles
San Joaquin County and surrounding counties have banned or restricted the land application of
biosolids. These local bans may require hauling biosolids to more distant locations for land
application and beneficial reuse.
To receive any “anaerobically digestible material,” California wastewater treatment facilities are required by the State Water Resources Control Board to develop and implement standard
operating procedures (SOP) to address material handling, spill prevention and response, and
avoidance of treatment process upsets, amongst other things. They are also required to
maintain records of each load received for three years. At this time, Manteca considers these requirements onerous and plant staff have not yet developed the SOP.
The City is also concerned that the additional nitrogen loading from the food waste will create a
higher concentration of ammonia in the dewatering centrate, which is routed back to the plant’s liquid treatment train. Manteca’s secondary process is a Modified Ludzack-Ettinger, which fully
nitrifies and denitrifies the stream to produce a Title 22 compliant effluent that is land applied in
the spring and summer. They also have National Pollutant Discharge Elimination System
(NPDES) nitrogen limits when discharging to the San Joaquin River in the winter. The additional
ammonia load in the recycle stream may exceed the secondary treatment capacity for nitrogen load and subsequently result in increased effluent nitrogen concentrations. As a result, Manteca
has planned to install a tank to collect the centrate and return it to the headworks at a metered rate to avoid exceeding nitrogen limits.
5.1.3 Delta Diablo
Delta Diablo is a California special district that provides wastewater services to the City of Antioch, the City of Pittsburg, and the unincorporated community of Bay Point, encompassing
54 square miles and serving over 214,000 residents. The Delta Diablo wastewater treatment
plant is located in Antioch, Contra Costa County. It is a medium-sized facility with a design
ADWF of 19.5 mgd (ESA 2018). In 2017, it received and treated approximately 12.8 mgd (Carollo
2018a).
Delta Diablo currently anaerobically digests primary and thickened waste activated sludge and
receives 10,000 gallons per day (gpd) of FOG for co-digestion. The WWTP has an average
electrical demand of 0.9 MW, 0.1 MW of which is supplied by PG&E and 0.8 MW by a cogeneration engine (ESA 2018).
CHAPTER 5: CO-DIGESTION AT SMALL TO MEDIUM SIZE WASTEWATER TREATMENT PLANTS | CO-DIGESTION CAPACITY ANALYSIS | SWRCB
FINAL | JUNE 2019 | 5-15
Delta Diablo partnered with Mt. Diablo Resource Recovery (MDRR), the local solid waste hauler,
to develop the East County Bioenergy Project (ECBP) in 2016. This project, currently in the planning phase, would allow the production and receipt of up to 285 wet tons/day of a food waste slurry (at 12 percent solids). Delivery of the slurry to the WWTP would occur 5 days/week
throughout the year. The acceptance of organics is anticipated to increase the WWTP’s electrical production to 2.5 MW and provide 9.4 million Btu (MMBtu)/hr of heat for heating needs (Delta Diablo 2018).
5.1.3.1 Facility Modifications
The facility modifications anticipated (per a 30 percent design plan) are listed below (Delta
Diablo 2018): • Food waste receiving facility (two 110,000-gallon storage tanks, mixers, pumps, odor
control). • Additional ferric chloride feed pumps and piping. • New high solids digester mixers. • Recuperative thickening system, including thickener and pumps, to be operated when a
digester is out of service. • New digester gas piping. • Upgraded digester gas storage and compressors. • Expanded/renewed biogas conditioning system consisting of H2S, moisture, and
siloxane removal. • Two new combined heat and power (CHP) units (engines). • A new flare. • Sidestream ammonia removal system with an acid scrubber.
5.1.3.2 Factors Facilitating Co-Digestion
State and Local Regulations
The SB 1383 and AB 1826 organic waste diversion goals motivated MDRR. Increasing onsite renewable energy generation and utilizing existing infrastructure capacity to stabilize rates motivated the WWTP. Providing sustainable solutions for shared customers appealed to both the WWTP and MDRR. These shared goals motivated both entities to pursue co-digestion.
Supportive Partnerships
The ECBP is a public-private partnership between Delta Diablo and MDRR. Both parties are
working together to develop the project and have gathered information from other agencies and
projects to inform the layout and structure of the ECBP. As currently envisioned, MDRR will
operate a pre-processing and polishing line to produce a cleaned organics slurry extracted from municipal solid waste. The slurry will then be trucked to Delta Diablo for co-digestion in existing digesters. Preliminary planning and design work have been done with the assistance of a
technology partner, Anaergia Technologies, LLC. Both Delta Diablo and MDRR have also hired
owner’s advisors and specialty legal assistance to help with project development.
Planning
In 2016, Delta Diablo and MDRR entered into a Memorandum of Agreement (MOA) with the
purpose of developing conceptual projects that could enhance the use of existing resources from
both partners (i.e., biosolids, green waste, food waste). During the planning phase, they identified for consideration the development of a co-digestion facility that would convert the District’s wastewater sludge and MDRR’s food waste into biogas and renewable energy. The
SWRCB | CO-DIGESTION CAPACITY ANALYSIS | CHAPTER 5: CO-DIGESTION AT SMALL TO MEDIUM SIZE WASTEWATER TREATMENT PLANTS
5-16 | JUNE 2019 | FINAL
MOA included a 50/50 cost-share arrangement with both parties obligated to contribute funds to
support planning activities. A number of planning reports were produced under the MOA
planning efforts. Among the planning reports are:
• Food Waste Receiving Facilities Assessment (Carollo 2016). • Biogas Utilization Options and Evaluation (Anaergia 2017a). • Delta Diablo East County Bioenergy Project Organics Co-Digestion Initial
Study/Mitigated Negative Declaration (ESA 2018). • East County Bioenergy Project Draft 30 Percent Design Development – Alternatives
Evaluation (Anaergia 2017b).
Future Revenue
The total cost estimate for the capital improvements required for Delta Diablo’s WWTP is approximately $30-34 million; for MDRR, $14-17 million. Additionally, Delta Diablo is in the
process of developing a rigorous financial model to analyze the success of the overall project and
understand the impacts to rates and cash flow. The model considers capital costs as well as
operating costs and revenues; it uses Monte Carlo simulations on over 50 different parameters (i.e., staffing levels, tipping fees, power revenue, escalation factors, interest rates, chemical
costs, etc.) so that sensitivity and probability analyses can be performed. The model also
considers which and/or what percentage of capital and operating costs would be recovered from
project revenue (e.g., tipping fees) and which would provide benefits to customers (i.e., by
helping to stabilize rates).
Under the current model, about half of the costs would be recovered from the tipping fee and
the other half from electricity sales through the Bioenergy Market Adjusting Tariff (BioMAT) program. The BioMAT program is a result of SB 1122, which directs investor owned utilities such
as PG&E to offer feed-in tariff power purchase agreements for eligible bioenergy projects. PG&E
allocates 30.5 MW to biogas from wastewater treatment, municipal organic waste diversion,
food waste processing and co-digestion at a fixed price of $127.72/megawatt hour (MWh) (PG&E
2018). Delta Diablo is also exploring other end uses of the biogas including pipeline injection and
use as vehicle fuel. The potential revenues and risks associated with the various options will be
evaluated and feasible options will be incorporated into the financial model. To better define the final project scope, Delta Diablo is also evaluating different project timing and phasing options.
5.1.3.3 Factors Impeding Co-Digestion
Delta Diablo has faced three major barriers to date: financial, risk, and third-party requirements.
Inadequate Funding
Because of the large capital costs associated with the ECBP, financing is the most significant
challenge for the project. Delta Diablo and MDRR are actively pursuing grants and low-interest loans to help offset financial risks and keep tipping fees in a manageable range. They’re exploring several grants and loans opportunities, including the California Department of Resources Recycling and Recovery’s (CalRecycle’s) Organics Grant Program, the Clean Water State Revolving Fund, Bay Area Air Quality Management District’s Climate Tech Financing,
California Infrastructure and Economic Development Bank (IBank) California Lending for Energy and Environmental Needs Center (CLEEN), California Alternative Energy Financing Authority’s Sales Tax Exclusion, and several from the California Energy Commission. As discussed in the
CHAPTER 5: CO-DIGESTION AT SMALL TO MEDIUM SIZE WASTEWATER TREATMENT PLANTS | CO-DIGESTION CAPACITY ANALYSIS | SWRCB
FINAL | JUNE 2019 | 5-17
Financing section above, Delta Diablo is also considering the varying revenue streams associated with different biogas utilization pathways.
Risk
Delta Diablo is investing a significant effort into mitigating risk. Delta Diablo is working with its owner’s advisor and legal team to develop a comprehensive risk register that includes technology, regulatory, legal, construction, start-up, operational, and financial risks. Each risk is being scored according to impact and probability of occurrence, and assigned to the appropriate partner (Delta Diablo, MDRR or the design builder). They are also identifying mitigation measures to incorporate into the feedstock and/or design-build agreements.
Third Party Coordination
A third challenge in implementing the ECBP has been to coordinate with third parties. From navigating the regulatory requirements of the local air district and CalRecycle to establishing interconnection- and power purchase agreements with PG&E, there are a multitude of factors
that affect the scope, timing and financial viability of the project.
5.1.4 Silicon Valley Clean Water
Located in Redwood City in San Mateo County, the Silicon Valley Clean Water (SVCW) WWTP is considered a large facility with a design ADWF of 29 mgd. In 2017, it received and treated
approximately 17 mgd (Carollo 2018a). SVCW services about 220,000 people and is a JPA with
four member agencies.
SVCW operated a food waste co-digestion pilot from December 2018 through March 2019. Due to numerous challenges faced in the implementation of its pilot project, SVCW could only
operate the pilot facility for three months. During this time, they accepted three to six wet tons
per day of a food waste slurry produced by a new technology, the organics extrusion press (OREX®).
SVCW is currently awaiting the final results of the pilot project. Based on preliminary positive
results, they intend to scale to full size.
5.1.4.1 Facility Modifications
To conduct the pilot project, the facility made the following modifications:
• Repurposed one of the two sub grade FOG receiving tanks to receive food waste. • Routed plant process water to food waste receiving area for dilution. • Installed a mixer in the dilution tank. • Added a feed pump for diluted food waste. • Added a paddle finisher to remove physical contaminants from food waste. • Installed a storage tank for the “clean” food waste slurry. • Utilized one of the two existing pumps to pump the “clean” food waste slurry to the
digester.
SVCW did not need to modify their digesters in order to co-digest food waste during the pilot project. Due to contamination, they added a polishing step (paddle finisher) for the food waste to reduce operational issues. If implemented at full scale, they will need a polished feedstock,
either from an organics polishing system offsite, or a paddle finisher onsite.
SWRCB | CO-DIGESTION CAPACITY ANALYSIS | CHAPTER 5: CO-DIGESTION AT SMALL TO MEDIUM SIZE WASTEWATER TREATMENT PLANTS
5-18 | JUNE 2019 | FINAL
5.1.4.2 Factors Facilitating Co-digestion
Planning
SVCW has been interested in co-digestion since their 2009 energy master plan recommended
this approach. In pursuing co-digestion, their primary goals were to increase energy efficiency of
the existing system and to explore new opportunities to increase energy generation and reduce
power costs.
SVCW also completed its energy recovery master plan in 2009, which laid the groundwork for
food waste co-digestion. SVCW opted to conduct a pilot project to understand the operational
issues and prove the feasibility before embarking on full-scale organic co-digestion. Planning for
the pilot project entailed brainstorming with a consultant, visiting Recology San Francisco to
understand the feedstock characteristics, and designing the pilot facility.
Supportive Partnerships
SVCW executed an MOU with the South Bayside Waste Management Authority (SBWMA) in
2014. In addition to the San Francisco Facility, Recology operates a facility at SBWMA. The
purpose of this MOU was to “collaborate on the planning and evaluation of options available for
a project that would be mutually beneficial to each agency in reaching California’s landfill and energy goals” (SVCW 2017). SBWMA, SVCW, and Recology have been working together to relocate an organics extrusion press (OREX®), which preprocesses “black bin” municipal solid waste, extracting the organic material.
The organics extrusion press was originally obtained by Recology San Francisco through a grant
from CalRecycle. This grant also included installation of an organics polishing system that would
further screen and process the organic waste from the press into a less contaminated organic
slurry. San Francisco has such an effective organics source separation process that the fraction of organic waste in the “black bin” is low. Inasmuch, the OREX® did not obtain high organics yields.
Recology decided not to operate it at the San Francisco Facility and opted instead to move
OREX® to SBWMA’s San Carlos Facility.
Financing
The organics extrusion press was purchased for installation at the Recology San Francisco
transfer station using a portion of the $3,000,000 CalRecycle Organics Grant awarded in Fiscal
Year 2014-2015. The grant also included funding for an organics polishing system for the Recology East Bay Organics processing facility, but that system has not yet been installed.
Recology is working with SBWMA and CalRecycle to transfer the organics extrusion press from
the San Francisco facility to SBWMA and to redirect remaining grant money to allow the
installation of the organics polishing system at the San Carlos Facility.
SVCW participated in this grant as a major contractor (provided the site and in-kind services) to Kennedy/Jenks Consultants, and was awarded a total of $600,000 grant funding for this pilot study. This funding was part of a $1.5 million grant from California Energy Commission to demonstrate a new technology to effectively pre-process food waste and to develop a new
strategy to lower the mass of dewatered cake, which would improve the economic viability of
co-digestion and biogas energy production at WWTPs.

CHAPTER 5: CO-DIGESTION AT SMALL TO MEDIUM SIZE WASTEWATER TREATMENT PLANTS | CO-DIGESTION CAPACITY ANALYSIS | SWRCB
FINAL | JUNE | ‐
. . . Factors Impeding Co‐Digestion
Regulatory Hurdles
SVCW faced several barriers to implementation. The most time‐consuming issue was an air
permitting issue, which took almost two years to resolve. However, the delay was not directly
due to the food waste project. The local air quality management district initially proposed
stringent conditions on biogas production, flaring, and H S limits. These limits would be difficult
to achieve at wastewater treatment plants, which face daily fluctuations in flows, loads, and
subsequent treatment processes. The agency and the air district discussed these issues, reached
a compromise, and the air district eventually granted a permit to construct.
The other major regulatory barrier that SVCW faces with full‐scale implementation of
co‐digestion is potentially the need for a municipal solid waste permit in order to receive organic
waste extruded from “black bin” discards. SVCW could be excluded from the solid waste permit
requirement if CalRecycle approves the black bin material received by SVCW as an additional
type of “anaerobically digestible material” ( CCR Section . ).
Contamination
The pilot project at SVCW operated for approximately three months. The facility co‐digested
with organic waste brought in from Recology San Francisco. The organic waste received by
SVCW was approximately percent solids which was diluted to approximately percent solids
with plant process water. The waste had about to percent contamination that was
removed by the Paddle Finisher and discharged into contaminant bins. This process took
approximately thirty minutes and required staff to replace contaminant bins one to two times
per day. For their full‐scale co‐digestion project, SVCW anticipates a cleaner feedstock because
the organics polishing system should be installed by that time.
. . . Lessons Learned
SVCW learned a number of lessons from their pilot project.
Ensuring High Quality Feedstock
One of the first lessons learned from the pilot project was the importance of securing high
quality feedstock in advance of implementation. To ensure reliable operation and optimize
results, WWTPs must have a consistent and high‐quality feedstock. Early feedstock agreements
can be challenging for Waste Management Agencies (WMAs) to commit to in advance of project
implementation. However, to meet statewide mandates and secure locations for organic waste
diversion, WMAs may become more willing to enter into feedstock agreements at early project
stages.
New Equipment to Handle Contaminants
SVCW’s pilot facility used a paddle finisher to remove large contaminants from the food waste
slurry as it was fed to the digesters. SVCW staff discovered in the early operation of the facility
that the type of screen selected for the paddle finisher was not suitable. Once SVCW staff
installed the correct type of screen, the performance improved significantly.
Due to a significantly higher than expected percentage of contamination in the incoming organic
feedstock, extra garbage bins were needed to discard the screened and manually removed
contaminants.
SWRCB | CO-DIGESTION CAPACITY ANALYSIS | CHAPTER 5: CO-DIGESTION AT SMALL TO MEDIUM SIZE WASTEWATER TREATMENT PLANTS
5-20 | JUNE 2019 | FINAL
Accommodating Delivery Vehicles
SVCW also learned they needed more space to accommodate food waste trucks. The trucks that
deliver food waste can be of different sizes. So, it is important to design a receiving facility that
can accommodate various truck sizes.
Increased Biogas Production
Preliminary results showed more biogas production and easier dewatering. The full results will
be available with the final report on the pilot study, expected after May 2019.
5.2 Conclusions
5.2.1 Factors Facilitating Co-Digestion
The case studies illustrated that there are common factors that facilitate co-digestion projects at
WWTPs.
5.2.1.1 State Law and Regulations Legislation mandating waste reduction and diversion, and legislation requiring greenhouse gas emission reductions motivated WWTPs (and partner agencies) to pursue co-digestion.
Specific catalysts include:
• AB 341 sets a goal of 75 percent solid waste reduction, recycling, or composting by 2020. • AB 1826 requires organic waste diversion from certain residential and commercial
entities to recycling centers. • SB 1383 sets a statewide organics diversion target of 75 percent by 2025, and could
impact facilities’ use of landfills as a biosolids disposal option. • AB 32 requires the state of California to reduce GHG emissions to 1990 levels by 2020. • SB 32 requires the state of California to reduce GHG emissions to 40 percent below 1990
levels by 2030.
5.2.1.2 Supportive Partnerships
In all the case studies, developing a partnership with a Waste Management Agency was critical
for success. The WMAs are ultimately responsible for meeting the SB 1383 targets and will need
a destination for their organic waste. Options include educating food waste diversion program
participants about proper source-separation and installing equipment to extract the organic matter from the black bin. In most cases, it is likely that this pre-processing will occur offsite at
an existing transfer station, either owned or operated by the Waste Management Agency. If
black bin waste is used, the transfer stations will require new equipment to extrude the organic
fraction of the solid waste stream.
Establishing a feedstock agreement with the Waste Management Agencies can help ensure the WWTPs receive a clean and reliable slurry to protect equipment and maintain consistent operations. These agreements can specify waste quality and/or quantity parameters, describe
how deliveries not meeting the specifications will be managed, and establish a tipping fee.
There are several WWTPs that have partnered with WMAs to advance co-digestion projects.
These examples include:
• Central Marin Sanitation Agency in partnership with Marin Sanitary Service. • Silicon Valley Clean Water in partnership with Recology.
CHAPTER 5: CO-DIGESTION AT SMALL TO MEDIUM SIZE WASTEWATER TREATMENT PLANTS | CO-DIGESTION CAPACITY ANALYSIS | SWRCB
FINAL | JUNE 2019 | 5-21
• Sanitation Districts of Los Angeles County – Joint Water Pollution Control Plant in partnership with Waste Management (See Chapter 6).
Another important partnership is that with a utility provider. Biogas can be put to multiple end-uses: heat, power, gas converted to vehicle fuel, or gas injected into the pipeline. Cogeneration
provides a relatively stable benefit and is applicable in most facilities. In three of the four case studies, the facilities pursued or are seriously considering cogeneration. If a facility determines
cogeneration is the right option for them, offsetting energy costs will save the facility money and
exporting power can generate revenue. Some important aspects to consider when negotiating
agreements to export power include:
• Net metering or sale and purchase costs. • Limits on cogeneration equipment capacity. • Additional infrastructure build out. • Power forecasting and timing requirements. • Duration of the agreement. • Local air quality regulations.
Finally, Board member and community support are also critical. Such support helps with local
buy-in, financing, and program sustainability. Board support is especially critical to move
projects forward and mitigate risk. Education and outreach about source separation can increase
the quality of the feedstock and reduce maintenance costs at the facility.
5.2.1.3 Planning
In all the case studies, planning efforts were very important. Each facility has unique needs,
especially regarding biogas utilization, energy management goals, and viable avenues for
biosolids end use. Feasibility studies can identify local market conditions for organics
management, biogas and biosolids use, capacity limitations within the treatment plant, and the
costs and payback periods for necessary investments. In some cases, the feasibility studies were
joint efforts between the Waste Management Agency and the WWTP and they considered the various requirements of the different entities for project success. Feasibility studies should also consider the availability food waste and the associated contamination, as well as what grant and
loans could be used to support different aspects of the project.
Some the featured facilities evaluated the feasibility of co-digestion as part of the master planning process. The City of Manteca, for example, evaluated co-digestion when considering
how to address treatment plant capacity limitations and then integrated co-digestion into a capital improvement project to produce higher quality biosolids. Master planning and capital investments for upgrades of existing or installing new components can be viewed as an
opportunity to consider resource recovery.
5.2.1.4 Financing
In two of the four case studies, the WWTP had secured financing and saw these projects as a
good long-term investment. In the other two case studies, lack of funding is a barrier that has
not yet been overcome. Having financial support via grants or low interest loans makes these
projects more viable. It is also important for these grants or low interest loans to eliminate
restrictions that could limit what a facility does with its biogas. For instance, if a loan requires a
20-year power purchase agreement, but power utilities only provide 10-year agreements, the
facility may opt not to export power.
SWRCB | CO-DIGESTION CAPACITY ANALYSIS | CHAPTER 5: CO-DIGESTION AT SMALL TO MEDIUM SIZE WASTEWATER TREATMENT PLANTS
5-22 | JUNE 2019 | FINAL
As noted earlier and described in Chapter 3, revenue sources can make co-digestion projects
economical, provided they’re reliable and cover increased O&M costs. The lack of certainty
surrounding tipping fees and the revenue from power sales or biogas production create
untenable risk for many agencies. If costs exceed revenue, co-digestion will not be feasible.
5.2.2 Factors Impeding Co-Digestion
5.2.2.1 Insufficient Planning
Based on these case studies, one significant barrier to success is the limited nature of planning
studies. Studies that do not encompass all aspects of the projects, consider impacts on ancillary
treatment systems, and engage all the entities involved may delay projects. Robust planning and
preliminary design efforts are necessary and should evaluate the following: impacts to the
treatment plant, treatment plant capacity to handle the additional loads and potential side-stream treatment options, robust equipment evaluation, air quality permit requirements, and
other requirements imposed by various regulatory agencies.
5.2.2.2 Regulatory Hurdles
The agencies featured in these case studies are concerned about increased nitrogen loading. The
additional nitrogen load from protein-rich food waste ends up in the dewatering centrate, which
is recycled back to the liquid treatment train. Some facilities have stringent nitrogen limits for
plant effluent. These facilities already have secondary treatment processes that nitrify and denitrify plant influent. Additional nitrogen loads from the centrate could exceed the treatment
capacity of the secondary treatment system.
Additional nitrogen loading may require increased aeration in the secondary treatment process.
Increased aeration may require larger blowers that consume more energy. If a facility has
stringent nitrogen limits and cannot accommodate higher nitrogen loads in the existing mainstream treatment process, co-digestion may require the installation of side stream nitrogen removal processes. This would add additional cost to the project.
Other regulatory obstacles, such as stringent emissions limits on stationary engines and a municipal solid waste permit to receive extruded “black bin” organics, can also present a
substantial barrier to implementation.
5.2.2.3 Inadequate Funding
Without financial assistance from grants or low-interest loans, facilities would have to rely
exclusively on their ratepayers to cover the high capital costs needed for full-scale implementation of co-digestion projects. However, WWTPs cannot typically justify high-risk
ventures that come at significant cost to their ratepayers. They are often unable to take on risk
associated with a new technology or burdensome requirements for contract lengths, energy
production guarantees, or similar contract terms. Furthermore, many communities cannot or will
not agree to rate increases for upgrades perceived as unrelated to a WWTP’s core business.
Additional grant programs for newer technologies or processes would help mitigate the risk for
these facilities and accelerate technology advancement, such as was the case for Manteca’s CNG fueling station.
Public/private partnerships could also be a potential financing option, but the contract terms for
such agreements would have to meet the needs and constraints of both parties.
CHAPTER 5: CO-DIGESTION AT SMALL TO MEDIUM SIZE WASTEWATER TREATMENT PLANTS | CO-DIGESTION CAPACITY ANALYSIS | SWRCB
FINAL | JUNE | ‐
. . . Feedstock Contamination
Even if food waste has been source separated (i.e., is a relatively clean feedstock), WWTPs may
need to perform an additional polishing step (e.g., paddle finisher) prior to feeding the pre‐
processed material to a digester. The polishing step also helps protect downstream equipment
(i.e., the pumps, valves, and piping) and digester operations.
Operations and maintenance costs are incurred in many ways, but the quality of feedstock
significantly impacts O&M labor and equipment costs. Hence, another barrier to success is
finding a clean and reliable feedstock at a tipping fee that can help recover costs over the long
term.
. . . Competition with Composting
Counties are required to divert organics from landfills. They can accomplish that by diverting
organics to WWTPs for co‐digestion or by diverting organics to composting operations. Many
already divert organics to composting operations. Waste Management Agencies that already
have an agreement in place with a composting operation may pay less in tipping fees and do
minimal pre‐processing compared to what might be required at a WWTP. A WWTP may be able
to navigate this potential barrier by developing a partnership with the local Waste Management
Agency and agreeing to a feedstock agreement with stable tipping fees for the duration of
project payback period. Tipping fees at compost facilities are generally shorter term. Longer‐
term agreements with WWTPs that include set tipping fees may reduce risk to WMAs.
5.3 Screening Questions for Co-Digestion
Based on the case studies and analyses in other chapters, we developed a process that agencies
can use to determine whether co‐digestion of food waste makes sense at their plants. While
there is no one answer for all facilities, this process guides users through a step‐by‐step
approach. The screening questions in the flow chart cover key items to evaluate in the early
stages of consideration (Appendix D). The screening questions are intended to help facilities
avoid some of the barriers to success described in previous sections. Following the screening
process may help facilities consider, pursue and implement co‐digestion.
5.4 References
CCR Section . Excluded Activites.
Anaergia ( a). Technical Memorandum Biogas Utilization Options and Evaluation. May.
Anaergia ( b). East County Bioenergy Project Draft Technical Memorandum: % Design Development – Alternatives Evaluation. September.
Carollo ( a). Co‐Digestion Capacity Analysis Survey Results. August.
Carollo ( b). Facilities Master Plan: Final Report. October.
Carollo ( ). Technical Memorandum: Food Waste Receiving Facilities Assessment. November.
CMSA ( ). Managing Central Marin Sanitation Agency’s Organic Waste Receiving Facility. CWEA Annual Conference. April.
Delta Diablo ( ) East County Bioenergy Project Owner’s Advisor Services. June. https://www.deltadiablo.org/Home/ShowDocument?id= .
EPA ( ). Clean Watershed Needs Survey. https://ofmpub.epa.gov/apex/cwns /f?p=cwns : : :. Accessed May , .
SWRCB | CO-DIGESTION CAPACITY ANALYSIS | CHAPTER 5: CO-DIGESTION AT SMALL TO MEDIUM SIZE WASTEWATER TREATMENT PLANTS
5-24 | JUNE 2019 | FINAL
ESA (2018). Delta Diablo East County Bioenergy Project Organics Codigestion: Final Initial Study/Mitigated Negative Declaration. California Environmental Quality Act Documentation.
Herwit Engineering (2016a). Biosolids and Biogas Utilization Plan. Prepared for the City of Manteca Wastewater Quality Control Facility. April.
Herwit Engineering (2016b). Solid Waste Master Plan. Prepared for the City of Manteca Department of Public Works. April.
Kennedy/Jenks Consultants (2010). 2009 F2E Work Plan Food-Waste to Energy Facility Predesign. February.
Kennedy/Jenks Consultants (2008). Methane Capture Feasibility Study. December.
Manteca & Waste Management (2015). Status and Future of Manteca’s Waste Management System: Leveraging Manteca’s Infrastructure for a Compliant and Sustainable Future. June 16. http://manteca-ca.granicus.com/MetaViewer.php?view_id=2&clip_id=232&meta_id=32379.
Manteca (2018). Manteca Capital Improvement Plan Fiscal Years 2018-2022.
MCE (2018). Feed-In Tariff. https://www.mcecleanenergy.org/feed-in-tariff/. Accessed May 17, 2019.
MSS & CMSA (2018). Central Marin Commercial Food-to-Energy (F2E) Program. Presentation to the California Refuse Recycling Council Next Generation Management & Leadership Program. February 15.
Michael D. Brown Consulting Engineers (2016). Interconnection Agreement Study Prepared for Central Marin Sanitary Agency. August. https://www.cmsa.us/assets/documents/Studies%20&%20Projects/CMSA%20Interconnection%20Agreement%20Study%20to%20CMSA_with%20Appendix%20A_083016.pdf
PG&E (2018). Bioenergy Market Adjusting Tariff (Senate Bill 1122). https://www.pge.com/en_US/for-our-business-partners/floating-pages/biomat/biomat.page?WT.mc_id=Vanity_rfo-biomat&ctx=large-business. Accessed May 17, 2019.
SJVAPCD (2016). 2016 Plan for the 2008 8-hour Ozone Standard. June 16. http://www.valleyair.org/Air_quality_Plans/Ozone-Plan-2016/05.pdf
SVCW (2017). Food Waste to Energy. http://www.svcw.org/innovation/SitePages/foodwastetoenergy.aspx. Accessed May 17, 2019.
SWRCB (2017). State Fiscal Year 2016-17 Wastewater User Charge Survey Report. https://www.waterboards.ca.gov/publications_forms/publications/general/docs/wastewater_user_charge_survey_fy2016_2017.xls. Accessed May 17, 2019.
CHAPTER 6: CO-DIGESTION AT LARGE WASTEWATER TREATMENT PLANTS | CO-DIGESTION CAPACITY ANALYSIS | SWRCB
FINAL | JUNE 2019 | 6-1
Chapter 6
CO-DIGESTION AT LARGE WASTEWATER TREATMENT PLANTS
6.1 East Bay Municipal Utility District
The East Bay Municipal Utility District’s (EBMUD) Main wastewater treatment plant (WWTP) serves approximately 650,000 residents from seven cities and sanitation districts located in the
East Bay near San Francisco and Oakland. The Main WWTP’s permitted average dry weather flow (ADWF) capacity is 120 million gallons per day (mgd), which is significantly higher than
observed flows. The WWTP was originally designed to handle high organic loads from canneries that have since left the area, leaving EBMUD with excess solids treatment capacity for its Resource Recovery program.
A key portion of that excess capacity is provided by eleven digesters, each of which has 1.8 million gallons (MG) of capacity. With all units in service, the digesters would provide a total digestion volume of 19.8 MG (Carollo 2018). Under normal conditions, two of the digesters are
out of service to maintain a regular schedule of digester cleaning. While the plant has a design
solids retention time (SRT) of 16 days, the actual SRT in 2017 averaged 22 days. EBMUD operates its digesters in the thermophilic temperature regime (Water Environment Federation 2018), heating digesters via spiral heat exchangers. Eight have both draft tubes and pumps for mixing and three are fitted only with pump mixing. The digesters are continuously fed in parallel to reduce digester gas production variability and operational issues such as foaming. One
digester is fitted with a double membrane cover for low pressure digester gas storage. The
digester gas piping connects all the digesters to this gas storage system.
EBMUD beneficially uses biogas as much as possible. The plant has three 2.1 MW engines and
one 4.5-megawatt (MW) gas turbine that utilize biogas to produce power and heat. EBMUD dewaters biosolids with centrifuges that have a total hydraulic capacity of 620 gallons per minute (gpm). The plant uses emulsion polymer for dewatering and produces dewatered cake at an average dryness of 25 percent. The dewatered cake is trucked offsite for various end uses.
6.1.1 Resource Recovery Program
Since 2002, the EBMUD Resource Recovery (R2) program has sought ways to increase biogas production through the co-digestion of additional feedstocks such as fats, oils, and grease (FOG) and other high-strength wastes. In the early 2000s, the agency constructed relatively low-cost systems ($1M in 2002): one to receive lower-strength liquid wastes like septage near the headworks and another, smaller system to receive FOG. EBMUD intended the FOG receiving station to be temporary - and included a macerator, rotary lobe pump, above-grade hoses, a
Baker storage tank, two feed pumps, and only a single truck offloading connection.
In 2004, the agency constructed a $7M solids and liquids receiving facility to accept higher-solids material such as food waste. This receiving facility included a sub-grade pit into which high solids material could be delivered, a paddle finisher, positive displacement transfer pumps and
associated piping, odor control, and provisions to allow dilution of the high-solids material into a
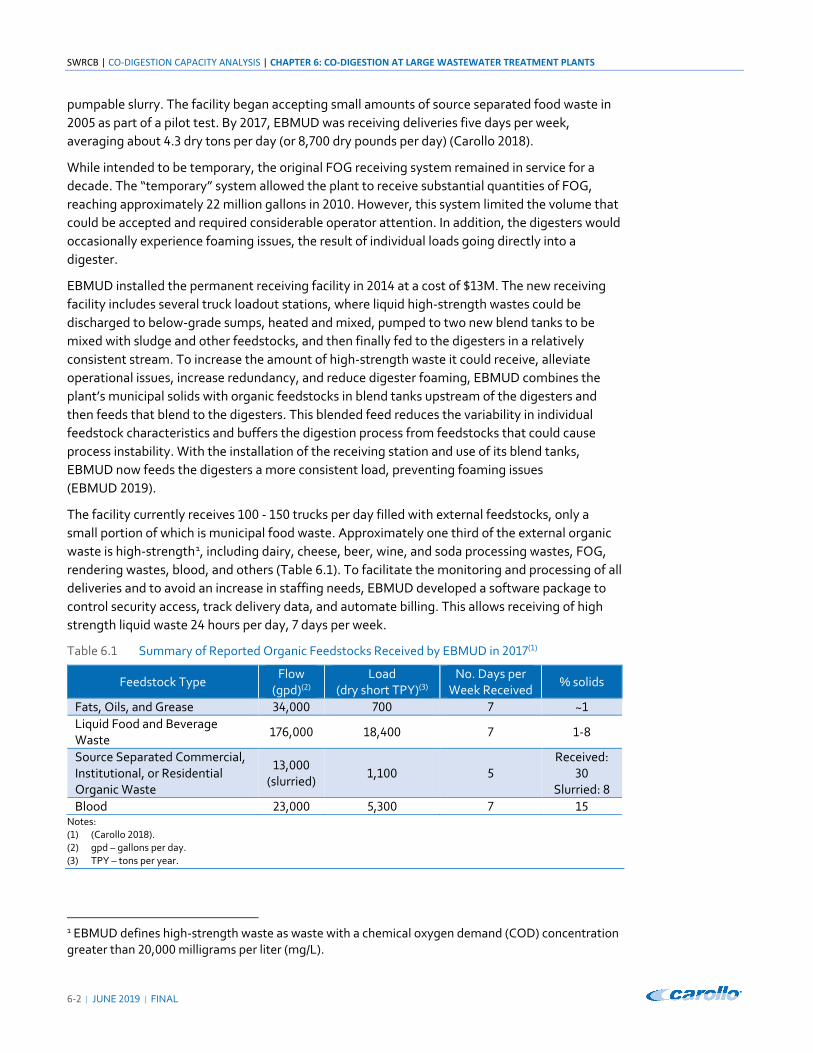
SWRCB | CO-DIGESTION CAPACITY ANALYSIS | CHAPTER 6: CO-DIGESTION AT LARGE WASTEWATER TREATMENT PLANTS
6-2 | JUNE 2019 | FINAL
pumpable slurry. The facility began accepting small amounts of source separated food waste in 2005 as part of a pilot test. By 2017, EBMUD was receiving deliveries five days per week,
averaging about 4.3 dry tons per day (or 8,700 dry pounds per day) (Carollo 2018).
While intended to be temporary, the original FOG receiving system remained in service for a decade. The “temporary” system allowed the plant to receive substantial quantities of FOG,
reaching approximately 22 million gallons in 2010. However, this system limited the volume that
could be accepted and required considerable operator attention. In addition, the digesters would occasionally experience foaming issues, the result of individual loads going directly into a digester.
EBMUD installed the permanent receiving facility in 2014 at a cost of $13M. The new receiving
facility includes several truck loadout stations, where liquid high-strength wastes could be discharged to below-grade sumps, heated and mixed, pumped to two new blend tanks to be
mixed with sludge and other feedstocks, and then finally fed to the digesters in a relatively
consistent stream. To increase the amount of high-strength waste it could receive, alleviate
operational issues, increase redundancy, and reduce digester foaming, EBMUD combines the plant’s municipal solids with organic feedstocks in blend tanks upstream of the digesters and then feeds that blend to the digesters. This blended feed reduces the variability in individual feedstock characteristics and buffers the digestion process from feedstocks that could cause process instability. With the installation of the receiving station and use of its blend tanks,
EBMUD now feeds the digesters a more consistent load, preventing foaming issues (EBMUD 2019).
The facility currently receives 100 - 150 trucks per day filled with external feedstocks, only a
small portion of which is municipal food waste. Approximately one third of the external organic waste is high-strength1, including dairy, cheese, beer, wine, and soda processing wastes, FOG,
rendering wastes, blood, and others (Table 6.1). To facilitate the monitoring and processing of all deliveries and to avoid an increase in staffing needs, EBMUD developed a software package to control security access, track delivery data, and automate billing. This allows receiving of high strength liquid waste 24 hours per day, 7 days per week.
Table 6.1 Summary of Reported Organic Feedstocks Received by EBMUD in 2017(1)
Feedstock Type Flow
(gpd)(2) Load
(dry short TPY)(3) No. Days per
Week Received % solids
Fats, Oils, and Grease 34,000 700 7 ~1 Liquid Food and Beverage Waste
176,000 18,400 7 1-8
Source Separated Commercial, Institutional, or Residential Organic Waste
13,000 (slurried)
1,100 5 Received:
30 Slurried: 8
Blood 23,000 5,300 7 15 Notes: (1) (Carollo 2018). (2) gpd – gallons per day. (3) TPY – tons per year.
1 EBMUD defines high-strength waste as waste with a chemical oxygen demand (COD) concentration greater than 20,000 milligrams per liter (mg/L).
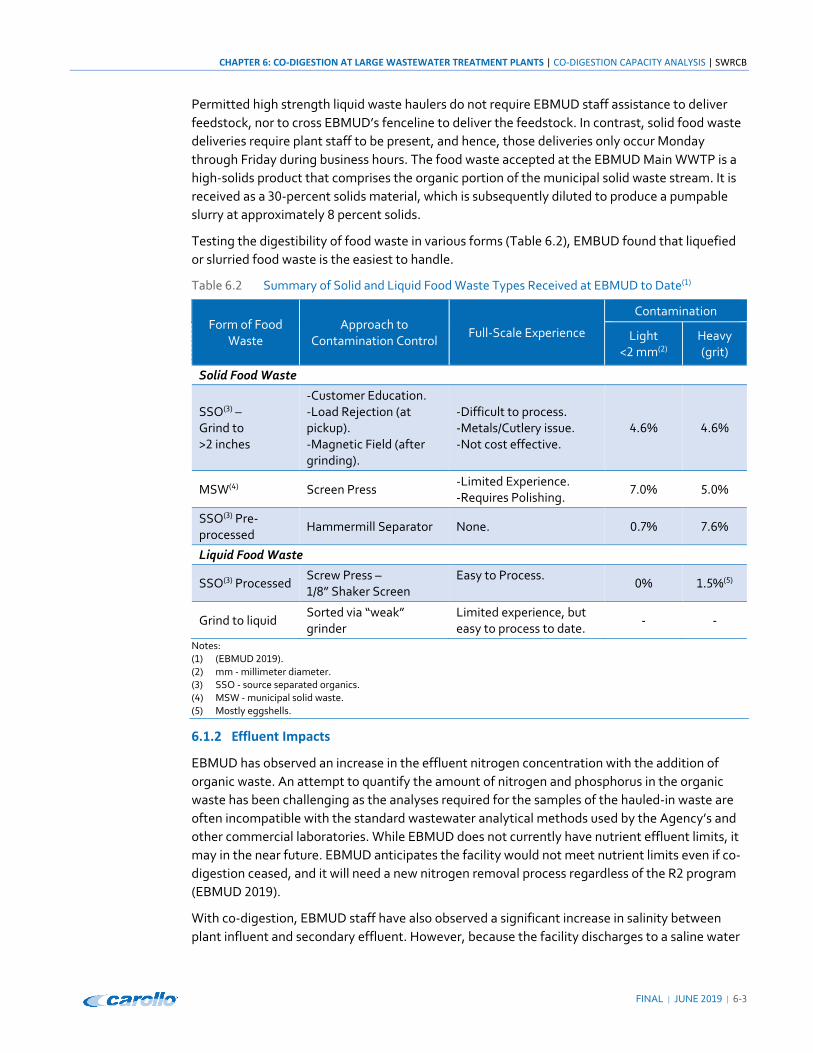
CHAPTER 6: CO-DIGESTION AT LARGE WASTEWATER TREATMENT PLANTS | CO-DIGESTION CAPACITY ANALYSIS | SWRCB
FINAL | JUNE 2019 | 6-3
Permitted high strength liquid waste haulers do not require EBMUD staff assistance to deliver feedstock, nor to cross EBMUD’s fenceline to deliver the feedstock. In contrast, solid food waste deliveries require plant staff to be present, and hence, those deliveries only occur Monday through Friday during business hours. The food waste accepted at the EBMUD Main WWTP is a high-solids product that comprises the organic portion of the municipal solid waste stream. It is
received as a 30-percent solids material, which is subsequently diluted to produce a pumpable
slurry at approximately 8 percent solids.
Testing the digestibility of food waste in various forms (Table 6.2), EMBUD found that liquefied or slurried food waste is the easiest to handle.
Table 6.2 Summary of Solid and Liquid Food Waste Types Received at EBMUD to Date(1)
Form of Food Waste
Approach to Contamination Control
Full-Scale Experience
Contamination
Light <2 mm(2)
Heavy (grit)
Solid Food Waste
SSO(3) – Grind to >2 inches
-Customer Education. -Load Rejection (at pickup). -Magnetic Field (after grinding).
-Difficult to process. -Metals/Cutlery issue. -Not cost effective.
4.6% 4.6%
MSW(4) Screen Press -Limited Experience. -Requires Polishing.
7.0% 5.0%
SSO(3) Pre-processed
Hammermill Separator None. 0.7% 7.6%
Liquid Food Waste
SSO(3) Processed Screw Press – 1/8” Shaker Screen
Easy to Process. 0% 1.5%(5)
Grind to liquid Sorted via “weak” grinder
Limited experience, but easy to process to date.
- -
Notes: (1) (EBMUD 2019). (2) mm - millimeter diameter. (3) SSO - source separated organics. (4) MSW - municipal solid waste. (5) Mostly eggshells.
6.1.2 Effluent Impacts
EBMUD has observed an increase in the effluent nitrogen concentration with the addition of organic waste. An attempt to quantify the amount of nitrogen and phosphorus in the organic waste has been challenging as the analyses required for the samples of the hauled-in waste are often incompatible with the standard wastewater analytical methods used by the Agency’s and other commercial laboratories. While EBMUD does not currently have nutrient effluent limits, it may in the near future. EBMUD anticipates the facility would not meet nutrient limits even if co-digestion ceased, and it will need a new nitrogen removal process regardless of the R2 program (EBMUD 2019).
With co-digestion, EBMUD staff have also observed a significant increase in salinity between plant influent and secondary effluent. However, because the facility discharges to a saline water

SWRCB | CO-DIGESTION CAPACITY ANALYSIS | CHAPTER 6: CO-DIGESTION AT LARGE WASTEWATER TREATMENT PLANTS
6-4 | JUNE 2019 | FINAL
body (i.e., the San Francisco Bay), its permitted discharge salinity limit is high and effluent concentrations are well below it (EBMUD 2019). Nevertheless, salinity remains a concern to
EBMUD because high salinity can limit the use of recycled water for cooling towers and other salt-sensitive applications.
6.1.3 Biogas Benefits and Challenges
EBMUD has seen a significant increase in biogas production as a result of co-digestion. The facility became energy neutral in 2012 and is now energy positive (EBMUD 2019). Because EBMUD combines multiple external feedstocks with municipal sludge, and feeds the blend to the digesters, data from this facility illustrate the impacts of the combined feed rather than impacts from only municipal food waste.
The left panel in Figure 6.1 shows the amount of biogas EBMUD produced prior to co-digesting organic waste (i.e., the full calendar year of 2001) and the relative increase in production of biogas after (specifically, years 2013 to 2017). According to our analysis, EBMUD’s biogas production has increased, on average, by 140 percent. As noted earlier, we cannot distinguish how much of the increased biogas production is attributable to the food waste alone. That said, the benefit of co-digestion is clear: the biogas derived from EBMUD’s R2 program reduces power costs by approximately $2M per year and generates approximately $1M per year in revenue from exported electricity (EBMUD 2016).
Figure 6.1 EBMUD Biogas Production Before and After Implementation of the R2 Program
Biogas production is highly variable. Production ramps up during the week when feedstock deliveries are more frequent, especially since EBMUD does not require feedstock deliveries to be
scheduled, and then drops on the weekends as deliveries decline. This variability poses challenges to biogas management. The equipment is unable to ramp up or down quickly, making it difficult for operations staff to run the system optimally. EBMUD has explored a variety of techniques to optimize biogas production and utilization, including:
• Continuously feeding digesters the feedstock and sludge blend. While continuous feed addressed some issues, gas production variability remains an issue.
• Storing organic (liquid/food) waste onsite. This option may be problematic as food waste is readily degradable and may produce methane in the storage tank, potentially creating

CHAPTER 6: CO-DIGESTION AT LARGE WASTEWATER TREATMENT PLANTS | CO-DIGESTION CAPACITY ANALYSIS | SWRCB
FINAL | JUNE | ‐
dangerous conditions both in and around the storage tank; it may also pose odor control
issues.
Storing biogas onsite. EBMUD determined the safety risks associated with storing high‐
pressure gas and the high capital cost of infrastructure needed to store a large volume of
low‐pressure gas made this technique unfeasible. Instead, the facility installed a low‐
pressure digester gas storage membrane cover on one of the plant’s digesters. This has
provided a buffer within the system.
Selling biogas derived power to the grid. Based on its agreements to date, EMBUD has
found that the value of wholesale electricity is decreasing. The agency estimates
revenue in the near‐term future will be too low to cover the operating costs for the
biogas utilization system.
Injecting renewable natural gas into the pipeline. EBMUD has abandoned this option, as
the agency discovered it would be subject to additional Occupational Safety and Health
Association (OSHA) regulations. EBMUD estimated that the additional engineering
activities required to comply would be too costly for this project to be feasible. For more
information related to the OSHA regulations, see the “Regulatory Considerations”
section in Chapter .
Incentivizing hauler delivery on weekends rather than weekdays. EBMUD is considering
ways to make delivering feedstock on weekends more attractive to haulers, with the end
goal of reducing the variability in biogas production during the week.
6.1.4 Biosolids Benefits and Challenges
Since implementing co‐digestion, EBMUD has observed an increase in biosolids production by
approximately percent on a wet weight basis (right panel in Figure . ). Additionally, the
production of biosolids per total solids (TS) fed to the digesters decreased by percent, from an
average of . pounds of dewatered biosolids per pound TS fed to the digester (pound [lb]
biosolids/lb TS fed) to . lb biosolids/lb TS fed. This reduction in biosolids production could be
related to the synergistic effects of co‐digestion and is a topic being researched within the co‐
digestion field (Higgins et al. ).
The increase in annual biosolids production results in an additional , wet tons per year, on
average. Using an average end use (or disposal unit) cost provided by EBMUD, this results in an
additional cost of approximately M annually2. While co‐digestion has increased the cost of
biosolids end‐use and disposal, that cost is still well below the electricity cost savings and
revenue (of approximately M) (EBMUD ).
In , approximately percent of the biosolids were used beneficially, either as Class B land
application via a third party, processed as a fertilizer via a third party, or as Alternative Daily
Cover (ADC) at the landfill (Table . ).
2 This cost does not account for the benefits of biosolids land application, such as carbon sequestration, offsetting synthetic fertilizer demand, increasing the organic content of soils, offsetting irrigation demand by increasing soil moisture holding capacity, increasing nutrient use efficiency, or increasing crop yield.

SWRCB | CO-DIGESTION CAPACITY ANALYSIS | CHAPTER 6: CO-DIGESTION AT LARGE WASTEWATER TREATMENT PLANTS
‐ | JUNE | FINAL
Table . Summary of EBMUD’s Reported Biosolids End Uses and Disposal in ( )
End Use or Disposal Biosolids (total wet tons) Percent of Total
Land Application (Class B) via a Third Party ,
Processed as Fertilizer via a Third Party ,
Landfill as ADC ,
Landfill Disposal ,
Notes: ( ) (Carollo, ).
While the food waste received accounts for less than percent of the total external feedstock
accepted at the plant, food waste and FOG represent the most operationally intensive streams
with considerable maintenance needs. One reason for this has been the presence of grit, glass,
and other hard debris in the food waste and FOG.
To reduce the maintenance associated with the food waste, EBMUD is planning to conduct a
pilot study in the summer of that will test grit removal from a percent solids slurry.
Reducing the grit load associated with the food waste would allow EBMUD to receive more
source separated organics (SSO) from pre‐processed food waste sources (EBMUD ).
6.2 Sanitation Districts of Los Angeles County
Located in Carson, the Sanitation Districts of Los Angeles County (LACSD) Joint Water Pollution
Control Plant (JWPCP) serves approximately . million residents in Los Angeles County. The
permitted ADWF capacity is mgd, which is significantly higher than observed flows. To
manage the solids it receives, the JWPCP operates anaerobic digesters, each having a
capacity of . MG. If all digesters were in service, they would provide a total digestion volume of
MG (Carollo ). All digesters are operated in the mesophilic temperature regime, mixed
via gas injection, and heated via direct steam injection. Under typical operating conditions, two
digesters are out of service for cleaning and to ensure all digesters are cleaned on a regular
schedule. The plant has a design SRT of days; in , actual SRT averaged days.
The biogas generated at JWPCP is beneficially used via five internal combustion engines, five
boilers, and three gas turbines to produce either power or heat (offsetting purchased electricity
and heat). The plant produces Class B biosolids, which are dewatered with centrifuges (aided by
polymer) to produce a percent biosolids cake ( average) that is trucked offsite for various
beneficial uses.
6.2.1 Food Waste Project
In , LACSD completed a feasibility study on co‐digesting food waste with solids. While
uncertain about the economics of such projects, LACSD nonetheless concluded that co‐digestion
with food waste was technically feasible, allowed under current regulations, and could serve as
an immediate option to assist the County and haulers with diversion mandates under Assembly
Bill (AB) , AB , and Senate Bill (SB) .
In , LACSD performed a bench scale test to quantify the biogas production potential of co‐
digesting LACSD solids with Waste Management’s Engineered Bioslurry (EBS®). The bench scale
test found co‐digestion with food waste increased biogas production. In the process of bench
scale testing, LACSD developed food waste specifications to avoid or minimize negative impacts
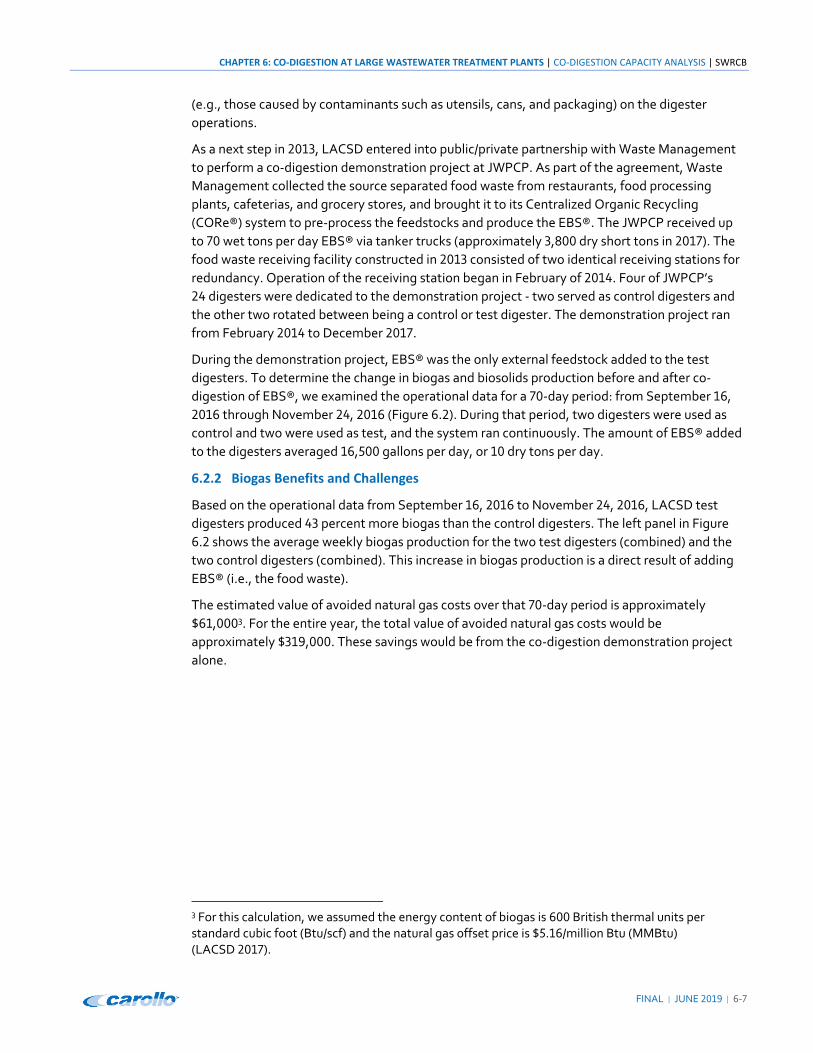
CHAPTER 6: CO-DIGESTION AT LARGE WASTEWATER TREATMENT PLANTS | CO-DIGESTION CAPACITY ANALYSIS | SWRCB
FINAL | JUNE | ‐
(e.g., those caused by contaminants such as utensils, cans, and packaging) on the digester
operations.
As a next step in , LACSD entered into public/private partnership with Waste Management
to perform a co‐digestion demonstration project at JWPCP. As part of the agreement, Waste
Management collected the source separated food waste from restaurants, food processing
plants, cafeterias, and grocery stores, and brought it to its Centralized Organic Recycling
(CORe®) system to pre‐process the feedstocks and produce the EBS®. The JWPCP received up
to wet tons per day EBS® via tanker trucks (approximately , dry short tons in ). The
food waste receiving facility constructed in consisted of two identical receiving stations for
redundancy. Operation of the receiving station began in February of . Four of JWPCP’s
digesters were dedicated to the demonstration project ‐ two served as control digesters and
the other two rotated between being a control or test digester. The demonstration project ran
from February to December .
During the demonstration project, EBS® was the only external feedstock added to the test
digesters. To determine the change in biogas and biosolids production before and after co‐
digestion of EBS®, we examined the operational data for a ‐day period: from September ,
through November , (Figure . ). During that period, two digesters were used as
control and two were used as test, and the system ran continuously. The amount of EBS® added
to the digesters averaged , gallons per day, or dry tons per day.
6.2.2 Biogas Benefits and Challenges
Based on the operational data from September , to November , , LACSD test
digesters produced percent more biogas than the control digesters. The left panel in Figure
. shows the average weekly biogas production for the two test digesters (combined) and the
two control digesters (combined). This increase in biogas production is a direct result of adding
EBS® (i.e., the food waste).
The estimated value of avoided natural gas costs over that ‐day period is approximately
, 3. For the entire year, the total value of avoided natural gas costs would be
approximately , . These savings would be from the co‐digestion demonstration project
alone.
3 For this calculation, we assumed the energy content of biogas is British thermal units per standard cubic foot (Btu/scf) and the natural gas offset price is . /million Btu (MMBtu) (LACSD ).
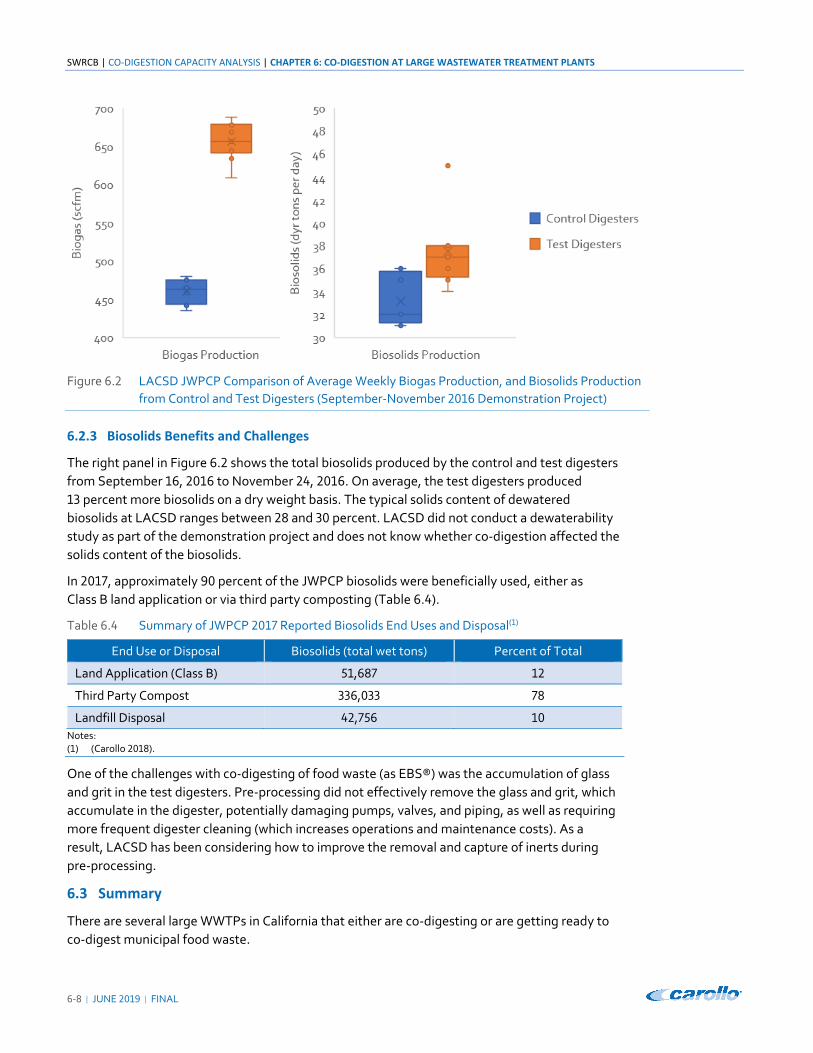
SWRCB | CO-DIGESTION CAPACITY ANALYSIS | CHAPTER 6: CO-DIGESTION AT LARGE WASTEWATER TREATMENT PLANTS
6-8 | JUNE 2019 | FINAL
Figure 6.2 LACSD JWPCP Comparison of Average Weekly Biogas Production, and Biosolids Production from Control and Test Digesters (September-November 2016 Demonstration Project)
6.2.3 Biosolids Benefits and Challenges
The right panel in Figure 6.2 shows the total biosolids produced by the control and test digesters from September 16, 2016 to November 24, 2016. On average, the test digesters produced 13 percent more biosolids on a dry weight basis. The typical solids content of dewatered biosolids at LACSD ranges between 28 and 30 percent. LACSD did not conduct a dewaterability study as part of the demonstration project and does not know whether co-digestion affected the solids content of the biosolids.
In 2017, approximately 90 percent of the JWPCP biosolids were beneficially used, either as Class B land application or via third party composting (Table 6.4).
Table 6.4 Summary of JWPCP 2017 Reported Biosolids End Uses and Disposal(1)
End Use or Disposal Biosolids (total wet tons) Percent of Total
Land Application (Class B) 51,687 12
Third Party Compost 336,033 78
Landfill Disposal 42,756 10 Notes: (1) (Carollo 2018).
One of the challenges with co-digesting of food waste (as EBS®) was the accumulation of glass
and grit in the test digesters. Pre-processing did not effectively remove the glass and grit, which accumulate in the digester, potentially damaging pumps, valves, and piping, as well as requiring
more frequent digester cleaning (which increases operations and maintenance costs). As a
result, LACSD has been considering how to improve the removal and capture of inerts during
pre-processing.
6.3 Summary
There are several large WWTPs in California that either are co-digesting or are getting ready to co-digest municipal food waste.
CHAPTER 6: CO-DIGESTION AT LARGE WASTEWATER TREATMENT PLANTS | CO-DIGESTION CAPACITY ANALYSIS | SWRCB
FINAL | JUNE 2019 | 6-9
The agency with the largest and the longest running co-digestion program is EBMUD. Since 2002, the EBMUD Resource Recovery program has sought ways to increase biogas production
through the co-digestion of additional feedstocks. Less than 5 percent of the high-strength organic feedstock EBMUD currently accepts is municipal food waste. As a result of co-digestion of the combined feedstock, EBMUD has seen a significant increase in biogas production, an
average increase of 140 percent. EBMUD has also observed an increase in biosolids production, approximately 25 percent on a wet weight basis.
The other large agency that has extensively investigated co-digestion is the LACSD. Following a bench scale test to quantify the biogas production potential in 2012, LACSD operated a co-digestion demonstration project for several years. Co-digestion at LACSD’s JWPCP facility increased biogas production by 43 percent, and biosolids production by 13 percent, on a dry
weight basis.
There are two other agencies getting municipal food waste co-digestion projects off the ground,
and another that has piloted a program. The Orange County Sanitation District’s (OCSD) Plant 2
(144 mgd ADWF) and the Riverside Regional Water Quality Control Plant (46 mgd ADWF) are in
the design and planning stages, respectively. The City of Los Angeles’ Hyperion Water Reclamation Plant (450 mgd ADWF) conducted a brief co-digestion pilot using its existing FOG receiving station. Subsequently, Hyperion completed an “In-Sink” pilot, evaluating the receipt of
ground food waste through the sewer system. Specific facility information on how co-digestion has affected biogas and biosolids production will become available as these projects evolve.
WWTPs have compelling reasons to co-digest food waste - and equally compelling reasons to proceed cautiously. The challenges confronting EBMUD and LACSD (e.g., anticipated nitrogen
limits, uncertainty of renewable electricity prices, and feedstock contamination) are but a few of
the obstacles WWTPs must navigate to co-digest with municipal food waste. For nascent programs such as those at the OCSD, Riverside and Hyperion to succeed, the wastewater and
waste industries as well as state and local agencies must holistically consider and address these challenges.
6.4 References
Carollo (2018). Co-digestion Capacity Survey.
EBMUD (2019). Experience and Challenges of Food Waste Co-Digestion and Digester Gas Utilization. Presentation at CWEA Energy-Biosolids Nexus Seminar. May 1, 2019.
Higgins, M., Rajagopalan G. (2017). Understanding Impacts of Co-Digestion: Digester Chemistry, Gas Production, Dewaterability, Solids Production, Cake Quality, and Economics. WE&RF.
LACSD (2017). Sanitation Districts of Los Angeles County Annual Energy Report Fiscal Year 2016/2017.
Water Environment Federation (2018). Design of Water Resource Recovery Facilities Manual of Practice No. 8. 2018.