Introduction to Water Resistive Barriers (WRBs) & Air Barriers
Upload
khangminh22Category
view
1download
0
sustainability
Article
Feasibility and Barriers for Anaerobic Digestion inMexico City
Nina Tsydenova 1,* , Alethia Vázquez Morillas 2 , Álvaro Martínez Hernández 2,Diana Rodríguez Soria 2, Camilo Wilches 3 and Alexandra Pehlken 4
1 School of Computing Science, Business Administration, Economics, and Law (Faculty II), Carl von OssietzkyUniversity of Oldenburg, 26129 Oldenburg, Germany
2 Department of Energy, Area of Sustainable Technologies, Universidad Autónoma Metropolitana UAMAzcapotzalco, Mexico City 02200, Mexico
3 bwe Energiesysteme GmbH & Co. KG, Zeppelinring 12–16, 26169 Friesoythe, Germany4 OFFIS—Institut für Informatik, Escherweg 2, 26121 Oldenburg, Germany* Correspondence: [email protected]; Tel.: +49-176-973-49877
Received: 29 June 2019; Accepted: 26 July 2019; Published: 30 July 2019�����������������
Abstract: Due to the high organic fraction in municipal solid waste (MSW) composition in MexicoCity, anaerobic digestion (AD) is considered as a viable treatment method for organics in this study.The most feasible way refers to the waste from the wholesale market Central de Abasto, which ispredominantly organics. This work aims to perform a business plan and discuss the barriers forAD technology in Mexico. In this case study, the cost-benefit analysis (CBA) approach is applied toestimate the profitability of the project. The net present value of this project is positive, and the modelresulted in a payback period of 7 years. Identified barriers to feasibility of energy generation throughbiogas of MSW in Mexico include the need for large investment, low profitability through sales ofelectricity, and no use for generated heat. An attractive panorama for clean energy in Mexico was notevidenced, even though the Energy Reform took place in 2013. However, the environmental analysisalso demonstrates a positive environmental impact of 730 kg CO2 per 1 Mg of MSW. Therefore,support incentives are needed to promote the use of other by-products of the AD process, such asheat and digestate.
Keywords: waste management; anaerobic digestion; emerging countries; biogas; digestate; Easewaste
1. Introduction
An increasing number of developing countries are showing interest in recovering energy frommunicipal solid waste (MSW). While some European Union states have been successful in this regard,many developing countries are investigating waste-to-energy (WtE) technologies to adopt [1]. So far,only a few have recorded successes. Undoubtedly, the investment and technical demands for advancedwaste treatment systems are the major reasons for the slow adoption of WtE in emerging countries [2].Additionally, recent data on characteristics of the MSW is missing in most developing countries.This also hinders the feasibility of WtE projects [3].
The functionality of waste management nowadays has shifted from the disposal of wastestowards energy and resource recovery [4]. Even though the primary objective of WtE is wastemanagement, it is also a renewable energy source that can complement traditional power supplies [5].To support a rapid transition in this direction, energy from waste technology should be promotedusing political instruments.
In this research, Mexico City, the capital of Mexico, was selected as a case study. In 2013, the EnergyReform created favorable conditions for the renewable energy generators throughout the country.
Sustainability 2019, 11, 4114; doi:10.3390/su11154114 www.mdpi.com/journal/sustainability

Sustainability 2019, 11, 4114 2 of 21
This paper examines the economic feasibility of an Anaerobic Digestion (AD) plant fed with MSWunder the new circumstances. After the change of the government at the end of 2018, the plan toconstruct an incineration plant in the city was abandoned, therefore, there is a need to search foralternative waste management solutions [6]. The prevailing percentage of MSW in Mexico is presentedby organics [7]; thus, anaerobic digestion technology was selected as the suitable treatment solution.The suggested substrate is the waste stemming from the wholesale market Central de Abasto, locatedin the borough Iztapalapa, east of the city. The MSW was sampled and examined to report data on itsproperties and estimate if it is suitable for the AD process.
This study analyzes the barriers and feasibility of a biogas plant in Mexico City fed with the organicfraction of MSW produced at Central de Abasto. The aim of this work is to use accurate businessplanning to discuss the barriers to AD technology in Mexico City. At the local level, the primaryobjective of this assessment is to support efforts of the authorities to incorporate an AD plant into theintegrated waste management system. Overall, it is expected that the study will assist in stimulatingfurther growth of waste generation technologies in emerging countries, especially in Latin America.
Previous works have analyzed other technologies, such as Escamilla García et al. [8] focusing onlandfill gas collection for Mexico City, and Rios and Kaltschmitt [9] comparing electricity generationin Mexico from landfill gas with use of biogas from wastewater and livestock manure. De MedinaSalas et al. [10] have discussed several treatment options for the organic fraction of MSW (OFMSW) inSierra Madre Orienta, in northeastern Mexico. However, to the best of author’s knowledge, there is nodetailed economic feasibility study of large-scale biogas projects for electricity generation in Mexicanurban areas available currently.
2. Background Information
2.1. Sustainabilty Development Goals
The Sustainable Development Goals (SDGs) address the global challenges, including poverty,inequality, climate, environmental degradation, prosperity, peace, and justice. They are interconnectedand are set for the year 2030. SDG 7 is focused on energy. This goal is especially important as it interlinkswith all other Sustainable Development Goals. Universal access to energy, energy efficiency, and thewider spread of renewable energy are crucial for creating sustainable and inclusive communities andresilience to environmental issues such as climate change. Access to electricity is closely linked withimprovements in human development, including productivity (SDG 8), health and safety (SDG 3),gender equality (SDG 5), and education (SDG 4) [11]. The correlation between human developmentand electricity consumption per capita was proved by Goldemberg et al. [12].
Mexico has undertaken many initiatives towards sustainable development and the SDG 7.The country has a high potential for development of renewable energies, solar, and wind power, withpotential for bioenergy, hydropower, and geothermal power as well [13,14]. Nevertheless, the Mexicanelectric power sector is characterized for the prevalence of fossil fuels (82%) in the energy mix [15].Mexico is a country with a high degree of electricity coverage, but challenges still remain in isolatedrural areas. In this context, the utilization of renewable energy sources for electric power generationbecomes an important factor in achieving the SDGs. Nonetheless, technologies face significant barriersin their wide usage, such as establishing appropriate financial sources and mechanisms to allowwidespread use of the renewable energy in the national power mix [16].
AD technology can contribute significantly to the implementation of SDGs, not only throughgenerating low carbon energy and fertilizers, but also through the reduction of methane emissionsfrom food and farming wastes, providing energy security, reducing poverty, and improving wastemanagement and sanitation. AD offers decentralization of energy generation. Rural and remotecommunities that are not connected to the electricity grids are able to produce their own from the wasteand the agricultural residues and become energy self-sufficient. Also, AD is a reliable energy source

Sustainability 2019, 11, 4114 3 of 21
compared to other renewables. Once started and stabilized, the plant produces biogas on a continuousbasis independently of external factors, such as the sun or wind [17].
2.2. Energy Reform in Mexico
The government of Mexico under the president Enrique Peña Nieto, who served from December2012 until November 2018, aimed to transition the country to cleaner and more diversified sources ofenergy. The Energy Reform, which took place in 2014, was implemented to increase energy security,minimize the negative effects of fossil fuel dependence, and minimize environmental impacts [18].Mexican Energy Reform consists of the introduction of the Electricity Industry Law and the FederalCommission of Electricity Law, along with other regulations arising from the amendments to articles25, 27, and 28 of the Constitution. This legal framework created better conditions for renewable energysources. The government also set the clear clean energy goals: to generate 35% of its electricity fromclean energy by 2024 and to reduce greenhouse gas emissions by 22% by 2030.
Before the reform, most of the functions of the electricity market were concentrated at ComisiónFederal de Electricidad (CFE), the state-owned electric utility of Mexico. In a nutshell, the goal of thereform is to open parts of energy sector to private investors, while retaining control over transmissionand distribution channels [19].
The reform introduced new stakeholders to the market and gave more freedom to the energygenerators. The Energy Reform allows private firms to compete against the state companies for theproduction, distribution, and retail of energy [20]. Power stations received the right to participate inthe electricity system under three schemes: sell electricity on the wholesale market, through contractsdirectly to the Suppliers or Qualified Users, and through auctions organized by CENACE, CentroNacional de Control de Energía (National Center of Energy Control) [21].
Mexico’s new president starting from January 2019, Andres Manuel Lopez Obrador (AMLO),made energy sovereignty the center of political agenda. However, to achieve this goal AMLOemphasizes existing hydroelectric, diesel, fuel oil, and coal fired power plants, while eliminatingmarket mechanisms that had allowed for investment in wind and solar capacity at record low prices [22].For instance, the fourth clean power auction was postponed indefinitely [23].
Energy from biomass can play a central role in achieving ambitious CO2 reduction, sustainability,and energy sovereignty targets in Mexico. Biogas is particularly important because it can be usedflexibly to generate heat, gas, electricity, or liquid fuels, and it can readily be stored and transported ifupgraded to biomethane [24]. However, use of biomass for biogas production for energy purposesmay compete with food production for the available area. In light of this competition for space, it isdesirable to include previously unused biomass fractions, such as the organic fraction of MSW into newsources for energy production [25]. The advantage here is no competition with food and no land usecompetition due to the fact that the input into the biogas fermenter is considered as waste, althoughthe AD technology has to cope with non-technological barriers, such as public acceptance, availabilityof incentives, distribution infrastructure, and shortage of institutional and regulatory support [26].
2.3. Anaerobic Digestion Technology
Anaerobic digestion (AD) is a microbiological process of decomposition of organic matter inthe absence of oxygen. The key process phases of AD are hydrolysis, acidogenesis, acetogenesis,and methanogenesis. In the course of these stages, complex organic molecules are broken downinto simpler ones and intermediate products are converted to methane, carbon dioxide, and water.The main components of biogas are methane (48–65%), carbon dioxide (36–41%), nitrogen (up to 17%),and traces of other gases, such as hydrogen sulphide (H2S) and siloxanes. Anaerobic digestion andbiogas production are influenced by parameters such as the total solids content (TS), the volatile solidscontent (VS), the carbon and nitrogen ratio (C/N), the particle size, the temperature, the pH, and theinoculum type [27].

Sustainability 2019, 11, 4114 4 of 21
The digestion process takes place at mesophilic (35–42 ◦C) or thermophilic (45–60 ◦C) temperatureconditions. Two process types are mainly adopted, namely wet or dry fermentation. In the first case,the input has a solid concentration below 12%, whereas, in dry digestion plants, solid concentrationis higher than 20%. Concerning the continuity, AD technologies can be classified into batch andcontinuous systems. In a batch system, the reactor is filled with the feedstock and left for a pre-definedperiod, during which digestion and biogas production take place. At the end of the period, the reactoris emptied, and the process restarts. In a continuous system, the biomass is regularly fed into the reactor,and, at the same time, effluent is discharged. All wet digestion processes are operated continuously,whereas, for dry fermentation, both batch and continuous processes are applied [27]. Moreover,one-stage or two-stage processes can be differentiated. In a one-stage system, all biochemical reactionstake place in one reactor, while a two-stage system consists of two reactors [28].
Worldwide, the biodegradable fraction of the MSW (i.e., food and biomass residues, paper,and cardboard) varies between 30% and 65% [7]. In this respect, several studies [29–32] show thatMSW is a potential primary energy source, especially the organic fraction of the municipal solid waste(OFMSW), thanks to the amount of biogas that can be produced through anaerobic digestion (AD).Therefore, AD is seen as a proper waste management solution in terms of solving the problem of wastegeneration and renewable energy production [33,34].
In practice, biogas is used onsite, for heating, local energy production and, in larger facilities,for district heating. Since biogas is a low-value fuel, it is not economically feasible to transport it forlong distances beyond the site where it is generated. Also, biogas cannot be easily shipped, consideringits corrosive potential. In contrast, upgraded biomethane could be more economically distributed to itspoint of use [26].
A by-product of AD, digestate, can be used as a fertilizer, which can help to avoid the negativeimpact of the production and use of chemical fertilizers. Most food waste plants have a pasteurizationunit for deactivating the pathogens present in the waste, which allows the use of the digestate ingardening operations [35]. The most important minerals in fertilizers are nitrogen (N), phosphorus (P),and potassium (K) [36]. Industrial nitrogen production relies on the Haber-Bosch manufacturing process,an energy-intensive nitrogen-fixation process that accounts for 1.2% of global energy consumption [37].Phosphorus and potassium, on the other hand, are obtained through mining. The phosphorousproduction chain is fragile because 77% of the world’s phosphate reserves are concentrated in just onecountry—Morocco. That is not the case with potassium fertilizers, which are mined and producedin many parts of the world. However, though potassium itself does not pose environmental risks,the mining activities may cause long-lasting ecological damage [38].
2.4. Case Study: Mexico City
Mexico City, the capital and the most populated city in the country, is an increasingly globalizedand spatially growing city in which MSW is a critical issue in terms of urban and environmentalgovernance. The city consists of 16 boroughs and is spread over an area of 1485 km2. The estimatedpopulation of 9 Million [39] generates 12,998 Mg of MSW per day, from which only 10,678 Mg arecollected through public services [40], while 48% of the generated waste stem from households,39% from services and commercial establishments, 5% from Central de Abasto (the biggest wholesalemarket), and the remaining 8% from medical units and laboratories, green areas, and other sources(see Figure 1). Lack of proper solid waste management infrastructure is a striking problem due tothe rapidly growing population. Further pressure is caused because people in urban areas consume2–3 times more natural resources than rural inhabitants [41].
The MSW management system of the city consists of twelve transfer stations, three separationand eight composting plants, and 5 landfills located outside of the city. As in the case with more thantwo-thirds of waste generated in Latin America and the Caribbean, the majority of MSW in Mexico-Cityis disposed of at the landfills [7]. Since 2011, when the only local landfill Bordo Poniente was closed,the city has had to send its waste for final disposal to nearby states. The landfills for final disposal are

Sustainability 2019, 11, 4114 5 of 21
the following: Milagro, Cañada, Cuautitlán, Chicoloapan, and Cuautla [40]. Transportation costs arehigh, and moreover, the access to the landfills has become an instrument of pressure in the conflictsbetween different political parties governing in neighboring Mexico State and Mexico City. To reducethe amount of waste sent to the landfill, in 2011, the city reinforced the source separation system,which was first introduced in 2003. According to this, household waste needed to be separatedinto two fractions: organics and inorganics. Unfortunately, the separation does not work properly,and the average separation efficiency for organics is 46% [40]. This system was designed to improvethe treatment of organic fraction with the help of several composting plants. In July 2017, the newenvironmental regulation for Mexico City NADF-024-AMBT-2013 came into force [42]. This normaims to increase the amount of separately collected recyclable materials, and thereby decrease thequantity of landfilled material. Non-recyclables were supposed to be treated in the incineration plant.The regulation introduces separation into four fractions: recyclables, non-recyclables, organic, andspecial waste, including Waste Electrical and Electronic Equipment (WEEE) and bulky waste. However,this type of segregation has not been implemented at full scale, and the separation efficiency is stilllow. The tender opened by the city was won the company from France Veolia [43]. However, the planto construct a thermovalorization plant was paused after the change of the City’s government [6].The possible reasons for that are the high capital and operating costs, ash generated, and gaseouspollutants to the atmosphere in case of inadequate air pollution control [29]. There is a belief in Mexicothat due the poor government control, the emission standards would not be respected during operationof the plant.
Since the incineration project is now paused in Mexico City, other alternatives should be discussed.Due to the high organic fraction and the lower set-up time, anaerobic digestion as a treatment methodfor organics should be considered. Interest in AD in Mexico has grown significantly in the last years,especially in the agricultural sector to treat cattle manure. The agricultural biogas plants representcovered lagoons with no mechanical agitation [44]. In 2012, there were 966 biodigesters treating animalslurries in Mexico [45].
The most feasible MSW feedstock are the residues from the wholesale market Central de Abasto(Supply Centre of Mexico City) (CEDA), which comprises 5% of total MSW generated in the city.Based on the composition study from 2017, these residues are mostly organics with low levels ofcontaminants. It needs to be mentioned that the main prerequisite for the AD is source-separatedorganics. In the case of waste from Central de Abasto, this condition could be fulfilled.
CEDA is a significant point of food distribution in Mexico City. It was founded in 1982.This 327-hectare terminal is the largest of its kind in the world, with 5000 businesses and over300,000 visitors per day. The Central de Abasto buys and distributes 30% of national fruit and vegetableproduction, with a value of around USD 9 billion per year, provides approximately 70,000 jobs andrepresents a central hub in the extensive network of formal and informal food-related activities inMexico City [46]. The production of residues is seasonal, associated with the harvest times of differentproducts [47].
For the purpose of this study, the AD plant is to be constructed in the borough of Tláhuac, whichis still rural in character. It is located on the south east edge of the district and has the area availablefor the plant and agricultural fields to accept the produced digestate. Also, Tláhuac is the neighbormunicipality to Iztapalapa, where the CEDA market is located. The distance from CEDA to the centerof Tláhuac is 20 km. Therefore, the implementation of the project would reduce the emission ofpollutants to the atmosphere through the reduced transportation distance.
2.5. Anaerobic Plant Design
Continuous wet anaerobic digestion technology is chosen for this project because it is a proventechnology for treatment of OFMSW [27,48]. The AD plant consists of eight digesters with a totalvolume of 51,472 m3. An average retention time of 63 days was achieved through the number ofdigesters. The gas storage capacity has a maximum of 21,900 m3. The combined heat and power (CHP)

Sustainability 2019, 11, 4114 6 of 21
units generates approximately 6 MW electrical and 6 MW thermal energy. The heat produced from theengine is recovered to provide heat to the reactors and evaporator for the digestate.
The pretreatment system consists of a hammer mill with contaminant separation and a gritseparation tank. Process water is also added to make the input pumpable. The biogas cleaningsystem consists of water removal and a reduction of the sulfur content by the addition of iron chloridein the digesters and carbon filters before the engines. Before the digestates are used as a fertilizer,they pass through a heat treatment in the pasteurizers followed by a separator to remove the remainingcontamination, after which it is sent to an evaporation unit to decrease the water content and increasenutrient concentrations in the fertilizer. Process water is also generated in this step. The CHP systemconsists of two engines of 3 MW each. The plant has a control and monitoring system achieving a highdegree of automation.
The mass flow diagram of the AD project discussed in this study is presented in Figure 2.The organic waste is delivered to the plant, where the contamination is sorted out. The part of thedigestate is sent to the evaporator to reduce the water quantity, and then to the agricultural fields asa fertilizer. Sulphur acid is added to the digestate to fix the nitrogen in the evaporation process andconvert it to a valuable plant fertilizer. The thermal power applied in the evaporator is the waste heatfrom the CHP unit, which is not used for self-supply of the plant. It is not enough to process the wholeamount of output product; 70,498 Mg of digestate is sent directly to the fields.
Figure 1. MSW generators in Mexico City [40].
Figure 2. Flow diagram of the AD plant (Mg/a).

Sustainability 2019, 11, 4114 7 of 21
3. Materials and Methods
3.1. Economic Assessment
The methodology presented in this paper is based on the following steps: identification of mainwaste categories (i.e., grass, nopal, corn shells, etc.) contained in residues from the central wholesalemarket in Mexico and characterization of the waste (in terms of water and ash content, organic matter,pH, N, P, C/N); estimation of energy generation of the anaerobic digestion plant based on the GIZstudy [49]; and economic feasibility.
The economic assessment is based on the analytical framework of Cost and Benefit Analysis (CBA)applied in Boardman et al. [50] and Berber [51]. In a CBA, the criterion for decision-making is based onthe Net Present Value (NPV) and Internal Rate of Return (IRR). As a last step, a sensitivity analysis isperformed in order to examine the robustness.
3.1.1. Net Present Value (NPV)
This study uses the cash flow model with NPV and IRR. Cash inflows arise from the followingactivities: financing operations, and investing while the outflows occur because of expenses,investments, and losses. Cash flow is often used for estimation of a company’s financial strength [52],the present case study is focused on the operating cash flow based on the International AccountingStandards (IAS). The IAS distinguish three types of cash flows for operating, investing, and financingactivities. The operating cash flow is normally used to identify which revenues generate cash inflowsto repay loans, cover the operating costs, pay dividends, and make new investments. In this model,interests to be paid and dividends received are classified as financing cash flows and investing cashflows, respectively, because they are costs of obtaining financial resources or returns on investments [53].Therefore, they are not included in the calculations here.
Although the unitary prices were only available in Mexican pesos ($), all the analyses were carriedout with economic values in euros (€). The exchange rate used was 21.54 Mexican pesos to 1 euro.The data was provided by the Central Bank of Mexico—BANXICO on 26 March 2019.
In this case study, the net present value (NPV) approach is applied to estimate if the project isprofitable or not. The NPV of an income stream is the sum of the present values of the individualamounts in the income stream. Each future income amount in the stream is discounted, meaning thatit is divided by a number representing the opportunity cost of holding capital. The formula used todetermine the NPV is described as follows:
NPV = −PNCF1
(1 + i)1+
NCF2
(1 + i)2 + . . .+NCFn
(1 + i)n (1)
where NCFn is net cash flow in the year n, P is Initial investment in the year 0, and i is reference ratecorresponding to the minimal acceptable rate of return (MARR) [8].
The NPV of an investment shows if the particular project is profitable for an investor or not,in comparison with the alternative one. When NPV is positive, the investment can be undertaken.A negative NPV means that the alternative project is more profitable [54]. The NPV estimationmodel has some shortcomings concerning the uncertainty and management’s flexibility to respond touncertainty during the whole life of the project [55]. Nevertheless, the NPV approach is widely used tomake investment decisions. The applied NPV is a before-interest benchmark. The debt in this case isdisregarded due to the uncertainty about the conditions and the amount of credit the potential investoris going to get.
The net present value (NPV) implies the difference between the present value of cash inflowsand the present value of cash outflows over a period of time. It does not represent the profit or lossthat can be generated during the project. The NPV simply indicates whether, within the investment,the desired MARR is achieved or not [56]. A negative NPV does not imply that there is a loss in theinvestment throughout the period of analysis. It indicates that the investment project is not generating

Sustainability 2019, 11, 4114 8 of 21
the expected profit. Therefore, the acceptance criteria for the NPV in investment projects are based onthe following: (1) NPV > 0 accepted; (2) NPV < 0 rejected.
3.1.2. Minimal Acceptable Rate of Return (MARR)
In order to carry out the financial analysis, the determination of a minimum acceptable rateof return (MARR) is required to provide a reference rate about the profitability of the investment.The MARR serves as a comparative base for the calculation of economic evaluations; if this rateof return is not obtained, the investment should be rejected and shall be defined as economicallyunviable. The MARR is defined by the investor and should consider the levels of inflation plus a riskpremium [57].
The risk premium was defined considering the following assumptions: the electricity demandin Mexico is stable; it shows few fluctuations and will increase in the following years. In addition,the renewable energy market in Mexico is new; therefore, there is no strong competition among powerplants. Based on the aforementioned, it is supposed that the investment risk is relatively low, and therisk premium can fluctuate between 2% and 5%. MARR is determined by the following formula:
MARR = Three times the inflation rate + Risk Premium (2)
The inflation rate is assumed to be 4.28%. Therefore, the MARR in this study makes up 14% [8].
3.1.3. Internal Rate of Return (IRR)
The annual profit in the project can be expressed as IRR. The IRR is the interest rate, which equatesthe future value of the investment [58]. The IRR is the discount rate, which makes the NPV equals tozero. The acceptance criteria are the following: IRR > MARR = accepted, IRR < MARR = rejected.
3.1.4. Payback Period
The payback period refers to the exact time when the initial investment is recovered. The methodfor the calculation of the payback period may vary according to the type of project.
However, a recurrent formula includes the following aspects:
PP = n +(I −CFA)
CFI(3)
where n is the immediate previous period in which the investment is recovered, I is the initialinvestment, CFA is the cash flow accumulated from the immediately previous period in which theinvestment is recovered, and CFI is the cash flow for the period in which the investment is recovered.
3.1.5. Input Categories
The calculation of project costs was based on literature sources [59,60]. The average capital costsand the operation and maintenance (O&M) costs are estimated based on typical project designs ofAD plants with similar characteristics operating in Europe, therefore, there may be variations whenapplying the analysis of a real case. The capital costs are estimated to be €31.2 million. Capital costsinclude civil works, electrical and mechanical installations, but do not include the following elements:taxes, planning, and design fees. No pasteurization stage for disinfection of the waste is applied in theproject due to the low percentage of the waste of animal origin, such as bones. It is assumed that thebiogas plant needs 2 ha of land for its construction. However, the price of land is not considered in theeconomic model due to the lack of data. For the calculation of personnel costs, a salary of €14,000 peryear [8] is considered. The lifetime of the project is expected to be 20 years, as in other studies [8,61].The economic assumptions have also been checked with the data provided by bwe EnergiesystemeGmbH, a German company with partners in Mexico. The input data for economic analysis is presentedin Table 1.
Sustainability 2019, 11, 4114 9 of 21
Table 1. Input data for economic analysis.
Costs Values
Investment Costs €31,200,000
Technology (Electrical Equipment, Gas equipment and Heatingequipment, Feeding technology and pre-treatment) €12,900,000
Evaporator €5,500,000CHP units €4,200,000Civil Engineering Works €4,900,000Reception building and air treatment €1,200,000Electrical connection €1,400,000Planning €400,000Legal, Insurance, and Consultants costs €200,000Other costs €500,000
Revenues
Price of electricity €0.06/kwhPrice of N2 in digestate €1.38/kg of N2Gate fee €10/Mg MSWSavings through shorter transportation distance €1,579,316.31/aPrice of transport €0.44/Mg/km
Other Parameters
Tax 25%Discount rate 14%CHP efficiency (electrical) 38%
The revenue budget refers to the estimation of the expected economic profits through the sales ofthe product or service. The income generated by the project included electricity generation, sale ofdigestate, and gate fee for waste treatment. Electricity generation from biogas is assumed to be realizedexclusively with CHP technology, proven to be an efficient option with huge market potential. Due tolack of heat demand, only the conversion of biogas to electricity is considered within this potentialassessment. However, the heat provided in CHP is used to a certain extend to heat up the organicmatter within the fermenter and for the evaporator.
The savings through shorter transport distance are considered to be the income source. The priceof the transport is supposed to be €0.44/Mg of MSW per km [62]. The average distance of the currentscenario where the waste from CEDA is delivered to a composting plant in Bordo Poniento and landfillsin Mexico State is 36.81 km, while the length between the CEDA and AD plant is 20 km.
The price for electricity considered in this research is €0.06/kwh, which is based on the localcommercial tariff High Demand in Medium Tension (GDMTH), as was done by Rios and Kaltschmitt [9].This study applies the average price from the period starting from January 2018 until June 2019. Also,the result of the official 3d CENACE public electricity auction which took place in 2017 could beconsidered. The price established at the end of the auction was €11.2 per MWh, however, it cannotbe applied for this study, given this price is only satisfactory for the big technology providers ofphotovoltaic parks and wind power plants, such as Enel Engie Solar, which participated in the 3dauction. Therefore, a higher price of €0.06/kwh is applied in this study. The price is stable during thelifetime of the AD plant; however, it is expected that it will increase.
The production of digestate is a source of income. The price of the bio-fertilizer was estimated byrelating the N content to the average selling price per Mg of N-fertilizer in the urea and ammoniumsulphate in Mexico; these prices were obtained from the Ministry of the Economy, at $1.55 USD/kg N(€1.38/kg) [63]. The gate fee is considered to be equal to the amount paid to the landfills, at €10/MgMSW [64].
To collect the required data of the waste management system, available official reports, legaldocuments, and scientific literature related to the MSW trends in Mexico City were studied.

Sustainability 2019, 11, 4114 10 of 21
3.2. Environmental Assessment
For the purpose of the analysis, the calculation of environmental impact was conducted withthe life cycle assessment (LCA) software EASEWASTE [65]. EASEWASTE is designed for LCA ofwaste management systems and facilitates a comprehensive environmental impact assessment bycalculating waste flows, resource consumption, and environmental emissions from individual wasteprocesses within the system. The model allows flexible definition of individual scenarios and includesdefault data needed for the LCA calculation. The model calculates emissions into water, air, and soil,along with the consumption of resources, and applies life-cycle impact assessment (LCIA) methodsfor conversion of these exchanges into environmental impacts [65]. Also, EASEWASTE considers thebiggest number of indicators compared to similar programmes [66].
The LCA model calculates the emissions from “cradle to grave”, from the point at which a materialis discarded into the waste stream to its final disposal. The system boundaries of LCA analysis arepresented in Figures 3 and 4. The functional unit of the study is 1 Mg of waste generated at CEDA.Scenario 1 involves direct landfilling of the residues (74%) and composting (26%). This representsa baseline option for waste management in Mexico City. The scenario includes construction andoperation of a landfill, leaching to water and soil, and leaking of landfill gas during the 100-year timehorizon. Scenario 2 represents an AD treatment of the waste. The scenario includes fugitive emissions,emissions from stationary engines, substitution of mineral fertilizer, and electricity. The data for bothscenarios is based on the EASETECH database.
Figure 3. System boundary of LCA of baseline scenario.
Figure 4. System boundary of LCA of AD scenario.
Energy derived from the AD system is regarded as a substitute for fossil fuel energy. Emissionsinto and alongside resource consumption, which would be avoided as a result of using a digester,are subtracted from the other emissions and resource consumptions in the waste system. Thecharacterized environmental impacts assessed in this paper followed the IPCC 2007 methodology. Thecalculations were made using the database of EASETECH from July 2017. All the processes were based

Sustainability 2019, 11, 4114 11 of 21
on the pre-modelled technologies existing in the database. The system boundaries are presented inFigures 1 and 2.
The program also evaluates emissions associated with the fuel consumption for collection andtransportation of waste. The distance for waste transportation was calculated using the free geographicinformation systems (GIS) software QGIS. Location of the landfills and the biggest composting facilityin Mexico City is presented in Figure 5. For the purpose of this analysis the following distances wereconsidered: from CEDA to landfills (36.81 km), and from CEDA to the AD plant (20 km). The emissionsfrom the transport of by-products of the compost (Baseline scenario) and of the digestate (AD scenario)are not considered. It is to be mentioned that the digestate is to be spread at the fields in Tláhuac,in the same borough where the AD plant is to be constructed. The exact destination of the compost isnot defined.
Figure 5. Location of the landfills and the composting facility Bordo Poniente and CEDA in Mexico City.
3.3. Composition Analysis
The analysis of waste composition was performed at the CEDA transfer station where the wastefrom the market is sent to. The samples were taken twice, in November 2017 and in February 2018.Five waste dump trucks were selected randomly. For the sample, five containers with a capacityof 200 L were collected. The composition analysis was performed according to the Mexican normNMX-AA-15-1985 [67]. The results of the composition analysis are presented in the next section.

Sustainability 2019, 11, 4114 12 of 21
3.4. Physicochemical Analysis
For the physicochemical analysis, the samples were ground to homogenize the components.Every experiment was performed 10 times to define mean values and standard deviations. The analysisincluded the following procedures: pH definition according to NMX-AA-25-1984 [68], water content(NMX-AA-016-1984) [69], organic matter (NOM-AA-21-1985) [70], ashes (NMX-AA-18-1984) [71],C/N ratio (NOM-AA-67-1985) [72], phosphorous (NMX-AA-32-1976) [73], and nitrogen (Micro-Kjeldahlmethod) [74].
3.5. Sensitivity Analysis
The Sensitivity Analysis procedure is based on previous work [61]. The analysis consists of a seriesof tables that show the effect of varying the most important input parameters (electricity price, gate fee,digestate price, investment costs, biogas yield, and efficiency degree of CHP) on the financial feasibilityindicators. The variation range for the parameters is 10%.
4. Results
4.1. Waste Composition
Table 2 presents the composition of the sample of the waste generated at Central de Abasto.The sample is almost purely organic and contamination does not exceed more than 1%. Therefore,this fraction is suitable for the AD process and does not need a pasteurization stage due to the lowpercentage of animal products.
Table 2. Waste composition of MSW from Central de Abasto.
Mean Value Standard Deviation
Waste Category Kg % Kg %
Broccoli and Radish 0.13 0.23% 0.1 0.001%Lettuce 0.77 0.01% 0.8 0.015%
Peas, Beans 1.11 0.02% 0.9 0.014%Nopal 0.11 0.002% 0.1 0.002%
Spinach 2.18 0.04% 1.8 0.027%Onion and Garlic 0.07 0.001% 0.05 0.001%
Tomato 10.09 0.18% 9.6 0.150%Carrot 0.13 0.002% 0.1 0.001%Herb 0.90 0.02% 0.9 0.017%Cane 0.13 0.002% 0.1 0.002%
Tangerine 1.10 0.02% 1.1 0.017%Mandarin 2.19 0.04% 0.3 0.002%
Orange 3.01 0.05% 0.2 0.001%Exotic Fruits: Avocado, Papaya,
Pineapple, Banana 1.05 0.02% 0.4 0.008%
Sweet Fruits: Apple, Grape 0.25 0.004% 0.1 0.002%Chili 0.11 0.002% 0.1 0.002%
Jicama 0.59 0.01% 0.6 0.011%Watermelon 2.96 0.05% 3.0 0.047%
Flowers in Good Condition 0.28 0.005% 0.3 0.005%Bones, Stems, Shells, Leaves 11.02 0.19% 2.7 0.027%
Residues of Edible Grass (Stems,Leaves, and Roots) 5.20 0.09% 5.2 0.101%
Residues of Nopal 7.46 0.13% 1.2 0.035%Residues of Corn 5.50 0.10% 4.7 0.093%
Wood, Plastics, Styrofoam, Paper 0.28 0.005% 0.0 0.001%Rest 0.78 0.01% 0.8 0.012%Total 57.36 100.00%
Sustainability 2019, 11, 4114 13 of 21
Table 3 shows the results of the physical-chemical characterization of the sample. In order to obtainrepresentative results, ten replicates were analyzed for each type of waste and the mean values werecalculated. These values correspond to the parameters needed for a stable AD process, as mentionedin other studies [75,76].
Table 3. Characteristics of MSW from Central de Abasto.
Parameter Mean Value Standard Deviation
pH 4.03 0.06Water content (%) 80.9 1.34
Dry matter (DM) (%) 19.1 Calculated, based on water contentOrganic DM (%) 17.34 Calculated, based on previous work [44]
Ash (%) 7.96 0.25Nitrogen (%) of DM 1.39 0.22
C/N ratio 39.01 5.55Phosphorous (ppm) 120.94 22.33
4.2. Economic Analysis
4.2.1. Quantification of Energy Generation
The economic analysis of the project is based on the estimation of the biogas generation fromthe substrate presented in Table 2. According to the study of German Corporation for InternationalCooperation (GIZ) in Mexico, the values of the theoretical potential biogas generated in cubic metersper Mg of MSW from the studied wholesale markets is 634 m3/Mg DM of MSW. This varies dependingon factors such as climate conditions, type of waste, microbial activity, dry matter content, and thecomposition of the waste. For the purpose of the present analysis, the model relates to information fromthe GIZ. These results match the outcomes of the previous research in Mexico City [76,77]. Therefore,these values were used to calculate the energy generation in this case study. Considering the amountof waste generated in CEDA, the modeling resulted in an estimation of biogas, including expectedgeneration, as shown in Table 4.
Table 4. Energy generation of the project.
Origin ofMSW
Biogas Yield(m3/Mg ofOFMSW)
ElectricityGeneration(kWhel/Mg)
MSWGeneration
(Mg/a)
ElectricityGeneration
(kWh/a)
InstalledCapacity(kWel)
CEDA 111.34 253.86 213,525 54,205,309.57 6776
4.2.2. Quantification of Costs and Revenues
The cost structure is described in order to provide detailed information related to the expectedexpenses. The investment costs include construction works, all equipment required, and a spare partspackage in case of necessary repairs. The equipment is specified according to the project size andexpected energy generation. Running costs include O&M.
The revenues and expenditures are presented in Table 5. The total installed capital cost is€34,200,000. The cash flow output considers total estimations of O&M costs during the operating yearsand the cashflow input shows the revenues. Finally, the estimated net incomes and cash flows of theproject are shown. The total installed capital cost is high; therefore, the project starts to generate profitsonly after 7 years of operation. The cash flow can be found in the Supplementary Materials.
Sustainability 2019, 11, 4114 14 of 21
Table 5. Annual revenues and expenditures.
Revenues (Figures in 1000 of €) €/a (Figures in 1000 of €)
Sale of Electricity 3088Sale of compost 782
Gate fee 2135Savings from transport costs 1579
Expenditures
Maintenance cost (without engines) 312Maintenance cost (engines) 170
Engine (major overhaul) 400 every 7th yearSelf-consumption of electricity 434
Insurance 156Disposal of contamination at landfill 137
Sulfur acid consumption 95Personnel costs 84
Transport from digestate 75Analysis of substrate 6
Other expenses 312
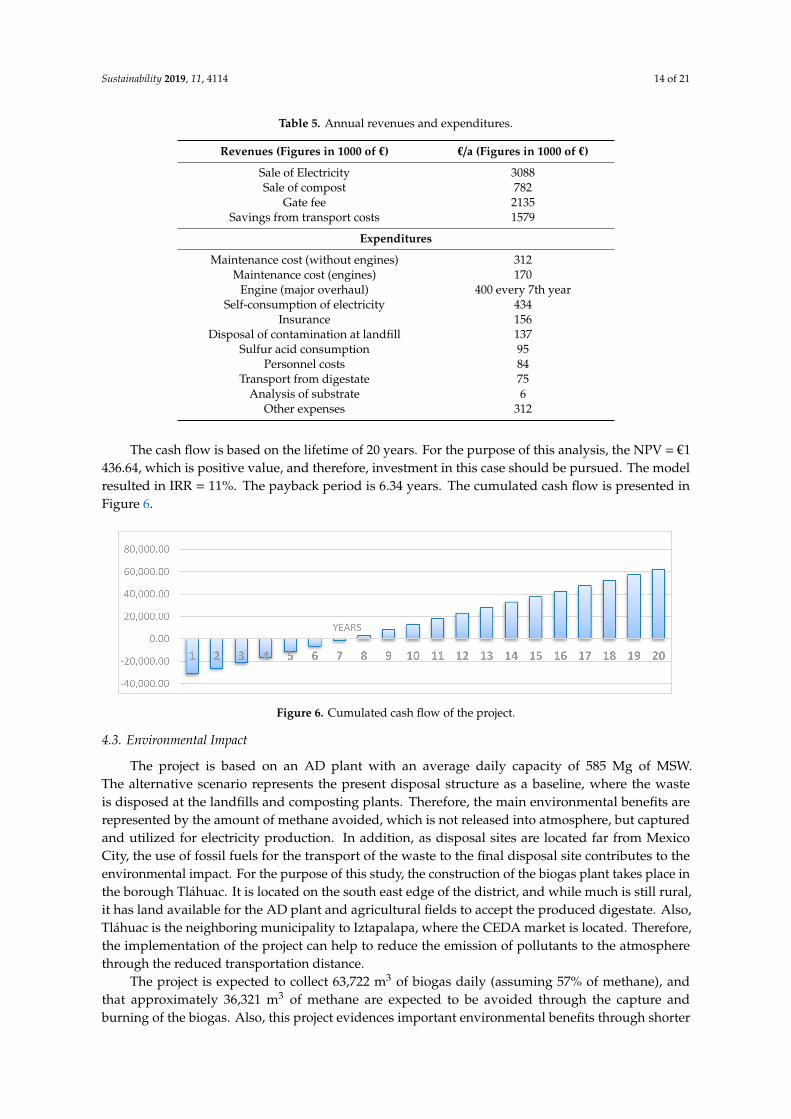
The cash flow is based on the lifetime of 20 years. For the purpose of this analysis, the NPV = €1436.64, which is positive value, and therefore, investment in this case should be pursued. The modelresulted in IRR = 11%. The payback period is 6.34 years. The cumulated cash flow is presented inFigure 6.
Figure 6. Cumulated cash flow of the project.
4.3. Environmental Impact
The project is based on an AD plant with an average daily capacity of 585 Mg of MSW.The alternative scenario represents the present disposal structure as a baseline, where the wasteis disposed at the landfills and composting plants. Therefore, the main environmental benefits arerepresented by the amount of methane avoided, which is not released into atmosphere, but capturedand utilized for electricity production. In addition, as disposal sites are located far from MexicoCity, the use of fossil fuels for the transport of the waste to the final disposal site contributes to theenvironmental impact. For the purpose of this study, the construction of the biogas plant takes place inthe borough Tláhuac. It is located on the south east edge of the district, and while much is still rural,it has land available for the AD plant and agricultural fields to accept the produced digestate. Also,Tláhuac is the neighboring municipality to Iztapalapa, where the CEDA market is located. Therefore,the implementation of the project can help to reduce the emission of pollutants to the atmospherethrough the reduced transportation distance.
The project is expected to collect 63,722 m3 of biogas daily (assuming 57% of methane), andthat approximately 36,321 m3 of methane are expected to be avoided through the capture andburning of the biogas. Also, this project evidences important environmental benefits through shorter
Sustainability 2019, 11, 4114 15 of 21
transportation distance of 0.527 kg CO2 eq per Mg of MSW based on the calculations of Easetechdatabase. The emissions (kg CO2 per Mg) per process are presented in Table 6. The major impact inthe baseline scenario is made by degradation of organic waste in landfills. The low emission level ofthe AD scenario is explained through the shorter distance for transportation of MSW, avoidance ofdecay of organics in landfills, and emission offset through substitution of grid electricity. Overall, theconstruction and operation of the AD plant can help to reduce the environmental impact by 730 kgCO2 per Mg of MSW.
Table 6. LCA Results.
Baseline Scenario kg CO2-Eq/Mg MSW AD kg CO2-Eq/Mg MSW
Composting 16.26 AD 2.91Landfill 716.03 Transport of MSW 1.10Transport of MSW 2.12
Sum 734.42 Sum 4.01
4.4. Employment
The project is expected to generate six job positions for staff responsible for operating andsupervising the plant [62].
4.5. Sensitivity Analysis
The sensitivity analysis was performed considering the following parameters: electricity price,gate fee, digestate price, investment costs, biogas yield, and efficiency degree of CHP with a variationrange of 10%. According to the results, the project is sensitive to the change of electricity price. With thedecrease of electricity price and CHP efficiency, as well as with the rise of investment costs, the NPVbecomes negative (Table 7). The files can be found in the Supplementary Materials.
Table 7. Parameters for Sensitivity Analysis.
Parameter Variation NPV
Electricity Price +10% 2689.21−10% −295.73
Gate Fee+10% 2451.69−10% 330.39
Digestate Price +10% 1779.64−10% 1002.44
Investment Costs+10% −1657.53−10% 4530.81
Biogas Yield +10% 2797.08−10% 67.82
Efficiency Degree of CHP +10% 2801.69−10% −1045.26
5. Discussion
Based on the results of the feasibility study, the barriers for the application of anaerobic digestion forMSW in Mexico can be summarized and divided into administrative, economic, and market-related [78].Among administrative barriers in Mexico are the following: bureaucracy (including difficulty inobtaining permission), instability of policies, discontinuity of support measures, and lack of publicacceptance of the technology. The process of application and authorization is complicated and mayneed years to complete. This may lead investors to lose interest, in view of the significant upfrontexpenses and faraway returns, slowing down the development of the entire sector. Also, a change of

Sustainability 2019, 11, 4114 16 of 21
government may affect the implementation of infrastructure projects, as happened with the incinerationplant which got delayed for an undefined time. Another issue concerns the failure of the government toperform the efficient source-separation and separate collection of MSW. Therefore, organic substrateswith low contamination suitable for the AD process would be missing.
The second category includes the need for large investment, lack of long-term perspective,low profitability through sales of electricity, no use for generated heat, limited investment resourcesdue to possible economic recession, and costs of transportation. Financing is frequently mentionedas a problem for the implementation of biogas projects in many countries [26]. Even in Germany,which has a well-developed internal biogas market, some biogas facilities suffer from lack of long-termperspective [79]. Financing is also the biggest barrier for the development of AD technology for wastetreatment, as can be observed in the previous section due to the negative NPV value.
Market-related barriers are presented for the use of biogas, since biogas is part of a regulatorysystem for renewable energies (together with solar, hydro, and geothermal); this results in a functionalorientation toward maximizing electricity production within biogas facilities. Heat-only productionand injection into the gas grid have been largely ignored by incentive schemes. Biogas can be used forother purposes than the production of electricity alone, such as district heating and transportation,in which its use is more efficient and sustainable in terms of energy and environment. In addition,biogas has the ability to be stored for later use. Since producers have no incentive to use the heatproduced, aside from self-consumption, no infrastructure for its exploitation is created and heat excessis released into the atmosphere. The upgrade to biomethane to be injected into the natural gas networkshould also be considered. This praxis has grown in European countries in the last years. Biomethanecan be also applied in the transportation sector. In Mexico, transportation is the sector with the highestenergy consumption—2362 PJ per annum and 46% of the total energy consumption in 2017 [80]. In lightof these considerations, an overall reorganization of incentives is generally needed regarding theoverall recovery of energy and of all other by-products from each project, as well as diversification offinal uses for the biogas [81].
Another market-related barrier refers to the absence of the high demand for the substrate asorganic fertilizer. Most farmers display a “more-is-better” preference [82], in which over-fertilizationleads to eutrophication of water bodies [83]. An educational concept could help gardeners and farmersdevelop practices which are both more ecologically sound and personally more satisfying. Positioningdigestate-based fertilizers as environmentally friendly may create a market and prevent the negativeenvironmental impact of overfertilization.
6. Study Limitations
The composition analysis was performed twice, which explains high standard deviation.For further research it is recommended to take more samples for the analysis.
Calculations of the economic modelling are based on the current prices and future fluctuations,for example, for maintenance costs and the increase of electricity, price was not considered.This approach was also used in previous work [84]. Also, no capital and property costs wereconsidered due to the lack of data.
In LCA the emissions from transportation of digestate and compost to final disposal is notconsidered. Due to the lack of field data, LCA is performed based on the database of EASETECH.
7. Conclusions
In Mexico City there is available stock for anaerobic digestion—the residues from the Centralde Abasto, which are predominantly organic. Energy generation by biogas from this fraction hasbe proven, in the terms of this study, to be a financially feasible option. However, an attractivepanorama for clean energy was not evidenced. The project has to cope with several barriers, such asadministrative, market-related, and economic, given low production of energy through biogas inMexico. The financial indicators, including NPV, IRR, and payback period, prove the profitability of

Sustainability 2019, 11, 4114 17 of 21
the investment, therefore, the project was evidenced as economically feasible. However, the resultsare not stable and change with the decrease of electricity price and CHP efficiency or increase ofinvestment costs.
The analysis also evidenced positive environmental impacts due to the decrease of methanereleased in the atmosphere. Therefore, incentives from the government are needed to promote the ADtechnology. The development of new alternatives for waste treatments, such as biogas plants, can leadto an integrated waste management system in Mexico, where waste is incorporated in a virtuous circle.
Supplementary Materials: The following are available online at http://www.mdpi.com/2071-1050/11/15/4114/s1.
Author Contributions: This research work was allocated in the following way. Conceptualization, N.T. andA.V.M.; methodology, N.T., A.V.M., A.M.H., and D.R.S.; software, N.T.; validation, C.W. and A.P.; formal analysis,A.M.H. and D.R.S.; investigation, N.T.; writing—original draft preparation, N.T.; writing—review and editing,A.V.M., C.W., and A.P.; visualization, N.T.; supervision, A.V.M. and A.M.H.; project administration, N.T.; fundingacquisition, N.T.
Funding: The first author received financial support for the conduct of this study from Konrad Adenauer Foundation.
Conflicts of Interest: The authors declare no conflict of interest.
References
1. Makarichi, L.; Kan, R.; Jutidamrongphan, W.; Techato, K. Suitability of municipal solid waste in Africancities for thermochemical waste-to-energy conversion: The case of Harare Metropolitan City, Zimbabwe.Waste Manag. Res. 2019, 37, 83–94. [CrossRef] [PubMed]
2. Amsterdam, H.; Thopil, G.A. Enablers towards establishing and growing South Africa’s waste to electricityindustry. Waste Manag. 2017, 68, 774–785. [CrossRef] [PubMed]
3. Masood, M.; Barlow, C.Y.; Wilson, D.C. An assessment of the current municipal solid waste managementsystem in Lahore, Pakistan. Waste Manag. Res. 2014, 32, 834–847. [CrossRef] [PubMed]
4. Malinauskaite, J.; Jouhara, H.; Czajczynska, D.; Stanchev, P.; Katsou, E.; Rostkowski, P.; Thorne, R.; Colóon, J.;Ponsá, S.; Al-Mansour, F.; et al. Municipal Solid Waste Management and Waste-to-Energy in the Context ofa Circular Economy and Energy Recycling in Europe. Energy 2013, 141, 2013–2044. [CrossRef]
5. Mutz, D.; Hengevoss, D.; Hugi, C.; Gross, T. Waste-to-Energy Options in Municipal Solid Waste Management.2017. Available online: https://www.giz.de/en/downloads/GIZ_WasteToEnergy_Guidelines_2017.pdf(accessed on 5 May 2019).
6. Cuenca, A. Tenemos Los Argumentos Para Mantener Cancelada la Planta Termovalorizadora, AseguraSheinbaum, 2019. Available online: https://capital-cdmx.org/nota-Tenemos-los-argumentos-para-mantener-cancelada-la-planta-termovalorizadora---asegura-Sheinbaum20196254 (accessed on 23 February 2019).
7. Kaza, S.; Yao, L.C.; Bhada-Tata, P.; Van Woerden, F. What a Waste 2.0: A Global Snapshot of Solid WasteManagement to 2050; Urban Development; World Bank: Washington, DC, USA, 2018. Available online:https://openknowledge.worldbank.org/handle/10986/30317 (accessed on 5 May 2019).
8. Escamilla García, P.E.; Tavera Cortés, M.E.; Sandoval Gómez, R.J.; Salinas Callejas, E.; Alvarado Raya, H.E.Economic feasibility analysis for electrical generation from biogas in waste disposal sites in Mexico City.Appl. Econ. 2016, 48, 5761–5771. [CrossRef]
9. Rios, M.; Kaltschmitt, M. Electricity generation potential from biogas produced from organic waste in Mexico.Renew. Sustain. Energy Rev. 2016, 54, 384–395. [CrossRef]
10. De Medina-Salas, L.; Castillo-González, E.; Giraldi-Díaz, M.R.; Jamed-Boza, L.O. Valorisation of the organicfraction of municipal solid waste. Waste Manag. Res. 2019, 37, 59–73. [CrossRef]
11. Alstone, P.; Gershenson, D.; Kammen, D.M. Decentralized energy systems for clean electricity access.Nat. Clim. Chang. 2015, 5, 305–314. [CrossRef]
12. Goldemberg, J.; Johansson, T.B.; Reddy, A.K.; Williams, R.H. Basic needs and much more with one kilowattper capita. Ambio 1985, 14, 190–200.
13. Alemán-Nava, G.S.; Casiano-Flores, V.H.; Cárdenas-Chávez, D.L.; Díaz-Chavez, R.; Scarlat, N.; Mahlknecht, J.;Dallemand, J.F.; Parra, R. Renewable energy research progress in Mexico: A review. Renew. Sustain. EnergyRev. 2014, 32, 140–153. [CrossRef]

Sustainability 2019, 11, 4114 18 of 21
14. Pérez-Denicia, E.; Fernández-Luqueño, F.; Vilariño-Ayala, D.; Montaño-Zetina, L.M.; Maldonado-López, L.A.Renewable energy sources for electricity generation in Mexico: A review. Renew. Sustain. Energy Rev. 2017,78, 597–613. [CrossRef]
15. Secretaría de Energía (SENER). Balance Nacional de Energía 2014. SENER: Mexico, 2015. Available online:http://www.gob.mx/cms/uploads/attachment/file/44353/Balance_Nacional_de_Energ_a_2014.pdf (accessedon 15 January 2019).
16. Grande-Acosta, G.; Islas-Samperio, J. Towards a low-carbon electric power system in Mexico. Energy Sustain.Dev. 2017, 37, 99–109. [CrossRef]
17. Surendra, K.C.; Takara, D.; Hashimoto, A.G.; Khanal, S.K. Biogas as a sustainable energy source for developingcountries: Opportunities and challenges. Renew. Sustain. Energy Rev. 2014, 31, 846–859. [CrossRef]
18. SENER. Programa Especial de la Transición Energética 2017–2018. 2017. Available online: http://www.gob.mx/cms/uploads/attachment/file/213322/PETE.pdf (accessed on 5 May 2019).
19. Alvarez, J.; Valencia, F. IMF Working paper. Made in Mexico: Energy Reform and Manufacturing Growth.2015. Available online: https://www.imf.org/external/pubs/ft/wp/2015/wp1545.pdf (accessed on 5 May 2019).
20. Moshiri, S.; Martinez Santillan, M.A. The welfare effects of energy price changes due to energy market reformin Mexico. Energy Policy 2018, 113, 663–672. [CrossRef]
21. Brown, M. Analysis of Mexico’s New Electric Industry Law. 2014. Available online: https://www.mayerbrown.com/-/media/files/perspectives-events/publications/2014/08/analysis-of-mexicos-new-electric-industry-law/files/get-the-full-report/fileattachment/update-analysiselectricitylaw_0814.pdf (accessed on5 May 2019).
22. The Dialogue. Leadership for the Americas. Mexico’s Problematic Energy Policy. 2019. Available online:https://www.thedialogue.org/analysis/mexicos-problematic-energy-policy/ (accessed on 29 July 2019).
23. Forbes. Political Risk Analysis: Mexico’s Problematic Energy Policy. 2019. Available online:https://www.forbes.com/sites/nathanielparishflannery/2019/06/07/political-risk-analysis-mexicos-problematic-energy-policy/#59cf972b2386 (accessed on 29 July 2019).
24. Koch, H.J.; Foth, H.; Faulstich, M.; von Haaren, C.; Jänicke, M.; Michaelis, P.; Ott, K. Angebot an Biomassezur Energetischen Nutzung. In Klimaschutz durch Biomasse; Sachverständigenrat für Umweltfragen: Berlin,Germany, 2007; pp. 22–23. Available online: http://www.umweltrat.de/SharedDocs/Downloads/DE/02_Sondergutachten/2007_SG_Biomasse_Buch.pdf?__blob=publicationFile (accessed on 5 May 2019).
25. Knappe, F.; Böß, A.; Fehrenbach, H.; Giegrich, J.; Vogt, R.; Dehoust, G.; Schüler, D.; Wiegmann, K.; Fritsche, U.Stoffstrommanagement von Biomasseabfällen mit dem Ziel der Optimierung der Verwertung organischer Abfälle;Umweltbundesamt: Berlin, Germany, 2007; pp. 100-112; 174-189.
26. Capodaglio, A.G.; Callegari, A.; Lopez, M.V. European Framework for the Diffusion of Biogas Uses: EmergingTechnologies, Acceptance, Incentive Strategies, and Institutional-Regulatory Support. Sustainability 2016, 8,298. [CrossRef]
27. Fachagentur Nachwachsende Rohstoffe. Guide to Biogas: From Production to Use. 2010. Available online:https://mediathek.fnr.de/media/downloadable/files/samples/g/u/guide_biogas_engl_2012.pdf (accessed on12 July 2019).
28. Ranieri, L.; Mossa, G.; Pellegrino, R.; Digiesi, S. Energy Recovery from the Organic Fraction of MunicipalSolid Waste: A Real Options-Based Facility Assessment. Sustainability 2018, 10, 368. [CrossRef]
29. Tyagia, V.K.; Fdez-Güelfoc, L.A.; Zhoud, Y.; Álvarez-Gallegof, C.J.; Romero Garciaf, L.I.; Jern Nga, W.Anaerobic co-digestion of organic fraction of municipal solid waste (OFMSW): Progress and challenges.Renew. Sustain. Energy Rev. 2018, 93, 380–399. [CrossRef]
30. Zakir, H.M.; Hasna, H.Q.; Uddin, M.; Ahmed, T. Municipal solid waste (MSW) as a source of renewableenergy in Bangladesh: Revisited. Renew. Sustain. Energy Rev. 2014, 39, 35–41. [CrossRef]
31. Sathish, S.; Chandrasekaran, M.; Parthiban, A. Effect of co-digestion agricultural-industrial residues: Variousslurry temperatures. Int. J. Ambient Energy 2017, 39, 694–697. [CrossRef]
32. Das, A.; Mondal, C. Biogas production from Co-digestion of substrates: A Review. Int. Res. J. Environ. Sci.2016, 5, 49–57.
33. Pavi, S.; Kramer, L.E.; Gomes, L.P.; Miranda, S. Biogas production from co-digestion of organic fraction ofmunicipal solid waste and fruit and vegetable waste. Bioresour. Technol. 2017, 228, 362–367. [CrossRef][PubMed]
Sustainability 2019, 11, 4114 19 of 21
34. Ragazzi, M.; Maniscalco, M.; Toretta, V.; Ferronato, N.; Rada, E.C. Anaerobic digestion as sustainable sourceof energy: A dynamic approach for improving the recovery of organic waste. Energy Procedia 2017, 119,602–614. [CrossRef]
35. De la Rubia, M.A.; Walker, M.; Heaven, S.; Banks, C.J.; Borja, R. Preliminary trials of in situ ammoniastripping from source segregated domestic food waste digestate using biogas: Effect of temperature andflow rate. Bioresour. Technol. 2010, 101, 9486–9492. [CrossRef]
36. Wellmer, F.W.; Scholz, R.W. The Right to Know the Geopotential of Minerals for Ensuring Food SupplySecurity: The Case of Phosphorus. J. Ind. Ecol. 2015, 19, 3–6. [CrossRef]
37. Hasler, K.; Bröring, S.; Omta, S.; Olfs, H.W. Life cycle assessment (LCA) of different fertilizer product types.Eur. J. Agron. 2015, 69, 41–51. [CrossRef]
38. Walan, P.; Davidsson, S.; Johansson, S.; Höök, M. Phosphate rock production and depletion: Regionaldisaggregated modeling and global implications. Resour. Conserv. Recycl. 2014, 93, 178–187. [CrossRef]
39. INEGI. Encuesta Intercensal. 2015. Available online: http://www.inegi.org.mx/est/contenidos/proyectos/encuestas/hogares/especiales/ei2015/doc/eic_2015_presentacion.pdf (accessed on 5 March 2019).
40. SEDEMA. Inventario de Residuos Sólidos. Ciudad de México. 2017. Available online: https://www.sedema.cdmx.gob.mx/storage/app/media/IRS_2017_FINAL_BAJA.pdf (accessed on 5 March 2019).
41. Schneider, P.; Anh, L.H.; Wagner, J.; Reichenbach, J.; Hebner, A. Solid Waste Management in Ho Chi MinhCity, Vietnam: Moving towards a Circular Economy? Sustainability 2017, 9, 286. [CrossRef]
42. SEDEMA. Norma Ambiental Para el Distrito Federal NADF-024-AMBT-2013, que Establece los Criteriosy Especificaciones Técnicas bajo los Cuales se Deberá Realizar la Separación, Clasificación, RecolecciónSelectiva y Almacenamiento de los Residuos del Distrito federal. 2013. Available online: http://data.sedema.cdmx.gob.mx/nadf24/images/infografias/NADF-024-AMBT-2013.pdf (accessed on 5 March 2019).
43. BNAmericas. Ciudad de México Adjudica Contrato por Planta de Termovalorización, 2017. Availableonline: http://www.bnamericas.com/es/noticias/aguasyresiduos/ciudad-de-mexico-adjudica-contrato-por-planta-de-termovalorizacion1/ (accessed on 5 March 2019).
44. Chan Gutiérrez, E.; Wall, D.M.; O’Shea, R.; Méndez Novelo, R.; Moreno Gómez, M.; Murphy, J.D. An economicand carbon analysis of biomethane production from food waste to be used as a transport fuel in Mexico.J. Clean. Prod. 2018, 196, 852–862. [CrossRef]
45. Weber, B.; Oropeza, M.R.; Torres, M.; Pampillon, L. Produccion de Biogas en Mexico: Estado Actual y Perspectivas.Red Mex. Bioenergía. 2012. Available online: https://sswm.info/sites/default/files/reference_attachments/WEBER%20et%20al%202012.%20Producci%C3%B3n%20de%20biog%C3%A1s%20en%20M%C3%A9xico.pdf(accessed on 5 May 2019).
46. Capron, G.; Gonzalez Arellano, S.; Wigle, J.; Diez, A.; Monterrubio, A.; Hidalgo, H.; Morales, J.; Castro, J.;Sánchez-Mejorada, C.; Huarte, T.; et al. The Urban Food System of Mexico City, Mexico; rep., pp. i-50,Hungry Cities Report, No. 7; Hungry Cities Partnership: Waterloo, ON, Canada, 2017. Available online:https://scholars.wlu.ca/cgi/viewcontent.cgi?article=1020&context=hcp (accessed on 5 March 2019).
47. Losada Custardoy, H.R.; Luna Rodríguez, L.; Cortés Zorrilla, J.; Vargas Romero, J.M. The Use of Organic Wastefrom Animals and Plants as Important Input to Urban. Int. J. Appl. Sci. Technol. 2015, 5, 38–44. Availableonline: http://www.ijastnet.com/journals/Vol_5_No_1_February_2015/5.pdf (accessed on 5 May 2019).
48. Di Maria, F.; Barratta, M.; Bianconi, F.; Placidi, P.; Passeri, D. Solid anaerobic digestion batch with liquiddigestate recirculation and wet anaerobic digestion of organic waste: Comparison of system performancesand identification of microbial guilds. Waste Manag. 2017, 59, 172–180. [CrossRef]
49. GIZ. Estudio de Digestión Anaeróbica Seca y Húmeda en Planta Piloto, Para Determinar el Potencial deProducción de Biogás a Partir de Residuos Orgánicos Generados en el Municipio de Naucalpan de Juárez. 2019.Available online: https://www.giz.de/de/downloads/ENRES%20Estudio_determinar_potencial_producc_biogas_env_2.pdf (accessed on 31 May 2019).
50. Boardman, A.; Greenberg, D.; Vining, A. Cost Benefit Analysis—Concepts and Practice, 3rd ed.; PearsonEducation Inc.: Upper Saddle River, NJ, USA, 2006.
51. Berber, H.; Frey, R.; Voronova, V.; Koroljova, A. A Feasibility Study of Municipal Solid Waste Incineration FlyAsh Utilisation in Estonia. Waste Manag. Res. 2017, 35, 904–912. [CrossRef]
52. Bajkowski, J. The Basics of Cash-Flow Analysis in the Stock Selection Process, in The American Associationof Individual Investors August 1996; pp. 17–20. Available online: https://www.aaii.com/files/journal/pdf/7020_the-basics-of-cash-flow-analysis-in-the-stock-selection-process.pdf (accessed on 5 May 2019).
Sustainability 2019, 11, 4114 20 of 21
53. Grant, Th. IAS 7: Statement of Cash Flows—A Guide to Avoiding Common Pitfalls and Application Issues.Available online: http://www.gti.org/files/ias_7_guide.pdf (accessed on 5 May 2019).
54. Baker, S.L. Perils of the Internal Rate of Return, 2000. Available online: http://concretebasics.org/
economicsbasics/perils-of-internal-rate-of-return/‎ (accessed on 5 May 2019).55. Gilbert, E. Capital budgeting: A case study analysis of the role of formal evaluation techniques in the
decision-making process. S. Afr. J. Account. Res. 2005, 19, 19–36. [CrossRef]56. Meehan, J.; Simonetto, M.; Montan, L.; Godin, C. Pricing and Profitability Management: A Practical Guide for
Business Leaders, 1st ed.; John Wiley & Sons: Hoboken, NJ, USA, 2011.57. Wilson, R.; Gilligan, C. Strategic Marketing Management: Planning, Implementation and Control, 3rd ed.;
Routledge: Oxford, UK, 2004.58. Lester, A. Project Management, Planning and Control: Managing Engineering, Construction and Manufacturing
Projects to PMI, APM and BSI Standards, 6th ed.; Butterworth-Heinemann: Oxford, UK, 2013.59. Tsilemou, K.; Panagiotakopoulos, D. Approximate cost functions for solid waste. Waste Manag. Res. 2006, 24,
310–322. [CrossRef] [PubMed]60. Wojciech, M.; Budzianowski, D.; Budzianowska, A. Economic analysis of biomethane and bioelectricity
generation from biogas using different support schemes and plant configurations. Energy 2015, 88, 658–666.61. Huiru, Z.; Yunjun, Y.; Liberti, F.; Pietro, B.; Fantozzi, F. Technical and economic feasibility analysis of an
anaerobic digestion plant fed with canteen food waste. Energy Convers. Manag. 2019, 180, 938–948. [CrossRef]62. Personal data by company bwe Energiesystem GmbH received through interviews. Available online:
https://www.bwe-energie.de/start/ (accessed on 30 May 2019).63. Rivas-Garcíaa, P.; Botello-Álvarez, J.E.; Abel Seabrac, J.E.; da Silva Walter, A.C.; Estrada-Baltazara, A.
Environmental implications of anaerobic digestion for manure management in dairy farms in Mexico: A lifecycle perspective. Environ. Technol. 2015, 36, 2198–2209. [CrossRef] [PubMed]
64. Contract between Mexico City and the Landfill El Milagro. 2016. Available online: http://www.data.obras.cdmx.gob.mx/wp-content/uploads/2016/11/PS-AD-008-1.pdf (accessed on 5 May 2019).
65. Kirkeby, J.T.; Birgisdottir, H.; Hansen, T.L.; Christensen, T.H.; Bhander, G.S.; Hauschild, M. Environmentalassessment of solid waste systems and technologies: EASEWASTE. Waste Manag. Res. 2006, 24, 3–15.[CrossRef] [PubMed]
66. Blikra Vea, E.; Martinez-Sanchez, V.; Thomsen, M. A Review of Waste Management Decision Support Toolsand Their Ability to Assess Circular Biowaste Management Systems. Sustainability 2018, 10, 3720. [CrossRef]
67. Secretaría de Comercio y Fomento Industrial. Mexican Norm NMX-AA-15-1985. EnvironmentalProtection-Soil Pollution-Solid Residues-Quarter Method, 1985. Available online: http://legismex.mty.itesm.mx/normas/aa/aa015.pdf (accessed on 12 July 2019).
68. Secretaría de Comercio y Fomento Industrial. Mexican Norm NMX-AA-025-1984. EnvironmentalProtection-Soil Contamination-Solid Residues-pH Determination-Potentiometric Method, 1984. Availableonline: http://legismex.mty.itesm.mx/normas/aa/aa025.pdf (accessed on 12 July 2019).
69. Secretaría de Comercio y Fomento Industrial. Mexican Norm NMX-AA-016-1984. EnvironmentalProtection-Soil Contamination-Solid Residues-Determination of Water Content, 1984. Available online:http://legismex.mty.itesm.mx/normas/aa/aa016.pdf (accessed on 12 July 2019).
70. Secretaría de Comercio y Fomento Industrial. Mexican Norm NOM-AA-21-1984. EnvironmentalProtection-Soil Contamination-Solid Residues-Determination of Organic Matter, 1985. Available online:http://legismex.mty.itesm.mx/normas/aa/aa021.pdf (accessed on 12 July 2019).
71. Secretaría de Comercio y Fomento Industrial. Mexican Norm NMX-AA-018-1984. EnvironmentalProtection-Soil Pollution-Solid Residues-Ashes Determination, 1984. Available online: http://legismex.mty.itesm.mx/normas/aa/aa018.pdf (accessed on 12 July 2019).
72. Secretaría de Comercio y Fomento Industrial. Mexican Norm NOM-AA-67-1985. EnvironmentalProtection-Soil Pollution-Solid Residues-Determination of C/N Ratio, 1985. Available online: http://legismex.mty.itesm.mx/normas/aa/aa067.pdf (accessed on 12 July 2019).
73. Secretaría de Comercio y Fomento Industrial. Mexican Norm NMX-AA-32-1976. Solid Residues-Determination of phosphorous, 1976. Available online: http://legismex.mty.itesm.mx/normas/aa/aa032.pdf(accessed on 12 July 2019).
Sustainability 2019, 11, 4114 21 of 21
74. Fernandez, L.C.; Rojas, N.G.; Roldan Carillo, T.G.; Ramirez, M.E.; Zegarra, H.G.; Uribe, R.; Reyes, R.J.;Hernandez, D.; Arce, J.M. Manual de Técnicas de Análisis Aplicadas a la Remediación de Sitios Contaminados;Instituto Mexicano del Petróleo: Mexico City, Mexico, 2006.
75. Cecchi, F.; Pavan, P.; Bolzonella, D.; Mace, S.; Mata-Alvarez, J. Anaerobic digestion of the organic fraction ofmunicipal solid waste for methane production: Research and industrial application. Compr. Biotechnol. 2011,463–472. [CrossRef]
76. Campuzano, R.; González-Martínez, S. Characteristics of the organic fraction of municipal solid waste andmethane production: A review. Waste Manag. 2016, 54, 3–12. [CrossRef]
77. González-Miranda, U.; González-Martínez, S.; Campuzano, R. Methane production from organic solid wastecomponents. In Proceedings of the Sixth International Symposium on Energy from Biomass and Waste,Venice, Italy, 14–17 November 2016.
78. McCormick, K.; Kaberger, T. Key barriers for bioenergy in Europe: Economic conditions, know-how andinstitutional capacity, and supply chain co-ordination. Biomass Bioenergy 2007, 31, 443–452. [CrossRef]
79. Walter, G.; Gutscher, H. Public Acceptance of Wind Energy and Bioenergy Projects in the Framework of Distributiveand Procedural Justice Theories: Insights from Germany, Austria and Switzerland; Advisory House AG; Universityof Zurich: Zurich, Switzerland, 2010.
80. Mediavilla Merchan, V. Technical Potential for Biogas Production and Greenhouse Gas Mitigation from theAnaerobic Digestion of Municipal Solid Waste. 2018. Available online: https://www.giz.de/en/downloads/giz2017-en-waste-to-energy.pdf (accessed on 5 May 2019).
81. Gold, S.; Seuring, S. Supply chain and logistics issues of bio-energy production. J. Clean. Prod. 2011, 19,32–42. [CrossRef]
82. Dahlin, J.; Halbherr, V.; Kurz, P.; Nelles, M.; Herbes, C. Marketing Green Fertilizers: Insights into ConsumerPreferences. Sustainability 2016, 8, 1169. [CrossRef]
83. Ulrich, A.E.; Malley, D.F.; Watts, P.D. LakeWinnipeg Basin: Advocacy, challenges and progress for sustainablephosphorus and eutrophication control. Sci. Total Environ. 2016, 542, 1030–1039. [CrossRef] [PubMed]
84. Köttner, M.; Kusch, S.; Kaiser, A.; Dörrie, D. Economic Modelling of Anaerobic Digestion/Biogas Installationsin a Range of Rural Scenarios in Cornwall; A Report to the Cornwall Agri-food Council by the InternationalBiogas and Bioenergy Centre of Competence and the Renewable Energy Association; International Biogasand Bioenergy Centre: Cornwall, UK, 2008.
© 2019 by the authors. Licensee MDPI, Basel, Switzerland. This article is an open accessarticle distributed under the terms and conditions of the Creative Commons Attribution(CC BY) license (http://creativecommons.org/licenses/by/4.0/).
Copyright © 2022 FDOKUMEN