Understanding the factors affecting e-business adoption and impact on logistics processes
Upload
khangminh22Category
view
2download
0
Understanding the Digestion and Health Impact
of Mycoprotein Based Products
Raffaele Colosimo
A thesis submitted for the degree of Doctor of Philosophy to the University of East Anglia,
for research conducted at the Quadram Institute Bioscience.
Quadram Institute Bioscience
December 2021
© This copy of the thesis has been supplied on condition that anyone who consults it is
understood to recognise that its copyright rests with the author and that use of any information
derived therefrom must be in accordance with current UK Copyright Law. In addition, any
quotation or extract must include full attribution.
I
Preface
This thesis was submitted to the University of East Anglia (Norwich, UK) for the degree
of Doctor of Philosophy. The work presented herein was undertaken at the Quadram Institute
Bioscience (Norwich, UK) from January 2018 to December 2021 and fully funded for 4 years
by Marlow Foods Ltd, UK.
Access Condition & Agreement
Each deposit in UEA Digital Repository is protected by copyright and other intellectual
property rights, and duplication or sale of all or part of any of the Data Collections is not
permitted, except that material may be duplicated by you for your research use or for
educational purposes in electronic or print form. You must obtain permission from the
copyright holder, usually the author, for any other use. Exceptions only apply where a deposit
may be explicitly provided under a stated licence, such as a Creative Commons licence or
Open Government licence.
Electronic or print copies may not be offered, whether for sale or otherwise to anyone,
unless explicitly stated under a Creative Commons or Open Government license.
Unauthorised reproduction, editing or reformatting for resale purposes is explicitly prohibited
(except where approved by the copyright holder themselves) and UEA reserves the right to
take immediate ‘take down’ action on behalf of the copyright and/or rights holder if this Access
condition of the UEA Digital Repository is breached. Any material in this database has been
supplied on the understanding that it is copyright material and that no quotation from the
material may be published without proper acknowledgement.
II
Abstract
Mycoprotein is a food ingredient comprising intact fungal cells, rich in protein and fibre.
Clinical trials have shown that mycoprotein reduces blood lipids and increase insulin sensitivity,
and the protein contained within the hyphal cells is highly bioavailable. However, the
mechanisms underlying these effects are not clearly understood. This thesis aimed to investigate
the simulated digestion of mycoprotein to understand its protein bioaccessibility and the impact
on digestive enzymes and macronutrients involved in carbohydrate and lipid digestion.
Furthermore, the release of -glucans and minor compounds (i.e., ergothioneine and phenolic
acids) from the mycoprotein cell walls was investigated, as well as the colonic fermentation of
mycoprotein following gastrointestinal in vitro digestion.
The simulated digestion of mycoprotein showed that proteins were released from the
fungal matrix and digestive enzymes such as -amylase, remained entrapped within hyphal cells
by diffusing through the cell wall, which resulted in a reduced carbohydrate digestion (75% lower
with 20 mg/mL of mycoprotein compared to the control; p-value < 0.001). Moreover,
mycoprotein reduced lipid digestion by lowering enzymatic lipolysis (38% lower compared to
the control; p-value < 0.001) and binding bile salts. Although the cell walls remained intact after
gastrointestinal digestion, -glucans (56.52 ± 5.14%) were released from the cell walls (p-value <
0.01) if mycoprotein was previously cooked. Notwithstanding, the cell walls maintained their
shape, and only colonic bacteria degraded its structure by fermenting its fibre and producing
short-chain fatty acids. Minor compounds that could have played a role in promoting health
benefits were not detected, except for ergothioneine, which deserves future research. The
findings presented in this thesis describes the behaviour of mycoprotein during simulated
gastrointestinal digestion and proposes biochemical mechanisms associated with physiological
processes that can promote health effects. Understanding these mechanisms is essential to
developing new products and strategies to improve human health.
III
Acknowledgements
I sincerely thank my supervisors Prof Pete Wilde, Dr Fred Warren, Dr Tim Finnigan
and Dr Cathrina Edwards, for their support and expert guidance throughout my PhD journey.
Our meetings have always been a moment of formation and exchange of ideas to me.
During the last 4 years, I had the opportunity to learn from world-leading scientists at
the Quadram Institute. I want to acknowledge Louise Salt and Myriam Grundy for supporting
me in developing and executing my first experiments in the lab and Mike Ridout for his
training and assistance in several instruments. I am grateful to Anabel Mulet-Cabero, who has
been a constant help during my PhD in the lab and the writing process. I acknowledge Mary
Parker, Kathryn Gotts and Catherine Booth for their help and support with different
microscopy techniques; I genuinely enjoyed using microscopy and thank them for winning the
engaging images competition contest at the Norwich Research Park library in 2019. I also
thank Natalia Perez and Peter Ryden for their excellent knowledge of food science and
digestion and our exciting exchange of opinions. I acknowledge Jennifer Ahn-Jarvis and
Hannah Harris for their help in my last experiments, it was a race against the clock, but we
managed it. A special thanks also go to Mark Philo and Shikha Saha for their help with mass
spectrometry. It has been a pleasure sharing this path with other fellow PhD students such as
Kathrin Haider, Petros Zafeiriou, Marina Corrado, Trey Koev, Ebenezer Foster-Nyarko,
Federico Bernuzzi, Jennifer McClure, and Anna Cherta Murillo. Several visitors have been
part of our lab during these years, and I thank everyone that I met along the way.
I want to thank my friends back in Italy for our funny calls and moments together, full
of laughter. Finally, last but not least, I want to thank my family, my mom Palma, my dad
Fausto, and my brother Fabrizio for being always there for me, no matter what. It is thanks to
your sacrifices that I am accomplishing this.
Thank you!
IV
Outputs from this Project
Peer-Reviewed Articles:
• Colosimo, R., Warren, F.J., Finnigan, T.J. and Wilde, P.J., 2020. Protein
bioaccessibility from mycoprotein hyphal structure: In vitro investigation of
underlying mechanisms. Food Chemistry, 330, p.127252.
• Colosimo, R., Warren, F.J., Edwards, C.H., Finnigan, T.J. and Wilde, P.J.,
2020. The interaction of α-amylase with mycoprotein: Diffusion through the
fungal cell wall, enzyme entrapment, and potential physiological implications.
Food Hydrocolloids, 108, p.106018.
• Colosimo, R., Mulet-Cabero, A.I., Warren, F.J., Edwards, C.H., Finnigan, T.J.
and Wilde, P.J., 2020. Mycoprotein ingredient structure reduces lipolysis and
binds bile salts during simulated gastrointestinal digestion. Food & Function,
11(12), pp.10896-10906.
• Colosimo, R., Mulet-Cabero, A.I., Cross, K.L., Haider, K., Edwards, C.H.,
Warren, F.J., Finnigan, T.J. and Wilde, P.J., 2021. β-glucan release from fungal
and plant cell walls after simulated gastrointestinal digestion. Journal of
Functional Foods, 83, p.104543.
• Colosimo, R., Warren, F.J., Edwards, C.H., Ryden, P., Dyer, P.S., Finnigan,
T.J. and Wilde, P.J., 2021. Comparison of the behavior of fungal and plant cell
wall during gastrointestinal digestion and resulting health effects: A review.
Trends in Food Science & Technology.
• Colosimo, R., Ahn-Jarvis, H.J., Harris, H.C., Troncoso-Rey, P., Warren, F.J.,
Edwards, C.H., Finnigan, T.J. and Wilde, P.J., 2020. Colonic in vitro
fermentation of mycoprotein (in preparation).
V
Oral Presentations at International Conferences:
May 2021 Virtual International Conference on Food Digestion.
Oct 2021 4th
Food Structure and Functionality Symposium (virtual).
Nov 2021 7th
International Conference on Food Chemistry & Technology,
(virtual).
Nov 2021 6th
International Conference on Food Structures, Digestion & Health,
(virtual)
Poster Presentations at International Conferences:
Oct 2018 Bioavailability 2018 Conference, Norwich, UK.
Apr 2019 6th
International Conference on Food Digestion, Granada, Spain.
Awarded Prize:
Jul 2019 Winner of the engaging images competition of the Norwich Research
Park Image Library with ‘Digesting Mycoprotein’.
Science Communication Events:
Oct 2019 Norwich Science Festival at the Forum, Norwich, UK. Presentation of
the winning image of the engaging images competition contest.
Nov 2020 Blog writing: ‘How mycoprotein influences digestion and promotes
health effects’
VI
Table of Contents
Preface ..................................................................................................................................... I
Abstract ................................................................................................................................. II
Acknowledgements .............................................................................................................. III
Outputs from this Project ..................................................................................................... IV
Table of Contents ................................................................................................................. VI
List of Figures .................................................................................................................... XIII
List of Tables ..................................................................................................................... XIX
List of Equations ............................................................................................................... XXI
List of Abbreviations ....................................................................................................... XXII
Chapter 1 Introduction & Literature Review .......................................................................... 1
1.1 Introduction ............................................................................................................................. 2
1.2 Mycoprotein: Discovery, Production and Nutrition Facts ........................................................ 3
1.2.1 The Origin of Mycoprotein ................................................................................................ 4
1.2.2 Industrial Process ............................................................................................................... 5
1.2.3 Nutrition Facts .................................................................................................................... 7
1.3 Food Structure Importance: The Fungal and Plant Cell Walls .............................................. 10
1.3.1 The Fungal Cell Wall ....................................................................................................... 10
1.3.2 The Plant Cell Wall ......................................................................................................... 12
1.3.3 Comparison of Fungal and Plant Cell Walls .................................................................... 14
1.4 Human Digestion ................................................................................................................... 18
1.4.1 Bioaccessibility of Nutrients ............................................................................................. 19
1.4.2 Macronutrients and Digestion .......................................................................................... 20
1.4.2.1 Proteins ..................................................................................................................... 21
1.4.2.2 Carbohydrates ........................................................................................................... 23
1.4.2.3 Lipids ........................................................................................................................ 26
1.4.2.4 Bioactive Components .............................................................................................. 29
1.5 In Vitro Models to Explain the In Vivo Findings ................................................................... 30
1.5.1 Simulation Methods for the Upper Gastrointestinal Tract ............................................... 30
1.5.2 Simulation Methods for the Lower Gastrointestinal Tract................................................ 32
VII
1.6 Key Findings After Postprandial Consumption of Mycoprotein ............................................ 32
1.6.1 Protein Bioaccessibility and Bioavailability ....................................................................... 33
1.6.2 Effects on Post-Prandial Insulin and Glucose Homeostasis .............................................. 35
1.6.2.1 Examples of Other Fungal and Plant-Based Foods in Relation with T2D ................. 37
1.6.3 Hypocholesterolaemic Effects .......................................................................................... 39
1.6.3.1 Examples of Other Fungal and Plant-Based Foods in Relation with CVD ................ 41
1.6.4 Impact of Colonic Fermentation on Human Health ........................................................ 42
1.6.5 In Vitro Outcomes of Phenolic Compounds from Mycoprotein ..................................... 44
1.7 Potential Biochemical Mechanisms Underlying the Health Effects ....................................... 44
1.7.1 Nutrient Bioaccessibility ................................................................................................... 45
1.7.1.1 Cell Wall Encapsulation and Tissue Structure .......................................................... 46
1.7.1.2 Binding and Sequestration of Digestive Components ............................................... 47
1.7.2 Increased Viscosity in the Gut .......................................................................................... 48
1.8 Aims & Objectives ................................................................................................................. 49
Chapter 2 General Materials & Methods ............................................................................. 51
2.1 Materials ................................................................................................................................ 52
2.1.1 Chemical and Reagents .................................................................................................... 52
2.1.2 Mycoprotein Samples ....................................................................................................... 53
2.2 Methods ................................................................................................................................. 54
2.2.1 In Vitro Simulation of Human Gastrointestinal Digestion ................................................ 54
2.2.2 In Vitro Simulation of Colonic Fermentation ................................................................... 58
2.2.3 Protein Analysis ................................................................................................................ 58
2.2.3.1 Bicinchoninic Acid Assay .......................................................................................... 59
2.2.3.2 Bradford Assay .......................................................................................................... 61
2.2.3.3 SDS-PAGE ............................................................................................................... 62
2.2.4 Carbohydrate Analysis ...................................................................................................... 64
2.2.4.1 Reducing Sugar Determination ................................................................................. 64
2.2.4.2 Alpha-Amylase Activity Assay ................................................................................... 65
2.2.4.3 Beta-Glucan Content Analysis ................................................................................... 66

VIII
2.2.5 Lipid Analysis ................................................................................................................... 66
2.2.5.1 pH-Stat Technique .................................................................................................... 67
2.2.5.2 Total Bile Acid Assay ................................................................................................ 68
2.2.6 DNA Analysis................................................................................................................... 69
2.2.6.1 Shotgun Metagenomics Sequencing .......................................................................... 69
2.2.6.2 Microbial Community Profiling................................................................................. 70
2.2.7 Metabolomic Analysis ...................................................................................................... 71
2.2.7.1 NMR Analysis ........................................................................................................... 71
2.2.7.2 LC-MS Analysis ........................................................................................................ 72
2.2.8 Analysis of Structural/Physical Properties ......................................................................... 73
2.2.8.1 Particle Size Analysis ................................................................................................. 73
2.2.8.2 Ultrasonication Process ............................................................................................. 75
2.2.8.3 Rheological Analysis .................................................................................................. 75
2.2.8.4 Microscopy ................................................................................................................ 77
Chapter 3 Protein Release from Mycoprotein Matrix During In Vitro Gastrointestinal
Digestion .............................................................................................................................. 84
3.1 Introduction ........................................................................................................................... 85
3.2 Materials & Methods .............................................................................................................. 86
3.2.1 Materials ........................................................................................................................... 86
3.2.1.1 Chemicals and Reagents ............................................................................................ 86
3.2.1.2 Mycoprotein Samples ................................................................................................ 87
3.2.2 Methods ........................................................................................................................... 87
3.2.2.1 Simulated Gastrointestinal Digestion ......................................................................... 87
3.2.2.2 Protein Quantification ............................................................................................... 88
3.2.2.3 Structural Analysis ..................................................................................................... 90
3.2.2.4 Data Analysis ............................................................................................................. 91
3.3 Results & Discussion .............................................................................................................. 91
3.3.1 Effect of Protein Extraction Methods and Cell-Wall-Degrading-Enzymes ....................... 91
3.3.2 Visualisation of Mycoprotein Hyphae After Protein Extraction Methods and Cell-Wall-
Degrading-Enzymes ................................................................................................................... 94

IX
3.3.3 Effect of In Vitro Gastrointestinal Digestion ..................................................................... 96
3.3.4 Visualisation of Mycoprotein Hyphae During In Vitro Digestion ...................................100
3.3.5 Effect of Protein Extraction Methods, Cell-Wall-Degrading-Enzymes, and In Vitro
Digestion on Protein Hydrolysis ..............................................................................................102
3.3.6 Effect of Protein Extraction Methods and In Vitro Digestion on Particle Size ................105
3.4 Conclusions ..........................................................................................................................106
Chapter 4 Mycoprotein Matrix Reduces In Vitro Carbohydrate Digestion by Sequestering
Alpha-Amylase ................................................................................................................... 108
4.1 Introduction ..........................................................................................................................109
4.2 Materials & Methods .............................................................................................................110
4.2.1 Materials ..........................................................................................................................110
4.2.1.1 Chemicals and Reagents ...........................................................................................110
4.2.1.2 Mycoprotein Samples ...............................................................................................111
4.2.2 Methods ..........................................................................................................................111
4.2.2.1 Simulated Small Intestinal Digestion ........................................................................111
4.2.2.2 Kinetic In Vitro Digestion of Starch .........................................................................112
4.2.2.3 The Binding of Alpha-Amylase by Mycoprotein ......................................................112
4.2.2.4 Microscopy Analysis .................................................................................................115
4.2.2.5 Data Analysis ............................................................................................................117
4.3 Results ...................................................................................................................................118
4.3.1 Glycogen Depletion from Mycoprotein ..........................................................................118
4.3.2 Inhibition of Alpha-Amylase ...........................................................................................121
4.3.3 Kinetic Analyses of Alpha-Amylase Inhibition ................................................................125
4.3.4 Microscopic Visualization of Mycoprotein Interaction with Alpha-Amylase ...................127
4.3.4.1 Labelling of Alpha-Amylase with FITC ....................................................................127
4.3.4.2 Alpha-Amylase Diffusion into Mycoprotein Cells ....................................................129
4.4 Discussion .............................................................................................................................131
4.5 Conclusions ..........................................................................................................................135
Chapter 5 Mycoprotein Modulates In Vitro Lipid Digestion by Reducing Lipase Activity and
Binding Bile Salts† ............................................................................................................. 136
X
5.1 Introduction ..........................................................................................................................137
5.2 Materials & Methods .............................................................................................................139
5.2.1 Materials ..........................................................................................................................139
5.2.1.1 Chemicals and Reagents ...........................................................................................139
5.2.1.2 Mycoprotein Samples ...............................................................................................139
5.2.2 Methods ..........................................................................................................................140
5.2.2.1 Lipolysis Analysis by In Vitro Digestion Using pH-Stat Method ..............................140
5.2.2.2 Simulated Gastrointestinal or Only Intestinal Digestion ...........................................141
5.2.2.3 Bile Salts Binding Experiments After Simulated Gastrointestinal Digestion .............142
5.2.2.4 Protein Analyses .......................................................................................................143
5.2.2.5 Rheological Analysis .................................................................................................145
5.2.2.6 Particle Size Analysis of Simulated Gastrointestinal Digestion .................................145
5.2.2.7 Data Analysis ............................................................................................................145
5.3 Results & Discussion .............................................................................................................146
5.3.1 Lipolysis Reduction of Emulsion in the Presence of Mycoprotein ..................................146
5.3.2 Mycoprotein Binding to Bile Salts ...................................................................................148
5.3.2.1 Extracted Mycoprotein Protein and Proteolysis Effect on Bile Salts Binding ...........151
5.3.2.2 Characterisation of Extracted Mycoprotein Proteins with Potential Bile Salts Binding
Activity .................................................................................................................................152
5.3.2.3 Limiting Factors to the Bile Salts Binding by Mycoprotein ......................................156
5.3.3 Effect of Digestion Conditions on Viscosity and Particle Size of Mycoprotein ................158
5.4 Conclusions ..........................................................................................................................160
Chapter 6 Beta-Glucans Release from Mycoprotein Cell Walls During In Vitro
Gastrointestinal Digestion................................................................................................... 162
6.1 Introduction ..........................................................................................................................163
6.2 Materials & Methods .............................................................................................................165
6.2.1 Materials ..........................................................................................................................165
6.2.1.1 Chemicals and Reagents ...........................................................................................165
6.2.1.2 Mycoprotein and Control Samples...........................................................................165
6.2.2 Methods ..........................................................................................................................166

XI
6.2.2.1 Sample Preparation ..................................................................................................166
6.2.2.2 Simulated Gastrointestinal Digestion ........................................................................166
6.2.2.3 Total Beta-Glucans Analysis .....................................................................................167
6.2.2.4 Protein and Reducing Sugar Analysis .......................................................................170
6.2.2.5 Viscosity Analysis .....................................................................................................170
6.2.2.6 Structural Analysis by SEM Microscopy ...................................................................171
6.2.2.7 Data Analysis ............................................................................................................171
6.3 Results ...................................................................................................................................172
6.3.1 Total Beta-Glucans Retained in the Pellet After Simulated GI Digestion........................172
6.3.2 Analysis of Proteins and Reducing Sugars Hydrolysis After Simulated GI Digestion ......176
6.3.3 Viscosity of The Supernatant After Simulated Digestion .................................................177
6.3.4 Structural Analysis of the Pellet Before and After Simulated GI Digestion .....................179
6.4 Discussion .............................................................................................................................182
6.5 Conclusions ..........................................................................................................................185
Chapter 7 Minor Compounds Release from Mycoprotein Matrix During In Vitro
Gastrointestinal Digestion................................................................................................... 187
7.1 Introduction ..........................................................................................................................188
7.2 Materials & Methods .............................................................................................................189
7.2.1 Materials ..........................................................................................................................189
7.2.1.1 Chemicals and Reagents ...........................................................................................189
7.2.1.2 Mycoprotein and Control Samples...........................................................................190
7.2.2 Methods ..........................................................................................................................190
7.2.2.1 Chemical Extraction .................................................................................................190
7.2.2.2 Simulated Gastrointestinal Digestion ........................................................................190
7.2.2.3 LC-MS Analysis .......................................................................................................191
7.2.2.4 Data Analysis ............................................................................................................192
7.3 Results & Discussion .............................................................................................................192
7.3.1 Phenolic Acids and Ergothioneine Release After Chemical Extraction ...........................192
7.3.2 Phenolic Acids and Ergothioneine Release During Simulated GI Digestion ...................194
7.4 Conclusions ..........................................................................................................................195
XII
Chapter 8 Colonic In Vitro Fermentation of Mycoprotein Promotes Shifts in Gut Microbiota
and Short-Chain Fatty Acids Production ............................................................................ 196
8.1 Introduction ..........................................................................................................................197
8.2 Materials & Methods .............................................................................................................198
8.2.1 Materials ..........................................................................................................................198
8.2.1.1 Chemicals and Reagents ...........................................................................................198
8.2.1.2 Mycoprotein and Control Samples...........................................................................199
8.2.2 Methods ..........................................................................................................................200
8.2.2.1 Simulated Upper Gastrointestinal Digestion ............................................................200
8.2.2.2 Batch Colonic In Vitro Fermentation .......................................................................201
8.2.2.3 Metabolomic Analysis ..............................................................................................205
8.2.2.4 DNA Analysis ..........................................................................................................206
8.2.2.5 Microscopy Analysis .................................................................................................209
8.2.2.6 Data Analysis ............................................................................................................210
8.3 Results & Discussion .............................................................................................................210
8.3.1 Protein and Carbohydrate Digestion in the Upper Gastrointestinal Tract .......................210
8.3.2 Metagenomic Analysis .....................................................................................................212
8.3.2.1 Processing Metagenomics Data Quality Control ......................................................212
8.3.2.2 Differentiation of Bacterial Communities During Colonic In Vitro Fermentation ...213
8.3.2.3 Taxonomic Analysis .................................................................................................216
8.3.3 Metabolomic Analysis .....................................................................................................218
8.3.3.1 Short-Chain Fatty Acids (SCFA) Analysis .................................................................218
8.3.3.2 Microbial Metabolites Analysis.................................................................................219
8.3.3.3 Branched-Chain Fatty Acids (BCFA) Analysis .........................................................221
8.3.4 Structural Changes in Mycoprotein Matrix After Colonic In Vitro Fermentation ...........223
8.4 Conclusions ..........................................................................................................................224
Chapter 9 Conclusions & Future Perspectives ................................................................... 226
9.1 General Conclusions .............................................................................................................227
9.2 Future Perspectives ...............................................................................................................230
References .......................................................................................................................... 233
XIII
List of Figures
--------------------------------------------------------------CHAPTER 1--------------------------------------------------------------
Figure 1.1 Optical image of filamentous cells present in the MYC ingredient, using brightfield
microscopy (x20). ................................................................................................................................ 4 Figure 1.2. Image of the MYC fermenters in Billingham, UK (left); a schematic representation of the
fermentation steps to produce MYC (right), data source adapted from Whittaker, Johnson, Finnigan,
Avery, and Dyer (2020). ...................................................................................................................... 6 Figure 1.3. Schematic representation of the outer layer of a generic fungal cell, including cell wall and
plasma membrane. Adapted from Vega and Kalkum (2012). ........................................................... 12 Figure 1.4. Schematic representation of the outer layer of a generic plant cell, including cell wall and
plasma membrane. Adapted from Scheller and Ulvskov (2010). ...................................................... 14 Figure 1.5. Schematic representation of human digestion compartments, physiological conditions, and
functions according to the INFOGEST protocol (Minekus et al., 2014). ......................................... 19 Figure 1.6. Schematic representation of the structural/organisational difference between plant tissues
and fungal hyphae; bioaccessibility of nutrients in plant and fungal cells. Figure source: Colosimo et al.
(2021). ............................................................................................................................................... 20 Figure 1.7. Schematic representation of peptide bond formation between two AA. In the Figure, N-
terminus is the amino group; C-terminus is the carboxyl group. ....................................................... 21 Figure 1.8. Simplified representation of protein fate during digestion. AA: amino acids; BCFA:
branched-chain fatty acids. ................................................................................................................ 22
Figure 1.9. Schematic representation of monosaccharides bound by -1,4-1,6 glycosidic bonds (left),
and −1,3-1,6 glycosidic bonds (right); and structural shape of starch (amylose and amylopectin),
glycogen, adapted from Pereira, Fajardo, Valente, Rubira, and Muniz (2016) and Engelking (2015),
respectively; and -glucans, adapted from Kofuji et al. (2012); chemical structure of cellulose. ........ 24 Figure 1.10. Simplified representation of carbohydrates (starch or fibre) fate during digestion. SCFA:
short-chain fatty acids. ....................................................................................................................... 25 Figure 1.11. Schematic representation of triglycerides composed of three fatty acids chains (right) and
a glycerol backbone (left); steroids (cholesterol in mammals, ergosterol in fungi). ............................ 27 Figure 1.12. Simplified representation of lipid (triacylglycerols TAG) fate during digestion. 1,2-DAG:
1,2-diacylglycerols; FFA: free fatty acids; 2-MAG: 2-monoacylglycerols. ........................................... 28 Figure 1.13. The chemical structure of PCA (Figure 1.13A), as an example of a common phenolic
acid, and the AA ergothioneine (Figure 1.13B). ................................................................................ 29
--------------------------------------------------------------CHAPTER 2------------------------------------------------------------
Figure 2.1. Freeze-dried MYC powder is the main sample used in the thesis experiments. .............. 53 Figure 2.2. Incubator (Excella E24 incubator shaker series, New Brunswick Scientific, USA) with
Grant-Bio PTR-35 rotator inside (Grant Instruments, UK). ............................................................. 55 Figure 2.3. An example of INFOGEST static in vitro digestion with 2.5 g of starting food and the oral,
gastric, and small intestinal phases. The simulated fluids, enzymes, BS, water, NaOH and HCl were
added based on the initial quantity of the food as described by Minekus et al. (2014). ..................... 57 Figure 2.4. Schematic representation of the BCA assay principle for protein determination. ........... 60 Figure 2.5. Schematic representation of the Bradford assay principle for protein determination. ..... 61 Figure 2.6 Schematic representation of the SDS-PAGE mechanism for protein hydrolysis and
molecular weight determination. ....................................................................................................... 63 Figure 2.7. Schematic representation of the PAHBAH assay principle for reducing sugars
determination. ................................................................................................................................... 65
Figure 2.8. Spectra of absorbance and fluorescence emission of BODIPY® FL dye. Image adapted
from the manufacturer protocol. ....................................................................................................... 66

XIV
Figure 2.9. Image of the pH-stat device KEM AT-700 (Kyoto electronics, Japan) used in this
experimental thesis work. .................................................................................................................. 68 Figure 2.10. Schematic representation of the basic principles of static laser light scattering. ............. 74 Figure 2.11. Particle size analyser LS13-320 (Beckman Coulter, USA) used in the experiments of this
thesis. ................................................................................................................................................ 74
Figure 2.12. Branson Digital Sonifier® (Marshall Scientific, USA) used in the experiments of this thesis.
.......................................................................................................................................................... 75 Figure 2.13. Advanced AR-2000 rheometer supplied by TA Instruments, UK. ............................... 77 Figure 2.14. Schematic representation of the principles of optical microscopy technique used in
brightfield (left) or epi-fluorescence (right). ....................................................................................... 80 Figure 2.15. Schematic representation of the principles of CLSM microscopy. ................................ 82
--------------------------------------------------------------CHAPTER 3--------------------------------------------------------------
Figure 3.1. Protein release (wt%) from the total protein of MYC samples after chemical, mechanical
and enzymatic extraction methods. Figure 3.1A: protein release from MYC25 and MYC10 after 120
min of incubation (INC) with ultra-pure water as a control (CNT), triton X-100 solution, urea solution
and application of homogenisation (INC + HOMO), glass-beads grinding (INC + GB), ultra-sonication
(INC + SON); three-way ANOVA, Tukey’s post hoc test (p-value < 0.05). Figure 3.1B: protein release
from MYC samples after treatment with Driselase™ buffer (DRI) for 120 min and comparison with
incubation with ultra-pure water (CNT), and ultra-sonication plus incubation with urea solution; one-
way ANOVA Tukey’s post hoc test (p-value < 0.05); values with different letters are statistically
significant. ......................................................................................................................................... 93 Figure 3.2. MYC hyphae visualisation after extraction methods. Figure 3.2A: Optical micrographs of
MYC25 after incubation (INC: a, b, c), incubation plus homogenisation (INC + HOMO: d, e, f), glass
bead grinding (INC + GB: g, h, i), and ultra-sonication (INC + SON: j, k, l) with urea solution. Figure
3.2B: MYC hyphae visualisation after Driselase™ buffer incubation; MYC25 and MYC10 before
(Control: a, b, c) and after incubation with Driselase™ buffer (MYC25: d, e, f; MYC10: g, h, i, j).
Brightfield mode with lactophenol cotton blue stain (LCB) and toluidine blue stain (TB); fluorescence
and epi-fluorescence mode with calcofluor white stain + EB (CFW + EB). ...................................... 95 Figure 3.3. Protein release from MYC samples after simulated GI digestion (based on the total MYC
protein content of 44% DW, Table 1.1 of Chapter 1, Section 1.2.3). Figure 3.5A: protein release from
MYC25, MYC25/SON, MYC10, MYC10/SON during in vitro digestion; two-way ANOVA, Dunnett’s
post hoc test (p-value < 0.05). Figure 3.3B: small intestinal phase of MYC25 digested with pancreatin
and individual enzymes (trypsin, chymotrypsin, or trypsin + chymotrypsin), and Figure 3.3C: gastric
and small intestinal phases of MYC25, RAW-MYC25 and W-RAW-MYC25, one-way ANOVA,
Dunnett’s post hoc test (p-value < 0.05). Figure 3.3D: small intestinal phase of MYC25 with previous
gastric digestion (gastric (+)) or without (gastric (-)). Unpaired t-test, (p-value < 0.05). Statistical
significance levels are discussed in the text. U: undigested sample (control without enzymes). ......... 97 Figure 3.4. Incubation of MYC25 in the absence of enzymes, at either acidic (gastric G) or neutral
(intestinal I) pH, which shows no significant release of protein (ns). In the graph, U represents MYC25
incubated without enzyme (control), whereas G120 and I120 are gastric and intestinal digestions with
enzymes after 120 min. One-way ANOVA, Dunnett’s post hoc test (p-value < 0.05); *** p-value <
0.001, ** p-value < 0.01. ................................................................................................................... 99 Figure 3.5. Optical micrographs of MYC25 during gastric and small intestinal phase of the simulated
GI digestion. Figure 3.5A: brightfield mode with lactophenol cotton blue stain (LCB: a, b), toluidine
blue stain (TB: c, d) and epi-fluorescence mode with calcofluor white stain (CFW: e, f). Figure 3.5B:
fluorescence microscopy with fast green FCF (FCF: a, b), calcofluor white stain + Evans blue (CFW +
EB: c, d), and fluorescein isothiocyanate isomer (FITC: e, f). ..........................................................101 Figure 3.6. SDS-PAGE gels for protein hydrolysis analysis from MYC after extraction methods with
urea buffer and Driselase™ buffer incubation (Figure 3.6A); INC: urea buffer incubation; HOMO:
incubation with urea buffer plus homogenisation; GB: incubation with urea buffer plus glass beads
XV
grinding; SON: incubation with urea buffer plus ultra-sonication; DRI: Driselase™ solution standard,
DRI25 and DRI10: Driselase™ buffer incubation with MYC25 and MYC10, respectively. Simulated
GI digestion (Figure 3.6B) and simulated intestinal digestion with trypsin (Figure 3.6C). kDa: molecular
weight in kDa; M: protein molecular weight marker; U: undigested sample of the in vitro digestion;
Pepsin, Pancreatin, Trypsin: enzyme standards. ..............................................................................103 Figure 3.7. Protein release from MYC after incubation with urea buffer followed by ultra-sonication
(SON); the two bands on the left were diluted 1:10 with ultra-pure water, whereas the two bands on the
right 1:5. In the figure, kDa is the molecular weight in kDa; M is the protein molecular weight marker.
.........................................................................................................................................................104 Figure 3.8. MYC particle size reduction after extraction methods and simulated GI digestion. Figure
3.8A: Particle size (D4,3) of MYC25 incubated with ultra-pure water (INC), incubation plus
homogenisation (INC + HOMO), incubation plus glass-beads grinding (INC + GB) and incubation
plus ultra-sonication (INC + SON). Figure 3.8B: MYC25 and MYC25/SON during in vitro digestion.
One-way ANOVA, Bonferroni post hoc test (p-value < 0.05); values with different letters are statistically
significant. ........................................................................................................................................105
--------------------------------------------------------------CHAPTER 4-------------------------------------------------------------
Figure 4.1. Total hydrolysis of the intracellular glycogen from MYC powder (starting concentration =
2.27 mg/mL) and extracted glycogen (2.27 mg/mL) during 120 min of intestinal phase of the
INFOGEST static in vitro digestion with pancreatic −amylase, activity 200 U/mL (Figure 4.1A) or
400 U/mL (Figure 4.1B). In the graph, U represents the undigested sample with no enzymatic
digestion. Unpaired t-test, (*p-value < 0.05); **p-value < 0.01; ***p-value < 0.001 are statistically
significant to the respective time point (U, 15, 30, 60, 120 min of extracted glycogen vs U, 15, 30, 60,
120 min of glycogen from MYC). ....................................................................................................119 Figure 4.2. Optical micrograph of raw MYC powder (Figure 4.2A) compared to glycogen-depleted
MYC in a pale-yellow colour (Figure 4.2B). .....................................................................................120 Figure 4.3. Total starch (STA) (5 mg/mL) hydrolysis in the presence of a range of concentrations (2.5
– 20 mg/mL) of glycogen depleted MYC powder (MYC) (Figure 4.3A) or −cellulose (CEL) (Figure
4.3B) at 2.5 or 20 mg/mL during time. One-way ANOVA, Dunnett’s multiple comparison test (*p-
value < 0.05, **p-value < 0.01, ***p-value < 0.001 are statistically significant to the respective time
point of the control (STA = 5 mg/mL). ............................................................................................121 Figure 4.4. Total starch hydrolysis in the presence of MYC, MYC plus BSA, and total -amylase in the
presence of MYC. Figure 4.4A: Total starch (STA) (5 mg/mL) hydrolysis in the presence of
concentrations (5, 10, 20 mg/mL) of EMP. Figure 4.4B: hydrolysis of STA (5 mg/mL) incubated with
MYC (5 mg/mL) and in the presence of concentrations (5, 10, 20 mg/mL) of BSA. Figure 4.4C: -
amylase (%) in the supernatant after 30 min of incubation with MYC. One-way ANOVA, Dunnett’s
multiple comparison test (*p-value < 0.05; **p-value < 0.01 ***p-value < 0.001 are statistically
significant to the respective control (Figure 4.4A: STA = 5 mg/mL; Figure 4.4B: STA + MYC = 5
mg/mL; Figure 4.4C: MYC = 0 mg/mL).. ........................................................................................123
Figure 4.5. Kinetic analyses. Figure 4.5A: Michaelis-Menten plot of starch hydrolysis rate () against a
range of starch (STA) concentrations (1, 2.5, 5, 10, 20, 30 mg/mL) in the presence of 0, 5, 10, 20
mg/mL of MYC. The reaction rate (mM/min) was obtained by the slope of three (n = 3) distinct in
vitro digestions of 12 min. Figure 4.5B: Lineweaver-Burk plot of the reciprocal of initial reaction
velocity (1/) against the reciprocal of substrate (1/S) concentrations in the presence of 0, 5, 10, 20
mg/mL of MYC. Figure 4.5C: Dixon plot of the reciprocal of initial reaction velocity (1/) and (Figure
4.5D) Cornish-Bowden plot of substrate/reaction rate (S/) against MYC concentrations (5, 10, 20
mg/mL); STA: 1, 2.5, 5, 10, 20, 30 mg/mL. .....................................................................................125 Figure 4.6. Diagram of a reversible linear mixed inhibition. E: enzyme; S: substrate; I: inhibitor; P:
product. MYC is the inhibitor (I) that can interact with the free enzyme (E) to form the complex
enzyme/inhibitor (EI), as well as with the enzyme/substrate complex (ES). This interaction promotes a

XVI
decrease of Vmax (maximum velocity of the enzyme) and an increase in Ks (enzyme-substrate
dissociation constant) in the presence of an inhibitor. ......................................................................127 Figure 4.7. Fractions (F) and blank (B) absorbances (AU) were obtained from a PD 10 desalting
column used for the FITC (495 nm) labelling of -amylase (285 nm). ............................................127
Figure 4.8. Micrographs of glycogen-depleted MYC powder interacting with -amylase and starch.
Figure 4.8A: CLSM of glycogen-depleted MYC powder stained in blue with calcofluor white (CFW)
and free fluorescein isothiocyanate isomer (FITC) in green. Figure 4.8B: CLSM of glycogen-depleted
MYC powder stained in blue with CFW and the FITC-labelled -amylase in green, Z-stack analysis
ortho mode. Figure 4.8C and 4.8D: Optical microscopy of MYC stained with Lugol’s solution after 12
min of in vitro digestion; a potential association of starch (purple) with MYC (yellow) is shown in Figure
4.8C, whilst free starch is also shown in Figure 4.8D (both 4.8C and 4.8D are from the same sample).
.........................................................................................................................................................129 Figure 4.9. CLSM of glycogen-depleted MYC powder mixed with calcofluor white (blue) and
fluorescein isothiocyanate isomer (green) for 30 s on a vortex mixer and washed with PBS for 5 min at
2,800 xg. ...........................................................................................................................................130
--------------------------------------------------------------CHAPTER 5----------------------------------------------------------
Figure 5.1. Volume (mL) of NaOH 0.1 M consumed during lipolysis. Figure 5.1A: Simulated intestinal
digestion with O/W emulsion (control) or O/W emulsion plus different MYC concentrations (10, 20,
30 mg/mL). Values were corrected by control measurements; this is the same experiments without the
addition of the O/W emulsion. One-way ANOVA, Dunnett post hoc test (p-value < 0.05); ***p-value
< 0.001 are statistically significant from the control. Figure 5.B: TBT (control) or TBT plus MYC (30
mg/mL) digested with pancreatin for 10 min. Unpaired t-test with Welch’s correction (two tailed p-
value < 0.05); **p-value < 0.01 is statistically significant from the control. .......................................146 Figure 5.2. MYC and O/W incubated with simulated intestinal fluids at 0h (left) and 1 h (right). MYC
is stained in blue with calcofluor white dye and O/W emulsion is stained in red by Nile red dye. ...148 Figure 5.3. BS concentration (mM) measured in the supernatant after 120 min of simulated intestinal
(I) or 120 min of gastric plus 120 min of intestinal (G + I) digestion in the presence of 0 (control), 10,
20, 30 mg/mL of MYC. Figure 5.3A: Intestinal digestion using pancreatin, pepsin and pancreatin for
G and I, respectively; Figure 5.3B: without enzymes (WO/E); Figure 5.3C: intestinal digestion using
trypsin, pepsin and trypsin for G and I, respectively. One-way ANOVA, Dunnett post hoc test (p-value
< 0.05); *p-value < 0.05, **p-value < 0.01, ***p-value < 0.001 are statistically significant compared to
the respective control (MYC 0 mg/mL). ns: not significant. .............................................................149 Figure 5.4. BS concentration (mM) measured after 120 min of simulated intestinal (I) or 120 min of
gastric plus 120 min of intestinal (GI) digestion in the presence of 8.8 mg/mL of EMP (which
corresponds to the protein concentration in 20 mg/mL of MYC). In the graph, CNT is the sample
without EMP (control); WO/E refers to EMP incubated without enzyme; TRP refers to EMP
incubated with trypsin; PEP + TRP refers to EMP incubated with pepsin and then trypsin. One-way
ANOVA, Dunnett post hoc test (p-value < 0.05); *** p-value < 0.001 is statistically significant compared
to the control (I). ..............................................................................................................................152 Figure 5.5. SDS-PAGE gels. Figure 5.5A: EMP in triplicate (bands 1, 2, 3) during only intestinal
digestion (with trypsin) or GI digestion (with pepsin + trypsin), EMP U refers to the EMP undigested.
Figure 5.5B: MYC in triplicate (bands 1, 2, 3), during only intestinal digestion (with trypsin) or GI
digestion (with pepsin + trypsin), MYC WO/E refers to the MYC undigested. In the figure, kDa refers
to the protein molecular weight, M refers to the protein standard mark, pepsin and trypsin are the
enzyme standards. ............................................................................................................................153 Figure 5.6. BS concentration (mM) measured after 120 min of simulated intestinal (I) or 120 min of
gastric plus 120 min of intestinal (GI) digestion in the presence of 30 mg/mL of MYC. In the graph,
CNT is the sample control without MYC; TRP refers to MYC incubated with trypsin; TRP/LIP-CoLIP
refers to MYC incubated with trypsin plus lipase-colipase; WO/E + TRP refers to MYC incubated with
no gastric pepsin, and then trypsin; PEP + TRP refers to MYC incubated with pepsin and then trypsin;

XVII
PEP + TRP/LIP-CoLIP refers to MYC incubated with pepsin and then trypsin plus lipase-colipase.
One-way ANOVA, Dunnett post hoc test (p-value < 0.05); ** p-value < 0.01, *** p-value < 0.001 are
statistically significant compared to the respective control. Unpaired t-test with Welch’s correction (two-
tailed p-value < 0.05) to compare TRP/LIP-CoLIP to TRP, * p-value < 0.05; WO/E + TRP to PEP +
TRP, * p-value < 0.05; and WO/E + TRP to PEP + TRP/LIP-CoLIP, ** p-value < 0.01. .............157 Figure 5.7.Viscosity and particle size analysis. Figure 5.7A: Viscosity (Pa.s) measured after 120 min of
simulated intestinal (I) or 120 min of gastric plus 120 min of intestinal (GI) digestion in the presence
of 30 mg/mL of MYC digested without enzyme (WO/E), pancreatin, or trypsin. In the graph, SIF is
simulated intestinal fluid (control). The gastric phase was carried out with pepsin except for WO/E
digestion. One-way ANOVA, Tukey’s post hoc test (p-value < 0.05) comparing the only intestinal with
t0e respective GI digestion sample (**p-value < 0.01), and all the samples vs SIF (***p-value < 0.001).
Figure 5.7B: Particle size diameter (D4,3) (m) measured after GI digestion in the presence of 30
mg/mL of MYC digested without enzymes (WO/E), pepsin plus pancreatin, or pepsin plus trypsin.
One-way ANOVA, Dunnett post hoc test (p-value < 0.05); ***p-value < 0.001 are statistically significant
compared to GI (WO/E). ................................................................................................................159
--------------------------------------------------------------CHAPTER 6----------------------------------------------------------
Figure 6.1. Total -glucans measured in the pellet of uncooked (Figure 6.1A) and cooked (Figure 6.1B)
MYC, WBM, OAT, and BAR after simulated digestion steps. : control gastric step (without pepsin);
: gastric step (with pepsin); : control intestinal step (without pancreatin/BS); : intestinal step
(with pancreatin and BS). Unpaired t-test (two-tailed p-value < 0.05); ****p-value < 0.0001, ***p-value
< 0.001, **p-value < 0.01, *p-value < 0.05 are statistically significant compared to the total -glucans
(100wt% DW) measured in the corresponding sample (MYC, WBM, OAT or BAR) before simulated
digestion; values within the same sample type annotated with different letters are statistically significant
(unpaired t-test, two-tailed, p-value < 0.05). ......................................................................................174
Figure 6.2. Total -glucans measured in the pellet of uncooked OAT and uncooked BAR or cooked
MYC and cooked OAT after simulated gastric followed by intestinal digestion. : GI step with BS
(no pancreatin); : GI step with pancreatin (no BS). Unpaired t-test (two-tailed p-value < 0.05) for
comparison with the simulated intestinal digestion of the same sample (MYC, OAT, BAR); values
within the same sample type annotated with different letters are statistically significant. ...................175 Figure 6.3. Total proteins released in the supernatant of uncooked (Figure 6.3A) and cooked (Figure
6.3B) MYC, WBM, OAT, and BAR after simulated GI digestion. Reducing sugars (wt% DW) released
in the supernatant of uncooked (Figure 6.3C) and (Figure 6.3D) of MYC, WBM, OAT, and BAR
simulated GI digestion. : control GI digestion (without pancreatin and BS); : GI digestion
(with pancreatin and BS). Unpaired t-test (two-tailed, p-value < 0.05) for comparison of the GI digestion
and control of uncooked and cooked samples (MYC, WBM, OAT, BAR). Statistical significance levels
are reported in the text. ....................................................................................................................176 Figure 6.4.Viscosity (Log base Pa.s) at a shear rate of 15 1/s measured in the supernatant of uncooked
(Figure 6.4A) and cooked (Figure 6.4B) MYC, WBM, OAT, and BAR after simulated digestion. :
control gastric step (without pepsin); : gastric step (with pepsin); : control intestinal step (without
pancreatin and BS); : intestinal step (with pancreatin and BS); : simulated intestinal fluid control
(SIF). Unpaired t-test (two-tailed p-value < 0.05); values with different letters are statistically significant
when comparing between the set of samples or gastrointestinal digestion and control. Statistical
significance vs SIF is reported in the text..........................................................................................178 Figure 6.5. SEM analysis of uncooked (Figure 6.5A) and cooked (Figure 6.5B) MYC, white button
WBM, OAT, and BAR before and after simulated GI digestion. ...................................................181
--------------------------------------------------------------CHAPTER 8----------------------------------------------------------
Figure 8.1 Quality control and filtering contaminants using KneadData (Biobakery/KneadData,
Accessed: 10/11/2021). The plot shows the mean number of reads removed for samples treated with
each substrate and the number of reads retained for downstream analysis. KneadData was used for
XVIII
quality control (trim adaptor sequences, remove low quality and short reads), and remove
contaminant reads and repetitive sequences. ................................................................................. 213 Figure 8.2. MDS plot from the taxonomic composition estimated by MetaPhlAn, where the samples
are grouped for time points (0, 4, 8, 24, 48, 72 h) of colonic in vitro fermentation of MYC (- - at 72
h), OAT (- - at 72 h), and CKN (- - at 72 h)................................................................................... 214 Figure 8.3. MDS plot of the microbial population grouped for donors (n = 6) of colonic in vitro
fermentation of MYC ( and - -), OAT ( and - -), and CKN ( and - -). ............................... 215 Figure 8.4. Relative abundance for the 10 most abundant species developing from CNT, MYC,
OAT, and CKN during colonic in vitro fermentation (0, 4, 8, 24, 58, and 72 h). ......................... 216 Figure 8.5 SCFA (Figure 8.5A, acetate; Figure 8.5B, propionate ; Figure 8.5C, butyrate) measured by
NMR from CNT ( ) , MYC ( ), OAT ( ), and CKN ( ) during 72 h of in vitro colonic
fermentation. One-way ANOVA, Dunnett post hoc test (p-value < 0.05); * p-value < 0.05, ** p-value
< 0.01, *** p-value < 0.001 are statistically significant compared to the CNT. Letters are used to
report statistical differences within the substrates (e.g., MYC vs OAT, MYC vs CKN, OAT vs CKN).
...................................................................................................................................................... 219 Figure 8.6. Microbial metabolites (Figure 8.6A, lactate ; Figure 8.6B, formate; Figure 8.6C, valerate;
Figure 8.6D, ethanol) measured by NMR from CNT( ) , MYC ( ), OAT ( ), and CKN ( )
during 72 h of in vitro colonic fermentation. One-way ANOVA, Dunnett post hoc test (p-value <
0.05); * p-value < 0.05, ** p-value < 0.01, *** p-value < 0.001 are statistically significant compared
to the CNT. Letters are used to report statistical differences within the substrates (e.g., MYC vs OAT,
MYC vs CKN, OAT vs CKN). ..................................................................................................... 220 Figure 8.7. BCFA (Figure 8.7A, isovalerate; Figure 8.7B, isobutyrate) measured by NMR from CNT
( ) , MYC ( ), OAT ( ), and CKN ( ) during 72 h of in vitro colonic fermentation. One-way
ANOVA, Dunnett post hoc test (p-value < 0.05); * p-value < 0.05, ** p-value < 0.01, *** p-value <
0.001 are statistically significant compared to the CNT. Letters are used to report statistical
differences within the substrates (e.g., MYC vs OAT, MYC vs CKN, OAT vs CKN). ................. 222 Figure 8.8. Optical microscopy in epi-fluorescence (with CFW) of MYC at 0, 4, 8, 24, 48, and 72 h
of in vitro colonic fermentation. .................................................................................................... 224
XIX
List of Tables
----------------------------------------------------------------CHAPTER 1-----------------------------------------------------------
Table 1.1 Nutritional composition of MYC ingredient on a DW basis (wt%). Data source adapted from
Mycoprotein.org (Accessed: 01/02/2020). ........................................................................................... 7 Table 1.2. PDCAAS of selected food proteins. Data source adapted from Mycoprotein.org (Accessed:
01/02/2020). ........................................................................................................................................ 8 Table 1.3. Micronutrient composition of MYC. Data source adapted from Mycoprotein.org (Accessed:
01/02/2020). % Percentage (%) Recommended Daily Allowance (RDA) values taken from the National
Health Service (NHS) guidelines (Accessedç 27/03/2022) .................................................................. 9 Table 1.4. Comparison of general biological characteristics of fungus and plant kingdoms (exceptions
exist). Adapted from Deacon (2013). ................................................................................................ 15
---------------------------------------------------------------CHAPTER 2-----------------------------------------------------------
Table 2.1. Volume (mL) of each electrolyte solution that was included in 800 mL of concentrated
simulated fluid (1.25x) for each digestion phase (e.g., simulated salivary fluid (SSF), simulated gastric
fluid (SGF) and simulated intestinal fluid (SIF)). Data from Minekus et al. (2014). .......................... 54 Table 2.2. List of microscopy dyes with (acronyms), application, and staining properties. IN the table,
B: Brightfield; EF: Epi-fluorescence with Olympus BX60 microscope; *EF: Epi-fluorescence with
Zeiss Axio imager M2 fluorescence microscope; CLSM: Confocal. ................................................. 79
---------------------------------------------------------------CHAPTER 3-----------------------------------------------------------
Table 3.1. Composition of the chemical buffers used for protein extraction. ................................... 89
---------------------------------------------------------------CHAPTER 4-----------------------------------------------------------
Table 4.1. Average ± standard error of apparent Vmax and Km obtained from Michaelis-Menten plot
after kinetic digestion of 5 mg/mL of starch in the presence of 0, 5, 10, 20 mg/mL of MYC. ..........126
Table 4.2. Protein concentration and moles dye per mole protein value of the FITC--amylase
fractions ...........................................................................................................................................128
---------------------------------------------------------------CHAPTER 5-----------------------------------------------------------
Table 5.1. List of EMP quantified by LC-MS/MS and identified in the UniProt database from
Fusarium venenatum organism with molecular weight > 37 kDa. In the Table, A refers to EMP digested
with trypsin, B refers to EMP digested with pepsin + trypsin. Unpaired t-test with Welch’s correction
(two-tailed p-value < 0.05); No statistically significant differences found in the same protein between A
and B. Values represent the average ± SD of 3 replicates unless stated († n = 2). ...........................155
---------------------------------------------------------------CHAPTER 6-----------------------------------------------------------
Table 6.1. Protein and carbohydrate content in total weight percentage (wt%) from the whole tested
samples on a dry weight basis (DW). 1 Information available online at Mycoprotein.org (Accessed:
01/02/2020); 2 Information provided by the manufacturer on a wet weight basis and converted in DW
after gravimetric analysis by removing the water via freeze-drying process; 3 Information provided by
the manufacturer. .............................................................................................................................166
Table 6.2. Total -glucan
content of tested (uncooked and cooked) mycoprotein (MYC), white button
mushroom (WBM), oat (OAT), and barley (BAR) before simulated GI digestion in total weight
percentage (wt%) on a DW basis.
Unpaired t-test (two-tailed p-value < 0.05) comparing the respective
uncooked sample vs the cooked; values with different letters are statistically significant. ..................172
---------------------------------------------------------------CHAPTER 7------------------------------------------------------------
Table 7.1. Concentrations of ergothioneine (ERG), protocatechuic acid (PCA), and coumaric acid
(COU) after chemical extraction from samples. Concentrations are expressed as g/g ± SD. n/d is not
XX
detected. Unpaired t-test (two-tailed, p-value < 0.05); statistically significant comparisons are described
in the text. ........................................................................................................................................193 Table 7.2. Release of ERG after simulated GI digestion. Control gastric is the digestion without
enzymes and BS; gastric is 2 h of gastric digestion with pepsin; control intestinal is the digestion without
enzymes and BS; intestinal is 2 h of gastric followed by 2 h of intestinal digestion. Concentrations are
expressed as g/g ± SD. Unpaired t-test (two-tailed, p-value < 0.05); statistically significant comparisons
are described in the text. ..................................................................................................................195
---------------------------------------------------------------CHAPTER 8-----------------------------------------------------------
Table 8.1. List of mineral salts used for the trace mineral solution prepared in 0.02 M HCl, made up
to 500 mL of ultra-pure water. .........................................................................................................202 Table 8.2. List of mineral salts (left) used for the trace mineral solution prepared in 0.02 M HCl,
making it up to 500 mL of ultra-pure water, and fatty acids (right) used for the trace mineral solution
prepared in 200 mL of 0.2 M NaOH. .............................................................................................203 Table 8.3. List of vitamins used for the vitamin solution prepared in 500 mL with 27.35 g KH2PO4.
.........................................................................................................................................................204
Table 8.4. Total protein, reducing sugars and -glucans from the whole respective sample (wt%)
remaining in the substrates pellet (MYC, OAT, and CKN) after simulated upper GI digestion and
before inoculation in the colonic batch fermentation. n/d: not detected; n/a: not applicable. ..........211
XXI
List of Equations
----------------------------------------------------------------CHAPTER 2-----------------------------------------------------------
Equation 2.1. Equation of the reaction of BS in the presence of Thio-NAD that are converted into 3-
ketosteroids and Thio-NADH (> 0.1 mM) by the enzyme 3-−hydroxysteroid dehydrogenase (3--
HSD, > 2 kU/L). ............................................................................................................................... 68 Equation 2.2. Equation of the reaction happening when 3-ketosteroids are in the presence of NADH
(> 0.1 mM) and are converted again into BS and NAD by 3--HSD................................................ 69
Equation 2.3. Equation of viscosity (η) as a function of the shear stress divided by the strain rate. ... 76
---------------------------------------------------------------CHAPTER 4-----------------------------------------------------------
Equation 4 1. Michaelis-Menten equation. ......................................................................................114 Equation 4.2. Lineweaver-Burk plot equation. .................................................................................114 Equation 4.3. Mixed reversible inhibition of an enzyme equation. ..................................................114 Equation 4.4. The equation to calculate protein concentration after enzymatic labelling with FITC.
.........................................................................................................................................................116 Equation 4.5. The equation to calculate moles dye per mole protein after enzymatic labelling with
FITC. ...............................................................................................................................................116
---------------------------------------------------------------CHAPTER 6-----------------------------------------------------------
Equation 6.1. The equation for the total -glucans (wt%), based on the total -glucan content measured
before digestion in each sample. ......................................................................................................169
XXII
List of Abbreviations
AA Amino Acids
BAEE N-Benzoyl-L-Tyrosine Ethyl Ester
BAR Barley Bran
BCA Bicinchoninic Acid Assay
BCFA Branched-Chain Fatty Acids
BS Bile Salts
BSA Bovine Serum Albumin
CFW Calcofluor white
CI95% Confidence Interval at 95%
CKN Chicken
CLSM Confocal Laser Scanning Microscopy
CNT Control
COU Coumaric Acid
CVD Cardiovascular Diseases
DF Dietary Fibre
DIAAS Digestible Indispensable Amino Acid Score
DNA Deoxyribonucleic Acid
DW Dry Weight
DRI Driselase™
D4,3 Volume equivalent sphere diameter mean
EB Evans Blue
EMP Extracted Mycoprotein Proteins
ERG Ergothioneine
FCF Fast Green FCF
FCW Fungal Cell Wall
XXIII
FFA Free Fatty Acids
FITC Fluorescein Isothiocyanate Isomer I
GB Glass Beads
GI Gastrointestinal
GIT Gastrointestinal Tract
GOPOD Glucose Oxidase/Peroxidase Reagent
HDL High-Density Lipoprotein
HOMO Homogenisation
I Inhibitor
INC Incubation
LCB Lactophenol Cotton Blue
LC-MS Liquid Chromatography-Mass Spectrometry
LDL Low-Density Lipoprotein
MDS Multidimensional Scaling
MLK Milk
MYC Mycoprotein
NMR Proton Nuclear Magnetic Resonance
OAT Oat Bran
OPLS-DA Orthogonal Projection to Latent Structures-Discriminant Analysis
O/W Oil in Water
PAHBAH p-Hydroxybenzoic Acid Hydrazide
PBS Phosphate-Buffered Saline
PCA Protocatechuic Acid
PCR Polymerase Chain Reaction
PCW Plant Cell Wall
PDCAAS Protein Digestibility-Corrected Amino Acid Score
XXIV
PCW Plant Cell Wall
RAW-MYC Raw Mycoprotein (Before RNA Depletion)
RHM Ranks Hovis McDougall
RNA Ribonucleic Acid
SCFA Short-Chain Fatty Acids
SD Standard Deviation
SDS-PAGE Sodium Dodecyl Sulphate Polyacrylamide Gel
SEM Scanning Electronic Microscopy
SGF Simulated Intestinal Fluid
SIF Simulated Intestinal Fluid
SON Sonication
SSF Simulated Salivary Fluid
STA Starch
TAME p-Toluene-Sulfonyl-L-Arginine Methyl Ester
TB Toluidine Blue
TBT Tributyrin
TNB 5-Thio-2-Nitrobenzoic Acid
T2D Type-2 Diabetes
UV/Vis Ultraviolet/visible
WBM White Button Mushroom
WO/E Without Enzymes
WPI Whey Protein Isolate
Chapter 1: Introduction & Literature Review
1 | P a g e
Chapter 1
Introduction & Literature Review
Chapter 1: Introduction & Literature Review
2 | P a g e
1.1 Introduction
An increasing body of evidence from in vivo studies links the food structure and effects
of dietary fibre (DF) during digestion on human health (Buttriss & Stokes, 2008; Fardet, 2010).
However, in vivo studies tend to lack a deep understanding of the biochemical mechanisms
underlying the effects. Hence, the mechanisms underpinning biological responses that can
enhance human health are not entirely understood. The plant cell wall (PCW) is a source of
DF that has gained much attention in the last decades, and there is a considerable contribution
of studies showing its health effects and importance during gastrointestinal (GI) digestion
(Dreher, 2018; Klementova et al., 2019; Threapleton et al., 2013). Similarly, the consumption
of fungi has been associated with health effects (Kim et al., 2019; Wu & Xu, 2015).
Nonetheless, the fungal cell wall (FCW), despite some similarities with the plant counterpart,
differs in the structural organisation (Section 1.3.1), and its behaviour and fate during human
digestion are still poorly understood.
Accordingly, this thesis literature review will focus on mycoprotein (MYC) as a fungal
ingredient that retains its filamentous and cellular structure that is a source of DF and an
alternative to plant-based ingredients. As the name might suggest, MYC is not simply a fungal
protein extract but comprises intact, filamentous cells that contribute to the texture of the final
products (Quorn™). It is, therefore, an ideal fungal sample to study since its structure is well
defined by filamentous cells. Furthermore, the findings of clinical trials over the years provide
consistent evidence of the health benefits after MYC consumption that requires a more in-
depth investigation regarding the biochemical mechanisms that trigger them.
The origin, industrial processing, and nutritional facts of MYC are discussed (Section 1.2)
before discussing the importance of the food structure, with particular attention to the FCW
and its comparison with PCW (Section 1.3). An overview of human digestion is reviewed
(Section 1.4) to highlight the digestive apparatus efficiency in breaking down food to obtain
Chapter 1: Introduction & Literature Review
3 | P a g e
nutrients and, therefore, energy. The digestion and fate of macronutrients such as proteins,
carbohydrates (including DF), and lipids in the gastrointestinal tract (GIT), as well as minor
compounds (i.e., phenolic acids and ergothioneine), is discussed since their release or
digestion in the presence of MYC is investigated in detail in the following chapters.
Furthermore, the in vitro approach is discussed in this chapter (Section 1.5) as a crucial tool
to understand the underlying mechanisms of the health effects observed by in vivo studies.
The key findings of the in vivo studies on human health after consumption of MYC are
discussed (Section 1.6). These findings are examined and compared to studies on other fungal
and plant samples, which are crucial for developing the hypotheses of this thesis and
understanding the biochemical mechanisms of how MYC can trigger health effects. Finally,
the potential mechanisms (Section 1.7) underlying the health effects promoted by MYC
consumption are discussed to introduce the aims and objectives of this thesis (Section 1.8).
1.2 Mycoprotein: Discovery, Production and Nutrition Facts
As mentioned above, MYC is a food ingredient used in meat replacements products
marketed as Quorn™. MYC is produced by the fermentation of the filamentous fungus
Fusarium venenatum (ATCC PTA-2684) from the Ascomycota division (Denny, Aisbitt, &
Lunn, 2008).
As filamentous fungi grow, they develop long hyphae that are filamentous structures that
form a mycelium (Carlile, 1995). MYC-based products are processed in such a way to preserve
the mycelial structure (Figure 1.1), containing intact cells that resemble the protein fibrils found
in meat tissue. This allows the products to make an excellent meat replacement from a
sustainable protein source (Finnigan, Needham, & Abbott, 2017).

Chapter 1: Introduction & Literature Review
4 | P a g e
Figure 1.1 Optical image of filamentous cells present in the MYC ingredient, using brightfield
microscopy (x20).
1.2.1 The Origin of Mycoprotein
During the 1960s, it was predicted that an increase in the world population would have
put pressure on the food chain supply and increased the possibility of malnutrition and famine
(Lam, 2011). Therefore, the Ranks Hovis McDougall (RHM) Research Centre started
investigating a method to convert carbohydrates from starch into protein-rich food for human
consumption. This led to discovering the filamentous fungus Fusarium venenatum in a soil
sample in 1967. It was selected from hundreds of thousands of micro-organisms that were
tested from soil samples all around the world. The filamentous fungus was discovered in
Marlow, UK, and it was initially misidentified as Fusarium graminearum, but now has been
reclassified as Fusarium venenatum (ATCC PTA-2684). After a 10-year evaluation
programme, the RHM obtained permission to sell MYC for human consumption in 1985
(Whittaker, Johnson, Finnigan, Avery, & Dyer, 2020). However, the rising global population

Chapter 1: Introduction & Literature Review
5 | P a g e
and increased demand for meat protein are still putting enormous pressure on the food supply
chain (Kummu et al., 2017). Thus, MYC represents a viable and sustainable alternative with a
much smaller carbon footprint than beef (Finnigan 2011). Nowadays, MYC forms the basis of
all Quorn™ products sold in the UK, several countries in Europe, the USA, and Australia
(Finnigan, Needham, & Abbott, 2017).
1.2.2 Industrial Process
MYC is produced by continuous fermentation of the filamentous fungus Fusarium
venenatum in 40-metre-high fermenters (Figure 1.2). After the sterilisation of the fermenter to
avoid the concomitant growth of undesired microorganisms, a glucose/water solution is added
as a carbon source, which is a medium that permits the movement of the hyphae. The
fermentation incorporates a continuous feed of nutrients, including microelements such as
biotin, potassium, magnesium, phosphate, and ammonia as a nitrogen source. The
microorganism uses the nutrients to grow, and the increased biomass is removed from the
fermenter every 5 to 6 h. The harvested biomass is presented as a dough that is heated (> 68℃
for 30 – 45 min) to activate nuclease enzymes to reduce the RNA content (Ward, 1998) from
10% to 2% (dry weight (DW)). This step is performed to comply with the World Health
Organization recommendations to reduce serum uric acid concentration that is a predictor of
gout (Edozien, Udo, Young, & Scrimshaw, 1970; Waslien, Calloway, & Margen, 1968).
Afterwards, the biomass is rapidly heated at 90℃ by injecting steam at 170℃ before being
transferred to the centrifuges where water and the mononucleotides released from the RNA
heating removal step are discarded. Finally, the biomass is chilled. The latter is a critical step
because it helps form ice crystals that push the fibres together, creating fibrous bundles that
give MYC its meat-like texture. The product at this stage is called MYC.
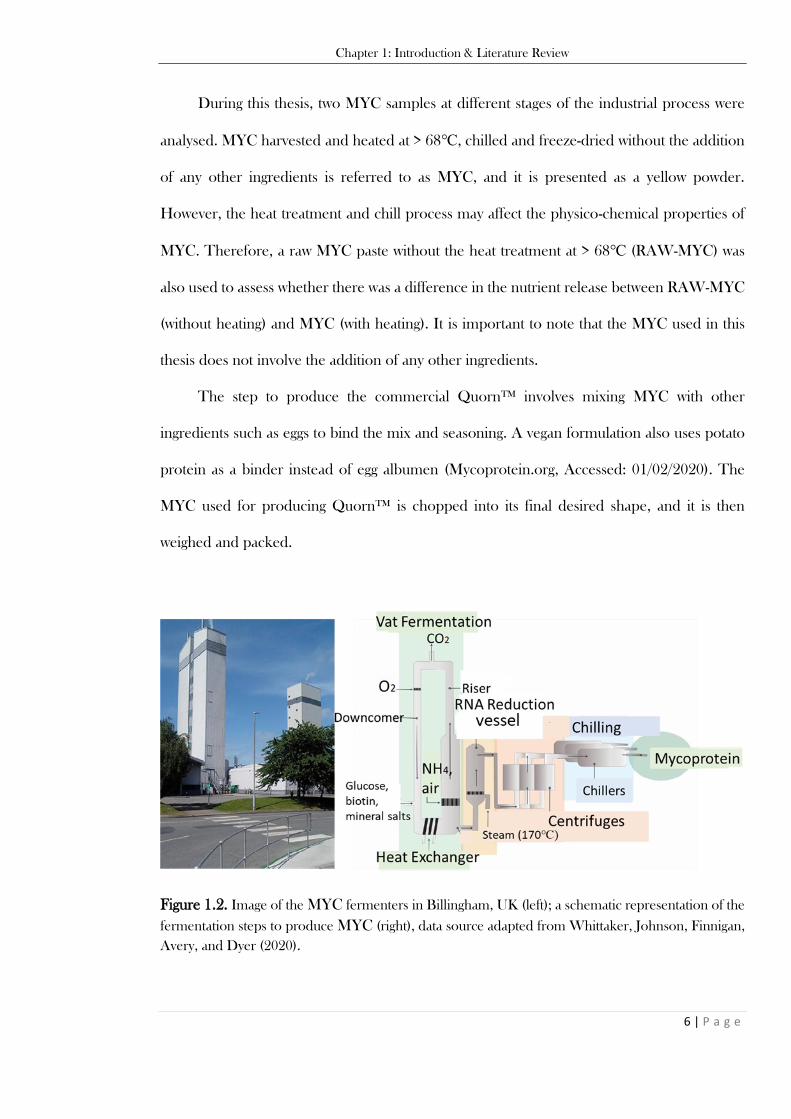
Chapter 1: Introduction & Literature Review
6 | P a g e
During this thesis, two MYC samples at different stages of the industrial process were
analysed. MYC harvested and heated at > 68℃, chilled and freeze-dried without the addition
of any other ingredients is referred to as MYC, and it is presented as a yellow powder.
However, the heat treatment and chill process may affect the physico-chemical properties of
MYC. Therefore, a raw MYC paste without the heat treatment at > 68℃ (RAW-MYC) was
also used to assess whether there was a difference in the nutrient release between RAW-MYC
(without heating) and MYC (with heating). It is important to note that the MYC used in this
thesis does not involve the addition of any other ingredients.
The step to produce the commercial Quorn™ involves mixing MYC with other
ingredients such as eggs to bind the mix and seasoning. A vegan formulation also uses potato
protein as a binder instead of egg albumen (Mycoprotein.org, Accessed: 01/02/2020). The
MYC used for producing Quorn™ is chopped into its final desired shape, and it is then
weighed and packed.
Figure 1.2. Image of the MYC fermenters in Billingham, UK (left); a schematic representation of the
fermentation steps to produce MYC (right), data source adapted from Whittaker, Johnson, Finnigan,
Avery, and Dyer (2020).

Chapter 1: Introduction & Literature Review
7 | P a g e
1.2.3 Nutrition Facts
Overall, MYC is considered a good source of protein (Dunlop et al., 2017; Solomons,
1987) and contains no trans fats or cholesterol, but some final products (Quorn™) may
contain minimal amounts of cholesterol due to the egg albumen used during the industrial
process to allow the formation of a texture similar to meat. The nutritional composition of
MYC per 100 g on a DW basis is listed in Table 1.1.
MYC is a rich source of DF, accounting for 24 wt% DW, of which 35% is polymeric n-
acetyl glucosamine (chitin), and 65% is 1,3-1,6 -glucan (Denny, Aisbitt, & Lunn, 2008). These
fibres are the main components of the cell wall. DF is classified as an indigestible carbohydrate
for human digestive enzymes (Dhingra, Michael, Rajput, & Patil, 2012), representing a
significant and complex component that defines the cellular structure and can control the
release of nutrients from the intracellular compartments.
Table 1.1 Nutritional composition of MYC ingredient on a DW basis (wt%). Data source adapted from
Mycoprotein.org (Accessed: 01/02/2020).
Nutrient Amount (wt% DW)
Protein 44
Carbohydrate (glycogen) 10
of which sugars 2
Dietary fibre 24
1,3-1,6 −glucans 16
Fat 12
of which Saturates
of which Mono-unsaturated
of which Poly-unsaturated
Poly-unsaturated (−3 Linolenic acid)
2.8
2
7.2
1.6
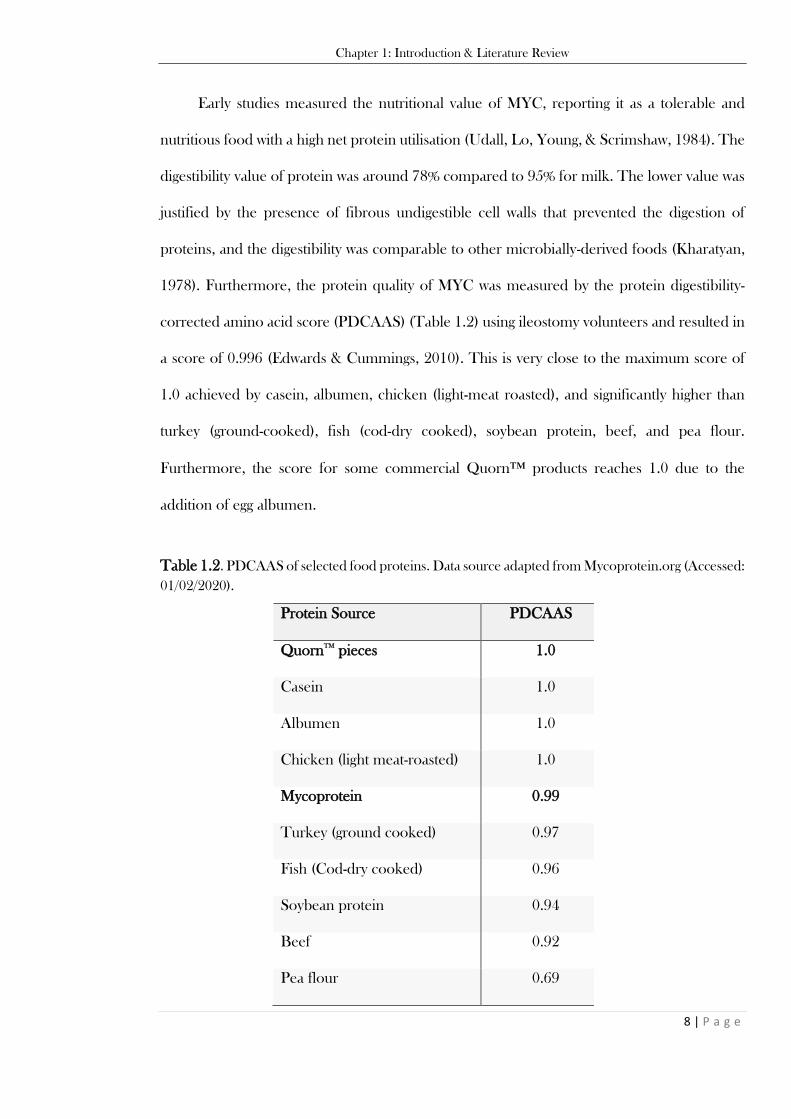
Chapter 1: Introduction & Literature Review
8 | P a g e
Early studies measured the nutritional value of MYC, reporting it as a tolerable and
nutritious food with a high net protein utilisation (Udall, Lo, Young, & Scrimshaw, 1984). The
digestibility value of protein was around 78% compared to 95% for milk. The lower value was
justified by the presence of fibrous undigestible cell walls that prevented the digestion of
proteins, and the digestibility was comparable to other microbially-derived foods (Kharatyan,
1978). Furthermore, the protein quality of MYC was measured by the protein digestibility-
corrected amino acid score (PDCAAS) (Table 1.2) using ileostomy volunteers and resulted in
a score of 0.996 (Edwards & Cummings, 2010). This is very close to the maximum score of
1.0 achieved by casein, albumen, chicken (light-meat roasted), and significantly higher than
turkey (ground-cooked), fish (cod-dry cooked), soybean protein, beef, and pea flour.
Furthermore, the score for some commercial Quorn™ products reaches 1.0 due to the
addition of egg albumen.
Table 1.2. PDCAAS of selected food proteins. Data source adapted from Mycoprotein.org (Accessed:
01/02/2020).
Protein Source PDCAAS
QuornTM
pieces 1.0
Casein 1.0
Albumen 1.0
Chicken (light meat-roasted) 1.0
Mycoprotein 0.99
Turkey (ground cooked) 0.97
Fish (Cod-dry cooked) 0.96
Soybean protein 0.94
Beef 0.92
Pea flour 0.69
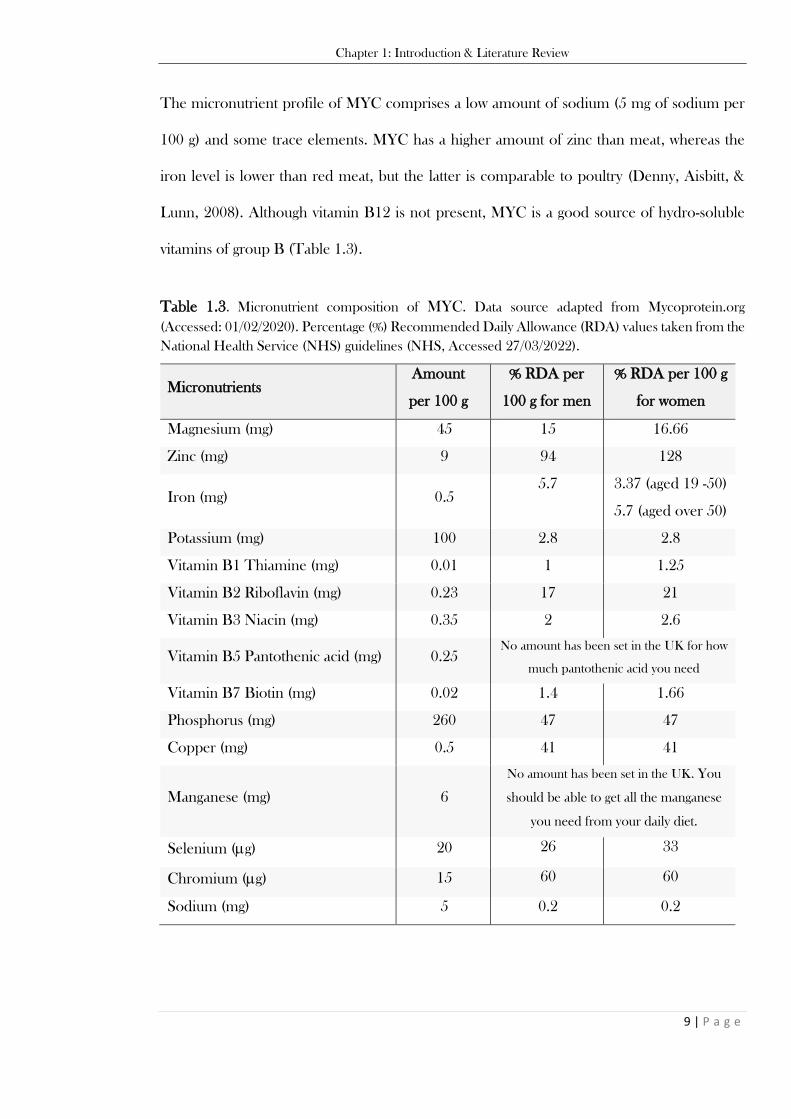
Chapter 1: Introduction & Literature Review
9 | P a g e
The micronutrient profile of MYC comprises a low amount of sodium (5 mg of sodium per
100 g) and some trace elements. MYC has a higher amount of zinc than meat, whereas the
iron level is lower than red meat, but the latter is comparable to poultry (Denny, Aisbitt, &
Lunn, 2008). Although vitamin B12 is not present, MYC is a good source of hydro-soluble
vitamins of group B (Table 1.3).
Table 1.3. Micronutrient composition of MYC. Data source adapted from Mycoprotein.org
(Accessed: 01/02/2020). Percentage (%) Recommended Daily Allowance (RDA) values taken from the
National Health Service (NHS) guidelines (NHS, Accessed 27/03/2022).
Micronutrients Amount
per 100 g
% RDA per
100 g for men
% RDA per 100 g
for women
Magnesium (mg) 45 15 16.66
Zinc (mg) 9 94 128
Iron (mg) 0.5 5.7 3.37 (aged 19 -50)
5.7 (aged over 50)
Potassium (mg) 100 2.8 2.8
Vitamin B1 Thiamine (mg) 0.01 1 1.25
Vitamin B2 Riboflavin (mg) 0.23 17 21
Vitamin B3 Niacin (mg) 0.35 2 2.6
Vitamin B5 Pantothenic acid (mg) 0.25 No amount has been set in the UK for how
much pantothenic acid you need
Vitamin B7 Biotin (mg) 0.02 1.4 1.66
Phosphorus (mg) 260 47 47
Copper (mg) 0.5 41 41
Manganese (mg) 6
No amount has been set in the UK. You
should be able to get all the manganese
you need from your daily diet.
Selenium (g) 20 26 33
Chromium (g) 15 60 60
Sodium (mg) 5 0.2 0.2

Chapter 1: Introduction & Literature Review
10 | P a g e
1.3 Food Structure Importance: The Fungal and Plant Cell Walls
Food is more than the sum of its parts. So often, foods have been considered for their
micro or macronutrient composition in terms of nutritional properties and biological effects.
However, the food structure (or matrix) is gaining more attention for its role in digestion and
modulation of subsequent physiological responses (Lundin, Golding, & Wooster, 2008;
Mackie, 2017; McClements, Decker, Park, & Weiss, 2008; Mulet-Cabero, Mackie, Brodkorb,
& Wilde, 2020). Food structure can be modified by food processing such as thermal
processing, extrusion, fermentation, homogenisation, drying and milling. These processes can
enhance the bioaccessibility and digestibility of nutrients (Grundy, Wilde, Butterworth, Gray,
& Ellis, 2015; Latunde-Dada et al., 2014; Mulet-Cabero, Mackie, Wilde, Fenelon, &
Brodkorb, 2019) as well as reduce the nutrition quality of micronutrients (Oghbaei & Prakash,
2016). The cell wall is an example of a food structure in plants and fungi on a microscopic
level. The cell wall is a polymeric structure, mainly composed of cellulose in plants and β-
glucans and chitin in fungi (Kang et al., 2018; Keegstra, 2010). From a nutritional viewpoint,
the cell wall can be considered the primary source of DF and can also provide a physical
barrier that controls the bioaccessibility of nutrients within the plant and fungal cells. DF is
classified as a carbohydrate indigestible to human digestive enzymes (Dhingra, Michael,
Rajput, & Patil, 2012). Indeed, the monosaccharides of DF are often connected by β-links
which human enzymes cannot hydrolyse; DF also comprises non-digestible α-linked
polysaccharides such as the pectin rhamnogalacturonans I (Lemaire et al., 2020).
1.3.1 The Fungal Cell Wall
The FCW can be present in a diet within edible mushrooms, the spore-bearing fruiting
bodies of filamentous fungi (Cheung, 2013). Fungi can be multicellular organisms organised
as hyphae that are multiple repeated cells to form branching structures, which compose the
Chapter 1: Introduction & Literature Review
11 | P a g e
mycelium, or unicellular organisms such as yeasts (Naranjo‐Ortiz & Gabaldón, 2020). The
latter is mainly used for fermentation processes such as bread baking and beverages brewing
(e.g., beer, wine, kombucha) (Reed, 2012). In the same way, filamentous fungi can be used for
fermentation purposes (e.g., koji uses Aspergillus oryzae, tempeh uses Rhizopus oligosporus,
mould-ripened cheeses use Penicillium camemberti or roqueforti). Fungi can also be used in
association with yeasts (e.g., cured meats can use Debaryomyces hansenii, and Penicillium
species; sake or rice wine uses Aspergillus oryzae, and Streptomyces cerevisiae; shoyu (soy
sauce) uses Aspergillus oryzae or sojae Hansenula species and Zygosaccharomyce rouxii)
(Venturini Copetti, 2019). Another way to consume filamentous fungi is represented by MYC,
which is not a mushroom, but the fermented mycelial biomass of the filamentous fungus
Fusarium venenatum (ATCC PTA-2684) from the Ascomycota division.
According to the growth stage, the FCW organization can vary between species (Gow,
Latge, & Munro, 2017). Moreover, the cell walls of the fruiting bodies tend to have higher
glucan content than mycelia (McCleary & Draga, 2016). Indeed, Bak, Park, Park, and Ka
(2014) showed that different sections of the fruiting bodies of Lentinula edodes differ in the
-glucan content. The stipe, which is the stem that supports the cap (pileus), showed the
highest -glucan content compared to the mycelium. Unlike the differences between the cap
and stipe of mushrooms, MYC is likely to be compositionally more uniform due to its single-
cell organisation in the hyphal matrix.
A general scheme of the FCW is represented in Figure 1.3, which considers filamentous
fungi. To note that the representation will vary depending on the growth stage and species, and
exceptions exist. The FCW is a biological envelope whose organization changes between
different fungal phyla. However, the core skeletal components of the cell wall are -glucans.
Glucans with β-1-3 links are the most abundant, which account for around 65-90% of the DW
of the cell wall, whereas the remaining percentage comprises -glucans, β-1-6-glucans,
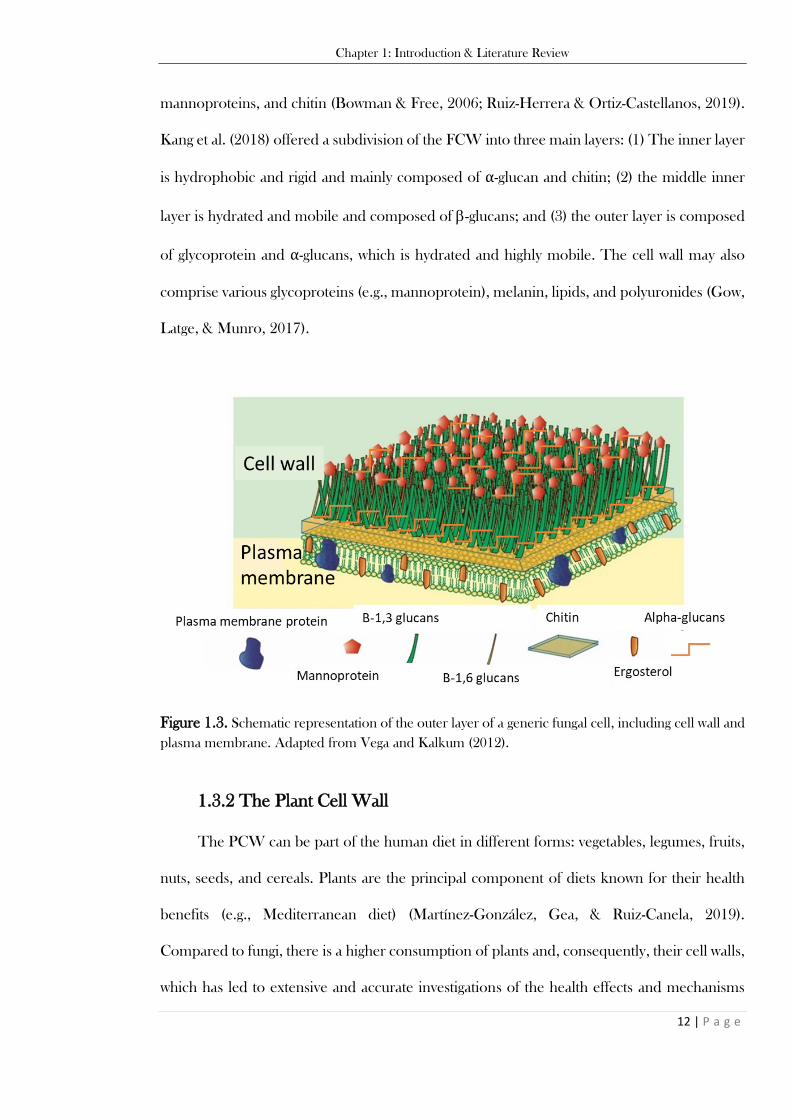
Chapter 1: Introduction & Literature Review
12 | P a g e
mannoproteins, and chitin (Bowman & Free, 2006; Ruiz-Herrera & Ortiz-Castellanos, 2019).
Kang et al. (2018) offered a subdivision of the FCW into three main layers: (1) The inner layer
is hydrophobic and rigid and mainly composed of α-glucan and chitin; (2) the middle inner
layer is hydrated and mobile and composed of -glucans; and (3) the outer layer is composed
of glycoprotein and α-glucans, which is hydrated and highly mobile. The cell wall may also
comprise various glycoproteins (e.g., mannoprotein), melanin, lipids, and polyuronides (Gow,
Latge, & Munro, 2017).
Figure 1.3. Schematic representation of the outer layer of a generic fungal cell, including cell wall and
plasma membrane. Adapted from Vega and Kalkum (2012).
1.3.2 The Plant Cell Wall
The PCW can be part of the human diet in different forms: vegetables, legumes, fruits,
nuts, seeds, and cereals. Plants are the principal component of diets known for their health
benefits (e.g., Mediterranean diet) (Martínez-González, Gea, & Ruiz-Canela, 2019).
Compared to fungi, there is a higher consumption of plants and, consequently, their cell walls,
which has led to extensive and accurate investigations of the health effects and mechanisms
Chapter 1: Introduction & Literature Review
13 | P a g e
mediated by plant-based foods. Conversely, the effects and mechanisms by which fungal
products and FCW can improve human health require more investigation.
A schematic representation of the PCW is illustrated in Figure 1.4. To note that the
representation will vary depending on the species, and exceptions exist. PCW can be generally
described as an envelope composed of a skeletal core of cellulose (unbranched and linear -
1-4 D-glucose units) that is combined with a hydrated-gel matrix comprising a range of
polysaccharides depending on plant species (e.g., pectin and hemicelluloses such as mixed-
linkage -glucans composed of linked glucosyl residues). The middle lamella is a pectin-rich
layer that links two plant cells together (Jarvis, Briggs, & Knox, 2003). The structure and
composition of the primary PCW vary according to the plant species, cell types of the same
plant species, and growth stage (Yokoyama, 2020). Other minor components such as
glycoproteins, phenolic acids, minerals and lignin contribute to completing the PCW
(Holland, Ryden, Edwards, & Grundy, 2020).
Furthermore, two main primary PCW types have been described. Legumes and other
dicotyledonous plant seeds have Type I primary cell walls rich in pectic polysaccharides and
xyloglucans. Conversely, cereals and other monocotyledonous grains have Type II cell walls
which tend to be lower in pectin but rich in arabinoxylans and mixed-linkage 1-3, 1-4 -D-
glucans (Waldron, Parker, & Smith, 2003). This different structure can affect nutrient
digestion. Indeed, a recent study comparing chickpea (type I) and durum wheat (type II)
tissues revealed different digestibility profiles due to differences in the cell wall properties, such
as permeability (Edwards, Ryden, Mandalari, Butterworth, & Ellis, 2021).
Moreover, some plant cells accumulate cellulose and lignin to form what is defined as
the secondary cell wall. The latter is less hydrated than primary cell walls, and the main
structural elements appear to be microfibrillar bundles rather than individual microfibrils
(Cosgrove & Jarvis, 2012). Overall, the DF in a diet is mainly consumed in the form of primary

Chapter 1: Introduction & Literature Review
14 | P a g e
cell walls since lignification in the secondary cell wall can decrease food palatability (Holland,
Ryden, Edwards, & Grundy, 2020; Waldron, Parker, & Smith, 2003).
Figure 1.4. Schematic representation of the outer layer of a generic plant cell, including cell wall and
plasma membrane. Adapted from Scheller and Ulvskov (2010).
1.3.3 Comparison of Fungal and Plant Cell Walls
Overall, the kingdoms of life of plants and fungi have similarities as well as significant
biological differences. Table 1.4 shows an overview that compares plant and fungi
characteristics, which is admittedly a generalisation as exceptions exist. Briefly, the two
organisms are eukaryotic as their cells have nuclei. Cell walls are the outer layer that defines
the cellular structure and retains membrane-bound organelles. Plants can perform
photosynthesis, transforming light energy into chemical energy (i.e., autotrophic).
On the other hand, fungi secrete enzymes into the extracellular environment to digest
and absorb nutrients (i.e., heterotrophic). The glucose storage of plants is starch, while

Chapter 1: Introduction & Literature Review
15 | P a g e
glycogen is present in many fungi. In general, the gametes for higher plants are eggs and pollen,
whereas fungi use spores.
Table 1.4. Comparison of general biological characteristics of fungus and plant kingdoms (exceptions
exist). Adapted from Deacon (2013).
Character Fungus Plant
Growth Hyphal tip or budding yeast Multicellular tissues
Nutrition Heterotrophic Autotrophic
Cell wall Chitin, − and −glucans Cellulose, hemicellulose, pectin, lignin
Carbon storage Glycogen, lipids, trehalose Starch, lipids, non-starch
polysaccharides
Membrane sterol Ergosterol Sitosterol, other plant sterols
Ergosterol is the principal sterol of the fungal cell membrane, while plants have different
phytosterols such as sitosterol. The structural organization and the composition of PCW and
FCW are similar as both cell walls are primarily composed of polysaccharides with links
which are indigestible in the upper human GIT. PCW and FCW share the presence of -
glucans in their cell walls. However, the glucosyl residues composing -glucans tend to be
linked by -1-3 and β-1-4 bonds in PCW, whereas -1-3 and β-1-6 are present in FCW.
Another critical difference between FCW and PCW is that fungi have chitin, a linear polymer
of N-acetylglucosamine units, whereas plants have cellulose, a polymer of D-glucose, and
pectin composed of galacturonic acid units. The dimensions of the cell walls may differ
substantially between the two kingdoms of life. Plant and fungal cell spatial distribution and
organisation are different as plant cells tend to form tissue structures with aggregated cells
(Steeves & Sawhney, 2017). In contrast, fungi tend to form separated hyphae/mycelium that
Chapter 1: Introduction & Literature Review
16 | P a g e
can potentially be more diffuse (e.g., higher surface exposure for human digestive enzymes)
than plant tissues. These differences can influence the bioaccessibility of nutrients retained
within the cell walls and differently influence digestion physiology. This mechanism is
discussed in Section 1.7.1.1.
Despite the different organisations of PCW and FCW, there are some analogies
between the two kingdoms of life. For example, a fibrous matrix (cell wall) with a robust but
dynamic structural nature and the ability to exert physiological effects in the GIT. The cell wall
is mainly composed of fibres classified as undigestible carbohydrates, in both plants and fungi,
due to -links that the human body cannot hydrolyse (Dhingra, Michael, Rajput, & Patil,
2012). Nevertheless, fibre is more than an inert and undigestible component as its structure
(e.g., cell wall) can influence digestion. For instance, studies have shown that DF from plant
cell walls can act as an envelope with a crucial role in controlling enzyme accessibility and
nutrient release (Grundy, Wilde, Butterworth, Gray, & Ellis, 2015). Both FCW and PCW can
have an impact on type-2 diabetes (T2D) or cardiovascular diseases (CVD) (Jeong et al., 2010;
Lunn & Buttriss, 2007; Martel et al., 2017; Scazzina, Siebenhandl-Ehn, & Pellegrini, 2013). A
delayed or sustained release of nutrients due to the encapsulation of nutrients (e.g., proteins)
within the cell wall could increase satiety signalling and decrease the glycaemic response
(Wilde, 2009). The cell wall porosity of both plant and fungi have been reported (De Nobel,
Klis, Priem, Munnik, & Van Den Ende, 1990; Grundy et al., 2016; Li, Gidley, & Dhital, 2019;
Walker et al., 2018). Moreover, the FCW has been described as molecularly more dynamic
and flexible than plant cell walls (Kang et al., 2018). This suggests that despite the enveloping
function, the cell wall can somehow be overcome by human digestive enzymes to access the
intracellular nutrients, or the nutrients per se can escape the cell wall to become accessible to
enzymes.
Chapter 1: Introduction & Literature Review
18 | P a g e
1.4 Human Digestion
Before discussing the in vivo studies that analysed MYC digestion and health impact, a
brief description of the human digestive system with insights on the bioaccessibility of nutrients
is discussed in this section. Furthermore, the characteristics and digestion of macronutrients
(i.e., protein, carbohydrates, and lipids) are discussed separately.
The digestive system can be divided into the upper and lower GIT. The upper GIT
involves the oral, gastric, and small intestinal phases in which the nutrients are released from
their food matrix (unless they are already accessible) and degraded into their constituents that
are then absorbed. The lower GIT is mainly represented by the large intestine, in which water
absorption takes place, and undigestible nutrients, such as fibre, are fermented by the resident
microbiota (Gouseti, Bornhorst, Bakalis, & Mackie, 2019). Figure. 1.5 shows the different
compartments of the digestive system and the main digestive enzymes, organs and molecules
that participate in the process of food digestion.
The ultimate aim of human digestion is to obtain sufficient energy and essential nutrients
from food to sustain the body. Nutrients can be divided into micronutrients (i.e., mineral salts
and vitamins) and macronutrients (i.e., proteins, carbohydrates, lipids, and water) (Mann &
Truswell, 2017). Therefore, human nutrition is the first step to introducing nutrients from the
food that are degraded and absorbed by the digestive system, then transformed into energy or
utilised in a range of physiological functions.
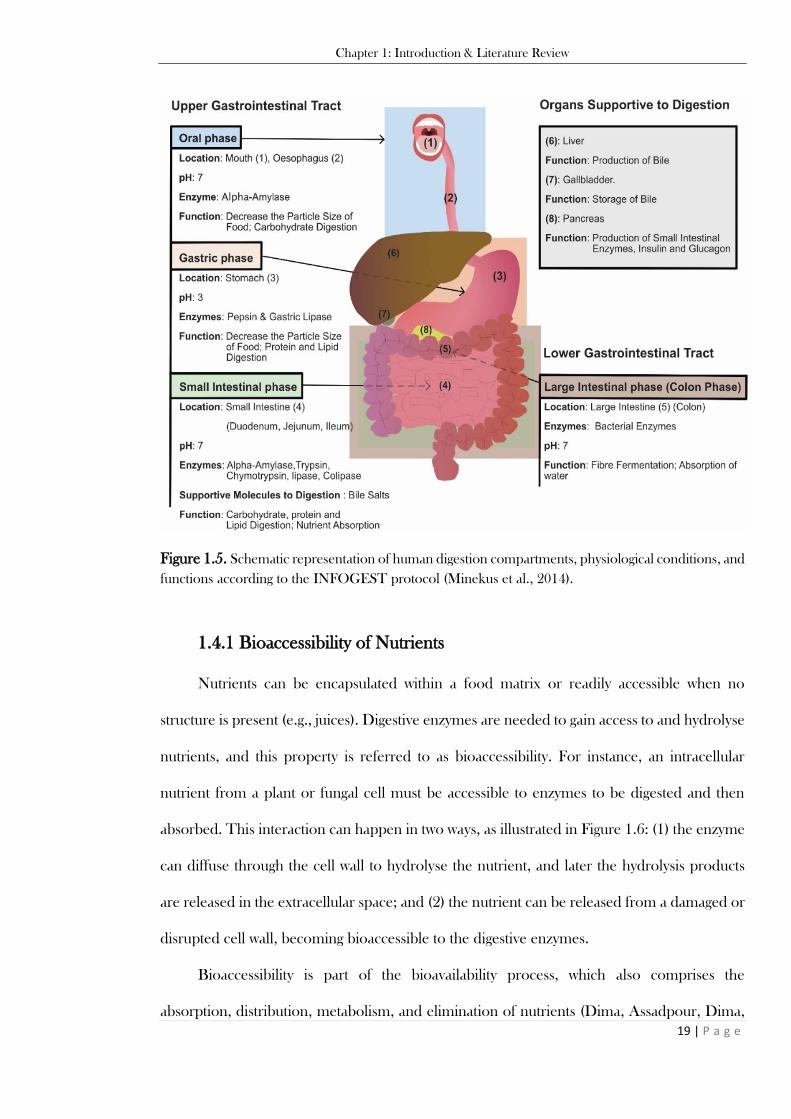
Chapter 1: Introduction & Literature Review
19 | P a g e
Figure 1.5. Schematic representation of human digestion compartments, physiological conditions, and
functions according to the INFOGEST protocol (Minekus et al., 2014).
1.4.1 Bioaccessibility of Nutrients
Nutrients can be encapsulated within a food matrix or readily accessible when no
structure is present (e.g., juices). Digestive enzymes are needed to gain access to and hydrolyse
nutrients, and this property is referred to as bioaccessibility. For instance, an intracellular
nutrient from a plant or fungal cell must be accessible to enzymes to be digested and then
absorbed. This interaction can happen in two ways, as illustrated in Figure 1.6: (1) the enzyme
can diffuse through the cell wall to hydrolyse the nutrient, and later the hydrolysis products
are released in the extracellular space; and (2) the nutrient can be released from a damaged or
disrupted cell wall, becoming bioaccessible to the digestive enzymes.
Bioaccessibility is part of the bioavailability process, which also comprises the
absorption, distribution, metabolism, and elimination of nutrients (Dima, Assadpour, Dima,

Chapter 1: Introduction & Literature Review
20 | P a g e
& Jafari, 2020). For example, the protein amount that can become accessible to proteases or
released from a matrix can be further degraded into peptides or amino acids (AA), which can
finally be absorbed, distributed, and metabolised.
Figure 1.6. Schematic representation of the structural/organisational difference between plant tissues
and fungal hyphae; bioaccessibility of nutrients in plant and fungal cells. Figure source: Colosimo et al.
(2021).
1.4.2 Macronutrients and Digestion
The three major macronutrients introduced by our diet are proteins, carbohydrates, and
lipids. The food matrix is mainly composed of these macromolecules that are used by the
human body for several functions necessary to maintain good health.
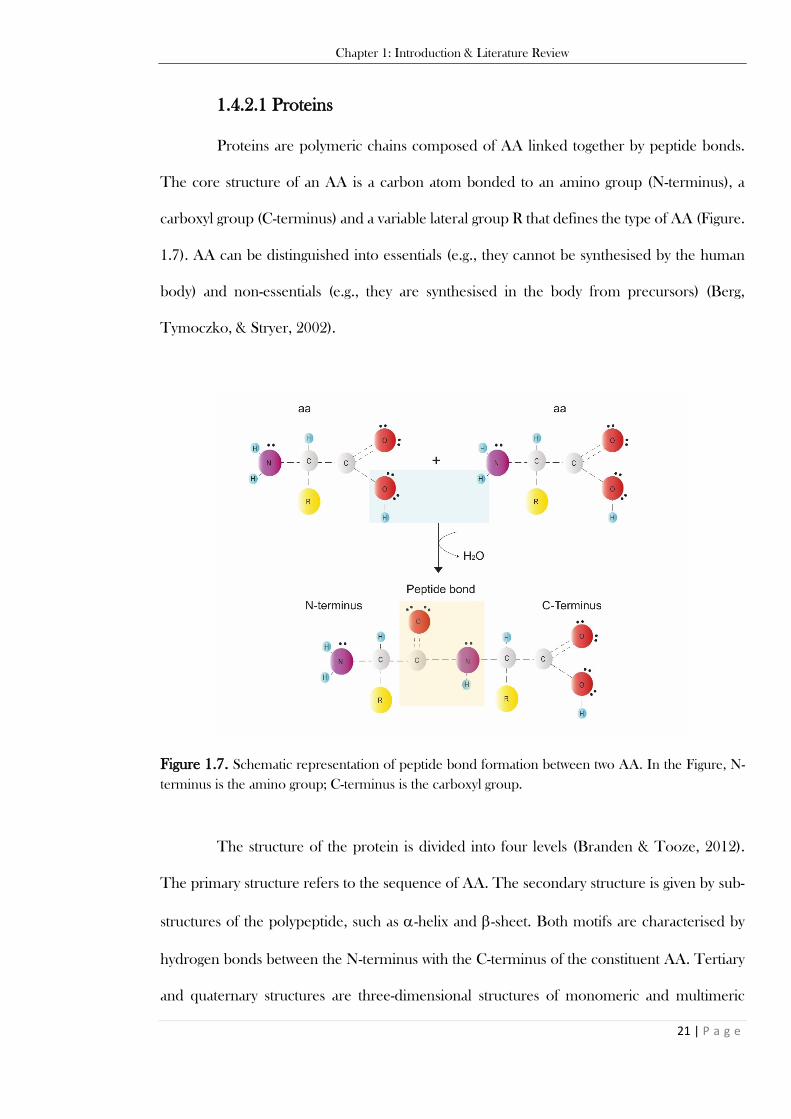
Chapter 1: Introduction & Literature Review
21 | P a g e
1.4.2.1 Proteins
Proteins are polymeric chains composed of AA linked together by peptide bonds.
The core structure of an AA is a carbon atom bonded to an amino group (N-terminus), a
carboxyl group (C-terminus) and a variable lateral group R that defines the type of AA (Figure.
1.7). AA can be distinguished into essentials (e.g., they cannot be synthesised by the human
body) and non-essentials (e.g., they are synthesised in the body from precursors) (Berg,
Tymoczko, & Stryer, 2002).
Figure 1.7. Schematic representation of peptide bond formation between two AA. In the Figure, N-
terminus is the amino group; C-terminus is the carboxyl group.
The structure of the protein is divided into four levels (Branden & Tooze, 2012).
The primary structure refers to the sequence of AA. The secondary structure is given by sub-
structures of the polypeptide, such as -helix and -sheet. Both motifs are characterised by
hydrogen bonds between the N-terminus with the C-terminus of the constituent AA. Tertiary
and quaternary structures are three-dimensional structures of monomeric and multimeric
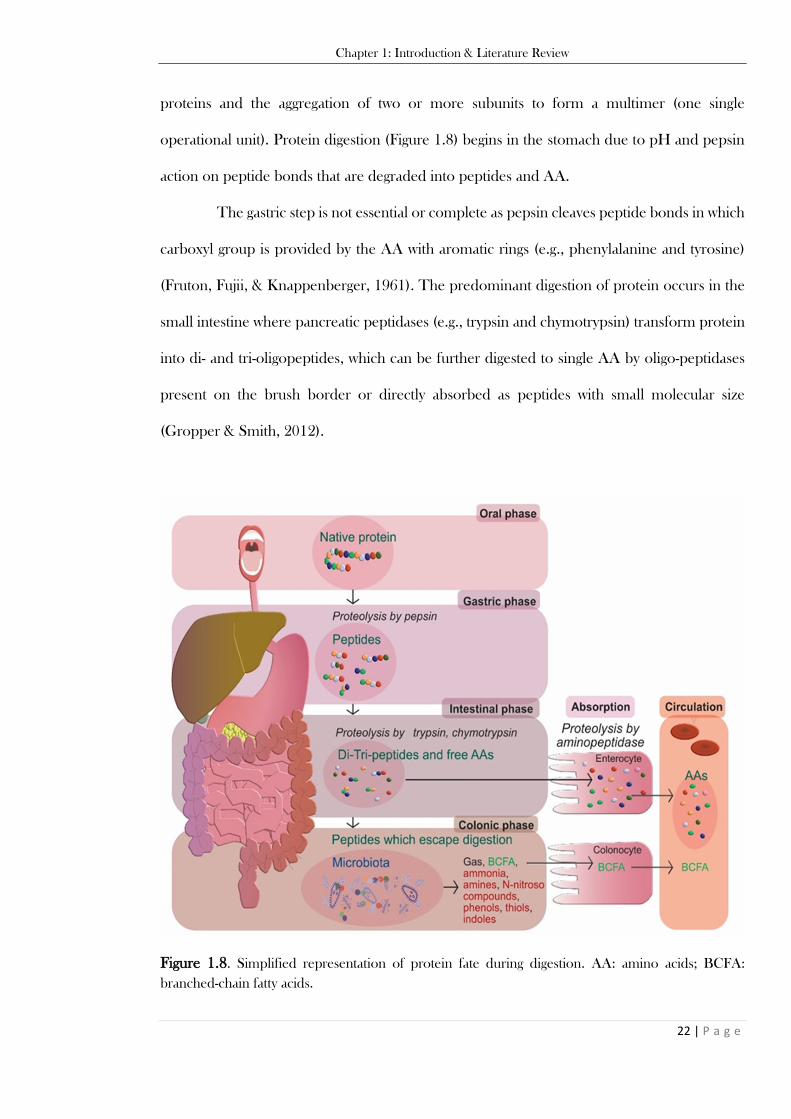
Chapter 1: Introduction & Literature Review
22 | P a g e
proteins and the aggregation of two or more subunits to form a multimer (one single
operational unit). Protein digestion (Figure 1.8) begins in the stomach due to pH and pepsin
action on peptide bonds that are degraded into peptides and AA.
The gastric step is not essential or complete as pepsin cleaves peptide bonds in which
carboxyl group is provided by the AA with aromatic rings (e.g., phenylalanine and tyrosine)
(Fruton, Fujii, & Knappenberger, 1961). The predominant digestion of protein occurs in the
small intestine where pancreatic peptidases (e.g., trypsin and chymotrypsin) transform protein
into di- and tri-oligopeptides, which can be further digested to single AA by oligo-peptidases
present on the brush border or directly absorbed as peptides with small molecular size
(Gropper & Smith, 2012).
Figure 1.8. Simplified representation of protein fate during digestion. AA: amino acids; BCFA:
branched-chain fatty acids.
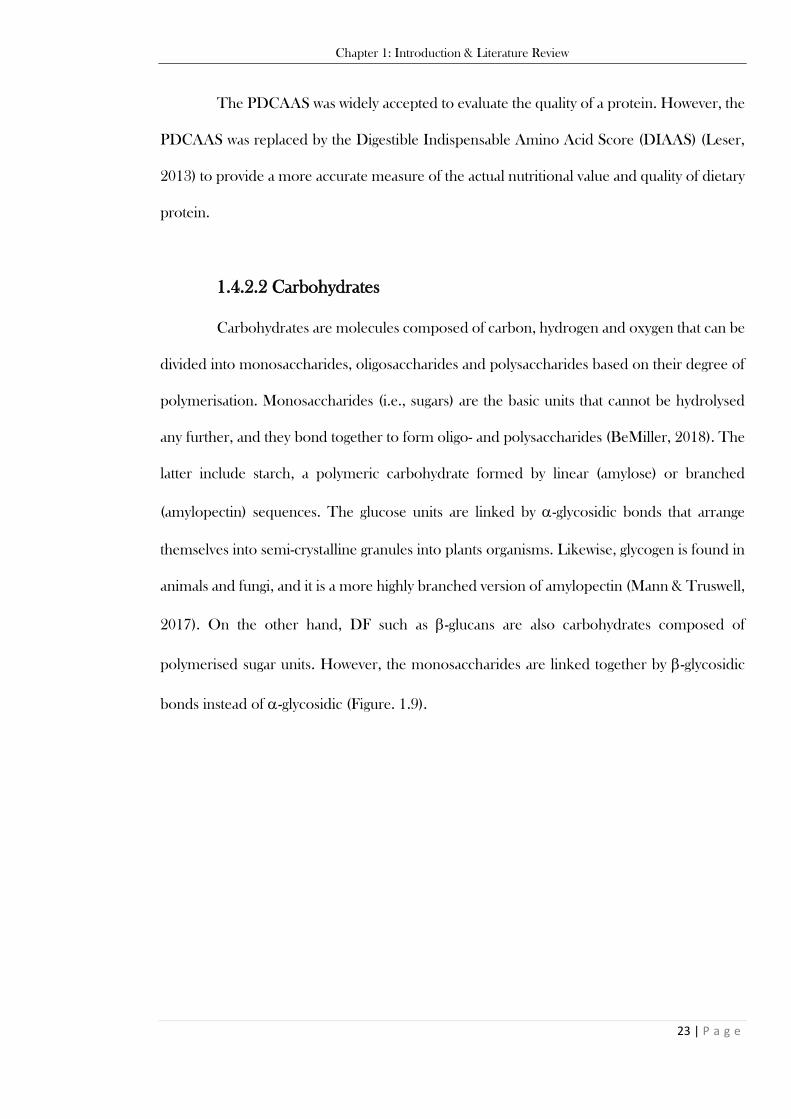
Chapter 1: Introduction & Literature Review
23 | P a g e
The PDCAAS was widely accepted to evaluate the quality of a protein. However, the
PDCAAS was replaced by the Digestible Indispensable Amino Acid Score (DIAAS) (Leser,
2013) to provide a more accurate measure of the actual nutritional value and quality of dietary
protein.
1.4.2.2 Carbohydrates
Carbohydrates are molecules composed of carbon, hydrogen and oxygen that can be
divided into monosaccharides, oligosaccharides and polysaccharides based on their degree of
polymerisation. Monosaccharides (i.e., sugars) are the basic units that cannot be hydrolysed
any further, and they bond together to form oligo- and polysaccharides (BeMiller, 2018). The
latter include starch, a polymeric carbohydrate formed by linear (amylose) or branched
(amylopectin) sequences. The glucose units are linked by -glycosidic bonds that arrange
themselves into semi-crystalline granules into plants organisms. Likewise, glycogen is found in
animals and fungi, and it is a more highly branched version of amylopectin (Mann & Truswell,
2017). On the other hand, DF such as -glucans are also carbohydrates composed of
polymerised sugar units. However, the monosaccharides are linked together by -glycosidic
bonds instead of -glycosidic (Figure. 1.9).
Chapter 1: Introduction & Literature Review
24 | P a g e
Figure 1.9. Schematic representation of monosaccharides bound by -1,4-1,6 glycosidic bonds (left),
and −1,3-1,6 glycosidic bonds (right); and structural shape of starch (amylose and amylopectin),
glycogen, adapted from Pereira, Fajardo, Valente, Rubira, and Muniz (2016) and Engelking (2015),
respectively; and -glucans, adapted from Kofuji et al. (2012); chemical structure of cellulose.
Carbohydrates cover 40 to 80% of the caloric needs in the world (Mann & Truswell,
2017). Humans can produce glucose by starting from substrates such as pyruvate, lactate, most
AA, and glycerol (Mann & Truswell, 2017). Figure 1.10 schematically shows the digestion of
starches that starts in the mouth due to the presence of salivary -amylase designated to break
down (or hydrolyse) the -glycosidic bonds of oligo-polysaccharides. Starch digestion can
continue in the stomach since salivary -amylase is still active at high pH values (around 6.0)
found in the stomach after meal consumption (Freitas, Le Feunteun, Panouillé, & Souchon,
2018). Then, gastric pH decreases below 4.0 over time (~ 45 min) due to acid secretion, and
salivary -amylase is inactivated. Starch digestion continues in the small intestine where
pancreatic -amylase produces di- and monosaccharides that can be absorbed into the small

Chapter 1: Introduction & Literature Review
25 | P a g e
intestinal mucosa and conveyed to the liver. Then, they can be used immediately for energy
purposes or stored as glycogen in the liver and muscles.
However, not all carbohydrates are digested in the small intestine (e.g., low
bioaccessibility) and can reach the colon undigested (Brown, 1996). Indeed, DF is indigestible
in the upper GIT because of the lack of enzymes to hydrolyse the -glycosidic bonds (Lam &
Cheung, 2013). For instance, resistant starch is considered a type of DF that is not digested in
the upper GIT and can be fermented by the resident microbiota in the colon to produce short-
chain fatty acids (SCFA) (i.e., acetic, propionic and butyric acid) and provide 2 kcal/g (Lockyer
& Nugent, 2017). SCFA can be used by the colon cells (colonocytes) or absorbed and used as
energy in peripheral tissues (Wong, de Souza, Kendall, Emam, & Jenkins, 2006).
Figure 1.10. Simplified representation of carbohydrates (starch or fibre) fate during digestion. SCFA:
short-chain fatty acids.
Chapter 1: Introduction & Literature Review
26 | P a g e
Glucose in the bloodstream is highly regulated as drifting in equilibrium values can cause
diseases or death. The process that maintains the glucose levels at a steady state is called
glucose homeostasis, and several actors participate in this process (Röder, Wu, Liu, & Han,
2016). The increase or decrease is dictated by several factors, mainly by carbohydrate
digestion, but also protein metabolism is a potent modulator of glucose homeostasis. The
pancreas plays a crucial role in maintaining glucose homeostasis by secreting hormones such
as insulin, glucagon, amylin, somatostatin, and pancreatic polypeptide (Röder, Wu, Liu, &
Han, 2016). Insulin is secreted when AA (Saltiel, 2015) or the blood glucose levels are ≥ 3
mM to increase glucose uptake, whereas glucagon is the counter-regulatory hormone to insulin
secreted during hypoglycaemia to restore the blood glucose levels (Bansal & Weinstock,
2020).
1.4.2.3 Lipids
Lipids are organic molecules that are poorly soluble in water but soluble in non-polar
solvents. Lipids represent one of the three macronutrients with three main functions: energy
source with 9 kcal/g; structural function as they are fundamental constituents of the membranes
of all cells (Downer, 1985); and precursors of hormones such as prostanoids (Smith, 1992).
Nutritionally, a recent book has reviewed the lipids introduced with the diet that can act as
carriers for fat-soluble vitamins and provide essential fatty acids (Grundy & Wilde, 2021).
Lipids can be classified into eight main categories: fatty acids, glycerophospholipids,
sphingolipids, sterols, prenols, saccharolipids, polyketides (Fahy et al., 2005). An example of
the structure of some common lipids introduced by the diet is reported in Figure 1.11.
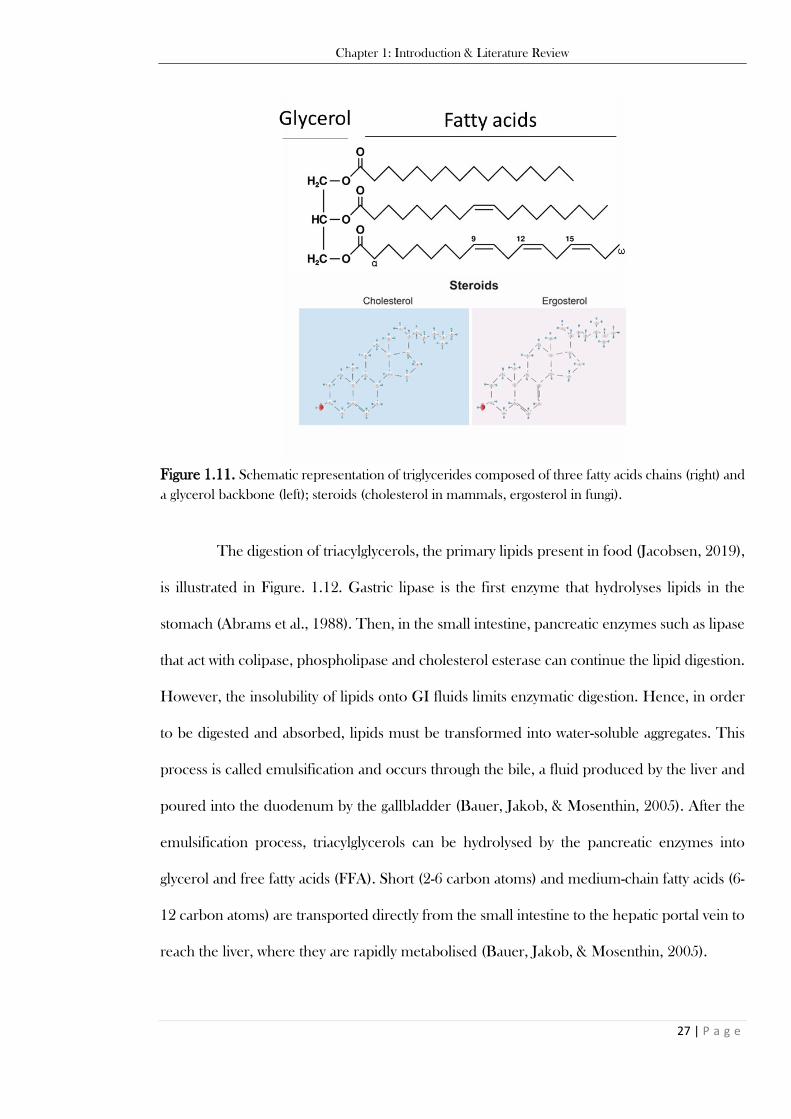
Chapter 1: Introduction & Literature Review
27 | P a g e
Figure 1.11. Schematic representation of triglycerides composed of three fatty acids chains (right) and
a glycerol backbone (left); steroids (cholesterol in mammals, ergosterol in fungi).
The digestion of triacylglycerols, the primary lipids present in food (Jacobsen, 2019),
is illustrated in Figure. 1.12. Gastric lipase is the first enzyme that hydrolyses lipids in the
stomach (Abrams et al., 1988). Then, in the small intestine, pancreatic enzymes such as lipase
that act with colipase, phospholipase and cholesterol esterase can continue the lipid digestion.
However, the insolubility of lipids onto GI fluids limits enzymatic digestion. Hence, in order
to be digested and absorbed, lipids must be transformed into water-soluble aggregates. This
process is called emulsification and occurs through the bile, a fluid produced by the liver and
poured into the duodenum by the gallbladder (Bauer, Jakob, & Mosenthin, 2005). After the
emulsification process, triacylglycerols can be hydrolysed by the pancreatic enzymes into
glycerol and free fatty acids (FFA). Short (2-6 carbon atoms) and medium-chain fatty acids (6-
12 carbon atoms) are transported directly from the small intestine to the hepatic portal vein to
reach the liver, where they are rapidly metabolised (Bauer, Jakob, & Mosenthin, 2005).
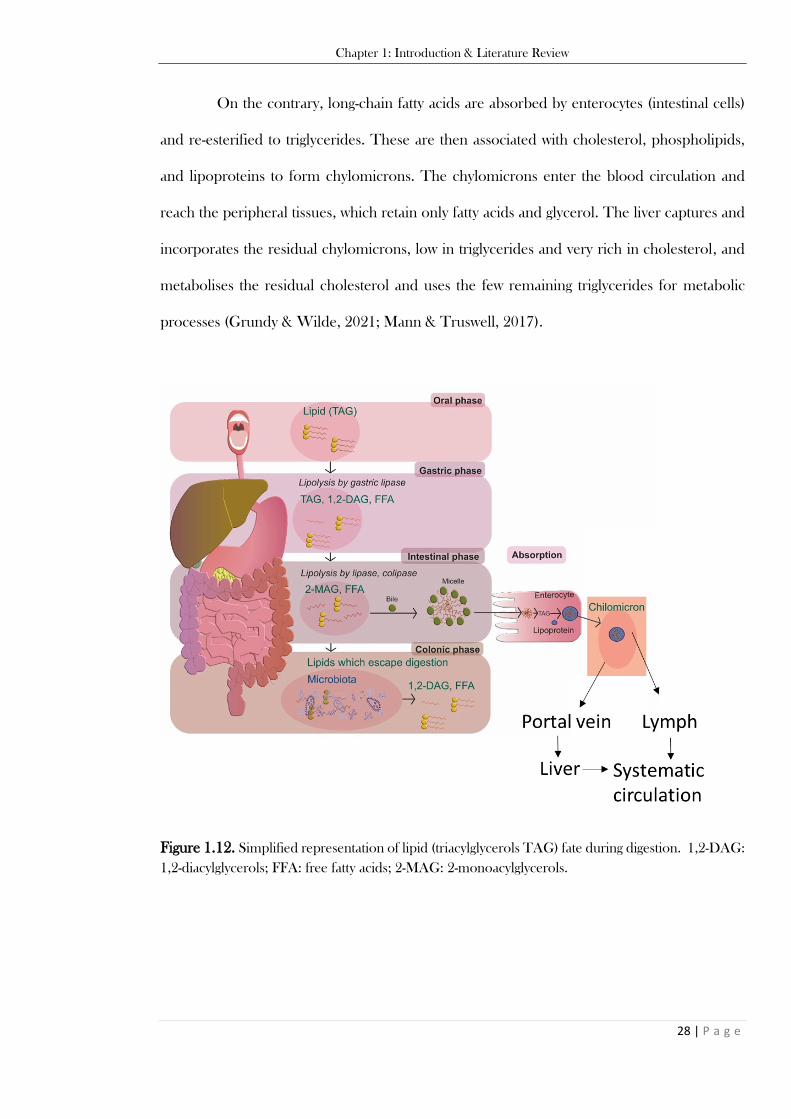
Chapter 1: Introduction & Literature Review
28 | P a g e
On the contrary, long-chain fatty acids are absorbed by enterocytes (intestinal cells)
and re-esterified to triglycerides. These are then associated with cholesterol, phospholipids,
and lipoproteins to form chylomicrons. The chylomicrons enter the blood circulation and
reach the peripheral tissues, which retain only fatty acids and glycerol. The liver captures and
incorporates the residual chylomicrons, low in triglycerides and very rich in cholesterol, and
metabolises the residual cholesterol and uses the few remaining triglycerides for metabolic
processes (Grundy & Wilde, 2021; Mann & Truswell, 2017).
Figure 1.12. Simplified representation of lipid (triacylglycerols TAG) fate during digestion. 1,2-DAG:
1,2-diacylglycerols; FFA: free fatty acids; 2-MAG: 2-monoacylglycerols.

Chapter 1: Introduction & Literature Review
29 | P a g e
1.4.2.4 Bioactive Components
The bioactive components described and analysed in this thesis are phenolic acids
and ergothioneine.
Phenolic Acids
Phenolic acids (e.g., protocatechuic acid (PCA) in Figure 1.13) are secondary
metabolites found mainly in plant and fungal samples and are known for their antioxidant
activity (Proestos, Boziaris, Nychas, & Komaitis, 2006; Smith, Doyle, & Murphy, 2015). In
general, phenolic compounds are introduced through the diet in complexes such as esters or
glycosides within the food matrix that are hydrolysed by the upper GIT enzymes or resident
microbiota before being absorbed, metabolised, and distributed into the organism (Kumar &
Goel, 2019).
Figure 1.13. The chemical structure of PCA (Figure 1.13A), as an example of a common phenolic
acid, and the AA ergothioneine (Figure 1.13B).
Ergothioneine
Ergothioneine is an AA (Figure 1.14) found in fungi and synthesised by a few
organisms, namely Actinobacteria and Cyanobacteria. The AA is a derivative of histidine,
which has found interest in the scientific literature for its potent antioxidant and cytoprotective
activity in vitro (Akanmu, Cecchini, Aruoma, & Halliwell, 1991; Borodina et al., 2020) and
can be absorbed through an intestinal transporter (OCTN1) with high specificity (Halliwell,
Cheah, & Tang, 2018).

Chapter 1: Introduction & Literature Review
30 | P a g e
1.5 In Vitro Models to Explain the In Vivo Findings
Research into food digestion is essential to understand the mechanisms responsible for
health effects promoted by certain foods and prevent diet-related diseases (e.g., T2D and
CVD). There are several ways to understand the fate of food in the GIT. In vivo studies are
considered the gold standard since they are performed in living organisms (from Latin “within
the living”). The in vivo studies can be conducted on an animal model (e.g., mice and pig) or
humans. In nutritional science research, the in vivo studies can offer observations based on
the parameters measured (e.g., blood and urine test), but the biochemical mechanisms are
often poorly understood.
On the other hand, in vitro studies (from Latin “in glass”) are performed with laboratory
glassware on microorganisms (e.g., bacteria and fungi), animal or human cells, or biochemical
molecules. The conditions of in vitro experiments are controlled, and this offers a consistent
and reproducible system. However, some in vivo conditions are not well simulated by in vitro
systems. Therefore, the results need to be considered carefully depending on the experiment.
Nonetheless, the in vitro studies offer essential preliminary results for the safety of a product
(e.g., drug or food) or to understand the biochemical mechanisms of physiological processes
that the observation of in vivo outcomes have hypothesised.
1.5.1 Simulation Methods for the Upper Gastrointestinal Tract
Overall, there is a consensus around the simulation methods for the upper GIT that has
been built around the INFOGEST COST action harmonised protocol (Minekus et al., 2014).
The in vitro digestion methods for food of the upper GIT can be classified for their dynamicity
to reproduce the human digestive system. Therefore, there are static, semi-dynamic and
dynamic models.
Chapter 1: Introduction & Literature Review
31 | P a g e
The static model mainly used in this thesis was the INFOGEST, with few adaptations
depending on the final aim of the experiment. The main feature of this system is that the pH
values and the composition of the digestive fluids, including the enzyme solutions in each
phase (e.g., oral, gastric and small intestine), are constant during each digestion time. This
model lacks the dynamic features present in the GIT, such as gastric emptying, gradual enzyme
secretion and peristalsis, but it offers a quick and low-cost tool for studies that aim to predict
the end-points of nutrient hydrolysis and bioaccessibility. Indeed, after the gastric and intestinal
digestion, the endpoints using the INFOGEST static protocol reflected the in vivo situation
observed in a pig model (Egger et al., 2019). Overall, the static method has shown to be
excellent for the low cost implied and time required, which simplify the hypothesis testing for
mechanistic studies while maintaining a good intra- and inter-laboratory reproducibility and
robustness of its results (Brodkorb et al., 2019).
On the other hand, the semi-dynamic and dynamic models tend to better simulate the
gastric phase in the gradual secretion of fluids and peristalsis. However, both methods are
more time-consuming than the static model, and dynamic models can be expensive. An
example of a semi-dynamic model is described by Mulet-Cabero et al. (2020). The latter
incorporates the gradual secretion of gastric fluids, including enzyme solutions and acid, and
gastric emptying. The dynamic models such as the Dynamic Gastric Model described by
Thuenemann, Mandalari, Rich, and Faulks (2015) can generally mimic better the complex
peristaltic movements of the stomach wall. Some of these dynamic models also include the
dynamic simulation of the small intestine, which includes the gradual secretion of digestive
fluids such as bile and pancreatic enzymes. An example of this system is the TIM model
(Minekus, 2015).
Chapter 1: Introduction & Literature Review
32 | P a g e
1.5.2 Simulation Methods for the Lower Gastrointestinal Tract
On the other hand, the simulation methods for the lower GIT lack a standardised
protocol but, similarly to the upper GIT tract methods, can be classified for their dynamicity
to reproduce the colonic environment. Indeed, the static methods performed in batches are
used to quickly assess the impact of foods on the gut microbiota and metabolites produced
(Veintimilla-Gozalbo, Asensio-Grau, Calvo-Lerma, Heredia, & Andrés, 2021). The main
advantages of these systems are the lower cost and time required to perform the experiment
and the accessibility to the equipment required. The main disadvantage is the lack of addition
and removal of substrate or metabolites produced. This factor leads to the accumulation of
fermentation products and bacterial growth that can saturate the system.
On the contrary, the dynamic models simulate the colonic fermentation processes by
continuously adding substrate and removing the fermentation products. Some examples of
dynamic models for the lower GIT are the SHIME® and TIM-2 (Minekus et al., 1999; Van
de Wiele, Van den Abbeele, Ossieur, Possemiers, & Marzorati, 2015). These methods require
specific equipment and can be expensive, although they provide a more realistic simulation of
the dynamics in the colonic environment.
1.6 Key Findings After Postprandial Consumption of Mycoprotein
The consumption of filamentous fungi is not highly widespread compared to mushrooms
(fruiting bodies of fungi) or plants, and little is known about their fate in the GIT. MYC can
be considered one of the primary sources of filamentous fungi for human consumption.
Therefore, this section analyses the available scientific publication about MYC consumption
and compares the health effects related to CVD and T2D observed with other plants and
fungi, where possible.

Chapter 1: Introduction & Literature Review
33 | P a g e
1.6.1 Protein Bioaccessibility and Bioavailability
MYC has been indicated in the past as a sustainable and nutritious food with a high net
protein utilisation (Udall, Lo, Young, & Scrimshaw, 1984). The protein quality, measured by
PDCAAS, resulted in a score of 0.996 (Edwards & Cummings, 2010), which is very close to
the maximum score of 1.0 achieved by milk and eggs and significantly higher than beef and
chicken.
More recently, Dunlop et al. (2017), in a dose-response study with a randomised, single-
blind cross-over design, observed the effects of ingestion of MYC and milk as non-animal and
animal protein sources, respectively, on 12 male subjects. The initial protein concentration
was 50% lower in the drink containing 20 g of MYC (MYC 20) than 20 g of milk (MLK20).
Therefore, it was expected higher plasma AA and insulin responses in MLK20. MLK20 was
compared to a drink containing 40 g of MYC (MYC40) (approximately equivalent amount of
protein of MLK20), and the total AA levels in plasma were equivalent between conditions.
Therefore, MYC was found to be as bioavailable as milk protein on a gram for gram basis.
The ingestion of 18 g of protein contained in MYC40 was sufficient to stimulate the muscle
protein synthesis, whilst 27 g contained in 60 g of MYC could provide an optimal anabolic
response. Increased MYC doses did not seem to confer any further benefits. Instead, they
could lead to a higher insulin response with carbohydrate co-ingestion, which may cause lipid
storage. Moreover, MYC led to a lower postprandial insulin response than milk protein,
presumably due to the high fibre content but comparable between MLK20 and MYC40. Due
to processing, MYC based foods are also lower in nucleotides content compared to animal-
based foods, which is important because a large number of nucleotides have been linked with
acute hyperuricemia that is related to gout disease (Edozien, Udo, Young, & Scrimshaw, 1970;
Waslien, Calloway, & Margen, 1968). The ingestion of MYC20 and MYC40 did not affect
serum uric acid concentrations, while MYC60 and 80 g of MYC (MYC80) increased the serum

Chapter 1: Introduction & Literature Review
34 | P a g e
uric acid from approximately from 350-370 to 380-390 mol/L when the clinically significant
concentration for men is > 420 mol/l (Duskin-Bitan et al., 2014).
Similarly, a randomised controlled trial on 20 healthy, physically active young men
reported that the ingestion of a single bolus of MYC could stimulate a higher muscle protein
synthesis rate when compared to a leucine-matched bolus of milk protein (Monteyne et al.,
2020). The two meals were in the form of powder shakes and consumed at the beginning of
the experiment. Analysis of AA and insulin in blood samples was performed at rest and after
exercise to determine the in vivo protein synthesis response in rested or exercised skeletal
muscles. After MYC consumption, the authors observed a slower and lower rise in plasma
AA concentrations than after milk ingestion. However, there was a significantly higher muscle
synthesis rate in MYC when compared to milk protein. The systemic AA concentrations
observed in MYC were lower compared to milk. This suggested that non-protein/AA factors
are potentially responsible for the significant muscle protein synthetic effect observed with
MYC consumption. Hence, the protein from a food matrix can trigger a potent effect on
muscle protein synthesis. Similarly, Van Vliet et al. (2017) observed that muscle anabolism
was stimulated differently if the food was consumed as a whole. The study reported that muscle
protein synthesis was higher after ingestion of whole eggs than egg white.
The properties of the cell wall can influence protein digestion and bioavailability. As
discussed in Section 1.3.3, it is possible to consider that enzymes could diffuse through the
cell wall and digest the intracellular nutrients due to its porosity/permeability, depending on
the intactness of the cell walls, as similarly observed with plant samples (Grundy et al., 2016).
Therefore, despite encapsulating nutrients, the FCW allows digestive enzymes to digest the
intracellular protein into peptides and AA that can be released in the extracellular space and
absorbed in the small intestine.
Chapter 1: Introduction & Literature Review
35 | P a g e
1.6.2 Effects on Post-Prandial Insulin and Glucose Homeostasis
As described in Section 1.4.2.2, the absorption of glucose released from dietary
carbohydrates causes a surge in blood glucose. Glucose homeostasis is maintained primarily
by insulin and glucagon, which regulate the uptake and release of glucose in the fed and fasted
states, respectively (Röder, Wu, Liu, & Han, 2016). An imbalance in glucose homeostasis,
such as insulin resistance, is one factor contributing to T2D development. The complications
related to T2D also include CVD, retinopathy, nephropathy, neuropathy and sexual
dysfunction (Ceriello, 2005). There are several possibilities to prevent these pathologies,
including a healthier lifestyle and dietary patterns. Several studies, which will be discussed in
this section, have shown that foods rich in fibre, such as MYC, can promote increased insulin
sensitivity and lower insulin resistance. Thus, controlling glycemia and insulin responses is an
essential tool for preventing T2D and CVD.
A crossover study with 19 participants (Turnbull & Ward, 1995) observed a significantly
lower postprandial serum glucose (p-value < 0.05; 5% decrease at 60 min) and insulin response
(p-value < 0.01; 19% and 36% decrease at 30 min and 60 min respectively) in a MYC-enriched
milkshake (containing soy and dried skim milk) compared to a nutritionally matched control
milkshake. The two meals were nutritionally identical except for the DF content. MYC test
meal contained 11.2 g more DF compared to control. That difference led the authors to
conclude that MYC fibre influences postprandial glycemia and insulinemia, delaying food
absorption in the small intestine, although the mechanisms of how it can influence these factors
remained unclear.
Bottin et al. (2016) found no difference between the postprandial glycaemic response in
a risotto made with chicken compared to MYC (both meals tested at low, medium, or high-
protein content) in a randomised controlled trial with 55 participants. Although the
insulinemic response of MYC compared with chicken was 12% lower at 30 min in the

Chapter 1: Introduction & Literature Review
36 | P a g e
medium-protein content meal, and 27% and 21% lower at 30 and 60 min respectively in the
high-protein content meal. Overall, MYC compared to chicken showed a 21% decrease with
the Disposition index in the context of insulin resistance, whereas a 7% increase of insulin
sensitivity was estimated with the Matsuda index. Both indexes showed statistical significance
only in the high protein content meals. On the contrary, the Insulinogenic index showed
differences in all the formulations with a decrease of 15%, 18% and 30% in low, medium and
high-protein content, respectively. Furthermore, metabonomic analysis was carried out on
urine samples, and different metabolites were associated with different meals. For instance,
the guanidino acetic acid excretion in urine was associated with MYC consumption and
methylistidine was associated with chicken. Plasma samples were evaluated, and a method for
multivariate data, the orthogonal projection to latent structures-discriminant analysis (OPLS-
DA), was constructed to compare 30 vs 180 min after MYC consumption. It was possible to
observe a high glucose level in the first 30 min and a successive high level of branched AA,
such as leucine, isoleucine, and valine. A separate OPLS-DA model was also constructed to
understand better which metabolites were associated with fullness after consuming chicken
and MYC meals. After chicken intake, paracetamol glucuronide was positively associated with
fullness, whereas creatinine was negatively associated. After MYC intake, the b-
hydroxybutyrate was positively associated with fullness, while creatinine and the deaminated
product of isoleucine, α-keto-β-methyl-N-valerate, were negatively associated. This study
demonstrated that MYC reduces energy intake in overweight and obese subjects and has a
better insulin response than chicken meat. It also suggested some candidate metabolites that
deserve more investigation in further studies. However, the mechanisms affecting these
metabolic responses are still unknown. DF was the only unmatched nutrient between the MYC
meal and the respective control. Hence, it was considered a critical factor in promoting these
physiological effects that require more investigation.
Chapter 1: Introduction & Literature Review
37 | P a g e
Likewise, the study from Dunlop et al. (2017) (Section 1.6.1) suggested that the insulin
response was lower and more sustained on a mass-matched meal bolus of 20 g of MYC than
milk protein. However, MYC and milk protein were comparable on a protein-matched meal
bolus (20 g milk protein vs 40 g MYC). This was supported by the Monteyne et al. (2020)
study (Section 1.6.1), which showed that a leucine-matched bolus of MYC had a lower insulin
response in the first 15 min when compared to milk, but it was comparable in the next time
points.
1.6.2.1 Examples of Other Fungal and Plant-Based Foods in Relation
with T2D
A study by Ng, Robert, Ahmad, and Ishak (2017) has shown how fibre (−glucans
from mushrooms) could be an essential factor in improving postprandial glycaemic response
by interfering with starch digestibility. The effect of adding a fibre-rich oyster mushroom
(Pleurotus sajor-caju) powder to biscuits at 0, 4, 8 and 12% levels was assessed on the in vivo
glycaemic index and the rheological and sensorial properties. The biscuits with 8% added fibre
resulted in the best way to reduce glycaemic index and maintain good palatability. The fibre
addition resulted in a less viscous paste, a reduced starch gelatinisation enthalpy value and
interfered with the integrity of the starch granules, which were reduced in size and assumed a
spherical shape. The starch hydrolysis was affected by these modifications due to a reduced
starch susceptibility to digestive enzymes, and consequently, the glycaemic response was lower.
This study showed how fibre can modify the digestibility of other nutrients (e.g., starch)
interfering in different ways and how fibre could improve the diet through a healthier blood
glucose response.
Studies on plant-based diets have shown health benefits regarding T2D. A meta-
analysis study reported an inverse correlation between T2D risk and DF intake, mostly when

Chapter 1: Introduction & Literature Review
38 | P a g e
consumed from oatmeal and psyllium (Dreher, 2018). Compared to a placebo, these two DF
sources have shown lower fasting blood glucose glycosylated haemoglobin in individuals with
diabetes and prediabetes. Likewise, a meta-analysis of Reynolds et al. (2019) concluded that a
high intake of DF and whole grains appeared to protect against CVD, T2D, and colorectal
and breast cancer. Similarly, an inverse correlation between the risk of T2D and consumption
of total DF and cereals DF has been reported by The InterAct (2015) study, including a human
study and a meta-analysis. The meta-analysis examined 18 cohort studies from 20 publications,
whereas the clinical study used data from 8 European countries. The latter comprises a case-
cohort design with T2D incident cases (n = 12,403) and a random sub-cohort (n = 16,835),
which included cases of incident T2D (n = 778). Although DF from vegetables and fruits was
not correlated to the decrease in the risk of T2D, a possible explanation is the lower amount
of DF contained in these foods compared to cereals. Hence, the consumption of large portions
of vegetables and fruits may be required to observe an effect. On the other hand, whole grains
tend to be more concentrated in DF, which means that small portions are required to observe
a significant effect. Otherwise, potential differences in the physicochemical and structural
properties of fruit and vegetable fibres compared to cereal fibres can result in less effective
outcomes. A similar inverse association between cereal fibres intake and T2D is consistent
with the meta-analyses conducted by Yao et al. (2014).
These studies offer strong evidence on the correlation between DF intake and the
prevention of T2D. Although the fibre source seems to influence the physiological response
and require further investigation to understand how different fibrous structures can influence
digestion, prevent T2D, and help develop healthier foods with a low glycaemic index. The
mechanisms of DF action in controlling glycemia are thought to act on different fronts, which
are discussed in Section 1.7.
Chapter 1: Introduction & Literature Review
39 | P a g e
1.6.3 Hypocholesterolaemic Effects
High levels of lipids in the blood are considered a risk factor for CVD development. A
healthy lifestyle characterised by not smoking, moderate physical activity, and a balanced diet
with fibre-rich foods (e.g., Mediterranean diet) is regarded as a preventive tool to reduce the
risk of developing CVD (Buttar, Li, & Ravi, 2005). Thus, DF sources such as PCW and FCW
are excellent candidates to prevent CVD development. In addition, as mentioned before, DF
can influence glucose homeostasis by reducing insulin resistance and controlling glycemia that
can also contribute to the prevention of CVD progression (Ceriello, 2005).
Turnbull and colleagues carried out several studies about the health benefits of MYC
after the commercial introduction of Quorn™ in 1985 (Whittaker, Johnson, Finnigan, Avery,
& Dyer, 2020). Turnbull, Leeds, and Edwards (1990) studied the effect of MYC consumption
within a diet for 3 weeks compared to a non-identically matched control diet containing meat
(type not disclosed) in 17 participants. The study reported an overall decrease of cholesterol
and low-density lipoprotein (LDL) levels in the MYC group, whereas high-density lipoprotein
(HDL) increased. One of the limits of the study was the duration. The study was short (only
3 weeks of follow up), and the cohort was limited (17 adults), but it was well controlled for the
nutrient intake. The conclusion is that human blood lipids changed to a healthier profile after
MYC consumption.
The same research group investigated the effect of MYC on blood lipids in 21
participants with slightly raised blood cholesterol levels for 8 weeks (Turnbull, Leeds, &
Edwards, 1992). MYC was incorporated in a cookie matrix and compared with nutrient-
balanced cookies without MYC. The results supported the previous study by reducing
cholesterol and LDL levels that were significantly lower than the control. This study was of
longer duration than the previous (8 weeks vs 3 weeks) but less controlled because the subjects
were free-living. Nevertheless, MYC showed a positive correlation with blood lipid reduction.
Chapter 1: Introduction & Literature Review
40 | P a g e
Another in vivo study (6 weeks, non-blinded, controlled intervention) with 21 free-living
subjects (healthy non-habitual MYC consumers) confirmed the reduction of cholesterol and
LDL levels in the intervention group eating Quorn™ products when compared to a control
group that followed their regular diet (Ruxton & McMillan, 2010). The authors reported a
significant reduction of total cholesterol levels in the participants with hypercholesterolemia,
suggesting that MYC could help manage blood cholesterol levels. The limits of the study were
the lack of randomisation or blinding and the small sample size. Despite the limits, this study
supported the increasing body of evidence of blood lipids reduction after MYC consumption.
In a cross-over study, Homma et al. (1995) observed a cholesterol reduction after MYC
consumption among 32 healthy free-living Japanese subjects. Subjects with a total cholesterol
concentration > 5.7 mM presented a 9.7% decrease in total cholesterol after consuming 24
g/day of MYC (DW). Subjects with a total cholesterol concentration > 5.7 mM consuming 18
g/day of MYC (DW) showed a lower decrease in total cholesterol (0.7%). All subjects
consuming 24 g/day had a statistically significant reduction in total cholesterol (6.7%), but for
subjects consuming 18 g/day of MYC, total cholesterol reduction was not significant (1.6%).
These results suggest a required minimum dose to achieve a cholesterol reduction effect.
Similarly, a randomised and parallel-group study in 20 healthy adults showed that MYC
consumption could modify the plasma lipidome compared to meat or fish (Coelho et al.,
2020). The study reported decreased lipoprotein fractions and cholesterol compared to the
meat/fish control. Nevertheless, the study of only HDL and LDL levels might not be a
complete representation of CVD, but lipoproteins functionality and atherogenic traits need to
be evaluated (Hernáez et al., 2019). Interest has risen in LDL oxidation that produces unstable
oxygen free radicals that promote atherosclerosis (Bays et al., 2013; Bays, 2011). Particularly,
LDL oxidation needs to be evaluated, considering that administering a dose of chitin-glucan
Chapter 1: Introduction & Literature Review
41 | P a g e
fibre has been reported to revert this effect (Bays et al., 2013). Therefore, more clinical trials
on MYC are encouraged to assess HDL function, LDL atherogenicity and oxidation.
1.6.3.1 Examples of Other Fungal and Plant-Based Foods in Relation
with CVD
Several studies have shown that edible mushrooms might have a role in preventing
CVD. For example, Kim et al. (2019) reported that the consumption of Portobello and Shitake
mushrooms could reduce atherosclerosis in mice fed with a high-fat diet fibre, and fungal -
glucans have been reported for their hypocholesterolaemic properties (Gil-Ramírez, Morales,
& Soler-Rivas, 2018; Gil-Ramírez & Soler-Rivas, 2014). Moreover, several fibre types can
impact CVD prevention (Lunn & Buttriss, 2007).
In a randomised, double-blind, parallel-group design study, Queenan et al. (2007)
reported that oat -glucans could reduce total cholesterol and LDL cholesterol in 75
hypercholesterolemic men and women. A meta-analysis with cohort study publications (n =
22) concluded that the intake of total DF, insoluble fibre or fibre from cereals, vegetables, and
fruits was inversely associated with CVD risk (Threapleton et al., 2013). Similarly, a list of 15
studies has been examined in a meta-analysis to understand the impact of DF and mortality
from CVD (Kim & Je, 2016). The DF source appeared to be crucial in modulating a significant
response, similar to what was reported in the studies on T2D (Section 1.6.2.1). Indeed, the
fibre sourced from cereals showed a significant inverse correlation with CVD mortality
compared to other sources.
The findings reported in this section suggest that DF intake is a critical factor for CVD
prevention. The mechanisms underlying these effects are discussed in Section 1.7.

Chapter 1: Introduction & Literature Review
42 | P a g e
1.6.4 Impact of Colonic Fermentation on Human Health
The area of research involving the GIT microbiota has gained high interest in recent
years (Prados-Bo & Casino, 2021). A shift and increase in the bacterial population or specific
bacterial activity have been correlated with the modulation of metabolic disorders such as T2D
(Cani, 2018). Moreover, diet appears to be a crucial tool to modify the colonic microbiota
(Wilson et al., 2020). In particular, DF is an important nutrient for the gut microbiota (Wang
et al., 2019).
It has been shown that the lack of DF is detrimental for murine colon health as the
resident microbiota starts to degrade the colonic mucus barrier and increases pathogen
susceptibility (Desai et al., 2016). The fermentation of DF by the microbiota leads to SCFA
production, such as acetic, propionic, and butyric acid (Harris, Morrison, & Edwards, 2020).
A study by Harris, Edwards, and Morrison (2019) has shown how the fermentation of whole
MYC or MYC isolated fibre can produce SCFA in an in vitro colonic model. The isolated
fibre had a higher SCFA production as expected by the higher amount of fibre, 75% compared
to the whole MYC that accounted for 6% fibre (wet weight). Propionic acid was produced in
higher quantities by the whole MYC than inulin and laminarin, whereas butyric acid was found
in higher concentrations in whole MYC than inulin. Propionic and butyric acid are considered
markers of -glucans fermentation (Hughes, Shewry, Gibson, McCleary, & Rastall, 2008).
Overall, SCFA have been correlated to beneficial effects for human health. For instance,
SCFA can regulate blood pressure, appetite, glucose homeostasis and maintain gut integrity
(Chambers, Preston, Frost, & Morrison, 2018). Propionic and butyric acid possess important
protective activity against inflammation and colon cancer. Propionic acid is also absorbed and
transported to the liver, where it has been suggested to have some beneficial effects on
cholesterol reduction and glycaemic control (Ramakrishna, 2013). Once the SCFA reach the
blood circulation, they can modulate physiological processes such as glucose storage in
Chapter 1: Introduction & Literature Review
43 | P a g e
different tissues (e.g., muscle and fat) and organs (e.g., liver) that may help in the control and
prevention of T2D (Kim, 2018). For instance, an open-label and parallel-group study reported
that a diet high in DF, composed of whole grains, traditional Chinese medicinal foods, and
prebiotics promoted changes in the gut microbiota and improved glucose homeostasis in 27
participants with T2D (Zhao et al., 2018). However, long-term studies using oligofructose as
DF did not report any significant effects of SCFA on glucose homeostasis (Daud et al., 2014).
The colonic fermentation of PCW and DF belonging to plants has been reviewed in the
literature (Williams, Grant, Gidley, & Mikkelsen, 2017). On the other hand, the fungal DF
literature still lacks enough studies to draw consistent conclusions. However, studies have
shown that SCFA are produced following fungal DF fermentation. For example, Kawakami et
al. (2016) showed that powders from white or brown Agaricus bisporus were fermented in rats.
The SCFA production was significantly higher in the white mushroom compared to the brown
and the control. Marzorati, Maquet, and Possemiers (2017) reported that repeated and
prolonged administration of isolated chitin/glucan, the two main components of FCW, can
promote gradual changes in the bacterial population in vitro (SHIME®). A different SCFA
production was reported between the low or high tested doses. The low dose was correlated
with propionate production, whereas the high dose provided both propionate and butyrate.
The overall growth of both Bacteroidetes and Firmicutes was observed with the higher
administration of chitin and glucans. However, a decrease in the ratio of
Bacteroidetes/Firmicutes was observed over time, with Bacteroidetes taking more advantage
of the presence of chitin and glucans. Similarly, a randomized, open-label cross-over study
with 32 participants eating meat or mushroom (Agaricus bisporus) diet reported a shift in
Bacteroidetes/Firmicutes ratio in favour of Bacteroidetes after the mushroom consumption.
(Hess, Wang, Gould, & Slavin, 2018). Furthermore, no differences in SCFA concentrations
were observed between the two diets.
Chapter 1: Introduction & Literature Review
44 | P a g e
1.6.5 In Vitro Outcomes of Phenolic Compounds from Mycoprotein
The presence of phenolic compounds from fungal sources and their antioxidant activity
has been well described in the literature (Angelini et al., 2019; Cheung, Cheung, & Ooi, 2003;
Elmastas, Isildak, Turkekul, & Temur, 2007; Puttaraju, Venkateshaiah, Dharmesh, Urs, &
Somasundaram, 2006). Phenolic compounds have also been reported to potentially control
the glycaemic response (Li et al., 2006; Lo & Wasser, 2011). On the other hand, the phenolic
acid relationship with atherosclerosis protection and bile acid excretion is still controversial
due to limitations in the in vitro and murine models used to study these effects (Chambers,
Day, Aboufarrag, & Kroon, 2019).
To date, there is only a study carried out by Prakash and Namasivayam (2013) that
investigated the antioxidant activity of water and ethanol MYC extracts with the 2,2-Diphenyl-
1-picrylhydrazyl assay, the antitumoral activity with an assay on Hep-2-cell line, and the
cytotoxic effect was evaluated on peripheral human red blood cells. The ethanol extract
showed an excellent scavenging activity, while both extracts demonstrated a potent antitumoral
activity, and no cytotoxic activity was observed. The study revealed some preliminary in vitro
results on the antioxidant, antitumoral and non-cytotoxic activity of MYC extracts but did not
identify any compounds and need further investigation.
1.7 Potential Biochemical Mechanisms Underlying the Health
Effects
As discussed in previous sections, foods rich in DF are often associated with reducing risk
factors for food-related diseases such as T2D and CVD. Several possible mechanisms have
been suggested that underpin these effects on health. The current knowledge suggests that DF
retain nutrients (low bioaccessibility), increase viscosity in the gut, and promote the
Chapter 1: Introduction & Literature Review
45 | P a g e
binding/sequestration of digestive components. These are the main mechanisms discussed in
this section and will be specifically investigated and discussed in the experiments carried out
on MYC in this thesis. Moreover, minor components such as phenolic acids with their
antioxidant properties (Section 1.6.5), or colonic fermentation that produces SCFA and
microbial changes (Section 1.5.4), may play a role in promoting health effects.
This thesis will not consider other DF-induced mechanisms that may lead to health
benefits such as hormonal regulation (Goff, Repin, Fabek, El Khoury, & Gidley, 2018).
1.7.1 Nutrient Bioaccessibility
The properties described in this section are specific to Type I or II cell walls. The cell
wall of different plant sources has been shown to retain nutrients and the bioaccessibility of
nutrients depends on the intactness of the cell walls. For instance, the behaviour of the PCW
(mainly Type I walls) to act as an envelope with a crucial role in the control of enzyme
accessibility and nutrient release has been described (Grundy, Wilde, Butterworth, Gray, &
Ellis, 2015; Li, Zhang, & Dhital, 2019; Zahir, Fogliano, & Capuano, 2020). Processing such as
particle size reduction (Edwards, Warren, Milligan, Butterworth, & Ellis, 2014) or hydrothermal
conditions (Pallares et al., 2018) can alter the physicochemical properties of cell walls with
marked effects on the availability of nutrients. For instance, plant tissues (mainly type II cell
walls) that are ruptured or fractured by grinding, mastication, and cooking could effectively
increase the release and rate/extent of nutrient digestion (Grundy, Wilde, Butterworth, Gray, &
Ellis, 2015; Mandalari et al., 2014). Cell wall intactness and encapsulation effects on nutrient
bioavailability are now well-established in plants. On the contrary, little is known about FCW
and its fate during GI digestion. Hence, differences in the cell wall structure between PCW and
FCW may result in the differential release of digested nutrients, with different physiological and
hormonal consequences.

Chapter 1: Introduction & Literature Review
46 | P a g e
1.7.1.1 Cell Wall Encapsulation and Tissue Structure
Despite the barrier effect, the diffusion of enzymes through the PCW has been
reported in the literature (Grundy et al., 2016). The permeability/porosity suggests that
enzymes can permeate through the cell walls to access the intracellular nutrients despite the
enveloping function. Similarly, the cell wall permeability/porosity in fungi has been observed
(Walker et al., 2018) and could be a crucial factor for the bioaccessibility of nutrients. The
structural and chemical differences in the layers can influence the diffusion rate of enzymes
through the cell wall. Furthermore, plant cells can be tightly packed together in tissues, bound
together by polymers, whereas fungi, despite some agglomeration of the hyphae, tend to be in
a more open structure where the cells are largely separate from each other. Therefore, the cell
surface area accessible to enzymes could be higher in fungi compared to cells contained in
plant tissues (Figure 1.6). The permeability/porosity may also be affected by digestive
processes that can increase the diameter of the pores or increase the diffusion of digestive
enzymes. Further investigation is required better to understand these mechanisms in both
PCW and FCW.
Chapter 1: Introduction & Literature Review
47 | P a g e
1.7.1.2 Binding and Sequestration of Digestive Components
The binding of digestive components (e.g., enzymes and bile salts (BS)) to DF is a
known mechanism that can potentially modulate digestion and subsequent physiological
responses. Binding is often associated with sequestration, these two terms are usually used as
synonyms, but they should be considered two separate concepts. Binding implies a non-
covalent or covalent interaction between molecules (e.g., fibre/protein from the cell wall with
digestive enzymes). In contrast, sequestration may refer to the consequence of the binding or
entrapment, leading to a reduced concentration, hence activity, of the bound compound from
solution. For instance, the physical entrapment of enzymes into the cell wall, or a viscous
matrix of soluble fibre, does not necessarily involve binding. Eventually, more clarity between
binding and sequestration would be required in future studies to understand better the
mechanisms by which DF modulates digestion.
In the case of BS binding by fibre, the interaction leads to decreased serum LDL
cholesterol as the steroid bile acids are bound and eliminated in the faeces (Goel et al., 1998).
Consequently, the liver activates the endogenous cholesterol catabolism to produce new bile
acids. Nonetheless, the BS binding could be influenced by increased viscosity promoted by
DF (Zacherl, Eisner, & Engel, 2011) or the different solubility of the fibre itself (Wang,
Onnagawa, Yoshie, & Suzuki, 2001). Bile acid-binding and consequent sequestration have
been examined extensively with plant samples (Gunness, Flanagan, & Gidley, 2010). In
contrast, little is known on how FCW or fungal components (e.g., protein or isolated fibre)
interact with BS despite the hypocholesterolaemic effects that have been reported by in vivo
studies (Section 1.6.3). Similarly, the binding of digestive enzymes has been observed in PCW
and FCW. Cellulose has been reported to bind the enzyme -amylase in a purified form or
as a component of wheat bran (with cell walls) (Dhital, Gidley, & Warren, 2015), suggesting a
sequestration mechanism more than binding.
Chapter 1: Introduction & Literature Review
48 | P a g e
1.7.2 Increased Viscosity in the Gut
Viscosity is generally defined as a physical property of fluids that show resistance to flow
or mathematically defined as the shearing stress ratio to the velocity gradient in a liquid
(Viswanath, Ghosh, Prasad, Dutt, & Rani, 2007). Some types of DF promote increased
viscosity in the GIT that has been extensively studied, especially in plant sources, for its inverse
correlation with blood glucose, lipid-lowering effects and enhancing satiety (Scazzina,
Siebenhandl-Ehn, & Pellegrini, 2013).
The impact of fungal components on increasing viscosity in vitro and potentially
promoting health benefits has been described by Wu, Chiou, Weng, Yu, and Wang (2014).
The authors described the hypoglycaemic effects (adsorption of glucose, retardation of glucose
diffusion, and reduction of the -amylase activity) of hot water extract of Auricularia polytricha
(wood ear mushroom), whose viscosity was comparable to psyllium. Although the hot water
extract showed a hypoglycaemic effect in vitro, it is unclear how fibre release from the FCW
would have similar effects under physiological conditions. The release of soluble fibre from
the food structure is a critical step that can increase the viscosity of digesta in the GIT, or the
food structure itself can also modulate viscosity. Similarly, exopolysaccharides obtained from
the culture broth of Phellinus baumii showed hypoglycaemic effects in diabetic rats (Hwang et
al., 2005).
Thus, viscosity might have a role in improving T2D as well as CVD. Several studies of
plant sources have been reviewed. However, more studies on fungal cells are required to
understand if DF can be released from the FCW and promote a viscosity increase in the GIT.
Besides, further work is required to understand the physical basis underlying the role of
viscosity during digestion, specifically whether it is the viscosity of the whole digesta or local
areas of high viscosity capable of retarding digestion.
Chapter 1: Introduction & Literature Review
49 | P a g e
1.8 Aims & Objectives
The purpose of this thesis was to use in vitro digestion approaches to investigate the
behaviour of MYC during digestion (e.g., the release of components and structural changes in
the cells) and the mechanisms underpinning the observed health impact promoted by MYC
consumption. Particular attention is given to the food matrix effect of MYC (i.e., cell wall) and
the control of the release of its components (e.g., proteins and -glucans).
This thesis hypothesised that:
• The cell wall of MYC could resist mechanical processing, whereas the chemical
action of buffers and the diffusion of digestive enzymes through the cell wall can
permit the release of protein from its structure.
• MYC components such as protein and cell wall can have a physiological impact
on delaying/slowing down carbohydrate and lipid digestion by sequestering
enzymes (e.g., pancreatic -amylase and lipase) and components of digestion
(e.g., BS).
• The release of -glucans was comparable with plant counterparts during GI
digestion.
• Minor compounds such as ergothioneine and phenolic compounds were
hypothesised to be present within the MYC matrix and potentially promote
health benefits.
• The colonic fermentation of MYC produces SCFA and induce shifts in the gut
microbiota.
The work described in this thesis was carried out at the Quadram Institute Bioscience in
Norwich, UK.
Chapter 1: Introduction & Literature Review
50 | P a g e
The targets of this thesis were to:
• Determine the mechanisms controlling the high protein bioavailability of MYC
in vivo by investigating the protein release from the MYC matrix during simulated GI
digestion and physical or chemical treatments. This work has been described in Chapter
3.
• Discover the mechanisms underlying the reduced postprandial glucose and
insulin responses promoted after MYC consumption by evaluating the capacity of MYC
in reducing carbohydrate digestion in vitro by sequestering -amylase. This work has been
described in Chapter 4.
• Establish the impact of MYC on lipid digestion and the resulting reduction of
blood lipids in vivo by analysing the ability of MYC to sequester BS and reduce lipase
activity in vitro. This work has been described in Chapter 5.
• Analyse the release of -glucans from the MYC cell walls during simulated GI
digestion to consider if soluble -glucans can promote health effects in the upper GIT
and potentially be readily fermented in the colon. This work has been described in
Chapter 6.
• Determine the presence and release of minor compounds from MYC to
understand if they may play a role in modulating health effects. This work has been
described in Chapter 7.
• Investigate changes in gut microbiota and metabolites production during MYC
colonic in vitro fermentation to consider if these effects could impact human health (e.g.,
CVD and T2D prevention). This work has been described in Chapter 8.
Chapter 2. General Materials & Methods
51 | P a g e
Chapter 2
General Materials & Methods

Chapter 2. General Materials & Methods
52 | P a g e
2.1 Materials
2.1.1 Chemical and Reagents
The reagents used throughout the thesis are listed below. The chemical/reagents used
for specific experiments are reported in the Materials & Methods section of the corresponding
chapter. Triple Red ultra-pure water (Avidity Science, UK) was used for preparing solutions
unless specified otherwise.
The following is a list of chemical and reagents of standard analytical grade purchased
from Merck, UK: NaOH (Catalogue No. 06203), NaCl (Catalogue No. S7653), pepsin from
porcine gastric mucosa (Catalogue No. P7012), pancreatin from porcine pancreas (Catalogue
No. P7545), bile bovine (Catalogue No. B3883), KCl (Catalogue No. P3911), KH2PO4
(Catalogue No. P0662), NaHCO3 (Catalogue No. S6014), MgCl2(H2O)6 (Catalogue No.
M2670), (NH4)2CO3 (Catalogue No. 207861), CaCl2(H2O)2 (Catalogue No. 223506),
bicinchoninic acid assay kit (BCA1), Bradford reagent (Catalogue No. B6919), bovine serum
albumin (Catalogue No. P0914), calcofluor white (Catalogue No. 18909), fast green (Catalogue
No. F7252), lactophenol cotton blue (Catalogue No. 61335), toluidine blue (Catalogue No.
T3260), fluorescein isothiocyanate isomer I (Catalogue No. F7250), phosphate buffered saline
(Catalogue No. P4417), p-hydroxybenzoic acid hydrazide (PAHBAH) (Catalogue No.
H9882), maltose monohydrate (Catalogue No. 1375025), and Eppendorf® Safe-Lock
microcentrifuge tubes (Catalogue No. T2795).
Other reagents were obtained from Thermo Fisher Scientific, UK: HCl (Catalogue No.
320331), NuPAGE™ LDS sample buffer (Catalogue No. 4X, NP0007), NuPAGE™ sample
reducing agent (Catalogue No. 10X, NP0007), NuPAGE™ 10% Bis-Tris 12-well pre-cast gels
(Catalogue No. NP0302BOX), methanol (Catalogue No. A4581), acetic acid (Catalogue No.
984303), Mark12™ Unstained Standard (Catalogue No. LC5677), SimplyBlue™ SafeStain

Chapter 2. General Materials & Methods
53 | P a g e
(Catalogue No. LC6065), EnzChek™ Ultra Amylase Assay Kit (Catalogue No. E33651), and
Owl™ Gel Staining Box (Catalogue No. OW-GSB-3).
Mushroom and yeast beta-glucan assay kit (Catalogue No. K-YBGL 11/19) and β-glucan
assay kit (mixed linkage) (Catalogue No. K-BGLU 08/18) were purchased from Megazyme
Ltd, Ireland.
2.1.2 Mycoprotein Samples
Marlow Foods Ltd, UK, provided mycoprotein (MYC) at two different stages of the
production process: A raw sample before RNA depletion (RAW-MYC) and a freeze-dried
powder (Figure 2.1), referred to as MYC that was prepared following RNA depletion (as
described in Chapter 1, Section 1.2.2). The RAW-MYC paste was extracted from the
fermenter vessel and subsequently freeze-dried or washed 3 times with ultra-pure water and
freeze-dried at the Quadram Institute Bioscience (W-RAW in Chapter 3). The MYC sample
was prepared at different concentrations (e.g., 25%wt or 10%wt in ultra-pure water in Chapter
3, or 10 – 20 mg/mL in Chapter 4) or processed before simulated GI digestion (e.g., digestion
to remove glycogen in Chapter 4, or sonicated or homogenised to reduce the particle size in
Chapter 3). MYC preparations will be described in the materials & methods section of each
specific chapter. The different MYC preparations are based on the aim of the experiment,
which is specified in the corresponding chapter.
Figure 2.1. Freeze-dried MYC powder is the main sample used in the thesis experiments.
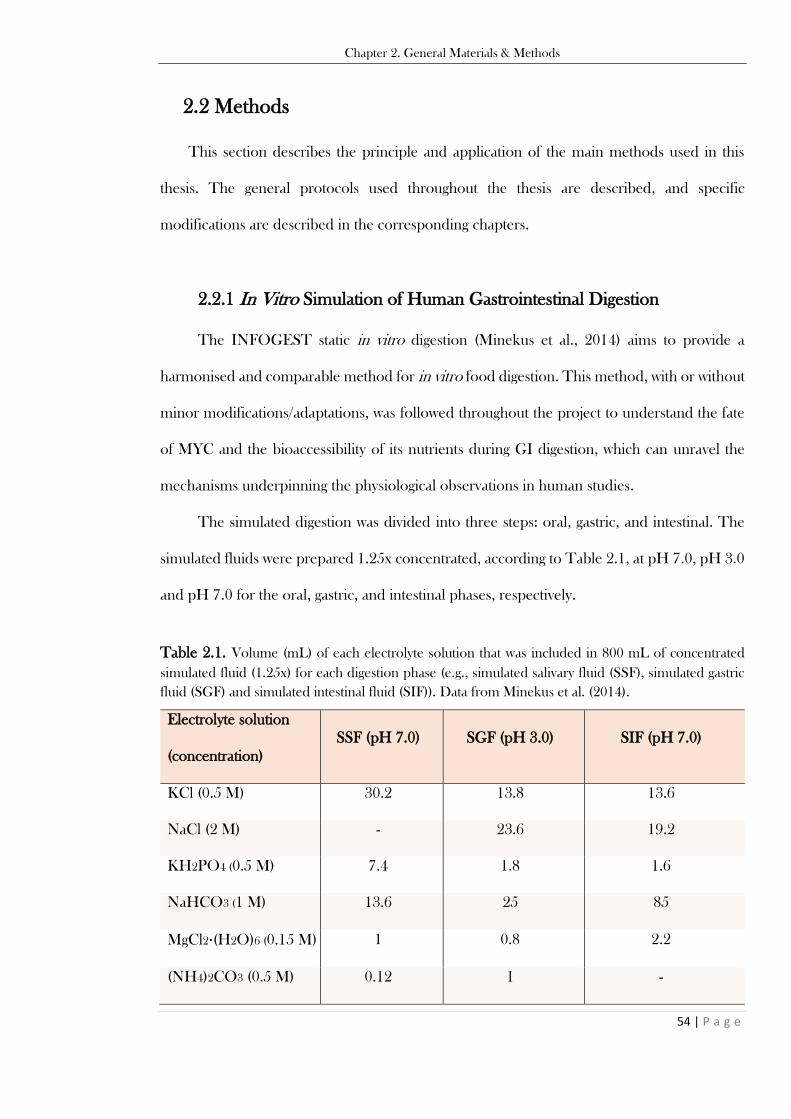
Chapter 2. General Materials & Methods
54 | P a g e
2.2 Methods
This section describes the principle and application of the main methods used in this
thesis. The general protocols used throughout the thesis are described, and specific
modifications are described in the corresponding chapters.
2.2.1 In Vitro Simulation of Human Gastrointestinal Digestion
The INFOGEST static in vitro digestion (Minekus et al., 2014) aims to provide a
harmonised and comparable method for in vitro food digestion. This method, with or without
minor modifications/adaptations, was followed throughout the project to understand the fate
of MYC and the bioaccessibility of its nutrients during GI digestion, which can unravel the
mechanisms underpinning the physiological observations in human studies.
The simulated digestion was divided into three steps: oral, gastric, and intestinal. The
simulated fluids were prepared 1.25x concentrated, according to Table 2.1, at pH 7.0, pH 3.0
and pH 7.0 for the oral, gastric, and intestinal phases, respectively.
Table 2.1. Volume (mL) of each electrolyte solution that was included in 800 mL of concentrated
simulated fluid (1.25x) for each digestion phase (e.g., simulated salivary fluid (SSF), simulated gastric
fluid (SGF) and simulated intestinal fluid (SIF)). Data from Minekus et al. (2014).
Electrolyte solution
(concentration)
SSF (pH 7.0) SGF (pH 3.0) SIF (pH 7.0)
KCl (0.5 M) 30.2 13.8 13.6
NaCl (2 M) - 23.6 19.2
KH2PO4 (0.5 M) 7.4 1.8 1.6
NaHCO3 (1 M) 13.6 25 85
MgCl2·(H2O)6 (0.15 M) 1 0.8 2.2
(NH4)2CO3 (0.5 M) 0.12 1 -

Chapter 2. General Materials & Methods
55 | P a g e
The volumes of simulated fluids and concentration of MYC sample to be digested varied
through this project and are specified in each specific chapter. The three phases of digestion
were performed either using a rotator (Grant-Bio PTR-35, Grant Instruments, UK) placed in
an incubator (Excella E24 incubator shaker series, New Brunswick Scientific, USA) to keep
the temperature at 37°C (Figure 2.2) or with the orbital shaker included in the incubator.
Figure 2.2. Incubator (Excella E24 incubator shaker series, New Brunswick Scientific, USA) with
Grant-Bio PTR-35 rotator inside (Grant Instruments, UK).
The oral phase was a quick step of 2 min used to simulate mastication of MYC with
occasional use of a meat mincer (manual meat mincer and sausage maker machine, Lakeland,
UK used for solid food such as chicken in Chapter 8) in the presence of concentrated (1.25x)
simulated salivary fluid (SSF) and CaCl2·(H2O)6 0.3 M to achieve 0.75 mM in the final mixture
and adding the necessary amount of water to dilute the stock solution of SSF. The bolus
coming from the oral phase was then mixed with a volume of the concentrated SGF, CaCl2
0.3 M, HCl 2M, ultra-pure water and pepsin solution. These solutions were added to achieve

Chapter 2. General Materials & Methods
56 | P a g e
2,000 U/mL pepsin, 0.075 mM CaCl2 and 1.25x concentrated SGF at pH 3.0 in the final
mixture. The gastric step was carried out for 120 min at 37℃. Then, the small intestinal step
was carried out by mixing the chyme from the gastric digestion with a volume of concentrated
SIF, CaCl2 0.3 mM, NaOH 2 M, bile salts (BS) solution 16 mM, pancreatin solution and
ultra-pure water. These solutions were added to achieve 0.3 mM CaCl2, 10 mM BS, and 1.25x
concentrated SIF at pH 7.0 in the final mixture. Pancreatin solution was added to reach: (1)
100 U/mL TAME-unit for trypsin which is one unit (U) that hydrolyses 1 mole of p-toluene-
sulfonyl-L-arginine methyl ester (TAME) per min at 25℃, pH 8.2, in the presence of 0.01 M
calcium ion in the final mixture; and (2) 100 or 2,000 U/mL for lipase where 1 unit (U) is
equal to 1 µmole of NaOH or free-fatty acid (FFA) titrated per min at 37℃, pH 8.0, in the
final mixture.
Also, individual pancreatic enzymes were used in Chapters 3-5 to obtain the following
activities: trypsin 100 U/mL (TAME); chymotrypsin 25 U/mL (BTEE-unit, which stands for
one enzyme unit that hydrolyses 1 µmole of N-benzoyl-L-tyrosine ethyl ester (BTEE) per min
at 25℃, pH 7.8); -amylase 200 or 400 U/mL (one unit of amylase releases 1 µmol of reducing
sugar equivalent to glucose per min under at 37℃, pH 6.9); lipase 2,000 U/mL plus colipase
2:1 molar ration colipase to lipase. The intestinal step was carried out for 120 min at 37℃.
Several tubes were run in parallel during digestion, representing the different time
points. The digestion was stopped at the established time points (15, 30, 60 and 120 min for
the gastric step and 5, 15, 30, 60 and 120 min for the intestinal) by adding NaOH 2 M to reach
pH 7.0 and pH 11.0 for gastric and intestinal phase, respectively. An example of simulated GI
digestion with 2.5 g of food, solutions added, and time points taken is represented in Figure
2.3.

Chapter 2. General Materials & Methods
57 | P a g e
Figure 2.3. An example of INFOGEST static in vitro digestion with 2.5 g of starting food and the oral,
gastric, and small intestinal phases. The simulated fluids, enzymes, BS, water, NaOH and HCl were
added based on the initial quantity of the food as described by Minekus et al. (2014).
An updated version of the INFOGEST static in vitro method for food digestion was
recently published. This protocol offered new approaches for the oral phase and added the
presence of gastric lipase for the digestion of lipid in the stomach (Brodkorb et al., 2019).
However, gastric lipase was omitted in this thesis because the estimation of the total digestion
of lipid from MYC was not the ultimate aim. Hence, the main goal of the experiments
involving the digestion of oil in water (O/W) emulsion in the presence of MYC in Chapter 5
was to understand the direct impact of MYC structure on the enzyme lipase and, therefore,
on lipolysis in the small intestinal system where most of the lipid digestion takes place.
Chapter 2. General Materials & Methods
58 | P a g e
2.2.2 In Vitro Simulation of Colonic Fermentation
The simulation of the colonic fermentation was carried out in vitro by a static batch
method as described by Williams, Bosch, Boer, Verstegen, and Tamminga (2005) with minor
modifications. This method was used to obtain information in a controlled system of the
colonic fermentation of MYC when compared to a control without substrate and oat and
chicken control samples. This in vitro model was selected since it provides a reproducible and
convenient method for obtaining preliminary colonic fermentation results (Harris, Edwards,
& Morrison, 2019). The colonic model was performed after the upper GI in vitro digestion
(Section 2.2.1) to simulate the MYC fate in the GIT completely.
The colonic fermentation of a control (CNT, faecal slurry without substrate), MYC, oat
bran (OAT), and chicken (CKN) was carried out for 72 h in anaerobic vessels (in duplicate)
with the media and the faecal slurry produced from the stools of six separate donors. The
details of the procedure are specified in Chapter 8.
2.2.3 Protein Analysis
The protein analysis aimed to determine and compare the protein release from the
MYC structure after incubation with different buffers, extraction methods applied, and in vitro
digestion. Protein analysis was carried out by colourimetric assays, which allowed rapid
estimation of the protein released from MYC and, for example, compared the different
protein extraction methods (e.g., chemical or enzymatic) with the simulated GI digestion in
Chapter 3. This helped determine the mechanisms that caused or restricted protein release
from the MYC structure. Moreover, the protein release and hydrolysis from the MYC matrix
were determined qualitatively with sodium dodecyl sulphate polyacrylamide gel
electrophoresis (SDS-PAGE) after in vitro digestion and protein extraction methods. This
section provides an overview of the assays used and their advantages and disadvantages.
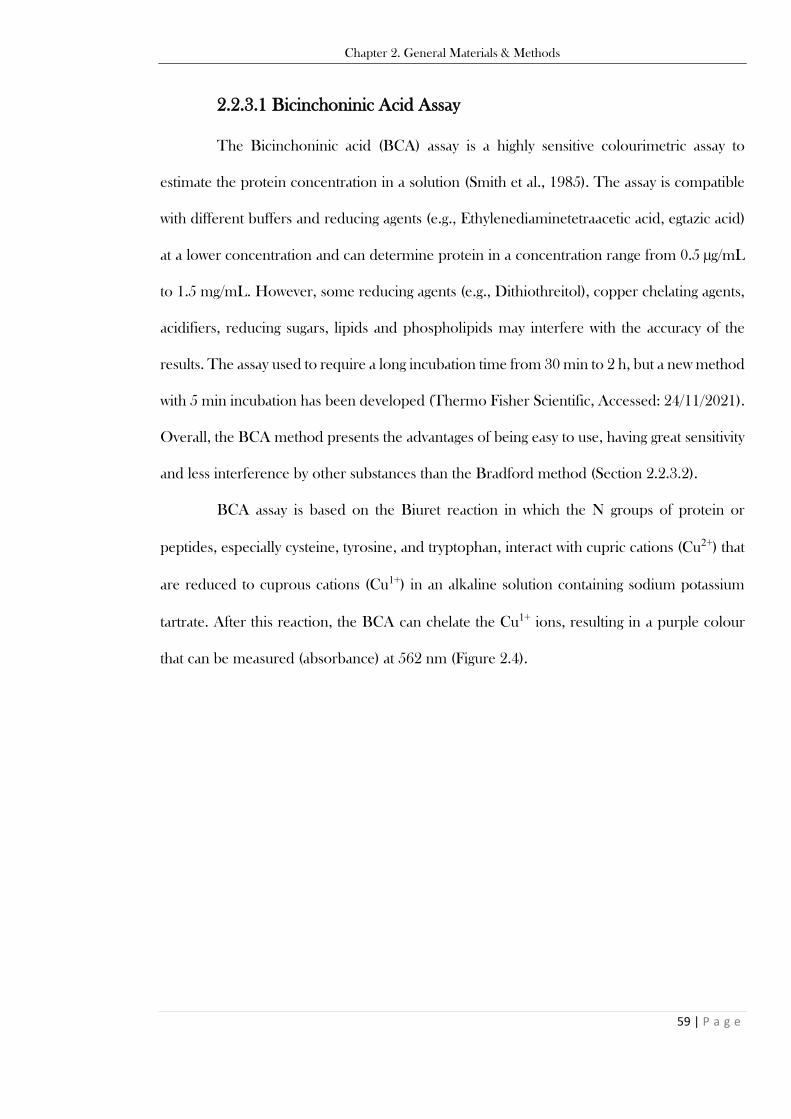
Chapter 2. General Materials & Methods
59 | P a g e
2.2.3.1 Bicinchoninic Acid Assay
The Bicinchoninic acid (BCA) assay is a highly sensitive colourimetric assay to
estimate the protein concentration in a solution (Smith et al., 1985). The assay is compatible
with different buffers and reducing agents (e.g., Ethylenediaminetetraacetic acid, egtazic acid)
at a lower concentration and can determine protein in a concentration range from 0.5 µg/mL
to 1.5 mg/mL. However, some reducing agents (e.g., Dithiothreitol), copper chelating agents,
acidifiers, reducing sugars, lipids and phospholipids may interfere with the accuracy of the
results. The assay used to require a long incubation time from 30 min to 2 h, but a new method
with 5 min incubation has been developed (Thermo Fisher Scientific, Accessed: 24/11/2021).
Overall, the BCA method presents the advantages of being easy to use, having great sensitivity
and less interference by other substances than the Bradford method (Section 2.2.3.2).
BCA assay is based on the Biuret reaction in which the N groups of protein or
peptides, especially cysteine, tyrosine, and tryptophan, interact with cupric cations (Cu2+) that
are reduced to cuprous cations (Cu1+) in an alkaline solution containing sodium potassium
tartrate. After this reaction, the BCA can chelate the Cu1+ ions, resulting in a purple colour
that can be measured (absorbance) at 562 nm (Figure 2.4).
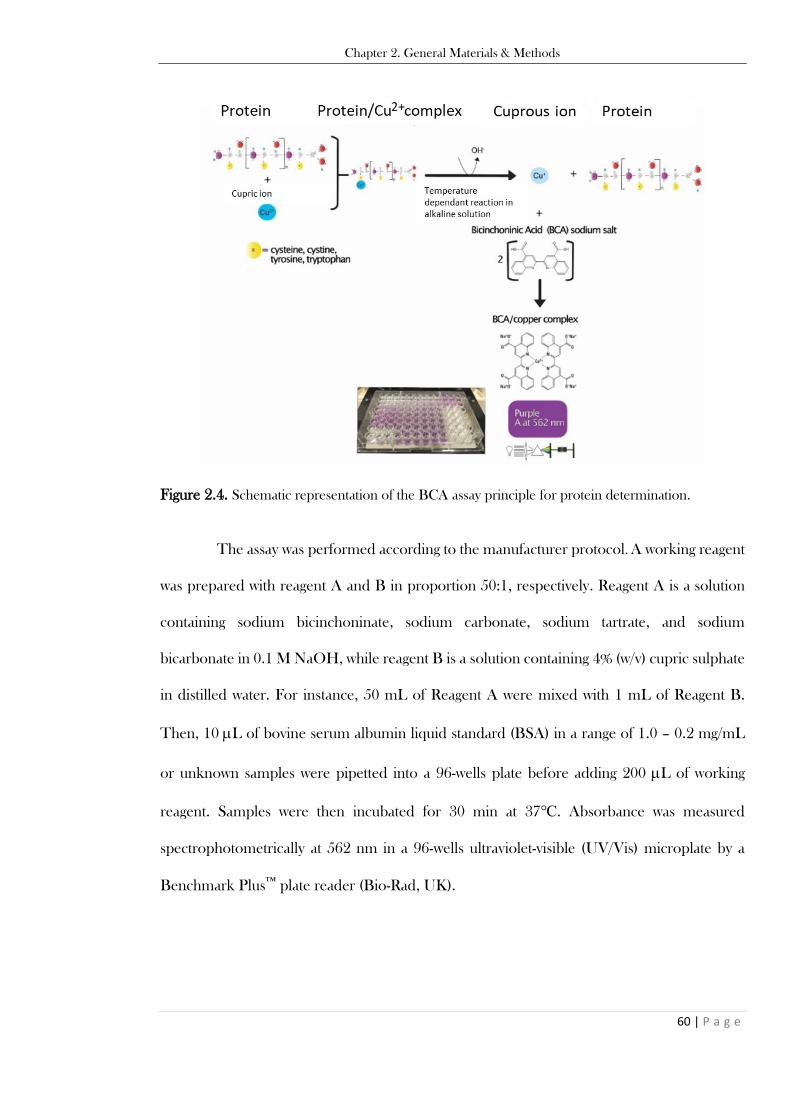
Chapter 2. General Materials & Methods
60 | P a g e
Figure 2.4. Schematic representation of the BCA assay principle for protein determination.
The assay was performed according to the manufacturer protocol. A working reagent
was prepared with reagent A and B in proportion 50:1, respectively. Reagent A is a solution
containing sodium bicinchoninate, sodium carbonate, sodium tartrate, and sodium
bicarbonate in 0.1 M NaOH, while reagent B is a solution containing 4% (w/v) cupric sulphate
in distilled water. For instance, 50 mL of Reagent A were mixed with 1 mL of Reagent B.
Then, 10 L of bovine serum albumin liquid standard (BSA) in a range of 1.0 – 0.2 mg/mL
or unknown samples were pipetted into a 96-wells plate before adding 200 L of working
reagent. Samples were then incubated for 30 min at 37℃. Absorbance was measured
spectrophotometrically at 562 nm in a 96-wells ultraviolet-visible (UV/Vis) microplate by a
Benchmark Plus™ plate reader (Bio-Rad, UK).

Chapter 2. General Materials & Methods
61 | P a g e
2.2.3.2 Bradford Assay
The Bradford assay is a sensitive method for estimating protein in the range of g
(Bradford, 1976). The advantages of this technique are the speed of execution (incubation of
10 min at room temperature) and the compatibility with different buffers, solvents, salts,
reducing agents, and chelating agents. However, the assay is incompatible with surfactants, and
single amino acids (AA), peptides and low molecular weight protein do not react. Nevertheless,
this method has been proven to be helpful for the determination of high molecular weight
protein (Dale & Young, 1987; Hii & Herwig, 1982). Moreover, the high sensitivity to basic and
aromatic AA (arginine, histidine, lysine) may cause a high protein-to-protein variation.
This method is based on the principle that Coomassie Brilliant Blue G-250
donates an electron to the protein chain, opening its stable structure and exposing any
hydrophobic domains that are then accessible to bind with the dye. In the cationic form, the
dye binds specifically through ionic interactions or Van der Waals attractions with AA residues
(e.g., arginine, histidine and lysine) that switches the dye to the anionic form, which results in
a colour change from brown-red to a blue that can be measured spectrophotometrically at 595
nm (Figure 2.5).
Figure 2.5. Schematic representation of the Bradford assay principle for protein determination.

Chapter 2. General Materials & Methods
62 | P a g e
Briefly, 10 L of standard (BSA, liquid) in a range of 1.0 – 0.2 mg/mL or unknown
sample were incubated with 250 L of Bradford reagent for 10 min in a fume cupboard at
room temperature, and then the absorbance of standard and test samples was measured in a
96-wells microplate at 595 nm with a Benchmark Plus™ UV/Vis spectrophotometer.
2.2.3.3 SDS-PAGE
SDS-PAGE is used to separate proteins based on their molecular weight. This
analytical technique is essential for the understanding of protein hydrolysis during digestion.
The principle of the technique is that reducing agents (such as 2-mercaptoethanol or
dithiothreitol) break the disulphide bonds of proteins, and sodium dodecyl sulphate acts as a
detergent that unfolds and masks the intrinsic charge of the R-groups of protein by negatively
charging the peptide chain. Then, proteins and peptides can migrate towards the anode under
an electric field through the porous polyacrylamide gel (Figure 2.6). The separation of the
different molecular weight proteins is then dependent on the pore size of the gel.
SDS-PAGE was performed on samples after GI digestion and according to the
manufacturer protocol. Briefly, 25 L of NuPAGE®
LDS sample buffer (4x), 10 L of sample
reducing agent (10x) and 65 L of the sample were mixed for 10-20 s and heated at 70℃ in a
water bath for 10 min. A volume of 50 mL of NuPAGE®
MES (20x) was prepared up to 1 L
of water and poured into the upper chamber of the tank; after making sure that there were no
leaks, the lower chamber was filled too. A volume of 10-15 L per sample was loaded into the
NuPAGE™ 10% Bis-Tris 12-well pre-cast gel and after securing the lid to the tank and
attaching the power leads to the Zoom®
Dual Power unit at the 250 V power supply, the run
was started using the following conditions: Voltage 200 V, Current 350 mA, Wattage 100 W,
35 min. After the run, the gel was removed from the tank, transferred into a gel staining box,
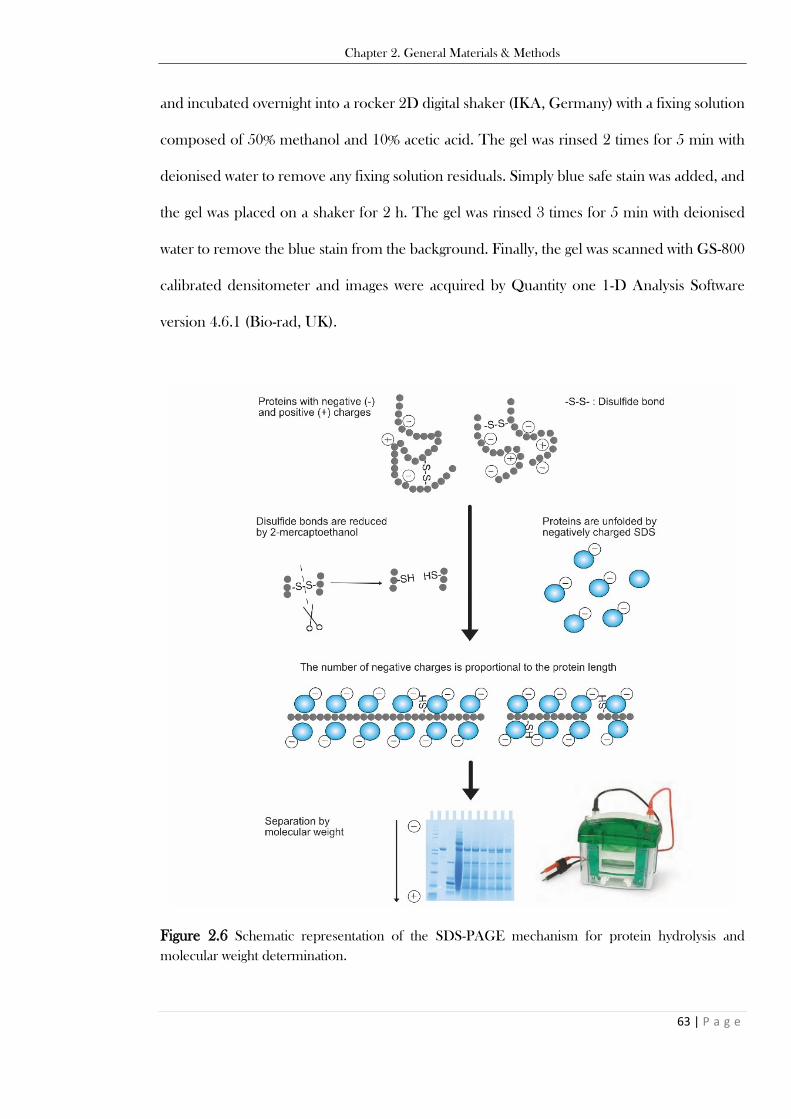
Chapter 2. General Materials & Methods
63 | P a g e
and incubated overnight into a rocker 2D digital shaker (IKA, Germany) with a fixing solution
composed of 50% methanol and 10% acetic acid. The gel was rinsed 2 times for 5 min with
deionised water to remove any fixing solution residuals. Simply blue safe stain was added, and
the gel was placed on a shaker for 2 h. The gel was rinsed 3 times for 5 min with deionised
water to remove the blue stain from the background. Finally, the gel was scanned with GS-800
calibrated densitometer and images were acquired by Quantity one 1-D Analysis Software
version 4.6.1 (Bio-rad, UK).
Figure 2.6 Schematic representation of the SDS-PAGE mechanism for protein hydrolysis and
molecular weight determination.
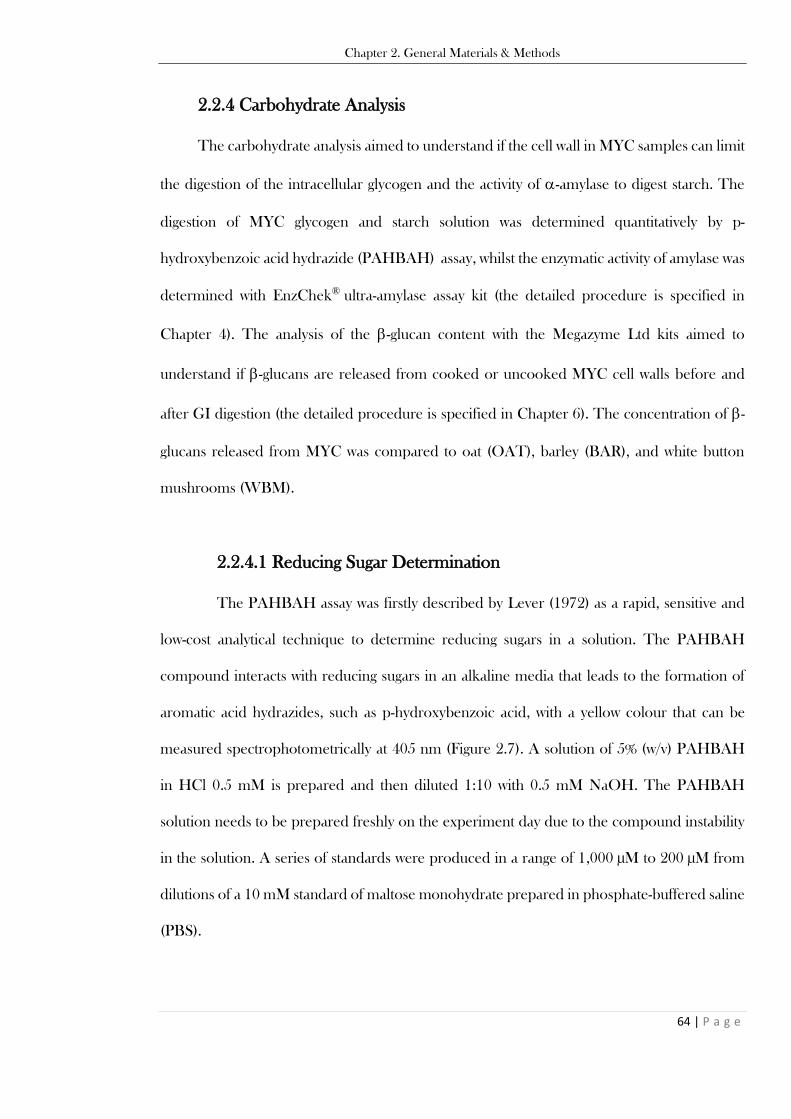
Chapter 2. General Materials & Methods
64 | P a g e
2.2.4 Carbohydrate Analysis
The carbohydrate analysis aimed to understand if the cell wall in MYC samples can limit
the digestion of the intracellular glycogen and the activity of -amylase to digest starch. The
digestion of MYC glycogen and starch solution was determined quantitatively by p-
hydroxybenzoic acid hydrazide (PAHBAH) assay, whilst the enzymatic activity of amylase was
determined with EnzChek® ultra-amylase assay kit (the detailed procedure is specified in
Chapter 4). The analysis of the -glucan content with the Megazyme Ltd kits aimed to
understand if -glucans are released from cooked or uncooked MYC cell walls before and
after GI digestion (the detailed procedure is specified in Chapter 6). The concentration of -
glucans released from MYC was compared to oat (OAT), barley (BAR), and white button
mushrooms (WBM).
2.2.4.1 Reducing Sugar Determination
The PAHBAH assay was firstly described by Lever (1972) as a rapid, sensitive and
low-cost analytical technique to determine reducing sugars in a solution. The PAHBAH
compound interacts with reducing sugars in an alkaline media that leads to the formation of
aromatic acid hydrazides, such as p-hydroxybenzoic acid, with a yellow colour that can be
measured spectrophotometrically at 405 nm (Figure 2.7). A solution of 5% (w/v) PAHBAH
in HCl 0.5 mM is prepared and then diluted 1:10 with 0.5 mM NaOH. The PAHBAH
solution needs to be prepared freshly on the experiment day due to the compound instability
in the solution. A series of standards were produced in a range of 1,000 µM to 200 µM from
dilutions of a 10 mM standard of maltose monohydrate prepared in phosphate-buffered saline
(PBS).
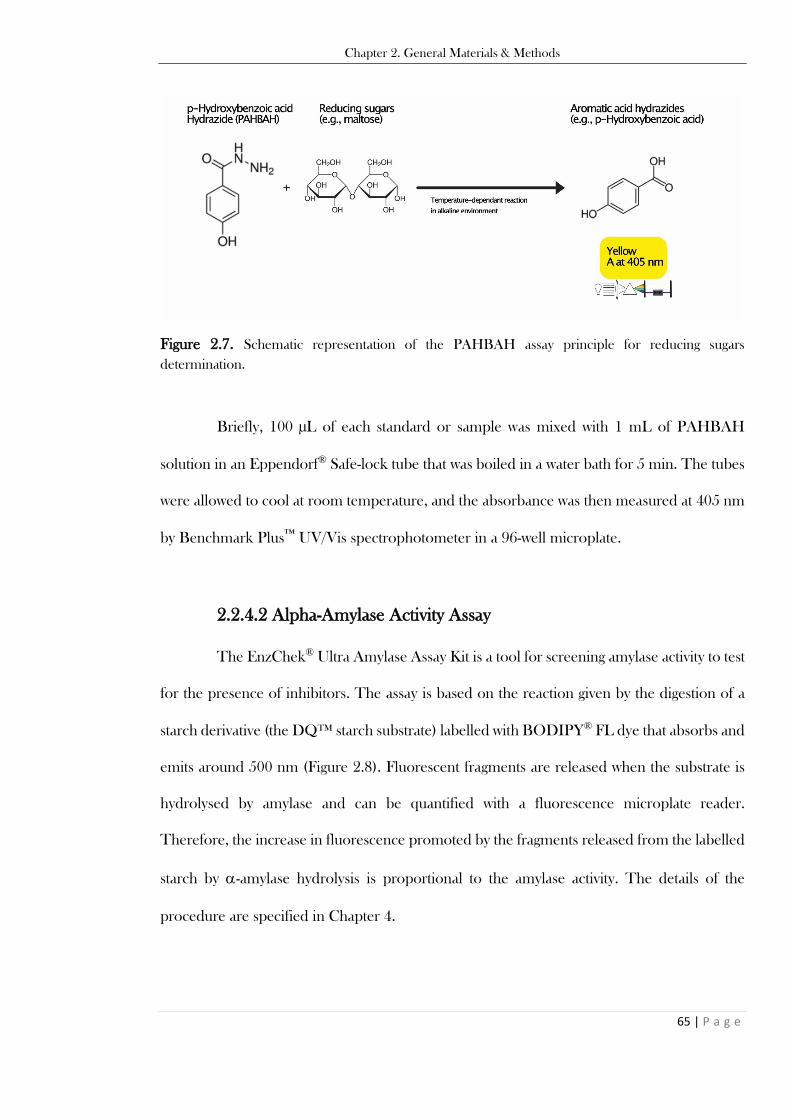
Chapter 2. General Materials & Methods
65 | P a g e
Figure 2.7. Schematic representation of the PAHBAH assay principle for reducing sugars
determination.
Briefly, 100 µL of each standard or sample was mixed with 1 mL of PAHBAH
solution in an Eppendorf® Safe-lock tube that was boiled in a water bath for 5 min. The tubes
were allowed to cool at room temperature, and the absorbance was then measured at 405 nm
by Benchmark Plus™ UV/Vis spectrophotometer in a 96-well microplate.
2.2.4.2 Alpha-Amylase Activity Assay
The EnzChek® Ultra Amylase Assay Kit is a tool for screening amylase activity to test
for the presence of inhibitors. The assay is based on the reaction given by the digestion of a
starch derivative (the DQ™ starch substrate) labelled with BODIPY® FL dye that absorbs and
emits around 500 nm (Figure 2.8). Fluorescent fragments are released when the substrate is
hydrolysed by amylase and can be quantified with a fluorescence microplate reader.
Therefore, the increase in fluorescence promoted by the fragments released from the labelled
starch by -amylase hydrolysis is proportional to the amylase activity. The details of the
procedure are specified in Chapter 4.
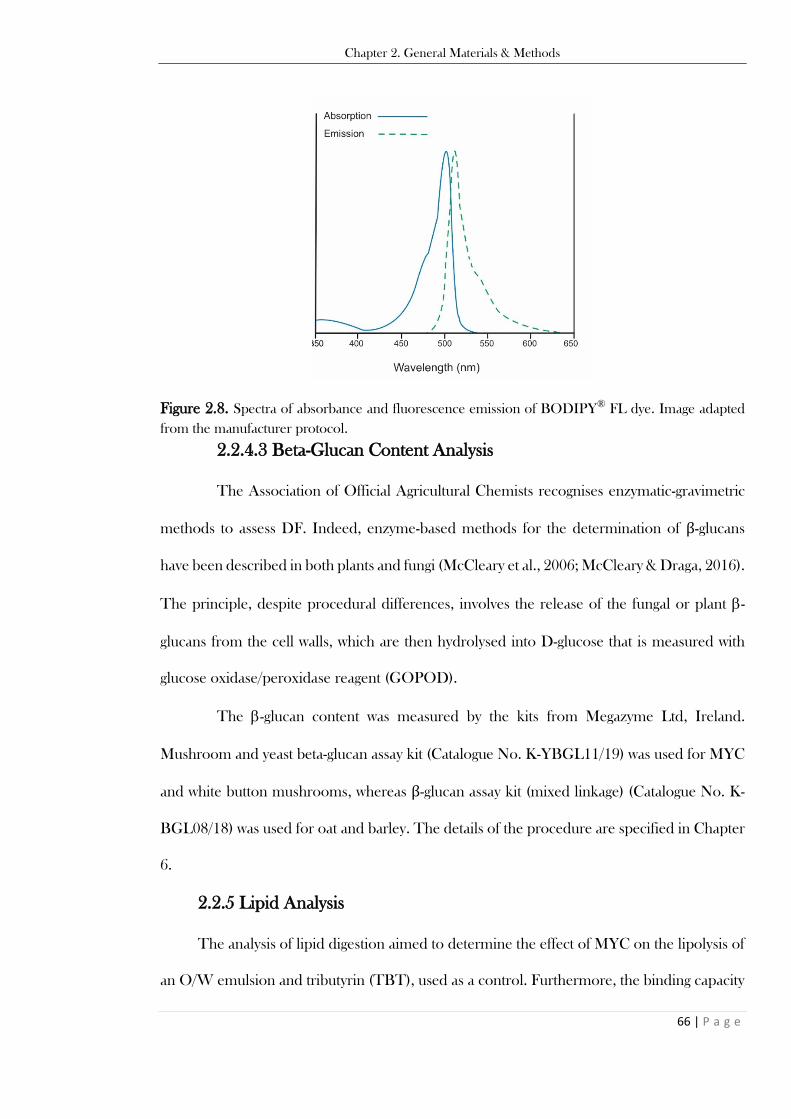
Chapter 2. General Materials & Methods
66 | P a g e
Figure 2.8. Spectra of absorbance and fluorescence emission of BODIPY® FL dye. Image adapted
from the manufacturer protocol.
2.2.4.3 Beta-Glucan Content Analysis
The Association of Official Agricultural Chemists recognises enzymatic-gravimetric
methods to assess DF. Indeed, enzyme-based methods for the determination of β-glucans
have been described in both plants and fungi (McCleary et al., 2006; McCleary & Draga, 2016).
The principle, despite procedural differences, involves the release of the fungal or plant -
glucans from the cell walls, which are then hydrolysed into D-glucose that is measured with
glucose oxidase/peroxidase reagent (GOPOD).
The -glucan content was measured by the kits from Megazyme Ltd, Ireland.
Mushroom and yeast beta-glucan assay kit (Catalogue No. K-YBGL11/19) was used for MYC
and white button mushrooms, whereas β-glucan assay kit (mixed linkage) (Catalogue No. K-
BGL08/18) was used for oat and barley. The details of the procedure are specified in Chapter
6.
2.2.5 Lipid Analysis
The analysis of lipid digestion aimed to determine the effect of MYC on the lipolysis of
an O/W emulsion and tributyrin (TBT), used as a control. Furthermore, the binding capacity

Chapter 2. General Materials & Methods
67 | P a g e
of MYC to BS was determined during simulated GI digestion. The digestion rate of O/W
emulsion was measured by the pH-stat method, whereas the depletion of BS from solution,
and, therefore, their binding to MYC, was determined by colourimetric assay. The specific
preparation of the O/W emulsion and the adapted conditions of simulated digestion are
described in Chapter 5.
2.2.5.1 pH-Stat Technique
The pH-stat technique has been used widely to measure lipase activity and lipid
digestion (Beisson, Tiss, Rivière, & Verger, 2000; Li, Hu, & McClements, 2011; Wilde,
Garcia-Llatas, Lagarda, Haslam, & Grundy, 2019). Its principle is to maintain a constant pH
by automatically titrating acid or alkali and constantly monitoring pH, mixing, and temperature
in a closed system. The changes in pH are due to the reaction taking place in the system that
releases ions H3O+
or OH-. For instance, lipolysis of triacylglycerols and the consequent
release of FFA leads to a decrease in pH. Hence, small, known volumes of a diluted alkaline
solution such as NaOH 0.1 M are constantly titrated into the system to maintain the pH at the
desired value. Therefore, the measured titration rate is assumed to be proportional to the
reaction rate. This technique has been widely used to correlate the volume of NaOH added
to the release of FFA generated from the lipid hydrolysis by lipase (Grundy, Wilde,
Butterworth, Gray, & Ellis, 2015; Li, Hu, & McClements, 2011).
The lipolysis of O/W emulsion by pancreatic lipase (100 U/mL in the final mixture)
was carried out in the small intestinal step of the INFOGEST protocol in the presence of
MYC at 0 (control), 10, 20, or 30 mg/mL by a pH-stat device KEM AT-700 (Kyoto electronics,
Japan) (Figure 2.9). In like manner, the digestion of 0.5 mL of TBT was carried out in the
small intestinal step of the INFOGEST protocol in the presence of MYC at 30 mg/mL.
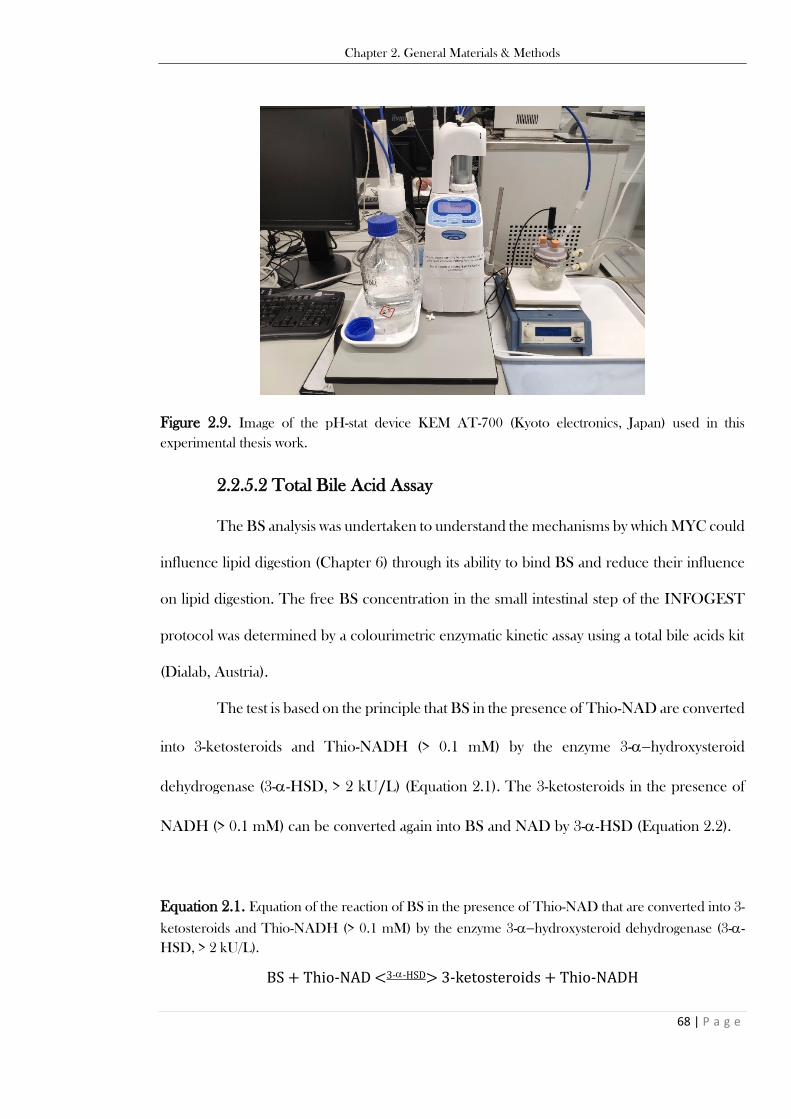
Chapter 2. General Materials & Methods
68 | P a g e
Figure 2.9. Image of the pH-stat device KEM AT-700 (Kyoto electronics, Japan) used in this
experimental thesis work.
2.2.5.2 Total Bile Acid Assay
The BS analysis was undertaken to understand the mechanisms by which MYC could
influence lipid digestion (Chapter 6) through its ability to bind BS and reduce their influence
on lipid digestion. The free BS concentration in the small intestinal step of the INFOGEST
protocol was determined by a colourimetric enzymatic kinetic assay using a total bile acids kit
(Dialab, Austria).
The test is based on the principle that BS in the presence of Thio-NAD are converted
into 3-ketosteroids and Thio-NADH (> 0.1 mM) by the enzyme 3-−hydroxysteroid
dehydrogenase (3--HSD, > 2 kU/L) (Equation 2.1). The 3-ketosteroids in the presence of
NADH (> 0.1 mM) can be converted again into BS and NAD by 3--HSD (Equation 2.2).
Equation 2.1. Equation of the reaction of BS in the presence of Thio-NAD that are converted into 3-
ketosteroids and Thio-NADH (> 0.1 mM) by the enzyme 3-−hydroxysteroid dehydrogenase (3--
HSD, > 2 kU/L).
BS + Thio-NAD <3--HSD> 3-ketosteroids + Thio-NADH
Chapter 2. General Materials & Methods
69 | P a g e
Equation 2.2. Equation of the reaction happening when 3-ketosteroids are in the presence of NADH
(> 0.1 mM) and are converted again into BS and NAD by 3--HSD.
3-ketosteroids + NADH <3--HSD> BS + NAD
The excess of NADH efficiently promotes both reaction (Equation 2.1) and
(Equation 2.2), and eventually, the rate of formation of Thio-NADH is determined by
measuring the specific change of absorbance at 405 nm with a Benchmark Plus™ plate reader
(Bio-Rad, UK). The details of the procedure are specified in Chapter 5.
2.2.6 DNA Analysis
The analysis of DNA was carried out to observe shifts in the microbial population of six
stool donors after 72 h of in vitro colonic fermentation (Section 2.2.2) with MYC, OAT, and
CKN substrates. The DNA was extracted with the MP bio fast DNA spin kit for soil (Catalogue
No. 11656020) (detail of the procedure are specified in Chapter 8), and samples were sent to
Genewiz European Headquarters, Germany, for shotgun analysis.
2.2.6.1 Shotgun Metagenomics Sequencing
Shotgun metagenomics sequencing captures the microbial community from a sample
at a given point, differently from other approaches that typically study a single gene or
individual genomes (Chen & Pachter, 2005). Shotgun metagenomic sequencing is used to
randomly sequence DNA strands within a given sample. Therefore, it allows sampling all genes
in all organisms present in a given complex sample. Compared to 16S rRNA gene sequencing,
which provides information on diversity and relative abundance, shotgun metagenomic
sequencing also offers insights into functional genes. In general, for shotgun metagenomic
sequencing, samples are barcoded and mixed for sequencing, and the DNA within the sample

Chapter 2. General Materials & Methods
70 | P a g e
is sheared into smaller fragments and subsequently sequenced using next generation
sequencing. The Illumina platform has become a dominant technology for shotgun
metagenomics due to its wide availability, very high outputs (up to 1.5 Tb per run) and high
accuracy (error rate between 0.1-1%). Multiple methods are available for the generation of
Illumina sequencing libraries, typically distinguished by the method of fragmentation used
(Quince, Walker, Simpson, Loman, & Segata, 2017). For example, transposase-based
tagmentation only require small DNA inputs (e.g., < 1 ng of DNA). The tagmentation method
requires a subsequent PCR amplification step that may introduce amplification biases and the
GC content biases associated with PCR. Alternatively, to reduce these biases, a PCR-free
method relying on physical fragmentation (e.g., PCR-free TruSeq) can be used to produce a
sequencing library that may be more representative of the underlying species composition in
a sample. The complete details of the shotgun metagenomic sequencing and analysis are
specified in Chapter 8.
2.2.6.2 Microbial Community Profiling
High quality and trimmed reads are used to estimate the microbial composition
profiles using MetaPhlAn v3.0.2 (Beghini et al., 2021; Segata et al., 2012). MetaPhlAn
identifies the microbes and their abundance from metagenomic reads by mapping them to the
ChocoPhlAn database of unique clade-specific marker genes. Clades are a group of organisms,
and clade-specific markers are coding sequences that are strongly conserved within the clade’s
genomes and are sufficiently different to any sequence outside the clade. The marker genes in
the database were identified from over 17,000 reference genomes from bacteria, archaea,
viruses and eukaryotes (Beghini et al., 2021).
Chapter 2. General Materials & Methods
71 | P a g e
2.2.7 Metabolomic Analysis
The metabolomic analysis was carried out with proton nuclear magnetic resonance
(NMR) and liquid chromatography-mass spectrometry (LC-MS). NMR was used to
characterise the metabolites produced after the colonic in vitro fermentation of MYC (Chapter
8), compared to OAT and CKN. LC-MS was used for MYC protein with potential BS binding
properties characterisation (Chapter 5) and investigation of phenolic acids and ergothioneine
within MYC, RAW-MYC, and WBM cell walls before and after simulated GI digestion
(Chapter 7).
NMR and LC-MS techniques are increasingly associated with the field of metabolomics
and the more recent foodomics, which is considered a discipline that deals with the study of
food and nutrition (Capozzi & Bordoni, 2013). NMR is excellent for analysing samples, liquid
or solid, without requiring any chemical treatment before analysis, while MS requires
separating the metabolite from the sample through separation techniques, such as liquid
chromatography, before detection and quantification. Although the sensitivity of MS can be
considered higher than NMR (Emwas et al., 2019), the latter gives the advantage of being a
non-destructive technique (the same sample can be recovered and analysed several times).
2.2.7.1 NMR Analysis
NMR is a powerful tool that defines the molecular properties of a sample. This
technique is excellent for experiments to determine the molecular profile, purity, and
molecular structure of unknown samples (Hatzakis, 2019).
Admittedly a simplification, the main principle of NMR is based on the spins of atomic
nuclei, similar to the spin of electrons. Nuclei are charged particles in motion that develop a
magnetic field, and when the nuclei with non-zero spins are placed in a strong magnetic field,
these nuclei move from a lower energy state to a higher energy state. The energy absorbed

Chapter 2. General Materials & Methods
72 | P a g e
during this transition depends on the nucleus type and the chemical environment. When the
magnetic field is increased, the excitation of nuclei is detected from one state to another, and
induced voltage results from the absorption of energy from the radiofrequency field. The free
induction decay in the time domain provides its equivalent frequency domain signal on Fourier
transformation. The area under a peak is proportional to the number of nuclei changing state,
and the structure of a molecule can be determined by observing the field strength at which the
protons absorb energy (Günther, 2013). The use of NMR is widespread thanks to the
omnipresence of hydrogen atoms in organic molecules. However, sometimes the NMR
spectra can be crowded, and the overlapping of the signals can complicate the detectability of
some metabolites. Therefore, an increase in resolution is desirable and can be achieved by
using stronger magnets (up to 1 GHz for hydrogen atoms) or complementary 2D experiments
such as J-resolved (requiring longer analysis times) (Kim, Choi, & Verpoorte, 2010). The
details of the procedure are specified in Chapter 8.
2.2.7.2 LC-MS Analysis
LC-MS is another excellent technique for determining metabolites (Xiao, Zhou, &
Ressom, 2012). Dr Carlo de-Oliveira-Martins and Mr Mark Philo performed the LC-MS
experiments of Chapter 5 and Chapter 7, respectively.
Admittedly a simplification, the main principle of LC-MS is the physical separation
based on liquid chromatography, which separates the molecules of a liquid solution thanks to
two immiscible phases (e.g., stationary and mobile). Then, it converts a molecule to a charged
(ionised) state. The ions and fragment ions produced by the ionisation process are then
analysed based on their mass to charge ratio (m/z). Several technologies are available for
ionisation and ion analysis (Gilbert-López et al., 2017). Overall, LC-MS has been widely used
in the field of foodomics and proteomics by offering a robust analysis for metabolic profiling
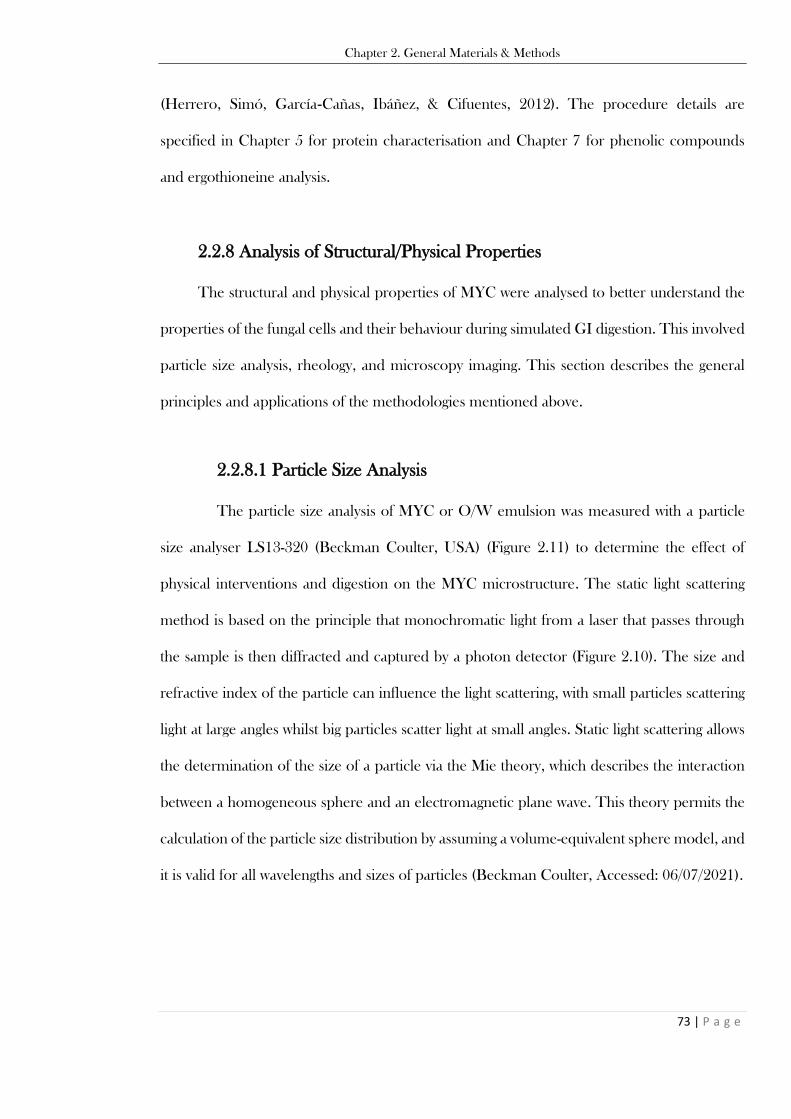
Chapter 2. General Materials & Methods
73 | P a g e
(Herrero, Simó, García‐Cañas, Ibáñez, & Cifuentes, 2012). The procedure details are
specified in Chapter 5 for protein characterisation and Chapter 7 for phenolic compounds
and ergothioneine analysis.
2.2.8 Analysis of Structural/Physical Properties
The structural and physical properties of MYC were analysed to better understand the
properties of the fungal cells and their behaviour during simulated GI digestion. This involved
particle size analysis, rheology, and microscopy imaging. This section describes the general
principles and applications of the methodologies mentioned above.
2.2.8.1 Particle Size Analysis
The particle size analysis of MYC or O/W emulsion was measured with a particle
size analyser LS13-320 (Beckman Coulter, USA) (Figure 2.11) to determine the effect of
physical interventions and digestion on the MYC microstructure. The static light scattering
method is based on the principle that monochromatic light from a laser that passes through
the sample is then diffracted and captured by a photon detector (Figure 2.10). The size and
refractive index of the particle can influence the light scattering, with small particles scattering
light at large angles whilst big particles scatter light at small angles. Static light scattering allows
the determination of the size of a particle via the Mie theory, which describes the interaction
between a homogeneous sphere and an electromagnetic plane wave. This theory permits the
calculation of the particle size distribution by assuming a volume-equivalent sphere model, and
it is valid for all wavelengths and sizes of particles (Beckman Coulter, Accessed: 06/07/2021).
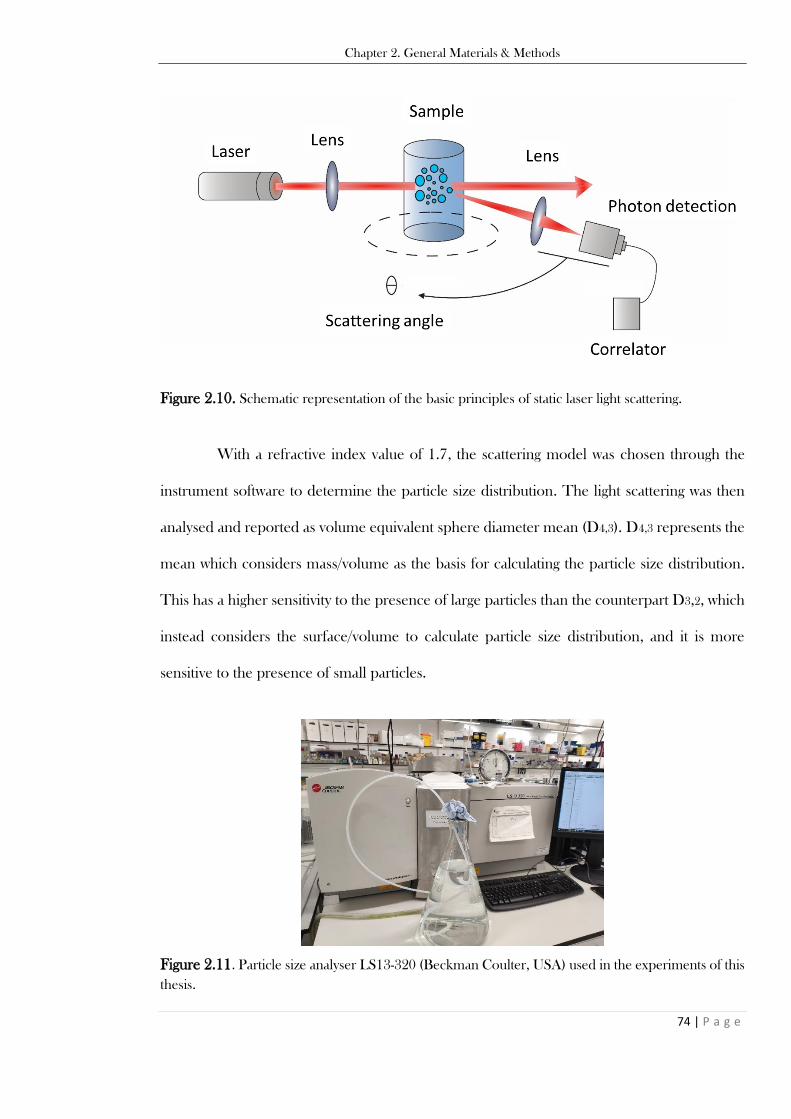
Chapter 2. General Materials & Methods
74 | P a g e
Figure 2.10. Schematic representation of the basic principles of static laser light scattering.
With a refractive index value of 1.7, the scattering model was chosen through the
instrument software to determine the particle size distribution. The light scattering was then
analysed and reported as volume equivalent sphere diameter mean (D4,3). D4,3 represents the
mean which considers mass/volume as the basis for calculating the particle size distribution.
This has a higher sensitivity to the presence of large particles than the counterpart D3,2, which
instead considers the surface/volume to calculate particle size distribution, and it is more
sensitive to the presence of small particles.
Figure 2.11. Particle size analyser LS13-320 (Beckman Coulter, USA) used in the experiments of this
thesis.
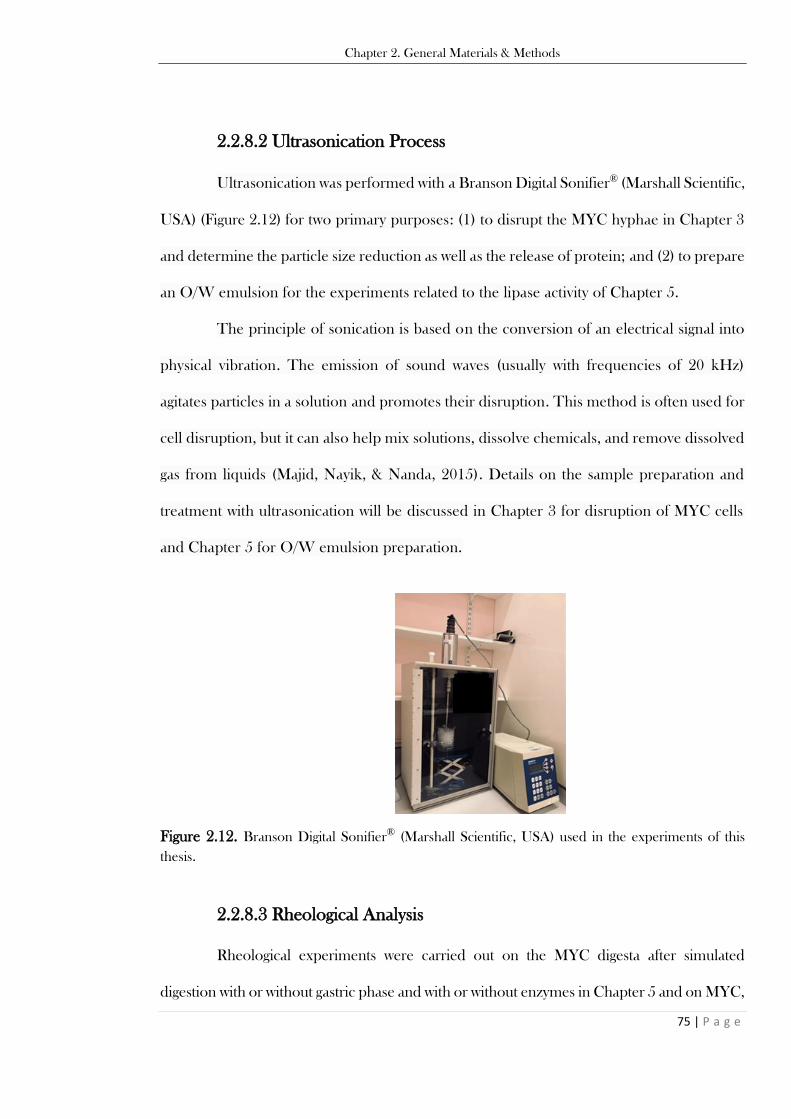
Chapter 2. General Materials & Methods
75 | P a g e
2.2.8.2 Ultrasonication Process
Ultrasonication was performed with a Branson Digital Sonifier® (Marshall Scientific,
USA) (Figure 2.12) for two primary purposes: (1) to disrupt the MYC hyphae in Chapter 3
and determine the particle size reduction as well as the release of protein; and (2) to prepare
an O/W emulsion for the experiments related to the lipase activity of Chapter 5.
The principle of sonication is based on the conversion of an electrical signal into
physical vibration. The emission of sound waves (usually with frequencies of 20 kHz)
agitates particles in a solution and promotes their disruption. This method is often used for
cell disruption, but it can also help mix solutions, dissolve chemicals, and remove dissolved
gas from liquids (Majid, Nayik, & Nanda, 2015). Details on the sample preparation and
treatment with ultrasonication will be discussed in Chapter 3 for disruption of MYC cells
and Chapter 5 for O/W emulsion preparation.
Figure 2.12. Branson Digital Sonifier® (Marshall Scientific, USA) used in the experiments of this
thesis.
2.2.8.3 Rheological Analysis
Rheological experiments were carried out on the MYC digesta after simulated
digestion with or without gastric phase and with or without enzymes in Chapter 5 and on MYC,
Chapter 2. General Materials & Methods
76 | P a g e
WBM, OAT, and BAR in Chapter 6. For Chapter 5 experiments, the main aim was to
determine the impact of digestion on the sample viscosity that could potentially impact the
binding of BS. For Chapter 6 experiments, the viscosity analysis was carried out to observe
any potential correlation between the increase in viscosity with the release of -glucans
following simulated GI digestion. The sample loaded onto the rheometer and analysed will be
specified in detail in the methods of Chapters 5 and 6.
Rheology is a branch of physics that study the flow of matter. Liquids and solids can
flow or elastically deform when a force or stress is applied. Different substances with complex
microstructures can be studied (e.g., muds, sludges, suspensions, polymers, silicates, foods and
additives, and bodily fluids) (Abraham, Sharika, Mishra, & Thomas, 2017). The instruments
(i.e., rheometers) used to determine the rheological properties of these substances apply a
specific force or shear stress to the sample that is measured in Pascal (force per unit area), the
rheometer then determines the resultant deformation (strain) or flow (strain rate). The
viscosity (η) is the tendency of the fluid to resist flow and is defined by Equation 2.3.
Equation 2.3. Equation of viscosity (η) as a function of the shear stress divided by the strain rate.
η= Shear Stress
Strain rate
Rheology measurements of particle dispersions can be controlled by the particle
properties of substances, such as size and shape. Viscosity is inversely proportional to particle
size; increased particle size (for a given particle-phase volume) decreases the viscosity and vice
versa. However, a suspension of particles with a large polydispersity (wide size distribution)
has more free space available than particles of the same size (narrow size distribution). The
free space allows the smaller particles to move around the larger particles, and the sample can
flow smoothly. Therefore, the resultant viscosity is lower. Other properties can influence
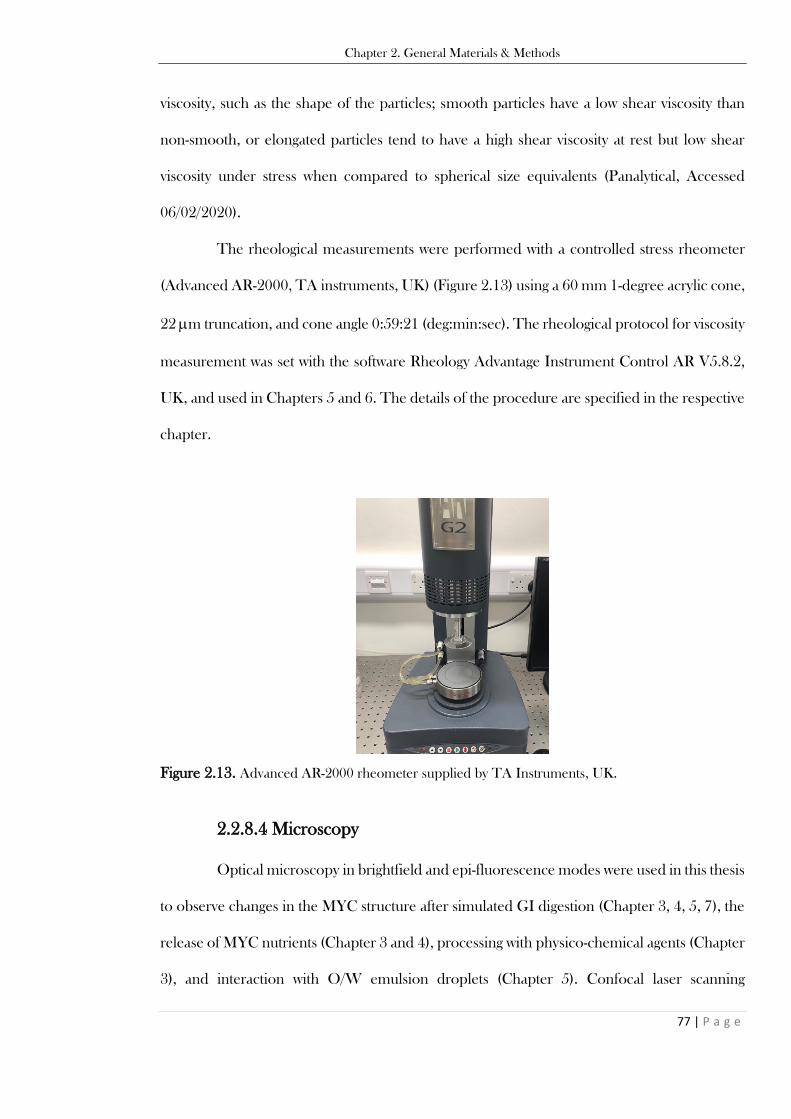
Chapter 2. General Materials & Methods
77 | P a g e
viscosity, such as the shape of the particles; smooth particles have a low shear viscosity than
non-smooth, or elongated particles tend to have a high shear viscosity at rest but low shear
viscosity under stress when compared to spherical size equivalents (Panalytical, Accessed
06/02/2020).
The rheological measurements were performed with a controlled stress rheometer
(Advanced AR-2000, TA instruments, UK) (Figure 2.13) using a 60 mm 1-degree acrylic cone,
22 m truncation, and cone angle 0:59:21 (deg:min:sec). The rheological protocol for viscosity
measurement was set with the software Rheology Advantage Instrument Control AR V5.8.2,
UK, and used in Chapters 5 and 6. The details of the procedure are specified in the respective
chapter.
Figure 2.13. Advanced AR-2000 rheometer supplied by TA Instruments, UK.
2.2.8.4 Microscopy
Optical microscopy in brightfield and epi-fluorescence modes were used in this thesis
to observe changes in the MYC structure after simulated GI digestion (Chapter 3, 4, 5, 7), the
release of MYC nutrients (Chapter 3 and 4), processing with physico-chemical agents (Chapter
3), and interaction with O/W emulsion droplets (Chapter 5). Confocal laser scanning
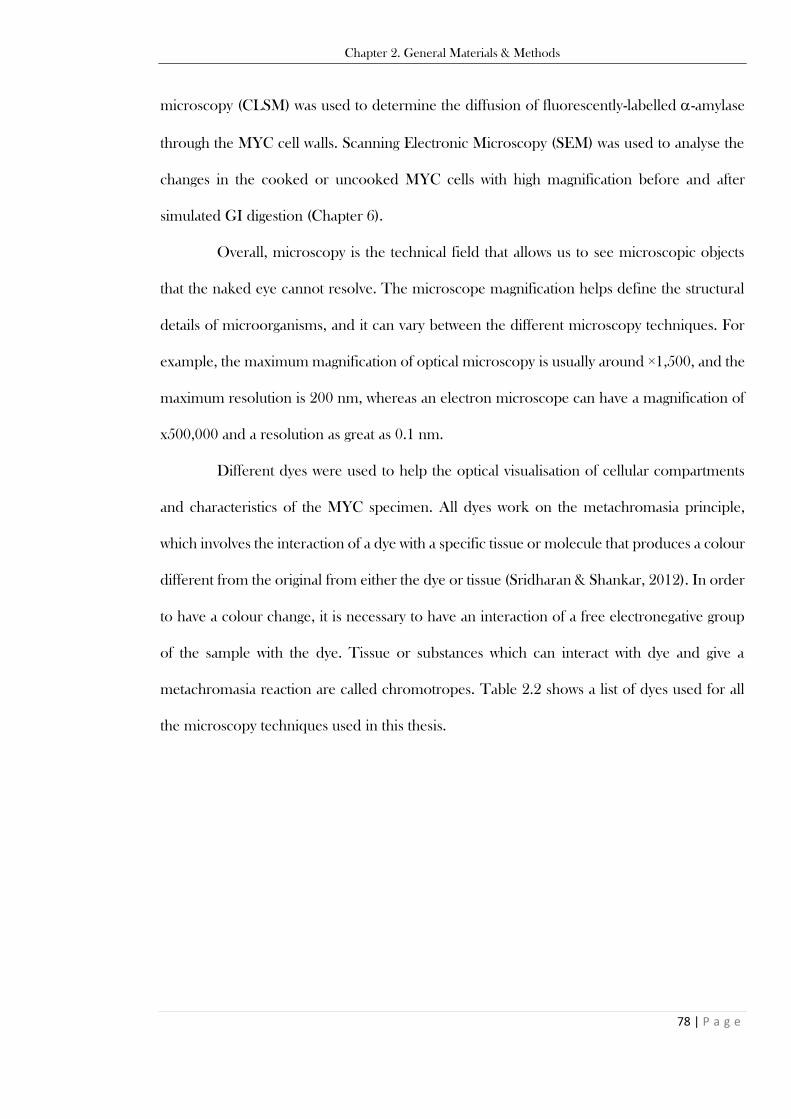
Chapter 2. General Materials & Methods
78 | P a g e
microscopy (CLSM) was used to determine the diffusion of fluorescently-labelled -amylase
through the MYC cell walls. Scanning Electronic Microscopy (SEM) was used to analyse the
changes in the cooked or uncooked MYC cells with high magnification before and after
simulated GI digestion (Chapter 6).
Overall, microscopy is the technical field that allows us to see microscopic objects
that the naked eye cannot resolve. The microscope magnification helps define the structural
details of microorganisms, and it can vary between the different microscopy techniques. For
example, the maximum magnification of optical microscopy is usually around ×1,500, and the
maximum resolution is 200 nm, whereas an electron microscope can have a magnification of
x500,000 and a resolution as great as 0.1 nm.
Different dyes were used to help the optical visualisation of cellular compartments
and characteristics of the MYC specimen. All dyes work on the metachromasia principle,
which involves the interaction of a dye with a specific tissue or molecule that produces a colour
different from the original from either the dye or tissue (Sridharan & Shankar, 2012). In order
to have a colour change, it is necessary to have an interaction of a free electronegative group
of the sample with the dye. Tissue or substances which can interact with dye and give a
metachromasia reaction are called chromotropes. Table 2.2 shows a list of dyes used for all
the microscopy techniques used in this thesis.
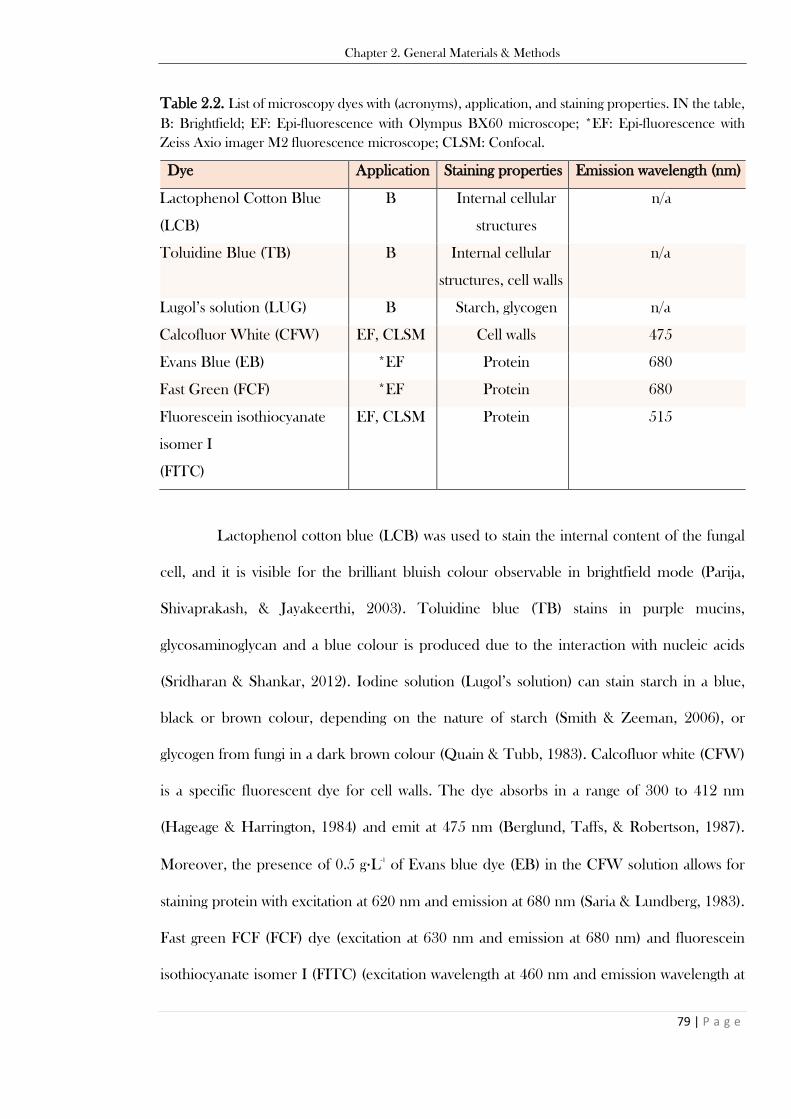
Chapter 2. General Materials & Methods
79 | P a g e
Table 2.2. List of microscopy dyes with (acronyms), application, and staining properties. IN the table,
B: Brightfield; EF: Epi-fluorescence with Olympus BX60 microscope; *EF: Epi-fluorescence with
Zeiss Axio imager M2 fluorescence microscope; CLSM: Confocal.
Dye Application Staining properties Emission wavelength (nm)
Lactophenol Cotton Blue
(LCB)
B Internal cellular
structures
n/a
Toluidine Blue (TB) B Internal cellular
structures, cell walls
n/a
Lugol’s solution (LUG) B Starch, glycogen n/a
Calcofluor White (CFW) EF, CLSM Cell walls 475
Evans Blue (EB) *EF Protein 680
Fast Green (FCF) *EF Protein 680
Fluorescein isothiocyanate
isomer I
(FITC)
EF, CLSM Protein 515
Lactophenol cotton blue (LCB) was used to stain the internal content of the fungal
cell, and it is visible for the brilliant bluish colour observable in brightfield mode (Parija,
Shivaprakash, & Jayakeerthi, 2003). Toluidine blue (TB) stains in purple mucins,
glycosaminoglycan and a blue colour is produced due to the interaction with nucleic acids
(Sridharan & Shankar, 2012). Iodine solution (Lugol’s solution) can stain starch in a blue,
black or brown colour, depending on the nature of starch (Smith & Zeeman, 2006), or
glycogen from fungi in a dark brown colour (Quain & Tubb, 1983). Calcofluor white (CFW)
is a specific fluorescent dye for cell walls. The dye absorbs in a range of 300 to 412 nm
(Hageage & Harrington, 1984) and emit at 475 nm (Berglund, Taffs, & Robertson, 1987).
Moreover, the presence of 0.5 g·L-1
of Evans blue dye (EB) in the CFW solution allows for
staining protein with excitation at 620 nm and emission at 680 nm (Saria & Lundberg, 1983).
Fast green FCF (FCF) dye (excitation at 630 nm and emission at 680 nm) and fluorescein
isothiocyanate isomer I (FITC) (excitation wavelength at 460 nm and emission wavelength at
Chapter 2. General Materials & Methods
80 | P a g e
515 nm) were also used to stain protein in red and green, respectively (Auty, Twomey, Guinee,
& Mulvihill, 2001). FITC was also used for the labelling of a-amylase in Chapter 4, Section
4.3.4.1.
Optical Microscopy
An Olympus BX60 microscope (Olympus, Japan), coupled with a Jenoptik
ProgRes C10plus camera, was used in brightfield and epi-fluorescent mode. In contrast, a Zeiss
Axio imager M2 fluorescence microscope (Carl Zeiss AG, Germany), with Axiocam mRm R3
camera, was used for epi-fluorescence only. Both microscopes were with or without different
dyes (Table 2.2) to qualitatively investigate the effect of various treatments applied to MYC.
Figure 2.14 shows the principles of the brightfield and epi-fluorescence techniques that are
discussed individually in the following sections.
Figure 2.14. Schematic representation of the principles of optical microscopy technique used in
brightfield (left) or epi-fluorescence (right).

Chapter 2. General Materials & Methods
81 | P a g e
Brightfield Microscopy
Brightfield microscopy is a basic microscopy illumination technique in which
the sample is illuminated from below and observed from above. The white light passes through
obstruction and a lens called a condenser before reaching the sample, where objects that
absorb or attenuate the light are viewed as darker and contrasted with the bright background.
Epi-Fluorescence Microscopy
The epi-fluorescence technique is also defined as wide-field fluorescence as a
specific wavelength illuminates the whole sample. The basic principle of fluorescence involves
the emission of fluorescent light from an object that has been previously excited by absorbed
light or electromagnetic radiation. The light source passes through an excitation filter that
selects a specific wavelength (or wavelengths) and illuminates the specimen after reflecting
through a dichroic mirror into the objective lens. Then, the sample absorbs the light, and the
active fluorophores in the sample emit an excitatory light that passes through the same
objective lens and reach the eyepiece and detector. Emission filters select out the wavelengths
of the fluorescently emitted light from the light reflected from the sample.
Confocal Laser Scanning Microscopy
CLSM was performed with a Zeiss LSM880 with Airyscan, and micrographs
were acquired with an Axiocam-S03 mono camera (Carl Zeiss AG, Germany). CLSM is based
on the principle of fluorescence emitted by a specimen when excited, but the main difference
with the wide-field fluorescence of the epi-fluorescence technique is that the whole specimen
is not completely illuminated. Indeed, CLSM uses a configuration with point illumination and
a pinhole that focuses the incident light on a minor focal point (Figure 2.15). This focal point
is scanned across the whole sample field to assemble an image with a tiny focal plane. This

Chapter 2. General Materials & Methods
82 | P a g e
allows the technique to produce a focussed signal that reduces the unfocussed background due
to the illumination on the whole specimen, resulting in a high optical resolution of the image.
Another advantage of CLSM is that several optical planes can be scanned and stacked using
Z-stack deconvolution software (Carl Zeiss AG, Germany). The latter can help visualise 3D
objects and, therefore, the depth of the specimen. Several lasers and emission/excitation filters
associated with several dyes can be used simultaneously. This makes possible the analysis of
different cellular compartments and components. The details of the procedure are specified
in Chapter 4.
Figure 2.15. Schematic representation of the principles of CLSM microscopy.
Scanning Electronic Microscopy
SEM is a valuable tool for analysing food structures and food processing
(Morris & Groves, 2013; Sharma & Bhardwaj, 2019). Dr Kathryn Cross performed the SEM
analysis at the John Innes Centre, UK.
SEM can provide images of the surface of small features or objects with a
high-quality and spatial resolution of 1 nm. The principle is based on the use of high energy
electrons that are pointed to a sample. The outcoming electrons/X-rays are analysed to
Chapter 2. General Materials & Methods
83 | P a g e
determine the observed material topography, morphology, composition, and orientation
(Akhtar, Khan, Khan, & Asiri, 2018). Electrons propagate with much smaller wavelengths
than optical light, resulting in highly detailed and magnified images. The details of the
procedure are specified in Chapter 6.
Chapter 3. Protein Release from Mycoprotein Matrix During In Vitro Gastrointestinal Digestion
84 | P a g e
Chapter 3
Protein Release from Mycoprotein Matrix During
In Vitro Gastrointestinal Digestion†
† This chapter is based on the published peer-reviewed manuscript Colosimo, Warren,
Finnigan, and Wilde (2020), Food Chemistry 330 (2020) 127252.
Chapter 3. Protein Release from Mycoprotein Matrix During In Vitro Gastrointestinal Digestion
85 | P a g e
3.1 Introduction
The recent literature concerning protein from the mycoprotein (MYC) matrix in clinical
trials has shown a high bioavailability, stimulating a robust anabolic response (Dunlop et al.,
2017; Monteyne et al., 2020). The fungal cell walls (FCW) of MYC may have some similarities
with plant cell walls. Regardless of species, plant cell walls (PCW) have shown to be highly
effective at controlling the accessibility of enzymes to intracellular substrates and the digestion
and release of nutrients. These effects result in nutrients being physically encapsulated inside
the food structure (Bhattarai, Dhital, Mense, Gidley, & Shi, 2018; Ellis et al., 2004; Grundy,
Wilde, Butterworth, Gray, & Ellis, 2015). The delayed or sustained release of nutrients due
to their encapsulation within the cell wall could potentially induce an increase in satiety
signalling and decrease the glycaemic response (Wilde, 2009).
On the other hand, the fungal cell wall has been described as more porous (De Nobel,
Klis, Priem, Munnik, & Van Den Ende, 1990; Walker et al., 2018), molecularly more dynamic
and flexible compared to PCW (Kang et al., 2018). Thus, it is possible to consider that
enzymes could diffuse through the fungal cell wall due to its porosity/permeability and digest
the intracellular nutrients. This effect may depend on the intactness of the cell walls, in a
similar way as observed with plants (Grundy et al., 2016). Although more flexible than PCW
to support structural growth, FCW have also been found to contain far more covalent
intermolecular crosslinks than PCW, which can provide more resilience to environmental
stress (Kang et al., 2018).
However, the mechanisms of protein bioavailability in fungal cells are not fully
understood. Underpinning the biochemical mechanisms behind the high protein release and
absorption from fungal cells is the key to developing new products manufactured for different
nutritional outcomes (e.g., high release and fast absorption or slow-release and slow
absorption). In this chapter, the mechanisms underlying protein release from MYC were
Chapter 3. Protein Release from Mycoprotein Matrix During In Vitro Gastrointestinal Digestion
86 | P a g e
proposed. Protein release was investigated by bicinchoninic acid (BCA) and Bradford assays
after protein extraction methods, including mechanical, chemical, and physical processing, to
assess the disruption of the cell walls. In the same way, the release of protein was evaluated
after enzymatic digestions using cell-wall-degrading enzymes (Driselase™) and simulated
gastrointestinal (GI) digestion following the INFOGEST static in vitro digestion method
(Minekus et al., 2014). Qualitative analysis of the cell wall integrity and release of cellular
components was performed by optical microscopy in brightfield and epi-fluorescence mode
and fluorescence microscopy. Beyond this, sodium dodecyl sulphate polyacrylamide gel
electrophoresis (SDS-PAGE) analysis was carried out to determine protein hydrolysis, and
static laser light scattering was performed to determine the effect of the different methods on
the particle size of the MYC hyphae.
3.2 Materials & Methods
3.2.1 Materials
3.2.1.1 Chemicals and Reagents
The specific reagents used in this chapter are specified below, while the common
materials to other chapters are listed in Chapter 2, Section 2.1.1.
All reagents were of analytical grade and purchased from Merck, UK unless
otherwise stated: Urea (Catalogue No. U6504), NH4Cl (Catalogue No. A9434), thiourea
(Catalogue No. T8656), 3-[(3-Cholamidopropyl) dimethylammonio]-1-propane sulfonate
hydrate (CHAPS) (Catalogue No. 226947), triton X (Catalogue No. X100), solid-glass beads
borosilicate (1 mm) (Catalogue No. Z273619), Driselase™ (Catalogue No. D9515), and
SimplyBlue™ SafeStain (Catalogue No. LC6065, Thermo Fisher Scientific, UK).
Chapter 3. Protein Release from Mycoprotein Matrix During In Vitro Gastrointestinal Digestion
87 | P a g e
3.2.1.2 Mycoprotein Samples
Freshly harvested MYC goes through heat treatment (˃ 68℃ followed by a quick
increase to 90℃) (Wiebe, 2002) to reduce the free RNA content (Chapter 1, Section 1.2.2).
MYC was provided by Marlow Foods Ltd, UK, at two different stages of the production
process, as described in Chapter 2, Section 2.2.2: (1) a raw sample prior to RNA depletion
(RAW-MYC) and (2) a freeze-dried powder prepared following RNA depletion (MYC).
The freeze-dried MYC powder was prepared at 25 wt% or 10 wt% with ultra-pure
water and the resulting samples are referred to in the text as MYC25 or MYC10, respectively.
These samples were also ultra-sonicated with a Branson Digital Sonifier® (Marshall Scientific,
USA) with ten cycles of 10 s ultra-sonication (70% amplitude) and 20 s rest. These samples
are referred to as MYC25/SON and MYC10/SON.
RAW-MYC25 was prepared at 25 wt% with ultra-pure water and is referred to in the
text as RAW-MYC25, or washed 3 times with ultra-pure water, centrifuged at 2,800 xg
(Heraeus Megafuge 16, Germany) for 10 min, and freeze-dried (LyoDry Compact,
Mechatech, UK) for 3 days. This washed and dried powder was prepared at 25 wt% with ultra-
pure water before digestion and is referred to as W-RAW-MYC25.
3.2.2 Methods
3.2.2.1 Simulated Gastrointestinal Digestion
The digestion was carried out following the INFOGEST static in vitro digestion
method for food described in Chapter 2, section 2.2.1.
The digestion was carried out with 2.5 g of food (e.g., MYC25 was prepared with
0.625 g of MYC powder plus 1.875 mL of ultra-pure water) with a total digesta volume of 10
mL for the gastric step and 20 mL for the intestinal. Samples were collected at the established
time points (i.e., 15, 30, 60, and 120 min for the gastric step, whereas 5, 15, 30, 60, and 120
Chapter 3. Protein Release from Mycoprotein Matrix During In Vitro Gastrointestinal Digestion
88 | P a g e
min for the intestinal step correspond to 125, 135, 150, 180, 240 min in Figure 3.3 and 3.8B).
The undigested (U in Figure 3.3) sample was the control without enzymes that went through
all the GI simulated digestion. The enzyme activity was stopped by adding 2 M NaOH to
reach pH 7.0 in the gastric time points and pH 11.0 in the samples from the small intestinal
phase. Afterwards, the samples were centrifuged at 2,800 xg for 10 min, and the supernatant
was immediately stored at -20℃ until protein analysis. In contrast, the pellet was stored at 4℃
and used on the same day of the experiment for microscopy and particle size analysis.
3.2.2.2 Protein Quantification
Quantitative protein analysis was performed by bicinchoninic acid assay (BCA) and
Bradford assays described in Chapter 2 (Sections 2.2.3.1 and 2.2.3.2, respectively). The
absorbances of Driselase™ solution, pepsin and pancreatin were measured separately by BCA
assay as baseline values at the same concentration used at the beginning of the in vitro
digestions and subtracted from the values obtained from the BCA assay of the digested
samples.
Chemical Extraction of Protein
The chemical buffers to facilitate protein release from MYC samples are reported
in Table 3.1.
The MYC25 or MYC10 was stirred for 2 min with the chemical buffer using a vortex
mixer and incubated for 120 min at room temperature. After the incubation, different
methods for microstructural disruption were performed on MYC25 or MYC10.
Homogenisation, ultra-sonication and glass bead grinding methods were applied to release the
protein from the MYC hyphae.
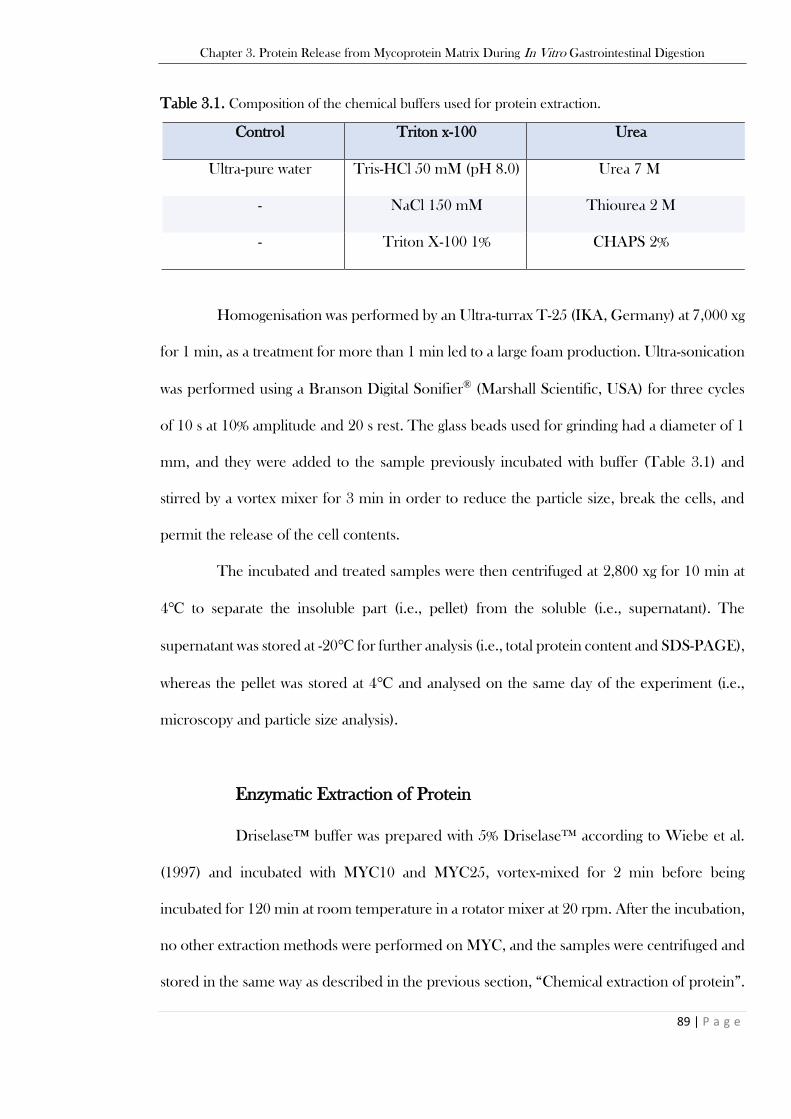
Chapter 3. Protein Release from Mycoprotein Matrix During In Vitro Gastrointestinal Digestion
89 | P a g e
Table 3.1. Composition of the chemical buffers used for protein extraction.
Control Triton x-100 Urea
Ultra-pure water Tris-HCl 50 mM (pH 8.0) Urea 7 M
- NaCl 150 mM Thiourea 2 M
- Triton X-100 1% CHAPS 2%
Homogenisation was performed by an Ultra-turrax T-25 (IKA, Germany) at 7,000 xg
for 1 min, as a treatment for more than 1 min led to a large foam production. Ultra-sonication
was performed using a Branson Digital Sonifier® (Marshall Scientific, USA) for three cycles
of 10 s at 10% amplitude and 20 s rest. The glass beads used for grinding had a diameter of 1
mm, and they were added to the sample previously incubated with buffer (Table 3.1) and
stirred by a vortex mixer for 3 min in order to reduce the particle size, break the cells, and
permit the release of the cell contents.
The incubated and treated samples were then centrifuged at 2,800 xg for 10 min at
4℃ to separate the insoluble part (i.e., pellet) from the soluble (i.e., supernatant). The
supernatant was stored at -20℃ for further analysis (i.e., total protein content and SDS-PAGE),
whereas the pellet was stored at 4℃ and analysed on the same day of the experiment (i.e.,
microscopy and particle size analysis).
Enzymatic Extraction of Protein
Driselase™ buffer was prepared with 5% Driselase™ according to Wiebe et al.
(1997) and incubated with MYC10 and MYC25, vortex-mixed for 2 min before being
incubated for 120 min at room temperature in a rotator mixer at 20 rpm. After the incubation,
no other extraction methods were performed on MYC, and the samples were centrifuged and
stored in the same way as described in the previous section, “Chemical extraction of protein”.
Chapter 3. Protein Release from Mycoprotein Matrix During In Vitro Gastrointestinal Digestion
90 | P a g e
3.2.2.3 Structural Analysis
Brightfield & Epi-Fluorescence Microscopy
Brightfield and epi-Fluorescence microscopy were performed using an Olympus
BX60 optical microscope (Olympus, Japan), and micrographs were acquired with Jenoptik
ProgRes C10plus camera (Jenoptik AG, Germany). For brightfield microscopy, lactophenol
cotton blue (LCB) was used in proportion 2:1 to the sample to stain the intracellular content
of MYC. Toluidine blue (TB) at 5% was used in proportion 2:1 to the sample to stain
glycated protein of MYC cell wall. Calcofluor white stain (CFW) was used in proportion 2:1
to the sample to stain the cell walls of MYC. Epi-fluorescence was performed with the WU
fluorescence cube, 330-385 nm, barrier filter 430 nm.
A Zeiss Axio imager M2 microscope was used for fluorescence microscopy, and
micrographs were acquired by Axiocam mRm R3 camera (Carl Zeiss AG, Germany).
Excitation for cell wall fibres stained with CFW was at 370 - 410 nm and emission at 430 - 470
nm. Moreover, the addition of Evan blue (EB) dye at 0.5 g/L in CFW allowed staining protein
with excitation at 625 - 655 nm and emission at 665 - 712 nm. Fast green FCF stain (FCF) and
Fluorescein isothiocyanate isomer (FITC) were used to stain protein in red and green,
respectively (Auty, Twomey, Guinee & Mulvihill, 2001; Lanz, Gregor, Slavík & Kotyk, 1997).
FCF and FITC were diluted at 1:100 with water and incubated in proportion 2:1 to MYC
hyphae for 5 min at room temperature. Excitation and emission spectra were respectively 625
- 655 nm and 665 - 712 nm for FG and 475 - 30 nm and 550 - 100 nm for FITC.
Particle Size Analysis
The particle size was measured using static laser light scattering with a particle size
analyser LS 13-320 (Beckman Coulter, USA). The analysis was carried out using a model with
Chapter 3. Protein Release from Mycoprotein Matrix During In Vitro Gastrointestinal Digestion
91 | P a g e
a refractive index of 1.7. The samples analysed were the pellets of MYC25 that underwent
different processing, as illustrated in Figure 3.8A: (1) incubated with ultra-pure water (control);
(2) incubated with water and furtherly homogenised; (3) grounded with glass beads; and (4)
ultra-sonicated. Furthermore, the particle size of the MYC25 and MYC25/SON samples was
analysed during simulated GI digestion (Figure 3.8B).
3.2.2.4 Data Analysis
Statistical analysis was performed with GraphPad Prism version 5 for Windows
(GraphPad Software, USA) and Jamovi version 1.0, Australia, (Jamovi project, 2019) for
Three-way ANOVA (Figure 3.1A); statistical significance was set at p-value < 0.05. For the
protein release measurements (Figure 3.1, 3.3 and 3.4), values were expressed as average ±
standard deviation (SD) of three independent measures (n = 3). The post-hoc analysis is
specified in the description of the corresponding figure where applicable.
3.3 Results & Discussion
3.3.1 Effect of Protein Extraction Methods and Cell-Wall-Degrading-
Enzymes
Analyses were undertaken to determine the effect of different processing in the overall
protein content released from the MYC samples and investigate the role of the cell wall in
controlling protein bioaccessibility. The release of protein was measured to determine the
effects of the chemical buffer (i.e., Triton X-100 or urea) and mechanical/physical processing
(i.e., homogenisation, glass beads and ultra-sonication) on protein bioaccessibility from the
two MYC formulations (i.e., MYC25 and MYC10 in Figure 3.1A). Furthermore, the release
of protein from these two MYC formulations was determined after incubation with cell wall
Chapter 3. Protein Release from Mycoprotein Matrix During In Vitro Gastrointestinal Digestion
92 | P a g e
degrading enzymes (i.e., Driselase™) (Figure 3.1B) and compared to the most efficient
physico-chemical method that released the highest amount of protein (i.e., urea plus ultra-
sonication in Figure 3.1A).
Figure 3.1A shows the protein released from MYC25 and MYC10 incubated for 120
min (INC) with ultra-pure water as a control (CNT), triton X-100, urea solutions and further
followed by homogenisation (INC + HOMO), glass-beads grinding (INC + GB), or ultra-
sonication (INC + SON). The mechanical/physical processing alone appeared to have no
effect per se on protein bioaccessibility. The controls of each category (i.e., the samples
incubated with ultra-pure water) did not show any significant change between the different
methods applied, but the presence of chemical solutions in conjunction with the treatments
showed an increase in the yield of protein released. Overall, this suggests that the hyphal cell
walls acted as an efficient barrier to limiting protein release and were resistant to harsh physical
treatments. This resistance might be due to the extensive covalent crosslinks between the cell
wall polymers (Kang et al., 2018). Urea with ultra-sonication was the most efficient method as
it promoted the highest amount of protein release. The different MYC concentrations did not
affect the proportion of protein released in any physical treatments, suggesting that the
extraction efficiency was not limited by the range of MYC concentrations studied here.
However, MYC10 had a statistically significantly higher protein release than MYC25
following the use of Driselase™ (p-value < 0.01). Driselase™ contains a mixture of enzymes,
including xylanase, cellulase and laminarinase. It has been shown in the past that Driselase™
could promote a more efficient protoplast release from MYC compared to other enzymes
(Wiebe et al., 1997). Figure 3.1B shows a statistically significant difference (p-value < 0.01)
between the two MYC formulations incubated with Driselase™ buffer, with the highest
proportion of protein released from the less concentrated MYC10, compared to MYC25. The
effect of the Driselase™ solution (DRI in Figure 3.1B) was comparable to the treatment of
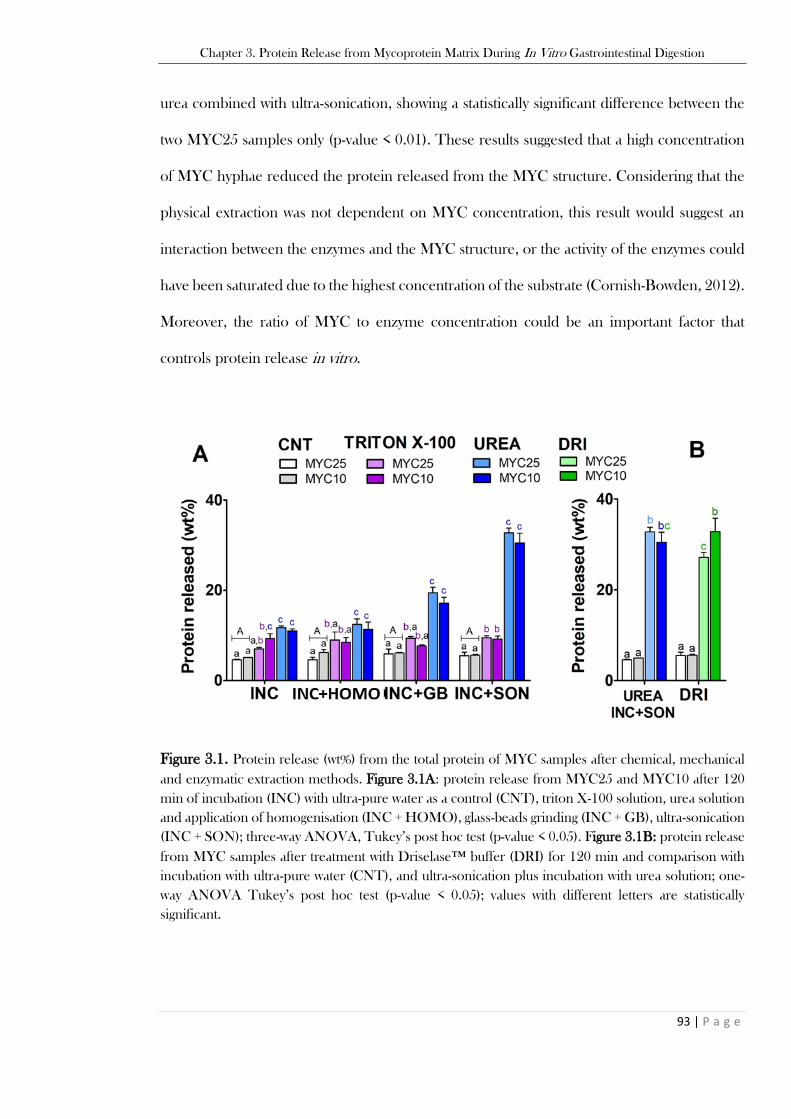
Chapter 3. Protein Release from Mycoprotein Matrix During In Vitro Gastrointestinal Digestion
93 | P a g e
urea combined with ultra-sonication, showing a statistically significant difference between the
two MYC25 samples only (p-value < 0.01). These results suggested that a high concentration
of MYC hyphae reduced the protein released from the MYC structure. Considering that the
physical extraction was not dependent on MYC concentration, this result would suggest an
interaction between the enzymes and the MYC structure, or the activity of the enzymes could
have been saturated due to the highest concentration of the substrate (Cornish-Bowden, 2012).
Moreover, the ratio of MYC to enzyme concentration could be an important factor that
controls protein release in vitro.
Figure 3.1. Protein release (wt%) from the total protein of MYC samples after chemical, mechanical
and enzymatic extraction methods. Figure 3.1A: protein release from MYC25 and MYC10 after 120
min of incubation (INC) with ultra-pure water as a control (CNT), triton X-100 solution, urea solution
and application of homogenisation (INC + HOMO), glass-beads grinding (INC + GB), ultra-sonication
(INC + SON); three-way ANOVA, Tukey’s post hoc test (p-value < 0.05). Figure 3.1B: protein release
from MYC samples after treatment with Driselase™ buffer (DRI) for 120 min and comparison with
incubation with ultra-pure water (CNT), and ultra-sonication plus incubation with urea solution; one-
way ANOVA Tukey’s post hoc test (p-value < 0.05); values with different letters are statistically
significant.
Chapter 3. Protein Release from Mycoprotein Matrix During In Vitro Gastrointestinal Digestion
94 | P a g e
3.3.2 Visualisation of Mycoprotein Hyphae After Protein Extraction
Methods and Cell-Wall-Degrading-Enzymes
The microscopy analysis of this section was carried out by brightfield, epi-fluorescence
and fluorescence techniques. Figure 3.2 shows the effects of the physico-chemical extraction
methods (Figure 3.1A) and cell-wall-degrading-enzymes (Figure 3.1B) on MYC structure and
cellular integrity.
Figure 3.2A shows optical micrographs of MYC25 hyphae obtained after incubation
with urea solution (INC: Figure 3.2A a, b, c), incubation plus homogenisation (INC + HOMO:
Figure 3.2A d, e, f), glass bead grinding (INC + GB: Figure 3.2A g, h, i) and ultra-sonication
(INC + SON: Figure 3.2A j, k, l). The fungal hyphae were stained entirely in all the treatments
using the dyes (LCB, TB or CFW). This indicated that the cell walls were fully encapsulating
their contents with no apparent signs of damage, despite the release of protein measured by
the BCA assay (Figure 3.1A). The long and compact hyphal structures visible in the incubation
with urea (INC: Figure 3.2A a, b, c) were less present in INC + HOMO, INC + GB and INC
+ SON.
Figure 3.2B shows optical micrographs of MYC25 and MYC10 hyphae before (control)
and after incubation with Driselase™ buffer (MYC25 and MYC10). Differently from the urea
solution incubation (Figure 3.2A), the fungal hyphae appeared to be damaged and took up
less dye when stained by LCB (Figure 3.2B d, g) and TB (Figure 3.2B e, h). Likewise, CFW
stains showed a less smooth surface in MYC25 (Figure 3.2B f) and a digested mass in MYC10
(Figure 3.2B i, j) compared to the control (Figure 3.2B c). This observation supported the
hypothesis that the digestion of the cell wall fibre was more effective in the less concentrated
formulation, which was suggested by the higher protein release by Driselase™ buffer from
MYC10 than MYC25 (Figure 3.1B, p-value < 0.01).
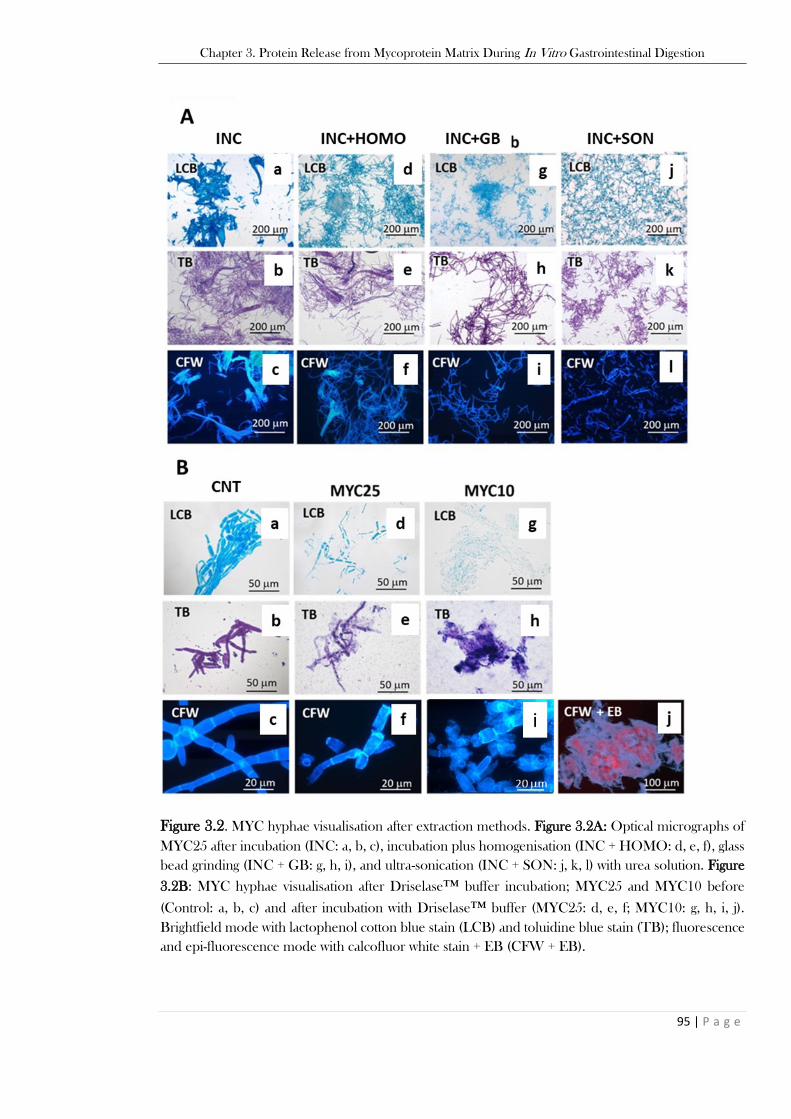
Chapter 3. Protein Release from Mycoprotein Matrix During In Vitro Gastrointestinal Digestion
95 | P a g e
Figure 3.2. MYC hyphae visualisation after extraction methods. Figure 3.2A: Optical micrographs of
MYC25 after incubation (INC: a, b, c), incubation plus homogenisation (INC + HOMO: d, e, f), glass
bead grinding (INC + GB: g, h, i), and ultra-sonication (INC + SON: j, k, l) with urea solution. Figure
3.2B: MYC hyphae visualisation after Driselase™ buffer incubation; MYC25 and MYC10 before
(Control: a, b, c) and after incubation with Driselase™ buffer (MYC25: d, e, f; MYC10: g, h, i, j).
Brightfield mode with lactophenol cotton blue stain (LCB) and toluidine blue stain (TB); fluorescence
and epi-fluorescence mode with calcofluor white stain + EB (CFW + EB).
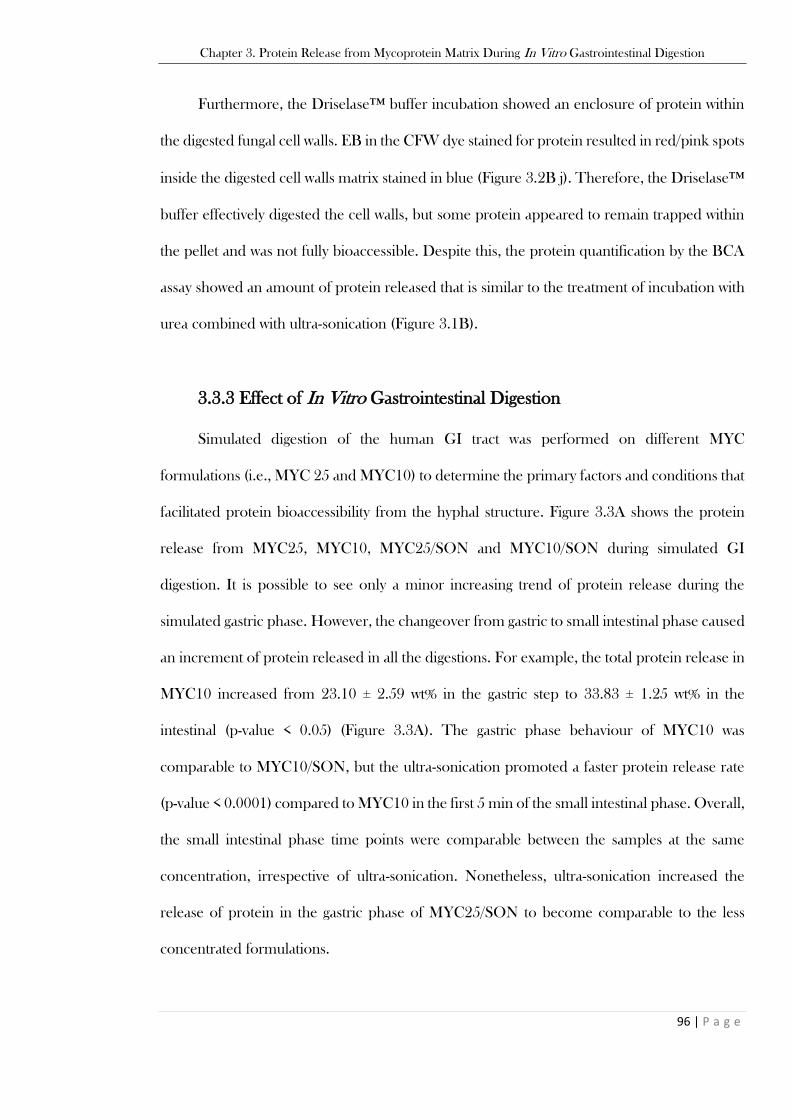
Chapter 3. Protein Release from Mycoprotein Matrix During In Vitro Gastrointestinal Digestion
96 | P a g e
Furthermore, the Driselase™ buffer incubation showed an enclosure of protein within
the digested fungal cell walls. EB in the CFW dye stained for protein resulted in red/pink spots
inside the digested cell walls matrix stained in blue (Figure 3.2B j). Therefore, the Driselase™
buffer effectively digested the cell walls, but some protein appeared to remain trapped within
the pellet and was not fully bioaccessible. Despite this, the protein quantification by the BCA
assay showed an amount of protein released that is similar to the treatment of incubation with
urea combined with ultra-sonication (Figure 3.1B).
3.3.3 Effect of In Vitro Gastrointestinal Digestion
Simulated digestion of the human GI tract was performed on different MYC
formulations (i.e., MYC 25 and MYC10) to determine the primary factors and conditions that
facilitated protein bioaccessibility from the hyphal structure. Figure 3.3A shows the protein
release from MYC25, MYC10, MYC25/SON and MYC10/SON during simulated GI
digestion. It is possible to see only a minor increasing trend of protein release during the
simulated gastric phase. However, the changeover from gastric to small intestinal phase caused
an increment of protein released in all the digestions. For example, the total protein release in
MYC10 increased from 23.10 ± 2.59 wt% in the gastric step to 33.83 ± 1.25 wt% in the
intestinal (p-value < 0.05) (Figure 3.3A). The gastric phase behaviour of MYC10 was
comparable to MYC10/SON, but the ultra-sonication promoted a faster protein release rate
(p-value < 0.0001) compared to MYC10 in the first 5 min of the small intestinal phase. Overall,
the small intestinal phase time points were comparable between the samples at the same
concentration, irrespective of ultra-sonication. Nonetheless, ultra-sonication increased the
release of protein in the gastric phase of MYC25/SON to become comparable to the less
concentrated formulations.
Chapter 3. Protein Release from Mycoprotein Matrix During In Vitro Gastrointestinal Digestion
97 | P a g e
Figure 3.3. Protein release from MYC samples after simulated GI digestion (based on the total MYC
protein content of 44% DW, Table 1.1 of Chapter 1, Section 1.2.3). Figure 3.5A: protein release from
MYC25, MYC25/SON, MYC10, MYC10/SON during in vitro digestion; two-way ANOVA, Dunnett’s
post hoc test (p-value < 0.05). Figure 3.3B: small intestinal phase of MYC25 digested with pancreatin
and individual enzymes (trypsin, chymotrypsin, or trypsin + chymotrypsin), and Figure 3.3C: gastric
and small intestinal phases of MYC25, RAW-MYC25 and W-RAW-MYC25, one-way ANOVA,
Dunnett’s post hoc test (p-value < 0.05). Figure 3.3D: small intestinal phase of MYC25 with previous
gastric digestion (gastric (+)) or without (gastric (-)). Unpaired t-test, (p-value < 0.05). Statistical
significance levels are discussed in the text. U: undigested sample (control without enzymes).
It has been shown that the reduced particle size in nanomaterials can increase the contact
surface (Suttiponparnit et al., 2010). Similarly, ultra-sonication can increase the contact surface
of the filamentous cells by reducing the particle size, and this can facilitate faster access of
enzymes in the cells and promote more rapid protein release. Despite this difference, the
overall protein concentration at the end of the small intestinal phase was comparable between
MYC10 and MYC10/SON. These results are similar to the urea extraction plus ultra-
sonication (Figure 3.1A), suggesting that physical processing is not crucial for protein release
but could have minor effects (e.g., protein digestion kinetics). On the other hand, the optimal
MYC/enzymes ratio did seem to be a critical factor that can control the release of protein,
Chapter 3. Protein Release from Mycoprotein Matrix During In Vitro Gastrointestinal Digestion
98 | P a g e
similar to what was observed with the cell wall degrading enzymes incubation (Figure 3.1B).
Hence, the less concentrated MYC10 samples had a significantly higher proportion of protein
released (p-value < 0.0001) at the endpoints of the intestinal phase compared to the more
concentrated MYC25 formulation.
Furthermore, to understand the role of different digestion stages, the use of the isolated
small intestinal proteases trypsin and chymotrypsin was studied, and the results were
comparable to when pancreatin was used (Figure 3.3B). The digestion of MYC25 using
individual enzymes such as chymotrypsin and trypsin individually or both enzymes combined
showed some kinetic differences in the protein release in the first 30 min, but comparable
results to the digestion with pancreatin in the last three time points (i.e., 30, 60, 120 min).
Therefore, it is possible to conclude that the pancreatic enzymes are the main factors that
facilitate protein bioaccessibility from the hyphal structure of MYC during GI digestion.
Figure 3.3C describes the protein release rate from the untreated paste RAW-MYC25
and W-RAW-MYC25, compared to MYC25. The undigested samples (i.e., without enzymatic
digestion) of RAW-MYC25 and W-RAW-MYC25 showed a higher amount of available
protein (p-value < 0.0001) compared to MYC25. The W-RAW-MYC25 and RAW-MYC25
samples also had a significantly higher protein release in the gastric phase than MYC25 (p-
value < 0.0001). W-RAW-MYC25 was comparable to MYC25 in the last time points of the
intestinal step (180 and 240 min), while the untreated RAW-MYC25 sample had significantly
higher protein release in all the intestinal phase points to both samples. Overall, the amount
of protein released appeared higher in the RAW-MYC25 samples compared to MYC25. This
suggested that the total nutrient content was greater in RAW-MYC compared to MYC, and
the heating process may have reduced it, as previously described by Wiebe (2002) and Ward
(1998). Notwithstanding, these findings suggested that the porosity/permeability of MYC
hyphae is an intrinsic property of the filamentous cells of Fusarium venenatum.
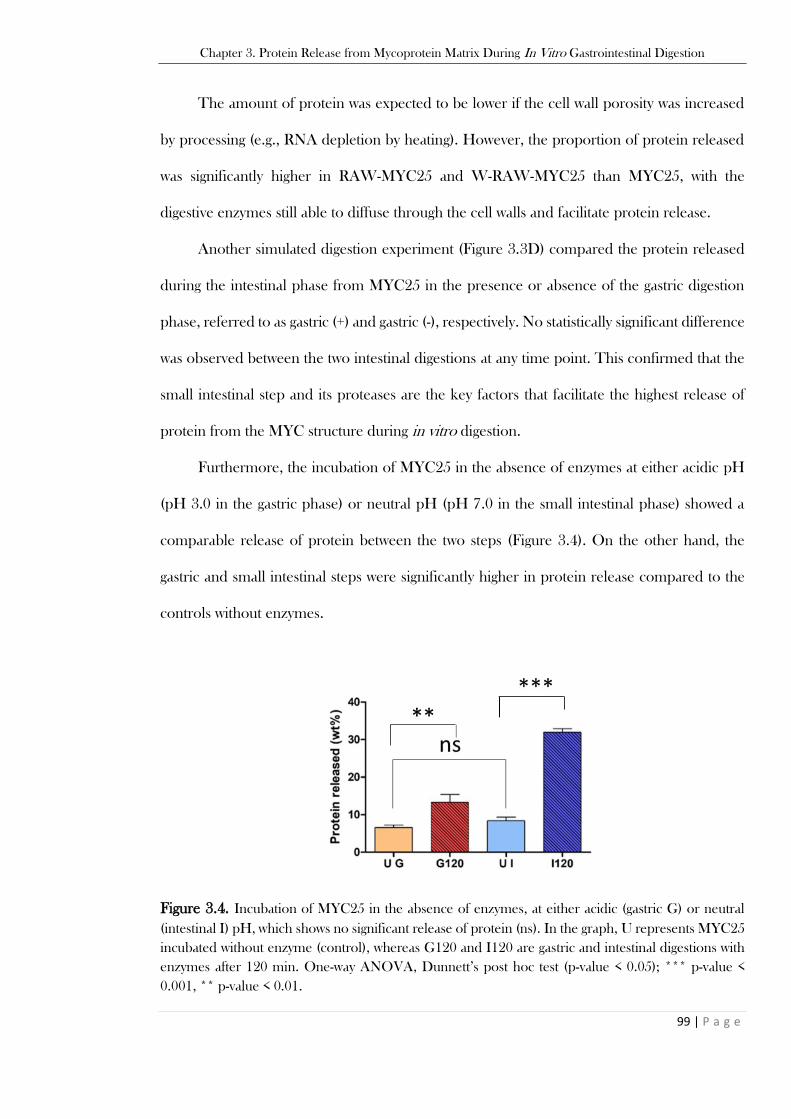
Chapter 3. Protein Release from Mycoprotein Matrix During In Vitro Gastrointestinal Digestion
99 | P a g e
The amount of protein was expected to be lower if the cell wall porosity was increased
by processing (e.g., RNA depletion by heating). However, the proportion of protein released
was significantly higher in RAW-MYC25 and W-RAW-MYC25 than MYC25, with the
digestive enzymes still able to diffuse through the cell walls and facilitate protein release.
Another simulated digestion experiment (Figure 3.3D) compared the protein released
during the intestinal phase from MYC25 in the presence or absence of the gastric digestion
phase, referred to as gastric (+) and gastric (-), respectively. No statistically significant difference
was observed between the two intestinal digestions at any time point. This confirmed that the
small intestinal step and its proteases are the key factors that facilitate the highest release of
protein from the MYC structure during in vitro digestion.
Furthermore, the incubation of MYC25 in the absence of enzymes at either acidic pH
(pH 3.0 in the gastric phase) or neutral pH (pH 7.0 in the small intestinal phase) showed a
comparable release of protein between the two steps (Figure 3.4). On the other hand, the
gastric and small intestinal steps were significantly higher in protein release compared to the
controls without enzymes.
Figure 3.4. Incubation of MYC25 in the absence of enzymes, at either acidic (gastric G) or neutral
(intestinal I) pH, which shows no significant release of protein (ns). In the graph, U represents MYC25
incubated without enzyme (control), whereas G120 and I120 are gastric and intestinal digestions with
enzymes after 120 min. One-way ANOVA, Dunnett’s post hoc test (p-value < 0.05); *** p-value <
0.001, ** p-value < 0.01.

Chapter 3. Protein Release from Mycoprotein Matrix During In Vitro Gastrointestinal Digestion
100 | P a g e
3.3.4 Visualisation of Mycoprotein Hyphae During In Vitro Digestion
Optical micrographs obtained by brightfield/epi-fluorescence (Figure 3.5A) and
fluorescence microscopy (Figure 3.5B) show the hyphal structures of MYC during gastric and
small intestinal phases of the simulated digestion of MYC25.
The internal content of MYC cells was completely stained by LCB during the gastric
phase (Figure 3.5A a), whereas no stain was observed inside the cells following small intestinal
digestion (Figure 3.5A b). The large, blue-stained area on the left of Figure 3.5A b was caused
by material in the pancreatin taking up the stain. TB showed a similar but less marked change
from gastric (Figure 3.5A c) to intestinal phase (Figure 3.5A d) with less stained MYC cells that
appeared partially digested. These results supported the protein release findings during in vitro
digestion (Figure 3.3A), showing substantial differences between gastric and small intestinal
phases.
However, CFW in epi-fluorescence and fluorescence mode showed no noticeable
structure changes following the change from gastric (Figure 3.5A e; 3.5B c) to small intestinal
digestion (Figure 3.5A f; 3.5B d). This revealed that the cell wall structure did not endure any
apparent visible damage and did not change between the two phases, as expected by the
absence of enzymes in pancreatin capable of cleaving the -bonds of cell wall fibres. Hence,
the access of the small intestinal proteases to intracellular protein was not helped by any cell
wall digestion as observed using the Driselase™ buffer (Figure 3.2B j). This further supports
the porosity/permeability hypothesis, which is in line with other studies showing that cells
(soybean) can be more permeable to enzymes during simulated digestion (Zahir, Fogliano, &
Capuano, 2020). This might be helped by the digestion of intracellular proteins or the
hydrolysis of cell wall protein.
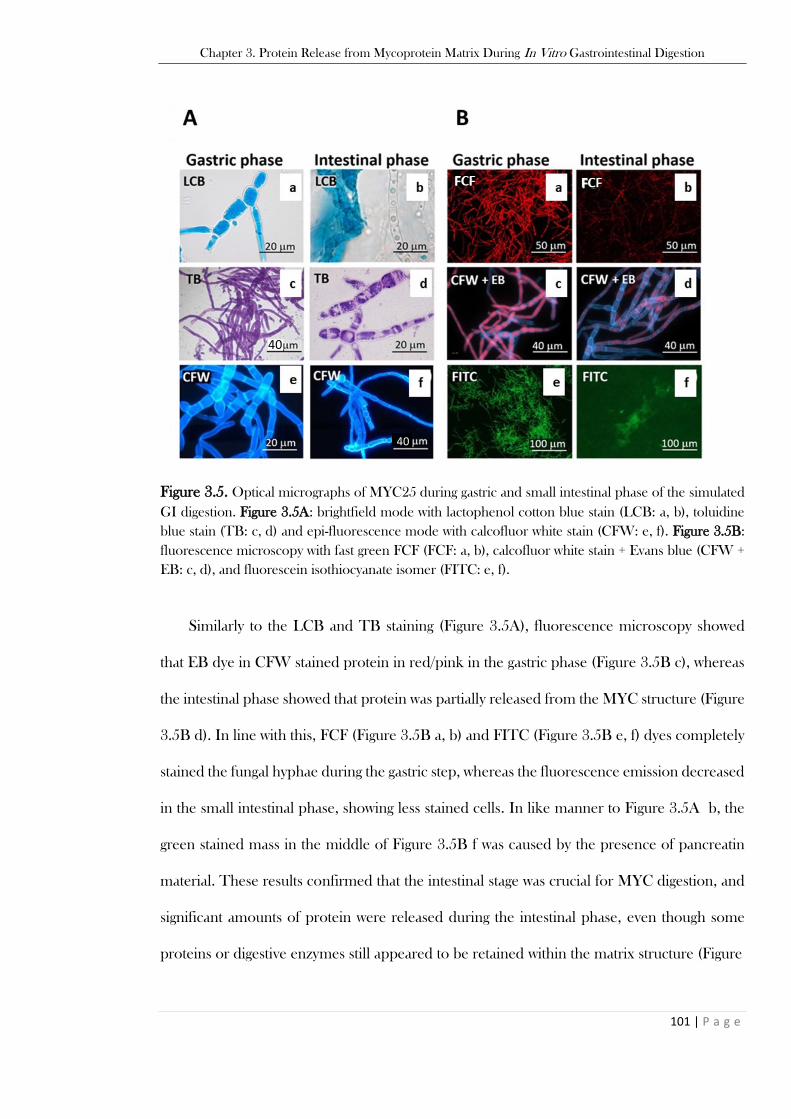
Chapter 3. Protein Release from Mycoprotein Matrix During In Vitro Gastrointestinal Digestion
101 | P a g e
Figure 3.5. Optical micrographs of MYC25 during gastric and small intestinal phase of the simulated
GI digestion. Figure 3.5A: brightfield mode with lactophenol cotton blue stain (LCB: a, b), toluidine
blue stain (TB: c, d) and epi-fluorescence mode with calcofluor white stain (CFW: e, f). Figure 3.5B:
fluorescence microscopy with fast green FCF (FCF: a, b), calcofluor white stain + Evans blue (CFW +
EB: c, d), and fluorescein isothiocyanate isomer (FITC: e, f).
Similarly to the LCB and TB staining (Figure 3.5A), fluorescence microscopy showed
that EB dye in CFW stained protein in red/pink in the gastric phase (Figure 3.5B c), whereas
the intestinal phase showed that protein was partially released from the MYC structure (Figure
3.5B d). In line with this, FCF (Figure 3.5B a, b) and FITC (Figure 3.5B e, f) dyes completely
stained the fungal hyphae during the gastric step, whereas the fluorescence emission decreased
in the small intestinal phase, showing less stained cells. In like manner to Figure 3.5A b, the
green stained mass in the middle of Figure 3.5B f was caused by the presence of pancreatin
material. These results confirmed that the intestinal stage was crucial for MYC digestion, and
significant amounts of protein were released during the intestinal phase, even though some
proteins or digestive enzymes still appeared to be retained within the matrix structure (Figure
40
40
Chapter 3. Protein Release from Mycoprotein Matrix During In Vitro Gastrointestinal Digestion
102 | P a g e
3.5B d). This could suggest a gradual release of nutrients during digestion, linked to healthier
digestion and increasing satiety (Wilde, 2009).
Moreover, slowly digested proteins have been shown to induce an improved
postprandial utilisation compared to quickly digested protein (Dangin et al., 2001). However,
these results are based on an in vitro model. The protein release could be higher in vivo due
to the continuous enzyme secretions and nutrient removal via absorption at the intestinal brush
border (Minekus et al., 2014), explaining the high protein absorption from MYC (Dunlop et
al., 2017).
3.3.5 Effect of Protein Extraction Methods, Cell-Wall-Degrading-Enzymes,
and In Vitro Digestion on Protein Hydrolysis
The analysis of protein hydrolysis (Figure 3.6) was carried out using the bioaccessible
protein in the supernatant obtained after protein extraction methods (Figure 3.1A), incubation
with cell-wall-degrading enzymes (Figure 3.1B), and INFOGEST in vitro digestion (Figure
3.3A).
Figure 3.6A shows the molecular weight profiles using SDS-PAGE of protein released
from MYC25 and MYC10 following different protein extraction methods. The MYC samples
following incubation in urea buffer (INC), incubation plus homogenisation (HOMO),
incubation plus glass bead grinding (GB), and incubation plus ultra-sonication (SON)
presented several protein bands ranging from approximately 116.3 kDa to 5 kDa. A higher
protein concentration was observed as a darker band in the sample incubated with urea and
ultra-sonicated (SON). This result supported the observations of the protein quantification
(Figure 3.1A), in which the treatment of urea combined with ultra-sonication led to the highest
protein release compared to other extraction methods. As supported by the diluted
concentrations (1:
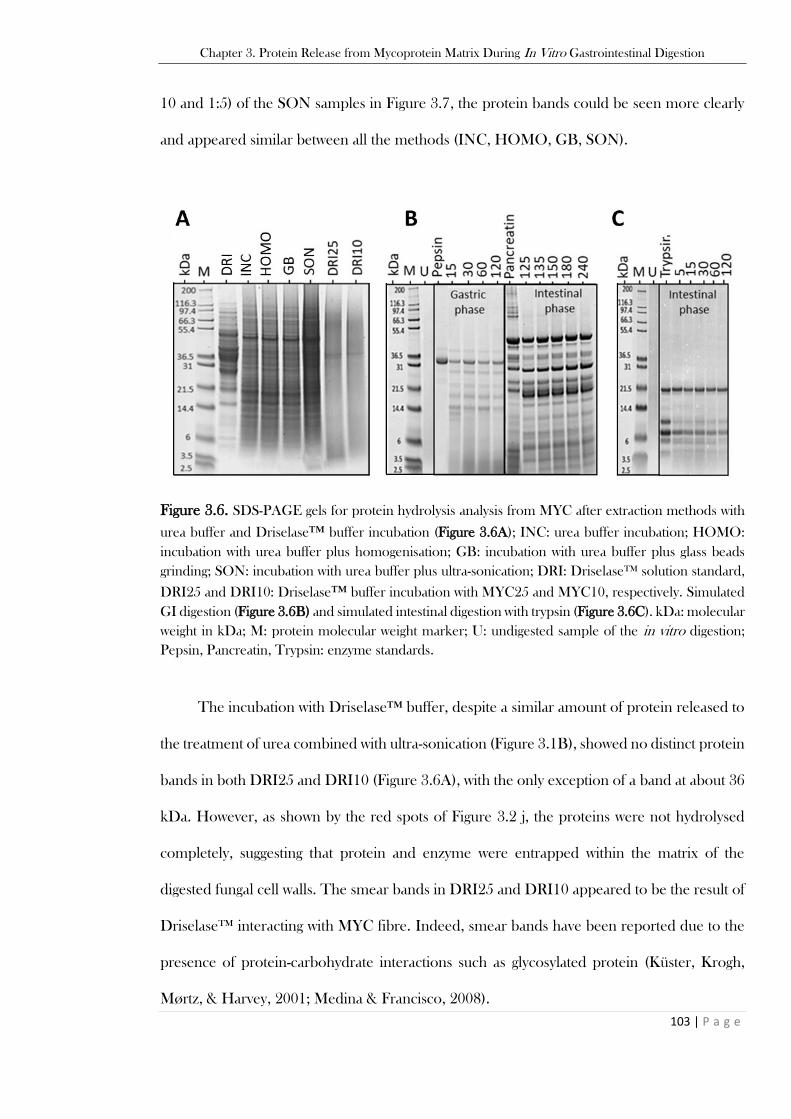
Chapter 3. Protein Release from Mycoprotein Matrix During In Vitro Gastrointestinal Digestion
103 | P a g e
10 and 1:5) of the SON samples in Figure 3.7, the protein bands could be seen more clearly
and appeared similar between all the methods (INC, HOMO, GB, SON).
Figure 3.6. SDS-PAGE gels for protein hydrolysis analysis from MYC after extraction methods with
urea buffer and Driselase™ buffer incubation (Figure 3.6A); INC: urea buffer incubation; HOMO:
incubation with urea buffer plus homogenisation; GB: incubation with urea buffer plus glass beads
grinding; SON: incubation with urea buffer plus ultra-sonication; DRI: Driselase™ solution standard,
DRI25 and DRI10: Driselase™ buffer incubation with MYC25 and MYC10, respectively. Simulated
GI digestion (Figure 3.6B) and simulated intestinal digestion with trypsin (Figure 3.6C). kDa: molecular
weight in kDa; M: protein molecular weight marker; U: undigested sample of the in vitro digestion;
Pepsin, Pancreatin, Trypsin: enzyme standards.
The incubation with Driselase™ buffer, despite a similar amount of protein released to
the treatment of urea combined with ultra-sonication (Figure 3.1B), showed no distinct protein
bands in both DRI25 and DRI10 (Figure 3.6A), with the only exception of a band at about 36
kDa. However, as shown by the red spots of Figure 3.2 j, the proteins were not hydrolysed
completely, suggesting that protein and enzyme were entrapped within the matrix of the
digested fungal cell walls. The smear bands in DRI25 and DRI10 appeared to be the result of
Driselase™ interacting with MYC fibre. Indeed, smear bands have been reported due to the
presence of protein-carbohydrate interactions such as glycosylated protein (Küster, Krogh,
Mørtz, & Harvey, 2001; Medina & Francisco, 2008).

Chapter 3. Protein Release from Mycoprotein Matrix During In Vitro Gastrointestinal Digestion
104 | P a g e
Figure 3.6 B shows the gel of the INFOGEST static in vitro digestion. As expected by
the absence of hydrolytic enzymes, no protein bands were observed in the undigested sample
(U). The gastric phase (from 15 to 120 min) appeared to have some bands below 40 kDa due
to protein released from MYC (MYC25 and MYC10). It was not possible to precisely
determine the protein released from MYC in the intestinal phases (from 125 to 240 min of
GI digestion) due to the numerous bands belonging to pancreatin itself, as shown by its control
(pancreatin alone). Incubation of MYC with urea led to the release of many intact protein
bands ranging from 5 to > 100 kDa, yet Figure 3.6B and 3.6C shows that no protein bands
were released in the undigested sample (U), which suggests that the protein was trapped inside
the cells in the absence of urea. The gel of the INFOGEST digestion with trypsin alone (Figure
3.6C), which led to the release of over 30% protein (Figure 3.3B), showed no discernible
protein bands similar to those found in the presence of urea (Figure 3.6A). This suggests that
proteins are entrapped inside the cells at the start of digestion, and trypsin can diffuse into the
cells to hydrolyse intracellular protein, resulting in the release of smaller peptides. The small
soluble peptides can be measured by BCA assay, despite not being visible in the SDS-PAGE
gel.
Figure 3.7. Protein release from MYC after incubation with urea buffer followed by ultra-sonication
(SON); the two bands on the left were diluted 1:10 with ultra-pure water, whereas the two bands on
the right 1:5. In the figure, kDa is the molecular weight in kDa; M is the protein molecular weight
marker.
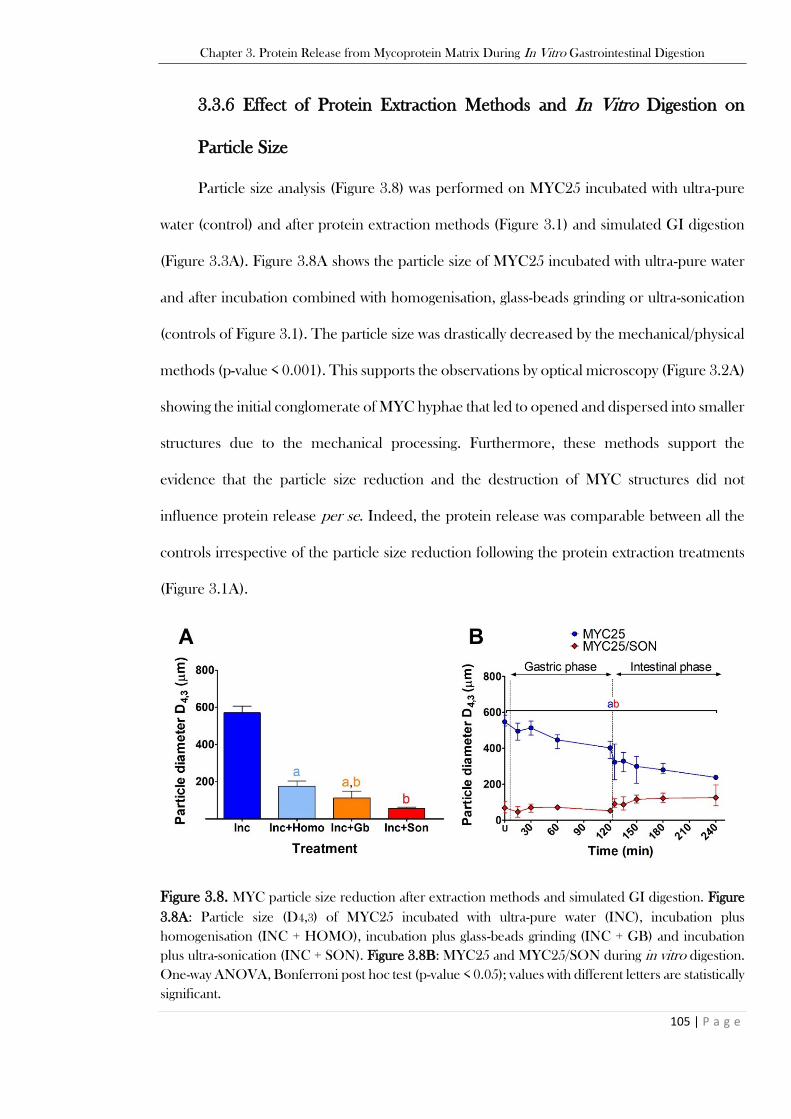
Chapter 3. Protein Release from Mycoprotein Matrix During In Vitro Gastrointestinal Digestion
105 | P a g e
3.3.6 Effect of Protein Extraction Methods and In Vitro Digestion on
Particle Size
Particle size analysis (Figure 3.8) was performed on MYC25 incubated with ultra-pure
water (control) and after protein extraction methods (Figure 3.1) and simulated GI digestion
(Figure 3.3A). Figure 3.8A shows the particle size of MYC25 incubated with ultra-pure water
and after incubation combined with homogenisation, glass-beads grinding or ultra-sonication
(controls of Figure 3.1). The particle size was drastically decreased by the mechanical/physical
methods (p-value < 0.001). This supports the observations by optical microscopy (Figure 3.2A)
showing the initial conglomerate of MYC hyphae that led to opened and dispersed into smaller
structures due to the mechanical processing. Furthermore, these methods support the
evidence that the particle size reduction and the destruction of MYC structures did not
influence protein release per se. Indeed, the protein release was comparable between all the
controls irrespective of the particle size reduction following the protein extraction treatments
(Figure 3.1A).
Figure 3.8. MYC particle size reduction after extraction methods and simulated GI digestion. Figure
3.8A: Particle size (D4,3) of MYC25 incubated with ultra-pure water (INC), incubation plus
homogenisation (INC + HOMO), incubation plus glass-beads grinding (INC + GB) and incubation
plus ultra-sonication (INC + SON). Figure 3.8B: MYC25 and MYC25/SON during in vitro digestion.
One-way ANOVA, Bonferroni post hoc test (p-value < 0.05); values with different letters are statistically
significant.
Chapter 3. Protein Release from Mycoprotein Matrix During In Vitro Gastrointestinal Digestion
106 | P a g e
Figure 3.8B illustrates the particle size of MYC25 and MYC25/SON during in vitro
digestion. A gradual decrease in the particle size of MYC25 was observed throughout the
whole digestion. The difference in particle size between MYC25 and MYC25/SON was
statistically significant in the undigested sample (U) and for all the time points during the gastric
phase (p-value < 0.0001), and during the small intestinal step (p-value < 0.0001 at 125, 135
min; p-value < 0.001 at 150, 180 min; p-value < 0.05 at 240 min). However, no statistically
significant difference was detected in the changeover from gastric to intestinal phase (120 to
125 min) in MYC25, contrary to what was measured by BCA assay with the sudden increase
of protein released following this transition (Figure 3.3A). In a similar way to Figure 3.8B, the
protein release at the endpoints of simulated digestion (Figure 3.3A) was independent of the
particle size reduction caused by ultra-sonication and confirms that the ratio enzyme/MYC
was more important for the digestion of protein in the intestinal phase than the particle size of
the MYC hyphae.
3.4 Conclusions
The results presented in this chapter provides insight into the mechanisms underlying the
protein bioaccessibility from MYC after different processing treatments. It was demonstrated
that physical or mechanical stress did not promote the most efficient protein release from
MYC, but chemical or enzymatic action was required. The hyphal structure was more
susceptible to small intestinal proteases than to the harsher physical extraction methods.
Indeed, the action of cell-wall-degrading enzymes and small intestinal proteases was dependent
on the MYC concentration. Therefore, the ratio of MYC to enzymes is a critical variable that
can influence protein bioaccessibility in vitro.
Furthermore, microscopy showed that the contents of MYC cells were partially digested
or released during the small intestinal phase of the in vitro digestion, despite the cell walls were
Chapter 3. Protein Release from Mycoprotein Matrix During In Vitro Gastrointestinal Digestion
107 | P a g e
visibly intact. These results suggested that the small intestinal proteases can permeate through
the fungal cell wall thanks to its porosity/permeability without damaging its fibres. The
enzymatic diffusion facilitated the intracellular protein hydrolysis that appeared to be highly
efficient in the simulated small intestinal step. These findings contribute to our understanding
of protein bioaccessibility from fungal cells during digestion and how this complex hyphal
structure behaves under different in vitro conditions. A further understanding of the
interaction between digestive enzymes and the MYC structure could help to explain the
biochemical mechanisms underlying the health effects observed in clinical trials. Additional
studies on fungal cell wall porosity and its interaction with enzymes are discussed in the
following chapters.

Chapter 4. Mycoprotein Matrix Reduces In Vitro Carbohydrate Digestion by Sequestering Alpha-Amylase
108 | P a g e
Chapter 4
Mycoprotein Matrix Reduces In Vitro
Carbohydrate Digestion by Sequestering Alpha-
Amylase†
† This chapter is based on the published peer-reviewed manuscript Colosimo, Warren,
Edwards, Finnigan, and Wilde (2020), Food Hydrocolloids, 106018.
Chapter 4. Mycoprotein Matrix Reduces In Vitro Carbohydrate Digestion by Sequestering Alpha-Amylase
109 | P a g e
4.1 Introduction
Findings over many years have suggested that mycoprotein (MYC) consumption
influences carbohydrate digestion or metabolism by improving glucose/insulin responses
(Bottin et al., 2016; Dunlop et al., 2017; Turnbull & Ward, 1995), which could be due to the
dietary fibre (DF) content of MYC. Overall, DF has been linked to various health effects
(Dahl et al., 2017; Kendall, Esfahani, & Jenkins, 2010), and foods containing DF are often
associated with reduced postprandial glucose and insulin response (Keogh, Lau, Noakes,
Bowen, & Clifton, 2007; Stewart & Zimmer, 2018), which can be beneficial for controlling
type-2 diabetes (T2D). However, the mechanism of action of fibre in controlling glycaemia
is not fully understood, and there may be several potential mechanisms: (1) by increasing the
small intestinal viscosity that delays the glucose absorption and reduces the gastric emptying;
(2) by binding or entrapping glucose and restricting its absorption; and (3) specifically by
inhibiting the -amylase activity that consequently reduces the rate of starch hydrolysis (Goff,
Repin, Fabek, El Khoury, & Gidley, 2018; Ou, Kwok, Li, & Fu, 2001).
Another possible mechanism is based on the food matrix effects offered by the
presence of cell walls. Indeed, DF is commonly organised to form complex structures such
as cell walls in both plants and fungi. In particular, the plant cell walls (PCW) of durum wheat
and chickpea have been reported to influence starch gelatinisation and digestion in vitro
(Edwards et al., 2015). Similarly, the PCW of almonds have been described as a barrier that
can control the release of nutrients (Ellis et al., 2004; Grundy, Wilde, Butterworth, Gray, &
Ellis, 2015). Therefore, the control of nutrient bioaccessibility and consequently the
absorption promoted by cell walls can influence the physiological responses of glucose and
insulin. For instance, a slower rise in plasma essential amino acids and a lower postprandial
insulin response was observed after MYC consumption compared to a mass-matched milk
protein bolus in the Dunlop et al. (2017) study. The diffusion of enzymes into the cell could
Chapter 4. Mycoprotein Matrix Reduces In Vitro Carbohydrate Digestion by Sequestering Alpha-Amylase
110 | P a g e
be possible due to the fungal cell walls (FCW) porosity/permeability that has been well
described in the literature (Scherrer, Louden, & Gerhardt, 1974; Shepherd, 1987; Walker et
al., 2018). Nonetheless, the diffusion of enzymes through the MYC cell wall lacks clear
evidence, and findings of direct inhibition of −amylase by MYC have not been reported.
Therefore, following these observations, this chapter aimed to test the hypothesis that
MYC hyphal structure interacted with -amylase to reduce the rate of starch digestion in vitro.
Then, the mechanisms underlying such potential reduction in starch hydrolysis, including the
diffusion of -amylase through the FCW, were investigated. Furthermore, this chapter aims
to investigate the diffusion of digestive enzymes through the FCW by confocal microscopy to
confirm and support the findings of Chapter 3, which suggested that intestinal enzymes diffuse
through the MYC cell wall to hydrolyse the intracellular protein.
4.2 Materials & Methods
4.2.1 Materials
4.2.1.1 Chemicals and Reagents
The specific reagents used in this chapter are specified below, while the common
materials to other chapters are listed in Chapter 2, Section 2.1.1.
All reagents were of analytical grade and purchased from Merck, UK: Soluble potato
starch (Catalogue No. S2004), glycogen from bovine liver (Catalogue No. G0885), -cellulose
(Catalogue No. C8002), porcine pancreatic -amylase (≥ 5 U/mg solid, 51-54 kDa, Catalogue
No. A3176) used for performing the standardised small intestinal in vitro digestion, a higher
purity porcine pancreas -amylase (≥ 1,000 U/mg protein, 51-54 kDa, Catalogue No. A6255)
was used for in vitro digestion kinetics and fluorescent labelling, Lugol’s solution (Catalogue
No. 62650), disposable PD 10 desalting columns (Catalogue No. GE17-0851).
Chapter 4. Mycoprotein Matrix Reduces In Vitro Carbohydrate Digestion by Sequestering Alpha-Amylase
111 | P a g e
4.2.1.2 Mycoprotein Samples
Marlow Foods Ltd, UK, provided freeze-dried MYC powder and extracted MYC
proteins (EMP). MYC powder was prepared in proportion 1:4 (w/v) with ultra-pure water and
subjected to a standardised small intestinal in vitro digestion (INFOGEST) to remove the
intracellular glycogen that may have interfered with the release of reducing sugar during the
kinetic in vitro digestion with -amylase (Section 4.2.2.2). After the simulated small intestinal
digestion, the sample was washed 3 times with ultra-pure water and centrifuged at 2,800 x g for
10 min (Heraeus Megafuge 16, Germany) to remove the supernatant containing the reducing
sugars released from the intracellular glycogen. The pellet was freeze-dried for 3 days with a
LyoDry Compact freeze drier (Mechatech, UK) to obtain the glycogen-depleted MYC
powder. This sample was then stored at -20℃ until further experiments.
4.2.2 Methods
4.2.2.1 Simulated Small Intestinal Digestion
The simulated digestion of the small intestinal step was performed on MYC and
extracted glycogen (accessible) following the INFOGEST static in vitro digestion method for
food described in chapter 2, Section 2.2.1.
The digestion was carried out with 2.5 g of food (e.g., 0.625 g of MYC plus 1.875 mL
of ultra-pure water) with a total digesta volume of 20 mL for the small intestinal step. The
−amylase activity in the final mixture was 200 U/mL (the recommended activity) or 400
U/mL (double of the recommended activity in the recognised protocol that aimed to digest
glycogen completely). Samples were taken at 30, 60, 80, 120 min of intestinal digestion,
whereas the undigested (U) sample was the control sample without enzymes that underwent
all the in vitro digestion. At the end of digestion, the enzyme activity was stopped with NaOH
Chapter 4. Mycoprotein Matrix Reduces In Vitro Carbohydrate Digestion by Sequestering Alpha-Amylase
112 | P a g e
2 M to reach pH 11.0 and samples were centrifuged at 2,800 xg for 10 min (Heraeus Megafuge
16, Germany). The supernatant was used for reducing sugar analysis with the p-
hydroxybenzoic acid hydrazide (PAHBAH) assay, while the pellet of the MYC digested with
400 U/mL of -amylase was treated as previously described (Section 4.2.1.2) to obtain the
glycogen-depleted MYC powder.
4.2.2.2 Kinetic In Vitro Digestion of Starch
A solution of soluble starch from potato (5 mg/mL) was prepared in phosphate-
buffered saline (PBS) and cooked for 20 min at 90℃. The starch solution was cooled down
for 10 min at room temperature and then incubated at 37℃ for 5 min. Aliquots of 10 mL of
the cooked starch solution were pipetted into 15 mL conical test tubes containing 0 (control),
2.5, 5, 10, 15, 20 mg/mL of glycogen-depleted MYC powder or 2.5, 20 mg/mL of cellulose
that served as a control, or 0, 5, 10, 20 mg/mL of EMP or bovine serum albumin (BSA). The
solution was equilibrated at 37℃ for 5 min under continuous stirring in a rotator at 60 rpm.
At time 0, 100 L of the solution was removed as a blank while 100 L of pancreatic -amylase
(the final enzyme activity in the test tube was 200 mU/mL) was added to start the in vitro
digestion. An aliquot of 100 L was collected at 3, 6, 9, and 12 min. The enzymatic reaction
was stopped in a micro-centrifuge tube containing 100 L of Na2CO3 0.3 M. The samples
were centrifuged at 13,000 xg for 5 min (Eppendorf® centrifuge 5424-R, Germany), and the
supernatant was used to determine the reducing sugars released by PAHBAH assay.
4.2.2.3 The Binding of Alpha-Amylase by Mycoprotein
MYC concentrations in the range of 0 - 20 mg/mL were prepared in PBS and
incubated at 37℃ for 30 min before adding 100 L of -amylase (200 mU/mL final). The
Chapter 4. Mycoprotein Matrix Reduces In Vitro Carbohydrate Digestion by Sequestering Alpha-Amylase
113 | P a g e
MYC and -amylase solutions were stirred on a rotator (60 rpm) for 30 min at 37℃.
Afterwards, the samples were centrifuged at 13,000 xg (centrifuge 5424-R, Eppendorf®,
Germany) for 5 min to separate the insoluble MYC, and the supernatant was analysed to
determine the residual enzymatic activity of the unbound enzyme using an EnzChek™ ultra-
amylase assay kit.
Briefly, an aliquot of 50 μL of the supernatant was pipetted into a 96-well microplate,
along with the fluorescent standard (BODIPY FL propionic acid in dimethyl sulfoxide) in the
range of 0 - 200 mU/mL, and a PBS blank. Then, 50 μL of DQ™ starch substrate solution
labelled with the fluorescent BODIPY® FL dye was added to the wells containing the enzyme
and MYC, or standards. The plate was placed in a microplate reader (FLUOstar Omega, UK),
and the fluorescence intensity was set at an excitation filter of 485 nm and an emission filter at
520 nm. The reading was performed at a series of time points from 0 to 30 min. The rate of
increase in fluorescence of the unknown samples was corrected using the blanks (PBS) and
compared to the standards to obtain the residual α-amylase activity value. This was then plotted
as bound -amylase by subtracting the value measured with no MYC (0 mg/mL) from the
values obtained in the presence of MYC (2.5 - 20 mg/mL).
Determination of Starch/Glycogen Hydrolysis
The PAHBAH assay was performed as described in Chapter 2, Section 2.2.4.1 to
estimate the total starch/glycogen hydrolysis (wt%), based on the release of reducing sugars
during the in vitro digestion and the kinetic in vitro digestion of starch.
Absorbance was read at 405 nm with a UV/Vis plate reader spectrophotometer
(Molecular Devices LLC VersaMax, United States).
Chapter 4. Mycoprotein Matrix Reduces In Vitro Carbohydrate Digestion by Sequestering Alpha-Amylase
114 | P a g e
Kinetic of Enzymatic Inhibition
The initial reaction rate (mM/min) for hydrolysis of starch by -amylase was
obtained using the PAHBAH assay (Section 2.2.4.1) during in vitro digestion of several starch
concentrations (1, 2.5, 5, 10, 20, 30 mg/mL) in the presence of 5, 10, 20 mg/mL of glycogen-
depleted MYC powder. The Michaelis-Menten data (based on Equation 4.1) was used to
produce the Lineweaver-Burk plot (Equation 4.2) (Lineweaver & Burk, 1934).
Equation 4 1. Michaelis-Menten equation.
𝑣 =𝑉𝑚𝑎𝑥 [𝑆]
𝐾𝑚 + [𝑆]
Equation 4.2. Lineweaver-Burk plot equation.
1
𝑣=
𝐾𝑚
𝑉𝑚𝑎𝑥∙
1
[𝑆]+
1
𝑉𝑚𝑎𝑥
The equation for describing mixed reversible inhibition of an enzyme (Equation 4.3)
may be written as follows:
Equation 4.3. Mixed reversible inhibition of an enzyme equation.
𝑣 =𝑉𝑚𝑎𝑥 [𝑆] 𝐾𝑚
𝐾𝑚 ∙ (1 +[𝐼]𝐾𝑖𝑐
)+ [𝑆] ∙ (1 +
1
𝐾𝑖𝑢)
Where the reaction rate (mM/min) is determined over a range of the substrate (S)
concentrations (mg/mL). The substrate [S] refers to starch. Vmax is the maximum reaction rate,
and Km is the Michaelis constant equal to the starch concentration, when is half of Vmax. The
Chapter 4. Mycoprotein Matrix Reduces In Vitro Carbohydrate Digestion by Sequestering Alpha-Amylase
115 | P a g e
inhibitor [I] refers to the MYC concentration (mg/mL), whereas Kic and Kiu are the
competitive and uncompetitive inhibitor constants (mg/mL), respectively. Taking the
reciprocals of both sides of Equation 4.3 allows a straight-line plot to be constructed of 1/v
against [I]. Plotting this for multiple values of [S] generates a Dixon plot. The point of
intersection between the lines of equal [S] corresponds to Kic. The Dixon plot does not permit
the calculation of Kiu, so an alternative is to plot [S]/v against [I] at a range of [S] (Cornish-
Bowden, 1974, 2012), resulting in a series of straight lines which intersect at Kiu.
4.2.2.4 Microscopy Analysis
The microscopy analysis was carried out with confocal laser scanning microscopy
(CLSM) to observe the interaction of fluorescein isothiocyanate (FITC) dye or FITC-labelled
-amylase with the MYC matrix. Moreover, brightfield microscopy was used to observe the
interaction of starch with MYC.
Enzyme Labelling
The enzyme -amylase was labelled with the fluorescent probe FITC to obtain
the -amylase-FITC conjugate used for CLSM.
Briefly, 1.44 mg/mL of FITC was mixed with 1 mL of carbonate buffer (NaHCO3
0.1 M and Na2CO3 0.1 M, pH 9.0), mixed with -amylase (2 mg/mL in carbonate buffer) and
incubated in the dark at room temperature for 120 min. Afterwards, the labelled enzyme was
poured into a PD 10 desalting chromatography column, previously equilibrated with 50 mL
of PBS at pH 7.4, to separate the conjugated enzyme from the other fractions (free FITC).
The absorbance (250 - 520 nm) of each fraction was measured using 1 cm cuvettes and
scanned with a UV/Vis spectrophotometer (Libra S50, Biochrom Ltd, UK) in order to
Chapter 4. Mycoprotein Matrix Reduces In Vitro Carbohydrate Digestion by Sequestering Alpha-Amylase
116 | P a g e
determine the fraction with the maximum enzyme conjugation using the following equations
to calculate the protein concentration (Equation 4.4) and moles dye per mole protein
(Equation 4.5):
Equation 4.4. The equation to calculate protein concentration after enzymatic labelling with FITC.
Protein concentration =𝐴280 − (
𝐴𝑚𝑎𝑥𝐶𝐹 )
𝜀∙ Dilution factor
Equation 4.5. The equation to calculate moles dye per mole protein after enzymatic labelling with
FITC.
Moles dye per mole protein =𝐴𝑚𝑎𝑥
𝜀′ ∙ 𝑃𝑟𝑜𝑡𝑒𝑖𝑛 𝑐𝑜𝑛𝑐𝑒𝑛𝑡𝑟𝑎𝑡𝑖𝑜𝑛∙ Dilution factor
Where A280 is the absorbance at 280 nm, Amax is the maximum absorbance,
CF is the correction factor obtained by dividing A280 by the Amax of the dye, ε is the protein
molar extinction coefficient, in this case, is 207,680 L mol−1 cm−1
(Guillén et al., 2007), and ε’
is the FITC extinction coefficient, in this case, is 68,000 (Pankov & Momchilova, 2009). These
measures are based on the protocol provided by Thermo Scientific for dye:protein molar
ratios calculations (Thermo Fisher Scientific, Accessed: 23/08/2021).
Confocal Laser Scanning Microscopy & Optical Microscopy
CLSM was performed with a Zeiss LSM880 with Airyscan, and micrographs were
acquired with an Axiocam-S03 mono camera (Carl Zeiss AG, Germany). Briefly, 5 L of
glycogen-depleted MYC powder stained with calcofluor white (CFW) (1:1) was transferred to
a slide with an ultra-thin adhesive imaging spacer. Before adding the cover-slip and seal, 1 L
Chapter 4. Mycoprotein Matrix Reduces In Vitro Carbohydrate Digestion by Sequestering Alpha-Amylase
117 | P a g e
of labelled -amylase was added. For CFW, excitation and emission filters were at 405 nm
and 415 - 470, respectively. For FITC and labelled -amylase, the excitation and emission
filters were 490 nm and 525 nm, respectively. A Z-Stack experiment was performed with Plan-
Apochromat 20x/0.8 M27, depth 10 m, 20 acquisitions, to analyse glycogen-depleted MYC
powder in different sections and verify the presence of the labelled enzyme inside the
filamentous cells.
Brightfield microscopy was performed using an Olympus BX60 optical
microscope (Olympus, Japan), micrographs were acquired with a Jenoptik ProgRes C10plus
camera (Jenoptik AG, Germany). An aliquot of 200 L of glycogen-depleted MYC powder
was stained with Lugol’s solution (1:1) after 12 min of in vitro digestion (Section 4.2.2.1) and
then transferred to a slide cover-slipped and sealed.
4.2.2.5 Data Analysis
Data were analysed by GraphPad Prism version 5 for Windows (GraphPad Software,
USA), statistical significance was set at p-value < 0.05. Values were expressed as average ±
confidence interval at 95% (CI95%) of three independent measures (n = 3). The post-hoc
analysis is specified in the description of the corresponding figure where applicable.

Chapter 4. Mycoprotein Matrix Reduces In Vitro Carbohydrate Digestion by Sequestering Alpha-Amylase
118 | P a g e
4.3 Results
4.3.1 Glycogen Depletion from Mycoprotein
Figure 4.1 shows the release of reducing sugars as a function of time from the
intracellular glycogen of MYC cells or extracted glycogen (glycogen without cell walls).
Glycogen hydrolysis was determined during 120 min of simulated intestinal digestion with 200
U/mL (Figure 4.1A) or 400 U/mL of -amylase (Figure 4.1B). These experiments were
carried out to show the different kinetics of digestion of the same glycogen concentration, but
with (MYC cells) or without (extracted glycogen) the presence of cell walls. Moreover, the
digestion with double recommended activity (i.e., 400 U/mL) was performed to completely
digest the glycogen from MYC and use the sample for the kinetic digestion experiments
(Section 4.2.2.2).
MYC (Figure 4.1A) and extracted glycogen (Figure 4.1B) digestion showed similar
kinetics of glycogen hydrolysis with an increase of reducing sugars observed in the first 15 min,
compared to the undigested sample (U in Figure 4.1). The glycogen hydrolysis kept increasing
in the next time points (30, 60, 120 min) to eventually reach a value of 105.20 ± 5.97 wt% in
the simulated digestion with enzyme activity 400 U/mL and 61.09 ± 2.59 wt% in the 200 U/mL
digestion. Therefore, the glycogen was considered digested in the digestion with -amylase
activity of 400 U/mL. Similarly, the simulated digestion of extracted glycogen had higher
hydrolysis with 400 U/mL of -amylase that reached a value of 99.39 ± 3.59 wt% compared
to 72.03 ± 1.20 wt% digestion at an enzyme activity of 200 U/mL.
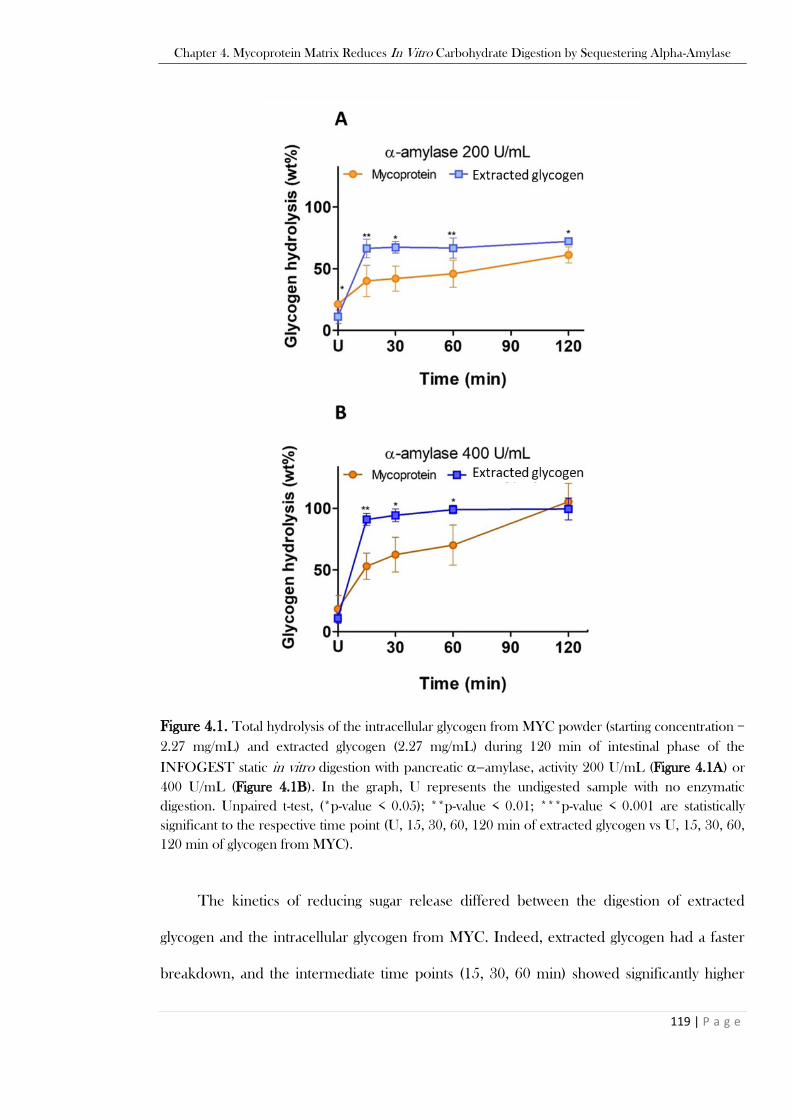
Chapter 4. Mycoprotein Matrix Reduces In Vitro Carbohydrate Digestion by Sequestering Alpha-Amylase
119 | P a g e
Figure 4.1. Total hydrolysis of the intracellular glycogen from MYC powder (starting concentration =
2.27 mg/mL) and extracted glycogen (2.27 mg/mL) during 120 min of intestinal phase of the
INFOGEST static in vitro digestion with pancreatic −amylase, activity 200 U/mL (Figure 4.1A) or
400 U/mL (Figure 4.1B). In the graph, U represents the undigested sample with no enzymatic
digestion. Unpaired t-test, (*p-value < 0.05); **p-value < 0.01; ***p-value < 0.001 are statistically
significant to the respective time point (U, 15, 30, 60, 120 min of extracted glycogen vs U, 15, 30, 60,
120 min of glycogen from MYC).
The kinetics of reducing sugar release differed between the digestion of extracted
glycogen and the intracellular glycogen from MYC. Indeed, extracted glycogen had a faster
breakdown, and the intermediate time points (15, 30, 60 min) showed significantly higher
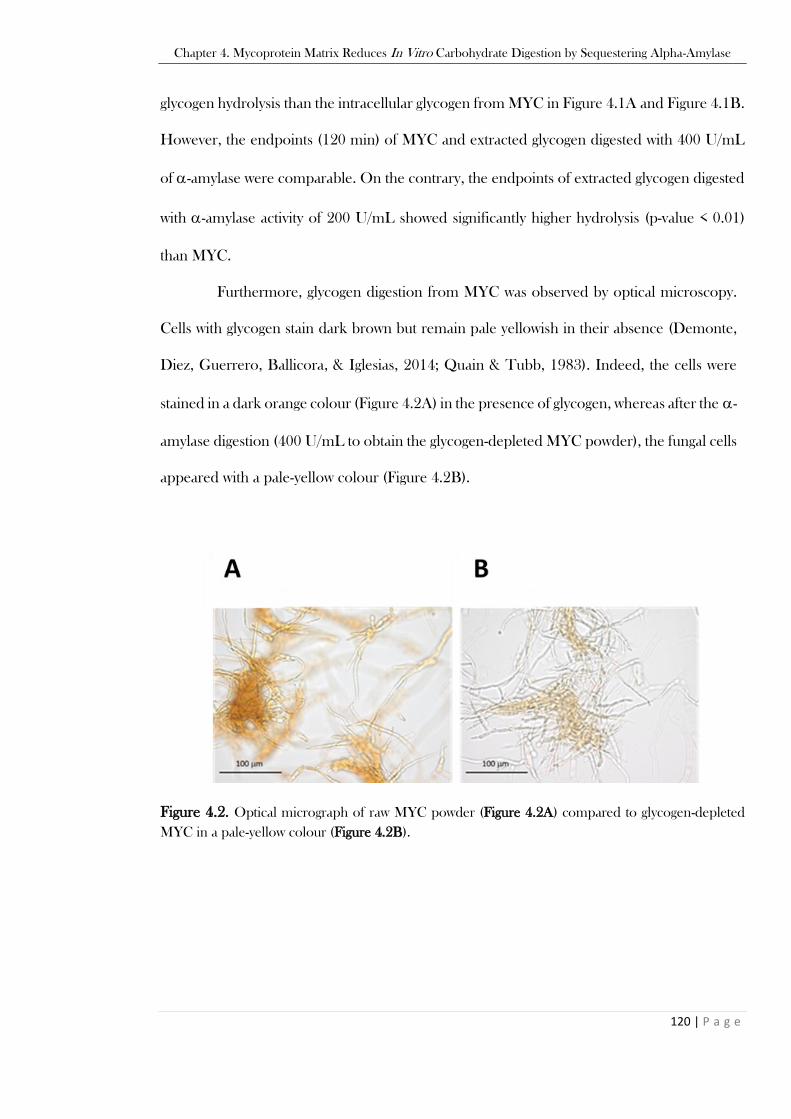
Chapter 4. Mycoprotein Matrix Reduces In Vitro Carbohydrate Digestion by Sequestering Alpha-Amylase
120 | P a g e
glycogen hydrolysis than the intracellular glycogen from MYC in Figure 4.1A and Figure 4.1B.
However, the endpoints (120 min) of MYC and extracted glycogen digested with 400 U/mL
of -amylase were comparable. On the contrary, the endpoints of extracted glycogen digested
with -amylase activity of 200 U/mL showed significantly higher hydrolysis (p-value < 0.01)
than MYC.
Furthermore, glycogen digestion from MYC was observed by optical microscopy.
Cells with glycogen stain dark brown but remain pale yellowish in their absence (Demonte,
Diez, Guerrero, Ballicora, & Iglesias, 2014; Quain & Tubb, 1983). Indeed, the cells were
stained in a dark orange colour (Figure 4.2A) in the presence of glycogen, whereas after the -
amylase digestion (400 U/mL to obtain the glycogen-depleted MYC powder), the fungal cells
appeared with a pale-yellow colour (Figure 4.2B).
Figure 4.2. Optical micrograph of raw MYC powder (Figure 4.2A) compared to glycogen-depleted
MYC in a pale-yellow colour (Figure 4.2B).
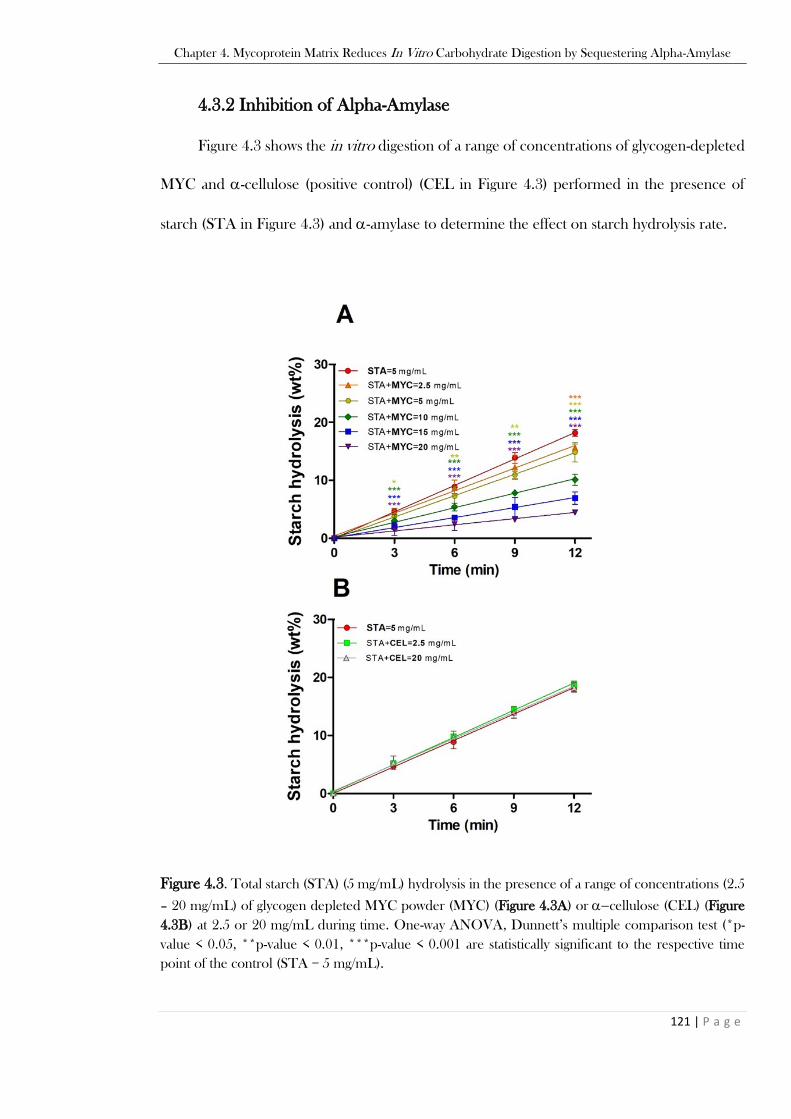
Chapter 4. Mycoprotein Matrix Reduces In Vitro Carbohydrate Digestion by Sequestering Alpha-Amylase
121 | P a g e
4.3.2 Inhibition of Alpha-Amylase
Figure 4.3 shows the in vitro digestion of a range of concentrations of glycogen-depleted
MYC and -cellulose (positive control) (CEL in Figure 4.3) performed in the presence of
starch (STA in Figure 4.3) and -amylase to determine the effect on starch hydrolysis rate.
Figure 4.3. Total starch (STA) (5 mg/mL) hydrolysis in the presence of a range of concentrations (2.5
– 20 mg/mL) of glycogen depleted MYC powder (MYC) (Figure 4.3A) or −cellulose (CEL) (Figure
4.3B) at 2.5 or 20 mg/mL during time. One-way ANOVA, Dunnett’s multiple comparison test (*p-
value < 0.05, **p-value < 0.01, ***p-value < 0.001 are statistically significant to the respective time
point of the control (STA = 5 mg/mL).
Chapter 4. Mycoprotein Matrix Reduces In Vitro Carbohydrate Digestion by Sequestering Alpha-Amylase
122 | P a g e
Figure 4.3A shows that the presence of glycogen-depleted MYC reduces the rate and
extent of starch hydrolysis. The hydrolysis of starch was reduced (p-value < 0.001) from a value
of 18.19 ± 0.41 wt% in the control (STA = 5 mg/mL) to 15.64 ± 0.43 wt% at the lowest MYC
concentration tested (2.5 mg/mL) in 12 min of in vitro digestion. Likewise, the highest
concentration of MYC (20 mg/mL) resulted in a starch hydrolysis endpoint (12 min) of 4.47
± 0.37 wt% (p-value < 0.001 compared to the starch control). No statistically significant
differences were detected in the hydrolysis of starch in the presence of -cellulose (2.5 or 20
mg/mL) (Figure 4.3B).
More in vitro digestion experiments were carried out to understand if the whole structure
of MYC mainly promoted the enzymatic inhibition (e.g., cell wall presence) or other
components such as EMP may have played a role (Figure 4.4A). In vitro digestion of MYC
was performed in the presence of starch, -amylase and BSA to better understand the
specificity of inhibition (Figure 4.4B), and the residual activity of the enzyme after incubation
with different concentrations of MYC was investigated and plotted as the percentage of the
total -amylase bound to MYC (Figure 4.4C).
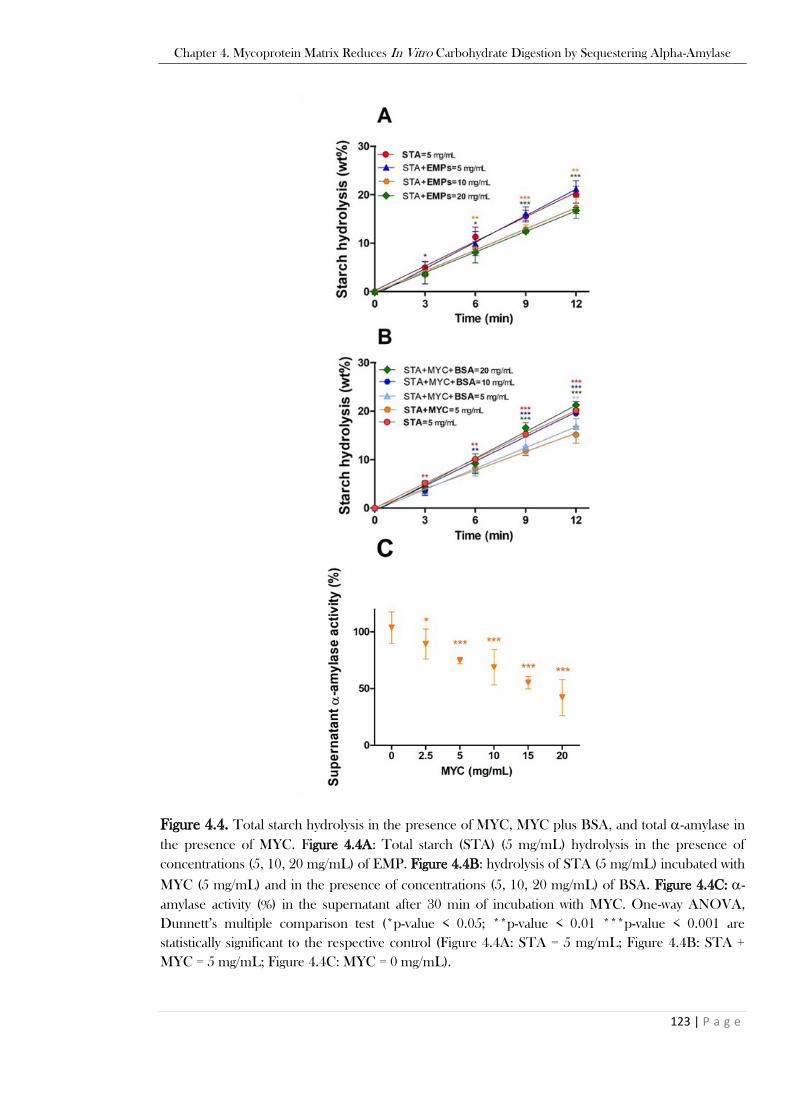
Chapter 4. Mycoprotein Matrix Reduces In Vitro Carbohydrate Digestion by Sequestering Alpha-Amylase
123 | P a g e
Figure 4.4. Total starch hydrolysis in the presence of MYC, MYC plus BSA, and total -amylase in
the presence of MYC. Figure 4.4A: Total starch (STA) (5 mg/mL) hydrolysis in the presence of
concentrations (5, 10, 20 mg/mL) of EMP. Figure 4.4B: hydrolysis of STA (5 mg/mL) incubated with
MYC (5 mg/mL) and in the presence of concentrations (5, 10, 20 mg/mL) of BSA. Figure 4.4C: -
amylase activity (%) in the supernatant after 30 min of incubation with MYC. One-way ANOVA,
Dunnett’s multiple comparison test (*p-value < 0.05; **p-value < 0.01 ***p-value < 0.001 are
statistically significant to the respective control (Figure 4.4A: STA = 5 mg/mL; Figure 4.4B: STA +
MYC = 5 mg/mL; Figure 4.4C: MYC = 0 mg/mL).
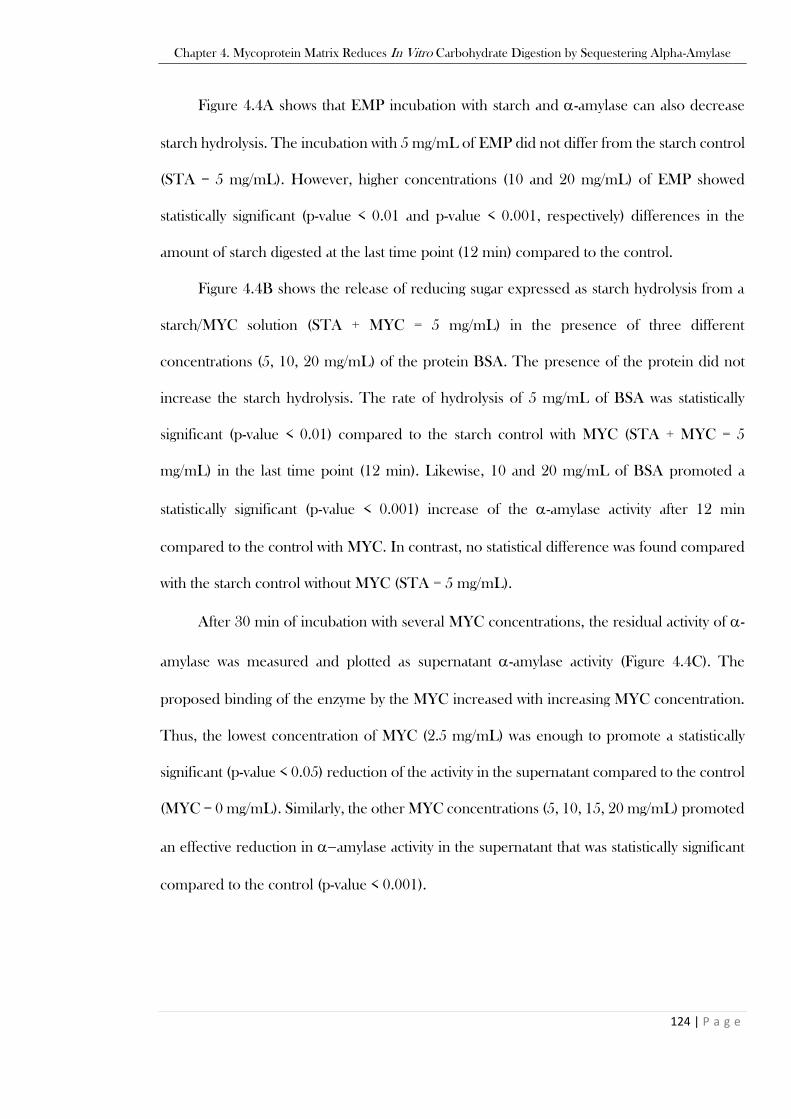
Chapter 4. Mycoprotein Matrix Reduces In Vitro Carbohydrate Digestion by Sequestering Alpha-Amylase
124 | P a g e
Figure 4.4A shows that EMP incubation with starch and -amylase can also decrease
starch hydrolysis. The incubation with 5 mg/mL of EMP did not differ from the starch control
(STA = 5 mg/mL). However, higher concentrations (10 and 20 mg/mL) of EMP showed
statistically significant (p-value < 0.01 and p-value < 0.001, respectively) differences in the
amount of starch digested at the last time point (12 min) compared to the control.
Figure 4.4B shows the release of reducing sugar expressed as starch hydrolysis from a
starch/MYC solution (STA + MYC = 5 mg/mL) in the presence of three different
concentrations (5, 10, 20 mg/mL) of the protein BSA. The presence of the protein did not
increase the starch hydrolysis. The rate of hydrolysis of 5 mg/mL of BSA was statistically
significant (p-value < 0.01) compared to the starch control with MYC (STA + MYC = 5
mg/mL) in the last time point (12 min). Likewise, 10 and 20 mg/mL of BSA promoted a
statistically significant (p-value < 0.001) increase of the -amylase activity after 12 min
compared to the control with MYC. In contrast, no statistical difference was found compared
with the starch control without MYC (STA = 5 mg/mL).
After 30 min of incubation with several MYC concentrations, the residual activity of -
amylase was measured and plotted as supernatant -amylase activity (Figure 4.4C). The
proposed binding of the enzyme by the MYC increased with increasing MYC concentration.
Thus, the lowest concentration of MYC (2.5 mg/mL) was enough to promote a statistically
significant (p-value < 0.05) reduction of the activity in the supernatant compared to the control
(MYC = 0 mg/mL). Similarly, the other MYC concentrations (5, 10, 15, 20 mg/mL) promoted
an effective reduction in −amylase activity in the supernatant that was statistically significant
compared to the control (p-value < 0.001).

Chapter 4. Mycoprotein Matrix Reduces In Vitro Carbohydrate Digestion by Sequestering Alpha-Amylase
125 | P a g e
4.3.3 Kinetic Analyses of Alpha-Amylase Inhibition
The reduction of starch hydrolysis in the presence of glycogen-depleted MYC was
further investigated in order to determine the type of inhibition employing Michaelis-Menten
(Figure 4.5A), Lineweaver-Burk (Figure 4.5B), Dixon and Cornish-Bowden plots (Figure 4.5C
and 4.5D, respectively).
Figure 4.5. Kinetic analyses. Figure 4.5A: Michaelis-Menten plot of starch hydrolysis rate () against
a range of starch (STA) concentrations (1, 2.5, 5, 10, 20, 30 mg/mL) in the presence of 0, 5, 10, 20
mg/mL of MYC. The reaction rate (mM/min) was obtained by the slope of three (n = 3) distinct in
vitro digestions of 12 min. Figure 4.5B: Lineweaver-Burk plot of the reciprocal of initial reaction
velocity (1/) against the reciprocal of substrate (1/S) concentrations in the presence of 0, 5, 10, 20
mg/mL of MYC. Figure 4.5C: Dixon plot of the reciprocal of initial reaction velocity (1/) and (Figure
4.5D) Cornish-Bowden plot of substrate/reaction rate (S/) against MYC concentrations (5, 10, 20
mg/mL); STA: 1, 2.5, 5, 10, 20, 30 mg/mL.
The Michaelis–Menten plot (Figure 4.5A) involved the kinetic digestion of 1, 2.5, 5, 10,
20 and 30 mg/mL of gelatinised starch in the presence of 0, 5, 10 and 20 mg/mL of glycogen

Chapter 4. Mycoprotein Matrix Reduces In Vitro Carbohydrate Digestion by Sequestering Alpha-Amylase
126 | P a g e
depleted MYC in order to obtain the apparent Vmax and Km. The Vmax showed a decreasing
trend as the MYC concentration was increased from 0 to 20 mg/mL, whilst Km was comparable
between 0 and 5 mg/mL, and afterwards increased at 10 and 20 mg/mL (Table 4.1). A
decrease of Vmax with an unchanged Km is typical of non-competitive inhibition, while
alteration of both Vmax and Km (an increase of Km at high concentration of inhibitor) suggests
a mixed linear inhibition (Cornish-Bowden, 2012; Seibert & Tracy, 2014).
Table 4.1. Average ± standard error of apparent Vmax and Km obtained from Michaelis-Menten plot
after kinetic digestion of 5 mg/mL of starch in the presence of 0, 5, 10, 20 mg/mL of MYC.
MYC 0 mg/mL MYC 5 mg/mL MYC 10 mg/mL MYC 20 mg/mL
Vmax 0.099 ± 0.002 0.080 ± 0.001 0.069 ± 0.002 0.031 ± 0.002
Km 1.242 ± 0.174 1.289 ± 0.105 2.564 ± 0.362 3.023 ± 0.774
Lineaweaver-Burk plot (Figure 4.5B), Dixon (Figure 4.5C), and Cornish-Bowden
(Figure 4.5D) plots were used to investigate the mechanism of inhibition. In the same way as
the Michaelis-Menten plot, the double reciprocal Lineweaver-Burk plot suggested a non-
competitive inhibition at the lowest concentration of MYC (5 mg/mL) that changed to mixed
inhibition at the highest concentration (10 and 20 mg/mL). Dixon (Figure 4.12) and Cornish-
Bowden (Figure 4.13) plots show that the intercept of the inhibition curves is mainly in the
fourth and the third quadrant, respectively. This is the typical behaviour of a reversible linear
mixed inhibition (Cornish-Bowden, 1974, 2012), assuming that the enzyme can bind to both
inhibitor and substrate (Figure 4.6).

Chapter 4. Mycoprotein Matrix Reduces In Vitro Carbohydrate Digestion by Sequestering Alpha-Amylase
127 | P a g e
Figure 4.6. Diagram of a reversible linear mixed inhibition. E: enzyme; S: substrate; I: inhibitor; P:
product. MYC is the inhibitor (I) that can interact with the free enzyme (E) to form the complex
enzyme/inhibitor (EI), as well as with the enzyme/substrate complex (ES). This interaction promotes a
decrease of Vmax (maximum velocity of the enzyme) and an increase in Ks (enzyme-substrate
dissociation constant) in the presence of an inhibitor.
4.3.4 Microscopic Visualization of Mycoprotein Interaction with Alpha-
Amylase
4.3.4.1 Labelling of Alpha-Amylase with FITC
Figure 4.7 shows the absorbances of the fractions obtained from the labelling of -
amylase after running through a PD 10 desalting column.
Figure 4.7. Fractions (F) and blank (B) absorbances (AU) were obtained from a PD 10 desalting
column used for the FITC (495 nm) labelling of -amylase (285 nm).
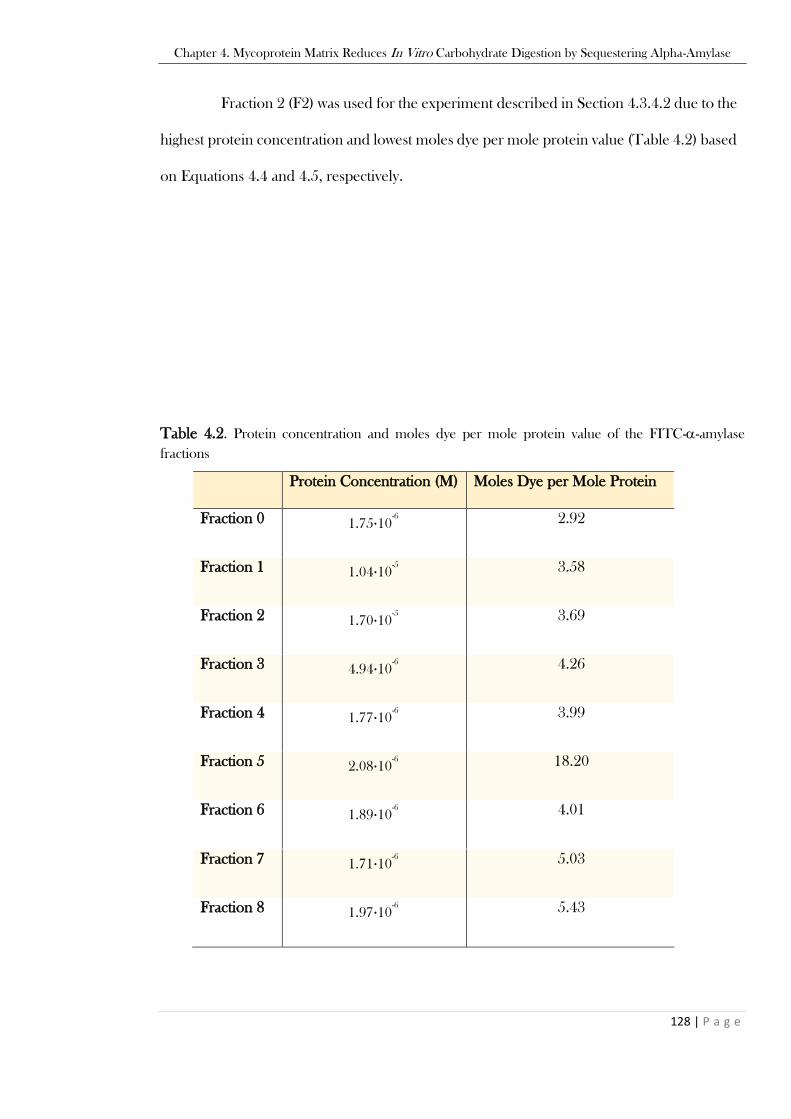
Chapter 4. Mycoprotein Matrix Reduces In Vitro Carbohydrate Digestion by Sequestering Alpha-Amylase
128 | P a g e
Fraction 2 (F2) was used for the experiment described in Section 4.3.4.2 due to the
highest protein concentration and lowest moles dye per mole protein value (Table 4.2) based
on Equations 4.4 and 4.5, respectively.
Table 4.2. Protein concentration and moles dye per mole protein value of the FITC--amylase
fractions
Protein Concentration (M) Moles Dye per Mole Protein
Fraction 0 1.75·10-6 2.92
Fraction 1 1.04·10-5 3.58
Fraction 2 1.70·10-5 3.69
Fraction 3 4.94·10-6 4.26
Fraction 4 1.77·10-6 3.99
Fraction 5 2.08·10-6 18.20
Fraction 6 1.89·10-6 4.01
Fraction 7 1.71·10-6 5.03
Fraction 8 1.97·10-6 5.43

Chapter 4. Mycoprotein Matrix Reduces In Vitro Carbohydrate Digestion by Sequestering Alpha-Amylase
129 | P a g e
4.3.4.2 Alpha-Amylase Diffusion into Mycoprotein Cells
Figure 4.8A and 4.8B shows the labelled -amylase inside the fungal cell compared
to the dye FITC when viewed by CLSM. Furthermore, the MYC interaction with starch after
12 min of in vitro digestion was observed by brightfield microscopy (Figure 4.8C and 4.8D).
Figure 4.8. Micrographs of glycogen-depleted MYC powder interacting with -amylase and starch.
Figure 4.8A: CLSM of glycogen-depleted MYC powder stained in blue with calcofluor white (CFW)
and free fluorescein isothiocyanate isomer (FITC) in green. Figure 4.8B: CLSM of glycogen-depleted
MYC powder stained in blue with CFW and the FITC-labelled -amylase in green, Z-stack analysis
ortho mode. Figure 4.8C and 4.8D: Optical microscopy of MYC stained with Lugol’s solution after 12
min of in vitro digestion; a potential association of starch (purple) with MYC (yellow) is shown in Figure
4.8C, whilst free starch is also shown in Figure 4.8D (both 4.8C and 4.8D are from the same sample).
Chapter 4. Mycoprotein Matrix Reduces In Vitro Carbohydrate Digestion by Sequestering Alpha-Amylase
130 | P a g e
FITC stained in green the MYC cells (Figure 4.8A) that were stained in blue by CFW
dye. Similarly, the FITC-labelled -amylase resulted in green spots on the MYC cells (Figure
4.8B). The Z-stack ortho analysis showed that the labelled -amylase was physically located
inside some MYC cells. The same imaging was also performed on the MYC sample where
extracellular fluorescently labelled amylase was removed by washing and centrifugation
(13,000 xg), and the images still showed the presence of intracellularly labelled amylase (Figure
4.9).
Figure 4.9. CLSM of glycogen-depleted MYC powder mixed with calcofluor white (blue) and
fluorescein isothiocyanate isomer (green) for 30 s on a vortex mixer and washed with PBS for 5 min at
2,800 xg.
Gelatinised starch also appeared to have some association with MYC (Figure 4.8C).
Lugol’s solution stained in purple the starch present in solution during the in vitro digestion,
whereas MYC gave a yellow colour. Starch appeared to be associated with some MYC hyphae.
However, Figure 4.8D also highlights that not all the starch in solution was associated with
Chapter 4. Mycoprotein Matrix Reduces In Vitro Carbohydrate Digestion by Sequestering Alpha-Amylase
131 | P a g e
MYC hyphae, as showed by the presence of free starch nearby MYC hyphae with no visual
evidence of an interaction.
4.4 Discussion
The FCW is known to be a rigid but flexible structure that is mainly composed of fibres
(i.e., chitin and -glucans) (Kang et al., 2018), and its porosity/permeability has been well
described in the literature (Scherrer, Louden, & Gerhardt, 1974; Shepherd, 1987; Walker et
al., 2018). The present study aimed to determine the impact of MYC on starch/carbohydrate
digestion and investigate the mechanisms underpinning any effects (e.g., enzymatic diffusion
through the cell walls). Moreover, the interaction of -amylase with the FCW was thought to
influence the enzymatic activity and, thus, promote a reduction of carbohydrate hydrolysis. A
decrease of starch amylolysis and the glycogen encapsulation by cell walls that slow down the
rate of carbohydrate digested are two crucial factors relevant to understanding the
glycaemic/insulinemic responses to MYC based products.
The small intestinal in vitro digestion showed that -amylase could hydrolyse the
intracellular glycogen of MYC (Figure 4.1). As expected, the release of sugar, thus the glycogen
amylolysis, depended on the enzymatic activity used. However, the extracted glycogen showed
a quicker digestion rate during the simulated digestion with 200 and 400 U/mL -amylase
(Figure 4.1A & 4.1B, respectively) compared to the intracellular glycogen from MYC. This
could be explained by the FCW limiting or slowing the accessibility of -amylase into the cell
to hydrolyse the glycogen. Similar behaviour of the cell wall has been reported in PCW (Ellis
et al., 2004; Grundy, Wilde, Butterworth, Gray, & Ellis, 2015).
The porosity/permeability of MYC cell walls was explored further by CLSM (Figure 4.8A
and 4.8C). The enzyme labelled with FITC was observed as fluorescent green spots distributed

Chapter 4. Mycoprotein Matrix Reduces In Vitro Carbohydrate Digestion by Sequestering Alpha-Amylase
132 | P a g e
in random regions of the hyphal matrix (Figure 4.8B). Why the enzyme is distributed
heterogeneously is not clear. The cell walls in these specific MYC regions could have an
increased porosity that allowed the diffusion of the labelled enzyme through the cell wall or
specific intra-cellular components with an affinity for the enzyme (such as protein, as shown
by the EMP in Figure 4.4A). This may have contributed to the binding process and will require
further study. A Z-stack experiment was performed to understand if the labelled enzyme was
interacting with MYC superficially (i.e., on the cell wall surface) or intracellularly. The X and
Y-axis of Figure 4.8B show the depth of the cells (10 m, scanned as 8 layers) and confirmed
the presence of the fluorescently labelled -amylase in the intracellular regions. Thus, the
enzyme was able to diffuse through the cell wall. Likewise, the diffusion of −amylase through
cell walls has been reported in other plant cells (e.g., potato tuber, red kidney bean and
banana), although the binding effect of the enzyme to the cell wall itself may partially limit this
process (Li, Gidley, & Dhital, 2019). Moreover, Figure 4.4C supports this finding by showing
that -amylase can be depleted from the solution by either binding to MYC or being entrapped
within the FCW, and these events were strong enough to resist the centrifugation process at
13,000 xg.
The enzyme -amylase has a molecular weight of 51-54 kDa, an ovoid shape with main
dimensions of approximately 13 x 8 x 5 nm (Brayer, Luo, & Withers, 1995). Previous work
has shown that filamentous fungi can internalise molecules of up to 150 kDa (Stokes radius 8-
9 nm) (Brul, Nussbaum, & Dielbandhoesing, 1997), thus suggesting it is highly probable that
most digestive enzymes can diffuse through the FCW as also described previously in Chapter
3 of this thesis. Therefore, if less enzyme was present in the supernatant (free enzyme), the
available enzyme activity was expected to be reduced.
Accordingly, the experiment with starch and -amylase in the presence of glycogen-
depleted MYC powder was performed to quantify any reduction in starch hydrolysis. Figure
Chapter 4. Mycoprotein Matrix Reduces In Vitro Carbohydrate Digestion by Sequestering Alpha-Amylase
133 | P a g e
4.3A shows a decrease in starch hydrolysis in the presence of a range of increasing glycogen-
depleted MYC powder concentrations. Even the lowest concentration of glycogen-depleted
MYC powder (2.5 mg/mL) used in this study decreased starch hydrolysis significantly (p-value
< 0.001 after 12 min) compared to the control, whereas -cellulose at 2.5 and 20 mg/mL did
not show any significant change, differently from what reported by Dhital, Gidley, and Warren
(2015). A critical difference between the two studies was the source of starch used. Dhital,
Gidley, and Warren (2015) used maize starch, while the present study used soluble potato
starch, impacting the competition between starch and cellulose. Thus, a possibility is that
amylase could have a higher affinity for soluble potato starch than for maize starch.
Figure 4.4A shows that the endpoints of the in vitro digestion of starch in the presence of
10 and 20 mg/mL of EMP resulted in a statistically significant inhibition (p-value < 0.01 and
p-value < 0.001, respectively) compared to the control. However, the inhibitory activity of the
protein from MYC was less marked than the inhibition promoted by the glycogen-depleted
MYC powder (Figure 4.3A), and a potential partial presence of cell wall fibres may have also
influenced this result. Hence, the inhibitory activity of MYC was mainly attributed to the
hyphal structure effect that was able to entrap/retain the enzyme and physically separate the
enzyme from the substrate. This may be permitted by the low density of covalent cross-links
between -glucans and chitin within FCW, likely resulting in a more open network structure
with larger pores (Kang et al., 2018). Nonetheless, the fact that EMP may have an inhibitory
activity towards -amylase needs further investigation for potential application in malting and
food industry processes that aim to reduce/limit starch degradation, like other -amylase
inhibitory proteins (Tysoe et al., 2016; Yu et al., 2018).
Conversely, BSA is a protein known to have no interaction with −amylase (Dhital,
Gidley, & Warren, 2015). Figure 4.4B shows that when BSA is in excess in the starch solution,
MYC and −amylase system reversed the enzymatic inhibition of the MYC and enhanced the
Chapter 4. Mycoprotein Matrix Reduces In Vitro Carbohydrate Digestion by Sequestering Alpha-Amylase
134 | P a g e
starch hydrolysis. BSA was potentially hindering the diffusion and subsequent entrapment of
-amylase through the MYC cell walls. Therefore, the free enzyme was available to hydrolyse
the starch. This finding was in line with Dhital, Gidley, and Warren (2015), which reported
that BSA blocked the binding of -amylase to −cellulose. Hence, the interaction of
−amylase with MYC appeared to be not specific, and an excess of BSA may act as a blocking
solution that slowed down the diffusion of the enzyme. This would leave a higher
concentration of amylase in solution to hydrolyse the starch more quickly than in the absence
of BSA.
The mechanisms of inhibition of -amylase by MYC were investigated using kinetic
analyses (Figure 4.5) and suggested that the inhibition was of a mixed type. A schematic
diagram of reversible, mixed linear inhibition is represented in Figure 4.6 and shows that
MYC, acting as an inhibitor (I), can interact with the enzyme (E), as well as the substrate (S)
bound to the enzyme (ESI). This mechanism is consistent with microscopy, which showed
that MYC might interact with both starch (Figure 4.8C and D) and -amylase (Figure 4.8B) to
form the complex -amylase/starch/MYC (ESI). The observations from microscopy fit with
the proposed inhibition mechanism. The Vmax results (Figure 4.5 and Table 4.1) suggest a less
available enzyme for starch digestion because a proportion of it is sequestered inside the MYC
cells. Similarly, the Km results suggest that increasing concentrations of MYC are directly
competing with the starch for the enzyme. Thus, the inhibition of the starch hydrolysis is
triggered by reducing the available enzyme in the solution.
MYC can be considered a food ingredient that relies upon a defined structure comprising
filamentous cells composed of cell walls, membranes, macromolecules, and organelles.
Hence, the kinetic analyses on the inhibition of -amylase by MYC could be considered
unconventional for this type of analysis, which usually involves the investigation of enzymes
Chapter 4. Mycoprotein Matrix Reduces In Vitro Carbohydrate Digestion by Sequestering Alpha-Amylase
135 | P a g e
inhibitors such as polyphenols (Striegel, Kang, Pilkenton, Rychlik, & Apostolidis, 2015; Sun
et al., 2016), protein (Barrett & Udani, 2011; da Silva et al., 2018) or drugs (Knights & Jones,
1992).
4.5 Conclusions
The results presented in this chapter suggested that pancreatic -amylase can diffuse
through the cell walls of MYC thanks to its porosity/permeability, sequestering the enzyme
within the hyphal cells. Therefore, the available enzyme concentration was reduced by MYC,
and starch hydrolysis was subsequently decreased. The mechanism proposed is the reduction
of the overall enzyme action by a reversible linear mixed inhibition that is mainly attributed to
the entrapment of the enzyme within the hyphal structure.
However, other components of MYC (i.e., proteins) may also play a minor role in the
inhibition of -amylase and the presence of cell walls that can slow down/limit the
bioaccessibility of glycogen. These findings contribute to understanding the mechanism
underlying the reduced glycemia and insulinemia observed in vivo after MYC consumption,
which can help patients with T2D. Furthermore, the food industry can apply these results to
develop new products to reduce starch hydrolysis and subsequent glycaemic response.

Chapter 5. Mycoprotein Modulates In Vitro Lipid Digestion by Reducing Lipase Activity and Binding Bile
Salts
136 | P a g e
Chapter 5
Mycoprotein Modulates In Vitro Lipid Digestion
by Reducing Lipase Activity and Binding Bile Salts†
† This chapter is based on the published peer-reviewed manuscript Colosimo et al. (2020),
Food and Function, 11, 10896-1090.

Chapter 5. Mycoprotein Modulates In Vitro Lipid Digestion by Reducing Lipase Activity and Binding Bile
Salts
137 | P a g e
5.1 Introduction
The consumption of some types of meat has been associated with an increased risk of
cardiovascular diseases (CVD) (Abete, Romaguera, Vieira, de Munain, & Norat, 2014). In
contrast, plant-based products, as well as edible mushrooms, being rich in dietary fibre (DF)
and low in saturated fat (Denny & Buttriss, 2007; Gil-Ramírez, Morales, & Soler-Rivas, 2018;
Schneider et al., 2011) could help in the prevention of CVD by reducing blood lipid levels
(Krittanawong et al., 2021; Satija & Hu, 2018). There is now accumulating evidence that
mycoprotein (MYC) can elicit similar beneficial effects on blood lipids (Coelho et al., 2020;
Ruxton & McMillan, 2010; Turnbull, Leeds, & Edwards, 1992; Turnbull, Leeds, & Edwards,
1990).
Understanding the underlying mechanisms by which this food ingredient can influence
lipid markers is essential. A blood lipid-lowering effect could be mediated by different
biological and physicochemical mechanisms (Gunness & Gidley, 2010). The inhibition of
lipase activity and the consequent delay in lipid digestion are important mechanisms that can
positively influence post-prandial lipidaemia (Adisakwattana, Intrawangso, Hemrid,
Chanathong, & Mäkynen, 2012). Similarly, the binding of bile salts (BS) by fibre (Goel et al.,
1998; Lia et al., 1995; Story & Kritchevsky, 1976) promotes the faecal excretion of BS and,
consequently, the alteration of the bile acid pool that forces the liver to produce more BS from
endogenous cholesterol (Staels, 2009). In the same manner, protein from different sources
(e.g., milk, soybean seed, corn, cumin, and lupin) has been reported to bind BS (Guerin,
Kriznik, Ramalanjaona, Le Roux, & Girardet, 2016; Kongo-Dia-Moukala, Zhang, & Claver
Irakoze, 2011; Makino, Nakashima, Minami, Moriyama, & Takao, 1988; Siow, Choi, & Gan,
2016; Yoshie-Stark & Wäsche, 2004). Also, the hydrophobicity of protein subunits or amino
acids (AA) has been linked to BS sequestering activity (Guerin, Kriznik, Ramalanjaona, Le
Roux, & Girardet, 2016; Iwami, Sakakibara, & Ibuki, 1986; Kongo-Dia-Moukala, Zhang, &
Chapter 5. Mycoprotein Modulates In Vitro Lipid Digestion by Reducing Lipase Activity and Binding Bile
Salts
138 | P a g e
Claver Irakoze, 2011). Finally, BS binding could also be influenced by increased viscosity
promoted by DF (Zacherl, Eisner, & Engel, 2011) depending on its composition (Story &
Kritchevsky, 1976) or solubility (Wang, Onnagawa, Yoshie, & Suzuki, 2001).
This chapter aimed to investigate the physicochemical processes during the digestion of
MYC in the gastrointestinal tract (GIT), which may underly the blood lipid-lowering effect
observed after MYC consumption in vivo. Thus, the hypotheses are that MYC and its
components (e.g., fibre, protein) can reduce lipid digestion by reducing lipase activity,
sequestering BS from solution, and increasing viscosity during simulated gastrointestinal (GI)
digestion. To test these hypotheses, an oil in water (O/W) emulsion or a tributyrin (TBT)
control were subjected to in vitro GI digestion in the presence of MYC to understand how
MYC can impact lipolysis rates during simulated small intestinal digestion. Additionally, BS
was incubated with different MYC concentrations or extracted MYC proteins (EMP) to
determine BS sequestration levels from isolated supernatants collected after simulated GI
digestion. Increased viscosity promoted by DF could also influence BS binding. Thus, the
viscosity of MYC digesta was measured to assess its contribution towards lipid digestion and
BS binding.
This study provides new insights into the digestive fate of MYC, which is relevant to
understanding the role of MYC enriched diets in improving blood lipid profiles and thereby
potentially lowering CVD risk.
Chapter 5. Mycoprotein Modulates In Vitro Lipid Digestion by Reducing Lipase Activity and Binding Bile
Salts
139 | P a g e
5.2 Materials & Methods
5.2.1 Materials
5.2.1.1 Chemicals and Reagents
The specific reagents used in this chapter are specified below, while the common
materials to other chapters are listed in Chapter 2, Section 2.1.1.
All standards and reagents were purchased from Merck, UK, unless otherwise stated:
sodium deoxycholate (Catalogue No. D6750), Nile Red (72485), DL-dithiothreitol (Catalogue
No. 10197777001), NH4HCO3 (Catalogue No. A6141), iodoacetamide (Catalogue No.
I1149), trifluoroacetic acid (Catalogue No. T6508), total bile acids kit (Catalogue No. 903115,
Dialab, Austria), acetonitrile (Catalogue No. A/0626/PB17, Fisher Scientific), chymotrypsin
(Catalogue No. V1061, Promega, USA), InstantBlue™ protein stain (Catalogue No. ISB1L,
Expedeon, UK), and whey protein isolate (BiPro®, Agropur, USA). The sunflower seed oil
from Helianthus annuus (Catalogue No. 88921) was treated with Florisil® (Catalogue No.
288705) to remove polar and surface-active compounds.
5.2.1.2 Mycoprotein Samples
Marlow Foods Ltd, UK, provided freeze-dried MYC powder and EMP. MYC
powder was prepared at different concentrations (i.e., 10, 20, 30 mg/mL) by mixing with ultra-
pure water before being added to the simulated digestion vessel. EMP were prepared at 8.8
mg/mL in ultra-pure water, which matched the total concentration of protein expected to be
present in 20 mg/mL of MYC based on the protein content determined by Marlow Foods
Ltd, UK, (Chapter 1, Section 1.2.3). The concentrations of 10, 20, 30 mg/mL of MYC or 8.8
mg/mL of EMP refers to the final concentrations in the final volume of the simulated digestion
experiments.
Chapter 5. Mycoprotein Modulates In Vitro Lipid Digestion by Reducing Lipase Activity and Binding Bile
Salts
140 | P a g e
5.2.2 Methods
5.2.2.1 Lipolysis Analysis by In Vitro Digestion Using pH-Stat Method
Simulated digestion with a pH-stat device was performed to study the impact of
different MYC concentrations on the lipolysis of O/W emulsion or TBT. This provided
information on the influence of MYC intake on lipase activity and, therefore, lipid digestion.
Emulsion Preparation
An O/W emulsion was prepared by pre-emulsifying 0.4 g of sunflower oil with 9.6
g of whey protein isolate (WPI) solution (1% w/v in water, stirred for 120 min at room
temperature) using an Ultra-Turrax T-25 homogeniser (IKA, Germany) for 1 min at 13,500
xg. The pre-emulsion was then sonicated with a Branson Digital Sonifier® (Marshall Scientific,
USA) for 2 min at 30% of amplitude with cycles of 10 s sonication and 10 s of rest. The particle
size of the O/W emulsion was measured by static light scattering (LS 13-320, Beckman
Coulter, USA), ensuring a mean particle diameter (D4,3) within the range of 1.5 - 2.5 m using
a refractive index of 1.7. A WPI stabilised emulsion was used as it is readily digested during
in vitro GI digestion (Macierzanka, Sancho, Mills, Rigby, & Mackie, 2009).
Lipolysis During Simulated Small Intestinal Digestion
The lipolysis of O/W emulsion in the presence of MYC was measured by a pH-
stat device KEM AT-700 (Kyoto electronics, Japan). Briefly, 2.5 mL of MYC at different
concentrations (10, 20, or 30 mg/mL in the final digesta) was placed in a jacketed reaction
vessel warmed to 37℃. The final composition in the reaction system was 300 mg lipid from
the O/W emulsion, 10 mM BS, and 100 U/mL pancreatin (based on lipase activity) in a final
volume of 20 mL. The volumes of simulated intestinal fluid (SIF) and CaCl2·2H2O were
Chapter 5. Mycoprotein Modulates In Vitro Lipid Digestion by Reducing Lipase Activity and Binding Bile
Salts
141 | P a g e
added to obtain the concentration of the electrolytes, according to Minekus et al. (2014).
However, in the composition of the SIF, the solution of NaHCO3 was replaced by NaCl to
avoid CO2 formation, which would have introduced undesirable pH changes as described by
Mat, Le Feunteun, Michon, and Souchon (2016), and recommended in the latest INFOGEST
protocol (Brodkorb et al., 2019). The pH was first adjusted to 7.0 and then maintained at that
value by constant titration of 0.1 M NaOH for 60 min of simulated digestion and continuous
stirring (500 rpm). Lipolysis was expressed as volume (mL) of NaOH 0.1 M necessary to
maintain pH 7.0 against the decrease of pH promoted by the release of free fatty acids (FFA)
during lipolysis.
TBT substrate was used to test the MYC effect on intrinsic lipase activity due to
its high efficiency to be hydrolysed in the absence of BS. For this, 0.5 mL of TBT was digested
as described in the pancreatic lipase activity assay by the INFOGEST method (Minekus et al.,
2014) with or without the presence of MYC at 30 mg/mL in the final volume. The pH was
first adjusted at 8.0 and then maintained at that value by constant titration of 0.1 M NaOH for
10 min with constant stirring (500 rpm). Lipolysis was expressed as volume (mL) of NaOH
0.1 M necessary to maintain pH 8.0 against the decrease of pH promoted by FFA release
during lipolysis.
5.2.2.2 Simulated Gastrointestinal or Only Intestinal Digestion
The GI digestion was carried out for 120 min of gastric phase followed by 120 min
of small intestinal step or only small intestinal digestion (referred to as I) for 120 min. Different
concentrations of MYC (10, 20, 30 mg/mL) or EMP (8.8 mg/mL) were digested according to
the INFOGEST standardised method (Minekus et al., 2014) described in Chapter 2, Section
2.2.1.
Chapter 5. Mycoprotein Modulates In Vitro Lipid Digestion by Reducing Lipase Activity and Binding Bile
Salts
142 | P a g e
After simulated digestion, MYC digesta (20 mL final volume) or EMP (1 mL final
volume) were centrifuged at 700 xg for 5 min at room temperature (Heraeus Megafuge 16
centrifuge, Germany, for MYC digesta and Eppendorf® centrifuge 5424-R, Germany, for
EMP). The resulting supernatant was collected and used for BS quantification on the same
day of the experiment.
5.2.2.3 Bile Salts Binding Experiments After Simulated Gastrointestinal
Digestion
The binding of BS is a crucial mechanism underlying the reduction of blood lipids.
The BS concentration was measured from the supernatant of simulated GI, or only intestinal
digestion of MYC or EMP carried out with different conditions, such as the presence or
absence of enzymes or the use of individual enzymes.
Bile Salts Estimation
BS concentration was determined by a colourimetric enzymatic kinetic assay using
the total bile acids kit (Dialab, Austria), as described in Chapter 2, Section 2.2.5.2.
Briefly, 5 L of standard (sodium deoxycholate in phosphate-buffered saline
(PBS)) in a range of 5 – 40 M or unknown concentration sample was transferred in a 96-
wells plate in duplicate. Then, 240 µL of Reagent 1 (Thio-NAD) was added to each well and
incubated for 5 min at 37℃ before adding 80 µL of Reagent 2 (3-−hydroxysteroid
dehydrogenase) to start the reaction. The plate was then incubated at 37℃, and absorbance
was measured at 405 nm every 30 s for 20 min in a plate reader (Benchmark Plus™, Bio-Rad,
UK). The rate of increase in absorbance of the unknown samples was corrected using the
blank and compared to the standard to obtain the BS concentration.

Chapter 5. Mycoprotein Modulates In Vitro Lipid Digestion by Reducing Lipase Activity and Binding Bile
Salts
143 | P a g e
5.2.2.4 Protein Analyses
Sodium dodecyl sulphate polyacrylamide gel electrophoresis (SDS-PAGE) was used
to analyse the hydrolysis of proteins belonging to MYC or EMP and visualise peptides resistant
to digestive enzymes. The resistant peptides identified were furtherly investigated by Liquid
Chromatography with Tandem Mass Spectrometry (LC-MS/MS).
SDS-PAGE
The proteins from digested GI samples from MYC and EMP were separated by
SDS-PAGE as described in Chapter 2, Section 2.2.3.3.
LC-MS/MS
Preparation of Gel Slices for LC-MS/MS
Protein bands resistant to trypsin digestion were observed by SDS-PAGE
(Figure 5.8), and gel slices in these bands were cut and prepared, as described below, for LC-
MS/MS analysis, performed by Dr Carlo de-Oliveira-Martins at the proteomic facility of the
John Innes Centre in Norwich, UK.
For the procedure of preparation of gel slices, washing steps were 20 min each
(unless otherwise stated) with strong vortex-mixing using 1 mL of solvent. Gel slices were
destained with 30% ethanol for 30 min at 65℃ until they were clear and then washed with
NH4HCO3 (50 mM) prepared in 50% NH4HCO3/50% acetonitrile and incubated with
dithiothreitol (10 mM) at 55℃ for 30 min. Dithiothreitol was removed by centrifugation, and
a solution of iodoacetamide (30 mM) was added for another 30 min of incubation by vortex
mixing at room temperature in the dark. The iodoacetamide solution was removed by
centrifugation, and the gel slices were washed with NH4HCO3/50% acetonitrile by vortex
Chapter 5. Mycoprotein Modulates In Vitro Lipid Digestion by Reducing Lipase Activity and Binding Bile
Salts
144 | P a g e
mixing. Another wash with NH4HCO3 was performed to remove the buffer, and gel slices
were transferred individually to a petri dish for cutting. The volume of each gel slice was
estimated before using a scalpel to cut the gel slices into smaller pieces (approximately 1 x 1
mm). The pieces were transferred to a clean tube and washed twice with NH4HCO3/50%
acetonitrile and 100% acetonitrile. Finally, the solvent was removed entirely by spinning the
samples in a vacuum-drier centrifuge (concentrator plus/vacufuge® plus, Eppendorf®,
Germany) for 30 min. The precipitated and dried gel slice residuals were collected and sent
for LC-MS/MS analysis.
LC-MS/MS Analysis
The dried gel slice residuals were digested with chymotrypsin (1:20
enzyme:protein) for 8 h at pH 7.5 and room temperature. LC-MS/MS analysis was performed
using an Orbitrap Eclipse tribrid mass spectrometer (Thermo Fisher Scientific, UK) and a
nanoflow high-performance liquid chromatography (HPLC) system (Dionex Ultimate3000,
Thermo Fisher Scientific, UK). Other settings were as follow: flow 0.2 µL/min, solvent A: 0.1%
trifluoroacetic acid, solvent B: 80% acetonitrile in 0.1% trifluoroacetic acid; total running time
of 118 min (multi-step gradient, including wash and re-equilibration), ion source voltage of
2,300 V (positive mode), operated in DDA mode, MS1 resolution of 120,000 and range 300-
1,800 m/z, RF = 30%, max injection time of 50 ms, a dynamic exclusion of 15 seconds. MS2
with CID and HCD fragmentation (ion trap, turbo mode), isolation window of 1.6 Da,
collision energy of 20%, and a max injection time of 35 ms.
The protein identification was carried out with Scaffold™ software V4.10.0
(Proteome software Inc, USA) and the UniProt database.

Chapter 5. Mycoprotein Modulates In Vitro Lipid Digestion by Reducing Lipase Activity and Binding Bile
Salts
145 | P a g e
5.2.2.5 Rheological Analysis
The viscosity of the whole digesta (supernatant + pellet) of MYC was measured at 30
mg/mL concentration after the GI digestion (WO/E refers to the control without enzymes;
this is without pepsin for the gastric step and trypsin or pancreatin for the intestinal). The
viscosity of the SIF was used as a control.
The experiment was carried out using a controlled stress rheometer Advanced AR-
2000 (TA instruments, UK) using a 60 mm 1-degree acrylic cone, 22 m truncation, and cone
angle 0:59:21 (deg:min:sec). The rheological protocol was set with the software Rheology
Advantage Instrument Control AR V5.8.2, UK, as follows: continuous ramp from a shear rate
of 10 to 1,000 1/s on a log scale, for 2 min at 37°C, 10 points per decade, sample density was
estimated as 1 g/cm3.
5.2.2.6 Particle Size Analysis of Simulated Gastrointestinal Digestion
The particle size diameter (D4,3) of the digesta of MYC 30 mg/mL was measured by
static laser light scattering using a particle size analyser LS 13-320 (Beckman Coulter, USA)
with model biomass in water (refractive index 1.7) after incubation with or without enzymes
(referred to as WO/E), this is without pepsin for the gastric phase and pancreatin or trypsin
for the intestinal step.
5.2.2.7 Data Analysis
Data were analysed by GraphPad Prism version 5 for Windows (GraphPad Software,
USA). Statistical significance was set at p-value < 0.05. Values were expressed as average ±
confidence interval at 95% (CI95%) of three independent measures (n = 3) for the pH-stat
digestion, rheology and particle size experiments, or six independent measures (n = 6) for the
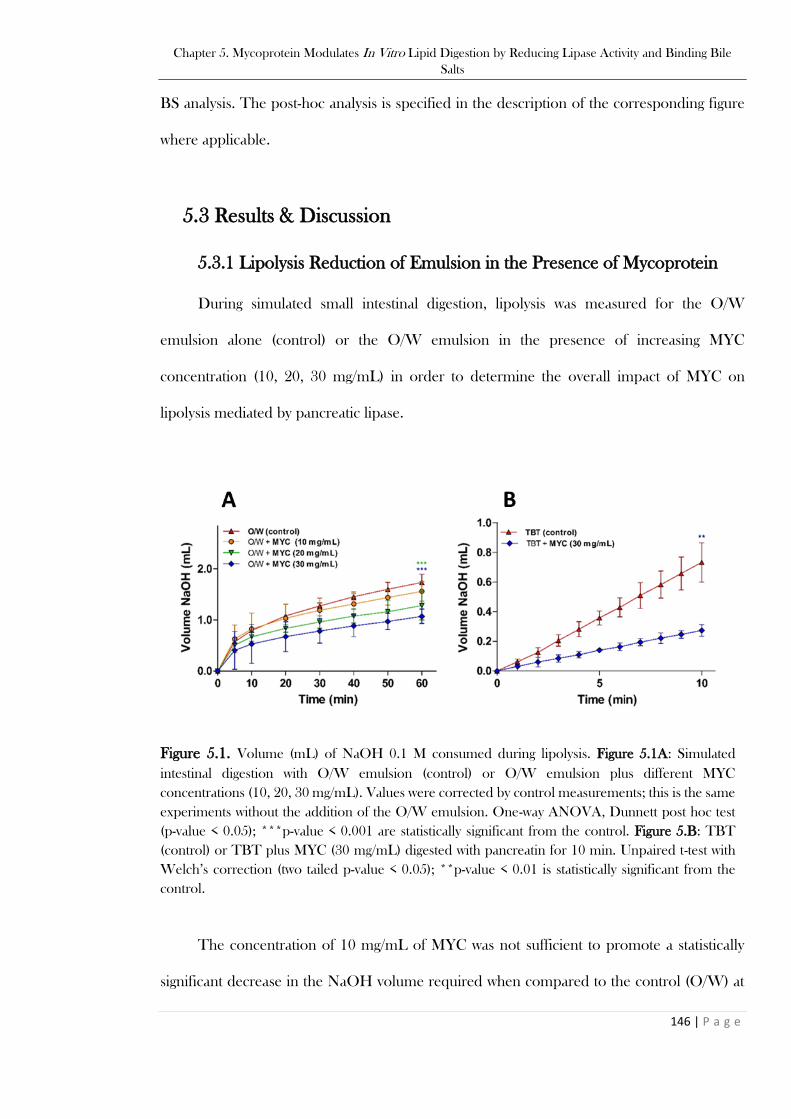
Chapter 5. Mycoprotein Modulates In Vitro Lipid Digestion by Reducing Lipase Activity and Binding Bile
Salts
146 | P a g e
BS analysis. The post-hoc analysis is specified in the description of the corresponding figure
where applicable.
5.3 Results & Discussion
5.3.1 Lipolysis Reduction of Emulsion in the Presence of Mycoprotein
During simulated small intestinal digestion, lipolysis was measured for the O/W
emulsion alone (control) or the O/W emulsion in the presence of increasing MYC
concentration (10, 20, 30 mg/mL) in order to determine the overall impact of MYC on
lipolysis mediated by pancreatic lipase.
Figure 5.1. Volume (mL) of NaOH 0.1 M consumed during lipolysis. Figure 5.1A: Simulated
intestinal digestion with O/W emulsion (control) or O/W emulsion plus different MYC
concentrations (10, 20, 30 mg/mL). Values were corrected by control measurements; this is the same
experiments without the addition of the O/W emulsion. One-way ANOVA, Dunnett post hoc test
(p-value < 0.05); ***p-value < 0.001 are statistically significant from the control. Figure 5.B: TBT
(control) or TBT plus MYC (30 mg/mL) digested with pancreatin for 10 min. Unpaired t-test with
Welch’s correction (two tailed p-value < 0.05); **p-value < 0.01 is statistically significant from the
control.
The concentration of 10 mg/mL of MYC was not sufficient to promote a statistically
significant decrease in the NaOH volume required when compared to the control (O/W) at
Chapter 5. Mycoprotein Modulates In Vitro Lipid Digestion by Reducing Lipase Activity and Binding Bile
Salts
147 | P a g e
the endpoint of the digestion experiment (60 min) (Figure 5.1A). The lipolysis of MYC at 20
and 30 mg/mL was statistically lower (p-value < 0.001) after 60 min of digestion when
compared to the control. Visual checks using light microscopy confirmed that MYC did not
induce coalescence or flocculation in the emulsion, which may have interfered with lipid
digestion (Figure 5.2). Figure 5.1B shows that the lipolysis of TBT in the presence of MYC 30
mg/mL was significantly reduced (p-value < 0.01). This finding implied that MYC was directly
interfering with the lipase activity, as the TBT assay is performed without BS and O/W
emulsion. The observed reduction in lipolysis mediated by MYC could reduce the rate of lipid
digestion and absorption in the small intestine. This can explain the blood lipid-lowering effect
of MYC observed in vivo (Coelho et al., 2020; Ruxton & McMillan, 2010; Turnbull, Leeds,
& Edwards, 1992; Turnbull, Leeds, & Edwards, 1990) that is beneficial in the prevention of
CVD (McBride, 2008). DF has been reported to reduce lipase activity (Balasubramaniam et
al., 2013; Houghton et al., 2015), but the mechanisms that cause the reduction in lipolysis rates
are not clear. A possible explanation is the lipase entrapment in the MYC matrix, similar to
what has been previously observed in the case of −amylase, as discussed in Chapter 4. The
enzyme −amylase remained entrapped within MYC cell walls, and consequently, lower
starch hydrolysis was observed by effectively reducing the enzyme concentration from the
solution. Moreover, the presence of -glucans can influence lipolysis (Zhai, Gunness, &
Gidley, 2020).
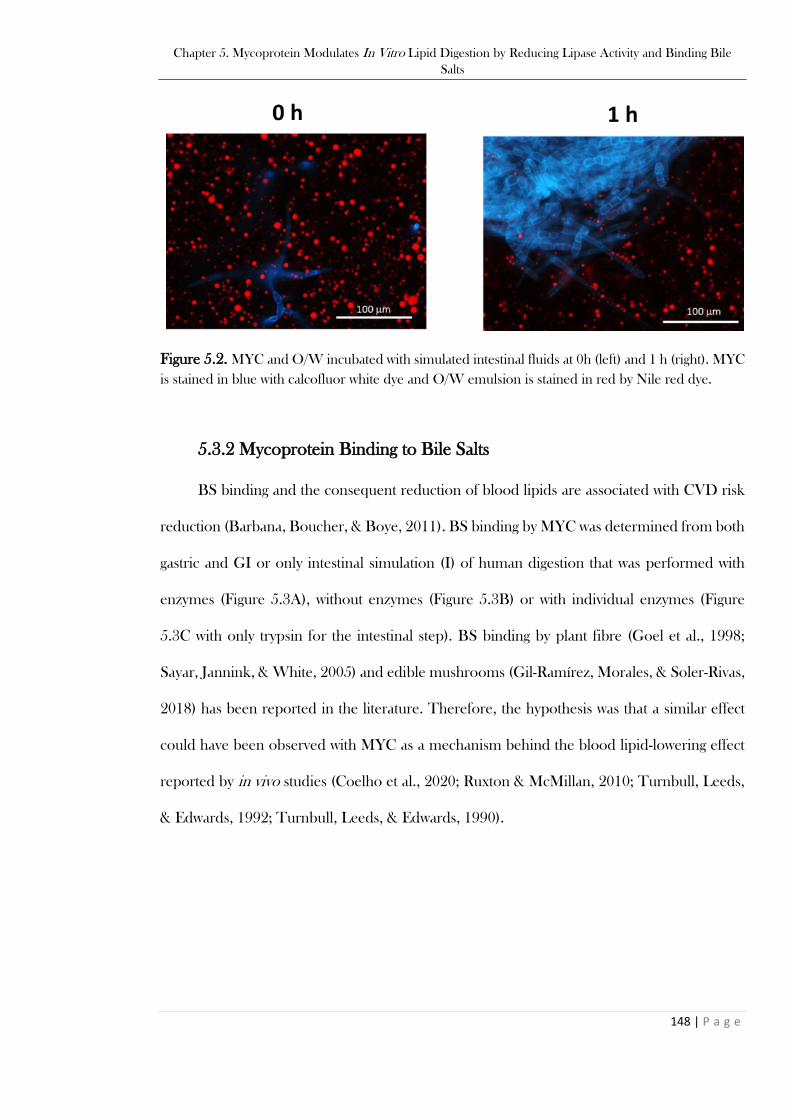
Chapter 5. Mycoprotein Modulates In Vitro Lipid Digestion by Reducing Lipase Activity and Binding Bile
Salts
148 | P a g e
Figure 5.2. MYC and O/W incubated with simulated intestinal fluids at 0h (left) and 1 h (right). MYC
is stained in blue with calcofluor white dye and O/W emulsion is stained in red by Nile red dye.
5.3.2 Mycoprotein Binding to Bile Salts
BS binding and the consequent reduction of blood lipids are associated with CVD risk
reduction (Barbana, Boucher, & Boye, 2011). BS binding by MYC was determined from both
gastric and GI or only intestinal simulation (I) of human digestion that was performed with
enzymes (Figure 5.3A), without enzymes (Figure 5.3B) or with individual enzymes (Figure
5.3C with only trypsin for the intestinal step). BS binding by plant fibre (Goel et al., 1998;
Sayar, Jannink, & White, 2005) and edible mushrooms (Gil-Ramírez, Morales, & Soler-Rivas,
2018) has been reported in the literature. Therefore, the hypothesis was that a similar effect
could have been observed with MYC as a mechanism behind the blood lipid-lowering effect
reported by in vivo studies (Coelho et al., 2020; Ruxton & McMillan, 2010; Turnbull, Leeds,
& Edwards, 1992; Turnbull, Leeds, & Edwards, 1990).
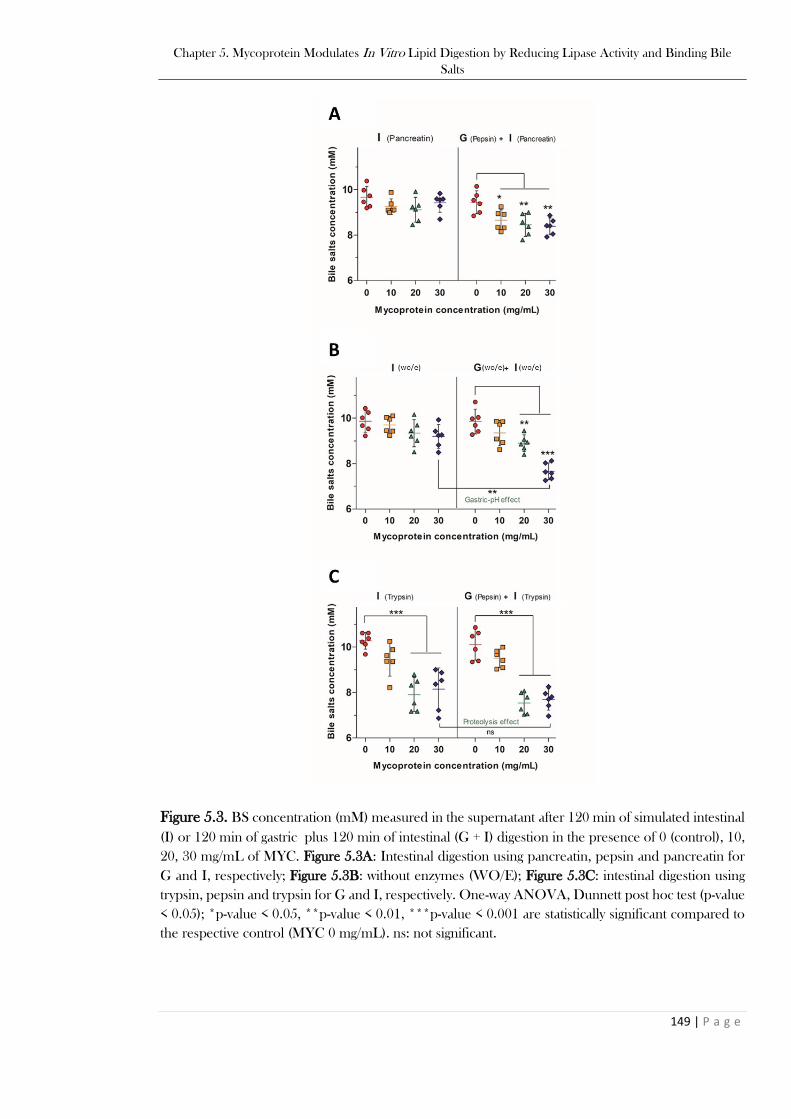
Chapter 5. Mycoprotein Modulates In Vitro Lipid Digestion by Reducing Lipase Activity and Binding Bile
Salts
149 | P a g e
Figure 5.3. BS concentration (mM) measured in the supernatant after 120 min of simulated intestinal
(I) or 120 min of gastric plus 120 min of intestinal (G + I) digestion in the presence of 0 (control), 10,
20, 30 mg/mL of MYC. Figure 5.3A: Intestinal digestion using pancreatin, pepsin and pancreatin for
G and I, respectively; Figure 5.3B: without enzymes (WO/E); Figure 5.3C: intestinal digestion using
trypsin, pepsin and trypsin for G and I, respectively. One-way ANOVA, Dunnett post hoc test (p-value
< 0.05); *p-value < 0.05, **p-value < 0.01, ***p-value < 0.001 are statistically significant compared to
the respective control (MYC 0 mg/mL). ns: not significant.
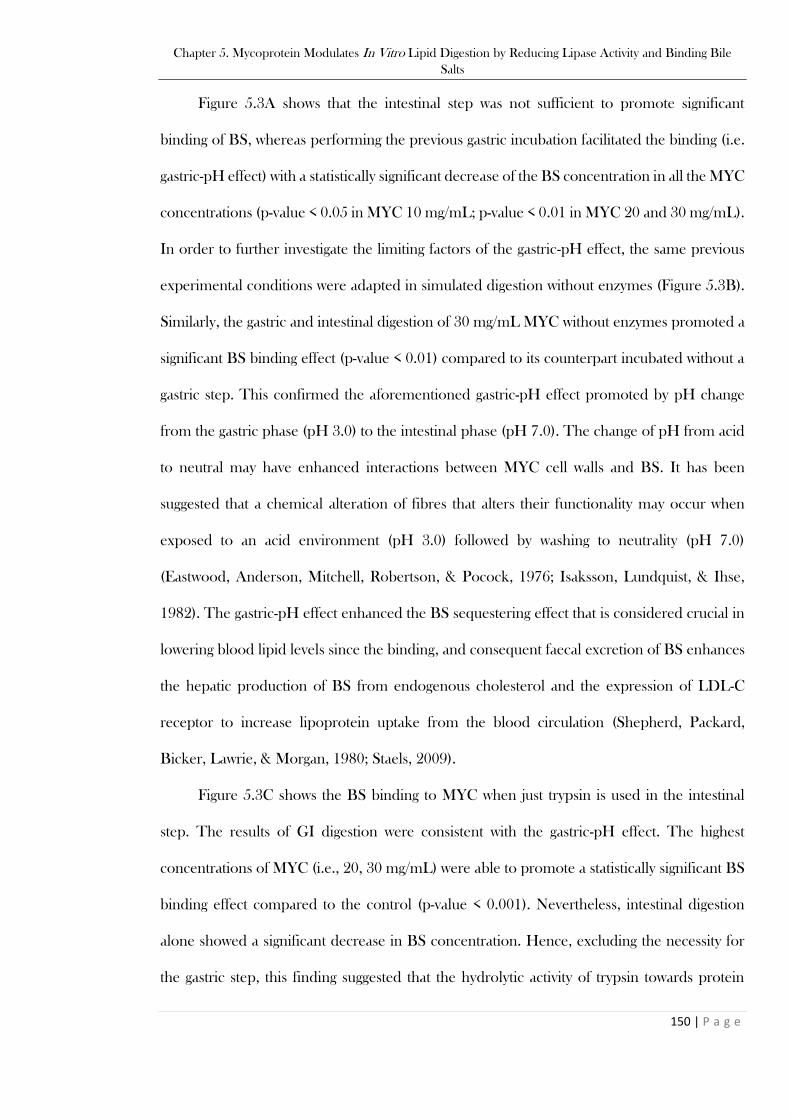
Chapter 5. Mycoprotein Modulates In Vitro Lipid Digestion by Reducing Lipase Activity and Binding Bile
Salts
150 | P a g e
Figure 5.3A shows that the intestinal step was not sufficient to promote significant
binding of BS, whereas performing the previous gastric incubation facilitated the binding (i.e.
gastric-pH effect) with a statistically significant decrease of the BS concentration in all the MYC
concentrations (p-value < 0.05 in MYC 10 mg/mL; p-value < 0.01 in MYC 20 and 30 mg/mL).
In order to further investigate the limiting factors of the gastric-pH effect, the same previous
experimental conditions were adapted in simulated digestion without enzymes (Figure 5.3B).
Similarly, the gastric and intestinal digestion of 30 mg/mL MYC without enzymes promoted a
significant BS binding effect (p-value < 0.01) compared to its counterpart incubated without a
gastric step. This confirmed the aforementioned gastric-pH effect promoted by pH change
from the gastric phase (pH 3.0) to the intestinal phase (pH 7.0). The change of pH from acid
to neutral may have enhanced interactions between MYC cell walls and BS. It has been
suggested that a chemical alteration of fibres that alters their functionality may occur when
exposed to an acid environment (pH 3.0) followed by washing to neutrality (pH 7.0)
(Eastwood, Anderson, Mitchell, Robertson, & Pocock, 1976; Isaksson, Lundquist, & Ihse,
1982). The gastric-pH effect enhanced the BS sequestering effect that is considered crucial in
lowering blood lipid levels since the binding, and consequent faecal excretion of BS enhances
the hepatic production of BS from endogenous cholesterol and the expression of LDL-C
receptor to increase lipoprotein uptake from the blood circulation (Shepherd, Packard,
Bicker, Lawrie, & Morgan, 1980; Staels, 2009).
Figure 5.3C shows the BS binding to MYC when just trypsin is used in the intestinal
step. The results of GI digestion were consistent with the gastric-pH effect. The highest
concentrations of MYC (i.e., 20, 30 mg/mL) were able to promote a statistically significant BS
binding effect compared to the control (p-value < 0.001). Nevertheless, intestinal digestion
alone showed a significant decrease in BS concentration. Hence, excluding the necessity for
the gastric step, this finding suggested that the hydrolytic activity of trypsin towards protein

Chapter 5. Mycoprotein Modulates In Vitro Lipid Digestion by Reducing Lipase Activity and Binding Bile
Salts
151 | P a g e
associated with MYC cells could somehow have altered existing protein/peptides to enhance
their BS binding activity (proteolysis effect). In line with this, previous studies have reported
the presence of proteins with BS binding properties (Guerin, Kriznik, Ramalanjaona, Le
Roux, & Girardet, 2016; Kongo-Dia-Moukala, Zhang, & Claver Irakoze, 2011; Makino,
Nakashima, Minami, Moriyama, & Takao, 1988; Siow, Choi, & Gan, 2016; Takeshita et al.,
2011; Yoshie-Stark & Wäsche, 2004), and will be discussed in the next section.
5.3.2.1 Extracted Mycoprotein Protein and Proteolysis Effect on Bile
Salts Binding
Following the observation that the proteolysis effect of trypsin towards MYC proteins
appeared to enhance the BS binding to MYC, EMP were furtherly investigated. EMP were
digested under simulated intestinal conditions alone (with trypsin, referred to as I) or including
the gastric phase (with pepsin for the gastric phase and trypsin for the intestinal, referred to as
GI) (Figure 5.4).
The proteolysis effect of trypsin on BS binding was confirmed by the statistically
significant effect (p-value < 0.001) compared to the control that was observed with trypsin
digestion (TRP) when just the intestinal digestion was performed. In contrast, there was no
effect when the incubation was performed without enzyme (WO/E in Figure 5.4). The gastric
incubation without enzyme (WO/E) did not promote any BS binding effect with EMP (Figure
5.4). This supported the previously described gastric-pH effect observation, which suggested
that the BS binding was promoted by the previous acid gastric incubation that altered the cell
wall fibre matrix in whole MYC. In contrast, the gastric pH had no impact on BS binding by
EMP due to the absence of cell walls, thus working as a negative control. Conversely, the
previous incubation of EMP with pepsin followed by trypsin digestion (PEP + TRP)
diminished the BS binding effect. It can be suggested that the combination of pepsin and

Chapter 5. Mycoprotein Modulates In Vitro Lipid Digestion by Reducing Lipase Activity and Binding Bile
Salts
152 | P a g e
trypsin hydrolysis could reduce the binding between BS and protein by breaking down the
primary protein structure and, therefore, affecting EMP binding functionality.
Figure 5.4. BS concentration (mM) measured after 120 min of simulated intestinal (I) or 120 min of
gastric plus 120 min of intestinal (GI) digestion in the presence of 8.8 mg/mL of EMP (which
corresponds to the protein concentration in 20 mg/mL of MYC). In the graph, CNT is the sample
without EMP (control); WO/E refers to EMP incubated without enzyme; TRP refers to EMP
incubated with trypsin; PEP + TRP refers to EMP incubated with pepsin and then trypsin. One-way
ANOVA, Dunnett post hoc test (p-value < 0.05); *** p-value < 0.001 is statistically significant compared
to the control (I).
5.3.2.2 Characterisation of Extracted Mycoprotein Proteins with
Potential Bile Salts Binding Activity
SDS-PAGE was used to investigate samples from the digestion of EMP (Figure 5.5A)
and MYC (Figure 5.5B) to assess the presence of potential BS binding proteins.
EMP WO/E at a concentration of 8.8 mg/mL appeared as a smeared band (Figure
5.5A), apart from the identifiable protein bands from ~37 kDa to ~97.4 kDa. EMP were
effectively digested during the simulated digestion apart from a resistant protein band observed
at ~37 kDa with trypsin or.
Chapter 5. Mycoprotein Modulates In Vitro Lipid Digestion by Reducing Lipase Activity and Binding Bile
Salts
153 | P a g e
Figure 5.5. SDS-PAGE gels. Figure 5.5A: EMP in triplicate (bands 1, 2, 3) during only intestinal
digestion (with trypsin) or GI digestion (with pepsin + trypsin), EMP U refers to the EMP undigested.
Figure 5.5B: MYC in triplicate (bands 1, 2, 3), during only intestinal digestion (with trypsin) or GI
digestion (with pepsin + trypsin), MYC WO/E refers to the MYC undigested. In the figure, kDa refers
to the protein molecular weight, M refers to the protein standard mark, pepsin and trypsin are the
enzyme standards.
Pepsin plus trypsin digestion showed a new protein band that potentially belonged to
pepsin. Like our results, Makino, Nakashima, Minami, Moriyama, and Takao (1988) reported
a protein band protein at ~37 kDa from soybean that could interact with BS anions to modify
its secondary structure and bind to BS.
Figure 5.5B shows the SDS-PAGE related to the whole MYC digestions. In this case,
there is no evidence of the presence of resistant proteins, and the only bands that are
recognisable appeared to belong to trypsin (from ~21.5 to 3.5 kDa). This might be due to the
presence of the fungal cell walls (FCW) that could limit the release of the intracellular proteins
into the extracellular solution and, thus, not detected on the SDS-PAGE gel. This is supported
by the results in Chapter 3, which suggested that the FCW is permeable to proteases that can
diffuse into the cell and hydrolyse the intracellular proteins, leading to the release of small

Chapter 5. Mycoprotein Modulates In Vitro Lipid Digestion by Reducing Lipase Activity and Binding Bile
Salts
154 | P a g e
peptides or AA. Similarly, the diffusion of -amylase through the FCW was also discussed in
Chapter 4. The contribution of residual extracellular proteases from the fungal biomass of
MYC in protein hydrolysis was excluded. Indeed, the heating treatment for reducing the RNA
content (i.e., ˃ 68℃ followed by a quick increase to 90℃), and the subsequent centrifugation,
would have been sufficient for denaturing and removing most of the extracellular proteases.
Furthermore, pepsin was not detected in Figure 5.5B This may be explained by the
dilution (1:2) from the gastric to the intestinal step or by pepsin diffusion through the cell walls,
resulting in the depletion from solution. Alternatively, trypsin may have contributed by partially
digesting pepsin when incubated with MYC.
LC-MS/MS was used to investigate the EMP gel slices in the region of ~37 kDa
digested with trypsin (A in Table 5.1) and pepsin plus trypsin (B in Table 5.1). This analysis
addressed which proteins/peptides were resistant to trypsin digestion and responsible for the
BS binding. Proteins resistant to digestion could have preventive effects against
hypercholesterolemia (Kato & Iwami, 2002). Identifying these peptides could be crucial for
future investigation of their specific functionality, including BS binding activity, and can open
the way to other studies, including clinical trials for developing nutritional supplements with
blood-lipid lowering activity.

Chapter 5. Mycoprotein Modulates In Vitro Lipid Digestion by Reducing Lipase Activity and Binding Bile
Salts
155 | P a g e
Table 5.1. List of EMP quantified by LC-MS/MS and identified in the UniProt database from
Fusarium venenatum organism with molecular weight > 37 kDa. In the Table, A refers to EMP digested
with trypsin, B refers to EMP digested with pepsin + trypsin. Unpaired t-test with Welch’s correction
(two-tailed p-value < 0.05); No statistically significant differences found in the same protein between A
and B. Values represent the average ± SD of 3 replicates unless stated († n = 2).
N0
Accession
Number Protein
Molecul
ar
Weight
(kDa)
Average ± SD
Total Spectra
Protein from A
(wt%)
Average ± SD
Total Spectra
Protein from B
(wt%)
1 CEI63049 Uncharacterised
protein 38 0.034 ± 0.018 0.039 ± 0.006†
2 CEI70330 Uncharacterised
protein 39 0.022 ± 0.012 0.026 ± 0.010
3 CEI38487
AB hydrolase-1
domain-
containing
protein
40 0.039 ± 0.019 0.012 ± 0.003
4 CEI67957 Uncharacterised
protein 42 0.004 ± 0.001† 0.004 ± 0.001†
5 CEI66110 Uncharacterise
d protein 45 0.056 ± 0.037 0.010 ± 0.013
6 CEI65138 Uncharacterise
d protein 47 0.005 ± 0.005 0.009 ± 0.008
7 CEI66021
Peptidase_M1
4 domain
containing
protein
49 0.092 ± 0.042 0.081 ± 0.014
8 CEI61026 Elongation
factor 1-alpha 51 0.006 ± 0.003 0.008 ± 0.002
9 CEI63178 Uncharacterise
d protein 93 0.022 ± 0.013 0.022 ± 0.011
10 CEI64213 Uncharacterise
d protein 117 0.007 ± 0.006 0.009 ± 0.005
11 CEI64538
C2H2-type
domain-
containing
protein
125 0.017 ± 0.008†
0.018 ± 0.002
Table 5.1 shows a list of the 11 proteins that were identified from the SDS-PAGE gel
slices (Figure 5.7) with molecular weight > 37 kDa that could have been involved in the binding
of BS. The raw LC-MS/MS data reported a list of 104 proteins, by which 11 potential proteins

Chapter 5. Mycoprotein Modulates In Vitro Lipid Digestion by Reducing Lipase Activity and Binding Bile
Salts
156 | P a g e
were selected after screening and removal of proteins with molecular weight < 37 kDa, protein
contaminants, trypsin derived peptides, protein structures decoy, and proteins that failed to be
identified in at least 2 replicates. Proteins with the molecular weight of 38, 39, and 40 kDa can
match the molecular weight of ~37 kDa shown in the SDS-PAGE gel (Figure 5.5A). However,
proteins with a molecular weight > 40 kDa were also listed since high molecular weight proteins
may have been hydrolysed into smaller protein fractions at ~37 kDa during the extraction
protocol of the EMP from MYC by the manufacturer (information not available). Similarly,
the trypsin hydrolysis of EMP with high molecular weight (e.g., 97.4 kDa) could have produced
protein fractions in the region of ~37 kDa (see EMP STD in Figure 5.5A).
AB hydrolase-1 domain-containing protein (number 3 in Table 5.1), peptidase_M14
domain-containing protein (number 7 in Table 5.1), elongation factor 1-alpha (number 8 in
Table 5.1) and C2H2-type domain-containing protein (number 11 in Table 5.1) were name-
identified, whereas other proteins remain uncharacterised. However, none of the listed
proteins has been reported in the literature for their BS binding capacity. Hence, further
research is required to test the BS binding activity of the listed protein (Table 5.1).
5.3.2.3 Limiting Factors to the Bile Salts Binding by Mycoprotein
The results so far indicate that BS binding could be due to a combination of the cell
wall matrix effect and a contribution from MYC protein. As discussed before, the gastric-pH
effect was identified as the main factor that controlled the overall extent of BS binding (Figure
5.3B). Likewise, the proteolysis effect promoted by trypsin (Figure 5.3C and 5.4) released
protein with BS binding activity. However, these positive effects on BS binding promoted by
MYC were influenced by other variables during digestion.
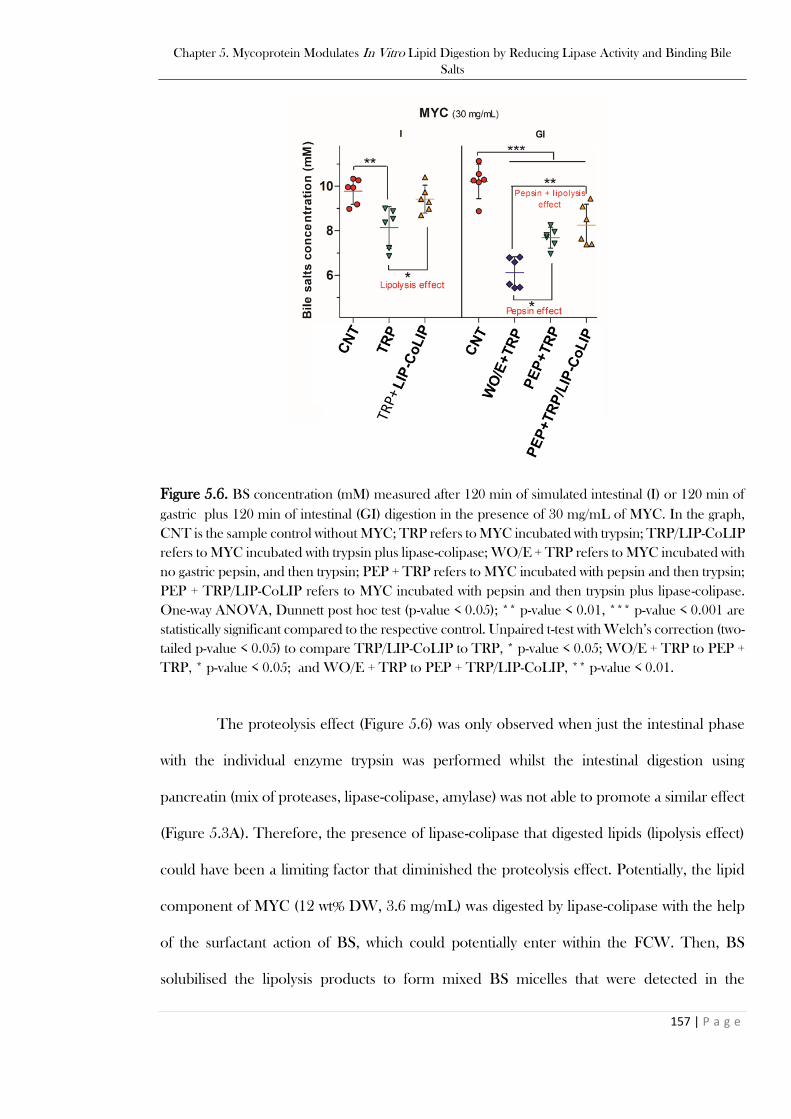
Chapter 5. Mycoprotein Modulates In Vitro Lipid Digestion by Reducing Lipase Activity and Binding Bile
Salts
157 | P a g e
Figure 5.6. BS concentration (mM) measured after 120 min of simulated intestinal (I) or 120 min of
gastric plus 120 min of intestinal (GI) digestion in the presence of 30 mg/mL of MYC. In the graph,
CNT is the sample control without MYC; TRP refers to MYC incubated with trypsin; TRP/LIP-CoLIP
refers to MYC incubated with trypsin plus lipase-colipase; WO/E + TRP refers to MYC incubated with
no gastric pepsin, and then trypsin; PEP + TRP refers to MYC incubated with pepsin and then trypsin;
PEP + TRP/LIP-CoLIP refers to MYC incubated with pepsin and then trypsin plus lipase-colipase.
One-way ANOVA, Dunnett post hoc test (p-value < 0.05); ** p-value < 0.01, *** p-value < 0.001 are
statistically significant compared to the respective control. Unpaired t-test with Welch’s correction (two-
tailed p-value < 0.05) to compare TRP/LIP-CoLIP to TRP, * p-value < 0.05; WO/E + TRP to PEP +
TRP, * p-value < 0.05; and WO/E + TRP to PEP + TRP/LIP-CoLIP, ** p-value < 0.01.
The proteolysis effect (Figure 5.6) was only observed when just the intestinal phase
with the individual enzyme trypsin was performed whilst the intestinal digestion using
pancreatin (mix of proteases, lipase-colipase, amylase) was not able to promote a similar effect
(Figure 5.3A). Therefore, the presence of lipase-colipase that digested lipids (lipolysis effect)
could have been a limiting factor that diminished the proteolysis effect. Potentially, the lipid
component of MYC (12 wt% DW, 3.6 mg/mL) was digested by lipase-colipase with the help
of the surfactant action of BS, which could potentially enter within the FCW. Then, BS
solubilised the lipolysis products to form mixed BS micelles that were detected in the
TRP+

Chapter 5. Mycoprotein Modulates In Vitro Lipid Digestion by Reducing Lipase Activity and Binding Bile
Salts
158 | P a g e
supernatant regardless of the proteolysis effect promoted by trypsin. This hypothesis was tested
and supported by the results from just the intestinal digestion of MYC (30 mg/mL) in the
presence of trypsin plus lipase-colipase (TRP/LIP-CoLIP). Figure 5.6 illustrates a reversal of
the proteolysis effect when lipolysis took place (i.e., the presence of lipase and colipase),
similar to what was observed using pancreatin (Figure 5.3A).
Furthermore, Figure 5.6 shows the negative effect of pepsin on BS binding (pepsin
effect). Pepsin plus trypsin (PEP + TRP) digestion in MYC (30 mg/mL) significantly reduced
(p-value < 0.05) the BS binding compared to the gastric step without enzyme (WO/E) that was
followed by trypsin digestion (WO/E + TRP). Besides, the BS binding effect was further
decreased (p-value < 0.01) by the combination of the pepsin and lipolysis effects (PEP +
TRP/LIP-CoLIP), both confirming the negative impact on BS binding
Therefore, in summary, pepsin and lipase digestion can hinder the BS binding that is
mainly promoted from the MYC structure/cell wall component (Figure 5.3A), as evidenced
by the effect of pH change in the absence of digestive enzymes (Figure 5.3B), and also by the
protein component, as evidenced by the role of the digestive proteases on EMP (Figure 5.3C
and 5.4).
5.3.3 Effect of Digestion Conditions on Viscosity and Particle Size of
Mycoprotein
The viscosity of soluble DF during digestion has been linked with reductions in lipid
digestion and absorption. However, in this case, Fig 5.7A shows that viscosity may not play an
essential role in the BS binding promoted by MYC as the WO/E samples provided the highest
viscosity, yet the intestinal alone WO/E sample had no significant BS binding activity (Figure
5.3A). The particle size of MYC after different in vitro digestion conditions did not impact
viscosity (Figure 5.7B).
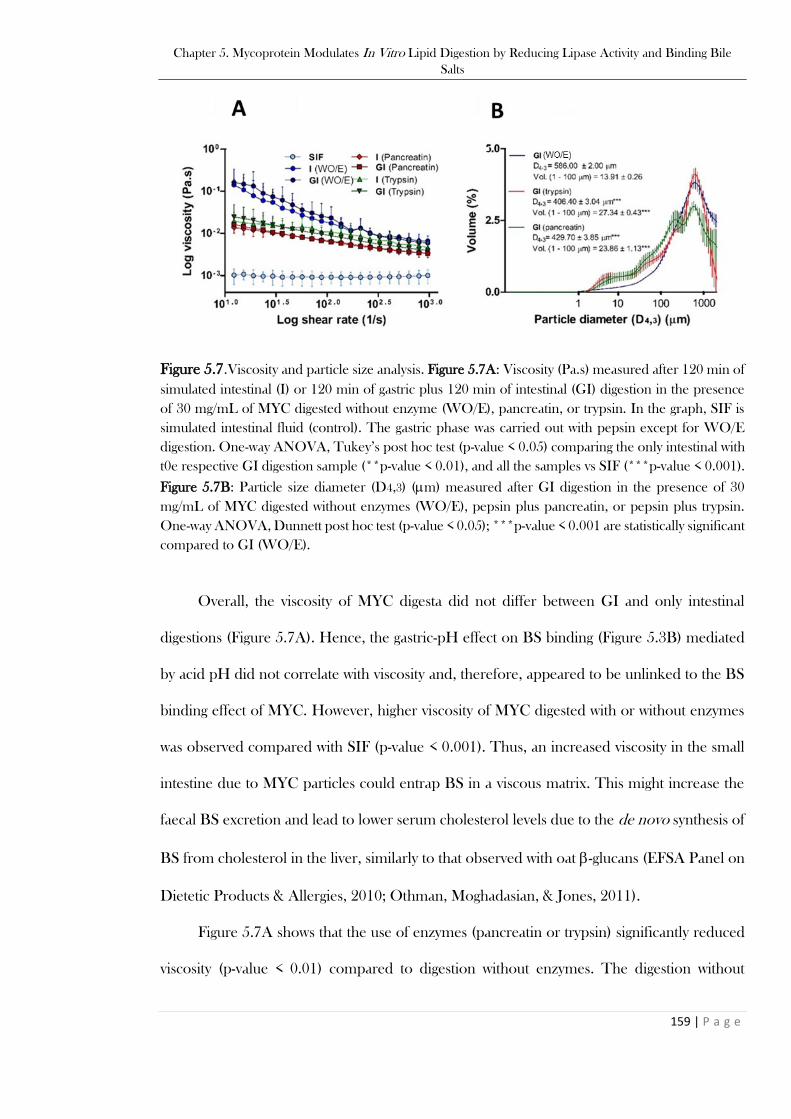
Chapter 5. Mycoprotein Modulates In Vitro Lipid Digestion by Reducing Lipase Activity and Binding Bile
Salts
159 | P a g e
Figure 5.7.Viscosity and particle size analysis. Figure 5.7A: Viscosity (Pa.s) measured after 120 min of
simulated intestinal (I) or 120 min of gastric plus 120 min of intestinal (GI) digestion in the presence
of 30 mg/mL of MYC digested without enzyme (WO/E), pancreatin, or trypsin. In the graph, SIF is
simulated intestinal fluid (control). The gastric phase was carried out with pepsin except for WO/E
digestion. One-way ANOVA, Tukey’s post hoc test (p-value < 0.05) comparing the only intestinal with
t0e respective GI digestion sample (**p-value < 0.01), and all the samples vs SIF (***p-value < 0.001).
Figure 5.7B: Particle size diameter (D4,3) (m) measured after GI digestion in the presence of 30
mg/mL of MYC digested without enzymes (WO/E), pepsin plus pancreatin, or pepsin plus trypsin.
One-way ANOVA, Dunnett post hoc test (p-value < 0.05); ***p-value < 0.001 are statistically significant
compared to GI (WO/E).
Overall, the viscosity of MYC digesta did not differ between GI and only intestinal
digestions (Figure 5.7A). Hence, the gastric-pH effect on BS binding (Figure 5.3B) mediated
by acid pH did not correlate with viscosity and, therefore, appeared to be unlinked to the BS
binding effect of MYC. However, higher viscosity of MYC digested with or without enzymes
was observed compared with SIF (p-value < 0.001). Thus, an increased viscosity in the small
intestine due to MYC particles could entrap BS in a viscous matrix. This might increase the
faecal BS excretion and lead to lower serum cholesterol levels due to the de novo synthesis of
BS from cholesterol in the liver, similarly to that observed with oat -glucans (EFSA Panel on
Dietetic Products & Allergies, 2010; Othman, Moghadasian, & Jones, 2011).
Figure 5.7A shows that the use of enzymes (pancreatin or trypsin) significantly reduced
viscosity (p-value < 0.01) compared to digestion without enzymes. The digestion without
Chapter 5. Mycoprotein Modulates In Vitro Lipid Digestion by Reducing Lipase Activity and Binding Bile
Salts
160 | P a g e
enzyme had a higher viscosity at low shear that decreased with the increase of the shear rate.
This can be explained by the presence of elongated particles (MYC filamentous cells) that
have a more shear-thinning effect and higher viscosity at low shear rates compared to spherical
particles (Panalytical, Accessed 06/02/2020). Figure 5.7B shows an overall decrease in particle
size from in the intestinal digestion with trypsin (D4,3: 406.40 ± 0.34 m) or pancreatin (D4,3:
429.70 ± 3.85 m), which was statistically significant (p-value < 0.001) compared to the
incubation without enzymes (WO/E) (D4,3: 586.00 ± 2.00 m). The reduction of particle size
is usually associated with increased viscosity (Panalytical, Accessed 06/02/2020). However, this
assumes the total dispersed phase volume is the same, and the properties of the particles are
all identical. Therefore, the reduced viscosity in the presence of enzymes in Figure 5.7A
suggests that either the dispersed phase volume is reduced, or the properties of the particles
are different following digestion. It has been previously described that digestion removes
protein and carbohydrates from the fungal cells (Chapter 3 and 4). Thus, it could be assumed
that the properties of the cells, such as deformability and size, may have changed, affecting the
contribution of the hyphal cells to the viscosity. The increased polydispersity of particles,
promoted by enzyme digestion, may also reduce the viscosity (Panalytical, Accessed
06/02/2020). For instance, Figure 5.7B shows a significant increase (p-value < 0.001) in the
volume of small particles in the region of 1-100 m in both trypsin and pancreatin digestion
that was higher compared to the digestion without enzyme.
5.4 Conclusions
This study aimed to identify possible mechanisms by which the complex cellular structure
of MYC influences lipid digestion. Evidence of MYC reducing lipolysis and BS binding was
provided. The reduction of lipolysis appeared to be mediated by direct interference of the
Chapter 5. Mycoprotein Modulates In Vitro Lipid Digestion by Reducing Lipase Activity and Binding Bile
Salts
161 | P a g e
MYC matrix with lipase. At the same time, the binding of BS was promoted both by the impact
of pH changes on the MYC cell wall structure and by protein activated by trypsin hydrolysis.
However, the protein-mediated binding was nullified following complete enzymatic digestion.
Moreover, viscosity during simulated GI digestion appeared to be unlinked with the BS
binding capacity of MYC. These findings can help the understanding of the complex
interaction of macronutrients such as DF and protein with digestive components (e.g., enzymes
and BS) that subsequently may influence physiological pathways (e.g., de novo cholesterol
synthesis). Therefore, this contributes to a new understanding of the mechanisms by which
diets enriched in MYC improve blood lipid profiles.
Chapter 6. Beta-Glucans Release from Mycoprotein Cell Walls During In Vitro Gastrointestinal Digestion
162 | P a g e
Chapter 6
Beta-Glucans Release from Mycoprotein Cell
Walls During In Vitro Gastrointestinal Digestion†
† This chapter is based on the published peer-reviewed manuscript Colosimo et al. (2021),
Journal of Functional Foods, 104543.
Chapter 6. Beta-Glucans Release from Mycoprotein Cell Walls During In Vitro Gastrointestinal Digestion
163 | P a g e
6.1 Introduction
-glucans are polysaccharides composed of D-glucose units linked by -glycosidic bonds
found in the cell wall of plants, fungi, and bacteria. The glycosidic bonds of -glucans vary
between the kingdoms of life. In plants, they mainly consist of -- -- linkages,
whereas the bonds in fungi are -- and -- (Zhu, Du, & Xu, 2016). -glucans are
considered a soluble dietary fibre (DF) (Wood, 2007) because of the inability of human
enzymes to hydrolyse the -linkages within the polysaccharidic chains (Lam & Cheung, 2013).
Despite being considered non-digestible in the upper gastrointestinal (GI) tract, -glucans
play a role in modulating digestion and promoting human health. For instance, -glucans can
reduce lipid digestion (Grundy et al., 2017), lowering the risk of cardiovascular diseases
(CVD). Also, β-glucans have been shown to reduce the post-prandial glycaemic response in
people with type-2 diabetes (T2D) (Bozbulut & Sanlier, 2019). In addition, -glucans can
modulate the physicochemical behaviour of the contents of the GI tract (GIT). It has been
observed that -glucans increased the viscosity in the GIT (Mäkelä, Brinck, & Sontag-Strohm,
2020) and can reach the large intestine largely intact, where fermentation by resident
microbiota occurs (Lam & Cheung, 2013; Lam, Keung, Ko, Kwan, & Cheung, 2018).
Furthermore, -glucans can dynamically interact with other digestive components such as
bile salts (BS) (Gunness, Flanagan, & Gidley, 2010; Gunness, Flanagan, Mata, Gilbert, &
Gidley, 2016; Mikkelsen et al., 2014). This interaction can potentially alter the cell wall
organisation and enhance the release of -glucans from the matrix. Moreover, the interaction
of -glucans with BS can result in the entrapment or sequestration of the BS micelles that can
reduce blood lipids (Queenan et al., 2007).
The release of -glucans from plant-based foods has been investigated over the years
(Grundy, Fardet, Tosh, Rich, & Wilde, 2018; Robertson, Majsak-Newman, & Ring, 1997;

Chapter 6. Beta-Glucans Release from Mycoprotein Cell Walls During In Vitro Gastrointestinal Digestion
164 | P a g e
Ulmius, Adapa, Önning, & Nilsson, 2012; Ulmius, Johansson‐Persson, Nordén, Bergenståhl,
& Önning, 2011). However, fungal-based foods have not received the same attention in this
regard. Moreover, differences in the linkages of -glucans and organisation of the cell walls
between plants and fungi may result in different -glucan release behaviour in the GIT. Thus,
this chapter hypothesises that the release of -glucans from the fungal cell wall (FCW) would
be absent or lower than that observed in the plant cell wall (PCW) due to the difference in the
origin and structural organisation. To test this hypothesis, the release of -glucans was
investigated from two fungal samples of different origins, white button mushroom (WBM) as
the external fruiting body of fungi and the filamentous fungal cells mycoprotein (MYC). The
fungal samples were then compared with two plant samples, oat bran (OAT) and barley bran
(BAR). Understanding if -glucans are released from MYC in the upper GIT may suggest
potential mechanisms of how MYC can protect from T2D and CVD. Indeed, -glucans can
promote protective effects towards T2D (Andrade & Orlando, 2018) and CVD (Grundy,
Fardet, Tosh, Rich, & Wilde, 2018) or potentially be readily available for colonic fermentation
and production of short-chain fatty acids (SCFA).
The -glucan release from uncooked and cooked samples was assessed before and after
simulated GI digestion. Furthermore, the total carbohydrate and protein released from the
food matrix after simulated GI digestion was determined. The viscosity of the supernatant was
also measured to test the hypothesis that -glucan release would correlate with an increase in
viscosity. The structural changes in the food matrix were further investigated by scanning
electron microscopy (SEM).
Chapter 6. Beta-Glucans Release from Mycoprotein Cell Walls During In Vitro Gastrointestinal Digestion
165 | P a g e
6.2 Materials & Methods
6.2.1 Materials
6.2.1.1 Chemicals and Reagents
The specific reagents or kits used in this chapter are specified below, while the
common materials to other chapters are listed in Chapter 2, Section 2.1.1.
The kits to measure the total β-glucan content were purchased from Megazyme Ltd,
Ireland. Mushroom and yeast -β-glucan assay kit (Catalogue No. K-YBGL 11/19) was used for
MYC and WBM, whereas β-Glucan Assay Kit (Mixed Linkage) (Catalogue No. K-BGLU
08/18) was used for OAT and BAR. Sticky carbon SEM tab (Catalogue No. AGG3347N) and
aluminium SEM stub (Catalogue No. AGG301P) used for SEM microscopy were purchased
from Agar Scientific, UK.
6.2.1.2 Mycoprotein and Control Samples
The fungal samples used in this chapter were MYC (Fusarium venenatum) provided
by Marlow Foods Ltd, UK, and WBM (Agaricus bisporus), purchased fresh/chilled from a
local store in the UK. The plant controls were OAT (Avena sativa) (White’s oats, medium
cut, UK), purchased from a local store and BAR (Hordeum vulgare) (Barley Balance®), which
was purchased from PolyCell Technologies, USA. Table 6.1 shows the protein and
carbohydrate profile from the samples mentioned above before digestion.
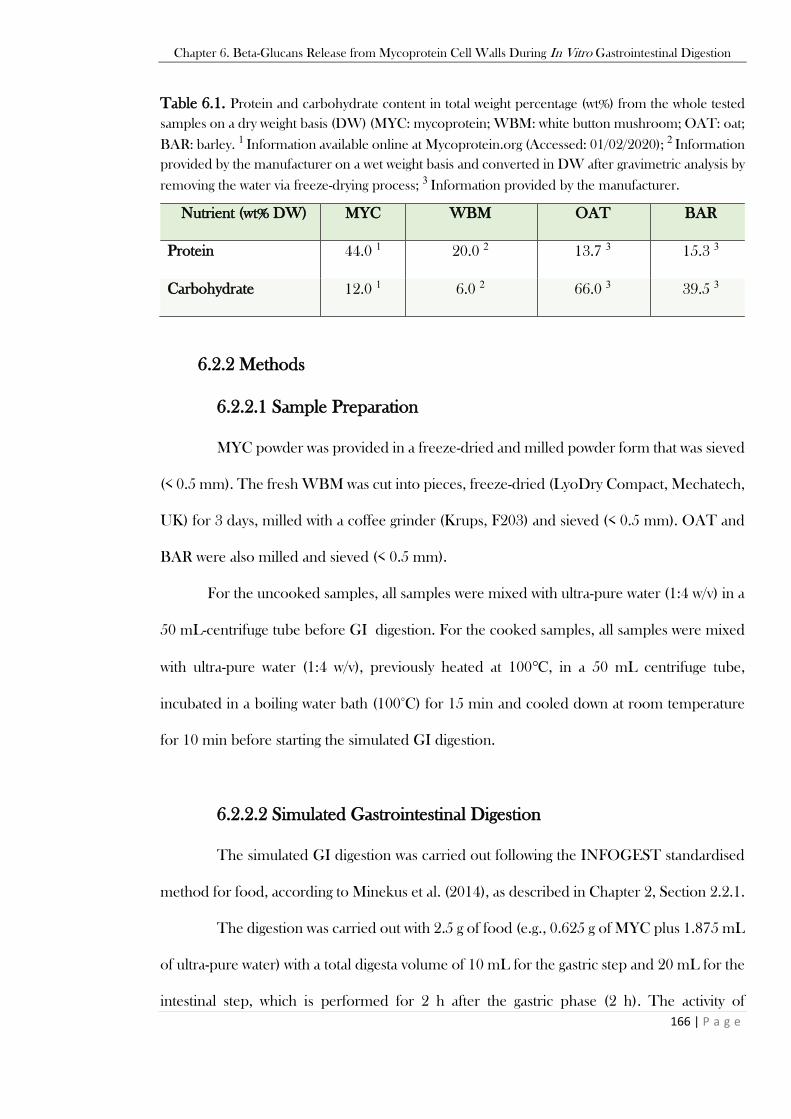
Chapter 6. Beta-Glucans Release from Mycoprotein Cell Walls During In Vitro Gastrointestinal Digestion
166 | P a g e
Table 6.1. Protein and carbohydrate content in total weight percentage (wt%) from the whole tested
samples on a dry weight basis (DW) (MYC: mycoprotein; WBM: white button mushroom; OAT: oat;
BAR: barley. 1 Information available online at Mycoprotein.org (Accessed: 01/02/2020); 2 Information
provided by the manufacturer on a wet weight basis and converted in DW after gravimetric analysis by
removing the water via freeze-drying process; 3 Information provided by the manufacturer.
Nutrient (wt% DW) MYC WBM OAT BAR
Protein 44.0 1 20.0 2 13.7 3 15.3 3
Carbohydrate 12.0 1 6.0 2 66.0 3 39.5 3
6.2.2 Methods
6.2.2.1 Sample Preparation
MYC powder was provided in a freeze-dried and milled powder form that was sieved
(< 0.5 mm). The fresh WBM was cut into pieces, freeze-dried (LyoDry Compact, Mechatech,
UK) for 3 days, milled with a coffee grinder (Krups, F203) and sieved (< 0.5 mm). OAT and
BAR were also milled and sieved (< 0.5 mm).
For the uncooked samples, all samples were mixed with ultra-pure water (1:4 w/v) in a
50 mL-centrifuge tube before GI digestion. For the cooked samples, all samples were mixed
with ultra-pure water (1:4 w/v), previously heated at 100℃, in a 50 mL centrifuge tube,
incubated in a boiling water bath (100°C) for 15 min and cooled down at room temperature
for 10 min before starting the simulated GI digestion.
6.2.2.2 Simulated Gastrointestinal Digestion
The simulated GI digestion was carried out following the INFOGEST standardised
method for food, according to Minekus et al. (2014), as described in Chapter 2, Section 2.2.1.
The digestion was carried out with 2.5 g of food (e.g., 0.625 g of MYC plus 1.875 mL
of ultra-pure water) with a total digesta volume of 10 mL for the gastric step and 20 mL for the
intestinal step, which is performed for 2 h after the gastric phase (2 h). The activity of

Chapter 6. Beta-Glucans Release from Mycoprotein Cell Walls During In Vitro Gastrointestinal Digestion
167 | P a g e
pancreatin was based on trypsin activity (100 TAME final activity). After digestion, samples
were centrifuged at 2,800 xg (Heraeus Megafuge 16 centrifuge, Germany) for 10 min at room
temperature. The supernatant was immediately used for rheology or stored at -20℃ for the
analysis of proteins and reducing sugars released during digestion. The remaining pellet was
washed 3 times with ultra-pure water, freeze-dried (LyoDry Compact, Mechatech, UK) for 3
days, and then used for the -glucans analysis.
6.2.2.3 Total Beta-Glucans Analysis
The -glucan content was determined in the samples before digestion to determine
the initial value of -glucans (Table 6.1) and in pellet fraction from the gastric and intestinal in
vitro digestion as described before (Section 6.2.2.2). The analysis also included the control
digestion of each sample (i.e., without enzymes and BS). Total -glucans were measured on
each sample before and after simulated digestion according to the manufacturer instructions.
The manufacturer instructions are described in the following “Mushroom and Yeast Beta-
Assay Kit” section for MYC and WBM, while the “-Glucan Assay Kit (Mixed Linkage)”
section is for OAT and BAR.
Mushroom and Yeast Beta-Assay Kit
For the Mushroom and Yeast Beta-Assay Kit (K-YBGL 11/19), 90 mg of sample
was added to a glass tube before adding 2 mL of 12 M H2SO4. The tubes were capped and
stirred on a vortex mixer before being placed in an ice-water bath for 2 h. Over this time, the
tubes were stirred for 15 s every 15 min. Then, 4 mL of ultra-pure water was added to each
tube and stirred on a vortex mixer for 10 s before adding 6 mL of ultra-pure water and stirring
the contents for a further 10 s. The caps were then loosened, and the tubes were placed in a
Chapter 6. Beta-Glucans Release from Mycoprotein Cell Walls During In Vitro Gastrointestinal Digestion
168 | P a g e
boiling water bath (100°C). After 5 min, the caps were tightened to continue the incubation.
After 2 h, the tubes were cooled at room temperature, and the content of each tube was
transferred to a 100 mL volumetric flask. Then, 6 mL of 8.0 M NaOH solution was added to
the volumetric flask, and the volume was adjusted with 200 mM sodium acetate buffer at pH
4.5. Aliquots of 1 mL were collected in tubes and centrifuged at 13,000 xg for 5 min. Then,
0.1 mL (in duplicate) was mixed with 0.1 mL of a mixture of exo-1,3-β-glucanase (20 U/mL)
plus β-glucosidase (4 U/mL) in 200 mM sodium acetate buffer at pH 4.5. The tube contents
were stirred on a vortex and incubated at 40°C for 60 min. GOPOD Reagent (3 mL) was
added to each tube and incubated at 40°C for 20 min. Finally, the absorbance of all solutions
was measured at 510 nm against the reagent blank using a UV/Vis spectrophotometer Libra
S50 (Biochrom, US).
Beta-Glucan Assay Kit (Mixed Linkage)
For the -Glucan Assay Kit (Mixed Linkage) (K-BGLU 08/18), 90 mg of sample
was mixed with 0.2 mL of aqueous ethanol (50% v/v) to aid dispersion. Sodium phosphate
buffer was added (4.0 mL, 20 mM, pH 6.5), and the content of each tube was stirred on a
vortex mixer. The tubes were placed in a boiling water bath (100°C), incubated for 60 s, stirred
on a vortex mixer and incubated again at 100°C for 2 min. Then, the tubes were incubated at
50°C for 5 min before adding lichenase (0.2 mL, 10 U), stirring the tube contents, and
incubating for 1 h with regular stirring (i.e., every 10 min) on a vortex mixer. Sodium acetate
buffer (5.0 mL, 200 mM, pH 4.0) was added and mixed with the content of the tubes. Aliquots
of 1 mL were centrifuged (1,000 xg, 10 min), and 0.1 mL of supernatant was transferred into
the bottom of 3 test tubes (12 mL capacity). -glucosidase (0.1 mL, 0.2 U) in 50 mM sodium
acetate buffer (pH 4.0) was added to two of these tubes (the reaction), whereas the third tube
(the reaction blank) was mixed with 50 mM acetate buffer (0.1 mL, pH 4.0). All the tubes were
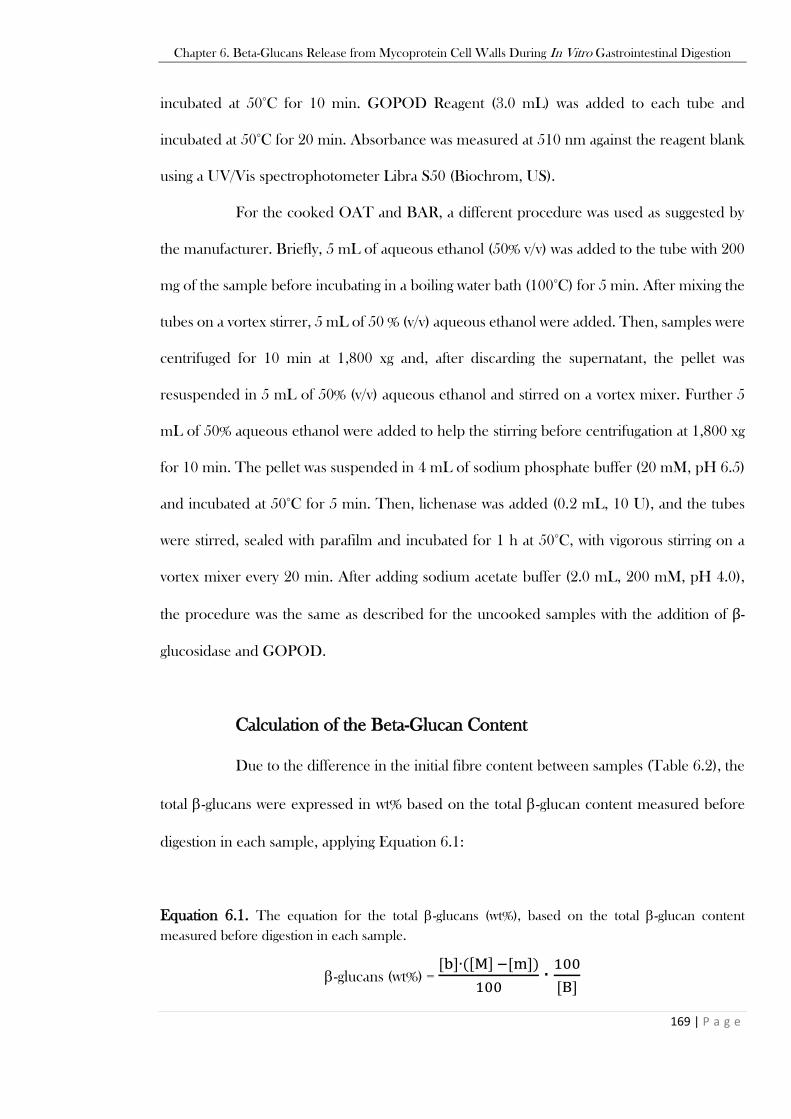
Chapter 6. Beta-Glucans Release from Mycoprotein Cell Walls During In Vitro Gastrointestinal Digestion
169 | P a g e
incubated at 50°C for 10 min. GOPOD Reagent (3.0 mL) was added to each tube and
incubated at 50°C for 20 min. Absorbance was measured at 510 nm against the reagent blank
using a UV/Vis spectrophotometer Libra S50 (Biochrom, US).
For the cooked OAT and BAR, a different procedure was used as suggested by
the manufacturer. Briefly, 5 mL of aqueous ethanol (50% v/v) was added to the tube with 200
mg of the sample before incubating in a boiling water bath (100°C) for 5 min. After mixing the
tubes on a vortex stirrer, 5 mL of 50 % (v/v) aqueous ethanol were added. Then, samples were
centrifuged for 10 min at 1,800 xg and, after discarding the supernatant, the pellet was
resuspended in 5 mL of 50% (v/v) aqueous ethanol and stirred on a vortex mixer. Further 5
mL of 50% aqueous ethanol were added to help the stirring before centrifugation at 1,800 xg
for 10 min. The pellet was suspended in 4 mL of sodium phosphate buffer (20 mM, pH 6.5)
and incubated at 50°C for 5 min. Then, lichenase was added (0.2 mL, 10 U), and the tubes
were stirred, sealed with parafilm and incubated for 1 h at 50°C, with vigorous stirring on a
vortex mixer every 20 min. After adding sodium acetate buffer (2.0 mL, 200 mM, pH 4.0),
the procedure was the same as described for the uncooked samples with the addition of β-
glucosidase and GOPOD.
Calculation of the Beta-Glucan Content
Due to the difference in the initial fibre content between samples (Table 6.2), the
total -glucans were expressed in wt% based on the total -glucan content measured before
digestion in each sample, applying Equation 6.1:
Equation 6.1. The equation for the total -glucans (wt%), based on the total -glucan content
measured before digestion in each sample.
-glucans (wt%) = [b]∙([M] −[m])
100∙
100
[B]

Chapter 6. Beta-Glucans Release from Mycoprotein Cell Walls During In Vitro Gastrointestinal Digestion
170 | P a g e
Where [b] is the -glucan (mg) content measured in the sample after the simulated
GI digestion, [M] is the sample mass (mg) recovered after the simulated digestion, [m] is the
isolated pancreatin and bile mass (mg) recovered after control digestion without sample, [B] is
the -glucan (mg) content measured in the sample before the simulated GI digestion.
6.2.2.4 Protein and Reducing Sugar Analysis
The total protein content released after GI digestion was determined using the
bicinchoninic acid assay (BCA) assay according to Smith et al. (1985), as described in Chapter
2, Section 2.2.3.1.
The total content of reducing sugars released after GI digestion was determined
using p-Hydroxybenzoic Acid Hydrazide (PAHBAH) assay according to the colourimetric
method described by Lever (1972) (Chapter 2, Section 2.2.4.1).
6.2.2.5 Viscosity Analysis
The viscosity of the supernatant of both uncooked and cooked samples (MYC,
WBM, OAT, BAR) was measured after gastric and intestinal steps. A controlled stress
rheometer Advanced AR-2000 (TA instruments, UK) was used with a 60 mm 1-degree acrylic
cone, 22 m truncation, and cone angle 0:59:21 (deg:min:sec). The protocol consisted of a 30
s conditioning step and a continuous ramp step from a shear rate of 10 to 1,000 1/s on a log
scale for 2 min, 10 points per decade. The protocol was performed at 37°C, and the viscosity
values were considered at a shear rate of 15 1/s
since a small shearing force may occur in the
GIT (Naumann, Schweiggert-Weisz, Bader-Mittermaier, Haller, & Eisner, 2018). The
software used was Rheology Advantage Instrument Control AR V5.8.2, UK.
Chapter 6. Beta-Glucans Release from Mycoprotein Cell Walls During In Vitro Gastrointestinal Digestion
171 | P a g e
6.2.2.6 Structural Analysis by SEM Microscopy
Dr Kathryn Cross performed the SEM experiments at the John Innes Centre, UK.
Briefly, small amounts of the cooked and uncooked fungal and plant samples (freeze-dried
powders) before and after intestinal digestion were applied to a sticky carbon SEM tab, which
was adhered to an aluminium SEM stub. The samples were mixed beforehand to ensure the
imaged sample contained all size ranges of particles. Excess particles that were not attached
were removed from the sticky tabs, and the samples were coated with gold in an Agar Scientific
high-resolution sputter-coater apparatus. SEM was carried out using a Zeiss Supra 55 VP FEG
SEM (Carl Zeiss AG, Germany), operating at 3 keV.
6.2.2.7 Data Analysis
Data were analysed by GraphPad Prism version 5 for Windows (GraphPad Software,
USA), statistical significance was set at p-value < 0.05. Values were expressed as average ±
standard deviation (SD) of three independent measures (n = 3). The post-hoc analysis is
specified in the description of the corresponding figure where applicable.
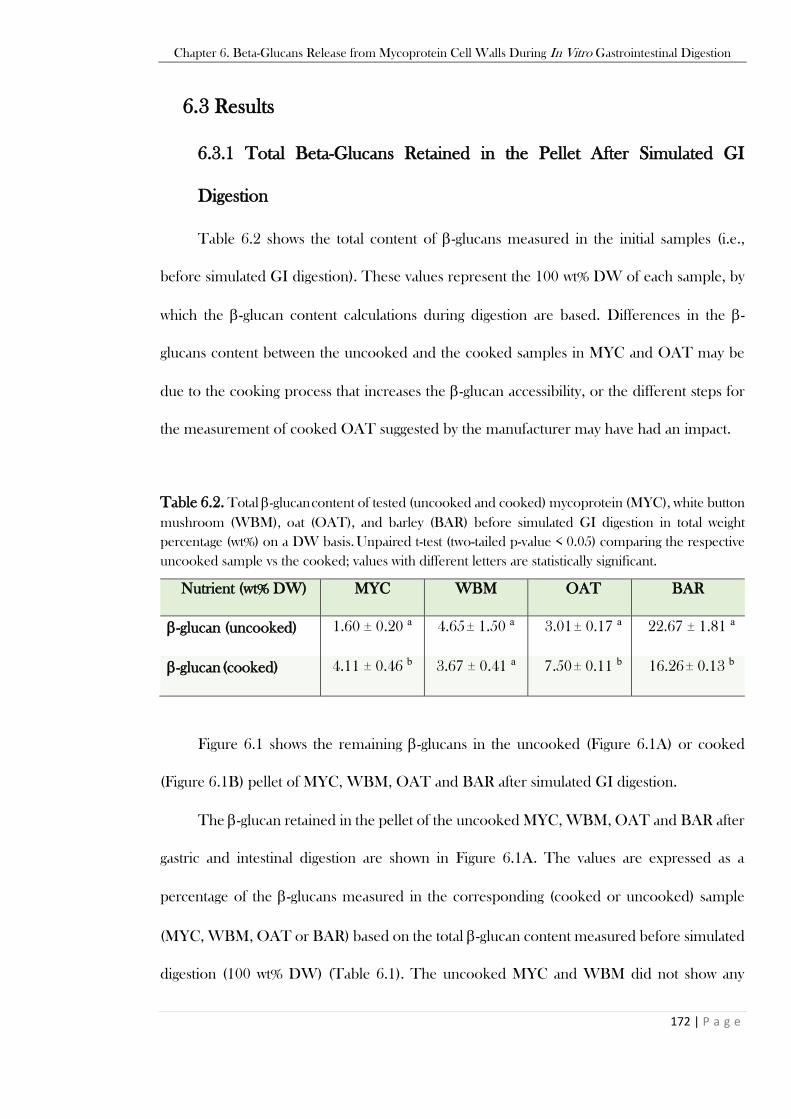
Chapter 6. Beta-Glucans Release from Mycoprotein Cell Walls During In Vitro Gastrointestinal Digestion
172 | P a g e
6.3 Results
6.3.1 Total Beta-Glucans Retained in the Pellet After Simulated GI
Digestion
Table 6.2 shows the total content of -glucans measured in the initial samples (i.e.,
before simulated GI digestion). These values represent the 100 wt% DW of each sample, by
which the -glucan content calculations during digestion are based. Differences in the -
glucans content between the uncooked and the cooked samples in MYC and OAT may be
due to the cooking process that increases the -glucan accessibility, or the different steps for
the measurement of cooked OAT suggested by the manufacturer may have had an impact.
Table 6.2. Total -glucan
content of tested (uncooked and cooked) mycoprotein (MYC), white button
mushroom (WBM), oat (OAT), and barley (BAR) before simulated GI digestion in total weight
percentage (wt%) on a DW basis.
Unpaired t-test (two-tailed p-value < 0.05) comparing the respective
uncooked sample vs the cooked; values with different letters are statistically significant.
Nutrient (wt% DW) MYC WBM OAT BAR
-glucan (uncooked)
1.60 ± 0.20 a 4.65
± 1.50 a 3.01
± 0.17 a 22.67 ± 1.81 a
-glucan
(cooked) 4.11 ± 0.46 b 3.67 ± 0.41 a 7.50
± 0.11 b 16.26
± 0.13 b
Figure 6.1 shows the remaining -glucans in the uncooked (Figure 6.1A) or cooked
(Figure 6.1B) pellet of MYC, WBM, OAT and BAR after simulated GI digestion.
The -glucan retained in the pellet of the uncooked MYC, WBM, OAT and BAR after
gastric and intestinal digestion are shown in Figure 6.1A. The values are expressed as a
percentage of the -glucans measured in the corresponding (cooked or uncooked) sample
(MYC, WBM, OAT or BAR) based on the total -glucan content measured before simulated
digestion (100 wt% DW) (Table 6.1). The uncooked MYC and WBM did not show any
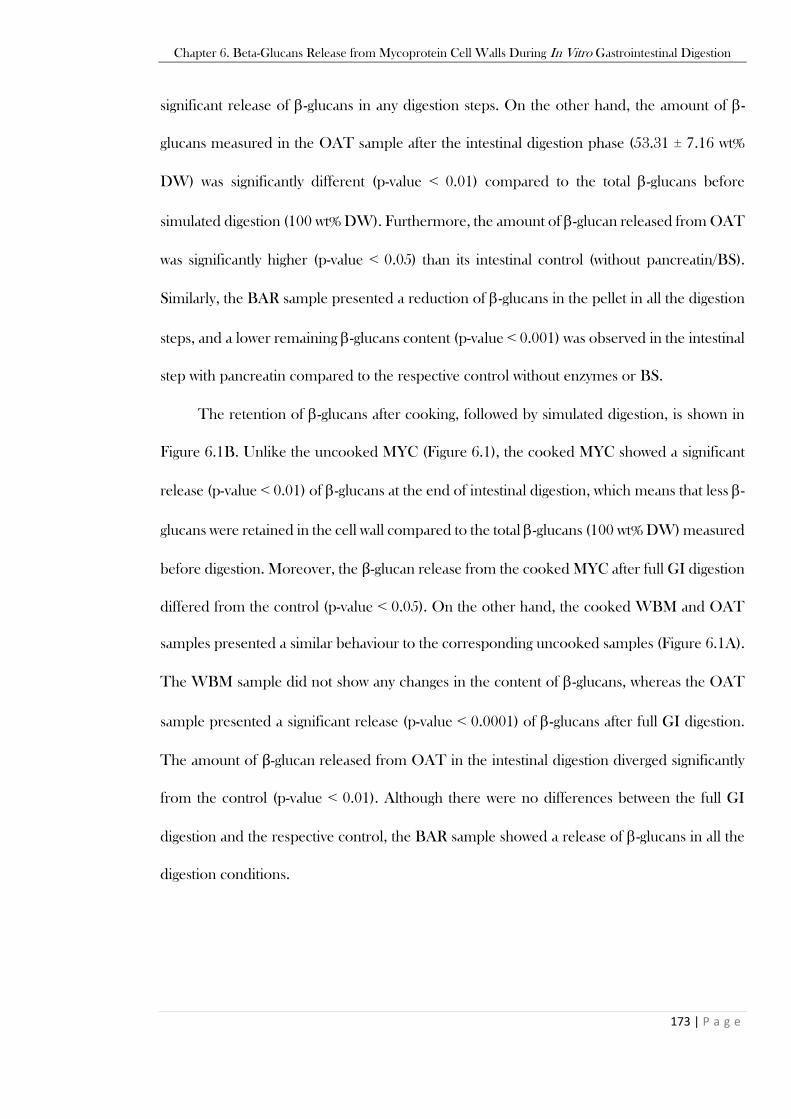
Chapter 6. Beta-Glucans Release from Mycoprotein Cell Walls During In Vitro Gastrointestinal Digestion
173 | P a g e
significant release of -glucans in any digestion steps. On the other hand, the amount of -
glucans measured in the OAT sample after the intestinal digestion phase (53.31 ± 7.16 wt%
DW) was significantly different (p-value ˂ 0.01) compared to the total -glucans before
simulated digestion (100 wt% DW). Furthermore, the amount of -glucan released from OAT
was significantly higher (p-value ˂ 0.05) than its intestinal control (without pancreatin/BS).
Similarly, the BAR sample presented a reduction of -glucans in the pellet in all the digestion
steps, and a lower remaining -glucans content (p-value ˂ 0.001) was observed in the intestinal
step with pancreatin compared to the respective control without enzymes or BS.
The retention of -glucans after cooking, followed by simulated digestion, is shown in
Figure 6.1B. Unlike the uncooked MYC (Figure 6.1), the cooked MYC showed a significant
release (p-value ˂ 0.01) of -glucans at the end of intestinal digestion, which means that less -
glucans were retained in the cell wall compared to the total -glucans (100 wt% DW) measured
before digestion. Moreover, the β-glucan release from the cooked MYC after full GI digestion
differed from the control (p-value ˂ 0.05). On the other hand, the cooked WBM and OAT
samples presented a similar behaviour to the corresponding uncooked samples (Figure 6.1A).
The WBM sample did not show any changes in the content of -glucans, whereas the OAT
sample presented a significant release (p-value ˂ 0.0001) of -glucans after full GI digestion.
The amount of β-glucan released from OAT in the intestinal digestion diverged significantly
from the control (p-value ˂ 0.01). Although there were no differences between the full GI
digestion and the respective control, the BAR sample showed a release of -glucans in all the
digestion conditions.

Chapter 6. Beta-Glucans Release from Mycoprotein Cell Walls During In Vitro Gastrointestinal Digestion
174 | P a g e
Figure 6.1. Total -glucans measured in the pellet of uncooked (Figure 6.1A) and cooked (Figure
6.1B) MYC, WBM, OAT, and BAR after simulated digestion steps. : control gastric step (without
pepsin); : gastric step (with pepsin); : control intestinal step (without pancreatin/BS); : intestinal
step (with pancreatin and BS). Unpaired t-test (two-tailed p-value < 0.05); ****p-value < 0.0001, ***p-
value < 0.001, **p-value < 0.01, *p-value < 0.05 are statistically significant compared to the total -
glucans (100wt% DW) measured in the corresponding sample (MYC, WBM, OAT or BAR) before
simulated digestion; values within the same sample type annotated with different letters are statistically
significant (unpaired t-test, two-tailed, p-value < 0.05).
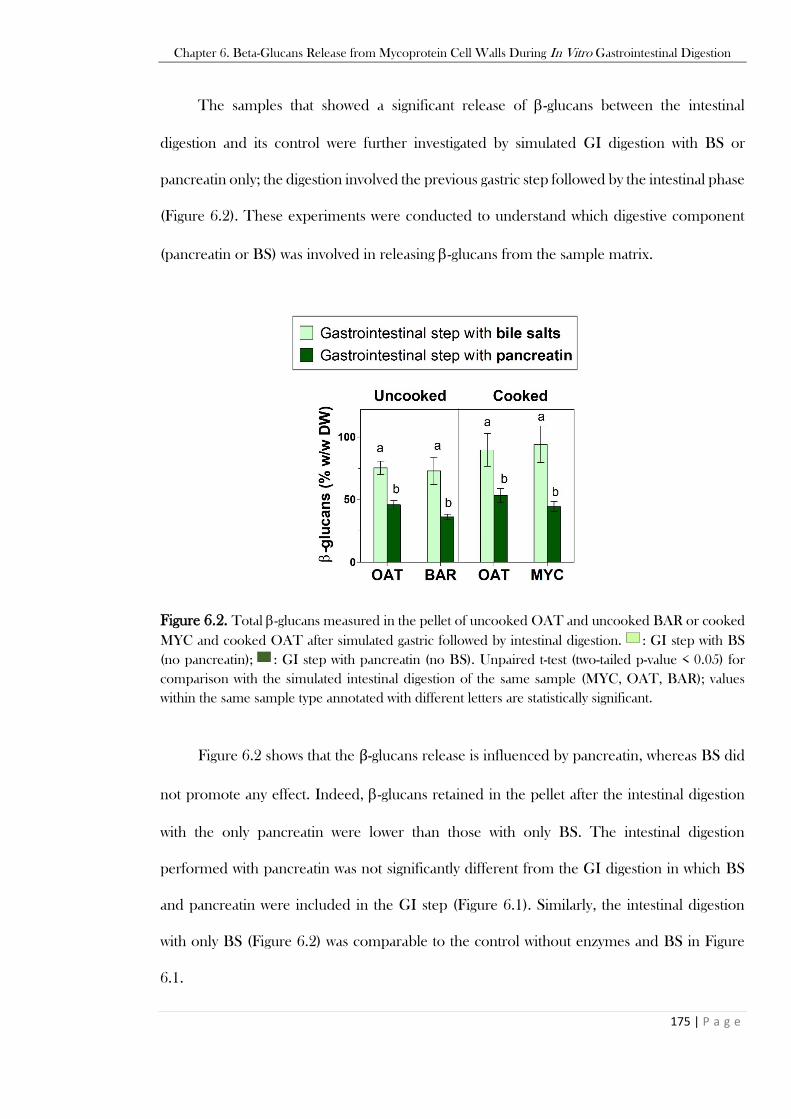
Chapter 6. Beta-Glucans Release from Mycoprotein Cell Walls During In Vitro Gastrointestinal Digestion
175 | P a g e
The samples that showed a significant release of -glucans between the intestinal
digestion and its control were further investigated by simulated GI digestion with BS or
pancreatin only; the digestion involved the previous gastric step followed by the intestinal phase
(Figure 6.2). These experiments were conducted to understand which digestive component
(pancreatin or BS) was involved in releasing -glucans from the sample matrix.
Figure 6.2. Total -glucans measured in the pellet of uncooked OAT and uncooked BAR or cooked
MYC and cooked OAT after simulated gastric followed by intestinal digestion. : GI step with BS
(no pancreatin); : GI step with pancreatin (no BS). Unpaired t-test (two-tailed p-value < 0.05) for
comparison with the simulated intestinal digestion of the same sample (MYC, OAT, BAR); values
within the same sample type annotated with different letters are statistically significant.
Figure 6.2 shows that the β-glucans release is influenced by pancreatin, whereas BS did
not promote any effect. Indeed, -glucans retained in the pellet after the intestinal digestion
with the only pancreatin were lower than those with only BS. The intestinal digestion
performed with pancreatin was not significantly different from the GI digestion in which BS
and pancreatin were included in the GI step (Figure 6.1). Similarly, the intestinal digestion
with only BS (Figure 6.2) was comparable to the control without enzymes and BS in Figure
6.1.

Chapter 6. Beta-Glucans Release from Mycoprotein Cell Walls During In Vitro Gastrointestinal Digestion
176 | P a g e
6.3.2 Analysis of Proteins and Reducing Sugars Hydrolysis After Simulated
GI Digestion
The analysis of proteins (Figure 6.3A and B) and reducing sugars (Figure 6.3C and D)
released following simulated GI digestion was performed to investigate if the hydrolysis of
nutrients (wt% DW) in the sample could correlate to the release of -glucans during GI
digestion (Figure 6.1). The values in Figures 6.3 are expressed as % based on the total nutrient
content (100 wt% DW).
Figure 6.3. Total proteins released in the supernatant of uncooked (Figure 6.3A) and cooked (Figure
6.3B) MYC, WBM, OAT, and BAR after simulated GI digestion. Reducing sugars (wt% DW) released
in the supernatant of uncooked (Figure 6.3C) and (Figure 6.3D) of MYC, WBM, OAT, and BAR
simulated GI digestion. : control GI digestion (without pancreatin and BS); : GI digestion
(with pancreatin and BS). Unpaired t-test (two-tailed, p-value < 0.05) for comparison of the GI digestion
and control of uncooked and cooked samples (MYC, WBM, OAT, BAR). Statistical significance levels
are reported in the text.
Chapter 6. Beta-Glucans Release from Mycoprotein Cell Walls During In Vitro Gastrointestinal Digestion
177 | P a g e
Figure 6.3A shows the protein released from all the uncooked samples after simulated
GI digestion and respective controls. In the uncooked samples, the release of total proteins
was not complete in MYC and WBM samples with values of 41.21 ± 5.60 wt% DW and 65.84
± 2.68 wt% DW, respectively. In contrast, the release of proteins from the OAT and BAR
samples appeared complete with 100 wt% DW values. The cooking process (Figure 6.3B) did
not affect the release of protein in the MYC and OAT samples, which showed no significant
difference compared to the uncooked. On the other hand, the WBM sample presented a
significant increase (p-value ˂ 0.001) in the release of proteins after cooking compared to the
uncooked WBM.
Figures 6.3C and 6.3D show no significant effect in the release of reducing sugars from
glycogen/-glucans in the cooked and uncooked MYC and WBM, as well as reducing sugars
from starch in OAT. Conversely, a decrease (p-value ˂ 0.01) in reducing sugars released was
observed in BAR starch after cooking.
6.3.3 Viscosity of The Supernatant After Simulated Digestion
The viscosity was measured in the supernatant of the uncooked (Figure 6.4A) and
cooked samples (Figure 6.4B) after simulated GI digestion. Rheological analysis was
performed to determine if the -glucan release could influence the behaviour of the digesta by
increasing the viscosity.
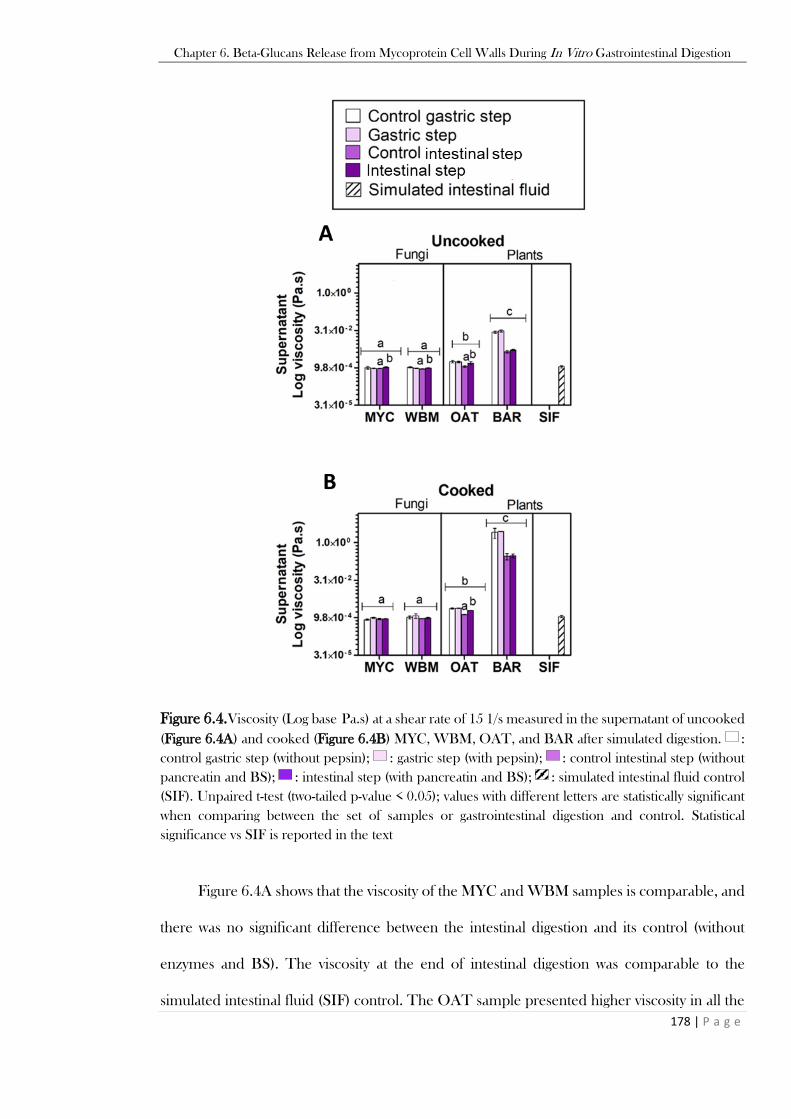
Chapter 6. Beta-Glucans Release from Mycoprotein Cell Walls During In Vitro Gastrointestinal Digestion
178 | P a g e
Figure 6.4.Viscosity (Log base Pa.s) at a shear rate of 15 1/s measured in the supernatant of uncooked
(Figure 6.4A) and cooked (Figure 6.4B) MYC, WBM, OAT, and BAR after simulated digestion. :
control gastric step (without pepsin); : gastric step (with pepsin); : control intestinal step (without
pancreatin and BS); : intestinal step (with pancreatin and BS); : simulated intestinal fluid control
(SIF). Unpaired t-test (two-tailed p-value < 0.05); values with different letters are statistically significant
when comparing between the set of samples or gastrointestinal digestion and control. Statistical
significance vs SIF is reported in the text
Figure 6.4A shows that the viscosity of the MYC and WBM samples is comparable, and
there was no significant difference between the intestinal digestion and its control (without
enzymes and BS). The viscosity at the end of intestinal digestion was comparable to the
simulated intestinal fluid (SIF) control. The OAT sample presented higher viscosity in all the

Chapter 6. Beta-Glucans Release from Mycoprotein Cell Walls During In Vitro Gastrointestinal Digestion
179 | P a g e
digestion conditions when compared to MYC, showing an increase in viscosity after the full
GI digestion (gastric plus intestinal steps) that was significant compared to the SIF control (p-
value ˂ 0.05). The viscosity in the intestinal digestion with pancreatin was significantly different
when compared to the respective control in MYC (p-value ˂ 0.01), WBM (p-value ˂ 0.01)
and OAT (p-value ˂ 0.05). The BAR sample presented a higher viscosity than the rest of the
samples, and there were no differences between the intestinal digestion with pancreatin
compared to the control. The BAR sample after the gastric step was more viscous compared
to the intestinal digestion.
The viscosity of the supernatant measured after cooking and digestion was similar to that
in the uncooked samples (Figure 6.4B), except for MYC that showed a higher viscosity at the
end of intestinal digestion than SIF (p-value ˂ 0.05). The BAR sample presented the highest
viscosity, followed by OAT. Conversely, the MYC and WBM samples were comparable,
showing the lowest viscosity among the other samples. Overall, the samples did not show
significant differences between the intestinal digestion with pancreatin and the control, except
for OAT (p-value ˂ 0.001).
6.3.4 Structural Analysis of the Pellet Before and After Simulated GI
Digestion
Structural analysis by SEM was carried out on the uncooked and cooked samples before
and after simulated GI digestion (Figure 6.5). The analysis was performed to visualise
structural changes in the food matrix, which could be linked to the release of -glucans (Figure
6.1).
Before digestion, the uncooked MYC consisted of filamentous cells that seemed full
and presented a wrinkled surface (Figure 6.5A a & 6.5A b). Some of the cells were broken
into short sections due to the processing of freeze-drying and sieving. After simulated GI
Chapter 6. Beta-Glucans Release from Mycoprotein Cell Walls During In Vitro Gastrointestinal Digestion
180 | P a g e
digestion, the cells seemed flattened and presented a smoother surface (Figure 6.5A c & 6.5A
d). However, the flattened cells formed into a close-packed layer, making it challenging to
distinguish the shape of the individual cells. The cooked MYC structure seemed to be
damaged before digestion, having a more irregular surface (Figure 6.5B a & 6.5B b). On the
other hand, the appearance of cooked and digested MYC (Figure 6.5B c & 6.5B d) was similar
to the uncooked sample. The WBM sample presented a different structure compared to
MYC. The uncooked WBM presented a layered and flat structure, showing no differences
before and after digestion (Figure 6.5A e-h). However, the cooking process impacted the
WBM sample structure, presenting as a rough and damaged surface regardless of the digestion
process. (Figure 6.5B e-h).
The uncooked OAT and BAR samples showed flat layers and spherical structures
surrounded by starch granules (Figure 6.5A i, 6.5A j, 6.5A m and 6.5A n). After simulated GI
digestion, the main change was the disappearance of most of the starch granules that were
hydrolysed (Figure 6.5A k, 6.5A l, 6.5A o and 6.5A p). After cooking, the latter samples did
not show any starch in granules (Figure 6.5B j & 6.5B n) but starchy gel layers (Figure 6.5B j
and 6.5B n) due to gelatinisation. The cooked and digested OAT and BAR were similar to
the uncooked samples in terms of the cracking in their structures (Figure 6.5B k & 6.5B o vs
6.5A k and 6.5A o), but they presented layers probably of gelatinised starch that appeared to
resist digestion (Figure 6.5B k and 6.5B p).
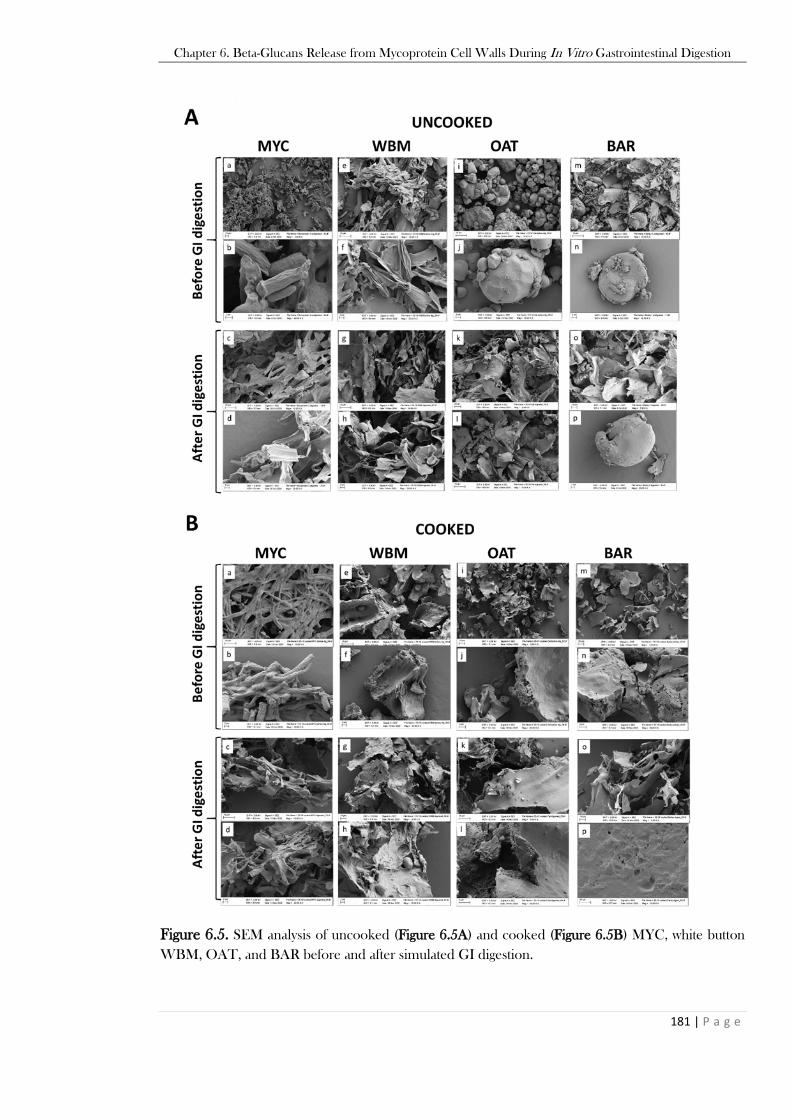
Chapter 6. Beta-Glucans Release from Mycoprotein Cell Walls During In Vitro Gastrointestinal Digestion
181 | P a g e
Figure 6.5. SEM analysis of uncooked (Figure 6.5A) and cooked (Figure 6.5B) MYC, white button
WBM, OAT, and BAR before and after simulated GI digestion.
Chapter 6. Beta-Glucans Release from Mycoprotein Cell Walls During In Vitro Gastrointestinal Digestion
182 | P a g e
6.4 Discussion
-glucans are essential structural and dietary components of the cell wall of plants and fungi
(Kacurakova, Capek, Sasinkova, Wellner, & Ebringerova, 2000; Ruiz-Herrera & Ortiz-
Castellanos, 2019). This study aimed to understand the release of -glucans from two fungal
samples compared to that observed from plants, the latter being extensively investigated
(Grundy et al., 2017; Robertson, Majsak-Newman, & Ring, 1997; Ulmius, Adapa, Önning, &
Nilsson, 2012; Ulmius, Johansson‐Persson, Nordén, Bergenståhl, & Önning, 2011).
Overall, the release of -glucans from the cell wall matrix was more significant in plant
samples, whereas the tested fungal samples seemed to be resilient to release them (Figure
6.1A). However, the fungal samples showed that the cooking step before digestion increased
the release of -glucans in MYC, but not in WBM. The cooking process has been reported
to increase the extractability of plant -glucans by altering the physico-chemical characteristics
of fibre (Henrion, Francey, Lê, & Lamothe, 2019). This effect was also observed in the BAR
sample, in which there was a substantial -glucan release in all the experimental conditions
(gastric and intestinal steps and respective controls). The cooking of the sample before
digestion enhanced the release of -glucans from BAR, whereas it did not affect the OAT
sample. Conversely, Grundy et al. (2017) showed that the cooking step decreased the
solubilisation of -glucans from oat flakes. This finding was explained by the possible
aggregation of nutrients and changes in the cell wall structure (Golding & Wooster, 2010;
Grundy et al., 2017).
Potential influencing factors promoting the solubilisation of -glucans were investigated in
isolated systems with only BS or pancreatic enzymes (Figure 6.2) since these two digestive
components have been reported to interact with -glucans. For instance, the interaction of -
glucans with BS has been studied previously (Bowles, Morgan, Furneaux, & Coles, 1996;
Chapter 6. Beta-Glucans Release from Mycoprotein Cell Walls During In Vitro Gastrointestinal Digestion
183 | P a g e
Gunness, Flanagan, & Gidley, 2010; Gunness, Flanagan, Mata, Gilbert, & Gidley, 2016;
Mikkelsen et al., 2014). These studies suggested a molecular interaction between β-glucan and
BS, as evidenced by changes in the organisation and conformation of -glucans. Robertson,
Majsak-Newman, and Ring (1997) observed an increase of solubilisation of barley -glucans
in the presence of pancreatic enzymes due to the action of specific proteases. Our findings
showed that the pancreatic enzymes facilitated the release of -glucans from MYC, whereas
no significant effects were observed when only BS were tested. This evidence may suggest an
interaction/link of the MYC -glucans with cell wall proteins, preventing their release in the
absence of pancreatic enzymes.
Moreover, the hydrolysis of proteins and digestible carbohydrates (-glucans and glycogen
for fungi and starch for plants) was investigated (Figure 6.3), as well as the structural changes
in the sample matrix using SEM (Figure 6.5). The cooking process did not significantly impact
the protein release and reducing sugars during the simulated GI digestion. The only exception
was the cooked WBM that had a higher protein release after the simulated digestion.
Furthermore, the starch granules observed in the uncooked BAR were no longer visible
in the cooked sample (Figure 6.5B m & 6.5B n). Thus, a gelatinised network (Figure 6.5B p),
composed of starch and potentially released -glucans, was observed in the cooked BAR. This
gel formation may also explain the viscosity increase observed after the cooking process (Figure
6.4) and could have contributed to the lack of release of proteins and reducing sugars (Figure
6.3B & 6.3D). There is also the possibility that the gel-like sample could have interfered with
with the BCA and PAHBAH colourimetric assays.
Some structural differences were observed between the cooked (Figure 6.5B b) and
uncooked MYC (Figure 6.5A b). The surface of the cell walls seemed to be irregular and loose
due to the cooking step. Thus, the combination of cooking and the simulated GI digestion
with pancreatic enzymes may have enhanced the release of -glucans. Moreover, the MYC
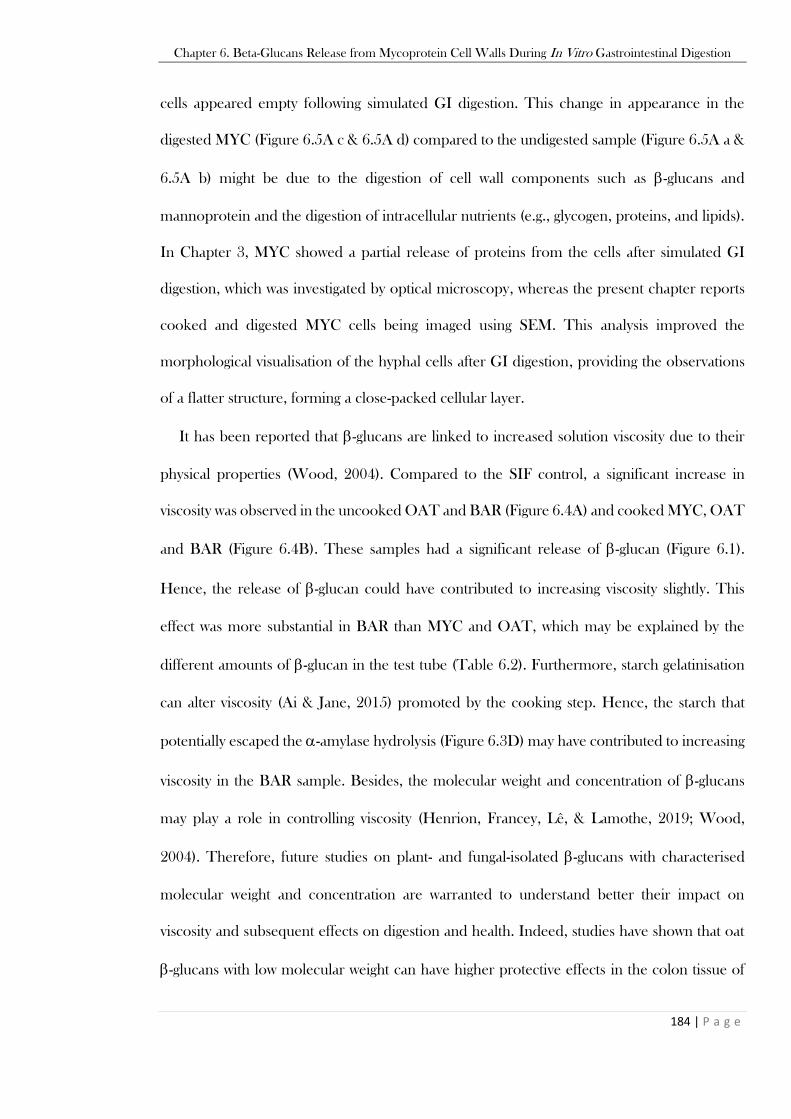
Chapter 6. Beta-Glucans Release from Mycoprotein Cell Walls During In Vitro Gastrointestinal Digestion
184 | P a g e
cells appeared empty following simulated GI digestion. This change in appearance in the
digested MYC (Figure 6.5A c & 6.5A d) compared to the undigested sample (Figure 6.5A a &
6.5A b) might be due to the digestion of cell wall components such as -glucans and
mannoprotein and the digestion of intracellular nutrients (e.g., glycogen, proteins, and lipids).
In Chapter 3, MYC showed a partial release of proteins from the cells after simulated GI
digestion, which was investigated by optical microscopy, whereas the present chapter reports
cooked and digested MYC cells being imaged using SEM. This analysis improved the
morphological visualisation of the hyphal cells after GI digestion, providing the observations
of a flatter structure, forming a close-packed cellular layer.
It has been reported that -glucans are linked to increased solution viscosity due to their
physical properties (Wood, 2004). Compared to the SIF control, a significant increase in
viscosity was observed in the uncooked OAT and BAR (Figure 6.4A) and cooked MYC, OAT
and BAR (Figure 6.4B). These samples had a significant release of -glucan (Figure 6.1).
Hence, the release of -glucan could have contributed to increasing viscosity slightly. This
effect was more substantial in BAR than MYC and OAT, which may be explained by the
different amounts of -glucan in the test tube (Table 6.2). Furthermore, starch gelatinisation
can alter viscosity (Ai & Jane, 2015) promoted by the cooking step. Hence, the starch that
potentially escaped the -amylase hydrolysis (Figure 6.3D) may have contributed to increasing
viscosity in the BAR sample. Besides, the molecular weight and concentration of -glucans
may play a role in controlling viscosity (Henrion, Francey, Lê, & Lamothe, 2019; Wood,
2004). Therefore, future studies on plant- and fungal-isolated -glucans with characterised
molecular weight and concentration are warranted to understand better their impact on
viscosity and subsequent effects on digestion and health. Indeed, studies have shown that oat
-glucans with low molecular weight can have higher protective effects in the colon tissue of
Chapter 6. Beta-Glucans Release from Mycoprotein Cell Walls During In Vitro Gastrointestinal Digestion
185 | P a g e
healthy rats than -glucans of high molecular weight (Wilczak et al., 2015). On the other hand,
Choromanska et al. (2018) reported cytotoxic activity towards cancer cells of high and low
molecular weight oat -glucans.
Overall, this study showed that the release of -glucans differs between fungal and plant-
based matrices. The different -linkages between the plant and fungal polysaccharides and the
different cell wall organisation/composition may have influenced the different release of -
glucan. Indeed, the polysaccharides matrix of the fungal cell wall is considered significantly
narrower and more flexible compared to the plant cellulose microfibrils (Kang et al., 2018).
These new insights are relevant since the release of -glucans may play a central role in
enhancing their activity to modulate digestion and promote health effects such as reducing the
risk of CVD (Bell et al., 1999; Grundy, Fardet, Tosh, Rich, & Wilde, 2018) or T2D (Andrade
& Orlando, 2018; Bozbulut & Sanlier, 2019). Moreover, the early release of -glucans in the
upper GIT can enhance their bioaccessibility in the large intestine to initiate fermentation by
the resident microbiota. Colonic fermentation will be investigated in Chapter 8.
6.5 Conclusions
This chapter showed that the behaviour of -glucans from cell walls during simulated GI
digestion differs between fungi and plants. The highest -glucan release was observed after full
GI digestion. Plants (OAT and BAR brans) released more -glucan than the fungal samples
(MYC and WBM). However, the cooking process enhanced the release of -glucans from the
MYC cell wall, whereas no significant effect was observed with white button mushroom. The
pancreatic enzymes played a critical role in the solubilisation of -glucans, whereas BS did not
have a significant impact.
Chapter 6. Beta-Glucans Release from Mycoprotein Cell Walls During In Vitro Gastrointestinal Digestion
186 | P a g e
Furthermore, the release of structural components (i.e., protein and reducing sugars) from
the matrix due to simulated GI digestion was investigated to understand their role in releasing
-glucans. Overall, no direct correlation of macronutrient and -glucans release was observed
in the samples, especially in MYC that showed a higher degree of -glucans released after
cooking. Furthermore, viscosity appeared to increase from the simulated fluid baseline
(control) at the end of simulated GI digestion in the samples with significant -glucans release.
Structural analysis using SEM showed changes in the food matrix after the cooking process
and simulated GI digestion that might have played a role in enhancing the release of -glucans
from MYC. These findings offer new insights into the potential fate of -glucans from fungal
matrices during GI digestion.
Chapter 7. Minor Compounds Release from Mycoprotein Matrix During In Vitro Gastrointestinal Digestion
187 | P a g e
Chapter 7
Minor Compounds Release from Mycoprotein
Matrix During In Vitro Gastrointestinal Digestion
Chapter 7. Minor Compounds Release from Mycoprotein Matrix During In Vitro Gastrointestinal Digestion
188 | P a g e
7.1 Introduction
The health effects promoted by mycoprotein (MYC) consumption on cardiovascular
diseases (CVD) and type-2 diabetes (T2D) have been discussed in Chapter 1 of this thesis,
and some mechanisms potentially underpinning these effects were investigated in the previous
chapters. The structure of MYC appeared to play an essential role in slowing down digestion
in vitro, and its interaction with digestive enzymes (e.g., pancreatic -amylase and lipase) and
bile salts (BS) appeared to influence digestion. These interactions observed in vitro may
explain the health effects on T2D and CVD observed by in vivo studies (Bottin et al., 2011;
Coelho et al., 2020; Turnbull, Leeds, & Edwards, 1992; Turnbull & Ward, 1995).
Nevertheless, it is known that minor compounds such as phenolics can promote health
effects (Kumar & Goel, 2019), and there is evidence in the literature on the positive effects of
phenolic compounds on CVD and T2D (Ali, Ahmad, Budin, & Zainalabidin, 2020;
Vinayagam, Jayachandran, & Xu, 2016). Phenolic compounds are widely found in the plant
(Kumar & Goel, 2019) and the fungal (Vaz et al., 2011) kingdoms of life. They are secondary
metabolites necessary for biotic and abiotic responses (Mandal, Chakraborty, & Dey, 2010).
Phenolic compounds are rarely found in a free form as they are generally bound to amides,
esters, or glycosides (Pereira, Valentão, Pereira, & Andrade, 2009). Moreover, dietary
polyphenols have been described to inhibit -amylase (Nyambe-Silavwe et al., 2015; Sun et
al., 2016), similarly to what was described in Chapter 4. Similarly, ergothioneine (ERG) is a
compound that has gained attention for its anti-inflammatory and antioxidant properties
(Cheah & Halliwell, 2012). ERG is a thio-histidine betaine amino acid that is synthesised by
microbes and fungi but not by plants and animals (Borodina et al., 2020).
These bioactive effects need to be evaluated carefully as the literature on phenolic
compounds and ERG is often based on in vitro studies that show powerful antioxidant or anti-
Chapter 7. Minor Compounds Release from Mycoprotein Matrix During In Vitro Gastrointestinal Digestion
189 | P a g e
inflammatory effects that can prevent diseases such as T2D and CVD. However, when it
comes to in vivo studies, the effects are reduced drastically (Halliwell, 2009).
Notwithstanding, an analysis of minor compounds such as ERG and phenolic compounds
in MYC was carried out in this chapter. The potential presence of minor compounds could
have influenced the health benefits promoted by MYC (Bottin et al., 2016; Turnbull, Leeds,
& Edwards, 1992; Turnbull & Ward, 1995), which can open the way to new studies.
7.2 Materials & Methods
7.2.1 Materials
7.2.1.1 Chemicals and Reagents
The specific reagents used in this chapter are specified below, while the common
materials to other chapters are listed in Chapter 2, Section 2.1.1.
All following standards and reagents were purchased from Merck, UK unless
otherwise stated: Acetonitrile (Catalogue No. 34851), ammonium formate (Catalogue No.
70221), formic acid (Catalogue No. 533002), protocatechuic acid (Catalogue No. 03930590),
coumaric acid (Catalogue No. C9008), ferulic acid (Catalogue No. 1270311), caffeic acid
(Catalogue No. C0625), chlorogenic acid (Catalogue No. C3878), vanillic acid (Catalogue No.
94770), syringic acid (Catalogue No. S6881), quinic acid (Catalogue No. 46944-U), cinnamic
acid (Catalogue No. 1133933), sinapic (Catalogue No. D7927), pyrogallol (Catalogue No.
P0381). Docosyl ferulate (Catalogue No. D494650), 1,3-dicaffeoylquinic acid (Catalogue No.
D429700), myricetin (Catalogue No. M884100), and L-(+)-ergothioneine (Catalogue No.
E600000) were purchased from Toronto Research Chemicals INC, Canada.
Chapter 7. Minor Compounds Release from Mycoprotein Matrix During In Vitro Gastrointestinal Digestion
190 | P a g e
7.2.1.2 Mycoprotein and Control Samples
The fungal samples used in this study were as follows: (1) RAW-MYC, this is MYC
in its rawest form before the RNA reduction treatment (as described in Chapter 1, Section
1.2.2); (2) MYC, after RNA reduction treatment; and (3) Agaricus bisporus (white button
mushroom, referred to as WBM). The samples of RAW-MYC and MYC were provided by
Marlow Foods Ltd, UK, as a paste and freeze-dried powder, respectively. RAW-MYC was
freeze-dried and sieved into a fine powder (< 0.5 mm), whereas MYC was only sieved (< 0.5
mm). WBM was purchased from a local store in the UK as a fresh, chilled product. The
mushrooms were washed, cut into pieces, freeze-dried, and sieved into a fine powder (< 0.5
mm).
7.2.2 Methods
7.2.2.1 Chemical Extraction
Chemical extraction was performed from 0.625 g of sample in aqueous methanol
(70% v/v) (20 mL) for 1 h at 60℃ in a water bath. Samples were centrifuged for 10 min at
2,800 xg (Heraeus Megafuge 16 centrifuge, Germany). The supernatant was collected and
stored at -20℃ for further analysis.
7.2.2.2 Simulated Gastrointestinal Digestion
The simulated GI digestion used in this study was the INFOGEST standardised
method for food (Minekus et al., 2014), as described in Chapter 2, Section 2.2.1.
The digestion was carried out with 2.5 g of food (e.g., 0.625 g of MYC plus 1.875 mL
of ultra-pure water) with a total digesta volume of 10 mL for the gastric step and 20 mL for the
intestinal. Samples were taken at the end of 2 h of gastric step (gastric) and 2 h intestinal
Chapter 7. Minor Compounds Release from Mycoprotein Matrix During In Vitro Gastrointestinal Digestion
191 | P a g e
digestion (in total 4 h of which 2 h gastric and 2 h intestinal step). The enzyme activity was
stopped by adding 2 M NaOH to reach pH 7.0 in the gastric time points and pH 11.0 in the
samples from the small intestinal phase. The controls were the samples without enzymes and
BS. After digestion, the samples were centrifuged at 2,800 xg (Heraeus Megafuge 16
centrifuge, Germany) for 10 min, and the supernatant was stored at -20℃ for further analysis.
7.2.2.3 LC-MS Analysis
Extracts and samples of GI digestion were analysed using a Waters Acquity iClass
ultra-performance liquid chromatography (UPLC) coupled to a Waters Xevo TQS-micro
triple quadrupole mass spectrometer (MS) (Wilmslow, UK). Mr Mark Philo performed the
analysis at the Quadram Institute Bioscience in Norwich, UK. Sample (1 µL) was injected and
separated as described in the following ”HILIC LC-MS” section for ERG and the “Reverse
phase UPLC-MS” section for phenolic compounds.
HILIC LC-MS for Ergothioneine Analysis
The separation by hydrophilic interaction chromatography (HILIC) was achieved
with a Waters BEH Amide 150 x 2.1, 1.7 Column at 35°C to quantify ERG. Solvent A was
composed 85% acetonitrile containing 10 mM ammonium formate and 0.15% formic acid.
Solvent B was water containing 10 mM ammonium formate and 0.15% formic acid at pH 3.0.
The sample injection was 1 µL, and the flow was 0.5 mL/min. The source conditions were as
follows: Capillary kV 1.50; desolvation temperature 500°C; desolvation flow 1,000 L/h; cone
flow 50 L/h; source temperature 150°C. The solvent gradient program was as follows: 0 min,
100% A and 0% B; 6 min, 100% A and 0% B; 6.1 min, 94% A and 6% B; 11 min, 83% A and
17% B; 14 min, 60% A and 40% B; 14.1 min 100% A, 0% B; 18 min, 100% A, 0% B.
Chapter 7. Minor Compounds Release from Mycoprotein Matrix During In Vitro Gastrointestinal Digestion
192 | P a g e
Reverse-Phase UPLC-MS for Phenolic Compound Analysis
The reverse-phase ultra-performance liquid chromatography (UPLC) coupled
with MS was performed with Waters TQS-micro to quantify phenolic compounds. The
column used was Waters HSS T3 100 x 2.1 x 2.7 at 35°C. Solvent A consisted of water
containing 0.1% formic acid, and solvent B was acetonitrile containing 0.1% formic acid. The
sample injection was 1 µL, and the flow was 0.4 mL/min. The source conditions were as
follows: capillary 1.50 kV; desolvation temperature 500°C; desolvation flow 1,000 L/h; cone
flow 50 L/h; source temperature 150°C. The solvent gradient program was as follows: 0 min,
97% A and 3% B; 2 min, 97% A and3% B; 6 min, 80% A and 20% B; 10 min, 50% A and50%
B; 12 min 5% A and 95% B; 13 min 5% A and 95% B; 13.1 min, 97% A and 3% B; 15 min,
97% A and 3% B.
7.2.2.4 Data Analysis
Data were analysed by GraphPad Prism version 5 for Windows (GraphPad Software,
USA), statistical significance was set at p-value < 0.05. Values were expressed as average ±
standard deviation (SD) of three independent measures (n = 3). The post-hoc analysis is
specified in the description of the corresponding table.
7.3 Results & Discussion
7.3.1 Phenolic Acids and Ergothioneine Release After Chemical Extraction
The extraction of ERG and phenolic acids was carried out with aqueous methanol (70%
v/v), which allowed the determination of its concentration and comparison with its release after
simulated GI digestion. ERG was found in all the samples with the highest concentration in
WBM, followed by the RAW-MYC (Table 7.1). On the other hand, MYC had a decreased

Chapter 7. Minor Compounds Release from Mycoprotein Matrix During In Vitro Gastrointestinal Digestion
193 | P a g e
ERG concentration than the unprocessed RAW-MYC (p-value < 0.0001). The RNA
reduction step at > 68℃ (see Chapter 1) followed by centrifugation may have reduced the
ERG concentration. Some studies on methylobacterium species showed that a temperature at
60℃ was sufficient for extracting ERG (Alamgir, Masuda, Fujitani, Fukuda, & Tani, 2015),
whereas studies on mushrooms showed that boiling water caused a loss of ERG (Tsai & Chen,
2019).
The phenolic compounds analysed in this chapter were as follows: protocatechuic acid
(PCA), coumaric acid (COU), docosyl ferulate, ferulic acid, caffeic acid, 1,3 dicaffeoylquinic
acid, chlorogenic acid, vanillic acid, syringic acid, quinic acid, cinnamic acid, sinapic,
pyrogallol, and myricetin. Many of these compounds are known to be present in fungal
samples (Çayan, Deveci, Tel-Çayan, & Duru, 2020; Palacios et al., 2011). Of the above
fourteen mentioned compounds, only two (i.e., protocatechuic acid and coumaric acid) were
detected in WBM, while the others were either absent or below the detection limit. There was
no signal detected for phenolic components neither in MYC nor RAW-MYC.
Table 7.1. Concentrations of ergothioneine (ERG), protocatechuic acid (PCA), and coumaric acid
(COU) after chemical extraction from samples. Concentrations are expressed as g/g ± SD. n/d is not
detected. Unpaired t-test (two-tailed, p-value < 0.05); statistically significant comparisons are described
in the text.
ERG PCA COU
Sample
Concentration
(g/g ± SD)
Concentration
(g/g ± SD)
Concentration
(g/g ± SD)
RAW-MYC 3.15 ± 0.12 n/d n/d
MYC 0.47 ± 0.15 n/d n/d
WBM 1,553.53 ± 51.67 0.57 ± 0.50 2.52 ± 0.42
Chapter 7. Minor Compounds Release from Mycoprotein Matrix During In Vitro Gastrointestinal Digestion
194 | P a g e
7.3.2 Phenolic Acids and Ergothioneine Release During Simulated GI
Digestion
The release of phenolic acids and ERG was also analysed after simulated GI digestion.
The endpoints were at the end of the 2 h of gastric digestion and after 2 h of gastric and 2 h of
small intestinal digestion (Table 7.2). The controls without enzymes and BS were also
performed, named control gastric, for the gastric step, and control intestinal for the gastric step
followed by the intestinal phase. The trend obtained was similar to the chemical extraction, in
which the WBM sample showed the highest release of ERG compared to MYC and RAW-
MYC (Table 7.2). However, from the initial value of 1,553.53 ± 51.67 g/g in WBM, only
340.85 ± 97.77 g/g was released in the control of the gastric step. Despite the effect of
enzymes and pH, the digestion process was not enough for releasing this compound from its
matrix. Alternatively, the potential interaction of ERG with digestive components may have
reduced its concentration. No differences were detected when comparing RAW-MYC with
MYC, although RAW-MYC had a lower release of ERG compared to the value obtained after
chemical extraction (p-value < 0.0001). The ERG concentration of 0.21 ± 0.02 g/g released
from MYC at the end of GI digestion (Table 7.2) could be sufficient to exert a potential
antioxidative effect in humans when a minimum dose of 25 g of MYC is provided (5.25 mg of
ERG in 25 g of MYC). Indeed, human studies have administered a daily dose range of 5-25
mg per day for 7 days to observe minimal decreasing trends in biomarkers of oxidative damage
and inflammation (Cheah, Tang, Yew, Lim, & Halliwell, 2017). However, these findings need
to be considered carefully since the effect was negligible, and more evidence of clinical trials
is required.
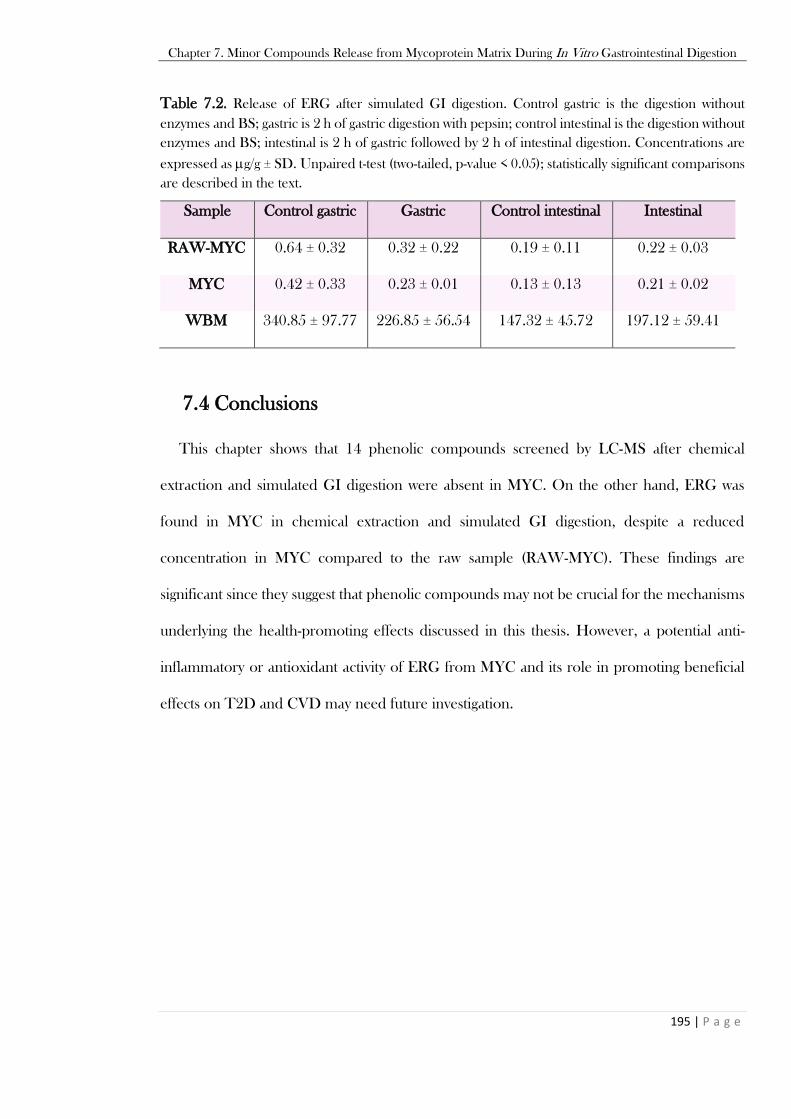
Chapter 7. Minor Compounds Release from Mycoprotein Matrix During In Vitro Gastrointestinal Digestion
195 | P a g e
Table 7.2. Release of ERG after simulated GI digestion. Control gastric is the digestion without
enzymes and BS; gastric is 2 h of gastric digestion with pepsin; control intestinal is the digestion without
enzymes and BS; intestinal is 2 h of gastric followed by 2 h of intestinal digestion. Concentrations are
expressed as g/g ± SD. Unpaired t-test (two-tailed, p-value < 0.05); statistically significant comparisons
are described in the text.
Sample Control gastric Gastric Control intestinal Intestinal
RAW-MYC 0.64 ± 0.32 0.32 ± 0.22 0.19 ± 0.11 0.22 ± 0.03
MYC 0.42 ± 0.33 0.23 ± 0.01 0.13 ± 0.13 0.21 ± 0.02
WBM 340.85 ± 97.77 226.85 ± 56.54 147.32 ± 45.72 197.12 ± 59.41
7.4 Conclusions
This chapter shows that 14 phenolic compounds screened by LC-MS after chemical
extraction and simulated GI digestion were absent in MYC. On the other hand, ERG was
found in MYC in chemical extraction and simulated GI digestion, despite a reduced
concentration in MYC compared to the raw sample (RAW-MYC). These findings are
significant since they suggest that phenolic compounds may not be crucial for the mechanisms
underlying the health-promoting effects discussed in this thesis. However, a potential anti-
inflammatory or antioxidant activity of ERG from MYC and its role in promoting beneficial
effects on T2D and CVD may need future investigation.
Chapter 8. Colonic In Vitro Fermentation of Mycoprotein Promotes Shifts in Gut Microbiota and Short-Chain
Fatty Acids Production
196 | P a g e
Chapter 8
Colonic In Vitro Fermentation of Mycoprotein
Promotes Shifts in Gut Microbiota and Short-
Chain Fatty Acids Production

Chapter 8. Colonic In Vitro Fermentation of Mycoprotein Promotes Shifts in Gut Microbiota and Short-Chain
Fatty Acids Production
197 | P a g e
8.1 Introduction
Previous chapters showed that the fungal cell wall (FCW) of mycoprotein (MYC) appeared
to be a crucial component in slowing down simulated upper GI digestion processes. The
fibrous cell wall has been shown to entrap digestive components such as -amylase (Chapters
4) and bile salts (BS) (Chapter 5). The entrapment of digestive components and sustained
digestion of nutrients may reflect in vivo with the homeostasis and digestion of lipids and
carbohydrates and explain the health effects related to cardiovascular diseases (CVD) and type-
2 diabetes (T2D) observed after MYC consumption (Bottin et al., 2016; Coelho et al., 2020;
Ruxton & McMillan, 2010; Turnbull, Leeds, & Edwards, 1992; Turnbull & Ward, 1995).
However, metabolites such as short-chain fatty acids (SCFA), derived from dietary fibre
(DF) fermentation in the lower GIT, and the changes in the colonic microbial population can
also modulate lipid and glucose metabolism. For instance, SCFA have been reported to
promote human health by regulating blood pressure, appetite, glucose homeostasis and
maintaining gut integrity (Chambers, Preston, Frost, & Morrison, 2018). Similarly, the gut
microbiota composition has shown promising evidence of its link with metabolic disorders
such as CVD and T2D (Miele et al., 2015).
A recent study has reported the production of SCFA during colonic in vitro fermentation
of the whole MYC and isolated MYC fibre (Harris, Edwards, & Morrison, 2019). The SCFA
produced from the MYC fermentation could modulate glucose and lipid homeostasis in vivo
and requires further investigation. Moreover, changes in the microbial population induced by
MYC fermentation may also impact CVD and T2D and have not been investigated yet.
Therefore, this chapter analysed the colonic in vitro fermentation of MYC previously
digested in a simulation of the upper gastrointestinal tract (GIT) and compared it to an oat
(OAT) and chicken (CKN) control. OAT and CKN can be fermented to produce SCFA and
modulate changes in the colonic bacterial population (Kim & White, 2009; Mälkki & Virtanen,

Chapter 8. Colonic In Vitro Fermentation of Mycoprotein Promotes Shifts in Gut Microbiota and Short-Chain
Fatty Acids Production
198 | P a g e
2001; Shen, Chen, & Tuohy, 2010). This comparison was important to observe how substrates
with structural differences (e.g., plant cell wall in OAT, fungal cell wall in MYC, and no cell
wall in CKN) and belonging to distinct kingdoms of life (i.e., fungi, plants, and animals) could
have influenced microbial changes and metabolite production. Indeed, SCFA production can
vary depending on bacterial groups and substrate (Morrison & Preston, 2016) and, therefore,
different DF substrates can promote distinct changes in the gut microbiota. Moreover,
alterations in the MYC structure after a complete upper and lower simulated GI digestion
were investigated.
The metabolites derived by colonic fermentation were analysed by proton nuclear magnetic
resonance (NMR), whereas the changes in microbiota were estimated using shotgun
metagenomics sequencing for taxonomic profiling and functional analysis. Moreover, changes
in MYC cells were investigated during the colonic in vitro fermentation by optical microscopy.
8.2 Materials & Methods
8.2.1 Materials
8.2.1.1 Chemicals and Reagents
The specific reagents used in this chapter are specified below, while the common
materials to other chapters are listed in Chapter 2, Section 2.1.
All standards and reagents were purchased from Merck, UK unless otherwise stated:
MgSO4·7H2O (Catalogue No. M7506), Pipes buffer (Catalogue No. P6757), NH4Cl
(Catalogue No. A9434), Trypticase (Catalogue No. Z699195), MnCl2·4H2O (Catalogue No.
M3634), FeSO4·7H2O (Catalogue No. F7002), ZnCl2 (Catalogue No. 208086), CuCl·2H2O
(Catalogue No. 224332), CoCl2·6H2O (Catalogue No. C8661), SeO2 (Catalogue No. 200107),
NiCl2·6H2O (Catalogue No. 654507), Na2MoO4·2H2O (Catalogue No. M1003), NaVO3
Chapter 8. Colonic In Vitro Fermentation of Mycoprotein Promotes Shifts in Gut Microbiota and Short-Chain
Fatty Acids Production
199 | P a g e
(Catalogue No. 72060), H3BO3 (Catalogue No. B6768), acetic acid (Catalogue No. 71251),
propionic acid (Catalogue No. P1386), butyric acid (Catalogue No. B103500), isobutyric acid
(Catalogue No. I1754), 2-methylbutyric acid (Catalogue No. 193070), valeric acid (Catalogue
No. 240370), isovaleric acid (Catalogue No. 129542), biotin (Catalogue No. B4639), folic acid
(Catalogue No. F8758), calcium D-pantothenate (Catalogue No. PHR1232), nicotinamide
(Catalogue No. N0636), riboflavin (Catalogue No. R9504), thiamine HCl (Catalogue No.
T1270), pyridoxine HCl (Catalogue No. P6280), para-amino benzoic acid (Catalogue No.
579513), cyanocobalamin (Catalogue No. PHR1234), deuterium oxide (Catalogue No.
151882), d4-trimethylsilyl propionic acid sodium salt (Catalogue No. 269913), molecular
biology grade water (Catalogue No. W4502), 5 mL Eppendorf® tubes (Catalogue No.
Z768744), 1.5 mL LoBind® tubes (Catalogue No. 0030108442), paraformaldehyde
(Catalogue No. P6148), MP bio fast DNA spin kit for soil (Catalogue No. 116560200, MP
Biomedicals, USA), and Seward Stomacher® Classic Bags (Catalogue No. BA6041/5/500;
The Laboratory Store, UK).
8.2.1.2 Mycoprotein and Control Samples
The substrates for colonic in vitro fermentation were a control (CNT, faecal slurry
without substrate), MYC, oat bran (OAT), and chicken breast (CKN). Marlow Foods Ltd,
UK, provided MYC, whereas OAT (White’s oats, medium cut, UK) and CKN (Iceland Ready
Cooked Sliced Chicken Breast, UK) were purchased from a local store. MYC and OAT were
hydrated 1:4 with ultra-pure water before digestion. Then, 100 g of the hydrated MYC and
OAT samples and 100 g of CKN were transferred into a Duran bottle and cooked for 15 min
in a boiling water bath (100°C). After cooling down at room temperature for 15 min, the
samples were digested following the INFOGEST protocol (Minekus et al., 2014), as described
in Section 2.2.1, before colonic in vitro fermentation (Section 2.2.2).
Chapter 8. Colonic In Vitro Fermentation of Mycoprotein Promotes Shifts in Gut Microbiota and Short-Chain
Fatty Acids Production
200 | P a g e
8.2.2 Methods
8.2.2.1 Simulated Upper Gastrointestinal Digestion
After sample preparation (Section 8.2.1.2), simulated upper GI digestion was carried
out as described in Chapter 2 (Section 2.2.1) to obtain the substrates for inoculation in the
colonic in vitro fermentation experiments.
The digestion was carried out with 100 g of food (e.g., 25 g of MYC plus 75 mL of
ultra-pure water) with a total digesta volume of 400 mL for the gastric step and 800 mL for the
small intestinal. At the end of simulated upper GI digestion, the enzyme activity was stopped
by adding 5 M NaOH to reach pH 11.0, and steps were performed to obtain the substrates
for colonic in vitro fermentation: (1) The supernatant was separated from the pellet by
centrifugation at 2,800 xg for 10 min at room temperature. This procedure was repeated
another 3 times with aqueous ethanol (50% v/v) to wash the pellet from the digestion products
(e.g., amino acids (AA), sugars, free-fatty acids). Then, the pellet was freeze-dried (LyoDry
Compact, Mechatech, UK) for 1 week to obtain a dry powder; (2) The supernatant that was
separated from step (1) was incubated with aqueous ethanol (80% v/v) for 1 h at room
temperature to precipitate the soluble -glucans in the MYC and OAT samples.
Ethanol precipitation at 70% to 80% in water has been used by numerous studies for
carbohydrate precipitation (Xu et al., 2014) and to extract plant and fungal -glucans (Zhu,
Du, & Xu, 2016). The precipitated pellet was then centrifuged at 2,800 xg for 10 min at room
temperature, washed 3 times with ultra-pure water and freeze-dried for 1 week. The obtained
powder was mixed with the dry powder obtained from step (1). Finally, the dry powders from
MYC, OAT, and CKN were stored at -20℃ and ready for colonic in vitro fermentation.
Chapter 8. Colonic In Vitro Fermentation of Mycoprotein Promotes Shifts in Gut Microbiota and Short-Chain
Fatty Acids Production
201 | P a g e
Protein & Reducing Sugar Analysis
At the end of the simulated GI digestion, protein and reducing sugar analysis was
carried out on the supernatant of the digested samples. The bicinchoninic acid assay (BCA)
and p-hydroxybenzoic acid hydrazide (PAHBAH) assays were used for protein and reducing
sugar estimation, respectively. BCA and PAHBAH assays were performed as described in
Chapter 2, Section 2.2.3.1, and Section 2.2.4.1, respectively.
The -glucan content of MYC and OAT was measured as described in Chapter
6 from the pellet obtained by mixing the recovered pellet from the aqueous ethanol (80% v/v)
precipitation and the washed pellet after simulated GI digestion (Section 8.2.2.1).
The values (%wt) obtained from BCA, PAHBAH, and -glucan content analysis
were expressed as residual proteins, carbohydrates, and -glucans in the sample pellet after
simulated upper GI digestion and before in vitro colonic fermentation. This was done by
subtracting the value obtained by BCA, PAHBAH and -glucan content analysis from the
total starting value (100%wt) of each sample proteins, carbohydrates, and -glucans before
digestion.
8.2.2.2 Batch Colonic In Vitro Fermentation
The colonic fermentation was carried out with the method described by (Williams,
Bosch, Boer, Verstegen, & Tamminga, 2005) with minor modifications. For each substrate,
the parallel fermentations (in duplicate) were carried out in anaerobic vessels with the media
and the faecal slurry produced from the stools of six separate donors. The blanks were MYC,
OAT, and CKN without the faecal slurry. An aliquot of 5 mL was taken at 0, 4, 8, 24, 48, and
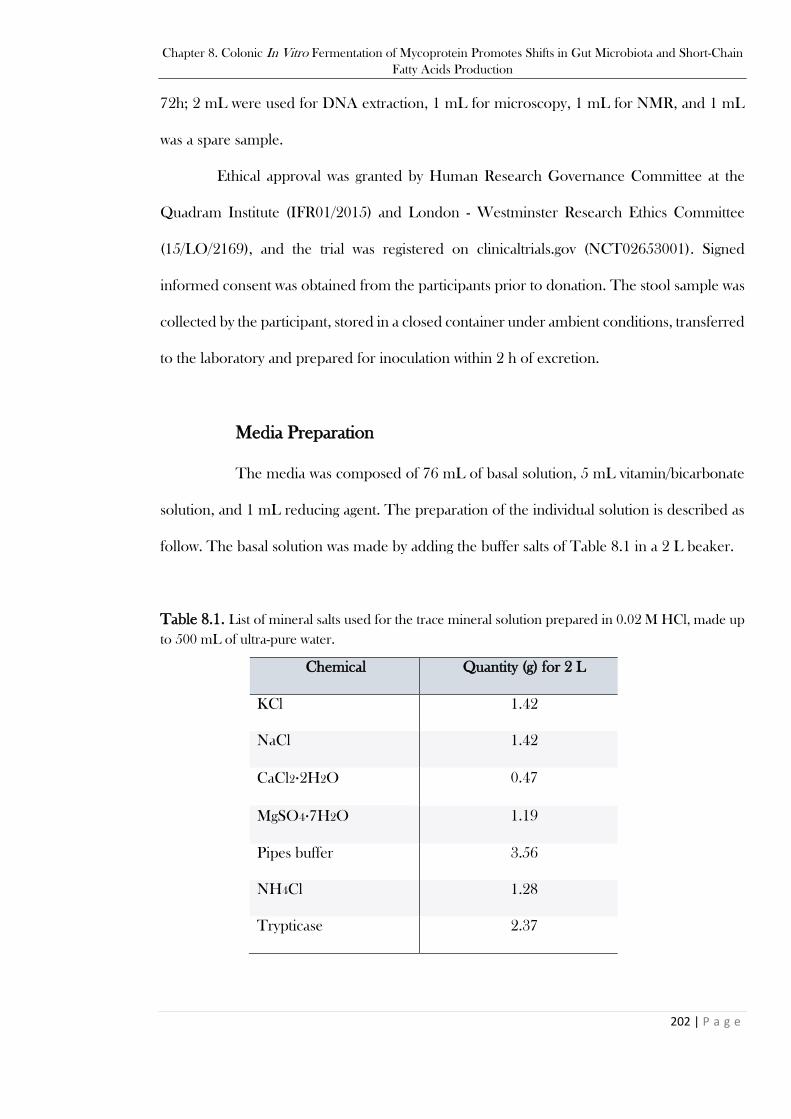
Chapter 8. Colonic In Vitro Fermentation of Mycoprotein Promotes Shifts in Gut Microbiota and Short-Chain
Fatty Acids Production
202 | P a g e
72h; 2 mL were used for DNA extraction, 1 mL for microscopy, 1 mL for NMR, and 1 mL
was a spare sample.
Ethical approval was granted by Human Research Governance Committee at the
Quadram Institute (IFR01/2015) and London - Westminster Research Ethics Committee
(15/LO/2169), and the trial was registered on clinicaltrials.gov (NCT02653001). Signed
informed consent was obtained from the participants prior to donation. The stool sample was
collected by the participant, stored in a closed container under ambient conditions, transferred
to the laboratory and prepared for inoculation within 2 h of excretion.
Media Preparation
The media was composed of 76 mL of basal solution, 5 mL vitamin/bicarbonate
solution, and 1 mL reducing agent. The preparation of the individual solution is described as
follow. The basal solution was made by adding the buffer salts of Table 8.1 in a 2 L beaker.
Table 8.1. List of mineral salts used for the trace mineral solution prepared in 0.02 M HCl, made up
to 500 mL of ultra-pure water.
Chemical Quantity (g) for 2 L
KCl 1.42
NaCl 1.42
CaCl2·2H2O 0.47
MgSO4·7H2O 1.19
Pipes buffer 3.56
NH4Cl 1.28
Trypticase 2.37
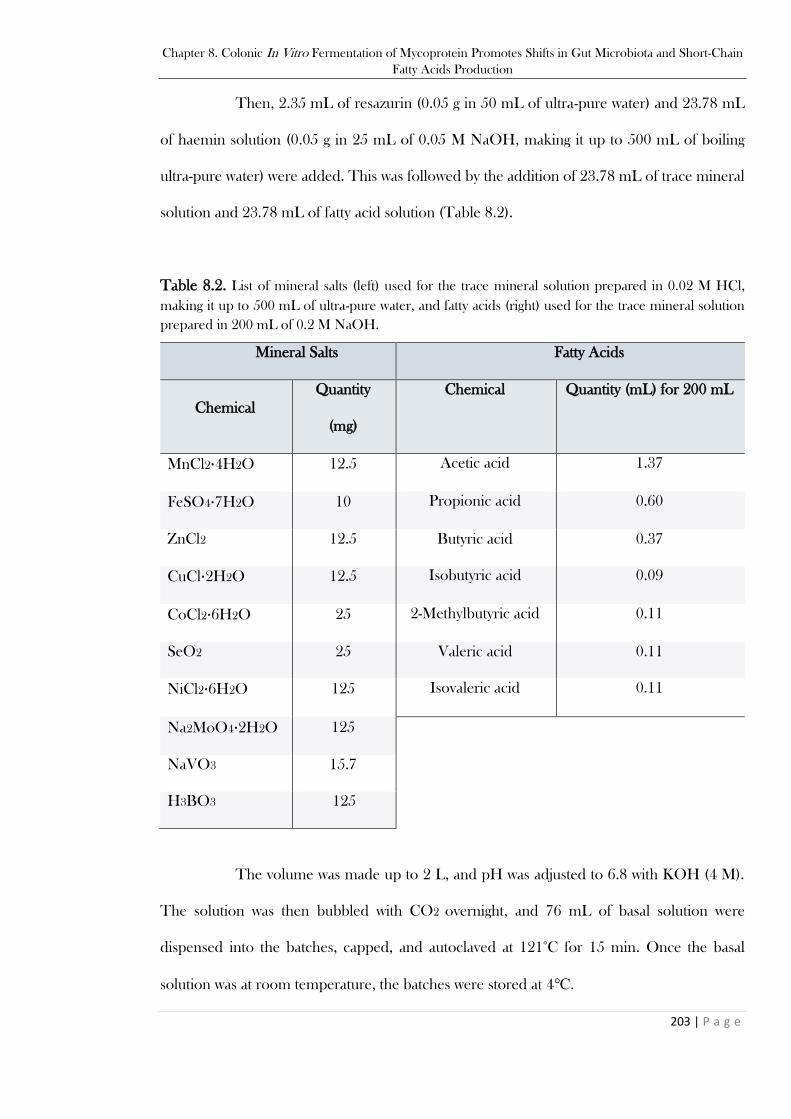
Chapter 8. Colonic In Vitro Fermentation of Mycoprotein Promotes Shifts in Gut Microbiota and Short-Chain
Fatty Acids Production
203 | P a g e
Then, 2.35 mL of resazurin (0.05 g in 50 mL of ultra-pure water) and 23.78 mL
of haemin solution (0.05 g in 25 mL of 0.05 M NaOH, making it up to 500 mL of boiling
ultra-pure water) were added. This was followed by the addition of 23.78 mL of trace mineral
solution and 23.78 mL of fatty acid solution (Table 8.2).
Table 8.2. List of mineral salts (left) used for the trace mineral solution prepared in 0.02 M HCl,
making it up to 500 mL of ultra-pure water, and fatty acids (right) used for the trace mineral solution
prepared in 200 mL of 0.2 M NaOH.
Mineral Salts Fatty Acids
Chemical
Quantity
(mg)
Chemical Quantity (mL) for 200 mL
MnCl2·4H2O 12.5 Acetic acid 1.37
FeSO4·7H2O 10 Propionic acid 0.60
ZnCl2 12.5 Butyric acid 0.37
CuCl·2H2O 12.5 Isobutyric acid 0.09
CoCl2·6H2O 25 2-Methylbutyric acid 0.11
SeO2 25 Valeric acid 0.11
NiCl2·6H2O 125 Isovaleric acid 0.11
Na2MoO4·2H2O 125
NaVO3 15.7
H3BO3 125
The volume was made up to 2 L, and pH was adjusted to 6.8 with KOH (4 M).
The solution was then bubbled with CO2 overnight, and 76 mL of basal solution were
dispensed into the batches, capped, and autoclaved at 121°C for 15 min. Once the basal
solution was at room temperature, the batches were stored at 4℃.
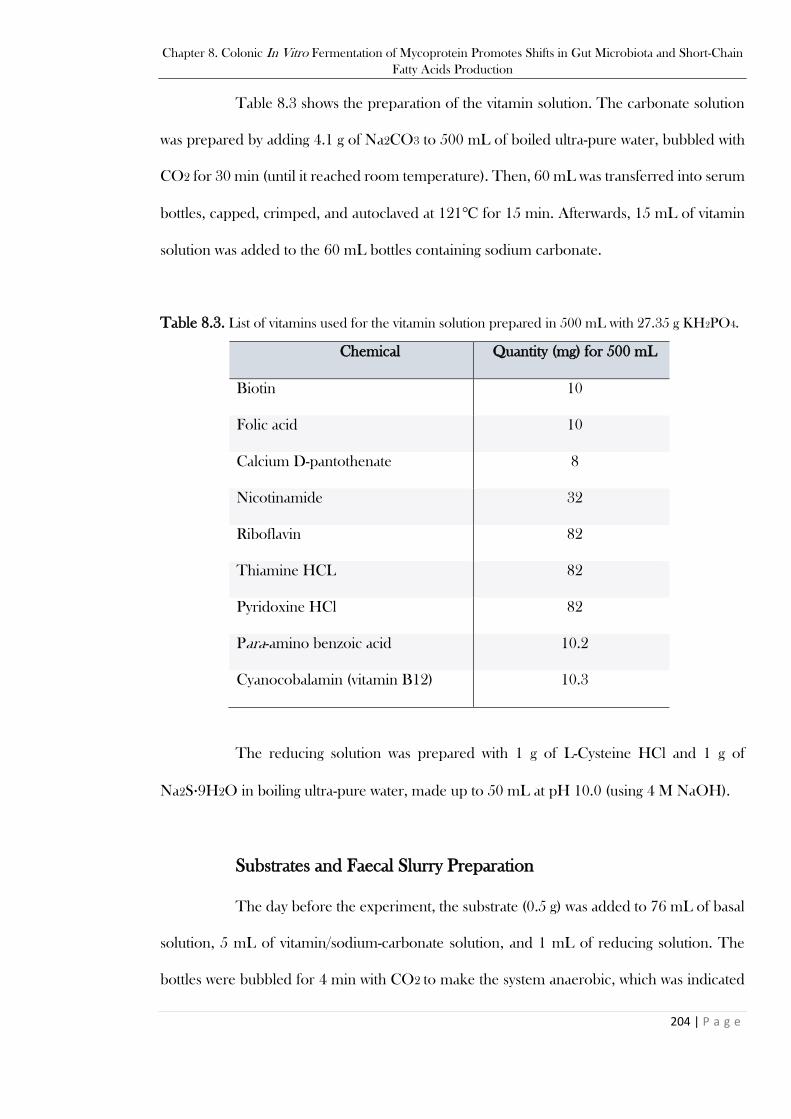
Chapter 8. Colonic In Vitro Fermentation of Mycoprotein Promotes Shifts in Gut Microbiota and Short-Chain
Fatty Acids Production
204 | P a g e
Table 8.3 shows the preparation of the vitamin solution. The carbonate solution
was prepared by adding 4.1 g of Na2CO3 to 500 mL of boiled ultra-pure water, bubbled with
CO2 for 30 min (until it reached room temperature). Then, 60 mL was transferred into serum
bottles, capped, crimped, and autoclaved at 121℃ for 15 min. Afterwards, 15 mL of vitamin
solution was added to the 60 mL bottles containing sodium carbonate.
Table 8.3. List of vitamins used for the vitamin solution prepared in 500 mL with 27.35 g KH2PO4.
Chemical Quantity (mg) for 500 mL
Biotin 10
Folic acid 10
Calcium D-pantothenate 8
Nicotinamide 32
Riboflavin 82
Thiamine HCL 82
Pyridoxine HCl 82
Para-amino benzoic acid 10.2
Cyanocobalamin (vitamin B12) 10.3
The reducing solution was prepared with 1 g of L-Cysteine HCl and 1 g of
Na2S·9H2O in boiling ultra-pure water, made up to 50 mL at pH 10.0 (using 4 M NaOH).
Substrates and Faecal Slurry Preparation
The day before the experiment, the substrate (0.5 g) was added to 76 mL of basal
solution, 5 mL of vitamin/sodium-carbonate solution, and 1 mL of reducing solution. The
bottles were bubbled for 4 min with CO2 to make the system anaerobic, which was indicated
Chapter 8. Colonic In Vitro Fermentation of Mycoprotein Promotes Shifts in Gut Microbiota and Short-Chain
Fatty Acids Production
205 | P a g e
by the colourless resazurin prior to inoculation, and incubated at 37℃ overnight to allow the
substrates to hydrate.
The stool sample was transferred in a stomacher bag and prepared at 1:10 ratio of
the stool sample to sterile phosphate-buffered saline (PBS). The stomacher bag containing the
slurry was added to a stomacher machine and mixed for 30 s. Using a 19G needle and syringe,
3 mL of the slurry was injected into the serum bottle to start the fermentation process. Aliquots
of 5 mL were taken with a 19G syringe at 0, 4, 8, 24, 48, and 72 h and stored at -80℃ for
DNA and metabolomic analysis, whereas samples for microscopy were fixed on the same day
of the experiment as discussed in section 8.2.2.5.
8.2.2.3 Metabolomic Analysis
NMR Analysis
NMR spectra were acquired on a Bruker, USA, Avance Neo 600 MHz
spectrometer equipped with a 5 mm TCI cryoprobe and 24 positions SampleCase
autosampler. The experiments were carried out at 298 K in deuterium oxide (D2O) buffer
containing 1 mM d4-trimethylsilyl propionic acid sodium salt (TSP). TopSpin software
(version 4.1.1, Bruker, USA) was used for data acquisition and processing.
Briefly, NMR spectra with water presaturation during relaxation delay were
acquired using a standard pulse sequence noesygppr1d, which suppressed residual water by
applying low power selective irradiation at the water frequency during the recycle delay (D1 =
4 s) and mixing time (D8 = 0.010 s). Four dummy scans were used for equilibration, followed
by 64 scans (acquisition time = 2.6 s) collected into 65,536 points of NMR spectra with 20.8
ppm width. The spectra were processed using the Bruker AMIX data processing package.
The Free Induction Decays were zero-filled, and an exponential 0.3 Hz line-broadening
function was applied before Fourier transformation. All NMR spectra were automatically
Chapter 8. Colonic In Vitro Fermentation of Mycoprotein Promotes Shifts in Gut Microbiota and Short-Chain
Fatty Acids Production
206 | P a g e
phased, and a baseline correction was applied. The TSP peak was assigned to be at δ 0.00
ppm for an internal chemical shift reference. The determination and quantification of the
peaks in the spectra corresponding to specific compounds were carried out with Chenomx
software, Canada.
8.2.2.4 DNA Analysis
DNA Extraction
DNA extraction was carried out per the manufacturer instructions with the MP
Bio fast DNA spin kit for soil.
To the colonic in vitro fermentation sample pellet, 400 L of water (molecular
biology grade) were added for the 0, 4, 8 h timepoints, whereas 500 L of water were added
for the 24, 48, 72 h time points. Then, 500 L of the sample was moved to a Lysing Matrix E
tube, and 980 L of sodium phosphate buffer and 120 L of MT buffer were added. The
samples were homogenised in the FastPrep instrument for 3 min (3 runs of 60 seconds each,
with 5 min rest in between). Afterwards, samples were centrifuge at 14,000 xg for 15 min, and
the sample supernatant was transferred into clean 2 mL microcentrifuge tubes with 250 L of
protein precipitate solution. The tubes were mixed by shaking by hand 10 times before
centrifugation at 14,000 xg for a further 10 min. The supernatant was transferred to 5 mL
tubes with a resuspended binding matrix (1 mL of silica slurry that binds DNA from lysates),
and the tubes were inverted for 2 min allowing the DNA to bind. The tubes were placed in a
rack and allowed the matrix to settle for 1 h. Then, 500 L of the supernatant was removed,
and the binding matrix was resuspended in the remaining supernatant. The washing steps
involved the transfer of 700 L of the mixture to a SPIN filter that was centrifuged at 1,000 xg
for 2 min to empty the catch tube and transfer the leftover mixture. This process was repeated
Chapter 8. Colonic In Vitro Fermentation of Mycoprotein Promotes Shifts in Gut Microbiota and Short-Chain
Fatty Acids Production
207 | P a g e
until all the mixture had been added to the SPIN filter. The pellet in the SPIN filter was
resuspended with 500 L of ethanol-based wash solution SEWS-M. The samples were
centrifuged at 14,000 xg for 5 min, and the catch tube was emptied. Then, samples were
centrifuged a second time (Dry spin) at 14,000 xg for 5 min to remove the residual wash
solution. The catch tube was replaced with a clean tube (1.5 mL LoBind Eppendorf® tubes),
and samples in the SPIN filter were air-dried for 10 min at room temperature and 5 min at
37℃. Then, 65 L of DNA extraction solution was added to the Binding Matrix and
incubated at room temperature for 5 min before being centrifuged at 6,600 xg for 2 min with
lids open to bring eluted DNA into the tube. The SPIN Filter was discarded, and the eluted
DNA was stored at -20℃.
Libraries Preparation
The eluted DNA samples were sent to Mr David Baker and Ms Rhiannon Evans,
which carried out the libraries preparation at the Quadram Institute Bioscience in Norwich,
UK.
Briefly, genomic DNA was normalised to 5 ng/µl with 10mM Tris-HCl buffer. A
miniaturised reaction was set up using the KAPA UDI Primer Mixes, 1-96 (Roche Catalogue
No 09134336001). A master mix was prepared from 0.5 µL tagmentation buffer 1, 5 µL bead-
linked transposomes, and 4 µL PCR grade water. Then, 5 μL of this master mix were added
to a chilled 96 well plate. Afterwards, 2 µL of normalised DNA (10 ng total) was pipette mixed
with the 5 µL of the tagmentation mix and heated to 55⁰C for 15 min in a PCR block. A PCR
master mix was made up from the Kap2G Robust PCR kit (Sigma Catalogue No. KK5005)
by using 4 µL kapa2G buffer, 0.4 µL dNTP’s, 0.08 µL Polymerase and 3.52 µL PCR grade
water, and 8 µL were taken and added to a 96-well plate before adding 5 µL of UDI index
primers. Finally, the 7 µL of Tagmentation mix was added and mixed. The PCR was run with
Chapter 8. Colonic In Vitro Fermentation of Mycoprotein Promotes Shifts in Gut Microbiota and Short-Chain
Fatty Acids Production
208 | P a g e
72⁰C for 3 min, 95⁰C for 1 min, 14 cycles of 95⁰C for 10 s, 55⁰C for 20 s and 72⁰C for 3 min.
Following the PCR reaction, the libraries were quantified using the Quant-iT dsDNA Assay
Kit, high sensitivity kit (Catalogue No. 10164582) and run on a FLUOstar Optima plate
reader, UK. Libraries were pooled following quantification in equal quantities. The final pool
was double-SPRI size selected between 0.5 and 0.7X bead volumes using KAPA Pure Beads
(Roche Catalogue No. 07983298001). The final pool was quantified on a Qubit 3.0 instrument
and run on a D5000 ScreenTape (Agilent Catalogue No. 5067- 5588 & 5067- 5589) using the
Agilent Tapestation 4200 to calculate the final library pool molarity. qPCR was carried out on
an Applied Biosystems StepOne Plus machine. Samples to be quantified and diluted 1 in
10,000. A PCR master mix was made up using 10 μL KAPA SYBR FAST qPCR Master Mix
(2X) (Sigma Catalogue No. KK4600), 0.4 μL ROX High, 0.4 μL 10 μM forward primer, 0.4
μL 10 μM reverse primer, 4 μL template DNA, and 4.8 μL PCR grade water. The PCR
program run was 95⁰C for 3 min, 40 cycles of 95⁰C for 10 s, 60⁰C for 30 s. Standards were
made from a 10 nM stock of Phix, dilution made in PCR grade water. The standard range was
from 20 pmol to 0.0002 pmol.
Samples were then ready to be sent for metagenomics shotgun sequencing to be
run along with sample names and index combinations used. Demultiplexed fastq’s are
returned on a hard drive.
Shotgun Metagenomics Sequencing and Analysis
Metagenomics shotgun sequencing was performed by Genewiz European
Headquarters (Germany), using Illumina NovaSeq, to generate 150 bp paired-end libraries to
a sequencing depth of 10 million reads.
Chapter 8. Colonic In Vitro Fermentation of Mycoprotein Promotes Shifts in Gut Microbiota and Short-Chain
Fatty Acids Production
209 | P a g e
Metagenomics Read Processing
Dr Perla Troncoso-Rey performed this analysis at the Quadram Institute
Bioscience, UK. DNA host contamination is expected in metagenomics datasets, and so the
first step in processing the sequencing data is to remove host sequences using bowtie and
bowtie indexes. KneadData (Biobakery/KneadData, Accessed: 10/11/2021) was used to
remove adapter sequences, perform quality control using Trimmomatic (Bolger, Lohse, &
Usadel, 2014) and remove contaminant sequences. KneadData was used to remove host
contaminants using the human (hg37) reference database (includes human genome and
transcriptome). This database is based on the Decoy Genome (CureFFI.org, Accessed:
11/10/2021), and contaminants were taken from Breitwieser, Pertea, Zimin, and Salzberg
(2019). In addition, bacterial rRNA reads from SILVA database (Quast et al., 2013) were also
removed. KneadData was used with the option –run-trim-repetitive for shotgun sequences to
trim overrepresented sequences. High quality trimmed and non-contaminant reads are used
for downstream analyses.
Microbial Community Profiling
An initial exploratory analysis was performed using a Multidimensional Scaling
(MDS) plot. MDS plot is an ordination plot where points represent objects, in this case,
samples, in which closer points are more alike than those further apart. The plot points were
arranged so that the distances among each pair of points represent the dissimilarity between
those 2 samples.
8.2.2.5 Microscopy Analysis
Optical microscopy in epi-fluorescence mode was performed on the samples pellet
after fixation. CFW dye was used in proportion 2:1 (dye:samples).

Chapter 8. Colonic In Vitro Fermentation of Mycoprotein Promotes Shifts in Gut Microbiota and Short-Chain
Fatty Acids Production
210 | P a g e
The samples were fixed with paraformaldehyde (PFA). Briefly, 1 mL taken from the
respective time point was centrifuged at 13,000 xg for 3 min to remove the supernatant and
resuspend in 400 L of PBS and 1.1 mL of PFA solution (4% in PBS, pH 6.9) at 4℃
overnight. Then, the tubes were centrifuged at 13,000 xg for 3 min to remove the supernatant,
and a further 3 washes were performed with 1 mL PBS. Finally, the pellet was resuspended in
600 L of ethanol (50%) in PBS and stored at -20°C.
8.2.2.6 Data Analysis
Data were analysed by GraphPad Prism version 5 for Windows (GraphPad Software,
USA), statistical significance was set at p-value < 0.05. Values were expressed as average ±
confidence interval at 95% (CI95%) of six independent measures (n = 6) for the metabolomic
analysis, and average ± standard deviation (SD) of six independent measures (n = 6) for protein
and carbohydrate analysis. The MDS plots were generated using the metaMDS function of
the R package vegan, version 2.5-7 (R Studio, USA).
8.3 Results & Discussion
8.3.1 Protein and Carbohydrate Digestion in the Upper Gastrointestinal
Tract
The samples went through the INFOGEST simulation of the upper GIT before in vitro
colonic fermentation. The undigested protein, reducing sugars and -glucans that remained in
the samples pellet after simulated GI digestion were analysed as described in Section 8.2.2.1
and are reported in Table 8.4.

Chapter 8. Colonic In Vitro Fermentation of Mycoprotein Promotes Shifts in Gut Microbiota and Short-Chain
Fatty Acids Production
211 | P a g e
Table 8.4. Total protein, reducing sugars and -glucans from the whole respective sample (wt%)
remaining in the substrates pellet (MYC, OAT, and CKN) after simulated upper GI digestion and
before inoculation in the colonic batch fermentation. n/d: not detected; n/a: not applicable.
Sample Proteins (wt%) Carbohydrates (wt%) -Glucans (wt%)
MYC 68.13 ± 0.86 30.32 ± 3.75 72.78 ± 6.30
OAT 74.64 ± 1.04 24.95 ± 1.16 81.92 ± 3.11
CKN 41.63 ± 2.97 n/d n/a
MYC had 68.13 ± 0.86 wt% and 30.32 ± 3.75 wt% of protein and carbohydrates
remaining in the pellet, respectively. These measures suggest that ~32 wt% and ~70 wt% of
MYC proteins and carbohydrates, respectively, were released from the pellet (in the
supernatant) and digested. This is in line with the protein release value measured in Chapter
3. Indeed, the protein release value was 30.1 ± 2.42 wt% in a similar condition with the activity
of trypsin at 2000 U/mL. On the other hand, MYC carbohydrate digestion in Chapter 4 was
based on 200 U/mL of -amylase, whereas this digestion was based on trypsin activity.
Nonetheless, the value of ~70 wt% based on trypsin activity was close to the 61.09 ± 2.59 wt%
based on -amylase activity measured in Chapter 4. Similarly, OAT kept 74.64 ± 1.04 wt%
and 24.95 ± 1.16 wt% of proteins and carbohydrates after upper simulated GI digestion,
respectively. This suggests that ~25 wt% of its protein and ~75 wt% of its carbohydrates were
released. On the other hand, CKN carbohydrates were not detected, whereas the protein
remaining value was 41.63 ± 2.97 wt%, suggesting a protein release of ~59 wt%.
The pellets from MYC and OAT obtained after simulated gastrointestinal digestion
were mixed with the respective pellet fraction recovered from the aqueous ethanol (80% v/v)
precipitation applied to recover soluble -glucans from the supernatant after digestion (as
described in Section 8.2.2.1). The -glucans value was 72.78 ± 6.30 wt% for MYC and 81.92
± 3.11 wt% for OAT. These measurements imply that ~27 wt% of the MYC and ~18 wt% of
Chapter 8. Colonic In Vitro Fermentation of Mycoprotein Promotes Shifts in Gut Microbiota and Short-Chain
Fatty Acids Production
212 | P a g e
the OAT -glucans were lost after the upper GI simulated digestion, despite the ethanol
precipitation that aimed to recover the soluble -glucans released in the supernatant. This loss
can be due to the release of soluble low molecular weight -glucans from the cell walls that can
escape the ethanol precipitation (Manzi & Pizzoferrato, 2000).
8.3.2 Metagenomic Analysis
Shotgun metagenomic analysis was carried out to determine the taxonomic shifts in the
microbial abundance promoted by different substrates (CNT, MYC, OAT, and CKN) during
colonic in vitro fermentation.
8.3.2.1 Processing Metagenomics Data Quality Control
Figure 8.1 shows the average number of reads used for downstream analysis for each
substrate. The figure shows that the sequencing data is high quality, with around 19% of reads
being removed for samples treated with any substrates.
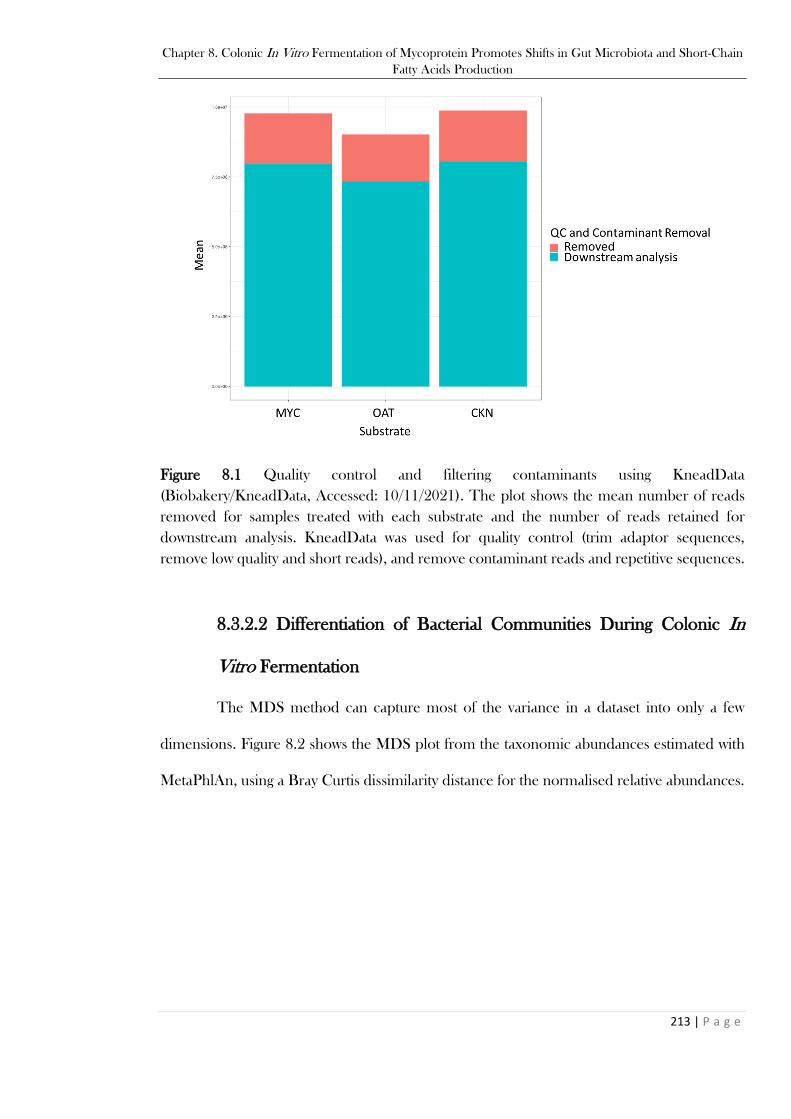
Chapter 8. Colonic In Vitro Fermentation of Mycoprotein Promotes Shifts in Gut Microbiota and Short-Chain
Fatty Acids Production
213 | P a g e
Figure 8.1 Quality control and filtering contaminants using KneadData
(Biobakery/KneadData, Accessed: 10/11/2021). The plot shows the mean number of reads
removed for samples treated with each substrate and the number of reads retained for
downstream analysis. KneadData was used for quality control (trim adaptor sequences,
remove low quality and short reads), and remove contaminant reads and repetitive sequences.
8.3.2.2 Differentiation of Bacterial Communities During Colonic In
Vitro Fermentation
The MDS method can capture most of the variance in a dataset into only a few
dimensions. Figure 8.2 shows the MDS plot from the taxonomic abundances estimated with
MetaPhlAn, using a Bray Curtis dissimilarity distance for the normalised relative abundances.
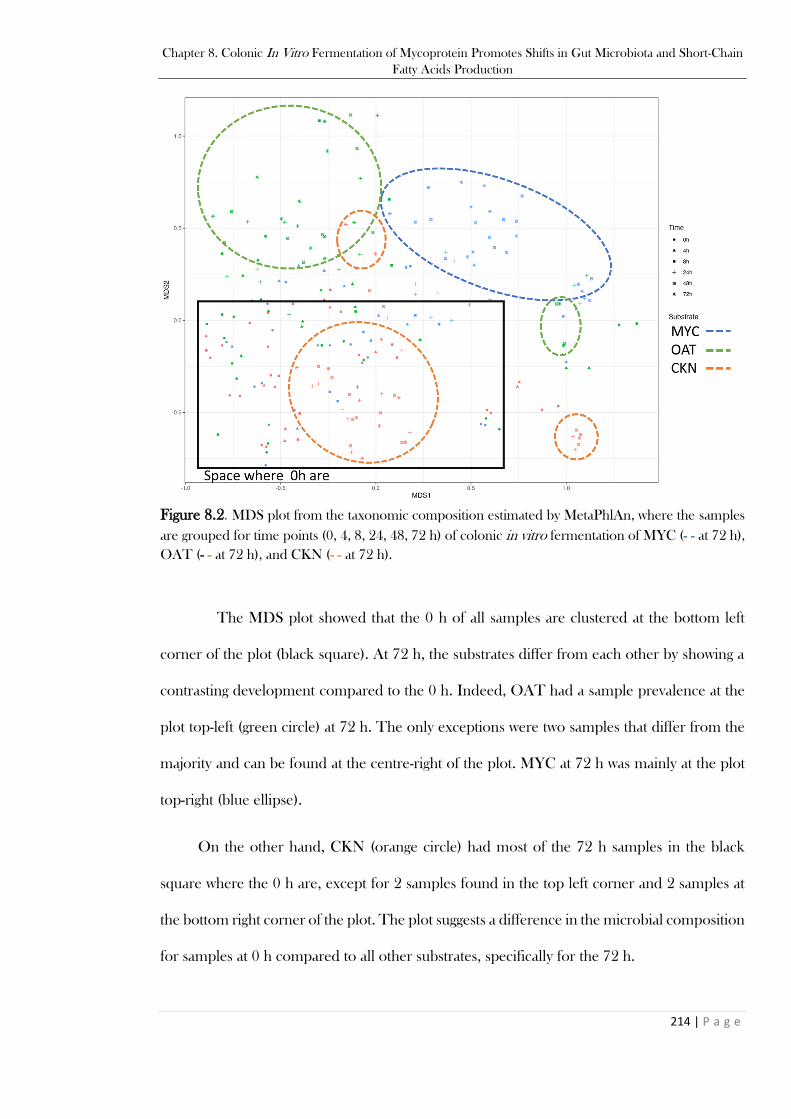
Chapter 8. Colonic In Vitro Fermentation of Mycoprotein Promotes Shifts in Gut Microbiota and Short-Chain
Fatty Acids Production
214 | P a g e
Figure 8.2. MDS plot from the taxonomic composition estimated by MetaPhlAn, where the samples
are grouped for time points (0, 4, 8, 24, 48, 72 h) of colonic in vitro fermentation of MYC (- - at 72 h),
OAT (- - at 72 h), and CKN (- - at 72 h).
The MDS plot showed that the 0 h of all samples are clustered at the bottom left
corner of the plot (black square). At 72 h, the substrates differ from each other by showing a
contrasting development compared to the 0 h. Indeed, OAT had a sample prevalence at the
plot top-left (green circle) at 72 h. The only exceptions were two samples that differ from the
majority and can be found at the centre-right of the plot. MYC at 72 h was mainly at the plot
top-right (blue ellipse).
On the other hand, CKN (orange circle) had most of the 72 h samples in the black
square where the 0 h are, except for 2 samples found in the top left corner and 2 samples at
the bottom right corner of the plot. The plot suggests a difference in the microbial composition
for samples at 0 h compared to all other substrates, specifically for the 72 h.
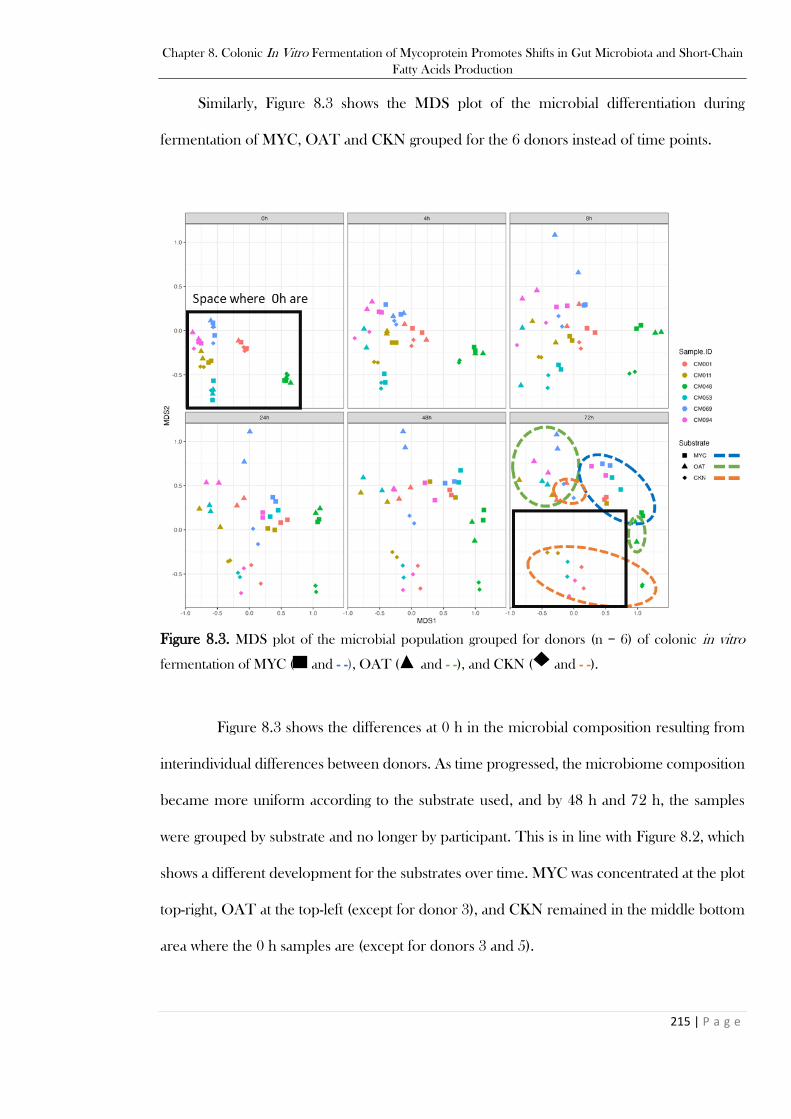
Chapter 8. Colonic In Vitro Fermentation of Mycoprotein Promotes Shifts in Gut Microbiota and Short-Chain
Fatty Acids Production
215 | P a g e
Similarly, Figure 8.3 shows the MDS plot of the microbial differentiation during
fermentation of MYC, OAT and CKN grouped for the 6 donors instead of time points.
Figure 8.3. MDS plot of the microbial population grouped for donors (n = 6) of colonic in vitro
fermentation of MYC ( and - -), OAT ( and - -), and CKN ( and - -).
Figure 8.3 shows the differences at 0 h in the microbial composition resulting from
interindividual differences between donors. As time progressed, the microbiome composition
became more uniform according to the substrate used, and by 48 h and 72 h, the samples
were grouped by substrate and no longer by participant. This is in line with Figure 8.2, which
shows a different development for the substrates over time. MYC was concentrated at the plot
top-right, OAT at the top-left (except for donor 3), and CKN remained in the middle bottom
area where the 0 h samples are (except for donors 3 and 5).

Chapter 8. Colonic In Vitro Fermentation of Mycoprotein Promotes Shifts in Gut Microbiota and Short-Chain
Fatty Acids Production
216 | P a g e
8.3.2.3 Taxonomic Analysis
Taxonomic analysis of the species developing from the colonic in vitro fermentation
of CNT, MYC, OAT, and CKN is shown in Figure 8.4.
Figure 8.4. Relative abundance for the 10 most abundant species developing from CNT, MYC, OAT,
and CKN during colonic in vitro fermentation (0, 4, 8, 24, 58, and 72 h).
This analysis revealed that the microbial population at 0 h had an overall abundance
of Prevotella copri in MYC, OAT, CKN, and CNT. At 4 h, Bacteroides vulgatus increased in
abundance in all the substrates, whereas OAT showed a marked difference compared to the
0 h and the other substrates with an increase in Faecalibacterium prausnitzii and Collinsella
aerofaciens. At 8 h, the trend was similar to 4h, but MYC started showing an abundance of
Bacteroides uniformis, and OAT had an increase of E. Coli that replaced C. aerofaciens.
Then, the 24 h of fermentation saw an increase in C. aerofaciens in OAT, B. uniformis and
Bacteroides ovatus in MYC, whereas CKN remained similar to the 8 h with an overall
abundance of P. copri and B. vulgatus. At 48 h, the trends remained similar to the 24 h in

Chapter 8. Colonic In Vitro Fermentation of Mycoprotein Promotes Shifts in Gut Microbiota and Short-Chain
Fatty Acids Production
217 | P a g e
MYC and OAT, but CKN had Bacteroides vulgatus replaced by C. aerofaciens. The 72 h
time points showed that the abundance of the 10 predominant species was higher in MYC,
followed by OAT, whereas CKN had the lowest abundance. C. aerofaciens was prevalent in
OAT, B. ovatus in MYC, and Colinsella aerofaciens in CKN.
Overall, the relative abundance for the 10 most abundant species for OAT and MYC
was higher than CKN, which was similar to the CNT. Moreover, Figure 8.4 supports the
findings of Figure 8.2 and Figure 8.3 that showed differentiation in the microbial population
in MYC and OAT over time. MYC showed a consistent increase of B. ovatus and B. uniformis
from the 24 h of fermentation. Bacteroides species are abundant anaerobic bacteria in the
human gut microbiota that are recognised as primary degraders of complex carbohydrates
such as -glucans (Centanni, Sims, Bell, Biswas, & Tannock, 2020; Fernandez-Julia, Munoz-
Munoz, & van Sinderen, 2021; Singh, Thakur, & Kumar, 2021). An increase in Bacteroides
species is in line with the Marzorati, Maquet, and Possemiers (2017) study, which reported an
increase of Bacteroidetes phylum when isolated doses of chitin/glucans (main components of
FCW) were administered in a colonic in vitro model (SHIME®). Moreover, B. ovatus has
been described as a novel probiotic that can improve the intestinal environment (Oba et al.,
2020), and it is known for degrading -glucans (Tamura et al., 2019). Furthermore, Ihekweazu
et al. (2019) showed that B. ovatus ATCC 8483 monotherapy helps ameliorate colitis and
stimulate epithelial recovery in a murine model of inflammatory bowel disease. Similarly, B.
uniformis may benefit in modulating mice metabolic responses by attenuating obesity
progression and limiting intestinal absorption of lipids (López-Almela et al., 2021). A bacterial
species that could be beneficial for CVD protection is Bacteroides vulgatus. The latter can
limit atherosclerosis (Yoshida et al., 2018), but it has been observed in MYC and OAT at 4 h
and 8 h and then disappeared at 24 h of colonic fermentation. In like manner, B. vulgatus was
observed in CKN from 4h to 24 h.
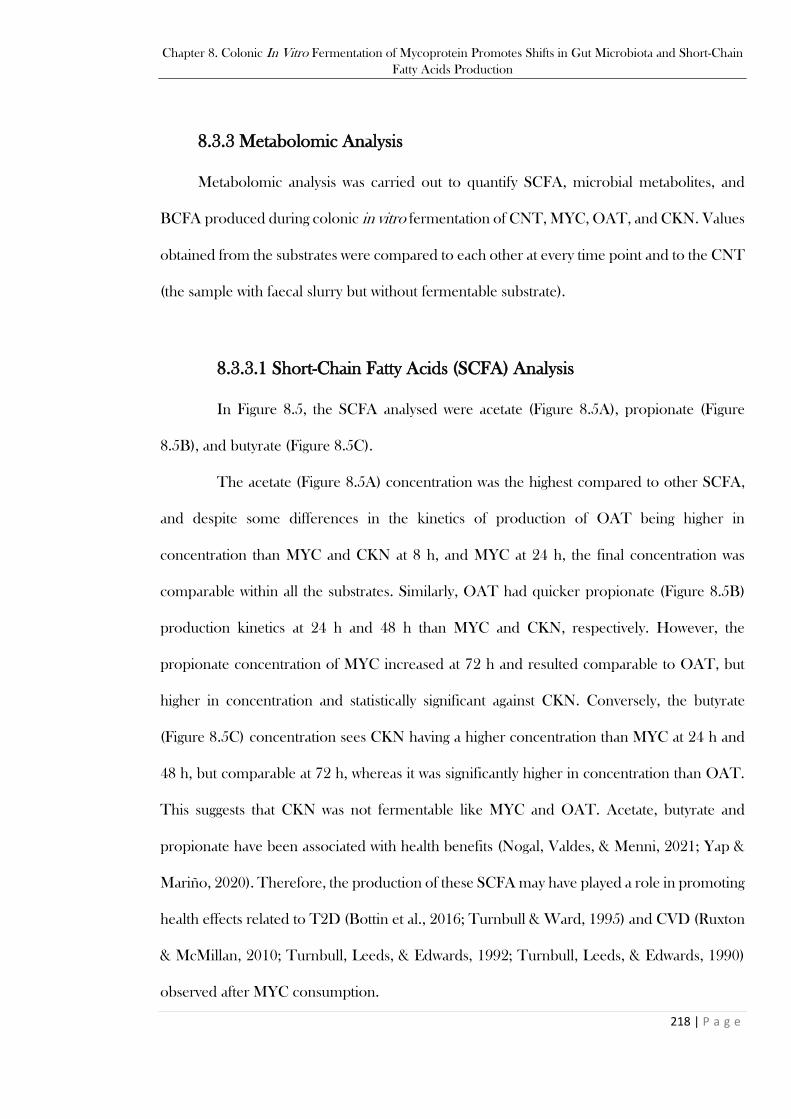
Chapter 8. Colonic In Vitro Fermentation of Mycoprotein Promotes Shifts in Gut Microbiota and Short-Chain
Fatty Acids Production
218 | P a g e
8.3.3 Metabolomic Analysis
Metabolomic analysis was carried out to quantify SCFA, microbial metabolites, and
BCFA produced during colonic in vitro fermentation of CNT, MYC, OAT, and CKN. Values
obtained from the substrates were compared to each other at every time point and to the CNT
(the sample with faecal slurry but without fermentable substrate).
8.3.3.1 Short-Chain Fatty Acids (SCFA) Analysis
In Figure 8.5, the SCFA analysed were acetate (Figure 8.5A), propionate (Figure
8.5B), and butyrate (Figure 8.5C).
The acetate (Figure 8.5A) concentration was the highest compared to other SCFA,
and despite some differences in the kinetics of production of OAT being higher in
concentration than MYC and CKN at 8 h, and MYC at 24 h, the final concentration was
comparable within all the substrates. Similarly, OAT had quicker propionate (Figure 8.5B)
production kinetics at 24 h and 48 h than MYC and CKN, respectively. However, the
propionate concentration of MYC increased at 72 h and resulted comparable to OAT, but
higher in concentration and statistically significant against CKN. Conversely, the butyrate
(Figure 8.5C) concentration sees CKN having a higher concentration than MYC at 24 h and
48 h, but comparable at 72 h, whereas it was significantly higher in concentration than OAT.
This suggests that CKN was not fermentable like MYC and OAT. Acetate, butyrate and
propionate have been associated with health benefits (Nogal, Valdes, & Menni, 2021; Yap &
Mariño, 2020). Therefore, the production of these SCFA may have played a role in promoting
health effects related to T2D (Bottin et al., 2016; Turnbull & Ward, 1995) and CVD (Ruxton
& McMillan, 2010; Turnbull, Leeds, & Edwards, 1992; Turnbull, Leeds, & Edwards, 1990)
observed after MYC consumption.

Chapter 8. Colonic In Vitro Fermentation of Mycoprotein Promotes Shifts in Gut Microbiota and Short-Chain
Fatty Acids Production
219 | P a g e
Figure 8.5 SCFA (Figure 8.5A, acetate; Figure 8.5B, propionate ; Figure 8.5C, butyrate) measured by
NMR from CNT ( ) , MYC ( ), OAT ( ), and CKN ( ) during 72 h of in vitro colonic
fermentation. One-way ANOVA, Dunnett post hoc test (p-value < 0.05); * p-value < 0.05, ** p-value
< 0.01, *** p-value < 0.001 are statistically significant compared to the CNT. Letters are used to report
statistical differences within the substrates (e.g., MYC vs OAT, MYC vs CKN, OAT vs CKN).
8.3.3.2 Microbial Metabolites Analysis
Figure 8.6 shows the lactate (Figure 8.6A), formate (Figure 8.6B), valerate (Figure
8.6C), and ethanol (Figure 8.6D) produced after colonic in vitro fermentation from CNT,
MYC, OAT, and CKN.
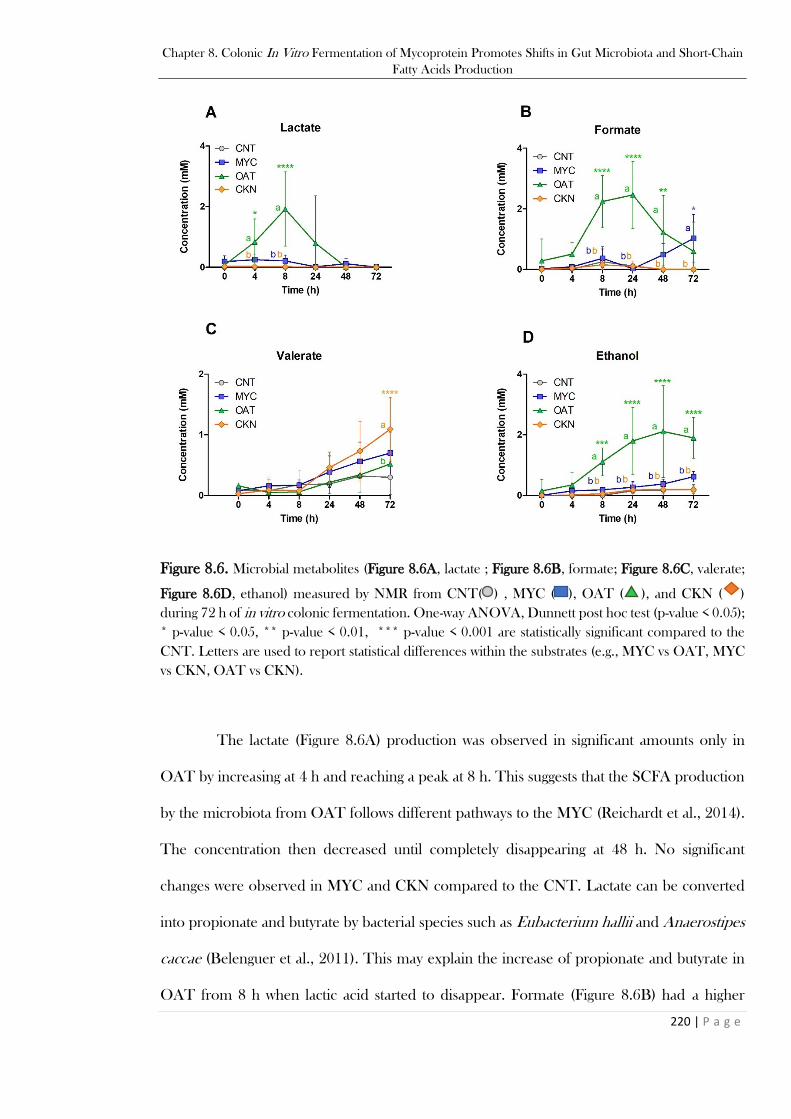
Chapter 8. Colonic In Vitro Fermentation of Mycoprotein Promotes Shifts in Gut Microbiota and Short-Chain
Fatty Acids Production
220 | P a g e
Figure 8.6. Microbial metabolites (Figure 8.6A, lactate ; Figure 8.6B, formate; Figure 8.6C, valerate;
Figure 8.6D, ethanol) measured by NMR from CNT( ) , MYC ( ), OAT ( ), and CKN ( )
during 72 h of in vitro colonic fermentation. One-way ANOVA, Dunnett post hoc test (p-value < 0.05);
* p-value < 0.05, ** p-value < 0.01, *** p-value < 0.001 are statistically significant compared to the
CNT. Letters are used to report statistical differences within the substrates (e.g., MYC vs OAT, MYC
vs CKN, OAT vs CKN).
The lactate (Figure 8.6A) production was observed in significant amounts only in
OAT by increasing at 4 h and reaching a peak at 8 h. This suggests that the SCFA production
by the microbiota from OAT follows different pathways to the MYC (Reichardt et al., 2014).
The concentration then decreased until completely disappearing at 48 h. No significant
changes were observed in MYC and CKN compared to the CNT. Lactate can be converted
into propionate and butyrate by bacterial species such as Eubacterium hallii and Anaerostipes
caccae (Belenguer et al., 2011). This may explain the increase of propionate and butyrate in
OAT from 8 h when lactic acid started to disappear. Formate (Figure 8.6B) had a higher
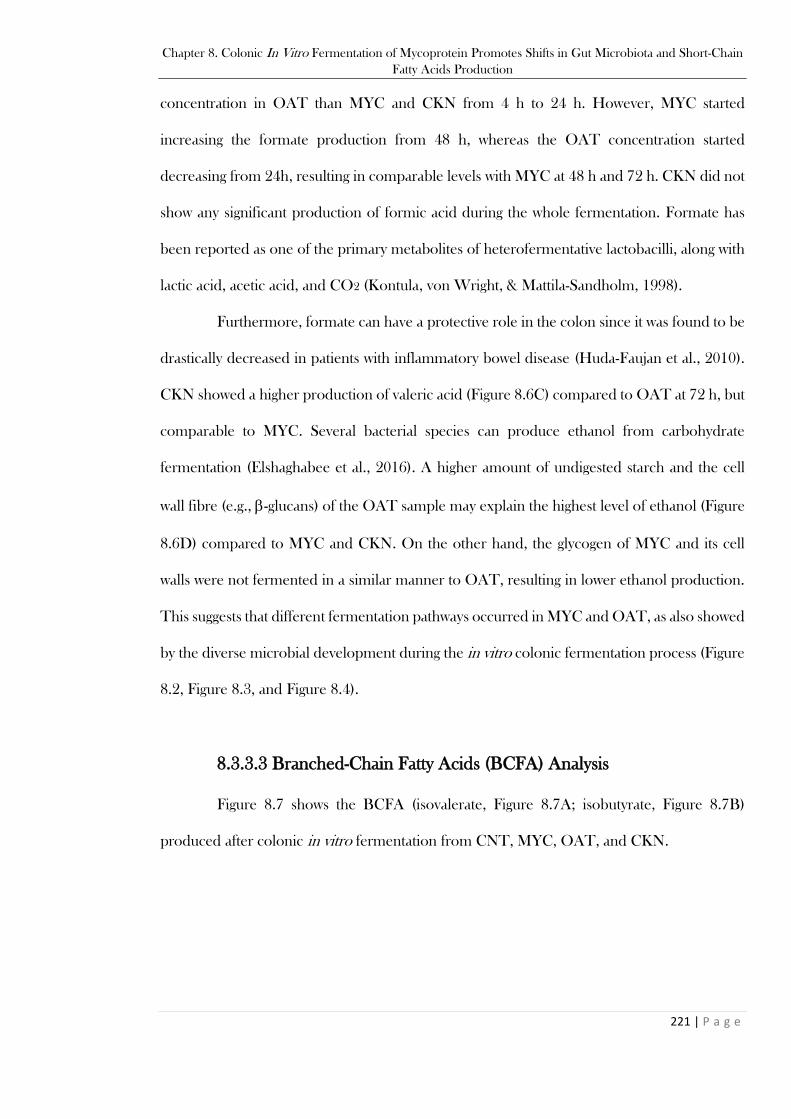
Chapter 8. Colonic In Vitro Fermentation of Mycoprotein Promotes Shifts in Gut Microbiota and Short-Chain
Fatty Acids Production
221 | P a g e
concentration in OAT than MYC and CKN from 4 h to 24 h. However, MYC started
increasing the formate production from 48 h, whereas the OAT concentration started
decreasing from 24h, resulting in comparable levels with MYC at 48 h and 72 h. CKN did not
show any significant production of formic acid during the whole fermentation. Formate has
been reported as one of the primary metabolites of heterofermentative lactobacilli, along with
lactic acid, acetic acid, and CO2 (Kontula, von Wright, & Mattila-Sandholm, 1998).
Furthermore, formate can have a protective role in the colon since it was found to be
drastically decreased in patients with inflammatory bowel disease (Huda-Faujan et al., 2010).
CKN showed a higher production of valeric acid (Figure 8.6C) compared to OAT at 72 h, but
comparable to MYC. Several bacterial species can produce ethanol from carbohydrate
fermentation (Elshaghabee et al., 2016). A higher amount of undigested starch and the cell
wall fibre (e.g., -glucans) of the OAT sample may explain the highest level of ethanol (Figure
8.6D) compared to MYC and CKN. On the other hand, the glycogen of MYC and its cell
walls were not fermented in a similar manner to OAT, resulting in lower ethanol production.
This suggests that different fermentation pathways occurred in MYC and OAT, as also showed
by the diverse microbial development during the in vitro colonic fermentation process (Figure
8.2, Figure 8.3, and Figure 8.4).
8.3.3.3 Branched-Chain Fatty Acids (BCFA) Analysis
Figure 8.7 shows the BCFA (isovalerate, Figure 8.7A; isobutyrate, Figure 8.7B)
produced after colonic in vitro fermentation from CNT, MYC, OAT, and CKN.
Chapter 8. Colonic In Vitro Fermentation of Mycoprotein Promotes Shifts in Gut Microbiota and Short-Chain
Fatty Acids Production
222 | P a g e
Figure 8.7. BCFA (Figure 8.7A, isovalerate; Figure 8.7B, isobutyrate) measured by NMR from CNT
( ) , MYC ( ), OAT ( ), and CKN ( ) during 72 h of in vitro colonic fermentation. One-way
ANOVA, Dunnett post hoc test (p-value < 0.05); * p-value < 0.05, ** p-value < 0.01, *** p-value <
0.001 are statistically significant compared to the CNT. Letters are used to report statistical differences
within the substrates (e.g., MYC vs OAT, MYC vs CKN, OAT vs CKN).
The BCFA isovalerate (Figure 8.7A) and isobutyrate (Figure 8.7B) saw CKN as the
higher producer compared to MYC and OAT starting from 24 h. The intestinal microbiota
can produce BCFA through protein fermentation and, in particular, through branched-chain
AA (i.e., valine, leucine, and isoleucine) (Macfarlane, Gibson, Beatty, & Cummings, 1992).
The fermentation of branched-chain AA is usually carried out by Bacteroides and Clostridium
species (Rios-Covian et al., 2020). However, interventional studies in healthy volunteers
following a diet with high vs average protein content did not find any change in the species
Chapter 8. Colonic In Vitro Fermentation of Mycoprotein Promotes Shifts in Gut Microbiota and Short-Chain
Fatty Acids Production
223 | P a g e
mentioned above, whilst lower Bifidobacteria and total bacterial count were recorded
(Brinkworth, Noakes, Clifton, & Bird, 2009; Duncan et al., 2007).
Although branched-chain AA, as precursors of BCFA, have been associated with
T2D and CVD (Newgard, 2012), some studies have found no relationship between BCFA
and metabolic diseases. For example, Hernández, Canfora, and Blaak (2021) reported that no
relationship of BCFA with insulin resistance and metabolic health parameters was found. This
was in line with Fernandes, Su, Rahat-Rozenbloom, Wolever, and Comelli (2014), who did
not find any association in the BCFA levels between overweight/obese and healthy individuals.
8.3.4 Structural Changes in Mycoprotein Matrix After Colonic In Vitro
Fermentation
Figure 8.8 shows the optical microscopy in epi-fluorescence mode performed during the
72 h of colonic in vitro fermentation of MYC. The filamentous cells of MYC were visible at 0
h, as also discussed and shown in Chapter 3. The cells appeared well defined and intact after
the upper GI digestion despite the loss of some nutrients (Table 8.4). The characteristic
cellular shape of MYC hyphae was still visible until 48 h. However, after 72 h, the cell shape
was not observable anymore and appeared as a digested mass. This result was similar to what
was observed after incubation with the cell-wall-degrading enzyme Driselase™ (Chapter 3,
Section 3.3.2), suggesting that bacteria digested the cell wall of MYC.

Chapter 8. Colonic In Vitro Fermentation of Mycoprotein Promotes Shifts in Gut Microbiota and Short-Chain
Fatty Acids Production
224 | P a g e
Figure 8.8. Optical microscopy in epi-fluorescence (with CFW) of MYC at 0, 4, 8, 24, 48, and 72 h
of in vitro colonic fermentation.
8.4 Conclusions
This chapter showed that MYC and OAT are fermentable substrates promoting a higher
differentiation in the colonic microbiota in vitro compared to CKN. Bacteroides uniformis
and ovatus species have been found in great abundance in MYC at the end of fermentation
(72 h) and are well characterised -glucan degrading species. These species can also promote
health effects that deserve further investigation into the link between gut microbes and health

Chapter 8. Colonic In Vitro Fermentation of Mycoprotein Promotes Shifts in Gut Microbiota and Short-Chain
Fatty Acids Production
225 | P a g e
impact after MYC consumption. The metabolomic analysis revealed the production of SCFA
in all substrates, whereas CKN was the higher producer of BCFA. The acetic acid production
at the end of fermentation was comparable in terms of concentration (mM) between all
substrates; propionate production differed from MYC to CKN but was comparable in terms
of concentrations with OAT; butyrate levels were higher in CKN than OAT but comparable
with MYC. Moreover, the hyphal structure of MYC was damaged after 72 h of colonic in vitro
fermentation as revealed by epi-fluorescence microscopy, suggesting the bacterial fermentation
of the cell walls fibres of MYC, as also shown by an increasing trend of SCFA in the last time
points (48 h – 72 h).
Overall, this chapter suggests that MYC colonic fermentation can promote changes in the
colonic microbial profile and produce SCFA. These findings are relevant to understanding
how MYC can modulate lipid and carbohydrate digestion and metabolism and, hence, reduce
the risk of T2D and CVD.

Chapter 9. Conclusions & Future Perspectives
226 | P a g e
Chapter 9
Conclusions & Future Perspectives
Chapter 9. Conclusions & Future Perspectives
227 | P a g e
9.1 General Conclusions
Findings over many years have suggested that mycoprotein (MYC) consumption influences
carbohydrate and lipid digestion. This leads to improved glucose/insulin responses and
reductions in blood lipids, which can be beneficial to the risk of developing type-2 diabetes
(T2D) and cardiovascular diseases (CVD), respectively (Bottin et al., 2016; Dunlop et al.,
2017; Turnbull, Leeds, & Edwards, 1992; Turnbull, Leeds, & Edwards, 1990; Turnbull &
Ward, 1995). Moreover, despite MYC structural complexity and the presence of intact cells,
the protein bioavailability from MYC appeared to be comparable to milk proteins (Dunlop et
al., 2017) or even higher (Monteyne et al., 2020). As discussed in Chapter 1, a general
conclusion of most studies was that the dietary fibre (DF) from MYC plays a crucial role in
influencing physiological responses and controlling the delivery of nutrients in the
gastrointestinal tract (GIT). However, the precise mechanisms underlying these effects are not
fully clear. The studies presented in this thesis investigated the behaviour of MYC during
simulated gastrointestinal (GI) digestion to understand the biochemical mechanisms that may
have influenced the digestion and the physiological responses after MYC consumption, which
led to health benefits such as reduced blood lipids and improved insulin response.
Chapter 3 showed how MYC released intracellular proteins when exposed to different
processing treatments, such as homogenisation, glass bead grinding, and ultra-sonication.
These treatments were compared to enzymatic treatment with cell wall degrading enzymes
(Driselase™) and GI digestive enzymes. The results showed that MYC cell walls are resilient
to physico-chemical and mechanical stress and enzymatic digestion. As expected, the fibrous
cell walls are not digested in the upper GIT and are crucial components in controlling the
release of its nutrients. These findings suggest that intestinal proteases are the main factor
controlling the high protein bioavailability observed in vivo. Thus, enzymes could diffuse
through the intact cell walls and hydrolyse the intracellular proteins.
Chapter 9. Conclusions & Future Perspectives
228 | P a g e
Enzymatic diffusion was also investigated in Chapter 4 with the enzyme -amylase. The
findings presented in this chapter showed that -amylase could diffuse thanks to the cell wall
porosity/permeability to digest intracellular nutrients. Indeed, confocal laser scanning
microscopy (CLSM) showed, in a Z-stack experiment, that a fluorescein isothiocyanate isomer
I (FITC) conjugated -amylase was found within the cells and, hence, diffused through the
cell walls. These results were also significant to understand the improved glucose and insulin
homeostasis after MYC consumption discussed in Chapter 1. The presence of -amylase
inside the cells suggests that the enzyme was trapped within the matrix. Therefore, the enzyme
concentration in the solution was reduced. This is in line with the kinetic digestion of starch in
the presence of MYC, which showed that the addition of MYC could act as an enzymatic
inhibitor. Thus, reduced starch hydrolysis suggests that the carbohydrate digestion in vivo
could be influenced by the presence of MYC and lead to slower digestion that can impact
insulin and glucose homeostasis.
Similarly, the impact of MYC on lipid digestion was investigated in Chapter 5. The
interaction of MYC with lipase and bile salts (BS) showed that MYC could reduce lipolysis
similar to what was observed with starch and -amylase. However, this is not the only
mechanism, as MYC can also bind and reduce BS concentrations. This implies that MYC can
reduce blood lipids in vivo by altering lipid digestion through lipolysis reduction and BS
binding.
The main factor controlling the sequestration of -amylase, or the reduction of lipolysis
and BS concentration, appeared to be the cell wall of MYC. This is supported by the
experiments with isolated MYC protein that failed to reproduce the same effects promoted by
the whole MYC. Indeed, isolated MYC protein led to a modest starch hydrolysis reduction in
Chapter 4. However, Chapter 5 shows that isolated MYC protein can also have a similar effect
to the whole MYC structure in the process of binding BS in simulated intestinal digestion with
Chapter 9. Conclusions & Future Perspectives
229 | P a g e
trypsin. Nevertheless, this effect was cancelled when the MYC proteins were previously
exposed to gastric digestion.
The MYC cell walls appeared intact when observed by microscopy at the end of every GI
digestion. Nonetheless, Chapter 6 shows that the -glucans from MYC cell walls can be
released if cooked before digestion, whereas no release was observed if not cooked. Despite
the release of -glucans, the cell walls did not show any apparent visual difference between the
fully digested cooked or uncooked cells in scanning electronic microscopy (SEM). The only
difference was seen before and after digestion. Before GI digestion, the cells looked full,
wrinkled and cylindrical, whereas, after digestion, they were flattened and smoother.
Moreover, a slight increase in viscosity was observed when MYC was cooked.
The release of minor compounds such as ergothioneine and phenolic acids was also
investigated and discussed in Chapter 7 to see if they were present within the MYC matrix and
could have been considered in promoting health benefits. However, no phenolic compounds
were observed after simulated GI digestion, whereas ergothioneine (ERG) was detected. These
findings suggested that phenolic compounds are unlikely to play a crucial role in modulating
health effects after MYC consumption, whilst the role of ERG in promoting health benefits
requires future research.
The final part of digestion involves colonic fermentation and was analysed in Chapter 8.
The control of insulin/glucose homeostasis and blood lipids can be mediated by changes in
the microbial population of the resident microbiota and the bacterial production of
metabolites such as short-chain fatty acids (SCFA). MYC was shown to be a fermentable
substrate in a colonic in vitro model that leads to changes in the microbiota and production of
SCFA. Some bacterial species, such as Bacteroides uniformis and ovatus, increased
particularly in MYC compared to an oat and chicken control. These findings suggest that MYC
may promote health benefits by modulating changes in the microbiota and producing SCFA.
Chapter 9. Conclusions & Future Perspectives
230 | P a g e
Overall, this thesis provides insight regarding the influence of MYC on digestion and
subsequent physiological responses. The in vivo studies mentioned in Chapter 1 offered
valuable observations that required further in vitro investigations to reveal the underpinning
biochemical mechanisms behind the health benefits observed after MYC consumption. The
common theme from this thesis regarding MYC functionality is the importance of the fungal
cell wall in controlling the release of nutrients, and the reduction and control of carbohydrates
and lipids digestion are crucial factors that may explain the health benefits observed by the in
vivo studies. Furthermore, the release of -glucans from the cell wall can increase viscosity in
the gut or fermentation in the colon that influences metabolites production and promotes
changes in the microbiota.
9.2 Future Perspectives
This thesis discusses the characterisation of the biochemical mechanisms underlying the
health effects observed after MYC consumption. The static INFOGEST model has been
applied to simulate the GI food digestion, allowing quick analysis and comparison of several
replicates. This method offered essential insights into the biochemical mechanisms underlying
protein, carbohydrate, fibre, and lipid digestion in the GI tract.
However, future studies should aim to reproduce these results with a semi-dynamic
(Mulet-Cabero et al., 2020) or dynamic method (Thuenemann, Mandalari, Rich, & Faulks,
2015) that can more accurately reproduce the complex stages and physiological processes of
GI digestion. These methods are better suited for kinetic analyses of nutrient digestion and
may offer new perspectives on the biochemical mechanisms that can promote health effects,
such as the binding of enzymes (Chapter 4) and BS (Chapter 5). Furthermore, semi-dynamic
and dynamic models allow the study of the colloidal behaviour of the food in the stomach by
measuring gastric emptying and gradually adding enzymes and decreasing pH. These features
Chapter 9. Conclusions & Future Perspectives
231 | P a g e
could be investigated in MYC to observe the impact of fungal hyphae on gastric digestion that
could be supported by in vivo studies using imaging techniques such as MRI (Magnetic
Resonance Imagining).
Similarly, these results can be confirmed with Quorn™ products. This thesis studied the
effects of MYC intended as the main ingredient of all Quorn™ products. Despite MYC being
the primary ingredient, the Quorn™ products have different textures, processing, and other
ingredients that can impact the biochemical mechanism described in the present thesis. Thus,
a range of commercialised Quorn™ products can be analysed by in vitro methods to
understand if similar results observed in this thesis can be reproduced with the marketed
products.
The findings of this thesis related to the role of the fungal cell wall in modulating digestion
in vitro can be furtherly investigated in vivo. A clinical trial to determine the role of hyphal
structure on energy intake modulation in humans is encouraged. The collection of digesta
from different GIT regions will support or offer new insight on the mechanistic explanation
for the effects of the cell wall offered in this thesis. Moreover, collecting blood and urine
samples will give a clearer picture of the physiology of MYC protein and carbohydrate
digestion.
In vitro studies on cell lines and organoids are also encouraged to analyse the digestion
biomarkers such as hormones produced during digestion and the absorption process. For
instance, the control of satiety and sensation of appetite is often associated with GI hormones
such as GLP-1, leptin, ghrelin, CCK and PYY (Zanchi et al., 2017). These hormones can be
studied and analysed in cell cultures exposed to the whole MYC or MYC pellet and
supernatant from digestion models and spent media from the colon model experiments
(Chapter 8). Chapter 3 describes the mechanisms behind the protein digestion of MYC. The
protein profile of MYC can be furtherly characterised in the future by employing sensitive and

Chapter 9. Conclusions & Future Perspectives
232 | P a g e
accurate methods such as LC-MS. The protein can be isolated and characterised singularly by
in vitro digestion methods. In like manner, the protein with potential BS binding activity
described in Chapter 5 can be studied in further detail. The proteins can be generated with
recombinant techniques, and their interaction/activity on BS or enzymes can be further studied
in isolated systems.
Future investigation is required to study the colonic fermentation of fungal cell walls
regarding microbial changes and metabolite production. Studies on fungal samples that can be
compared to MYC are needed. Moreover, combining MYC with an elaborate meal (e.g.,
mixing MYC with chicken or oat) would be insightful to observe if mixing two or more
substrates can reproduce changes in bacteria and metabolites obtained by a single substrate.
Also, the analysis of isolated fibre (e.g., soluble -glucans) from MYC compared to the whole
MYC matrix can suggest which part of the cell wall contribute better to the fermentation by
the gut microbiota.
In conclusion, this thesis offered new insights into the biochemical mechanisms
underlying the health effects on T2D and CVD observed after MYC consumption. The
advance of knowledge offered by this thesis highlights the importance of considering the food
structure as an essential tool for controlling digestion and improving human health. Indeed,
these findings are significant as they can be applied to the research and development of new
products with the aim to improve digestion and human health.
233 | P a g e
References

234 | P a g e
Abete, I., Romaguera, D., Vieira, A. R., de Munain, A. L., & Norat, T. (2014). Association
between total, processed, red and white meat consumption and all-cause, CVD and
IHD mortality: a meta-analysis of cohort studies. British Journal of Nutrition, 112(5),
762-775.
Abraham, J., Sharika, T., Mishra, R. K., & Thomas, S. (2017). 14 - Rheological characteristics
of nanomaterials and nanocomposites. In R. K. Mishra, S. Thomas & N. Kalarikkal
(Eds.), Micro and Nano Fibrillar Composites (MFCs and NFCs) from Polymer
Blends, (pp. 327-350): Woodhead Publishing.
Abrams, C. K., Hamosh, M., Lee, T. C., Ansher, A. F., Collen, M. J., Lewis, J. H., Benjamin,
S. B., & Hamosh, P. (1988). Gastric lipase: localization in the human stomach.
Gastroenterology, 95(6), 1460-1464.
Adisakwattana, S., Intrawangso, J., Hemrid, A., Chanathong, B., & Mäkynen, K. (2012).
Extracts of edible plants inhibit pancreatic lipase, cholesterol esterase and cholesterol
micellization, and bind bile acids. Food Technology and Biotechnology, 50(1), 11.
Ai, Y., & Jane, J. l. (2015). Gelatinization and rheological properties of starch. Starch‐Stärke,
67(3-4), 213-224.
Akanmu, D., Cecchini, R., Aruoma, O. I., & Halliwell, B. (1991). The antioxidant action of
ergothioneine. Archives of biochemistry and biophysics, 288(1), 10-16.
Akhtar, K., Khan, S. A., Khan, S. B., & Asiri, A. M. (2018). Scanning Electron Microscopy:
Principle and Applications in Nanomaterials Characterization. In S. K. Sharma (Ed.),
Handbook of Materials Characterization, (pp. 113-145). Cham: Springer International
Publishing.
Alamgir, K. M., Masuda, S., Fujitani, Y., Fukuda, F., & Tani, A. (2015). Production of
ergothioneine by Methylobacterium species. Frontiers in microbiology, 6, 1185.
235 | P a g e
Ali, S. S., Ahmad, W. A. N. W., Budin, S. B., & Zainalabidin, S. (2020). Implication of dietary
phenolic acids on inflammation in cardiovascular disease. Reviews in cardiovascular
medicine, 21(2), 225-240.
Andrade, E., & Orlando, D. (2018). Beta-Glucans as a therapeutic agent: Literature Review.
Madridge J Food Tech, 3(2), 154-158.
Angelini, P., Girometta, C., Tirillini, B., Moretti, S., Covino, S., Cipriani, M., D’Ellena, E.,
Angeles, G., Federici, E., & Savino, E. (2019). A comparative study of the antimicrobial
and antioxidant activities of Inonotus hispidus fruit and their mycelia extracts.
International Journal of Food Properties, 22(1), 768-783.
Auty, M. A., Twomey, M., Guinee, T. P., & Mulvihill, D. M. (2001). Development and
application of confocal scanning laser microscopy methods for studying the
distribution of fat and protein in selected dairy products. Journal of Dairy Research,
68(3), 417-427.
Bak, W. C., Park, J. H., Park, Y. A., & Ka, K. H. (2014). Determination of glucan contents in
the fruiting bodies and mycelia of Lentinula edodes cultivars. Mycobiology, 42(3), 301-
304.
Balasubramaniam, V., Mustar, S., Khalid, N. M., Rashed, A. A., Noh, M. F. M., Wilcox, M.
D., Chater, P. I., Brownlee, I. A., & Pearson, J. P. (2013). Inhibitory activities of three
Malaysian edible seaweeds on lipase and α-amylase. Journal of applied phycology,
25(5), 1405-1412.
Bansal, N., & Weinstock, R. S. (2020). Non-Diabetic Hypoglycemia. Endotext [Internet].
Barbana, C., Boucher, A. C., & Boye, J. I. (2011). In vitro binding of bile salts by lentil flours,
lentil protein concentrates and lentil protein hydrolysates. Food Research
International, 44(1), 174-180.
236 | P a g e
Barrett, M. L., & Udani, J. K. (2011). A proprietary alpha-amylase inhibitor from white bean
(Phaseolus vulgaris): a review of clinical studies on weight loss and glycemic control.
Nutrition Journal, 10(1), 24.
Bauer, E., Jakob, S., & Mosenthin, R. (2005). Principles of physiology of lipid digestion. Asian-
Australasian Journal of Animal Sciences, 18(2), 282-295.
Bays, H., Evans, J., Maki, K., Evans, M., Maquet, V., Cooper, R., & Anderson, J. (2013).
Chitin-glucan fiber effects on oxidized low-density lipoprotein: a randomized
controlled trial. European journal of clinical nutrition, 67(1), 2-7.
Bays, H. E. (2011). Adiposopathy: is “sick fat” a cardiovascular disease? Journal of the
American College of Cardiology, 57(25), 2461-2473.
Beckman Coulter. (Accessed: 06/07/2021). Laser Diffraction for Particle Size Analysis; URL:
https://www.mybeckman.uk/resources/technologies/laser-diffraction. Web Page.
Beghini, F., McIver, L. J., Blanco-Míguez, A., Dubois, L., Asnicar, F., Maharjan, S., Mailyan,
A., Manghi, P., Scholz, M., & Thomas, A. M. (2021). Integrating taxonomic,
functional, and strain-level profiling of diverse microbial communities with bioBakery
3. Elife, 10, e65088.
Beisson, F., Tiss, A., Rivière, C., & Verger, R. (2000). Methods for lipase detection and assay:
a critical review. European Journal of Lipid Science and Technology, 102(2), 133-153.
Belenguer, A., Holtrop, G., Duncan, S. H., Anderson, S. E., Calder, A. G., Flint, H. J., &
Lobley, G. E. (2011). Rates of production and utilization of lactate by microbial
communities from the human colon. FEMS Microbiology Ecology, 77(1), 107-119.
Bell, S., Goldman, V. M., Bistrian, B. R., Arnold, A. H., Ostroff, G., & Forse, R. A. (1999).
Effect of β-glucan from oats and yeast on serum lipids. Critical reviews in food science
and nutrition, 39(2), 189-202.
BeMiller, J. N. (2018). Carbohydrate chemistry for food scientists: Elsevier.
237 | P a g e
Berg, J. M., Tymoczko, J. L., & Stryer, L. (2002). Protein structure and function. Biochemistry,
262, 159-173.
Berglund, D. L., Taffs, R. E., & Robertson, N. P. (1987). A rapid analytical technique for flow
cytometric analysis of cell viability using calcofluor white M2R. Cytometry, 8(4), 421-
426.
Bhattarai, R. R., Dhital, S., Mense, A., Gidley, M. J., & Shi, Y.-C. (2018). Intact cellular
structure in cereal endosperm limits starch digestion in vitro. Food hydrocolloids, 81,
139-148.
Biobakery/KneadData. (Accessed: 10/11/2021). Quality control tool on metagenomic and
metatranscriptomic sequencing data. URL: https://github.com/biobakery/kneaddata.
In).
Bolger, A. M., Lohse, M., & Usadel, B. (2014). Trimmomatic: a flexible trimmer for Illumina
sequence data. Bioinformatics, 30(15), 2114-2120.
Borodina, I., Kenny, L. C., McCarthy, C. M., Paramasivan, K., Pretorius, E., Roberts, T. J.,
van der Hoek, S. A., & Kell, D. B. (2020). The biology of ergothioneine, an antioxidant
nutraceutical. Nutrition research reviews, 33(2), 190-217.
Bottin, J., Cropp, E., Ford, H., Bétrémieux, L., Finnigan, T., & Frost, G. (2011). Mycoprotein
reduces insulinemia and improves insulin sensitivity. Proceedings of the Nutrition
Society, 70(OCE6).
Bottin, J. H., Swann, J. R., Cropp, E., Chambers, E. S., Ford, H. E., Ghatei, M. A., & Frost,
G. S. (2016). Mycoprotein reduces energy intake and postprandial insulin release
without altering glucagon-like peptide-1 and peptide tyrosine-tyrosine concentrations
in healthy overweight and obese adults: a randomised-controlled trial. Br J Nutr,
116(2), 360-374.
238 | P a g e
Bowles, R. K., Morgan, K. R., Furneaux, R. H., & Coles, G. D. (1996). 13C CP/MAS NMR
study of the interaction of bile acids with barley β-d-glucan. Carbohydrate Polymers,
29(1), 7-10.
Bowman, S. M., & Free, S. J. (2006). The structure and synthesis of the fungal cell wall.
Bioessays, 28(8), 799-808.
Bozbulut, R., & Sanlier, N. (2019). Promising effects of β-glucans on glyceamic control in
diabetes. Trends in Food Science & Technology, 83, 159-166.
Bradford, M. M. (1976). A rapid and sensitive method for the quantitation of microgram
quantities of protein utilizing the principle of protein-dye binding. Analytical
biochemistry, 72(1-2), 248-254.
Branden, C. I., & Tooze, J. (2012). Introduction to protein structure: Garland Science.
Brayer, G. D., Luo, Y., & Withers, S. G. (1995). The structure of human pancreatic α‐amylase
at 1.8 Å resolution and comparisons with related enzymes. Protein Science, 4(9), 1730-
1742.
Breitwieser, F. P., Pertea, M., Zimin, A. V., & Salzberg, S. L. (2019). Human contamination
in bacterial genomes has created thousands of spurious proteins. Genome research,
29(6), 954-960.
Brinkworth, G. D., Noakes, M., Clifton, P. M., & Bird, A. R. (2009). Comparative effects of
very low-carbohydrate, high-fat and high-carbohydrate, low-fat weight-loss diets on
bowel habit and faecal short-chain fatty acids and bacterial populations. British journal
of nutrition, 101(10), 1493-1502.
Brodkorb, A., Egger, L., Alminger, M., Alvito, P., Assunção, R., Ballance, S., Bohn, T.,
Bourlieu-Lacanal, C., Boutrou, R., & Carrière, F. (2019). INFOGEST static in vitro
simulation of gastrointestinal food digestion. Nature protocols, 14(4), 991-1014.
239 | P a g e
Brown, I. (1996). Complex carbohydrates and resistant starch. Nutrition Reviews, 54(11),
S115.
Brul, S., Nussbaum, J., & Dielbandhoesing, S. K. (1997). Fluorescent probes for wall porosity
and membrane integrity in filamentous fungi. Journal of Microbiological Methods,
28(3), 169-178.
Buttar, H. S., Li, T., & Ravi, N. (2005). Prevention of cardiovascular diseases: Role of exercise,
dietary interventions, obesity and smoking cessation. Experimental & clinical
cardiology, 10(4), 229.
Buttriss, J. L., & Stokes, C. S. (2008). Dietary fibre and health: an overview. Nutrition Bulletin,
33(3), 186-200.
Cani, P. D. (2018). Human gut microbiome: hopes, threats and promises. Gut, 67(9), 1716.
Capozzi, F., & Bordoni, A. (2013). Foodomics: a new comprehensive approach to food and
nutrition. Genes & nutrition, 8(1), 1-4.
Carlile, M. (1995). The success of the hypha and mycelium. In The growing fungus, (pp. 3-
19): Springer.
Çayan, F., Deveci, E., Tel-Çayan, G., & Duru, M. E. (2020). Identification and quantification
of phenolic acid compounds of twenty-six mushrooms by HPLC–DAD. Journal of
Food Measurement and Characterization, 14(3), 1690-1698.
Centanni, M., Sims, I. M., Bell, T. J., Biswas, A., & Tannock, G. W. (2020). Sharing a β-
glucan meal: transcriptomic eavesdropping on a Bacteroides ovatus-Subdoligranulum
variabile-Hungatella hathewayi consortium. Applied and environmental microbiology,
86(20), e01651-01620.
Ceriello, A. (2005). Postprandial hyperglycemia and diabetes complications: is it time to treat?
Diabetes, 54(1), 1-7.
240 | P a g e
Chambers, E. S., Preston, T., Frost, G., & Morrison, D. J. (2018). Role of gut microbiota-
generated short-chain fatty acids in metabolic and cardiovascular health. Current
nutrition reports, 7(4), 198-206.
Chambers, K. F., Day, P. E., Aboufarrag, H. T., & Kroon, P. A. (2019). Polyphenol Effects
on Cholesterol Metabolism via Bile Acid Biosynthesis, CYP7A1: A Review. Nutrients,
11(11), 2588.
Cheah, I. K., & Halliwell, B. (2012). Ergothioneine; antioxidant potential, physiological
function and role in disease. Biochimica et Biophysica Acta (BBA)-Molecular Basis of
Disease, 1822(5), 784-793.
Cheah, I. K., Tang, R. M., Yew, T. S., Lim, K. H., & Halliwell, B. (2017). Administration of
pure ergothioneine to healthy human subjects: uptake, metabolism, and effects on
biomarkers of oxidative damage and inflammation. Antioxidants & redox signaling,
26(5), 193-206.
Chen, K., & Pachter, L. (2005). Bioinformatics for whole-genome shotgun sequencing of
microbial communities. PLoS computational biology, 1(2), e24.
Cheung, L., Cheung, P. C., & Ooi, V. E. (2003). Antioxidant activity and total phenolics of
edible mushroom extracts. Food chemistry, 81(2), 249-255.
Cheung, P. C. K. (2013). Mini-review on edible mushrooms as source of dietary fiber:
Preparation and health benefits. Food Science and Human Wellness, 2(3), 162-166.
Choromanska, A., Kulbacka, J., Harasym, J., Oledzki, R., Szewczyk, A., & Saczko, J. (2018).
High- and low-Molecular Weight oat Beta-Glucan Reveals Antitumor Activity in
Human Epithelial Lung Cancer. Pathology & Oncology Research, 24(3), 583-592.
Coelho, M. O., Monteyne, A. J., Dirks, M. L., Finnigan, T. J., Stephens, F. B., & Wall, B. T.
(2020). Daily mycoprotein consumption for 1 week does not affect insulin sensitivity
241 | P a g e
or glycaemic control but modulates the plasma lipidome in healthy adults: a
randomised controlled trial. British Journal of Nutrition, 1-14.
Colosimo, R., Mulet-Cabero, A.-I., Cross, K. L., Haider, K., Edwards, C. H., Warren, F. J.,
Finnigan, T. J. A., & Wilde, P. J. (2021). β-glucan release from fungal and plant cell
walls after simulated gastrointestinal digestion. Journal of Functional Foods, 83,
104543.
Colosimo, R., Mulet-Cabero, A.-I., Warren, F. J., Edwards, C. H., Finnigan, T. J. A., & Wilde,
P. J. (2020). Mycoprotein ingredient structure reduces lipolysis and binds bile salts
during simulated gastrointestinal digestion. Food and Function (In press).
Colosimo, R., Warren, F. J., Edwards, C. H., Finnigan, T. J. A., & Wilde, P. J. (2020). The
interaction of α-amylase with mycoprotein: Diffusion through the fungal cell wall,
enzyme entrapment, and potential physiological implications. Food Hydrocolloids,
108, 106018.
Colosimo, R., Warren, F. J., Edwards, C. H., Ryden, P., Dyer, P. S., Finnigan, T. J. A., &
Wilde, P. J. (2021). Comparison of the behavior of fungal and plant cell wall during
gastrointestinal digestion and resulting health effects: A review. Trends in Food Science
& Technology, 110, 132-141.
Colosimo, R., Warren, F. J., Finnigan, T. J. A., & Wilde, P. J. (2020). Protein bioaccessibility
from mycoprotein hyphal structure: in vitro investigation of underlying mechanisms.
Food Chemistry, 127252.
Cornish-Bowden, A. (1974). A simple graphical method for determining the inhibition
constants of mixed, uncompetitive and non-competitive inhibitors. Biochemical
Journal, 137(1), 143.
Cornish-Bowden, A. (2012). Fundamentals of enzyme kinetics (Vol. 510): Wiley-Blackwell
Weinheim, Germany.
242 | P a g e
Cosgrove, D., & Jarvis, M. (2012). Comparative structure and biomechanics of plant primary
and secondary cell walls. Frontiers in Plant Science, 3(204).
CureFFI.org. (Accessed: 11/10/2021). The decoy genome. URL:
http://www.cureffi.org/2013/02/01/the-decoy-genome/) In).
da Silva, F. v. C. V., do Nascimento, V. V., Machado, O. L. T., Pereira, L. d. d. S., Gomes,
V. M., & de Oliveira Carvalho, A. (2018). Insight into the α-Amylase Inhibitory
Activity of Plant Lipid Transfer Proteins. Journal of chemical information and
modeling, 58(11), 2294-2304.
Dahl, W. J., Agro, N. C., Eliasson, Å. M., Mialki, K. L., Olivera, J. D., Rusch, C. T., & Young,
C. N. (2017). Health benefits of fiber fermentation. Journal of the American College
of Nutrition, 36(2), 127-136.
Dale, C., & Young, T. (1987). Rapid methods for determining the high molecular weight
polypeptide components of beer. Journal of the Institute of Brewing, 93(6), 465-467.
Dangin, M., Boirie, Y., Garcia-Rodenas, C., Gachon, P., Fauquant, J., Callier, P., Ballèvre,
O., & Beaufrère, B. (2001). The digestion rate of protein is an independent regulating
factor of postprandial protein retention. American Journal of Physiology-
Endocrinology And Metabolism, 280(2), E340-E348.
Daud, N. M., Ismail, N. A., Thomas, E. L., Fitzpatrick, J. A., Bell, J. D., Swann, J. R.,
Costabile, A., Childs, C. E., Pedersen, C., & Goldstone, A. P. (2014). The impact of
oligofructose on stimulation of gut hormones, appetite regulation and adiposity.
Obesity, 22(6), 1430-1438.
De Nobel, J. G., Klis, F. M., Priem, J., Munnik, T., & Van Den Ende, H. (1990). The
glucanase‐soluble mannoproteins limit cell wall porosity in Saccharomyces cerevisiae.
Yeast, 6(6), 491-499.
Deacon, J. W. (2013). Fungal biology: John Wiley & Sons.
243 | P a g e
Demonte, A. M., Diez, M. D. A., Guerrero, S. A., Ballicora, M. A., & Iglesias, A. A. (2014).
Iodine Staining of Escherichia coli Expressing Genes Involved in the Synthesis of
Bacterial Glycogen. Bio-protocol, 4(17), e1224.
Denny, A., Aisbitt, B., & Lunn, J. (2008). Mycoprotein and health. Nutrition bulletin, 33(4),
298-310.
Denny, A., & Buttriss, J. (2007). Plant foods and health: focus on plant bioactives. Synthesis
report, 4, 1-64.
Desai, M. S., Seekatz, A. M., Koropatkin, N. M., Kamada, N., Hickey, C. A., Wolter, M.,
Pudlo, N. A., Kitamoto, S., Terrapon, N., Muller, A., Young, V. B., Henrissat, B.,
Wilmes, P., Stappenbeck, T. S., Núñez, G., & Martens, E. C. (2016). A Dietary Fiber-
Deprived Gut Microbiota Degrades the Colonic Mucus Barrier and Enhances
Pathogen Susceptibility. Cell, 167(5), 1339-1353.e1321.
Dhingra, D., Michael, M., Rajput, H., & Patil, R. (2012). Dietary fibre in foods: a review.
Journal of food science and technology, 49(3), 255-266.
Dhital, S., Gidley, M. J., & Warren, F. J. (2015). Inhibition of α-amylase activity by cellulose:
Kinetic analysis and nutritional implications. Carbohydrate Polymers, 123, 305-312.
Dima, C., Assadpour, E., Dima, S., & Jafari, S. M. (2020). Bioavailability of nutraceuticals:
Role of the food matrix, processing conditions, the gastrointestinal tract, and
nanodelivery systems. Comprehensive Reviews in Food Science and Food Safety,
19(3), 954-994.
Downer, R. G. (1985). Lipid metabolism. Comprehensive insect physiology, biochemistry and
pharmacology, 10, 77-113.
Dreher, M. L. (2018). Fiber in Type 2 Diabetes Prevention and Management. In Dietary
Fiber in Health and Disease, (pp. 227-249): Springer.

244 | P a g e
Duncan, S. H., Belenguer, A., Holtrop, G., Johnstone, A. M., Flint, H. J., & Lobley, G. E.
(2007). Reduced dietary intake of carbohydrates by obese subjects results in decreased
concentrations of butyrate and butyrate-producing bacteria in feces. Applied and
environmental microbiology, 73(4), 1073-1078.
Dunlop, M. V., Kilroe, S. P., Bowtell, J. L., Finnigan, T. J. A., Salmon, D. L., & Wall, B. T.
(2017). Mycoprotein represents a bioavailable and insulinotropic non-animal-derived
dietary protein source: a dose-response study. Br J Nutr, 118(9), 673-685.
Duskin-Bitan, H., Cohen, E., Goldberg, E., Shochat, T., Levi, A., Garty, M., & Krause, I.
(2014). The degree of asymptomatic hyperuricemia and the risk of gout. A
retrospective analysis of a large cohort. Clin Rheumatol, 33(4), 549-553.
Eastwood, M., Anderson, R., Mitchell, W., Robertson, J., & Pocock, S. (1976). A method to
measure the adsorption of bile salts to vegetable fiber of differing water holding
capacity. The Journal of nutrition, 106(10), 1429-1432.
Edozien, J. C., Udo, U. U., Young, V. R., & Scrimshaw, N. S. (1970). Effects of high levels of
yeast feeding on uric acid metabolism of young man. Nature, 228(5267), 180.
Edwards, C. H., Ryden, P., Mandalari, G., Butterworth, P. J., & Ellis, P. R. (2021).
Comparative structure-function studies of chickpea and durum wheat uncover
mechanisms by which cell wall properties influence starch bioaccessibility Nature
Foods (Accepted Manuscript).
Edwards, C. H., Warren, F. J., Campbell, G. M., Gaisford, S., Royall, P. G., Butterworth, P.
J., & Ellis, P. R. (2015). A study of starch gelatinisation behaviour in hydrothermally-
processed plant food tissues and implications for in vitro digestibility. Food & function,
6(12), 3634-3641.
245 | P a g e
Edwards, C. H., Warren, F. J., Milligan, P. J., Butterworth, P. J., & Ellis, P. R. (2014). A novel
method for classifying starch digestion by modelling the amylolysis of plant foods using
first-order enzyme kinetic principles. Food & function, 5(11), 2751-2758.
Edwards, D., & Cummings, J. (2010). The protein quality of mycoprotein. Proceedings of the
Nutrition Society, 69(OCE4).
EFSA Panel on Dietetic Products, N., & Allergies. (2010). Scientific Opinion on the
substantiation of a health claim related to oat beta glucan and lowering blood
cholesterol and reduced risk of (coronary) heart disease pursuant to Article 14 of
Regulation (EC) No 1924/2006. EFSA Journal, 8(12), 1885.
Egger, L., Ménard, O., Baumann, C., Duerr, D., Schlegel, P., Stoll, P., Vergères, G., Dupont,
D., & Portmann, R. (2019). Digestion of milk proteins: Comparing static and dynamic
in vitro digestion systems with in vivo data. Food Research International, 118, 32-39.
Ellis, P. R., Kendall, C. W., Ren, Y., Parker, C., Pacy, J. F., Waldron, K. W., & Jenkins, D.
J. (2004). Role of cell walls in the bioaccessibility of lipids in almond seeds. The
American journal of clinical nutrition, 80(3), 604-613.
Elmastas, M., Isildak, O., Turkekul, I., & Temur, N. (2007). Determination of antioxidant
activity and antioxidant compounds in wild edible mushrooms. Journal of Food
Composition and Analysis, 20(3-4), 337-345.
Elshaghabee, F. M., Bockelmann, W., Meske, D., de Vrese, M., Walte, H.-G., Schrezenmeir,
J., & Heller, K. J. (2016). Ethanol production by selected intestinal microorganisms
and lactic acid bacteria growing under different nutritional conditions. Frontiers in
microbiology, 7, 47.
Emwas, A.-H., Roy, R., McKay, R. T., Tenori, L., Saccenti, E., Gowda, G., Raftery, D.,
Alahmari, F., Jaremko, L., & Jaremko, M. (2019). NMR spectroscopy for
metabolomics research. Metabolites, 9(7), 123.
246 | P a g e
Engelking, L. R. (2015). Chapter 23 - Glycogen. In L. R. Engelking (Ed.), Textbook of
Veterinary Physiological Chemistry (Third Edition), (pp. 147-152). Boston: Academic
Press.
Fahy, E., Subramaniam, S., Brown, H. A., Glass, C. K., Merrill Jr, A. H., Murphy, R. C.,
Raetz, C. R., Russell, D. W., Seyama, Y., & Shaw, W. (2005). A comprehensive
classification system for lipids. European journal of lipid science and technology,
107(5), 337-364.
Fardet, A. (2010). New hypotheses for the health-protective mechanisms of whole-grain
cereals: what is beyond fibre? Nutrition research reviews, 23(1), 65-134.
Fernandes, J., Su, W., Rahat-Rozenbloom, S., Wolever, T. M. S., & Comelli, E. M. (2014).
Adiposity, gut microbiota and faecal short chain fatty acids are linked in adult humans.
Nutrition & Diabetes, 4(6), e121-e121.
Fernandez-Julia, P. J., Munoz-Munoz, J., & van Sinderen, D. (2021). A comprehensive review
on the impact of β-glucan metabolism by Bacteroides and Bifidobacterium species as
members of the gut microbiota. International Journal of Biological Macromolecules,
181, 877-889.
Finnigan, T., Needham, L., & Abbott, C. (2017). Mycoprotein: a healthy new protein with a
low environmental impact. In Sustainable protein sources, (pp. 305-325): Elsevier.
Freitas, D., Le Feunteun, S., Panouillé, M., & Souchon, I. (2018). The important role of
salivary α-amylase in the gastric digestion of wheat bread starch. Food & function, 9(1),
200-208.
Fruton, J. S., Fujii, S., & Knappenberger, M. H. (1961). The mechanism of pepsin action.
Proceedings of the National Academy of Sciences of the United States of America,
47(6), 759.
247 | P a g e
Gil-Ramírez, A., Morales, D., & Soler-Rivas, C. (2018). Molecular actions of
hypocholesterolaemic compounds from edible mushrooms. Food & function, 9(1),
53-69.
Gil-Ramírez, A., & Soler-Rivas, C. (2014). The use of edible mushroom extracts as bioactive
ingredients to design novel functional foods with hypocholesterolemic activities.
Mushrooms: Cultivation, antioxidant properties and health benefits, 43-73.
Gilbert-López, B., Valdés, A., Acunha, T., García-Cañas, V., Simó, C., & Cifuentes, A. (2017).
Chapter 10 - Foodomics: LC and LC-MS-based omics strategies in food science and
nutrition. In S. Fanali, P. R. Haddad, C. F. Poole & M.-L. Riekkola (Eds.), Liquid
Chromatography (Second Edition), (pp. 267-299): Elsevier.
Goel, V., Cheema, S. K., Agellon, L. B., Ooraikul, B., McBurney, M. I., & Basu, T. K. (1998).
In vitro binding of bile salt to rhubarb stalk powder. Nutrition Research, 18(5), 893-
903.
Goff, H. D., Repin, N., Fabek, H., El Khoury, D., & Gidley, M. J. (2018). Dietary fibre for
glycaemia control: Towards a mechanistic understanding. Bioactive Carbohydrates
and Dietary Fibre, 14, 39-53.
Golding, M., & Wooster, T. J. (2010). The influence of emulsion structure and stability on
lipid digestion. Current Opinion in Colloid & Interface Science, 15(1-2), 90-101.
Gouseti, O., Bornhorst, G. M., Bakalis, S., & Mackie, A. (2019). Interdisciplinary approaches
to food digestion: Springer.
Gow, N. A., Latge, J.-P., & Munro, C. A. (2017). The fungal cell wall: structure, biosynthesis,
and function. The fungal kingdom, 267-292.
Gropper, S. S., & Smith, J. L. (2012). Advanced nutrition and human metabolism: Cengage
Learning.

248 | P a g e
Grundy, M. M.-L., Fardet, A., Tosh, S. M., Rich, G. T., & Wilde, P. J. (2018). Processing of
oat: the impact on oat's cholesterol lowering effect. Food & function, 9(3), 1328-1343.
Grundy, M. M.-L., & Wilde, P. (2021). Bioaccessibility and digestibility of lipids from food.
In): Springer.
Grundy, M. M., Quint, J., Rieder, A., Ballance, S., Dreiss, C. A., Cross, K. L., Gray, R., Bajka,
B. H., Butterworth, P. J., & Ellis, P. R. (2017). The impact of oat structure and β-
glucan on in vitro lipid digestion. Journal of functional foods, 38, 378-388.
Grundy, M. M. L., Carrière, F., Mackie, A. R., Gray, D. A., Butterworth, P. J., & Ellis, P. R.
(2016). The role of plant cell wall encapsulation and porosity in regulating lipolysis
during the digestion of almond seeds. Food & Function, 7(1), 69-78.
Grundy, M. M. L., Wilde, P. J., Butterworth, P. J., Gray, R., & Ellis, P. R. (2015). Impact of
cell wall encapsulation of almonds on in vitro duodenal lipolysis. Food Chemistry, 185,
405-412.
Guerin, J., Kriznik, A., Ramalanjaona, N., Le Roux, Y., & Girardet, J.-M. (2016). Interaction
between dietary bioactive peptides of short length and bile salts in submicellar or
micellar state. Food chemistry, 209, 114-122.
Guillén, D., Santiago, M., Linares, L., Pérez, R., Morlon, J., Ruiz, B., Sánchez, S., &
Rodríguez-Sanoja, R. (2007). Alpha-amylase starch binding domains: cooperative
effects of binding to starch granules of multiple tandemly arranged domains. Applied
and environmental microbiology, 73(12), 3833-3837.
Gunness, P., Flanagan, B. M., & Gidley, M. J. (2010). Molecular interactions between cereal
soluble dietary fibre polymers and a model bile salt deduced from 13C NMR titration.
Journal of cereal science, 52(3), 444-449.
249 | P a g e
Gunness, P., Flanagan, B. M., Mata, J. P., Gilbert, E. P., & Gidley, M. J. (2016). Molecular
interactions of a model bile salt and porcine bile with (1, 3: 1, 4)-β-glucans and
arabinoxylans probed by 13C NMR and SAXS. Food chemistry, 197, 676-685.
Gunness, P., & Gidley, M. J. (2010). Mechanisms underlying the cholesterol-lowering
properties of soluble dietary fibre polysaccharides. Food & function, 1(2), 149-155.
Günther, H. (2013). NMR spectroscopy: basic principles, concepts and applications in
chemistry: John Wiley & Sons.
Hageage, G. J., & Harrington, B. J. (1984). Use of Calcofluor White in Clinical Mycology.
Laboratory Medicine, 15(2), 109-112.
Halliwell, B. (2009). The wanderings of a free radical. Free Radical Biology and Medicine,
46(5), 531-542.
Halliwell, B., Cheah, I. K., & Tang, R. M. Y. (2018). Ergothioneine – a diet-derived
antioxidant with therapeutic potential. FEBS Letters, 592(20), 3357-3366.
Harris, H. C., Edwards, C. A., & Morrison, D. J. (2019). Short Chain Fatty Acid Production
from Mycoprotein and Mycoprotein Fibre in an In Vitro Fermentation Model.
Nutrients, 11(4), 800.
Harris, H. C., Morrison, D. J., & Edwards, C. A. (2020). Impact of the source of fermentable
carbohydrate on SCFA production by human gut microbiota in vitro - a systematic
scoping review and secondary analysis. Critical Reviews in Food Science and Nutrition,
1-12.
Hatzakis, E. (2019). Nuclear magnetic resonance (NMR) spectroscopy in food science: A
comprehensive review. Comprehensive reviews in food science and food safety, 18(1),
189-220.
Henrion, M., Francey, C., Lê, K.-A., & Lamothe, L. (2019). Cereal B-glucans: the impact of
processing and how it affects physiological responses. Nutrients, 11(8), 1729.

250 | P a g e
Hernáez, Á., Soria-Florido, M. T., Schröder, H., Ros, E., Pinto, X., Estruch, R., Salas-Salvado,
J., Corella, D., Arós, F., & Serra-Majem, L. (2019). Role of HDL function and LDL
atherogenicity on cardiovascular risk: A comprehensive examination. PloS one, 14(6).
Hernández, M., Canfora, E., & Blaak, E. (2021). Faecal microbial metabolites of proteolytic
and saccharolytic fermentation in relation to degree of insulin resistance in adult
individuals. Beneficial Microbes, 12(3), 259-266.
Herrero, M., Simó, C., García‐Cañas, V., Ibáñez, E., & Cifuentes, A. (2012). Foodomics: MS‐
based strategies in modern food science and nutrition. Mass spectrometry reviews,
31(1), 49-69.
Hess, J., Wang, Q., Gould, T., & Slavin, J. (2018). Impact of Agaricus bisporus mushroom
consumption on gut health markers in healthy adults. Nutrients, 10(10), 1402.
Hii, V., & Herwig, W. (1982). Determination of high molecular weight proteins in beer using
Coomassie Blue. Journal of the American Society of Brewing Chemists, 40(2), 46-50.
Holland, C., Ryden, P., Edwards, C. H., & Grundy, M. M.-L. (2020). Plant Cell Walls: Impact
on Nutrient Bioaccessibility and Digestibility. Foods, 9(2), 201.
Houghton, D., Wilcox, M. D., Chater, P. I., Brownlee, I. A., Seal, C. J., & Pearson, J. P.
(2015). Biological activity of alginate and its effect on pancreatic lipase inhibition as a
potential treatment for obesity. Food hydrocolloids, 49, 18-24.
Huda-Faujan, N., Abdulamir, A., Fatimah, A., Anas, O. M., Shuhaimi, M., Yazid, A., &
Loong, Y. (2010). The impact of the level of the intestinal short chain fatty acids in
inflammatory bowel disease patients versus healthy subjects. The open biochemistry
journal, 4, 53.
Hughes, S. A., Shewry, P. R., Gibson, G. R., McCleary, B. V., & Rastall, R. A. (2008). In vitro
fermentation of oat and barley derived β-glucans by human faecal microbiota. FEMS
Microbiology Ecology, 64(3), 482-493.
251 | P a g e
Hwang, H.-J., Kim, S.-W., Lim, J.-M., Joo, J.-H., Kim, H.-O., Kim, H.-M., & Yun, J.-W.
(2005). Hypoglycemic effect of crude exopolysaccharides produced by a medicinal
mushroom Phellinus baumii in streptozotocin-induced diabetic rats. Life Sciences,
76(26), 3069-3080.
Ihekweazu, F. D., Fofanova, T. Y., Queliza, K., Nagy-Szakal, D., Stewart, C. J., Engevik, M.
A., Hulten, K. G., Tatevian, N., Graham, D. Y., Versalovic, J., Petrosino, J. F., &
Kellermayer, R. (2019). Bacteroides ovatus ATCC 8483 monotherapy is superior to
traditional fecal transplant and multi-strain bacteriotherapy in a murine colitis model.
Gut Microbes, 10(4), 504-520.
Isaksson, G., Lundquist, I., & Ihse, I. (1982). Effect of dietary fiber on pancreatic enzyme
activity in vitro: the importance of viscosity, pH, ionic strength, adsorption, and time
of incubation. Gastroenterology, 82(5), 918-924.
Iwami, K., Sakakibara, K., & Ibuki, F. (1986). Involvement of post-
digestion'hydrophobia'peptides in plasma cholesterol-lowering effect of dietary plant
proteins. Agricultural and biological chemistry, 50(5), 1217-1222.
Jacobsen, C. (2019). Oxidative Rancidity. In L. Melton, F. Shahidi & P. Varelis (Eds.),
Encyclopedia of Food Chemistry, (pp. 261-269). Oxford: Academic Press.
Jamovi project. (2019). Jamovi. (Version 1.0) [Computer Software]. URL:
https://www.jamovi.org. Accessed: 15/11/2019.
Jeong, S. C., Jeong, Y. T., Yang, B. K., Islam, R., Koyyalamudi, S. R., Pang, G., Cho, K. Y.,
& Song, C. H. (2010). White button mushroom (Agaricus bisporus) lowers blood
glucose and cholesterol levels in diabetic and hypercholesterolemic rats. Nutrition
Research, 30(1), 49-56.

252 | P a g e
Kacurakova, M., Capek, P., Sasinkova, V., Wellner, N., & Ebringerova, A. (2000). FT-IR
study of plant cell wall model compounds: pectic polysaccharides and hemicelluloses.
Carbohydrate polymers, 43(2), 195-203.
Kang, X., Kirui, A., Muszyński, A., Widanage, M. C. D., Chen, A., Azadi, P., Wang, P.,
Mentink-Vigier, F., & Wang, T. (2018). Molecular architecture of fungal cell walls
revealed by solid-state NMR. Nature communications, 9(1), 2747.
Kato, N., & Iwami, K. (2002). Resistant protein; its existence and function beneficial to health.
J Nutr Sci Vitaminol (Tokyo), 48(1), 1-5.
Kawakami, S., Araki, T., Ohba, K., Sasaki, K., Kamada, T., Shimada, K.-I., Han, K.-H., &
Fukushima, M. (2016). Comparison of the effect of two types of whole mushroom
(Agaricus bisporus) powders on intestinal fermentation in rats. Bioscience,
Biotechnology, and Biochemistry, 80(10), 2001-2006.
Keegstra, K. (2010). Plant cell walls. Plant physiology, 154(2), 483-486.
Kendall, C. W., Esfahani, A., & Jenkins, D. J. (2010). The link between dietary fibre and
human health. Food Hydrocolloids, 24(1), 42-48.
Keogh, J., Lau, C., Noakes, M., Bowen, J., & Clifton, P. (2007). Effects of meals with high
soluble fibre, high amylose barley variant on glucose, insulin, satiety and thermic effect
of food in healthy lean women. European journal of clinical nutrition, 61(5), 597-604.
Kharatyan, S. G. (1978). Microbes as food for humans. Annual Reviews in Microbiology,
32(1), 301-327.
Kim, C. H. (2018). Microbiota or short-chain fatty acids: which regulates diabetes? Cellular &
Molecular Immunology, 15(2), 88-91.
Kim, H. J., & White, P. J. (2009). In vitro fermentation of oat flours from typical and high β-
glucan oat lines. Journal of agricultural and food chemistry, 57(16), 7529-7536.
253 | P a g e
Kim, H. K., Choi, Y. H., & Verpoorte, R. (2010). NMR-based metabolomic analysis of plants.
Nature Protocols, 5(3), 536-549.
Kim, S. H., Thomas, M. J., Wu, D., Carman, C. V., Ordovás, J. M., & Meydani, M. (2019).
Edible Mushrooms Reduce Atherosclerosis in Ldlr−/− Mice Fed a High-Fat Diet. The
Journal of Nutrition, 149(8), 1377-1384.
Kim, Y., & Je, Y. (2016). Dietary fibre intake and mortality from cardiovascular disease and
all cancers: A meta-analysis of prospective cohort studies. Archives of cardiovascular
diseases, 109(1), 39-54.
Klementova, M., Thieme, L., Haluzik, M., Pavlovicova, R., Hill, M., Pelikanova, T., &
Kahleova, H. (2019). A Plant-Based Meal Increases Gastrointestinal Hormones and
Satiety More Than an Energy-and Macronutrient-Matched Processed-Meat Meal in
T2D, Obese, and Healthy Men: A Three-Group Randomized Crossover Study.
Nutrients, 11(1), 157.
Knights, K. M., & Jones, M. E. (1992). Inhibition kinetics of hepatic microsomal long chain
fatty acid-CoA ligase by 2-arylpropionic acid non-steroidal anti-inflammatory drugs.
Biochemical pharmacology, 43(7), 1465-1471.
Kofuji, K., Aoki, A., Tsubaki, K., Konishi, M., Isobe, T., & Murata, Y. (2012). Antioxidant
Activity of <i>β</i>-Glucan. ISRN Pharmaceutics, 2012, 125864.
Kongo-Dia-Moukala, J. U., Zhang, H., & Claver Irakoze, P. (2011). In vitro binding capacity
of bile acids by defatted corn protein hydrolysate. International journal of molecular
sciences, 12(2), 1066-1080.
Kontula, P., von Wright, A., & Mattila-Sandholm, T. (1998). Oat bran β-gluco-and xylo-
oligosaccharides as fermentative substrates for lactic acid bacteria. International journal
of food microbiology, 45(2), 163-169.
254 | P a g e
Krittanawong, C., Isath, A., Hahn, J., Wang, Z., Fogg, S. E., Bandyopadhyay, D., Jneid, H.,
Virani, S. S., & Tang, W. H. W. (2021). Mushroom Consumption and Cardiovascular
Health: A Systematic Review. The American Journal of Medicine, 134(5), 637-
642.e632.
Kumar, N., & Goel, N. (2019). Phenolic acids: Natural versatile molecules with promising
therapeutic applications. Biotechnology Reports, 24, e00370.
Küster, B., Krogh, T. N., Mørtz, E., & Harvey, D. J. (2001). Glycosylation analysis of gel‐
separated proteins. PROTEOMICS: International Edition, 1(2), 350-361.
Lam, D. (2011). How the world survived the population bomb: lessons from 50 years of
extraordinary demographic history. Demography, 48(4), 1231-1262.
Lam, K.-L., & Cheung, P. C.-K. (2013). Non-digestible long chain beta-glucans as novel
prebiotics. Bioactive carbohydrates and dietary fibre, 2(1), 45-64.
Lam, K.-L., Keung, H.-Y., Ko, K.-C., Kwan, H.-S., & Cheung, P. C.-K. (2018). In vitro
fermentation of beta-glucans and other selected carbohydrates by infant fecal
inoculum: An evaluation of their potential as prebiotics in infant formula. Bioactive
carbohydrates and dietary fibre, 14, 20-24.
Latunde-Dada, G. O., Li, X., Parodi, A., Edwards, C. H., Ellis, P. R., & Sharp, P. A. (2014).
Micromilling Enhances Iron Bioaccessibility from Wholegrain Wheat. Journal of
Agricultural and Food Chemistry, 62(46), 11222-11227.
Lemaire, A., Duran Garzon, C., Perrin, A., Habrylo, O., Trezel, P., Bassard, S., Lefebvre, V.,
Van Wuytswinkel, O., Guillaume, A., Pau-Roblot, C., & Pelloux, J. (2020). Three
novel rhamnogalacturonan I- pectins degrading enzymes from Aspergillus aculeatinus:
Biochemical characterization and application potential. Carbohydrate Polymers, 248,
116752.
255 | P a g e
Leser, S. (2013). The 2013 FAO report on dietary protein quality evaluation in human
nutrition: Recommendations and implications. Nutrition Bulletin, 38(4), 421-428.
Lever, M. (1972). A new reaction for colorimetric determination of carbohydrates. Analytical
biochemistry, 47(1), 273-279.
Li, C., Allen, A., Kwagh, J., Doliba, N. M., Qin, W., Najafi, H., Collins, H. W., Matschinsky,
F. M., Stanley, C. A., & Smith, T. J. (2006). Green tea polyphenols modulate insulin
secretion by inhibiting glutamate dehydrogenase. Journal of biological chemistry,
281(15), 10214-10221.
Li, H., Gidley, M. J., & Dhital, S. (2019). Wall porosity in isolated cells from food plants:
Implications for nutritional functionality. Food chemistry, 279, 416-425.
Li, P., Zhang, B., & Dhital, S. (2019). Starch digestion in intact pulse cells depends on the
processing induced permeability of cell walls. Carbohydrate Polymers, 225, 115204.
Li, Y., Hu, M., & McClements, D. J. (2011). Factors affecting lipase digestibility of emulsified
lipids using an in vitro digestion model: Proposal for a standardised pH-stat method.
Food Chemistry, 126(2), 498-505.
Lia, A., Hallmans, G., Sandberg, A. S., Sundberg, B., Aman, P., & Andersson, H. (1995). Oat
beta-glucan increases bile acid excretion and a fiber-rich barley fraction increases
cholesterol excretion in ileostomy subjects. The American Journal of Clinical
Nutrition, 62(6), 1245-1251.
Lineweaver, H., & Burk, D. (1934). The Determination of Enzyme Dissociation Constants.
Journal of the American Chemical Society, 56(3), 658-666.
Lo, H.-C., & Wasser, S. P. (2011). Medicinal mushrooms for glycemic control in diabetes
mellitus: history, current status, future perspectives, and unsolved problems.
International journal of medicinal mushrooms, 13(5).
256 | P a g e
Lockyer, S., & Nugent, A. P. (2017). Health effects of resistant starch. Nutrition Bulletin,
42(1), 10-41.
López-Almela, I., Romaní-Pérez, M., Bullich-Vilarrubias, C., Benítez-Páez, A., Gómez Del
Pulgar, E. M., Francés, R., Liebisch, G., & Sanz, Y. (2021). Bacteroides uniformis
combined with fiber amplifies metabolic and immune benefits in obese mice. Gut
Microbes, 13(1), 1865706.
Lundin, L., Golding, M., & Wooster, T. J. (2008). Understanding food structure and function
in developing food for appetite control. Nutrition & Dietetics, 65(s3), S79-S85.
Lunn, J., & Buttriss, J. L. (2007). Carbohydrates and dietary fibre. Nutrition Bulletin, 32(1),
21-64.
Macfarlane, G., Gibson, G., Beatty, E., & Cummings, J. (1992). Estimation of short-chain fatty
acid production from protein by human intestinal bacteria based on branched-chain
fatty acid measurements. FEMS microbiology ecology, 10(2), 81-88.
Macierzanka, A., Sancho, A. I., Mills, E. C., Rigby, N. M., & Mackie, A. R. (2009).
Emulsification alters simulated gastrointestinal proteolysis of β-casein and β-
lactoglobulin. Soft Matter, 5(3), 538-550.
Mackie, A. (2017). Food: more than the sum of its parts. Current Opinion in Food Science,
16, 120-124.
Majid, I., Nayik, G. A., & Nanda, V. (2015). Ultrasonication and food technology: A review.
Cogent Food & Agriculture, 1(1), 1071022.
Mäkelä, N., Brinck, O., & Sontag-Strohm, T. (2020). Viscosity of β-glucan from oat products
at the intestinal phase of the gastrointestinal model. Food Hydrocolloids, 100, 105422.
Makino, S., Nakashima, H., Minami, K., Moriyama, R., & Takao, S. (1988). Bile acid-binding
protein from soybean seed: isolation, partial characterization and insulin-stimulating
activity. Agricultural and biological chemistry, 52(3), 803-809.
257 | P a g e
Mälkki, Y., & Virtanen, E. (2001). Gastrointestinal effects of oat bran and oat gum: a review.
LWT-Food Science and Technology, 34(6), 337-347.
Mandal, S. M., Chakraborty, D., & Dey, S. (2010). Phenolic acids act as signaling molecules
in plant-microbe symbioses. Plant signaling & behavior, 5(4), 359-368.
Mandalari, G., Grundy, M. M.-L., Grassby, T., Parker, M. L., Cross, K. L., Chessa, S.,
Bisignano, C., Barreca, D., Bellocco, E., & Lagana, G. (2014). The effects of
processing and mastication on almond lipid bioaccessibility using novel methods of in
vitro digestion modelling and micro-structural analysis. British Journal of Nutrition,
112(9), 1521-1529.
Mann, J., & Truswell, A. S. (2017). Essentials of human nutrition: Oxford University Press.
Manzi, P., & Pizzoferrato, L. (2000). Beta-glucans in edible mushrooms. Food Chemistry,
68(3), 315-318.
Martel, J., Ojcius, D. M., Chang, C.-J., Lin, C.-S., Lu, C.-C., Ko, Y.-F., Tseng, S.-F., Lai, H.-
C., & Young, J. D. (2017). Anti-obesogenic and antidiabetic effects of plants and
mushrooms. Nature Reviews Endocrinology, 13(3), 149-160.
Martínez-González, M. A., Gea, A., & Ruiz-Canela, M. (2019). The Mediterranean diet and
cardiovascular health: A critical review. Circulation research, 124(5), 779-798.
Marzorati, M., Maquet, V., & Possemiers, S. (2017). Fate of chitin-glucan in the human
gastrointestinal tract as studied in a dynamic gut simulator (SHIME®). Journal of
Functional Foods, 30, 313-320.
Mat, D. J., Le Feunteun, S., Michon, C., & Souchon, I. (2016). In vitro digestion of foods
using pH-stat and the INFOGEST protocol: Impact of matrix structure on digestion
kinetics of macronutrients, proteins and lipids. Food Research International, 88, 226-
233.
258 | P a g e
McBride, P. (2008). Triglycerides and risk for coronary artery disease. Current atherosclerosis
reports, 10(5), 386-390.
McCleary, B. V., Charnock, S. J., Rossiter, P. C., O'Shea, M. F., Power, A. M., & Lloyd, R.
M. (2006). Measurement of carbohydrates in grain, feed and food. Journal of the
Science of Food and Agriculture, 86(11), 1648-1661.
McCleary, B. V., & Draga, A. (2016). Measurement of β-Glucan in Mushrooms and Mycelial
Products. Journal of AOAC INTERNATIONAL, 99(2), 364-373.
McClements, D. J., Decker, E. A., Park, Y., & Weiss, J. (2008). Designing Food Structure to
Control Stability, Digestion, Release and Absorption of Lipophilic Food Components.
Food Biophysics, 3(2), 219-228.
Medina, M. L., & Francisco, W. A. (2008). Isolation and enrichment of secreted proteins
from filamentous fungi. In 2D PAGE: Sample Preparation and Fractionation, (pp.
275-285): Springer.
Miele, L., Giorgio, V., Alberelli, M. A., De Candia, E., Gasbarrini, A., & Grieco, A. (2015).
Impact of gut microbiota on obesity, diabetes, and cardiovascular disease risk. Current
cardiology reports, 17(12), 1-7.
Mikkelsen, M. S., Cornali, S. B., Jensen, M. G., Nilsson, M., Beeren, S. R., & Meier, S. (2014).
Probing interactions between β-glucan and bile salts at atomic detail by 1H–13C NMR
assays. Journal of agricultural and food chemistry, 62(47), 11472-11478.
Minekus, M. (2015). The TNO gastro-intestinal model (TIM). The impact of food bioactives
on health, 37-46.
Minekus, M., Alminger, M., Alvito, P., Ballance, S., Bohn, T., Bourlieu, C., Carrière, F.,
Boutrou, R., Corredig, M., Dupont, D., Dufour, C., Egger, L., Golding, M., Karakaya,
S., Kirkhus, B., Le Feunteun, S., Lesmes, U., Macierzanka, A., Mackie, A., Marze, S.,
McClements, D. J., Ménard, O., Recio, I., Santos, C. N., Singh, R. P., Vegarud, G. E.,
259 | P a g e
Wickham, M. S. J., Weitschies, W., & Brodkorb, A. (2014). A standardised static in
vitro digestion method suitable for food – an international consensus. Food &
Function, 5(6), 1113-1124.
Minekus, M., Smeets-Peeters, M., Bernalier, A., Marol-Bonnin, S., Havenaar, R., Marteau,
P., Alric, M., & Fonty, G. (1999). A computer-controlled system to simulate conditions
of the large intestine with peristaltic mixing, water absorption and absorption of
fermentation products. Applied microbiology and biotechnology, 53(1), 108-114.
Monteyne, A. J., Coelho, M. O., Porter, C., Abdelrahman, D. R., Jameson, T. S., Jackman,
S. R., Blackwell, J. R., Finnigan, T. J., Stephens, F. B., Dirks, M. L., & Wall, B. T.
(2020). Mycoprotein ingestion stimulates protein synthesis rates to a greater extent than
milk protein in rested and exercised skeletal muscle of healthy young men: a
randomized controlled trial. The American Journal of Clinical Nutrition.
Morris, V., & Groves, K. (2013). Food microstructures: Microscopy, measurement and
modelling: Elsevier.
Morrison, D. J., & Preston, T. (2016). Formation of short chain fatty acids by the gut
microbiota and their impact on human metabolism. Gut microbes, 7(3), 189-200.
Mulet-Cabero, A.-I., Egger, L., Portmann, R., Ménard, O., Marze, S., Minekus, M., Le
Feunteun, S., Sarkar, A., Grundy, M. M.-L., & Carrière, F. (2020). A standardised
semi-dynamic in vitro digestion method suitable for food–an international consensus.
Food & Function, 11(2), 1702-1720.
Mulet-Cabero, A.-I., Mackie, A. R., Brodkorb, A., & Wilde, P. J. (2020). Dairy structures and
physiological responses: a matter of gastric digestion. Critical Reviews in Food Science
and Nutrition, 1-16.
260 | P a g e
Mulet-Cabero, A.-I., Mackie, A. R., Wilde, P. J., Fenelon, M. A., & Brodkorb, A. (2019).
Structural mechanism and kinetics of in vitro gastric digestion are affected by process-
induced changes in bovine milk. Food Hydrocolloids, 86, 172-183.
Mycoprotein.org. (Accessed: 01/02/2020). Nutritional profile of mycoprotein, URL:
https://assets.ctfassets.net/2bynbqpgfb2s/1mykBC5QRyYMkMcOuO0WMa/631474
f6d720c9bcd0664a4a8dae73be/nutritional-profile-of-quorn.pdf. In).
Naranjo‐Ortiz, M. A., & Gabaldón, T. (2020). Fungal evolution: cellular, genomic and
metabolic complexity. Biological Reviews, 95(5), 1198-1232.
Naumann, S., Schweiggert-Weisz, U., Bader-Mittermaier, S., Haller, D., & Eisner, P. (2018).
Differentiation of Adsorptive and Viscous Effects of Dietary Fibres on Bile Acid
Release by Means of In Vitro Digestion and Dialysis. International Journal of
Molecular Sciences, 19(8).
Ng, S. H., Robert, S. D., Ahmad, W. A. N. W., & Ishak, W. R. W. (2017). Incorporation of
dietary fibre-rich oyster mushroom (Pleurotus sajor-caju) powder improves
postprandial glycaemic response by interfering with starch granule structure and starch
digestibility of biscuit. Food chemistry, 227, 358-368.
NHS. (Accessed 27/03/2022). Vitamin and minerals, URL:
https://www.nhs.uk/conditions/vitamins-and-minerals/.
Nogal, A., Valdes, A. M., & Menni, C. (2021). The role of short-chain fatty acids in the
interplay between gut microbiota and diet in cardio-metabolic health. Gut Microbes,
13(1), 1-24.
Nyambe-Silavwe, H., Villa-Rodriguez, J. A., Ifie, I., Holmes, M., Aydin, E., Jensen, J. M., &
Williamson, G. (2015). Inhibition of human α-amylase by dietary polyphenols. Journal
of Functional Foods, 19, 723-732.
261 | P a g e
Oba, S., Sunagawa, T., Tanihiro, R., Awashima, K., Sugiyama, H., Odani, T., Nakamura, Y.,
Kondo, A., Sasaki, D., & Sasaki, K. (2020). Prebiotic effects of yeast mannan, which
selectively promotes Bacteroides thetaiotaomicron and Bacteroides ovatus in a human
colonic microbiota model. Scientific Reports, 10(1), 17351.
Oghbaei, M., & Prakash, J. (2016). Effect of primary processing of cereals and legumes on its
nutritional quality: A comprehensive review. Cogent Food & Agriculture, 2(1).
Othman, R. A., Moghadasian, M. H., & Jones, P. J. (2011). Cholesterol-lowering effects of oat
β-glucan. Nutrition reviews, 69(6), 299-309.
Ou, S., Kwok, K.-c., Li, Y., & Fu, L. (2001). In vitro study of possible role of dietary fiber in
lowering postprandial serum glucose. Journal of agricultural and food chemistry, 49(2),
1026-1029.
Palacios, I., Lozano, M., Moro, C., D’arrigo, M., Rostagno, M., Martínez, J., García-Lafuente,
A., Guillamón, E., & Villares, A. (2011). Antioxidant properties of phenolic
compounds occurring in edible mushrooms. Food Chemistry, 128(3), 674-678.
Pallares, A. P., Miranda, B. A., Truong, N. Q. A., Kyomugasho, C., Chigwedere, C. M.,
Hendrickx, M., & Grauwet, T. (2018). Process-induced cell wall permeability
modulates the in vitro starch digestion kinetics of common bean cotyledon cells. Food
& function, 9(12), 6544-6554.
Panalytical, M. (Accessed 06/02/2020). Changing the Properties of Particles to Control Their
Rheology, URL: https://www.azom.com/article.aspx?ArticleID=12304. In AZoM).
Pankov, R., & Momchilova, A. (2009). Fluorescent labeling techniques for investigation of
fibronectin fibrillogenesis (labeling fibronectin fibrillogenesis). In Extracellular matrix
protocols, (pp. 261-274): Springer.
262 | P a g e
Parija, S. C., Shivaprakash, M. R., & Jayakeerthi, S. R. (2003). Evaluation of lacto-phenol
cotton blue (LPCB) for detection of Cryptosporidium, Cyclospora and Isospora in the
wet mount preparation of stool. Acta Tropica, 85(3), 349-354.
Pereira, A. G. B., Fajardo, A. R., Valente, A. J. M., Rubira, A. F., & Muniz, E. C. (2016).
Chapter 7 Outstanding Features of Starch-based Hydrogel Nanocomposites. In
Starch-based Blends, Composites and Nanocomposites, (pp. 236-262): The Royal
Society of Chemistry.
Pereira, D. M., Valentão, P., Pereira, J. A., & Andrade, P. B. (2009). Phenolics: From
chemistry to biology. In): Molecular Diversity Preservation International.
Prados-Bo, A., & Casino, G. (2021). Microbiome research in general and business
newspapers: How many microbiome articles are published and which study designs
make the news the most? PloS one, 16(4), e0249835.
Prakash, P., & Namasivayam, S. K. R. (2013). Anti oxidative and anti tumour activity of
biomass extract of mycoprotein Fusarium venenatum. African Journal of Microbiology
Research, 7(17), 1697-1702.
Proestos, C., Boziaris, I., Nychas, G.-J., & Komaitis, M. (2006). Analysis of flavonoids and
phenolic acids in Greek aromatic plants: Investigation of their antioxidant capacity and
antimicrobial activity. Food chemistry, 95(4), 664-671.
Puttaraju, N. G., Venkateshaiah, S. U., Dharmesh, S. M., Urs, S. M. N., & Somasundaram,
R. (2006). Antioxidant activity of indigenous edible mushrooms. Journal of agricultural
and food chemistry, 54(26), 9764-9772.
Quain, D. E., & Tubb, S. (1983). A rapid and simple method for the determination of glycogen
in yeast. Journal of the Institute of Brewing, 89(1), 38-40.
Quast, C., Pruesse, E., Yilmaz, P., Gerken, J., Schweer, T., Yarza, P., Peplies, J., & Glöckner,
F. O. (2013). The SILVA ribosomal RNA gene database project: improved data
263 | P a g e
processing and web-based tools. Nucleic acids research, 41(Database issue), D590-
D596.
Queenan, K. M., Stewart, M. L., Smith, K. N., Thomas, W., Fulcher, R. G., & Slavin, J. L.
(2007). Concentrated oat β-glucan, a fermentable fiber, lowers serum cholesterol in
hypercholesterolemic adults in a randomized controlled trial. Nutrition Journal, 6(1),
6.
Quince, C., Walker, A. W., Simpson, J. T., Loman, N. J., & Segata, N. (2017). Shotgun
metagenomics, from sampling to analysis. Nature biotechnology, 35(9), 833-844.
Ramakrishna, B. S. (2013). Role of the gut microbiota in human nutrition and metabolism.
Journal of gastroenterology and hepatology, 28, 9-17.
Reed, G. (2012). Yeast technology: Springer Science & Business Media.
Reichardt, N., Duncan, S. H., Young, P., Belenguer, A., McWilliam Leitch, C., Scott, K. P.,
Flint, H. J., & Louis, P. (2014). Phylogenetic distribution of three pathways for
propionate production within the human gut microbiota. The ISME Journal, 8(6),
1323-1335.
Reynolds, A., Mann, J., Cummings, J., Winter, N., Mete, E., & Te Morenga, L. (2019).
Carbohydrate quality and human health: a series of systematic reviews and meta-
analyses. The Lancet, 393(10170), 434-445.
Rios-Covian, D., González, S., Nogacka, A. M., Arboleya, S., Salazar, N., Gueimonde, M., &
de Los Reyes-Gavilán, C. G. (2020). An overview on fecal branched short-chain fatty
acids along human life and as related with body mass index: associated dietary and
anthropometric factors. Frontiers in microbiology, 11, 973.
Robertson, J., Majsak-Newman, G., & Ring, S. (1997). Release of mixed linkage (1→ 3),(1→
4) β-d-glucans from barley by protease activity and effects on ileal effluent.
International journal of biological macromolecules, 21(1-2), 57-60.
264 | P a g e
Röder, P. V., Wu, B., Liu, Y., & Han, W. (2016). Pancreatic regulation of glucose
homeostasis. Experimental & molecular medicine, 48(3), e219-e219.
Ruiz-Herrera, J., & Ortiz-Castellanos, L. (2019). Cell wall glucans of fungi. A review. The Cell
Surface, 5, 100022.
Ruxton, C. H., & McMillan, B. (2010). The impact of mycoprotein on blood cholesterol
levels: a pilot study. British Food Journal, 112(10), 1092-1101.
Saltiel, A. R. (2015). Insulin signaling in the control of glucose and lipid homeostasis.
Metabolic Control, 51-71.
Saria, A., & Lundberg, J. M. (1983). Evans blue fluorescence: quantitative and morphological
evaluation of vascular permeability in animal tissues. J Neurosci Methods, 8(1), 41-49.
Satija, A., & Hu, F. B. (2018). Plant-based diets and cardiovascular health. Trends in
Cardiovascular Medicine, 28(7), 437-441.
Sayar, S., Jannink, J.-L., & White, P. J. (2005). In Vitro Bile Acid Binding of Flours from Oat
Lines Varying in Percentage and Molecular Weight Distribution of β-Glucan. Journal
of Agricultural and Food Chemistry, 53(22), 8797-8803.
Scazzina, F., Siebenhandl-Ehn, S., & Pellegrini, N. (2013). The effect of dietary fibre on
reducing the glycaemic index of bread. British Journal of Nutrition, 109(7), 1163-1174.
Scheller, H. V., & Ulvskov, P. (2010). Hemicelluloses. Annual review of plant biology, 61.
Scherrer, R., Louden, L., & Gerhardt, P. (1974). Porosity of the yeast cell wall and membrane.
Journal of bacteriology, 118(2), 534-540.
Schneider, I., Kressel, G., Meyer, A., Krings, U., Berger, R. G., & Hahn, A. (2011). Lipid
lowering effects of oyster mushroom (Pleurotus ostreatus) in humans. Journal of
Functional Foods, 3(1), 17-24.
265 | P a g e
Segata, N., Waldron, L., Ballarini, A., Narasimhan, V., Jousson, O., & Huttenhower, C.
(2012). Metagenomic microbial community profiling using unique clade-specific
marker genes. Nature methods, 9(8), 811-814.
Sharma, V., & Bhardwaj, A. (2019). Scanning Electron Microscopy (SEM) in food quality
evaluation. In Evaluation technologies for food quality, (pp. 743-761): Elsevier.
Shen, Q., Chen, Y. A., & Tuohy, K. M. (2010). A comparative in vitro investigation into the
effects of cooked meats on the human faecal microbiota. Anaerobe, 16(6), 572-577.
Shepherd, J., Packard, C. J., Bicker, S., Lawrie, T. V., & Morgan, H. G. (1980).
Cholestyramine promotes receptor-mediated low-density-lipoprotein catabolism. New
England Journal of Medicine, 302(22), 1219-1222.
Shepherd, M. G. (1987). Cell envelope of Candida albicans. CRC Critical Reviews in
Microbiology, 15(1), 7-25.
Singh, R. P., Thakur, R., & Kumar, G. (2021). Human gut Bacteroides uniformis utilizes
mixed linked β-glucans via an alternative strategy. Bioactive Carbohydrates and Dietary
Fibre, 100282.
Siow, H.-L., Choi, S.-B., & Gan, C.-Y. (2016). Structure–activity studies of protease activating,
lipase inhibiting, bile acid binding and cholesterol-lowering effects of pre-screened
cumin seed bioactive peptides. Journal of functional foods, 27, 600-611.
Smith, A. M., & Zeeman, S. C. (2006). Quantification of starch in plant tissues. Nature
protocols, 1(3), 1342-1345.
Smith, H., Doyle, S., & Murphy, R. (2015). Filamentous fungi as a source of natural
antioxidants. Food Chemistry, 185, 389-397.
Smith, P. e., Krohn, R. I., Hermanson, G., Mallia, A., Gartner, F., Provenzano, M., Fujimoto,
E., Goeke, N., Olson, B., & Klenk, D. (1985). Measurement of protein using
bicinchoninic acid. Analytical biochemistry, 150(1), 76-85.
266 | P a g e
Smith, W. L. (1992). Prostanoid biosynthesis and mechanisms of action. American Journal of
Physiology-Renal Physiology, 263(2), F181-F191.
Solomons, G. (1987). Myco-protein: safety evaluation of a novel food. In Mechanisms and
Models in Toxicology, (pp. 191-193): Springer.
Sridharan, G., & Shankar, A. A. (2012). Toluidine blue: A review of its chemistry and clinical
utility. Journal of Oral and Maxillofacial Pathology : JOMFP, 16(2), 251-255.
Staels, B. (2009). A review of bile acid sequestrants: potential mechanism (s) for glucose-
lowering effects in type 2 diabetes mellitus. Postgraduate medicine, 121(sup1), 25-30.
Steeves, T. A., & Sawhney, V. K. (2017). Essentials of developmental plant anatomy: Oxford
University Press.
Stewart, M. L., & Zimmer, J. P. (2018). Postprandial glucose and insulin response to a high-
fiber muffin top containing resistant starch type 4 in healthy adults: a double-blind,
randomized, controlled trial. Nutrition, 53, 59-63.
Story, J. A., & Kritchevsky, D. (1976). Comparison of the binding of various bile acids and
bile salts in vitro by several types of fiber. The Journal of nutrition, 106(9), 1292-1294.
Striegel, L., Kang, B., Pilkenton, S. J., Rychlik, M., & Apostolidis, E. (2015). Effect of black
tea and black tea pomace polyphenols on α-glucosidase and α-amylase inhibition,
relevant to type 2 diabetes prevention. Frontiers in nutrition, 2, 3.
Sun, L., Chen, W., Meng, Y., Yang, X., Yuan, L., & Guo, Y. (2016). Interactions between
polyphenols in thinned young apples and porcine pancreatic α-amylase: Inhibition,
detailed kinetics and fluorescence quenching. Food chemistry, 208, 51-60.
Suttiponparnit, K., Jiang, J., Sahu, M., Suvachittanont, S., Charinpanitkul, T., & Biswas, P.
(2010). Role of Surface Area, Primary Particle Size, and Crystal Phase on Titanium
Dioxide Nanoparticle Dispersion Properties. Nanoscale Res Lett, 6(1), 27.

267 | P a g e
Takeshita, T., Okochi, M., Kato, R., Kaga, C., Tomita, Y., Nagaoka, S., & Honda, H. (2011).
Screening of peptides with a high affinity to bile acids using peptide arrays and a
computational analysis. Journal of bioscience and bioengineering, 112(1), 92-97.
Tamura, K., Foley, M. H., Gardill, B. R., Dejean, G., Schnizlein, M., Bahr, C. M., Creagh, A.
L., van Petegem, F., Koropatkin, N. M., & Brumer, H. (2019). Surface glycan-binding
proteins are essential for cereal beta-glucan utilization by the human gut symbiont
Bacteroides ovatus. Cellular and Molecular Life Sciences, 76(21), 4319-4340.
The InterAct, C. (2015). Dietary fibre and incidence of type 2 diabetes in eight European
countries: the EPIC-InterAct Study and a meta-analysis of prospective studies.
Diabetologia, 58(7), 1394-1408.
Thermo Fisher Scientific. (Accessed: 23/08/2021). Calculate dye:protein molar ratios. URL:
https://tools.thermofisher.com/content/sfs/brochures/TR0031-Calc-FP-ratios.pdf. In).
Thermo Fisher Scientific. (Accessed: 24/11/2021). A rapid, sensitive protein assay for the
accurate analysis of protein concentrations. .
Threapleton, D. E., Greenwood, D. C., Evans, C. E. L., Cleghorn, C. L., Nykjaer, C.,
Woodhead, C., Cade, J. E., Gale, C. P., & Burley, V. J. (2013). Dietary fibre intake
and risk of cardiovascular disease: systematic review and meta-analysis. BMJ : British
Medical Journal, 347, f6879.
Thuenemann, E. C., Mandalari, G., Rich, G. T., & Faulks, R. M. (2015). Dynamic gastric
model (DGM). In The impact of food bioactives on health, (pp. 47-59): Springer,
Cham.
Tsai, S.-Y., & Chen, Z.-Y. (2019). Influence of Cold Storage and Processing of Edible
Mushroom on Ergothioneine Concentration. inflammation, 10, 12.
Turnbull, W. H., Leeds, A. R., & Edwards, D. G. (1992). Mycoprotein reduces blood lipids
in free-living subjects. Am J Clin Nutr, 55(2), 415-419.

268 | P a g e
Turnbull, W. H., Leeds, A. R., & Edwards, G. D. (1990). Effect of mycoprotein on blood
lipids. Am J Clin Nutr, 52(4), 646-650.
Turnbull, W. H., & Ward, T. (1995). Mycoprotein reduces glycemia and insulinemia when
taken with an oral-glucose-tolerance test. The American Journal of Clinical Nutrition,
61(1), 135-140.
Tysoe, C., Williams, L. K., Keyzers, R., Nguyen, N. T., Tarling, C., Wicki, J., Goddard-
Borger, E. D., Aguda, A. H., Perry, S., & Foster, L. J. (2016). Potent human α-amylase
inhibition by the β-defensin-like protein helianthamide. ACS central science, 2(3), 154-
161.
Udall, J. N., Lo, C. W., Young, V. R., & Scrimshaw, N. S. (1984). The tolerance and
nutritional value of two microfungal foods in human subjects. The American journal
of clinical nutrition, 40(2), 285-292.
Ulmius, M., Adapa, S., Önning, G., & Nilsson, L. (2012). Gastrointestinal conditions influence
the solution behaviour of cereal β-glucans in vitro. Food chemistry, 130(3), 536-540.
Ulmius, M., Johansson‐Persson, A., Nordén, T. I., Bergenståhl, B., & Önning, G. (2011).
Gastrointestinal release of β‐glucan and pectin using an in vitro method. Cereal
chemistry, 88(4), 385-390.
Van de Wiele, T., Van den Abbeele, P., Ossieur, W., Possemiers, S., & Marzorati, M. (2015).
The simulator of the human intestinal microbial ecosystem (SHIME®). The impact
of food bioactives on health, 305-317.
Van Vliet, S., Shy, E. L., Abou Sawan, S., Beals, J. W., West, D. W., Skinner, S. K., Ulanov,
A. V., Li, Z., Paluska, S. A., & Parsons, C. M. (2017). Consumption of whole eggs
promotes greater stimulation of postexercise muscle protein synthesis than
consumption of isonitrogenous amounts of egg whites in young men. The American
journal of clinical nutrition, 106(6), 1401-1412.
269 | P a g e
Vaz, J. A., Barros, L., Martins, A., Morais, J. S., Vasconcelos, M. H., & Ferreira, I. C. F. R.
(2011). Phenolic profile of seventeen Portuguese wild mushrooms. LWT - Food
Science and Technology, 44(1), 343-346.
Vega, K., & Kalkum, M. (2012). Chitin, chitinase responses, and invasive fungal infections.
International journal of microbiology, 2012.
Veintimilla-Gozalbo, E., Asensio-Grau, A., Calvo-Lerma, J., Heredia, A., & Andrés, A.
(2021). In Vitro Simulation of Human Colonic Fermentation: A Practical Approach
towards Models’ Design and Analytical Tools. Applied Sciences, 11(17).
Venturini Copetti, M. (2019). Yeasts and molds in fermented food production: an ancient
bioprocess. Current Opinion in Food Science, 25, 57-61.
Vinayagam, R., Jayachandran, M., & Xu, B. (2016). Antidiabetic effects of simple phenolic
acids: a comprehensive review. Phytotherapy research, 30(2), 184-199.
Viswanath, D. S., Ghosh, T. K., Prasad, D. H., Dutt, N. V., & Rani, K. Y. (2007). Viscosity of
liquids: theory, estimation, experiment, and data: Springer Science & Business Media.
Waldron, K. W., Parker, M., & Smith, A. C. (2003). Plant cell walls and food quality.
Comprehensive reviews in food science and food safety, 2(4), 128-146.
Walker, L., Sood, P., Lenardon, M. D., Milne, G., Olson, J., Jensen, G., Wolf, J., Casadevall,
A., Adler-Moore, J., & Gow, N. A. (2018). The viscoelastic properties of the fungal
cell wall allow traffic of AmBisome as intact liposome vesicles. MBio, 9(1), e02383-
02317.
Wang, M., Wichienchot, S., He, X., Fu, X., Huang, Q., & Zhang, B. (2019). In vitro colonic
fermentation of dietary fibers: Fermentation rate, short-chain fatty acid production and
changes in microbiota. Trends in food science & technology.
Wang, W., Onnagawa, M., Yoshie, Y., & Suzuki, T. (2001). Binding of bile salts to soluble
and insoluble dietary fibers of seaweeds. Fisheries science, 67(6), 1169-1173.
270 | P a g e
Ward, P. (1998). Production of food. Patent No. US5739030.
Waslien, C. I., Calloway, D. H., & Margen, S. (1968). Uric acid production of men fed graded
amounts of egg protein and yeast nucleic acid. Am J Clin Nutr, 21(9), 892-897.
Whittaker, J. A., Johnson, R. I., Finnigan, T. J. A., Avery, S. V., & Dyer, P. S. (2020). The
Biotechnology of Quorn Mycoprotein: Past, Present and Future Challenges. In H.
Nevalainen (Ed.), Grand Challenges in Fungal Biotechnology, (pp. 59-79). Cham:
Springer International Publishing.
Wiebe, M. (2002). Myco-protein from Fusarium venenatum: a well-established product for
human consumption. Applied Microbiology and Biotechnology, 58(4), 421-427.
Wiebe, M. G., Nováková, M., Miller, L., Blakebrough, M. L., Robson, G. D., Punt, P. J., &
Trinci, A. P. (1997). Protoplast production and transformation of morphological
mutants of the Quorn® myco-protein fungus, Fusarium graminearum A3/5, using the
hygromycin B resistance plasmid pAN7-1. Mycological Research, 101(7), 871-877.
Wilczak, J., Błaszczyk, K., Kamola, D., Gajewska, M., Harasym, J. P., Jałosińska, M., Gudej,
S., Suchecka, D., Oczkowski, M., & Gromadzka-Ostrowska, J. (2015). The effect of
low or high molecular weight oat beta-glucans on the inflammatory and oxidative stress
status in the colon of rats with LPS-induced enteritis. Food & function, 6(2), 590-603.
Wilde, P. J. (2009). Eating for Life: Designing Foods for Appetite Control. Journal of Diabetes
Science and Technology, 3(2), 366-370.
Wilde, P. J., Garcia-Llatas, G., Lagarda, M. J., Haslam, R. P., & Grundy, M. M. L. (2019).
Oat and lipolysis: Food matrix effect. Food Chemistry, 278, 683-691.
Williams, B. A., Bosch, M. W., Boer, H., Verstegen, M. W. A., & Tamminga, S. (2005). An
in vitro batch culture method to assess potential fermentability of feed ingredients for
monogastric diets. Animal Feed Science and Technology, 123-124, 445-462.
271 | P a g e
Williams, B. A., Grant, L. J., Gidley, M. J., & Mikkelsen, D. (2017). Gut fermentation of
dietary fibres: physico-chemistry of plant cell walls and implications for health.
International journal of molecular sciences, 18(10), 2203.
Wilson, A. S., Koller, K. R., Ramaboli, M. C., Nesengani, L. T., Ocvirk, S., Chen, C.,
Flanagan, C. A., Sapp, F. R., Merritt, Z. T., & Bhatti, F. (2020). Diet and the human
gut microbiome: an international review. Digestive diseases and sciences, 65(3), 723-
740.
Wong, J. M. W., de Souza, R., Kendall, C. W. C., Emam, A., & Jenkins, D. J. A. (2006).
Colonic Health: Fermentation and Short Chain Fatty Acids. Journal of Clinical
Gastroenterology, 40(3).
Wood, P. J. (2004). Relationships between solution properties of cereal β-glucans and
physiological effects — a review. Trends in Food Science & Technology, 15(6), 313-
320.
Wood, P. J. (2007). Cereal β-glucans in diet and health. Journal of cereal science, 46(3), 230-
238.
Wu, N.-J., Chiou, F.-J., Weng, Y.-M., Yu, Z.-R., & Wang, B.-J. (2014). In vitro hypoglycemic
effects of hot water extract from Auricularia polytricha (wood ear mushroom).
International Journal of Food Sciences and Nutrition, 65(4), 502-506.
Wu, T., & Xu, B. (2015). Antidiabetic and antioxidant activities of eight medicinal mushroom
species from China. International journal of medicinal mushrooms, 17(2).
Xiao, J. F., Zhou, B., & Ressom, H. W. (2012). Metabolite identification and quantitation in
LC-MS/MS-based metabolomics. TrAC Trends in Analytical Chemistry, 32, 1-14.
Xu, J., Yue, R.-Q., Liu, J., Ho, H.-M., Yi, T., Chen, H.-B., & Han, Q.-B. (2014). Structural
diversity requires individual optimization of ethanol concentration in polysaccharide
precipitation. International Journal of Biological Macromolecules, 67, 205-209.
272 | P a g e
Yao, B., Fang, H., Xu, W., Yan, Y., Xu, H., Liu, Y., Mo, M., Zhang, H., & Zhao, Y. (2014).
Dietary fiber intake and risk of type 2 diabetes: a dose–response analysis of prospective
studies. In): Springer.
Yap, Y. A., & Mariño, E. (2020). Dietary SCFAs immunotherapy: reshaping the gut
microbiota in diabetes. SpringerLink; Springer: New York, NY, USA.
Yokoyama, R. (2020). A Genomic Perspective on the Evolutionary Diversity of the Plant Cell
Wall. Plants, 9(9), 1195.
Yoshida, N., Emoto, T., Yamashita, T., Watanabe, H., Hayashi, T., Tabata, T., Hoshi, N.,
Hatano, N., Ozawa, G., Sasaki, N., Mizoguchi, T., Amin, H. Z., Hirota, Y., Ogawa,
W., Yamada, T., & Hirata, K.-i. (2018). Bacteroides vulgatus and Bacteroides dorei
Reduce Gut Microbial Lipopolysaccharide Production and Inhibit Atherosclerosis.
Circulation, 138(22), 2486-2498.
Yoshie-Stark, Y., & Wäsche, A. (2004). In vitro binding of bile acids by lupin protein isolates
and their hydrolysates. Food Chemistry, 88(2), 179-184.
Yu, W., Zou, W., Dhital, S., Wu, P., Gidley, M. J., Fox, G. P., & Gilbert, R. G. (2018). The
adsorption of α-amylase on barley proteins affects the in vitro digestion of starch in
barley flour. Food chemistry, 241, 493-501.
Zacherl, C., Eisner, P., & Engel, K.-H. (2011). In vitro model to correlate viscosity and bile
acid-binding capacity of digested water-soluble and insoluble dietary fibres. Food
Chemistry, 126(2), 423-428.
Zahir, M., Fogliano, V., & Capuano, E. (2020). Effect of soybean processing on cell wall
porosity and protein digestibility. Food & Function, 11(1), 285-296.
Zanchi, D., Depoorter, A., Egloff, L., Haller, S., Mählmann, L., Lang, U. E., Drewe, J.,
Beglinger, C., Schmidt, A., & Borgwardt, S. (2017). The impact of gut hormones on
273 | P a g e
the neural circuit of appetite and satiety: A systematic review. Neuroscience &
Biobehavioral Reviews, 80, 457-475.
Zhai, H., Gunness, P., & Gidley, M. J. (2020). Barley β-glucan effects on emulsification and
in vitro lipolysis of canola oil are modulated by molecular size, mixing method, and
emulsifier type. Food Hydrocolloids, 103, 105643.
Zhao, L., Zhang, F., Ding, X., Wu, G., Lam, Y. Y., Wang, X., Fu, H., Xue, X., Lu, C., & Ma,
J. (2018). Gut bacteria selectively promoted by dietary fibers alleviate type 2 diabetes.
Science, 359(6380), 1151-1156.
Zhu, F., Du, B., & Xu, B. (2016). A critical review on production and industrial applications
of beta-glucans. Food Hydrocolloids, 52, 275-288.
Copyright © 2022 FDOKUMEN