Start-up phase of a two-stage anaerobic co-digestion process
Upload
khangminh22Category
view
1download
0
ANAEROBIC DIGESTION OF PIGGERY WASTE.
This study was carried out at the Department of Water Pollution Control,
Agricultural University, Wageningen, The Netherlands. Financial support
came from the Commissie Hinderpreventie Veeteeltbedrijven, The Hague,
The Netherlands. „ „ » . I f I ANOBOUWCATAUOGUS

Promotor : dr. P.G. Fohr, oud-hoogleraar aan de Landbouwhogeschool
Co-referent : dr. G. Lettinga, wetenschappelijk hoofdmedewerker aan de
Landbouwhogeschool
L

Y)\n (9 'lui $vy ç*
A.F.M, van Velsen
ANAEROBIC DIGESTION OF PIGGERY WASTE
Proefschrift
ter verkrijging van de graad van
doctor in de landbouwwetenschappen,
op gezag van de rector magnificus,
dr. H.C. van der Plas,
hoogleraar in de organische scheikunde,
in het openbaar te verdedigen
op woensdag 20 mei 1981
des namiddags te vier uur in de aula
van de Landbouwhogeschool te Wageningen.
K^ idoèLoi

BIBLIOTHEEK LH 0 6 net iss,
°m- wasemt. «M

uwo8"2*/./8y</<
STELLINGEN
1. De standaard methode ter bepaling van het droge stof en organische stof
gehalte geeft voor de praktijk van de anaërobe gisting doorgaans niet de
juiste informatie. Het is doelmatiger het substraat te karakteriseren aan
de hand van CZV-bepalingen.
Dit proefschrift.
2. De resultaten van de experimenten van McCarty en McKinney naar de giftig
heid van kationen op het anaërobe gistingsproces hebben slechts een zeer
beperkte geldigheid, omdat in de betreffende experimenten onvoldoende tijd
is genomen voor aanpassing van de bakteriepopulatie.
McCarty P.L. & McKinney R.E., 1961. Salt toxicity in anaerobic digestion. J. Water Pollut. Control Fed. 33, 399.
3. Bij de vergisting van complexe substraten is de hydrolyse doorgaans de
snelheidsbepalende stap. Ten onrechte wordt er bij het opstellen van
kinetische modellen voor het anaërobe gistingsproces dikwijls van uitgegaan,
dat de methaanvorming snelheidsbepalend is.
Andrews J.F., 1969. Dynamic model of the anaerobic digestion process. J. Sanit. Eng. Div., SA 1, 95. Novak J.T. & Ramesh M.S., 1975. Stimulation in anaerobic degradation. Water Res., 9, 963.
Dit proefschrift.
4. Met het oog op de toenemende schaarste aan energie en minerale grond
stoffen dient, in aansluiting op de toepassing van anaërobe zuivering van
afvalwater, de terugwinning van waardevolle mineralen als ammoniumstikstof
te worden nagestreefd. Het proces van NH, strippen, gevolgd door absorptie,
biedt in dit opzicht uitstekende perspektieven.
5. Uit het feit, dat defosfatering op rioolwaterzuiveringsinstallaties
in principe de P-belasting van het oppervlaktewater sterker kan reduceren
dan het weglaten van fosfaat uit wasmiddelen, concludeert het VNO zeer ten
onrechte, dat prioriteit moet worden gegeven aan defosfatering op zuiverings
installaties .
Selectief defosfateringsbeleid gewenst. Milieuhygiëne 12 (1981) 1, 1.
6. De scepsis van gevestigde instituten t.a.v. nieuwe ontwikkelingen
is dikwijls niet alleen gebaseerd op wetenschappelijke argumenten.
7. Het bestaan van monopolieposities op de afzetmarkt vormt geen stimulans
voor de terugwinning en het hergebruik van waardevolle componenten uit
afval.
8. Het is een fundamenteel recht voor iedereen desgewenst te kunnen be
schikken over alle informatie met betrekking tot zijn/haar leefmilieu.
9. De invoer van grote hoeveelheden tapioca uit Thailand zou kunnen worden
uitgelegd als een vorm van ontwikkelingssamenwerking, omdat het een
gunstige invloed heeft op het inkomen van de Thaise boeren. Strikt genomen
is het echter een verhullende vorm van uitbuiting, omdat de door ons be
taalde prijzen te laag zijn om de aan de grond onttrokken mineralen weer
aan te vullen met kunstmest.
Asseldonk J.S.O van, Faber D.C. en Stolwijk H.J.J., 1980. De betekenis van tapioca voor de landbouwsector in Thailand en Nederland. Landbouwk. Tijdschr. 92, 202.
10. Het instituut 'kroondocent' heeft zich niet of nauwelijks aangepast
aan de veranderde omstandigheden in het wetenschappelijk onderwijs. Het
verdient aanbeveling dit instituut te vervangen door een systeem van
gedeelde verantwoordelijkheid op basis van specifieke capaciteit en
ervaring.
11. De liefde van stadsmensen voor het platteland gaat kennelijk niet
door de neus.
A.F.M, van Velsen, Anaerobic digestion of piggery waste. Wageningen, 20 mei 1981.

VOORWOORD
Bij het verschijnen van dit proefschrift wil ik graag allen bedanken die op
enigerlei wijze hebben bijgedragen aan de totstandkoming van dit werk.
Het heeft mij verheugd dat Prof. Fohr als promotor wilde optreden.
De begeleiding van het onderzoek was in handen van Gatze Lettinga, aan
wiens doorzettingsvermogen het ook is te danken dat het onderzoek destijds
doorgang heeft gevonden. Zijn stimulerende samenwerking en kritische hou
ding hebben in hoge mate bijgedragen tot de resultaten. Goede herinneringen
bewaar ik ook aan andere collega's, die steeds bereid waren te helpen bij
het oplossen van problemen. Hans Gerritsen, Peter Rombout, Egbert van 't
Oever en Dirk den Ottelander hebben in het kader van hun doctoraalstudie
meegewerkt aan het onderzoek. De onontbeerlijke technische assistentie werd
verleend door de Centrale Dienst van het Biotechnion. Graag memoreer ik de
hulpvaardigheid van de heren Rijpma en Schimmel (ontwerp installaties en
tekenwerk), de heer v.d. Goor en Henk Bouwman (bouw installaties) en Alfred
van Baaren (foto- en reproduktiewerk).
Een semi-technische installatie kon worden opgesteld bij de proefaccomoda-
tie van het Zodiac complex dankzij de medewerking van de heer Deprijck van
de afdeling Bouwzaken en Prof. Oosterlee en zijn medewerkers van de afde
ling Veehouderij .
Dr. J. de Waart en zijn medewerkers hebben mij de mogelijkheid geboden een
deel van het onderzoek uit te voeren bij het CIVO-TNO te Zeist.
De prettige samenwerking met Prof. Jongebreur en de heer Poelma van het
IMAG wil ik hier niet onvermeld laten.
Het onderzoek werd voor 50% gefinancierd door het Fonds Hinderpreventie
Veeteeltbedrijven.
Ontwerp omslag: Willem Baljet

CONTENTS
1. Introduction 1
2. Materials and methods 12
3. Adaptation of digested sewage sludge to high ammonia
nitrogen concentrations 21
4. Influence of detention time and manure concentration 41
5. Influence of temperature 58
6. General discussion 71
Appendix. Preliminary research into the anaerobic decomposi
tion of phenol and p-cresol 81
Summary 90
Samenvatting 94
References 99

1 INTRODUCTION
1.1 GENERAL INTRODUCTION
The present-day economical system of the developed countries is based on
an almost unlimited supply of fossil energy and minerals at low costs. This
system has forced up the consumption of raw materials to such high levels
that the finite natural resources threaten to give out. The consequent
threat of a world fossil energy and mineral shortage has stimulated the
search for systems producing minerals and energy from renewable resources.
The modern economical system also has resulted in the production of large
amounts of industrial, domestic and agricultural wastes. Although wastes
may contain useful and valuable components, including potential energy, re
covery often could not compete with the low prices of these products on the
world market, thus attributing to wastes a negative economical value. The
consequent disposal of large amounts of waste materials has resulted in the
pollution of the natural environment on a mondial scale.
In combining both these problems the Western society is faced with, it
more and more becomes clear that wastes should be considered as raw materi
als rather than as unwanted materials of no or even a negative value. Be
cause of this there is a need for appropiate processes capable to convert
wastes into useful products, e.g. energy, food and minerals.
Anaerobic digestion of organic matter is one of the technologies avail
able now to reduce the environmental pollution while at the same time valu
able products are produced. In anaerobic digestion organic matter is micro-
biologically converted to a mixture of methane and carbon dioxide ('biogas')
which represents a very useful fuel. According to a global scheme of Beek
(1976) for mondial energy relations, the human activity in forestry, animal
keeping and human food results in a waste stream of 0.7 TW, which chiefly
is of organic nature. Assuming that these wastes can be converted to meth
ane at a 50 % efficiency, the potential energy recovery can be estimated at
0.35 TW, which is about 5 % of the present world fossil energy consumption.
Moreover, other elements of the digestible wastes such as nitrogen, phos
phorus, potassium etc. remain in the digested residues, which enables the
re-use of these compounds as fertilizer.
As compared to other processes directed towards the valorization of or
ganic wastes, e.g. methanol-, ethanol- and SCP-production, anaerobic di
gestion is particularly suited for treating wet complex organic wastes, be
cause the gaseous endproducts spontaneously escape from the liquid phase,
which saves the need for additional separation processes.
In nature, anaerobic digestion is part of the carbon cycle as it plays a
role in the mineralization of organic material. Anaerobic decomposition of
organic materials occurs at all places where organic materials accumulate

2 -
and the supply of oxygen is insufficient for aerobic degradation, e.g. in
marshes and lake sediments.
The fact that rottening organic material will produce an inflammable gas
has been known for centuries, particularly in the phenomenon of marsh gas.
The occasional dancing flames of this gas - ignited perhaps by sparks from
a nearby fire - seen at night, have given rise to many legends. As early as
1930, Van Helmont (Partington, 1960) mentioned, among 15 different kinds of
gas, an inflammable gas that evolves during putrefaction and also is con
tained in intestinal gas. Volta in 1776 (Priestley, 1790) was the first who
recognized the close relationship between the decaying vegetation in the
sediments of lakes and streams and the appearance of combustible gas.
The research on anaerobic digestion may be considered to have begun in
1808, when Davy (1814) collected methane from cattle manure in a retort un
der vacuum. Davy was not interested in the production of energy; his exper
iments were directed towards an evaluation of the fertilizing value of di
gested and undigested manure. Gayon (Dubaquie, 1943) in investigating the
digestion of manure in 1883 - 1884, collected such large amounts of gas,
that Pasteur suggested to utilize the gas produced from horse manure for
improving street lightning in Paris (Le Figaro, 1884). However, as a matter
of fact the first utilization of gas produced in anaerobic digestion occur
red in Exeter (England) in 1895, where the gas from a 'carefully designed'
septic tank was used for street lightning (Liebmann, 1956). Since then,
anaerobic digestion of domestic sewage sludge has been increasingly ap
plied. The main objective of sewage sludge digestion has always been - and
still is - the stabilization of excess primary and secundary sludge in do
mestic sewage treatment. The methane produced in this process sometimes was
considered as an useful byproduct to cover part of the energy requirements
of the treatment plant, but frequently it was simply flared. The digestion
process was also utilized for producing energy from agricultural residues
(manure, straw) whenever fossil energy was in short supply, e.g. during and
shortly after World War II in France, Algeria and Germany (Tietjen, 1975).
However, in the post-war period, energy from digestion of agricultural re
sidues could not compete with cheap fossil energy and the direct interest
in the process diminished. On the other hand, the development of manure di
gestion processes has been continued in some Asian countries (India, Korea,
China), which has resulted in an extensive small-scale application of the
process in these countries (Pyle, 1980).
The energy crisis of 1973 forced the developed countries to realize
their dependence on finite natural resources. This and the consequent pros
pect of ever-increasing prices of raw materials in the near future, has
strongly revived the interest and the research into anaerobic digestion as
an energy-producing method and an energy-saving waste treatment technology.
The main objective of the present investigation was to assess the energy
recovery and malodour abatement potentials of piggery waste digestion.

1.2 OBJECTIVES OF MANURE DIGESTION
The main objectives of applying manure digestion in the Netherlands are
1. the abatement of malodour nuisance during storage and spreading of ani
mal slurries and
2. energy recovery.
Until recently, animal husbandry was characterized by a close relation
between the number of animals kept and the area of cultivated land to pro
duce the animal feed. The import of large amounts of animal feed seriously
disrupted this relation and resulted in a change-over from traditional ani
mal husbandry to the system of intensive animal keeping. In regions where
intensive animal housing units are concentrated, much more manure is produc
ed than can be utilized for fertilizing the nearby cultivated land, thus
creating a serious manure-surplus problem.
For the purpose of reducing the labour requirements, intensive animal
production units commonly are equipped with slatted floors, beneath which
the combined droppings, viz. faeces, urine and spillage water, are collect
ed and stored. During storage of the slurry malodorous compounds are form
ed, which has to be attributed to the occurrence of an incomplete anaerobic
fermentation (Spoelstra, 1978). The spreading of these slurries frequently
causes malodour nuisance, especially in densely populated regions (Voorburg,
1978). When subjecting manure to anaerobic digestion under controlled con
ditions, most of the digestible organic matter is eliminated, resulting in
the production of a stabilized material without offensive odours.
Because of the production of an useful fuel, anaerobic manure stabili
zation provides an attractive alternative for conventional, energy-consum
ing aerobic treatment systems. According to V.d. Hoek (1977) aeration re
quires a minimum energy input of 36 kWh per pig place per year to prevent
malodorous nuisance during storage and spreading of pig manure.
The other, and in many cases prime object of animal manure digestion is
the recovery of biogas, which consists mainly of methane (60-75%) and car
bon dioxide (25-40%). The gas produced is an useful fuel, either for heat
ing or for driving combustion engines, e.g. to generate electricity. The
production of energy is particularly important for farms having a high
energy consumption, such as pig and poultry breeding units and dairies.
Depending on the farm size and the manure handling system applied, anaero
bic digestion may provide sufficient energy to cover the farm needs at pro
duction costs that can compete with the present-day retail price of fossil
fuels (Hashimoto and Chen, 1980; Poelma, 1981 personal communication).
However, in spite of its favourable prospects, the process can only play
a minor role in the national energy supply. In Table 1.1. the animal manure
production in the Netherlands has been estimated together with the maximum
obtainable gross methane yield. Table 1.1 indicates that, in case all ma
nure produced in the Netherlands is properly digested, the annual methane

production amounts to 720 x io6 m3. This corresponds to an energy produc
tion of 0.85 GW, which is about 1% of the present-day national energy con
sumption (Nota Energiebeleid, 1979).
Table 1.1 Potential methane production from animal wastes, produced in the Netherlands.
manure production methane production total methane production
(10 kg TS* year" ) (m kg"' TS*added) (10 m3 year"')
cattle 3 135 0.10 - 0.13b'C'd 300 - 400
pigs 1 080 0.15 - 0.20e'f 150 - 200
poultry 552 0.20 - 0.24C'e 100 - 120
total 550 - 720
a. Landbouwcijfers 1980
b. Baader et al., 1978
c. Badger et al., 1979
d. Hayes et al., 1980
e. Hobson et al. , 1980
f. van Velsen, this publication
* Total solids
An additional benefit of anaerobic digestion, in which only little inte
rest has been shown, concerns the use of digested residues for fertilizer
purposes. Upon digestion, manure retains its fertilizer value and becomes
easier to handle. The extensive small-scale practice of manure digestion in
countries like India (Singh, 1972) and Kenya (Hutchinson, 1972) has shown
that the fertilizing properties of manure even may improve through anaero
bic digestion, at least under the local conditions. A closer examination of
the available data learns that these observations have to be attributed to
the addition of straw and other carbon-rich material to the manure feed in
such amounts that the C to N ratio in the feed increases to approx. 30. In
consequence, the ammonia nitrogen present in the residue is almost comple
tely incorporated in bacterial biomass, thus producing a fertilizer which
does not rapidly release N, and therefore reduces the nitrogen losses dur
ing spreading. Given the needs for fertilizer and minerals, it becomes
clear that this benefit of anaerobic digestion is mirrored at in the devel
oping countries (Pyle, 1980).

- 5
At present such an improvement of the fertilizer value is of minor im
portance in developed countries, such as in the Netherlands, because these
countries largely rely on chemical fertilizers for their high agricultural
production. However, with the raising prices of chemical fertilizers, the
production of slow release organic fertilizers may become increasingly im
portant in these countries as well.
1.3 MICROBIOLOGY AND BIOCHEMISTRY OF ANAEROBIC DIGESTION
The effective conversion of complex organic matter to methane depends on
the combined activity of a miscelanneous microbial population, consisting
of diverse genera of obligate and facultative anaerobic bacteria. As a re
sult of the coordinated activity of the different bacterial groups, anae
robic digestion as a whole is a stable process.
According to the present knowledge, complete anaerobic digestion of or
ganic matter proceeds according to the scheme depicted in Fig. 1.1
(Mclnerney et al., 1980). The responsible microbial population is comprised
of at least four trophic groups of bacteria, each with a distinct carbon
catabolizing function: hydrolytic bacteria (1), H2-producing acetogenic
bacteria (2), methanogenic bacteria (3) and homo-acetogenic bacteria (4).
ORGANIC MATTER carbohydrates proteins lipids
\
I FATTY ACIDS
i 1 _^~^^^
ACETATE """
^ ^ ^
' ACETATE
DECARBOXYLATION (3)
ACETOGENIC DEHYDROGENATION (2)
ACETOGENIC HYDROGENATION (4)
(1) I I
' _ ^ H 2 + C 0 2
1
REDUCTIVE METHANE FORMATDN (3)
CH4.G02 a-u*H2o
Fig. 1.1 Scheme for the complete anaerobic degradation of organic matter according to Mclnerney et al. (1980).

Hydrolytic bacteria (group 1) ferment organic polymers, e.g. proteins,
polysaccharides and lipid material, into compounds with a low-moleculair
weight, such as volatile fatty acids, organic acids, alcohols, hydrogen,
carbon dioxide, ammonia nitrogen and sulphide. They possess the ability to
produce and excrete hydrolysing enzymes (exo-enzymes), enabling them to
utilize high-molecular, even undissolved compounds. According to the type
of exo-enzymes produced, hydrolytic bacteria isolated from anaerobic digest
er populations are classified in lipolytic bacteria, e.g. Anaerovibrio
lipolytica (Hobson et al., 1974), proteolytic bacteria, e.g. Clostridia
spp., Micrococcus spp. (Hobson et al., 1974) and Eubacterium (Zeikus, 1980)
and cellulolytic bacteria, e.g. Ruminococcus spp., Butz/rivibrio fibrisol-
vens (Hobson et al., 1974) and Clostridium thermocellum (Ng et al., 1977).
According to Hobson and Shaw (1974) streptococci are the predominant fer
mentative bacteria in piggery waste digesters. The total population of hy
drolytic bacteria in mesophilic sewage sludge amounts to 108 - 109 ml 1
(Kirsch, 1969; Mah and Sussman, 1968; Toerien and Siebert, 1967).
The obligate H2-producing acetogenic bacteria (group 2) degrade propio
nate and longer chain fatty acids, alcohols, aromatics and other fermenta
tion products. They produce acetate, hydrogen and carbon dioxide (from odd
numbered carbon sources). Because of their metabolic activity, the aceto
genic bacteria form an intermediate group linking the fermentative and
methanogenic stage. Since the catabolic reactions of the H2-producing ace-
togens are thermodynamically unfavourable unless the hydrogen partial pres
sure is kept extremely low (below 2 x io~3 atm. and 9 x 10~5 atm. for the
degradation of butyrate and propionate, respectively), these organisms can
grow only in the presence of hydrogen-utilizing bacteria, e.g. methanogens
and sulphate reducing organisms (Zeikus, 1980; Mclnerney et al., 1980).
Thus, in cocultured growth, the hydrogen metabolism of methanogens provides
thermodynamically favourable conditions for H2-producing acetogens. The
classic example of a H2-producing acetogen is the S-organism isolated from
the "Methanobacillus omelanskii" mixture. Bryant et al. (1967) demonstrated
that N. omelanskii, which had been regarded as an ethanol-utilizing metha-
nogen, in fact is a syntrophic association of two bacterial species, viz.
the S-organism catabolizing ethanol to acetate and hydrogen and Methano-
bacterium strain MOH. Recently Mclnerney et al. (1980) reported that inter
species hydrogen transfer reactions also occur in the methane formation
from propionate and longer chain fatty acids. Populations of 4.2 x 10⁶ H2-
producing acetogens per ml mesophilic sewage sludge have been reported
(Zeikus, 1980).
The methanogenic bacteria (group 3) produce methane from acetate and
one-carbon compounds, e.g. hydrogen/carbon dioxide (carbon monoxide) mix
tures, methanol, formate and methylamine (Balch et al., 1979). Owing to
their ability to produce a reduced gaseous endproduct, methane, that spon
taneously escapes from the liquid phase, the methanogens are the "key"-

7 -
organisms in the anaerobic digestion process providing thermodynamically
favourable conditions for the preceeding non-methanogenic stages. Methano-
gens are featured by the relatively slow growth rate, the requirement of
strictly anaerobic environments (redox potential below about -300 mV) and
the utilization of only a narrow range of substrates as their energy source.
Yet, the methanogens appear to show a wide microbial diversity. Balch et
al. (1979) proposed a taxonomie scheme, based on comparative cataloguing of
the 16S ribosomal RNA and substrates used (Table 1.2). They classified the
methanogens in three orders, viz. Methanobacteriales, Methanococcales and
Methanomicrobiales. In mesophilic sewage sludge digesters populations have
been reported of approx. 108 methanogens per ml (Zeikus, 1980).
Table 1.2 Proposed taxonomie scheme for methanogenic bacteria of Balch et al. (1979) based on comparative cataloguing of the 16S ribosomal RNA and substrates used.
Type Substrates for growth
strain and CH, production
Order I. Methanobacteriales (type order) Family I. Methanobacteriaceae
Genus I. Methanobacterium (type genus) 1. Methanobacterium formicicum (neotype species) 2. Methanobacterium bryantii
Methanobacterium bryantii strain M.o.H.G. 3. Methanobacterium thermoautotrophicum Genus II. Methanobrevibacter 1. Methanobrevibacter ruminantiwn (type species) 2. Methanobrevibacter arboriphilus
Methanobrevibacter arboriphilus strain AZ Methanobrevibacter arboriphilus strain DC
3. Methanobrevibacter smithii Order II. Methanococcales
Family I. Methanococcaceae Genus I. Methanocoacus 1. Methanococcus vannielii (neotype species) 2. Methanococcus voltae
Order I I I . Methanomicrobiales Family I. Methanomicrobiaceae (type family)
Genus I. Methanomicrobium (type genus) 1. Methanomicrobium mobile (type species) Genus II. Methanogenium 1. Methanogenium cariaci (type species) 2. Methanogenium marisnigri Genus III. Methanospirillum 1. Methanospirillum hungatii
Family II. Methanosarcinaceae Genus II. Methanosarcina (type genus) 1. Methanosarcina barkeri (type species)
Methanosarcina barkeri strain 227 Methanosarcina barkeri strain W
MF M.o.H.
AH
MI DH1
PS
SB PS
BP
JR1 JR1
JF1
H2
H2
H2
H2 H2
H2
H2 H2
H2
formate
formate
formate
formate formate
formate
formate formate
formate
MS H .CH.OH.CH.NH-,acetate H ,CH OH,CH3NH,acetate H .CHjOH.CHNH .acetate

- 8 -
The H2-consuming acetogenic or homo-acetogenic bacteria (group 4) show a
mixotrophic metabolism and catabolize both hydrogen/carbon dioxide and mul-
ticarbon compounds. They can produce acetate and longer chain volatile fat
ty acids from hydrogen/carbon dioxide mixtures, but are successfully out-
competed for hydrogen by the methanogenic bacteria in the gastro-intestinal
environment (Prins and Lankhorst, 1977). The exact role of homo-acetogenic
bacteria in anaerobic digestion is not yet clear. According to Zeikus
(1980), the net result of homo-acetogenic metabolism in anaerobic digestion
is the maintenance of low hydrogen partial pressures, thus contributing to
process stability. The present known homo-acetogenic bacteria all belong to
the genera Clostridium and Acetobacterium (Zeikus, 1980). Ohwaki et al.
(1977) and Braun et al. (1979) reported populations of 10s - 10e homo-aceto
genic bacteria per ml in sewage sludge.
The above mentioned scheme for anaerobic digestion describes the process
on the basis of distinguished trophic groups of bacteria found in anaerobic
digester populations. As the metabolism of these groups is closely inter
linked, the scheme is very useful for understanding the process, but be
cause of its complexicity it is not suited for describing the course of the
process from routine analyses.
A simplified scheme, shown in Fig. 1.2 is proposed for describing the
digestion of complex, undissolved substrates. In the scheme, anaerobic di
gestion is split up into three steps, viz. hydrolysis of undissolved com
pounds, acid formation and methane formation. The conversion degree of the
DIGESTION PROCESS CALCULATION ANALYSIS
ORGANIC MATTER
1 SIS
I HYDROLYSIS OF UNDISSOLVED MATTER
ACID - FORMATION
I METHANE - FORMATION
! CH4
total manure - COD
supernatant - COD
COD of the volatile fatty acids
COD of the methane produced
Fig. 1.2 Simplified scheme for descr ibing the anaerobic degradation of organic material on the bas i s of chemical rout ine analyses .

- 9 -
distinguished steps in continuous experiments can be roughly estimated from
routine analyses, by expressing the analytical data in terms of chemical
oxygen demand (COD).
According to the proposed scheme, hydrolysis is confined to the lique
faction of undissolved organic compounds and exclusively indicates the net
activity of hydrolysing exo-enzymes produced by fermentative bacteria. Acid
formation indicates the extent to which the feed-COD is converted into vol
atile fatty acids. For this purpose, it has been assumed (a) that methane
is exclusively produced from endproducts of fermentative and acetogenic bac
teria and (b) that volatile fatty acids are the predominant process inter
mediates as was stated before by Hobson et al. (1974). Methane formation
indicates which part of the feed-COD is ultimately converted to methane.
Methane formation thus expressed is a measure of the overall process effi
ciency under the circumstances investigated.
The proposed scheme provides a means to get insight in the conversion
degree of the distinguished process steps under the conditions investiga
ted. However, it should be emphasized that the three distinct steps do not
coincide with the trophic microbial groups discussed before. In consequence,
conclusions on the basis of the simplified scheme do not necessarily demon
strate the activity of the distinguished trophic groups.
2.1 MALODOURS IN ANAEROBICALLY STORED PIGGERY WASTES
Odours are hardly accessible to measurement, because both their strength
and their nature can be estimated only by sensory perception. As a conse
quence, methods have been developed for defining odours on the basis of the
subjective perception of panel members. These sensorial methods, e.g. ol
factometry, indicate the odour strength (threshold dilution level) rather
than the sensorial appreciation of the odour. To describe odour quality,
the subjectivity of the human language is introduced as well (Harper et
al., 1968). Furthermore, reliable sensorial measurements need rather large
panels to preclude the response of one individual, which makes them costly
and unsuited for routine analyses.
Odour can be defined more objectively by giving the complete spectrum of
contributing components, including their concentrations. For anaerobically
stored piggery wastes, this is impossible because of the great number of
compounds involved. Spoelstra (1978), in compiling literature data, men
tioned over sixty compounds identified in both the air of swine confinement
units and anaerobically stored piggery wastes. Furthermore, such a spectrum
of malodorous compounds, supposing it is complete, does not give any infor
mation about the nature of the malodorous sensation.
Attempts to overcome the practical problems involved in estimating malo-
dours of anaerobically stored piggery wastes, include the search for corre
lations between the malodour strength and the concentration of one or more

10 -
components, which contribute to the piggery waste malodour. As the concen
tration of such compounds can be determined instrumentally, such an ap
proach might provide a cheap and fast method for estimating malodours. How
ever, such a direct relationship is difficult to understand, because the
volatilization of acid and alkaline compounds depends on the pH level of
the wastes (Spoelstra, 1978).
According to Schaefer et al. (1974) the main compounds responsible for
the bad smell of piggeries are volatile fatty acids (especially butyric
acid), diacethyl, phenol, p-cresol, indole and skatole. A mixture of these
odorous compounds was selected by a panel as having similarity with the
odour from piggery wastes. However, when correlating odour intensity with
the concentration of these components in the air from piggeries it appeared
that a significant correlation was obtained only with p-cresol (Schaefer,
1977). Spoelstra (1978) investigated the formation of volatile fatty acids,
phenol, p-cresol, 4-ethylphenol, indole and skatole at anaerobic storage of
piggery wastes and demonstrated that these components result from the ac
tivity of fermentative bacteria. He further presented evidence that simple
phenols (phenol and p-cresol) and indoles (indole and skatole) originate
from the degradation of tyrosine and tryptophan, respectively.
In the underlying study the concentration of the malodorous compounds
presented by Schaefer et al. (1974) and Spoelstra (1978), viz. volatile
fatty acids, phenol, p-cresol, 4-ethylphenol, indole and skatole, have been
used to indicate the reduction of piggery waste malodours at anaerobic di
gestion.
1.5 OUTLINE OF THE INVESTIGATION
In view of the motives underlying the use of piggery waste digestion,
the investigation was directed to assess the potentials of anaerobic diges
tion to reduce malodours and to produce energy.
Chapter 3 describes the start-up of piggery waste digesters seeded with
anaerobic sewage sludge. As the adaption of anaerobic sewage sludge to pig
gery waste appeared to be related to an increase of the ammonia nitrogen
concentration beyond the presumed inhibitory level of approx. 1500 mg 1 *
(McCartey et al., 1961), the effect of high ammonia nitrogen concentrations
on the digestion process is emphasized.
In Chapter 4 attention is given to the effects of the manure concentra
tion and the detention time on the digestion of piggery waste.
Experiments on the influence of the process temperature are presented
and discussed in Chapter 5.
Chapter 6 contains a general discussion on the anaerobic digestion of
piggery wastes. From the results obtained proposals are made for improving
the process efficiency.

- 11 -
The results of some preliminary experiments on the elimination of phenol
and p-cresol under anaerobic, methanogenic conditions are presented and
discussed in an Appendix.
12 -
2 MATERIALS AND METHODS
2 .1 ANALYSES
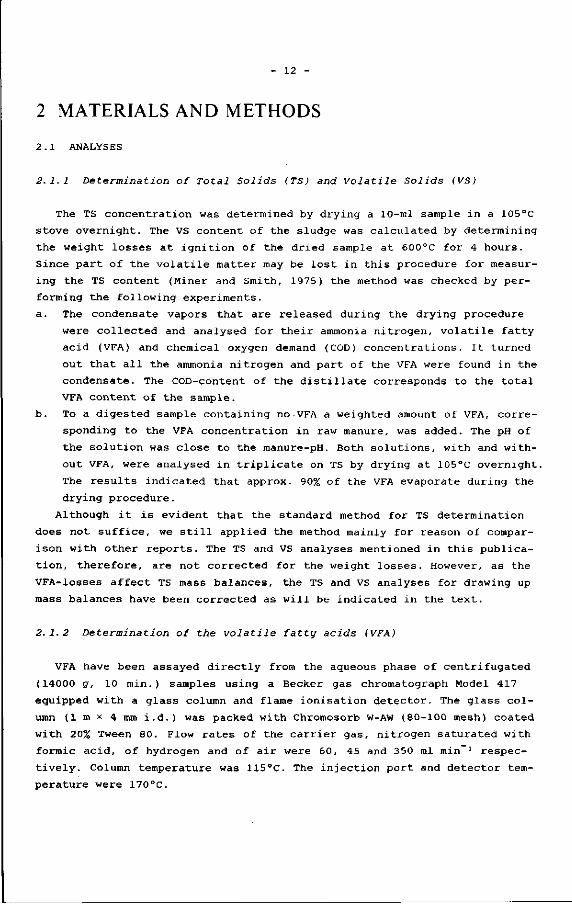
2.1.1 Determination of Total Solids (TS) and Volatile Solids (VS)
The TS concentration was determined by drying a 10-ml sample in a 105°C
stove overnight. The VS content of the sludge was calculated by determining
the weight losses at ignition of the dried sample at 600°C for 4 hours.
Since part of the volatile matter may be lost in this procedure for measur
ing the TS content (Miner and Smith, 1975) the method was checked by per
forming the following experiments.
a. The condensate vapors that are released during the drying procedure
were collected and analysed for their ammonia nitrogen, volatile fatty
acid (VFA) and chemical oxygen demand (COD) concentrations. It turned
out that all the ammonia nitrogen and part of the VFA were found in the
condensate. The COD-content of the distillate corresponds to the total
VFA content of the sample.
b. To a digested sample containing no VFA a weighted amount of VFA, corre
sponding to the VFA concentration in raw manure, was added. The pH of
the solution was close to the manure-pH. Both solutions, with and with
out VFA, were analysed in triplicate on TS by drying at 105°C overnight.
The results indicated that approx. 90% of the VFA evaporate during the
drying procedure.
Although it is evident that the standard method for TS determination
does not suffice, we still applied the method mainly for reason of compar
ison with other reports. The TS and VS analyses mentioned in this publica
tion, therefore, are not corrected for the weight losses. However, as the
VFA-losses affect TS mass balances, the TS and VS analyses for drawing up
mass balances have been corrected as will be indicated in the text.
2. 1. 2 Determination of the volatile fatty acids (VFA)
VFA have been assayed directly from the aqueous phase of centrifugated
(14000 g, 10 min.) samples using a Becker gas Chromatograph Model 417
equipped with a glass column and flame ionisation detector. The glass col
umn (1 m x 4 mm i.d.) was packed with Chromosorb W-AW (80-100 mesh) coated
with 20% Tween 80. Flow rates of the carrier gas, nitrogen saturated with
formic acid, of hydrogen and of air were 60, 45 and 350 ml min ' respec
tively. Column temperature was 115°C. The injection port and detector tem
perature were 170°C.

- 13 -
2.1.3 Determination of the chemical oxygen demand (COD)
COD was estimated according to Standard Methods (Am. Society, 1965). The
liquid phase-COD (COD ) was determined on supernatant samples prepared by
centrifugation at 14000 g for 10 minutes.
2.1.4 Determination of ammonia nitrogen
Two methods were used to determine the ammonia nitrogen concentration.
a. Steam distillation at pH 7.4 into a boric acid solution and titration
with standard acid.
b. Distillation at pH 7.3, with lead hydrocarbonate as a catalyser, into a
boric acid solution and titration with a standard acid.
2. 1. 5 Determination of total nitrogen
The total nitrogen concentration was determined by a Kjelldahl-type de
struction, followed by neutralization with NaOH and distillation at pH 7.3
into a boric acid solution and titration with a standard acid.
The destruction procedure was as follows: a well mixed 10-ml sample was
boiled in concentrated sulphuric acid with Selenium Mixture GR as a cataly
ser, up to clearness of the sample.
2. 1. 6 Determination of the pH
A Knick pH-meter was used for pH measurements.
2. 1. 7 Determination of phenol, p-cresol, 4-ethylphenol, indole and skatole
The concentration of these aromatic compounds was determined using two
methods.
a. According to the method described by Spoelstra (1978).
Two ml of a freshly prepared 6% NaHC03 solution and 1.00 ml of a stan
dard solution of 5-decanol in ether were added to a sample of slurry of
about 5 g. 5-Decanol was used as an internal standard in the gaschroma-
tographical analysis. Subsequently, the sample was extracted four times
with 20 ml of ether. The emulsion, which was usually formed during the
ether extraction, was broken by gentle centrifugation. The combined
ethereal fractions were evaporated under reduced pressure at a maximum
temperature of 25°C to a volume of a few millilitres. The residual
ether was dried by adding anhydrous CaS04, and transferred to a 10-ml
tube. The volume was further reduced to 0.5 - 1 ml by holding the test
tube in a waterbath of 30°C. Approximately 1 microlitre of the final
ethereal solution was injected for gas-chromatographical analysis.

14 -
The gas Chromatograph used was a Varian 2240 model equipped with a
flame ionisation detector. A column of stainless steel (3m * 3mm o.d.)
was used, packed with 10% SE 30 on Chromosorb W-AW (80 - 100 mesh). The
operational data were: temperature, oven 140°C; injection port 150°C;
detectorblock 190°C; flow of carrier gas, nitrogen, of air and of H2
40, 300 and 30 ml min ~1, respectively.
The peak heights obtained were measured relative to the peak height of
the internal standard and compared with a calibration curve, which had
been obtained by the same procedure as described above with mixtures of
known concentrations of phenol, p-cresol, 4-ethylphenol, indole and
skatole in water,
b. A gas chromatographical method applied to supernatant samples (14000 g,
10 minutes) without further treatment. The clear samples were intro
duced in a glass column (2m x 4 mm i.d.) packed with 5% FE'AP on Chromo
sorb G-AW-DMCS. The column was installed in a Becker 756 gas Chromato
graph equipped with a flame ionisation detector. Column temperature was
200°C and that of the injection port and detectorblock 240°C. Flow
rates of the carrier gas, nitrogen, of H2 and of air were 75, 50 and
235 ml min *, respectively.
The peak heights obtained were measured relative to the peak heights of
mixtures of known concentrations of these aromatic compounds in water.
2. 1. 8 Determination of hemicellulose, cellulose and lignin
The concentration of hemicellulose, cellulose and lignin in dried sam
ples was determined according to the method described by de Wit (1980).
One gram of washed solids was supplied with 50 ml of 0.1 N H2S04 and
transferred to a glass tube which was sealed and heated for 6 hours at
100°C. During hydrolysis the tube was shaken frequently. After cooling, the
slurry was centrifugated. The supernatant was used for carbohydrate analy
sis. The amount of hemicellulose was estimated by measuring the reducing
sugars present in the hydrolysate. Reducing sugars were determined accor
ding to the method of Somogyi and Nelson (Somogyi, 1952) as described by
Hodge and Hofreiter (1962).
After washing with acetone and air drying, the residue of the hemicellu
lose determination was transferred to a tube which was supplied with 2 ml
of 72% sulphuric acid and left at 30°C for 1 hour in order to solubilize
the cellulose. Subsequently, 50 ml of water was added, the glass tube
sealed and the contents hydrolysed completely at 100°C within 6 hours. Af
ter cooling, the slurry was spun down and the supernatant analysed for glu
cose which resulted from the hydrolysis of cellulose.
The residue of the cellulose hydrolysis was washed twice with deionized
water and dried at 103°C until constant weight. The dried samples were sub
sequently heated at 550°C for 6 hours whereupon the ash content was measur
ed. Oven-dry sample minus ash content was defined as lignin.

15
2. 1. 9 Gas analysis
The methane content of the gas was determined using one of the following
methods.
a. Gas chromatographically on a Fraktovap Model M partitioner equipped with
a dual column arrangement of Molecular Sieve 30/60 mesh 5A and silica
gel 30/60 mesh.
b. Entrapping of the carbon dioxide of the gas in a KOH solution. This ana
lysis is performed with an Orsatt apparatus. As all remaining gas is
assumed to consist of methane, this analytical method provides only a
rough estimate of the methane content of the gas.
c. Combustion of the gas in a portable combustible gas meter calibrated
for methane.
2.2 MATERIALS
2. 2.1 Manure and seed materials
The piggery wastes used in the experiments consisted of combined faeces,
urine and spillage water, obtained from different piggeries. Because of the
inevitable variations in the composition of the feedstock, the most relevant
chemical characteristics of the manure used are mentioned in each Chapter
separately.
This also holds for the origin and the chemical characteristics of the
seed materials.
2.2.2 Volatile fatty acids stock solution
The volatile fatty acids stock solution (Chapter 3) contained 12 g 1 1
acetic acid, 7 g 1 ' propionic acid and 4 g 1 _ 1 n-butyric acid. The solu
tion was neutralized with NaOH.
2.3 EXPERIMENTAL EQUIPMENT
2. 3. 1 Batch experiments
The batch experiments described in Chapter 3 were performed in 1-litre
glass bottles, placed in a temperature-controlled room of 30 ± 2°C. The di
gestion units were shaken by hand once a day. The gas production was deter
mined by means of a brine displacement system.
The equipment used for the batch experiments, described in the Appendix,
consisted of 5-litre glass bottles, placed in a temperature-controlled room
of 30 ± 2°C. Mechanical mixing was provided for 15 s every 20 min. The gas
produced was led through a 1% NaOH solution in order to entrap volatile aro-

16
matic compounds. In the gas outlet system only poly-ethylene tubes were used.
The gas production was estimated with a brine displacement system.
2. 3. 2 Daily fed laboratory experiments
The laboratory experiments were performed in digesters with a volume of
1.5, 2, 5, 6 and 45 litres. The experimental arrangement of the digesters
was further almost identical. The digester system is shown in Fig. 2.1.
1. inlet pipe 2. digestion vessel 3. s t i r r ing motor 4 outlet pipe 5. gas outflow pipe 6. brine displacement system
Fig. 2.1 Laboratory digester system
The fresh manure was added at the top of the digester whereas the efflu
ent was discharged at the bottom. The gas production was estimated with a
brine displacement system using brine with a pH of 1 in the experiments
with 1.5-litre and 2-litre digesters and by means of a wet gas meter in the
experiments with 5-litre, 6-litre and 45-litre digesters.
The digestion units except those with a volume of 45 litres were placed
in a temperature-controlled room of 30 ± 2°C. The experiments at deviating
temperatures were conducted in 5-litre digesters equipped with a water jack
et. Digestion temperature in these digesters was regulated by circulating
thermostated water through the jacket. The 45-litre digesters were heated
electrically. Temperature in these digesters was regulated with a thermo
couple in the digester contents.
The digestion units were mixed mechanically at 100 rev min ' for 15 s
every 4 min. At this stirring intensity the small digesters (1.5 - 6 litres)
were mixed up completely, but the stirring capacity in the 45-litre digest
ers was not sufficient to achieve a complete mixing of the digester contents.

- 17
2. 3. 3 Small pilot plant experiments
The small pilot plant consisted of two identical insulated digestion
units with a volume of 240 litres each. The digester system is shown in
Fig. 2.2.
1 manure inlet tunnel with sieve
2. digestion unit
3. outlet pipe
4. sludge recirculation pump
5. gas meter
6. gas recirculation pump
7 thermo couple and
thermostatic control
8. water circulation pump
9. hot water tank (about 50°C)
Fig. 2.2 Small pilot plant digester (240 litres).
Mixing was achieved by continuous gas recirculation using a gas flow of
about 3 litres min ' . Furthermore the digester contents were mixed by re
circulating the digester contents with a sludge pump (capacity approx.
5 m3 h ') once a day for 15 min. The daily feed was added during sludge re
circulation. To prevent damage to the sludge pump the manure feed was sieved
through a 0.5-cm sieve to remove hairs, straw etc.
The digester heating system consisted of a hot water tank (temperature
of the water 50°C), a water circulation pump and stainless steel heat ex
change piping inside the digester. The digestion temperature (30 - 32°C)
was controlled by means of a thermocouple and a thermostatic control, con
nected with the water circulation pump. Gas production was determined with
a wet gas meter.

- 1 É
2. 3. 4 Pilot plant experiments
Pilot plant experiments were conducted in a 6-m3 insulated steel diges
ter. A scheme of the experimental pilot plant is shown in Fig. 2.3.
gas*-Q
foam separator
overflow
manure storage tank
C—*-Q*W^-
Fig. 2.3. Experimental pilot plant digester (6 m3)
The contents of the digester were kept at a constant temperature by re
circulating electrically heated water (35°C) through the digester bottom
and an internal heat exchanger. Mixing was accomplished by intermittent
mechanical stirring at the bottom of the digester (0.7 rev min ') and at
the top of the digester (30 rev min ' ) . Fresh manure was added from a man
ure holding tank at the bottom of the digester by means of an adjustable
mono-pump. The fresh manure displaced an equal amount of the digester con
tents via an overflow system at the upper part of the digester into an
effluent storage tank. The gas was discharged at the top of the digester.
Gas production was measured with a dry gas meter.
2.4 EXPERIMENTAL PROCEDURES
The laboratory and 240-litre pilot plant digesters were fed daily except
during the weekends when only one feed was supplied, although of a double
amount. The feeding procedure was as follows. After determining the gas pro
duction a fixed volume (determined by the detention time) of the mixed di
gester contents was discharged. Then the manure was added according to the
organic and hydraulic load. Before and during the feeding procedure the di
gester contents were mixed.

19
In the 6-m3 digester fresh manure was added every 30 min for 1 min. In
view of the feeding system the pilot plant digester can be considered as a
continuously fed system.
The duration time of all daily fed and continuous experiments was at
least three times the hydraulic detention time in order to approach a steady
state and to avoid the influence of variations in the manure composition.
2.5 CALCULATIONS
2. 5. 1 Calculation of the degree of hydrolysis, acid formation and methane
formation in continuous experiments.
The digestion of undissolved material can be supposed to proceed in
three subsequent steps, viz. hydrolysis, acid formation and methane for
mation (Chapter 1.3). For the calculation of the conversion degree of the
separate steps at the end of the daily fed and continuously fed experiments,
when a steady state condition had been approached, all experimental results
are converted to COD-values (Fig. 1.2).
The degree of hydrolysis, acid formation and methane formation can be
calculated then by the following equations:
Hydrolysis (%) = 100 (G+S)/M
Acid formation (%) = 100 (G+V)/M
Methane formation (%) = 100 G/M
in which: G = COD removed via methane gas ( g l 1 manure)
The COD-value of the digester gas is calculated by multiply
ing the volumetric methane production (at 30°C and a pressure
of 720 mm Hg) by 2.46.
S = COD supernatant (g 1~')
M = total manure COD (g l"1)
V = COD, corresponding with the VFA concentration ( g l 1).
The VFA-COD is calculated by multiplying the concentration
(in g 1 ') of acetic acid, propionic acid, (n- and iso-) bu
tyric acid and (n- and iso-) valeric acid with a factor of
1.06, 1.51, 1.82 and 2.04 respectively and summing up the
COD-values of the separate VFA.
In the calculation it is assumed (1) that in hydrolysis only undissolved
organic matter* is converted into dissolved fragments, (2) that the VFA are
exclusively formed by acid-forming bacteria and (3) that all methane pro
duced originates from the endproducts of the acid formation.
Arbitrarily defined as the material that is precipitated during centrifligation at 14000 g for 10 minutes.

- 20
2.5.2 Calculation of the concentration of undissociated ammonia nitrogen
The fraction of undissociated ammonia under a given set of conditions
can be calculated by the following equation:
PH NH -N = NH -N 10
kb/kw + 1 0 p H
in which: NH3-N = concentration of undissociated ammonia nitrogen (mg 1 ' )
NH4-N = concentration of total ammoniacal nitrogen (mg 1 ] )
k, = dissociation constant of aqueous ammonia
k = ionization constant for water w The values of k. and k at different temperatures were derived from Weast
b w (1972).

21 -
3 ADAPTATION OF DIGESTED SEWAGE SLUDGE TO HIGH AMMONIA NITROGEN CONCENTRATIONS
3.1 INTRODUCTION
In anaerobic digestion the greater part of the oxygen demanding organic
matter is eliminated from the liquid phase through the formation of methane.
Therefore the process efficiency largely depends on the metabolism rate of
the methanogenic organisms. In view of specific features of the methane-
producing organisms, such as the long generation time and sensitivity to
environmental factors, the start-up of the digestion process is of great
importance, especially that of the methanogenic stage.
With respect to the feasibility of the on-farm application of digestion
a proper start-up procedure, i.e. not requiring intensive supervision,
should be on hand. This condition seems to be met for digesters treating
ruminant wastes, because these wastes as a rule contain sufficient anaero
bic organisms, acid-forming as well as methane-forming, to start the diges
tion process without seeding. However, in the manure of non-ruminants such
as pigs and poultry, the concentration of methanogenic bacteria is relative
ly low. Together with the low growth rate of these organisms, this will re
sult in an extended period of digester start-up, unless seed material is
added (Hobson and Shaw, 1973). Therefore, seeding is recommended of diges
ters treating pig and poultry wastes.
Undoubtedly the mixed liquor from a well-working digester treating the
same type of manure is the most suitable seed material. However, up to now
anaerobic digestion of farm wastes still is not extensively applied and
therefore, other seed materials should be considered. An attractive mate
rial for this purpose is digested sewage sludge from municipal sewage
plants (1) because this material is the only enriched methanogenic inoculum
generally available in large quantities and (2) because it may be expected
to be a suitable seed material for the digestion of substrates being as
complex as raw sewage sludge, viz. piggery wastes.
Being a microbial process, methanogenesis is influenced by a variety of
environmental factors. An important factor in this respect is ammonia ni
trogen, because exceptionally high ammonia nitrogen concentrations frequent
ly occur in piggery wastes, e.g. exceeding 3000 mg l"1.
Evidently a minimum amount of ammonia is always required in order to
achieve favourable conditions for growth, because ammonia nitrogen is an
essential nutrient for most anaerobic organisms (Mah et al., 1977). Ammonia
nitrogen concentrations up to 1500 mg 1 ' , which frequently occur in sewage
sludge digester, are supposed to have no adverse effects on the methane
formation. However, the effect of ammonia nitrogen at concentrations in ex
cess of 1500 mg 1 ' is not clear at present. Literature data concerning the
effect of these ammonia nitrogen concentrations on methane formation are
rather conflicting.

22 -
McCarty and McKinney (1961) stated that ammonia nitrogen concentrations
between 1500 and 3000 mg l"1 are inhibitory at pH levels above 7.4, whereas
ammonia nitrogen concentrations in excess of 3000 mg 1 ' are toxic at all
pH values. These threshold levels were confirmed by Hobson and Shaw (1976)
in investigations on the influence of ammonia nitrogen on a pure culture of
Methanobacterium formicicum. Albertson (1961) studied the digestion of se
wage solids and reported an ammonia nitrogen inhibitory level of approx.
1250 mg l"1. According to McCarty and McKinney (1961) the ammonium ion toxi
city is related to the concentration of undissociated ammonia in the solu
tion. The critical concentration for inhibition of methanogenesis appeared
to be approx. 140 mg l"1. On the other hand many investigators recently re
ported satisfactory anaerobic digestion at ammonia nitrogen concentrations
considerably exceeding 1500 « g l 1 , even in combination with pH values in
the range 7.5 - 8. These results were obtained in the digestion of concen
trated sewage sludge (Melbinger and Donnellon, 1971) and animal wastes
(Gramms et al., 1971; Lapp et al., 1975; Hobson and Shaw, 1976; Kroeker et
al.,1976; Converse et al., 1977; Fisher et al., 1977). The successful di
gestion at ammonia nitrogen concentrations in excess of 1500 mg 1 ' was
attributed to an adaptation of the methanogenic organisms (Melbinger and
Donnellon, 1971; Lapp et al., 1975), to cation antagonism (Lapp et al.,
1975) or to a combination of both.
This Chapter deals with the results of laboratory and pilot-plant stud
ies concerning the adaptation of digested sewage sludge to piggery waste.
The main objective was to establish practical directions for starting up
anaerobic digesters for piggery waste and similar substrates.
The sensitivity of the microbial population, both adapted and unadapted
to piggery waste, to ammonia nitrogen concentrations up to 3500 mg 1 ] was
tested in batch-type experiments.
The final part of the investigation on the adaptation, described in Sec
tion 3.3, concerns the influence of ammonia nitrogen concentrations in the
range 2070 - 5290 mg l_1on the continuous digestion of piggery wastes by a
microbial population, which was well adapted to this material.
3.2 START-UP PROCEDURE WITH DIGESTED SEWAGE SLUDGE AS SEED MATERIAL
3. 2. 1 Procedures
The influence of the organic loading rate on the adaptation of digested
sewage sludge to piggery waste was investigated both in four 4-litre diges
ters (Section 2.3.2) and in the 6-m3 pilot plant (Section 2.3.4). The di
gestion units were filled completely with digested sewage sludge. The seed
materials for the laboratory and pilot plant experiments were obtained from
the municipal sewage plant at Zeist and Ede, respectively. Some chemical

- 23
characteristics of both seed sludges are summarized in Table 3.1. Before
starting the feeding with piggery waste the digesters were warmed up to the
digestion temperature of 30CC.
Table 3.1 Chemical characteristics of the seed materials used in the start-up experiments.
TS (g 1 ')
vs (g r ' ) Ammonia nitrogen (mg N 1 )
Total ammonia (mg N 1 )
COD total (mg 1~')
COD supernatant (mg 1 )
COD of the VFA (mg 1~')
Acetic acid cone, (meq 1 )
Propionic acid cone, (meq 1 )
Laborato
36.0
22.2
900
n.d.
n.d.
700
0
0
0
ry Pilot plant
31.6
21.5
336
1420
16900
980
18
0.3
0
In order to investigate the effect of the loading rate upon the adapta
tion, different initial loading rates have been applied in the laboratory
experiments. Since in these experiments manure was used with a TS concentra
tion of about 60 g 1 ' , the desired loading rate could be obtained by ad
justing the detention time. In the course of the experiments the loading
rate was increased gradually. The experiments were continued until a stable
digestion process had been achieved at a 15-days detention (loading rate
4.0 kg TS « 3 day ' ). Based on the results of the laboratory experiments
the pilot plant was operated at an initial loading rate of approx. 2.5
kg TS m 3 day"1 (detention time 20 days). At day 67 the loading rate was
increased to approx. 3.5 kg TS m"3 day"1 (detention time 15 days).
The manure used in the investigation consisted of both urine and faeces.
Relevant chemical characteristics of the manure are contained in Table
3.2.

- 24
Table 3.2 Chemical characteristics of the manure used in the start-up experiments
TS (g 1 )
vs (g r ' ) pH
Ammonia nitrogen (mg N I )
Total nitrogen (mg N I )
COD total (mg 1 )
COD supernatant (mg 1 )
COD of the VFA (mg 1_1)
Acetic acid (meq 1 )
Propionic acid (meq 1 )
Labora
day 0-147
57.5
38.2
n.d.
1675
3400
58500
15900
8700
65
28
tory
day 147-200
61 .7
46.3
n.d.
2480
4230
60000
23500
15200
100
4
P
average
58.3
43.9
7.03
1200
2680
51750
8440
4775
40.3
9.1
Llot plant
maximum
93.9
64.6
7.92
1800
3800
116500
16250
8700
72.7
17.7
minimum
29.5
21.6
6.4
720
1570
28000
4100
1580
13.2
3.4
The manure used in the laboratory experiments was obtained from pig
geries with a slatted-floor system and contained no litter material. If
necessary the manure was diluted with tap water to a TS concentration of
about 60 g 1 1 . The experiments were conducted with two different batches
of manure, which were stored at 4CC. From analyses made twice a week during
the storage period it appeared that storage at 4°C hardly affects the che
mical composition of the manure.
The piggery waste used in the pilot plant experiment was obtained from
an experimental farm where the manure solids and the manure liquid were
discharged separately. Before digestion both fractions were combined in
appropriate proportions. The manure in this case partly consisted of saw
dust and other litter materials. As the manure concentration varied con
siderably, only the maximum, the minimum and the average values are given
in Table 3.2.
Before as well as after the adaptation of digested sewage sludge to pig
gery waste the microbial populations were tested for their sensitivity to
ammonia nitrogen in concentrations up to 3500 mg 1 1 . The tests were per
formed in five 1-litre batch digesters (Section 2.3.1) at a temperature of
30°C. One series of digesters was seeded with digested sewage sludge from
the municipal sewage plant at Zeist. The ammonia nitrogen concentration of
the seed material was 815 mg l"1. The other series was conducted with di
gested piggery waste, adapted to 2420 mg 1_ 1 ammonia nitrogen. The sludge

- 25
was obtained from a well-balanced laboratory digester, which was fed with
piggery waste for a period of 6 months. Originally the piggery waste di
gester was seeded with digested sewage sludge of the same origin as the
sludge used in the first series of the tests.
The digestion units were seeded with 250 ml of the seed material. After
addition of 500 ml tap water, ammonium chloride was supplied from a concen
trated stock solution to increase the ammonia nitrogen concentration to the
desired level. The ammonia nitrogen concentrations employed are summarized
in Table 3.3. Feed was added by supplying 100 ml of a neutralized VFA stock-
solution (Section 2.2.3). Then the digesters were filled up to 1 litre with
tap water and subsequently the digester-pH was adjusted to 7.0 with HCl or
NaOH. At the start of the experiments nitrogen gas was passed through the
digester contents to assure anaerobic conditions. The course of the methane
formation was followed by measuring the gas production (daily) and the VFA
concentration in the digester contents (2 or 3 times a week).
Table 3.3 Ammonia nitrogen concentrations employed in the batch experiments (in mg N l"1).
Digested sewage sludge Digested piggery manure
730
1210
2360
3520
4990
605
1230
1790
2410
3075
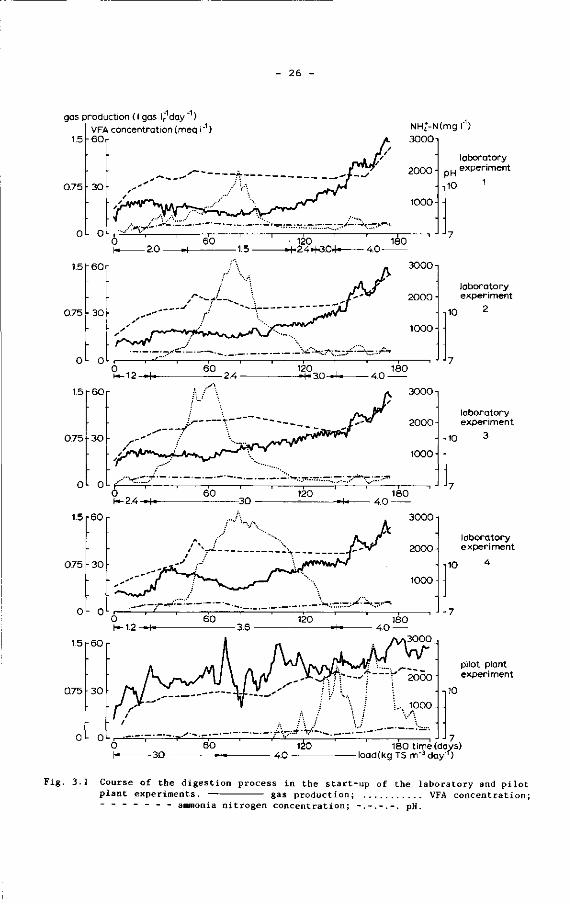
3.2.2 Results
The course of the gas production, the VFA concentration, the ammonia
nitrogen concentration and the pH of the mixed liquor in the start-up ex
periments are shown graphically in Fig. 3.1, together with the loading
rates applied.
- 26
gas production ( I gas I, day ~1) VFA concentration (meq I"1)
- 6 0 NHj-N(mg I"1) 30001
laboratory experiment
. J J 7 180 time (days)
load (kg TS m"3day'r)
Fig. 3.1 Course of the digestion process in the start-up of the laboratory and pilot plant experiments. gas production; VFA concentration; - - - - - - - ammonia nitrogen concentration; -.-.-.-. pH.

- 27
From these results it appears that the course of the process was very
similar in all experiments. The results reveal an immediate start of the
gas production after supply of the feed and no appreciable accumulation of
VFA in the first weeks after the start of the experiments. However, in due
time the VFA concentration increased in all experimental units, indicating
that the digestion process passed a certain imbalance. Nevertheless, the
feeding of the digesters was continued at the same level. In spite of this
the digestion process in all digesters recovered within 3 months. Some of
the more characteristic features of the start-up period as observed in the
laboratory experiments, such as the maximum total VFA, the maximum acetic
acid and propionic acid concentrations and the duration of the period of
process imbalance, are summarized in Table 3.4. For this purpose we defined
the digestion process as being in imbalance at VFA concentrations in excess
of 10 meq 1 1 .
Table 3.4 Summary results of the laboratory start-up experiments.
Exp. 1 Exp. 2 Exp. 3 Exp. 4
-3 -1 Load at acclimation (kg TS m day )
Sludge load (kg COD kg"'VS day"1)
Duration of adaptation period * (days after initial feeding)
Duration period of imbalance (days)
Maximum VFA cone, (meq 1 )
Maximum ace t i c acid cone, (meq 1 )
Maximum propionic acid cone, (meq 1 )
The d iges t ion process i s a r b i t r a r i l y considered to be imbalanced at VFA concentrat ions
in excess of 10 meq 1
2.0 - 1.5
0.070
93
48
40
38
8
2
0
117
71
64
50
14
4
084
3.
0.
106
80
65
42
22
0
105
3.6
0.12
131
84
64
55
27
In comparison with the laboratory experiments, where the increase in the
VFA concentrat ion s tar ted approx. 25 days a f t er the i n i t i a l feeding, the
increase in the VFA concentrat ion in the p i l o t p lant experiment was s i g
n i f i c a n t l y delayed because i t took p lace a f t er 110 days.
The smell of the d iges ter e f f l uen t in the period of unbalanced d i g e s t i on
as determined by personal observation was rather obnoxious and more or l e s s
s imi lar to that of fresh manure. However, a f t er recovery of the process the

28
o d o u r WAS s i g n i f i c a n t l y l e s s o b j e c t i o n a b l e than t h a t o f t h e f r e s h manure.
The me t h an e p r o d u c t i o n b e f o r e and a f t e r t h e p e r i o d o f imba lance i s c o n t a i n
ed i n T a b l e 3 . 5 . From t h e s e da ta i t appears t h a t t h e d i g e s t i o n p r o c e s s has
n o t b e en s e r i o u s l y a f f e c t e d by t h e temporary u p s e t . The h i g h e r g a s y i e l d a s
f ound i n t h e p i l o t p l a n t e x p e r i m e n t r e l a t i v e t o t h a t i n t h e l a b o r a t o r y e x
p e r i m e n t s s h o u l d be a t t r i b u t e d t o t h e p r e s e n c e o f l i t t e r m a t e r i a l s i n t h e
manure u sed i n t h e p i l o t p l a n t e x p e r i m e n t .
Table 3.5 Methane production before and a f te r the period of imbalanced d igest ion in the s t a r t - up experiments.
Laboratory P i lo t p lant
Exp. 1 Exp. 2 Exp. 3 Exp. 4
be f(>?e pei'-i-od of process imbalance
- 3 -1 Load (kg IS m day )
CH, production (m CH, kg-1TS added)
After period of process -imbalance
Load (kg TS m " day ) 3 -1
CH/ production (m CH, kg TS added)
2.0
0. 173
1.2
0.207
2.4
0. 181
! .2
0. 195
2.5
0.227
2.4
0. 186
3.0
0. 184
4. 1
0. 165
3.6
0.172
3.5
0.265
After recovery of the process the organic loading rate was increased in
all experiments to approx. 4 kg TS m ~ 3 day" 1 by increasing the detention
time stepwise to 15 days (Fig. 3 . 1 ) . At day 147 it was necessary to use
manure of a slightly different chemical composition in the laboratory ex
periments. Both these changes did not affect the process stability. At the
end of the experimental period the digestion process proceeded very similar
ly in all laboratory digesters and the results were also in accordance with
those of other experiments conducted at comparable process circumstances
(Chapter 4) as can be seen in Table 3.6.

29
Table 3.6 Comparison of the average results at the end of the start-up experiments with those of other experiments at similar process circumstances (Chapter 4). Manure concentration 60 g 1 1; detention time 15 days; temperature 30°C.
'typical' results results of the startup experiments
3 -1
CH production (m CH kg TS added) 0.197
pH 7.8
Ammonia nitrogen (mg N 1 ) 2675
TS reduction (%) 30.8
VS reduction (%) 39.2
VFA concentration (meq 1 ) 3.5
Acetic acid (meq 1 ) 3.5
Propionic acid (meq 1 ) 0
0
7
27 50
31
42
5
3
1
202
55
6
6
0
1
3
The results of the batch experiments with digested sewage sludge and di
gested piggery waste are shown in Figs. 3.2 and 3.3, respectively. The re
sults presented in Fig. 3.2 indicate that methanogenesis in digested sewage
sludge adapted to 815 mg 1 1 ammonia-nitrogen takes place at all ammonia
nitrogen concentrations investigated, even at a concentration of 4990 mg
1 '. However, an increasing lag phase occurs when the sludge is inoculated
at increasing concentrations, viz. extending to 50 days at an ammonia ni
trogen concentration of 4990 mg 1 1. Once the methane formation has begun,
the VFA were eliminated simultaneously except at 4990 mg 1 ] ammonia ni
trogen when propionic acid was not eliminated at all, even not after 90
days of incubation.
In digested piggery waste acclimated to 2420 mg 1 _ 1 ammonia nitrogen
methane production started immediately after the incubation at all ammonia
nitrogen concentrations investigated in the range 605 - 3075 mg 1 1 . In
these experiments the course of the gas production as well as that of the
VFA elimination are very similar. Acetic acid and butyric acid were elimi
nated simultaneously and immediately after incubation, whereas the break
down of propionic acid started only 18 days after incubation. The methane
content of the gas collected during the whole experimental period, ranged
from 90 to 95%. The pH measured at the end of the experiments was in the
range 7.2 - 7.4 for the experiments with digested sewage sludge and in the
range 7.5 - 7.6 in the experiments with digested piggery waste.

- 30
gasproduction (ml) VFA concentration (mg I" )
•1500
1500
1000
500-
o-
VN 4990 mg NH^-N I"1
—\ 1 1 1 1— r 0 20 40 60
•1500
•1000
•500
l r 80
t ime (days)
Fig. 3.2. Cumulative gas production and the course of the VFA elimination by digested sewage sludge at increasing ammonia nitrogen concentrations. VS concentration 6-8 g l 1 . gas production; - - - - - acetic acid concentration;
. propionic acid concentration; n-butyric acid concentration.

- 31 -
gaspnoduction (ml ) 1500
1000-
500-
0
1500-,
1000
500
1 5 0 0 i
1000
500
0 -
1500-
1000-
500-
1500-1
1000-
500
VFA concentration (mg I" ) 1-1500
605 mg N H 4 - N i '
r^ i i i i l l r
1230 mg N H 4 - N I "
n i i r-
1790 mg N H ^ - N I " 1
n 1 1 1 1 r
2410 mg N H 4 NI -1
T^ r i i i i i i r
3075 mg N H 4 - N I -1
ï — " — r 1 1 1 1 1 1 r 20 4 0 60 80
-1000
-500
1-1500
1000
5 0 0
1500
•1000
5 0 0
-1500
-1000
500
•1500
•1000
5 0 0
time (days)
Fig. 3.3. Cumulative gas production and the course of the VFA elimination by digested piggerywaste at increasing ammonia nitrogen concentrations. VS concentration 9 - 8 8 * • — gas production; - - - - - acetic acid concentration; "•"•"•"•"•-•- propionic acid concentration; n-butyric acid concentration.

32 -
3. 2. 3 Discussion
Digested sewage sludge apparently is a fairly suitable material for seed
ing a piggery waste digester because methane formation starts immediately
upon feeding with piggery waste. The methane production reached its maximum
level already in the first week after the start of the feeding (Table 3.5).
These observations demonstrate that the anaerobic organisms present in di
gested sewage sludge are capable to metabolize the digestible constituents
of piggery waste without any adaptation.
On the other hand all start-up experiments are characterized by the oc
currence of a period of process imbalance as indicated by the increase in
the VFA concentration. An increase in the VFA concentration in anaerobic
processes reveals that the methane formation rate is insufficient to meta
bolize the VFA offered. As the sum of the COD removed via the methane gas
and the VFA-COD present in the mixed liquor remained almost unchanged dur
ing the whole experimental period, it is evident that the accumulation of
VFA in these experiments should be attributed to an inhibition of the me
thane-forming organisms. Since the seed material was well adapted to pig
gery waste, the inhibition of the methane formation can be attributed to
changes in the environmental conditions, resulting from the gradual dis
placement of the original mixed liquor by piggery waste. A significant
change in the environmental conditions concerns the increase in the ammonia
nitrogen concentration of the digester contents. In all start-up experiments
the VFA concentration only started to increase when the ammonia nitrogen
concentration of the digester contents reached a level of approx. 1700 mg
1 1 . This coincidence is the more striking because the presumed critical
ammonia nitrogen concentration of approx. 1700 mg 1_ 1 is reached after 3
weeks in the laboratory experiments, but only after 15 weeks in the pilot
plant experiment. The experimental results, therefore, evidently point to
an ammonia nitrogen inhibition at concentrations exceeding 1700 mg 1 1 .
A further proof for the role of ammonia nitrogen in the methanogenesis
of digested sewage sludge at concentrations above the threshold value of
1700 mg 1 1 is found in the results of the batch experiments with digested
sewage sludge (Fig. 3.2). Here the VFA were metabolized almost immediately
at ammonia nitrogen concentrations of 730 and 1210 mg 1 *, but at a concen
tration of 2360 mg 1 1 the microbial population required a lag phase of 25
days. This sharp increase in the lag phase at ammonia nitrogen concentra
tions between 1210 and 2360 mg 1_ 1 once again points to the above mentioned
threshold ammonia nitrogen concentration somewhere in this range, beyond
which a prolonged lag phase is required for the adaptation of the sludge.
The existence of such a critical threshold level is in accordance with the
results of Melbinger and Donnellon (1971). Ammonia nitrogen here appeared
to be toxic or inhibitory at concentrations above 1700 - 1800 mg 1 1 only
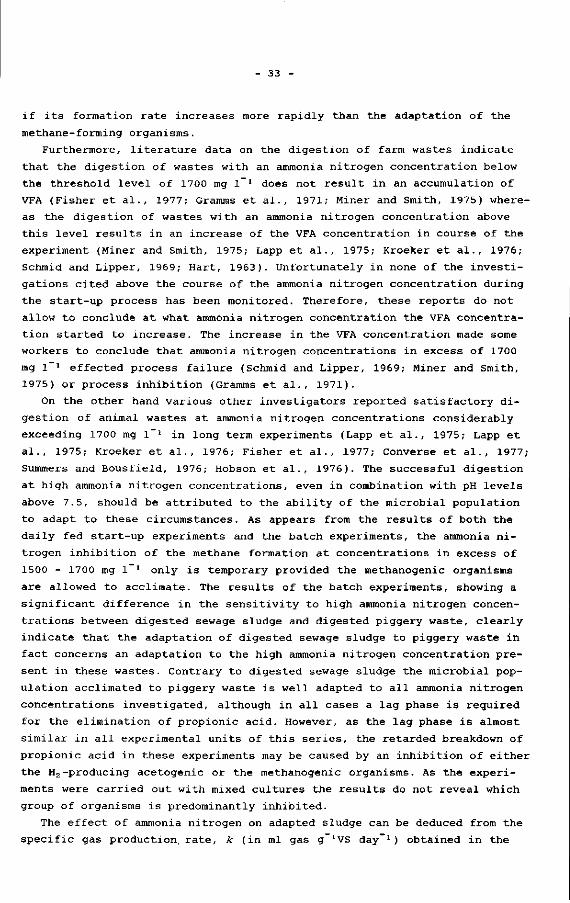
33 -
if its formation rate increases more rapidly than the adaptation of the
methane-forming organisms.
Furthermore, literature data on the digestion of farm wastes indicate
that the digestion of wastes with an ammonia nitrogen concentration below
the threshold level of 1700 mg l"1 does not result in an accumulation of
VFA (Fisher et al., 1977; Gramms et al., 1971; Miner and Smith, 1975) where
as the digestion of wastes with an ammonia nitrogen concentration above
this level results in an increase of the VFA concentration in course of the
experiment (Miner and Smith, 1975; Lapp et al., 1975; Kroeker et al., 1976;
Schmid and Lipper, 1969; Hart, 1963). Unfortunately in none of the investi
gations cited above the course of the ammonia nitrogen concentration during
the start-up process has been monitored. Therefore, these reports do not
allow to conclude at what ammonia nitrogen concentration the VFA concentra
tion started to increase. The increase in the VFA concentration made some
workers to conclude that ammonia nitrogen concentrations in excess of 1700
mg 1 1 effected process failure (Schmid and Lipper, 1969; Miner and Smith,
1975) or process inhibition (Gramms et al., 1971).
On the other hand various other investigators reported satisfactory di
gestion of animal wastes at ammonia nitrogen concentrations considerably
exceeding 1700 mg l"1 in long term experiments (Lapp et al., 1975; Lapp et
al., 1975; Kroeker et al., 1976; Fisher et al., 1977; Converse et al., 1977;
Summers and Bousfield, 1976; Hobson et al., 1976). The successful digestion
at high ammonia nitrogen concentrations, even in combination with pH levels
above 7.5, should be attributed to the ability of the microbial population
to adapt to these circumstances. As appears from the results of both the
daily fed start-up experiments and the batch experiments, the ammonia ni
trogen inhibition of the methane formation at concentrations in excess of
1500 - 1700 mg 1 J only is temporary provided the methanogenic organisms
are allowed to acclimate. The results of the batch experiments, showing a
significant difference in the sensitivity to high ammonia nitrogen concen
trations between digested sewage sludge and digested piggery waste, clearly
indicate that the adaptation of digested sewage sludge to piggery waste in
fact concerns an adaptation to the high ammonia nitrogen concentration pre
sent in these wastes. Contrary to digested sewage sludge the microbial pop
ulation acclimated to piggery waste is well adapted to all ammonia nitrogen
concentrations investigated, although in all cases a lag phase is required
for the elimination of propionic acid. However, as the lag phase is almost
similar in all experimental units of this series, the retarded breakdown of
propionic acid in these experiments may be caused by an inhibition of either
the H2-producing acetogenic or the methanogenic organisms. As the experi
ments were carried out with mixed cultures the results do not reveal which
group of organisms is predominantly inhibited.
The effect of ammonia nitrogen on adapted sludge can be deduced from the
specific gas production, rate, k (in ml gas g 1VS day"1) obtained in the

- 34 -
batch experiments. The ^-values at different ammonia nitrogen concentra
tions are shown in Fig. 3.4. The ̂ -values suggest the existence of a linear
relationship between k and the ammonia nitrogen concentration. Assuming
such a linear relationship a regression line has been computed and depicted
in Fig. 3.4. The correlation coefficient, r2 , of this regression line is
0.73.
k (ml gas, g V.S.~1,day~1)
40-
30-
20-
10-
I— regression line digested piggery manure 30.10 - 0.0023 [IMH4- N]
1000 2000 3000 4000
NH4-N concentration (mg I"1)
Fig. 3.4. Maximum specific gas production rate (k) of digested piggery waste at increasing ammonia nitrogen concentrations.
The successful digestion at high ammonia nitrogen concentrations seems
to conflict with the experimental results of Mccarty and McKinney (1961)
and Hobson and Shaw (1976), who found that ammonia nitrogen is inhibitory
at about 1500 mg l"1 and toxic at about 3000 mg l"1. However, a more close
comparison of our results with those of McCarty et al. and Hobson et al.
suggest that the inhibitory ammonia nitrogen concentration, as found by
McCarty et al. and Hobson et al., correlates with the critical concentra
tion of 1700 mg l"1 observed in our experiments. The threshold levels re
ported by McCarty et al. and Hobson et al. were deduced from experiments
lasting only 30 days and 10 days, respectively. In the light of the exten
ded lag phase observed in the present investigations, we are the opinion
that the experiments of McCarty et al. and Hobson et al. were run over a
too short period of time to allow an adaptation of the microbial popula
tion.

The results obtained in the present study show that anaerobic sludge,
once it is adapted to the ammonia nitrogen threshold level of about 1700
mg 1 x, is also adapted to much higher concentrations. The increase of the
ammonia nitrogen concentration in the start-up experiments after day 147
did not cause any accumulation of VFA in the digester contents. Accordingly
no lag phase occurred in the batch experiments with digested piggery waste
when sludge adapted to 2420 mg 1 l ammonia nitrogen was inoculated at a con
centration of 3075 mg 1 *.
The results of the laboratory start-up experiments reveal that an in
crease in the initial loading rate is accompanied with both an increase in
the VFA concentration and an extension of the period of imbalanced diges
tion (Table 3.4). Since in these experients 6% TS manure has been used an
increase of the organic loading rate is accomplished by the application of
a shorter detention time, resulting in an accelerated increase in the ammo
nia nitrogen concentration. Therefore the results do not allow to conclude
whether the increased loading rate or the accelerated rise in the ammonia
nitrogen concentration predominates with respect to the height of the VFA
concentration and the duration of the period of process imbalance.
Although the initial loading rate markedly affects the degree of process
imbalance it apparently has not any clear effect on the final digestion
characteristics, because the performance of the 4 laboratory digesters at
the end of the experiments is very similar. Moreover, as the results were
very similar to those of other experiments at similar process circumstances
it seems reasonable to conclude that the start-up procedure is especially
important to provide optimum conditions for the adaptation of the organisms
to the increasing ammonia nitrogen concentrations, but that the initial
loading rate does not influence the operation of the digester once the mi
crobial population has been adapted.
With respect to the procedure to be followed in the first start-up of
full scale digesters emphasis should be given to the initial sludge load _ _ l
(in kg COD kg 'VS day ) as directive and not to the space load (in kg COD m 3 day * or kg TS m~3 day"1)/ because the quantity of seed sludge avail
able for start-up frequently is insufficient to fill up the digester com
pletely. The results of the start-up experiments (Table 3.4) indicate that
a digester can be started up succesfully at sludge loads up to 0.126 kg
COD kg 1VS day"1. The digester should be fed at this loading rate for a pe
riod of 2.5 months in order to allow the sludge to adapt. During the start
up of a piggery waste digester a fall of the pH below pH 7 is very unlikely
because as a rule sufficient ammonia nitrogen and other buffering agents
are present in this waste to neutralize the VFA, even in case of severe ac
cumulation of these intermediates. After 2.5 months the loading rate can be
increased stepwise, e.g. according to the procedures outlined in Fig. 3.1,
to the desired level.

36 -
3.3 THE INFLUENCE OF AMMONIA NITROGEN ON CONTINUOUS DIGESTION OF PIGGERY
WASTE BY ADAPTED SLUDGE
3.3.1 Procedures
The influence of ammonia nitrogen at concentrations in the range 2070 -
5290 mg 1 1 on the continuous digestion of piggery waste was investigated
in three 45-litre laboratory digesters (Section 2.3.2). At the start of
these experiments the digestion units were filled completely with digested
piggery waste and fed with 6% TS manure at a 15-days detention time (organ
ic load 4 kg TS m~3 day"1)- The seed material originated from the 6-m3 pi
lot plant digester when it was operated at a temperature of 30°C and at a
15-days detention (loading rate 4 kg TS m 3 day 1). The digester population
already was adapted to 1900 mg l"1 ammonia nitrogen.
The piggery waste used in the experiment was obtained from an experimen
tal farm where the manure solids and the manure liquid were discharged sep
arately. For the experiments both fractions were combined in appropiate
proportions and stored at a temperature of 4°C. In the three parallel ex
periments the same manure was used. Some chemical characteristics of the
manure, including the concentration of the aromatic malodorous compounds,
are represented in Tabel 3.7. To raise the ammonia nitrogen concentration
urea was added to the manure feed used in experiments 2 and 3 at an amount
of 4 g and 8 g per litre manure, respectively.
Table 3.7 Chemical characteristics of the manure used in the experiments on the influence of ammonia nitrogen on the digestion of piggery waste.
TS (g 1 ') 61.8
VS (g f') 51.9
Ammonia nitrogen (mg N I ) 1 325
Total nitrogen (mg N 1~ ) 3230
C0D total (mg 1~ ' ) 64130
COD supernatant (mg 1~ ) 7750
VFA (meq 1~') 70.4
Phenol (mg I-1) 18.4
p-Cresol (mg 1~') 32.9
4-Ethylphenol (mg 1 ) 5.1
Indole (ig f 1 ) 4.9
Skatole (mg 1~') 1.5

- 37 -
3.3.2 Results
The ga s p r o d u c t i o n , t h e g a s c o m p o s i t i o n and some c h e m i c a l c h a r a c t e r i s
t i c s o f t h e d i g e s t e r e f f l u e n t a t t h e end o f t h e e x p e r i m e n t s a r e summarized
i n Tab le 3 . 8 , t o g e t h e r w i t h t h e p r o c e s s c o n d i t i o n s a p p l i e d . In Tab l e 3 . 8
t h e v a l u e s o f TS, VS and COD t o t a l a re n o t r e p r e s e n t e d s i n c e t h e y a re i n
e x p r e s s i v e a s a r e s u l t o f t h e i n c o m p l e t e m i x i n g o f t h e d i g e s t e r c o n t e n t s i n
t h e 4 5 - l i t r e d i g e s t e r s ( S e c t i o n 2 . 3 . 2 ) .
Table 3.8 Summary r e su l t s a t steady s t a t e operation of laboratory experiments concerning the influence of ammonia n i t rogen on the d iges t ion of piggery waste. Temperature 30 ± 2°C; detent ion time 15 days; organic load 4.1 kg TS m"3 day"1 ; durat ion of the experiments 100 days.
Urea added to the manure ( g l )
Gas
Gas production (1 gas lr day ) 3 -1
(m gas kg TS added)
Gas composition (% CH4)
Methane production (m3 kg-' TS added)
COD removed via gas (g COD 1 manure)
Digester effluent
pH
Ammonia n i t rogen (mg N 1 )
Total n i t rogen (mg N 1 )
COD supernatant (mg 1 )
COD of the VFA (mg 1_1)
VFA (meq 1~')
Acetic acid (meq 1 )
Propionic acid (meq 1 )
COD t o t a l reduction (%)
C0Ds r eduction (%)
Reduction of the VFA-COD (%)
1.708
0.415
64.3
0.267
40.52
1.416
0.344
69.1
0.237
36. 10
1.126
0.273
73.6
0.201
30.59
7.46
2070
3520
3870
98
1 .5
1 .4
0. 1
63.2
50
98.2
7.69
3760
5460
4680
213
3.5
3.4
0.1
56.3
38.7
96.1
7.8
5290
6890
6130
1673
25.1
23.6
1.2
47.7
20.9
69.3
The r e s u l t s o f Tab l e 3 . 8 i n d i c a t e t h a t t h e g a s p r o d u c t i o n a t 2070 mg 1 _ 1
ammonia n i t r o g e n i s c o n s i d e r a b l y h i g h e r , v i z . 33%, t han t h a t a t 5290 mg l " 1 .
However, a s t h e d i g e s t e r g a s c o n t a i n s more methane a t i n c r e a s i n g ammonia
n i t r o g e n c o n c e n t r a t i o n s , t h e d e c r e a s e o f t h e methane p r o d u c t i o n i s o n l y

- 3£
24.5% over this concentration range. The increase of the methane content of
the gas at raising ammonia nitrogen concentrations can be explained from
the higher digester-pH, effectuated by the higher bicarbonate alkalinity
More of the carbon dioxide produced in the digestion process dissolves in
the digestion mixed liquor in that case and consequently the biogas is
richer in methane. The experimental results further show an evident in
crease in the concentration of dissolved process intermediates upon raising
ammonia nitrogen concentrations, i.e. the supernatant COD increases from
3870 mg l"1 at 2070 mg _1 ammonia nitrogen to 6900 mg l"1 at 5290 mg l"1
ammonia nitrogen and the concentration of the VFA from 1.5 meq 1 ' to 25.1
meq l"1 . The increase in the VFA concentration mainly concerns acetic acid
which points to a slight inhibition of the methane-forming organisms under
these circumstances.
The less complete conversion of piggery waste ingredients at high ammo
nia nitrogen concentrations also appears from the relative concentrations
of the malodorous compounds at the various ammonia nitrogen concentrations
(Fig. 3.5). There is a sharp increase in the concentration of the malodor
ous compounds, especially that of the aromatic compounds, at increased am
monia nitrogen concentrations.
relative concentration (%)
100- phenol
p-cresol
4- ethylphenol
indole
skat ole
acetic acid
propionic acid
iso-butyric add
butyric acid
iso-valeric acid
valeric acid
5290 ammonia-nitrogen cone, (mg f )
Fig. 3.5 Relative concentration of malodorous compounds at various ammonia nitrogen concentrations. The concentration has been expressed in relation to the concentration in raw manure (Table 3.7). Temperature 30°C; detention time 15 days; organic load 4.1 kg TS m 3 day 1.

- 39 -
3. 3. 3 Discussion
The experimental results indicate that methanogenesis proceeds satisfac
torily even at an ammonia nitrogen concentration of 5290 mg 1 1 and a pH of
7.88, despite the fact that under these circumstances the concentration of
undissociated ammonia nitrogen is 310 mg l"1, which is appreciably higher
than the toxic level of 140 mg l"1 mentioned by McCarty and McKinney (1961).
On the other hand a rise in the ammonia nitrogen concentration clearly af
fects the digestion process; the methane production is lower and the con
centration of the process intermediates becomes higher. A closer examina
tion of the results learns that the increased concentration of process in
termediates is insufficient to account for the decreased methane produc
tion. Obviously the addition of urea not only affects the metabolism rate
of the methane-forming organisms but also that of the hydrolytic bacteria.
The addition of urea results in an increased ammonia nitrogen concentration
and consequently in a higher pH of the medium. As the culture-pH affects
both the enzyme concentration and the enzyme activity (Hobson et al., 1974;
Dean, 1972; Bull, 1972) no conclusions can be drawn on the question which
factor predominates in the inhibition of the separate steps of the diges
tion process, either it can be the increased ammonia nitrogen concentration
or the higher culture-pH or a combination of both.
methane production ( I CHa l~1 day"1)
1.2-
0.8
0.4-
2000 3000 4000 5000 ammonia - nitrogen cone. ( mg I )
Fig. 3.6 Methane production rate at various ammonia nitrogen concentrations. Temperature 30 ± 2°C; detention time 15 days; organic load 4.1 kg TS m 3 day l.

- 40
The effect of ammonia nitrogen on the methane production rate is shown
in Fig. 3.6. Conform the results of the batch experiments with digested
piggery wast and VFA as feed (Fig. 3.4) the experimental results of Fig.
3.6 show a linear relationship between the ammonia nitrogen concentration
and the methane production rate, although it should be taken in mind that
the pH was different in the various experiments.
Referring to the practical application of the digestion process these
results implicate that the loading rate should be decreased as the ammonia
nitrogen concentration increases in order to achieve the same degree of
stabilization and methane formation. This especially holds for ammonia ni
trogen concentrations exceeding 5000 mg l"1 (concentration undissociated
ammonia nitrogen 300 mg 1 ' ). As the obtainable degree of manure stabili
zation may also be influenced by ammonia nitrogen it is doubtful whether or
not a satisfactory reduction of the manure malodours can be obtained at
these high ammonia nitrogen concentrations.
From long-term experiments with piggery waste in the 6-m3 digester it
turned out that at an ammonia nitrogen concentration slightly above 5000
mg 1 J and a loading rate of 3.5 kg TS m~3 day ' (detention time 20 days)
the methane production decreases slowly in the course of several months.
Similar observations were made in a 300-m3 full scale piggery waste diges
ter. The gradual decrease of the methane production under these circumstan
ces may be explained from the wash-out of methane-forming bacteria since
their activity and hence their growth rate decreases at these high ammonia
nitrogen concentrations.

- 41 -
4 INFLUENCE OF DETENTION TIME AND MANURE CONCENTRATION
4.1 INTRODUCTION
A basic knowledge of the effects of the loading rate on the digestion
process is essential for assessing the optimum digester design and opera
tion. However, the loading rate of a digester, expressed in kg TS m 3 day 1 ,
can not be considered as a single process parameter but is fixed by the de
tention time and the manure feed concentration. Both these feeding parame
ters may influence the digestion process independently.
The manure feed concentration affects a number of important environmen
tal factors of the digestion process, such as the pH, the ammonia nitrogen
concentration, the hydrogen sulphide concentration and the VFA concentra
tion. Together the complex of these factors influences the metabolic acti
vity of the microbial population, including the production, secretion and
activity of exocellular enzymes (Dean, 1972; Bull, 1972; Demain, 1972).
The other loading parameter, i.e. the manure detention time, influences
the digester population as well. Since the digestion of concentrated sub
strates like piggery wastes is performed in mixed reactors, the sludge de
tention time in these systems is equal to the manure detention time applied.
Hence the detention time together with the growth rate of each individual
type of organism under the prevalent environmental conditions determines
which organisms can sustain in the digester and which not.
In order to determine the influence of the loading rate on the digestion
process the effects of both loading parameters should be investigated in
dependently. This Chapter deals with the results of laboratory and small
pilot plant experiments on the influence of the manure detention time on
the digestion of piggery waste at varying TS concentrations.
4.2 PROCEDURES
The laboratory experiments with piggery waste at TS concentrations of
4%, 6% and 9% were performed in digesters with a volume of 1.5, 2, 5, and 6
litres (Section 2.3.2). In addition the digestion of 6% TS piggery waste
was studied in two 240-litre pilot plant digesters (Section 2.3.3).
The manure concentrations and the detention times investigated are sum
marized in Table 4.1. The laboratory experiments were carried out in two
series, which have been indicated also in Table 4.1. The first series labo
ratory and pilot plant experiments were seeded with digested sewage sludge,
which was well adapted to piggery waste as it was fed with 6% TS piggery
waste at a 40-days detention time for more than 6 months. In the second se
ries laboratory experiments seed sludge from the pilot plant experiment D2
was used after a stable digestion had been established at a 20-days deten
tion time.

- 42
Table 4.1 Manure concentrations and detention times applied in the experiments
Detention time
(days)
Manure concentration (g TS 1 )
40 60
laboratory pilot plant
90
40
20
16
15
12.5
12
10
3l>ß2
First series of experiments
Second series of experiments
Table 4.2 Chemical characteristics of the piggery waste used in the experiments.
TS waste 4% TS waste 9% TS waste
minimum maximum average
TS (gl ')
vs (g r 1 ) Ammonia nitrogen (mg N I )
COD total (mg 1~ )
COD supernatant (mg 1 )
VFA (meq l"1)
Aromatic compounds
Phenol (mg 1 )
p-Cresol (mg 1 )
4-Ethylphenol (mg 1 )
Indole (mg 1 )
Skatole (mg 1 )
58
40.
1780
64500
17500
107
7
6
63
46.
2635
104000
23300
170
5
7
61
43
2090
80300
19400
134
4
6
40.9
29. 1
1390
53500
12900
89
92.1
65.4
3140
120500
29000
201
12.6
118.2
5.7
0.6
33.4
55.4
195.6
14.4
3.7
48.7
25.2
149.0
11.2
2.2
39.6
16.8
99.3
7.5
1.5
26.4
37.8
223.5
16.8
3.3
59.4

- 43 -
The piggery waste used in the experiments consisted of urine and faeces
and contained no or only minor amounts of bedding or litter. The manure,
obtained from an experimental farm was supplied at a rather constant TS
concentration of approx. 110 g 1~' and was diluted to the desired level
with tap water.
Table 4.2 summarizes some important chemical characteristics of raw ma
nure, including the concentration of the aromatic odorous compounds.
During the experimental period the analysis of both the manure and the
digester effluent were carried out according to the scheme shown in Table
4.3.
Table 4.3 Scheme of the analytical measurements.
Daily 3 times Weekly Fortnightly Incidentally
a week
Gas production X
Gas composition X
pH X
COD total X
COD supernatant X
VFA X
Ammonia nitrogen X
Total solids X
Volatile solids X
Aromatic compounds X
4.3 RESULTS
The results of the laboratory experiments with 4%, 6% and 9% TS piggery
waste together with the experimental conditions applied are summarized in
Tables 4.4, 4.5 and 4.6, respectively. The data in these Tables concern the
average values of the analytical results during the last 4 weeks of the ex
periments, when the digestion processes had reached a steady state. The val
ues for the COD reduction mentioned in Tables 4.4 to 4.7 have been calcu
lated from the amount of COD removed via the methane gas and the initial
manure-COD.

44
Table 4.4 Results obtained at steady state operation of laboratory digesters fed with 40 g TS 1 * piggery waste.
Exp. A Exp. A
Working digester volume (litres)
Duration experiment (days)
Detention time (days) -3 -1
Organic load (kg TS m day )
(kg COD m~ day"1)
Gas
Gas production (1 gas 1 day ) 3 r -1
(m gas kg TS added) Gas composition (% CH^)
o -1 Methane production (m kg TS added)
COD removed via gas (g COD 1 manure)
Digester effluent
pH
Ammonia nitrogen (mg N 1 )
TS (g I"')
vs (g r 1 ) COD s u p e r n a t a n t (mg 1 )
VFA (meq l " 1 )
A c e t i c a c i d (meq 1 )
P r o p i o n i c a c i d (meq 1 )
COD t o t a l r e d u c t i o n (%)
TS r e d u c t i o n (%)
VS r e d u c t i o n (%)
COD r e d u c t i o n (%) s
VFA r e d u c t i o n (%)
1.5
92
15
2 . 8
3 .5
0 . 650
0 .232
8 4 . 9
0 . 197
20 .37
7 .6
1700
3 0 . 3
19 .8
6200
12.9
4 . 5
4 . 1
44.4
28.4
31.9
63.1
1.5
60
10
4.2
5.3
0.713
0. 170
82.8
0.141
14.47
7.45
1830
32.5
21.7
10000
38.6
4. 1
33.1
31.5
23.2
25.3
40.0
61.6
The m e t h a n e c o n t e n t o f t h e d i g e s t e r g a s , p r o d u c e d i n t h e e x p e r i m e n t s A j ,
A2 , B3 and B4 , i s ' h i g h i n c o m p a r i s o n w i t h t h e g a s p r o d u c e d i n t h e o t h e r e x
p e r i m e n t s . T h i s d i f f e r e n c e h a s t o b e a t t r i b u t e d t o t h e u s e o f a b r i n e d i s
p l a c e m e n t s y s t e m t o c o l l e c t t h e d i g e s t e r g a s i n t h e f o rme r e x p e r i m e n t s .
P a r t o f t h e c a r b o n d i o x i d e d i s s o l v e s i n t h e b r i n e s o l u t i o n !
I n a l l l a b o r a t o r y d i g e s t e r s m i x i n g was n e c e s s a r y t o p r e v e n t t h e f o rma
t i o n o f a f l o a t i n g l a y e r . N e v e r t h e l e s s , i n some d i g e s t e r s a t o u g h f l o a t i n g
l a y e r was f o rmed , wh i ch c o u l d o n l y b e d i s r u p t e d by c o n t i n u o u s s t i r r i n g f o r
10 m i n u t e s . Scum f o r m a t i o n d i d n o t o c c u r e x c e p t u n d e r c o n d i t i o n s o f d i g e s
t i o n i m b a l a n c e . I n none o f t h e l a b o r a t o r y e x p e r i m e n t a l u n i t s r e t a r d e d d i
g e s t i o n was o b s e r v e d e x c e p t i n e x p e r i m e n t C 3 , whe re 9% TS p i g g e r y w a s t e was
a dded a t a 1 0 - d a y s d e t e n t i o n t i m e .
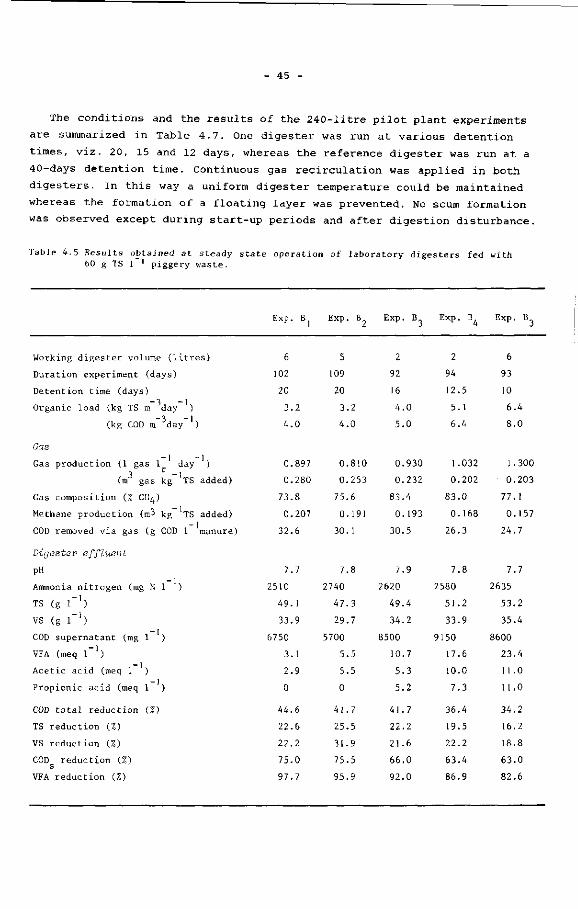
- 45
The conditions and the results of the 240-litre pilot plant experiments
are summarized in Table 4.7. One digester was run at various detention
times, viz. 20, 15 and 12 days, whereas the reference digester was run at a
40-days detention time. Continuous gas recirculation was applied in both
digesters. In this way a uniform digester temperature could be maintained
whereas the formation of a floating layer was prevented. No scum formation
was observed except during start-up periods and after digestion disturbance.
Table 4.5 Results obtained at steady state operation of laboratory digesters fed with 60 g TS 1 1 piggery waste.
Exp. B Exp. B Exp. B Exp. B Exp. B
Working digester volume (litres)
Duration experiment (days)
Detention time (days) -3 -1
Organic load (kg TS m day ) (kg COD m~3day~')
6
102
20
3.2
4.0
5
109
20
3.
4.
.2
0
2
92
16
4.
5.
0
0
2
94
12.5
5.1
6.4
6
93
10
6.4
8.0
Gas
Gas production (1 gas 1 day )
(m3 gas kg_1TS added)
Gas composition (% C H A ) i ~ 1 Methane production (mJ kg TS added)
COD removed via gas (g COD 1 manure)
0.897 0 . 810
0 .280 0 . 253
7 3 . 8 7 5 . 6
0 .207 0 .191
32 .6 30 .1
0 . 930 1.032 1.300
0 . 232 0 .202 0 . 203
8 3 . 4 8 3 . 0 77 .1
0 . 193 0 .168 0 .157
30 . 5 2 6 . 3 24 .7
Digester effluent
pH
Ammonia nitrogen (mg N I )
Ts (g r ' ) vs (g r ' ) COD supernatant (mg 1 )
VFA (meq 1~')
Acetic acid (meq 1 )
Propionic acid (meq 1 )
COD total reduction (%)
TS reduction (%)
VS reduction (%)
COD reduction (%) s
VFA reduction (%)
7.7
2510
49.1
33.9
6750
3.1
2.9
0
44.6
22.6
22.2
75.0
97.7
7.8
2740
47.3
29.7
5700
5.5
5.5
0
41.7
25.5
31.9
75.5
95.9
7.9
2620
49.4
34.2
8500
10.7
5.3
5.2
41.7
22.2
21.6
66.0
92.0
7.8
2580
51.2
33.9
9150
17.6
10.0
7.3
36.4
19.5
22.2
63.4
86.9
7.7
2635
53.2
35.4
8600
23.4
11.0
11.0
34.2
16.2
18.8
63.0
82.6

46
Table 4.6 Results obtained at steady state operation of laboratory digesters fed with 90 g TS 1 1 piggery waste.
Exp. C Exp. C Exp. C
Working digester volume (litres)
Duration experiment (days)
Detention time (days) -3 -I
Organic load (kg TS m day )
(kg COD m~3 day"1)
Gas
Gas production (1 gas 1 day ) 3 r -1
(m gas kg TS added)
Gas composition (% CH4) 3 -1
Methane production (m kg TS added)
COD removed via gas (g COD 1 manure)
Digester effluent pH
Ammonia nitrogen (mg N 1 ) K
TS (g 1 ')
VS (g I"1)
COD supernatant (mg 1 )
VFA (meq 1~')
Acetic acid (meq 1 )
Propionic acid (meq 1 )
COD total reduction (%)
TS reduction (%)
VS reduction (%)
COD reduction (%) s
VFA reduction (%)
5
109
20
4.8
6.0
5
109
15
6.4
8.0
5
109
10
9.5
12.0
1. 120
0.233
74.7
0.174
41.2
1 .448
0.226
74.4
0.169
39.8
0.534
0.056
67.6
0.038
8.9
7.9
3950
77.2
49.6
12000
18.9
18.1
0.8
31 .7
19.0
24.2
66.4
90.6
7.9
3910
79.2
51.5
13000
20. 1
18.0
1 .7
30.5
16.9
21 .3
63.6
90.0
7.55
3980
85.9
57.3
30600
201.3
11 1.0
63.5
6.8
9.8
12.4
14.3
0.2
Due to a failure in the temperature control system the digestion tempera
ture in experiment D2 temporarily (24 hrs ) increased to approx. 50°C
shortly after reducing the detention time from 40 to 20 days. This resulted
in a severe imbalance of the digestion process as was indicated by a sudden
decrease of the gas production, a low methane content of the digester gas
and a strong increase in the VFA concentration. To accomplish process re
covery no feed was supplied for 3 days, followed by a period in which the
supply of the feed was increased stepwise: for a period of 2 days 6 litres

47
of manure per day, then for a period of 3 days 9 litres per day and subse
quently with a daily quantity of 12 litres according to the orginal deten
tion time of 20 days. The course of the process recovery is shown in Fig.
4.1. Although gas production and gas composition soon restored, the VFA
concentration reached high values, especially that of propionic acid. How
ever, after 5 weeks the propionic acid concentration decreased rapidly,
which indicated that the recovery of the digestion process had been com
pleted.
Table 4.7 Results obtained at steady state operation of 240-litre pilot plant experiments with 60 g TS 1 ' piggery waste.
Digester II Digester I
Exp. D Exp. D Exp. D Exp. D4
Working digester volume (litres)
Duration experiment (days)
Detention time (days) -3 -1
Organic load (kg TS m day )
(kg COD m day"')
240
200
40
1.6
2.0
240
100
20
3
4
2
0
240
92
15
4
5
2
3
240
40
12
5.3
6.7
Gas
Gas production (1 gas 1 day ) 3 r -1
(m gas kg TS added)
Gas composition (% CH^) T -1
Methane production (mJ kg TS added)
COD removed via gas (g COD 1 manure)
Digester effluent
PH
Ammonia nitrogen (mg N 1 )
Ts (g r 1 ) vs (g r 1 ) COD supernatant (mg 1 )
VFA (meq 1 ')
Acetic acid (meq 1 )
Propionic acid (meq 1 )
COD total reduction (%)
TS reduction (%)
VS reduction (%)
COD reduction (%) s
VFA reduction (%)
0.420
0.262
73.9
0.194
30.5
0.850
0.265
75.2
0. 199
31.5
1.030
0.245
76.4
0.187
29.0
1.180
0.223
76.3
0.170
26.6
n.d.
2970
45.3
28.5
6600
4.2
4.2
0
49.0
28.7
34.6
61.2
96.9
n.d.
2820
41.3
27.2
6350
4.2
4.0
0.2
44.3
35.0
37.6
74.1
96.9
n.d.
2680
48.5
31. 1
6550
3.5
3.5
0
43.9
23.6
28.7
62.9
97.4
n.d.
2320
48.6
31.5
6100
4.7
3.9
0.8
40.3
23.5
27.8
65.5
96.5
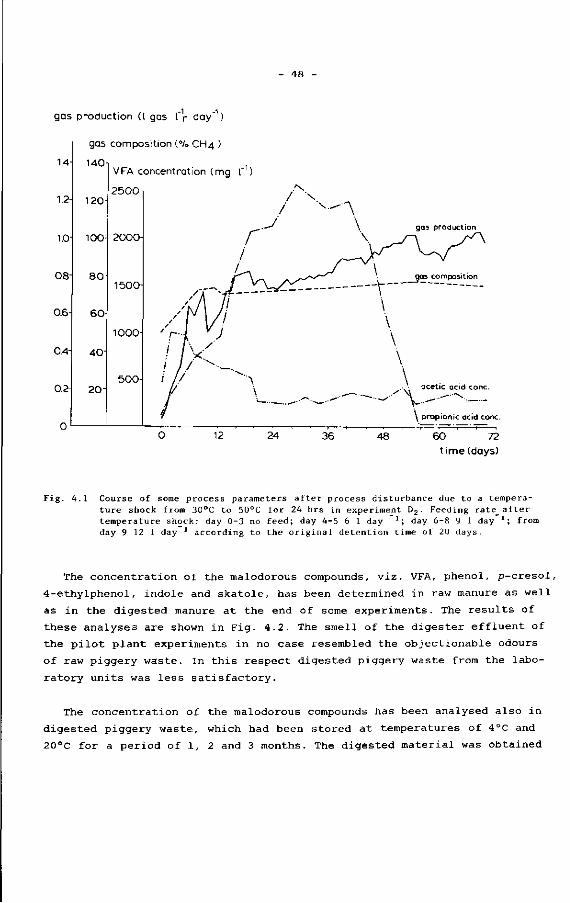
- 48
gas p roduc t i on (I gas f1r day"1)
1.4-
1.2-
1.0-
0.8-
0.6-
0.4-
0.2-
n
gas
140
120
100-
8 0
6 0
40 -
2 0 -
cormposition (% CH4 )
VFA concentrat ion (mg l~1)
2 5 0 0 -
2 0 0 0 -
1500-
1000-
500 -
/ \ .
r i
-iK Ji / r \/i
'Vi vJ ! / V '
ij
"A \ gas production
gas composition
\ \ \ \
.- • acetic acid cone.
\ propionic acid cone
12 24 36 48 6 0 72
t i m e (days)
Fig. 4.1 Course of some process parameters after process disturbance due to a temperature shock from 30°C to 50°C for 24 hrs in experiment D2 • Feeding rate_ after temperature shock: day 0-3 no feed; day 4-5 6 1 day *; day 6-8 9 1 day 1; from day 9 12 1 day * according to the original detention time of 20 days.
The concentration of the malodorous compounds, viz. VFA, phenol, p-cresol,
4-ethylphenol, indole and skatole, has been determined in raw manure as well
as in the digested manure at the end of some experiments. The results of
these analyses are shown in Fig. 4.2. The smell of the digester effluent of
the pilot plant experiments in no case resembled the objectionable odours
of raw piggery waste. In this respect digested piggery waste from the labo
ratory units was less satisfactory.
The concentration of the malodorous compounds has been analysed also in
digested piggery waste, which had been stored at temperatures of 4°C and
20°C for a period of 1, 2 and 3 months. The digested material was obtained

49 -
relat ive concentration (%>)
226'/.
140 i
A. Feed manure cone. 6%>TS
100
6 0
20 L 10 days 12 days
re lat ive concen t ra t i on (%>)
20 days B 2
40days
465-/. 283'/. 289«/. B. Feed manure cone. 9 ° / o T S
140
100
I D
phenol p - cresol 4-ethylphenol indole skatole acetic acid propionic acid iso-butyric acid butyric acid iso-valeric acid valeric acid
detention time number experiment
Fig. 4.2 Concentration of malodorous compounds present in digested piggery waste. The concentration has been expressed in relation to the concentration in raw manure (Table 4.2).

- 50
from an e x p e r i m e n t a l d i g e s t i o n u n i t t r e a t i n g 6% TS p i g g e r y w a s t e a t a 1 5 -
days d e t e n t i o n t ime a t 3 0 °C . The a n a l y t i c a l r e s u l t s , shown i n Tab l e 4 . 8 ,
r e v e a l t h a t upon s t o r a g e t h e c o n c e n t r a t i o n o f t h e malodorous compounds d e
c r e a s e s f u r t h e r .
Table 4.8 Effect of the temperature on the concentrat ion of malodorous compounds ( in mg 1 1) during s torage of digested piggery waste. Digestion condi t ions : tempera tu re 30°C; detent ion time 15 days; manure concentrat ion 6% TS.
d igested manure s torage a t 4 C s torage a t 20 C
s torage time (months)
a ce t i c acid
propionic acid
i so -bu ty r ic acid
bu tyr ic acid
i s o -va l e r i c acid
v a l e r i c acid
phenol
p -c reso l
4-ethy1phenol
indole
ska tole
1300
105
7
<1
5
<1
0
1
5
0
12
3
9
2
7
6
180
14
<1
<1
6
<1
0
0
0
0
3
4
2
9
2
9
220
23
3
<1
8
<1
0
0
0
<0
2
5
2
9
1
2
140
19
2
<1
2
<1
0
0
0
<0
1
4
2
9
1
2
22
<1
<1
<1
<1
<1
<0.1
<0.1
1.7
<0.1
6.1
49
<1
<1
<1
<1
<1
<0
<0
0
<0
3
1
1
3
1
5
9
<1
<1
<1
<1
<1
<0.1
<0.1
<0.1
<0.1
0.9
4 . 4 DISCUSSION
4.4.1 Process efficiency
The above r e s u l t s i n d i c a t e t h a t p i g g e r y w a s t e can be d i g e s t e d s u c c e s s f u l
l y a t l o a d i n g r a t e s from 1 .6 - 6 . 4 kg TS m~3 d a y" 1 , i . e . 1 . 1 - 4 . 4 kg VS
day However, application of a space load of 9.5 kg TS m~3 day"
i.e. 6.5 kg VS m 3 day"1, as in experiment C3 results in process failure as
reflected in the strong decrease of the CH4-yield. These values of the ap
plicable loading rate are in accordance with those reported in literature.
Loehr (1969), in summarizing available information, reported that animal
wastes could be successfully digested at loading rates in the range of 1.6 -
6.4 kg VS m 3 day"1. More recently Hobson et al. (1979) and Fisher et al.
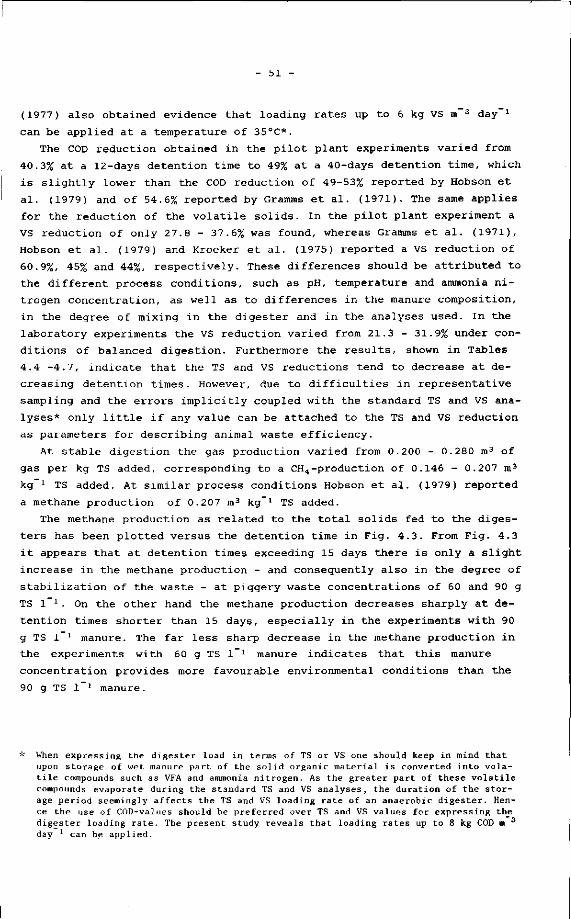
- 51 -
(1977) also obtained evidence that loading rates up to 6 kg VS m 3 day 1
can be applied at a temperature of 35°C*.
The COD reduction obtained in the pilot plant experiments varied from
40.3% at a 12-days detention time to 49% at a 40-days detention time, which
is slightly lower than the COD reduction of 49-53% reported by Hobson et
al. (1979) and of 54.6% reported by Gramms et al. (1971). The same applies
for the reduction of the volatile solids. In the pilot plant experiment a
VS reduction of only 27.8 - 37.6% was found, whereas Gramms et al. (1971),
Hobson et al. (1979) and Kroeker et al. (1975) reported a VS reduction of
60.9%, 45% and 44%, respectively. These differences should be attributed to
the different process conditions, such as pH, temperature and ammonia ni
trogen concentration, as well as to differences in the manure composition,
in the degree of mixing in the digester and in the analyses used. In the
laboratory experiments the VS reduction varied from 21.3 - 31.9% under con
ditions of balanced digestion. Furthermore the results, shown in Tables
4.4 -4.7, indicate that the TS and VS reductions tend to decrease at de
creasing detention times. However, due to difficulties in representative
sampling and the errors implicitly coupled with the standard TS and VS ana
lyses* only little if any value can be attached to the TS and VS reduction
as parameters for describing animal waste efficiency.
At stable digestion the gas production varied from 0.200 - 0.280 m3 of
gas per kg TS added, corresponding to a CH4-production of 0.146 - 0.207 m3
kg"1 TS added. At similar process conditions Hobson et al. (1979) reported
a methane production of 0.207 m3 kg ' TS added.
The methane production as related to the total solids fed to the diges
ters has been plotted versus the detention time in Fig. 4.3. From Fig. 4.3
it appears that at detention times exceeding 15 days there is only a slight
increase in the methane production - and consequently also in the degree of
stabilization of the waste - at piggery waste concentrations of 60 and 90 g
TS 1 '. On the other hand the methane production decreases sharply at de
tention times shorter than 15 days, especially in the experiments with 90
g IS 1 ' manure. The far less sharp decrease in the methane production in
the experiments with 60 g TS 1 • manure indicates that this manure
concentration provides more favourable environmental conditions than the
90 g TS l"1 manure.
When expressing the digester load in terms of TS or VS one should keep in mind that upon storage of wet manure part of the solid organic material is converted into volatile compounds such as VFA and ammonia nitrogen. As the greater part of these volatile compounds evaporate during the standard TS and VS analyses, the duration of the storage period seemingly affects the TS and VS loading rate of an anaerobic digester. Hence the use of COD-values should be preferred over TS and VS values for expressing the digester loading rate. The present study reveals that loading rates up to 8 kg COD m 3
day l can be applied.

54 -
4. 4. 2 Reduction of malodorous compounds
According to Schaefer et al. (1974) the main compounds, responsible for
the objectionable piggery waste odour are compounds such as VFA, phenol,
p-cresol, 4-ethylphenol, indole and skatole. These compounds are formed
through microbiological activity in stored wet piggery wastes (Spoelstra,
1978). However, under the anaerobic conditions prevailing in methane diges
ters these compounds are effectively eliminated (Fig. 4.2). The experimen
tal results, indicating a considerable reduction of the odorous compounds
and hence of the manure malodours, are in accordance with the observations
of Hobson et al. (1979) and Welsh (1977) who reported that anaerobic diges
tion substantially reduces the piggery waste odours.
The experimental results summarized in Fig. 4.2 indicate
1. that the elimination of malodorous compounds increases at increasing
detention times,
2. that the VFA are eliminated faster than the aromatic compounds and
3. that a better elimination, especially of indole and skatole, is obtain
ed if the TS levels in the digester feed are lower.
In the experiments with 40 g TS 1 _ 1 manure a decrease of the detention
time from 15 to 10 days results in an increase in the VFA concentration,
especially of propionic acid. Unfortunately the concentration of the aromat
ic malodorous compounds has not been determined in these experiments.
With the 6% TS piggery waste the VFA concentration in the pilot plant
experiments was 3.5 - 4.2 meq l"1 at all detention times investigated, viz.
40, 20, 15 and 12 days. In the laboratory experiments the VFA concentration
increased from 3.1 meq 1 _ 1 at a 20 days detention time to 23.4 meq l"1 at a
10-days detention time. In the latter experiment the increase in the VFA
concentration again mainly concerns propionic acid. Concerning the aromatic
compounds phenol is almost completely eliminated at a 10-days detention
time, but the reduction of the p-cresol concentration was only 2% at a 10-
days detention time, whereas it increased to 98% at a 12-days detention
time. The explanation for this remarkably better elimination at a 12-days
detention time may be (1) that the organisms responsible for the p-cresol
degradation have - under these conditions - a generation time between 10
and 12 days and/or (2) that at a 12-days detention time all easily degra-
dable constituents of the manure feed have been reduced to a low concentra
tion, so that the metabolization of less easily degradable substrates, such
as aromatic compounds, is stimulated. At a 10-days detention time the in
dole concentration increased with a factor of 2.66 relative to its concen
tration in the raw manure, indicating that the indole formation surpasses
its elimination rate. However, increasing the detention time to 15 days re
sults in an effective indole elimination of 76%. In summarizing the results
of the experiments with 60 g TS l"1 piggery waste it appears that the eli
mination of odorous compounds markedly improves by increasing the detention

55 -
time in the range 10 - 15 days. As a further reduction of these compounds
is not manifest at detention times beyond 15 days (Fig. 4.2), the optimum
detention time with respect to the reduction of the manure odour is approx.
15 days. These results are in accordance with those of Welsh et al. (1977)
who performed olfactory studies on undigested and digested pig manure and
concluded that the most effective odour reduction through anaerobic diges
tion occurs at or beyond a 12-days detention time.
In the experiments with 90 g TS l"1 manure the VFA concentration was
approx. 18 meq. 1_1 at detention times of both 20 and 15 days. However, at
a 10-days detention time there was no reduction in the VFA concentration;
on the contrary, the propionic acid concentration in the digestion liquid
was even higher than in the manure feed. Contrary to the effective elimi
nation of the simple phenols (phenol, p-cresol, 4-ethylphenol) at detention
times of 15 and 20 days, no elimination of indole and skatole occurred in
the experiments with 90 g TS l"1 manure, even not at a 20-days detention
time. These poor results should be attributed to the fact that too high
space loads were applied and consequently only an acceptable elimination
can be achieved of the easily degradable organic compounds. These results
indicate that the digestion of piggery waste at high TS concentrations
should be dissuaded when a reduction of the manure odours is the prime ob
ject of the process application.
4. 4.3 Process balance
As volatile fatty acids are important intermediates in the conversion of
complex organic matter to methane and carbon dioxide, the VFA concentration
is an appropiate indicator for process imbalance (Kroeker et al., 1975;
McCarty, 1964).
The VFA concentration in the pilot plant experiments was 3.5 - 4.2 meq
1 *, whereas the VFA consisted exclusively of acetic acid. In the labora
tory experiments the VFA concentration at stable digestion conditions was
in the range 3.1 - 38.6 meq 1 1. Here, at a 20-days detention time acetic
acid was the mere volatile fatty acid present, whereas at shorter detention
times the increase of the VFA concentration mainly resulted from an increase
in the propionic acid concentration.
With respect to the process recovery after the temporary upset, shown in
Fig. 4.1, we found that considerably more time was involved in the recovery
of the propionic acid degradation than of the other VFA. Hobson et al.
(1974) also observed that at failing digestion conditions propionic acid
was the predominant VFA. From all these observations it appears that propi
onic acid is a critical factor in anaerobic digestion of piggery wastes and
that the course of the propionic acid concentration is a more useful indi
cator for process imbalance than the total VFA concentration.

56 -
As a result of the high ammonia nitrogen concentration occurring in di
gested piggery waste the system has a high buffer capacity; a dramatic pH-
drop below the critical value of pH 6 hardly can occur. The digestion of
piggery waste, therefore, is extremely stable with respect to the pH
(Kroeker et al., 1976). Even in case of severe process failure as occurred
in the experiment with 9% TS manure at a 10-days detention time the pH re
mained 7.55 in spite of the 200 meq l"1 VFA present in the mixed liquor.
4.4.4 Process rate limiting step
From the point of view of process optimalization it is important to get
insight in the course of the separate biochemical steps of the digestion
process. Therefore, the experimental results have been evaluated for the
degree of hydrolysis, acid formation and methane formation according to the
method described in Section 2.5.
The results of the calculations are shown graphically in relation to the
organic load in Fig. 4.5 A for the pilot plant experiments with 6% TS man
ure and in Fig. 4.5 B for the laboratory experiments with 9% TS manure.
The results of the pilot plant experiments indicate a slight decrease in
the rate of the distinguished steps at decreasing the detention time from
40 to 12 days. From this it can be concluded that the first step in the
anaerobic conversion, i.e. the hydrolysis of undissolved organic material,
is the rate limiting step in the overall process. This is in accordance
with ideas of Maki (1954) and Hobson et al. (1974).
In the experiments with 90 g TS 1_ I manure hydrolysis once again is the
rate limiting step when the detention time is decreased from 20 to 15 days.
However, in decreasing the detention time from 15 days (organic loading
rate 6.4 kg TS m~3 day ') to 10 days (organic loading rate 9.5 kg TS ni 3
day 1 ) the rate of methanogenesis drops off much stronger than that of hy
drolysis and acid formation, indicating that methane formation is the rate
limiting step under these circumstances. Acid formation was never found to
be rate limiting in anaerobic digestion of piggery waste.
4.4. 5 Practical aspects
Considering the practical application of anaerobic digestion for the
stabilization of piggery waste, the most important requirements to achieve
are:
1. a satisfactory reduction of the objectionable manure odours and
2. optimum process economics.
Optimum process economics is obtained when a high space load is combined
with a maximum gas production. From the results presented in this Chapter
it appears that a balanced digestion can be maintained at a loading rate of
6.4 kg TS m~3 day"1, either by digesting 9% TS manure at a 15-days deten
tion time (CH4 production 0.180 m3 kg"1 TS added) or by digesting 6% TS

- 57 -
COD C/o) 100-,
80
6CH
4 0
20i
04 0
CODCU 100-,
80
6 0
40
20
O
A. Feed manure cone. 60 g TS I"
hydrolysis acid formation methane formation
~ i 1 1 1 •
4 6 8 10 organic load (kg TS m"3 day"1)
B. Feed manure cone. 90 g TS I"
hydrolysis
acid formation
methane formation
eT 4 6 8 10 organic loadCkg TS m"3 day*1)
Fig. 4.5 Influence of the organic loading rate upon hydrolysis, acid formation and methane formation.
manure at a 10-days detention time ( CH4 production 0.166 m3 kg ' TS added).
However, at a loading rate of 6.4 kg TS m 3 day J the reduction of malodor
ous compounds is much less satisfactory. In order to accomplish a situation
in which both requirements are met, the optimum loading rate should be ap-
prox. 4 kg TS m 3 day ', provided this loading rate is obtained by diges
ting 6% TS piggery waste at a 15-days detention time. The methane produc
tion will be about 0.2 m3 kg"' TS added in that case.

58 -
5 INFLUENCE OF TEMPERATURE
5.1 INTRODUCTION
The potentials of anaerobic digestion to recover energy from organic
matter largely depend on the methane production rate. However, apart from
the production of methane gas, the digestion process consumes energy as
well, viz. for pumping, mixing and generally also for heating the manure
and maintaining the digester at the desired temperature. In temporate cli
mates like in Western Europe the greater part of the energy consumption is
used for heating purposes (Mills, 1979).
As in temporate climate areas the energy requirements of the process
chiefly depend on the applied digestion temperature, knowledge of the in
fluence of temperature on the gas production is indispensable for determin
ing the optimum process temperature with respect to the net energy recovery.
Anaerobic digestion of animal wastes can be conducted at mesophilic tem
peratures (20 - 40°C) and at thermophilic temperatures (40 - 65°C). Although
thermophilic digestion of manure may have benefits over mesophilic diges
tion, such as higher rates of digestion, greater conversion'of waste organ-
ics to gas, faster solid-liquid separation and minimization of bacterial
and viral pathogens, the mesophilic temperature range should be preferred
for animal waste digestion at farm-scale application because of practical
reasons.
For digestion in the mesophilic range commonly a temperature of 33 -
35°C is used. This temperature range originates from the practice of sewage
sludge digestion. However, the optimization of the sewage sludge digestion
process has been primarily directed to a maximum stabilization of the sludge,
and therefore to a maximum gas production, rather than to a maximum net
energy recovery.
The studies were performed to investigate the effects of temperature on
the digestion of wet piggery manure. The main objectives of the study were
1. to assess the digestion temperature at which the maximum gas yield is
obtained and
2. to collect sufficient information for optimizing the net energy recov
ery in the mesophilic temperature range (20 - 40°C).
5.2 PROCEDURES
The influence of temperature on the digestion of wet piggery manure was
investigated in three series of experiments, designated as series A, B and
C. In each series three different temperatures were tested. Table 5.1 shows
the temperatures investigated together with the loads applied.

Table 5.1 Experimental scheme.
59
Series of experiments
-3 -1 Load (kg TS m day )
Detention time (days)
Temperatures investigated ( C)
3.3
22.5
20
25
30
4.
15
27
32
40
2 3.6
20
13
35
55 (in duplicate)
The experiments of series A and B were performed in three 45-litre labo
ratory digesters (Section 2.3.2), whereas the experiments of series C were
conducted in four 5-litre laboratory digesters equipped with a water jacket
(Section 2.3.2).
All digestion units were seeded with well-digested sludge obtained from
experimental digestion units fed with 6% TS piggery waste and operated at
30°C. The VFA concentration of the seed material was less than 200 mg 1 _ 1 .
After seeding the digester temperatures were adjusted immediately to the
desired value. The digesters were fed daily or bidaily (viz. in the week
ends) by discharging a fixed amount of the digester contents. Then the same
volume of fresh manure was added.
As the three series of experiments were not conducted simultaneously the
piggery waste used in the various series differed with respect to the ori
gin and the composition. The chemical manure characteristics are summarized
in Table 5.2.
The manure used in series A originated from an experimental pig housing
unit. The pigs were fed here ad libitum so that the manure may contain some
spilled feed rests. The series B experiments were conducted with manure
from a pig-fattening farm and those of series C with manure from an experi
mental farm where the manure solids and the manure liquid were discharged
separately. Both fractions were combined in appropriate proportions before
supplying it to the digester. The manure in this case partly consisted of
saw dust and other litter material. The experiments were continued for a
period of at least 25 days after the digestion process had reached a steady
state with respect to the gas production and the VFA concentration.

- 60
Table 5.2 Chemical characteristics of piggery wastes used in the experiments on digestion temperature.
Exp. A Exp. B Exp. C
pH
Ts (g r ' ) vs (g r 1 ) Ammonia nitrogen (mg N I )
Total nitrogen (mg N I )
COD supernatant (mg 1 )
COD total (mg 1 )
COD of the VFA (mg 1 )
VFA (meq 1~')
7. 1
74.0
56.2
2320
3850
22800
67500
15900
176.2
7.2
63.3
42.5
1840
n.d.
17500
64500
9600
107.2
6.9
71.6
55.1
1730
3810
16000
65000
10250
1 15
5.3 RESULTS
The experimental results of series A, B and C are summarized in Tables
5.3, 5.4 and 5.5, respectively. The data presented in these Tables concern
the average values of the results during the last 25 days of the experi
ments when the digestion process had reached a steady state. In Tables 5.3
5.5 the values of TS, VS and COD total are not presented as they are inade
quate due to the incomplete mixing of the digester contents.
The gas production obtained in the reference experiments conducted at
approx. 30°C of each series differed considerably from each other, which
should be mainly attributed to the use of manure of different origin and
composition. Therefore, but also because of the application of different
loading rates in the three series (between 3.3 and 4.2 kg TS m-3 day"1) the
interpretation of the results should be primarily related to the data ob
tained within each separate series.
The results in Table 5.5 indicate that methane production is nihil at a
process temperature of 13°C under the conditions applied. This can not be
attributed to a lack of adequate substrates for the methane-forming bacte
ria because of the high VFA concentration in the digester mixed liquor. The
VFA concentration even increased from 115 meq l"1 in the feed to 181.7 meq
1 * after being exposed to 13°C in the digestion experiment.

- 61
However, a t 20°C an a c t i v e methane f e rmenta t ion t a ke s p l a c e ; t h i s r e s u l t s i n a sharp dec rease i n t he VFA concen t r a t i on of t h e d i g e s t e r c on t en t s r e l a t i v e t o t h a t of t he f r e sh manure. The r e s u l t s p r e s en t ed i n Table 5 .3 a l s o r e v e a l t h a t t he a c t i v i t y of t he b a c t e r i a l ë ludge i s c on s i de r ab ly h ighe r a t 25°C (CH4 p r oduc t ion 0.246 m3 kg"1 TS added) than a t 20°C (CH4 p roduct i o n 0.172 m3 kg * TS added) . However, an i n c r e a s e of t h e t empera tu re from 25°C t o 30°C does no t f u r t h e r improve t he methane p roduc t i on s i g n i f i c a n t l y , v i z . only from 0.246 m3 kg"1 TS added a t 25CC t o 0.262 m3 kg"1 TS added a t 30°C.
Table 5.3 Experimental results of series A. (Piggery waste concentration 74 g TS 1 *; detention time 22.5 days; load 3.3 kg TS m 3 d a y " 1 ) .
Exp. A Exp. A2 Exp. A ,
Working digester volume (litres)
Duration experiment (days)
Temperature ( C)
Gas
Gas production (1 gas 1 day ) 3 r -1
(m gas kg TS added)
Gas composition (% CH^) -5 -1
Methane production (mJ kg TS added)
COD removed via gas (g COD 1 manure)
Digester effluent
pH
Ammonia nitrogen (mg N 1 )
Total nitrogen (mg N 1 )
COD supernatant (mg 1 )
VFA (meq 1~')
Acetic acid (meq 1 )
Propionic acid (meq 1 )
COD total reduction (%)
COD reduction (%) s
VFA reduction (%)
45
95
20
0.795
0.242
71. 1
0.172
32.3
7.4
2870
3950
7000
18.9
14.7
3.8
54.8
69.7
90.3
45
95
25
1.155
0.351
70.1
0.246
46.3
7.55
2990
3680
7200
3.2
3.2
0
78.6
68.8
98.4
45
95
30
1.248
0.379
69.0
0.262
49.3
7.6
2990
3650
5200
2.7
2.6
0.1
83.5
77.6
98.6

- 62
Table 5.4 Experimental results of series B. (Piggery waste concentration 63.3 g TS 1 1 ; detention time 15 days; load 4.2 kg TS « 3 day"1).
Exp. Exp. B Exp. B
Working digester volume (litres)
Duration experiment (days)
Temperature ( C)
Gas
Gas production (1 gas 1 day) 3 r -1
(m gas kg TS added)
Gas composition (% CH4) 3 -1
Methane production (mJ kg TS added)
COD removed via gas (g COD 1 manure)
Digester effluent
pH
Ammonia nitrogen (mg N 1 )
Total nitrogen (mg N 1 )
COD supernatant (mg 1 )
VFA (meq 1~')
Acetic acid (meq 1 )
Propionic acid (meq 1 )
COD total reduction (%)
COD reduction (%) s
VFA reduction (%)
45
90
27
0.989
0.234
74.0
0.173
27.9
7.6
2330
n.d.
7230
3.4
3. 1
0.3
43.4
58.6
96.8
45
90
32
1.076
0.255
72.8
0.186
29.9
7.65
2255
n.d.
5760
1. 1
1 .1
0
46.4
67.1
99.0
45
90
40
1.129
0.268
73.5
0.197
31.6
7.7
2275
n.d.
7930
6.5
4.8
1.5
49.2
54.6
93.9
Correspondingly the results of series B (Table 5.4) show that the methane
production increases only slightly and almost linearly with the digestion
temperature in the range from 27 to 40°C. The results of the separate ex
periments within this series are very similar except that the VFA concen
tration and the COD of the supernatant solution in the 32°C experiment are
clearly lower than that in the 27°C and 40°C experiments. From the experi
ments in the mesophilic temperature range the reduction of malodorous com
pounds was only determined at 20°C, 25°C and 30°C (series A ) . The analytic
al results, presented in Table 5.6, show that there is an evident reduction
of these compounds at increasing temperatures.

63
The d ige s t i on process at 55°C was i nve s t i ga t ed in two p a ra l l e l exper i ments, which showed very s imi lar r e su l t s (Table 5 . 5 ) . A r a i s e in temperature from 35°C t o 55°C adversely a f f e c t s the gas production because the methane production a t 55°C, v i z . 0.190 m3 CH4 kg"1 TS added, i s only 75% of that a t 35°c (0.249 m3 CH4 kg"1 TS added). Furthermore, the methane content of the gas produced under thermophil ic condit ions i s somewhat lower.
Table 5.5 Experimental results of series C. (Piggery waste concentration 71.6 g TS 1 ' ; detention time 20 days; load 3.6 kg TS m"3 day"1).
Exp. C
5
73
13
0
0
-0
0
6.7
1820
3790
20600
181.7
113.1
38.1
--28
-58
Exp. C2
5
73
35
1.382
0.384
65.0
0.249
44.3
7.4
2061
3643
5630
1.6
1.5
0.1
68.1
64.9
98.6
Exp.
(in dupl
5
80
55
1.134
0.315
58.5
0.184
32.7
7.8
+2430
3740
18100
84.5
19.7
41.6
50.3
-12.9
26.5
C3 icate)
5
80
55
1.195
0.332
59.0
0.196
34.7
7.7
+2400
3450
Î720O
81.0
18.9
36.4
53.3
-7.1
29.6
Working digester volume ( l i t res) Duration experiment (days) Temperature ( C)
Gas
Gas production (1 gas 1 day ) 3 r -1
(m gas kg TS added)
Gas composition (% CH,)
-1„ Methane production (mJ kg TS added)
COD removed via gas (g COD 1 manure)
Digester effluent
PH
Ammonia nitrogen (mg N 1 )
Total nitrogen (mg N 1 )
COD supernatant (mg 1 )
VFA (meq 1~')
-1, Acetic acid (meq 1 )
Propionic acid (meq 1 )
COD total reduction (%)
COD reduction (%) s
VFA reduction (%)
increasing to
In additional experiments various efforts were made to initiate thermo
philic digestion at 55°C of piggery waste having an ammonia nitrogen con
centration of 3000 mg 1 '. However, in no case methane production did start
under these circumstances. As it was believed that the main reason for the
poor results of the latter experiments was the stronger inhibitory action

64
Table 5.6 The concentration of aromatic malodorous compounds (in mg 1 1) in raw manure and after digestion at 20°C) 2_5°C and 30°C in experimental series A (Detention time 20 days; load 3.3 kg TS i 3 day"1).
Fresh manure
20 C
Digested manure
25 C 30 C
phenol
p-cresol
4-ethylphenol
indole
skatole
24.6
103.3
25.4
0.9
8.7
2.0
27.9
3.5
0.5
3.8
1.1
4.3
1.5
0.3
5.2
1. 1
0.8
1.0
0.2
3.4
of ammonia nitrogen on the digestion process under thermophilic than under
mesophilic conditions, two additional experiments were performed with the
intention to get more information about the influence of ammonia nitrogen
on thermophilic digestion.
1. After finishing series C one of the 55°C-digesters was continuous
ly operated at 55°C and fed with 6% TS piggery waste at a 30-days
detention time (reference digester).
2. The other 5s°C-digester of series C was operated similarly as the
reference digester except that 5.1 g urea per litre piggery waste
was added in order to increase the ammonia nitrogen concentration
in the digester contents to approx. 3800 mg l"1.
The results of the additional thermophilic experiments are presented in
Table 5.7. They indicate that gas production almost completely ceases at an
ammonia nitrogen concentration of 3800 mg l"1 and does not recuperate with
in the experimental period of 50 days. The methane production in the refer
ence digester is very similar to that obtained in the 55°C-experiments of
series C (Table 5.5).
5.4 DISCUSSION
The most relevant digestion characteristic for evaluating the influence
of temperature on anaerobic digestion is the methane production, especially
when energy recovery is the main objective for applying the digestion pro
cess. However, the methane production only represents the final degree of
conversion and does not necessarily reveal the rate limiting step in the
process. To gain a better insight in the course of the digestion process,
the fraction of organic material converted in the three separate steps.

- 65 -
Table 5.7 Thermophilic digestion at various ammonia nitrogen concentrations (temperature 55°C; detention time 30 days; manure concentration 65 g TS l"1; load 2.2 kg TS m 3 day 1).
Manure Reference Ureum added
Duration of experiment (days)
Gas 3 -1
Gas production (m gas kg . TS added)
Gas composition (% CH^)
Methane production (mJ kg TS added)
Digester effluent
PH Ammonia nitrogen
COD supernatant (mg 1 )
COD of the VFA (mg 1~ ' )
VFA (meq 1~')
Acetic acid (meq 1 )
Propionic acid (meq 1 )
50 50
7.2
1200
8000
3870
46.6
33.6
7.6
0.276
63
0. 174
0.038
39
0.015
7.9
1500
n.d.
5380
50.3
22.8
16.2
7.7
3800
n.d.
12900
164.4
133
17.5
v i z . h y d r o l y s i s , a c i d f o r m a t i o n and me t h an e f o r m a t i o n , h a s b e e n c a l c u l a t e d
a c c o r d i n g t o t h e me thod e x p l a i n e d i n S e c t i o n 2 . 5 . The r e s u l t s o f t h e s e c a l
c u l a t i o n s h a v e b e e n p l o t t e d v e r s u s t h e t e m p e r a t u r e i n F i g . 5 . 1 f o r t h e e x
p e r i m e n t a l s e r i e s A and B and a r e p r e s e n t e d i n T a b l e 5 . 8 f o r s e r i e s C.
Table 5.8 Influence of temperature on the degree of hydro lys i s , acid formation and methane formation ( in % of the manure-COD) in experimental s e r i e s C.
Manure 13"C 35 C 55 C
Hydrolysis
Acid formation
Methane formation
24.6
15.8
0
31.8
25.7
0
76.1
67.7
67.5
78.5
67.2
51.5

66 -
COD C/o)
100-,
80
series A
60
40
20-
20
CODC/o) 100-n
80-
60-
40
20
25
hydrolysis
acid formation
methane formation
— i — 1 1 1
25 30 35 40
t empera tu re (°C)
ser ies B
hydrolysis
acid formation
methane formation
30 — i —
35 40 45 50
temperature (°C)
Fig . 5.1 Influence of temperature in the mesophilic range (20°C to 40°C) on the degree of hydro lys i s , acid formation and methane formation.
5.4.1 Digestion at 13°C
L i t e r a t u r e da t a (Ha t f i e l d e t a l . , 1928; Rudolfs , 1927; Imhoff, 1936)
concern ing t h e d i g e s t i o n of s o l i d wastes such as sewage s ludge i n d i c a t e

67
that methane production still takes place at temperatures of approx. 10°C
though at a very low rate. Contrary to these reports no gas is produced in
the present 13°C-experiment under the process conditions applied. The ab
sence of methane production in this experiment may indicate that environ
mental factors such as the high ammonia nitrogen concentration and the high
pH levels in piggery manure together with the low temperature create condi
tions which are unfavourable for methanogenic organisms.
Contrary to the results of experiments conducted in our laboratory indi
cating that methane-forming organisms accomodate well to changes in tempe
rature between 10 and 45°C (Lettinga, 1979) the gas production in a piggery
manure digester evidently ceases at a fall in temperature from 30 to 13°C.
Heukelekian et al. (1948) and Speece and Kern (1970) also reported that,
in the digestion of sewage sludge, the gas production did not continue im
mediately after a sudden decrease in temperature in this range.
The cessation of methane production in combination with the application
of a 20-days detention time immediately after the start of the experiments
may have caused a wash-out of methanogenic bacteria. Therefore, better re
sults may be expected when more time is taken to acclimate the bacterial
population to the change in temperature.
The results in Table 5.8 also indicate that hydrolysis is very incomplete
at 13°C. This may be attributed (1) to the low activity of the hydrolytic
enzyme complexes at this temperature and/or (2) to an inhibition of hydro
lysis by the endproducts of the acid formation, such as VFA and hydrogen,
which accumulate in the digester contents.
5. 4. 2 Digestion at mesophilic temperatures (20 - 40°C)
As appears from Fig. 5.1 all three separate steps of the digestion pro
cess (hydrolysis, acid formation and methane formation) are affected to.
about the same extent by the temperature in the range 20 - 40°C. Hence it
can be concluded that changes in the methane production at the different
temperatures investigated should be attributed mainly to changes in the
rate of hydrolysis (liquefaction of undissolved material). Evidently the
methane production in the underlying experiments reflects in fact the in
fluence of temperature on the rate of hydrolysis. The fact that hydrolysis
is the rate limiting step in the digestion of piggery waste at a tempera
ture of 30°C was already observed in the experiments described in Chapter
4. These observations are in accordance with those of Pfeffer (1974) who
investigated the effect of temperature on the digestion of shredded domes
tic refuse.
Fig. 5.1 further reveals that the rate of hydrolysis strongly increases
when the temperature is raised from 20 to 25°C. The combined results of
series A and B indicate that the rate of hydrolysis - and therefore the me
thane production - increases almost linearly with temperature in the range

25 - 40°C, although the average rate of increase in the gas production is
only about 1% per °C in this temperature range!.
Fair and Moore (1934), in summarizing the results of batch experiments
concerning the influence of temperature on the digestion of sewage solids,
also approximated the relation between the relative rate of digestion and
temperature in the range 25 - 40°C by a linear relationship and concluded
that in fact little can be gained by raising the digestion temperature a-
bove 25°C. Similarly Golueke (1958) reported a linear relationship between
temperature (30 - 40°C) and gas production at the digestion of raw sewage
sludge at a load of 1.45 kg VS m~3 day"1.
In assessing the effect of the temperature on the digestion process, im
portant factors to be considered are the detention time and the ammonia
nitrogen concentration. At a shorter, and therefore more critical detention
time the differences in methane production at different temperatures pre
sumably are more pronounced. Hobson et al. (1979) conducted experiments
with pig slurry at a 10-days detention time and reported an increase in the
gas production from 0.30 m3 kg"1 TS added at 30°C to 0.42 m3 kg"1 TS added
at 40°C which corresponds to an average increase in the gas production of
4% per °C. The ammonia nitrogen concentration of the digester contents may
also affect the relation between the temperature and the digestion, because
an increase in the digestion temperature is, as we have seen before, accom
panied with an increase in the concentration of undissociated ammonia. In
our experiments (series B) the undissociated ammonia nitrogen concentration,
as calculated by the equation of Section 2.5.2, increases from 59.1 mg 1 1
at 27°C to 165.6 mg l"1 at 40°C.
5. 4. 3 Digestion at 55°C
The increase of the digestion temperature from 35°C to 55°C resulted in
a decrease in the gas production of approx. 25%, despite a slight increase
in the degree of hydrolysis (Table 5.8). This has to be attributed to an
improved conversion of carbohydrates and nitrogenous substances such as
proteins. Table 5.9 which contains a rough estimate of the relative break
down of carbohydrates at digestion temperatures of 13, 35 and 55°C, indi
cates that the conversion of both cellulose and hemicellulose increases at
raising temperatures.
The breakdown of nitrogenous components can be estimated from the ammo
nia nitrogen concentration before and after digestion. These analyses give
only an impression of the overall process because apart from the release of
ammonia nitrogen during the breakdown of nitrogenous substances, part of
the ammonia nitrogen is incorporated in new cell material. Furthermore,
some ammonia nitrogen may have been lost from the digestion liquor with the
gas. The ammonia nitrogen concentration in the experimental series C in-

69 -
Table 5.9 Rough estimate of the reduction of hemicellulose and cellulose as observed in experimental series C (in % of the concentration in the manure). Lignin is used as an internal standard.
13 C 35 C 55 C
Hemicellulose 38 43 53
Cellulose 34 39 52
creased significantly with increasing temperature, i.e. from 1820 mg l"1 at
13°C to 2400 mg 1 1 at 55°C , which points to an increased conversion of
nitrogenous components at 55°C. Both the higher VFA concentration and super
natant COD at thermophilic digestion as compared to mesophilic digestion
has also been observed by Buhr et al. (1977), Golueke (1958), Garber et al.
(1975) and Pohland and Bloodgood (1963). Apparently the observed decrease
in the gas production in the underlying experiments is due to both a less
complete acid and methane formation.
Earlier investigations on the effect of temperature on anaerobic diges
tion of wastes gave rather conflicting results. Heukelekian (1930) and Fair
and Moore (1932) found in batch experiments with sewage sludge both a higher
gas production and gas production rate at increasing temperatures up to
60°C, whereas in similar experiments Maly and Fadrus (1971) found that this
only holds for the gas production rate. Continuous experiments at different
temperatures were conducted with municipal sewage sludge (Golueke, 1958;
Pohland et al., 1963; Malina, 1961; Garber et al., 1975), shredded domestic
refuse (Pfeffer, 1974) and dairy manure (Converse et al., 1977). Garber et
al. (1975) and Pfeffer (1974) reported an increase in the gas production
when increasing the temperature from the mesophilic to the thermophilic
range. On the other hand the reports of Golueke (1958), Pohland and Blood-
good (1963), Malina (1961) and Converse et al. (1977) showed a similar or
somewhat lower gas production at thermophilic as compared with mesophilic
temperatures. These discrepancies in the reports may be caused either by
differences in the adaptation procedures applied or by the influence of
some yet unidentified inhibitory agent for thermophilic methanogenic organ
isms.
Anyhow, the results obtained in the additional experiment conducted in
the present study, where the ammonia nitrogen concentration was increased

70
from 1500 mg 1 1 to 3800 mg 1 1, clearly indicate that ammonia nitrogen
severely inhibits the methane formation under thermophilic conditions. In
fact such an inhibition also occurs under mesophilic conditions but the ex
perimental results presented in Chapter 3 have shown that the digestion
process can adapt in that case to ammonia nitrogen concentrations up to
5000 mg 1 1 . Under these conditions the concentration of undissociated am
monia nitrogen is approx. 300 mg 1_1 . The concentration of undissociated
ammonia nitrogen in the 55°C-experiment at 3800 mg 1 1 , however, is 619 mg
1 '. As it is presumed that undissociated ammonia is the inhibitory agent
for methanogenesis, it is clear that the effect of ammonia nitrogen is con
siderably greater under thermophilic than under mesophilic conditions.
5.4. 4 Determination of the optimum digestion temperature
The experimental results reveal that the mesophilic temperature range is
! most adequate for the digestion of wet piggery manure. At a submaximum load
! of about 4 kg TS m~3 day"1, which is imperative when the abatement of odour
j nuisance is pursued (Chapter 4), the gas production increases almost linear-
i ly with temperature in the range 25 - 40°C with about 1% per °C.
Starting from the results of experimental series B a raise in tempera
ture from 27°C to 40°C causes an increase in the methane production from
0.024 m3 kg 1 TS (Table 5.4) which corresponds to an increase in energy
yield of 0.865 MJ kg"1 TS. However, considering that heating of 6% TS ma
nure feed from 27°C to 40°C theoretically requires 0.91 MJ kg"1 TS, the ex
tra methane production is not sufficient to heat the manure from 27°C to
40°C, even not at a 100% efficiency of the energy conversion.
The energy balance might be more positive when more concentrated manure
is digested. However, the gas production per kg TS levels off at increasing
TS concentrations beyond 6% TS (Chapter 4). Therefore, when the heat re
quirements of a digester have to be supplied exclusively with high-grade
fuel, e.g. with part of the biogas produced, the optimum temperature with
respect to net energy recovery is at the lower temperature range of meso
philic digestion, i.e. between 25°C and 30°C. This confirms recent finding
of Stevens et al. (1979) mentioning that low temperature (approx. 25°C)
digestion is technically feasible for a swine manure management and energy
producing strategy. Moreover, as can be deduced from our results an addi
tional benefit of piggery waste digestion at low temperatures is the de
crease in the concentration of undissociated ammonia in the lower mesophil
ic temperatures range making the process less sensible to high ammonia ni
trogen concentrations. However, since the reduction of malodorous compounds
improves at higher temperatures in the range 20 - 30°C (Table 5.6), a di
gestion temperature of approx. 30°C should be preferred if the abatement of
odour nuisance is pursued as well.
When sufficient waste energy, f.e. cooling water of a gas motor/generator
set, is available the optimum process temperature for energy recovery is at
the upper part of the mesophilic range, i.e. approx. 40°C, because then the
maximum conversion to methane is achieved.

- 71
6 GENERAL DISCUSSION
The main objectives of the application of anaerobic digestion of com
plex, chiefly solid substrates are energy recovery and waste stabilization.
Additional benefits to be achieved in the application of the process in
clude the conservation of the fertilizer value and the reduction of the TS
content of the waste. The economical viability of the anaerobic digestion
process is dependent upon factors such as the gas production, the total
costs of the process (investment costs, interest, running costs and costs
of the biomass), the prevailing retail prices for energy, the local avail
ability of energy and the efficiency of the gas utilization. Moreover,
other potential achievements of digestion, such as the malodour reduction,
the reduction of pathogens and the value of the digested residues as a fer
tilizer may improve the feasibility of the process in specific cases, es
pecially when the compulsory application of other treatment processes, e.g.
aerobic stabilization, can be saved.
In anaerobic digestion, biodegradable organic material is converted to
methane and bacterial cells. In treating substrates consisting mainly of
easily biodegradable compounds anaerobic bacteria, grown on the substrate
constitute main part of the digester solids. As a consequence these sludges
will develop a high specific activity, which allows the application of high
organic loading rates provided the sludge is sufficiently retained in the
digester. This can be achieved by applying anaerobic treatment systems,
such as the anaerobic filter (Young and McCarty, 1969) and the recently de
veloped upflow anaerobic sludge blanket process (Lettinga et al., 1980).
With both systems high loading rates can be applied with dissolved, but al
so with easily biodegradable solid substrates, e.g. even exceeding 30 kg
COD m~3 day"1 (Lettinga et al., 1980).
However, many types of biomass and organic residues available for bio
logical conversion to methane, e.g. crops, straw, manure, domestic refuse
and sewage sludge, contain a relatively high fraction of poorly or nonbio
degradable components. The presence of refractory materials in the digester
feed not only adversely affects the process efficiency, viz. the conversion
degree and the TS reduction, but also reduces the specific activity of the
sludge, due to the entrapment of biologically inert solids from the feed
stock. As a consequence the maximum applicable organic loading rate with
these feedstocks will be significantly lower than that with dissolved or
easily biodegradable solid substrates. A conventional digester of the flow-
through type is adequate to treat complex, partly biodegradable substrates.
The digestion of these substrates as a rule is not completed within a pe
riod of 10 days, which can be regarded as the minimum sludge detention time
under mesophilic conditions.
The major refractory component in these types of biomass is lignocellu-
losic material originating from plant cell walls. This material mainly con-
72 -
sists of cellulose and hemicellulose incorporated in a lignic complex. As
lignin is regarded as virtually undegradable by anaerobic processes (Hobson
et al., 1974) and the cellulolytic enzymes cannot penetrate in the lignin
matrix because of steric hindrance (de Wit, 1980), the incorporated poly
saccharides are hardly available for biodégradation. As a consequence the
digestibility of these substrates can only be improved to a greater or smal
ler extent by applying a proper pretreatment method, directed towards a
disrupture of the lignin matrix. Such a method may consist of a physical,
chemical, mechanical or combined treatment of the feedstock.
Gottschall et al. (1978) examined the effect of gamma-radiation on the
biodegradability of domestic sewage sludge and reported that a radiation
dose of approx. 0.4 Rad per hour with a cobalt 60 source for 24 hours in
creased the gas yield by approx. 50% provided the irradation was performed
in the presence of excess of oxygen. Kelsey et al. (1980) investigated the
effect of ball-milling and wet-milling with concurrent enzymatic hydrolysis
on the saccharification of cellulosic materials, including 'pure' cellu
lose, newspaper, lignocellulose and wood. In all cases investigated a com
bined treatment of wet-milling with cellulase proved to be far more effec
tive than ball-milling. For lignocellulose 93% could be saccharified by
wet-milling with concurrent enzymatic attack for 24 hours, whereas ball-
milled and untreated lignocellulose only yield a degree of saccharification
of 30% and 9%, respectively. Chemical pretreatment methods, either with
mineral acids or alkaline, have been reported to be effective in improving
the biodegradability of straw (Ginnivan et al., 1977; Detroy et al., 1980),
the fiber fraction of cattle manure (Nesse et al., 1977) and pig faeces
(Ngian et al., 1977). Chemical treatment seems to be more effective at ele
vated temperatures. Studies on the thermochemical pretreatment of the fiber
fraction of cattle manure (Nesse et al., 1977), domestic sewage sludge
(Stuckey et al., 1978; Haug et al., 1978; McCarty et al., 1976), newspaper
(McCarty et al., 1978), organic municipal refuse (Pfeffer et al., 1976) and
pig faeces (de Wit, 1980) indicated that these methods effect a substantial
increase of the biodegradability of these substrates, although the efficien
cy depends on the treatment temperature and on the type of chemical used.
NaOH is the most effective chemical, both at ambient and at elevated temper
atures. However, Stuckey et al. (1978) reported that thermochemical pre
treatment causes the formation of toxic compounds and refractory nitrogen
containing organic materials. This effect seems to be more pronounced as
treatment conditions become more severe, e.g. at temperatures above 175°C.
Although the biodegradability of refractory materials can be improved by
applying physical, chemical or mechanical pretreatments, it should be rec
ognized that these contrivances are accompanied with the consumption of
energy and/or chemicals.
An alternative, and potentially more attractive, pretreatment method
might be the use of lignin-degrading organisms. A number of fungi, includ-

- 73
ing actinomycetes, basidiomycetes and ascomycetes (Crawford et al., 1974;
Ginnivan et al., 1977; de Wit, 1980; Dickinson and Pugh, 1974) and bacteria
have been reported to be effective in the attack of lignified cellulose.
Recently Akin (1980) isolated a facultative anaerobic micro-organism from
rumen fluid, capable to attack lignified tissue in forage grasses under
anaerobic conditions. However, thus far the application of biological pre-
treatment methods still is limited because the penetration of enzymes into
the lignin-cellulose complex, and consequently the reaction rate, is slow.
Nevertheless, in view of their potential importance biological methods have
recently become one of the major areas of research.
6.1 BIODEGRADABILITY OF PIGGERY WASTE
The gas production from piggery wastes in well-established digestion
units is in the range 0.24 - 0.49 m3 kg"1 VS added. The gas yields obtained
in the present investigation under various process conditions are summarized
in Table 6.1 together with relevant literature data. Table 6.1 shows that
the gas yields obtained in the present study are of the same order of magni
tude as those reported in literature.
Table 6.1 Gas production from piggery wastes.
Temp. Detention time Organic load Gas production Reference
(°C) (days) (kg VS m 3 day ') (m3 kg""' VS added)
35
35
35
35
33
35
35
30
32
30
30
30
20-30
27-40
10
15 -
15
26
10 -
10 -
20
15
12 -
10 -
10 -
15 -
22
15
30
5
15
50
40
15
20
20
5
1.4 - 4.5
1.05 - 2.1
4.0
2.4
1.92 - 3.85
0.32 - 3.20
2.41 - 3.05
3.5
1.1 - 3.6
2.0 - 3.0
2.3 - 4.5
3.4 - 4.5
2.5
2.8
0
0.62
0
0.36
0.26
0.49
0.37
0.33
0.31
0.24
0.28
0.32
0.32
0.35
43
- 0.82
55
- 0.42
- 0.45
-0.64
-0.54
-0.49
- 0.37
- 0.33
- 0.39
- 0.33
- 0.50
- 0.40
Hobson et al. (1980)
Kroeker et al. (1975)
Fisher et al. (1977)
Haga et al. (1979)
Gramms et al. (1971)
Taiganides et al. (1963)
Jeffrey et al. (1964)
see chapter 3
see chapter 4
see chapter 4
see chapter 4
see chapter 4
see chapter 5
see chapter 5

74
However, considering the extreme values reported, the gas yield from
piggery wastes varies in a wide range, viz. from 0.24 - 0.82 m3 kg ' VS
added. This variation originates partly from differences in the process
conditions, e.g. the digestion temperature and the organic and hydraulic
loading rate. However, even under very similar process conditions the gas
yields may differ considerably. This can be primarily attributed to differ
ences in the composition and the origin of the feed manure. Important fac
tors affecting the composition of animal slurries include the animal diet,
the presence of spilled feed rests and of bedding materials, the manure
collection and storage system applied, the storage temperature and the du
ration of the storage period. Moreover, it should be emphasized at this
place, that the use of TS and VS values as parameters for describing the
process efficiency is erratic because the standard methods applied in the
measurement of these parameters frequently gives incorrect results, espe
cially if the waste contains high concentrations of volatile compounds such
as VFA, ammonia nitrogen and alcohols. These compounds are only partly in
cluded in the standard TS analysis and therefore the VS value does not re
present the actual organic content of the waste. Both the standard TS and
VS values have to be corrected for the ammonia nitrogen and VFA losses
(Section 2.1.1). Doing so, the gas yield is 0.22 - 0.32 m3 kg"1 VS added
and the methane yield per kg VS destroyed is in the range 0.40 - 0.60 m3
with an average value of about 0.54 m3. From this it can be calculated that
the COD:VS ratio of the converted organic material ranges from 0.99 - 1.47.
Fig. 6.1 shows the average fractional composition of raw piggery waste,
in terms of the biodegradable COD-fraction (i.e. converted to methane and
bacterial mass) and the refractory COD-fraction (dissolved and solid). The
conversion of piggery waste-COD to methane varies from 30 to 80%, with a
mean value of about 50%. Obviously, the biodegradable COD-fraction of pig
gery waste is slightly higher than this 50%, because part of the biodegra
dable constituents is converted to bacterial cells. Estimating the bacteri
al growth yield factor at 0.10 the biodegradability of piggery wastes is
about 55%. Yet, considering that both the gas production and the elimina
tion of malodorous compounds show little if any increase in the digestion
of 6% TS manure at 30°C at detention times exceeding 15 days, the manure
can be considered as well stabilized after a digestion time of 15 days.
This idea is supported by the results of storage experiments conducted
with digested piggery waste at 4°C and 20°C. The results indicate that the
formation of malodorous compounds is close to nihil under these circumstan
ces. The remaining organic matter, therefore, can be regarded as highly re
fractory. As illustrated in Fig. 6.1 part of the refractory material (about
10% of the original manure-COD) occurs in the supernatant solution of the
digester effluent. According to results of Hobson et al. (1973) this frac
tion is also hardly biodegradable under aerobic conditions, i.e. aerobic

75 -
post-treatment of a supernatant solution of 5400 mg C0D_1 results in a COD
reduction of only 2%
COD (%.)
100-
80-
60-
methane
bacterial cells
biodegradable
refractory
Fig. 6.1 The average fractional composition of piggery wastes in terms of the biodegradable COD-fraction and the refractory COD-fraction.
The remaining 30 - 40% of the original manure-COD even has not been hy-
drolysed and remains in the digester residue as solid material. This solid
fraction presumably mainly consists of lignocellulosic material originating
from plant cell walls. Because these feed ingredients are hardly digested
by pigs rfith a maximum weight of 100 kg (Dammers, 1964) they find their way
into the wastes. According to results of de Wit (1980) lignocellulosic ma
terial comprises 35 - 40 percent of the total solids in freshly voided pig
faeces. The main part of this material, viz. 60 - 65 percent, consists of
cellulose and hemicellulose, whereas the lignin content is 16 - 19 percent
(de Wit, 1980). Obviously, the efficiency of piggery waste digestion can be
increased only by improving the availability of the incorporated polysaccha
rides through a proper pretreatment of the waste.

76 -
Preliminary pretreatment experiments conducted in our laboratory con
cerning the liquefaction of piggery waste indicated that
particle size reduction increases the rate but does not affect the ulti
mate degree of liquefaction
chemical treatment with acid or alkali for 1 hour at pH 1 and 13, res
pectively increases the degree of liquefaction, especially in the case
of the alkaline treatment which increased the liquefaction by about 30%
thermal pretreatment during 1 hour at 100°C under atmospheric pressure
improved the degree of liquefaction by about 80%
a combined 1 hour alkaline-thermal treatment at pH 13 at 100°C under at
mospheric pressure was the most effective pretreatment method investi
gated. The degree of liquefaction in that case was almost doubled.
These results together with those from literature, cited before, demon
strate that a proper pretreatment can increase the biodegradability of pig
gery wastes. However it is quite doubtful whether or not these methods will
result in a net energy gain. Moreover, as they will be accompanied with
high investment and running costs, the application of these methods at in
dividual farms is not attractive.
The presence of refractory solids in piggery wastes and the fact that
they as a rule are highly concentrated, viz. in the range 4-10% TS, suggest
that a digester of the conventional flow-through type is adequate to handle
these wastes. At present mixed digesters and plug-flow digesters are most
common in the treatment of animal wastes. Mixing of the digester contents
is indispensable when the manure feed easily forms deposits such as in poul
try and piggery wastes, or floating layers such as in straw-containing
dairy manure. Therefore, mixed digesters seem most appropiate for these
types of animal slurries. On the other hand manure with a more homogeneous
consistency can be succesfully treated in unmixed digesters of the plug-
flow type. Such a horizontal plug-flow type digester was originally intro
duced by Reinhold and Noack (1955) and has been applied later by Fry (1971)
and Hayes et al. (1980).
At the present retail energy prices and the total digestion running costs,
energy production from animal manure is estimated as economically feasible
in the Netherlands at a digester volume exceeding approx. 100 m3, treating
the wastes produced by 1300 fattening pigs or 100 dairy cows. Accounting
for the present Dutch governmental subsidies on the investment costs of di
gesters, i.e. 30 - 35%, the process becomes economically feasible at diges
ter volumes exceeding approx. 70 m3 (1000 pig units or 70 dairy cows). The
number of farms keeping such an amount of animals is rather limited. In or
der to make the process economically feasible for smaller farms there is a
need for simple, cheap and safe digester systems with a minimum demand for
energy. Moreover as the investment costs of gas storage systems are high
(Donne, 1980) it should be pursued that gas production coincides as much as
possible with its production.

\
77 -
6.2 FACTORS AFFECTING THE DIGESTION OF BIODEGRADABLE MATERIAL IN PIGGERY
WASTE
The digestion process can be considered as completed when the biodegra
dable fraction of the waste has been converted to methane. The biological
degradation already starts during the storage of the waste: on this stage
part of the solid material is converted to low-molecular weight compounds
such as VFA, phenol, p-cresol, 4-ethylphenol, indole and skatole. As these
compounds are hardly degraded further under the conditions prevailing in a
holding tank they will accumulate in the waste, thus contributing to its
malodour (Spoelstra, 1978). Upon subjecting stored piggery waste to methane
fermentation, the low-molecular compounds are converted to methane. In the
first instance this holds for those compounds, that can be utilized direct
ly by the methanogenic organisms. The elimination of these compounds, in
cluding hydrogen, provides thermodynamically favourable conditions for the
H2-producing acetogenic and fermentative bacteria, resulting in an effec
tive degradation of longer chain VFA and other fermentation products. How
ever, dependent on the stage of the digestion process, at the same time
low-molecular compounds may be formed from the complex biodegradable solids
still present in the stored waste. Therefore, the actual concentration of
these intermediates in the digester mixed liquor depends on their rate of
formation and degradation. For this reason the concentration of some speci
fic compounds in the digester effluent may be higher than in the influent.
This was so for some of the aromatic compounds, e.g. 4-ethylphenol, indole
and skatole, in the digestion of 9% TS piggery waste at detention times up
to 20 days and also in the digestion of 6% TS piggery waste at a 10-days
detention time. As VFA have been well eliminated under these conditions,
the degradation of the concerning aromatic compounds obviously proceeds
much less effective than that of the VFA. Nevertheless, microbial popula
tions present in digested piggery waste are capable of converting phenol
and p-cresol (Appendix) and presumably also other aromatic compounds to
methane. All malodorous compounds are effectively eliminated from a 6% TS
piggery waste when digested at a detention time of 15 days (loading rate 4
kg TS m 3 day 1). As both the reduction of malodorous compounds and the gas
production hardly increase with an increase in the detention time above 15
days, 6% TS piggery waste can be considered as well stabilized under these
circumstances.
Except from factors such as temperature, an effective digestion of the
biodegradable fraction depends on the environmental factors imposed by the
feed composition, such as the presence of buffering agents and the occur
rence of inhibitory or toxic compounds and process intermediates.
Piggery waste digesters are well buffered against changes in the pH main
ly as a result of the high ammonia nitrogen concentrations, viz. ranging
from 3000 - 5000 mg 1~' (215 - 360 meq l"1)- As ammonia nitrogen is present

r 78 -
mainly as bicarbonate a dramatic pH-fall below the critical value of pH 6
can hardly occur. Obviously, measurements of the digester-pH is not a prop
er way of controlling piggery waste digesters. Unfortunately ammonia ni
trogen affects the process stability also in a negative sense. Ammonia ni
trogen at concentrations in excess of approx. 1700 mg 1 1 is inhibitory ex
cept if the sludge has been allowed to acclimatize. During the adaptation
of unacclimatized sludge to high ammonia nitrogen concentrations, which may
last 8 - 1 0 weeks, the digestion process becomes slightly out of balance.
But also with sludge being well adapted to ammonia nitrogen concentrations
in excess of 1700 mg 1 _ 1 , the methane production from piggery wastes slight
ly decreases with increasing ammonia nitrogen concentrations in the range
1700 - 5000 mg 1 1 . According to McCarty and McKinney (1961) the ammonia
nitrogen inhibition is connected with the presence of undissociated ammonia.
As the fraction of undissociated ammonia sharply increases with temperature,
this may explain the poor results obtained in thermophilic digestion of
piggery waste.
Other potentially inhibitory compounds for the anaerobic digestion pro
cess that may occur in piggery wastes include feed additives, e.g. CuS04,
antibiotics and disinfectants. The toxicity of copper and other heavy met
als on anaerobic digestion seems to be mainly concerned with the free met-
alions. As a consequence the degree of toxicity of these compounds mainly
depends on the presence of complexing or precipitating anions. Investiga
tions of Lawrence and McCarty (1965) revealed that heavy metals, including
copper, are extremely toxic when added as chlorides, but not when added as
sulphates. According to Mosey et al. (1971) copper does not inhibit anaero
bic digestion processes at sulphide-ion concentrations in excess of 10 1 7 - 2
mol 1 1 . Therefore, when the digester feed contains sulphuric compounds
(sulphate, S-containing proteins) in excess, as is the case in piggery
wastes, very high copper concentrations are admissible. Antibiotics used in
animal production units may find their way into the wastes, but their ef
fect on the anaerobic digestion has not yet been ascertained properly. Dis
infectants in use for agricultural purposes generally contain compounds
like sodium hydroxide, sodium hypochloride and formalin. As these means are
used incidentally they will be greatly diluted in the manure collection and
storage system. Because of this dilution and because of the rapid decompo
sition of chemically active compounds in anaerobic environments, disinfec
tants in general will not occur any more in significant amounts in the di
gester influent.
In the present study any incomprehensible process inhibition has never
been observed, despite the fact that the manure used in the laboratory ex
periments originated from different farms and the 6-m3 digester has been
continuously fed with the wastes from one pig housing unit for more than
1.5 year. Nevertheless, antibiotics and/or disinfectants, if present in the
wastes, might have influenced the process but never significantly.

79
6.3 USE OF DIGESTER RESIDUES AS A FERTILIZER
The value of organic slurries for fertilizing purposes depends mainly on
their mineral content, especially that of N, P and K. Of these elements on
ly nitrogen occurs in a form that it may be lost with the gas during anae
robic digestion, viz. as ammonia nitrogen. Analyses made in pilot-plant
studies with piggery wastes (v. Velsen, 1979) have shown that the nitrogen
content remains almost unchanged at ammonia nitrogen concentrations below
2100 mg l"1 . However, at a concentration of 5000 mg l"1 the N-losses were
about 11%, mainly due to the higher pH of such solutions.
Field studies on the fertilizing properties of digested residues of in
tensive animal keeping units are scarce. Some investigations made with di
gested and undigested slurries on grassland demonstrated little differences
in yield (Summers et al., 1980). Moreover, in this study indications were
obtained that the use of digested slurry affects the soil structure in a
positive way as compared to the use of untreated slurry.
6.4 APPLICATION OF ANAEROBIC DIGESTION IN PIGGERY WASTE PURIFICATION PLANTS
In view of the problems involved in the production of excess amounts of
animal manure in certain regions of Western Europe, a complete purification
of these wastes should be taken into consideration at present. Anaerobic
digestion as a first step provides a means to achieve a substantial reduc
tion of carboneous material. This can be even improved by the application
of a proper (pre)treatment of the solid fraction, either before or after
digestion. Therefore, in these cases a (pre)treatment of animal wastes may
be attractive.
However, as anaerobic digestion is uncapable of producing effluents that
can be discharged on the surface water, the method should be followed by a
proper post-treatment. Since animal wastes are high in valuable constituents,
such as N and P, such a post-treatment should aim at a recovery of these
minerals.
A proper post-treatment system, as shown in Fig. 6.2 might include sludge
dewatering, supply of lime to rise the pH (precipitation of P ) , followed by
a combined strip/absorption process for removal and recovery of ammonia,
and as a last step a physico/chemical treatment of the remaining liquid
fraction. Because of the high investment costs and the complexicity of the
technologies involved, such a complete treatment of animal wastes can be
practised only in large-scale, centralized plants treating the wastes of
50 000 or more pig units.

- 80
methane gas
ANAEROBIC
DIGESTION
Ca(OH)2
* SETTLING SETTLING
DEWATERING
sludge 2 0 % TS.
* 15% o1 the manure •
volume
concentrated ammonium-salt
solution t
N H 3 - stripping and
NH3-absorption
aerobic or physical/chemical
t reatment
final eff luent
Fig. 6.2 Proposed scheme for complete purification of animal waste

81 -
APPENDIX
PRELIMINARY RESEARCH INTO THE ANAEROBIC DECOMPOSITION OF PHENOL AND p-CRESOL A.1 INTRODUCTION
In the digestion of piggery waste at loading rates of 4 kg TS m~3 day"1
and lower, the concentration of the odorous aromatic compounds phenol, p-
cresol, 4-ethylphenol, indole and skatole is considerably reduced as has
been shown in Chapters 3, 4 and 5. Since the presence of these compounds in
anaerobically stored pig slurries results from the microbial breakdown of
proteins (Spoelstra, 1978), these aromatics will presumably be formed upon
anaerobic storage of most other protein-rich wastes. Aromatics also occur
in the effluents of coal gasinfication plants, oil refineries and other
chemical industries.
In comparison to the aerobic degradation of aromatics relatively little
is known about the degradation under anaerobic conditions. However, the
fate of aromatic compounds in methane digestion gets more and more atten
tion not only because of their possible inhibitory effects on the digestion
process but also to assess the potential energy production from aromatic
material such as lignin, which is the most abundant organic carbon source
in the world after cellulose.
Lin Chou et al. (1978) investigated the toxicity of nine aromatic com
pounds (benzoic acid, phtalic acid, ethyl benzene, aniline, hydroquinone,
phenol, catechol, nitrobenzene and resorcinol) to unacclimated methane fer
mentation systems. Except phtalic acid all these aromatics were found toxic
to some degree. The inhibitory level of phenol appeared to be approx. 470
mg 1 1 . Pearson et al. (1980) studied the toxicity of phenol under shock
loading and reported a 50% reduction in sludge activity at a dose of 500 mg
1 1 . According to Neufeld et al. (1980) the non-methanogenic anaerobic phe
nol decomposition is inhibited by phenol at concentration levels in excess
of 686 mg l"1.
The degradation of aromatics during methane fermentation has been inves
tigated in detail only in the case of benzoic acid. Tarvin and Buswell
(1934), Fina and Fiskin (1960), Nottingham and Hungate (1969), Keith (1972)
and Ferry and Wolfe (1976) all demonstrated the conversion of benzoic acid
to methane and carbon dioxide. Keith (1972) and Ferry and Wolfe (1976) sug
gested from sequential induction experiments that benzoate is degraded by a
reductive pathway. A similar reductive pathway has been shown to occur in
the anaerobic benzoate degradation during photosynthetic metabolism (Dutton
and Evans, 1969) and nitrate respiration (Williams and Evans, 1973; Bakker,
1977). Ferry and Wolfe (1976) further presented evidence that benzoate is
converted to methane by a microbial food chain in which the removal of in
termediates, such as acetate and hydrogen, by the methanogenic bacteria

82 -
provides thermodynamically favourable conditions for the benzoate degrada
tion. Chmielowski et al. (1965, 1965, 1966) performed kinetic studies on
the anaerobic decomposition of phenol, p-cresol and resorcinol in batch ex
periments with 100 mg 1 1 of the respective phenolic compounds. Mixed bac
terial populations gave complete conversion of these phenolics to methane
and carbon dioxide. These investigators further reported that during fer
mentation some unidentified intermediates having the nature of satured com
pounds temporarily accumulated. The degradation of phenol by methanogenic
populations has also been reported by Healy and Young (1978), Lin Chou et
al. (1978) and Pearson et al. (1980).
Other aromatics reported to be degradable under methanogenic conditions
include catechol (Healy and Young, 1978; Lin Chou et al., 1978), nitroben
zene, phtalic acid, hydroquinone, resorcinol (Lin Chou et al., 1978) and
ferulic acid, a model lignin derivate (Healy et al,, 1980).
The experiments described in this Appendix concern the elimination of
phenol and p-cresol by mixed methanogenic populations. The study was per
formed to obtain a better understanding of the elimination mechanism of
these aromatics in anaerobic digestion.
A. 2 PROCEDURES
The degradation of phenol and p-cresol was investigated in four 5-litre
glass fermentors (Section 2.3.1). The digestion units were seeded with 4
litres of a 1:1 mixture of well-digested piggery waste and tap water. The
TS and VS content in the experimental units at the start of the experiments
were 22.3 g 1 * and 15.1 g l 1 , respectively. After seeding nitrogen gas
was passed through the digester contents to assure anaerobic conditions.
Because of the poor solubility of phenol and p-cresol in water the follow
ing feeding procedure has been applied. The feed components were dissolved
in as little water as possible. Immediately after adding the feed-solution
to the digester and subsequent mixing of the digester contents a sample was
taken to determine the initial feed concentration.
Four series of batch experiments, designated as A, B, C and D were per
formed. In series A the reactor was fed 5 successive times with about 400
mg 1 x phenol as the only carbon source. During the degradation of phenol
in the fifth feeding 410 mg l"1 p-cresol was added.
In series B the reactor was fed 5 successive times with about 400 mg 1 *
p-cresol. During the degradation of p-cresol in the fifth feeding 404 mg
1 * phenol was supplied.
In series C the reactor was fed 2 successive times with a mixture of
phenol and p-cresol, each at a concentration of about 400 mg 1 1.
In series D the first feeding consisted of a mixture of phenol, p-cresol
and acetic acid, each at a concentration of about 400 mg 1_1. In the second
feeding only phenol and p-cresol were added.

83 -
A.3 RESULTS
The result of the series A experiments are shown graphically in Fig. A.l
viz. the concentration of phenol and acetic acid in relation to the time.
phenol cone, (mg I"1) p-cresol cone.(mg I"1) HAc cone.(mg l~1)
500
400-
300
200-
100
A A p-cresol o o pheno! x x HAc
p-cresol
Fig. A.l Course of the digestion process in experimental series A, fed 5 successive times with phenol as the only carbon source. During the last feeding p-cresol is added.
Due to a leakage in the gas system, the gas production in this experi
mental series has not been determined. Fig. A.l shows that phenol is elimi
nated under the prevailing anaerobic conditions, although a lag phase of
4-8 days occurred in the first two feedings. In the course of the succes
sive feedings the maximum elimination rate of phenol increased from 2.4 mg
g"1 VS day"1 in the first feeding to 14.3 mg g"1 VS day"1 in the fifth
feeding. However, this was not a gradual increase because the phenol elimi
nation rate in the second feeding is significantly lower than that in the
first feeding. In all feedings acetic acid appeared in the digester mixed
liquor indicating that this compounds acts as an intermediate in the phenol
degradation. The addition of 410 mg 1 * p-cresol during the degradation of
phenol in the fifth feeding did not influence the phenol degradation. How-

- 84
ever, p-cresol was not eliminated in the first 7 days after feeding, indi
cating that the phenol adapted population is unable to metabolize p-cresol
immediately.
cumulative gasproduction (ml lr ) phenol cone, (mg I -1 ) p -cresol (mg I-1) HAc cone. ( mg I -1 )
5 0 0
400
300
200
100 -
A — A A A A A ^
-oe:
/ /
16 24 32
gasproduction o o phenol A A p-cresol x x HAc
phenol
*i r
t i me (days)
Fig. A.2 Course of the d iges t ion process in experimental s e r i e s B, fed 5 successive times with p -cresol as the only carbon source. During the f i f th feeding phenol i s added. *
Fig. A.2 shows the results of experimental series B, viz. the course of
the gas production and that of the p-cresol, phenol and acetic concentra
tion. In the f irst feeding the p-cresol elimination started after a lag
phase of 4 days, resulting in a sharp drop in the p-cresol concentration
from 425 mg 1_1 at day 4 to 280 mg l~x at day 7. However, the p-cresol e l i
mination during this period was not accompanied with a gas production but
with a certain accumulation of acetic acid and phenol in the digester mixed
liquor. The concentration of these intermediates is too low to account ful
ly for the decrease in the p-cresol concentration. From day 7 to day 16 the
concentration of p-cresol and that of the intermediates remained unchanged,
but beyond day 16 p-cresol was degraded further and now i t was accompanied
with an evident gas production. At the five successive feedings the maximum
elimination rate of p-cresol tended to increase from 1.9 mg g 1 VS day ' i n

35 -
the first feeding to 3.7 mg g 1 VS day 1 in the fifth feeding. The results
of the fifth feeding of series B, when 404 mg 1 1 phenol was added during
the degradation of p-cresol, indicate that phenol is degraded immediately
and at a rate comparable to that of the p-cresol degradation. The methane
content of the gas in this series ranged from 87% to 89%.
cumulative gasproduction (ml IF1).
phenol; p-cresol; HAc _ Q (mg I"1).
800-
6 0 0
4 0 0
2 0 0
200-
gasproduction o o phenol Û A p-cresol x x HAc
50 t ime(days)
Fig. A.3 Course of the digestion process in the first feeding of experimental series C, fed with phenol and p-cresol.
The experimental results of the first feeding in series C, consisting of
443 mg 1 * phenol and 400 mg 1 ' p-cresol are shown in Fig. A.3. In compar
ing the results with those in Fig. A. 2, it appears that the elimination of
both phenol and p-cresol resembles that of the p-cresol elimination found
in the first feeding of experimental series B, fed exclusively with p-
cresol. After an initial lag phase of 4 days the concentration of both com
pounds decreased from day 4 to day 7, then followed by a period of retarded
digestion. Only approx. 35 days after incubation a further degradation of
phenol and p-cresol occurred. In the second feeding, consisting of 455 mg
1 ' phenol and 456 ig 1 ' p-cresol, both compounds were eliminated within

86
17 days at an almost linear rate. The methane content of the gas was 92%
and 94% respectively.
cumulative gasproduction (ml IF1)
phenol ; p-cresol; H Ac
o _ o _ <m9 l_1)
8 0 0
6 0 0
4 0 0
2 0 0
gasproduction o o phenol Û A p-cresol x x H Ac
40 time(days)
Fig. A.4 Course of the digestion process in the f i rs t feeding of experimental series D, fed with phenol, p-cresol and acetic acid.
The exper imenta l r e s u l t s of t h e f i r s t f eeding i n s e r i e s D, c o n s i s t i n g of pheno l , p - c r e s o l and a c e t i c a c id each a t a c o n c en t r a t i on of approx. 400 mg 1 1 a r e shown i n F i g . A .4 . F ig . A.4 shows t h a t a f t e r a 4-days i n i t i a l l ag phase a c e t i c a c id was r a p i d l y conver ted i n t o methane w i t h in 10 days whereas t h e e l i m i n a t i o n of bo th a romat ic compounds resembled t h a t observed i n s e r i e s C (F ig . A . 3 ) . However, p - c r e s o l and phenol now were degraded w i t h in 40 days which i s c on s i de r ab ly f a s t e r t han i n s e r i e s C, where t he d eg rada t i on took 50 days . Although t h e m i c rob i a l p opu l a t i on was wel l adapted t o t he de g r ada t i on of a c e t i c a c i d , t h i s i n t e rmed i a t e accumulated i n t he d i g e s t e r mixed l i q u o r whenever t h e p - c r e s o l or phenol d eg rada t i on reached i t s maximum r a t e . In t h e second f eed ing , c o n s i s t i n g of 375 mg l " 1 phenol and 338 mg 1 1 p - c r e s o l , phenol and p - c r e s o l were degraded w i t h in 9 days a t an a lmost l i n e a r r a t e . The methane c on t en t of t he gas amounted t o 86% i n bo th feedings .

87
In all experiments described in this Chapter the pH was in the range
6.8-7.2.
A.4 DISCUSSION
The reduction of phenol, p-cresol and other odorous compounds as found
during the anaerobic digestion of piggery wastes (Chapters 3, 4 and 5) may
be the result of one of the following mechanisms: (a) volatilization, (b)
incorporation of these compounds in cell proteins or (c) microbial degrada
tion.
Considering the experimental results presented in this Appendix, showing
production of methane in experiments where phenol and p-cresol were supplied
as the only carbon source, it is evident that microbial degradation is the
main mechanism for the phenol and p-cresol elimination under the prevailing
methanogenic conditions and not the incorporation of the compounds in cell
proteins. Also the ability of the microbial populations to adapt to the
aromatic compounds points to a microbial degradation.
In all experiments the degradation of phenol and p-cresol is accompanied
with a temporary increase in the acetic acid concentration in the digester
contents. Evidently acetic acid is an intermediate in the conversion of
these aromatics to methane, which is conform the observations of Ferry and
Wolfe (1976) who reported that acetic acid is an intermediate in the con
version of benzoate to methane. The appearance of phenol in the first feed
ing of series B, fed with p-cresol as the only carbon source, may indicate
that phenol is an intermediate in the p-cresol degradation (Fig. A.2). This
idea is supported by the observation that p-cresol adapted sludge is also
adapted to phenol, as clearly appears from the results of the fifth feeding
in series B. On the other hand the phenol adapted sludge is not capable to
degrade p-cresol immediately (Fig. A.l). Apparently, a demethylation is the
first step in the p-cresol degradation under methanogenic conditions. Such
a degradation route of p-cresol deviates from the pathway suggested by
Bakker (1977) for the microbial degradation of p-cresol in nitrate respira
tion, involving a decomposition route leading to 4-ethylcaproic acid. Never
theless, it seems quite reasonable that under methanogenic conditions a de
methylation of compounds like p-cresol can take place because methanogenic
organisms are capable to convert methylgroups directly to methane. The ex
perimental results, however, do not allow to draw any conclusion concerning
the mechanism of the p-cresol demethylation and the fate of the methylgroup.
For this purpose labelling experiments should be performed.
As the concentration of acetic acid and phenol during the period before
stagnation in the first feeding of series B, C and D is too low to account
fully for the decrease in the concentration of the feed compounds, the accu
mulation of other, unidentified intermediates is plausible. This corresponds
with the findings of Chmielowski et al. (1965, 1965, 1966) who reported

- 88
about an accumulation of some intermediates having the nature of saturated
compounds, during the anaerobic fermentation of phenol, p-cresol and resor-
cinol. Ferry and Wolfe (1976) reported that apart from acetic acid also
carbon dioxide, hydrogen and formic acid were intermediates in the benzoate
degradation under methanogenic conditions. The appearance of process inter
mediates during the degradation of phenol and p-cresol indicates that these
aromatics are degraded by a microbial consortium and not by a single organ
ism as has been suggested by Nottingham and Hungate (1969) for the methano
genic fermentation of benzoate.
The course of the phenol and p-cresol elimination in the first feeding
differs from one experimental series to another. In all cases the elimina
tion, even that of acetic acid, starts after a lag phase of 4-5 days. This
indicates that it takes some time before the conditions in the experimental
units are suitable for anaerobic conversions.
After the lag phase the phenol concentration in series A decreased al
most linearly (Fig. A.l), whereas in series B, C and D the elimination of
phenol and p-cresol is characterized by the occurrence of a period of stag
nated elimination. (Figs. A.2, A.3 and A.4). The reduction in the phenol
and p-cresol concentration before the stagnation reveals the ability of the
microbial population to assimilate these aromatics. Furthermore, phenol and
p-cresol are partially degraded in this period as appears from the accumu
lation of process intermediates.
The stagnation in the elimination of phenol and p-cresol may be attri
buted to a retarded methanogenesis. As the methanogenic organisms serve as
terminal organisms of a food chain producing methane from intermediates for
med during the degradation of aromatic compounds (Ferry and Wolfe, 1976),the
accumulation of intermediates may create thermodynamically unfavourable
conditions for a further degradation of phenol and p-cresol. The lag phase
in the methane formation occurring in the present experiments may be caused
either by unfavourable environmental conditions, e.g. the redox potential
and/or the presence of unidentified inhibitory intermediates, or by a dis-
rupture of micro-environments in the methanogenic seed sludge during the
start-up procedure. Micro-environments are supposed to play an important
role in the interspecies H2 transfer. De Zeeuw et al. (1980) recently sug
gested that the formation of micro-environments is part of the adaptation
process of methanogenic populations to propionic acid. Ferry and Wolfe
(1976) reported that the benzoate degradation under methanogenic conditions
ceased if the bacterial floe was disrupted by vortexing, which also points
to the importance of micro-environments in the degradation of aromatics.
Another explanation for the differences in the course of the phenol eli
mination between series A and that in series C and D might be found in a
temporary inhibition of one of the metabolic stages in the phenol and p-
cresol degradation by some intermediate accumulating during the p-cresol
degradation, because a stagnation in the phenol and p-cresol elimination
only occurs when the feed contains p-cresol (series B, C and D ) . However,

- 89
p-cresol itself does not affect the phenol degradation by adapted sludge as
appears from the results of the last experiment of series A.
The results of the present experiments do not allow to be certain of the
reasons underlying the discrepancies between the results of the first feed
ing of experimental series A and those of the other series.
The addition of acetate, a substrate suitable for methanogenic bacteria,
in series D does shorten the period of stagnated elimination occurring in
the phenol and p-cresol degradation (compare with the results of series C).
Evidently, the conversion of acetate at the start of the experiment creates
more favourable conditions for the degradation of phenol and p-cresol.

90 -
SUMMARY
Anaerobic digestion is a biological process by which organic matter is
converted to methane and carbon dioxide by microbes in the absence of air
(oxygen). In nature, anaerobic conversions occur at all places where organ
ic material accumulates and the supply of oxygen is deficient, e.g. in marsh
es and lake sediments. Microbial formation of methane also plays a role in
the ruminant digestion.
In digestion units, the external conditions acting upon the process can
be regulated to speed it up as compared with that occurring in nature. More
over, the gas produced can be collected and used as a fuel. In this way,
anaerobic digestion for waste treatment allows us to reduce the concentra
tion of polluting organic substances and produce useful energy. So there is
increasing interest in anaerobic digestion, especially as fossil energy
threatens to give out and people are concerned about environmental pollu
tion.
By the end of the 19th Century, anaerobic digestion was used to stabi
lize excess sewage sludge. The process was also utilized for energy produc
tion from agricultural wastes (manure, straw) whenever fossil energy was in
short supply, e.g. during and shortly after World War II in France, Algeria
and Germany. However, after the War energy from digestion of agricultural
wastes could not compete with cheap fossil energy and direct interest in
the process diminished. The main objectives of using digestion for disposal
of animal manure are the abatement of malodour nuisance and the recovery of
energy from wastes. The change-over from traditional animal husbandry to
intensive systems has resulted in the production of large amounts of manure
in certain regions of Western Europe. Disposal of the manure creates severe
environmental pollution.
The wastes produced in intensive animal production often consist of com
bined droppings: faeces, urine and spillage water. During storage of the
slurry, low-molecular malodorous compounds such as volatile fatty acids,
phenol, p-cresol, 4-ethylphenol, indole and skatole are formed by microbial
activity (Spoelstra, 1978). The spreading of these slurries often causes
malodour nuisance, especially in more densely populated areas. Upon subject
ing the wastes to anaerobic digestion under controlled conditions, most of
the biologically degradable material is converted to methane, thus produc
ing a stabilized residue without offensive odour. Any malodorous compounds
given out during digestion form components of the digester gas and will not
lead to malodour nuisance in the surroundings unless the gas be discharged
unburned.
The gas produced is an useful fuel either for heating or for combustion
engines, e.g. to generate electricity. Farms with a high energy consumption
can largely cover their farm needs with the gas produced. Examples are pig
and poultry breeding units and dairies. However, in spite of the favourable
prospects on individual farms, manure digestion can play only a minor role

91
in the national energy supply, since the maximum production is about 1% of
present energy consumption.
According to present knowledge of the microbiology and biochemistry of
anaerobic digestion (Zeikus, 1980; Mclnerney et al., 1980) the conversion
of complex organic material to methane results from the activity of at
least 4 distinct trophic groups of bacteria: fermentative bacteria, hydro
gen-producing acetogenic bacteria, methanogenic bacteria and hydrogen-con
suming acetogenic bacteria. As a result of the interaction between the con
tributing groups, anaerobic digestion as a whole is a stable process.
However, the classification of the microbial population does not provide
an adequate method of analysing the course of the digestion process in prac
tice. So a simplified scheme was proposed, based on routine chemical anal
ysis. In the scheme, anaerobic digestion was split up into three steps: (1)
hydrolysis of undissolved compounds, (2) acid formation from dissolved or
ganic compounds and (3) methane formation. The course of these separate
steps of the digestion process can be estimated from routine data, such as
the gas production, gas composition, Chemical Oxygen Demand and volatile
fatty acids (Chapter 1).
The feasibility of anaerobic digestion processes depends on the availa
bility of a suitable seed material.«In Chapter 3 experiments are described
on the influence of organic loading rate, in the range 0.07 - 0.125 kg COD
kg 1 VS day 1, on the adaptation of digested sewage sludge to piggery was
te. Digested sewage sludge was a fairly suitable seed material, since meth
ane formation started immediately after adding piggery waste. However, all
experiments were characterized by a period of imbalance, which might be at
tributable to an inhibition of the methanogens by ammonia nitrogen at con
centrations over about 1700 mg l"1. In a period of 2-3 months, dependent on
the loading rate, the methanogenic population was adapted to these concen
trations of ammonia nitrogen. The adapted populations were also capable of
forming methane at far higher ammonia nitrogen concentrations, viz. up to
5000 mg 1 1 . The idea that methanogenesis was temporarily inhibited by am
monia nitrogen was supported by the results of two series of batch-type ex
periments, on the digestion of volatile fatty acids by two types of metha
nogenic sludge, viz. digested sewage sludge and digested piggery waste, at
increasing ammonia nitrogen concentrations. In the experiment with digested
sewage sludge adapted to 815 mg 1 ' ammonia nitrogen, methane formation oc
curred at all ammonia nitrogen concentrations investigated (in the range
730 - 4990 mg 1 1), but an increasing lag phase was observed at increasing
concentrations. This was not so for the experiment with digested piggery
waste adapted to 2420 mg 1 x ammonia nitrogen. Here the methane formation
started immediately without any significant lag phase for the propionic
acid degradation. The maximum rate of methane formation slowly decreased
with increasing ammonia nitrogen concentrations. Daily fed experiments

92 -
with piggery waste (loading rate 4.1 kg TS m 3 day 1) demonstrated success
ful digestion at all ammonia nitrogen concentrations imposed, viz. 2070,
3670 and 5290 mgl" 1 . The gas production only slightly decreased with in
creasing ammonia nitrogen concentration.
From the combined results it appears that the presumed inhibitory effect
of ammonia nitrogen concentrations in excess of approx. 1700 mg 1 ' is only
temporary. Consequently the use of anaerobic digestion may also be consid
ered for wastes having a N-content far exceeding this level.
Chapter 4 deals with the influence of the piggery waste concentration
and the detention time on the digestion at a temperature of 30°C. At all
manure concentrations (4%, 6% and 9% TS) and detention times investigated
(in the range 10 - 40 days) a stable digestion could be achieved and main
tained except with 9% TS manure at a 10-days detention time (space load
approx. 9 kg TS m~3 day"1)- At fixed detention times an increase in the man
ure concentration effected a decrease in both the gas yield per kg TS added
and the reduction of malodorous compounds. The gas production improves sig
nificantly in increasing the detention time from 10 days to 15 days, but
beyond a 15-days detention time there is only a slight further increase.
Although a stable digestion could be maintained at space loads up to 6 kg
IS i 3 day 1, the maximum load for a satisfactory reduction of objection
able piggery waste odours was about 4 kg TS m 3 day ', provided this load
ing rate was achieved by digesting 6% TS piggery waste at a 15-days deten
tion time and not by digesting 9% TS manure at a 22.5-days detention time.
The experimental results further indicate that hydrolysis is the rate-limit
ing step in the digestion of piggery wastes.
Experiments concerning the effect of temperature in the range 13°C -
55°C on the digestion of piggery waste are described in Chapter 5. The ex
periments were performed in daily fed laboratory digesters at a loading
rate of approx. 4 kg TS m~3 day"1 . No methane was produced at a digestion
temperature of 13°C, but an active methane fermentation took place at 20°C.
In the mesophilic temperature range (20°C - 40°C) the methane production
increased sharply with temperature in the range 20°C - 25°C, but in the
range 25 - 40 C there was only a slight further increase. Hydrolysis of un
dissolved manure components turned out to be the rate-limiting step of the
digestion process.
Under thermophilic conditions (55°C) the methane production decreased by
about 25% as compared to mesophilic digestion, in spite of a somewhat high
er degree of hydrolysis. Digestion under thermophilic conditions seems to
be more sensitive to high ammonia nitrogen concentrations than mesophilic
digestion, which presumably is caused by an increase in the fraction of free
ammonia with temperature (at constant pH and total ammoniacal nitrogen con
centration) .

- 93
From the results it can be concluded that digestion under mesophilic
conditions is most adequate for piggery waste stabilization. Furthermore
the results of the mesophilic experiments indicated that at a load of ap-
prox. 4 kg TS m"3 day"1 the optimum temperature with respect ot the net
energy recovery is 27°C - 30°C when high-grade fuel is required to elevate
the temperature. When sufficient waste energy is available the process pre
ferentially should be conducted at a temperature of 35°C - 40°C.
Chapter 6 contains a general discussion on the application of the anae
robic digestion process and provides information about the features of pig
gery waste as a substrate for anaerobic digestion. Items discussed include
the biodegradability, the degree of stabilization, the process stability
and the economical feasibility of the process. Data are provided which de
monstrate that the gas production from piggery wastes can be increased by
petreating the wastes. However, in view of the accompanying consumption of
energy and/or chemicals it is doubtful whether or not these pretreatment
methods are effective in increasing the net energy production.
The Appendix deals with preliminary batch-type experiments on the elimi
nation of two aromatic malodorous compounds, viz. phenol and p-cresol, in
anaerobic digestion. The results demonstrate that both these compounds are
converted into methane by the microbial population in piggery waste digest
ers. Furthermore indications were obtained that phenol is an intermediate
in the p-cresol degradation and that the first step in the microbial break
down of p-cresol apparently is a demethylation of p-cresol to phenol.

- 94 -
SAMENVATTING
Anaërobe gisting is een microbiologisch proces, waarbij dood organisch
materiaal in een zuurstofloos milieu wordt omgezet in een gasmengsel, dat
voornamelijk bestaat uit methaan (60 - 75%) en koolzuur, het z.g. biogas.
In de natuur komt het anaërobe mineralisatieproces voor op plaatsen waar
zich organisch materiaal ophoopt en de toevoer van luchtzuurstof stagneert,
b.v. in moerassen en bodemsedimenten van meren en plassen. Ook bij de spijs
vertering van herkauwers speelt methaangisting een belangrijke rol.
In gistingsinstallaties vindt het anaërobe proces plaats onder controleer
bare omstandigheden, als gevolg waarvan de omzettingen sneller kunnen ver
lopen dan doorgaans in de natuur het geval is. Bovendien wordt het gevormde
gas opgevangen en als brandstof gebruikt. Wanneer anaërobe gisting wordt
toegepast voor de behandeling van afvalprodukten biedt het proces de moge
lijkheid de verwerking van afval te combineren met de produktie van ener
gie. Gezien de dreigende schaarste aan fossiele brandstoffen en de huidige
zorg voor het milieu is het niet verwonderlijk, dat er een groeiende belang
stelling is voor de toepassing van anaërobe gisting voor de behandeling van
afval en afvalwater.
Methaangisting wordt reeds vanaf het eind van de vorige eeuw toegepast
voor de stabilisatie (=stankvrij maken) van surplus-slib, gevormd bij de
aërobe zuivering van huishoudelijk afvalwater. In landen als Duitsland,
Frankrijk en Algerije is het proces ook toegepast voor de produktie van
energie uit landbouwafval tijdens en vlak na de tweede wereldoorlog, toen
de energievoorziening stagneerde. In de na-oorlogse periode is de belang
stelling voor het anaërobe gistingsproces als energie-opwekkingsmethode ech
ter weer afgenomen als gevolg van de lage prijzen van fossiele brandstoffen.
De belangrijkste argumenten voor de toepassing van mestvergisting zijn
momenteel de reductie van meststank en de produktie van energie. Door de
opkomst van de intensieve veehouderij worden er plaatselijk en regionaal
grote hoeveelheden mest geproduceerd. In een aantal streken van ons land,
waar veel intensieve veehouderij wordt bedreven, zoals de Veluwe en Oost-
Brabant, heeft dit geleid tot de produktie van mestoverschotten. Het dumpen
van deze mest betekent een ernstige aantasting van het milieu.
In de intensieve veehouderij wordt de geproduceerde mest meestal verza
meld onder de stallen te zamen met de urine en het spoelwater, de z.g. drijf-
mest. Bij de opslag van drijfmest worden stankstoffen, zoals vluchtige vet
zuren, fenol, p-cresol, ethylfenol, indol en skatol, gevormd als gevolg van
microbiologische omzettingen (Spoelstra, 1978). Het uitrijden van de aan-
gerotte mest geeft dikwijls aanleiding tot stankoverlast, vooral in dicht
bevolkte gebieden. Bij vergisting van de mest worden de organische stoffen
die aanleiding geven tot stank, of waaruit stankstoffen kunnen worden ge
vormd, grotendeels verwijderd en omgezet in gas.

95 -
Het gevormde gas is een uitstekende brandstof, zowel voor verwarming als
voor het aandrijven van motoren, b.v. electriciteitsopwekking met warmte
krachtkoppeling. Afhankelijk van het bedrij fstype en de bedrij fsgrootte
kunnen veehouderijbedrijven met het geproduceerde gas voor een belangrijk
gedeelte in hun eigen energiebehoefte voorzien. Landelijk gezien is de po
tentiële energieproduktie uit mest echter gering, nl. ongeveer 1% van de
nationale consumptie van primaire energie.
Naast de bovengenoemde aspecten wordt in hoofdstuk 1 verder ingegaan op
de microbiologische en biochemische achtergronden van de methaangisting.
Naar de meest recente inzichten (Zeikus, 1980; Mclnerney et al., 1980) spe
len bij de omzetting van complexe organische stof tot methaan vier verschil
lende groepen micro-organismen een rol, nl. fermentatieve bacteriën, re
producerende acetogene bacteriën, methanogene bacteriën en H2-consumerende
acetogene bacteriën. De stofwisseling van deze groepen van bacteriën grijpt
op elkaar in als gevolg waarvan anaërobe gisting'als geheel een stabiel
I proces is. In de praktijk kan het verloop van het gistingsproces echter
niet of slechts met zeer veel moeite worden beschreven aan de hand van de
aanwezige microbiologische populatie. Daarom is een vereenvoudigd schema
opgesteld, waarmee het procesverloop kwantitatief kan worden beschreven aan
de hand van chemische routine analyses. In dit schema wordt de vergisting
van complex organisch materiaal ingedeeld in 3 stappen, nl. (1) de omzet
ting van onopgelost materiaal in oplosbare bestanddelen, (2) de vorming van
vluchtige vetzuren uit de opgeloste bestanddelen en (3) de vorming van me
thaan.
In hoofdstuk 2 is een overzicht gegeven van de experimentele opstelling
en en de gebruikte methodes.
Een belangrijk aspect voor de toepassing van het proces is het opstarten
van gistingsinstallaties. In hoofdstuk 3 is de invloed beschreven van de
belasting op de adaptatie van rioolslijk aan varkensdrijfmest. Voor dit on
derzoek werd een aantal vergisters gevuld met rioolslijk en dagelijks ge
voed met varkensdrijfmest bij belastingen variërend van 0,07 tot 0,125 kg
CZV kg"1 org. stof dag"1. Rioolslijk bleek een geschikt entmateriaal. On
middellijk na voeding met varkensdrijfmest kwam de methaanproduktie op gang.
Na verloop van tijd raakte het proces in alle vergisters echter uit balans.
Dit kan worden toegeschreven aan een remming van de methaanvormende bacte
riën door ammoniumstikstof, aangezien het proces in alle experimenten wordt
verstoord wanneer de ammoniumstikstof-concentratie een waarde van ongeveer
1700 mg 1~' overschrijdt. Volgens McCarty en McKinney (1961) is de remmende
werking van ammoniumstikstof bij deze en hogere concentraties het gevolg
van een te hoge concentratie aan ongedissocieerd ammonia. Het slib adapteert
evenwel na 2 tot 3 maand (afhankelijk van de toegepaste belasting) aan deze
ammoniumstikstof-concentraties. Na de adaptatieperiode bleek het slib in

96 -
staat tot methaanvorming bij aanzienlijke hogere ammoniumstikstof-concentra-
ties, nl. tot ca. 5000 mg l"1.
De aanwijzing dat de methaangisting gedurende de opstartperiode tijde
lijk werd geremd door de toename van de ammoniumstikstof-concentratie werd
bevestigd door de resultaten van twee series ladingsgewijze gevoede experi
menten. In deze experimenten is de invloed onderzocht van toenemende ammo-
niumstikstof-concentraties op de methaanvorming uit vluchtige vetzuren door
rioolslijk en vergiste varkensdrijfmest. Het bleek dat rioolslijk geadap
teerd aan een ammoniumstikstof-concentratie van 815 mg 1 1 methaan produ
ceerde bij alle onderzochte ammoniumstikstof-concentraties (tussen 730 en
4990 mg 1 1), maar dat de methaanvorming pas begon na een lag-fase. De lag-
fase duurde langer bij toenemende ammoniumstikstof-concentraties. Vergiste
varkensdrijfmest geadapteerd aan een ammoniumstikstof-concentratie van 2420
mg 1 1 daarentegen was in staat onmiddellijk na incubatie methaan te vormen
bij alle onderzochte ammoniumstikstof-concentraties (tussen 605 en 3075 mg
1 1 ) . De maximale methaanvormingssnelheid nam af bij toenemende ammonium
stikstof-concentraties .
Uit de resultaten van dagelijks gevoede experimenten (belasting 4,1 kg
DS m 3 dag 1; temperatuur 30°C) naar de invloed van ammoniumstikstof in con
centraties van 2070, 3760 en 5290 mg l"1 op de vergisting van varkensdrijf-
mest bleek, dat bij alle ammoniumstikstof-concentraties de vergisting goed
verliep, maar dat de gasproduktie enigszins afnam bij toenemende ammonium
stikstof-concentraties .
De resultaten van de experimenten beschreven in hoofdstuk 3 tonen aan
dat de vermeende remmende werking van ammoniumstikstof boven een concentra
tie van ca. 1700 mg l"1 slechts tijdelijk is en dat afvalstromen met aan
zienlijk hogere stikstofgehaltes met succes kunnen worden vergist.
In hoofdstuk 4 zijn een aantal experimenten beschreven die tot doel had
den de invloed vast te stellen van de verblijftijd en de mestconcentratie
op de vergisting bij 30°C. Bij alle onderzochte mestconcentraties, nl. 4%,
6% en 9% droge stof, en verblijftijden, tussen 10 en 40 dagen, stelde zich
een stabiel gistingsproces in, behalve bij het experiment waarin mest met
een droge stofgehalte van 9% werd gevoed bij een verblijftijd van 10 dagen
(belasting 9 kg DS m 3 dag 1 ). De methaanproduktie in deze experimenten
varieerde van 0,141 tot 0,207 1 kg"1 toegevoerde drogestof. In het algemeen
nam bij gelijke verblijftijden de gasproduktie per kg toegevoerde drogestof
en de reductie van stankcomponenten af bij een verhoging van de mestconcen
tratie. Bij eenzelfde mestconcentratie nam de gasproduktie sterk toe bij
een verlenging van de verblijftijd van 10 tot 15 dagen. Bij verblijftijden
boven 15 dagen nam de gasproduktie per kg toegevoerde droge stof en de re
ductie van stankcomponenten nauwelijks toe.
Alhoewel de vergisting nog goed verloopt bij een belasting van 6 kg DS
m 3 dag x bleek de optimale belasting met betrekking tot de stankreductie

- 97
en de energieproduktie ongeveer 4 kg DS m 3 dag * te zijn, althans wanneer
deze belasting wordt verkregen door mest met een droge stof gehalte van 6%
te vergisten bij een verblijftijd van 15 dagen. Uit de experimenten bleek
verder, dat de hydrolyse van onopgeloste mestbestanddelen de beperkende
stap is in het gistingsproces.
In hoofdstuk 5 wordt aandacht besteed aan de invloed van de temperatuur
op het gistingsproces. Dagelijks gevoede vergisters werden bedreven bij een
belasting van ca. 4 kg DS m~3 dag"1 en bij temperaturen variërend van 13°C
tot 55°C. Bij een temperatuur van 13°C werd er geen gas gevormd. In het me-
sofiele temperatuurgebied (20 - 40°C) nam de gasproduktie toe met de tem
peratuur, vooral bij een verhoging van de temperatuur van 20°C naar 25°C.
In het gebied van 25°C tot 40°C was de invloed van de temperatuur minder
groot: de gasproduktie nam lineair toe met ongeveer 1% per graad tempera-
tuurverhoging. Onder thermofiele omstandigheden (55°C) was de methaanpro-
duktie ca 25% lager dan bij 35°C, alhoewel meer onopgeloste mestbestandde
len werden gehydrolyseerd. Het bleek dat thermofiele vergisting gevoeliger
is voor hoge ammoniumstikstof-concentraties dan mesofiele vergisting, wat
waarschijnlijk toegeschreven moet worden aan een toename van de concentra
tie aan ongedissocieerd ammonia bij toenemende temperatuur (bij constante
pH en totale ammoniumstikstof-concentratie).
De resultaten van deze experimenten geven aan dat mesofiele vergisting
het meest geschikt is voor de behandeling van varkensdrijfmest. De optimale
vergistingstemperatuur met betrekking tot de produktie aan netto-energie
(geproduceerde energie minus de energie gebruikt voor verwarming van de
mest) is 27 - 30°C wanneer hoogwaardige brandstof, b.v. biogas, aardgas of
olie, wordt gebruikt om de vergistingsinstallatie op de gewenste tempera
tuur te houden en 35 - 40°C wanneer voldoende afvalwarmte, b.v. koelwater,
beschikbaar is.
In de algemene discussie (hoofdstuk 6) wordt een aantal aspecten van de
vergisting van varkensdrijfmest besproken, zoals de variaties in de gaspro
duktie onder vergelijkbare procesomstandigheden, de mate van stabilisatie
van de mest na vergisting en de stabiliteit van het proces. Verder wordt op
basis van de verkregen resultaten aangegeven, dat de gasproduktie uit var
kensdri j fmest kan worden verhoogd door een voorbehandeling van de mest. Ge
zien de energieconsumptie van dergelijke bewerkingen valt het echter te be
twijfelen of de extra gasproduktie voldoende is om het energieverbruik van
de voorbehandeling te compenseren.
In de appendix zijn een aantal voorlopige experimenten beschreven, die
er op waren gericht inzicht te krijgen in de eliminatie van twee aromatische
stankcomponenten, nl. fenol en p-cresol, tijdens het gistingsproces. De re
sultaten van deze experimenten geven aan dat fenol en p-cresol door vergis-

- 98 -
te varkensdrijfmest kunnen worden omgezet in methaan. Verder zijn er duide
lijke aanwijzingen verkregen dat fenol een tussenprodukt is bij de vergis
ting van p-cresol. Hieruit kan worden afgeleid dat demethylering van p-
cresol tot fenol waarschijnlijk de eerste stap is bij de vergisting van p-
cresol.

99 -
REFERENCES
Akin D.E., 1980. Attack of lignified grass cell walls by a facultatively anaerobic bacterium. Appl. and Environ. Microbiol. 40, 809.
Albertson O.E., 1961. Ammonia nitrogen and the anaerobic environment. J. Water Pollut. Control Fed. 33, 978.
American Public Health Association, 1965. Standard methods of water and sewage analysis, 12th edition.
Baader W. , Dohne E. and Brenndorfer M., 1978. Biogas in Theorie und Praxis. KTBL-Schrift no. 229, KTBL-Schriftenvertrieb im Landwirtschaftsverlag, Hiltrup.
Badger D.M., Bogue M.J. and Stewart D.J., 1979. Biogas production from crops and organic wastes. New Zealand J. Sei. 22, 11.
Bakker G., 1977. Degradation of aromatic compounds by micro-organisms in dissimilatory nitrate reduction. Thesis, Delft.
Balch W.E., Fox G.E., Magrum L.J., Woese C.R. and Wolfe R.S., 1979. Methanogens: réévaluation of a unique biological group. Microbiol. Rev. 43, 260.
Beek W.J., 1976. In: Voedsel voor allen, plaats en rol van de EEG. Stichting Toekomstbeeld der Techniek 20, 81.
Braun M., Schoberth S. and Gottschall G., 1979. Enumeration of bacteria forming acetate from H2 and C02 in anerobic habitats. Arch. Microbiol. 120, 201.
Bryant M.P., Wolin E.A., Wolin M.J. and Wolfe R.S., 1967. Methanobacterium omelanskii: a symbiotic association of two species of bacteria. Arch. Microbiol. 59, 20.
Buhr H.O. and Andrews J.F., 1977. The thermophilic anaerobic digestion process. Water Res. 1], 129.
Bull A.T., 1972. Environmental factors influencing the synthesis and excretion of exo-cellular macromolecules. In: Environmental Control of Cell Synthesis and Function, Academic Press, London.
Chmielowski J. and Wasilewski W. , 1965. A study on the dynamics of anaerobic decomposition of some phenols in methane fermentation. Zesz. Nauk. Politech. Slaska Inz. 8, 95.
Chmielowski J., 1965- Biochemical degradation of some phenols during methane fermentation. Zesz. Nauk. Politech. Slaska. Inz. 8, 97.
Chmielowski J. and Kusznik W. , 1966. Methane fermentation of some phenolic wastewaters. Zesz. Nauk. Politech. Slaska. Inz., 9.
Converse J.C., Evans G.W., Verhoeven C R . , Gibbon W. and Gibbon M., 1977. Performance of a large size anaerobic digester for poultry manure. ASAE paper No 77-0451.
Converse J.C., Graves R.E. and Evans G.W., 1977. Anaerobic degradation of dairy manure under mesophilic and termophilic temperatures. Transactions of the ASAE 20, 336.
Crawford D.L., 1974. Cellulase production and growth characteristics of Thermomonospora fusca on cellulose and lignocellulose. Univ. Microfilms Ann. Arbor Michigan. Order no. 73 - 32, 110. Diss. Abstr. Int. B 34, 4814.
Dammers J., 1964. Verteringsstudies bij het varken. Thesis, Leuven. Davy H., 1814. Elemente der Agrikulturchemie. Uebers v. F. Wolff, pag. 345. Berlin. Dean A.C.R., 1972. Influence of environment on the control of enzyme synthesis. In: En
vironmental Control of Cell Synthesis and Function, Academic Press, London. Demain A.L., 1972. Cellular and environmental factors affecting the synthesis and excre
tion of metabolites. In: Environmental Control of Cell Synthesis and Function, Academic Press, London.
Detroy R.W., Lindenfelser L.A., St. Julian G. and Orton W.L., 1980. Saccharification of wheat-straw cellulose by enzymatic hydrolysis following fermentative and chemical pre-treatment. Biotechnol. Bioeng. Symp. No. 10, 135.
Dickinson C.H. and Pugh G.J.F. (eds), 1974. Biology of plant litter decomposition. Vol. 1 and 2. Academic Press, New-York - London.
Dohne E., 1980. Biogas storage and utilisation. In: Anaerobic Digestion. Applied Science Publisher Ltd. London.
Dubaquie J., 1943. Le gaz de fumier. Compte-rendu de l'Académie d'Agriculture de France, séance de 1 dec. 1943.
Dutton P.L. and Evans W.C., 1969. The metabolism of aromatic compounds by Rhodopseudo-monas palustris. Biochem. J. 113, 525.
Fair G.M. and Moore E.W., 1932. Heat and energy relations in the digestion of sewage solids III. Sewage Works J. 4, 589.
Ferry J.G. and Wolfe R.S., 1976. Anaerobic degradation of benzoate to methane by a microbial consortium. Arch. Microbiol. 107, 33.
Fina L.R. and Fiskin A.M., 1960. Theanaerobic decomposition of benzoic acid during methane fermentation II. Fate of carbons one and seven. Arch. Biochem. Biophys. 91, 163.

- 100
Fisher J.R., Sievers D.M. and Fulhage C D - , 1975. Anaerobic digestion in swine wastes. In: Energy, Agriculture and Waste Management. Ann Arbor Science, Ann Arbor, Michigan 48106.
Fisher J.R., Ianotti E.L., Porter J.H. and Garcia A., 1977. Producing methane gas from swine manure in a pilot-size digester. ASAE Paper No. MC77-604 (March).
Fisher J.R., Meador N.F., Sievers D.M., Fulhage C D . and Ianotti E.L., 1977. Design and operation of a farm-size anaerobic digester for swine. ASAE Paper No. 77-4052 (June).
Fry J.L., 1971. Practical building of methane power plants. Standard Printing, Santa Barbara, California.
Garber W.F., Ohara G.T., Colbaugh J.E. and Raksit S.K., 1975. Thermophilic digestion at the Hyperion treatment plant. J. Water Pollut. Control Fed. 47, 950.
Ginnivan M.J., Woods J.L. and O'Callaghan J.R., 1977. Thermophilic fermentation of pig faeces and straw by actinomycetes. J. Appl. Bacteriol. 43, 231.
Golueke C.G., 1958. Temperature effects on anaerobic digestion of raw sewage sludge. Sewage ind. Wastes 30, 1225.
Gottschall W. and Morse J.G., 1978. The effect of gamma radiation on yields of methane gas from the anaerobic bacterial digestion of sewage sludges. Symp. Energy from Bio-mass and Wastes, Washington DC, August.
Gramms L.C., Polkowski L.B. and Witzel S.A., 1971. Anaerobic digestion of farm animal wastes. Trans. Am. Soc. Eng. 14, 7.
Haga K., Tanaka H. and Higaki S., 1979. Methane production from animal wastes and its prospects in Japan. Agric. Wastes 1, 45.
Harper R., Bate Smith E.C. and Land D.G., 1968. Odour description and odour classification. J & A. Churchill Ltd., London.
Hart S.A., 1963. Digestion tests of livestock wastes. J. Water Pollut. Control Fed. 35, 748.
Hashimoto A.G. and Chen Y.R., 1980. The overall economics of anaerobic digestion. In: Anaerobic Digestion. Applied Science Publishers Ltd., London.
Hatfield W.D., Symons G.E. and Mills R.R., 1928. Gases from sewage sludge digestion. Ind. Eng. Chem. 20, 174.
Haug R.T., Stuckey, D.C. , Gösset J.M. and McCarty P.L., 1978. Effect of thermal pretreat-ment on digestibility and dewaterability of organic sludges. J. Water Pollut. Control Fed. 50, 73.
Hayes T.D., Jewell W.J., Dell'Orto S., Fanfoni K.J., Leuschner A.P. and Sherman D.F. , 1980. Anaerobic digestion of cattle manure. In: Anaerobic Digestion. Applied Science Publishers Ltd., London.
Healy J.B. Jr. and Young L.Y., 1978. Catechol and phenol degradation by a methanogenic population of bacteria. Appl. Environ. Microbiol. 35, 216.
Healy J.B. Jr., Young L.Y. and Reinhard M., 1980. Methanogenic decomposition of ferulic acid, a model lignin derivate. Appl. Environ. Microbiol. 39, 436.
Heukelekian H. , 1930. Further studies on thermophilic digestion of sewage solids. Sewage Works J., 2, 219.
Heukelekian H. and Kaplovsky A.J., 1948. Effect of change of temperature on thermophilic digestion. Sewage Works J. 20, 806.
Hobson P.N. and Shaw B.G., 1973. The anaerobic digestion of wastes from an intensive pig unit. Water Res. 7, 437.
Hobson P.N., Bousfield S. and Summers R. , 1974. Anaerobic digestion of organic matter. CRC Crit. Rev. Environ. Control 4, 131.
Hobson P.N. and Shaw B.G., 1974. The bacterial population of piggery waste digesters. Water Res. 8, 507.
Hobson P.N. and Shaw B.G., 1976. Inhibition of methane production by Methanobacterium formicicum. Water Res. 10, 849.
Hobson P.N., Bousfield S., Summers R. and Mills P.J., 1979. Anaerobic digestion of farm animal wastes. In: Engineering Problems with Effluents from Livestock. ECSC-EEC-EAEC, Brussels-Luxembourg. Eur 6249 EN.
Hobson P.N., Bousfield S. and Summers R., 1980. Anaerobic digestion of piggery and poultry wastes. In: Anaerobic Digestion. Applied Science Publishers Ltd., London.
Hodge J.E. and Hofreiter B.T., 1962. Determination of reducing sugars and carbohydrates. In: Methods in Carbohydrate Chemistry Vol. I. Analysis and Preparation of Sugars. Academic Press, New York - London.
Hoek K.W. van der, 1977. Odour control in liquid swine manure by aeration. Proc. Seminar on Odour Characterization and Odour Control. Agric. and Environ. 3.
Hutchinson T.H., 1972. Methane farming in Kenia. Compost Sei. 13, 30. Imhoff K., 1936. Temperature and sludge digestion. Techn. Gemeindebl. 39, 162. Jeffrey E.A., Blackman W.C. and Ricketts R.L., 1964. Aerobic and anaerobic digestion
characteristics of livestock wastes. Eng. Ser. Bull. No. 57, Univ. of Missouri, Columbia, Missouri.

101 -
Keith C L . , 1973. Intermediates in the anaerobic metabolism of benzoic acid. Diss. Abstr. 33, 7.
Kelsey R.G. and Shafizadeh F., 1980. Enhancement of cellulose accessibility and enzymatic hydrolysis by simultaneous wet milling. Biotechnol. and Bioeng. XXII, 1025.
Kirsch E.J., 1969. Studies on the enumeration and isolation of obligately anaerobic bacteria from digesting sewage sludge. Dev. Ind. Microbiol. 10, 170.
Kroeker E.J., Lapp H.M. and Schulte D.D., 1975. Cold weather energy recovery from anaerobic digestion of swine manure. In: Energy, Agriculture and Waste Management. Ann. Arbor Science, Ann. Arbor, Michigan 48106.
Kroeker E.J., Lapp H.M., Schulte D.D., Haliburton J.D. and Sparling A.B., 1976. Methane production from animal wastes II. Process stability. CSAE Paper No. 76-208.
Landbouwcijfers, 1980. CBS/LEI. Lapp H.M., Schulte D.D., Kroeker E.J., Sparling A.B. and Topnik B.H., 1975. Start-up of
pilot scale swine manure digesters for methane production. In: Managing Livestock Wastes. ASEA publication PROC-275, 234.
Lapp H.M., Sparling A.B., Schulte D.D. and Buchanan L.C., 1975. Methane production from animal wastes. I. Fundamental considerations. Can. agric. Eng. 17, 97.
Lawrence A.W. and McCarty P.L., 1965. The role of sulphide in preventing heavy metal toxicity in anaerobic treatment. J. Water Pollut. Control Fed. 37, 392.
Le Figaro, 1884. Un drôle éclairage. 5 mars. Lettinga G., 1979. Direct anaerobic treatment handles wastes effectively. Ind. Wastes 25,
18. Lettinga G., Velsen A.F.M, van, Hobma S.W., Zeeuw W. de and Klapwijk A., 1980. Use of the
upflow sludge blanket (USB) reactor concept for biological wastewater treatment, especially for anerobic treatment. Biotechnol. Bioeng. XXII, 699.
Liebman H. (ed), 1956. Muenchener Beitraege zu Abwasser-, Fischerei- und Flussbiolgie, bd. 3. Gewinnung und Verwertung von Methan aus Klaerschlamm und Mist. Muenchen.
Lin Chou W. , Speece R.E., Siddiqi R.H. and McKeon K., 1978. The effect of petrochemical structure on methane fermentation toxicity. Prog. Water Technol. 10, 545.
Loehr R.C., 1969. Animal wastes - A national problem. J. sanit. Eng. Div. Am. Soc. agric. Eng. 95, No. SA2, 189.
Mah R.A. and Sussman L. , 1968. Microbiology of anaerobic sludge fermentation. I. Enumeration of the non-methanogenic anaerobic bacteria. Appl. Microbiol. 16, 358.
Mah R.A., Ward D.M., Baresi L. and Glass T.L., 1977. Biogenesis of methane. A. Rev. Microbiol. 31, 309.
Maki L.W., 1954. Experiments on the microbiology of cellulose decomposition in a municipal sewage plant. Anthonie van Leeuwenhoek 20, 185.
Malina J.F. Jr., 1961. The effect of temperature on high-rate digestion of activated sludge. Proc. 16th ind. Waste Conf. (Purdue Univ.), 232.
Maly J. and Fadrus H., 1971. Influence of temperature on anaerobic digestion. J. Water Pollut. Control Fed. 43, 641.
McCarty P.L. and McKinney R.E., 1961. Salt toxicity in anaerobic digestion. J. Water Pollut. Control Fed. 33, 399.
McCarty P.L., 1964. Anaerobic waste treatment fundamentals, Part I, II, III and IV. Public Works 95, no. 9, 10, 11 and 12.
McCarty P.L., Young L.Y., Gösset J.M., Stuckey D.C. and Healy J.B., 1976. Heat treatment for increasing methane yields from organic materials. In: Microbial Energy Conversion. Erich Goltze KG. Göttingen, Germany.
McCarty P.L., Young L.Y., Healy J.B. Jr., Owen W.F. and Stuckey D . C , 1978. Thermochemi-cal treatment of lignocellulosic and nitrogenous residuals for increasing anaerobic biodegradability. 2nd Annual Symp. on Fuels from Biomass, Troy, New York (June).
Mclnerney M.J., Bryant M.P. and Stafford D.A., 1980. Metabolic stages and energetics of microbial anaerobic digestion. In. Anaerobic Digestion. Applied Science Publishers Ltd., London.
Melbinger N.R. and Donnellon J., 1971. Toxic effects of ammonia nitrogen in high-rate digestion. J. Water Pollut. Control Fed. 43, 1658.
Mills P.J., 1979. Minimisation of energy input requirements of an anaerobic digester. Agric. Wastes 1, 57.
Miner J.R. and Smith J.R. (eds), 1975. Livestock waste management with pollution control. North Central Regional Publication 222. Midwest Plan Service Handbook MWPS-19, 83.
Mosey F., Swanwick J.D. and Hughes D.A., 1971. Factors affecting the availability of heavy metals to inhibit anaerobic digestion. J. Inst. Water Pollut. Control 70, 668.
Nesse N., Wallick J. and Harper J.M., 1977. Pretreatment of cellulosic wastes to increase enzyme reactivity. Biotechnol. Bioeng. XIX, 323.
Neufeld R.D., Mack J.D. and Strakey J.P., 1980. Anaerobic phenol biokinetics. J. Water Pollut. Control Fed. 52, 2367.

102
Ng T.K. , Wiener P.J. and Zeikus J.G., 1977. Cellulolytic and physiological properties of Clostridium thermocellum. Arch. Microbiol. 114, 1.
Ngian M.F., Ngian K.F., Lin S.H. and Pearce G.R., 1977. Biogasification using NaOH treat, pig faeces. J. Environ. Eng. Div. 103, EE6, 1131.
Nota Energiebeleid, 1979. Tweede kamer zitting 1979-1980. No. 15 802. Nottingham P.M. and Hungate R.E., 1969. Methanogenic fermentation of benzoate. J. Bacte-
riol. 98, 1170. Ohwaki K. and Hungate R.E. , 1977. Hydrogen utilization by Clostridia in sewage sludge
Appl. Environ. Microbiol. 33, 1270. Partington J.R., 1960. A short history of chemistry. 3rd edition, London. Pearson F., Shiun-Chung C. and Gautier M., 1980. Toxic inhibition of anaerobic biodégra
dation. J. Water Pollut. Control Fed. 52, 472. Pfeffer J.T., 1974. Temperature effects on anaerobic fermentation of domestic refuse.
Biotechnol. Bioeng. XVI, 771. Pfeffer J.T. and Khan K.A., 1976. Microbial production of methane from municipal refuse.
Biotechnol. Bioeng. XVIII, 1179. Pohland F.G. and Bloodgood D.E., 1963. Laboratory studies on mesophilic and thermophilic
anaerobic sludge digestion. J. Water Pollut. Control Fed. 35, 11. Priestley J., 1790. Experiments and observations on different kinds of air. Vol. I, 206.
Birmingham. Prins. R.A. and Lankhorst A-, 1977. Synthesis of acetate from C02 in the cecum of some
rodents. FEMS Microbiology Letters 1, 255. Pyle D.L., 1980. Anaerobic digester design in the third world. In: Anaerobic Digestion.
Applied Science Publishers Ltd., London. Reinhold D. and Noack W., 1955. Biogas in der Landwirtschaft. Eisner, Darmstadt. Rudolfs W. , 1927. Effect of temperature on sewage sludge digestion. Ind. Eng. Chem. 19,
241. Schaefer J., Bemelmans J.M.H. and Ten Oever de Brauw M.C., 1974. Onderzoek naar de voor
de stank van varkensmesterij en verantwoordelij ke componenten, Landbouwkd. Tijdschr. 86, 228.
Schaefer J., 1977. Sampling, characterization and analysis of malodours. Agric. Environ. 3, 121.
Schmid L.A. and Ripper R.I., 1969. Swine wastes, characterization and anaerobic digestion. In: Animal Waste Management. Proc. Cornell Univ. Conf. agric. Waste Management.
Singh R.B., 1972. Building a bio-gas plant. Compost Sei. 13, 12. Somogyi M., 1952. Notes on sugar determination. J. Biol. Chem. 195, 19. Speece R.E. and Kem J.A., 1970. The effect of short-term temperature variations on me
thane production. J. Water Pollut. Control Fed. 42, 1990. Spoelstra S.F., 1978. Microbial aspects of the formation of malodorous compounds in anae-
robically stored piggery wastes. Thesis, Wageningen. Stevens M.A. and Schulte D.D., 1979. Low temperature digestion of swine manure. J. Environ
Eng. Div. 105, no. EE5, 33. Stuckey D.C. and McCarty P.L., 1978. Thermochemical pretreatment of nitrogenous materials
to increase methane yield. Biotechnol. Bioeng. Symp. No. 8, 219. Summers R. and Bousfield S., 1976. Practical aspects of anaerobic digestion. Process Bio-
chem. (June), 3-6. Summers R., Bousfield S. and Hobson P.N., 1980. Uses and analyses of digested sludge. In:
Anaerobic Digestion. Applied Science Publishers Ltd., London. Taiganides E.P., Baumann E.R., Johnson H.P. and Hazen T.E., 1963. Anaerobic digestion of
hog wastes. J. agric. Eng. Res. 8, 327. Tarvin D. and Buswell A.M., 1934. The methane fermentation of organic acids and carbohy
drates. J. Am. Chem. Soc. 56, 1751. Tietjen C , 1975. From biodung to biogas - Hystorical review of european experience. In:
Energy, Agriculture and Waste Management. Ann. Arbor Science Publishers Inc., Ann. Arbor, Michigan 48106.
Toerien D.F. and Siebert M.F., 1967. A method for enumeration and cultivation of anaerobic acid forming bacteria present in digesting sludge. Water Res. 1, 397.
Velsen A.F.M. van, 1979. Anaerobic digestion of piggery wastes. In: Engineering Problems with Effluents from Livestock. ECSC-EEC-EAEC, Brussels-Luxembourg, EUR 6249 EN.
Voorburg J.H., 1978. Stankbestrijding bij de intensieve veehouderij, pt-p 33, 665. Weast R.C. (ed.) 1972. Handbook of chemistry and physics. 45th edition. CRC Press, West
Palm Beach, Florida. Welsh F.W., Schulte D.D., Kroeker E.J. and Lapp H.M., 1977. The effect of anaerobic di
gestion upon swine manure odors. Canadian agric. Eng. 19, 122. Williams R.J. and Evans W.C., 1973. Anaerobic metabolism of aromatic substrates by cer
tain micro-organisms. Biochem. Soc. Trans. 1, 186.

103
Wit W. de, 1980. Utilization of cellulose and hemicellulose of pig faeces by Trichoderma viride. Thesis, Veenman & zonen, Wageningen.
Young J.C. and McCarty P.L., 1969. The anaerobic filter for waste treatment. J. Water Pollut. Control Fed. 41, R 160.
Zeeuw W. de and Lettinga G., 1980. Acclimation of digested sewage sludge during start-up of an upflow anaerobic sludge blanket (UASB) reactor. Paper presented at the 35th Purdue Industrial Waste Conf. (May), Lafayette, Indiana.
Zeikus J.G., 1980. Microbial populations in digesters. In: Anaerobic Digestion. Applied Science Publishers Ltd., London.

CURRICULUM VITAE
De auteur werd op 1 januari 1948 geboren te Zwolle. Na het behalen in 1966
van het diploma gymnasium ß aan het Thomas a Kempislyceum te Zwolle, werd
in datzelfde jaar begonnen met de studie in de richting Waterzuivering aan
de Landbouwhogeschool te Wageningen. Het doctoraalexamen, afgelegd in 1973,
omvatte de vakken waterzuivering (hoofdvak), algemene microbiologie (ver
zwaard) en natuurbeheer en -behoud. In 1975 was hij als onderzoeker werk
zaam bij het CIVO-TNO te Zeist. Van 1976 tot 1979 was hij als gastmedewer
ker werkzaam bij de vakgroep Waterzuivering van de Landbouwhogeschool. In
mei 1979 werd een functie aanvaard als wetenschappelijk medewerker bij de
vakgroep Waterzuivering van genoemde hogeschool.
Copyright © 2022 FDOKUMEN