Bio-silage of mussel work-processing wastes by lactobacilli on semi-solid culture

53
This study was conducted by research fund supported by the Agricultural R&D center (ARPC). The article was submitted for publication on 2010-01-04, reviewed on 2010-01-27, and approved for publication by editorial board of KSAM on 2010-02-09. The author are Sang Hun Kim, Professor, and Gopi Krishna Kafle, Graduate Student, Dept. of Biosystems Engineering, Kangwon National University, Chuncheon, Korea. Corres-ponding author: S. H. Kim, Professor, Dept. of Biosystems Engineering, Kangwon National University, Chuncheon Gangwon-Do, 200-701, Korea;Tel: +82-33-250-6492; Fax: +82-33-255-6406; E-mail <[email protected]>.
돈분과 배추사일리지를 이용한 2조 혐기소화의 효과적인 처리
김상헌 Gopi Krishna Kafle
Effective Treatment of Swine Manure with Chinese Cabbage Silage through
Two Serial Anaerobic Digestion
S. H. Kim G. K. Kafle
The performance of two serial completely stirred tank reactors (CSTRs) for treatment of swine manure (SM) with Chinese cabbage silage (CCS) was studied. The two CSTRs of 41 liters each were connected in series and first reactor was fed swine manure with Chinese cabbage silage in 3:1 proportion by VS basis. The FOS/TAC, methane content (%) and pH were utilized as the parameters for the digester stability control. The FOS/TAC value was found to be effective indicator for instant digester condition. The stability of reactors can be obtained with the FOS/TAC value up to 1.0 with accumulation of FOS value below 10,000 mg/L. Material exchange method was effective in transferring the excess volatile fatty acids (VFA) from the first reactor to the second one and maintaining stability in both the reactors. The biogas yield and the methane yield was 0.55-0.61 and 0.41-0.42 L/g VS fed, respectively, at organic loading rate (OLR) of 2.2-2.6 g VS/L with total HRT of 32 days.
Keywords : Anaerobic digestion, Biogas, Swine manure, Chinese cabbage silage, CSTR, Serial digestion
1. INTRODUCTION
Swine farm is growing rapidly in Korea and there is a problem of waste disposal and treatment. Swine manure treat-ment by anaerobic process could be most effective way of animal waste management (Zhang et al., 1997). In Korea the total annual production of Chinese cabbage is approximately three million tons, and its value is estimated at 10 million dollars. It is estimated that up to 30% of the total production, approximately one million tons, is discarded as waste (Choi and Park, 2003). Chinese cabbage waste is produced during harvest, transport, and at the wholesale markets. Large amo-unts of waste are also generated from Kimchi factories during the trimming process. Sometimes, cabbages are abandoned in
the field, due to overproduction and an inefficient marketing system. Since cabbage waste contains more than 92% of water and decomposes readily, many unpleasant environmental con-sequences arise when it is abandoned in fields or near fac-tories. There is major limitation of anaerobic digestion of fruits and vegetable waste because there will be rapid acidification of these wastes causing to decrease pH in the reactor, and a larger volatile fatty acids production, which stresses and inhi-bits the activity of methanogenic bacteria (Misi and Foster, 2001; Bouallagui et al., 2005). In co-digestion of plant mate-rials and animal manure, animal manures provide buffering capacity and various nutrients, while plant material provides high carbon contents. So co-digestion of manure and plant materials will decrease the risk of ammonia inhibition (Ha-
바이오시스템공학 (J. of Biosystems Eng.)Vol. 35, No. 1, pp.53~63 (2010. 2)

돈분과 배추사일리지를 이용한 2조 혐기소화의 효과적인 처리
54
shimoto, 1983; Hills and Roberts, 1981). So utilizing the Chi-nese cabbage waste with swine manure for biogas production can be one of the appropriate solutions of organic waste treat-ment.
Conventional single CSTR is simple to operate but less efficient in terms of effluent quality compared to other reac-tors (Azbar et al., 2001; Speece et al., 1997). From the study it has been seen that the serial digestion could produce 13-17.8 % more biogas and methane with an optimal volume distri-bution of 70/30% or 50/50% and also contained low VFA and residual methane potential loss in effluent compared to the single CSTR-process (Kaparaju et al., 2009). The excess acid in the main digester can be transferred to the next digester and maintain the stability of the reactors. The results from organic pulse load test showed that the second reactor in serial CSTRs helped utilizing VFA produced from overlo-ading in the first reactor, which improved the effluent quality and conversion efficiency of the serial CSTR (Boe and An-gelilidaki, 2009). Organic acids, pH and alkalinity are related parameters that influence digester performance (McCarty, 1964; WPCF, 1987). The ratio of volatile organic acids to alkaline buffer capacity is a measure of the risk of acidification of biogas plant and is recognized as a guide value for assessing fermentation processes. It enables process problems exten-ding as far as the imminent inversion of the digester biology to be detected at an early stage, so that countermeasures can be initiated (Lossie and Pütz, 2008). The suitable FOS/TAC value for a particular reactor can be determined through its long time observations (Rieger and Weiland, 2006). There is a linear relationship between alkalinity and ammonia, up to pH of 7.5 and the VFA concentrations are also linear with acid (Kepp et al., 2001). This indicates that the VFA concen-trations and alkalinity ratio is valid as an indicator of diges-ter control up to pH of 7.5.
The main objective of this study was to evaluate the per-formance of the serial CSTRs for the swine manure (SM) mixed with Chinese cabbage silage (CCS), and to determine the de-sign parameters of organic loading rate, hydraulic retention time, ratio of VFA and alkalinity (FOS/TAC).
2. MATERIAL AND METHODS
A. Feed Collection and Preparation.
The compressed Chinese cabbage waste with moisture con-tent of about 82-85% (TS=15-18% and VS=10-13%) was
obtained from the Kimchi factory. To make silage, the ca-bbage was packed in plastic bags with air tight condition and kept in 36-38℃ chamber for 3-4 months. The swine manure was obtained from the swine farm and kept in a 20 liter plastic bucket. Testing manure was kept in tank with mixer and was mixed completely every morning and midnight before feeding. Also before feeding, the manure was diluted to required moi-sture content to maintain the organic loading rate. The silage was pulverized by blender and packed in small plastic bags for daily feed and stored in a freezer. Every midnight the silage bags were taken to biogas reactor chamber and cont-rolled the temperature of them for feeding. Lehtomäki et al. (2007) suggested that co-digestion of manure and crops could be feasible up to 40% of crops, and Baltrenas et al. (2008) found that hen manure to fruits and vegetables ratio of 75:25 was most efficient in terms of gas yield. Also Kaparaju and Rintala (2005) suggested potato material up to 15-20% showed better performance for co-digestion of potato with manure. On the basis of above discussed results, swine manure and Chinese cabbage silage were taken in a ratio of 3:1 based on VS contents. Characteristics of feed are listed in Table 1.
Table 1 Average composition of Chinese cabbage silage (CCS), swine manure (SM) and mixed feed (MF) of CCS and SM
Particulars SM CCS MF(3:1 g VS basis)
TS (%) 3.3-9.5 13.2-15.9 4.3-9.5
VS (%) 2.13-7.1 8.45-11.24 3.0-6.9
PH 6.9-7.2 5-6 6.43-7.16
NH3-N (mg/L) 3,620-5,813 NA 3,067-6,413
TVFA (FOS) mg/L 13,091-29,202 NA 11,329-22,798
Alkalinity (TAC) mg/L 5,035-10,070 NA 4,196-10,489
FOS/TAC 1.7-2.9 NA 1.6-2.7
TCODcr (mg/L) 52,027-150,853 120,000-140,000 52,960-109,760
SCOD (mg/L) NA NA 31,467-44,800
NA – Not in Account
B. Process Set up and Operation
In this system feeding, discharging, temperature control, pH and ORP measurements were done by automatic system. The temperature in first reactor R1 and second reactor R2 were maintained 36-38℃ by circulation of hot water around the circumference of each reactor (using hot water circulation pump). Gas collections and measurements for reactor R1 were

J. of Biosystems Eng. Vol. 35, No. 1.
55
done by gas collector made by plastic tube and reactor R2 were done using Gas meter (Ritter-German, 50 L/h). Both the reactors were provided with two mechanical stirrers at top and bottom of each reactor for completely mixing of materials inside reactors. In reactor R1 the silage was fed using screw feeder and the swine manure using peristaltic pump twice a day. The material in each reactor was completely mixed using mechanical stirrers (fixed on top and bottom of each reactor) operating 15 minutes every hour. The arrangement for exchan-ge of two reactor’s digesting material of reactor R1 and R2 was also provided. The schematic drawing and picture of two serial CSTRs are shown in Fig. 1.
(a) Schematic drawing of two serial CSTRs
(b) Picture of two serial CSTRs
Fig. 1 Arrangement of two serial CSTRs.
C. Analytical Methods
TS, VS (APHA, 1998), pH (HANNA instruments, WOON-SOCKET, RI 02895), Gas composition (GEOTEC GAS ME-TER, Biogas- Geotechnical Instruments, UK Ltd.), TCOD (Clo-sed Reflux, Titrimetric Method), NH3-N (HACH-1992), FOS/TAC (Nordmann-titration method), were measured during test period. For FOS/TAC determination sample were centrifu-ged for 20 minutes at 4000 rpm and then 5ml was taken in
beaker and added 30 ml de-ionized water. The sample was then titrated using 0.1N H2SO4.
D. Experimental Designs
1) Calibration of FOS and TAC
FOS was calibrated with acetate (CH3COOH) and TAC with calcium carbonate (CaCO3). For calibration of FOS value, the acetate from 500 mg to 20,000 mg was diluted with 1,000 mL de-ionized water containing 30,000mg/L of CaCO3 and was titrated with O.1 N H2SO4 for determining FOS value using Titrator DL15 (Mettler Toledo). For calibration of TAC value the de-ionised water with CaCO3 concentration from 500-20,000 mg/L was taken and titrated similarly as determining FOS value.
2) Digester stability and overall gas productions at
different OLR and HRT
The first reactor (R1) was fed with various OLR from 2.2 to 8.3 g VS/L and at specific period was tested from high to low concentrated feed (OLR from 4.33 to 2.2 g VS/L). And also sudden high OLR (4.8, 5.3, 8.3 g VS/L) was applied for the effects on stability and gas production of the reactor.
3) FOS/TAC based stability
FOS stands for Flüchtige Organische Säuren (i.e. volatile organic acid) and TAC stands for Totales Anorganisches Car-bonat (i.e. total inorganic carbonate, alkaline buffer capacity) (Lossie and Pütz, 2008; Rieger and Weiland, 2006). FOS and TAC were calculated by using empirical equations (Nordmann method).
FOS = [((Con B – Con A) x 20ml /EF x 1.66) – 0.15] x 500 [mg/L acetate] (1)
TAC = Con A x 250 x 20 ml /EF [mg/L CaCO3] (2)
Where,Con A= mL of 0.1 N H2SO4 consumed by sample
to reach 5.0 pH value.Con B= mL of 0.1 N H2SO4 consumed by sample
to reach 4.4 pH value.EF = extracted fluid volume (sample volume)
Based on the measured value of the FOS and TAC, their

돈분과 배추사일리지를 이용한 2조 혐기소화의 효과적인 처리
56
effects on digester stability, the biogas yield, and methane yield was evaluated according to the various OLR. Also the sudden increase of OLR was tested to determine the patterns of FOS and TAC change. The effect on pH value was also observed.
4) Material exchange effect
The serial digestions were performed with and without material exchange method and its effect on gas production, CH4%, FOS/TAC and pH was studied. For the material ex-change effect reactor material was transferred from reactor R1 to reactor R2 and reactor R2 to reactor R1 based on reac-tor volume of 6.5 to 13%. Material exchange method was used twice a day regularly when the system was unstable.
E. Results of FOS and TAC Calibration.
Nordmann method was used to investigate the FOS and TAC equivalent to acetate and calcium carbonate respecti-vely. The FOS and TAC values in the reactors were below 15,000 mg/L and 20,000 mg/L respectively so the test was performed up to these upper limit values. A linear relationship was established for both FOS and TAC with acetate and cal-cium carbonate respectively as shown in Fig.2 and Fig.3. The regression coefficients R2 were found to be 0.99 for both calibrations. A linear relationship between FOS and acetate, and between TAC and calcium carbonate, respectively, are shown in equation (3) and (4).
Acetate (CH3COOH) = 1.44 x FOS -781.24 (3)
CaCO3 = 1.1024 x TAC+ 85.20 (4)
From equations 3 and 4, the amount of VFA (equivalent to acetate) and alkalinity (equivalent to CaCO3) inside the di-gester can be determined from the FOS and TAC value.
Fig. 2 FOS calibration with acetate by Nordmann method.
Fig. 3 TAC calibration with CaCO3 by Nordmann method.
3. RESULTS AND DISCUSSION
A. Performance of the Serial CSTRs
The tests were performed at OLR from 2.0-6.8 g VS/L and HRT from 16-32 days. During overall test period at OLR from 2.0 to 2.6 g VS/L with HRT of 32 days, the serial CSTR was found to have higher performance in terms of gas yield compared to the other higher OLR up to 6.8 g VS/L (as can be seen in Fig. 6 and Fig. 8). The test was performed with different alkaline feed value (TAC value of 9,165 mg/L and 4,230 mg/L) at HRT of 32 days during period I (93 to 107 day), period II (182 to 197 day) and period III (198 to 230 day) as shown in the Fig. 4 and Fig. 5. The characteristic features of the influent to reactor R1 and effluent from reactor R1 and R2 during the each test period are shown in the Fig. 4 and Fig. 5.
Fig. 4 Performance of two serial CSTRs at test period I.
During the test period I, the feed with TAC value 9165 mg/L at OLR of 2.6 g VS /L was supplied to the first reactor R1. The FOS/TAC maintained in the first reactor was 0.88 as seen in Fig.4 and the first reactor was in stable condition during this test period. While during test period II though the OLR was reduced by 15% because of low alkaline feed (TAC=4230 mg/L) the FOS/TAC maintained in the first reactor was very high reaching up to 1.45 as shown in Fig. 5 A. The re-actor R1 was unstable in the test period II with decline in pH up to 6.95 and about to failure. So to overcome the uns-

J. of Biosystems Eng. Vol. 35, No. 1.
57
Table 2 Performance of Two serial CSTRs
Particular
Period I93 -107 dayWithout aME
bM:S (OLR=2.55)
Period II182-197 day
Just before aME startedM:S (OLR=2.2)
Period III198 to 230 dayAfter 13% aME
M:S feed (OLR=2.2)
R1(HRT=16)
R2(HRT=16)
R1& R2(HRT=32) R1 R2 R1 & R2 R1
(HRT=16)R2
(HRT=16)R1&R2
(HRT=32)
cGCCH4 (%) 67-70 76-77 73 54-56 73-76 65 63-68 72-73 69
H2S (pp m) 3686-3892 1477-1521 3519-4942 3512-4119
BiogasL/d 34-38 21-23 55-61 16-18 16-17 32-35 25-29 26-28 52-57
dl/g VS fed 0.33-0.36 0.28-0.31 0.52-0.58 0.28-0.31 0.36-0.40 0.28-0.32 0.38-0.47 0.58-0.63
CH4L/d 23-26 16-18 40-45 9-10 12-13 21-23 16-19 19-21 36-40
dL/g VS fed 0.22-0.25 0.21-0.24 0.38-0.43 0.10-0.11 0.20-0.26 0.18-0.20 0.32 -0.35 0.40-0.44
Removal (%)
TCOD 33-37 21-23 47-52
VS 23-24 21-23 39-40 31-33 25-32 50-53a ME: Material exchange.b M:S: Swine Manure and Chinese cabbage silage mixturec GC: Gas composition.d L/g VS : volume / gram volatile solid
tability in the reactor R1, the material exchange method was applied continuously in the test period III (in which the infl-uent was same as in test period II) as shown in B in Fig. 5 and Fig. 6. The material exchange starting from 6.5 to 13% was applied and 13% was found to be enough in maintain-ing stability in reactor R1 by transferring excess VFA from reactor R1 to R2 and obtaining additional alkalinity and me-thanogens from reactor R2 and also the gas yield was impro-ved in both the reactors as can be seen in Fig.6 (210 to 230 days). The FOS/TAC was reduced from 1.45 to 0.93 in reac-tor R1 with some increase (0.55-0.66) in reactor R2 as shown in Fig. 5 B.
(a) Unstable condition in R1 (before material exchange) at test period II
(b) With 13% material exchange between R1 and R2 at test period III
Fig. 5 Performance of two serial CSTRs at test period II and III.
From Table 2 the biogas yield and the methane yield was
found to be 0.55-0.61 and 0.41-0.42 L/g VS fed respectively at organic loading rate (OLR) of 2.2-2.6 g VS/L with total HRT of 32 days. In the test period I the biogas production in reactor R1 was higher than R2 by around 40%. During test period II the overall biogas yield was reduced to 0.36-0.40 L/g VS. The 13% material exchange in test period III impro-ved the overall biogas and methane yield (L/d) by 63 and 73 % respectively from the test period II gas yield. Also the biogas yield in both the reactors in period III was almost same. This may have happened because of the excess VFA which was inhibiting methanogens in reactor R1 was trans-ferred to R2.
The methane content in the test period I was found to be 67-70% and 76-77% in the reactor R1 and R2 respectively while in the test period II it was 54-56%, 20% reduction of methane contents in biogas of reactor R1 due to pH drop to 6.9-7.0. In the test period III the methane content in reactor R1 was improved by 20% (i.e. 63-68%) from lower value of test period II, as result of material exchange between reactor R1 and R2 which increased the pH value to 7.4. In test period I the H2S concentration in reactor R1 was higher (by 61%) than in reactor R2 while it was almost same in both the reactors in test period III. The H2S concentration in each test period was found above the permissible range(less than 200 ppm) for the heat engine, so need additional H2S removal attachments (e.g. Micro-aeration) so that biogas can be utilized for generating electricity or running vehicles. The COD and

돈분과 배추사일리지를 이용한 2조 혐기소화의 효과적인 처리
58
VS reduction were found up to 52% and 53%, respectively. The NH3-N increased (up to 44%) after anaerobic digestion (Kim and Zhang, 2002).
B. Biogas Yields at Various OLR
The biogas production of two serial CSTRs is shown at various organic loading rates in Fig. 6. Table 3 shows the bio-gas yield (L/ g VS fed) and biogas production ratios of two reactors at different OLR.
Fig. 6 Biogas production at different OLR in two serial CSTRs.
Biogas yield was reduced with increase in the OLR (Kim and Zhang, 2002) as shown in Table 3. At higher OLR above 4.3 g VS/L, the first reactor R1 was found unstable and biogas production from reactor R2 was more than reactor R1 by 33% as shown in Table 3. With reduction of OLR from 4.8 to 2.55 g VS/L (i.e. by 47%) the biogas yield (L/g VS fed) was increased nearly three times as shown in Table 3. At lower OLR 2.55 g VS/L, both the reactors were found to be stable. With 13% material exchange between reactor R1 and R2 in the period after 198 day the biogas production was almost same in both the reactors as shown in Table 3. As by serial digestion the biogas production can be increased up to 16.4-17.8% (Kaparaju et al., 2009), so if we apply the material exchange method we can further improve in the biogas yield in the serial digestion system. Table 4 shows the duration taken for inclining or declining the biogas yield with sudden inc-rease or decrease in OLR. From Table 4 in period A, the biogas yield increased by 16% on next day with reduction of OLR from 4.3 to 2.6 g VS/L and further gas production increased on later days. In period B it can be seen that with OLR sudden increase from 2.8 to 5.3 g VS/L the biogas yield was reduced on next day while increased on second day and then start decreasing from third day. Similarly in period C
with increase in OLR from 2.6-4.3 g VS/L the gas yield was reduced by 21% on next day and further reduced on second day and showed stable balanced gas yield from 3rd days. Again with further sudden increase in OLR from 4.3 to 8.3 g VS/L in period C the gas yield reduced by 25% on next day and 46% in second day and continuous decrease was seen and reactor was imbalance. Thus Table 4 shows that gas produc-tion is sensitive to sudden change in OLR and effect on gas yield can be observed with in 1 to 3 days depending on the amount of OLR changed. The increase in the biogas yield from next day of decreased in OLR may be due to that when OLR is reduced the acid production will be lower than previ-ous days so the methanogens activation will be higher resul-ting in higher gas yield and reverse situation may occur for sudden increase in OLR.
Table 3 Biogas yield at different OLR
OLR (g VS/L)
Biogas Yield(L/g VS fed)
Biogas production ratios Periodin Fig. 6R1 and R2
4.8 0.20 1:1.3 30 to 61 day
4.3 0.25 1:1.3 81 to 93 day
2.6 0.57 1:0.6 94 to 107 day
2.2 0.61 1:1 (with ME) 198 to 225 day
2.0 0.65 1:1(with ME) 226 day after
ME- Material exchange
C. OLR and FOS/TAC
The trends of change in FOS/TAC, FOS and TAC value in the reactor R1 at different OLR during the test period is shown in Fig.7. FOS/TAC value was sensitive to change in the OLR. Sudden increase or decrease in OLR showed the change in FOS/TAC in a day as shown in Fig.7 A. At each high FOS value, low TAC value was observed in Fig. 7 B. So when VFA accumulation was higher, simultaneously alkali reduction was higher (Sánchez et al., 2005). Table 5 shows that feed alkalinity was maintained 9,165 and 4,230 mg/L to test with variation in OLR. At constant alkalinity of 9,165 mg/L, FOS/TAC increased with increase in OLR. Even at low OLR (2.2 g VS/L), if the feed used have low alkalinity(TAC) value then the FOS/TAC value will be increased rapi-dly as can be seen in Fig. 7 B. during period 185 to 198 day.
When the OLR was reduced from 2.6 to 2.2 with feed al-kalinity reduced by 54%, the FOS/TAC value in reactor R1 was increased from 0.88 to 1.45 as shown in Table 5. Thus it showed that even at lower OLR if there is deficient of

J. of Biosystems Eng. Vol. 35, No. 1.
59
(a) FOS/TAC in Reactor R1
(b) FOS and TAC in Reactor R1
Fig. 7 Patterns of change in FOS/TAC, FOS and TAC in reactor R1 at different OLR.
Table 5 FOS/TAC value in reactor R1 at different OLR and alkalinity (TAC)
OLR (g VS/l)
Feed alkalinity(TAC) mg/l
FOSmg/l
TACmg/l
FOS/TAC
Condition in reactor R1
4.89165
14267 7240 1.70 *unstable
2.6 10383 11400 0.88 **stable
2.2
4230
13736 9460 1.45 *unstable
2.2(with 13%
ME)9155 10010 0.93 **stable
ME- Material exchange
Table 4 Effect on biogas yield with sudden increase or decrease of OLR at R1
Period OLR (g VS/l) Biogas yield (l/d) Test day Remarks
A (91 to 96 day)
4.326 91
Sudden decrease of OLRFrom 4.3 to 2.6 g VS/L
26 92
2.6
30.1 9330.4 9436.3 9539.0 96
B (162 to 167 day)
2.822 162
Sudden increase of OLRFrom 2.8 to 5.3 g VS/L
22 163
5.3
20.4 16426.7 16521.0 16616.5 167
C (105 to 116 day)
2.638 105
Sudden increase of OLRFrom 2.6 to 4.3 g VS/L and 4.3 to 8.3 g VS/L
42 106
4.3
33 10731 10836 10935 11135 11234 11337 114
8.328 11520 116
alkalinity, VFA will accumulate and it will inhibit the metha-nogens and makes the digester unstable. To overcome the higher FOS/TAC condition at OLR of 2.2 g VS/l from 198 day, the material exchange was started and reduced the FOS/TAC below 1.0 in reactor R1 by improving alkalinity and re-ducing VFA (FOS maintained 9,000-10,000 mg/L). Finally the system was stable and obtained high gas production as shown in Fig. 6 (210 to 230 day). Table 6 shows the condi-tions at which the reactor could be stable or unstable. For
돈분과 배추사일리지를 이용한 2조 혐기소화의 효과적인 처리
60
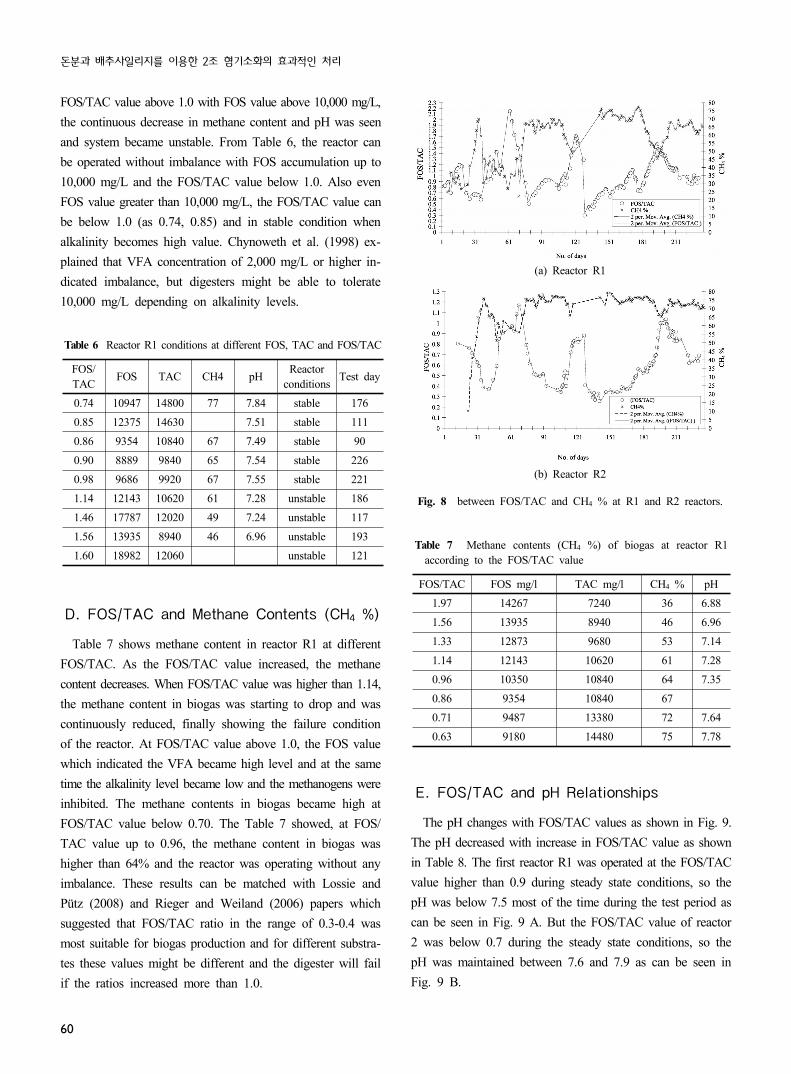
Table 6 Reactor R1 conditions at different FOS, TAC and FOS/TAC
FOS/TAC FOS TAC CH4 pH Reactor
conditions Test day
0.74 10947 14800 77 7.84 stable 176
0.85 12375 14630 7.51 stable 111
0.86 9354 10840 67 7.49 stable 90
0.90 8889 9840 65 7.54 stable 226
0.98 9686 9920 67 7.55 stable 221
1.14 12143 10620 61 7.28 unstable 186
1.46 17787 12020 49 7.24 unstable 117
1.56 13935 8940 46 6.96 unstable 193
1.60 18982 12060 unstable 121
FOS/TAC value above 1.0 with FOS value above 10,000 mg/L, the continuous decrease in methane content and pH was seen and system became unstable. From Table 6, the reactor can be operated without imbalance with FOS accumulation up to 10,000 mg/L and the FOS/TAC value below 1.0. Also even FOS value greater than 10,000 mg/L, the FOS/TAC value can be below 1.0 (as 0.74, 0.85) and in stable condition when alkalinity becomes high value. Chynoweth et al. (1998) ex-plained that VFA concentration of 2,000 mg/L or higher in-dicated imbalance, but digesters might be able to tolerate 10,000 mg/L depending on alkalinity levels.
D. FOS/TAC and Methane Contents (CH4 %)
Table 7 shows methane content in reactor R1 at different FOS/TAC. As the FOS/TAC value increased, the methane content decreases. When FOS/TAC value was higher than 1.14, the methane content in biogas was starting to drop and was continuously reduced, finally showing the failure condition of the reactor. At FOS/TAC value above 1.0, the FOS value which indicated the VFA became high level and at the same time the alkalinity level became low and the methanogens were inhibited. The methane contents in biogas became high at FOS/TAC value below 0.70. The Table 7 showed, at FOS/TAC value up to 0.96, the methane content in biogas was higher than 64% and the reactor was operating without any imbalance. These results can be matched with Lossie and Pütz (2008) and Rieger and Weiland (2006) papers which suggested that FOS/TAC ratio in the range of 0.3-0.4 was most suitable for biogas production and for different substra-tes these values might be different and the digester will fail if the ratios increased more than 1.0.
(a) Reactor R1
(b) Reactor R2
Fig. 8 between FOS/TAC and CH4 % at R1 and R2 reactors.
Table 7 Methane contents (CH4 %) of biogas at reactor R1 according to the FOS/TAC value
FOS/TAC FOS mg/l TAC mg/l CH4 % pH
1.97 14267 7240 36 6.88
1.56 13935 8940 46 6.96
1.33 12873 9680 53 7.14
1.14 12143 10620 61 7.28
0.96 10350 10840 64 7.35
0.86 9354 10840 67
0.71 9487 13380 72 7.64
0.63 9180 14480 75 7.78
E. FOS/TAC and pH Relationships
The pH changes with FOS/TAC values as shown in Fig. 9. The pH decreased with increase in FOS/TAC value as shown in Table 8. The first reactor R1 was operated at the FOS/TAC value higher than 0.9 during steady state conditions, so the pH was below 7.5 most of the time during the test period as can be seen in Fig. 9 A. But the FOS/TAC value of reactor 2 was below 0.7 during the steady state conditions, so the pH was maintained between 7.6 and 7.9 as can be seen in Fig. 9 B.

J. of Biosystems Eng. Vol. 35, No. 1.
61
(a) Reactor R1
(b) Reactor R2
Fig. 9 Relationship between FOS/TAC and pH at R1 and R2 reactors.
The pH value changed very slowly according to the change of FOS/TAC value. From Fig. 9 A (between 52 to 62 days) it can be seen that it took around 10 days for the pH to drop from 7.63 to 6.88 which is still sustainable value for the ana-erobic reactor generally, but during these days the FOS/TAC was already increased up to 2.15 which was very critical for the system and the CH4 % was dropped below 40% (Fig. 8 A) which was failure condition of digester R1 (Fig. 9 A). Similar conditions happened during the period between 185 to 200 days as shown in Fig. 9 A, when the FOS/TAC was already increased up to 1.50, but the pH was dropped to 6.98 which was still in appropriate operating condition. Same as these results, the pH only could not be efficient indicator for the instant digester condition for the high buffering feed like swine manure (Murto et al., 2004; Björnsson et al., 2001). The pH and FOS/TAC value measurement at the same time could be good tool in maintaining the digester stability in early stages and controlling feed rate (Lossie and Pütz, 2008; Rieger and Weiland, 2006).
Table 8 pH value at different FOS/TAC in reactor R1
S.N FOS/TAC pH
1 0.3 8.16
2 0.74 7.89
3 0.77 7.85
4 0.88 7.61
5 1.05 7.5
6 1.16 7.44
8 1.52 6.93
9 2.15 6.88
5. CONCLUSIONS
The performance of two serial CSTRs was studied for the treatment of swine manure with Chinese cabbage silage in 3:1 proportion by VS basis. The OLR was varied from 2.0 to 8.3 g VS/L. The effect of OLR variation on FOS/TAC and digester stability was studied. The relation of methane contents and pH with FOS/TAC value was also studied. The effect of material exchange method on maintaining digester stability was studied. The following conclusions were made on the basis of results.
(1) The biogas yield and the methane yield were 0.55-0.61 and 0.41-0.42 L/g VS fed respectively at organic loa-ding rate (OLR) of 2.2-2.6 g VS/L and HRT of 32 days. The COD and VS reduction were 52% and 53% respectively. With two serial CSTRs arrangement, the biogas yield increased compared to single stage CSTR and with material exchange method for two serial CSTRs system the biogas yield could be improved additionally.
(2) The pH only was less efficient indicator for instant re-actor stability with high alkalinity feed like swine ma-nure. Reactors worked in stable and high biogas yields condition in the pH range between 7.4 and 7.9.
(3) As the FOS/TAC value increased more than 1.14, me-thane content in biogas became low value and decrea-sed consistently.
(4) The FOS/TAC value was found to be an effective pa-rameter for predicting the instant reactor condition. High methane content in biogas was obtained at the FOS/TAC value below 0.7. The stability of reactors can be obtained with the FOS/TAC value up to 1.0 with accumulation of FOS value below 10,000 mg/L.

돈분과 배추사일리지를 이용한 2조 혐기소화의 효과적인 처리
62
(5) Material exchange was effective method to overcome reactor imbalance condition and improve the biogas yield.
REFERENCES
1. APHA. 1998. Standard Methods for the Examination of Water and Wastewater, 20th ed. American Public Health Association, Washington, DC.
2. Azbar, N., P. Ursillo and R.E. Speece. 2001. Effect of process configuration and substrate complexity on the performance of anaerobic processes. Water Research 35:817-829.
3. Baltrenas, P., M. Kvasauskas and A. Y. Waldberg. 2008. Ex-perimental investigation on biogas production using hen ma-nure, fruits and vegetables. Environmental Engineering, 7th International conference. Cited at www.vgtu.lt/upload/leid_konf/baltrenas_et_al_experimental.pdf. Accessed on 2009-12-30.
4. Björnsson, L., M. Murto, T. G. Jantsch and B. Mattiasson. 2001. Evaluation of new methods for the monitoring of alkali-nity, dissolved hydrogen and the microbial community in ana-erobic digestion. Water Research 35(12):2833-2840.
5. Boe, K. and I. Angelidaki. 2009. Serial CSTR digester confi-guration for improving biogas Production from manure. Water Research 43(1):166-172
6. Bouallagui, H., Y. Touhami, R. Ben Cheikh and M. Hamdi. 2005. Bioreactors performance used in anaerobic digestion of fruit and vegetable wastes: review. Process Biochemistry 40: 989-995.
7. Choi, M. H. and Y. H. Park. 2003. Production of Yeast bio-mass using waste Chinese cabbage. Biomass and Bioenergy 25:221-226.
8. Chynoweth, D. P., A. C. Wilkie and J. M. Owens. 1998. Anae-robic processing of piggery wastes: A review. ASAE Meeting Paper No. 984101. St. Joseph, Mich.: ASAE.
9. Hashimoto, A. G. 1983. Conversion of straw–manure mixtures to methane at mesophilic and thermophilic temperatures. Bio-technology and Bioengineering 25:185-200.
10. Hills, D. J. and D. W. Roberts. 1981. Anaerobic digestion of dairy manure and field crop residues. Agriculture Wastes 3:179-189.
11. Kaparaju, P. and J. Rintala. 2005. Anaerobic co-digestion of potato tuber and its industrial by-products with pig manure. Resource, Conservation and Recycling 43:175-188.
12. Kaparaju, P., L. Ellegaard and I. Angelidaki. 2009. Optimisa-tion of biogas production from manure through serial digestion: Lab-scale and Pilot-scale studies. Bioresource Technology 100:701-709.
13. Kepp, U., K. Panter and O.E. Solheim. 2001. High dry solids digestion. In Proc. CIWEM/Aqua. Enviro 6, European Bioso-lids and Organic Residuals Conf., Wakefield.
14. Kim, S. H. and R. H. Zhang. 2002. Biological Treatment of Kitchen Food Waste with Sequencing Batch Reactors. ASAE Meeting Paper No. 026054. St. Joseph, Mich.: ASAE.
15. Lehtomäki, A., S. Huttunen and J. A. Rintala. 2007. Laboratory investigations on co-digestion of energy crops and crop resi-dues with cow manure for methane production: Effect of crop to manure ratio. Resources, Conservation and Recycling 51: 591-609.
16. Lossie, U. and P. Pütz. 2008. Targeted control of biogas plants with the help of FOS/TAC. Practice Report. HACH Lange. Cited at www.hachlange.hu/.../HL_FOSTAC_HU_DOC042_86_20011_Mar08_web.pdf. Accessed on 20-8-2009.
17. Mc Carty, P. L. 1964. Anaerobic treatment fundamentals. Pu-blic Works Journal (Sept., Oct., Dec. Issue).
18. Misi, S. N. and C. F. Foster. 2001. Batch co-digestion of multi-components agro-wastes. Bioresource Technology 80: 19-28.
19. Murto, M., L. Bjornsson and B. Mattiasson. 2004. Impact of food industrial waste on anaerobic co-digestion of sewage sludge and pig manure. Journal of Environmental Management 70(2): 101-107.
20. Rieger, C. and P. Weiland. 2006. Early detection of process disturbance (Prozessstorungen fruhzeitig erkennen). Biogas Journal, 4/06. Cited at www.biogas-infoboard.de/.../Seiten18-20%20aus%204-2006_komplett.pdf. Accessed on 20-08-2009.
21. Sánchez, e., R. Borja, L. Travieso, A. Martín and M.F. Colme-narejo. 2005. Effect of organic loading rate on stability, opera-tional parameters and performance of a secondary upflow ana-erobic sludge bed reactor treating piggery waste. Bioresource Technology 96:335-344.
22. Speece, R. E., M. Duran, G. Demirer, H. Zhang and T. DiStefa-no. 1997. The role of process configuration in the performance of anaerobic systems. Water Science and Technology 36(6):539-547.
23. WPCF. 1987. Anaerobic Sludge Sludge Digestion. Manual Prac-tice No. 19 second edition. Water pollution Control Federation, Alexandria, VA.
24. Zhang, R. H., Y. Yin, S. Sung and R. R. Dague. 1997. Anaero-bic treatment of swine waste by the anaerobic sequencing batch reactor. Transactions of the ASAE 40(3):761-767.

Copyright © 2022 FDOKUMEN