Sustainable Handling and Utilisation of Livestock Manure from ...
202
DIAS report Animal Husbandry no. 21 • January 2001 Publisher: Danish Institute of Agricultural Sciences Tel. +45 89 99 19 00 Research Centre Foulum Fax +45 89 99 19 19 P.O. Box 50 DK-8830 Tjele Sale by copies: up to 50 pages 50,- DKK (incl. VAT) up to 100 pages 75,- DKK more than100 pages 100,- DKK Subscription: Depending on the number of reports sent but equivalent to 75% of the price of sale by copies. Hans Benny Rom & Claus G. Sorensen Research Centre Bygholm Department of Agricultural Engineering P. O. Box 536 DK-8700 Horsens Sustainable Handling and Utilisation of Livestock Manure from Animals to Plants Proceedings, NJF-Seminar no. 320, Denmark, 16-19 January 2001 Organiser: NJF-Section VII. Agricultural Engineering
-
Upload
khangminh22 -
Category
Documents
-
view
0 -
download
0
Transcript of Sustainable Handling and Utilisation of Livestock Manure from ...

DIAS report Animal Husbandry no. 21 • January 2001
Publisher: Danish Institute of Agricultural Sciences Tel. +45 89 99 19 00Research Centre Foulum Fax +45 89 99 19 19P.O. Box 50DK-8830 Tjele
Sale by copies: up to 50 pages 50,- DKK(incl. VAT) up to 100 pages 75,- DKK
more than100 pages 100,- DKK
Subscription: Depending on the number of reports sent but equivalent to 75% ofthe price of sale by copies.
Hans Benny Rom & Claus G. SorensenResearch Centre BygholmDepartment of Agricultural EngineeringP. O. Box 536DK-8700 Horsens
Sustainable Handling and Utilisationof Livestock Manure from Animals to Plants
Proceedings, NJF-Seminar no. 320, Denmark, 16-19 January 2001
Organiser: NJF-Section VII. Agricultural Engineering


3
Preface
This report provides a compilation of the papers presented at the NJF-seminar No. 320:“Sustainable Handling and Utilisation of Livestock Manure from Animals to Plants”.
In recent years, the concept of sustainable agriculture has become a main topic in the politicaldebate about agricultural production systems as well as in the debate within the agriculturalcommunity itself. Animal welfare, technological development, energy and nutrient recyclingcombined with minimising the environmental impact have been, and continue to be keywords inthe development of a sustainable agricultural sector within Europe.
Good agricultural practices for reducing the ammonia emission are being addressed on a natio-nal and on an international level, including animal feeding, housing systems, manure transpor-tation systems and storage facilities for solid and liquid manure, and finally spreading techni-ques including transport and logistics.
Consequently, it is highly needed to highlight validated and certified methods of reducing gase-ous missions and achieving a sustainable development within the handling and utilisation oflivestock manure from animals to plants.
The objective of the seminar was to promote scientific discussions on a national as well as onan international level in order to stimulate innovative research, product development andscientific co-operation within the topics. Furthermore, handling methods and treatmenttechniques were discussed and validated in order to develop sustainable and certified methodsthat may contribute to improving the utilisation of nutrients and minimising the environmentalimpact from livestock manure.
Committed and encouraged scientists presenting the state-of-the-art of the issues addressedhave written the seminar papers. The presentations were organised in five sessions dealingwith various aspects of handling and utilisation of livestock manure combined with mini-mising the environmental impacts.
The topics presented at the seminar covered the following scientific subjects:• Losses of nutrients and odours related to diet composition and feeding strategy• Nutrient transformation, losses and odours related to livestock production facilities• (indoor/outdoor productions)• Nutrient transformation, losses and odours related to storage facilities• Distribution, losses of nutrients and odours related to application techniques and strategy• Operational and economic management for handling, transportation and spreading.

4
We want to recognise the Scientific Committee for their support in achieving a high scientificlevel through review and relevant comments to the presented papers. Furthermore, we wish tothank the leader group and our colleagues at Research Centre Bygholm for their encourage-ment, support and positive criticism.
Finally, we want to recognise the group of secretaries for their secretarial help, which has be-en essential for the preparation of the seminar and the report.
The Organising Committee
Organizing committee
Hans Benny Rom, DIAS, Research Centre Bygholm, Horsens, DenmarkClaus G. Sørensen, DIAS, Research Centre Bygholm, Horsens, DenmarkMarianne P. Thygesen, DIAS, Research Centre Bygholm, Horsens, Denmark
Scientific Committee
John Morken, Norwegian Agricultural University, Dept. of Technique, Aas, NorwayGretar Einarsson, Agricultural Research Institute, Technical Department, Borgarnes, IcelandEirikur Blöndal, Agricultural Research Institute, Technical Department, Borgarnes, IcelandGirma Gebresenbet, Swedish Agricultural University, Uppsala, SwedenPetri Kapuinen, MTT/Vakola, Vakolantie 55, Vihti, FinlandClaus Grøn Sørensen, DIAS, Research Centre Bygholm, Horsens, DenmarkHans Benny Rom, DIAS, Research Centre Bygholm, Horsens, Denmark

5
Contents
The Danish nitrate policy..................................................................................................... 7Sophie Winther, Denmark
Integrating emissions at a farm scale................................................................................... 11N.J. Hutchings, Denmark (N.J. Hutchings & S.G. Sommer)
Best available techniques (BAT) for Irish intensive pig and poultry producers ................. 16W. Magette, Ireland (W. Magette, T. Curran, G. Provolo, V. Dodd, P. Grace,B. Sheridan & E. Cummins)
The environmental load from outdoor areas and yards for pigs.......................................... 24Hans von Wachenfelt, Sweden
Quantification of nitrogen losses and nutrient flow in straw bedded housingsystems for cattle ................................................................................................................. 34Hans Benny Rom, Denmark (H.B. Rom, K. Henriksen, P. Dahl & M. Levring)
Low cost aerobic stabilisation of poultry layer manure ...................................................... 42K.A. Smith, United Kingdom (K.A. Smith, D.R. Jackson & J.P. Metcalfe)
Storage of manure in heaps ................................................................................................. 51Maarit Puumala, Finland
The influence of different litter materials on the emission of poultry manure.................... 58Günter Hörnig, Germany (G. Hörnig, R. Brunsch & E. Scherping)
Ammonia emissions from broiler manure during handling................................................. 66Stig Karlsson, Sweden (S. Karlsson & L. Rodhe)
Specification of requirements – a way in bringing new spreading techniques into use...... 67Carl-Magnus Petterson, Sweden
Improved spreading technology for semi-solid organic fertilisers ...................................... 75Johan Malgeryd, Sweden (J. Malgeryd & O. Pettersson)
Slurry application on ley – new techniques......................................................................... 81Lena Rodhe, Sweden (L. Rodhe & C. Rammer)
Ammonia volatilization from pig slurry applied to spring wheatwith different techniques ..................................................................................................... 82Pasi Mattila, Finland
A new concept for use of pig slurry for cereals................................................................... 89Petri Kapuinen, Finland

6
Reduction of ammonia emission by slurry injection – effect of differenttypes of injectors.................................................................................................................. 98Martin N. Hansen, Denmark
Development of a simple predictive model for ammonia volatilisationfollowing land application of manures ................................................................................ 106T.H. Misselbrook, United Kingdom (T.H. Misselbrook, F.A. Nicholson,R.A. Johnson & G. Goodlass)
Development of a measuring device for the transverse distribution of slurryusing an injector................................................................................................................... 116Jan Langenakens, Belgium
Experiences with ReBio wet sowing in the years 1997-1999 ............................................. 125Hans Christian Endrerud, Norway (H.C. Endrerud, S. Sakshaug & B. Simonsen)
Separation of slurry in a decanting centrifuge and a screw press as influencedby slurry characteristics ....................................................................................................... 126H.B. Møller, Denmark
Enhancing plant utilization of livestock manure: A cropping system perspective.............. 134Enrico Ceotto, Italy
Runoff of nutrients and faecal micro-organisms from grassland after slurry application... 144Jaana Uusi-Kämppä, Finland (J. Uusi-Kämppä & H. Heinonen-Tanski)
Sustainable handling and utilisation of manure and organic waste resources.The centralised biogas plant approach................................................................................. 152Kurt Hjort-Gregersen, Denmark
Labour and machinery input for different manure application techniquesand transportation systems................................................................................................... 159Claus G. Sørensen, Denmark
Measurement of soil compaction around slurry injection slits............................................ 168Ivar Lund, Denmark
Ammonia volatilization from manure applied to fields - data collection for anEU database and its statistical analysis .................................................................................... 174Henning T. Søgaard, Denmark (H.T. Søgaard & S.G. Sommer)
The economics of manure handling from storage to field application.................................... 188Brian H. Jacobsen, Denmark
Umbilical slurry system for the future ..................................................................................... 196Kyrre Vastveit & Kjell Vastveit, Norway
Nordic Association of Agricultural Scientists (presentation).................................................. 202

7
THE DANISH NITRATE POLICY
Ms. Sophie WintherMinistry of the Environment and Energy, The National Forest and Nature Agency
Haraldsgade 53, DK-2100 Copenhagen Ø. Tel.: +45 39 47 27 59. Email: [email protected]
The Nitrates Directive (91/676/EEC)
The objectives of the Nitrates Directive are as follows- to reduce water pollution caused or induced by nitrates from agricultural sources- to prevent further pollution
To achieve these goals the member states will have to identify zones vulnerable to nitrateleaching, and Denmark has designated the whole national territory as vulnerable.
The member states have to implement action plans for the vulnerable zones.
State of the environment
The Danish agricultural production is very intensive, which has led to high levels of nitrateleaching into the aquatic environment. In Denmark, nitrate leaching mainly causes problemswith regard to ground water and in inlets and coastal waters.
Nitrate pollution is seen as severe algae growth in inlets and in coastal waters. In periods inthe summer, this can cause lack of oxygen and consequently, fish mortality.
In the ground water, the nitrate leaching has in some drillings led to a nitrate concentrationhigher than 50 mg/l.
Improvement of the environmental state of the surface water ground water has a high priorityfor the Danish Government, and so it has been for the last 15 years, because:
- Lakes, streams, inlets and coastal waters are important elements in the Danish natural en-vironment
- In Denmark non-purified ground water is used as drinking water- From an international perspective, nutrient losses from Danish agricultural production are
of importance to the state of the marine environment of the Baltic Sea and the North Sea.
8
Danish Nitrate Policy
The action plans relevant to the aquatic environment sector are listed below:
• The NPo Action Plan of 1985• The Action Plan for the Aquatic Environment of 1987• The Action Plan for a Sustainable Development in Agriculture of 1991• The Action Plan for the Aquatic Environment II of 1998.
In implementing the four action plans Denmark fulfils the requirements stated in Art. 5 in theNitrates Directive.
General regulations
The Danish action plans are implemented through a number of statutory rules. These rules aregrouped in the following:
Storage capacity for animal manureThe storage capacity must be sufficient to ensure that application of manure takes place in ac-cordance with the provisions for field application. As an absolute minimum the storage capa-city must correspond to 7 and in general 9 months’ production, but most farmers have a ca-pacity of 10 months’ production, or even more.
Livestock densityThe regulations describe a maximum number of animals (LU) per hectare on a farm. For in-stance, if the farmer has a livestock of 170 LU, he must have 100 hectares of arable land avail-able for manure application. He must either own the land, rent it or have an agreement with an-other farmer to whom he can deliver the manure. In Denmark, this rule is called the “harmonycriteria”.
“The harmony criteria” is an expression of the maximum amount of livestock manure that maybe applied per hectare annually, and hence is an expression of how much nitrogen may be ap-plied per hectare annually.
Green cover and catch cropsOne of the preconditions for effective nutrient management is to prevent nitrogen from leachingfrom the soil after harvest. On each individual farm, there must be a green cover during theautumn at a minimum of 65-70% of the arable farmland.

9
Quota for Nitrogen FertilisationNormative values for crop nitrogen are stipulated and developed for each crop as a function ofsoil type and precrop. The nitrogen norms are stipulated at 10% below the economically op-timal application rate.
The farmers are obliged to calculate the nitrogen quota for his farm every year. This quotasets the maximum allowed nitrogen fertilisation. The farmers are not allowed to use more ni-trogen fertiliser regardless of whether they use chemical fertiliser, manure or other organicfertilisers.
Standards for nitrogen content in manureValues for nitrogen content in manure are stipulated for type of animal as a function of type ofhousing and storage facilities. The farmers are obliged to use these standards when calculatingthe nitrogen content of the manure produced on their farms.
In Denmark, there is a voluntary development towards a more efficient protein feeding oflivestock. The use of protein per kg of pig or poultry meat produced has been reduced by ad-justing the amino acid composition of the diet to the needs of the animals.
Minimum requirements for the utilisation of nitrogen in manureThe rules also stipulate minimum requirements for the utilisation of the nitrogen content.
Pig slurry 70%*Cattle slurry 65%*Other types of manure 60%*
* plus 5%, if necessary
Fertiliser accountsTo monitor the use of fertiliser there is an obligation for all Danish farmers each year to drawup crop rotation and fertiliser plans as well as fertiliser accounts. The use of crop rotation andfertiliser plans will be obligatory when calculating the quota of nitrogen fertiliser.
After every harvest the fertiliser accounts should be sent to the authorities for control. Theauthorities will have access to information on delivery of milk, animals for slaughter and saleof chemical fertiliser to the individual farmers.
The authorities that control the fertiliser accounts use this information. If the farmer has anexcess use of nitrogen fertiliser, he will be fined.

10
Tax on fertiliserNitrogen fertiliser used for other purposes than for agricultural and fruit and vegetable pro-duction, e.g. fertiliser for private gardens and public parks, will be taxed.
Voluntary instrumentsBesides the general obligatory regulation, there are a number of programmes aimed at con-vincing farmers to adopt environmentally friendly production methods. The programmes in-clude financial support for the conversion to:
- Organic farming- Nature restoration projects, such as afforestation and re-establishment of wetlands- Environmentally friendly farming, e.g. use of less nitrogen fertiliser
Environmental Improvements
There are strong indications that the Danish action plans for the aquatic environment over thepast 15 years have reduced the environmental impact from the agricultural production:
- the amount of chemical fertilisers used has been reduced by nearly 130 mill. kg N, whichcorresponds approximately to a 30% reduction.
- the nitrogen surplus in Danish agriculture – i.e. the difference between nitrogen input(chemical fertilisers, manure, nitrogen fixation and deposition) and removed nitrogen –has been reduced by approx. 20%.
- The overall national nitrogen leaching – based on model calculations – has been reducedby approx. 27%.
- The nitrate concentration in water leaving the root zone has been reduced by approx. 25%in the period 1990-1999.
- There are indications that reduction of nitrate concentration in root-zone water will causea reduction of the nitrate content in streams with a few years of delay. The available dataseems to indicate this. It will take some years before there are enough data from which tomake any conclusions due to different influences such as crop rotations, soil types andespecially the climatic conditions.
- Monitoring from 1997 shows that 65% of the Danish ground water drillings contain lessthan 1 mg of nitrates per litre and 10% exceeds the Danish recommended level of 25 mgnitrate per litre.

11
INTEGRATING EMISSIONS AT A FARM SCALE
N. J. Hutchings1* & S.G. Sommer2
1Dept. of Agricultural Systems, Danish Institute of Agricultural Sciences, Research CentreFoulum, P.O. Box 50, DK-8830 Tjele, Denmark. E-mail: [email protected]. of Agricultural Engineering, Danish Institute of Agricultural Sciences, Research CentreBygholm, P.O. Box. 536, DK-8700 Horsens, Denmark. E-mail: [email protected].
Abstract
This paper describes the latest developments in the FASSET farm-scale model. The modelhas been expanded to describe cattle farming and the description of manure handling impro-ved. The improvements include the capacity to house more than one animal type in an animalhouse and a more detailed description of the emission of ammonia from animal housing, sto-rage and field-applied manures.
Key words: ammonia emission, manure, farm.
Introduction
In most European countries, livestock farms make the largest contribution to ammonia emis-sions. This ammonia has its origins in the portion of the nitrogen fed to animals in feedstuffsthat fails to be incorporated in agricultural products and is excreted in animal manure. Thisnitrogen may be emitted as ammonia from a number of on-farm sources; animal housing, ma-nure storage, field-applied manure and excreta deposited in the field by grazing animals. Ashousing, storage and field sources are sequentially linked, any change in the emission fromone source will have an effect on emissions later in the chain. Current methods of estimatingammonia emissions incorporate the 'knock-on' effect of emission from one source on subse-quent sources. Emission estimates used in modelling atmospheric ammonia are normally ba-sed on emission factors, i.e. the ammonia emitted is calculated as a percentage of the total in-coming nitrogen. For animal housing or grazed pasture, this incoming nitrogen is the totalnitrogen excreted by animals. For stored or spread manure, it is the nitrogen output from theprevious stage of the manure handling system.
The advantage of this method of calculating ammonia emissions is that it is simple and reaso-nably transparent. This is a major consideration if one wishes to reflect regional variations inthe structure of agriculture, as separate calculations must be made for all the different catego-ries of livestock (sheep, pigs, dairy cattle etc). However, there are a number of disadvantagesin this approach:

12
• the emission from liquid manures is related to the ammoniacal content of manures, not thetotal nitrogen content.
• both the emission rate and the dispersion pattern are affected by the weather. Some disper-sion models make allowance for this by seasonally weighting the emissions. The validityof these weightings is uncertain.
• ammonia emission abatement techniques may affect the emission of other forms of pollu-tion (e.g. emission of nitrous oxide, nitrate leaching), and this may be overlooked.
To address some of these problems, we have adopted a more process-orientated, farm-scaleapproach.
The Farm ASSEssment Tool (FASSET)
The FASSET farm model uses information concerning livestock feeding practices to estimatethe excretion of organic and ammoniacal nitrogen. This nitrogen is tracked as it passesthrough animal housing, manure storage and manure spreading or after deposition on pastureduring grazing (Fig. 1). The model operates with a daily timestep.
Figure 1. N flows in FASSET
Version 1.0 of the model, which can simulate arable and pig farming, is completed and hasbeen described elsewhere (Jacobsen et al., 1999). Here we describe some on-going develop-ments to the model, with the emphasis on the management of animal manure.
Animal modelsFASSET contains a pig model, and a cattle model has been constructed and is currently beingtested. These models partition N in feed between production (milk, animal growth), urine andfaeces. The pig model is prescriptive, i.e. the level of production is an input, and the onlyfunction of the model is to partition the excreta between urine and faeces. The cattle model isresponsive, i.e. the production increases and decreases in response to feeding practice. Thetwo different approaches reflect the degree of control achievable with the two species; pig
Animal feed
Animals
Animal housing
Manure storage
Fields
NH 3 , N 2 ONH 3 , N 2 O
NO 3NO 3
Cropsproduced
DepositionFixationFertiliser
DepositionFixationFertiliser
Cropssold
Cropssold
FeedboughtFeed
bought
N flow in FASSETAnimal products

13
production can be closely controlled, while most cattle production is at the mercy of thequantity and quality of forage available.
The excrete is routed to either the animal housing or the pasture, depending on whether theanimals are grazing or not.
Housing modelThe animal housing is divided into sections, each containing a separate animal category (e.g.fattening pigs, calves) (Fig 2).
Figure 2. Schematic representation of an example animal house and section.
The animal section can have one or two floors (e.g. solid floor and slats). Animal excreta isdeposited on the floor as dung or urine. If two floors are present, the excreta is partitionedbetween them according to a user-input distribution parameter.
Ammonia loss from the animal section is simulated by use of a dynamic process model thatresponds to the area of flooring covered by excreta, the chemical composition of the excreta(ammoniacal N concentration, pH), the temperature in the animal house and the ventilationrate. For solid and farm-yard manure, the emission of ammonia is dependent on whether themanure is composting. The switch between composting/non-composting is made dependenton the C:N ratio of the manure and whether air has access to the base of the floor. If the ma-nure composts, a simple model of ammonia emission is used, again dependent on the C:N ra-tio. If a solid or farm-yard manure does not compost, a proportion of the urine excreted is as-sumed to remain on the surface of the manure and is volatilised.
For slurry-based systems or those based on partial separation of solid and liquid manures, theexcreta is removed to store daily. Storage can be temporarily in-house (e.g. slurry pit) or long-term in-house (e.g. as in straw-based systems), or the manure can be removed immediately.
Animals
FYM
slurry pit
Example animal sectionAnimal house
Field/storage
Storage

14
The routing of manure from animal category onto the flooring and then to a specific manurestore means that the consequences of changes in the feeding of a particular animal categorywill be reflected in the ammonia emission from the relevant animal section and in the qualityof the manure produced from it.
Manure storageManure can be stored as slurry in a slurry tank (covered or uncovered), as the liquid fractionfrom partial separation in a closed tank or as farm-yard manure or the solid fraction resultingfrom partial separation, in a stack.
Ammonia emission from the stored slurry is simulated by a dynamic process model, similar tothat used for animal housing. In addition to the chemical characteristics of the slurry, the los-ses from storage are made a function of wind speed, air temperature and rainfall. Emissionfrom the liquid fraction of partially separated manure is simulated in the same way but as it issubscribed by law that it must be stored in a covered tank, the emissions are always low. Thesame model of emission from farm-yard manure stored in animal housing is used to simulateemissions from muck heaps.
Field application of manurePloughing, sowing and fertilisation follows a user-determined time schedule. There is cur-rently no capacity to adjust the timings of these events to reflect the effect of current conditi-ons (e.g. soil moisture status).
The field model consists of a soil model and one or more crop models (e.g. a spring barleycrop would have one model, whereas spring barley undersown with grass would have two).The crop model describes nutrient uptake and growth. The soil is modelled as a number oflayers, and the water flow between these layers is simulated. Nutrient transformations (cur-rently only nitrogen) are described in each layer. To date, the greatest effort has been put intothe field model, but details are not provided here, as the emphasis in this paper is on manurehandling. Further details of the field model can be found elsewhere (Jacobsen et. al., 1999).
Manure is applied by use of a user-defined application technique. Depending on the choice oftechnique, the area of manure exposed to the atmosphere is either the area of the field (broad-spreading) or some fraction of it (e.g. trailing hose application). If the field is ploughed afterapplication, the manure is buried to the appropriate depth. Ammonia emission is simulatedusing a model similar to that described in Hutchings et. al. (1996). If the field is ploughedafter application, ammonia volatilisation is simulated as a two-stage process; before and afterploughing. Although this approach acknowledges the need to account for differences in thetime-lag between application and ploughing, as daily mean meteorological variables are used,the simulation is only partially realistic in this respect.

15
Model outputsThe model outputs are production of milk, animals or crops and losses of nitrogen as nitrate,ammonia and nitrous oxide (though not currently nitrous oxide from manures). Certain eco-nomic variables are also output, although the economic aspects of manure spreading are notmodelled.
Role of FASSET
FASSET has three main roles. Firstly, it can be used to investigate how farm management canbe changed to reduce the losses of ammonia and other nitrogen compounds to the environ-ment and to assess the economic consequences of such actions. Secondly, it can be used toreveal interactions (both positive and negative) between measures designed to reduce ammo-nia emissions and the losses of other compounds. The reverse is also possible. Finally, FAS-SET allows emission estimates to take account of national or regional variations in livestocknumbers and feeding practices, animal housing, manure storage, manure spreading and theirinteraction with the climate. However, if the results are to represent an improvement over exi-sting methods, it also demands that good quality data are available concerning the farmstructure and management.
References
Hutchings, N.J., Sommer, S.G. & Jarvis, S.C., 1996. A model of ammonia volatilisation froma grazing livestock farm. Atmospheric Environment 30: 589-599.
Jacobsen, B.H., Petersen, B.M., Berntsen, J., Boye, C., Sørensen, C.G., Søgaard,H.T. & Han-sen, J.P., 1999. An integrated economic and environmental farm simulation model (FAS-SET). Danish Institute of Agricultural and Fisheries Economics, Copenhagen. ReportNo. 102.

16
BEST AVAILABLE TECHNIQUES (BAT) FOR IRISH INTENSIVEPIG AND POULTRY PRODUCERS
W. Magette1* T. Curran1, G. Provolo2, V. Dodd1, P. Grace1
B. Sheridan1 & E. Cummins1
1Agricultural and Food Engineering Department, University College Dublin, EarlsfortTerrace, Dublin 2, IRELAND *Corresponding author: [email protected] di Ingegneria Agraria, Via Celoria 2, Universita di Milano, I-20133 Milan, Italy
Abstract
The EU Directive (96/61/EC) of 24 September 1996 concerning integrated pollution preven-tion and control (IPPC) requires for a variety of industrial activities to be issued environ-mental permits (e.g., IPPC licenses) to ensure a high level of environmental protection. In-stallations for the intensive rearing of pigs and poultry are among the industrial activities thatwill require IPPC licenses. The IPPC Directive states that emission limit values, parameters orequivalent technical measures should be based on best available techniques (BAT) taking intoconsideration the technical characteristics of the installation concerned, its geographical loca-tion and local environmental conditions. We were commissioned by the Irish EnvironmentalProtection Agency to develop a draft Best Available Techniques Guidance Note, which willidentify BAT for controlling emissions to all environmental media (soil, water and air) fromintensive pig and poultry rearing operations. We considered issues ranging from building de-sign to operating (i.e., managerial) practices, as well as related issues such as animal welfare,disease transmission, and food safety. In this paper we present our preliminary synthesis ofscientific papers, legislation, and limited on-site operating data from facilities in Ireland andother EU Member States.
Key words: IPPC, BAT, agricultural pollution.
Introduction
In June 2000, the Irish Environmental Protection Agency contracted us1 to produce a "draftBAT note" applicable to pig and poultry operations in preparation for implementing EUCouncil Directive 96/61/EC concerning integrated pollution prevention and control (IPPC).This Directive advances environmental management beyond that mandated by previous EUlegislation, and endeavours "to achieve integrated prevention and control of pollution" fromspecified activities. Among the specified activities in Directive 96/61/EC are those for the in-tensive rearing of pigs and poultry.
1 Environmental Engineering Group, Agricultural and Food Engineering Department, University College Dublin.

17
Directive 96/61/EC requires affected activities to employ “best available techniques” (BAT)for pollution prevention and control, and gives a generic definition of BAT and related terms.
“BAT shall mean, the most effective and advanced stage in the development ofactivities and their methods of operation which indicate the practical suitabilityof particular techniques for providing in principle the basis for emission limitvalues designed to prevent and, where that is not practicable, generally to reduceemissions and the impact on the environment as a whole:
Techniques shall include both the technology used and the way in which the in-stallation is designed, built, maintained, operated and decommissioned,
Available techniques shall mean those developed on a scale which allows imple-mentation in the relevant industrial sector, under economically and technicallyviable conditions, taking into consideration the costs and advantages, whether ornot the techniques are used or produced inside the Member State in question, aslong as they are reasonably accessible to the operator,
Best shall mean most effective in achieving a high general level of protection ofthe environment as a whole."
Our group had previously been responsible for developing guidance notes for EPA (EPA1996a, 1996b) describing the best available technology not entailing excessive costs (BAT-NEEC) in the pig and poultry production sectors. Our brief in this project was to update thesedocuments by defining more specifically what constitutes BAT for controlling environmentalemissions from these two types of agricultural industries in Ireland. In addition to environ-mental emission issues, we also were to consider related topics such as animal welfare, dis-ease transmission, food safety, buffer zones, energy management, and soil P limits.
We were required to produce three iterations of the draft BAT note, allowing for public re-view and comment during the development process. This paper presents our current progresstoward this end. We understand each Member State is conducting a similar appraisal.
Methods
On our behalf the Irish EPA established a "BAT Reference Committee" to facilitate interac-tion with agricultural and environmental stakeholders and preparation of the initial drafts ofthe BAT note. Membership on the committee consisted of prominent representatives from thepig / poultry industries, the National Agricultural Research and Advisory Service, and theNational Fisheries Management Agency. EPA chaired committee meetings, which were held

18
prior to our preparation of a first draft of the BAT note. (Subsequent meetings with the com-mittee will be held as we produce the two additional iterations of the draft BAT note).
We conducted an extensive literature review focused on five key areas:• manure management and emissions to soil and water• odour and ammonia emissions to the atmosphere• atmospheric dispersion modelling as an analytical tool• waste management systems and building design• odour and ammonia treatment technologies.
We also developed a very detailed questionnaire for distribution to selected European andAmerican colleagues in an attempt to solicit operating data about outstanding pig and poultryproduction facilities in other countries. We endeavoured to visit some facilities firsthand, andwere assisted in doing so by gracious hosts in Denmark, Germany, The Netherlands, Italy andAmerica. In addition, we attended various technical conferences both to learn about the latestresearch in pollution control for intensive animal production facilities and to publicise our ef-forts to develop a BAT statement for Ireland. We “networked” with leading scientists inEurope and the U.S. via email, and also worked through professional organisations (i.e.,European Society of Agricultural Engineers) to solicit information for use in our analysis.
Our ultimate objective was to identify technologies and techniques that were:• widely perceived to provide exceptional control of environmental emissions• commercially available and/or in widespread use• applicable in Irish conditions.
Results and Discussion
Our meetings with the BAT Reference Committee have been productive in transferring in-formation to and from agricultural and environmental stakeholders, as represented by thecommittee membership. We have had frank discussions encompassing philosophical to prac-tical issues. Our broad literature review has produced a database of nearly 1000 citations,most of which were written in the last 10 years. Our attendance at a variety of recent confer-ences has assured us that we are up-to-date on the latest developments in pollution control foranimal-based enterprises. Likewise, with the assistance of colleagues in Europe and America,we feel confident that we have seen examples of the best management practices and technolo-gies that have achieved widespread commercial application.
Perhaps not surprisingly, we received very limited responses to our questionnaire. We believethe poor response was due largely to the comprehensive nature of the questions we asked. Forexample, for a given operation deemed to be exceptional, we requested quite specific opera-tional data in our attempt to quantify the environmental performance of different production

19
systems (i.e., combinations of technologies and managerial practices). In some cases suchdata were not available. But, according to many recipients, the length of time required forcompleting the questionnaire was also an impediment.
The word “best” implies a unique entity unsurpassed by any other according to some measure.Thus, “best available techniques” for pollution control implies a suite of technologies andpractices that are unparalleled in their abilities to control pollution. From our analysis of lit-erature (including draft BAT statements from other Member States), our visits to other coun-tries, and our discussions with colleagues in Europe and America, we believe that there is nounique set of techniques for pollution control that would be “best” for every pig and poultryproducer. Rather, there exists a collection of techniques that are clearly superior to others forminimising or controlling certain emissions, and producers should implement one or more ofthese techniques (as dictated by site-specific circumstances) to achieve integrated pollutioncontrol.
The foregoing notwithstanding, one technique we do believe is applicable in all situations isthe implementation of an environmental management system (EMS). Such a system is basedon the idea of continuous improvement; when implemented in good faith, an EMS shouldlead to better and better levels of environmental management over time. ISO 14001 is an in-ternational standard guiding the development of an EMS, and although pig and poultry pro-ducers have not implemented such systems (to our knowledge), other sectors of the food in-dustry have done so. Because an EMS is tailored to site-specific conditions, we believe thistool is an obvious requirement under Directive 96/61/EC, and have already recommended itsadoption under existing Irish environmental legislation (Magette, et. al., 2000). It is reassur-ing that adoption of EMS by pig and poultry producers is being encouraged in other countries(Harrison, 2000; Slizankiewicz, 2000).
Although an EMS offers each individual pig or poultry producer a framework for accom-plishing enhanced environmental management, it is through the technologies and techniquesimplemented as a consequence of the EMS that emission control will take place. In ourjudgement, these technologies and techniques consist of a mix of practices already in commonusage in Ireland and some not so commonly used. Our description of “best available tech-niques” is contained in the following tables and is generally organised on the basis of opera-tions within the animal production process. Tables 1-5 relate primarily to controlling emis-sions to soil and water. Table 6 pertains to atmospheric emissions. At this stage of progress,we have not dealt in detail with animal welfare and building design issues.
It goes without saying that siting and construction of facilities are two especially crucial fac-tors in minimising potential environmental emissions. We anticipate that these factors will re-ceive ample attention in the environmental impact assessment stage of planning approval.
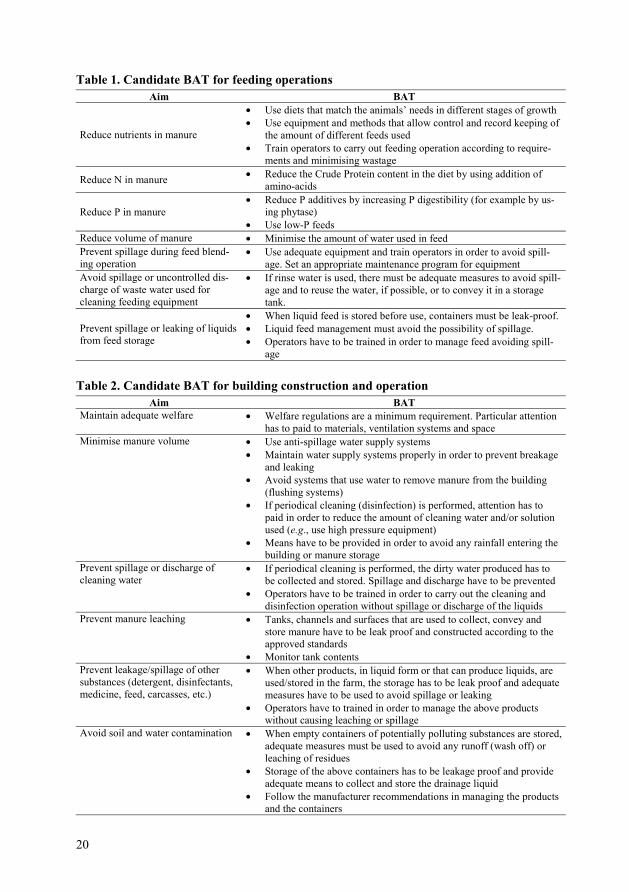
20
Table 1. Candidate BAT for feeding operationsAim BAT
Reduce nutrients in manure
• Use diets that match the animals’ needs in different stages of growth• Use equipment and methods that allow control and record keeping of
the amount of different feeds used• Train operators to carry out feeding operation according to require-
ments and minimising wastage
Reduce N in manure • Reduce the Crude Protein content in the diet by using addition ofamino-acids
Reduce P in manure• Reduce P additives by increasing P digestibility (for example by us-
ing phytase)• Use low-P feeds
Reduce volume of manure • Minimise the amount of water used in feedPrevent spillage during feed blend-ing operation
• Use adequate equipment and train operators in order to avoid spill-age. Set an appropriate maintenance program for equipment
Avoid spillage or uncontrolled dis-charge of waste water used forcleaning feeding equipment
• If rinse water is used, there must be adequate measures to avoid spill-age and to reuse the water, if possible, or to convey it in a storagetank.
Prevent spillage or leaking of liquidsfrom feed storage
• When liquid feed is stored before use, containers must be leak-proof.• Liquid feed management must avoid the possibility of spillage.• Operators have to be trained in order to manage feed avoiding spill-
age
Table 2. Candidate BAT for building construction and operationAim BAT
Maintain adequate welfare • Welfare regulations are a minimum requirement. Particular attentionhas to paid to materials, ventilation systems and space
Minimise manure volume • Use anti-spillage water supply systems• Maintain water supply systems properly in order to prevent breakage
and leaking• Avoid systems that use water to remove manure from the building
(flushing systems)• If periodical cleaning (disinfection) is performed, attention has to
paid in order to reduce the amount of cleaning water and/or solutionused (e.g., use high pressure equipment)
• Means have to be provided in order to avoid any rainfall entering thebuilding or manure storage
Prevent spillage or discharge ofcleaning water
• If periodical cleaning is performed, the dirty water produced has tobe collected and stored. Spillage and discharge have to be prevented
• Operators have to be trained in order to carry out the cleaning anddisinfection operation without spillage or discharge of the liquids
Prevent manure leaching • Tanks, channels and surfaces that are used to collect, convey andstore manure have to be leak proof and constructed according to theapproved standards
• Monitor tank contentsPrevent leakage/spillage of othersubstances (detergent, disinfectants,medicine, feed, carcasses, etc.)
• When other products, in liquid form or that can produce liquids, areused/stored in the farm, the storage has to be leak proof and adequatemeasures have to be used to avoid spillage or leaking
• Operators have to trained in order to manage the above productswithout causing leaching or spillage
Avoid soil and water contamination • When empty containers of potentially polluting substances are stored,adequate measures must be used to avoid any runoff (wash off) orleaching of residues
• Storage of the above containers has to be leakage proof and provideadequate means to collect and store the drainage liquid
• Follow the manufacturer recommendations in managing the productsand the containers

21
Table 3. Candidate BAT for manure transportAim BAT
Avoid leakage and spillage • Equipment used to transport manure, including the transfer of manureboth from the building to the storage and from the storage to thefields, has to be constructed and managed in order to avoid any spill-age and leakage
Table 4. Candidate BAT for external manure storage and treatmentAim BATAvoid leaching • Storage structures must be waterproof and built according to the ap-
proved standardsAvoid incorrect application to land • Storage capacity for liquid manure must be adequate to the farm
needs and in any case at least able to contain the manure and col-lected water produced by the farm in 6 months
Avoid leakage or spillage • Storage structures for solid manure must have an impermeable baseand drainage liquids must be collected and stored in approved struc-tures
• Storage for liquid manure and slurries must have adequate means toprevent accidental outflow of the manure (e.g. two valves in line)
• Contents must be monitoredReduce the amount of manure • External storage structures must be covered in order to exclude rain-
fallImprove manure handling and man-agement
• Depending on site-specific requirements, various degrees of treat-ment may be implemented, which may or may not affect environ-mental emissions. Treatment should not be viewed as a means toachieve a discharge to water resources. Treatment considered appro-priate are:• Solid / liquid separation• Anaerobic digestion with biogas recovery• Composting
Table 5. Candidate BAT for manure application to landAim BAT
Minimise emission to water & over-enrichment of soil
• Land application of manure must follow a field (or management area)based nutrient management plan drafted according to approved rec-ommendations and codes of good management practice, local byelaws, etc.
• Nutrient management plans must achieve a nutrient balance for theland limiting nutrient, by following current agronomic recommenda-tions that consider soil fertility status
• Operators have to be trained in order to use the equipment and tofollow the planned operations.
• In order to minimise emission to water, the equipment used mustguarantee a good evenness of spread and limit the amount of nutrientin a runoff event following manure application to land.
• The application of liquid manure on tillage land has to be performedby shallow injection or band spreading followed by incorporationwithin 4 hours.
• The application of liquid manure on grassland must be carried outwith trailing shoes or band spreader.
• The manure spreader must use means to assure that an even amountof manure is applied to land according to a specified load rate. Forliquid manure variable speed positive displacement pumps have to beused. For solid manure calibrated muck spreaders must be used.
• Operators have to be trained in order to use the equipment to spreadmanure according to prescription and to perform regular calibrationof the spreading equipment used.
• Manure transactions must be recorded, preferably electronically

22
Table 6. Candidate BAT for controlling atmospheric emissionsAim BAT
Minimise odour/gas emissions from house • Optimise crude protein in feed• Minimise manure storage time in house• Minimise surface area of manure• Minimise air contact with manure by proper
ventilation method• Minimise water spillage
Minimise odour/gas emissions from external ma-nure storage tanks
• Install cover on tank• Minimise surface area of manure• Avoid over agitation - only agitate when re-
moving• Fill and empty tanks below the liquid surface
Minimise odour/gas emissions from land applica-tion
• Use low trajectory application methods i.e.band spreading and/or injection
• Transport in leak-proof containersMinimise offsite odour impacts • Land spread during dry breezy conditions
during daylight hours (8 am-6 pm), early in themorning where possible
• Spread downwind of odour sensitive locations• Avoid spreading on public holidays, weekends
and eveningsMeasurement of odour/gas emissions to assessimpact and abatement technique
• Use approved method for:• Sampling procedure• Olfactometry• Gas analysis• Emission rate determination
Odour/gas abatement of exhaust ventilation airfrom livestock buildings
• Negative ventilation only• Biofilters• Bioscrubbers
Treatment of manure • Anaerobic digestion• To reduce odour/gas emissions• To produce biogas
Conflicting Technologies and Emerging Technologies
The simultaneous control of emissions to air, soil and water presents significant challengesbecause measures advised for controlling emissions to one media may exacerbate emissionsto another media. For example, agitation of slurry tanks is a recommended practice to im-prove the uniformity of manure application to land, but potentially increases losses of odoursand ammonia to the atmosphere. This underscores the need for site-specific conditions to beseriously considered when selecting BAT, in order to achieve the optimum emission controlfor the local environment.
Directive 96/61/EC requires that new techniques for emission control be constantly reviewed.In other words, the list of measures that constitute BAT is not static. A number of so-calledemerging technologies such as Hercules (The Netherlands), BioSor (Canada and France) andSolepur (France) currently exist and may achieve widespread acceptance in the near future.

23
Summary
It must be emphasised that Tables 1-6 represent only our current views on BAT for intensivepig and poultry rearing facilities in Ireland. These recommendations form the basis for ourfirst draft of a BAT statement for the Irish Environmental Protection Agency, and the Agencywill circulate the draft note widely for review and comment. Consequently, our currentthinking might change through the evolution of subsequent drafts, in response to commentsfrom reviewers both in and outside Ireland.
Acknowledgements
This work has been part funded by the Irish Environmental Protection Agency. We are par-ticularly grateful for the assistance of Dr. Vera Power, EPA’s technical advisor on the project,and to the BAT Reference Committee. We also express appreciation for those colleagues inDenmark, The Netherlands, Germany, Italy and America who took time from hectic schedulesto show us exemplary pig, poultry and related facilities in their respective countries.
References
Environmental Protection Agency, 1996a. Integrated Pollution Control Licensing BATNEECGuidance Note for the Pig Sector, Environmental Protection Agency, Wexford, Ireland,30 pp.
Environmental Protection Agency, 1996b, Integrated Pollution Control Licensing BATNEECGuidance Note for the Poultry Sector, Environmental Protection Agency, Wexford, Ire-land, 30 pp.
Harrison, J., 2000, Agriculture Environmental Management Systems, Available online athttp://www.ext.usu.edu/aems/what.htm.
Magette, W., T. Curran, V. A. Dodd, G. Provolo, C. Glennon & A. Quirke, 2000, Develop-ment and Testing of an Environmental Management System for Organic Wastes from In-tensive Pig and Poultry Units, Environmental Protection Agency, Wexford, Ireland (inpress).
Slizankiewicz, V., 2000, Final Report EMS Project, IWM Pty Limited, Toowong, Queens-land, Australia, 11 pp.’

24
THE ENVIRONMENTAL LOAD FROMOUTDOOR AREAS AND YARDS FOR PIGS
Hans von Wachenfelt1
Swedish University of Agricultural Sciences, Dept. of Biosystems and TechnologyP.O.Box 86, S-230 53 Alnarp, Sweden
Tel.: +46 40415485. Fax: +46 40415475. E-mail: [email protected]
Abstract
An investigation was conducted during 1997-2000 to determine the environmental load frompiglet-finishing pig production in a semi-outdoor production unit. The aim was to quantify theamount and concentration of nutrients in the runoff rainwater from outdoor dwelling areas du-ring winter conditions. The barn, with open front, had four deep litter pens, with a scrapeddung area and an outdoor area (4 × 4 m2) for each pen. The outdoor areas were constructed asnon-porous (concrete) and porous (gravel) pavements. The number of pigs per pen during themeasuring period was in average 21 including 2 sows during the weaning period.
The drainage and runoff water quantity as well as the quality from the outdoor areas were re-gistered and analyzed according to Swedish Standards (1991). The porous pavement had a se-aled canvas drained by a pipe to a collection well. The dominating parameters in the drainageand runoff water are BOD 7, COD, suspended substance and total solids content. Strong re-ductions were obtained in the porous pavements, but a problem could be the high amount ofsuspended substance and total solids content.
Key words: Nutrients, runoff rainwater, outdoor dwelling areas, winter conditions
Introduction
Organic farming is becoming more common in Sweden and to keep animals according to theEU-decree (No. 9310/99) and the national regulations (KRAV, 1999) there are requirementson daily access to outdoor areas and yards for the animals. On the organic farm where thestudy was carried out, the sow has two litters of piglets a year, normally one during the sum-mer season and one during the winter. Piglets and finishing pigs are raised on grassland du-ring summer and in barns with access to outdoor pavement in the winter period. In Swedenthe animal protection law SJVFS(1993:129) requires hardened surface areas where the animal
1 Author is Agricultural Engineer at Swedish University of Agricultural Sciences, De-partment of Agricultural Biosystems and Technology, Alnarp, Sweden.

25
traffic load is heavy. The purpose of using porous materials was to verify the degree of con-tamination in ground and surface runoff as well as to reduce the amount of manure contami-nated rainwater runoff that follows with hardened surfaces, according to White (1973).
In U.S.A. open feedlot systems have been studied regarding feedlot effluent for many years.Clark et al. (1975) concluded that precipation - runoff relations were linear, and that the qua-lity was variable at each location and depended on factors, such as rainfall intensity, duration,time since last runoff and stocking rate.
In 1994 Lott et al. examined solids of manure from Australian feedlots and differentiated twocomponents – large particles that would settle within 10 minutes (40 to 70% of total solids)and small particles that required extremely long settling times. Most of the work has been do-ne with different settling basin systems for collecting runoff from concrete feedloots to meetthe environmental requirements on detaining runoff during rainstorms (Gilberson et al., 1980,Edwards et al., 1980 and Lorimor et al., 1995).
The knowledge of runoff water quality caused by paved outdoor areas for pigs are fairly li-mited in Sweden. The investigation was conducted during the winters from 1998 to 2000 at anorganic farm in south Sweden.
Materials and methods
During two winter seasons, from November to May, pigs were kept in an open front barn withaccess to huts and deep litter beds. The four pens had a scraped dung area with urine drainagealong the aisle. Outside the aisle and in extension of the pens there was an outdoor area (4 ×4 m2) for each pen. The outdoor areas were constructed as nonporous (concrete) and porous(gravel) pavements (Figure 2), two of each model. The concrete area exposed to runoff had a4% slope. The number of pigs per pen during the mesurement period were in average 21 pig-let-finishing pigs for c. 154-160 production days, and 2 sows during the nursing period (7-8weeks).
From the non-porous surfaces the runoff was dischaged into a collecting groove and a depositwell and then piped to the measuring well. The porous pavement were made of a 500 mmthick layer of gravel on a sealed canvas drained by a pipe to a collection well. In the collectionwells the runoff and drainwater quantity were registered along with continuous sampling ofthe fluid concentration, which was analysed after each event according to Swedish Standards(1991).
Tipping buckets with an inductive sensor connected to a data-logger converted the signals tothe amount of fluid that passed per minute.

26
B B
A A
Figure 1. Plan drawing viewing the out-door areas.
MANURE- AISLE
OUTDOOR AREA
MANURE- AISLE
OUTDOOR AREA
A-A POROUS SURFACE
B-B NON-POROUS SURFACE
BARN
BARN
Figure 2. Section from porous- (gravel)and non-porous (concrete)pavements on outdoor areas.
The logger made the registration and displayed the amounts every 10 minutes. The bucketswere calibrated individually for 50 strokes per minute. Adjacent to the outdoor areas a wea-ther station collected precipitation (tipping bucket) and ambient temperature data (thermo-couple). The fluid concentration was sampled by buckets that were intermediately filled fromthe tipping buckets and collected.
The gravel media in 1998-99 was local earth from the under the mulch. The second year itwas replaced by lightweight ceramic bulbs (Leca) of 20 mm in diameter and washed 4-8 mmgravel as top layer. Earth samples were collected after each season to find out how much ofthe runoff it contained (Lindén, 1977).
Manure samples were collected in both the manure aisle and in the outdoor area during bothseasons, so that the nutrient concentration could be compared with the runoff concentration.
Results and discussion
The purpose of measuring the amount of runoff and its concentration was to examine the en-vironmental load from outdoor areas during winter conditions, but also during the rest of theyear. It mainly focused on COD, BOD, organic and inorganic nitrogen, phosphorus, and po-tassium, total solids and suspended solids.
The precipitation was 234-249 mm per season, and in average it never exceeded 2 mm withinone hour. In reality there were rainstorms with up to 2.5 mm of rain in 10 minutes, but this

27
happened less than 2-3 times per season in a time period of maximum 80 minutes. Both sea-sons had their snow melting period in the beginning of March. Rain often occurred in rain pe-riods, with more than 15 mm at a time within 3-4 days.
The first year the amounts of fluid from the outdoor areas surpassed the precipitation by 30%,but in the following years the fluids were reduced to 90% of the precipitation. The last seasonreduction of fluids compared to precipitation mainly is due to improved management of theoutdoor areas as well as flumes and sludge wells. From 20 April 2000 there was a four-weekdry period. In 2000 the number of pigs increased by 10% on the concrete paved areas, but de-creased by 55% on the porous pavements (small litters).
The liquid volumes from the outdoor areas as well as the precipitation were accumulated du-ring 12 rain periods each year, Figures 3 and 4. The concentration of nutrients is very muchdependent on the liquid flow per time period.
0
500
1000
1500
990107990202
990309990325
990414990511
Date
Lite
r/16
m2 ou
tdoo
r are
a
0
50
100
150
200
250
300
Prec
ipita
tion,
mm
Area A, concrete Area B, concreteArea C, gravel Area D, gravelPrecipitation
Figure 3. Accumulated amounts of fluid andprecipitation on different outdoorareas during 1999.
0
500
1000
1500
99-12-22 00-02-02 00-03-07 00-04-04
Date
Lite
r/16
m2 ou
tdoo
r are
a
0
50
100
150
200
250
300
Prec
ipita
tion,
mm
Area A, concrete Area B, concreteArea C, gravel Area D, gravelPrecipitation
Figure 4. Accumulated amounts of fluidand precipitation on differentoutdoor areas during 2000.
After a low flow period the concentrations rose and then fell again with the liquid dilution of ahigh flow in the rain period.
The average concentrations, calculated from 11 samples in 1999 and 10 samples in 2000, ofdifferent parameters are presented in Figures 5 and 6 and in Table 1. The dominant fractionsare COD and total solids content, but BOD and suspended substance are within the same ran-ge.

28
0
2000
4000
6000
8000
10000
12000
14000
A-1999,Concrete
A-2000,Concrete
B-1999,Concrete
B-2000,Concrete
C-1999,Gravel
C-2000,Gravel
D-2000,Gravel
Outdoor area
Con
cent
ratio
n, m
g/l
BOD 7
CODCR
Susp. substance
Total solids
Figure 5. The predominant fractions (average of 11 samples in 1999 and 10 samples in2000) in runoff from different outdoor areas for pigs during two seasons.
0
200
400
600
800
1000
1200
1400
1600
1800
A-1999,Concrete
A-2000,Concrete
B-1999,Concrete
B-2000,Concrete
C-1999,Gravel
C-2000,Gravel
D-2000,Gravel
Outdoor area
Con
cent
ratio
n, m
g/l
Kjelldahl-N
Total-N
Total-P
Total-K
Figure 6. Average nutrient concentration (11 samples in 1999 and 10 samples in 2000)in runoff from different outdoor areas for pigs during two seasons.
Most of the fractions from the concrete areas were reduced in concentration in the last measu-ring period, COD by 20-30%, total solids by >50% and suspended substance by 30-40%, andamong the nutrients the Kjelldahl-N dropped by > 50%, the total-N by c. 40-45%, and thetotal-P by c. 85%.
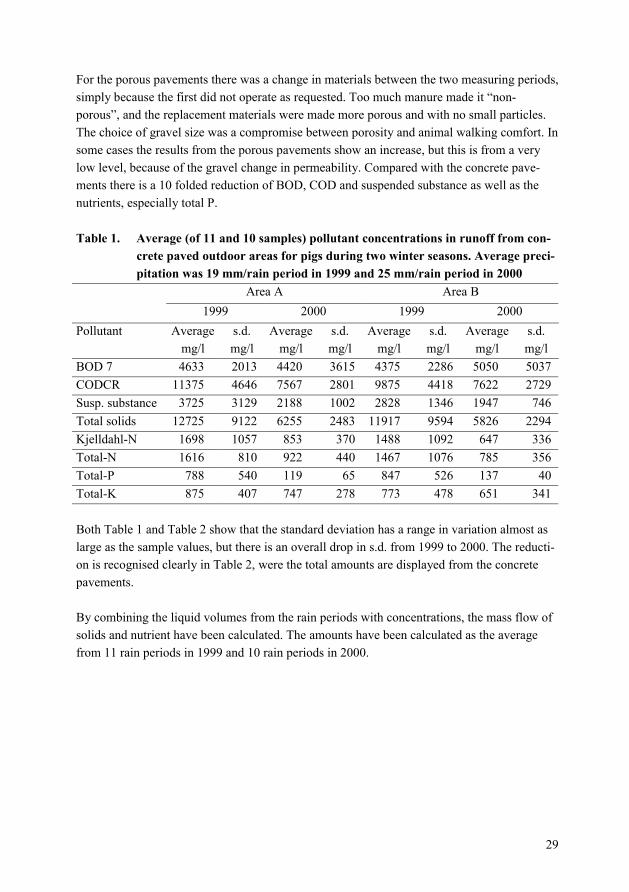
29
For the porous pavements there was a change in materials between the two measuring periods,simply because the first did not operate as requested. Too much manure made it “non-porous”, and the replacement materials were made more porous and with no small particles.The choice of gravel size was a compromise between porosity and animal walking comfort. Insome cases the results from the porous pavements show an increase, but this is from a verylow level, because of the gravel change in permeability. Compared with the concrete pave-ments there is a 10 folded reduction of BOD, COD and suspended substance as well as thenutrients, especially total P.
Table 1. Average (of 11 and 10 samples) pollutant concentrations in runoff from con-crete paved outdoor areas for pigs during two winter seasons. Average preci-pitation was 19 mm/rain period in 1999 and 25 mm/rain period in 2000
Area A Area B1999 2000 1999 2000
Pollutant Average s.d. Average s.d. Average s.d. Average s.d.mg/l mg/l mg/l mg/l mg/l mg/l mg/l mg/l
BOD 7 4633 2013 4420 3615 4375 2286 5050 5037CODCR 11375 4646 7567 2801 9875 4418 7622 2729Susp. substance 3725 3129 2188 1002 2828 1346 1947 746Total solids 12725 9122 6255 2483 11917 9594 5826 2294Kjelldahl-N 1698 1057 853 370 1488 1092 647 336Total-N 1616 810 922 440 1467 1076 785 356Total-P 788 540 119 65 847 526 137 40Total-K 875 407 747 278 773 478 651 341
Both Table 1 and Table 2 show that the standard deviation has a range in variation almost aslarge as the sample values, but there is an overall drop in s.d. from 1999 to 2000. The reducti-on is recognised clearly in Table 2, were the total amounts are displayed from the concretepavements.
By combining the liquid volumes from the rain periods with concentrations, the mass flow ofsolids and nutrient have been calculated. The amounts have been calculated as the averagefrom 11 rain periods in 1999 and 10 rain periods in 2000.

30
Table 2. Average amount of pollutant (of 11 and 10 samples) in runoff from concretepaved outdoor areas for pigs during two winter seasons. Average precipitati-on was 19 mm/rain period in 1999 and 25 mm/rain period in 2000
Area A Area B1999 2000 1999 2000
Pollutant Average s.d. Average s.d. Average s.d. Average s.d.kg kg kg kg kg kg kg kg
BOD 7 1.48 1.26 1.37 1.34 2.18 2.09 1.26 1.18CODCR 3.63 3.62 2.53 2.98 5.76 6.71 2.24 2.48Susp. Substance 1.19 1.64 0.71 0.73 2.46 4.64 0.60 0.65Total Solids 4.07 4.09 2.03 1.97 5.94 6.23 1.68 1.61Kjelldahl-N 0.48 0.46 0.31 0.35 0.76 0.71 0.18 0.23Total-N 0.54 0.69 0.33 0.37 0.74 0.68 0.23 0.26Total-P 0.28 0.23 0.04 0.04 0.33 0.33 0.04 0.04Total-K 0.26 0.22 0.24 0.22 0.39 0.29 0.18 0.16
Figure 7. The total amount from the predominant fractions (average of 11 samples in1999 and 10 samples in 2000) in runoff from different outdoor areas for pigsduring two seasons.
0
10
20
30
40
50
60
70
A-1999,Concrete
A-2000,Concrete
B-1999,Concrete
B-2000,Concrete
C-1999,Gravel
C-2000,Gravel
D-1999,Gravel
D-2000,Gravel
Outdoor area
Tota
l am
ount
in k
g/se
ason
BOD 7
CODCR
Susp. substance
Total solids
30
Table 2. Average amount of pollutant (of 11 and 10 samples) in runoff from concretepaved outdoor areas for pigs during two winter seasons. Average precipitati-on was 19 mm/rain period in 1999 and 25 mm/rain period in 2000
Area A Area B1999 2000 1999 2000
Pollutant Average s.d. Average s.d. Average s.d. Average s.d.kg kg kg kg kg kg kg kg
BOD 7 1.48 1.26 1.37 1.34 2.18 2.09 1.26 1.18CODCR 3.63 3.62 2.53 2.98 5.76 6.71 2.24 2.48Susp. Substance 1.19 1.64 0.71 0.73 2.46 4.64 0.60 0.65Total Solids 4.07 4.09 2.03 1.97 5.94 6.23 1.68 1.61Kjelldahl-N 0.48 0.46 0.31 0.35 0.76 0.71 0.18 0.23Total-N 0.54 0.69 0.33 0.37 0.74 0.68 0.23 0.26Total-P 0.28 0.23 0.04 0.04 0.33 0.33 0.04 0.04Total-K 0.26 0.22 0.24 0.22 0.39 0.29 0.18 0.16
Figure 7. The total amount from the predominant fractions (average of 11 samples in1999 and 10 samples in 2000) in runoff from different outdoor areas for pigsduring two seasons.
0
10
20
30
40
50
60
70
A-1999,Concrete
A-2000,Concrete
B-1999,Concrete
B-2000,Concrete
C-1999,Gravel
C-2000,Gravel
D-1999,Gravel
D-2000,Gravel
Outdoor area
Tota
l am
ount
in k
g/se
ason
BOD 7
CODCR
Susp. substance
Total solids

31
Figure 8. Total amount of nutrients (11 samples in 1999 and 10 samples in 2000) inrunoff from different outdoor areas for pigs during two seasons.
Each rain period corresponds with a liquid sample, which has been collected during the peri-od. The total amounts from the outdoor areas are presented in Figures 7 and 8 and in Table 2.Reduced concentrations paired with the amount of precipitation from the rain periods gives aneven larger reduction in total amounts for 2000 on the concrete paved areas, see Table 2. Allparameters that can be connected with manure have been reduced; the most noticeable isphosphorus. Potassium is water-soluble and is therefore easily lost in runoff.
Figure 9. Average amounts of solids and nutrients in manure and runoff from concreteoutdoor areas during winter in 1999 and 2000 in compared with solid manu-re from regular indoor pens (Kemira, 1998).
0
1
2
3
4
5
6
7
8
9
A-1999,Concrete
A-2000,Concrete
B-1999,Concrete
B-2000,Concrete
C-1999,Gravel
C-2000,Gravel
D-1999,Gravel
D-2000,Gravel
Outdoor area
Tota
l am
ount
in k
g/se
ason
Kjelldahl-N
Total-N
Total-P
Total-K
0
5
10
15
20
25
%Total Solids
kg/tTotal-N
kg/tTotal-P
kg/tTotal-K
Analysis parameters
Solid manure from pens, Kemira, 1998
Manure on concrete areas, 1999
Manure on concrete areas, 2000
Runoff from concrete areas, 1999
Runoff from concrete areas, 2000

32
In 1999, the runoff concentration is 30% of the manure on the concrete pavements, except forsolids, and in 2000 all pollutants are below 30%, Figure 9.
The conclusions from Clark et al. (1975) are illustrated in this study by the difference in con-centration between the rain periods during the season and the large variation from the averageconcentration. A major difference compared with the U.S. studies were that the outdoor areaswere cleaned 8 times a month. The large amount of solids from pig production areas has to beconsidered in planning the outdoor areas. With settling basins and cleaning one to two timesper month (Sutton et al. 1986) the runoff concentrations in 1986 were somewhat higher thanthe concentrations in 1999.
The reduction of pollutants that has taken place in this study is mainly achieved by better ma-nagement practice. The whole measuring system from pavement to measuring well was regu-larly cleaned. The porous pavements had a reduction in total mineral N from 1000-2000 kg/hato c. 20 kg/ha in 2000. The main reduction was made in BOD, COD and suspended substan-ces, but also in total-P.
Conclusions
Runoff from outdoor areas has a linear relation to precipation. The liquid quality depends onfactors as rainfall intensity, duration, time since last runoff and stocking rate. In a Swedishcontext the outdoor areas will probably have a more frequent cleaning and therefore a lowerrate of pollutant concentration. The amount of solids is a key factor to be able to handle therunoff as a liquid. Runoff concentration would benefit from designs that facilitate an easy cle-aning of the outdoor areas. In considering the amount of solids only non-porous pavementscan be recommended. A porous pavement could be useful to retain runoff after a settling ba-sement.
References
Clark, R.N., Gilbertson C.B. & Duke, H.R., 1975. Quantity and quality of beef feedyard ru-noff in Great Plains. In Managing Livestock Wastes. Proceedings of the 3rd InternationalSymposium on Livestock Wastes, American Society of Agricultural Engineers, St Joseph,MI.: 429-431.
Edwards, W.M., Owens, L.B., Norman, D.A. & White, R.K., 1980. A settling basin-grass fil-ter system for managing runoff from paved beef feedlot. Livestock Waste: A RenewableResource. Proceedings of the 4th International symposium on livestock Wastes: 265-273.ASAE, St Joseph. Michigan.
EU-decree No. 9310/99, 1999. European Union Council. Limite Agrileg 84, appendix 1B.Brussels, Belgium.
33
Gilbertson, C.B., Clark, R.N., Nye, J.C. & Swanson, N.P., 1980. Runoff control for livestockfeedlots – state of the art. Transactions of the ASAE 23(5): 1207-1202.
Kemira A/S, 1998. Handbook for farmers. (Håndbog for landmaen). Fredericia, Denmark.KRAV, national rules for organic pig production in Sweden, 1999.Lindén, B. 1977. Equipment for collection of soil samples from arable land (In Swedish.).
Swedish University of Agricultural Sciences. Dep. of Soil Sciences, Section for Plant Nu-trient. Report 129, Uppsala, Sweden. 46 pp.
Lorimar, J.C., Melvin, S.W. & Adam, K.M., 1995. Settling basin performance from two out-door feedlots. Seventh International Symposium on Agricultural and Food ProcessingWastes (ISAFPW95), p. 17-23. Chicago.
Lott, S.C., Loch, R.J. & Watts, P. J., 1994. Settling characteristics of feedlot cattle faeces andmanure. Transaction of ASAE, 37(1): 281-285. St Joseph, MI.
Sutton, A.L., Jones, D.O., Kelly, D.T., & Bache, D.H., 1986. Two types of runoff control sy-stems for open concrete swine feedlots. Applied Engineering in Agrilculture 1986, 2:2,193-198.
Swedish Board of Agriculture, 1993. Directions from the Swedish Board of Agriculture aboutanimal management in agriculture etc. (In Swedish.). Statens Jordbruksverks författnings-samling, SJVFS 1993:129, Jönköping, Sweden, 39 pp.
Swedish Standards, 1991. SIS No. 028123, SS Nos. 028113, 028118, 028122 SS 028143,SS28142/2, SS 028127/2, SIS 028131,SIS 028134, SIS 028133, NMKL No. 6-76 KT, SS028126/2, Flamfotometer, SS 028112 and SS 028113. Stockholm.
White, R.K., 1973. Stream pollution from cattle feedlot runoff. Ohio Water Resources CenterProject. Report No. 393. The Ohio State University.
34
QUANTIFICATION OF NITROGEN LOSSES, AND NUTRIENT FLOWIN STRAW BEDDED HOUSING SYSTEMS FOR CATTLE
Hans Benny Rom1*, Kaj Henriksen2, Preben Dahl1 & Morten Levring1.1Danish Institute of Agricultural Sciences, Dept. of Agr. Engineering, Research CentreBygholm, DK-8700 Horsens. Phone: +45 7629 6035. E-mail: [email protected]
2Aalborg University, Department of Civil Engineering, Sohngaardsholmsvej 57DK-9000 Aalborg, Denmark, Phone: +45 9635 8510. E-mail: [email protected]
Abstract
Two similar livestock units were designed for separate housing of 15 to 20 heifers on deeplitter in each unit. The two units were mechanically ventilated, and the air exchange rate wasrecorded as well as the emission of methane, carbon dioxide, nitrous oxide, water vapour andammonia. Carbon and nitrogen transformations were quantified for different feeding strategi-es during two winter housing periods. A mass balance of C and N in import of feed and ex-port of animal products and deep litter was determined. Aerobic microbial activity in the sur-face layers of the deep litter caused a temperature increase to a maximum of 40-50oC at 10 cmdepth. A high proportion of the ammonium was found more than 10 cm from the surface.Most of the ammonium was absorbed by the straw and thereafter transformed by micro-organisms to non-volatile organic N. Owing to the absorption and immobilisation, the ammo-nia volatilization was less than 8% of the nitrogen that was excreted and collected in the strawlitter. In the deep litter no nitrification and denitrification was measured, and in consequence,none or a very low concentration of nitrous oxide was determined. The nitrification and deni-trification processes were inhibited by low oxygen partial pressure, high temperatures and ahigh ammonia concentration. In the layers more than 10 cm from the surface the oxygen con-centration was low, and consequently, the methane production was high. Oxidation of metha-ne in the microbial active surface layers reduced the methane concentration significantly.Therefore, the daily methane emission was only 30-70 g C ton-1, corresponding to abt. 15% ofthe total methane and carbon dioxide emission from the deep litter.
Key words: Deep litter, cattle, gas emissions.
Introduction
Gaseous emissions from livestock manure have been given a high priority in the general opi-nion and among farmers during the last decade. Especially during the past year the environ-mental impacts from livestock housing systems in Denmark have been discussed in the mediaas well as during meetings and seminars in order to disseminate information among farmersregarding minimisation of ammonia emissions due to handling and storing of livestock manu-

35
re. Especially in organic farming systems the recycling of nutrients has high priority. In orderto achieve a high animal welfare level, deep litter housing systems are often used. But deeplitter has been assumed to contribute with a relatively high ammonia emission compared tohousing systems designed for handling of manure as slurry.
On the basis of results from a number of research activities in North and Central Europe thenitrogen emissions from deep litter systems for dairy cattle was estimated to be 15 to 25kg/cow per year, which was more than twice the emission from a cubicle house (Koerkamp etal. 1998). Karlsson & Jeppesson (1995) found the ammonia emission to be equivalent to12-13 kg/cow per year. It was notified that the ammonia emission particularly depends on themanure management – the more the bedding material was mixed up and aerated in the storageperiod, the higher the emission. Consequently, the handling and utilization of livestock manu-re will be significant in order to minimise the nitrogen losses to the atmosphere, contributingto deterioration of the air quality inside the building and to eutrophication of the external en-vironment.
In organic farming import restrictions of plant nutrients enhance the need for an efficient useof organic manure for plant production. Handling of deep litter in Denmark is characterisedby adding fresh straw daily on top of the existing layer of bedding material. So the beddingmaterial is not mixed up during the storage period inside the livestock building. Solid manurehas to be handled with care, because of the risk of great losses of C and N during collection inthe livestock buildings, during storage and after application in the field.
Aim of the studies
In this study C and N transformations in livestock buildings was quantified. Different feedingregimes were examined in order to give information about the gaseous emission from deeplitter and to develop handling methods aimed at minimising losses of plant nutrients.
Experimental layout
Two similar livestock sections with deep litter for heifers were employed. Each section wasdesigned for 15-20 heifers. The dimension of each section was 7.5 × 12 m. Owing to a slopedaccess area near the entrance to the section, the net area was approximately 78 m2, equivalentto app. 4.3 m2 per animal. The deep litter volume space was 0.8 m below ground level. Twomoveable feed troughs were used for ad libitum feeding of forage.
The sections were mechanically ventilated, and the air exchange rate was continuously recor-ded. In order to simulate the normal building design found in practise, the ventilation flowrate was pre-set to maximum airflow. The indoor temperature was almost the same as the out-

36
door temperature. The concentration of CH4, CO2, N2O and NH3 were measured continuouslyin the outlet duct. The measuring set-up was designed and calibrated according to Rom(1995). The gas fluxes from the bedding material was recorded on two occasions during theexperimental period (Table 1).
During both housing periods the N contents in the diet was equal in the two sections. Highand low water contents in the diet were provided in order to validate the effect on the emissi-ons of the two diets. In Section 1 the heifers were fed at a low water content, and in Section 2they were fed at a high water content. All drinking water, feed and bedding material inputswere recorded, and the total quantity of deep litter was weighed out when removed from thebuilding. The deep litter was removed once every three months in January/February and inMay.
The first housing period was characterised by a low protein diet to heifers; Section 1 combi-ned with low water content and Section 2 with a high water content. The second housing pe-riod was characterised by a high protein level diet combined with a low water content inSection 1 and a high water content in Section 2.
Table 1. Summary of recordings during the experimentsGases Climate Production level
Ammonia (NH3)Methane (CH4)Nitrous oxide (N2O)Carbon dioxide (CO2)
Ventilation flow rate (m3/h)Temp. incoming air (Toutdoor)Temp. outgoing air (Tindoor)Temp. bedding surface (Tbedding)
Feed consumption (kg/animal/day)Water consumption (kg/animal/day)Straw consumption (kg/animal/day)Daily gain (kg/animal/day)Deep litter quantity (kg/animal/day)
The gas emissions and climate conditions were continuously recorded during periods of mi-nimum 72 hours per week. The production level was recorded once a week or at the end of theexperiment. The estimation of the daily consumption, gain and produced deep litter was basedon the weekly records.
Results
During the first experimental period 18 heifers were housed in Section 1 and 18 in Section 2,respectively. The average body live weight (LW) of the animals was 358 kg in Section 1 and345 kg in Section 2, equivalent to 82.6 and 79.6 kg/m2 or 4.3 m2/animal. The diet was a lowprotein diet with or without beets (Table 2). According to the diet composition as described inTable 2, the protein level was relatively low, thus resulting in very low daily gain.

37
Table 2. Diet composition during the first experimental periodFeed type Unit Quantity in kg/animal/day
Section 1 Section 2Oct. - Feb. Feb.-May Oct.-Feb. Feb.-May
Straw kg/animal/day 5.9 8.1 5.6 6.8Silage kg/animal/day 2.2 2.7 1.8 2.3Beets kg/animal/day 10.8 10.5Grass pellets kg/animal/dayWater consumption: Section 1, 35.7 l/animal and Section 2: 31.1 l/animal.Bedding consumption: 12 kg of barley straw/animal/day. The consumption was equal for the two sections.
The bedding was removed from each section twice during the entire housing period fromOctober to May. The first removal took place in February and the second in May.
The total input was 11-12 kg dry matter per animal/day as feed and bedding. The total quan-tity of manure (deep litter) removed was in average 8-9 kg DM per animal/day. The averagetotal nutrient content in the deep litter ex building was 5.6 and 6.6 kg/t. The ammonium nitro-gen content was 0.97 and 1.3 kg/t. The carbon input (feed and bedding) was 5521 and 5537 gper animal/day. The equivalent carbon removal was estimated to 4099 and 3822 g per ani-mal/day, equivalent to a total carbon reduction of about 26 to 30%.
According to the nutrient balances, the average nitrogen excretion ex. animal was estimated tobe 76 g per animal/day for the group f at a with low water content and 86 g per animal/day forthe group fed at a high water content.
Table 3. Average mass balance for C, N and dry matter in the deep litter with a lowprotein diet composition, when removed after a 3 month period in section 1 (LW) and2 (HW), respectivelyNitrogen level Component Nitrogen
g N/animal/dayDry matter
kg DM/animal/dayCarbon
kg C/animal/dayLW1 HW1 LW HW LW HW
Low Total input2 184.9 181.6 11.3 11.2 5.5 5.5Bedding3 163.6 167.7 9.0 8.2 3.9 3.6Emission4 10.2 10.4Balance5 -0.5 3.0 2.3 3.0 1.7 1.9
1) LW; HW: Section 1 low water content (without beets) and section 2, high water content (includingbeets)
2) Total input is the sum of feed input and bedding input.3) Bedding: Deep litter when removed from the section4) Emission: Recorded NH3 emission from the section5) Balance: Balance (N) = total input – bedding – emission
Balance (DM) = total input – beddingBalance (C) = total input – bedding

38
The ammonia emission from the deep litter system was estimated at 10.2 to 10.4 g N per ani-mal/day, equivalent to 6-8% of excreted nitrogen. The methane emission was in average 386and 413 g per animal/day, respectively. The equivalent CO2 emission was 2844 and 2869 gper animal/day (Table 3).
During the second experimental period 16 heifers were housed in Section 1 and 16 in Secti-on 2, respectively. The average body live weight (LW) of the animals was 505 kg in Section 1and 513 kg in Section 2, equivalent to 103.6 and 105.2 kg/m2 or 4.8 m2/animal. The diet was ahigh protein diet with or without beets (Table 4).
Table 4. Diet composition during the first experimental periodFeed type Unit Quantity in kg/animal/day
Section 1 Section 2Oct.-Feb. Feb.-May Oct.-Feb. Feb.-May
Straw kg/animal/day 6.7 9.2 6.4 7.7Silage kg/animal/day 2.2 3.1 2.1 2.6Beets kg/animal/day 12.6 11.9Grass pellets kg/animal/day 4.5 2.6 4.9 2.9Water consumption: Section 1: 35.7 l/animal and Section 2: 31.1 l/animal.Bedding consumption: Section 1: 10.4 kg of barley straw/animal/day. Section 2: 10.7 kg of barleystraw/animal/day
The bedding was removed from each section twice during the entire housing period fromOctober to May. The first removal took place in February and the second in May.
Table 5. Average mass balance for C, N and dry matter in the deep litter with a highprotein diet composition, when removed after a 3-month period in Section 1(LW) and 2 (HW) respectively.
Nitrogenlevel
Component Nitrogeng N/Animal/Day
Dry MatterKg DM/Animal/Day
CarbonKg C/Animal/Day
LW1 HW1 LW HW LW HWHigh Total input2 302.7 (12.8) 263.1 (5.9) 11.3 (0.1) 11.6 (0.2) 5.4 (0.2) 5.6 (0.1)
Bedding3 285.6 (15.3) 246.6 (12.5) 11.9 (0.0) 11.7 (0.6) 5.1 (0.0) 5.0 (0.4)Emission4 14.6 (1.0) 12.0 (0.2)Balance5 2.5 (3.5) 4.5 (6.9) -0.6 -0.1 0.3 (0.1) 0.6 (0.5)
1) LW; HW: Section 1 low water content (without beets) and Section 2, high water content (including beets)2) Total input is sum of feed input and bedding input.3) Bedding: Deep litter when removed from the section4) Emission: Recorded NH3 emission from the section5) Balance: Balance (N) = total input – bedding – emission
Balance (DM) = total input – beddingBalance (C) = total input – bedding
The total input was 11-12 kg of dry matter per animal/day as feed and bedding. The totalquantity of manure (deep litter) removed was in average 11-12 kg DM per animal/day. Theaverage total nutrient content in the deep litter ex building was 6.9 and 6.1 kg/t, respectively.

39
The ammonium nitrogen content was 1.6 and 1.0 kg/t. The carbon input (feed and bedding)was 5438 and 5619 g per animal/day. The equivalent carbon removal was estimated at 5116and 4989 g per animal/day, equivalent to a total carbon reduction of about 4 to 17%.
According to the nutrient balances in Table 5, the average nitrogen excretion ex. animal wasestimated at 239 g per animal/day for the group fed at a low water content and 198 g per ani-mal/day for the group fed at a high water content.
From measurements of the gaseous concentration in the bedding material it was found that ahigh proportion of the ammonium was found more than 10 cm from the surface. The ammo-nia emission from the deep litter system was found to be 14.6 to 12 g N per animal/day equi-valent to 6-7 % of excreted nitrogen. The Methane emission was in average 465 and 608 g peranimal/day, respectively. The equivalent CO2 emission was and 4443 g per animal/day. In thedeep litter no nitrification and denitrification was measured, and in consequence, none or avery low concentration of nitrous oxide in the exhaust was determined.
Because of the emission measurements carried out on the deep litter surface it was estimatedthat the daily methane emission was only 30-70 g C ton-1, corresponding toabt. 15% of thetotal methane and carbon dioxide emission from the deep litter. The N2O emissions from thedeep litter and from the section was recorded.
Temperature increased rapidly below the surface to a maximum of 45-55°C at 10-12 cmdepth. Oxygen was only present in the upper 15-20 cm of the litter bed, whereas the air-filledpore volume of the deeper layers contained up to 60% CH4 and 40% CO2.
Only traces of N2O were measured in the upper 20 cm of the deep litter bed, and measure-ments of actual denitrification rates showed zero activity, except for a few samples with verylow denitrification rates. Consequently, the N2O emission from the sections were negligible.
Discussion
From measurements of the gaseous concentration in the bedding material a high proportion ofthe ammonium was found more than 10 cm from the surface. Most of the ammonium was ab-sorbed by the straw and thereafter transformed by micro-organisms to non-volatile organic N.Owing to absorption and immobilisation, the ammonia volatilization was less than 8% of theN that was excreted. This was significantly less than that found by Karlsson and Jeppesson(1995), who found 12-13 kg ammonia/cow per year equivalent to approximately 10-12% ofexcreted total nitrogen. In the deep litter no nitrification and denitrification was measured, andin consequence, none or a very low concentration of nitrous oxide was determined. The nitri-fication and denitrification processes were inhibited by a low oxygen partial pressure, hightemperatures and a high ammonia concentration. In the layers more than 10 cm from the sur-

40
face the oxygen concentration was low, and consequently, the methane production was high.An oxidation of methane in the microbial active surface layers reduced the methane concen-tration significantly.
The results indicate that both the nitrification and the denitrification processes are inhibited incattle deep litter beds both in the aerobic top layer and in the deeper anaerobic layers, owingto high ammonia concentrations and to some extent high temperatures (nitrification process).
Flux measurements of CO2, CH4 and O2 (static flux chambers) at the deep litter surfaceshowed that only 15% of the total gaseous carbon flux was methane, and the rest was carbondioxide. This indicates that most of the carbon mineralization occurs in the aerobic top layerof the deep litter.
During the first experiments the animals’ daily gain was very small. One reason could be theextreme low protein input. It was also notified that the transformation of carbon during the se-cond experiment was substantial low. The most significant reason may be data error for bed-ding input or deep litter output.
As expected, the ammonia emission was found to be influenced by the diet composition. Theemission may increase, because of an increasing content of nitrogen, which was demonstratedin the second experiment (Figure 1). By threefold higher nitrogen content in the feed the am-monia emission increased by 30%. In contrary the experiments did not find correlation betwe-en the water content in the diet and the ammonia emission.
0.0
10.0
20.0
30.0
40.0
50.0
1 3 5 7 9 11 13 15 17 19 21 23 25 27 29
Em
issi
on g
/ani
mal
/day
Feed excl.bee ts Feed incl.beets
Low protein feed High protein feed
Figure 1. Ammonia emission from one section with a low and high protein diet
Conclusion
Because of the absorption and immobilisation, the ammonia volatilization was only 6-8% ofthe nitrogen that was excreted and collected in the straw litter. In the deep litter no nitrificati-

41
on and denitrification was measured, and in consequence, none or a very low concentration ofnitrous oxide was determined. The nitrification and denitrification processes were inhibited bya low oxygen partial pressure, high temperatures and a high ammonia concentration. In thelayers more than 10 cm from the surface, the oxygen concentration was low, and consequ-ently, the methane production was high. The oxidation of methane in the microbial active sur-face layers reduced the methane concentration significantly. Therefore, the daily methaneemission was only 30-70 g C tonne-1 corresponding to abt. 15% of the total methane and car-bon dioxide emission from the deep litter. The loss of dry matter during the storing periodwas found to be 25-30% of the dry matter input.
The results indicate that both the nitrification and the denitrification processes are inhibited incattle deep litter beds, both in the aerobic top layer and in the deeper anaerobic layers, owingto high ammonia concentrations and to some extent high temperatures (nitrification process).
Flux measurements of CO2, CH4 and O2 (static flux chambers) at the deep litter surfaceshowed that only 15% of the total gaseous carbon flux was methane and the rest was carbondioxide. This indicates that most of the carbon mineralization occurs in the aerobic top layerof the deep litter bed.
References
Koerkamp, P.W.G. G.; Metz, H.M.; Uenk, G.H.; Phillips, V.R.; Holden, M.R.; Sneath, R.W.;Short, J.L.; White, R.P.; Hartung, J.; Seedorf,H.; Schröder, M.; Linkert, K.H.; Pedersen, S.;Takai, H.; Johnsen, J.O. &Walter, C.M. Concentrations and Emissions of Ammonia inLivestock Buildings in Northern Europe., 1998 Journal of Agric. Engineering Res. 70:79-95.
Karlsson S. & Jeppson K.-H., 1995. Djupströbädd i stall och mellanlager (Deep Litter in Live-stock Buildings and field Storages). JTI-rapport 204. Jordbrugstekniska institutet, Ultuna-Uppsala, Sverige. 120 pp.
Kyllingsbæk, A,; Rom, H.B.; Sommer, S.G.; Petersen, P.; Kroman, H. & Knudsen, L., 1998.Teknik, ab stald og lager. (Technical issues (ex livestock building and store) In: DamgaardPoulsen, H. & Kristensen, V.F. (Edit.), 1998. Standard Values for Farm Manure. A Revalua-tion of the Danish Standard Values concerning the Nitrogen, Phosphorus and PotassiumContent of Manure. DJF Report No. 7 41-52.
Rom, H.B., 1995. Ammonia Emission from Pig Confinement Buildings. System Analysis andMeasuring Methods. Ph.D. Thesis. The Royal Veterinary and Agricultural University,Copenhagen. Denmark.
Rom, H.B.; Petersen, J.; Sommer, S.G.; Andersen, J.A.; Poulsen, H.D.; Kristensen, V.F.; Han-sen, J.F. & Kyllingsbæk, A. & Jørgensen, V., 1999. Teknologiske muligheder for reduktion afammoniakfordampningen fra landbruget (Technological means for reduction of ammoniaevaporation from farms).Partial report No. 2. DIAS.
42
LOW COST AEROBIC STABILISATIONOF POULTRY LAYER MANURE
K.A. Smith*, D.R. Jackson & J.P. MetcalfeADAS Wolverhampton, Woodthorne, Wolverhampton, WV6 8TQ, UK
Abstract
A prototype, low-rate ventilation system, for the in-situ treatment of deep pit layer manure hasbeen developed using small fans and air ducted beneath the accumulating manure via perfo-rated plastic pipe. The system has proved capable of generating high dry matter poultry manu-re, at reasonable cost. Based on the study findings, the costs might be contained withinc. £3.60 per tonne of manure, or 14 p per bird, by using low cost night-time electricity. Thesecosts might be at least partially recovered by the observed, improved utilisation of manure ni-trogen (N) in crop production.
The drying process, once effectively established, appears to significantly reduce ammoniaemissions during the production cycle. The process results in an apparently stabilised manureproduct, with a consistently lower ammonium-N (NH4-N) content and increased uric acid-Ncontent, compared with untreated layer manure. Nitrogen in the “stabilised” manure appearsto be utilised by crops consistently more efficiently than untreated layer manure N. Manureuric acid + NH4-N (UAN) or NH4-N content are the currently accepted standards for estima-ting the N supply potential of layer manure following land application. However, field expe-riments using the differentially treated manure, suggested that uric acid content, on its own,may provide a more reliable estimation.
Key words: Poultry manure, treatment, drying, ammonia, nitrogen utilisation.
Introduction
Poultry layer manure is potentially valuable sources of plant nutrients, but, because of theirvariable nature and high moisture content (60-70%) (Nicholson et al., 1996), are difficult tostore, handle and utilise consistently. In addition, they are commonly associated with seriousodour and fly nuisance; a survey of local authorities in the UK, in 1995/96, showed that poul-try units represented about 30% of the livestock premises causing “justifiable” odour com-plaints (MAFF, 1998). Poultry production is also estimated to be a major source of ammonia(NH3) emissions from UK agriculture, at around 42 kt NH3-N per year. This comprisesc. 29 kt from housing and 12.3 kt from land spreading and represents about 18% of the 230 ktNH3-N annual emissions (Misselbrook et al., 2000).

43
The majority of caged layers in the England and Wales (c. 60 %, housing, or some 50% of theadult layer population of 33.9 million birds) are based on deep pit systems (Mercer, 1993).Deep pit houses are particularly associated with odour nuisance and ammonia emissions, be-cause of the anaerobic conditions and extended storage requirement. Houses with belt andscraper-clean systems are normally considered to present less of an ammonia and smell nui-sance risk, due to regular (daily or every few days) manure removal. Moreover, because ofhigh moisture content and the risk of nuisance, layer manures are much less attractive to al-ternative outlets than litter-based manures; either to non-fossil fuel burning power stations, orspreading on neighbouring farms. It is clear that a treatment system capable of generating adrier, “cleaner” product, less attractive to flies and with reduced odour, would offer conside-rable advantages to both poultry producers and the environment. This project investigated thefeasibility of a simple treatment system for deep-pit layer manure, also testing effects on ma-nure quality and utilisation, odour and ammonia emissions and allowing a preliminary eco-nomic assessment.
Material and methods
Background to system designThe end product of most of the metabolised nitrogen (N) in birds is uric acid (C5H4N3O4),rather than the urea (CO(NH2)2) produced in mammals. Uric acid is relatively insoluble, and itcan be excreted as a thick paste, at the expense of less water than is involved in urea excreti-on. Once uric acid is voided in droppings, it is potentially easily converted to NH4-N by mi-cro-organisms. Uric acid degradation will occur via several stages and the activity of bothaerobic and anaerobic, uricolytic bacteria and some other micro-organisms before the conver-sion of glycolate and urea to NH3 and CO2. Moisture content, pH and temperature have beenidentified as the most important parameters of litter composition, with regard to the degrada-tion of N-containing compounds into NH3. Increasing water content, in particular, leads to anincrease in the microbial degradation of these components (Groet Koerkamp & Elzing, 1996).
Ventilated drying of layer manure in battery cage systems, using air-supply tubes over themanure cleaning belts, has been shown to be effective in reducing NH3 emission as manuremoisture content fell, with a sharp decrease in emission evident at dry matter contents above60 % (Groet Koerkamp et al., 1995). Composting of mixtures of manure and litter will alsoreduce the moisture content of the mixture very effectively. However, this is associated withincreasing microbiological activity, usually with increasing temperature (up to 60-70°C),which will encourage a substantial loss of NH3 (Sommer et al., 1999). Therefore, the aim ofthe system was to encourage air movement in and around the stored manure and to promotethe removal of moisture at relatively low temperatures.
System design was approached, initially at a small pilot-scale, with air supplied via perforatedplastic pipes laid across the base of small heaps (3-4 tonnes) of layer manure. Fresh manure

44
was laid over the pipe at the start of the run, or added on a cumulative (near-daily) basis, tosimulate conditions in the commercial deep pit house. These preliminary studies included de-tails of fan operating regime, manure temperature, ambient conditions and manure analysis.Relative humidity (RH), fan air flow and manure moisture balance, allowed preliminary esti-mates of the capacity for water removal and a provisional design for larger-scale studies.
On-farm treatment system studiesAn on-farm study was initiated in February 1998, at a conventional, 10000 bird commercialdeep pit house in Staffordshire. Prior to the introduction of birds, perforated plastic pipes werelaid along the floor of the pit, in the position of each manure windrow. Small electric fanssupplied air, intermittently, to the manure collecting in the storage pit. In the first study, airsupply pipes were laid along the end third of each of five manure windrows and comparedwith untreated manure (control), in the lower third of the house. Plastic sheeting partitions di-vided the pit into three sections, with a buffer zone between the treatment and control areas.This allowed a meaningful comparison of ammonia emissions during storage of treated anduntreated manure (Figure 1). Observations included treatment fan use and house ventilationrates (fan calibration and logged fan operation time). Ammonia concentrations within the pit(diffusion tubes), manure temperature, manure sampling and analyses and examination forpresence and level of Salmonella spp. and E. coli were also recorded. Fly larval infestationand predatory invertebrates were monitored and odour offensiveness of the manure was asses-sed towards the end of the cycle.
TREATED BUFFER CONTROL
Exhaust fansTreatment fan
* 1
* 4
* 5
* 8
º 2
º 3
º 6
º 7
Non-perforatedduct
Perforated duct
Ammonia diffusion tube sampling heights: * 1 m, º 2 m
Figure 1. Manure treatment in deep pit building, Staffordshire, 1998. Plan view show-ing layout of manure collection pit, exhaust fans, ducting for supply of dryingair and ammonia diffusion tube sampling positions.
In January 1999, a further study, in a different house on the same commercial unit, was set up.The design of this experiment was similar to the previous one, except for some modifications
45
to the manure ventilation, involving replacement of the single large diameter duct (c. 20 cm),with two narrower (c. 12 cm) ducts; this was aimed at achieving better air distribution andmore efficient drying.
Field studies on the utilisation of manure nitrogenSmall plot experiments were undertaken, to assess the effectiveness of treated and untreatedmanure as an N source for either spring barley or silage grass test crops, using the manure ge-nerated by each of three treatment runs. Experimental sites were at ADAS Gleadthorpe,(spring barley, 1998) and at the poultry farm in Staffordshire (silage grass in 1998 and twoexperiments on silage grass, 1999).
Results and discussion
Manure drying studiesThroughout the discussion of results, the manure subjected to the drying treatment is referredto as “vented” manure and the untreated control, as “unvented”. Results of the first commer-cial unit study are summarised in Figure 2a. For the first 50-60 days, drying of the manurewas rather ineffective, with little difference in manure DM content, between vented and un-vented and with no differences in ammonia emissions apparent. Thereafter, results from thisstudy, completed in October-November 1998, were very encouraging and showed that a ma-nure product of almost 80% DM can be achieved (compared with around 40% DM for un-vented material). Also, it was apparent that NH3 losses via air exhausted from the pit can bereduced by up to 50%, once effective manure drying has been achieved (Figure 2a). The ini-tially disappointing results coincided with a period of low ambient temperatures and wetweather when, no doubt, the air drawn through the stored manure by the fan was of high rela-tive humidity (RH), with little capacity for water absorption and, therefore, manure drying ca-pability.
Design of a second “treatment run” on the commercial unit was modified to allow buildingexhaust air, rather than outside ambient air, to be drawn through the ducting placed beneaththe manure. The aim was to use warmer (and drier) air for ventilation to facilitate more rapidearly drying. Further modifications involved replacement of the single large diameter duct(20 cm), with two narrower (12 cm) ducts; this was aimed at achieving better air distributionand more efficient drying. Despite commencing this study in January 1999, when low ambi-ent temperature and high RH might, again, have been expected to impede effective treatment,the results suggested that significant drying could be achieved and an increase in manure DMof c. 20%, was apparent early in the cycle (Figure 2b). However, extreme wetness of the ma-nure was a problem in this house, because of drinker leakage and scouring problems in theflock. The unvented manure remained at a very low DM content throughout the study.
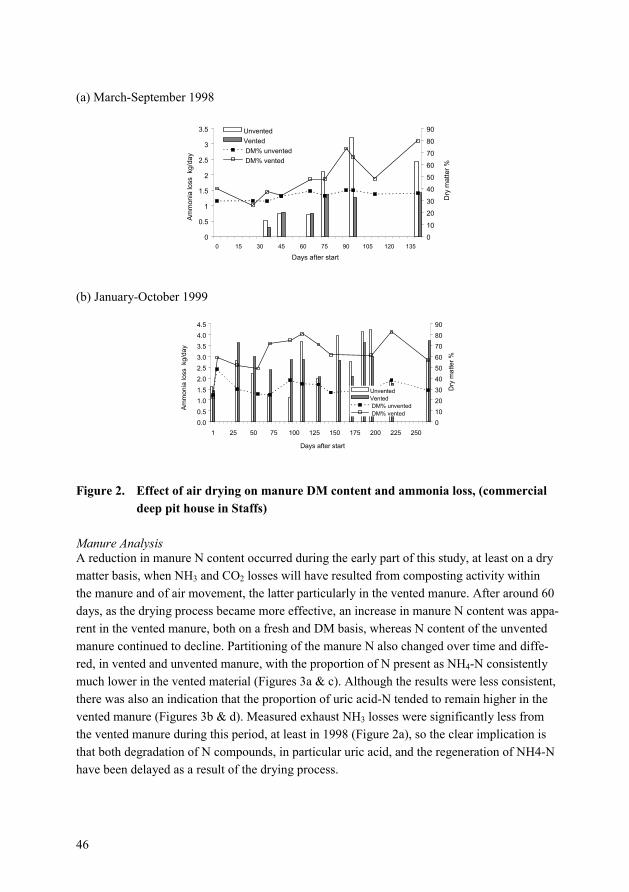
46
(a) March-September 1998
0
0.5
1
1.5
2
2.5
3
3.5
0 15 30 45 60 75 90 105 120 135
Days after start
Dry
mat
ter %
0
10
20
30
40
50
60
70
80
90
Amm
onia
loss
kg/
day
UnventedVented DM% unvented DM% vented
(b) January-October 1999
0.00.51.01.52.02.53.03.54.04.5
1 25 50 75 100 125 150 175 200 225 250
Days after startD
ry m
atte
r %
0102030405060708090
Amm
onia
loss
kg/
day
UnventedVented DM% unventedDM% vented
Figure 2. Effect of air drying on manure DM content and ammonia loss, (commercialdeep pit house in Staffs)
Manure AnalysisA reduction in manure N content occurred during the early part of this study, at least on a drymatter basis, when NH3 and CO2 losses will have resulted from composting activity withinthe manure and of air movement, the latter particularly in the vented manure. After around 60days, as the drying process became more effective, an increase in manure N content was appa-rent in the vented manure, both on a fresh and DM basis, whereas N content of the unventedmanure continued to decline. Partitioning of the manure N also changed over time and diffe-red, in vented and unvented manure, with the proportion of N present as NH4-N consistentlymuch lower in the vented material (Figures 3a & c). Although the results were less consistent,there was also an indication that the proportion of uric acid-N tended to remain higher in thevented manure (Figures 3b & d). Measured exhaust NH3 losses were significantly less fromthe vented manure during this period, at least in 1998 (Figure 2a), so the clear implication isthat both degradation of N compounds, in particular uric acid, and the regeneration of NH4-Nhave been delayed as a result of the drying process.
46
(a) March-September 1998
0
0.5
1
1.5
2
2.5
3
3.5
0 15 30 45 60 75 90 105 120 135
Days after start
Dry
mat
ter %
0
10
20
30
40
50
60
70
80
90
Amm
onia
loss
kg/
day
UnventedVented DM% unvented DM% vented
(b) January-October 1999
0.00.51.01.52.02.53.03.54.04.5
1 25 50 75 100 125 150 175 200 225 250
Days after start
Dry
mat
ter %
0102030405060708090
Amm
onia
loss
kg/
day
UnventedVented DM% unventedDM% vented
Figure 2. Effect of air drying on manure DM content and ammonia loss, (commercialdeep pit house in Staffs)
Manure AnalysisA reduction in manure N content occurred during the early part of this study, at least on a drymatter basis, when NH3 and CO2 losses will have resulted from composting activity withinthe manure and of air movement, the latter particularly in the vented manure. After around 60days, as the drying process became more effective, an increase in manure N content was appa-rent in the vented manure, both on a fresh and DM basis, whereas N content of the unventedmanure continued to decline. Partitioning of the manure N also changed over time and diffe-red, in vented and unvented manure, with the proportion of N present as NH4-N consistentlymuch lower in the vented material (Figures 3a & c). Although the results were less consistent,there was also an indication that the proportion of uric acid-N tended to remain higher in thevented manure (Figures 3b & d). Measured exhaust NH3 losses were significantly less fromthe vented manure during this period, at least in 1998 (Figure 2a), so the clear implication isthat both degradation of N compounds, in particular uric acid, and the regeneration of NH4-Nhave been delayed as a result of the drying process.

47
(a) NH4-N March-September 1998 (b) Uric acid-N March-September 1998
0
25
50
75
100
1 26 62 94 207Days after start
NH
4-N
in T
N % Unvented
Vented
0
25
50
75
100
1 26 62 94 207
Days after start
Uric
aci
d-N
in T
N % Unvented
Vented
(c) NH4-N Jan-October 1999 (d) Uric acid-N Jan-October 1999
0
25
50
75
100
1 111 194 224 267Days after start
NH
4-N
in T
N %
UnventedVented
0
25
50
75
100
1 111 194 224 267Days after start
Uric
aci
d-N
in T
N % Unvented
Vented
Figure 3. Effect of air drying on total-N content of manure, results on fresh and DMbasis (commercial deep pit house in Staffs)
Odour offensivenessTowards the end of the two on-farm treatment and monitoring periods, odour strength and of-fensiveness assessments of samples of treated and untreated manure were made by means ofan odour panel and according to methodology similar to that described by Smith et al., 1980.Sub-samples of vented and unvented manure samples were collected towards the end of theexperimental runs and placed in plastic containers and covered with a thin, odourless cloth, toavoid visual stimulus influencing the result, with horticultural peat used as an “odourless”blank. Results from the first samples collected in early September, 1998, (190 days after thestart of treatment), indicated a reduction in offensiveness of 25% (p <0.001) and in odourstrength of 20% (p = 0.005), as a result of treatment.
Field studies on utilisation of manure nitrogenDrying of manure and reduction of NH3 emissions during the egg production cycle will be oflittle benefit if the conserved N is lost by NH3 volatilisation following land application of thevented manure. Therefore, field assessments of manure N utilisation, including a controlledcomparison of vented and unvented manures, were an important objective of the study.
Crop yields (not presented here) were sometimes modest but were, consistently, significantlyincreased (P >0.05) by the vented manure treatment, in all four experiments. The fertiliser e-

48
quivalent, manure N efficiency and apparent N recovery were significantly increased for thedried manure, except from the initial pilot treatment at Gleadthorpe where the increases didnot reach statistical significance (P <0.05). The experimental design included two manure ap-plication rates, which was a necessary compromise to allow for the differential N content ofthe dried and unvented manure products and to provide a balanced comparison of the effecti-veness of the manure N at similar levels of N supply. It can be seen from the linear relations-hip between fertiliser N equivalent (FEQ) and rate of manure N applied (Fig. 5) that, withinthe range of rates tested, application rate had little effect on N utilisation efficiency. The data,however, did suggest a systematically increased FEQ (and efficiency) and a more consistentcrop response as a result of manure treatment. This observation appears to be attributable tothe higher proportion of manure N present as uric acid and, possibly, the likely reduction inNH3 volatilisation losses following application of the “stabilised”, vented manure.
y = 0.29xR2 = 0.89y = 0.29xR2 = 0.89
y = 0.13xR2 = -0.05y = 0.13xR2 = -0.05
0
20
40
60
80
100
120
0 100 200 300 400Manure N applied kg/ha
Fert
equi
v. k
g/ha
UnventedVented
Figure 5. Relationship between rate of manure N applied and fertiliser N equivalentmeasured in field experiments
The recent convention for estimating likely available N supply from poultry manures has beenbased on the uric acid-N + NH4-N (UAN) content (Chambers et al., 1999). However, therather limited data available from these field experiments suggest that UAN is not necessarilya good predictor of likely N supply from poultry manures, whereas uric acid-N, on its own, israther more successful.
Treatment costsA preliminary estimate of costs has been made on the basis of the materials used, the volumeof manure treated and the running costs (i.e. electricity).
From the 8 m length of treatment run, the manure production is estimated as follows:
5 birds/cage × 2 cages/m × 4 levels × 2 sides = 80 birds/m run of building
80 birds/m run × 4 rows × 0.115 kg manure/bird per day = 36.8 kg/m per dayFor 8 m of row length treated = 294.4 kg per day
Production over 333 days = 98.04 tonnes (say 100 tonnes)

49
MaterialsThe main duct was recovered after the trial. The lateral ducts were not recovered.100 mm drainage pipe is costed at 0.75 p/metre. A total of 65 metres of ducting were used,costing £49.00. The fan was rebuilt after the second trial at a cost of £800. It would normallybe expected to last 10 years and has been costed at £80 per year.
Running costsThe fans operated for 10 hours a day over a period of 333 days: i.e. 333 days × 10 hours ×3 kW = 9990 kWh. With electricity costed at £0.063/kwh, running costs = £629. The totalcosts based on these pilot runs are therefore calculated as follows:
Item Total cost, £ Costs, £ / tonne Costs, £/1000 birds
Duct work 48.75 0.49 19.04Fans 80.00 0.80 31.25Electricity 629 6.29 245.70Total cost 757.75 7.58 296.00
Within this study, fan noise and the proximity of domestic dwellings precluded the possibilityof nighttime fan operation and therefore significantly lower costs. Moreover, the fan had ca-pacity to supply air to a larger number of cages than represented by the trial and so these costswould normally be dispersed over a larger number of birds and manure output than has beenconsidered in the above calculations. The option of nighttime ventilation is estimated as likelyto reduce treatment running cost by £4.00 per tonne, giving a possible treatment cost of £3.58per tonne.
Conclusions
A prototype system, for the in-situ treatment of deep pit layer manure has been developed,which has proved capable of generating a high DM poultry manure at reasonable cost. Thesecosts might be contained within c. £3.60 per tonne of manure, or 14 p per bird, based on theuse of cheaper nighttime electricity.
The fans and ducted air facilitate moisture removal from the manure, whilst keeping in-heapmanure temperature down and reducing the potential composting effect during storage. Thereduced manure moisture content, lower temperatures and reduced pH (due to reduced NH4-Ncontent), factors known to contribute to reducing the rate of degradation of uric acid, explainthe reduction in ammonia emissions associated with the venting treatment. The vented manureappears to be “nitrogen-stabilised”, with a consistently lower NH4-N content and increaseduric acid-N content, compared with unvented layer manure. This “stabilised” manure N hasbeen shown by the results of this project to be utilised consistently more efficiently than un-

50
vented layer manure N and, it is likely that NH3 emissions following land application of thismaterial will be significantly reduced.
Acknowledgements
The authors gratefully acknowledge funding for this research, provided jointly by MAFF, En-vironment Agency and the BOC Foundation.
References
Chambers, B.J., Lord, E.I., Nicholson, F.A. & Smith, K.A., 1999. Predicting nitrogen availa-bility and losses following application of organic manures to arable land: MANNER. SoilUse & Management 15: 137-143.
Groet Koerkamp, P.W.G., Keen, A., Niekerk, Th.G.C.M. van & Smits, S., 1995. The effect ofmanure and litter handling and indoor climatic conditions on ammonia emissions from abattery cage and an aviary housing system for laying hens. Netherlands Journal of Agri-cultural Science, 43: 351-373.
Groet Koerkamp, P.W.G. & Elzing, A., 1996. Degradation of nitrogenous components in andvolatilization of ammonia from litter in aviary housing systems for laying hens. Transacti-ons of the ASAAE, 1996, 39 (1): 211-218.
MAFF, 1998. Code of Good Agricultural Practice for the Protection of Air. Ministry of Agri-culture, Fisheries and Food and Welsh Office Agricultural Dept. PB 0618, MAFF Publica-tions, London.
Mercer, D.R., 1993. Estimates of the numbers and types of poultry housing in use in England& Wales. Report to MAFF, May 1993.
Misselbrook, T.H., Pain, B.F., Jarvis, S.C., Chambers, B.J., Smith, K.A., Webb, J.D., Phillips,V.R. & Sneath, R., 2000. Ammonia emission and deposition from livestock production sy-stems. Ammonia emission inventory for agriculture in the UK. MAFF Contract WA0630,Final report, March, 2000.
Nicholson, F.A., Chambers, B.J. & Smith, K.A., 1996. Nutrient composition of poultry manu-res in England and Wales. Bioresource Technology 58: 279-284.
Smith, K.A., Drysdale, A. & Saville, D., 1980. An investigation into the effectiveness of someodour control treatments in stored pig manure. NZAEI Project Report: 24, New ZealandAgricultural Engineering Institute.
Sommer, S.G., Dahl, P., Rom, H.B. & Moller, H.B., 1998. Emissions of ammonia, nitrousoxide, methane and carbon dioxide during composting of deep litter. In Actes de Colloque,8th International Conference on Management Strategies for organic waste use in Agricultu-re, Eds. J Martinez & M.N Maudet: 157-169.

51
STORAGE OF MANURE IN HEAPS
Maarit PuumalaAgricultural Research Centre of Finland, Institute of Agricultural Engineering
Vakolantie 55, FIN-03400 Vihti, Finland, e-mail: [email protected]
Abstract
In this paper the possibility of storing manure in heaps is discussed. For this purpose heaps offour different classes of manure were put up. Samples from the manure were taken both whenpiling and unloading the heaps. Temperatures and rates of ammonia emission from each heapwere measured. Effluents from every heap were collected. The total rate of the effluents weremeasured and their nutrient content of them was analysed. From the results of the nutrientcontent analyses a rough estimation of total nitrogen losses from the heaps was made. Recom-mendations for storing manure in heaps are given.
Key words: manure, heap, nutrient losses.
Introduction
In Finland manure from livestock is mainly stored in manure stores. According to an EU fun-ded environmental programme for Finnish agriculture the capacity of these stores has to befor 12 months. If the cattle have the opportunity to go to the pasture, a capacity of 8 monthswill be allowed. On many farms the capacity of manure stores is too small, and some arran-gements to store the excess manure have to be made. Storing the manure in heaps is the mostcommon way of handling this situation. After 1998 storage of manure in a heaps can be al-lowed with a permit issued by a competent authority. On organic farms manure is also storedin heaps, because the manure has to be composted before it can be spread to the fields. In bothcases the storage of manure must be done in an environmentally acceptable manner. The aimof this project was to find out what kind of manure can be stored in heaps, what happens tothe manure during the storing period, and what are the environmental impacts of heap storage.
Materials and methods
Four different class of manure was used in this project; peat litter from broiler houses, saw-dust bedding from horse stables, dry manure with straw from dairy cows and a pre-compostedmixture of pig slurry and peat. Different type of beds were built up for the heaps, and more-over, arrangements for collecting effluents from the heaps were built up.

52
All other classes of manure, except peat litter from broiler houses, had a solid slab. For saw-dust and dairy cow manure the slab was made of concrete, and for the pre-composted manureit was made of asphalt. The concrete slabs were similar in shape. There were low wallsaround the slab, and in the middle of the slab there were grooves to collect effluents from theheap to wells. There were also low walls around the asphalt slab for pre-compost. But thewhole slab was sloping towards a straw filter through which the effluents from the heaps werecollected into wells.
For the first period of follow-up the peat litter heaps from broiler houses were placed on sandbeds. Under the sand there was a plastic sheet and drainage pipes to recollect the effluents towells. For the second period of follow-up two of the heaps were made directly on the plasticsheets without any sand. And the drainage pipes were at the bottom of the heaps. The thirdheap was laid directly on the surface of the field without any plastic sheets or drainage pipes.The aim was to control the changes of nutrient content in the surface layer of the field.
The heaps were covered with different covering materials. For peat litter pure peat was used,for dairy cow manure pure peat and plastic sheets were used and for pre-compost a specialsheet designed for compost heaps was used as covering material. The heaps of horse sawdustmanure were not covered because the slab was situated on a windy place and plastic or othersheet covers would not have remained on the heaps. And moreover, as the sawdust heaps we-re turned over, the covering would have to be removed several times.
The temperatures during the storing period were measured from all the heaps. From broilerlitter and dairy cow manure the temperatures were measured once a month during the firstfollow-up period. During the second period the temperatures were at first measured once aweek then every second week finally, once a month. From the pre-compost the temperatureswere mainly measured a couple of times during the storing period. For one period observati-ons were made more intensively, and the temperatures were measured every week. From thehorse sawdust the manure temperatures were measured from heaps of different age and alsoafter turning over the heap. The aim was to determine the state of the composting process inthe heaps.
Emission of ammonia was measured from the heaps by the Dräger measuring device. Themeasuring technique shows how much ammonia volatilises from a certain point during themeasuring period. Total emissions from the heaps can not be measured by use of this techni-que. But the effects of different covering materials to the emissions can be measured.
The nutrient contents in the heaps were determined from samples taken as the heaps were pi-led and as they were unloaded. Nutrient contents were also determined from the effluentscollected to the wells. From this data a rough estimate of nutrient losses was made.
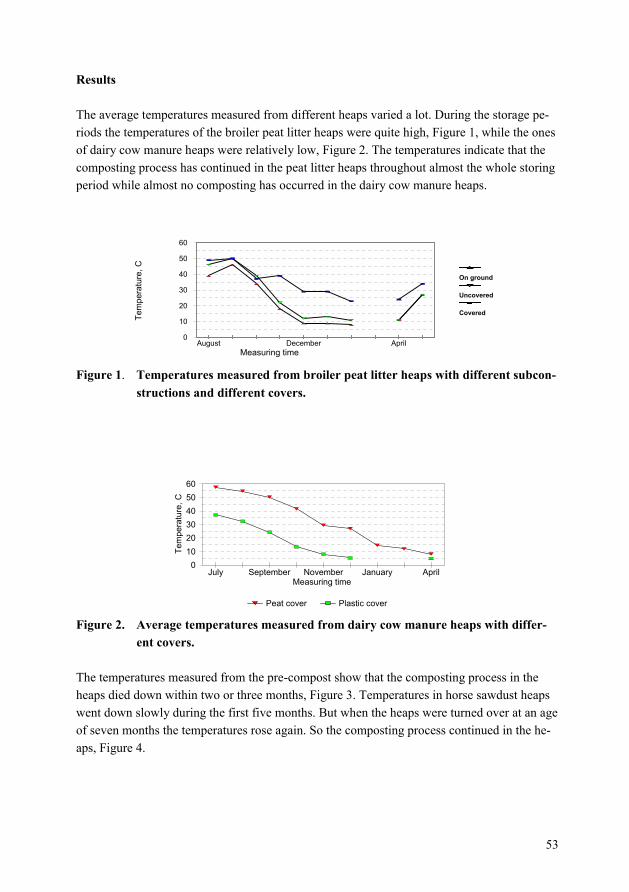
53
Results
The average temperatures measured from different heaps varied a lot. During the storage pe-riods the temperatures of the broiler peat litter heaps were quite high, Figure 1, while the onesof dairy cow manure heaps were relatively low, Figure 2. The temperatures indicate that thecomposting process has continued in the peat litter heaps throughout almost the whole storingperiod while almost no composting has occurred in the dairy cow manure heaps.
Figure 1. Temperatures measured from broiler peat litter heaps with different subcon-structions and different covers.
Figure 2. Average temperatures measured from dairy cow manure heaps with differ-ent covers.
The temperatures measured from the pre-compost show that the composting process in theheaps died down within two or three months, Figure 3. Temperatures in horse sawdust heapswent down slowly during the first five months. But when the heaps were turned over at an ageof seven months the temperatures rose again. So the composting process continued in the he-aps, Figure 4.
0 10 20 30 40 50 60
Tem
pera
ture
, C
July September November January AprilMeasuring time
Peat cover Plastic cover
0
10
20
30
40
50
60
Tem
pera
ture
, C
August December AprilMeasuring time
On ground
Uncovered
Covered

54
Figure 3. Average temperatures measured from pre-compost heaps during the storageperiod.
Figure 4. Average temperatures measured from horse sawdust litter heaps after differ-ent storing periods.
The measured ammonia emission rates are presented in Figure 5. Different covering materialsreduced the emission quite efficiently. No emissions through the plastic sheet were measured.Peat covering reduced the emissions totally from dairy cow manure heaps and 80 – 90 % frombroiler peat litter heaps. The special covering for compost did not have such a good effect onthe emissions. The reduction was only some 10% from the pre-compost heaps.
Figure 5. Ammonia emission from broiler peat litter (left) and pre-composted manureheaps (right).
0
5
10
15
20
25
30
NH
3, p
pm
7.12. 5.1. 8.3. 10.4. 15.5.Date of the measuring
Uncovered Uncovered Covered
0
10
20
30
40
NH
3, p
pm
First day 10 Days 1 Month
Lenght of storage
Covered Uncovered
0
10
20
30
40
50
60
70
Tem
pera
ture
, C
Surface -20 -40 -60 -80 -100Measuring depth
1 Week
1 Month
5 Months
7 Months
15
20
25
30
35
40
45
Tem
pera
ture
, oC
July August September OctoberMeasuring time
Covered
Uncovered
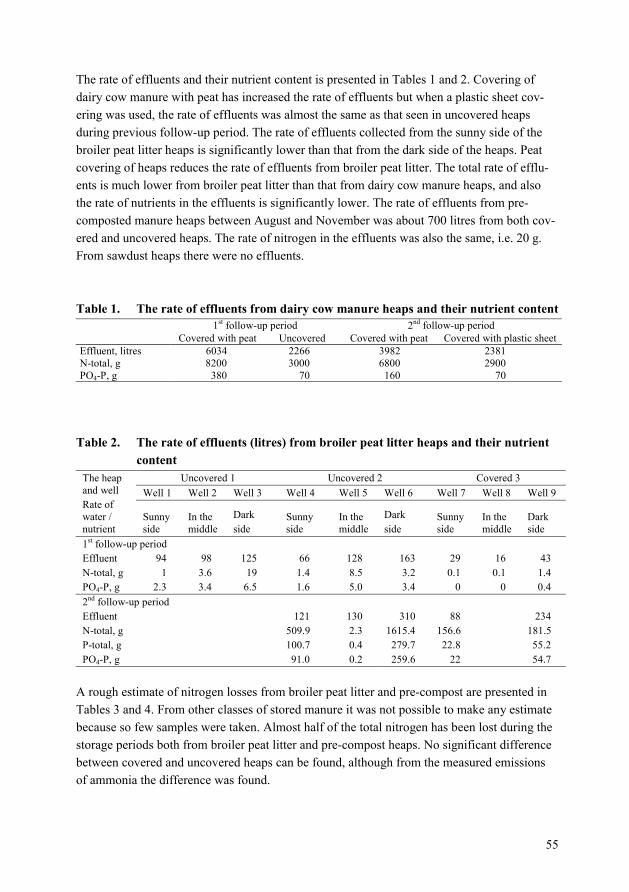
55
The rate of effluents and their nutrient content is presented in Tables 1 and 2. Covering ofdairy cow manure with peat has increased the rate of effluents but when a plastic sheet cov-ering was used, the rate of effluents was almost the same as that seen in uncovered heapsduring previous follow-up period. The rate of effluents collected from the sunny side of thebroiler peat litter heaps is significantly lower than that from the dark side of the heaps. Peatcovering of heaps reduces the rate of effluents from broiler peat litter. The total rate of efflu-ents is much lower from broiler peat litter than that from dairy cow manure heaps, and alsothe rate of nutrients in the effluents is significantly lower. The rate of effluents from pre-composted manure heaps between August and November was about 700 litres from both cov-ered and uncovered heaps. The rate of nitrogen in the effluents was also the same, i.e. 20 g.From sawdust heaps there were no effluents.
Table 1. The rate of effluents from dairy cow manure heaps and their nutrient content1st follow-up period 2nd follow-up period
Covered with peat Uncovered Covered with peat Covered with plastic sheetEffluent, litres 6034 2266 3982 2381N-total, g 8200 3000 6800 2900PO4-P, g 380 70 160 70
Table 2. The rate of effluents (litres) from broiler peat litter heaps and their nutrientcontent
Uncovered 1 Uncovered 2 Covered 3Well 1 Well 2 Well 3 Well 4 Well 5 Well 6 Well 7 Well 8 Well 9
The heapand wellRate ofwater /nutrient
Sunnyside
In themiddle
Darkside
Sunnyside
In themiddle
Darkside
Sunnyside
In themiddle
Darkside
1st follow-up periodEffluent 94 98 125 66 128 163 29 16 43N-total, g 1 3.6 19 1.4 8.5 3.2 0.1 0.1 1.4PO4-P, g 2.3 3.4 6.5 1.6 5.0 3.4 0 0 0.42nd follow-up periodEffluent 121 130 310 88 234N-total, g 509.9 2.3 1615.4 156.6 181.5P-total, g 100.7 0.4 279.7 22.8 55.2PO4-P, g 91.0 0.2 259.6 22 54.7
A rough estimate of nitrogen losses from broiler peat litter and pre-compost are presented inTables 3 and 4. From other classes of stored manure it was not possible to make any estimatebecause so few samples were taken. Almost half of the total nitrogen has been lost during thestorage periods both from broiler peat litter and pre-compost heaps. No significant differencebetween covered and uncovered heaps can be found, although from the measured emissionsof ammonia the difference was found.

56
Table 3. Estimation of total nitrogen losses from broiler peat litter heaps in percent-age in case the loss of dry matter during the storing period is considered tobe 15%
At the begin-ning
To the wells orground
At the end Decrease%
1st follow-up periodUncovered 1 100 10 35 55Uncovered 2 100 7 16 77Covered 100 1 30 692nd follow-up periodOn ground 100 16 64 20Uncovered 100 1 62 37Covered 100 0 52 48
Table 4. Estimation of total nitrogen losses from pre-compost heaps in percentage incase the loss of dry matter during the storing period is considered to be 15%
In the heap atthe beginning
To the wells In the heap atthe end
Decrease in theheap, %
1st follow-up period2.2.-15.5.1997Uncovered 100 0.01 47 532nd follow-up period12.7.-26.10.1997Covered 100 0.02 92 8Uncovered 100 0.08 55 453rd follow-up period27.10.-97-28.4.-98Covered 100 60 40Uncovered 100 59 41
Conclusions
Broiler peat litter, sawdust manure from horse stables and pre-composted manure can all bestored in heaps. The rate of effluents is relatively small and no base slab will be needed if thelocation of the heap is changed every year. On the other hand when piling and unloading theheap, moving around with heavy vehicles will be more convenient on solid base. If the heap isalways located on the same place a solid slab will be needed.
The manure from dairy cow barns is not suitable for storage in heaps. The rate of straw is inthe manure so small that the dry matter content is less than 20%. When it is gathered in a heapthe weight of the manure will press the liquid out of the heap. Neither can the rain be absor-bed into the heap, because of the low dry matter content. So, the rate of effluents will become

57
high, and because of the relatively high nutrient content of the effluent, they will have to becollected efficiently. The best way to do this will be to build up a proper manure store.
Most of the ammonia emission occurred during the first two or three days. This means thatthe heaps will have to be covered immediately after they have been piled, if the emissions areto be kept at a minimum. Pure peat is a good covering and easy to use, because it can bespread to the field together with the manure.
The composting process continued in all other heaps, except in dairy cow manure. In pre-composted manure heaps the final product was of good quality. But in broiler peat litter andhorse sawdust heaps the final product was of quite uneven quality. If the final product is to beof good and even quality, the heaps will have to be turned over during the storage period, orthere will have to be some kind of system to blast air into the heaps to make the conditionsproper for composting all over the heaps.

58
THE INFLUENCE OF DIFFERENT LITTER MATERIALS ON THEEMISSION OF POULTRY MANURE
Günter Hörnig*, Reiner Brunsch & Eike ScherpingInstitute of Agricultural Engineering Bornim e. V. (ATB), Max-Eyth-Allee 100D-14469 Potsdam, Fax: +49/331/5699-849, E-mail: [email protected]
Abstract
Ammonia, methane and carbon dioxide emit from poultry manure as a consequence of micro-bial conversions. The intensity of these emissions is also influenced by the kind of litter.Therefore, research work is done to quantify the effect of both known and new litter materials.
The measurements are carried out in 12 containers under laboratory conditions (T = 20°C).Fresh excrements from laying hens are intensively mixed with the following litter materials:straw from wheat, barley, rye and oat (non-hackled, chopped in lengths of 40 mm and 10 mm,as well as spliced), pellets from wheat straw and from wheat/barley straw, wood shavings, pe-at and lignite xylite. Every day, during a period of 10 days, the temperature of the manure andthe concentrations (emissions) of NH3, CH4, N2O and CO2 are measured. Five series of expe-riments are planned to investigate each of the 20 litter variants for three times.
There was a characteristic temperature curve in the manure during all previous series of expe-riments. Directly after storage, a strong microbial activity started and the temperatures rose upto 40°C for 20 hours. Then, the temperatures fell exponentially to as low as 22°C on the 10th
storage day.
A method was developed to determine the influence of the different litter materials on gasemissions using statistical evaluation. First results are reported.
Key words: Poultry manure, litter materials, gaseous emissions.
Introduction
Along with water vapour and carbon dioxide ammonia and methane are final products of theanimal metabolism and the microbial conversion of the excrements and the litter. Ammonia isthe quantitatively most important trace gas. Methane is generated only under anaerobic con-ditions, if organic substances (carbon) are available.
Substantial quantities of nitrogen with different forms of bonding are excreted contained inthe excrements. Broilers excrete about 121 g of faeces per animal and day in a fattening peri-

59
od of 37 days, which contain 1.5 g of nitrogen. Laying hens excrete 170 g of faeces/animaldaily with 2.22 to 2.86 g of nitrogen (Priesmann et al., 1991). These are 13-17 g of N/kg,what nearly agrees with reports of 19 g of N/kg by Koriath et al. (1984) and of 15 g of N/kgby Menzi et al. (1997).
The total nitrogen content can be split up into uric acid (about 60%), in ammonium (6%) andin urea (2%). The remaining 32% are integrated into the residual nitrogen (Frenken, 1989).
In comparison with cattle and pigs dry matter and nitrogen contents of the excrements, as wellas the different rates of the soluble nitrogen components are quite high. Consequently, in lay-ing hen houses a much larger part of the excreted nitrogen is lost as ammonia than in cattleand pig houses.
The emission factors reported by several authors show a wide range of variations:- 0.06 kg of NH3/animal per year (cages) and 0.36 kg of NH3/animal per year (floor system)
(Pedersen et al., 1996);- 0.32 kg of NH3/animal per year (Jelínek et al., 1997);- 0.11 kg of NH3/animal per year (Rains, 1998);- 0.38-0.44 kg of NH3/animal per year (floor system) (Mennicken, 2000).
Ammonia emits in consequence of microbial conversions, the intensity of which is influencedby temperature, humidity and pH value. Alternative keeping systems such as the floor systemuse litter for ethological reasons. The NH3 emission is by about 3 to 10 times higher than atkeeping in cages. Therefore, it is necessary to search for abatement techniques. Due to the factthat the type and processing of the litter considerably influence the emission course, researchactivities deal with the question, whether the emissions can be minimized by conventional andnew litter materials. This paper reports on laboratory investigations of twenty litter variants.
Materials and methods
Fresh excrements from laying hens kept in battery cages with four floors were taken from theconveyor belt. They were intensively mixed with the following litter materials: straw fromwheat, barley, rye and oat (non-hackled, chopped and pellets) as well as wood shavings, peatand lignite xylite (Table 1). The latter is a residue from lignite processing and mostly consistsof non-carbonized wood fibres. The measurements of environmentally relevant gaseous emis-sions were carried out under laboratory conditions (T = 20°C). The mixtures from excrementsand litter were filled into twelve containers shown in Figure 1. The height of the manure lay-ers was 6 cm.

60
Table 1. Litter materials and their processingLitter Processing Original
Non-hackled 40 mm 10 mm Spliced PelletsWheat strawBarley strawRye strawOat straw
xxxx
xxxx
xxxx
xxx
xx1)
Wood shavingsPeatLignite xylite
xxx
1) barley/wheat straw
Figure 1. Experimental set-up for measuring the gaseous emissions.
The measured parameters of the manure were dry matter content, pH, Ntotal and NH4-N. Du-ring a period of 10 days, the temperature of the manure and the concentrations of NH3, CH4,CO2 and N2O were measured daily.
The containers were closed only during measurement. The head spaces of the containers wereventilated with equal amounts of clean air, which was pumped into the containers via fourrotameters. The ventilation flow rate was about 25 l/min, so the air velocity above the surfacewas very low. The photo-acoustic gas monitor sucked in the air samples from the air outlets atthe top of each container.

61
Five series of experiments have been planned to investigate each of the 20 litter variants forthree times. The sequence is randomly distributed. Therefore, the statistical evaluation is notready yet. In this paper we can present first results of those litter materials where the measu-rements have been completed.
Results
There was a characteristic temperature curve measured in the manure during all previous seri-es of experiments. Directly after mixing and storing in the containers a strong microbial acti-vity started and the temperatures reached between 36.5 and 44.5°C for about 20 hours (Fi-gure 2). Then, the temperatures fell exponentially to as low as 22°C on the 10th storage day.
Figure 2. Course of manure temperature depending on measuring time.
The NH3, CO2 and CH4 concentrations measured daily follow the temperature course. Thatmeans, the concentration levels decrease from day to day. Due to the fact that the manure sur-face has strongly dried up after four days, the surfaces were moistened daily from the fifth dayon. As a result, the gas concentrations slightly increased. So the present evaluation concernsonly the results from the first to the fourth measuring day.
A typical course of ammonia concentration during one measurement is shown in Figure 3.The data 4 to 13 were obtained from closed containers and during ventilation. The curve isshaped almost like a symmetrical trapezium. However, the concentration courses of carbondioxide and methane show that after closing the containers there is a concentration peak (Fi-gures 4 and 5). Therefore, the first two data of the series were eliminated before evaluation, sothat 8 measured data per series were generally used.
19
24
29
34
39
44
49
0 1 2 3 4 5 6 7 8 9 10Measuring day
Man
ure
tem
pera
ture
,
Barley, splicedXyliteRye, splicedWheat, 40 mmRye, 40 mmBarley, splicedOat, unhackledWheat, splicedXylitePeatWood shavingsOat, 40 mm
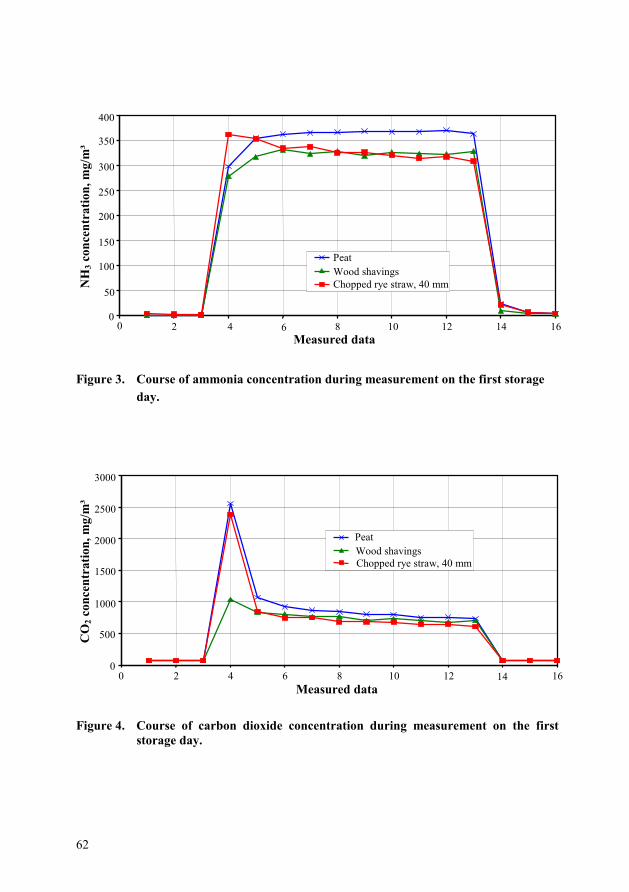
62
Figure 3. Course of ammonia concentration during measurement on the first storageday.
Figure 4. Course of carbon dioxide concentration during measurement on the firststorage day.
0
50
100
150
200
250
300
350
400
0 2 4 6 8 10 12 14 16 Measured data
NH
3 con
cent
ratio
n, m
g/m
³
PeatWood shavingsChopped rye straw, 40 mm
0
500
1000
1500
2000
2500
3000
0 2 4 6 8 10 12 14 16Measured data
CO
2 con
cent
ratio
n, m
g/m
³
PeatWood shavingsChopped rye straw, 40 mm

63
Figure 5. Course of methane concentration during measurement on the first storageday.
The temporal decrease of the concentration levels occurs very differently. Thus, the NH3 con-centration after four days amounts to about 50%, compared to the first measuring day (Fi-gure 6).
Figure 6. Ammonia concentration from laying hen manure with rye straw, woodshavings and peat, depending on measuring time.
0
2
4
6
8
10
12
14
16
18
0 2 4 6 8 10 12 14 16Measured data
CH
4 con
cent
ratio
n, m
g/m
³
PeatWood shavingsChopped rye straw, 40
y = -84.288 Ln(x) + 218.29R² = 0.4551 - rye straw
0
50
100
150
200
250
300
350
400
0 1 2 3 4 5 Measuring day
NH
3 con
cent
ratio
n, m
g/m
³
Woodshavings
Peat
Trend, woodshavings
Chopped ryestraw, 40 mmTrend, rye Trend, peat
y = -84.979 Ln(x) + 244.66R² = 0.6583 - wood shavings
y = -85.855 Ln(x) + 243.38R² = 0.4726 - peat

64
Eight values per measuring day at three repetitions, altogether 24 values per measuring daywere used for the calculation of the trends.
The respective CH4 and CO2 concentrations decrease to about 33% and 25%, respectively.This is causally connected with the different behaviour of the nitrogen and carbon sources ofthe manure. The generation of CO2 and CH4 rapidly decreases in the first half of the measu-ring time, together with the decline in the microbial activity (temperature). On the other hand,the release of appreciable quantities of ammonia covers a longer period because of the additi-onal delivery from ammonium.
To compare the emission behaviour of the different manures from laying hen faeces and littermaterials, the area under the trend curve (Figure 6) is used for the calculation of mean values.The emission behaviour is then compared using the mean values of the gas concentrations inpercent (Figure 7). This shows that the proportionate NH3 concentration of manure withchopped rye straw is by about 18% lower than of those with wood shavings and peat. Regar-ding the CO2 emission, the difference is yet higher in favour of rye straw. However, the CH4
emission from manure with wood shavings and peat is a little lower than from manure mixedwith chopped rye straw.
Figure 7. Proportionate gas concentrations after four measuring days.
70
80
90
100
110
120
130
Litter material
Pro
port
iona
te c
once
ntra
tion,
%
NH3 concentration CO2 concentration CH4 concentration
Choppedrye straw,
40 mm
Woodshavings
Peat Choppedrye straw,
40 mm
Woodshavings
Peat Choppedrye straw,
40 mm
Woodshavings
Peat
65
Conclusions
A general comparison of the effects of the 20 litter materials on emissions is not yet possible.The final results are to be expected from statistical evaluation, when the fifth series of investi-gations is finished.
It can be concluded that the chosen method can be used to determine the influence of differentlitter materials on gas emissions. The aim of further evaluation is to quantify these effects de-pending on the kind and processing of the litter materials.
References
Anonymus, 1998. UN-ECE-Strategies against acidification, RAINS ammonia modul. 6th Re-port of IIASA Laxenburg (A); www.iiasa.ac.at/~rains
Frenken, A., 1989. Stickstoffverluste aus verschiedenen Stickstoffverbindungen des Legehen-nenkotes …(Nitrogen losses from different nitrogen compounds ...) Doctoral thesis of theUniversity of Bonn, Germany.
Jelínek, A.; Sláma, J.; ešpiva, M.; Plíva, P., 1997. The toxic gases emissions from stablesenvironment impact. Annual report of the Research Inst. of Agric. Engineering Prague,CZ.
Koriath, H.; Rinno, G.; Ebert, K., 1984. Gewinnung trockensubstanzreicher Gülle (Reclama-tion of slurry with high dry matter content). Agra-Empfehlung für die Praxis, Markklee-berg, Germany.
Mennecken, L., 2000. An environmentally friendly floor system for laying hens ("Biobed").Workshop of the BLE, 05.04.2000, Frankfurt, Germany.
Menzi, H.; Frick, R.; Kaufmann, R., 1997. Ammoniak-Emissionen in der Schweiz (Ammoniaemissions in Switzerland). Schriftenreihe der FAL 26, Liebefeld-Bern, CH.
Pedersen, S.; Takai, H.; Johnsen, J.; Birch, H., 1996. Ammonia and dust in cattle, pig andpoultry houses. Internal Report Nr. 65 of the Danish Inst. of Animal Science, Horsens, DK.
Priesmann, T.; Petersen, J.; Frenken, A.; Schmitz, W., 1991. Stickstoffverluste aus Geflügel-kot bei verschiedenen Haltungssystemen (Nitrogen losses from poultry excrements at dif-ferent keeping systems). Archiv für Geflügelkunde, 55 (3): 97-104.

66
AMMONIA EMISSIONS FROM BROILER MANUREDURING HANDLING
Stig Karlsson* & Lena RodheSwedish Institute of Agricultural Engineering, P.O. Box 7033, S-750 07 Uppsala, Sweden. Tel:
+46 (0)18 30 33 00. Fax: + 46 (0)18 30 09 56. Email: [email protected], [email protected]
AbstractBroiler manure from poultry farms has become a commercial fertiliser mainly for farmerswith ecological production. However, there is a lack of knowledge about nutrient losses frombroiler manure during storage and after spreading within crop production. The aim was to de-termine what happens to the material during the course of handling, with special emphasis onammonia losses, and to see how different measures affect the amount of ammonia losses.
Broiler manure was stored for seven months from October until May. The manure was placedin two separate heaps, one uncovered and one covered with a 30 cm thick layer of straw. Am-bient air temperature and temperatures in the heaps were recorded continuously. Ammoniaemissions were measured five times during the storage period. A micrometeorological massbalance method, described by Schjörring et al. (1992) and applied by Karlsson (1994) was used.
At the end of May, broiler manure from the uncovered heap and a commercial product basedon broiler manure (Binadan) were spread on arable land at a rate of 110 kg total-N per ha.Ammonia emissions were measured from plots fertilised with broiler manure and Binadan,respectively, with and without harrowing four hours after spreading. A micrometeorologicalmethod of measuring gaseous NH3 was used, which is based on passive diffusion samplingclose to the ground (Svensson, 1994).
Temperature measurements in the heaps during storage revealed high biological activity. Thehighest temperatures were observed in the covered heap. Despite this, the nitrogen lost in theform of ammonia was limited. The cumulative ammonia losses in per cent of total N were 7%from the uncovered heap and 10% from the covered heap.
In total, 13.5% of the total nitrogen in the broiler manure was lost as ammonia after spreadingwithout incorporation of the manure and 7.5% was lost from plots with incorporation fourhours after spreading. After incorporation no ammonia emission occurred. No emissions oc-curred from plots fertilised with Binadan.
ReferencesSchjörring, J.K., Sommer, S.G. & Ferm, M., 1992. A simple passive sampler for measuring
ammonia emission in the field. Water, Air, and Soil Pollution, 62:13-24.Karlsson, S., 1994. Composting of Deep Straw Manure. Report N. 94-C-092 presented at AgEng
International Conference on Agricultural Engineering, Milan, Italy, Aug. 29-Sept. 1, 1994.Svensson, 1994. A new dynamic chamber technique for measuring ammonia emissions from
landspread manure and fertilisers. Acta Agriculturae Scandinavica, Section B, Soil andPlant Science 44(1): 35-46.

67
SPECIFICATION OF REQUIREMENTS – A WAY OF BRINGING NEWSLURRY SPREADING TECHNIQUE INTO USE
Carl-Magnus PetterssonMiljöteknikdelegationen, S-117 86 Stockholm, Sweden
SummaryThe Swedish Delegation for Sustainable Technology conducted the project “EnvironmentallyFriendly Slurry Spreaders” from 1998 to 2000. The aim of the project was, on a voluntary ba-sis, to stimulate the manufacturers of slurry spreaders to develop new types of spreaders thatgive the users better possibilities to utilise the slurry’s nutrient, thereby reducing the environ-mental impact of slurry spreading. The aim was also to influence the farmers to buy these newspreaders and encourage them to ask for more developed spreading techniques in the future.
The central part of the project was a specification of requirements that pointed out the directi-on of development and set limits on requirements of the slurry spreader’s function. Sevenmanufacturers/suppliers sold 25 slurry spreaders/spreading systems that fulfilled the require-ments within the frame of the project. An evaluation of the project showed that the project re-ached the overall aim in bringing new spreading technique in use. The project also increasedthe farmers’ demand on more developed technique for slurry spreading, and consequently, theproject has a long-term effect. However, for a full effect of the project the authority shouldhave a longer mandate than the one that the Delegation had.
Key words: Slurry spreading, Environmental protection, Ammonia emission
IntroductionMiljöteknikdelegationen, The Swedish Delegation for Sustainable Technology, was establis-hed in 1997 as a short-term independent governmental authority under the Ministry of Indu-stry and Commerce. The delegation finished its work at the end of year 2000. The Delegati-on’s objective was to develop and test methods in order to stimulate the manufacture, the sale,and the use of environmentally friendly products and services. By concrete examples, real re-sults should be obtained with small economical means, instead of the “normal” way of ma-king theories about how one should work. By implementing different projects, the Delegationhas shown how a broker can act between the manufacturer’s technical achievements and in-novations and the user’s needs and demands.
The Delegation has worked within four specific areas and one “overarching” area. The fourspecific areas were:

68
• Buildings and living• Ecological remediation of soil• Food and agriculture• Transportation
In the “overarching” area, different projects were carried out, like an environmental technolo-gy contest, environmentally friendly grease, oil for two-stoke engines, and different informa-tion campaigns. The characteristics of most of the projects can be described as:
• Use the competition between manufacturers by using moments of contest. Hereby, themanufacturers are encouraged to go further in the development of new technique withoutdistorting the market situation.
• Describe the desired function, instead of specifying certain technical solutions. In thatway, the doors will be open for new solutions, and locking to an existing technique will beprevented.
• Frame the lowest requirement that the technique shall meet. Real improvement can thenbe obtained compared to the present market situation.
• Engage environmentally driven actors, who actively demand products and services thatare environmentally adapted. These actors know best which environmental problems thatneed to be solved within their own area, and they will also be the first users to buy thenew technique.
• Have a sensitive ear for the user’s demands and the manufacturer’s opinion. Specificationof requirements can then correspond to real needs, and at the same time it will be possibleto realise them at a reasonable level of costs.
Environmentally friendly slurry spreaders – an example of how to influence the marketThe method for speeding up the introduction of new products used by the Delegation in se-veral of the projects, follows the general steps, shown in Figure 1. The two alternatives,shown in the figure, depend on the type of product, and whether it is possible to create a con-sortium of buyers, who commonly can or cannot put a call for tenders. For example, oneproject on flexible fuel cars used the alternative 1, the consortium method. In that case, it waspossible to create a consortium of buyers that committed to buy cars that fulfilled the requi-rements. In the project “Environmentally friendly slurry spreaders”, which was carried outwithin the targeted area Food and Agriculture, it was not possible to create such a group ofbuyers. Therefore, alternative 2 was used.

69
Ideas and potential fordevelopment
Userdemands Matching
Group of potential buyersInput from experts, scientists,
organisations etc.
Specification of requirements
Consortium of buyers is createdFormal tenders are invited
Challenge orcompetition
Alternative 1 Alternative 2
• Evaluation of obtained offers• Verification of performance characteristics and functionality
One or several winners are chosen
Purchasing isperformed
Information campaigns, demonstrations arecarried out
Figure 1. Two alternative routes for putting new technique into use.
The principal steps in the project were:Preparatory studies about the market situation, technology status, etc.Developing a specification of requirementsChallenge the manufacturers to develop new types of spreadersCarry out information and demonstrations of the new spreadersStimulate the market by giving the 25 first buyers a “stimulation cheque”Evaluate the work.
The first step, the preparatory study
At the initial phase of the project inquiries and discussions with scientists, farmers and orga-nisations were carried out. A study of the slurry spreader market was also carried out. Duringthis initial phase a group of farmers’ organisations was formed, i.e. a “buyers group”, whichacted as proxy customers.

70
Work out the specification of requirements
The specification of requirements was the central part of the project. It pointed out the directi-on of development; set focus on the most important parts in slurry spreading and set thelowest limits that a spreader must fulfil. The work on the specification of requirements wasdone in collaboration with the group of farmers’ organisations that was established in the pre-paratory part of the project. The manufacturers were also involved. Because of the voluntaryaspect, it was important to compare the desired requirements from the “buyers group” withthose that could be obtained/developed at reasonable costs.
The specification of requirements encompasses the following topics:
1. Spreading device – the types of spreading device that are accepted, the evenness of sprea-ding, and the possibilities to exchange the spreading device. At a minimum, the spreadershould be equipped with a trailing hose system. It must also be possible to equip thespreader with an injection system. The exchange of spreading devices should be easy toaccomplish. The requirements on the evenness of spreading (between outlets/hoses)follows the requirements in the proposal to European standard prEN 13406, “Slurry tan-kers and spreading devices – Environmental protection – Requirements and test methodsfor the spreading precision”. The centre distance between the outlets (hoses) shall not ex-ceed 300 mm.
2. Application rate – the possibilities to set and control the application rate in order to obtainthe desired application rate. It shall be possible to set the application rate between 10 and40 tonnes per ha at a defined forward speed. There should also be an instrument at the dri-ver’s seat for continuous display of the current application rate in tonnes per ha.
3. Filling of the spreader – the filling capacity and the prevention of spillage of slurry duringfilling. The manufacturer should state the filling capacity at defined conditions. Thespreader shall also be equipped with devices that prevent spillage of slurry while thespreader is filled.
4. Practical function. The spreader shall be equipped with a device (for example a stone trap)for protection of sensitive parts from foreign objects such as stones and pieces of metal, inthe slurry.
5. Soil-compaction. The spreader shall be equipped with tyres that will allow a tyre-pressuredown to 60 kPa during spreading. The manufacturer/supplier should also state the coeffi-cient of fullness of the tank that will result in an axle-load of maximum 6 tonnes/axle.
6. Instructions for the use of the spreader. An instruction handbook will be delivered withthe spreader to describe the spreader’s function, how to set, control and calibrate the sy-stem for controlling the application rate, and how to do service and to carry out mainte-nance in order to keep the desired function of the spreader. In addition, the supplier willdeliver a spare-part list, diagrams of the electrical and hydraulics systems and provide aninstruction/education at the buyer’s premises when the spreader is to be taken into use.

71
7. Specifications. Along with the spreader, the manufacturer will deliver a specification withdata for the spreader, the spreading device, the spreader’s requirements to the tractor andwhether there are any limits in the use of the spreader (e.g. certain types of slurry forwhich the spreader is not suitable).
The requirements listed above are a summary. For a full list, see “Specification of require-ments for environmentally friendly slurry-spreaders” and the Swedish version “Kravspecifi-kation för miljöanpassade flytgödselspridare”.
Challenge the manufacturers
The Delegation presented the specification of requirements to the manufacturers in October1998. At the same time, the manufacturers were informed that if they developed spreadersthat met the requirements in the specification, the spreaders would be joined in a demonstrati-on campaign during the spreading season of 1999. The manufacturers were also informed thatthe first buyers of the developed spreaders would get a “stimulation cheque”.
Demonstrations of spreaders from six manufacturers were held at 15 locations around Swe-den. Each of the demonstrations was combined with lectures on spreading technique, use ofthe slurry and the effect of soil compaction from heavy machines. Table 1 shows the sprea-ders that joined the demonstrations.
Table 1. Spreaders that fulfilled the requirements and joined the 15 shows in 1999Name Model Tank capacity
m3Spreading device Manufacturer/
supplier
Hill HT 12 500 L 12.5DGI shallow injectionsystem
LK-Verkstad,Linköping
JOSSlurry tanker,15 m3 15.0
JOS shallow injectionsystem
Göma Halmstad
Neuero Umbilical cord system – Trailing hosesSvenska Neuero,Kävlinge
OlbySlurry tanker,12 m3 12.0 Trailing hoses Olby-maskiner, Skövde
SpeedSlurry tanker,13,5 m3 13.5 Trailing hoses Trejon, Vännäs
StarSlurry tanker Proffs15000 L
15.0JAKO shallow injectionsystem
Ranaverken AB,Tråvad

72
Stimulate the market
To stimulate the farmers to buy these new types of spreaders (which were expected to be mo-re expensive than ordinary spreaders), a so-called stimulation cheque, equivalent to app. 5%of the price of the spreader, was given to the first 25 buyers. The farmers that got a cheque al-so committed to join an evaluation of the spreader during the first year of use. Table 2 showsthe spreaders sold in combination with the stimulation cheque. Of the 25 spreaders, four wereof the umbilical-cord type (where the slurry is pumped to the spreading device trough a hose),two of the remaining 21 spreaders were equipped with a shallow injection system and the restwith a trailing hose system. Altogether, seven manufacturers delivered spreaders.
Table 2. Spreaders sold with the stimulation cheque. They formed the basis for theevaluation of the project in 2000
Manufacturer/supplier Spreader Tank capacitym3
Number of spreadersand spreading device
Alexandersson, Vessigebro Harsö 18 1 (trailing hose)LK-Verkstad, Linköping Hill slurry tanker 15-22 3 (trailing hoses)
Göma HalmstadJOS slurry tanker (2)Samson (1)
15.0 3 (trailing hoses)
Svenska Neuero, KävlingeNeuero Umbilical CordSystem
- 4 (trailing hoses)
Samson SAK 15 1 (trailing hose)Trejon, Vännäs Speed slurry tanker 13.5 1 (trailing hose)
Ranaverken AB, Tråvad Star slurry tanker 10.6-1810 (trailing hoses)2 (JAKO shallow injecti-on systems)
The learning phase
An evaluation of the effect of the project was carried out during the first year that the 25spreaders, sold with the stimulation cheque, were used. The evaluation encompassed inter-views with the 25 buyers and the 7 suppliers, inspections of spreaders in use and measure-ments of spreading capacity and energy demands. The main questions that were set up beforethe evaluation were:
1. Has the project reached the main objective, i.e. to put new types of spreaders into use, andis there any long-term effect?
2. Which technical development has the project caused?3. Were the requirements adequate when taken into consideration the experience from the
use of the spreaders?4. At the time when the farmer purchased the spreader, was the stimulation cheque important
for the selection of the spreader?

73
5. Was the practical function satisfactory?6. Which spreading capacity can be obtained, and what will the energy consumption be if
slurry is spread with ordinary slurry spreaders and with a system of the umbilical-cord ty-pe?
Summary of the evaluation
The project has shown clearly that the use of a specification of requirements is an appropriatemethod for speeding up the process of developing/bringing new technique in use withoutusing laws or other regulations. The main development has been on the systems for settingand controlling the application rate, the evenness of spreading and the reduction of soil com-paction. The new technique gives the user better possibilities to spread the intended amount ofslurry in a controlled way, thereby reducing the emissions of ammonia and leakage of plant-nutrient. It also gives possibilities to reduce the risk for harmful soil-compaction. However, toget full impact of the project, it is important that the authority has a longer mandate than theDelegation had, in order to continuously approve new spreader models, to keep a record ofapproved models and, for example, to administrate a system for labelling approved spreaders.The evaluation concluded that the Delegation’s aim was reached.
The stimulation cheques were important and essential for the success of the project. They ma-de it possible for 25 new spreaders to be introduced on the market within a short time, afterwhich they could act as references and inspiration for other potential buyers. They also moti-vated the manufacturers/suppliers to invest in the development of the new spreaders.
The sale of slurry spreaders equipped with modern technique has continued after the 25 sti-mulation cheques were finished. During the current season about 30% of the sold slurryspreaders were equipped with technical equipment comparable to that which fulfilled the spe-cification of requirements. Several of the 25 interviewed farmers stated that after testing thenew technique, they would have bought it today even without the stimulation cheque.
For both farmers and manufacturers/suppliers the common opinion was that the requirementswere balanced and realistic, except for the requirements on tyres that allow down to 60 kPatyre-pressure during spreading at full load. Both the farmers and the suppliers considered that80 kPa would have a more appropriate requirement.
The interviews with the farmers showed that in some cases, when spreading thick cow manu-re, the system for controlling the application rate was not as reliable as the users had expected.The explanation can be that the manufacturer did not have sufficient time for testing the newtechnique, due to the timetable that was set up for the project.

74
Measurement of the spreading capacity showed that within a 2 km distance from the slurrystorage, up to app. 90 m3/hour could be obtained both with a modern slurry spreader with15 m3 tank and with the umbilical-cord type spreading system that was included in the study.However, the spreading capacity depends on several factors, and it is not possible to say thatone system has a higher capacity than the other, but it is apparent that there is a limit for theumbilical-cord type system at a distance of a few km. Then an intermediate storage will haveto be used.
The fuel consumption (litres/m3 transported and spread slurry) varied between 0.24 and0.57 litres/m3. In “normal” cases, the fuel consumption for spreading slurry with an ordinaryslurry spreader and with the umbilical-cord type spreading system was approximately the sa-me. However, for the umbilical type system, the slurry thickness (fluidity) and the length ofthe hose will have a great influence on the fuel consumption.

75
IMPROVED SPREADING TECHNOLOGY FORSEMI-SOLID ORGANIC FERTILISERS
Johan Malgeryd*& Ola PetterssonJTI – Swedish Institute of Agricultural and Environmental Engineering
P.O. Box 7033, SE-750 07 Uppsala, Sweden
Abstract
Adapting fertiliser application rate to the requirements of the crop is one of the most impor-tant factors for reducing leaching of nitrogen and other plant nutrients. Uneven spreading alsoresults in greater losses due to local under and overfertilisation. In comparison with modernslurry spreaders, today’s spreaders for solid and semi-solid manure offer very limited possi-bilities for the farmer to apply the manure evenly and at the desired rate.
In a project financed by the Swedish Board of Agriculture, JTI has, in collaboration with theSwedish manufacturer LK Verkstad/Ranaverken AB, developed a new spreading unit. Thisconsiderably improves the lateral distribution of the Hill spreader, a rear discharge spreaderwith screw delivery, which is frequently used for semi-solid manures in Sweden. The spread-ing unit has two horizontal beaters covered by a hood and four spinning discs. Initial testswith cattle manure showed that it was possible to reach a lateral coefficient of variation of13 % at a 9 m working width.
The spreader was also modified with hydraulically powered augers to make continuous ad-justment of the delivery rate possible. Provided that funds can be raised, we plan to developan automatic rate control system in the near future.
Key words: Spreading technology, semi-solid manure, manure distribution, application rate.
Introduction
Adaptation of fertiliser application rate to the requirements of the crop is one of the most im-portant factors for reducing leaching of nitrogen and other plant nutrients. Uneven spreadingalso results in greater losses due to local under and overfertilisation. In comparison with mo-dern slurry spreaders, today’s spreaders for solid and semi-solid manure offer very limitedpossibilities for the farmer to apply the manure evenly and at the desired rate.
A spreader type which is frequently used for semi-solid manure, sewage sludge and poultrymanure in Sweden is the so-called Hill spreader (Fig. 1). This spreader has two mechanicallypowered bottom augers which deliver the manure to a spreading device consisting of two

76
spinning discs. The application rate can only be adjusted by adjusting the position of the rearhatch and by choosing another gear on the tractor.
Figure 1. Schematic diagram of the Hill spreader.
Problems associated with the Hill spreader are:Limited possibilities to adjust the flow of manureImpossible to achieve low application rates, e.g., with poultry manureDecreasing manure flow during the unloading processInsufficient ability to fragment the manure (clods of various sizes pass the spreading devicewithout being fragmented)Uneven lateral distribution with a typical ”Hill peak”Pulsating flow of manure
Materials and methods
In a project financed by the Swedish Board of Agriculture, JTI has, in collaboration with theSwedish manufacturer LK Verkstad/Ranaverken AB, developed a new spreading unit whichconsiderably improves the lateral distribution of the Hill spreader. The spreading unit is ofa two-step type, consisting of two horizontal beaters covered by a hood and four spinningdiscs.
The spreader was also modified with hydraulically powered augers to enable continuous ad-justment of the delivery rate. A schematic diagram of the modified spreader is shown inFig. 2.

77
Figure 2. Schematic diagram of the modified Hill spreader. 1) Horizontal beaters cove-red by a hood, 2) Hydraulically powered augers (continuously adjustable 0 –30 rpm), 3) Hydraulically powered spinning discs.
Under the container a transmission shaft, driven by “PTO 1000 rpm”, supplies two hydraulicpumps and also the two horizontal beaters (1) with power. The first hydraulic pump serves ahydraulic engine with oil. The engine is connected to the bottom augers (2) via a chain trans-mission. The speed of the augers can be continuously adjusted from 0 to 30 rpm by a propor-tional flow control valve. The second hydraulic pump serves another hydraulic engine, whichis directly connected to a row of four gearboxes. Each gearbox is connected to one of thespinning discs (3). The speed of these can be continuously adjusted up to 950 rpm. Both theangle and the longitudinal position of the spinning disc unit are adjustable. The latitudinal po-sitions of the spinning discs are also adjustable.
The horizontal beaters are connected directly to the main transmission shaft by an overloadsecurity coupling and a 2:1 v-belt transmission, so the speed of the beaters is 500 rpm. Thetasks for these beaters are to cut the manure into smaller fragments and to level out the shorttime variations in the flow of manure to the spinning discs. The spreader has it’s own hydrau-lic system and does not use oil from the tractor. A 200 litre tank for hydraulic oil is placed onthe left side of the container. A synthetic ester hydraulic oil is used.
The spreader was tested at JTI’s test site for manure spreaders in Lövsta 13 km east ofUppsala, Sweden. The tests were conducted with methods described in the European standardproposal PrEN 13080 (CEN, 1997). The forward speed used in the lateral tests was 1 km/h.
2
1
3

78
Results and discussion
Practical functionTests performed with both cattle manure and manure from laying hens showed that the spin-ning discs require a lot more power than the expected 20-25 kW. When the delivery rate wasincreased to 24 kg/s, the rotational speed of the discs decreased by 50 % from the nominal950 rpm. To overcome this problem, the hydraulic power supply system of the discs needs tobe re-dimensioned.
Another problem that occurred was that manure tended to accumulate on the ends of the spin-ning disc unit. Clods of manure then fell down onto the ground and caused irregularities in thelateral distribution pattern. This problem could probably be overcome by modifying the pro-tective plates.
Lateral manure distribution, working width and ability to fragment the manureIn spite of the problem with insufficient power supply and dropping speed of the spinningdiscs, tests with cattle manure showed that it was possible to reach a lateral coefficient of va-riation (CV) of 13.3% at 9 m working width (Fig. 3). Similar results were achieved with ma-nure from laying hens.
Figure 3. Lateral manure distribution when spreading cattle manure with the modifiedHill spreader. The working width was 9.0 m and the lateral coefficient of va-riation 13.3 %.
Across the direction of travel, the application rate after overlapping varied only between 80and 120% of the mean rate. This is a considerable improvement compared to the results achi-eved when the Swedish National Machinery Testing Institute (SMP) tested the “original” Hillspreader with a similar kind of manure. In that case, the application rate after overlapping tooptimum working width ranged from 60 to 180% of the mean rate (SMP, 1994).
0-10 -6 -2 2 6 10Distance from spreaders mid-point, m
200
160
120
80
40
0
App
licat
ion
rate
, % o
f mea
n ra
te
-8 -4 4 8
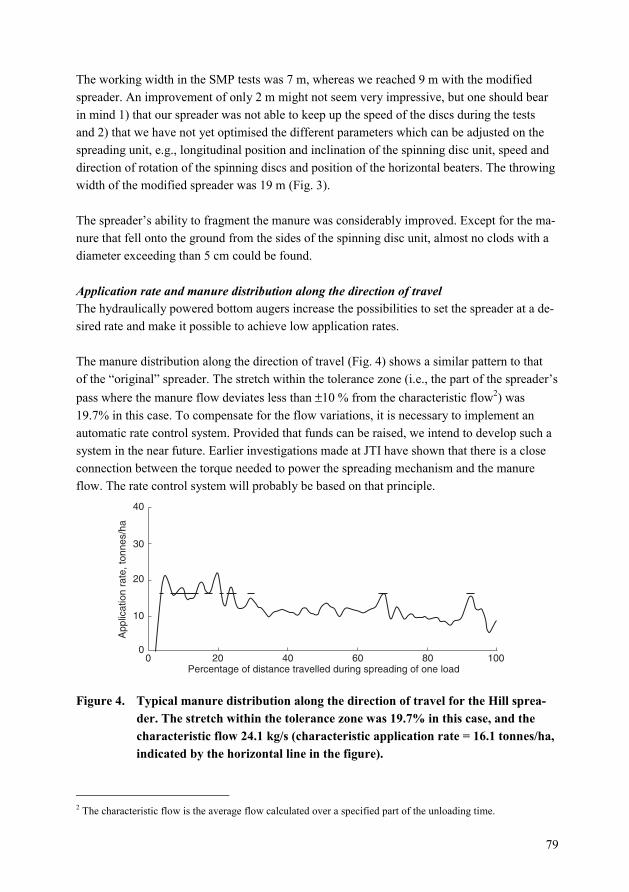
79
The working width in the SMP tests was 7 m, whereas we reached 9 m with the modifiedspreader. An improvement of only 2 m might not seem very impressive, but one should bearin mind 1) that our spreader was not able to keep up the speed of the discs during the testsand 2) that we have not yet optimised the different parameters which can be adjusted on thespreading unit, e.g., longitudinal position and inclination of the spinning disc unit, speed anddirection of rotation of the spinning discs and position of the horizontal beaters. The throwingwidth of the modified spreader was 19 m (Fig. 3).
The spreader’s ability to fragment the manure was considerably improved. Except for the ma-nure that fell onto the ground from the sides of the spinning disc unit, almost no clods with adiameter exceeding than 5 cm could be found.
Application rate and manure distribution along the direction of travelThe hydraulically powered bottom augers increase the possibilities to set the spreader at a de-sired rate and make it possible to achieve low application rates.
The manure distribution along the direction of travel (Fig. 4) shows a similar pattern to thatof the “original” spreader. The stretch within the tolerance zone (i.e., the part of the spreader’spass where the manure flow deviates less than ±10 % from the characteristic flow2) was19.7% in this case. To compensate for the flow variations, it is necessary to implement anautomatic rate control system. Provided that funds can be raised, we intend to develop such asystem in the near future. Earlier investigations made at JTI have shown that there is a closeconnection between the torque needed to power the spreading mechanism and the manureflow. The rate control system will probably be based on that principle.
Figure 4. Typical manure distribution along the direction of travel for the Hill sprea-der. The stretch within the tolerance zone was 19.7% in this case, and thecharacteristic flow 24.1 kg/s (characteristic application rate = 16.1 tonnes/ha,indicated by the horizontal line in the figure).
2 The characteristic flow is the average flow calculated over a specified part of the unloading time.
0 20 40 60 80 100
40
30
20
10
0
Percentage of distance travelled during spreading of one load
App
licat
ion
rate
, ton
nes/
ha

80
One of the purposes of the horizontal beaters and the hood was to level out the short time flowvariations, which are typical for the Hill spreader. The beaters improved the situation, but didnot completely manage to level out the variations. A rate control system based on the prin-ciple described above will not be able to compensate for these variations, since a manure clodwill already have left the feeding-out mechanism when it is hit by the wings of the spinningdisc. In practice, however, this phenomenon will probably not affect the longitudinal evennessof spreading very much since the manure is spread over a large area (approximately 20 × 30 m)behind the spreader.
Conclusions
The spinning discs require a lot more power than the expected 20 to 25 kW. The present hy-draulic power supply system has to be re-dimensioned to avoid large decreases in rotationalspeed at higher delivery rates.The lateral evenness of application and the spreader’s ability to fragment the manure wereconsiderably improved.A moderate improvement of the working width was also achieved.The hydraulically powered bottom augers increase the possibilities to control the spreader atthe desired rate and make it possible to achieve low application rates.To compensate for the flow variations during the feeding-out process, it is necessary to im-plement an automatic rate control system.
References
CEN, 1997. Manure spreaders – Specification for environmental preservation – Requirementsand test methods. PrEN 13080. Comité Européen de Normalisation.
SMP, 1994. Stallgödselspridare Hill HS 6-2000. Meddelande 3409. Statens Maskinprov-ningar, Uppsala.
Acknowledgements
Financial support by the Swedish Board of Agriculture is gratefully acknowledged. We wouldalso like to thank LK Verkstad/Ranaverken AB for a fruitful collaboration and for placing aspreader at our disposal free of charge.

81
SLURRY APPLICATION ON LEY – NEW TECHNIQUES
Lena Rodhe1* and Chri Rammer2
1Swedish Institute of Agricultural Engineering, P.O. Box 7033, S-750 07 Uppsala, Sweden.Tel.: + 46 (0)18 30 33 51. Fax: + 46 (0)18 30 09 56. Email [email protected]. of Animal Nutrition and Management, SLU, S-750 07 Uppsala, Sweden.
Tel.: +46(0)18 67 16 35. Fax: +46(0)18 67 19 88. Email [email protected]
Abstract
A field experiment was conducted in June 1999 in order to evaluate different aspects of newtechniques for spreading slurry on grassland. Most of the studies were conducted in a blockexperiment, where three replicates of the following treatments were included: 1) unfertilised(control), 2) band application by trailing hoses on a boom, 3) shallow injection with slurry jetat high pressure (DGI), and 4) shallow injection with V-shaped rotating disc tines.
The experiment, laid out on grassland growing on loam, included studies of the slurry’s pla-cement in the soil profile, contamination of the crop, ammonia release after application, yieldin the second cut, and ensilability of the crop. The studies of the slurry’s placement in the soilprofile were also made for grassland growing on clay soil. Finally, an economic evaluation ofthe handling and application of slurry to grassland by use of different techniques was made onthe basis of the results obtained together with earlier knowledge.
The results illustrate that the shallow injection methods used in this study were unable to in-corporate the slurry satisfactorily under very dry conditions on loam and clay soils. The pla-cement of the slurry in the soil differed negligibly between the loam and the clay soils. Of theapplied amount of slurry, between 14 and 23%was recovered on the crop’s stubble. No stati-stically significant differences in contamination of the crop’s stubble could be demonstratedbetween the different application techniques.
As a result of the poor incorporation and the hot and dry weather, there was a high release ofammonia following application with all techniques. The ammonia emissions ranged betweenhalf and the entire amount of ammonia applied with the slurry. Shallow injection with a tinegave a significantly higher ammonia release than seen for band application and shallow in-jection at high pressure. The yield in the second cut was low in all treatments, and no statisti-cally significant differences between the application techniques could be demonstrated.
Despite the high dry matter contents, the harvested fresh material contained increased con-centrations of clostridium spores in all types of silage, regardless of the method of slurry ap-plication used. Surface application with disc tines gave a significantly better silage qualitythan band application, and shallow injection with a tine showed a tendency to give the bestsilage quality of all three application methods.
Computer simulations showed that the net values of the slurry under the set options were ne-gative. Broadcast spreading and band spreading were economically more profitable than
shallow injection.

82
AMMONIA VOLATILIZATION FROM PIG SLURRY APPLIED TOSPRING WHEAT WITH DIFFERENT TECHNIQUES
Pasi MattilaAgricultural Research Centre, Plant production research / Crops and soil
FIN-31600 Jokioinen, Finland. E-mail: [email protected]
Abstract
Ammonia (NH3) volatilization was measured for three days from pig slurry applied to springwheat on clay soil at three growth stages by broadcast spreading, band spreading or injectionat the rate of 118 kg of soluble nitrogen (N) per hectare. First applications were on harrowedsoil before planting with incorporation by another harrowing 1 h after applications and dril-ling 0.5 h later, after which the NH3 measurement began. Later applications were made at the1-2 or at 3-4 leaf stage, when the measurement was started immediately after applications.
The NH3-N volatilization rates from surface applied and subsequently incorporated slurry wasbelow 100 g ha-1 h-1, and at later stages without incorporation the volatilization did not exceed250 g ha-1 h-1. From injected slurry volatilization was clearly lower with the highest valueslightly over 20 g ha-1 h-1. Injection reduced the volatilization even when the field was har-rowed after applications. There was no consistent difference between broadcasting and bandspreading. The volatilization seemed to increase with wind speed and temperature.
When slurry was incorporated by harrowing, the N losses during the 3 days were less than 1%of the soluble N in slurry, and after later applications without incorporation they were about3% at highest. However, the longer-term N losses may have been substantially larger.
Key words: manure slurry, ammonia, nitrogen, application technique, emission.
Material and methods
The ammonia (NH3) volatilization was measured from pig slurry applied to spring wheat bybroadcast spreading, band spreading (spacing 0.30 m) or injection (spacing 0.30 m, depth0.05-0.10 m) at the rate of 31 Mg ha-1. The slurry contained total nitrogen (N) 5.4 g kg-1
(167 kg ha-1) and soluble N 3.8 g kg-1 (118 kg ha-1). The dry matter content of the slurry was6.6 % and the pH was 7.0.
The first applications were carried out at two locations in southern Finland: on clay loam andon gyttja clay (a clay soil mixed with a high amount of sedimented organic matter). Slurrywas applied on harrowed soil before planting and the field was harrowed again at about

83
0.07 m depth 1 h after applications and drilled 0.5 h thereafter. The NH3 measurement beganabout 0.5 h after the planting. Later NH3 was measured only on the clay loam site from slurryapplications at 1-2 and 3-4 leaf stages, when the measurement was started 5-10 min after ap-plications.
The NH3 volatilization was measured on the day of application and on the following two dayswith a micrometeorological chamber technique (Ferm and Svensson 1992, Svensson 1994a).This method uses passive diffusional NH3 samplers, which are placed at soil surface both inambient air and under chambers, which have constant ventilation rates. The method gives theamount of volatilized NH3 per area and time under the weather conditions prevailing in theambient air during the measurement. For the assessment of NH3 volatilization potentialwithout the effect of varying wind speed, the results of NH3 concentration in the chamberswere used.
Two chambers and two ambient air sampler holders were placed on each plot. The plot sizewas 5 m × 20 m and measurement was carried out in three replications. The NH3 concentrati-on in the chambers was calculated for each plot as the average of the two chambers. For thecalculation of NH3 volatilization rate, treatment averages of absorbed NH3 for each samplertype and position (C- and L-sampler in ambient air and C-sampler in chamber) were used.This way the effect of rather large random variation in the differences between samplers couldbe dampened.
For the estimation of the total amount of volatilized N, NH3 volatilization between measure-ment periods was interpolated taking into account the actual temperature and wind speed(Malgeryd 1996).
Results
The NH3 concentration in the chambers was clearly higher with surface applied slurry thanwith injection (Table 1). The difference existed even in the results of the first applications,when the slurry was incorporated into the soil by harrowing. However, the concentrations oflater surface applications, when the slurry remained on the soil under high temperatures, wereseveral times higher than those of harrowed surface applied slurry. The difference betweeninjected and surface applied slurry diminished with time. After the first applications on clayloam the concentration was higher than on gyttja clay, obviously because the clay loam soilhad rather large clay aggregates, which did not cover the slurry as efficiently as the mellowergyttja clay. Also, the higher temperature during the measurement on clay loam probably con-tributed to the difference between the soil types (Table 2). There were no significant differen-ces between broadcast and band spread slurry. However, after the application at 3-4 leaf stageboth NH3 concentration in chambers and NH3 volatilization in ambient air were lower withband spread slurry than with broadcast slurry.

84
Table 1. Ammonia concentration in chambers and ammonia volatilization rate in am-bient air. Superscripts denote statistically significant differences of ammoniaconcentration. Volatilization rate values which may have been affected by rainor ammonia drifting from other plots are in parenthesis. Estimates of N vola-tilized during measurement periods and their intervals as percentages of ap-plied soluble N in slurry are given in italics
Growth stage Date and Ammonia concentration Ammonia volatilization rateand soil type period in chambers, µg NH3 m-3 in ambient air, g NH3-N ha-1 h-1
1999 Broadca-sting
Bandspreading
Injection Broadca-sting
Bandspreading
Injection
Before May 19 322 281 168 94 47 17planting, May 20 106 120 76 29 33 22clay loam May 21 48 65 43 8
0.8%16
0.7% 6
0.4%
Before May 25 143a 207a 65b 21 42 1planting, May 26 102ab 134a 45b 19 18 3gyttja clay May 27 180 171 127 -1
0.4% 7
0.5% -3
0.03%
1-2 leaf stage, June 8 I 1972a 1811a 163b 85 105 (-22)clay loam June 8 II 1208a 1138ab 126b (-84) 41 (-11)
June 8 III 940a 884a 116b (-69) 8 (-4)June 9 582a 661a 111b 161 203 10June 10 429a 516a 58b 64 117 1
(1.9%) 3.1% (0.03%)
3-4 leaf stage, June 21 I 2484a 1568a 148b 241 99 (-7)clay loam June 21 II 1285a 823a 175b (49) (25) (-13)
June 22 871 677 57 106 77 -3June 23 511a 411a 35b 125 116 -2
(2.5%) (1.8%) (-0.1%)
NH3-N volatilization rates from surface applied slurry was in all cases below 250 g ha-1 h-1
and after harrowing they did not exceed 100 g ha-1 h-1. From injected slurry the volatilization

85
Table 2. Average weather conditions during ammonia measurements. Data of applica-tion day is given separately for each application technique, because applicati-ons and subsequent ammonia measurements were carried out at different ti-mes. Precipitation between the end of a measurement period and the start ofthe next period is in parenthesis
Date Application Duration Temperature Wind speed Precipitationtechnique h °C m s-1 mm
May 19 Broadcasting 4 25.0 3.6 0May 19 Band spreading 4 23.5 3.9 0May 19 Injection 4 19.5 2.8 0May 20 All 11 22.5 2.4 0May 21 All 11 21.5 2.7 0
May 25 Broadcasting 4 18.5 4.5 0May 25 Band spreading 4 18.0 4.6 0May 25 Injection 4 18.0 4.6 0 (1.5)May 26 All 11 18.0 3.4 0May 27 All 3 15.5 2.6 0
June 8 Broadcasting I 2 21.5 2.1 0June 8 Band spreading I 2 24.0 1.8 0June 8 Injection I 2 27.0 1.8 0June 8 Broadcasting II 2 27.0 1.8 0June 8 Band spreading II 2 29.0 1.9 0June 8 Injection II 2 30.5 1.5 0June 8 Broadcasting III 2 30.5 1.5 0June 8 Band spreading III 2 32.0 1.3 0June 8 Injection III 2 33.0 1.2 0June 9 All 5 22.5 5.6 <0.5 (2)June 10 All 11.8 24.5 2.0 0
June 21 Broadcasting I 2 27.5 1.8 0June 21 Band spreading I 2 24.5 1.1 0June 21 Injection I 2 21.0 0.8 0June 21 Broadcasting II 2 21.0 0.8 1.5June 21 Band spreading II 2 18.5 1.1 1.5June 21 Injection II 2 16.5 1.1 1.5 (3.5)June 22 All 11 28.0 1.0 <0.5June 23 All 12 30.5 3.9 0

86
was clearly lower: the highest value was 22 g ha-1 h-1. Injection reduced the volatilizationeven when the field was harrowed after applications. The differences between treatments inNH3 volatilization were generally in accordance with the NH3 concentrations in chambers.However, in some cases the effect of the difference in wind conditions between ambient airand chambers could be seen in the results. The NH3 concentrations under the chambers ongyttja clay were on the second day slightly lower than on the application day, but they werehigher on the third day. The lower values of the second day were probably a consequence of1.5 mm rain in the night following the first day. The chambers were removed from the plotsfor the night and, therefore, moistening of soil by the rain reduced the NH3 volatilization bothin ambient air and under the chambers. On the third day drying of the soil increased the NH3
volatilization potential, which could be seen as higher NH3 concentration in the chambers. Inthe ambient air, however, the NH3 volatilization was lower than on the second day, because oflower wind speed and temperature. The difference in temperature applied also to the cham-bers, but the lower wind speed affected the NH3 volatilization in the ambient air, only, whichled to the different trends in NH3 volatilization the in ambient air and NH3 concentration inthe chambers. Both in the ambient air and in the chambers the amounts of NH3 absorbed intosamplers were low relative to the random variation within and between plots and, therefore, insome cases the calculated NH3 volatilization rate values were below zero. The negative valuesare a consequence of higher amounts of absorbed NH3 in the ambient air samplers than in thechamber samplers.
The negative NH3 volatilization values were also obtained on June 8, when the wind speedwas low and the amounts of NH3 absorbed in the ambient air samplers were close to those inthe chamber samplers. In the case of broadcast plots the amount of NH3 in the ambient airsamplers may have been increased by NH3 drifting from the band spreading plots, where slur-ry was applied during the second and third measurement period in the broadcast plots. Thevalues of broadcast plots from these periods are negative, because the ambient air samplersabsorbed more NH3 than the chamber samplers. Similarly, the NH3 from surface applicationsmay have contributed to the negative values of injection plots measured after the two later ap-plications, when surface applied slurry was not incorporated.
On June 9 and 23 the wind speed was several times higher than on the previous day, whichincreased the NH3 volatilization more than on the day before. The 1.5 mm precipitation onJune 21 during the second period, may have affected the NH3 volatilization values, becausethe soil remained dry under the chambers.
Discussion
Even though the weather was warm or even hot, the NH3 emissions were not very high. Whenslurry was incorporated into the soil by harrowing, the total N losses through NH3 volatiliza-
87
tion were less than 1% of the soluble N in slurry. The emissions from injected slurry wereeven lower. After later applications, when slurry was not incorporated, the N losses from sur-face applied slurry was higher, but still only about 3% of the soluble N at the highest. Appa-rently, the soil has absorbed the slurry rather efficiently. However, measurement was carriedout for three days only and the longer-term volatilization may have been substantially higherthan the measured losses.
There were no significant differences in NH3 volatilization between band spread and broad-cast slurry, which is in accordance with the results obtained by Ferm et al. (1999). Also, thereduction of NH3 volatilization achieved through injection or incorporation by harrowing cor-responds to earlier results (Dosch & Gutser 1996, Svensson 1994b, Weslien et al. 1998).
Plants may reduce the NH3 volatilization through NH3 absorption into leaves (Sommer et al.,1997). However, the taller wheat canopy of 3-4 leaf stage did not keep the NH3 emissionslower than at the 1-2 leaf stage, probably because the weather conditions and especially thewind speed affected the NH3 volatilization more and because the canopy was rather thin afterdry weather in the spring and early summer. At the 3-4 leaf stage the wheat canopy possiblycontributed to the lower but not significantly different, NH3 volatilization from band spreadslurry compared with broadcast slurry.
The measurement method used in this experiment may give biased results in a growing crop,because under chambers, where the NH3 concentration is usually higher than outside, plantsmay absorb more NH3 than in ambient air (Ferm et al. 1999). This should reduce the NH3 ab-sorption into chamber samplers and give lower NH3 volatilization values. However, this couldnot be observed, when comparing the results of the 3-4 leaf stage with those of the 1-2 leafstage.
In addition to reduced NH3 volatilization, injection also improves the utilization of slurry Nby placing the slurry deeper into the soil. This makes the N better available for plant roots,because at the injection depth there are usually more roots and moisture than in the surfacesoil, where slurry remains after surface spreading and incorporation by harrowing.
In the soil slurry N is susceptible to gaseous losses emerging from the nitrification of ammo-nium to nitrate and subsequent denitrification of nitrate. In these emissions nitrous oxide(N2O) is of most concern, because it contributes to both climate changes and depletion ofstratospheric ozone. By reducing the NH3 losses and increasing slurry N in soil, injection orincorporation of slurry may increase the N2O emissions from the soil (Dosch & Gutser 1996).However, the NH3 emitted into the environment may eventually transform into N2O and,therefore, reduction in NH3 emission will not necessarily affect the total N2O emission (Fermet al., 1999, Weslien et al., 1998). Addition of more N into the soil may also increase the riskfor nitrate leaching, but if the utilization of manure N by crop plants is improved by injectionor incorporation of manure, the overall N load on the environment will be reduced.

88
References
Dosch, P. & Gutser, R., 1996. Reducing N losses (NH3, N2O, N2) and immobilization fromslurry through optimized application techniques. Fertilizer Research 43: 165-171.
Ferm, M., Kasimir-Klemedtsson, Å., Weslien, P. & Klemedtsson, L., 1999. Emission of NH3
and N2O after spreading of pig slurry by broadcasting or band spreading. Soil Use and Ma-nagement 15: 27-33.
Ferm, M. & Svensson, L., 1992. A new approach to estimate ammonia emissions in Sweden.In: Klaassen, G. (ed.). Ammonia emissions in Europe: Emission coefficients and abate-ment costs. Laxenburg: International Institute for Applied Systems Analysis. p. 109-125.
Malgeryd, J. 1996. Åtgärder för att minska ammoniakemissionerna vid spridning av stallgöd-sel (Measures to reduce ammonia emissions following application of animal manure). JTI-rapport, Lantbruk & Industri nr 229, 126 p. Uppsala: Swedish Institute of AgriculturalEngineering (in Swedish, summary in English)
Sommer, S. G., Friis, E., Bach, A. & Schjørring, J. K., 1997. Ammonia volatilization from pigslurry applied with trail hoses or broadspread to winter wheat: effects of crop develop-mental stage, microclimate, and leaf ammonia absorption. Journal of Environmental Qua-lity 26: 1153-1160.
Svensson, L., 1994a. A new dynamic chamber technique for measuring ammonia emissionsfrom land-spread manure and fertilizers. Acta Agriculturæ Scandinavica, Section B, Soiland Plant Science 44: 35-46.
Svensson, L., 1994b. Ammonia volatilization following application of livestock manure toarable land. Journal of Agricultural Engineering Research 58: 241-260.
Weslien, P., Klemedtsson, L., Svensson, L., Galle, B., Kasimir-Klemedtsson, Å & Gustafs-son, A., 1998. Nitrogen losses following application of pig slurry to arable land. Soil Useand Management 14: 200-208.

89
A NEW CONCEPT FOR USE OF PIG SLURRY FOR CEREALS
Petri KapuinenAgricultural Research Centre of Finland, Agricultural Engineering Research
Vakolantie 55, FI-03400 Finland. Email: [email protected]
Abstract
Application of pig slurry may cause problems in a short growing season like in Finland. Theeffect of nitrogen in autumn application is difficult to predict. An environmental impact mayarise in the form of ammonia, nitrate and nitrous oxide. In the case of spring application, therewill be a risk of compaction of still wet subsoil on clay soil. One recent solution to the pro-blem has been spreading slurry in growing crops. Because ammonia losses are highly depen-dent on the weather during and after the application, and because it is typically warmer in thesummer than in the spring, that will not be a complete solution to the problem. Additionally,the odour nuisance during an extended period, e.g. in the best holiday time, will cause con-flicts with the neighbours. The emissions could best be avoided by injection techniques. Theinjection should take place at the time of sowing, because otherwise it could harm the plantsrealised in crowing crops. The soil compaction problem of early spreading could be avoidedby using appropriate machinery with low axle loads and low inflation pressures. The qualityof grain yield could be improved by using slurry only up to the amount needed to supply suf-ficient amounts of phosphorus and to carry out nitrogen fertilisation with artificial fertilisers.The latter is equivalent with the starter nitrogen when spreading in growing crops. To evaluatethis theory a field test was arranged. In a one-year field trial the results were promising. Thelosses caused by compaction by of the tanker were only 1%. The injection system and thecombined system yielded 38 and 27% better on clay soil than the traditional method on thebasis of nitrogen originating from slurry. The use of slurry did not increase the moisture con-tent of the yield, compared with use of artificial fertiliser, only.
Key words: pig slurry, spring cereals, application technique, injection, application strategy.
Introduction
Application of pig slurry will be a problem in a short growing season like in Finland. The ef-fect of autumn application is difficult to predict (Kemppainen, 1989, Steineck et al., 1991). Incase of low effect an environmental impact will arise in the form of ammonia, nitrate and ni-trous oxide. In the spring, there will be a risk of soil compaction of still wet subsoil on theclay soils (Alakukku, 1997), especially in areas where pork production mainly takes place(Kapuinen 1994), when fields are sown as early as possible to utilize the short growing seasonas effectively as possible.

90
One recent solution to the problem has been spreading slurry in growing crops (Hoffmann &Hege, 1985, Pedersen & Østergaard, 1991, Rodhe & Salomon, 1992a, 1992b, Kapuinen,1996). Yields achieved by spreading slurry on growing crops are at least as high as those a-chieved by applying slurry on the surface and incorporating it into the soil just one hour befo-re sowing (Kapuinen, 1997a, Kapuinen, unpublished data). For this solution, starter nitrogenis used to supply nitrogen for crops, where the slurry has not yet been spread. The advantagesare that the slurry application will not disturb the sowing, and that the great labour require-ment involved with of slurry application will be postponed until after the labour requirementpeak when the subsoil is no longer too wet. However, according to the study, yields typicalfor equivalent rates of artificial fertiliser will not be achieved from of e.g. ammonia emissions(Mattila 2001). The loss of nitrogen as ammonia can not be compensated from using additio-nal nitrogen from artificial fertilisers within the Agro-Environment Subsidy Scheme of Fin-land (MMM 1995a, 1995b, 1996, 1997, 2000). The value of yield loss per kg of ammonia lostis clearly higher than the value of nitrogen in artificial fertiliser (Kapuinen 1994, 1997b). Theuse of slurry will not only cause yield losses, but also reductions in the quality of the yield.
Ammonia losses are highly dependent on the weather during and after application, which istypically warmer in the summer than in the spring (Beachamp et al., 1978, Lauer et al., 1976,Molloy & Tunney, 1983, Steineck et al., 1991). The application should take place late in theevening and at night when the temperature is not higher than from 15 to 20°C (Hoff et al.,1981, Döhler, 1990) and the wind velocity is low. This is not convenient and will not permitan efficient use of spreading machinery. Additionally, the odour nuisance during the best ho-liday time including the most important national summer festival, the Midsummer, will causeconflicts with the neighbours. From a logistic point of view manure should have a high con-centration of dry matter producing a high nutrient content. However, this would increase theammonia emissions of slurry applied on surface (Sommer & Christensen, 1990). The ammo-nia emissions and the odour nuisance could be best avoided by using the injection techniquewhen spreading such slurry. However, injection into growing crops may damage the crops(Kapuinen 1996, 1997a). This could be avoided by injecting before or in combination withthesowing. The soil compaction problem could be avoided by using appropriate machinery withlow axle loads and low inflation pressures (Kapuinen, 1996, Alakukku, 1997). The quality ofgrain yield could be improved by using the needed amount of slurry to supply sufficientamounts of phosphorus and complete nitrogen fertilisation with artificial fertiliser.
The objectives of the study were to evaluate the performance of pig slurry application in com-bination with artificial fertiliser sown with a combined drill in relation to more traditionaltechniques.

91
Development of the injection technique for grain crops
Low draft simple-tine injectorOne of the applied techniques in the previous study was injection into pre-harrowed soil withan injector with a simple tine construction (spring loaded straight tubes) and a very low draft(400 N, Kapuinen, unpublished data) allowing a very wide working width in practical soluti-ons (Kapuinen, 1997a). The technique yielded better on a light soil type having a great orga-nic matter content than application on surface (Kapuinen, 1997a, Kapuinen, unpublished da-ta). Silty clay soil was still course after the one harrowing, and some ammonia was stillreleased to the atmosphere (Mattila 2001). The nitrogen mineralised from the organic matterof soil was not sufficient to replace that. The spacing of the tines of 30 cm could be seen asdark green about 10 cm wide stripes in the crops afterwards. The technique was even used ingrowing crops with almost similar results. Further development was required.
The new concept of slurry injection combined with sowing

92
The subsoil compaction due to the spreading just before sowing, which was one of the mostvital motivations of spreading slurry only in growing crops, was not recognized (Kapuinen,unpublished data). The inflation of the tires was only 100 kPa, although the load of the boogieaxle of the tanker was 12 tonnes at the greatest. The remaining disadvantage of slurry appli-cation in the spring was the great labour requirement at peak days (Klemola 2000). However,an early application of slurry would improve the effect of nutrients of slurry. The odour nui-sance and ammonia emissions could be avoided with an advanced injection technique (Döhler1990), where a combination of sowing and slurry application would facilitate the injection ofslurry in the every second space of seed rows about 6 cm apart from seed rows. There is a clo-se correlation between the rate of odour and the ammonia emissions during and after applica-tion of untreated pig slurry (Pain & Misselbrook 1990). By using a combined drill with slurryfeed through hydraulically driven manifold and hoses into the fertiliser tines trailed by an or-dinary slurry tanker and tractor (Fig. 1), the fertiliser and the slurry could be lead into the seedbed, which technique has given the best performance of artificial fertiliser in Finnish andScandinavian conditions on clay soils (Kara et al., 1970, Huhtapalo, 1982).
A new concept of application strategyPig slurry has got an appropriate nutrient relation for grain crops, but the lost nitrogen in pro-duction facilities and storage as well as the organically bound nitrogen in slurry must be re-placed with additional soluble nitrogen (Steineck et al, 1991). When pig slurry is used to theamount containing phosphorus the average allowed rate, 15 kg/ha, for plants available phos-phorus (75% of the total phosphorus), the application rate of ammoniacal nitrogen from slurrywill be about 50 kg/ha (Kapuinen & Karhunen ,1990, MMM, 1995a, 1995b, 1996, 1997,2000, Viljavuuspalvelu, 2000). The remainder according to the plants = requirements, from 50to 90 kg/ha, will be applied most appropriately as an artificial nitrogen fertiliser. Nitrogen ori-ginating from the artificial fertiliser will be readily available for the plants soon after thesowing, and the quality of yield will be high and within narrow specifications when the pro-portion of nitrogen from slurry and the rate of applied organically bound nitrogen is small.The only disadvantage seems to be the requirement for nurse tankers and their drivers to sup-ply slurry facilitating continuos sowing. However, at least one Finnish farmer uses the nursetankers (Kapuinen 1999).
Materials and methods
The performance of the combined slurry injection and sowing system with starter fertiliserplaced into the same row with slurry was tested in a field experiment on a silty clay soil inVihti in 2000. The design was randomized blocks with four replicates. The four nitrogen le-vels 0, 50, 75, 100 and 125 kg/ha were included in each block randomized separately from theslurry treatments. The slurry treatments were: 1) slurry (50 kg sol. N/ha) injected and artificialfertiliser (50 kg N/ha) placed simultaneously with sowing of the seed with the developed

93
combined drill system, 2) slurry (50 kg sol. N/ha) injected before a combines placement ofartificial fertiliser (50 kg N/ha) and sowing of the seed, 3) slurry (50 kg sol. N/ha) spread onthe surface and incorporated with an S-tine harrow one hour later followed by a combinedplacement of artificial fertiliser (50 kg N/ha) and sowing of the seed and 4) artificial fertiliser(100 kg/ha N) placed simultaneously with sowing of the seed with the developed combinedsystem.
The establishment of the field test took place on 10 May, 2000. The field was levelled theprevious day to achieve an even moisture content in soil and cultivated with a horizontal rota-ry harrow just before the treatments. The inflation pressure of any tire in the combination was100 kPa. The boogie axle load of the tanker was 12 tonnes. The nutrient contents of the pigslurry used were: 6.2 kg tot. N/t, 4.5 kg sol. N/t, 1.34 kg tot. P/t and 1.89 kg K/t. The drymatter content was 6.2% and the pH was 7.28. 75% of the total phosphorus was considered tobe available to plants. The application rate was 11.8 t/ha. The application rate was controlledby RDS Apollo 3 controller installed on the machinery (Kapuinen 2000). The nutrient con-tents of artificial fertiliser used in slurry treatments 1 to 3 were: 26% N and 1%K in treatment4 and the nitrogen levels were 20% N, 5% P and 4% K. The accurate rates of nutrients in slur-ry treatments 1 to 3 were then 123 kg tot. N/ha, 103 kg sol. N/ha, 12 kg available P/ha and27 kg K/ha. In treatment 4 and nitrogen level 100 kg/ha the application rate of phosphorus andpotassium were 25 and 20 kg/ha, respectively, and followed the application rate of nitrogen.The crop was spring barley of the variety Inari. The ambient temperature was 22 to 23°C, theaverage relative humidity of air was 29%, and the average wind velocity was 5.7 m/s duringthe application and during the time when slurry was exposed to the air. The moisture contentof the soil was 19.4% in the uppermost 10 cm and 27.4 to 29.5% from 10 to 50 cm deep in thesoil. The plots were harvested on 6 September. The yield and moisture contents at harvest we-re determined. Further analyses from the samples are not included in this material.
Results and discussion
The yield losses caused by trampling effect is presented in Fig. 2 as a difference of yields ofnitrogen level 100 kg N/ha and treatment 4. The loss was negligible, 1% for a working widthof 4.7 m, as expected according to the results of earlier studies (Kapuinen, unpublished data)where the tractor, the tanker and the inflation pressure of the tires were the same as in the pre-sent study. On the contrary, in even earlier studies (Kapuinen 1997a) where the inflation pres-sure of the tires and the axle load of the tanker were 190 kPa and 3-9 tonnes, accordingly, atrampling treatment at sowing time caused a significant loss of 8.1% for a working width of4.7 m. On the other hand, in that earlier study the trampling treatment and the combined ferti-liser placement and sowing took place separately.
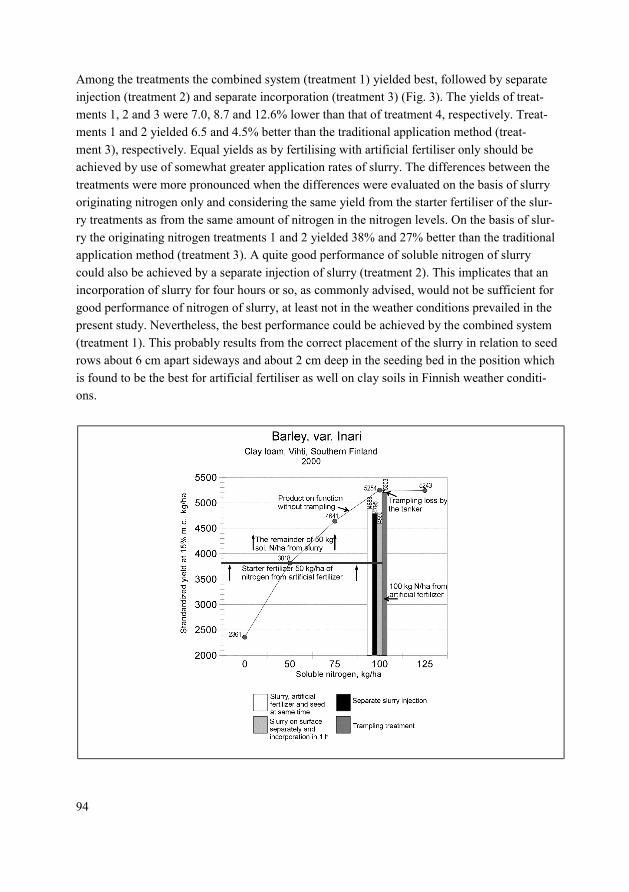
94
Among the treatments the combined system (treatment 1) yielded best, followed by separateinjection (treatment 2) and separate incorporation (treatment 3) (Fig. 3). The yields of treat-ments 1, 2 and 3 were 7.0, 8.7 and 12.6% lower than that of treatment 4, respectively. Treat-ments 1 and 2 yielded 6.5 and 4.5% better than the traditional application method (treat-ment 3), respectively. Equal yields as by fertilising with artificial fertiliser only should beachieved by use of somewhat greater application rates of slurry. The differences between thetreatments were more pronounced when the differences were evaluated on the basis of slurryoriginating nitrogen only and considering the same yield from the starter fertiliser of the slur-ry treatments as from the same amount of nitrogen in the nitrogen levels. On the basis of slur-ry the originating nitrogen treatments 1 and 2 yielded 38% and 27% better than the traditionalapplication method (treatment 3). A quite good performance of soluble nitrogen of slurrycould also be achieved by a separate injection of slurry (treatment 2). This implicates that anincorporation of slurry for four hours or so, as commonly advised, would not be sufficient forgood performance of nitrogen of slurry, at least not in the weather conditions prevailed in thepresent study. Nevertheless, the best performance could be achieved by the combined system(treatment 1). This probably results from the correct placement of the slurry in relation to seedrows about 6 cm apart sideways and about 2 cm deep in the seeding bed in the position whichis found to be the best for artificial fertiliser as well on clay soils in Finnish weather conditi-ons.
95
Further research is needed to confirm the results of this one-year field test even on clay soils.The system should be evaluated on other soil types and in other crops as well. By now, onlythe yield performance of nitrogen of slurry and the moisture content at harvest are considered.In the future, the quality of yield will be analysed from the samples taken. A visual observati-on and the moisture contents of the samples, however, did not implicate any deterioration ofquality in relation to the one from the nitrogen levels. The moisture contents of treatments 1and 2 were 21.5% compared with 23.2 to 24.2% for treatments 3 and 4 at a nitrogen level of100 kg/ha. Nitrogen levels lower than 75 kg/ha increased the moisture content at harvest. Thiswas due to a rather dry period after the sowing and rainy weather from midsummer.
Conclusions
The fertiliser value of soluble nitrogen in slurry is always somewhat lower than that of artifi-cial fertiliser, even when the best available technique is used, and it should be assessed some-what lower than the soluble nitrogen content of slurry. However, advanced applicationtechniques could improve the usage of nitrogen of slurry significantly, even when the appli-cation takes place at high ambient temperatures or windy weather conditions, thus facilitatingthe application to take place in a rather wide range of weather conditions. There should be arisk of soil compaction when using such a system with a reasonable tanker size and low infla-tion pressures at time of spring sowing.
References
Alakukku, L., Long-term soil compaction due to high axle load traffic, Agricultural ResearchCentre of Finland, Institute of Crop and Soil Science, PhDThesis, 55 pp. + 5 appendices.
Beachamp, E.G., Kidd, G.E. & Thurtell, G., 1978, Ammonia Volatilization from SewageSludge Applied in the Field, J. Environ Qual. 7, 1: 141-146.
Döhler, H., 1990, Laboratory and field experiments for estimating ammonia losses from pigand cattle slurry. In: Nielsen, V.C., Voorburg, J.H. & L = Hermite, P., Odour and Ammo-nia Emissions from Livestock farming, Proceedings of a seminar held in Silsoe, UK,March 26-28, 1990, Commission of the European Communities: 132-139.
Hoff, J.D., Nelson, D.W. & Sutton, A.L., 1981, Ammonia volatilization from liquid swinemanure applied to cropland, Journal of Environmental Quality, 10: 1: 90-94.
Hoffmann, H. & Hege, U., 1985, Gülle – ein wertvoller Wirtschaftsdünger, Auswertungs- undInformationsdienst für Ernährung, Landwirtshaft und Forsten (AID), 149: 1-28.
Huhtapalo, Å., 1982, Scandinavian principles for fertiliser placement, Proceedings of 9thConference of International Soil Tillage Research Organization (ISTRO), Yugoslavia, 21-25 June: 669-674.
Kapuinen, P., 1994, Lannan käytön taloudellisuus ja lannan ravinteiden hyväksikäytön pa-rantaminen. VAKOLAn tutkimusselostus No 68, 90 pp.

96
Kapuinen, P., 1996, Lannan levitys kasvustoon. Osa 2. Lietelannan levitysmahdollisuudetkasvavaan viljanoraaseen, VAKOLAn tukimusselostus 73: 1-62.
Kapuinen, P., 1997a, Avuksi levitys suoraan kasvustoon - Lannan levittäjät ahtalla. Pellervono 3b: 28-31
Kapuinen, P., 1997b, Onko lanta tuote vai jäte? [Manure - byproduct or waste?] In: Salo, R.(ed.), Maa kasvun antaa [Growth from the Earth], Symposium on agricultural productionand research, Jokioinen, August, 5-7, 1997, Maatalouden tutkimuskeskuksen julkaisuja,Sarja A no 27: 97-105.
Kapuinen, P., 1999. Lietelannan levitysmadollisuudet, TTS:n maataloustiedote, 6: 1-6.Kapuinen, P., 2000. Lietelannan levityksen täsmäviljelysovellus, MTTLn julkaisuja, 94: 261.Kapuinen, P. & Karhunen, J., 1990, Lietelantajärjestelmien toimivuus, VAKOLAn tutkimus-
selostus No. 59, 108 pp. + 2 appendices.Kara, O., Räisänen, L. & Palomäki, A., 1970, Rivilannoitus sekä rivi- ja kylvölannoituskone-
et, VAKOLAn tiedote no. 11, 1-12.Kemppainen, E., 1989, Nutrient content and fertiliser value of livestock manure with special
reference to cow manure, Annales Agriculturae Fenniae, PhD Thesis, 28, 3: 163-284.Lauer, D.A., Bouldin, D. R. & Klausner, S. D., 1976, Ammonia Volatilization from Dairy
Manure Spread on the Soil Surface, J. Environ. Qual., 5, 2: 134-141.Maa- ja metsätalousministeriö (MMM), 1995a, Valtioneuvoston päätös maatalouden ympäri-
stötuesta No. 760: 1-7.Maa- ja metsätalousministeriö (MMM), 1995b, Maatalouden ympäristötuen perustuki. O-
hjelmakohtaiset tuet, Maatalouspolitiikan osasto, Yleiskirje No. 46: 11 + 12 appendices.Maa- ja metsätalousministeriö (MMM), 1996, Maatalouden ympäristötuen perustuki. O-
hjelmakohtaiset tuet, Maatalouspolitiikan osasto, Yleiskirje No. 65:13 pp.Maa- ja metsätalousministeriö (MMM), 1997, Maatalouden ympäristötuen perustuki. O-
hjelmakohtaiset tuet, Maatalouspolitiikan osasto, Yleiskirje No. 85: 11 pp. + 1 appendix.Maa- ja metsätalousministeriö (MMM), 2000, Ympäristötukiopas: 27 pp.Mattila, P., 2001, Ammonia volatilization from pig slurry applied to spring wheat with diffe-
rent techniques, these proceedings.Molley, S.P. & Tunney, H., 1983, A laboratory study of ammonia volatilization from cattle
and pig slurry, Ir. J. agric. Res., 22: 27-45.Pain, B. F. & Misselbrook, T. H., 1990, Relationships between odour and emission during and
following the application of slurries to land, In: Nielsen, V.C., Voorburg, J.H. & L = Her-mite, P., Odour and Ammonia Emissions from Livestock farming, Proceedings of a semi-nar held in Silsoe, UK, March 26-28, 1990, Commission of the European Communities: 2-9.
Pedersen, C.Å. & Østergaard, H.S., 1991, Plantavlsarbeijdet i de landøkonomiske foreninger1990. Gødning og kalkning. Landudvalget for planteavl, Århus: 70-112.
Rodhe, L. & Salomon, E., 1992a, Spridning av flytgödsel i stråsäd, Jordbrukstekniska insti-tutet, JTI-report No 139: 59 pp. + 18 appendices.
97
Rodhe, L. & Salomon, E., 1992b, Trials on Slurry Application Techniques for Cereal Crops,International Conference on Agricultural Engineering AgEng = 92, Uppsala, June 1-4,1992: 291-292
Sommer, S.G. & Christensen, B.T., 1990, Effect of dry matter content on ammonia loss fromsurface applied cattle slurry, In: Nielsen, V.C., Voorburg, J.H. & L = Hermite, P., Odourand Ammonia Emissions from Livestock farming, Proceedings of a seminar held in Silsoe,UK, March 26-28, 1990, Commission of the European Communities: 141-147.
Steineck, S., Djurberg, L. & Ericsson, J., 1991, Stallgödsel, Sveriges lantbruksuniversitet,Speciella skrifter No. 43: 91 pp.
Viljavuuspalvelu, 2000, Viljavuustutkimuksen tulkinta peltoviljelyssä: 31 pp.

98
REDUCTION OF AMMONIA EMISSION BY SLURRY INJECTIONEFFECT OF DIFFERENT TYPES OF INJECTORS
Martin N. HansenDanish Institute of Agricultural Sciences, Department of Agricultural Engineering
Research Centre Bygholm, P.O. Box 536, DK-8700 Horsens DenmarkTel.: +45 7629 6036. E-mail: [email protected]. Fax: +45-7629 6100
Abstract
The ammonia emission from livestock production causes losses of nutrients and environmen-tal effects. A substantial part of the ammonia emission arises from spreading of livestock ma-nure. Injection of slurry is one way to reduce the ammonia emission, but slurry injection ingeneral, and especially on grassland, puts heavy demands on the slurry injection techniques.An investigation was therefore initiated to investigate the ammonia reduction potential of dif-ferent slurry injection techniques. Compared with surface application the ammonia emissionwas lowered substantially when slurry was injected. Compared with surface applied slurry,the ammonia loss was 77% lower when the slurry was injected by use of the most efficientslurry injection method and 12% lower when incorporated by the least efficient injection met-hod. The reduction of the ammonia emission was correlated to the injection depth and thevolume of the slot created.
Key words: Ammonia, emission, slurry, spreading, injection
Background
Considerable amounts of nitrogen are lost from livestock production as ammonia. This causesloss of nutrients and significant deleterious effects on forests, lakes and natural resorts (Bak etal., 1999). It has been estimated that the livestock production in Denmark contributes withapproximately 99% of the ammonia emission and that approximately 25% of the ammoniaemission is derived from spreading of livestock manure (Bak et al., 1999; Andersen et al.,1999). Therefore, there is a high interest in the development of technology that will enable re-ductions in the ammonia emission arising from application of livestock manure to fields.
A steadily increasing share of the Danish animal livestock manure is applied to growing cropsin order to increase the utilization rate of the manure and due to environmentally deterrent re-gulations. However, due to the climatic conditions in the growing season, the application ofmanure to growing crops may increase the ammonia emission (Nathan & Malzer, 1994;Sommer et al., 1997). In order to decrease the ammonia emission from slurry application, ithas proved advantageous to use trailed hose spreading (Sommer et al., 1997) and especially

99
slurry injection technologies (Thomson et al., 1987; Rubæk et al., 1996; Huijsmans et al.,1997).
Slurry injection was formerly done by means of deep-injectors, which typically injected theslurry 15 to 20 cm below the soil surface. However, this type of injection caused crop dama-ges (Prins et al., 1987; Long & Gracey, 1990), and the capacity was low, due to a highdraught force requirement. In order to decrease the crop damage and increase the capacity ofthe slurry injection system, various new types of shallow slurry injectors have been develo-ped. Several of them were developed to permit shallow injection of slurry into grassland(grasslands injectors). The various types of grassland injectors are equipped with injection sy-stems of different design. The design of the injection system will influence the slurry injectionefficiency, thereby influencing the potential for reducing the ammonia emission. Therefore, aresearch initiative was made to investigate the ammonia reduction potentials of different typesof slurry injection technologies.
Materials and method
As the climatic conditions during the growing season will have a major impact on the effectof slurry injection, the investigation was performed both in the growing season of 1999 and inthe growing season of 2000. Both years the investigation took place in a second-year grassfield immediately after the first mowing in the beginning of June. The soil conditions of thefield used in 1999 were clay with fine sand, and the soil conditions of the field used in 2000were fine sand with clay. After the grass crop was removed, the needed plots were marked. E-ach plot measured 36 × 36 m, and the distance between the plots was of 100 m. Approxima-tely 3888 kg of cattle slurry per plot corresponding to 30 t of slurry per ha was applied to eachplot by use of different types of slurry injectors.
Application techniquesThe different types of shallow slurry injectors that formed part of the investigation were cho-sen on the basis of the results of a preliminary investigation. The aim of the preliminary inve-stigation was to get an overview of the different types of slurry injectors presently in use, sothat distinct and efficient types could be chosen for the investigation. Three different types ofslurry injectors (JOS_d, UM and Harzoe) and one trailed hose spreader for comparison wereused for the 1999 investigation, and four different types of slurry injectors (JOS_d, JL-Combi,Kimadan and JOS_s) and one trailed hose were used in the 2000 investigation.
The injection system of the various slurry injectors cuts slots into the grass sward into whichthe slurry is applied. The different types of slurry injectors have different design of injectionsystem. The designs of the injections system used in the present investigation are as follows:

100
• JOS_d: A disk opening system of two angled disk coulters. The angled disks have a dia-meter of 305 mm, a width of 5 mm and are placed at an angled of 7° with respect to eachother. The coulters almost touch each other at the point where the cutting of the sward be-gin.
• UM: Thin disk coulters followed by vertical injector coulters. The disk coulters create thinslots with a width of 5 mm, which are widen to 24 mm by the vertical injections coulters.
• Harzoe: Vibrating disk coulters, which simultaneously cut and widen the slots.• JOS_s: Three disk coulters combined to a thick disk coulter-system that creates a V-
shaped slot into which the slurry is applied.• JL-Combi: Thick disk coulter-system. The thick disks cut and create V-shaped slots into
which the slurry is applied.• Kimadan: Thin disk coulters followed by vertical tines and rubber wheels. The thin disks
coulters cuts thin slots in the grass, which are enlarged by the vertical tines before the slur-ry is applied. The slots are closed by the rubber wheels after the slurry is applied.
Ammonia measurementThe rate of ammonia emission was estimated for each of the plots by use of the Micrometeo-rological Mass Balance Technique (Leuning et al., 1985). The technique involves a measuringmast situated centrally in each plot and a background measuring mast located outside the plotfor measurement of the background ammonia level. In 1999, the centrally located masts werefitted with five measuring units mounted at levels of 30, 50, 95, 110, and 200 cm above thesoil surface, and the background mast was fitted with two measuring units mounted at levelsof 35 and 80 cm above the soil surface. In 2000, an alternative Zinst method of the Micromete-orological Mass Balance Technique was used (Wilson et al.,1982; Sherlock et. al, 1989),where both the centrally placed masts and the background mast were fitted with two measu-ring units placed at a height of 88 cm. The ammonia emission rate after the slurry applicationwas measured continuously for six days in 1999 and for twelve days in 2000.
In order to estimate the effectiveness of the injection, the mean injection depth and the meanvolume of the slot created by the injection were measured for each type of slurry injector. Themean injection depth was determined from 20 random measurements of the depth of the slotsby means of a vertical rod-plate measurement method. The volumes of the slots were estima-ted by 16 plaster casts per plot.
Results
The climatic conditions of both growing seasons were relatively humid (Fig. 1) with 36 mmof rain in May 1999 and 53 mm of rain in May 2000.

101
a) b)
05
101520
1 6 11 16 21 26 31
D ate of M ay 1999
Dai
ly ra
infa
ll, m
m
05
101520
1 6 11 16 21 26 31
Date of May 2000
Dai
ly ra
infa
ll, m
m
Fig. 1. Daily rainfall in the month prior to the slurry application in a) 1999, b) 2000.The slurry application took place on 1 June 1999 and 30 May 2000.
The climatic conditions during and after the slurry application were approximately similar forthe two investigation periods (Table 1). The higher air temperature and wind speed and thelower humidity during the application in 2000 may have increased the potential for ammoniaemission.
Table 1. Climatic conditions during and after the application of slurry in 1999 and2000. Values in brackets are standard deviations
Period Year Rainfallmm
Soil temp.oC
Air tempoC
Wind speedm × s-1
Humidity%
1999 0 12.4 10.6 3.2 71.3Duringapplication 2000 0 10.0 12.5 7.7 66.0
1999 22.0 12.8 (0.5) 12.6 (2.9) 4.1 (1.9) 83.8 (11.5)The following6 days 2000 9.5 10.9 (0.7) 10.3 (1.8) 3.9 (1.5) 77.9 (7.9)
Mixed cattle slurry was applied both years, but the composition of the applied slurry was dif-ferent (Table 2). The potential for ammonia emission was highest in 2000 due to the highercontent of dry matter and ammonium in the applied slurry.
Table 2. Composition of the slurry applied in 1999 and 2000. Values in brackets arestandard deviations
Year No. ofobservations
Dry matter%
pH Total Ng per kg slurry
Ammonium Ng per kg slurry
1999 4 3.6 (0.5) 7.7 (0.06) 2.15 (0.22) 1.34 (0.18)2000 10 8.5 (0.2) 7.0 (0.02) 3.24 (0.12) 1.58 (0.09)

102
a) b)
0
10
20
30
40
50
UM JOS_d Bandspreader
Harsøe
Type of application technique
NH
3 lo
ss, %
of a
pplie
d TA
N
0
10
20
30
40
50
Bandspreader
JOS_s JOS_d JL combi Kimadan
Type of application technique
NH
3 lo
ss, %
of a
pplie
d TA
N
Figure 1. Ammonia loss in per cent of applied total ammonium nitrogen (TAN) afterslurry application to grass by use of different application techniques in a)1999 and b) 2000. UM, JOS_d, Harsøe, JOS_s, JL-combi and Kimadan aredifferent types of slurry injection techniques.
Both years the ammonia emission was lower from the injected slurry than from the surfaceapplied slurry (Fig. 2). The most efficient slurry injection technique used in 1999 reduced theammonia emission by 50%, compared to surface applied slurry (Fig. 2a), while the least effi-cient injection type caused a 20% reduction of the ammonia emission. The ammonia emissionwas considerably higher in 2000, due to the higher ammonium and dry matter content(Table 3). The most efficient type of slurry injection used in 2000 reduced the ammonia emis-sion by 77%, compared to trailed hose application, while the least efficient injection type re-duced the ammonia emission by 12% (Fig. 2b).
Table 3. Injection depth and volume of the slots created by the various slurry injecti-on techniques
Year Type Depth of injection
cm
Volume ofslots
dm/m2
Distance bet-ween slots
cm
Slurry applied
t/ha.
Part of ap-plied slurry
injected%
UM 3.9 (1.8) 1.8 (1.0) 25 38.8 46JOS_d 4.3 (1.1) 2.2 (0.8) 25 37.7 61
1999
Harsoe 5.4 (1.1) 3.5 (1.2) 30 31.2 100JOS_s 2.5 (1.5) 1.04 (0.96) 25 42.3 25JOS_d 2.6 (1.5) 0.72 (0.52) 25 33.6 21
Kimadan 6.9 (1.2) 6.6 (7.16) 25 29.5 100
2000
JL Combi 3.2 (1.7) 1.73 (1.25) 20 32.4 53
The mean depth of injection and the mean volume of the slots created during the injection va-ried considerably for the shallow injectors used in the investigation (Table 3). A good corre-lation between the depth of injection and the volume of slots was seen, and only types crea-

103
ting a mean injection depth of more than 5 cm allowed full injection of approximately 30 t ofslurry per ha.
0
20
40
60
80
100
0 1 2 3 4 5 6 7
Mean volume of injection slots, dm3/m2
Rel
ativ
e am
mon
ia
emis
sion
, %
Figure 3. The relation between the obtained ammonia emission reductions and the vo-lume of injection slots established by the different slurry injection techniques.
The effectiveness of the injections had a major influence on how efficiently the ammoniaemission was reduced by slurry injections. A positive correlation (r2 = 0.88) was seen betweenthe volume of the injection slots created by the different slurry injection techniques and thepotential for reducing the ammonia emission (Fig. 3).
Discussion
The aim of slurry injection is to reduce the ammonia loss as much as possible by reducing thecontact surface area between the slurry and the atmosphere. This can be done by injectingslurry into the slots created by the injection unit of the slurry injectors. The smallest contactsurface area between the slurry and the atmosphere will be obtained when all the applied slur-ry can be held in the slots. However, as the soil can be very resistant to penetration in thegrowing season, efficient slurry injection makes heavy demands on the design of the injectionunit. A high clay content and especially drought will increase the penetration resistance of thesoil, and efficient slurry injection may therefore be impossible in some areas and periods.
In both 1999 and 2000 the rainfall before slurry injection was close to the average of May(49 mm of rainfall), and so, the soil conditions in both years were considered to be normal.Under these conditions injection of slurry reduced the emission of ammonia to between 77and 12% of the ammonia emission from surface applied slurry (Fig. 3). A similar reduction ofthe ammonia emission by means of injection has been found in other investigations. Compa-red to surface application by trailed hose, Rubæk et al. (1996) found that the ammonia emis-sion was lowered by 47 to 72% when slurry was injected into 5 cm slots, Huijsmans et al.(1997) found that slurry injection into 5 cm deep slots reduced the ammonia emission by54%, and Misselbrooke et al. (1996) found that slurry injection into 6 cm deep slots reducedthe ammonia emission between 40 and 79%.

104
The ammonia reduction potential of slurry injection primarily depended on the volume of theslots created by the injection units (Fig. 3). The higher the volume of slots, the lower the rela-tive ammonia emission. This is due to the fact that the ammonia emission is positively relatedto the slurry surface area after application and that the surface area between the slurry and theatmosphere will be the lowest possible when all the slurry is placed beneath the soil surface.
Despite the similarity of soil conditions, a high variation of the efficiency of injection was se-en between the different shallow injectors (Table 3). The variation was caused by the diffe-rences in the slot shapes and especially the differences in the depth of injection. The depth ofinjection depends on the design of the injection unit and on the adjustment of the injector. Toexemplify this, the slurry injector JOS_d was used in the investigation both years. Despite thefact that the soil conditions in 2000 determined the efficiency of injection to be at least asgood as in 1999, the depth of injection was much lower in 2000. This shows that the ad-justment of shallow injectors will have a major influence on the efficiency of injection andthereby on the potential for reduction of the ammonia emission.
The draught force and thereby the need for fossil resources will be higher when slurry is in-jected than when it is surface applied. Huijsmans et al. (1998) demonstrated that the draughtforce needed for slurry injection depends on the design of the injection unit, the soil conditi-ons and the depth of injection. According to their investigation, an increase in the depth ofinjection from 3 to 5 cm in moist sandy loam increased the draught force needed for injectionby between 32 and 54% to between 370 and 711 N per injection unit, depending on the designof the injection units.
Slurry application to grassland by means of shallow injection may in some situations causeyield reductions due to crop damage (Misselbrooke et al., 1996). The crop damages were notinvestigated in the present investigation, but the visual impression was that the injectiontechnique giving the most efficient injection also caused most damage to the crop. On theother hand, the contamination of the crop would be lower if all the applied slurry could befully injected into the soil. The optimal goal for shallow slurry injection would therefore be aninjection technique creating a slot that could hold the applied slurry, i.e. a mean injectiondepth of approximately 5 cm when between 30 and 40 tons of slurry has to be applied.
References
Andersen, M.A.; Sommer, S.G.; Hutchings, N.J.; Kristensen, V.F.; Poulsen, H.D., 1999.Emission af ammoniak fra landbruget – status og kilder. Ammoniakfordampning, re-degørelse nr. 1. (Emission of ammonia from agriculture – status and sources. Ammoniaemission, review No. 1) (In Danish).
105
Bak, J.; Thybirk, K; Gundersen, P.; Jensen, J.P.; Conley, D.; Hertel, O., 1999. Natur og mil-jøeffekter af ammoniak. Ammoniakfordampning, redegørelse nr. 3. (Environmental effectsof ammonia. Ammonia emission, Report No. 3) (In Danish).
Huijsmans, J.F.M.; Hol, J.M.G.; Bussink, B.W., 1997. Reduction of ammonia emission bynew slurry application techniques on grassland. In gaseous nitrogen emissions from grass-lands (Jarvis SC; Pain BF, eds) 281-285.
Huismans, J.F.M.; Hendriks, J.GF.L.; Vereulen, G.D., 1998. Draught requirement of trailing-foot and shallow injection equipment for applying slurry to grassland. Journal of Agricul-tural Engineering Research. 71: 347-356.
Leuning, R.; Freney, J.R.; Denmead, O.T.; Sipson, J.R., 1985. A sampler for measuring at-mospheric ammonia flux. 19: (7) 1117-1124.
Long, F.N.J.; Gracey, H.I., 1990. Herbage production and nitrogen recovery from slurry in-jection and fertilizer nitrogen application. Grass and Forage Science. 45: 77-82.
Misselbrooke. T.H.; Laws. J.A.; Pain. B.F.. 1996. Surface application and shallow injection ofcattle slurry on grassland: nitrogen losses, herbage yields and nitrogen recoveries. Grassand Forage Science. 51: 270-277.
Nathan, M.V.; Malzer, G.L., 1994. Dynamics of Ammonia Volatilisation from Turkey Manu-re and Urea Applied to soil. Soil Science Society of American Journal. 58: 985-990.
Prins, W.H.; Snider, P.J.M.; Meer, H.G.; Unwin, R.J.; Dijk, T.A. Enik, G.C., 1987. Negativeeffects of animal manure on grassland due to surface spreading and injection. Proc. of ani-mal manure on grassland and fodder crops. Fertilizer or waste? 119-135.
Rubæk, G.H.; Henriksen, K.; Petersen, J.; Rasmussen, B.; Sommer, S.G., 1996. Effects of ap-plication technique and anaerobic digestion on gaseous nitrogen loss from animal slurryapplied to ryegrass. Journal of Agricultural Science. 126: 481-492.
Sherlock, R.R.; Freney, J.R.; Smith, N.P.; Cameron, K.C.. 1989. Evaluation of a sampler forassessing ammonia losses from fertilized fields. Fertiliser research. 21: 61-66.
Sommer, G.S.; Fries, E.; Bach, A.; Schjorring, J.K., 1997. Ammonia volatilisation from pigslurry applied with trailed hoses or bread spread to winter wheat: Effects of crop develop-mental stage, microclimate, and leaf ammonia absorption. Journal of Environmental Qua-lity. 26: 1153-1160.
Thompson, R.B.; Ryden, J.C.; Lockyer, D.R., 1987. Fate of nitrogen in cattle slurry followingsurface application or injection to grassland. Journal of Soil Science. 38: 689-700.
Wilson, J.D.; Thurtell, G.W.; Kidd, G.E.; Beauchamp, E.G., 1982. Estimation of the rate ofgaseous mass transfer from a surface source plot to the atmosphere. Atmospheric En-vironment 16: (8) 1861-1867.

106
DEVELOPMENT OF A SIMPLE PREDICTIVE MODELFOR AMMONIA VOLATILISATION FOLLOWING
LAND APPLICATION OF MANURES
T.H. Misselbrook1*, F.A. Nicholson2, R.A. Johnson1 & G. Goodlass3
1Institute of Grassland and Environmental Research,North Wyke, Okehampton, Devon EX20 2SB, UK
2ADAS Gleadthorpe, Meden Vale, Mansfield, Nottinghamshire NG20 9PF, UK3ADAS High Mowthorpe, Duggleby, Malton, North Yorkshire YO17 8BP, UK
Abstract
Reliable prediction of ammonia (NH3) loss following application of animal manures to landwould enable farmers to take better account of manure N in fertiliser management plans. Byusing a system of small wind tunnels, a series of experiments were conducted over three yearsand aimed at developing relationships between NH3 volatilisation and a range of manure,meteorological, soil and crop factors following application of cattle and pig slurry, cattle andpig FYM and poultry manure to both grassland and arable land. This paper details three ap-proaches being considered in the development of a predictive model with some preliminaryresults from each approach. The first approach uses multiple regression analysis betweencumulative ammonia loss and the influencing variables. The second approach was to fit Mi-chaelis-Menten type curves to the cumulative loss curve for each individual data-set and then,using regression analysis, to derive relationships between the parameters of the fitted curvesand the influencing variables. A boundary line approach was also assessed. Further work isrequired to fully develop these models which also require validation against independent data.
Introduction
There can be great variability in yield response to applied manure N. One of the major reasonsfor this is the variation in ammonia (NH3) loss immediately following application, the rateand extent of which can be dependant on many environmental and management variables(Pain and Misselbrook, 1997). Better prediction of NH3 loss would enable farmers to takebetter account of manure N in fertiliser management plans, potentially saving money and re-ducing N surpluses in the soil as well as reducing environmental impact.
Predictive models may be mechanistic (process-based) or empirical. Mechanistic models at-tempt to describe mathematically the processes leading to NH3 loss (e.g. Genermont et al.,1997; van der Molen et al., 1990). However, these models have not been widely validated andin practice may be difficult to use, requiring many parameters or calibration for individual ca-ses. Empirical models mathematically fit observed responses to measured variables, often

107
using linear regression procedures, and not necessarily taking account of the underlying phy-sical, chemical or biological processes. Several empirical models have been developed for theprediction of NH3 loss following manure application (Braschkat et al., 1997; Smith andChambers, 1995). However, such models do not always provide good predictions for data setsother than those from which they were derived. The aim of this work was to quantify the ef-fects of selected environmental and management variables on NH3 emissions from the maintypes of manure produced by housed livestock and to develop a simple predictive model forestimating NH3 loss following application of manures to both grassland and arable land.
Materials and methods
Ammonia emission measurementsA series of experiments was conducted using a system of small wind tunnels (Lockyer, 1984)to investigate the influence of a wide range of variables on NH3 loss. Measurements were ma-de following applications of cattle and pig slurry and cattle farm yard manure (FYM) to gras-sland and pig slurry, pig FYM and poultry manure to arable land (both to stubble and growingcereal crops). Manures were applied to small plots (2 × 2 m) by using either calibrated wate-ring cans (for slurries) or by hand after weighing out specific amounts (for solid manures).After application, wind tunnel canopies were positioned over the plot and air drawn through ata controlled rate. The concentration of NH3-N in both the air entering and leaving each tunnelwas determined by drawing a sub-sample of air through absorption flasks containing orthop-hosphoric acid. The emission per sampling period was calculated as the product of the volumeof air passing through the tunnel and the difference in outlet and inlet air concentration.
Experiments were conducted on both clay and sand/sandy loam soils. A broad range of expe-riments was conducted for applications of cattle slurry to grassland and pig slurry to arableland, with a more limited number of experiments investigating losses from solid manures(Table 1). Temperature differences were achieved by conducting experiments at different ti-mes of year, using the same manure stored under controlled conditions. In experiments inve-stigating the effect of wind speed, a range of wind speeds of between 0.5 and 4 m s-1 throughthe wind tunnel canopies was set. For all other experiments wind speed was maintained at ap-proximately 1 m.s-1. Rainfall was simulated using calibrated watering cans.
Statistical analysesThree approaches were taken to derive predictive models from the observations.
In the first approach, linear regression modelling was used to predict the cumulative loss ofthe manure total ammoniacal N (TAN) content with time from the controlling variables, usingthe MINITAB statistical package. As the relationship between cumulative loss and time takesthe form of an exponential curve, time was included in the model as loge(time). Predictive re-

108
lationships were developed using two thirds of the available data and then tested against theremaining third.
In the second approach, a Michaelis-Menten type curve was fitted to cumulative NH3 losswith time, as used by Sommer and Ersboll (1994):
( )mKt
tNtN+
= max (1)
where N(t) (kg N ha-1) is the cumulative loss at time t (h) and Nmax (kg N ha-1) and Km (h) aremodel parameters representing total loss as time approaches infinity and time at which lossreaches one half of maximum, respectively. As there will be a serial correlation between suc-cessive measurements, it is better to model loss rates against time (H. Sogaard, unpubl.):
Table 1. Variables investigated for each manure typeManure type Land
useVariables investigated
Cattle slurry grass Temperature, wind speed, rainfall, soil type, soil pH, soil moisturecontent, grass height, slurry dry matter content, slurry pH, appli-cation rate
Cattle FYM grass Temperature, rainfall, soil typePig slurry grass Temperature, soil type, slurry dry matter contentPig slurry arable Temperature, wind speed, rainfall, soil type, soil pH, soil moisture
content, crop cover, slurry dry matter content, slurry pH, applicati-on rate
Pig FYM arable Temperature, rainfall, soil typePoultry manure arable Temperature, rainfall, soil type
( ) ( )( )mm
mrate
KttKtK
NttN+∆++
=∆ max, (2)
where Nrate is the mean emission rate (kg N ha-1 h-1) between times t and t+ t. For each indi-vidual manure application, the parameters Nmax and Km were derived with the model fittingprocedure in GENSTAT. Multiple linear regression was then used to relate Nmax and Km tomeasured variables, enabling cumulative loss to be predicted from Eq. 1.
The third approach used was a boundary line procedure, as described by Elliot and de Jong(1993) for the prediction of denitrification rates. A scattergram was plotted of the ratio of themeasured to the maximum rate of NH3 emission against each variable. For a sufficiently largedata set, it can be assumed that the points which lie on the outer limits of each scattergram re-present the effect of that variable on NH3 emission rate. The boundary line is a trend fitted

109
(empirically) to these points and describes the fractional reduction (F) in the dependent varia-ble below the maximum caused by the specified variable. F-values derived for each of the va-riables were multiplied together to assess the total reduction below the maximum emissionrate:
...max ××××= cbaraterate FFFNN (3)
where a, b and c are specific variables. By including time after application as one of the speci-fic variables in Eq. 3, an emission rate curve following application can be derived, also enab-ling cumulative emission to be calculated.
Some validation data were available from micrometeorological measurements of NH3 emissi-on after application of cattle slurry to grassland. Predicted emission rates from the model de-veloped under the second approach (Michaelis-Menten curve fitting) were compared with themeasured emission rates using mean square prediction error (MSPE) analysis (see Dhanoa etal., 1999), which yields information on both the precision and reproducibility of the model.
Results
Specific variablesThere were good relationships between NH3 loss (as% TAN applied) and wind speed for allsites, with loss increasing at 9 and 12% TAN applied per 1 m s-1 increase in wind speed forthe two arable sites (for pig slurry) and 15% TAN applied per 1 m s-1 increase in wind speedfor the two grassland sites (for cattle slurry). There was some evidence of increased losses athigher ambient temperatures from one of the arable and one of the grassland sites. However,for the grassland sites, parallel regression analysis showed there to be no significant effect oftemperature and a consistent effect of wind speed at all temperatures for both sites (shown bythe two fitted lines in Figure 1 having the same slopes). Losses from site 2 were consistentlygreater than those from site 1, which was probably due more to differences in dry matter con-tent of the slurries (greater for site 2) than differences in site characteristics. As temperaturedifferences were effected by conducting the experiments at different times of year, there mayhave been interactions between temperature, humidity, solar radiation and soil moisture con-tent, thus obscuring any direct relationship between emission and temperature. Total NH3 los-ses from pig and cattle slurry were similar when applied to grassland on heavy soil. However,on a more freely draining soil, losses from pig slurry were lower, probably because of betterinfiltration of the less viscous pig slurry.
There was a good relationship between slurry dry matter content and NH3 loss for cattle slurryapplications to grassland, with NH3 losses increasing from 22 to 62% as slurry dry matter wasincreased from 2 to 10%. However, no such relationship was found for applications of pigslurry to arable land.

110
Increasing application rate resulted in a decrease in NH3 loss when expressed as a percentageof TAN applied, for both cattle slurry applications to grassland and pig slurry applications toarable land. Reducing slurry pH by the addition of inorganic acid reduced NH3 loss. Relati-onships with other variables were less clear. Simulated rainfall after manure application ten-ded to decrease emissions from pig and cattle slurry but there were some indications thatemissions increased from solid manures. There was no clear effect of sward height on lossesfrom cattle slurry applied to grassland, but for pig slurry applied to arable land losses weregreater from applications to stubble than those to fallow land or growing cereals. Soil moistu-re content appeared to have little effect on loss.
Figure 1. Relationship between wind speed and ammonia loss (as% TAN applied)following cattle slurry applications to grassland. Site 1 (fitted = dashed line):30oC ( ), 21oC ( ), 8oC ( ), 7oC ( ); site 2 (fitted = solid line): 18oC (*), 9oC(+), 8oC (-), 6oC ( ).
ModelsData were divided into groups for model development, representing cattle slurry to grassland,pig slurry to grassland, cattle FYM to grassland, pig slurry to arable, pig FYM to arable andpoultry manure to arable, to reflect the possibility that there would be differences in NH3
emission rate which may not be fully accounted for by relating to the variables in Table 1. Forexample, infiltration of manure TAN into soil will be very different between slurries and solidmanures, between grassland and arable land and possibly between pig and cattle slurry andnone of the measured variables would fully account for these differences.
Relationships developed between cumulative emission and measured variables, using multiplelinear regression, were generally poor for the above groups. Plots of predicted against actualemission for the validation data showed non-linearities, indicating that there were furtherfactors influencing loss which had not been included in the models. One exception was for pigFYM applications to arable land (Fig. 2) where the fitted model, which included manure TAN
0
20
40
60
80
100
120
140
0 1 2 3 4 5wind speed (m s-1)
Am
mon
ia lo
ss

111
content, dry matter content, manure pH, cumulative time, wind speed, soil moisture content,soil pH and temperature, accounted for 82% of the variance.
The variables which were significant predictors of Nmax and Km, after fitting Michaelis-Menten curves to the cumulative NH3 emission, are given in Table 2 for each group. Gene-rally, better relationships were derived for Nmax than for Km. Manure dry matter content, TANcontent and wind speed were important predictive variables for Nmax for most groups. Slurrydry matter content was also important in predicting Km, together with ambient temperature forslurries and TAN content for solid manures. For cattle slurry applied to grassland the derivedrelationships were:
( ) ( ) ( ) ( )DMWSTANWFPSN e 90.338.5log2.3944.097.11max ++++−= (4)
( ) ( ) ( )WFPSTDMK m 04.008.030.093.2 −−+= (5)
where WFPS is water filled pore space, WS is wind speed (m s-1), DM the manure dry mattercontent (%) and T ambient temperature (oC). Equations 4 and 5, together with Eq. 2, wereused to predict NH3 emission rates for an independent data set derived from micrometeorolo-gical measurements of NH3 emission following application of cattle slurry to grassland.MSPE analysis showed that while there was good correlation between observed and predictedemission rates (r2 = 0.70), the fitted line differed from the line of equality (Fig. 3). The modeloverestimated emission rates and the overestimation increased with increasing observed emis-sion rate.
Figure 2. Predicted vs. measured cumulative ammonia loss (kg N ha-1) for applicationsof pig FYM to arable land.
-10
0
10
20
30
40
50
60
0 20 40 60 80
Measured loss
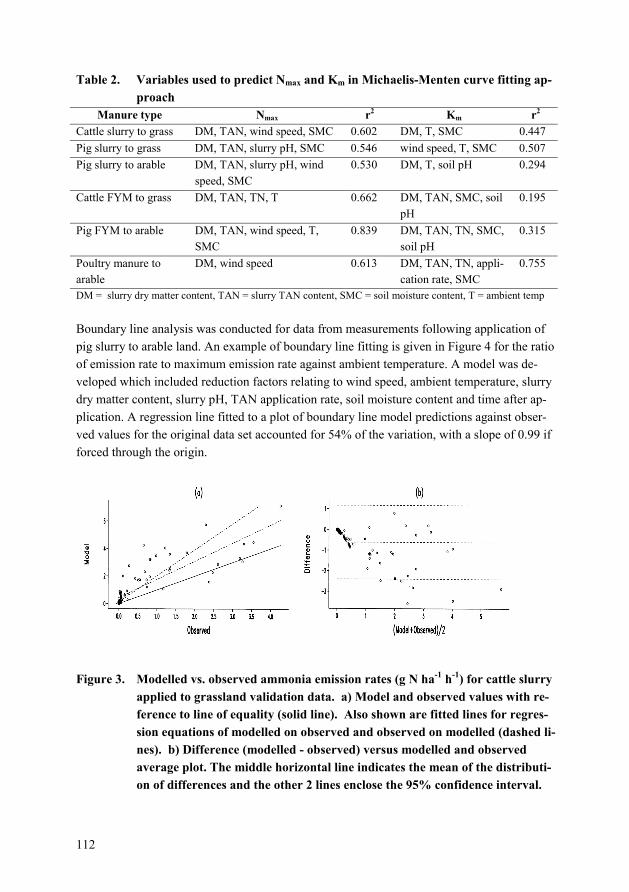
112
Table 2. Variables used to predict Nmax and Km in Michaelis-Menten curve fitting ap-proach
Manure type Nmax r2 Km r2
Cattle slurry to grass DM, TAN, wind speed, SMC 0.602 DM, T, SMC 0.447Pig slurry to grass DM, TAN, slurry pH, SMC 0.546 wind speed, T, SMC 0.507Pig slurry to arable DM, TAN, slurry pH, wind
speed, SMC0.530 DM, T, soil pH 0.294
Cattle FYM to grass DM, TAN, TN, T 0.662 DM, TAN, SMC, soilpH
0.195
Pig FYM to arable DM, TAN, wind speed, T,SMC
0.839 DM, TAN, TN, SMC,soil pH
0.315
Poultry manure toarable
DM, wind speed 0.613 DM, TAN, TN, appli-cation rate, SMC
0.755
DM = slurry dry matter content, TAN = slurry TAN content, SMC = soil moisture content, T = ambient temp
Boundary line analysis was conducted for data from measurements following application ofpig slurry to arable land. An example of boundary line fitting is given in Figure 4 for the ratioof emission rate to maximum emission rate against ambient temperature. A model was de-veloped which included reduction factors relating to wind speed, ambient temperature, slurrydry matter content, slurry pH, TAN application rate, soil moisture content and time after ap-plication. A regression line fitted to a plot of boundary line model predictions against obser-ved values for the original data set accounted for 54% of the variation, with a slope of 0.99 ifforced through the origin.
Figure 3. Modelled vs. observed ammonia emission rates (g N ha-1 h-1) for cattle slurryapplied to grassland validation data. a) Model and observed values with re-ference to line of equality (solid line). Also shown are fitted lines for regres-sion equations of modelled on observed and observed on modelled (dashed li-nes). b) Difference (modelled - observed) versus modelled and observedaverage plot. The middle horizontal line indicates the mean of the distributi-on of differences and the other 2 lines enclose the 95% confidence interval.

113
Figure 4. Fitted boundary-line for the plot of the ratio of NH3 emission rate to maxi-mum emission rate vs. air temperature; data are for applications of pig slur-ry to arable land.
DiscussionThere is little published data on predictive models for NH3 emissions from solid manures.Menzi et al. (1997) found, from the results of five experiments conducted under differentconditions, that loss could be predicted solely as a function of the TAN applied. For slurries,much more published data exists. Dry matter content is commonly reported to be the mostimportant controlling variable (Smith and Chambers, 1995; Sommer and Olesen, 1991), beingrelated to the infiltration rate of slurry into the soil. Increasing loss with increasing wind speedhas also been commonly observed (Sommer et al., 1991; Thompson et al., 1990), althoughSommer et al. (1991) reported that losses increased with wind speed up to a maximum of 2.5m s-1, beyond which there was no further increase. Sommer et al. (1991) also reported increa-sing losses with increasing temperature. However, Braschkat et al. (1997) found no such rela-tionship with temperature, but showed that solar radiation was an important variable.
The boundary-line approach requires a large data set covering a broad range of values for allthe variables. In our experiments, the range of values for all the variables may not be suffici-ently large for this approach to be successful. For the Michaelis-Menten approach, the failureto reliably predict Km requires further investigation; it may be that further variables should beincluded in the model. For slurries, infiltration into the soil is likely to be important and thiswill be influenced both by variables which were measured (e.g. slurry dry matter content, soilmoisture content) and some which were not measured (e.g. crop density, soil pore size distri-bution). Differences in the measurement techniques used for the model development data(wind tunnels) and the validation data (micrometeorological mass balance) may account forsome of the lack of fit in Figure 3. Loubet et al., (1999) calculated that the transfer rate (forCO2) was consistently higher inside a wind tunnel than outside. Another factor may have beenerrors in deriving wind speed at a height of 0.25 m for the validation data so that the modeldeveloped from the wind tunnel data could be used, where actual wind speed was measured at2 m. Standard profiles of wind speed against height were used to derive the values at 0.25 m.
boundary line: y = -0.002x2 + 0.089x + 0.081
0.0
0.2
0.4
0.6
0.8
1.0
0 10 20 30 40
Air temperature (oC)
114
Preliminary results presented in this paper have shown that the three modelling approacheshave potential in deriving a predictive model for NH3 losses after manure application to land.Linear regression modelling, either of cumulative loss or of the parameters to fit Michaelis-Menten curves, may be more successful with the present data set, as there may be insufficientdata for the boundary-line approach. Important predictive variables include wind speed, ma-nure dry matter content, TAN content and ambient temperature. Further model developmentis still required together with more validation.
Acknowledgements
The work was funded by the Ministry of Agriculture, Fisheries and Food, London. IGER issponsored by the Biological and Biotechnological Sciences Research Council, Swindon.
References
Braschkat, J., Mannheim, T. & Marschner, H., 1997. Estimation of ammonia losses after ap-plication of liquid cattle manure on grassland. Zeitschrift Fur Pflanzenernahrung Und Bo-denkunde 160: 117-123.
Dhanoa, M.S., Lister, S.J., France, J. & Barnes, R.J., 1999. Use of mean square prediction er-ror analysis and reproducibility measures to study near infrared calibration equation per-formance. Journal of Near Infrared Spectroscopy 7: 133-143.
Elliot, J.A. & de Jong, E., 1993. Prediction of field denitrification rates: a boundary-line ap-proach. Soil Science Society of America Journal 57: 82-87.
Genermont, S. & Cellier, P., 1997. A mechanistic model for estimating ammonia volatilizati-on from slurry applied to bare soil. Agricultural and Forest Meteorology 88: 145-167.
Lockyer, D. R., 1984. A system for the measurement in the field of losses of ammoniathrough volatilization. Journal of the Science of Food and Agriculture 35: 837-848.
Loubet, B., Cellier, P., Genermont, S. & Flura, D., 1999. An evaluation of the wind-tunneltechnique for estimating ammonia volatilization from land: Part 2. Influence of the tunnelon transfer processes. Journal of Agricultural Engineering Research 72: 83-92.
Menzi, H., Katz, P.E., Frick, R., Fahrni, M & Keller, M., 1997. Ammonia emissionsfollowing the application of solid manure to grassland. IN: Gaseous Nitrogen Emissionsfrom Grassland (eds. Jarvis, S.C. & Pain, B.F.), CAB International, Wallingford: 265-274.
Pain, B.F. & Misselbrook, T.H., 1997. Sources of variation in ammonia emission factors formanure applications to grassland. In: Gaseous Nitrogen Emissions from Grasslands (eds.S.C. Jarvis & B.F. Pain), CAB International, Wallingford: 293-301.
Smith, K.A. & Chambers, B.J., 1995. Muck from waste to resource - utilization: the impactsand implications. Agricultural Engineering: 33-88.
Sommer, S.G. & Ersboll, A.K., 1994. Soil tillage effects on ammonia volatilization from sur-face-applied or injected animal slurry. Journal of Environmental Quality 23: 493-498.

115
Sommer, S.G. & Olesen, J. E. (1991). Effects of dry-matter content and temperature on am-monia loss from surface-applied cattle slurry. Journal of Environmental Quality 20:679-683.
Sommer, S.G., Olesen, J.E. & Christensen, B.T., 1991. Effects of temperature, wind-speedand air humidity on ammonia volatilization from surface applied cattle slurry. Journal ofAgricultural Science 117: 91-100.
Thompson, R.B., Pain, B.F. & Rees, Y.J., 1990. Ammonia volatilization from cattle slurryfollowing surface application to grassland. 2. Influence of application rate, wind- speedand applying slurry in narrow bands. Plant and Soil 125: 119-128.
van der Molen, J., Beljaars, A.C.M., Chardon, W.J., Jury, W.A. & van Faassen, H.G., 1990.Ammonia volatilization from arable land after application of cattle slurry. 2. Derivation ofa transfer model. Netherlands Journal of Agricultural Science 38: 239-254.

116
DEVELOPMENT OF A MEASURING DEVICE FOR THETRANSVERSE DISTRIBUTION OF SLURRY
BY USE OF AN INJECTOR
Jan Langenakens1*, Kristof Wilsens1, Willy Cappelle1, Pieter Danau1,Luc De Leeuw2 and Dirk Van Gyseghem2 , Domien Dessein2
1 Ministry of Small Enterprises, Traders and Agriculture, Department of Mechanisation,Labour, Buildings, Animal Welfare and Environmental Protection, Burg.
Van Gansberghelaan 115, B-9820 Merelbeke, Belgium.Tel.: +32 9 272 28 00. Fax: +32 9 272 28 01. E-mail: [email protected]
2 Flemish Community, Division Manure Bank, Guldenvlieslaan 72, B-1060 Brussels, Belgium.
Abstract
The ammonia emission reduction plan of the Flemish Government prescribes that all slurrydistributed on arable land should be incorporated within four hours after spreading. Recentinjection techniques have shown irregularities in the transverse distribution of slurry. No ac-curate equipment was available in the past to measure the transverse distribution of slurry in-jectors without influencing the distribution. Therefore, a new device that is capable of measu-ring the transverse distribution of slurry by injectors for grassland and arable land has beendeveloped. The envisaged device must be able to deal with a number of restrictions. The in-jectors and tanks have to be horizontal, in order not to affect the distribution. The injectorsshould be placed at working depth, and the hoses should be kept above the distribution levelat manual working position, so that the normal flow can be set. For grassland injectors the in-jector elements have to be activated in order to open the shutters, as it is seen in practice du-ring injection. To avoid the influence of the differences in length of the various hoses, thelatter will be completely filled. In this way, the influence of the initial filling process of thehoses can be avoided. The slurry is subsequently gathered in containers that can easily beemptied, and the degree of filling is determined. A first series of measurements on 11 diffe-rent injectors for grassland showed that the device worked. CV's between 5 and 33% wereobtained. The device allows studies of the different parameters affecting the distribution.
Key words: slurry injection, transverse distribution, new measuring device.
Introduction
The ammonia emission reduction plan of the Flemish Government prescribes that all slurrydistributed on arable land has to be injected or ploughed in within four hours after spreading.On grassland, liquid manure has to be injected or 'rained-in' within four hours after applicati-

117
on taking advantage of a rainy period or using irrigation. Recent injection techniques haveshown irregularities in the transverse distribution of slurry. No accurate equipment was avai-lable in the past to measure the transverse distribution of slurry injectors without influencingthe distribution. Therefore, a new device capable of measuring the transverse distribution ofslurry by injectors for grassland or arable land has been developed.
Because of this new regulation, farmers are forced to upgrade their equipment with injectorsfor arable fields and grassland. Experienced and less experienced companies have designednumerous constructions in the last years. The farmers want to be sure that they can acquiregood working machines. The type of work does not allow them to evaluate the work visually.On arable land, the slurry is mixed with soil, while on grassland it is distributed in grooves ofa certain depth. The odour of slurry does not encourage people to see what is the purpose ofsuch injectors.
In general, the knowledge about the different settings of slurry injectors is very poor. The ad-justments for other doses and for other types of slurry with different viscosity, dry mattercontents, etc. are usually based on the experience of the operators, but sometimes also onguesswork. The Flemish Land Society and more in particular the Manure Bank Division, in-tend to help farmers in selecting qualitative good slurry injectors. They want to circulate thetechnical properties of the injectors on the Flemish market to the farmers. Their aim is notonly to reduce ammonia emission through injection, but also to improve slurry spreading tolimit leaching of minerals into the groundwater.
Objectives for future equipment
The Flemish Land Society, Division Manure Bank, has funded the Department of Mechanisa-tion, Labour, Buildings, Animal Welfare and Environmental Protection to design and developa tool to measure the transverse distribution of slurry in an objective way.
The envisaged device must be able to deal with a number of restrictions. The injectors andtanks have to be horizontal in order not to affect the distribution. The injectors should be pla-ced at working depth and the hoses between the injector, and the distributor should be in wor-king position, so that the normal flow can be set and reached. For grassland injectors the in-jector elements have to be activated in order to open the shutters, as it is seen in practiceduring injection. To avoid the influence of differences in the lengths of the various hoses, thelatter should be completely filled before the measurement is started, so as to avoid the influ-ence of the initial filling process.
For environmental reasons, the slurry should be recuperated from the measurements. The de-vice should be capable of measuring the distribution of grassland injectors as well as that ofarable land injectors. If possible, the entire measuring equipment should be easily transporta-

118
ble, so that the different machines throughout the entire Flemish region can be characterised.The measurement should be as precise as possible and fulfil the requirements of prEN 13406.
Design and development of the equipment
Objective measurement without influencing the slurry flowThe slurry is injected into the soil. If the injectors are elevated from the ground, the flow ofslurry will be influenced in various ways. Firstly, several types of injectors are equipped withshutters to prevent slurry to drip on the headland (a kind of anti-drip device as with sprayers).The shutters allow a clean job under all conditions, thereby reducing odour and ammonia vo-latilisation. In some cases, the shutters are based on a spring system that squeezes the rubberhoses connecting the distributor and the injection elements. In practice, it was observed thatnot all available systems function satisfactorily, and that some clamps regularly failed to openwhen required, which, of course, will have serious consequences as to the transverse distribu-tion of slurry. Secondly, when the injectors are lifted, the hoses connected to the distributorwill no longer be in their original position. In many cases the distributors will be lifted andtilted, so that the original slurry flow will no longer be guaranteed and the measured flow willnot reflect the actual working conditions. Therefore, the slurry has to be collected beneath theinjector elements. This can be done by elevating the complete machine or by placing the e-quipment in a hole behind the machine. Grassland injectors require a hard shoulder of the pitor an elevation for their shutters to open. In the current situation, the entire machine was pla-ced on a ramp. On the sides of the ramp a construction was made, which provided a counterpressure that caused the grassland injection elements to open. To provide a normal workingdepth, the injector can be placed on blocks with a height equalling the working depth.
Capturing the slurryThe amount of slurry injected through one pipe is estimated at maximum 330 l/min (a dose of50 tonnes/ha, a spacing of 33 cm between injection elements and a driving speed of 12 km/h).This flow should be captured without wastage. In a first attempt, a system comparable to aspray table was considered. The slurry was guided through gutters into a container. The ideawas to tilt the gutters, thereby allowing the manure to flow into containers and when tilted inthe other direction to flow into a direct recuperation container. Several shapes of gutters wereconstructed and tested at different angles to the ground. When reaching the higher flow rates,the slurry did not stay in the gutters but overflowed the brim of the gutters. Therefore, it be-came necessary to guide the slurry through tubes to avoid spillage. To capture the slurry andguide it into the tubes, funnels were mounted above the tubes. The opening of the funnels hadto be wide enough to allow an immediate evacuation of a massive flow of slurry. This con-struction was made in stainless steel to increase its lifetime and to ease the maintenance of it(Fig 1).

119
Figure 1. Outlets of the different pipes draining into the recuperation container. Themeasuring containers are shown at the right.
Defining the amount of slurryThe amount of slurry flowing out of the tubes has to be measured. When an injector is putinto action, a certain time interval will be needed before the flow reaches equilibrium in allpipes. Usually, it will take more time to fill the outer and longer hoses with slurry. To avoidany adverse effects of this, the first slurry is guided to the direct recuperation container. Oncethe slurry reaches equilibrium, it will be directed to the measuring containers for a certain ti-me and with a known flow. Therefore, a construction consisting of two concentric, sliding tu-bes was installed. The end of the second tube was terminated by a bend to re-establish a verti-cal flow of the slurry stream. By pulling the second part of the tube, the slurry was collectedin the measuring container. When enough slurry was collected, the tube was pushed back intothe recuperation position (Fig 2).
The measuring containers were designed in such a way that they could easily contain about70 litres of slurry. However, full containers are inconvenient to manipulate. Therefore, thecontainers were equipped with four wheels that ran on a track. The track leads across a weig-hing station that registers the weight of the filled slurry container. After the weighing, thecontainer is pushed forwards until it reaches an actuator that causes the container to tip itscontents into a recuperation container. This device (tipper) makes it easier to empty the con-tainers. Once all containers have been weighed and emptied, they are weighed again, and thenext measurement can be started after the containers are positioned in front of the tubing sy-stem.
By determining the weight and how long it takes to fill the containers, the flow can be calcu-lated and compared with the aimed setting. From the different weights and/or flow rates, thetransverse distribution can be derived on the basis of a calculation of the difference betweenthe containers and to the average or the coefficient of variation over the full working width.

120
Figure 2. Collecting funnels and pipes for slurry.
Adaptable for a different spacing between injection elementsOn the basis of on an inventory of the machines presently available on the Flemish market itwas found that the injection element spacing varied between 15 cm and 50 cm. Therefore, themeasuring containers had to have a maximum width of 14 cm to allow correct positioning ofthe containers in front of the tubes, corresponding to an injection element. The tubing systemhas to be moveable in the transverse direction. Therefore, all tubes were connected to themain frame with other small tubes that could be slid in the transverse direction. The supportsof the main frame were constructed in such a way that they only supported the frame andcould be slid in the transverse direction, as well (Fig 3).
Adaptable injection elements not in lineWith most arable land injectors, the slurry hoses are connected to the teeth of the harrow. Be-cause of the twisted configuration of these harrows, the slurry outlets are twisted, too. Thelongitudinal distance between the outputs can reach 50 cm. The tubes that slide into eachother were extended in such way that the funnels could be slid forwards or backwards to al-low the manure to drain in the midpoint.

121
Figure 3. General view of the test setup.
Results
Objective measurements without influencing the slurry flowAll measurements were executed the days before the demonstration of slurry injection ongrassland of 15 March 2000 at Merelbeke, Belgium. The participating manufacturers were gi-ven the opportunity of presenting their equipment for several measurements. The transversedistribution measurement was one of them. 11 machines were measured twice within a timeslot of about 12 hours.
The measurements were performed as an example, and all machines were measured twice,and usually at different settings. The influence of the different parameters could not be dedu-ced. A first series of measurements with 11 different grassland injectors showed that the de-vice worked satisfactorily. CV's between 3 and 34% were obtained (Table 1).
The average deviation between the different measuring containers was also defined, and it va-ried between 2.3 and 27%. Examples of two distributions are displayed below (Figs. 4 and 5).
For both series of measurements, many adjustments were made to several machines to impro-ve the distribution. A different setting of some parameters of the Jako equipment improvedthe transverse distributionsignificantly, the CV decreased from almost 34 to 9%, and the ave-rage deviation decreased from 27 to 7%. This example illustrates that these machines also re-quire an appropriate setting to perform correctly.

122
Figure 4. Transverse distribution of Ipsam-Ipsam-Slootsmid.
Figure 5. Transverse distribution of Jako-Jako-Jako.
Transverse distribution
0
0,2
0,4
0,6
0,8
1
1,2
1,4
1 3 5 7 9 11 13 15 17 19 21 23 25 27 29 31 33 35
Injector element nr.
Flow
rate
(kg/
s)
Test 1 test 2
Transverse distribution
0
0,5
1
1,5
2
2,5
1 2 3 4 5 6 7 8 9 10 11 12 13 14 15 16 17 18 19 20 21 22 23 24
Injector element nr.
Flow
rate
(kg/
s)
Test 1 test 2

123
Table 1. Transverse distribution resultsCompany-tank-injector Measurement 1 Measurement 2Deroo – Deroo – Deroo Flow rate (m³/min) 1.39 1.47
CV (%) 7.65 9.97Average deviation (%) 6.39 8.79
Eropak – Vredo – Vredo Flow rate (m³/min) 3.78 3.92CV (%) 15.01 9.32Average deviation (%) 13.29 7.92
Ipsam – Ipsam – Slootsmid Flow rate (m³/min) 2.44 1.89CV (%) 2.98 10.02Average deviation (%) 2.31 8.39
Jako – Jako – Jako Flow rate (m³/min) 1.65 1.85CV (%) 33.78 9.11Average deviation (%) 27.20 7.30
Joskin – Joskin – Joskin Flow rate (m³/min) 2.56 2.70CV (%) 14.23 6.17Average deviation (%) 11.17 4.48
Steeno – Vervaet – Steeno Flow rate (m³/min) 2.50 3.84CV (%) 18.80 18.36Average deviation (%) 14.04 14.87
Vervaet – Vervaet – Veenhuis Flow rate (m³/min) 2.67 3.09CV (%) 3.50 6.14Average deviation (%) 2.77 4.55
De Zwaef – De Zwaef – Schouten Flow rate (m³/min) 8.81 7.89CV (%) 17.06 11.49Average deviation (%) 13.96 9.18
Joskin – Joskin – Joskin Flow rate (m³/min) 2.83 3.45CV (%) 12.16 10.73Average deviation (%) 8.29 7.63
Schuitemaker – Schuitemaker – Schuitemaker Flow rate (m³/min) 2.34 2.45CV (%) 10.18 12.28Average deviation (%) 8.54 10.15
Dezeure – Dezeure – Bomech Flow rate (m³/min) 1.25 1.19CV (%) 5.93 15.79Average deviation (%) 4.13 8.25
Conclusions
The dedicated equipment constructed to measure the transverse distribution can be used to de-fine the characteristics of grassland injectors without influencing the slurry flow. The measu-rements can be considered as being objective. Measurements are still very laborious with thisprototype equipment. Further actions will be taken to automate the measuring device and tocharacterise an injector for a large range of flow rate conditions, slurry characteristics andother settings, with a minimum of personnel.
124
As a result of the measurements performed at of the slurry injection demonstration, severalmanufacturers have subsequently improved their system and are presenting their improved sy-stems voluntarily for new measurement sessions. The device allows the study of the differentparameters affecting the distribution. Future research will establish the influence of those pa-rameters.
Acknowledgments
The authors wish to thank the Ministry of Small Enterprises, Traders and Agriculture and theFlemish Land Society of the Ministry of the Flemish Community for their financial support.
References
Danau, P., 2000. Constructie van een meettoestel voor het bepalen van de dwarsverdeling vanmengmestinjectoren. Eindverhandeling voorgedragen tot het bekomen van de graad vanIndustrieel Ingenieur, KHK, Geel, 124 pp.
Langenakens, J., 2000, Evaluatie artikel van de demonstratiedag 'Mengmestinjectie opGrasland' van 15 Maart.

125
EXPERIENCES WITH REBIO WET SOWINGIN THE YEARS 1997-1999
Hans Christian Endrerud1*, Stein Sakshaug2, Bjørnar Simonsen2,1Agricultural University of Norway, Department of Agricultural Engineering,
P.O. Box 5065, N-1432 Ås, Norway2ReBio AS, Saghellinga, N-1432 Ås, Norway
Abstract
The injection of a mixture of manure and seeds into the soil has been tested in Norway in theyears of 1997-1999. The experiments have been conducted on various locations and for dif-ferent crops. The injection has been carried out by using the DGI injector mounted on a traileror by using a hose delivery system. This new method implies a one-pass establishment of anew crop and the placing of a liquid surrounding the seeds. The distance between rows was300 mm, and the slot depth varied from 0-100 mm.
The results show large variations in yield, compared to conventional establishment of crops.The reasons for this have not yet been revealed in full, but are attributed to a number of con-ditions like row distance, depth of seeds, metering of seeds in the liquid manure and chemicalinfluence to the seeds from the manure.
On the basis of these experiments a new generation of injectors and a more suitable methodfor metering of seeds into manure is being developed.
Key words: Manure injection, direct drilling, wet sowing.

126
SEPARATION OF SLURRY IN A DECANTING CENTRIFUGE AND ASCREW PRESS AS INFLUENCED BY SLURRY CHARACTERISTICS
H.B. MøllerDanish Institute of Agricultural Sciences, Department of Agricultural Engineering
Research Centre Bygholm, P.O. Box 536, DK-8700 Horsens, Denmark.Tel.: +45 7629 6043. E-mail: [email protected]. Fax: +45 7629 6100
Abstract
The separation efficiency in relation to dry matter and nutrients has been tested with a screwpress separator and a decanting centrifuge with several types of slurry, including pig, cattleand digested slurry. The separation efficiency varies in slurry from different animal speciesand is also affected by factors, such as anaerobic decomposition processes during storage,animal diet and pretreatment of the slurry in anaerobic digestion plants. For freshly collectedslurry the removal efficiencies obtained for DM, TP, TN and COD when a centrifuge wasused were between 32.27-68.55, 52.35-90.95, 7.32-49.12 and 37.23-48.82, respectively, thusindicating that the removal efficiencies for TP, DM and COD are highly varying for differentslurry types. Even within each individual type of slurry there will be a high variation in remo-val efficiencies, especially within the group of anaerobically digested slurry. The removal ef-ficiencies obtained for DM, TP and TN by using a screw press ranged between 13.12-29.94,7.12-15.46 and 6.62-7.58, thus indicating that the removal efficiencies will be much lowerthan for centrifuges.
Key words: Animal slurry, anaerobic digestion, mechanical separators, decanting centrifuges,separation efficiency
Introduction
In livestock production areas, a surplus of nutrients may be produced in relation to crop requi-rements, thereby increasing the risk of nutrient losses to the environment (Burton, 1997). Li-quid slurry is produced in large amounts and has a low concentration of nutrients, and thus thecosts involved with transport of nutrients from livestock farms with a nutrient surplus to ara-ble farms with a nutrient deficit are high. However, the cost of nutrient transport costs can bereduced by separating the slurry into a nutrient-rich solid fraction and a liquid fraction, so thatthe volume of slurry that has to be transported from one farm to another will be much smaller(Møller et al., 2000). Solid-liquid separation of slurry can be performed by use of differenttechnologies, like screw presses, decanting centrifuges, etc. Separation efficiency can be defi-ned as the capacity of a technique to separate slurry into a dry-matter and nutrient-rich fracti-on and a liquid fraction containing less dry matter and less nutrients. The total amount of nu-

127
trients in the solid fraction and the ratio between the solid and the liquid fractions should beconsidered when evaluating the separation efficiency (Svarovsky, 1985). The performancedata of mechanical separators vary widely, not only because of the different testing and re-porting procedures, but also because the characteristics of the slurry are sometimes largelydifferent (Westerman et al. 2000). The separation efficiencies of mechanical screen separatorsand centrifuges are greatly affected by the physical and chemical factors of the slurry (Zhang& Westerman, 1997). The understanding of the particle size distribution of the solids in slurryand different chemical factors is important to take into consideration when evaluating the per-formance of separators (Zhang & Westerman, 1997). The particle size distribution and thechemical constituents of manure vary in slurry from different animal species and are also af-fected by factors, such as anaerobic decomposition processes during storage in the slurrychannels (Zhu, 2000), animal diet (Clanton et al., 1991), and addition of straw and pretreat-ment of the slurry in an anaerobic digestion plant (Sommer & Husted, 1995). Anaerobic bac-teria first consume the dissolved solids, and at the same time they hydrolyze and convert thesuspended solids into dissolved solids to obtain a continuous food supply to their growth. Thisdecomposition process leads to an increase of totally dissolved solids and a decrease of totallysuspended solids (Zhu, 2000).
The separation efficiency in relation to dry matter and nutrients has been tested with a screwpress separator and a decanting centrifuge with several types of slurry, including pig, cattleand digested slurry.
Methods
The experiments were conducted at Research Centre Bygholm by use of pig, cattle andanaerobically digested slurry. The cattle and pig slurry was stored in 1.7 m high 10 m3
cylindrical concrete buffer tanks before separation. The fresh pig and cattle slurry wasseparated the same day as it was removed from the houses, and the remainder of the slurrywas stored for 1 and 4 months, respectively, before separation. The anaerobically digestedslurry was transported by lorry from a commercial digestion plant and stored in buffer tanksbefore separation took place. The buffer tanks were situated outside, and some dilution withrainwater took place during the storage of pig and cattle slurry. Two types of mechanicalseparation were used in the test, i.e. an Alfa Laval NX 309B-31 decanting centrifuge and ascrew press manufactured by SWEA, 5600 Kolding, Demark (Fig. 1).

128
Figure 1. Section through the centrifuge. A: slurry inlet; B: drum; C: screw; E:‘beach’; F: solids outlet; G: level regulating discs; r1: inside radius of drum;r2: liquid radius.
Figure 2. Section through the tilted plane screen and screw press.
The centrifugeSlurry was pumped into the centrifuge (Fig. 1) through the slurry inlet (A). The drum rotatedat a speed of 5600 r.p.m., exerting a pressure of 4100 g at the drum circumference; therotational speed of the screw (C) was 60-80 r.p.m. slower than the speed of the drum.Thereby, the solids, which had settled inside the drum, were forced into the conical section(D). The solids were removed from the liquid to a “beach” (E), where they were allowed todrain before being pushed out of the centrifuge (F). The cylindrical section of the drum was700 mm long, the conical part was 300 mm long, and the inside radius of the drum (r1) was234 mm. The slurry level inside the drum was controlled by three level-regulating discs (G),located at the end of the rotor, and through which the centrifuged liquid flowed out. Theliquid radius was kept at 77 mm. For one type of slurry the liquid radius was changed from 75to 82.5 mm to see how this would influence the separation efficiency.
The screw pressThe SWEA screw press (Fig. 1) was combined with a tilted plane screen (Møller et al., 2000)to improve the capacity of the screw press. The slurry was first pumped towards a tilted planescreen with a 1 mm screen size, after which the coarse material leaving the tilted plane screen
BC
D
A
F L
E
G
r r
OutletScreen
ScraperInlet
Dry matterrich fraction
Inlet
Adjustable overflow
Conveyer unit with brushes
Outlet
Dry matterrich fraction

129
was drained in the screw press. The screw press uses a central screw conveyor housed in acylindrical screen with a 1 mm screen size. The screen is used to retain the solids in the screenchamber, and the screw is used to convey the drained the solids.
Table 1. Characteristics for the pig, cattle and digested biogas slurry separated in thisstudy. Slurry No. 3: were kept in slurry pits for a long period andsedimentation occurred during removal. Slurry No. 5: It has not beenpossible to mix the slurry properly, because of very strong sedimentationduring storage
Slurry No. Slurry type Storage time Storage/digestiontemperature
1 Pig, fatteners Freshly collected2 weeks in channels
15-20°C
2 Pig, fatteners10% beet in the feed
Freshly collected3 weeks in channels
15-20°C
3 Pig, fatteners Freshly collected4 weeks in channels
18-20°C
4 Pig, fatteners Slurry No. 1 kept4 weeks in storage tank
15-20°C in channel10-17°C in tank
5 Pig, fatteners Slurry No. 1 kept16 weeks in storage tank
15-20°C in channel12-20°C in tank
6 Cattle, dairy Freshly collected2 weeks in channels
15-20°C
7 Cattle, dairy Slurry No. 6 kept4 weeks in storage tank
15-20°C in channel10-17°C in tank
8 Cattle, dairy Slurry No. 6 kept16 weeks in storage tank
15-20°C in channel12-20°C in tank
9 Anaerobically digestedfrom Studsgaardpig+25% other waste
Less than 1 day Termophilic 53°C
10 Anaerobically digestedfrom FangelPig + 25% other waste
Less than 1 day Mesophilic 35°C
11 Anaerobically digestedfrom GosmerPig slurry + 2% plant oil
Less than 1 day Mesophilic 38°C
12 Anaerobically digestedfrom FilskovCattle+25% other waste
Less than 1 day Termophilic 53°C

130
Results and discussion
Separation efficiency in relation to slurry characteristics and slurry ageAnimal slurry contains a mixture of faeces, urine, waste feed and water, and slurry characteri-stics are greatly affected by diet, species and growth stage of the animals, the slurry collectionmethods used and the amount of water added to the slurry collection systems (Zhang &Westerman, 1997). Besides this anaerobic decomposition processes during storage of themanure in slurry channels (Zhu, 2000) and pretreatment in anaerobic digestion plants greatlyaffect the slurry characteristics (Sommer & Husted, 1995). The chemical characteristics ofpig, cattle and anerobic digested slurrys used in the test are given in Table 2. The characteri-stics of both fresh and 1 and 4 months old pig and cattle slurry are given.
Table 2. Composition of freshly collected and stored pig, dairy cow and anaerobicallydigested slurry before separation
Age pH VFA Energy DM Ash COD NH4-N TN TP KSlurry
No. mg/l gkal/g DM (g l–1)
Pig slurry 1 Fresh 7.5 9208 4269 53.2 14.99 45.96 3.60 4.20 1.26 3.20
2 Fresh 7.2 4409 4090 17.1 5.7 ND 1.30 2.20 0.38 1.27
3 Fresh 8.3 3388 4011 25.5 10.24 ND 3.0 3.90 0.62 2.72
4 1 month 7.5 13525 ND 47.9 14.76 ND 3.50 4.40 1.14 3.12
5 4 months 8.1 10216 4100 21.2 8.58 ND 3.1 3.70 0.91 3.14
Cattle slurry 6 Fresh 7.4 5813 4100 63.7 17.56 37.28 1.70 2.50 0.69 3.54
7 1 month 7.4 6885 4211 54.8 14.00 ND 1.60 2.90 0.61 3.06
8 4 months 7.9 2762 4060 44.90 14.14 ND 1.50 2.59 0.48 4.26
Anaerobicallydigested
9 Fresh 8.3 1030 3409 56.20 24.22 45.93 2.80 4.20 0.89 2.54
10 Fresh 8.1 587 4009 65.30 28.30 ND 4.00 5.00 1.67 2.31
11 Fresh 8.5 981 3890 20.50 7.26 ND 3.50 4.10 0.43 2.73
12 Fresh 8.2 3382 4262 37.40 10.47 ND 2.40 3.30 0.78 2.19
The removal efficiencies obtained from using a decanting centrifuge and a screw press interms of DM (dry matter), TP (total phosphate), TN (total nitrogen) and COD are shown inTable 3 for pig, cattle and anaerobically digested slurry. For freshly collected slurry the remo-val efficiencies obtained for DM, TP, TN and COD when a centrifuge was used were between32.27-68.55, 52.35-90.95, 7.32-49.12 and 37.23-48.82, respectively, thus indicating that theremoval efficiencies for TP, DM and COD are highly varying for different slurry types. Evenwithin each individual type of slurry there will be a high variation in removal efficiencies,especially within the group of anaerobically digested slurry.
The removal efficiencies obtained for DM, TP and TN by using a screw press ranged between13.12-29.94, 7.12-15.46 and 6.62-7.58, thus indicating that here, the removal efficiencies willbe much lower than for centrifuges.

131
Pig slurryThe removal efficiencies for DM and TP in freshly pig slurry collected by way of centrifugingranged between 32.8-60.48 and 62.3-65.9, respectively (Table 3), thus indicating that the se-paration efficiency of DM will be highly varying, whereas the efficiency for TP will be quiteconstant.
The removal efficiencies for pig slurry when using a centrifuge in the case of separation im-mediately after collection from the slurry channels and after storage for 1 and 4 months werealso calculated. In the case of slurry No. 1, it can be seen that after storage for one month theremoval efficiencies were reduced by 20.2%, 3.0% and 36.6% for DM, TP and TN, respecti-vely. After four months of storage the separation efficiencies for DM and TP were reduced by89.1% and 84.6%, respectively. The dramatical drop in separation efficiency after fourmonths of storage is probably due to improper mixing and sedimentation of all the large par-ticles during storage, rather than to biological degradation of the particles.
Cattle slurryThe removal efficiencies for cattle slurry in the case of centrifugation immediately after col-lection from the slurry channels and after storage for one and four months were calculated.The removal efficiencies for cattle slurry in terms of DM, TP and TN were 65.2, 82.0 and49.1, respectively, which is higher than for what was seen for pig slurry. The removal effi-ciencies for DM, TP and TN were reduced by 9.5, 5.1 and 35.6%, respectively, after onemonth of storage. After four months of storage the removal efficiencies were reduced by 15.6,4.0 and 45.1%, respectively, thus, the separation of TN was mainly affected, while the remo-val efficiency for TP was only slightly affected by the slurry age.
Anaerobically digested slurryThe removal efficiencies obtained for DM, TP and TN when separating anaerobically dige-sted slurry by means of centrifuging were 32.3-68.6, 52.4-91.0 and 7.3-31.0, respectively. Theremoval efficiencies will be highly varying between slurry from different digestion plants.The anaerobically digested slurry from Gosmer (slurry No. 11) was sedimented and filteredbefore being taken from the digester to increase the SRT (solid retention time) in the digester,which reduced the amount of TSS in the slurry and thus reduced the potential for separation.The removal efficiencies obtained from centrifuging the slurry from the two codigestion,mainly dealing with pig slurry (slurry Nos. 9 and 10) proved higher in terms of both DM, TPand TN, compared to the efficiencies obtained from fresh pig slurry. This indicates that ananaerobic digestion might have a positive influence on the separation potential. In contrary itseems that the anaerobic digestion of cattle slurry (slurry No. 12) might reduce the separationpotential, compared to that seen for freshly collected cattle slurry.

132
Table 3. Removal efficiency (%) and energy consumptionRemoval efficiency (%)Slurry
No.Age Separation
equipmentLiquid flow
ratel/hour
Solid fraction:slurry ratio
(U/Q) (%)
DM TP TN COD
Pig slurry 1 Fresh Centrifuge 750 13.1 60.48 62.28 29.32 37.232 Fresh Centrifuge 1036 5.67 62.10 63.56 20.08 ND3 Fresh Centrifuge 709 4.69 32.77 65.89 13.12 ND4 1 month Centrifuge 1189 8.28 48.28 60.43 18.59 ND5 4 months Centrifuge ND 1.00 6.58 9.57 2.43 ND
Cattle slurry 6 Fresh Centrifuge 983 20.85 65.17 82.00 49.12 59.097 1 month Centrifuge 1189 15.56 59.00 77.80 31.66 ND8 4 months Centrifuge 1050 11.63 55.02 78.74 26.99 ND
Anaerobically 9 Fresh Centrifuge 869 13.72 68.55 90.95 24.21 48.82digested 10 Fresh Centrifuge ND 14.11 65.07 64.21 31.01 ND
11 Fresh Centrifuge 812 2.89 32.27 59.95 7.32 ND12 Fresh Centrifuge 1433 9.91 53.50 52.35 23.69 ND
Pig slurry 1 Fresh screw press 2594 4.21 27.25 7.12 6.62 ND5 4 months screw press ND 0 0 0 0 0
Cattle slurry 6 Fresh screw press 1868 5.23 29.94 15.46 7.58 ND8 4 months screw press 3456 2.36 13.12 7.97 4.00 ND
Anaerobically 9 Fresh screw press 1765 3.85 18.39 10.30 7.36 NDdigested 12 Fresh screw press 3145 2.88 22.98 8.68 6.01 ND
Acknowledgement
Thanks to Frank Bjerregaard Rasmussen, Alfa Laval A/S, Rødovre, Denmark for makingtheir decanting centrifuge available and for his assistance in the performance of the tests.
References
Burton, C.H., 1997. Manure Management – Treatment Strategies for Sustainable Agriculture.Silsoe Research Institute, Silsoe, UK.
Clanton, C.J., Nichols, D.A., Moser, R.L., Ames, D.R., 1991. Swine manure characterizationas affected by environmental temperature, dietary level intake and dietary fat addition.Transactions of the ASAE, 34(5): 2164-2170.
Møller, H.B., Lund, I., Sommer, S.G. (2000). Solid-liquid separation of livestock slurry: effi-ciency and cost. Bioresource technology, 74: 223-229.
Svarovsky, L., 1985. Solid–liquid separation processes and technology. In Handbook of Pow-der Technology, Volume 5, ed. J.C. Williams & T. Allen. Bradford, UK: 18-22.
Sommer, S.G. & Husted, S., 1995. The chemical buffer system in raw and digested animalslurry. Journal of Agricultural Science, Cambridge, 124: 45-53.

133
Zhang, R.H., Westerman, P. W. 1997. Solid–liquid separation of animal manure for odorcontrol and nutrient management. Applied Engineering in Agriculture, 13: 657-664.
Zhu, J., 2000. Early separation of pig manure may enhance separation efficiency. Engineeringnotes. University of Minnesota.
Westerman, P.W. & Bicudo, J.R., 2000. Tangential flow separation and chemical enhance-ment to recover swine manure solids, nutrients and metals. Bioresource technology, 73:1-11.

134
ENHANCING PLANT UTILIZATION OF LIVESTOCK MANURE:A CROPPING SYSTEM PERSPECTIVE
Enrico CeottoIstituto Sperimentale Agronomico – Sezione di Modena
Viale Caduti in Guerra 134, I-41100 Modena, Italy. E-mail: [email protected]
Abstract
This paper highlights some key features of cropping systems coupling quantitative approachesand experimental data collected on poliennial experiment fertilized with pig slurry in the areaof the lower Po Valley. In areas with intensive livestock activities the contamination of sur-face and ground water is a crucial environmental concern. The type and the sequence in whichcrops are cultivated play an important role in determining sustainability of land use. Throughthe choice of proper crop rotations an efficient use of natural resources may be achieved, nu-trient uptake can be optimized and losses of nutrients can be kept at a tolerable level. Theaims of maximizing nutrient uptake by the plants and diminishing nutrient leaching can bepursued by the adoption of the so-called “intensive cropping”. Increasing the time and theextent of green leaf covering during the growing season leads to full use of solar radiation, ef-ficient use of water resources and maximum nutrient uptake by the crops. Conversely, crop-ping systems that leave the soil uncovered for long periods between subsequent crops, maylead to high risk of nitrate leaching even when fertilization levels are moderate. Consequently,farmers should be encouraged to the adoption of cropping systems assuring a maximum leafcover during the growing season.
Key words: cropping systems, nutrient uptake, intensive cropping.
Introduction
Agricultural systems have evolved over long periods as a consequence of modifications ofclimate, agricultural technology and socioeconomic conditions. Agriculture itself nowadayscan be viewed as multitasking land use activity, whereas for a long time it had the uniquepurpose to supply food to mankind (van Ittersum and Rabbinge, 1992).
In several areas, a set of socio-economic conditions lead to a high concentration of livestockactivities, determining the undesired environmental effects of accumulation of nutrients andcontamination of surface and ground water. In such situations, the demand increasingly ad-dressed to agriculture is to provide suitable solutions for agronomic utilization of manure,whereas crop production may become a secondary objective.

135
The type and the sequence of cultivated crops play a crucial role in determining sustainabilityof land use. A proper choice of crop rotation may alleviate the existing problems increasingnutrient uptake and keeping unavoidable nutrient losses at a tolerable level. In this view, croprotations were defined as mechanisms developed by the farmers to enhance sustainability(Fresco and Kroonemberg, 1992). Consequently, a quantitative evaluation of cropping sys-tems options can provide valuable information in facing the dilemma of acceptable compro-mise among conflicting objectives of socio-economic and ecological nature.
The aim of this paper is to highlight some key features of cropping systems coupling quanti-tative approaches and experimental data collected on poliennial experiment fertilized with pigslurry in the low Po Valley. In this region pig slurry constitutes a serious waste problem, dueto high concentration of pigs with livestock in some areas. Environmental concerns are evenincreased by the amounts of mineral fertilizers generally applied.
Case study of the low Po Valley
Materials and methodsA cropping system experiment was established since 1993 at S. Prospero (Modena) (Lat. 44°38’ N, Long. 10° 50’ E, 20 m asl). The objective of the research was to evaluate cropping sy-stems prototypes with respect to their suitability in receiving application of pig slurry whilstlimiting the effects on the environment.
The soil of the site has clay-silty texture, it is classified as Vertic Ustochrept, and it has a wa-ter holding capacity of about 150 mm per metre of depth. The average annual climatic rain-fall of the site is 648 mm, distributed quite uniformly along the year.
The crop rotations in comparison are the following:
Sugar beet-Wheat (S-W) (biennial – dryland)Sugar beet-Sorghum-Wheat (S-Sr-W) (triennial – dryland)Sugar beet-Maize-Maize-Wheat (S-M-M-W) (quadriennial – irrigated)Maize-Maize-Wheat (M-M-W) (triennial – irrigated)Barley + Sorghum II Crop-Soybean (B+SrII-So) (biennial – irrigated)
Crop rotations are performed both in time and in space, so all phases of crop sequences arepresent every year. Each rotation is conducted with three different sets of agronomic inputs(production techniques), corresponding to three different production orientations.
Pig slurry is applied in amounts corresponding to 250 kg N ha-1, to maize, sorghum and sor-ghum late sowing. Consequently, the relative presence of maize and sorghum in the rotationdetermines the intensification of pig slurry application per unit area.

136
The size of individual plots is 775 m2, which allows the execution of tillage operation by useof normal field machinery.
Simple nutrient budgets at farm levels (i.e. inputs fertilizers-output products) were performedin order to identify situations of nutrient accumulation.
The nitrate content of soil layers of 0.2 m, until 1.2 m depth, was measured at the harvest timeof each crop, and at the beginning of the winter (fixed arbitrarily at 20 November). Water per-colation in this environment occurs mainly during winter and early spring. Then, the amountof nitrates present in soil profile in November is an important element for assessing the risk ofnitrogen leaching.
Results and discussionFocusing on the nitrate content in soil profile, only two extreme cropping systems are dealtwith in this paper. The first one is the rotation Sugar beet-Wheat, which showed the highestnitrate content in the soil profile at the beginning of the winter (Table 1).
Table 1. Nitrate nitrogen content (kg N-NO3 ha-1) integrated over soil profile (0-1.2 m)at harvest time and at 20 November for 3 subsequent years: biennial rota-tions sugar beet-wheat and barley+sorghum II crop-soybean
1994 1995 1996
Harvest 20 Nov. Diff. Harvest 20 Nov. Diff. Harvest 20 Nov. Diff.Sugarbeet
46(Aug.)
101 +55 55(Aug.)
95 +40 41(Aug.)
121 +79
Wheat 67(July)
107 +40 43(July)
99 +56 69(July)
94 +25
S-W 104 97 107Sorgh.II 28
(Oct.)48 +20 40
(Oct.)51 +11 43 (Oct.
)50 +7
Soybean 58(Oct.)
78 +20 35(Oct.)
69 +34 61(Oct.)
61 0
So-B+SrII
63 60 56
Surprisingly strange, this rotation receives moderate nitrogen fertilization (i.e. the nitrogenbudget inputs – outputs are close to zero) and do not receive any application of pig slurry.
The opposite case is represented by the rotation Soybean-Barley + Sorghum late sowing, theone which showed the lower nitrate content in soil profile at the beginning of the winter.

137
This rotation receives pig slurry application on 50% of the area on a yearly basis, ad has a ni-trogen surplus about of 120 kg ha-1.
The intriguing differences between the above crop rotations appear to be related with thelength of the period in which the soil remains uncovered during the useful growing season.
In fact, in case of both wheat and sugar beets half of the nitrate present in soil profile in No-vember accumulated after the harvest of the crop. Conversely, in case of soybean and sor-ghum second crop (after barley) the soil cover is protracted until October. Then, the presenceof an active canopy (a root system) allowed a steady sink for mineralized nitrogen.
Figure 1 illustrates the seasonal courses of Leaf Area Index (LAI) of the two crop sequences,simulated with the crop growth model SUCROS97 (Van Laar et. al., 1997).
The model was calibrated on the basis of crop parameters and partitioning tables measured inthe same field experiment (Ceotto, 1999 ). The daily flux of incoming (potential) photosyn-tetically active radiation (PAR) was calculated by the subroutine ASTRO (Goudriaan and vanLaar, 1994) on the basis of the latitude of the site. This figure gives an idea of the differentuse of solar radiation made by each cropping systems. The interception of solar radiation bycanopy cover varies strongly troughout the seasons.
On an annual basis two extreme situation can be observed: the wheat crop that completes itscycle before the maximum period of incoming radiation and leaves the soil uncovered for therest of the useful growing period; the within-year crop sequence barley + sorghum secondcrop, that extend the soil cover from early spring to the end of the summer, even though thereis a short period of incomplete covering during the period of the maximum incoming radia-tion.
Then, in the climatic conditions of southern Europe, where the growing season is sufficientlyextended, the adoption of second crops may contribute to alleviation of water pollution.

138
Figure 1. Time course of soil cover and yearly course of (potential) incoming PAR forbiennial rotations sugar beet-wheat and barley+sorghum II crop-soybean
Finally, it is valuable to remark here that perennial crops (e.g. lucerne) that extend the soilcover from the beginning to the end of the useful growing season (with thresholds delimitedby temperature patterns), seem to be ideal with respect to the objectives of intensive cropping.
Enhancing nutrient uptake in theory
Agricultural production possibilities are defined and constrained by climate, crop characteris-tics and soil properties. Approaches using the biophysical potentials for quantification of pro-duction technologies are increasingly applied in evaluating options for agricultural land use.In particular, the concept of potential production (Rabbinge, 1993; Evans & Fisher, 1999) hasgained wide acceptance during the last few years.
In analogy with potential production, for our purpose we can define potential nutrient uptake,as the amount of nutrients absorbed by a crop growing on a given physical environment, wit-hout limitation of water and nutrient availability, with pest organisms effectively controlled.
Net primary productivity (NPP) was defined as the net change in weight of crop plants, fromsowing to harvest in case of annual crop, and from the beginning to the end of the year in case
0
1
2
3
4
5
6
1 31 61 91 121
151
181
211
241
271
301
331
361 26 56 86 116
146
176
206
236
266
296
326
356
day of the year
LAI (
m2 m
-2 )
0246810121416
PAR
( M
J m
-2 )
Barley Sorg.II Soybean
0
1
2
3
4
5
6
1 46 91 136
181
226
271
316
361
41 86 131
176
221
266
311
356
day of the year
LAI (
m2 m
-2 )
0246810121416
PAR
( M
J m-2
)
Sugar beet Wheat

139
of perennial crops (Pearson, 1992). NPP depends on the crop genotype and crop ecosystem,which is set by the climate, the soil, and the human management; it is thus the integral overtime of crop growth, less death and predation. In mathematical terms:
Where LUE is the light use efficiency, Io is the daily PAR incident on a crop uppermost sur-face, k is the canopy extinction coefficient, LAI is the daily value of leaf area index, and D isthe rate of seasonal losses due to death or predation.
Aiming to quantify the Net Nutrient Uptake (NNU) at cropping systems level, we can usetime integral over the period of crop rotation, neglect the term D, and modify the above equa-tion as follows:
Where n is the number of year of crop rotation duration, and Nut% is the nutrient concentra-tion (either N or P) in crop biomass.
Nutrient concentrations in dry matter of crops growing in non-limiting conditions are deter-mined to a large extent by the genetic characteristic of the crops (van Duivenbooden, 1992).In addition, even the P/N ratio of crop biomass at harvest is rather constant when nutrients arenon-limiting: values of 0.10 were reported for grasses and 0.15 for cereals (Penning de Vriesand van Keulen, 1982).
Crop dry matter production can be calculated with identical results as a function of cumulateddaily rate of water transpiration (TRANSP) and the crop transpiration efficiency (TE) (Tannerand Sinclair, 1983). In this case the NNP can be calculated as follows:
This approach appears more “energy balance” sound if one considers that most of the net ra-diation (Rn) absorbed by the crop is dissipated in water transpiration. Also in this case, LAI isa pivotal variable for partitioning soil evaporation and plant transpiration. Then, regardless ofthe approach taken, the time course of LAI is a key feature in determining resource use interms of radiation, water and consequently nutrients.
The key role of LAI is illustrated in Figure 2.
On daily basis, the amount of radiation that reaches the soil and then is lost for crop produc-tion (and nutrient uptake) can be calculated with the equation I= Io *exp(-kLAI). From a sim-
[ ]{ }dtkLAIIoLUENutNNUn
∫ −−=365*
0
)exp(.1**%
( )dtTRANSPTENutNNUn
∫=365*
0
**%
[ ]{ }dtDkLAIIoLUENPP ∫ −−−= )exp(.1**

140
ple inspection of the equation, when LAI = 0 then exp(0) = 1 and I = I0, and obviously alldaily radiation is lost for crop production and consequently for nutrient uptake.
Then, we can quantify the amount of radiation lost at cropping systems level (Ilost) with a timeintegral over the length of crop rotation:
Since crop production is essentially an energy processing system, the ratio (Io-Ilost) / Io can betaken as an efficiency index for the use of natural resources at cropping system level.
Yet, long periods of intercropping during the useful growing season increase the amount ofIlost and diminish the global efficiency of cropping system. On the other hand, the canopycover during the winter period is not effective due to low level on incoming radiation thatmakes crop production and nutrient uptake hardly possible.
Figure 2. The key role of LAI in determining use of solar radiation, water and nutri-ents (adapted from Hsiao & Bradford, 1983).
Solar radiationRg
LAILeaf characteristicsplant density
Dry matterproduction
NNUNet Nutrient
Uptake
kPAR
kTS
PARabs
Effective leafabsorbing PAR
Effective leafabsorbing Rg
Solar radiationRg
LUE
Rnabs
T
TE
dry matterproduction
Nutrient %Plant species
dtkLAIIoIn
lost ∫ −=365*
0
)]exp(*[

141
Strategy towards intensive cropping
The implication of the simple relations illustrated so far, is that a good strategy to improveproductivity on one hand and nutrient uptake on the other, is to extend the period and the ex-tent of interception of solar radiation by “intensive cropping”. Following the definition givenby Loomis (1983) intensive cropping is “a system that comes rapidly to complete leaf coverand extend the cover for the full growing season without limitations by nutrients, diseases, orpests”. By the adoption of intensive cropping, the following objectives may be accomplishedat the same time:
• Transformation of solar radiation into edible biomass is improved• The use of water resources is more efficient. In fact, due to the conservative nature of
transpiration efficiency, high crop production determines high water use for crop transpi-ration, soil evaporation is brought to a low fraction of total evapotranspiration, and waterlosses by surface runoff and deep percolation are minimized
• Nutrient accumulation in the soil is reduced. In fact, nutrient content in crop biomass var-ies within narrow limits defined by the crop species, and increasing crop production theamount of nutrient uptake is also increased.
Enhancing nutrient uptake in practice
Theory is one thing, but agriculture reality is quite another thing. Dealing with agriculturalmanagement practices socio-economic aspects have to be considered together with biophysi-cal concepts.
Farmers should be considered the target people in pursuing sustainable land use (Magette,2000). Management practices adopted by the farmers depend on their perception of economicconvenience, labour organization and also by traditions. Further, in many agricultural en-vironments there are constraints imposed by climate or resource availability.
Then, aiming to foster the diffusion of more sustainable cropping systems, the following setof conditions seems to be necessary:
• Policy makers and advisory services should firstly be aware of the importance of canopycover when designing sustainable land uses and developing policy to foster their intro-duction
• Farmers should become aware of the importance of this aspect in mitigating water polluti-on and provided with additional technical knowledge
• Economic incentives should be available in order to make the new cropping systems eco-nomically attractive, and then to motivate farmers to act for the general interest.
142
Concluding remarks
Nutrient budgets at farm level may conceal risks of nitrate leaching when the soil remainsbare for long periods during the useful growing season. An effective way to improvesustainability of cropping systems appears to be the adoption of “intensive cropping” strategy.In fact, by extending the period in which the soil is covered by a “full cover canopy” severalimportant objectives may be accomplished at the same time: crop productivity is improved,water resources are used more efficiently, nutrient uptake is increased, then nutrient accumu-lation and losses are diminished.
This strategy cannot be seen as a panacea, but rather as a step towards alleviation of existingenvironmental problems.
The adoption of this strategy in practice depends on a proper level of communication betweenresearchers, policy makers and farmers that makes possible an effective policy action at re-gional and national levels.
Acknowledgements
This work was funded by National Research Council (CNR), Programma Reflui, legge 95/95.
The field experiment was financed by the Italian Ministry of Agricultural Policy. FinalizedProject “PANDA”, Subproject 2.
The author is indebted with Dr. P. Spallacci for providing his data.
References
Ceotto, E., 1999. Exploring cropping systems of the low Po Valley using the system ap-proach. MSc Thesis, Landbouwuniversiteit Wageningen: 90.
Evans, L.T. & Fisher, R.A., 1999. Yield Potential: Its definition, measurement, and signifi-cance. Crop Science. 39: 1544-1551.
Fresco, L.O. & Kroonemberg, S., 1992. Time and spatial scales of sustainability. Land UsePolicy: 155-168.
Goudriaan, J. & van Laar, H.H., 1994. Modeling Potential Crop Growth Processes. Textbookwith Exercises. Kluwer Academic Publishers, Dordrecht, The Netherlands, 238 pp.
Hsiao, T. & Bradford, K.J., 1983. Physiological Consequences of Cellular Water Deficit. In:Taylor, H.M., Jordan, W.R. & Sinclair, T.R. (eds.). Limitations to efficient water use incrop production. ASA-CSSA-SSSA: 227-245.

143
Loomis, R.S., 1983. Crop manipulations for efficient use of water: an overview. In: Taylor,H.M., Jordan, W.R.& Sinclair, T.R. (eds.) Limitations to efficient water use in crop pro-duction. ASA-CSSA-SSSA: 345-380.
Magette, W.L., 2000. Controlling Agricultural Losses of Pollutants to Water and Air: Are weHelping the Farmer Enough? Proceedings of 9th Workshop of the Network on Recycling ofAgricultural, Municipal and Industrial Residues in Agriculture (RAMIRAN). Gargnano(Italy) 6-9 September 2000. (In press).
Rabbinge, R., 1993. The ecological background of food production. In: Crop protection andsustainable agriculture. Ciba Foundation Symposium 177: 2-29.
Pearson, C.J., 1992. Attributes and evolution of field crop ecosystems. In: C.J. Pearson (ed.)Ecosystems of the world 18. Field crop ecosystems: 1-10.
Penning de Vries, F.T.W, van Keulen, H., 1982. La prodution actuelle et l’action de l’azote etdu phosphore. In: Penning de Vries, F.T.W, Djitèye, M.A. (eds.) La production despàturages sahéliens. Une étude des sols, des végétations et de l’exploitation de cetteressource naturelle. Agric. Research Reports 918, Pudoc Wageningen: 196-225.
Tanner, C.B. & Sinclair, T.R., 1983. Efficient water use in crop production: research or re-search? In: Taylor, H.M., Jordan, W.R. & Sinclair, T.R. (eds.), Limitations to efficientwater use in crop production. ASA-CSSA-SSSA: 1-27.
Van Duivenbooden, N., 1992. Sustainability in terms of nutrient elements with special refe-rence to West -Africa. Cabo-Dlo, Report 160, 261 pp.
Van Ittersum, M.K.& Rabbinge, R., 1997. Concepts in production ecology for analysis andquantification of agricultural input-output combinations. Field Crop Research 52: 197-208.
Van Laar, H.H., Goudriaan, J. & van Keulen, H. (eds.), 1997. SUCROS 97: Simulation ofcrop growth for potential and water limited production situations. Quantitative Approachesin Systems Analysis No. 14, 52 pp.

144
RUNOFF OF NUTRIENTS AND FAECAL MICRO-ORGANISMS FROMGRASSLAND AFTER SLURRY APPLICATION
Jaana Uusi-Kämppä1)* & Helvi Heinonen-Tanski2)
1) Agricultural Research Centre of Finland, Resource Management Research,FIN-31600 Jokioinen, Finland, E-mail: [email protected]
2) University of Kuopio, Department of Environmental Sciences, P.O. Box 1627,FIN-70211 Kuopio, Finland, E-mail: [email protected]
Abstract
The application of slurry on perennial grass is becoming more normal on Finnish dairy farms,because the farms mainly have perennial grass leys and less cereal. However, the effect of re-current slurry application on the eutrophication and hygiene of surface waters is not wellknown. We have therefore studied the phosphorus and nitrogen runoff and levels of faecalmicro-organisms in surface runoff at experimental plots with perennial grass.
An eight-plot experimental field (0.34 ha) was located on a clay soil at Jokioinen, southernFinland. The slurry applications were done the in summer and autumn of 1998-2000. The ex-perimental areas were fertilised according to agricultural practice with cattle slurry, either sur-face-spread (1) or injected into the soil (2). The control was mineral fertilisation on the soilsurface (3).
The runoff was normally low. However, in the autumn of 1998, the saturated soil and heavyrainfalls immediately after the slurry application increased the loads of nutrients and faecalmicro-organisms from the treatments 1 and 2. The levels of total runoff phosphorus and nitro-gen were 2.7 and 7.8 kg ha-1, respectively, in the surface-spread plots in the winter of 1998-1999.
Key words: Cattle, slurry, faecal micro-organisms, nitrogen, phosphorus, runoff.
Introduction
Since Finland joined the European Union in 1995, both the number of animal units and thepercentage of fields cropped with perennial grass have increased on dairy farms. Many dairyfarms do have great problems with manure storage, as they have to know when and where toapply the manure or slurry. Because most Finnish soils are wet in early spring, only a shortperiod is available for handling and disposal of manure and slurry. In addition, it is forbiddento spread slurry or manure on the snow or on the frozen soil (Council of State decision,

145
219/1998). Therefore, application of cattle slurry on perennial grass in the summer and some-times also in the autumn was started, although autumn application is not recommended.
Slurry application will usually have an effect on nutrient runoff and leaching if excessamounts of slurry is spread in one place, or weather conditions are unsuitable during orshortly after the slurry application. Manure and slurry application outside the growing seasonmay cause high risk of nutrient losses to downstream waters (Turtola and Kemppainen 1998).This can lead to an increased risk of euthrophication in streams, lakes and coastal waters.
To prevent loads of P and N compounds to surface and ground water, the levels of P and Nfertilisers have been limited by the Finnish Agri-Environmental Programme (FAEP). The ma-ximum level of P varies from 0 to 50 kg P ha a-1 for forage grasses, depending on soil fertilitytests. Most of P is recommended to be incorporated into the soil when grass is established.
Annually it is allowed to give nitrogen up to 100 kg ha-1 for the first, 100 kg ha-1 for the se-cond and 50 kg ha-1 for the third grass yield. However, the annually allowed amount of totalnitrogen in manure or slurry is restricted into 170 kg ha-1 (Council of State decision,219/1998). In autumn it is allowed to spread 30,000 kg ha-1 of cattle slurry by way of injecti-on on grassland. Runoff can also be decreased from a field by establishing a 3 m wide bufferstrip or 15 m wide buffer zone. Also, to minimize nutrient losses, the Finnish Council Statedecision (219/1998) recommends leaving at least 10 m wide unmanured areas along watercourses and main ditches, and from 30 to 100 m wide unmanured areas around householdwells and springs.
This paper reports on N and P losses in surface runoff during a two year experiment, whereslurry was either surface-spread or injected into perennial grass in summer and late autumn.Autumn application was studied because nitrogen losses were thought to be small if slurrywas spread in cool weather conditions. Mineral fertiliser was applied on grass in control plotsin spring and summer. 10 m wide buffer strips were left in the lower part of the experimentalplots.
Methods
The experimental fieldAn eight-plot experimental field (0.34 ha) is located on a clay and silty clay soil at the Agri-cultural Research Centre at Jokioinen, southwestern Finland. Although the field area had beendrained, only surface water samples could be collected. The experimental field was dividedinto eight plots (6 m * 70 m). The plots were isolated by a plastic sheet into a depth of 60 cmand by a small soil bank to prevent water flow from a plot to the other one. A ditch was dugaround the experimental field to prevent surface runoff from surrounding field areas. Surfaceand subsurface water to a depth of 30 cm flowed from the plot area (0.042 ha) into a collector

146
trench planned by Puustinen (1994). The waters were directed to plastic tanks (1.5 m3) situa-ted under the soil. Water volume was measured and representative subsamples were taken forlaboratory analyses when the tanks were being emptied.
For the establishment of the perennial grass ley a seed mixture of timothy (Phleum pratence)and meadow fescue (Festuca pratensis) 26 kg ha-1 had been sown in summer 1995. The plotswere fertilised with NPK fertiliser applied on the soil surface in spring. An experiment on nu-trient runoff from grass applied with cattle slurry in summer was studied 1996–1997 (Uusi-Kämppä et al. 1998).
Experimental designExperimental treatments continued on the same plots as in the earlier study, but in the currentexperiment the slurry was spread both in summer and autumn. The experimental treatmentswere as follows:1. Surface-spread cattle slurry in June and in October 1998–2000 (three replicates)2. Cattle slurry injected into the soil in June and in October 1998–2000 (three replicates)3. Mineral fertilisation on the soil surface in May and June 1998–2000 (two replicates)
During the experimental period cattle slurry and NPK fertiliser were spread on the centralarea (5 m * 50 m) of the plots. A Teho-Lotina distributor was used to spread slurry, 50–60t ha-1, in summer and 30–40 t ha-1 in autumn. The target for N fertilisation was 100 kg N ha-1
for each yield. It was estimated that 75% of total P spread in cattle slurry was to be in theplant available form and 50% of soluble N spread in autumn was to be in the plant availableform the following spring. Therefore, in spring 1999 and 2000 the grass applied with slurrythe previous autumn needed more nitrogen, 60–70 kg ha-1,which was given in NPK (26-0-1)fertiliser. 10 m wide buffer zones were neither fertilised nor manured.
Chemical analyses Water samples of 500 ml were collected in polyethylene bottles from storage tanks from eve-ry two weeks to twice a day during runoff periods. The samples were stored dark and cool.Concentrations of total nitrogen (TN) and total phosphorus (TP) were determined in unfilteredwater samples. For other determinations water samples were filtered through a membrane fil-ter (Nuclepore Polycarbonate, pore size 0.2 µm) before analyses. Ammonium nitrogen(NH4-N) and nitrate nitrogen (NO3-N) were analysed according to the Finnish standard met-hods SFS 3032 (1976) and SFS 3030 (1990) respectively, and by use of Skalar autoanalyser.Orthophosphate phosphorus (PO4-P), TP and TN were analysed according to the Finnishstandards SFS 3025 (1986), SFS 3026 (1986) and SFS 3031 (1990), and by use of TecatorFIAstar autoanalyser. Plant available phosphorus was obtained by extracting soil sampleswith acid ammonium acetate (AAAc, pH 4.65) for soluble P (Vuorinen & Mäkitie 1955). Thecontents of N and P in slurry were determined as described by Kemppainen (1989).

147
Micro-organismsThe hygiene of runoff waters has been followed by determination of DNA- and RNA-coliphages (E. coli ATCC 13706 and 15597 as hosts) according to the method of Grabow andCoubrough (1986) and modified by Rajala-Mustonen and Heinonen-Tanski (1992). Total co-liforms were cultivated on m-ENDO-agarLES (Difco 0736-17-2; Finnish standard SFS 3016),faecal coliforms on mFC-agar (Difco, 0677-17-3; Finnish standard SFS 4088) and confirmedsince autumn 1998 by oxidase test. Enterococci were cultivated on KF-streptococcus agar(Oxoid CM701) and colonies confirmed with 3% of H2O2 and on bile-aesculin-azid agar (Dif-co 0525-17; Finnish standard SFS 3014). Sulphite reducing clostridia were determined accor-ding to the European Norm on media self-made (EN 26461), but incubated in Oxoid anaero-bic jar.
Results
RunoffObviously, the soil had an extremely good infiltration capacity because the amount of runoffwater was quite small during the experimental years. The mean runoff varied from 40 to170 mm during an experimental year. On a nearby field the amounts of runoff water from agrass field varied from 140 to 250 mm and the amount of drainage water varied from 100 to120 mm during 1980-1982 (Turtola & Jaakkola 1995). In our experiment the surface runoffwas the greatest in 1998 when the soil was saturated during autumn application. In summer1998 there was little runoff (2-6 mm), although the rainfall was over 200 mm between June30th and October 16th. Obviously, the precipitation was high in growing vegetation. Thesummer 1999 was so dry that in the autumn there was hardly any grass for harvesting.
Nitrogen RunoffThe annual loads of TN in runoff water from grass ley were small, varying from 0.7 to 8 kgha-1. In runoff water most of nitrogen was obviously in organic form because the load of NH4-N varied from 0 to 2.5 kg ha-1, and load of NO3-N was also extremely small. The runoff ofTN and NH4-N from slurry application was normally as small as from the control with an ex-ception the runoff from surface-applied slurry in autumn 1998 and spring 1999. The loads ofTN and NH4-N were 5.6 and 2.5 kg ha-1, respectively, in autumn 1998. Also concentrations ofNO3-N were extremely high in runoff water soon after the slurry application. Turtola andKemppainen (1998) also found the N losses to be extremely high after slurry application inautumn and winter, accounting for 11and 33% of the applied N. In our experiment, injectionof slurry decreased the amount of TN in runoff water by an average of 87% and 36% in au-tumn 1998 and in the following spring, respectively. On the other hand, after a very dry sum-mer in 1999 the TN load was near zero in following autumn and only 1 kg ha-1 in the springof 2000. In the autumn of 1999 the soil was unsaturated and the rainfall was not heavy enoughto born surface runoff.

148
Phosphorus RunoffThe annual loads of PO4-P and TP varied from 0.2 to 2.2 kg ha-1 and 0.2 to 2.7 kg ha-1, re-spectively, in the runoff water. Usually, the runoff of TP and PO4-P from slurry applicationplots was as small as from the control plots. An exception was the runoff of TP and PO4-Pfrom the plots with surface-spread slurry in autumn 1998 and spring 1999. The injection ofslurry decreased the loads of PO4-P and TP by an average of 80% in autumn 1998 and 40% inspring 1999. Also the concentrations of PO4-P and TP in runoff water were high immediatelyafter the slurry application in autumn 1998, most of TP being in the soluble form. In autumn1999 the P losses were small after autumn application, because the soil was unsaturated aftera very dry summer. Also less P was applied in 1999 because the dairy cow slurry used onlycontained 0.5 kg TP tn-1, while the beef cattle slurry used earlier had contained more than0.8 kg TP tn-1.
P in SoilOn the topsoil layer (0–2) the content of PAC was the greatest on the plots with surface-spreadslurry. The medium content of PAC doubled or even increased eightfold during three experi-mental years, being 81mg kg-1 in autumn 1999. In the plots with injected slurry the content ofPAC was the greatest in the depth of 5–10 cm where the slurry had been applied. Also the ru-noff of PO4-P was the greatest from the plot with surface-spread slurry. Turtola and Yli-Halla(1999) stated that on a low P soil surface application of slurry may considerably increase theP status at the soil surface within a few years and multiply the P loading to surface runofffrom the site. On the plots with injection of slurry, the greatest (10–35 mg P kg-1) content wasobserved in the drilled area where the slurry was injected and the smallest (under 7 mg P kg-1)was observed between the drills. Because P was only applied into drills with the slurry appli-cations the P content increased dramatically in drills.
Faecal Micro-organismsThe number of faecal micro-organisms in runoff waters was rather low at the beginning (up toJune 1998) of the experiment when the amounts of surface runoff waters were very low. Themost typical geometric means for both coliphage types and sulphite reducing clostridia wereless than the detection limit. This result was usual also for faecal coliforms, maybe due to thefact that these organisms are the true enteric micro-organisms in Finnish climate. The maxi-mum geometric means for total coliforms and faecal coliforms and enterococci, respectively,160, 170 and 2000 cfu/100 ml without any clear differences between different treatments.
The situation changed in late June 1998, as shown in Table 1.

149
Table 1. Geometric means for numbers of faecal micro-organisms in surface runoffwater samples. DNA-coliphages with host E. coli ATCC 13706 are markedCP6 and RNA-coliphages with host E. coli ATCC 15597 as CP7, sulphite re-ducing clostridia as SRC, total coliforms as TC, faecal coliforms as FC andenterococci as EC. Less than the detection limit = ld. # Confirmed still byoxidase test
Treatment Numbers of faecal micro-organisms cfu or pfu/100ml
Sampling date andLast slurry
CP6 CP7 SRC TC FC ECSurface-spread slurry 1 200 1 200 1 2 100 2 900 4 400Injected slurry 220 1 100 1 10 000 10 000 10 000
Jun. 21, 1998, after he-avy rains, 360 days ofslurry application Mineral fertilisation 29 1 300 10 3 600 5 300 17 000
Surface-spread slurry 2 700 130 1 500 19 000 880# 4 800Injected slurry 110 1 69 6 100 350# 460
Oct. 20, 1998, afterrains and 5 days ofslurry application Mineral fertilisation 0.7 Ld Ld 770 740# 140
Surface-spread slurry 2.5 Ld Ld 170 6.5# 160Injected slurry 22 0.9 Ld 240 4.0# 37
Apr. 14, 1999, afterwinter, snow meltingand 180 days of slurryapplication
Mineral fertilisation Ld Ld Ld 270 1.4# 7.1
The summer of 1999 was so dry that samples for microbial analyses were not available Thenumber of faecal micro-organisms was very low in October 27th, but on 1 Dec. 1999 it washigher, especially in the runoff waters of injected slurry, where all faecal micro-organismscould be found (Table 2).
Table 2. Geometric means for numbers of faecal micro-organisms in surface runoffwater in samples. The other legend as in Table 1
Treatment Numbers of faecal micro-organisms /100 mlSampling date andlast slurry CP6 CP7 SRC TC FC EC
Surface-spread slurry 1.5 0.9 55 2 100 3 100 510Injected slurry 100** 70* 38 1 500 1 100 720
Dec 1, 1999, after34 days of slurryapplication Mineral fertilisation 1.0 Ld 3.9 480 940 140
The difference of logarithmically transformed numbers of coliphages in the injected plot andthe other plots were statistically very significant for DNA-coliphages (p = 0.007) and signifi-cant for RNA-coliphages (p = 0.03). It can be assumed that in this case the injection did notguarantee better water hygiene, and during the winter the faecal micro-organisms ran to hesurface water.
In the spring of 2000 some RNA-coliphages (CP7) were found in runoff waters and most ofthem (13 as geometric mean) were found in mineral fertilised plot waters, showing that mayberich melting waters could be partly mixed as could do the heavy rains, too (Table 1, firstsampling). Generally, the numbers of faecal micro-organisms were, low, however.
150
Conclusions
The nutrient runoff was normally quite small after summer slurry applications. However, thelevel of runoff of nutrients and faecal micro-organisms may be high, if the soil is saturatedand it rains shortly after the applications. Wide unmanured buffer areas along water coursescan decrease the runoff, but nitrogen fertiliser should be applied on buffered areas in spring toimprove grass growing on buffers. There was also a risk that nitrogen leached through draina-ge flow or into groundwater. Altogether, summer application, a little amount of nutrients ap-plied, wide buffer areas and injection of slurry is quite a safe way to apply slurry on grass.Saturated soil and heavy rains after application increase the risk of runoff of nutrients and fae-cal micro-organisms dramatically, especially from grass with surface-applied slurry. In somecases, especially in winter or spring, the runoff waters originated from the injected slurriescontained high numbers of faecal micro-organisms, too.
References
EN 26461, 1993. Water quality – Detection and enumeration of the spores of sulphite-reducing anaerobes (clostridia) – Part 2. Method by membrane filtration. Brussels. 7 pp.
Council of (Finnish) State decision, 219/1998. The protection of waters against pollution cau-sed by nitrates from agricultural sources.
Grabow, W.O.K. & Coubrough. P., 1986. Practical direct plaque assay method for coliphagesin 100 ml samples of drinking water. Appl. Environ. Microbiol., 52: 430-433.
Kemppainen, E., 1989. Nutrient content and fertilizer value of livestock manure with specialreference to cow manure. Ann Agric Fenn 28: 163–284.
Puustinen, M., 1994. Effect of soil tillage on soil erosion and nutrient transport in ploughlayer runoff. Helsinki, Finland: National Board of Waters and the Environment.Publications of the Water Research Institute 17: 71–90.
Rajala-Mustonen, R. & Heinonen-Tanski, H., 1992. A cheaper method for detection of colip-hages in 100 ml water samples. 6th Int. Symp. on Microbial Ecology, Barcelona.
SFS 3032, 1976. Veden ammoniumtypen määritys. (Finnish standard concerning determinati-on of ammonia-nitrogen of water). Suomen standardisoimisliitto. Helsinki.6 pp.
SFS 3014, 1984. Veden fekaalisten streptokokkien lukumäärän määritys pesäkemenetelmällä.(Finnish standard for faecal streptococci with colony counting method) Helsinki.
SFS 3016, 1984. Veden koliformisten bakteerien kokonaismäärän määritys kalvosuodatusme-netelmällä. (Finnish standard for total coliforms with membrane filtration method) Hel-sinki.
SFS 3025, 1986. Veden fosfaatin määritys. (Finnish standard concerning determination ofphosphate in water). Suomen standardisoimisliitto. Helsinki. 10 pp.
SFS 3026, 1986. Veden kokonaisfosforin määritys. Hajotus peroksodisulfaatilla. (Finnishstandard concerning determination of total phosphorus in water. Digestion with peroxo-disulfate). Suomen standardisoimisliitto. Helsinki.

151
SFS 4088, 1988. Veden lämpökestoisten (fekaalisten) koliformisten bakteerien määritys kal-vosuodatusmenetelmällä. (Finnish standard for faecal coliforms with membrane filtrationmethod) Helsinki.
SFS 3030, 1990. Veden nitriitti- ja nitraattitypen summan määritys. (Finnish standardconcerning determination of the sum of nitrite and nitrate nitrogen in water). Suomenstandardisoimisliitto. Helsinki. 5 pp.
SFS 3031, 1990. Veden typen määritys. Peroksodisulfaattihapetus. (Finnish standard concer-ning determination of nitrogen in water. Oxidation with peroxodisulfate). Suomen standar-disoimisliitto. Helsinki.
Turtola, E. & Jaakkola, A., 1995. Loss of phosphorus by surface runoff and leaching from aheavy clay soil under barley and grass ley in Finland. Acta Agriculturae Scandinavica.Section B Soil and plant science 45: 159-165.
Turtola, E. & Kemppainen, E., 1998. Nitrogen and phosphorus losses in surface runoff anddrainage water after application of slurry and mineral fertilizer to perennial grass ley. Agri-cultural and food science in Finland 7: 569-581.
Turtola, E. & Yli-Halla, M., 1999. Fate of phosphorus applied in slurry and mineral fertilizer:accumulation in soil and release into surface runoff water. Nutrient Cycling in Agroecosy-stems 55: 165–174.
Uusi-Kämppä, J., Tanni, R., Grék, K. & Seppänen, A., 1998. Nurmeen levitetyn lietelannanpintavalunta. (Runoff from perennial grass after application of slurry). (In Finnish). In:Cost-efficient and environmentally friendly manure management: The final report of theprogramme for manure research in 1995-1997, In. Sipilä, & A. Pehkonen (eds.). Agricul-tural Economics Research Institute, Finland, Publications 87: 78–81.
Vuorinen, J. & Mäkitie, O., 1). The method of soil testing in use in Finland. Agrogeol Publ63: 1–14.

152
SUSTAINABLE HANDLING AND UTILISATION OF MANUREAND ORGANIC WASTE RESOURCES
THE CENTRALISED BIOGAS PLANT APPROACH
Kurt Hjort-Gregersen, M.Sc.Danish Institute of Agricultural and Fisheries Economics,Rolighedsvej 25 DK-1958 Frederiksberg C (Copenhagen)
Tel. +45 3528 6800. Fax +45 3528 6802. Email: [email protected] or [email protected]: http://www.sjfi.dk
Introduction
The Centralised Biogas Plant Concept was developed in the early 1980’es after sporadic andnot very successful attempts to develop farm scale plant types. It was then anticipated that alarger scale biogas technology, like the centralised biogas plant concept, might be technicallyand economically more successful.
The first centralised plants constructed in 1984-87 were primarily meant as energy producingfacilities, as they would supply heat and power to local villages.
In this period a greater awareness of the environmental impacts of livestock production in theform of manure handling and application emerged. Since then still more restricted legislationon manure handling, application and utilisation has been imposed, Al Seadi, T. et al. (2000)The key elements are the so-called harmony rules that regulate the quantities of manure al-lowed to spread per land unit and required utilisation ratios of manure applied. The latter re-quires certain storage facilities and spreading at optimal moments for plant nutrient absorpti-on.
In their attempts to comply with the mentioned environmental requirements farmers saw thecentralised biogas plant concept as a helpful tool. This was also recognised by the govern-ment, who since 1988 launched successive biogas development programmes, and provided arelatively favourable framework with economic incentives strong enough to initiate a devel-opment. As a result, 20 centralised biogas plants are in operation in Denmark today.
The centralised biogas plant in a traditional manure handling chain
In the below Figure 1 the centralised biogas plant concept is schematically described. Animalmanure, mainly slurry, is transported in vehicles to the biogas plants. Organic waste fromfood industries is also transported by vehicles and applied to the biogas plant. Some plantsalso treat source sorted household waste.
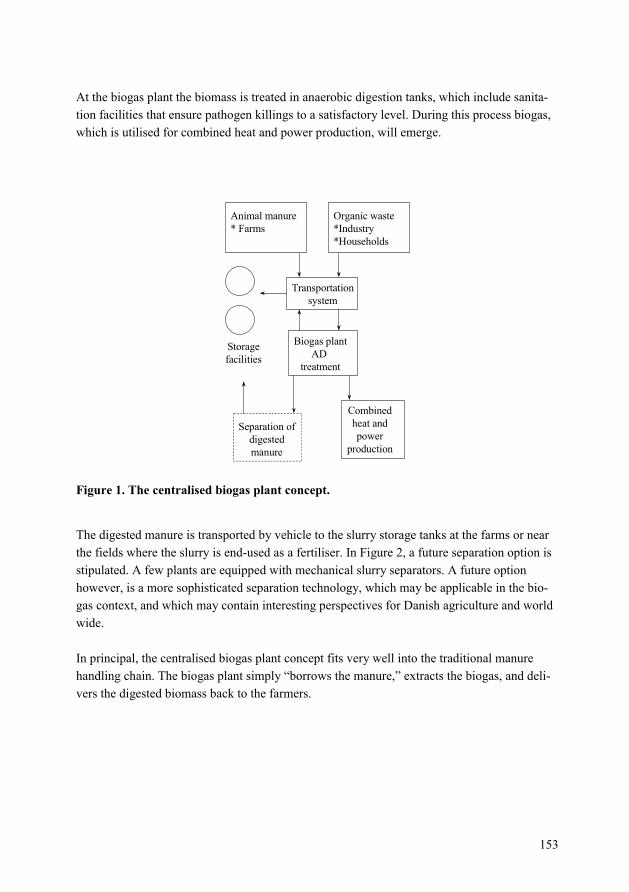
153
At the biogas plant the biomass is treated in anaerobic digestion tanks, which include sanita-tion facilities that ensure pathogen killings to a satisfactory level. During this process biogas,which is utilised for combined heat and power production, will emerge.
Animal manure* Farms
Organic waste*Industry*Households
Transportationsystem
Biogas plantAD
treatment
Combinedheat andpower
production
Storagefacilities
Separation ofdigestedmanure
Figure 1. The centralised biogas plant concept.
The digested manure is transported by vehicle to the slurry storage tanks at the farms or nearthe fields where the slurry is end-used as a fertiliser. In Figure 2, a future separation option isstipulated. A few plants are equipped with mechanical slurry separators. A future optionhowever, is a more sophisticated separation technology, which may be applicable in the bio-gas context, and which may contain interesting perspectives for Danish agriculture and worldwide.
In principal, the centralised biogas plant concept fits very well into the traditional manurehandling chain. The biogas plant simply “borrows the manure,” extracts the biogas, and deli-vers the digested biomass back to the farmers.

154
Transport
Biogas plant
Transport
Animal manure
Feedstuff
Manure application
Storage tanks
Figure 2. The centralised biogas plant in a traditional manure handling chain.
The digested manure is stored in storage tanks at the farms or near the fields, where it is end-used as a fertiliser. In the fields crops are grown which are finally used as feed in livestockproduction.
Contributions to a sustainable handling of manure
Ammonia utilisation ratios require certain manure storage capacity in Denmark. This is notspecific for farmers in a biogas context, but as the required storage capacity is provided bythe biogas plant, the compliance with these demands is easier and cheaper than experiencedby other farmers, Al Seadi et al. (2000), Ørtenblad et al. (1995).
The transportation system in combination with the decentral storage tanks contribute to awider distribution of nutrients in the digested manure, which leads to increased nutrient utili-satio, Ørtenblad et al. (1995).
Pig and cattle manure are mixed in the biogas plant. As pig manure often contains a phospho-rous surplus for typical crop rotations on pig farms, and cattle manure often contains a potas-

155
sium surplus for typical crop rotations on cattle farms, the digested manure mixture is moresuitable for crop rotations on both pig and cattle breeding farms, Ørtenblad et al. (1995).
What the anaerobic process does to the biomass is that organic matter is converted intomethane and carbon-dioxide. The viscosity of the liquid biomass is thereby reduced, Ørten-blad et al. (1995), which makes it more suitable for application in advanced trailing hose sy-stems or injection systems, which allow a higher nutrient utilisation.
After the biogas process, the proportion of mineralised ammonia will be higher than in con-ventional manure, Ørtenblad et al. (1995). Thus, it will be more suitable for plant absorption.Increased plant absorption means that fewer nutrients will be lost to the environment.
Organic waste from food processing industries and households will be recycled and utilisedas fertilisers, Hjort-Gregersen (1999).
Most centralised biogas plants control sanitation facilities that ensure pathogen killings to asatisfactory degree, Bendixen (1996).
Odour nuisances from manure spreading will be reduced if the manure is treated in a biogasplant. The odour reduction will not be total, but many manifestations prove it to be signifi-cant, Ørtenblad et al. (1995).
From conventional manure in storage tanks considerable amounts of methane will emerge du-ring the storage period, especially at high temperatures. It has been documented that themethane emissions will be reduced if digested manure is stored, Petersen & Sommer (1998).
From fields where conventional manure has been applied, an N2O-emission will take place.Investigations have documented that the N2O-emission will be reduced if digested manure isapplied instead, Petersen & Sommer (1998).]
From the anaerobic process renewable energy will be produced in the form of biogas. Energybalance of agriculture in general will thereby be improved, and a contribution will be made tothe fulfilment of government ambitions within the fields of greenhouse gas reduction, Hjort-Gregersen (1999).
Economics of a biogas plant
Danish centralised biogas plants benefit from a number of special preconditions. Some of themost important are mentioned in the following. All plants received 20-40% investment grants.Biogas and heat from biogas are not energy taxed, and a production subsidy of DKK 0.27/kWh

156
will be obtained. In Denmark district heating systems are widespread, thus enabling the plantsto market their heat production, which is essential to plant economy.
The following calculations in Table 1 are based on experience from Danish centralised biogasplants, thus representing the economics of a fictive plant with a daily treatment capacity of300 m3 of biomass.
The organic waste ratio of total biomass application is 20%. A biogas price of DKK 2.00 isused.
The total investments of a plant this size would amount to approx. DKK 34 mill.
Table 1. Costs and revenues per m3 of biomass treatedDKK per m3 of biomass treated
No investment grants 20% investment grantsTransport- Operating costs- Capital costs
164
163
Anaerobic treatment/biogas production- Operating costs- Capital costs
2126
2121
Energy salesGate fees (receiving organic waste)
606
606
Profit -1 5
It appears from Table 1 that an economic balance can be achieved under Danish conditionswith relatively small investment grants. The options for economic success has increased in re-cent years, due to the increase in world market fuel prices.
In general, economic results from Danish centralised biogas plants have improved conside-rably over the years, and most of the plants find themselves in an acceptable economic situa-tion. Some of the older plants, however, were not able to meet their financial obligations byown means and had to be financially reconstructed. Most of the later plants, as gained experi-ence was built into new plants, produced better results, primarily due to improved operationstability. A few plants, however, even some relatively new ones, still face relatively troubles-ome economic situations.
Farmers’ incentives
Most centralised plants in Denmark are partly or fully owned by farmers in co-operative com-panies. Farmers took the initiative, but what made them do so, as they would not withdraw aprofit from the biogas companies? The answer is that farmers went for the derived economic

157
benefits that will be gained from the operation of a biogas plant in the form of cost savings forthe individual farmers.
In many cases the centralised biogas plants provide slurry storage facilities that are requiredby law, and which farmers otherwise would have to establish themselves. In this way, farmerscan gain cost savings in slurry storage.
Some of the storage tanks are sited near the fields where the slurry is end-used as a fertiliser.The vehicles of the biogas plant take the degassed biomass to these tanks. In this way farmersgain cost savings in slurry transportation.
The mixture of various biomasses in a biogas plant will make the nutrient content of the dige-sted biomass more suitable and valuable as a fertiliser in crop production. In this way, farmerswill gain cost savings in fertiliser purchases.
The proportions of the derived economic benefits will depend of the conditions for each far-mer. An average of 5 DKK per m3 of slurry supplied to the biogas plant has been calculated,Hjort-Gregersen (1993).
Future options for centralised biogas plants
Environmental legislation will undoubtedly be increasingly restricted, indeed, concerninghandling and utilisation of animal manure. One option is manure separation, under which nu-trients may be fractionated and marketed, or utilised on the farms. Many efforts have beencarried out in recent years to develop appropriate and reliable technology for manure separati-on. The idea is that centralised biogas plants may hold the perfect infrastructure for such atechnology. If so, centralised biogas plants may make a second start in Denmark. On a Euro-pean level, as well as worldwide, it is the impression that post treatment of manure is the maininterest.
Conclusions
The centralised biogas concept has proven to make a considerable contribution to a moresustainable handling and utilisation of manure, and under Danish conditions even without ex-tra costs for involved farmers, who, on the contrary, will gain derived economic benefits.
At the same time, waste recycling problems in food processing industries and households aretaken care of in an appropriate and veterinary safe way

158
Finally, the energy production makes a contribution to the fulfilment of government obligati-ons within greenhouse gas reduction.
References
Al Seadi, T., Hjort-Gregersen, K. & Holm-Nielsen, J.B., 2000. The impact of the LegislativeFramework on the Implementation and Development of Manure Based Centralised Co-digestion Systems in Denmark. University of Southern Denmark.
Bendixen, H.J., 1996. Hygiene and Sanitation Requirements in Danish Biogas Plants. In pro-ceedings of the 9th European Bioenergy Conference: Biomass for energy and industry,Vol. I, 296-301. Pergamon. Copenhagen
Hjort-Gregersen, K., 1993. Economic Analysis of Separating Digested Manure at the Linko-gas Centralised Biogas Plant (In Danish). Danish Institute of Agricultural and Fisheries E-conomics.
Hjort-Gregersen, K., 1999. Centralised Biogas Plants, Integrated Energy Production, WasteTreatment and Nutrient Redistribution Facilities. Danish Institute of Agricultural andFisheries Economics.
Petersen, S.O. & Sommer, S.G., 1998. Greenhouse Gas Emissions from Digested Manure (InDanish). Danish Institute of Agricultural Sciences.
Ørtenblad, H., Birkmose, T. & Knudsen, L., 1995. Nutrient utilisation in Digested Manure (InDanish). The Danish Agricultural Advisory Centre.

159
LABOUR AND MACHINERY INPUT FOR DIFFERENT MANUREAPPLICATION TECHNIQUES AND TRANSPORTATION SYSTEMS
Claus G. SørensenDanish Institute of Agricultural Sciences, Department of Agricultural Engineering,
Research Centre Bygholm, P.O. Box 536, DK-8700 Horsens, Denmark,Tel. +4576296023. E-mail: [email protected] .Fax. +4576296100
Abstract
The handling and application of manure makes considerable demands on the capacity of tech-nical systems, as significant quantities of manure will have to be applied within a short timeframe in order to achieve the maximum utilisation of the nutrients. Consequently, from anoperational machine planning point of view it is essential to understand the consequences interms of labour input and system capacity from using various technologies, which mightimply different degrees of utilisation of manure nutrients as well as different expected en-vironmental influences.
As part of a project creating basic knowledge on design elements for slurry applicationtechniques, operational technical studies are being carried out on a number of private farmsusing different methods of transportation and different application techniques. Specific studiesare made into transportation systems involving traditional slurry tankers, separate transport tobuffer tanks in the field and systems for pumping the slurry to the field by way of pipelines.As regards application techniques, the attention was focused on band spreading by means oftrailing hoses and shallow injection on grassland or fallow soil. The studies included a detai-led measurement of the time and labour requirement, the machinery capacity, the slurry cha-racteristics, etc.
The processed data and the results obtained from the studies will be incorporated into norma-tive models for evaluation and prediction of the capacity and the labour requirement, conside-ring certain prerequisites like size of field, machinery size, travelling distance to field, dosage,etc. By applying the developed model to different farm scenarios (specific size of herd, speci-fic amount of slurry produced, etc.) and different management farm scenarios as regardshandling systems (specific storage facility and mixing, specific type of transport and applica-tion technology, etc.) these scenarios will be evaluated with respect to operational technicalconsequences. In this way, both existing manure handling systems as well as more innovativesystems may be considered.
Key words: Labour input, machinery input, normative models.
160
Introduction
In recent years, Danish livestock production has experienced a dynamic growth and is facinga challenge to ensure that this growth is carefully balanced with a strong commitment to en-vironmentally-friendly farming practices. An important factor in meeting this challenge willbe an effective manure management involving innovative manure handling technologies andtheir implementation into practical on-farm applications.
A research programme within the framework of sustainable ways of handling the animal ma-nure has been initiated. One project within this programme focuses on creating basic know-ledge about design elements for slurry application techniques. The ultimate objective is toobtain an increase in the plant uptake of nitrogen and phosphorus from the applied slurrythrough an optimisation of the application technique with respect to, for example, minimisati-on of ammonia volatilisation. As part of this objective an analysis of the labour input and thecapacity consequences of using different types application techniques is being carried out.The application of slurry requires a high capacity, and there is a significant demand for a mi-nimum sensitivity to weather, as an application of large quantities of slurry must be carriedout within a relatively short period in order to achieve a maximum utilisation by the plants.
Materials and methods
The objective is to analyse different techniques for slurry application with special reference tothe machinery input and the labour demand. The preliminary investigation has included thefollowing methods:
− tractor pulled tanker transport from storage to field and injection applicator for spreading− self-propelled tanker transport and injection applicator for spreading− separate transport from storage to buffer tank plus tanker transport from buffer tank to
field and injection applicator (transport by truck or tractor-pulled tanker) for spreading− transport from store by transfer hose and spreading by drag hose and self-propelled appli-
cator with trailing hoses and no tank
Labour studies have been carried out, including time studies, measurements of capacity, wor-king width, dose, etc. The acquired data together with supplementary data from other studiesare processed and form the basis for model calculations. The models will make it possible toestimate results, which are not directly encountered in praxis. The conditions are significantlydifferent from one farm to the other and in order to compare different manure handling sy-stems modelling will be needed. The modelling can be carried out following the methods andmodelling principles outlined by Nielsen and Sørensen (1993).

161
A number of operational technical studies were carried out on selected private farms by use ofdifferent variants of the above-mentioned methods for transportation and application on thefield. The time was measured for similar part operations as regards labour content. The mea-sured value includes two types of variations: 1) the variation from non-quantifiable factors li-ke weather, experience of the operator, small changes of methods, etc., and 2) the variationfrom quantifiable factors like transport distance, load, machinery capacity, working speed,etc.
In recent years, the method of band spreading with trailing hoses has more or less become astandard method for slurry application. The slurry is spread through a line of separate tubes(20 or 40 cm apart) placed in bands on the ground. The method can be used in both growingcrops and on fallow land. In the latter case, the spreading will normally be followed by imme-diate incorporation into the soil, e.g. with a plough or some sort of harrow. However, the ever-increasing demand for higher utilisation of the nutrients in the manure has encouraged the useof different injection methods. Contrary to earlier methods that involve deep/closed slits, to-day’s injection is predominantly of the so-called shallow injection type, where the slits are leftopen only to be covered in case the injector is attached with a harrow.
Transport of the slurry may be organised in a number of different ways. The traditional wayinvolves use of the slurry tanker as both a transport unit and a spreading unit. This method issufficient in the case of small transport distances (<2-3 km), whereas larger distances requirethe invoking of separate transport units, delivery of the slurry into the spreading unit at thefield or into a special buffer tank at the field.
Investigations show that the operation of slurry application in the field is often the one opera-tion that implies the highest traffic intensity and therefore, the highest risk of soil compaction(Håkansson & Danfors, 1988). The best utilisation of the slurry will normally be achieved byapplication in early spring and/or to a growing crop. The use of traditional heavy slurry tan-kers involves an increased risk of soil compaction, and in addition, because the spring periodis an intensive work period with other types of operations pending, the application of slurryby use of traditional techniques may cause a negative timeliness effect. By using an alternati-ve system, the slurry will be transported by way of a pipe to a self-propelled spreader (with notanker) applying slurry with trailing hoses mounted on a 24 m spreading bar. This spreadingequipment will be capable of spreading slurry at distances of up to 2-3 km from the slurry sto-re. Among other things, the benefits obtained from using this type of spreader will be reducedsoil compaction, reduced labour requirement and increased application capacity.
Results
Table 1 presents some statistical information on the selected application methods, which havebeen part of the operational analyses. The studies have comprised 82 ha distributed over 15

162
studies. The effective working widths of the injectors ranged from 5.8 to 7.5 m, the averagebeing 6.6 m. The tank capacities varied from 10 to 22 tonnes, the average being 16.6 tonnes.The gross capacities, i.e. the capacities including ancillary work operations like turnings,stops, maintenance, etc., have varied between 23 and 96 t/h, the average being 56.2 t/h. Thegross capacity will depend on the size of the machinery, the pumping capacity, etc., and mostimportant, it will rely heavily on the transport distance.
The self-propelled spreaders equipped with trailing hoses and pipelines for pumping slurryfrom store to field had an average working width of 22 m and an average gross capacity of105.5 t/h ranging from 79 to 134 t/h.
Table 1. Statistical information about analyses of different slurry application methodsTractor-pulled
tanker + injectorSelf-propelled
tanker + injectorSelf-propelled
band spreader withtrailing hoses
Fallow soil Grass Fallow soil Grass Winter crop
Effective workingwidth, m
6.3(5.8-7.2)
6.2 7.0(5.9-7.5)
8.0(7.9-8.0)
22(20-24)
Payload, t 16.9(10-22)
18.5 16.2(13-20)
13.6(13-14 )
Loading capacity, t/h 280(211-355)
214 527(501-551)
506(496-515)
Spreading capacity, t/h 156.4(95-224)
75.0 209.8(187-242)
244.3(206-297)
105.5(79-134)
Gross capacity, t/h 50.9(23-89)
18.0 64.8(48-96)
85.0(68-100)
Dose, t/ha 34.3(18-50)
17.5 29.8(25-35)
26.7(25-30)
40.2(32.8-53.8)
The numbers in brackets are min./max. values
Operating time for manure applicationThe time required for carrying out field operations will depend on the circumstances (dimensi-ons of plot, working speed and width of the machines, distance to manure storage, etc.) and thework organisation. Model calculations were carried out to estimate the time required for apply-ing manure on a field. The model gives the division of the time spent over the activities sprea-ding, transport and loading, given specific prerequisites, like working width, pay-load, transportdistance, etc.
As an example the following application techniques are considered:1. Self-propelled tanker with injector; working width = 7.0 m; pay-load = 16 tonnes; loading
capacity = 500 m3/h; emptying capacity = 220 m3/h2. Tractor-driven tanker with injector; working width = 6.0 m; pay-load = 16 tonnes; loading
capacity = 300 m3/h; emptying capacity = 160 m3/h3. Tractor-driven tanker trailing hoses; working width = 16.0 m; pay-load = 16 tonnes;
loading capacity = 300 m3/h; emptying capacity = 360 m3/h

163
Table 2 shows the estimated labour requirement and system capacities for the application sy-stem defined above. The calculations are tabulated as minutes per load and then transformedinto minutes per tonne and tonnes per hour. For the technical assumptions stated here, the in-jector types have lower capacities than the system with trailing hoses (6% lower for the self-propelled tanker with injector and 30% lower for the tractor-driven tanker with injector). Allin all, the shallow injectors have a reasonable capacity compared to what is the case for bandspreading.
Table 2. Work requirement/capacity for different application systemsMan-min per load
Self-propelled tankerwith injectorWorking width = 7.0 mPay-load =16 tLoading capacity =500 m3/hEmptying capacity =220 m3/h
Tractor-driven tankerwith injectorWorking width = 6.0 mPay-load =16 tLoading capacity =300 m3/hEmptying capacity =160 m3/h
Tractor-driventanker trailing hosesWorking width =16.0 mPay-load =16 tLoading capacity =300 m3/hEmptying capacity =360 m3/h
Loading from storage:Preparation/terminationLoading
1.31.9
1.83.2
1.83.2
Loading, total 3.2 5.0 5.0Transport, 500 m 1) 2.4 2.4 2.4Application on fieldTransport on field, etc. 3.4 4.5 2.6Spreading 4.4 6.0 2.7Spreading, total 7.8 10.5 5.3Application, total 13.4 17.9 12.7Min/t 0.84 1.12 0.79t/h 71.4 53,6 75.91) Velocity on road, 25 km/h
As mentioned earlier, transport distances exceeding 2-3 km will often make it advantageousto invoke a separate transport unit in order to reach a reasonable system capacity. Thefollowing example gives the estimated labour input and capacity for transport by truck andspreading on the field by a tractor-driven tanker fitted with an injector. The technical specifi-cations are as follows:
1. Truck, pay-load = 30 tonnes, loading capacity = 240 m3/h; unloading capacity = 266 m3/h2. Tractor-driven tanker with injector; working width = 6.0 m; pay-load = 16 tonnes; loading
capacity = 300 m3/h; emptying capacity = 160 m3/h
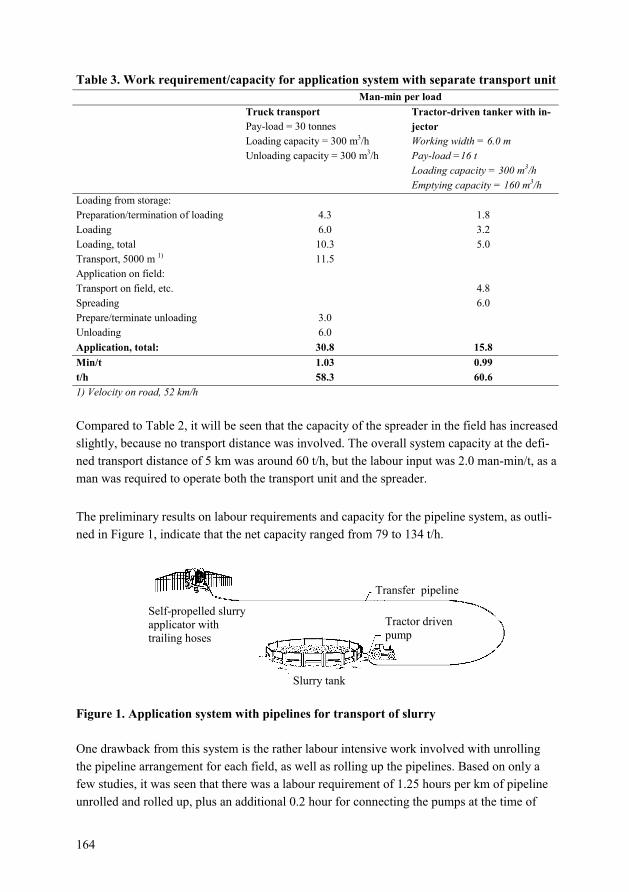
164
Table 3. Work requirement/capacity for application system with separate transport unitMan-min per load
Truck transportPay-load = 30 tonnesLoading capacity = 300 m3/hUnloading capacity = 300 m3/h
Tractor-driven tanker with in-jectorWorking width = 6.0 mPay-load =16 tLoading capacity = 300 m3/hEmptying capacity = 160 m3/h
Loading from storage:Preparation/termination of loadingLoading
4.36.0
1.83.2
Loading, total 10.3 5.0Transport, 5000 m 1) 11.5Application on field:Transport on field, etc. 4.8Spreading 6.0Prepare/terminate unloading 3.0Unloading 6.0Application, total: 30.8 15.8Min/t 1.03 0.99t/h 58.3 60.61) Velocity on road, 52 km/h
Compared to Table 2, it will be seen that the capacity of the spreader in the field has increasedslightly, because no transport distance was involved. The overall system capacity at the defi-ned transport distance of 5 km was around 60 t/h, but the labour input was 2.0 man-min/t, as aman was required to operate both the transport unit and the spreader.
The preliminary results on labour requirements and capacity for the pipeline system, as outli-ned in Figure 1, indicate that the net capacity ranged from 79 to 134 t/h.
Figure 1. Application system with pipelines for transport of slurry
One drawback from this system is the rather labour intensive work involved with unrollingthe pipeline arrangement for each field, as well as rolling up the pipelines. Based on only afew studies, it was seen that there was a labour requirement of 1.25 hours per km of pipelineunrolled and rolled up, plus an additional 0.2 hour for connecting the pumps at the time of
Slurry tank
Self-propelled slurryapplicator withtrailing hoses
Transfer pipeline
Tractor drivenpump
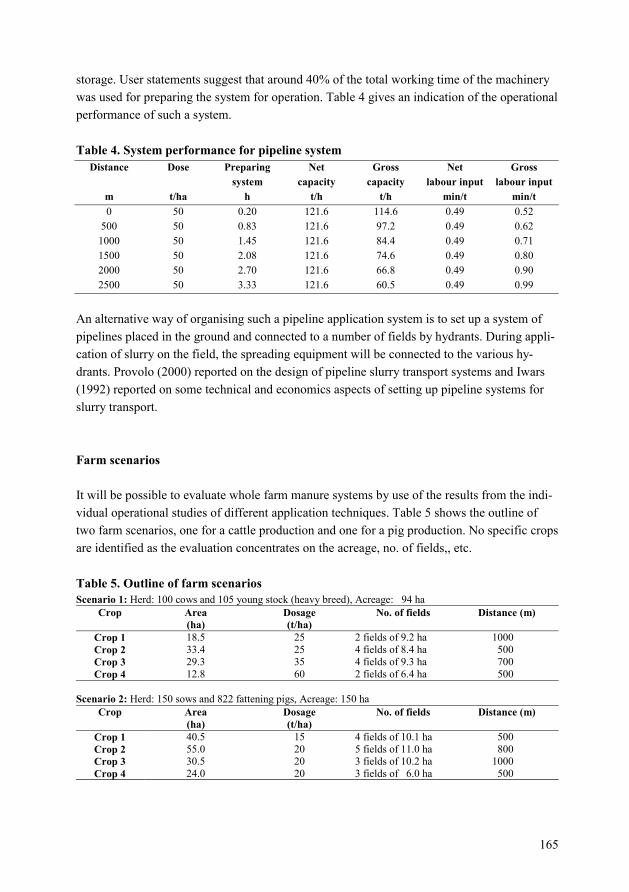
165
storage. User statements suggest that around 40% of the total working time of the machinerywas used for preparing the system for operation. Table 4 gives an indication of the operationalperformance of such a system.
Table 4. System performance for pipeline systemDistance Dose Preparing
systemNet
capacityGross
capacityNet
labour inputGross
labour inputm t/ha h t/h t/h min/t min/t0 50 0.20 121.6 114.6 0.49 0.52
500 50 0.83 121.6 97.2 0.49 0.621000 50 1.45 121.6 84.4 0.49 0.711500 50 2.08 121.6 74.6 0.49 0.802000 50 2.70 121.6 66.8 0.49 0.902500 50 3.33 121.6 60.5 0.49 0.99
An alternative way of organising such a pipeline application system is to set up a system ofpipelines placed in the ground and connected to a number of fields by hydrants. During appli-cation of slurry on the field, the spreading equipment will be connected to the various hy-drants. Provolo (2000) reported on the design of pipeline slurry transport systems and Iwars(1992) reported on some technical and economics aspects of setting up pipeline systems forslurry transport.
Farm scenarios
It will be possible to evaluate whole farm manure systems by use of the results from the indi-vidual operational studies of different application techniques. Table 5 shows the outline oftwo farm scenarios, one for a cattle production and one for a pig production. No specific cropsare identified as the evaluation concentrates on the acreage, no. of fields,, etc.
Table 5. Outline of farm scenariosScenario 1: Herd: 100 cows and 105 young stock (heavy breed), Acreage: 94 ha
Crop Area(ha)
Dosage(t/ha)
No. of fields Distance (m)
Crop 1 18.5 25 2 fields of 9.2 ha 1000Crop 2 33.4 25 4 fields of 8.4 ha 500Crop 3 29.3 35 4 fields of 9.3 ha 700Crop 4 12.8 60 2 fields of 6.4 ha 500
Scenario 2: Herd: 150 sows and 822 fattening pigs, Acreage: 150 haCrop Area
(ha)Dosage(t/ha)
No. of fields Distance (m)
Crop 1 40.5 15 4 fields of 10.1 ha 500Crop 2 55.0 20 5 fields of 11.0 ha 800Crop 3 30.5 20 3 fields of 10.2 ha 1000Crop 4 24.0 20 3 fields of 6.0 ha 500

166
The dairy farm produces 3510 m3 of slurry per year, and the pigs farm produces 2688 tonnesof slurry per year.
Operational technical evaluationThe capacity and labour requirement for different application techniques applied to the abovefarm scenarios are evaluated by use of normative operational models predicting these measu-res. (Nielsen and Sørensen, 1993; Sørensen, 1993). Table 6 presents the labour input and ca-pacities for the application techniques of tanker transport/trail hoses, tanker transport with in-jection, and pipeline transport with hoses. No operational technical evaluation of the agitationin the store and the incorporation in the field is included in the present analysis. The reasonbeing that the agitation of the slurry is similar for the different application techniques and assuch does not affect the comparability between the methods. As for the incorporation, this isassumed to be part of the normal field operations concerning sowing.
Table 6. Capacity and labour requirement for different application methodsTanker transport 1)
with trailing hosesTanker transport 2)
with injectionPipeline transport 3)
Dairy farm h/ha min/m3 Total, h h/ha min/m3 Total, h h/ha 4) min/m3 Total, h 5)
Crop 1Crop 2Crop 3Crop 4
0.410.350.520.83
0.990.830.890.83
7.611.615.210.6
0.550.490.721.17
1.331.171.241.17
10.316.321.715.0
0.33) 4)
0.330.360.48
0.660.660.550.44
9.014.314.87.8
Total time 45.0 63.3 45.9Pig farm h/ha min/m3 Total, h h/ha min/m3 Total, hCrop 1Crop 2Crop 3Crop 4
0.210.310.330.28
0.830.930.990.83
8.417.110.16.6
0.290.420.440.39
1.171.271.331.17
11.823.313.59.4
0.260.280.280.28
1.040.880.840.84
13.821.412.98.1
Total time 42.2 58.0 56.21), 2) Technical specifications as prescribed in Table 23) Technical specifications as prescribed in Table34) This time excludes time required for setting up the machine to operate in a specific field5) The total time requirement includes time for setting up the machine to operate in a specific field
Table 6 shows that there are some differences as regards the labour input and capacity for thedifferent application methods. However, it should be noted that prerequisites, like size ofpayload for the tanker systems, might change the results. The results for the pipeline transportindicate that this system is the most time saving method in the case of high dosage applicati-on, whereas the combination of a lower dosage and many fields tends to increase the labourrequirement for this system, because the time used for preparing and finishing the machineryoperation increases.

167
Conclusion
The developed calculations and models based on the operation technical studies provide away of evaluating operationally and technically for a given manure handling system. For e-xample, the current scenarios clearly indicate the significant difference in labour input andmachinery capacity for the various application methods. Also, a significant increase in the ca-pacity for the shallow injectors is observed, as compared to earlier deep slit types. An advan-tage of the models will be their flexibility to cope with numerous different farm and applicati-on scenarios.
References
Håkansson, I. & Danfors, B., 1998. The economic consequences of soil compaction by heavyvehicles when spreading manure and municipal waste. Jordbruktekniska Instituttet,Uppsala, report 96:2.
Iwars, U., 1992. Transport av flytgodsel i rorledning [Transport of slurry in pipelines], Jord-brukstekniska Instituttet, Uppsala.
Nielsen, V., Sørensen, C.G., 1993. DRIFT – A program for calculation of WORK REQUI-REMENT, WORK CAPACITY, WORK BUDGET, WORK PROFILE. National Institute ofAgricultural Engineering, Bulletin No. 53, 1993
Poulsen, H.E. & Kristensen, V.D., 1997. Standard values for farm manure – A revaluation ofthe Danish standard values concerning the nitrogen, phosphorous and potassium contentof manure. Ministry of Food, Agriculture and Fisheries, Danish Institute of AgriculturalSciences, Tjele, Denmark.
Provolo, G., Tangorra, F.M. & T. Bettati 2000. A tool to support the design of pipeline slurrytransport systems. Recycling of Agricultural, Municipal and Industrial Residues in Agri-culture, Ninth International Workshop of the Network, Gargnano, italy, 6-9 September2000.11.06
Sørensen, C.G., 1993. Slurry Versus Solid and Liquid Farmyard Manure – Primaily illustra-ted on the Basis of Operational Technical and Environmental Consequences. Bulletin No.54, National Institute of Agricultural Engineering, Dept. for Farm Management, 1994.

168
MEASUREMENT OF SOIL COMPACTION AROUNDSLURRY INJECTION SLITS
Ivar LundDanish Institute of Agricultural Sciences (DIAS). Dept. of Agricultural Engineering
Research Centre Bygholm, Horsens, DenmarkTel.: +45 7629 6000. Fax: +45 7629 6100. Email: [email protected]
Abstract
The compaction effect from slurry injectors on the soil in the slits may have a great influenceon the redistribution of injected slurry. In order to optimise the application technology, thefirst step will be to develop a compaction index.
Measurements of air permeability through soil samples taken from injection slits have beenused as a method to indicate the effect of applicators in terms of soil compaction. A test probehas been designed, and tests carried out in the laboratory as well as in the field.
Laboratory tests showed that the air permeability was influenced by soil compaction and soilmoisture level. The field tests indicated that air permeability of undisturbed soil was quite dif-ferent from the permeability of soil from injection slits produced by two different slurry in-jectors.
Key words: Air permeability through soil, slurry infiltration, slurry injection.
Introduction
Conditions favourable for transportation of air, water and nutrients in the topsoil are essentialfor growing crops on farmland. In connection with slurry application on fields it is importantthat the nutrients in the slurry can be redistributed in the soil. This will happen in the liquidphase, partly by convective transport of the liquid fraction of slurry. Several factors will influ-ence the transport of nutrients, e.g., the slurry type, the physical properties of the slurry, andthe type, moisture level and compaction of the soil.
Ammonia emissions due to slurry application can be largely eliminated by way of direct in-jection provided the injection slit is properly closed afterwards, but this is not always the caseRedistribution of the slurry liquid fraction is also important, but direct injection may lead tocompaction and smearing of the soil around the injection slit and thereby cause reductions inthe transport velocity of liquid in the direction away from injection zone.

169
If a method for measurement of soil compaction, or infiltration potential, can be developed, itshould be easier to predict other relevant parameters in connection with slurry injection, e.g.the nutrient availability for the crops, and maybe also to estimate the ammonia emission.
This paper deals with the development of a method designed for measurement of soil com-paction around slurry injection slits and the influence of the compaction on the transport ofliquid.
Materials and methods
Theoretical methodTransport of air and liquid in the soil will mainly take place by means of diffusion, but it isalso possible to produce a mass flow by means of pressure differences. In this paper the po-tential transport of air and liquid in the soil will be referred to as the permeability for the ac-tual soil type.
The flow of liquid through a porous material is described by Darcy as follows:
where v is the mean velocity of the flow through the material, K is the permeability for thespecific material, is the dynamic viscosity of the liquid/air, and p is the pressure gradient.
This equation is only valid under isothermal conditions and at laminar flow. The equation canbe used both for liquid flow and for air flow.
The pressure gradient is defined as the pressure difference per unit length,
where p is the pressure difference and l is the height of the tested soil sample.The total air/liquid flow through a material with the cross-sectional area A in the time intervalt can be expressed by the following equation:
tAvQ ××=
pKv ×=η
lpp ∆=
(1)
(2)
(3)

170
The model for air permeability which will be used in this paper is based on Equations 1, 2 and3 and was presented as follows by P. Schønning (1986):
It is assumed that there is a good correlation between the permeability of air and liquid, andtherefore the measurements described below are based on the permeability of air in the soil.
Test method in the fieldSoil samples to measure soil compaction around the slurry injection slit are taken by use of atest probe as illustrated in Figures 1 and 2 The test sample is taken at the lower end of the slit,since this is where the liquid or the slurry is supposed to infiltrate in the soil.
Figure 1. Position of test sample in slurry injection slit.
The test probe is cylindrical, with a cross-sectional area of 700 mm2 and a length of 50 mm.The test is made for the entire volume of the soil, and no pressure gradient across the length ofthe sample is taken into account.
The test probe with the soil sample is afterwards placed in a test rig, where air is forcedthrough the sample. The air flow through the test sample and the corresponding pressure dif-ference are measured.
Figure 2. Test probe with soil sample.
The results from measurements of air permeability have been validated through direct meas-urements of liquid infiltration in the injection slit under field conditions
Air flowAir flow
ptAlQK
∆××××= η
(4)
Position of
test probe
Soil surface Soil surface
Injection slit

171
Soil types
The method for measuring compaction by the permeability of air has been used for two simi-lar soils, see Table 1. The measurement were made in the laboratory by using soil A, and inthe field by using soil B.
Table 1. Texture classes, % of dried soil in different classesSoil No. Soil
moisture%
Clay
< 2 µm
Silt
2-20 µm
Coarse silt
20-63 µm
Fine sand
63-200 µm
Coarse sand
200-2000 µmA 11.9-15.7 12.7 14.9 10.7 30.7 28.1B 11 8.1 13.0 11.9 31.5 32.3
ResultsLaboratory testSoil samples from the field were collected and brought to the laboratory (soil A in Table 1).The soil was dried for different lengths of time to obtain different moisture classes for the test.
The soil samples were compacted to two different degrees in 5,6 litres boxes with a surfacearea of 0,043 m2, and permeability tests were made. Figure 3 shows results from a number oftests with soil A at 15,7% soil moisture. It is seen that the method distinguished between thedifferent compactions, or pressure degrees. At a compression pressure of 6.5 kPa at the sur-face area in the boxes the mean value of the permeability index was 145 (S.D. 40), whereas itwas 47 (S.D. 21) at a compression pressure of 20 kPa.
Figure 3. Permeability, K (µµµµm2), at different degrees of compression of the soil sample.
0
5 0
1 0 0
1 5 0
2 0 0
2 5 0
6 , 5 k P a 2 0 k P a
Perm
eabi
lity,
K

172
The influence of different moisture contents of the soil was also tested. Results from a seriesof tests with soil moisture at 15.7 and 11.9%, respectively, and a head pressure of 20 kPa isshown in Figure 4.
The mean value of the permeability index at a humidity of 15.7% was 47 (S.D. 22) and at ahumidity of 11,9% it was 99 (S.D. 65). Although not statistically significant due to soil het-erogeneity, this experiment indicates that the largest moisture content in the soil will also havethe lowest permeability. The reason is probably that a greater part of the volume in which theair/liquid could be transported will now be filled with water.
Figure 4. Permeability, K (µm2), at different soil humidities.
Field test with different slurry injectorsA field test with different slurry injectors was made. The test includes results from 10 indi-vidual measurements with each of two different injector principles, as shown in Figure 5. Thefirst one is a double disc injector, where the two discs are angled as a V. The second one is atraditional harrow tine injector. These permeability results are compared with a reference,where no machinery has disturbed the soil. In that way it will be possible to evaluate the rela-tive effect of the different injectors. The results show the greatest variability with soil fromthe reference test, while the two different injectors had no cases of high air permeability in thesoil. The mean value from the reference test was 18 (S.D. 18), from the V-disc it was 8(S.D. 4), and from the harrow tine injector it was 5 (S.D. 2).
0
5 0
1 0 0
1 5 0
2 0 0
2 5 0
3 0 0
2 0 k P a1 5 , 7 % h u m i d i t y
2 0 k P a1 1 , 9 % h u m i d i t y
Perm
eabi
lity,
K

173
The difference between the two injectors was too small to suggest any significant differencein the infiltration of slurry liquid, as had been indicated by special field tests.
Figure 5. Permeability, K (µµµµm2), from different slurry injectors.
Conclusion
Development of a method for measuring compaction around slurry injection slits appears tobe possible by measuring the permeability of air with a specially designed test prope. Thelaboratory test shows that air permeability was influenced by soil compaction and soil mois-ture.
The field measurements show that slurry injectors can greatly influence on soil permeabilityaround injection slits.
References
Schjønning, P., 1986. Jordens permeabilitet for luft og vand i relation til jordtype samt ned-muldning og afbrænding af halm (Soil permeability for air and water as influenced by soiltype and incorporation of straw). Danish Institute of Plant and Soil Sciences, ReportNo. 1849, In: Plant Breeding No. 90, 227-239.
0
5
10
15
20
25
30
35
40
45
50
Reference V-Discs Harrow tine
Perm
eabi
lity,
K

174
AMMONIA VOLATILIZATION FROM MANUREAPPLIED TO FIELDS – DATA COLLATION FOR ANEU DATABASE AND ITS STATISTICAL ANALYSIS
1Søgaard, H.T., 1Sommer, S.G., 2Hutchings, N.J.,3Huijsman J., 4Bussink, W. & 5Nickelson, F.
1 Department of Agricultural Engineering, Danish Institute of Agricultural Sciences (DIAS)Research Centre Bygholm, P.O. Box 536, DK-8700 Horsens, Denmark.
2 Department of Agricultural Systems, Danish Institute of Agricultural Sciences, ResearchCentre Foulum, P.O. Box 50, DK-8830 Tjele, Denmark.
3 Institute of Agricultural and Environmental Engineering (IMAG-DLO), P.O. Box 43NL-6700 AA Wageningen, The Netherlands.
4Nutrient Management Institute, Runderweg 6, NL-8219 PK, Lelystad, The Netherlands5 ADAS Gleadthorpe, Meden Vale, Mansfield, Notts, NG20 9PF, UK.
IntroductionThe volatilization of ammonia from field-spread animal manure represents a major source ofatmospheric pollution and leads to a significant reduction in the fertilizer value of the manure(Jarvis and Pain, 1990). Concern at the impact of atmospheric ammonia forms the backgroundto ongoing international negotiations for reduction of national ammonia emissions (ECETOC,1994). In addition, legislation restricting the application of nitrogen in animal manure, both atan EU level (Nitrate Directive) and at a national level (Burton & Martinez, 1996, compilationof articles in Ingénieries), will make it increasingly important for the farmers to make an op-timal use of manure nitrogen.
Many studies have been made of ammonia loss from field applied manure, particularly slurry.The full value of the investment in this research can only be realised if the knowledge gainedis communicated effectively to farmers, advisors and legislators. Ammonia volatilization fromfield applied manures is affected by a wide range of factors, e.g. application technique, diffe-rences in manure composition, crops/no crops, climate and soil conditions (Sommer & Ole-sen, 1991, 2000, Bussink et al, 1994, Brachkat et al, 1997). Ammonia volatilization studiesare labour demanding and expensive, so the studies typically involve relatively few experi-ments, each designed to examine one or two of the contributory factors. In contrast, the usersof the collected information will often need to consider ammonia volatilization within a widerange of climatic, soil and agronomic situations, even if they only operate within a single re-gion. Alone, the individual studies in the nations of Europe do not provide an adequate basisfor informing the users.
In a European concerted action project entitled Ammonia Losses from Field-applied Manure(ALFAM), data from studies carried out by a number of European institutes have been colla-

175
ted in a single database. The database will provide a basis for a more complete description ofthe factors determining NH3 losses than is possible with the results from national research.This database will be useful both for developing mechanistic models, designed to encapsulatethe state of knowledge concerning ammonia losses from field-spread manure, and in the con-struction of decision support systems (DSS).
This paper gives a brief description of the database. An analysis of the loss pattern in relation tomeasurement technique and manure types is presented, and some of the models linking ammoniavolatilization to climate data are tested.
MethodsData collationFor the construction of an ammonia emission model, existing knowledge was used to identifythe range of factors affecting ammonia volatilisation. The variables included were time, thetechnique used to measure volatilization of NH3 plus a range of climate, soil, manure andagronomic factors. Data were entered into a standardised Microsoft Excel spreadsheet andsubsequently sent to the project co-ordinator. Here, the data were checked for obvious errorsand then combined into a master spreadsheet. The data were then transferred from this spre-adsheet to a Microsoft Access database.
DatabaseThe database contains data provided by six European countries (Table 1). The data derivefrom about 800 separate experiments, and a total of almost 6000 records are stored. The data-base was uploaded to a www server (www.alfam.dk). The web site was configured to permitanyone to search the database for datasets fulfilling certain criteria (e.g. manure type, applica-tion technique) and to display a summary of the data held. This information includes indicati-ons of where the data have been published, the objective of the study and the owners of thedataset and their address. The latter information is provided to enable users who are not partof the project can contact the relevant owner of the data. After having logged in the projectparticipants will have the additional facility to download all or some of the actual data.
Each measurement of volatilization has been formatted as one record, giving information ofrate of volatilization, climate, soil condition, etc., during the measuring period. The data maytherefore be transferred to statistical analysis programs like SAS or SPSS without problems.Since the different studies have had different objectives, variables are missing in a number ofthe records in the database.

176
Statistical analysisThe data was analysed by fitting a model to the loss rates of ammonia volatilization. The mo-del used is based on the Michaelis-Menten-type equation presented by Sommer & Ersbøll(1994):
mKttNtN
+= max)( (1)
This model describes the cumulated NH3 volatilisation, N(t) (NH3 lost as fraction of appliedTAN), over time, t, beginning from the start of experiment:
manure)N/kg(gmanureincontentTANmanure/ha)(trateManureN/ha)(kgtimeatlossNHCumulated)( 3
×= ttN (2)
The model parameter Nmax is the total loss of NH3 (fraction of TAN applied) as time approa-ches infinity, and the parameter Km (h) is the time t satisfying N(t) = ½ Nmax (Fig. 1).
Sommer & Ersbøll (1994) fitted this model directly to cumulated loss data. However, to mi-nimize the serial correlation between successive measurement and thereby achieving a morereliable statistical analysis, it will be better to model loss rates rather than cumulated loss.Another advantage of the former approach is that missing loss rate observations during theexperiment can better be accepted here than for the latter approach. The reason is that onemissing loss rate observation will prevent any calculation of subsequent cumulated loss va-lues. However, to perform loss rate modelling it will be necessary to reformulate the model inEq. (1).
Loss rates will normally be recorded as mean rates over finite time periods. Assume that theNH3 loss has been measured over the time period from t to t + ∆t. Then the mean loss rateover this time period can be expressed as:
tKttN
KttttN
ttNttNttN mm
∆+
−+∆+∆+
=∆
−∆+=∆maxmax
rate)()(),(
or
))((),( maxrate
mm
m
KttKtKNttN
+∆++=∆ (3)
The model in Eq. (3) has been used for the analysis of NH3 loss rates as a function of time.Since the loss pattern over time will depend on climate, manure composition, soil conditions,

177
application method, etc., the parameters, Nmax and Km, has been modelled as functions of suchexplanatory variables. Sommer & Ersbøll (1994) applied linear (additive) functions of thefollowing form:
mm xaxaaN ′++′+′= �110max (4)
mmm xbxbbK ′++′+′= �110 (5)
where a'0, …, a'm and b'0, …, b'm are model parameters to be estimated by statistical analysis,and x1, …, xm are the explanatory variables.
Since Nmax and Km should only take non-negative values, while the expressions in Equations(4) and (5) can take any real values, the following relationships may be more appropriate:
)exp( 110max mm xaxaaN +++= � (6)
)exp( 110 mmm xbxbbK +++= � (7)
where a0, …, am and b0, …, bm are model parameters to be estimated. By rewriting these ex-pressions it can be seen that Equations (6) and (7) correspond to multiplicative relationshipswith the exponentials of the explanatory variables as factors:
mieAAAAN im ai
xm
x ,,0,where,110max �� ==×××= (8)
mieBBBBK im bi
xm
xm ,,0,where,1
10 �� ==×××= (9)
The explanatory variables selected for the model analysis are listed in Table 2 (m = 15). Mostof the variables are so-called indicator variables, which can only take values zero and one.These variables have been introduced in order to represent different states of categorical fac-tors (e.g. application method).
The ammonia loss model in Eq. (3) has been analysed with both additive and multiplicativemodels for Nmax and Km (Eqs. (4-5) and (6-7), respectively). In both cases a power transfor-mation has been introduced as follows in Eq. (3) to ensure that the residuals will be approxi-mately Gaussian distributed:
[ ]λ
λ ���
�
+∆++=∆
))((),( maxrate
mm
m
KttKtKNttN (10)
The value of the exponent, λ, has been chosen to give the best approximation to a Gaussiandistribution. The reason why both sides of the equation have been raised to the power of λ isthat this will ensure that the original interpretations of Nmax and Km are still valid.
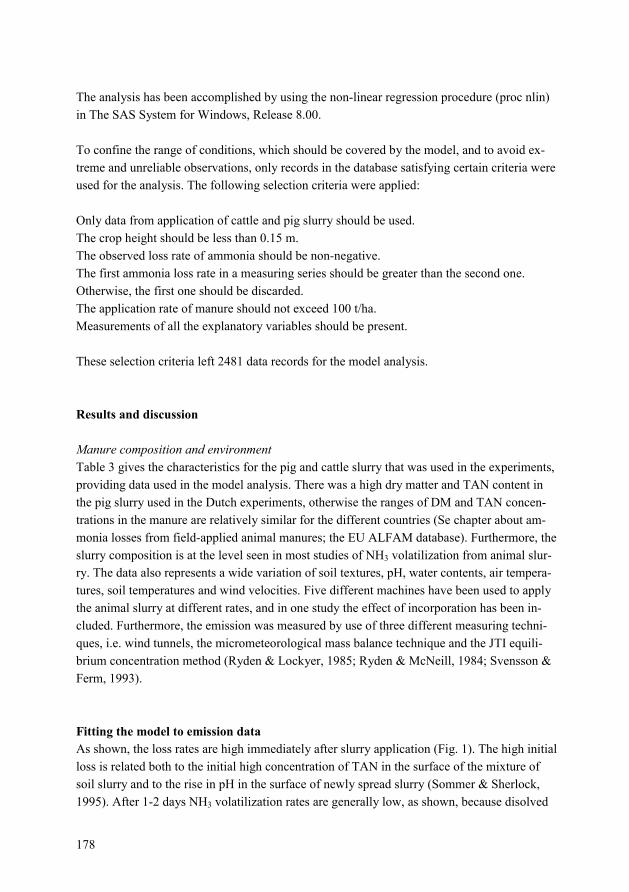
178
The analysis has been accomplished by using the non-linear regression procedure (proc nlin)in The SAS System for Windows, Release 8.00.
To confine the range of conditions, which should be covered by the model, and to avoid ex-treme and unreliable observations, only records in the database satisfying certain criteria wereused for the analysis. The following selection criteria were applied:
Only data from application of cattle and pig slurry should be used.The crop height should be less than 0.15 m.The observed loss rate of ammonia should be non-negative.The first ammonia loss rate in a measuring series should be greater than the second one.Otherwise, the first one should be discarded.The application rate of manure should not exceed 100 t/ha.Measurements of all the explanatory variables should be present.
These selection criteria left 2481 data records for the model analysis.
Results and discussion
Manure composition and environmentTable 3 gives the characteristics for the pig and cattle slurry that was used in the experiments,providing data used in the model analysis. There was a high dry matter and TAN content inthe pig slurry used in the Dutch experiments, otherwise the ranges of DM and TAN concen-trations in the manure are relatively similar for the different countries (Se chapter about am-monia losses from field-applied animal manures; the EU ALFAM database). Furthermore, theslurry composition is at the level seen in most studies of NH3 volatilization from animal slur-ry. The data also represents a wide variation of soil textures, pH, water contents, air tempera-tures, soil temperatures and wind velocities. Five different machines have been used to applythe animal slurry at different rates, and in one study the effect of incorporation has been in-cluded. Furthermore, the emission was measured by use of three different measuring techni-ques, i.e. wind tunnels, the micrometeorological mass balance technique and the JTI equili-brium concentration method (Ryden & Lockyer, 1985; Ryden & McNeill, 1984; Svensson &Ferm, 1993).
Fitting the model to emission dataAs shown, the loss rates are high immediately after slurry application (Fig. 1). The high initialloss is related both to the initial high concentration of TAN in the surface of the mixture ofsoil slurry and to the rise in pH in the surface of newly spread slurry (Sommer & Sherlock,1995). After 1-2 days NH3 volatilization rates are generally low, as shown, because disolved

179
TAN in soil surface will decrease rapidly due to volatilization, infiltration and nitrification(Molen et al., 1990), with daily variations showing peaks during the day, because of increasesin temperature (Bless et al., 1991; Brunke et al., 1988). In most studies cumulated NH3 vola-tilization has reached 50% of its maximum within the first 4-12 h after slurry application withsplash plate (Pain et al., 1989, Moal et al., 1995).
The model with multiplicative submodels for Nmax and Km has turned out to yield a better fitthan the one with additive submodels (R2 values of 0.80 and 0.77, respectively). This resulttogether with the non-negativity constraints for Nmax and Km suggest that the multiplicativeapproach should be chosen rather than the additive one. Consequently, only results from theformer approach are presented below.
The estimates of the A and B parameters appear from Table 4. Notice that five parameterswith very low statistical significance levels (P > 0.4) have been fixed at 1. This has been doneto minimise the variance that will occur when using the model for prediction of NH3 loss forsituations (values of the explanatory variables) not covered by the data set used for modelling.
From the parameter estimates, Nmax and Km are estimated by use of Equations (8) and (9).However, one may also attribute a direct interpretation to each individual parameter value inthe table. As an example the total NH3 volatilisation (Nmax) from wet soil has been estimatedto be about 10% higher than from dry soil, i.e. the multiplicative factor is 1.102.
Notice that one should be careful when interpreting the A6 and A12 parameters. They are bothless than 1, indicating that the total NH3 volatilisation, Nmax, will decreases if the TAN contentof the slurry increases or if the manure rate is increased. However, since the total NH3 volati-lisation is defined as a fraction of TAN applied, cf. Eq. (2), it can be verified that the actualamount of lost NH3 in g N/ha will increase when the TAN content or the manure rate is incre-ased (provided that the TAN content is less than -(ln A6)-1 = 5.3 g N/kg and the manure rate isless than -(ln A12)-1 = 231 t/ha).
Effect of slurry composition and environment on Nmax
The cumulated ammonia loss (Nmax) is shown to increase with air temperature and wind speed(A3 and A3 > 1 in Table 4). The analysis confirms the results from studies showing that NH3
volatilization during the initial 4-6 h increases with increasing air temperatures or incidentsolar radiation (Brunke et al., 1988, Moal et al., 1995 and Braschkat et al., 1997; Sommer etal., 1997). The increase with incident global radiation is due to the requirement of energy forthe endothermic volatilization process to take place. Accumulated NH3 volatilization during7 days from slurry applied with splash plates to crops has been shown to be related to windspeed (Sommer et al., 1997). The effect of wind speed has not been found in all studies (Be-auchamp et al., 1978; Bussink et al., 1994), probably because wind speed normally will be sohigh that the gas phase resistance is negligible.
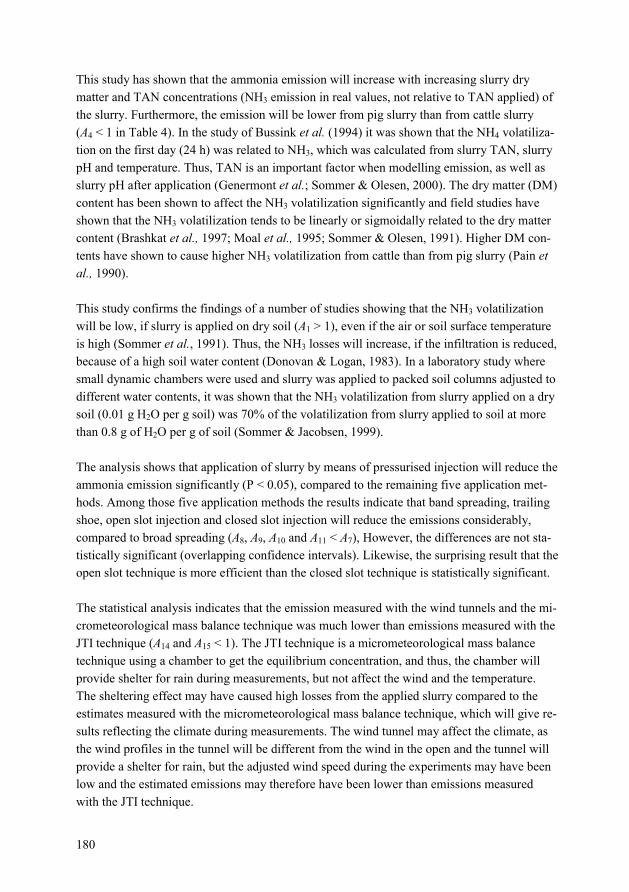
180
This study has shown that the ammonia emission will increase with increasing slurry drymatter and TAN concentrations (NH3 emission in real values, not relative to TAN applied) ofthe slurry. Furthermore, the emission will be lower from pig slurry than from cattle slurry(A4 < 1 in Table 4). In the study of Bussink et al. (1994) it was shown that the NH4 volatiliza-tion on the first day (24 h) was related to NH3, which was calculated from slurry TAN, slurrypH and temperature. Thus, TAN is an important factor when modelling emission, as well asslurry pH after application (Genermont et al.; Sommer & Olesen, 2000). The dry matter (DM)content has been shown to affect the NH3 volatilization significantly and field studies haveshown that the NH3 volatilization tends to be linearly or sigmoidally related to the dry mattercontent (Brashkat et al., 1997; Moal et al., 1995; Sommer & Olesen, 1991). Higher DM con-tents have shown to cause higher NH3 volatilization from cattle than from pig slurry (Pain etal., 1990).
This study confirms the findings of a number of studies showing that the NH3 volatilizationwill be low, if slurry is applied on dry soil (A1 > 1), even if the air or soil surface temperatureis high (Sommer et al., 1991). Thus, the NH3 losses will increase, if the infiltration is reduced,because of a high soil water content (Donovan & Logan, 1983). In a laboratory study wheresmall dynamic chambers were used and slurry was applied to packed soil columns adjusted todifferent water contents, it was shown that the NH3 volatilization from slurry applied on a drysoil (0.01 g H2O per g soil) was 70% of the volatilization from slurry applied to soil at morethan 0.8 g of H2O per g of soil (Sommer & Jacobsen, 1999).
The analysis shows that application of slurry by means of pressurised injection will reduce theammonia emission significantly (P < 0.05), compared to the remaining five application met-hods. Among those five application methods the results indicate that band spreading, trailingshoe, open slot injection and closed slot injection will reduce the emissions considerably,compared to broad spreading (A8, A9, A10 and A11 < A7), However, the differences are not sta-tistically significant (overlapping confidence intervals). Likewise, the surprising result that theopen slot technique is more efficient than the closed slot technique is statistically significant.
The statistical analysis indicates that the emission measured with the wind tunnels and the mi-crometeorological mass balance technique was much lower than emissions measured with theJTI technique (A14 and A15 < 1). The JTI technique is a micrometeorological mass balancetechnique using a chamber to get the equilibrium concentration, and thus, the chamber willprovide shelter for rain during measurements, but not affect the wind and the temperature.The sheltering effect may have caused high losses from the applied slurry compared to theestimates measured with the micrometeorological mass balance technique, which will give re-sults reflecting the climate during measurements. The wind tunnel may affect the climate, asthe wind profiles in the tunnel will be different from the wind in the open and the tunnel willprovide a shelter for rain, but the adjusted wind speed during the experiments may have beenlow and the estimated emissions may therefore have been lower than emissions measuredwith the JTI technique.
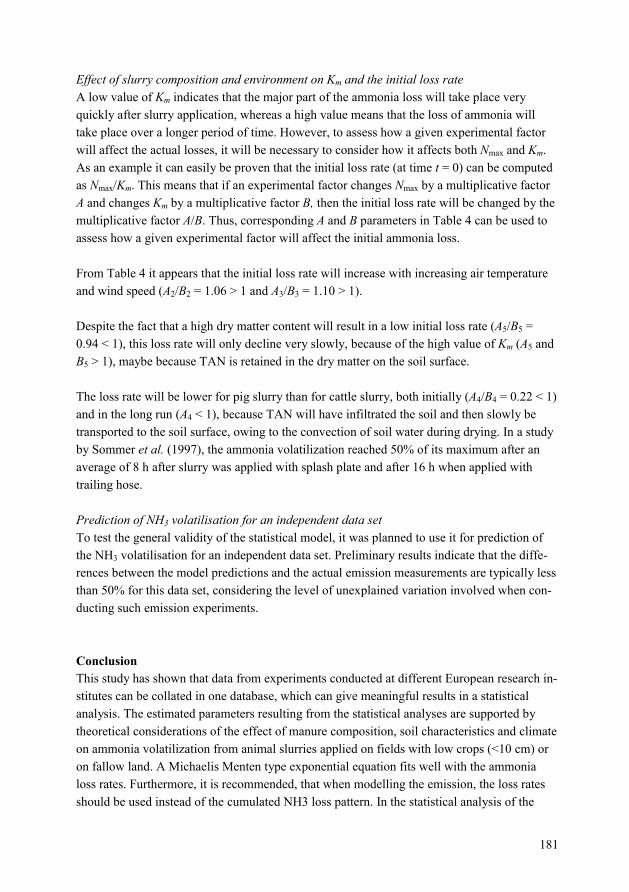
181
Effect of slurry composition and environment on Km and the initial loss rateA low value of Km indicates that the major part of the ammonia loss will take place veryquickly after slurry application, whereas a high value means that the loss of ammonia willtake place over a longer period of time. However, to assess how a given experimental factorwill affect the actual losses, it will be necessary to consider how it affects both Nmax and Km.As an example it can easily be proven that the initial loss rate (at time t = 0) can be computedas Nmax/Km. This means that if an experimental factor changes Nmax by a multiplicative factorA and changes Km by a multiplicative factor B, then the initial loss rate will be changed by themultiplicative factor A/B. Thus, corresponding A and B parameters in Table 4 can be used toassess how a given experimental factor will affect the initial ammonia loss.
From Table 4 it appears that the initial loss rate will increase with increasing air temperatureand wind speed (A2/B2 = 1.06 > 1 and A3/B3 = 1.10 > 1).
Despite the fact that a high dry matter content will result in a low initial loss rate (A5/B5 =0.94 < 1), this loss rate will only decline very slowly, because of the high value of Km (A5 andB5 > 1), maybe because TAN is retained in the dry matter on the soil surface.
The loss rate will be lower for pig slurry than for cattle slurry, both initially (A4/B4 = 0.22 < 1)and in the long run (A4 < 1), because TAN will have infiltrated the soil and then slowly betransported to the soil surface, owing to the convection of soil water during drying. In a studyby Sommer et al. (1997), the ammonia volatilization reached 50% of its maximum after anaverage of 8 h after slurry was applied with splash plate and after 16 h when applied withtrailing hose.
Prediction of NH3 volatilisation for an independent data setTo test the general validity of the statistical model, it was planned to use it for prediction ofthe NH3 volatilisation for an independent data set. Preliminary results indicate that the diffe-rences between the model predictions and the actual emission measurements are typically lessthan 50% for this data set, considering the level of unexplained variation involved when con-ducting such emission experiments.
ConclusionThis study has shown that data from experiments conducted at different European research in-stitutes can be collated in one database, which can give meaningful results in a statisticalanalysis. The estimated parameters resulting from the statistical analyses are supported bytheoretical considerations of the effect of manure composition, soil characteristics and climateon ammonia volatilization from animal slurries applied on fields with low crops (<10 cm) oron fallow land. A Michaelis Menten type exponential equation fits well with the ammonialoss rates. Furthermore, it is recommended, that when modelling the emission, the loss ratesshould be used instead of the cumulated NH3 loss pattern. In the statistical analysis of the

182
NH3 volatilization a multiplicative model was used instead of an additive to obtain a morecorrect data analysis.
ReferencesBeauchamp, E.G., Kidd, G.E., Thurtell, B., 1978. Ammonia volatilization from sewage slud-
ge applied in the field. Journal of Environmental Quality 7: 141-146.Bless, H.G., Beinhauer, R., Sattelmacher, B., 1991. Ammonia emission from slurry applied to
wheat stubble and rape in North Germany. Journal of Agricultural Science, Cambridge117: 225-231.
Braschkat, J., Mannheim, T. & Marschner, H., 1997. Estimation of ammonia losses after ap-plication of liquid cattle manure on grassland. Zeitschrift für Pflanzenernährung und Bo-denkunde: 160, 117-123.
Brunke, R., Alvo, P., Schuepp, P. & Gordon R., 1988. Effect of meteorological parameters onammonia loss from manure in the field. Journal of Environmental Quality 17: 431-436.
Burton, C.H. & Martinez, J. (Eds.), 1996. Animal manures and environments in Europe. In-génieries: Eau-agriculture-territoires. Special Issue, 100 pp.
Bussink, D.W., Huijsmans, J.F.M. & Ketelaars, J.J.M.H., 1994. Ammonia volatilization fromnitric-acid-treated cattle slurry surface applied to grassland. Netherland Journal of Agri-cultural Science 42: 293-309.
Donovan, W.C. & Logan, T.J., 1983. Factors affecting ammonia volatilization from sewagesludge applied to soil in a laboratory study. Journal of Environmental Quality 12: 584-590.
ECETOC., 1994. Ammonia emissions to air in Western Europe, Technical Report No. 62.European Centre for Ecotoxicology and Toxicology of Chemicals. Brussels, Belgium: 196.
Jarvis, S.C. & Pain, B.F., 1990. Ammonia volatilization from agricultural land. ProceedingsFertility Soc. No. 298. Greenhill House, Peterborough, England. 35 pp.
Moal, J.F., Martinez, J., Guiziou, F. & Coste, C.M., 1995. Ammonia volatilization followingsurface-applied pig and cattle slurry in France. Journal of Agricultural Science Cambridge125: 245-252.
Molen, J. van der, Beiljaars, A.C., Chardon, W.J., Jury, W.A. & Faassen, H.G. van., 1990.NH3 volatilization from arable land after application of cattle slurry. 2. Derivation of atransfer model. Netherland Journal of Agricultural Science 38: 239-254.
Pain, B.F., R.B. Thompson, Y.J. Rees & J.H. Skinner., 1990. Reducing gaseous losses of ni-trogen from cattle slurry applied to grassland by the use of additives. J. Sci. Food Agric.50: 141-153.
Pain, B.F., V.R. Phillips, C.R. Clarkson & J.V. Klarenbeek., 1989. Loss of nitrogen throughNH3 volatilisation during and following application of pig or cattle slurry to grassland.Journal of the Science of Food and Agriculture 47: 1-12.
Ryden, J.C. & McNeill J.E., 1984. Application of the micrometeorological mass balance met-hod to the determination of ammonia loss from a grazed sward. J. Sci. Food Agric. 35:1297-1310.

183
Ryden, J.C. & Lockyer, D.R., 1985. Evaluation of a system of wind tunnels for field studiesof ammonia loss from grassland through volatilisation. Journal of the Science of Food andAgriculture, 36, 781-788.
Sommer, S.G., Olesen, J.E. & Christensen, B.T., 1991. Effects of temperature, wind speedand air humidity on NH3 volatilization from surface applied cattle slurry. Journal of Agri-cultural Science, Cambridge 117: 91-100.
Sommer, S.G. & Ersbøll, S.K., 1994. Soil tillage effects on ammonia volatilization from sur-face-applied or injected animal slurry. Journal of Environmental Quality 23: 493-498.
Sommer, S.G. & Jacobsen, O.H., 1999. Infiltration of slurry liquid and volatilization of am-monia from surface applied pig slurry as affected by soil water content. Journal of agri-cultural science, Cambridge, 132: 297-303.
Sommer, S.G. & Olesen, J.E., 2000. Modelling ammonia volatilization from animal slurry trai-ling hose applied to cereals. Atmos. Environ. 34: 2361-2372.
Sommer, S.G. & Olesen, J.E., 1991. Effect of dry matter content and temperature on NH3 lossfrom surface-applied cattle slurry. Journal of Environmental Quality 20: 679-683.
Sommer, S.G. & Sherlock, R.R., 1996. pH and buffer component dynamics in the surface lay-ers of animal slurries. Journal of Agricultural Science, Cambridge 127: 109-116.
Sommer, S.G., Friis, E., Bak, A.B. & Schjørring, J.K., 1997. Ammonia volatilization from pigslurry applied with trailing hoses or broadspread to winter wheat: Effects of crop develop-mental stage, microclimate, and leaf ammonia absorption. Journal of Environmental Qua-lity, 26: 1153-1160.
Svensson, L. & Ferm, M., 1993. Mass transfer coefficient and equilibrium concentration askey factors in a new approach to estimate ammonia emission from livestock manure. J.Agric. Engng. Res. 56: 1-11.

184
Figure 1. Ammonia loss rate in relation to time after application of animal slurry (abo-ve) and the cumulated volatilization (below).
Loss rate
Time, t
Cumulated volatilization, N
Time, t
N = Nmax
N = ½Nmax
t = Km
Mean loss rate = slope
184
Figure 1. Ammonia loss rate in relation to time after application of animal slurry (abo-ve) and the cumulated volatilization (below).
Loss rate
Time, t
Cumulated volatilization, N
Time, t
N = Nmax
N = ½Nmax
t = Km
Mean loss rate = slope
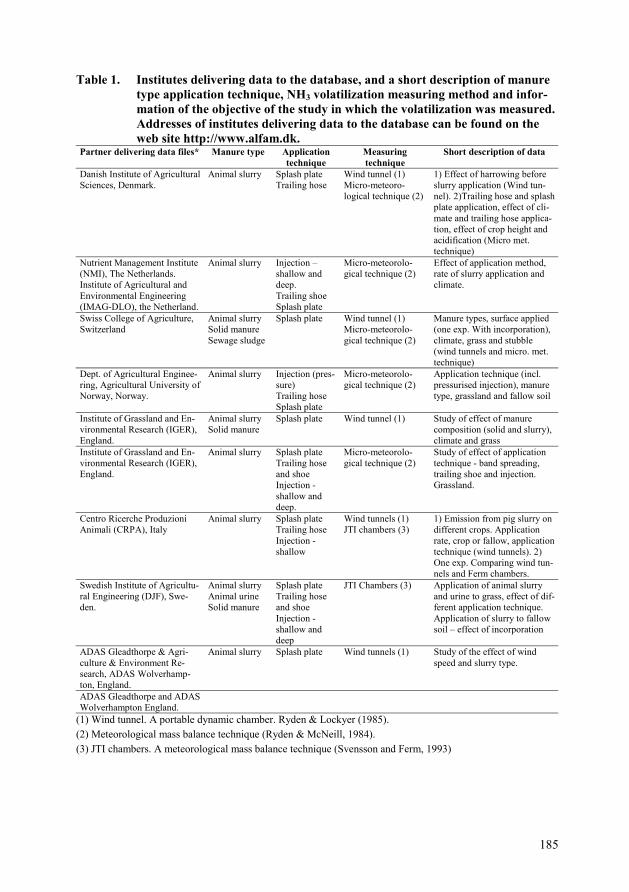
185
Table 1. Institutes delivering data to the database, and a short description of manuretype application technique, NH3 volatilization measuring method and infor-mation of the objective of the study in which the volatilization was measured.Addresses of institutes delivering data to the database can be found on theweb site http://www.alfam.dk.
Partner delivering data files* Manure type Applicationtechnique
Measuringtechnique
Short description of data
Danish Institute of AgriculturalSciences, Denmark.
Animal slurry Splash plateTrailing hose
Wind tunnel (1)Micro-meteoro-logical technique (2)
1) Effect of harrowing beforeslurry application (Wind tun-nel). 2)Trailing hose and splashplate application, effect of cli-mate and trailing hose applica-tion, effect of crop height andacidification (Micro met.technique)
Nutrient Management Institute(NMI), The Netherlands.Institute of Agricultural andEnvironmental Engineering(IMAG-DLO), the Netherland.
Animal slurry Injection –shallow anddeep.Trailing shoeSplash plate
Micro-meteorolo-gical technique (2)
Effect of application method,rate of slurry application andclimate.
Swiss College of Agriculture,Switzerland
Animal slurrySolid manureSewage sludge
Splash plate Wind tunnel (1)Micro-meteorolo-gical technique (2)
Manure types, surface applied(one exp. With incorporation),climate, grass and stubble(wind tunnels and micro. met.technique)
Dept. of Agricultural Enginee-ring, Agricultural University ofNorway, Norway.
Animal slurry Injection (pres-sure)Trailing hoseSplash plate
Micro-meteorolo-gical technique (2)
Application technique (incl.pressurised injection), manuretype, grassland and fallow soil
Institute of Grassland and En-vironmental Research (IGER),England.
Animal slurrySolid manure
Splash plate Wind tunnel (1) Study of effect of manurecomposition (solid and slurry),climate and grass
Institute of Grassland and En-vironmental Research (IGER),England.
Animal slurry Splash plateTrailing hoseand shoeInjection -shallow anddeep.
Micro-meteorolo-gical technique (2)
Study of effect of applicationtechnique - band spreading,trailing shoe and injection.Grassland.
Centro Ricerche ProduzioniAnimali (CRPA), Italy
Animal slurry Splash plateTrailing hoseInjection -shallow
Wind tunnels (1)JTI chambers (3)
1) Emission from pig slurry ondifferent crops. Applicationrate, crop or fallow, applicationtechnique (wind tunnels). 2)One exp. Comparing wind tun-nels and Ferm chambers.
Swedish Institute of Agricultu-ral Engineering (DJF), Swe-den.
Animal slurryAnimal urineSolid manure
Splash plateTrailing hoseand shoeInjection -shallow anddeep
JTI Chambers (3) Application of animal slurryand urine to grass, effect of dif-ferent application technique.Application of slurry to fallowsoil – effect of incorporation
ADAS Gleadthorpe & Agri-culture & Environment Re-search, ADAS Wolverhamp-ton, England.
Animal slurry Splash plate Wind tunnels (1) Study of the effect of windspeed and slurry type.
ADAS Gleadthorpe and ADASWolverhampton England.
(1) Wind tunnel. A portable dynamic chamber. Ryden & Lockyer (1985).(2) Meteorological mass balance technique (Ryden & McNeill, 1984).(3) JTI chambers. A meteorological mass balance technique (Svensson and Ferm, 1993)

186
Table 2. Explanatory variables used for modelling the NH3 volatilisation.Explanatoryvariable(s)
CommentExperimental factor
Sym-bol
Range
Moisture content of soil x1 [0, 1] x1 = 1 if wet soil; x1 = 0 if dry soil.Air temperature x2 [–5.6,
36.0]Unit: °C.
Wind speed x3 [0.0, 9.0] Unit: m/s.Manure type x4 [0, 1] x4 = 1 if pig slurry; x4 = 0 if cattle slurry (only pig
and cattle slurry have been included in the analy-sis).
Dry matter content of manure x5 [0.8, 11.0] Unit: %.TAN content of manure x6 [0.2, 4.0] Unit: g N/kg.Application method x7
x8
x9
x10
x11
[0, 1][0, 1][0, 1][0, 1][0, 1]
x7 = 1 if broad spread; x7 = 0 otherwise.x8 = 1 if band spread/trailing hose; x8 = 0 otherwi-se.x9 = 1 if trailing shoe; x9 = 0 otherwise.x10 = 1 if open slot; x10 = 0 otherwise.x11 = 1 if closed slot; x11 = 0 otherwise.(The last application method "pressurised injecti-on" will be represented by the variable constella-tion x7 = x8 = x9 = x10 = x11 = 0.)
Application rate of manure x12 [9.6, 99.3] Unit: t/ha or m3/ha.Manure incorporation x13 [0, 1] x13 = 1 if no incorporation; x13 = 0 if shallow cul-
tivation.Technique for NH3 loss measuring x14
x15
[0, 1][0, 1]
x14 = 1 if wind tunnel; x14 = 0 otherwise.x15 = 1 if micro met; x15 = 0 otherwise.(The last measuring technique "Lennart boxes(dynamic chambers)" will be represented by thevariable constellation x14 = x15 = 0.)

187
Table 3. Averages of pH, dry matter percentage, N total and TAN for the slurry dataused for model analysis. Standard deviations and numbers of observationsare given in parenthesis as (standard deviation; number of observations).
Slurry type pH DM, % N Total, g N/kg TAN, g N/kgCattle slurry 7.34 (0.38; 162) 4.34 (1.75; 250) 2.30 (1.97; 230) 1.05 (0.50; 250)Pig slurry 7.55 (0.35; 83) 4.04 (2.41; 115) 3.67 (1.32; 97) 2.54 (0.99; 115)
Table 4. Parameter estimates and confidence limits for the model with multiplicativesubmodels.Parameters related to NmaxExperimental factor Parameter Estimate
Symbol Interpretation of parameter (as amultiplicative factor)
Approximate95% confidence
limitsNone A0 Common factor 0.00139 0.00018 0.01084Moisture content of soil A1 Wet soil (compared to dry soil) 1.102 1.028 1.181Air temperature A2 Increase per °C 1.0223 1.0175 1.0273Wind speed A3 Increase per m/s 1.0417 1.0178 1.0662Manure type A4 Pig slurry (compared to cattle slurry) 0.856 0.773 0.947Dry matter content of ma-nure
A5 Increase per % dry matter 1.108 1.087 1.129
TAN content of manure A6 Decrease per g N/kg 0.828 0.786 0.872Application method A7 Broad spread 35.5 14.7 85.9
A8 Band spread/trailing hose 20.5 8.4 50.0A9 Trailing shoe 23.6 6.5 85.0A10 Open slot 9.7 3.8 24.7A11 Closed slot
(Compared to pressurised injection)19.3 7.0 53.3
Application rate of manure A12 Decrease in t/ha or m3/ha 0.996 0.993 0.998Manure incorporation A13 No incorp. (compared to shallow
cult.)11.3 1.8 72.0
Technique for NH3 lossmeasuring
A14 Wind tunnel 0.528 0.436 0.640
A15 Micromet(Compared to Lennart boxes)
0.578 0.470 0.710
None B0 Common factor 1.038 0.606 1.776Moisture content of soil B1 Wet soil (compared to dry soil) 1.102 0.967 1.256Air temperature B2 Decrease per °C 0.960 0.951 0.969Wind speed B3 Decrease per m/s 0.950 0.913 0.988Manure type B4 Pig slurry (compared to cattle slurry) 3.88 3.18 4.74Dry matter content of ma-nure
B5 Increase per % dry matter 1.175 1.134 1.218
TAN content of manure B6 Increase per g N/kg 1.106 1.004 1.219Application method B7 Broad spread 1*) - -
B8 Band spread/trailing hose 1*) - -B9 Trailing shoe 1*) - -B10 Open slot 1*) - -B11 Closed slot
(Compared to pressurised injection)1*) - -
Application rate of manure B12 Increase per t/ha or m3/ha 1.0177 1.0127 1.0227Manure incorporation B13 No incorp. (compared to shallow
cult.)1*) - -
Technique for NH3 lossmeasuring
B14 Wind tunnel 1.48 1.04 2.08
B15 Micromet(Compared to Lennart boxes)
2.02 1.38 2.94
*) Parameter fixed to 1 due to very low significance level (P >0.4).
188
THE ECONOMICS OF MANURE HANDLINGFROM STORAGE TO FIELD APPLICATION
Senior Researcher Brian H. JacobsenDanish Institute of Agricultural and Fisheries Economics,
Rolighedsvej 25, DK-1958 Frederiksberg C, E-mail: [email protected].
AbstractIn this paper, an economic analysis of different ways to cover slurry tanks and apply slurry tofields has been carried out. It is found that covering slurry tanks with either straw or a floatinglid is profitable. New field application techniques have become more profitable since an N-norm of 10% under the economic optimum was adopted in Denmark. This has increased theshadow value of nitrogen. When applying animal manure, injection is a profitable alternativeto trailing hoses in spring crops before sowing and in many forage crops, as it gives higher yi-elds and sometimes also higher protein content. Injection of animal manure can in some caseseliminate the negative economic effect of a nitrogen norm. There are no clear advantages ofusing injection in winter crops, but it is a technique which more Danish farms will use in theyears to come. The paper finishes by outlining different whole manure chain systems, wherefor example separation techniques will be analysed further. Theses systems are constructed inorder to ensure that improvements in manure efficiency will be maintained throughout the dif-ferent links of the N-chain.
Key words: Economics of different application techniques, Marginal value of Nitrogen.
Introduction
The manure handling in Denmark has for many years been guided by detailed legislation co-vering restrictions on the N-application (fertiliser account) and application time, as well as therequirements concerning storage capacity. This legislation has implications for the choice ofstorage and how the application of the manure to the fields is actually made. Although thechoice of technique at the farm level can seem fairly easy, it is not always easy to decide themost optimal application technique. Considerations concerning availability and the use ofown labour, as opposed to contractors, also influence the choice.
As it becomes more important to utilise the nitrogen in animal manure, more farmers are inte-rested in systems that utilise manure efficiently and ensure that gains in one link of the nitro-gen chain are maintained through the entire manure chain from stable to field.
Also, the pressure from the public is increasing, and farmers today are very much aware of thewind direction when they spread the manure, and weekend spreading is often avoided. It is
189
clear that farmers today do many things to reduce the ammonia emission and the odour in lo-cal communities.
Investigations show that manure in most cases is transported less than 3 km from storage tofield, and very few farmers transport manure more than 6 km (e.g. Miljøstyrelsen, 1999b). Butthe transportation of manure is an increasing problem, as increasing more area is needed foreach livestock unit. The number of animals in some regions has almost reached the limit. Inthese areas techniques to separate slurry are increasingly in demand.
In order to address these problems, a research program on “Optimal Redistribution and Utili-sation of Plant Nutrients from Animal Manure” has been implemented. The project is a jointeffort between the Danish Institute of Agricultural Sciences and the Danish Institute of Agri-cultural and Fisheries Economics. This paper presents some preliminary results from theproject.
This paper looks at the economics of different ways to cover the storage and the cost of usingdifferent application techniques. The effect of new legislation on manure management is alsoinvestigated. In the last section of the paper, an outline is given of entire manure systemswhich can be set up in order to ensure the most cost effective manure management.
Storage
A storage capacity of 9 months is mandatory for almost all animal farms in Denmark andmost farms probably have a storage capacity of around 12 months. Slurry tanks have to be co-vered in order to reduce ammonia emission. A top layer will be created naturally in most ca-ses, but on most pig farms this is not the case, due to the high ammonium content of the slur-ry. The cover, therefore, has to be made of either plastic or straw. However, surveys indicatethat up to half of all pig farms do not have a cover on their slurry tank (Miljøstyrelsen,1999a).
The costs of creating a cover over the slurry tank are described in Table 1. The cost of the in-vestment is calculated in DKK/m2. A concrete lid is the most expensive, but it also lasts thelongest.
The return on the investment comes both as a higher value of the slurry and lower transporta-tion/application cost. The lower application cost will arise, as the precipitation no longer ne-eds to be transported out into the field. This does not hold for a straw cover, as it does notprevent water from entering the tank. The precipitation amounts to just over 400 m3 and, witha cost of 14 DKK per tonne, this lowers the application cost by approximately 6,000 DKK or12 DKK/m2.
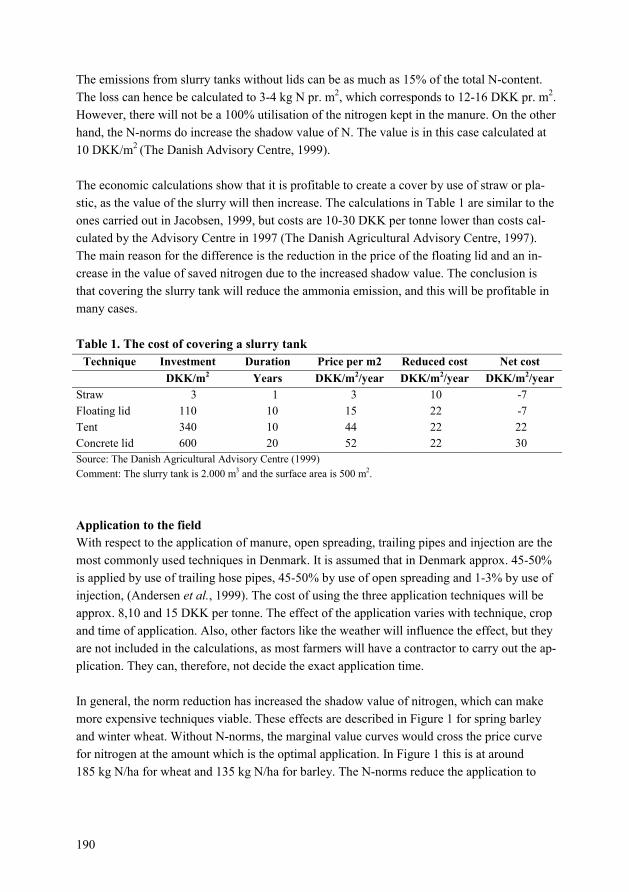
190
The emissions from slurry tanks without lids can be as much as 15% of the total N-content.The loss can hence be calculated to 3-4 kg N pr. m2, which corresponds to 12-16 DKK pr. m2.However, there will not be a 100% utilisation of the nitrogen kept in the manure. On the otherhand, the N-norms do increase the shadow value of N. The value is in this case calculated at10 DKK/m2 (The Danish Advisory Centre, 1999).
The economic calculations show that it is profitable to create a cover by use of straw or pla-stic, as the value of the slurry will then increase. The calculations in Table 1 are similar to theones carried out in Jacobsen, 1999, but costs are 10-30 DKK per tonne lower than costs cal-culated by the Advisory Centre in 1997 (The Danish Agricultural Advisory Centre, 1997).The main reason for the difference is the reduction in the price of the floating lid and an in-crease in the value of saved nitrogen due to the increased shadow value. The conclusion isthat covering the slurry tank will reduce the ammonia emission, and this will be profitable inmany cases.
Table 1. The cost of covering a slurry tankTechnique Investment Duration Price per m2 Reduced cost Net cost
DKK/m2 Years DKK/m2/year DKK/m2/year DKK/m2/yearStraw 3 1 3 10 -7Floating lid 110 10 15 22 -7Tent 340 10 44 22 22Concrete lid 600 20 52 22 30Source: The Danish Agricultural Advisory Centre (1999)Comment: The slurry tank is 2.000 m3 and the surface area is 500 m2.
Application to the fieldWith respect to the application of manure, open spreading, trailing pipes and injection are themost commonly used techniques in Denmark. It is assumed that in Denmark approx. 45-50%is applied by use of trailing hose pipes, 45-50% by use of open spreading and 1-3% by use ofinjection, (Andersen et al., 1999). The cost of using the three application techniques will beapprox. 8,10 and 15 DKK per tonne. The effect of the application varies with technique, cropand time of application. Also, other factors like the weather will influence the effect, but theyare not included in the calculations, as most farmers will have a contractor to carry out the ap-plication. They can, therefore, not decide the exact application time.
In general, the norm reduction has increased the shadow value of nitrogen, which can makemore expensive techniques viable. These effects are described in Figure 1 for spring barleyand winter wheat. Without N-norms, the marginal value curves would cross the price curvefor nitrogen at the amount which is the optimal application. In Figure 1 this is at around185 kg N/ha for wheat and 135 kg N/ha for barley. The N-norms reduce the application to

191
Figure 1. Marginal value for N-application at N-norm for spring barley and winterwheat. Source: Own calculations.
approximately 170 kg N/ha and 120 kg N/ha. The calculations show that the fertiliser normendorsed in Denmark increases the marginal value of the last applied kilo of nitrogen. Thevalue is found in the figure where the norm applications cross the marginal value curve. Theshadow value of N increases from 4 DKK (price of nitrogen) to 6 DKK for barley and 7 DKKper kg N for wheat, making it more profitable to use more costly techniques.
In recent years more Danish farmers have started to use the injection technique. The reasonsfor this are several. With fertiliser accounts and requirements on the utilisation of animal ma-nure, it can be costly not to use the manure efficiently. Currently, the field effects (1 year ef-fect) of nitrogen in animal manure used in the fertiliser accounts are 55% for pig slurry and50% for slurry from dairy cows. This will probably increase to 60% and 55% in 2002/2003.
Secondly, the 10% reduction in the fertiliser norm restricts the total application. If farmers canuse the animal manure more efficiently than the requirement, they can reduce or remove theyield effect of a reduction in the nitrogen norm. Trails have proven that injection of animalmanure in several crops will give an increase in yield on top of the increase due to the higherapplication effects. This extra effect is called a place-effect, as the nitrogen is now placedwhere the roots need it (The Danish Agricultural Advisory Centre, 2000a). In some cases theprotein content will also increase. This effect is described in Figure 2.
-10
-5
0
5
10
15
20
25
30
35
40
0 20 40 60 80 100 120 140 160 180 200
Kg eff. N/ha
Mar
gina
l val
ue (D
KK
/ kg
N)
Marginal value wheatMarginal value spring barleyNorm wheatNorm spring barleyPrice kg N
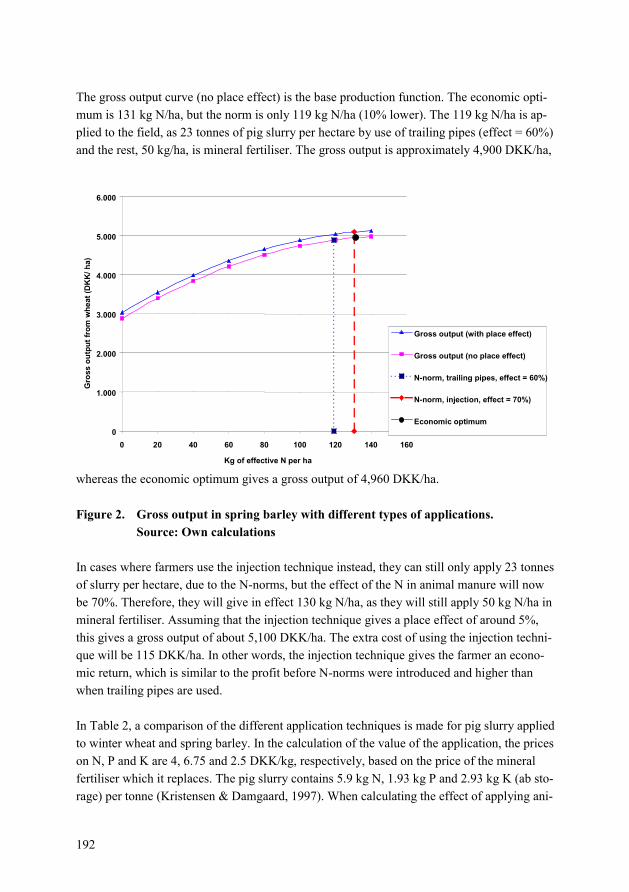
192
The gross output curve (no place effect) is the base production function. The economic opti-mum is 131 kg N/ha, but the norm is only 119 kg N/ha (10% lower). The 119 kg N/ha is ap-plied to the field, as 23 tonnes of pig slurry per hectare by use of trailing pipes (effect = 60%)and the rest, 50 kg/ha, is mineral fertiliser. The gross output is approximately 4,900 DKK/ha,
whereas the economic optimum gives a gross output of 4,960 DKK/ha.
Figure 2. Gross output in spring barley with different types of applications.Source: Own calculations
In cases where farmers use the injection technique instead, they can still only apply 23 tonnesof slurry per hectare, due to the N-norms, but the effect of the N in animal manure will nowbe 70%. Therefore, they will give in effect 130 kg N/ha, as they will still apply 50 kg N/ha inmineral fertiliser. Assuming that the injection technique gives a place effect of around 5%,this gives a gross output of about 5,100 DKK/ha. The extra cost of using the injection techni-que will be 115 DKK/ha. In other words, the injection technique gives the farmer an econo-mic return, which is similar to the profit before N-norms were introduced and higher thanwhen trailing pipes are used.
In Table 2, a comparison of the different application techniques is made for pig slurry appliedto winter wheat and spring barley. In the calculation of the value of the application, the priceson N, P and K are 4, 6.75 and 2.5 DKK/kg, respectively, based on the price of the mineralfertiliser which it replaces. The pig slurry contains 5.9 kg N, 1.93 kg P and 2.93 kg K (ab sto-rage) per tonne (Kristensen & Damgaard, 1997). When calculating the effect of applying ani-
0
1.000
2.000
3.000
4.000
5.000
6.000
0 20 40 60 80 100 120 140 160
Kg of effective N per ha
Gro
ss o
utpu
t fro
m w
heat
(DK
K/ h
a)
Gross output (with place effect)
Gross output (no place effect)
N-norm, trailing pipes, effect = 60%)
N-norm, injection, effect = 70%)
Economic optimum
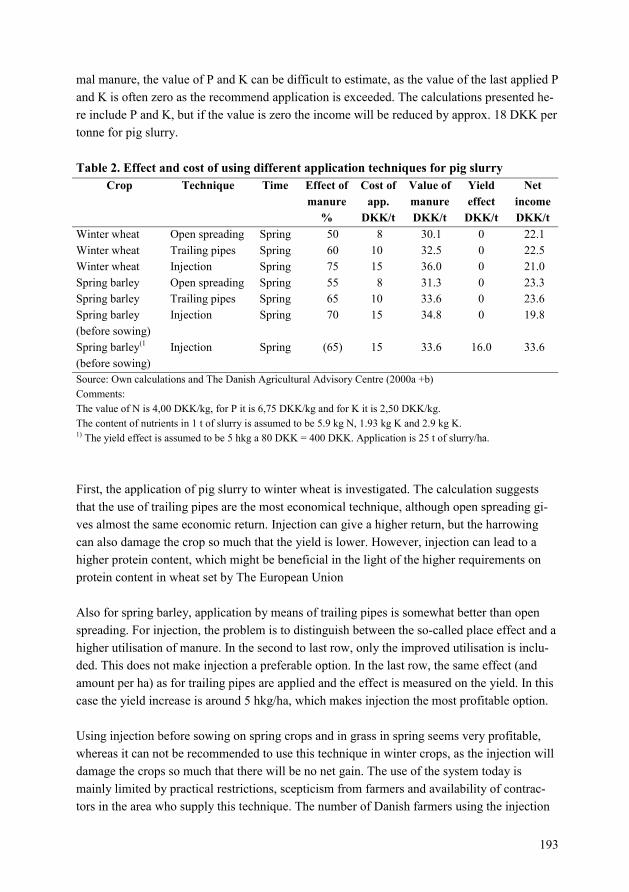
193
mal manure, the value of P and K can be difficult to estimate, as the value of the last applied Pand K is often zero as the recommend application is exceeded. The calculations presented he-re include P and K, but if the value is zero the income will be reduced by approx. 18 DKK pertonne for pig slurry.
Table 2. Effect and cost of using different application techniques for pig slurryCrop Technique Time Effect of
manureCost of
app.Value ofmanure
Yieldeffect
Netincome
% DKK/t DKK/t DKK/t DKK/tWinter wheat Open spreading Spring 50 8 30.1 0 22.1Winter wheat Trailing pipes Spring 60 10 32.5 0 22.5Winter wheat Injection Spring 75 15 36.0 0 21.0Spring barley Open spreading Spring 55 8 31.3 0 23.3Spring barley Trailing pipes Spring 65 10 33.6 0 23.6Spring barley(before sowing)
Injection Spring 70 15 34.8 0 19.8
Spring barley(1
(before sowing)Injection Spring (65) 15 33.6 16.0 33.6
Source: Own calculations and The Danish Agricultural Advisory Centre (2000a +b)Comments:The value of N is 4,00 DKK/kg, for P it is 6,75 DKK/kg and for K it is 2,50 DKK/kg.The content of nutrients in 1 t of slurry is assumed to be 5.9 kg N, 1.93 kg K and 2.9 kg K.1) The yield effect is assumed to be 5 hkg a 80 DKK = 400 DKK. Application is 25 t of slurry/ha.
First, the application of pig slurry to winter wheat is investigated. The calculation suggeststhat the use of trailing pipes are the most economical technique, although open spreading gi-ves almost the same economic return. Injection can give a higher return, but the harrowingcan also damage the crop so much that the yield is lower. However, injection can lead to ahigher protein content, which might be beneficial in the light of the higher requirements onprotein content in wheat set by The European Union
Also for spring barley, application by means of trailing pipes is somewhat better than openspreading. For injection, the problem is to distinguish between the so-called place effect and ahigher utilisation of manure. In the second to last row, only the improved utilisation is inclu-ded. This does not make injection a preferable option. In the last row, the same effect (andamount per ha) as for trailing pipes are applied and the effect is measured on the yield. In thiscase the yield increase is around 5 hkg/ha, which makes injection the most profitable option.
Using injection before sowing on spring crops and in grass in spring seems very profitable,whereas it can not be recommended to use this technique in winter crops, as the injection willdamage the crops so much that there will be no net gain. The use of the system today ismainly limited by practical restrictions, scepticism from farmers and availability of contrac-tors in the area who supply this technique. The number of Danish farmers using the injection

194
technique has increased over the last two years and will increase in the years to come, but fewfarmers are likely to find it profitable to invest in the equipment themselves. Furthermore, thenumber of reactions from the public will be reduced with an increase in the use of the injecti-on technique. So far, injections are mainly used on sandy soil, but it will also be possible touse this technique on mixed soils, whereas it can not be used on clay soil and on hilly fieldswith the present set-up.
With respect to legislation the ammonia-plan which the government will propose at the end ofthis year, a ban on the use of open spreading will probably be included, at least in the summermonths. This will be when the ammonia emission (and the smell) is at its highest.
Considerations concerning calculations at the system level
The economic calculations in the research project will be based on the detailed analysis, asdescribed above, but they will also include consideration with respect to the use of separationtechniques and the distance over which the manure has to be transported. The systems analy-sed will include both traditional and new systems, which are not widely adopted, yet. Thesenew approaches will involve separation techniques (Biorek, Manura, etc.) and facilities werethe slurry is pumped to the field. Another aim is to find systems that might make it possible touse injection on sandy-clay soil in the spring. Also, the cost of transporting the manure overlonger distances (over 10 km) will be analysed in more detail.
The investigated farms are pig, dairy and poultry farms of a size that will be typical for farmsin the years to come. As an example, the pig farms range from 100 sows to 1,000 sows. Cal-culations of the cost of farm biogas plants will only be carried out for the largest farms. The2-year project will finish at the end of 2001. The focus of the systems will be to ensure a highN-efficiency from stables to the field. Some preliminary results are expected to be ready earlynext year.
References
Andersen, J.M.; Sommer, S.; Hutchings, N.; Kristensen, V.F. & Poulsen, H.D., 1999. Emissi-on af ammoniak fra landbruget – status og kilder [Ammonia emission from agriculture].DJF/DMU. Ammoniak fordampning – redegørelse nr. 1.
Jacobsen, B.H., 1999. Økonomiske vurderinger af tiltag til reduktion af ammoniakfordamp-ningen fra landbruget. [Economic assessment of the cost of reducing ammonia emission inagriculture]. Ammoniakfordampning – redegørelse nr. 4. Statens Jordbrugs- og Fiske-riøkonomiske Institut.
Kristensen, V. & Damgaard, H., 1997. Normtal for husdyrgødning [Norms for animal manu-re]. Beretning nr. 736. Danmarks Jordbrugsforskning.

195
Miljøstyrelsen, 1999a. Undersøgelse af flydelag i gyllebeholdere og kommunernes tilsynhermed [Investigation of the covers of slurry containers and the control carried out by themunicipality]. Udkast til rapport udarbejdet af COWI-consult.
Miljøstyrelsen, 1999b. Kvælstofanvendelse i dansk landbrug – økonomi og kvælstofudvask-ning [Use of nitrogen in Danish Agriculture]. Miljøprojekt nr. 461. Unpublished.
The Danish Agricultural Advisory Centre, 2000a. Oversigt over landsforsøgene 1999 [Over-view of plant trails in 1999]. Landsudvalget for Planteavl.
The Danish Agricultural Advisory Centre, 2000b. Håndbog i plantedyrkning [Handbook ofgrowing crops] 2000. Landbrugsforlaget.
The Danish Agricultural Advisory Centre, 1999. Flydelag eller låg på gyllen [Put a Lid on theslurry].
The Danish Agricultural Advisory Centre, 1997. Overdækning af gyllebeholdere [Cover onslurry tanks].
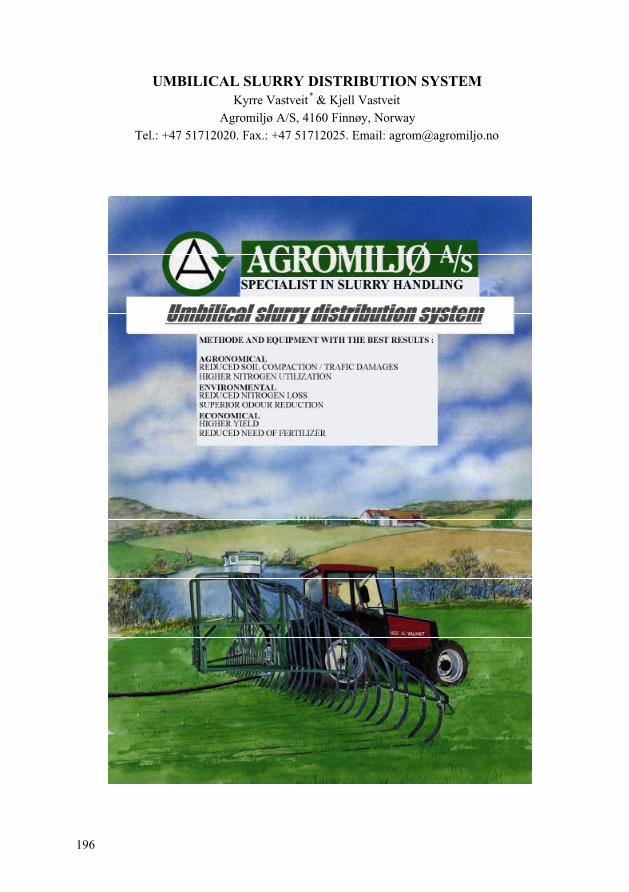
196
UMBILICAL SLURRY DISTRIBUTION SYSTEMKyrre Vastveit* & Kjell Vastveit
Agromiljø A/S, 4160 Finnøy, NorwayTel.: +47 51712020. Fax.: +47 51712025. Email: [email protected]
196
UMBILICAL SLURRY DISTRIBUTION SYSTEMKyrre Vastveit* & Kjell Vastveit
Agromiljø A/S, 4160 Finnøy, NorwayTel.: +47 51712020. Fax.: +47 51712025. Email: [email protected]

197
Reduced soil compaction andtraffic damaged higher yield.Only 1/3 of traffic compared to tankers.
Umbilical drag hose system•Light weight
•Minimized trafficdamaged.
Track pattern, traditional tankers.•Heavy equipment
•Much traffic, incl.in and out of field.
•Soil compaction.
•Traffic damaged ongrowing crops.
Umbilical band sreading:
Good growth condition
Good soil structure
Good root system
Spreading with tankers:
More injured corps.
Worse growth condition.
Compact soil structure.
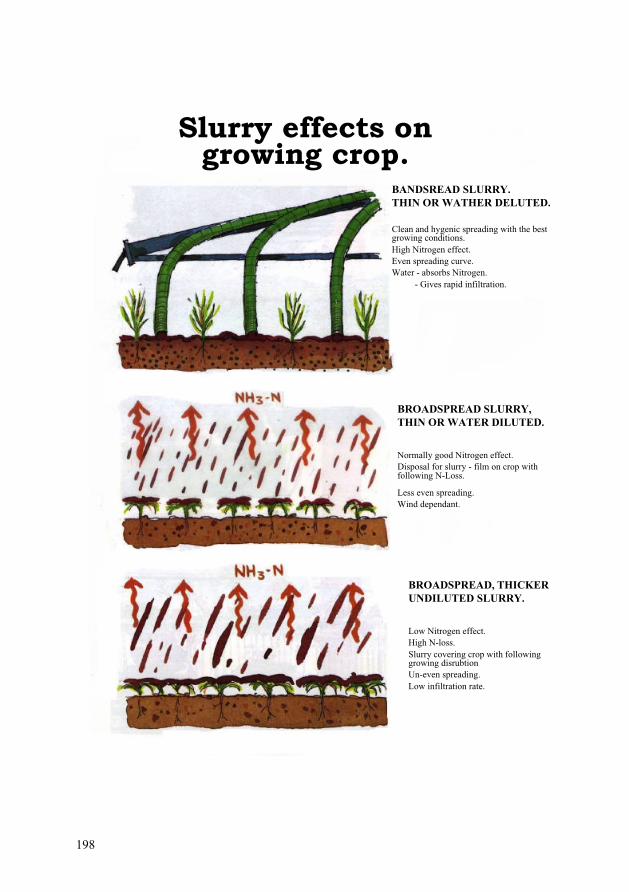
198
Slurry effects ongrowing crop.
BANDSREAD SLURRY.THIN OR WATHER DELUTED.
Clean and hygenic spreading with the bestgrowing conditions.High Nitrogen effect.Even spreading curve.Water - absorbs Nitrogen. - Gives rapid infiltration.
BROADSPREAD, THICKERUNDILUTED SLURRY.
Low Nitrogen effect.High N-loss.Slurry covering crop with followinggrowing disrubtionUn-even spreading.Low infiltration rate.
BROADSPREAD SLURRY,THIN OR WATER DILUTED.
Normally good Nitrogen effect.Disposal for slurry - film on crop withfollowing N-Loss.
Less even spreading.Wind dependant.

199
FLEXIBLE SPREADING TIMEIndependant of wind and weather.
Umbilical bandspreading ongrowing crop:•High nitrogen utiliziation•Great capacity, up to 120 m3/ hr.•Minimized transport damages.•Clean and hygenic spreading•Not influenced by wind.
No more smells - No more trouble !
Traditional Broadspreading

200
LONGER GROWING SEASONConcentrate on soil cultivation.
-Slurry application later in growing season.Earilerseeding
Spring farmer operations:- Plowing
- Harrowing
-Earlier seeding.
-Sprout growth.
-Slurry Application on growing crop:
- Gives reduced stress during springoperation.
- High slurry effect.
-Minimized risk of run-off or leaks.
- Higher grain yield.
Spring farmer operations:
-Waiting for drivingconditions with tankers.
- Plowing.
- Harrowing.
- Delayed seeding.
- High stress factor duringspring operation.

201 201

202
NORDIC ASSOCIATION OF AGRICULTURAL SCIENTISTS (Nordiska Jordbruksforskaras Förening)
What is NJF?The Nordic Association of Agricultural Scientists (NJF) was established in 1918. It is the old-est still active Nordic association of scientists.
NJF is an idealistic association with approximately 2600 members from the five Nordiccountries Denmark, Finland, Iceland, Norway and Sweden, all of which have national NJF-departments. Within the last few years a number of Baltic agricultural scientists have becomemembers of NJF via the Finnish department.
The members are engaged in research, education, advisory services and administration withinagricultural research or in public service within the agricultural area, or they are prominentagriculturalists.
The members can be attached to one or more of the 12 professional sections within NJF.
NJF’s most important objective is to further the agricultural research in the Nordic countries.In order to achieve this objective close contacts have been made between scientists and vari-ous research institutions with a view to an efficient utilization of available resources. NJF hasalso established contacts outside the Nordic countries.
The languages in NJF are Swedish, Norwegian, Danish and to some extent English.
NJF’s activities are financed through Government grants, membership fees and income fromseminars and sale of publications.
SECTION VII - AGRICULTURAL ENGINEERING
The subjects of the section are buildings, mechanization and other technical equipment andtools for plant and animal production and fish farming. Other subjects are rationalization,mechanization and automation of the work involved in production. Improving the environ-ment for both men, animal and environment are important tasks of the section. Other work ofimmediate importance concerns energy conservation in production areas with a high-energyconsumption. The section arranges workshops, meetings, seminars, etc. in order to exchangeand give information and to initiate new research and development.