Bioconversion of cassava starch by-product into Bacillus and related bacteria polyhydroxyalkanoates

AUTHOR QUERY SHEET
Author(s): Du, Rios-Solis, Ward, Dalby, Lye
Article title: Evaluation of CV2025 ω-transaminase for the bioconversion of lignin breakdown products into value-added chemicals: synthesis of vanillylamine from vanillin
Article no: 976632
Enclosures: 1) Query Sheet
3) Article Proofs
Dear Author,
Please check these proofs carefully. It is the responsibility of the corresponding author to check against the original manuscript and approve or amend these proofs. A second proof is not normally provided. Informa Healthcare cannot be held responsible for uncorrected errors, even if introduced during the composition process. The journal reserves the right to charge for excessive author alterations, or for changes requested after the proofing stage has concluded.
The following queries have arisen during the editing of your manuscript and are marked in the margins of the proofs. Unless advised otherwise, submit all corrections using the CATS online correction form. Once you have added all your corrections, please ensure you press the “Submit All Corrections” button.
[AQ1]Please review the table of contributors below and confirm that first and last names are structured correctly and that the authors are listed in the order of contribution.
Contrib. No.
Given name(s) Surname Suffix
C. J. Du
L. Rios-Solis
J. M. Ward
P. A. Dalby
G. J. Lye
Page No. Query Details Author Reply
1 [AQ2] Affiliations are correct? Please check and advise

Page No. Query Details Author Reply
3 [AQ3] Please check whether inserted running title is correct?
11 [AQ4] A declaration of interest statement reporting no conflict of interest has been inserted. Please confirm whether the statement is accurate.
1 [AQ5] Please check whether the given affiliations and the corresponding author details are correct.
11 [AQ6] Please provide statement for the acknowledgement section.
11 [AQ7] Please provide URL for the “Borregaard 2011”.
12 [AQ8] Kindly please abbreviate the journal title in reference “Wang and Li 2011”.

[AQ1]
[AQ2]
[AQ5]
1234567891011121314151617181920212223242526272829303132333435363738394041424344454647484950515253545556
57585960616263646566676869707172737475767778798081828384858687888990919293949596979899100101102103104105106107108109110111112
ORIGINAL ARTICLE
Evaluation of CV2025 w-transaminase for the bioconversion of lignin breakdown products into value-added chemicals: synthesis of vanillylamine from vanillin1
C. J. Du, L. Rios-soLis, J. M. WaRD, P. a. DaLby & G. J. Lye
Department of Biochemical Engineering, University College London, London, UK
AbstractLignin is an essential component of the cell wall of various plants and represents an abundant and renewable natural resource. both thermo-chemical and biological pre-treatment can be applied to break down the phenylpropanoid polymer subunits present in lignin. These liberate a range of phenolic compounds which represent potential substrates for biocon-version by w-transaminases. in this work, the CV2025 w-transaminase (w-Tam) from Chromobacterium violaceum DsM30191, heterologously expressed in E. coli, was explored for selective amination of lignin breakdown intermediates into value-added products. eight potential w-Tam substrates were initially screened using (s)-a-methylbenzylamine (Mba) as the amino donor. Vanillin was identified as the best potential substrate which is converted into vanillylamine; an intermediate in the preparation of pelargonic acid vanillylamide used as a hyperemia inducing active substance in wound dressings. at low vanillin and Mba concentrations ( 10 mM) and with an excess of the amine donor (1:4 mol/mol) 100% w/w conversion of vanillin into vanillylamine was observed within 25 min. at vanillin concentrations above 10 mM, sub-strate inhibition was observed decreasing the rate and yield of the bioconversion. High concentrations of the reaction product (vanillylamine) and by-product (acetophenone) also limited the conversion due to increased backward reaction rate and inhibition. Vanillylamine synthesis could be carried out by both whole cell and clarified lysate forms of the CV2025 w-Tam while fed-batch bioconversions (feeding low concentrations of both vanillin and Mba) could help overcome sub-strate inhibition and double the final product concentrations obtained. These results demonstrate the potential for biocon-version of lignin breakdown products into value-added chemicals but illustrate the need for enzymes with improved substrate range and implementation of techniques to overcome product inhibition and equilibrium constraints.
Keywords: Bioconversion, lignin degradation, transaminase, vanillin, vanillylamine
Correspondence: Professor Gary J. Lye, Department of biochemical engineering, university College London, Torrington Place, London, WC1e 7Je, uK. e-mail: [email protected]; 1Manuscript prepared for biocatalysis and biotransformation (Revised 14.07.2014).
(Received 5 September 2013; revised 1 September 2014; accepted 10 October 2014)
Introduction
Chemical and pharmaceutical companies are cur-rently showing considerable interest in biocatalysis combined with the use of biorenewable feedstocks (saha et al. 2001; Pollard & Woodley 2007; Prather & Martin 2008; Huisman & Collier 2013). Com-pared to chemical syntheses biocatalytic routes to a particular target compound can avoid the use of haz-ardous reagents and organic solvents and generally require considerably less energy input (Henderson et al. 2008). For petrochemical derived synthons, there are growing concerns over the stability and predictability of feedstock price (Fan 2000; Wang & Li 2011) further prompting a shift toward biorenew-able feedstocks.
Lignin is the most abundant aromatic substance present in the biosphere. it forms an irregular non-crystalline network in plant cell walls which is highly resistant to microbial degradation (Vicuna 1988). as a polymer it is composed of phenylpropanoid units linked through a variety of non-hydrolysable C-C and C-o-C bonds. it shows an inherent heterogene-ity caused by variations in the polymer composition, size, cross-linking, and functional groups (bonini et al. 2008). both biological and thermochemical methods exist for lignin pretreatment and degrada-tion (Mohtashamipur & Norpoth 1990; Zimmer-mann 1990; Fiechter 1993; bonini & D’ auria 2004; bugg et al. 2011). From an environmental perspec-tive biodegradation of lignin is advantageous as it is
Biocatalysis and Biotransformation, 2014; early online: 1–12
issN 1024-2422 print/issN 1029-2446 online © 2014 informa uK, Ltd.Doi: 10.3109/10242422.2014.976632
GBAB_A_976632.INDD 1 10/28/2014 9:26:05 PM

1234567891011121314151617181920212223242526272829303132333435363738394041424344454647484950515253545556
57585960616263646566676869707172737475767778798081828384858687888990919293949596979899100101102103104105106107108109110111112
2 C. J. Du et al.
less energy intensive and potentially more selective (Crawford & Crawford 1984; eriksson 1993; Tuomela et al. 2000). However, both methods liber-ate a range of monomers that might represent useful starting materials for the synthesis of value-added chemicals (FitzPatrick et al. 2010; azadi et al. 2013). at present there are about 1.5 million tons of lignin-based products on the market including the food ingredient vanillin, and other breakdown products having applications in many fields such as the paper industry, synthetic resins, dyes, cosmetics, and phar-maceuticals (Taniguchi et al. 2005).
aminated compounds are useful synthons in the manufacture of a wide range of fine chemicals and pharmaceuticals (Huisman & Gray 2002). it is esti-mated that the majority of pharmaceuticals are syn-thesized from compounds possessing amine functionalities (Ralph et al. 2001; said 2002). ami-nation, and ideally stereoselective amination, of lignin breakdown products is therefore an attractive option for increasing the value of the compounds liberated following thermochemical or biological pretreatment. Transaminases are ubiquitously pres-ent in microbes and higher organisms and have great potential for the production of natural and nonnatu-ral amino acids as well as chiral amines (sheldon 1996; shin & Kim 1997; shin et al. 2001). The advantages of using transaminases over other enzy-matic or chemical methods include high stereoselec-tivity and overcoming requirements for organic solvents or cofactor regeneration (Kaulmann et al. 2007). Transaminases are pyridoxal-phosphate coen-zyme dependent, catalyzing amino group transfer from a donor to the substrate of interest by a ping-pong bi–bi mechanism (Rudat et al. 2012). a wide range of amino donors have been reported in the literature, the most common being (s)-a-methyl-benzylamine (Mba) (schell et al. 2009).
This paper explores the utility of the CV2025 w-Tam from Chromobacterium violaceum DsM30191 for the selective bioconversion of a range of lignin breakdown products. The enzyme, previously cloned by us (Kaulmann et al. 2007), is expressed in Escher-ichia coli bL21 (De3) and can be used either as a clarified lysate or whole cell biocatalyst. it is shown that the CV2025 w-Tam possesses good activity with a range of lignin breakdown products but that product inhibition and equilibrium considerations currently limit the space-time yields achievable.
Materials and methods
Materials and biocatalyst source
Nutrient broth and nutrient agar were obtained from Fisher scientific (Leicestershire, uK). Competent E.
coli bL21 (De3) Gold cells were obtained from stratagene (amsterdam, NL). Vectors pQR800 and pQR801 were created in previous research (smithies et al. 2007). Vanillin and benzaldehyde were pur-chased from Thermo Fisher scientific (New Jersey, us). all other reagents were obtained from sigma-aldrich (Gillingham, uK) and were of the highest purity available.
Plasmids pQR800 and pQR801
Transaminase was expressed from plasmids pQR800 and pQR801 containing the complete C. violaceum DsM30191 transaminase gene (smithies et al. 2007) in either native or His6-tagged form, respec-tively. These plasmids were constructed using the expression vector peT29(a) (5.3 kb) which con-tains an inducible T7 promoter, the lac repressor sequence and codes for resistance to kanamycin. Plasmids were transformed into E. coli bL21 (De3) Gold cells which were subsequently stored as glyc-erol stocks at –80°C.
CV2025 w-transaminase preparation
E. coli bL21 (De3) Gold cells containing pQR801 were initially grown on Lb glycerol agar plates (5 g L 1 yeast extract, 10 g L 1 tryptone, 10 g L 1 NaCl, 10 g L 1 glycerol, 15 g L 1 agarose) containing 150 mg mL 1 kanamycin at 37°C overnight. a single colony was then picked from the agar plate and cul-tured in a 250 mL shake flask with 20 mL of Lb-glycerol media containing 150 mg mL 1 kanamycin at 37°C with orbital shaking at 250 rpm using an si 50 orbital shaker (stuart scientific, Redhill, uK) for 11–16 h. The entire contents of the flask were then transferred to a 2 L flask with 180 mL of Lb-glycerol media containing 150 mg mL 1 kanamycin, incu-bated at 37°C, 250 rpm. When the oD600 reached between 1 and 1.5, isopropyl-b-D-thiogalactosidase (iPTG) was added to a final concentration of 0.1 mM. after 5 h glycerol stocks were produced by mix-ing 250 mL of cell suspension into 250 mL 20% v/v glycerol solution. This was stored in a 1.5 mL eppen-dorf tube and kept at -80°C until use.
Cell lysate was prepared from E. coli bL21 (De3) Gold cells harvested by centrifugation at 6000 rpm for 10 min. Following supernatant removal the cell pellet was resuspended in 50 mM Tris buffer contain-ing 0.2 mM co-factor at pH 7.5. This cell suspension was then sonicated using a soniprep 150 sonicator (Mse, sanyo, Japan) using 10 cycles of 10 s, 10 mm pulses with 10-second intervals on ice to avoid enzyme denaturation. The sonicated suspension was then centrifuged again at 5000 rpm at 4°C for 5 min.
GBAB_A_976632.INDD 2 10/28/2014 9:26:05 PM

[AQ3]
1234567891011121314151617181920212223242526272829303132333435363738394041424344454647484950515253545556
57585960616263646566676869707172737475767778798081828384858687888990919293949596979899100101102103104105106107108109110111112
Synthesis of vanillylamine from vanillin 3
The supernatant (soluble fraction, lysate) was filtered through a 0.2 mm filter to obtain clarified extract and either used immediately or frozen at 20°C (control experiments showed no decrease in lysate activity over 4 months when stored in this way).
Bioconversions
Screening for w-TAm activity on lignin breakdown inter-mediates. screening experiments were performed using 20 mM of each potential substrate with 20 mM of the amino donor (s)-a-methylbenzylamine (Mba). The concentration of CV2025 w-Tam lysate used in the reactions was 0.3 mg mL 1, along with 0.2 mM of added PLP. Reactions were performed in a sealed 96-well glass microtiter plate to minimize evaporation with Nunc aluminum seal Tape (Ny, usa) and incubated in an eppendorf Thermomixer Comfort shaker (Cambridge, uK) for 24 h. Reac-tion temperature was 30°C and shaking was at 350 rpm (orbital shaking diameter 6 mm). 20 mL aliquots were taken at various intervals and rapidly quenched with 380 mL of a 0.2% v/v trifluoroacetic acid (TFa) solution. samples were then centrifuged for 5 min at 13000 rpm and the supernatant analyzed by HPLC.
Microwell scale bioconversions. a 96-well glass micro-titer plate was used to perform small scale kinetic experiments. Random wells were first filled with amino donor solutions at final concentrations between 5 and 50 mM at pH 7.5. Next 0.3 mg mL 1 of either w-Tam lysate or whole cell biocata-lyst containing an equivalent quantity of enzyme, along with 0.2 mM of PLP, was added. The plate was sealed and incubated at 30°C for 20 min to equilibrate all reaction components. To initiate the bioconversion the required substrate was added to the wells and the reaction incubated and shaken in a thermomixer with 20 mL of sample removed peri-odically for analysis.
Investigation of inhibition and equilibrium constraints. experiments to examine substrate inhibition were performed varying the initial concentration of the desired substrate (or amine donor) between 5 and 50 mM while keeping the initial concentration of the amine donor (or substrate) fixed, typically at 5 mM or 20 mM. experiments to examine back reaction kinetics and/or product inhibition were performed at different added initial concentrations of product or by-product. all reactions were performed in a 96-well glass microtiter plate as described in section 2.4.1.
Influence of biocatalyst form on stability. The stability of CV2025 w-Tam activity in both lysate and whole
cell forms was evaluated by incubation of the bio-catalyst preparations for different lengths of time. Reactions were performed in a 96-well glass micro-titer plate with each well initially containing 20 mM Mba, 5 mM vanillin, and 0.2 mM PLP in 50 mM Tris buffer to a total volume of 300 mL. To initiate the bioconversion, 50 mL of either lysate or whole cell CV2025 w-Tam preparation was first added to the solution of reactants with shaking at 30°C. Reac-tions were performed on a thermomixer at 30°C, 350 rpm for 60 min with samples for HPLC analysis taken at specific time intervals. For quantitative comparison of w-Tam activity in either lysate or whole cell forms bioconversions were performed using identical concentrations of the CV2025 w-Tam of 0.3 mg mL 1. initial substrate concentrations were 40 mM Mba and 10 mM vanillin. all other experimental conditions were as described in sec-tion 2.4.1.
Fed batch bioconversions. Fed-batch experiments were carried out in a covered 50 mL stirred glass reactor using 15 mL total reaction volume. Clarified lysate containing the CV2025 w-Tam expressed from pQR801 was first incubated with 0.2 mM PLP in 50 mM Tris buffer for 20 min at 30°C. stirrer speed was controlled using an iKaMaG RCT magnetic stirrer while temperature was kept constant using a TXF200 series heated circulating bath. pH was maintained at pH 7.5 using a Metrohm 718 pH sTaT Titrino and 806 exchange unit (Metrohm Ltd., switzerland).
experiments at low initial substrate concentra-tion used 10 mM Mba and 5 mM vanillin, along with 0.3 mg mL 1 w-Tam and 0.2 mM PLP. The feeds comprised concentrated solutions of Mba (170 mM, 0.88 mL) and vanillin (60 mM, 1.25 mL) pre-dissolved in the reaction medium. These were added following complete vanillin conversion at t 1 h and t 2 h in order to restore the initial starting concentrations of both substrates. experiments at high initial substrate concentration used 60 mM Mba and 40 mM vanillin. The feeding commenced following complete vanillin conversion at t 4 h and t 8 h.
Analytical techniques
Dry cell weight (DCW) and optical density (oD) measurements for biomass quantification were per-formed as previously described (Rios-solis et al. 2013). Protein concentrations of the lysates and whole cells were obtained using a bradford assay and sDs-PaGe as reported previously (smithies et al. 2007). a Dionex (Camberley, uK) microbore HPLC system with Chromeleon 6.80 software was
GBAB_A_976632.INDD 3 10/28/2014 9:26:05 PM

1234567891011121314151617181920212223242526272829303132333435363738394041424344454647484950515253545556
57585960616263646566676869707172737475767778798081828384858687888990919293949596979899100101102103104105106107108109110111112
4 C. J. Du et al.
employed for all RP-HPLC analyses. This system comprised a P680 gradient pump, asi-100 auto-mated sampler injector, sTH 585 column oven, and uVD170u uV detector (275 nm). Vanillin, vanil-lylamine, Mba, acetophenone (aP), and the other compounds listed in Table i were quantified on an aCe 5 C18 reverse phase column (150 mm 4.6
mm, 5 mm particle size; advance Chromatography Technologies, aberdeen, uK), using 0.1% v/v TFa at 1.0 mL.min 1 with a gradient of acetonitrile from 15% to 72% over 9 min. Quantification of solute concentrations was performed using calibration curves prepared with standards for each separate compound.
Table i. screening of CV2025 w-Tam for activity on selected lignin breakdown intermediates. activity based on detection of compound depletion within 24 h (using Mba as an amino donor). Reactions performed as described in section 2.4.1.
Lignin breakdown intermediate structure
activity detected
Vanillin ✓
Coniferyl aldehyde ✓
Trans-cinnamaldehyde ✓
benzaldehyde ✓
p-Hydroxyacetophenone ✓
acetovanillone ✓
Caffeic acid 𝟀
Ferulic acid 𝟀
GBAB_A_976632.INDD 4 10/28/2014 9:26:05 PM

mon
o fo
r pr
int c
olou
r on
lin
e
1234567891011121314151617181920212223242526272829303132333435363738394041424344454647484950515253545556
57585960616263646566676869707172737475767778798081828384858687888990919293949596979899100101102103104105106107108109110111112
Synthesis of vanillylamine from vanillin 5
Purification of products prior to identification involved centrifugation of the bioconversion mixture (5000 rpm, at 4°C for 15 min) followed by superna-tant filtration (0.2 mm). Fifty gram of amberlite iRa-410 resin was then added for 1 h, and the resin was then removed by filtration. The remaining aqueous mixture was then passed through an isolute sCX-2 ion exchange column (biotage, uppsala, sweden), and the column was washed with 400 mL of metha-nol. The column was then eluted with 500 mL 4 M NH3 and the eluent was evaporated to yield the desired product. Chemical ionisation (Ci) mass spectrometry analyses were conducted on a Thermo Finnigan MaT900xp mass spectrometer. Methane was used as the carrier gas. operating conditions: capillary tem-perature 300°C, capillary voltage 9 V, spray voltage 4.5 kV, sheath gas 80, auxiliary gas 30, and sweep gas 0 arbitrary units. 1H NMR spectra were recorded on a bruker aDVaNCe iii 600 (600 MHz) spectrometer, using D2o solvent. The chemical shifts (d) were given in ppm units relative to tetramethylsilane, and coupling constants (J) are measured in Hertz. Proton 1 H NMR multiplicities are shown as s (singlet), d (doublet), t (triplet), m (multiplet), dd (doublet of doublet), bs (broad singlet), bd (broad doublet), bt (broad triplet), and bm (broad multiplet). all product characterization results are shown in supplementary information to be found online at http://informahealthcare.com/doi/abs/10.3109/10242422.2014.976632
Results and discussion
Production of transaminase
E. coli bL21 (De3) GoLD cells transformed with plasmid pQR801, containing the CV2025 w-Tam gene, were routinely grown in batch shake flask cul-tures as shown in Figure 1 (a). w-Tam expression was induced with 0.1 mM iPTG when oD600 reached around 1 to 1.5. it can be seen that after adding iPTG at 3 h, the growth of the transformed cells was retarded slightly in a way that is typical of cells overexpressing a heterologous protein (smithies et al. 2007). The maximum biomass concentration reached was 1.4 gDCW.L 1 after 10 h which was 18% lower than the untransformed cells.
in terms of the amount of w-Tam produced, analysis of the soluble protein fraction after cell lysis indicated a total protein concentration of 2.81 0.03 g L 1. Figure 1 (b) shows sDs-PaGe analysis of the soluble protein fraction from cells harvested at 8 h. Lanes 2 and 3, from duplicate cultures, show overex-pression of w-Tam at the expected molecular weight of 47 kDa (smithies et al. 2007). Density scanning of the gels suggested that w-Tam comprised 42 4% w/w of total protein for the induced cultures. The
specific yield of w-Tam in the E. coli bL21-Gold (De3) cells was therefore 0.2 g.gDCW
1 of cells. This level of expression is broadly in agreement with that found previously (smithies et al. 2007).
Screening of w-TAm activity on lignin breakdown intermediates
several potential w-Tam substrates were selected from both thermochemical breakdown and biodeg-radation pathways (Fahmi et al. 2007; Ko et al. 2009; Werhan et al. 2012). They were evaluated in order to explore the potential to synthesize value-added
Figure 1. shake flask culture of E.coli bL21 (De3) Gold expressing CV2025 w-Tam from the plasmid pQR801: (a) growth kinetics for induced (with 0.1 mM iPTG) () and non-induced cells (); (b) analysis of over-expression of the 47 kDa w-Tam. sDs PaGe analysis shows molecular weight markers (Lane 1), induced (Lanes 2–3) and non-induced (Lanes 4–5) cells. shake flask cultures performed as described in section 2.3 and sDs-PaGe performed as described in section 2.5.
GBAB_A_976632.INDD 5 10/28/2014 9:26:07 PM

1234567891011121314151617181920212223242526272829303132333435363738394041424344454647484950515253545556
57585960616263646566676869707172737475767778798081828384858687888990919293949596979899100101102103104105106107108109110111112
6 C. J. Du et al.
products via a bioconversion route. screening reac-tions were performed at low initial substrate concen-trations ( 20 mM) so as to minimize any reaction equilibrium or inhibition effects.
one of the issues with w-transaminases is that they have a limited substrate range, with most accept-ing only substrates with a substituent no larger than a methyl group at the position adjacent to the ketone (savile et al. 2010). The results from Table i are con-sistent with this in that the smaller the group at this position the greater the activity detected. Vanillin showed the fastest initial reaction rate while conver-sions for substrates like acetovanillone and p- hydroxyacetophenone were very low due to the presence of the methyl substituent adjacent to the ketone. in these cases less than 10% w/w conversion could be reached in 24 h. as expected, the last two compounds in the Table i did not react since they do not possess ketone or aldehyde groups.
since the focus of this work was to explore the use of w-Tam for bioconversions to value-added chemicals, vanillin was chosen for further study. Not only did it display the highest activity but it is known that the expected product, vanillylamine, can be readily converted into pelargonic acid vanillylamide used as a hyperemia inducing active substance in plasters (Meyer & Heddesheimer 2005). Further-more, work by borregaard Ltd. has shown that Co2 emissions as a result of using vanillin produced from lignin are 90% lower than those for vanillin produced from mineral oil derivatives (borregaard 2011).
Vanillin bioconversion kinetics
Having shown w-Tam activity on vanillin, the next step was to examine in more detail the kinetics of the bioconversion using Mba as amino donor (Figure 2a) and to confirm the identity of the pos-tulated vanillylamine product. Figure 3 shows the measured bioconversion kinetics determined at low equimolar substrate concentrations. The initial reac-tion rate was 1.1 g L 1 h 1 and a 79% w/w conver-sion was obtained in 12 h. This suggests vanillin is a good substrate for the CV2025 w-Tam with both the rate and extent of conversion being higher than for many w-Tam substrates previously investigated (smithies et al. 2007). Confirmation of the identity of the vanillylamine product made in preparative scale bioconversions (section 3.2) was obtained by Ci mass spectrometry and NMR spectroscopy (see supplementary information to be found online at http://informahealthcare.com/doi/abs/10.3109/10242422.2014.976632).
Investigation of inhibition and equilibrium constraints. Commercial enzymatic synthesis of vanillylamine
will need to be achieved with high substrate conver-sion and high product concentrations in order to be economically viable. issues of substrate/product inhibition and equilibrium constraints can often limit the rates and yields of w-Tam bioconversions (yi et al. 2007) and so these were investigated in further detail.
For bioconversions operated at a fixed Mba con-centration of 20 mM, Figure 4 shows the influence of varying vanillin concentration on reaction rate and yield. in terms of equilibrium limitations, it was found that at low vanillin concentration up to 10 mM and Mba:vanillin ratio 2:1, quantitative
Figure 2. Proposed reaction mechanism for the w-Tam mediated synthesis of vanillylamine using Mba as amino donor. VaN (vanillin), VaNaM (vanillylamine), aP (acetophenone), e-PLP (enzyme bound pyridoxal 5’-phosphate), e-PMP (enzyme bound pyridoxamine5’-phosphate).
Figure 3. Confirmation of vanillin bioconversion by CV2025 w-Tam lysate: vanillin consumption (), vanillylamine production (). experimental conditions: pH 7.5, 30°C, 350 rpm, 300 mL, [vanillin] 20 mM, [Mba] 20 mM, 50 mM Tris buffer, 0.2 mM PLP. experiments performed as described in section 2.4.1.
GBAB_A_976632.INDD 6 10/28/2014 9:26:07 PM

1234567891011121314151617181920212223242526272829303132333435363738394041424344454647484950515253545556
57585960616263646566676869707172737475767778798081828384858687888990919293949596979899100101102103104105106107108109110111112
Synthesis of vanillylamine from vanillin 7
conversion of vanillin into vanillylamine was obtained in under 30 min. Higher concentrations of Mba thus drive the equilibrium toward vanillylamine for-mation. When the concentration of vanillin was over 10 mM, high conversions could still be gained by increasing the ratio of Mba:vanillin up to 4:1.
as shown above, increasing the ratio of Mba:vanillin could improve the conversion yield, however, it is important to also investigate potential substrate inhibition by Mba. The impact of Mba concentration, as a typical amino donor used in
w-Tam reactions (schell, et al. 2009), was thus eval-uated at a fixed initial vanillin concentration of 5 mM. Figure 5 shows that no inhibition to the bio-conversion was found for Mba concentrations up to 50 mM. in addition, once the ratio of Mba:vanillin concentration was over 2:1, any inhibitory influence of vanillin was apparently offset by the shift in reac-tion equilibrium to product formation.
achieving high product concentrations will be crucial for process economics and so the influence
Figure 5. effect of initial Mba concentration on bioconversion kinetics using CV2025 w-Tam lysate: (a) vanillin utilization; (b) vanillylamine production. experimental conditions: pH 7.5, 30°C, 350 rpm, 300 mL, [Mba] 5 mM (), 10 mM (), 20 mM (), 30 mM (), 40 mM () and 50 mM (), [vanillin] 5 mM, 50 mM Tris buffer, 0.2 mM PLP. experiments performed as described in section 2.4.3. error bars indicate the mean (n 3) one standard deviation.
Figure 4. effect of initial vanillin concentration on bioconversion kinetics using CV2025 w-Tam lysate: (a) vanillin utilization; (b) vanillylamine production. experimental conditions: pH 7.5, 30°C, 350 rpm, 300 mL, [vanillin] 5 mM (), 10 mM (), 20 mM () and 25 mM (), [Mba] 30 mM, 50 mM Tris buffer, 0.2 mM PLP. experiments performed as described in section 2.4.3. error bars indicate the mean (n 3) one standard deviation.
GBAB_A_976632.INDD 7 10/28/2014 9:26:10 PM

1234567891011121314151617181920212223242526272829303132333435363738394041424344454647484950515253545556
57585960616263646566676869707172737475767778798081828384858687888990919293949596979899100101102103104105106107108109110111112
8 C. J. Du et al.
of added vanillylamine on bioconversion kinetics was also studied with regard to product inhibition and increased back reaction rate (Rios-solis et al. 2013). since these experiments were performed at relatively high substrate concentrations, the reaction occurred over 24 h. based on Figure 6, it can be seen that the 75% w/w conversion achieved without added prod-uct continually decreased in proportion to the added concentration of vanillylamine. The observed
decreases in initial rate are most likely due to prod-uct inhibition while the decreases in yield are most likely due to the increases in the back reaction rate though further experiments would be needed to con-firm this. using Mba as amino donor, acetophe-none will be liberated as the by-product of the reaction in stoichiometric amounts. as shown in Figure 7, without acetophenone addition a 92% w/w conversion could be achieved, but this fell to 77% w/w once added concentrations of acetophenone were above 10 mM. again this could be due to either inhibition or equilibrium effects. Concomitant reduc-tions in initial reaction rate with increasing starting concentrations of acetophenone were also seen.
Figure 6. effect of added vanillylamine on the bioconversion kinetics of CV2025 w-Tam lysate: (a) vanillin utilization; (b) vanillylamine production with different initial added concentrations of vanillylamine: 0 mM (), 5 mM (), 10 mM (), 20 mM (). experimental conditions: pH 7.5, 30°C, 350 rpm, 300 mL, [Mba] 40 mM, [vanillin] 20 mM, 50 mM Tris buffer, 0.2 mM PLP. experiments performed as described in section 2.4.3. error bars indicate the mean (n 3) one standard deviation.
Figure 7. effect of added acetophenone on the bioconversion kinetics of CV2025 w-Tam lysate: (a) vanillin utilization; (b) vanillylamine production with different initial added concentrations of acetophenone: 0 mM (), 5 mM (), 10 mM (). experimental conditions: pH 7.5, 30°C, 350 rpm, 300 mL, [Mba] 10 mM, [vanillin] 10 mM, 50 mM Tris buffer, 0.2 mM PLP. experiments performed as described in section 2.4.3. error bars indicate the mean (n 3) one standard deviation.
GBAB_A_976632.INDD 8 10/28/2014 9:26:11 PM
1234567891011121314151617181920212223242526272829303132333435363738394041424344454647484950515253545556
57585960616263646566676869707172737475767778798081828384858687888990919293949596979899100101102103104105106107108109110111112
Synthesis of vanillylamine from vanillin 9
Determination of kinetic parameters. at this stage, it would be desirable to develop a reliable kinetic model in order to predict reaction rate and yield over a range of bioreactor operating conditions and it is known that w-Tam catalyzes amino group transfer by a ping-pong bi–bi mechanism (Kuramitsu et al. 1990). it has been reported for other w-Tam bio-conversions that a substrate or product can bind to the enzyme, creating dead end complexes that can-not react further, causing a potentially strong irre-versible inhibition (shin & Kim 1998; shin & Kim 2002). For the CV2025 w-Tam mediated synthesis of vanillylamine, the presence of abortive complexes in the reaction mechanism has not previously been determined; hence it was necessary to first elucidate the appropriate reaction mechanism.
The establishment of full kinetic models can be time and resource intensive, especially when using traditional linear data fitting methods (Chen et al. 2008). We have recently published a nonlinear regres-sion method to rapidly determine the most appropri-ate reaction model and the values of the associated kinetic parameters (Rios-solis et al. 2013). using this methodology, different kinetic models were first fitted to the experimental initial rate data of Figures 4 and 5 to identify a solution in the vicinity of the global minimum for the Michaelis–Menten values of the for-ward reaction. Those values were then used as initial guesses to perform nonlinear regressions of the data from Figures 6 and 7 to identify the exact location of the solution as well as the value of the other kinetic parameters. The initial value of kr was set as kf/10, since high equilibrium conversions were found exper-imentally, and the remainder of the initial values for other constants were set to 1. among all the models tested, the reaction mechanism shown in Figure 2 (b) which did not include any dead end complex forma-tion gave the best statistical fit to the data [39].
The resulting kinetic model can be represented by equation 1:
v k k e [Mba][VaN][aP][VaNaM]
K/ denf r iTam
eq
(1)
den k k [VaN] k K [Mba]
k [VaN][Mba]k K [VaNaM]
K
k
r Mba r VaN
rf aP
eq
ff VaNaM
eq
f
eq
r Mba
iVaNaM
K [aP]
K
k [aP][VaNaM]
K
k K [VaN][VaNaM]
K
k K [Mba][aP]
K Kf VaNaM
eq iMba
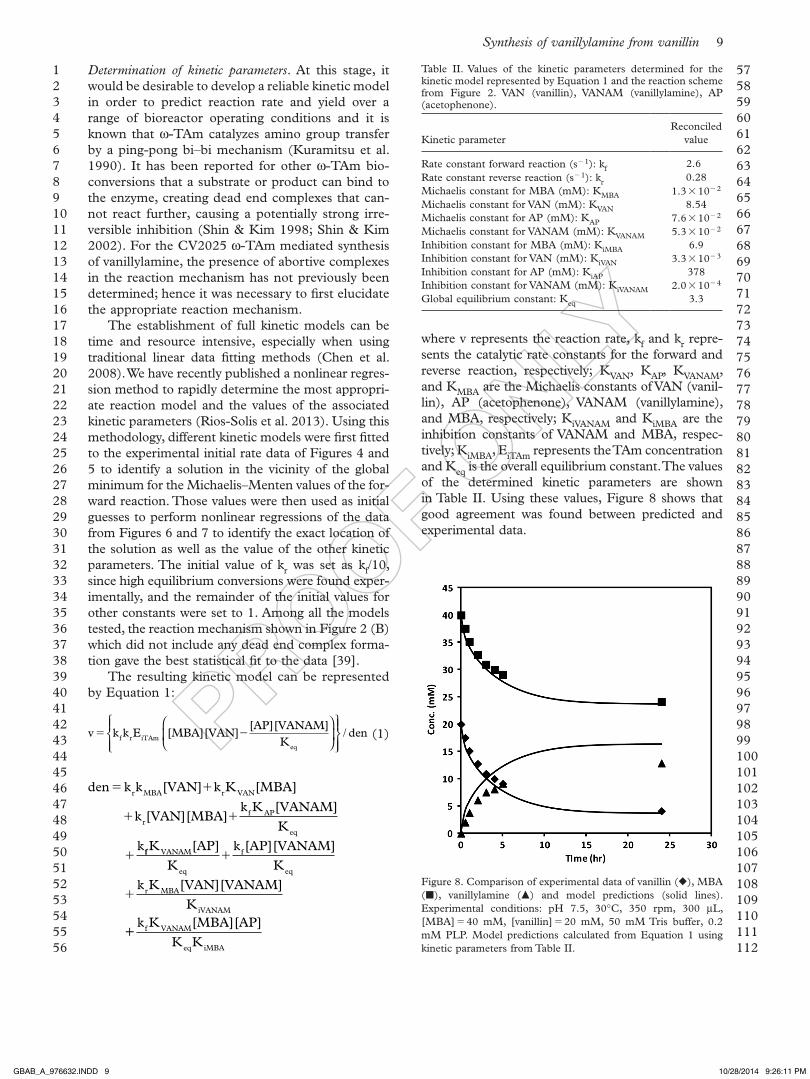
where v represents the reaction rate, kf and kr repre-sents the catalytic rate constants for the forward and reverse reaction, respectively; KVaN, KaP, KVaNaM, and KMba are the Michaelis constants of VaN (vanil-lin), aP (acetophenone), VaNaM (vanillylamine), and Mba, respectively; KiVaNaM and KiMba are the inhibition constants of VaNaM and Mba, respec-tively; KiMba, eiTam represents the Tam concentration and Keq is the overall equilibrium constant. The values of the determined kinetic parameters are shown in Table ii. using these values, Figure 8 shows that good agreement was found between predicted and experimental data.
Figure 8. Comparison of experimental data of vanillin (), Mba (), vanillylamine () and model predictions (solid lines). experimental conditions: pH 7.5, 30°C, 350 rpm, 300 mL, [Mba] 40 mM, [vanillin] 20 mM, 50 mM Tris buffer, 0.2 mM PLP. Model predictions calculated from equation 1 using kinetic parameters from Table ii.
Table ii. Values of the kinetic parameters determined for the kinetic model represented by equation 1 and the reaction scheme from Figure 2. VaN (vanillin), VaNaM (vanillylamine), aP (acetophenone).
Kinetic parameterReconciled
value
Rate constant forward reaction (s 1): kf 2.6Rate constant reverse reaction (s 1): kr 0.28Michaelis constant for Mba (mM): KMba 1.3 10 2
Michaelis constant for VaN (mM): KVaN 8.54Michaelis constant for aP (mM): KaP 7.6 10 2
Michaelis constant for VaNaM (mM): KVaNaM 5.3 10 2
inhibition constant for Mba (mM): KiMba 6.9inhibition constant for VaN (mM): KiVaN 3.3 10 3
inhibition constant for aP (mM): KiaP 378inhibition constant for VaNaM (mM): KiVaNaM 2.0 10 4
Global equilibrium constant: Keq 3.3
GBAB_A_976632.INDD 9 10/28/2014 9:26:11 PM
1234567891011121314151617181920212223242526272829303132333435363738394041424344454647484950515253545556
57585960616263646566676869707172737475767778798081828384858687888990919293949596979899100101102103104105106107108109110111112
10 C. J. Du et al.
The kinetic constants of the CV2025 w-Tam using erythrulose (eRy) and Mba as substrates have already been published (Rios-solis 2013). in that work, a low Michaelis–Menten constant of Mba was also found, and the forward kinetic constant was 60% lower than the one determined for vanillin in this work. The main kinetic bottleneck of the eRy and Mba w-Tam bioconversion was the high Michaelis–Menten constant of the amino acceptor eRy (95 mM). The bottleneck was alleviated in this work due to the 10-fold decrease in the Michaelis– Menten constant of the amino acceptor (8.5 mM), making vanillin a very suitable substrate for the CV2025 w-Tam.
The values of the equilibrium constant (3.3) and the vanillylamine inhibition constant, KiVaNaM sug-gest that increased back reaction rates and/or prod-uct inhibition most likely limit the economic viability of the reaction. These limitations could be alleviated by the implementation of techniques such as in situ product removal (Lye & Woodley 1999). Likewise substrate inhibition by vanillin was also observed but this could be overcome via in situ substrate supply (schmolzer et al. 2012) or adoption of a fed-batch operating strategy (see section 3.5).
Evaluation of different biocatalyst forms
For industrial implementation, it can be advanta-geous to select between either whole cell or isolated enzyme biocatalysts (Duetz et al. 2001). Table iii illustrates that both forms of the CV2025 w-Tam biocatalyst could satisfactorily perform the biocon-version. over 99% w/w conversion could be gained within 60 min when using the w-Tam lysate while an 88% w/w conversion was obtained using the whole cell form within the same time period. The initial rate of vanillylamine production from the
whole cell form was calculated as 0.12 mM min 1 which is ∼10% less than with lysate. in addition, the half-life of the biocatalysts was also examined with the results in Table iii indicating that both w-Tam biocatalyst forms were stable over 24 h.
Fed-batch vanillin bioconversions
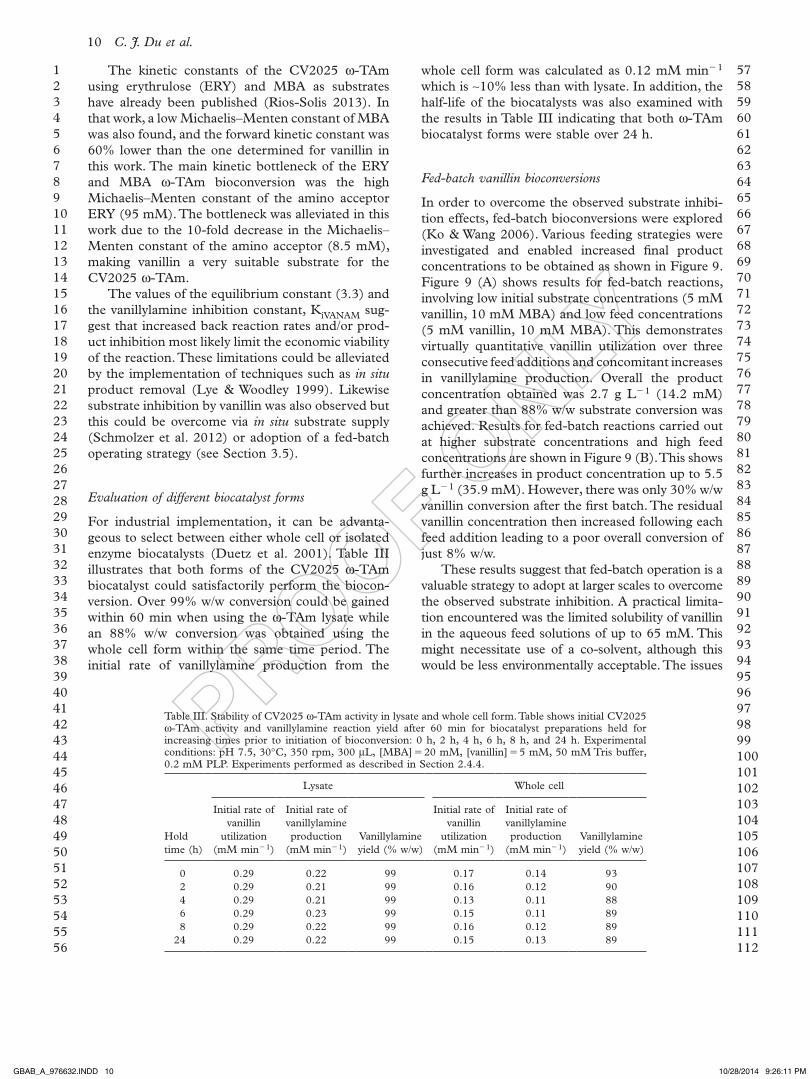
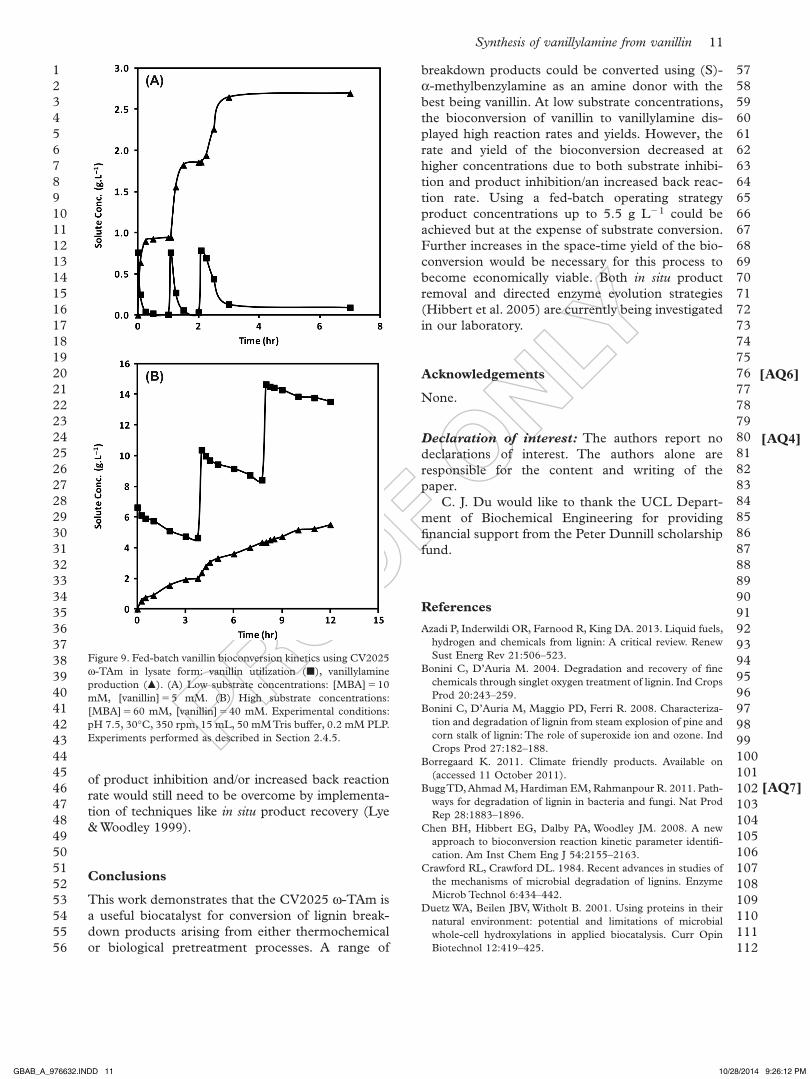
in order to overcome the observed substrate inhibi-tion effects, fed-batch bioconversions were explored (Ko & Wang 2006). Various feeding strategies were investigated and enabled increased final product concentrations to be obtained as shown in Figure 9. Figure 9 (a) shows results for fed-batch reactions, involving low initial substrate concentrations (5 mM vanillin, 10 mM Mba) and low feed concentrations (5 mM vanillin, 10 mM Mba). This demonstrates virtually quantitative vanillin utilization over three consecutive feed additions and concomitant increases in vanillylamine production. overall the product concentration obtained was 2.7 g L 1 (14.2 mM) and greater than 88% w/w substrate conversion was achieved. Results for fed-batch reactions carried out at higher substrate concentrations and high feed concentrations are shown in Figure 9 (b). This shows further increases in product concentration up to 5.5 g L 1 (35.9 mM). However, there was only 30% w/w vanillin conversion after the first batch. The residual vanillin concentration then increased following each feed addition leading to a poor overall conversion of just 8% w/w.
These results suggest that fed-batch operation is a valuable strategy to adopt at larger scales to overcome the observed substrate inhibition. a practical limita-tion encountered was the limited solubility of vanillin in the aqueous feed solutions of up to 65 mM. This might necessitate use of a co-solvent, although this would be less environmentally acceptable. The issues
Table iii. stability of CV2025 w-Tam activity in lysate and whole cell form. Table shows initial CV2025 w-Tam activity and vanillylamine reaction yield after 60 min for biocatalyst preparations held for increasing times prior to initiation of bioconversion: 0 h, 2 h, 4 h, 6 h, 8 h, and 24 h. experimental conditions: pH 7.5, 30°C, 350 rpm, 300 mL, [Mba] 20 mM, [vanillin] 5 mM, 50 mM Tris buffer, 0.2 mM PLP. experiments performed as described in section 2.4.4.
Hold time (h)
Lysate Whole cell
initial rate of vanillin
utilization (mM min 1)
initial rate of vanillylamine production
(mM min 1)Vanillylamine yield (% w/w)
initial rate of vanillin
utilization (mM min 1)
initial rate of vanillylamine production
(mM min 1)Vanillylamine yield (% w/w)
0 0.29 0.22 99 0.17 0.14 932 0.29 0.21 99 0.16 0.12 904 0.29 0.21 99 0.13 0.11 886 0.29 0.23 99 0.15 0.11 898 0.29 0.22 99 0.16 0.12 89
24 0.29 0.22 99 0.15 0.13 89
GBAB_A_976632.INDD 10 10/28/2014 9:26:11 PM
[AQ4]
[AQ7]
[AQ6]
1234567891011121314151617181920212223242526272829303132333435363738394041424344454647484950515253545556
57585960616263646566676869707172737475767778798081828384858687888990919293949596979899100101102103104105106107108109110111112
Synthesis of vanillylamine from vanillin 11
of product inhibition and/or increased back reaction rate would still need to be overcome by implementa-tion of techniques like in situ product recovery (Lye & Woodley 1999).
Conclusions
This work demonstrates that the CV2025 w-Tam is a useful biocatalyst for conversion of lignin break-down products arising from either thermochemical or biological pretreatment processes. a range of
breakdown products could be converted using (s)- a-methylbenzylamine as an amine donor with the best being vanillin. at low substrate concentrations, the bioconversion of vanillin to vanillylamine dis-played high reaction rates and yields. However, the rate and yield of the bioconversion decreased at higher concentrations due to both substrate inhibi-tion and product inhibition/an increased back reac-tion rate. using a fed-batch operating strategy product concentrations up to 5.5 g L 1 could be achieved but at the expense of substrate conversion. Further increases in the space-time yield of the bio-conversion would be necessary for this process to become economically viable. both in situ product removal and directed enzyme evolution strategies (Hibbert et al. 2005) are currently being investigated in our laboratory.
Acknowledgements
None.
Declaration of interest: The authors report no declarations of interest. The authors alone are responsible for the content and writing of the paper.
C. J. Du would like to thank the uCL Depart-ment of biochemical engineering for providing financial support from the Peter Dunnill scholarship fund.
References
azadi P, inderwildi oR, Farnood R, King Da. 2013. Liquid fuels, hydrogen and chemicals from lignin: a critical review. Renew sust energ Rev 21:506–523.
bonini C, D’auria M. 2004. Degradation and recovery of fine chemicals through singlet oxygen treatment of lignin. ind Crops Prod 20:243–259.
bonini C, D’auria M, Maggio PD, Ferri R. 2008. Characteriza-tion and degradation of lignin from steam explosion of pine and corn stalk of lignin: The role of superoxide ion and ozone. ind Crops Prod 27:182–188.
borregaard K. 2011. Climate friendly products. available on (accessed 11 october 2011).
bugg TD, ahmad M, Hardiman eM, Rahmanpour R. 2011. Path-ways for degradation of lignin in bacteria and fungi. Nat Prod Rep 28:1883–1896.
Chen bH, Hibbert eG, Dalby Pa, Woodley JM. 2008. a new approach to bioconversion reaction kinetic parameter identifi-cation. am inst Chem eng J 54:2155–2163.
Crawford RL, Crawford DL. 1984. Recent advances in studies of the mechanisms of microbial degradation of lignins. enzyme Microb Technol 6:434–442.
Duetz Wa, beilen JbV, Witholt b. 2001. using proteins in their natural environment: potential and limitations of microbial whole-cell hydroxylations in applied biocatalysis. Curr opin biotechnol 12:419–425.
Figure 9. Fed-batch vanillin bioconversion kinetics using CV2025 w-Tam in lysate form: vanillin utilization (), vanillylamine production (). (a) Low substrate concentrations: [Mba] 10 mM, [vanillin] 5 mM. (b) High substrate concentrations: [Mba] 60 mM, [vanillin] 40 mM. experimental conditions: pH 7.5, 30°C, 350 rpm, 15 mL, 50 mM Tris buffer, 0.2 mM PLP. experiments performed as described in section 2.4.5.
GBAB_A_976632.INDD 11 10/28/2014 9:26:12 PM
[AQ8]
1234567891011121314151617181920212223242526272829303132333435363738394041424344454647484950515253545556
57585960616263646566676869707172737475767778798081828384858687888990919293949596979899100101102103104105106107108109110111112
12 C. J. Du et al.
eriksson Ke. 1993. Concluding remarks: where do we stand and where are we going? Lignin biodegradation and practical utili-zation. J biotechnol 30:149–158.
Fahmi R, bridgwater aV, Thain sC, Donnison is, Morris PM, yates N. 2007. Prediction of Klason lignin and lignin thermal degradation products by Py-GC/Ms in a collection of Lolium and Festuca grasses. J anal appl Pyrolysis 80:16–23.
Fan PH. 2000. Price uncertainty and vertical integration: an examination of petrochemical firms. J Corp Finance 6: 345–376.
Fiechter a. 1993. Function and synthesis of enzymes involved in lignin degradation. J biotechnol 30:49–55.
FitzPatrick M, Champagne P, Cunningham MF, Whitney Ra. 2010. a biorefinery processing perspective: treatment of ligno-cellulosic materials for the production of value-added products. bioresour Technol 101:8915–8922.
Henderson RK, Jimenez-Gonzalez C, Preston C, Constable DJC, Woodley JM. 2008. eHs & LCa assessment for 7-aCa syn-thesis: a case study for comparing biocatalytic & chemical syn-thesis. ind biotech 4:180–192.
Hibbert eG, baganz F, Hailes HC, Ward JM, Lye GJ, Woodley JM, Dalby Pa. 2005. Directed evolution of biocata-lytic processes. biomol eng 22:11–19.
Huisman GW, Collier sJ. 2013. on the development of new biocatalytic processes for practical pharmaceutical synthesis. Curr opin Chem biol 17:284–292.
Huisman GW, Gray D. 2002. Towards novel processes for the fine-chemical and pharmaceutical industries. Curr opin biotechnol 13:352–358.
Kaulmann u, smithies K, smith Meb, Hailes HC, Ward JM. 2007. substrate spectrum of w-transaminase from Chromobac-terium violaceum DsM30191 and its potential for biocatalysis. enzyme Microb Technol 41:628–637.
Ko CL, Wang Fs. 2006. Run-to-run fed-batch optimization for protein production using recombinant Escherichia coli. biochem eng J 30:279–285.
Ko JJ, shimizu y, ikeda K, Kim sK, Park CH, Matsui s. 2009. biodegradation of high molecular weight lignin under sulfate reducing conditions: lignin degradability and degradation by-products. bioresour Technol 100:1622–1627.
Kuramitsu s, Hiromi K, Hayashi H, Morino y, Kagamiyama H. 1990. Pre-steady-state kinetics of Escherichia coli aspartate ami-notransferase catalyzed reactions and thermodynamic aspects of its substrate specificity. biochemistry 29:5469–5476.
Lye GJ, Woodley JM. 1999. application of in situ product-removal techniques to biocatalytic processes. Trends biotechnol 17: 395–402.
Meyer o, Heddesheimer i. 2005. Process for Preparing Vanil-lylamine Hydrochloride. ingelheim, De: u.s: boehringer ingel-heim Pharma KG. pp. 3.
Mohtashamipur e, Norpoth K. 1990. Release of mutagens after chemical or microbial degradation of beech wood lignin. Toxi-col Lett 51:277–285.
Pollard DJ, Woodley JM. 2007. biocatalysis for pharmaceutical intermediates: the future is now. Trends biotechnol 25:66–73.
Prather KL, Martin CH. 2008. De novo biosynthetic pathways: rational design of microbial chemical factories. Curr opin bio-technol 19:468–474.
Ralph Ns, Cheol Hy, Kyung WJ. 2001. synthesis of secondary amines. Tetrahedron 57:7785–7811.
Rios-solis L, bayir N, Halim M, Du C, Ward JM, baganz F, Lye GJ. 2013. Non-linear kinetic modelling of reversible bioconver-
sions: application to the transaminase catalyzed synthesis of chiral amino-alcohols. biochem eng J 73:38–48.
Rudat J, brucher bR, syldatk C. 2012. Transaminases for the synthesis of enantiopure beta-amino acids. aMb express 2:11.
saha bC, Demirjian DC. 2001. american Chemical society M, advances in applied b, american Chemical society. Division of biochemical T, american Chemical s. applied biocatalysis in specialty chemicals and pharmaceuticals. Washington, D.C.: oxford: american Chemical society; oxford university Press [distributor].
said sa. 2002. stereoselective Transformations of Chiral amines. Department of Chemistry: Norwegian university of science and Technology. pp. 1–26.
savile CK, Janey JM, Mundorff eC, Moore JC, Tam s, Jarvis WR, Colbeck JC, Krebber a, Fleitz FJ, brands J, Devine PN, Huisman GW, Hughes GJ. 2010. biocatalytic asymmetric synthesis of chiral amines from ketones applied to sitagliptin manufacture. science 329:305–309.
schell u, Wohlgemuth R, Ward JM. 2009. synthesis of pyridox-amine 5’-phosphate using an Mba:pyruvate transaminase as biocatalyst. J Mol Catal b enzym 59:279–285.
schmolzer K, Madje K, Nidetzky b, Kratzer R. 2012. bioprocess design guided by in situ substrate supply and product removal: process intensification for synthesis of (s)-1-(2-chlorophenyl)ethanol. bioresour Technol 108:216–223.
sheldon Ra. 1996. Chirotechnology: Designing economic chiral syntheses. J Chem Tech biotechnol 67:1–14.
shin Js, Kim bG. 1997. Kinetic resolution of alpha- methylbenzylamine with omicron-transaminase screened from soil microorganisms: application of a biphasic system to over-come product inhibition. biotechnol bioeng 55:348–358.
shin Js, Kim bG. 1998. Kinetic modeling of omega-transamina-tion for enzymatic kinetic resolution of alpha-methylben-zylamine. biotechnol bioeng 60:534–540.
shin Js, Kim bG. 2002. exploring the active site of amine:pyruvate aminotransferase on the basis of the substrate structure- reactivity relationship: how the enzyme controls substrate spe-cificity and stereoselectivity. J org Chem 67:2848–2853.
shin Js, Kim bG, Liese a, Wandrey C. 2001. Kinetic resolution of chiral amines with omega-transaminase using an enzyme-membrane reactor. biotechnol bioeng 73:179–187.
Taniguchi M, suzuki H, Watanabe D, sakai K, Hoshino K, Tanaka T. 2005. evaluation of pretreatment with Pleurotus ostreatus for enzymatic hydrolysis of rice straw. J biosci bioeng 100:637–643.
Tuomela M, Vikman M, Hatakka a, itavaara M. 2000. biodegra-dation of lignin in a compost environment: a review. bioresour Technol 72:169–183.
Vicuna R. 1988. bacterial degradation of lignin. enzyme Microb Technol 10:646–655.
Wang sy, Li D. 2011. The spillover effects on petrochemical industrial concentration of international oil price. energy Procedia 5:2444–2448.
Werhan H, Farshori a, Von Rohr PR. 2012. separation of lignin oxidation products by organic solvent nanofiltration. J Mem-brane sci 423–424:404–412.
yi ss, Lee CW, Kim J, Kyung D, Kim bG, Lee ys. 2007. Covalent immobilization of w-transaminase from Vibrio fluvialis Js17 on chitosan beads. Proc biochem 42:895–898.
Zimmermann W. 1990. Degradation of lignin by bacteria. J bio-technol 13:119–130.
Supplementary available online
supplementary information.
GBAB_A_976632.INDD 12 10/28/2014 9:26:12 PM
1234567891011121314151617181920212223242526272829303132333435363738394041424344454647484950515253545556
57585960616263646566676869707172737475767778798081828384858687888990919293949596979899100101102103104105106107108109110111112
1
Additional information
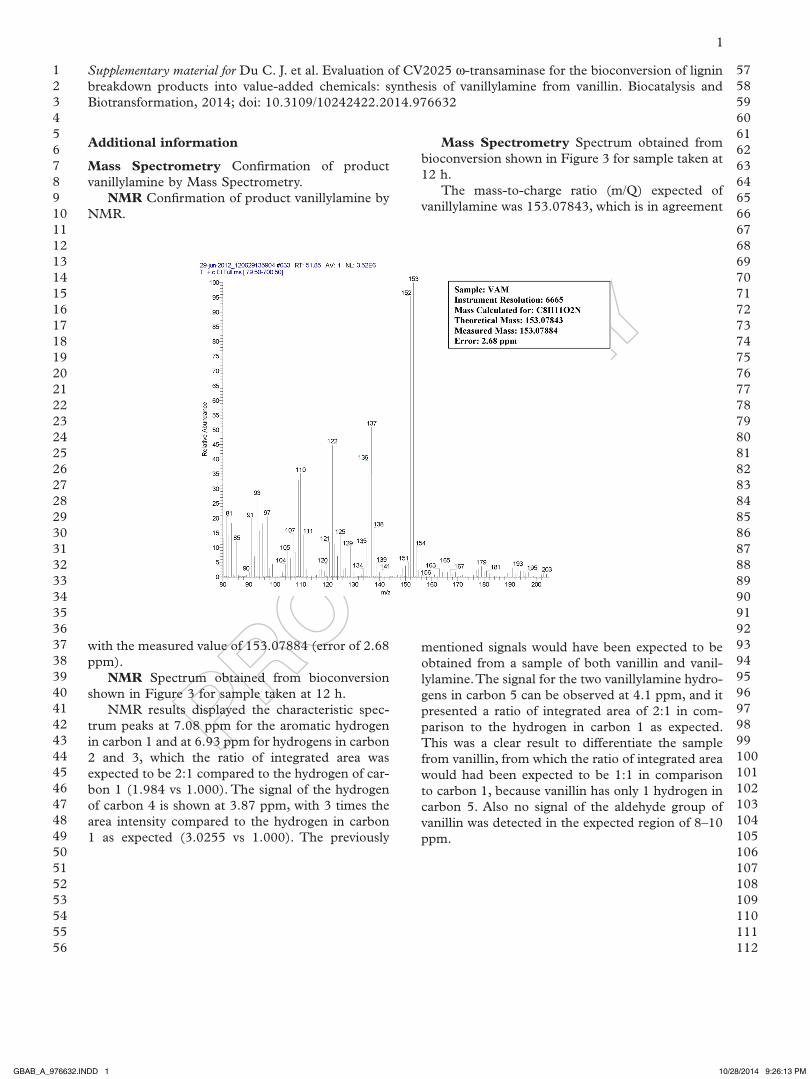
Mass Spectrometry Confirmation of product vanillylamine by Mass spectrometry.
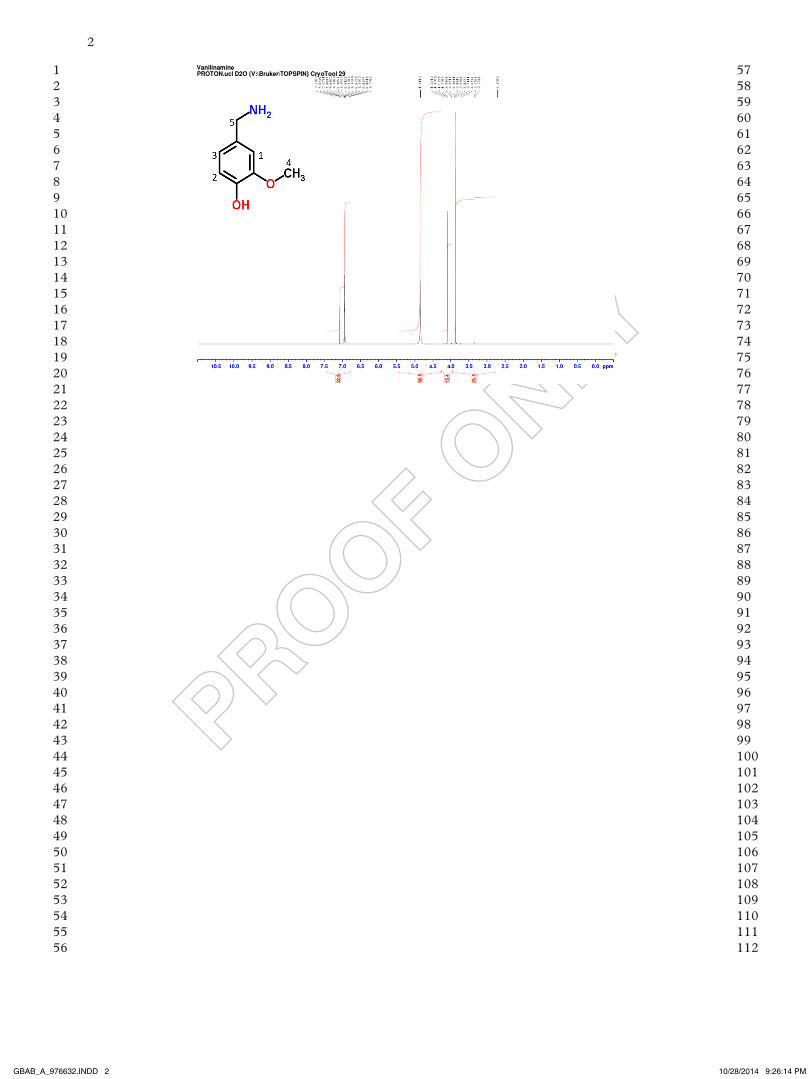
NMR Confirmation of product vanillylamine by NMR.
Supplementary material for Du C. J. et al. evaluation of CV2025 w-transaminase for the bioconversion of lignin breakdown products into value-added chemicals: synthesis of vanillylamine from vanillin. biocatalysis and biotransformation, 2014; doi: 10.3109/10242422.2014.976632
Mass Spectrometry spectrum obtained from bioconversion shown in Figure 3 for sample taken at 12 h.
The mass-to-charge ratio (m/Q) expected of vanillylamine was 153.07843, which is in agreement
with the measured value of 153.07884 (error of 2.68 ppm).
NMR spectrum obtained from bioconversion shown in Figure 3 for sample taken at 12 h.
NMR results displayed the characteristic spec-trum peaks at 7.08 ppm for the aromatic hydrogen in carbon 1 and at 6.93 ppm for hydrogens in carbon 2 and 3, which the ratio of integrated area was expected to be 2:1 compared to the hydrogen of car-bon 1 (1.984 vs 1.000). The signal of the hydrogen of carbon 4 is shown at 3.87 ppm, with 3 times the area intensity compared to the hydrogen in carbon 1 as expected (3.0255 vs 1.000). The previously
mentioned signals would have been expected to be obtained from a sample of both vanillin and vanil-lylamine. The signal for the two vanillylamine hydro-gens in carbon 5 can be observed at 4.1 ppm, and it presented a ratio of integrated area of 2:1 in com-parison to the hydrogen in carbon 1 as expected. This was a clear result to differentiate the sample from vanillin, from which the ratio of integrated area would had been expected to be 1:1 in comparison to carbon 1, because vanillin has only 1 hydrogen in carbon 5. also no signal of the aldehyde group of vanillin was detected in the expected region of 8–10 ppm.
GBAB_A_976632.INDD 1 10/28/2014 9:26:13 PM
1234567891011121314151617181920212223242526272829303132333435363738394041424344454647484950515253545556
57585960616263646566676869707172737475767778798081828384858687888990919293949596979899100101102103104105106107108109110111112
2
GBAB_A_976632.INDD 2 10/28/2014 9:26:14 PM
Copyright © 2022 FDOKUMEN