Non-linear kinetic modelling of reversible bioconversions: Application to the transaminase catalyzed...
11
Biochemical Engineering Journal 73 (2013) 38–48 Contents lists available at SciVerse ScienceDirect Biochemical Engineering Journal journa l h o me pa ge: www.elsevier.com/locate/bej Regular article Non-linear kinetic modelling of reversible bioconversions: Application to the transaminase catalyzed synthesis of chiral amino-alcohols L. Rios-Solis a , N. Bayir a , M. Halim a , C. Du a , J.M. Ward b , F. Baganz a , G.J. Lye a,∗ a Department of Biochemical Engineering, University College London, Torrington Place, London WC1E 7JE, UK b Institute of Structural and Molecular Biology, Darwin Building, University College London, Gower Street, London WC1E 6BT, UK a r t i c l e i n f o Article history: Received 30 July 2012 Received in revised form 4 January 2013 Accepted 15 January 2013 Available online 23 January 2013 Keywords: Nonlinear kinetic modelling Transaminase Reversible bioconversions Amino-alcohols Microscale high-throughput Reaction mechanism selection a b s t r a c t This work describes the establishment of a full kinetic model, including values of apparent kinetic parameters, for the whole cell E. coli mediated synthesis of the chiral amino-alcohol (2S,3R)-2-amino- 1,3,4-butanetriol (ABT), using (S)-(−)--methylbenzylamine (MBA) as amino donor. The whole cell biocatalyst expressed the CV2025 -transaminase from Chromobacterium violaceum. Establishment of the most suitable reaction mechanism and determination of the complete forward and reverse kinetic parameter values for the reversible bioconversion where obtained using a hybrid methodology. This combined traditional initial rate experiments to identify a solution in the vicinity of the global mini- mum, with nonlinear regression methods to determine the exact location of the solution. The systematic procedure included selection and statistical evaluation of different kinetic models that best described the measured reaction rates and which ultimately provided new insights into the reaction mechanism; in particular the possible formation of a dead end complex between the amino donor and the cofactor enzyme complex. The hybrid methodology was combined with a microscale experimental platform, to significantly reduce both the number of experiments required as well as the time and material required for full kinetic parameter estimation. The equilibrium constant was determined to be 849, and the for- ward and reverse rate constants were found to be 97 and 13 min −1 , respectively, which greatly favoured the asymmetric synthesis of chiral ABT. Using the established kinetic model, the asymmetric synthesis of ABT was simulated, and excellent agreement was found between the experimental and predicted data over a range of reaction conditions. A sensitivity analysis combined with various simulations suggested the crucial bottleneck of the reaction was the second half reaction of the ping pong bi–bi mechanism, in part due to the low Michaelis constant of substrate l-erythrulose (ERY). The toxicity of MBA towards the transaminase was identified as another major bottleneck. The kinetic model was useful to give early insights into the most appropriate bioconversion conditions, which can improve the rate and yield of ABT formation, as well as minimizing the toxicity and inhibition effects of the substrates and products. The systematic methodology developed here is considered to be generic and useful in regard to speeding up bioconversion process design and optimization. © 2013 Elsevier B.V. All rights reserved. 1. Introduction Chiral amino-alcohols are of great interest to the pharmaceuti- cal and fine-chemical industries, as they are useful building blocks in the synthesis of optically pure pharmaceuticals like HIV pro- tease inhibitors [20,25], active molecules such as (S)-amphetamine [41] or broad spectrum antibiotics like chloramphenicol and thi- amphenicol ([6,57]). The standard chemical synthesis of optically pure amino-alcohols is usually complex, requiring many steps and resulting in low overall productivities ([49,58]). Transaminases (TAm), are a group of enzymes that can directly convert a carbonyl ∗ Corresponding author. Tel.: +44 020 7679 7942. E-mail address: [email protected] (G.J. Lye). to an amino group [14], and have been shown to be a promising alternative for the asymmetric synthesis of chiral amino-alcohols [22,40,49,48]. Compared to other enzymes performing the same conversion, like the acid or amine dehydrogenases [7], TAm has some clear advantages including broad substrate specificity, no need for redox cofactor recycling and high stereoselectivity [51,50]. Transaminases have been classified into 4 different groups based on primary structure, and into different subgroups depending of the classification of the substrates utilized [35]. The -TAms, belong- ing to Group II, can catalyze substrates not generally accepted by the other TAms, including primary amine compounds not bearing a carboxylic group [59]. Among them, the -TAm from Chromobac- terium violaceum 2025 (CV2025 TAm) showed the best performance for amino-alcohol synthesis from a pool of several other TAms cloned by us in previous work [22]. Applications of TAms have been 1369-703X/$ – see front matter © 2013 Elsevier B.V. All rights reserved. http://dx.doi.org/10.1016/j.bej.2013.01.010
Transcript of Non-linear kinetic modelling of reversible bioconversions: Application to the transaminase catalyzed...

R
Nt
La
b
a
ARRAA
KNTRAMR
1
cit[apr(
1h
Biochemical Engineering Journal 73 (2013) 38– 48
Contents lists available at SciVerse ScienceDirect
Biochemical Engineering Journal
journa l h o me pa ge: www.elsev ier .com/ locate /be j
egular article
on-linear kinetic modelling of reversible bioconversions: Application to theransaminase catalyzed synthesis of chiral amino-alcohols
. Rios-Solisa, N. Bayira, M. Halima, C. Dua, J.M. Wardb, F. Baganza, G.J. Lyea,∗
Department of Biochemical Engineering, University College London, Torrington Place, London WC1E 7JE, UKInstitute of Structural and Molecular Biology, Darwin Building, University College London, Gower Street, London WC1E 6BT, UK
r t i c l e i n f o
rticle history:eceived 30 July 2012eceived in revised form 4 January 2013ccepted 15 January 2013vailable online 23 January 2013
eywords:onlinear kinetic modellingransaminaseeversible bioconversionsmino-alcoholsicroscale high-throughput
eaction mechanism selection
a b s t r a c t
This work describes the establishment of a full kinetic model, including values of apparent kineticparameters, for the whole cell E. coli mediated synthesis of the chiral amino-alcohol (2S,3R)-2-amino-1,3,4-butanetriol (ABT), using (S)-(−)-�-methylbenzylamine (MBA) as amino donor. The whole cellbiocatalyst expressed the CV2025 �-transaminase from Chromobacterium violaceum. Establishment ofthe most suitable reaction mechanism and determination of the complete forward and reverse kineticparameter values for the reversible bioconversion where obtained using a hybrid methodology. Thiscombined traditional initial rate experiments to identify a solution in the vicinity of the global mini-mum, with nonlinear regression methods to determine the exact location of the solution. The systematicprocedure included selection and statistical evaluation of different kinetic models that best describedthe measured reaction rates and which ultimately provided new insights into the reaction mechanism;in particular the possible formation of a dead end complex between the amino donor and the cofactorenzyme complex. The hybrid methodology was combined with a microscale experimental platform, tosignificantly reduce both the number of experiments required as well as the time and material requiredfor full kinetic parameter estimation. The equilibrium constant was determined to be 849, and the for-ward and reverse rate constants were found to be 97 and 13 min−1, respectively, which greatly favouredthe asymmetric synthesis of chiral ABT. Using the established kinetic model, the asymmetric synthesisof ABT was simulated, and excellent agreement was found between the experimental and predicted dataover a range of reaction conditions. A sensitivity analysis combined with various simulations suggestedthe crucial bottleneck of the reaction was the second half reaction of the ping pong bi–bi mechanism,
in part due to the low Michaelis constant of substrate l-erythrulose (ERY). The toxicity of MBA towardsthe transaminase was identified as another major bottleneck. The kinetic model was useful to give earlyinsights into the most appropriate bioconversion conditions, which can improve the rate and yield of ABTformation, as well as minimizing the toxicity and inhibition effects of the substrates and products. Thesystematic methodology developed here is considered to be generic and useful in regard to speeding upbioconversion process design and optimization.. Introduction
Chiral amino-alcohols are of great interest to the pharmaceuti-al and fine-chemical industries, as they are useful building blocksn the synthesis of optically pure pharmaceuticals like HIV pro-ease inhibitors [20,25], active molecules such as (S)-amphetamine41] or broad spectrum antibiotics like chloramphenicol and thi-mphenicol ([6,57]). The standard chemical synthesis of optically
ure amino-alcohols is usually complex, requiring many steps andesulting in low overall productivities ([49,58]). TransaminasesTAm), are a group of enzymes that can directly convert a carbonyl∗ Corresponding author. Tel.: +44 020 7679 7942.E-mail address: [email protected] (G.J. Lye).
369-703X/$ – see front matter © 2013 Elsevier B.V. All rights reserved.ttp://dx.doi.org/10.1016/j.bej.2013.01.010
© 2013 Elsevier B.V. All rights reserved.
to an amino group [14], and have been shown to be a promisingalternative for the asymmetric synthesis of chiral amino-alcohols[22,40,49,48]. Compared to other enzymes performing the sameconversion, like the acid or amine dehydrogenases [7], TAm hassome clear advantages including broad substrate specificity, noneed for redox cofactor recycling and high stereoselectivity [51,50].
Transaminases have been classified into 4 different groups basedon primary structure, and into different subgroups depending of theclassification of the substrates utilized [35]. The �-TAms, belong-ing to Group II, can catalyze substrates not generally accepted bythe other TAms, including primary amine compounds not bearing
a carboxylic group [59]. Among them, the �-TAm from Chromobac-terium violaceum 2025 (CV2025 TAm) showed the best performancefor amino-alcohol synthesis from a pool of several other TAmscloned by us in previous work [22]. Applications of TAms have been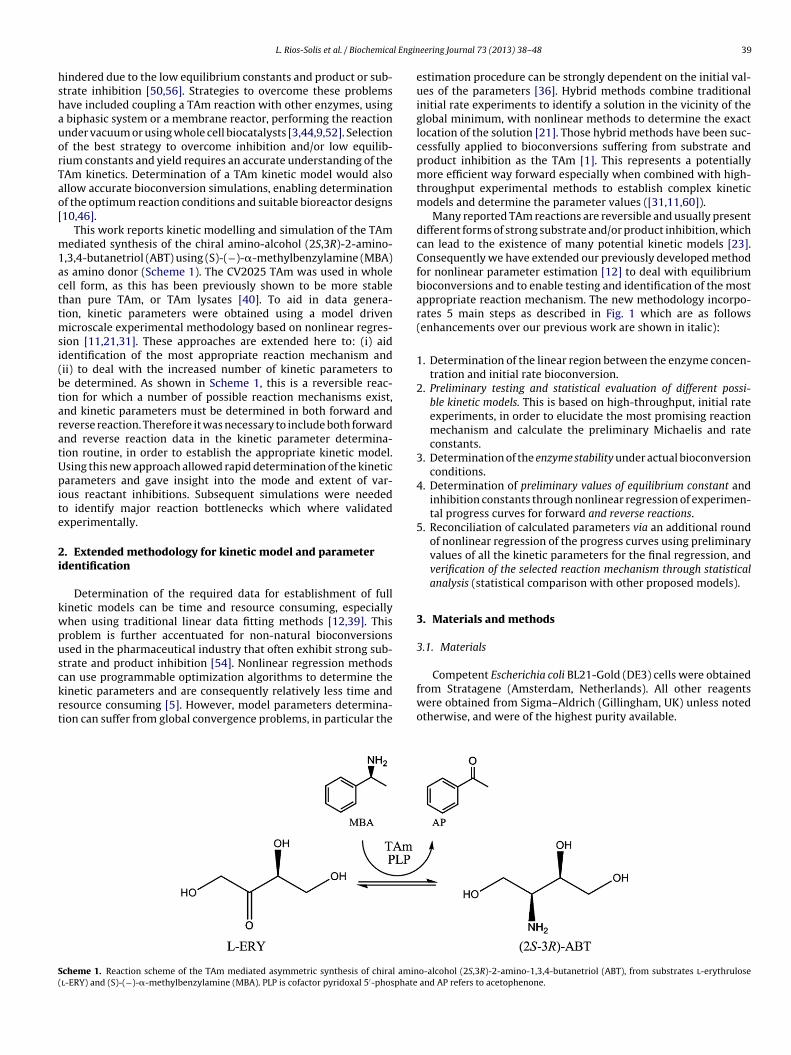
l Engin
hshauorTao[
m1acttmsi(btaratUpite
2i
kwpusckrt
S(
L. Rios-Solis et al. / Biochemica
indered due to the low equilibrium constants and product or sub-trate inhibition [50,56]. Strategies to overcome these problemsave included coupling a TAm reaction with other enzymes, using
biphasic system or a membrane reactor, performing the reactionnder vacuum or using whole cell biocatalysts [3,44,9,52]. Selectionf the best strategy to overcome inhibition and/or low equilib-ium constants and yield requires an accurate understanding of theAm kinetics. Determination of a TAm kinetic model would alsollow accurate bioconversion simulations, enabling determinationf the optimum reaction conditions and suitable bioreactor designs10,46].
This work reports kinetic modelling and simulation of the TAmediated synthesis of the chiral amino-alcohol (2S,3R)-2-amino-
,3,4-butanetriol (ABT) using (S)-(−)-�-methylbenzylamine (MBA)s amino donor (Scheme 1). The CV2025 TAm was used in wholeell form, as this has been previously shown to be more stablehan pure TAm, or TAm lysates [40]. To aid in data genera-ion, kinetic parameters were obtained using a model driven
icroscale experimental methodology based on nonlinear regres-ion [11,21,31]. These approaches are extended here to: (i) aiddentification of the most appropriate reaction mechanism andii) to deal with the increased number of kinetic parameters toe determined. As shown in Scheme 1, this is a reversible reac-ion for which a number of possible reaction mechanisms exist,nd kinetic parameters must be determined in both forward andeverse reaction. Therefore it was necessary to include both forwardnd reverse reaction data in the kinetic parameter determina-ion routine, in order to establish the appropriate kinetic model.sing this new approach allowed rapid determination of the kineticarameters and gave insight into the mode and extent of var-
ous reactant inhibitions. Subsequent simulations were neededo identify major reaction bottlenecks which where validatedxperimentally.
. Extended methodology for kinetic model and parameterdentification
Determination of the required data for establishment of fullinetic models can be time and resource consuming, especiallyhen using traditional linear data fitting methods [12,39]. Thisroblem is further accentuated for non-natural bioconversionssed in the pharmaceutical industry that often exhibit strong sub-trate and product inhibition [54]. Nonlinear regression methods
an use programmable optimization algorithms to determine theinetic parameters and are consequently relatively less time andesource consuming [5]. However, model parameters determina-ion can suffer from global convergence problems, in particular thecheme 1. Reaction scheme of the TAm mediated asymmetric synthesis of chiral aminl-ERY) and (S)-(−)-�-methylbenzylamine (MBA). PLP is cofactor pyridoxal 5′-phosphate
eering Journal 73 (2013) 38– 48 39
estimation procedure can be strongly dependent on the initial val-ues of the parameters [36]. Hybrid methods combine traditionalinitial rate experiments to identify a solution in the vicinity of theglobal minimum, with nonlinear methods to determine the exactlocation of the solution [21]. Those hybrid methods have been suc-cessfully applied to bioconversions suffering from substrate andproduct inhibition as the TAm [1]. This represents a potentiallymore efficient way forward especially when combined with high-throughput experimental methods to establish complex kineticmodels and determine the parameter values ([31,11,60]).
Many reported TAm reactions are reversible and usually presentdifferent forms of strong substrate and/or product inhibition, whichcan lead to the existence of many potential kinetic models [23].Consequently we have extended our previously developed methodfor nonlinear parameter estimation [12] to deal with equilibriumbioconversions and to enable testing and identification of the mostappropriate reaction mechanism. The new methodology incorpo-rates 5 main steps as described in Fig. 1 which are as follows(enhancements over our previous work are shown in italic):
1. Determination of the linear region between the enzyme concen-tration and initial rate bioconversion.
2. Preliminary testing and statistical evaluation of different possi-ble kinetic models. This is based on high-throughput, initial rateexperiments, in order to elucidate the most promising reactionmechanism and calculate the preliminary Michaelis and rateconstants.
3. Determination of the enzyme stability under actual bioconversionconditions.
4. Determination of preliminary values of equilibrium constant andinhibition constants through nonlinear regression of experimen-tal progress curves for forward and reverse reactions.
5. Reconciliation of calculated parameters via an additional roundof nonlinear regression of the progress curves using preliminaryvalues of all the kinetic parameters for the final regression, andverification of the selected reaction mechanism through statisticalanalysis (statistical comparison with other proposed models).
3. Materials and methods
3.1. Materials
Competent Escherichia coli BL21-Gold (DE3) cells were obtainedfrom Stratagene (Amsterdam, Netherlands). All other reagentswere obtained from Sigma–Aldrich (Gillingham, UK) unless notedotherwise, and were of the highest purity available.
o-alcohol (2S,3R)-2-amino-1,3,4-butanetriol (ABT), from substrates l-erythrulose and AP refers to acetophenone.
40 L. Rios-Solis et al. / Biochemical Engineering Journal 73 (2013) 38– 48
F ationm
3
TNvm[
3
tbc
ig. 1. Overview of the systematic procedure for rapid kinetic parameter determinediated synthesis of ABT from ERY and MBA (Scheme 1).
.2. Transaminase plasmid
Plasmid pQR801 contained the complete C. violaceum 2025Am gene with a N-Terminal His6-tag (GenBank accession no.P 901695). Plasmid pQR801 was constructed using the expressionector pET29(a) + (5.3 kb), which contains an inducible T7 pro-oter, the Lac repressor and codes for resistance to kanamycin
22].
.3. TAm whole cell biocatalyst preparation
Competent E. coli BL21-Gold (DE3) cells were transformed withhe plasmid pQR801 using the heat shock technique describedy the supplier (Stratagene, Amsterdam, Netherlands). For wholeell bioconversions, fresh cells were always used and they were
for a reversible bioconversion. The approach is illustrated for the whole cell TAm
produced as follows: an overnight culture of the transformed cellswas obtained in a 100 ml shake flask (10 ml working volume) of lb-glycerol broth (10 g l−1 tryptone, 5 g l−1 yeast extract, 10 g l−1 NaCland 10 g l−1 glycerol) containing 150 �g ml−1 kanamycin. Growthwas performed at 37 ◦C with orbital shaking at 250 rpm using an SI50 orbital shaker (Stuart Scientific, Redhill, UK). The total volume ofthis culture was used to inoculate a 1 l shake flask (100 ml workingvolume) and when the OD600 reached a value of 0.5, isopropylth-iogalactopyranoside (IPTG) was added to a final concentration of0.2 mM. After 6 h induction, the cells were harvested and follow-ing the removal of broth by centrifugation, they were resuspended
in 200 mM HEPES buffer, pH 7.5 and used for whole cell biocon-versions. When a TAm lysate was needed, the cells were sonicatedwith a Soniprep 150 sonicator (MSE, Sanyo, Japan). The sonicatedlysate was then centrifuged at 5000 rpm in Falcon tubes for 5 min
l Engin
tau
3
boEtL3oddccwsfottmvcwatfTnobFdtr
3
6Cioa
HRwccd[3pCChwNmup
experiments.This limit of 0.8 mg ml−1 is one order of magnitude smaller when
compared to other types of enzymes like transketolase [12]. Theobservation of a lower limit of proportionality among TAms has
L. Rios-Solis et al. / Biochemica
o remove cell debris, and the clarified supernatant was finallyliquoted into 1.5 ml Eppendorf vials to be stored at −20 ◦C andsed within 1 month.
.4. Microscale experimental platform
All bioconversions were performed in a glass 96-well, flat-ottomed microtiter plate with individual wells having a diameterf 7.6 mm and height of 12 mm (Radleys Discovery Technologies,ssex, UK). The microplate was covered with a thermo plastic elas-omer cap designed to work with automated equipment (Micronic,elystad, Netherlands). All bioconversions were performed using00 �l total volume at 30 ◦C, pH 7.5 unless noted otherwise. Shakingccurred at 400 rpm using a Thermomixer Comfort shaker (Eppen-orf, Cambridge, UK) (shaking diameter of 3 mm) situated on theeck of a Tecan Genesis laboratory robotic platform [61]. TAm bio-onversions were carried out in 200 mM HEPES buffer, and theoncentration of TAm cofactor pyridoxal 5′-phosphate (PLP) usedas 0.2 mM. In all cases, the whole cell suspension and the cofactor
olution were always added first in the well and left to incubateor 20 min at 30 ◦C, prior to initiation of the reaction by additionf the substrate solutions. Previous studies have shown that ini-ial incubation with cofactor was necessary to allow the enzymeo bind to PLP [15,38]. This practice also enabled more consistent
easurement of specific activity data, by avoiding initial nonlinearariation of product concentration believed to be caused in someases by the binding of the enzyme and cofactors. Aliquots of 20 �lere taken at various time intervals and quenched with 380 �l of
0.1% (v/v) trifluoroacetic acid (TFA) solution. They were then cen-rifuged for 5 min at 5000 rpm and transferred into an HPLC vialor further analysis. All experiments were performed in triplicate.he specific activities were determined as the amount of acetophe-one and ABT formed per unit of time normalized by the amountf enzyme used in the reaction. The specific activity was calculatedased on the measured mass of TAm present in each bioconversion.or whole cell experiments, it was calculated based on 50% of thery cell weight of the cells being protein [62], combined with quan-itative SDS-PAGE analysis of the percentage of the total proteinepresented by the overexpressed TAm.
.5. Analytical methods
Biomass concentration was measured as optical density at00 nm (OD600) using a spectrophotometer (Thermo Spectronic,ambridge, UK) and converted to dry cell weight (DCW) using a cal-
bration curve where 1 OD600 = 0.4 gDCW l−1. Protein concentrationsf the lysates were obtained using a Bradford assay and SDS-PAGEs described previously [22].
A Dionex HPLC system (Camberley, UK) with a Bio-Rad AminexPX-87H reverse phase column (300 mm × 7.8 mm, Bio-Rad Labs.,ichmond, CA, USA), controlled by Chromeleon client 6.60 soft-are was used for the separation and analysis of ERY. The system
omprised a GP50 gradient pump, a FAMOS autosampler, an LC30hromatography column oven and an AD20 UV/vis absorbanceetector. The HPLC method used has been described previously11]. To quantify MBA, AP and ABT, an integrated Dionex ultimate000 HPLC system (Camberley, UK) with an ACE 5 C18 reversehase column (150 mm × 4.6 mm, 5 �m particle size; Advancehromatography Technologies, Aberdeen, UK) controlled byhromeleon client 6.60 software was employed. The HPLC methodas been reported elsewhere [22]. To analyze ABT, the samplesere derivatized by addition of an excess of 6-aminoquinolyl-
-hydroxysuccinimidyl carbamate. The derivatizing reagent wasade in house following the protocol of [63], and the HPLC methodsed has been described previously [19]. ABT standards wererepared in a multi-step chemical synthesis described elsewhere
eering Journal 73 (2013) 38– 48 41
[19,48]. The ee of ABT was determined by first derivatizing theamino-alcohol to the respective benzoate form. The assay wasperformed against the four diastereomer samples of the ben-zoate synthesized as described elsewhere [48] using chiral HPLC:Chiracel-OD column (Daicel); mobile phase, isopropanol/hexane(5:95); flow rate, 0.8 ml min−1, detection, UV 210 nm. Examples ofthe different HPLC profiles have been published elsewhere [40].
3.6. Nonlinear regression methods
In order to implement the procedure illustrated in Fig. 1, aprogramme was developed using Matlab® software (MathWorks,Natick, MA, USA) in order to automatically perform all the nonlinearregressions and statistical analyses. All the nonlinear regressionswere performed using the mesh adaptive pattern search algorithmin Matlab® known as: “The Genetic Algorithm and Direct SearchToolbox”. This method was previously shown to be more likely toachieve global optimization than gradient-based methods [11].
4. Results
4.1. Proportionality between reaction rate and enzymeconcentrations
As described in Fig. 1, the first step to obtain the kinetic param-eters is to determine the region of linear proportionality betweenTAm concentration and the measured initial reaction rate. This wasnecessary to ensure that any increase in enzyme concentrationwould contribute fully to the measured kinetics [11]. It is commonthat increasing the enzyme concentration in a reaction does notcorrespond to a proportional increase in the initial bioconversionrate due to mass transfer limitations or certain forms of inhibition[27]. For the synthesis of ABT (Scheme 1), the substrate concen-trations used were 10 mM MBA and 50 mM ERY for each enzymeconcentration. Under these conditions the linear relationship couldbe maintained up to a TAm concentration of 0.8 mg ml−1 as can beenin Fig. 2. This value was thus set as the upper limit for all subsequent
Fig. 2. Initial rate of TAm mediated synthesis of ABT (Scheme 1 1as a function ofTAm concentration in whole cell form. Reaction conditions: 0.2 mg ml−1 [TAm] inwhole cell form, 10 mM [MBA] and 50 mM [ERY], 0.2 mM PLP, 30 ◦C and pH 7.5 in200 mM HEPES buffer. Solid line fitted by linear regression (R2 0.998). Error barsrepresent one standard deviation about the mean (n = 3).

42 L. Rios-Solis et al. / Biochemical Engineering Journal 73 (2013) 38– 48
Fig. 3. Initial rate of the forward reaction for the TAm mediated synthesis of ABT(Scheme 1 1as a function of substrate concentration: (•) [MBA] varied while main-ta0
bcmacmcn
4q
imrrActvwoIss3atam
ttahppoons
Fig. 4. Apparent initial rate of the TAm reverse reaction for the synthesis of ABTand MBA as function of the concentration of substrates: (�) varying [ABT] whilemaintaining [AP] fixed at 35 mM using pure enzyme and (�) TAm in whole cellform, (©) varying [AP] while maintaining [ABT] fixed at 100 mM using pure enzyme
corresponding rate model is derived in Eq. (1) [46,4]:
v = {kfkrEiTAm([MBA][ERY] − (([AP][ABT])Keq))}den
(1)
aining initial [ERY] at 200 mM, (�) [ERY] varied while maintaining initial [MBA]t 10 mM. In all experiments 0.2 mg ml−1 [TAm] in whole cell form was used with.2 mM [PLP], 30 ◦C and pH 7.5 in 200 mM HEPES buffer.
een reported before [2]. A possible explanation is that the enzymean show self-inhibition where an end amino group of one TAmolecule might bind the pyridoxal phosphate associated with the
ctive site of another enzyme molecule [16]. In the case of wholeell forms of TAm, mass transfer limitations across the cell wallight also be the cause [37,53]. However, provided that this TAm
oncentration of 0.8 mg ml−1 is not exceeded, such effects did noteed to be accounted for.
.2. Preliminary reaction mechanism identification anduantification of initial rates for forward and reverse reactions
Following the second step of the procedure (Fig. 1), a set ofnitial rate data varying the concentration of one substrate, while
aintaining the other one fixed was obtained for both forward andeverse reactions for the TAm mediated synthesis of ABT and MBAespectively (Scheme 1). Fig. 3 shows the measured initial rate ofBT formation for the forward reaction as a function of varyingoncentration of substrate ERY while maintaining the concentra-ion of MBA fixed at 10 mM. Also shown in Fig. 3 are results of theariation of initial rate as a function of the concentration of MBAhile maintaining ERY at 200 mM. Strong inhibition of MBA can be
bserved at concentrations higher than 10 mM of the amino donor.n a similar way for the reverse reaction, Fig. 4 shows the mea-ured initial reaction rate as a function of varying concentration ofubstrate ABT, while maintaining the concentration of AP fixed at5 mM. Also shown in Fig. 4 is the initial rate of the reverse reactions a function of AP concentration while maintaining ABT concen-ration at 100 mM. Most noticeable when comparing the forwardnd reverse reaction rates is that the reverse reaction is an order ofagnitude slower than the forward rate.In terms of elucidating the appropriate reaction mechanism for
he TAm mediated synthesis of ABT, it is known that TAm requireshe cofactor pyridoxal 5′-phosphate and that it catalyses enzymaticmino group transfer by a ping-pong bi–bi mechanism [8,24]. Itas been reported for other TAm bioconversions that a substrate orroduct can bind an incorrect enzyme form, creating dead end com-lexes that cannot react further, causing a potentially strong form
f inhibition [8,45–47]. For the CV2025 TAm mediated synthesisf ABT, the presence of abortive complexes in the reaction mecha-ism was not previously been shown, hence it provides a good testystem on which to elaborate the methodology shown in Fig. 1.and (•) TAm in whole cell form. In all experiments 0.2 mg ml−1 of TAm in whole cellor pure form was used with 0.2 mM PLP, 30 ◦C and pH 7.5 in 200 mM HEPES. Errorbars represent one standard deviation about the mean (n = 3).
Consequently different kinetic models were initially fitted by non-linear regression to the experimental initial rate data shown in Figs3 and 4. These explored the possibility of different dead end com-plex formation with the aim of identifying the most suitable prelim-inary kinetic model (which would be further verified in Step 5 of theproposed methodology). Among all the models tested, the reactionmechanism which included substrate inhibition by the formation ofthe dead end complex E–PMP–MBA gave the best statistical fitting,with an R2 of 0.98 and a sum of squares of 0.24. This was signif-icantly better than the R2 of 0.87 and sum of squares of 14.2 forthe second best fitting model which did not include any substrateinhibition by a dead end complex. The resulting King–Altman fig-ure for the selected reaction pathway is presented in Fig. 5, and the
Fig. 5. Proposed King–Altman figure for the TAm mediated synthesis of ABT. Solidlines represent the basic kinetic model without the formation of abortive complexes.The dashed arrows represent substrate inhibition via formation of dead end complexE–PMP–MBA.
l Engineering Journal 73 (2013) 38– 48 43
d
wctAcsc
b
scK
tnewtTta
opcwptE
abBhw
Tghvnattctttbra
Fig. 6. Evaluation of whole cell TAm biocatalyst stability: forward initial reactionrates after incubation with (•) 50 mM [ERY] or (©) 50 mM [MBA]; reverse initialreaction rates after incubation with (�) 100 mM [ABT] or (�) 35 mM [AP]. In allexperiments 0.2 mg ml−1 of TAm in whole cell form was used with 0.2 mM PLP,30 ◦C and pH 7.5 in 200 mM HEPES buffer. Reaction conditions for forward reaction
L. Rios-Solis et al. / Biochemica
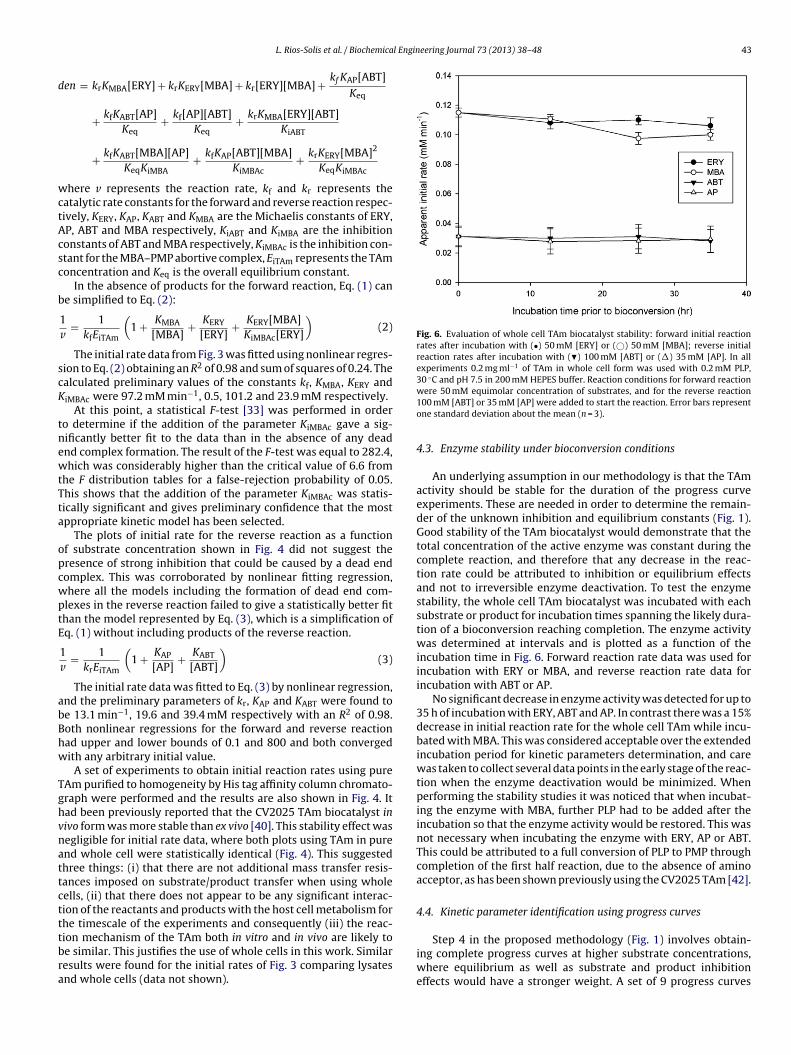
en = krKMBA[ERY] + krKERY[MBA] + kr[ERY][MBA] + kf KAP[ABT]Keq
+ kfKABT[AP]Keq
+ kf[AP][ABT]Keq
+ krKMBA[ERY][ABT]KiABT
+ kfKABT[MBA][AP]KeqKiMBA
+ kfKAP[ABT][MBA]KiMBAc
+ krKERY[MBA]2
KeqKiMBAc
here v represents the reaction rate, kf and kr represents theatalytic rate constants for the forward and reverse reaction respec-ively, KERY, KAP, KABT and KMBA are the Michaelis constants of ERY,P, ABT and MBA respectively, KiABT and KiMBA are the inhibitiononstants of ABT and MBA respectively, KiMBAc is the inhibition con-tant for the MBA–PMP abortive complex, EiTAm represents the TAmoncentration and Keq is the overall equilibrium constant.
In the absence of products for the forward reaction, Eq. (1) cane simplified to Eq. (2):
1v
= 1kfEiTAm
(1 + KMBA
[MBA]+ KERY
[ERY]+ KERY[MBA]
KiMBAc[ERY]
)(2)
The initial rate data from Fig. 3 was fitted using nonlinear regres-ion to Eq. (2) obtaining an R2 of 0.98 and sum of squares of 0.24. Thealculated preliminary values of the constants kf, KMBA, KERY andiMBAc were 97.2 mM min−1, 0.5, 101.2 and 23.9 mM respectively.
At this point, a statistical F-test [33] was performed in ordero determine if the addition of the parameter KiMBAc gave a sig-ificantly better fit to the data than in the absence of any deadnd complex formation. The result of the F-test was equal to 282.4,hich was considerably higher than the critical value of 6.6 from
he F distribution tables for a false-rejection probability of 0.05.his shows that the addition of the parameter KiMBAc was statis-ically significant and gives preliminary confidence that the mostppropriate kinetic model has been selected.
The plots of initial rate for the reverse reaction as a functionf substrate concentration shown in Fig. 4 did not suggest theresence of strong inhibition that could be caused by a dead endomplex. This was corroborated by nonlinear fitting regression,here all the models including the formation of dead end com-lexes in the reverse reaction failed to give a statistically better fithan the model represented by Eq. (3), which is a simplification ofq. (1) without including products of the reverse reaction.
1v
= 1krEiTAm
(1 + KAP
[AP]+ KABT
[ABT]
)(3)
The initial rate data was fitted to Eq. (3) by nonlinear regression,nd the preliminary parameters of kr, KAP and KABT were found toe 13.1 min−1, 19.6 and 39.4 mM respectively with an R2 of 0.98.oth nonlinear regressions for the forward and reverse reactionad upper and lower bounds of 0.1 and 800 and both convergedith any arbitrary initial value.
A set of experiments to obtain initial reaction rates using pureAm purified to homogeneity by His tag affinity column chromato-raph were performed and the results are also shown in Fig. 4. Itad been previously reported that the CV2025 TAm biocatalyst inivo form was more stable than ex vivo [40]. This stability effect wasegligible for initial rate data, where both plots using TAm in purend whole cell were statistically identical (Fig. 4). This suggestedhree things: (i) that there are not additional mass transfer resis-ances imposed on substrate/product transfer when using wholeells, (ii) that there does not appear to be any significant interac-ion of the reactants and products with the host cell metabolism forhe timescale of the experiments and consequently (iii) the reac-
ion mechanism of the TAm both in vitro and in vivo are likely toe similar. This justifies the use of whole cells in this work. Similaresults were found for the initial rates of Fig. 3 comparing lysatesnd whole cells (data not shown).were 50 mM equimolar concentration of substrates, and for the reverse reaction100 mM [ABT] or 35 mM [AP] were added to start the reaction. Error bars representone standard deviation about the mean (n = 3).
4.3. Enzyme stability under bioconversion conditions
An underlying assumption in our methodology is that the TAmactivity should be stable for the duration of the progress curveexperiments. These are needed in order to determine the remain-der of the unknown inhibition and equilibrium constants (Fig. 1).Good stability of the TAm biocatalyst would demonstrate that thetotal concentration of the active enzyme was constant during thecomplete reaction, and therefore that any decrease in the reac-tion rate could be attributed to inhibition or equilibrium effectsand not to irreversible enzyme deactivation. To test the enzymestability, the whole cell TAm biocatalyst was incubated with eachsubstrate or product for incubation times spanning the likely dura-tion of a bioconversion reaching completion. The enzyme activitywas determined at intervals and is plotted as a function of theincubation time in Fig. 6. Forward reaction rate data was used forincubation with ERY or MBA, and reverse reaction rate data forincubation with ABT or AP.
No significant decrease in enzyme activity was detected for up to35 h of incubation with ERY, ABT and AP. In contrast there was a 15%decrease in initial reaction rate for the whole cell TAm while incu-bated with MBA. This was considered acceptable over the extendedincubation period for kinetic parameters determination, and carewas taken to collect several data points in the early stage of the reac-tion when the enzyme deactivation would be minimized. Whenperforming the stability studies it was noticed that when incubat-ing the enzyme with MBA, further PLP had to be added after theincubation so that the enzyme activity would be restored. This wasnot necessary when incubating the enzyme with ERY, AP or ABT.This could be attributed to a full conversion of PLP to PMP throughcompletion of the first half reaction, due to the absence of aminoacceptor, as has been shown previously using the CV2025 TAm [42].
4.4. Kinetic parameter identification using progress curves
Step 4 in the proposed methodology (Fig. 1) involves obtain-ing complete progress curves at higher substrate concentrations,where equilibrium as well as substrate and product inhibitioneffects would have a stronger weight. A set of 9 progress curves

44 L. Rios-Solis et al. / Biochemical Engineering Journal 73 (2013) 38– 48
Table 1Initial substrate and enzyme concentrations used for experimental progress curve determination (data obtained was used to determine the kinetic parameters in Steps 4 and5 of the methodology described in Fig. 1). The first 9 progress curves represent forward reaction bioconversions, while the last 3 represent reverse reaction bioconversions.
Progress curve number 1 2 3 4 5 6 7 8 9 10 11 12
[ERY] (mM) 50 70 150 250 300 150 200 10 20 0 0 0[MBA] (mM) 100 250 250 40 30 15 50 120 200 0 0 0[AP] (mM) 0 0 0 0 0 0 0 0 0 10 20 40
5
fittwcuAoew
olqcostm
a3vtlwH
K
c
K
K
ww
K
of
K
a
[ABT] (mM) 0 0 0 0 0
[Ei] (mg ml−1) 0.3 0.4 0.3 0.15 0.1
or the forward reaction, each with 12 sampling points at differentntervals were obtained to ensure the accuracy of the model fit tohe experimental data. This set was complemented with the addi-ion of 3 reverse reaction progress curves, to ensure that the modelould fit both forward and reverse reaction profiles. The substrate
oncentrations chosen are shown in Table 1, and included thosender which the final bioconversion process might be performed.lso included are experiments covering the lower and higher rangef the concentration spectrum, to ensure that the inhibition andquilibrium constants would be accurately determined over theidest possible range of bioconversion conditions.
Initial nonlinear regression analysis highlighted the importancef the data points before 60 min of reaction. These points involvingow product concentration were found to be crucial in giving ade-uate weight to the preliminary parameters kf, kr, and the Michaelisonstants previously obtained, thus allowing a better convergencef the optimization algorithm. Therefore care was taken to includeeveral points within that time range, in order for the optimizationo converge around the vicinity of the preliminary values deter-
ined in Section 4.2.The preliminary results for kf and kr, of 97.2 and 13.1 min−1,
nd for KMBA, KERY, KiMBAc, KAP and KABT of 0.5, 101.2, 23.9, 19.6 and9.4 mM respectively obtained in Section 4.2 were used as fixedalues in the full kinetic model (Eq. (1)). This was done in ordero be able to determine the rest of the kinetic constants by non-inear regression of the progress curves. The equilibrium constant
as calculated simultaneously in the iteration process using thealdane equation:
eq =(
kf
kr
)2 KABTKAP
KMBAKERY(4)
The two remaining inhibition constants KiERY and KiAP were cal-ulated using the following Haldane equations:
iAP = EeqkrKERYKiMBA
kfKABT(5)
iERY = kfKAPKiABT
KeqkrKMBA(6)
The partial equilibrium constant K1 for the first half reaction,here MBA reacts with E–PLP to produce AP and E–PMP (Fig. 5)as calculated using Eq. (7):
1 = k1k3
k2k4= KiAP
KiMBA(7)
In the same way, the partial equilibrium constant K2 for the sec-nd half reaction, where E–PMP is converted to E–PLP through theormation of ABT from ERY (Fig. 5) was obtained using Eq. (8):
k5k7 KiABT
2 =k6k8=
KiERY(8)
It should be noted that the overall equilibrium constant Keq canlso be expressed as the product of the two partial constants as
0 0 0 0 120 200 1000.15 0.15 0.3 0.45 0.15 0.44 0.3
shown in Eq. (9), and the value obtained should be the same as theone obtained with Eq. (4).
Keq = K1K2 = [AP]eq[ABT]eq
[ERY]eq[MBA]eq(9)
Global optimization was next performed using the patternsearch algorithm described in Section 3.6. Following this approach,the optimization solution was relatively independent of the ini-tial values of the inhibition constants, because only 3 parametersneeded to be estimated. The preliminary values of KiMBA, KiABT andKeq were determined to be 0.004 and 2.2 mM and 830 respectively.The lower and upper bounds for both nonlinear regressions wereset at 0.0001 and 800, and the optimization was always found toconverge to the same result for any given initial value within thebounds.
4.5. Reconciliation and final kinetic parameter values
The preliminary kinetic parameters obtained up to this pointare believed to be close to the “true” values, yet they stillpresent some inaccuracies because they are based on the catalyticand Michaelis–Menten constants determined using the simplifiedkinetic models in Eqs. (2) and (3). Any error obtained using suchsimplified models in Step 2 would be propagated to the values ofall the next parameters determined in Step 4. Therefore in Step5 of the methodology described in Fig. 1, the kinetic constantswere reconciled by using the corresponding full kinetic model (Eq.(1)) combined with nonlinear regression of the 12 progress curves,where all the preliminary parameters were used as initial valuesfor the optimization.
The lower and upper bounds were set as 0.1 and 800 (exceptfor KMBA and KiMBA where the lower bound was set to 0.01 and0.0001 respectively), and because the initial estimates were closeto the final parameter values, the global optimization was rapidlyachieved around the vicinity of the initial estimates. The pre-liminary and “reconciled” kinetic values obtained this way aresummarized in Table 2, where a description in terms of rateconstants of each parameter is also included. The preliminary andfinal values were relatively similar with the major difference (33%)was found for the inhibition constant KAPi. Such changes to thefinal values of the kinetic parameters at this point were consid-ered acceptable for a nonlinear regression based methodology[36,5,11].
In order to perform a complete statistical analysis, the fullmethodology described in Fig. 1 was also performed using thekinetic model without including substrate inhibition by the forma-tion of dead end complexes (Eq. (1) without including the last twoterms). The final nonlinear regression performed with this model inStep 5 to reconcile the parameters failed to converge successfully.Instead, it reached the upper limit for KERY and showed relatively
high discrepancies between the initial and “reconciled” values (datanot shown), presenting a residual of 16.3 compared to 0.55 usingthe full model of Eq. (1). A statistical F-test was performed inorder to determine if the addition of the parameter KiMBAc gave a
L. Rios-Solis et al. / Biochemical Engineering Journal 73 (2013) 38– 48 45
Table 2Initial and final (reconciled) values of apparent kinetic parameters. Values were obtained in Step 5 of Fig. 1 using the full kinetic model represented by Eq. (1).
Kinetic parameter Kinetic parameter in terms of rate constants Initial value Reconciled value
(1) Catalytic rate constants (min−1)Rate constant forward reaction: kf
k3k7k3+k7
97.2 95.1
Rate constant reverse reaction: krk2k6
k2+k613.1 12
(2) Michaelis–Menten constants (mM)Michaelis constant for MBA: KMBA
k7(k2+k3)k1(k3+k7) 0.49 0.51
Michaelis constant for ERY: KERYk3(k6+k7)k5(k3+k7) 101.2 95.5
Michaelis constant for AP: KAPk6(k2+k3)k4(k2+k6) 19.6 16.1
Michaelis constant for ABT: KABTk2(k6+k7)k8(k2+k6) 39.4 37
(3) Inhibition constants (mM)Inhibition constant for MBA: KiMBA
k2k1
4.0 × 10⁻³ 4.0 × 10⁻³
Inhibition constant for ERY: KiERYk6k5
0.75 1.0
Inhibition constant for AP: KiAPk3k4
1.2 1.1
Inhibition constant for ABT: KiABTk7k8
2.2 3.1
Inhibition constant for MBA complex: KiMBAck9k10
23.9 24
(4) Equilibrium constantsGlobal equilibrium constant: Keq
k1k3k5k7k2k4k6k8
830 843
Equilibrium constant for the first half reaction: K1k1k3k2k4
301 275
sFoiwstmpaFt
4
4aficTspmwcmbfia
Fsimcmp
Equilibrium constant for the second half reaction: K2k5k7k6k8
ignificantly better fit to the progress curve data. The result of the-test was equal to 15.7, which was higher than the critical valuef 3.9 from the F distribution tables with false-rejection probabil-ty of 0.05. This confirms that the addition of the parameter KiMBAc
as also statistically significant to fit the progress curves. Thesetatistical analyses, in addition to those in Section 4.2, showed thathe kinetic model described by Eq. (1) represents the best reaction
echanism for describing both initial rate data and the completerogress curves. This finding strongly supports the formation of thebortive complex E–PMP–MBA for the TAm reaction studied here.urther experiments using mass spectrometry would be requiredo confirm this.
.6. Validation of kinetic parameters
In order to validate the kinetic parameters obtained in Section.2, experimental and predicted data of reactant concentrationss a function of time were compared. Very good agreement wasound for all the forward and reverse reaction conditions describedn Table 1. Fig. 7 shows a set of experimental and model dataomparisons for the forward reaction, using progress curves fromable 1 that were used to determine the kinetic parameters. Fig. 7(a)pecifically compares experimental ABT data points from differentrogress curves with the predicted model where excellent agree-ent is seen. Fig. 7(b) focuses on the initial period until 60 minhere, as described in Section 4.4, several key data points were
ollected. Good agreement was again found between the experi-ental values and model predictions for reaction occurring over
oth short and long periods. Fig. 8 shows experimental data pointsor MBA formation during the reverse reaction conditions describedn Table 1. Again excellent agreement is observed between the datand the model.
To further test the kinetic model and the calculated parameters,ig. 9 shows the comparison of model predictions with additionalets of experimental progress curve data (under conditions notncluded in Table 1 to establish the kinetic parameters). Good agree-
ent is also found between these additional independent progressurves and the model predictions, verifying the appropriate deter-ination of the kinetic model (Eq. (1)) and its corresponding
arameters (Table 2).
2.9 3.1
5. Discussion
5.1. Kinetic constants
The value of the Michaelis constant of KAP was determined tobe two orders of magnitude higher than KMBA. A similar low KMBAand higher KAP value was determined for the �-TAm from Vibriofluvialis [45,47] which shares 38% sequence identity towards theCV2025 TAm [22]. Interestingly, the opposite result was found forthe �-TAm from Bacillus thuringiensis, where the Michaelis con-stant for MBA and AP were two orders of magnitude higher andlower respectively than the ones determined in this work [46]. TheMichaelis constant of ERY was 200 times bigger than the one forMBA, while the Michaelis constant of ABT was half that for AP. Incontrast to the reverse reaction, the kinetic parameters of the for-ward reaction did not follow the general trend where the Michaelisconstant of each amino donor were higher than the correspondingamino acceptor [18,14,26,29,34,46].
5.2. Equilibrium constants
The uses of transaminases to synthesize chiral amines havebeen generally hampered by equilibrium constants near unity orconstants which favours the ketone starting material [51,50,52]. Forthe conversion studied here however, the value of the partial equi-librium constants K1 and K2 for the first and second half reactionswere 275 and 3.1 as determined by Eqs. (7) and (8) respectively. Thehigh value of K1 has also been suggested in literature for the syn-thesis of pyridoxamine 5′-phopsate using CV2025 TAm [42]. Thevalues of K1 and K2 lead to a global equilibrium constant of 843 (Eq.(9)), which strongly favoured the asymmetric synthesis of ABT.
In addition, the catalytic constant for the forward reaction wasalmost one order of magnitude higher than the constant for thereverse reaction (Table 2). Similar differences in catalytic constantshave been found for the �-TAm from B. thuringiensis to pro-duce l-alanine from pyruvate and MBA [46], yet in general these
results are not common among other TAms where kf and kr donot differ greatly [8,14,17,18,24,51]. In general, due to the lowequilibrium constants of the TAm bioconversions, the commonlyused method in industry for amine synthesis has been by kinetic
46 L. Rios-Solis et al. / Biochemical Engineering Journal 73 (2013) 38– 48
Fig. 7. Example experimental and fitted progress curves for the forward reactionindicating ABT formation (a) for the entire bioconversions and (b) for the first 50 minof reaction. Initial substrate concentrations were (•) 70 mM [ERY], 250 mM [MBA]and 0.4 mg ml−1 [TAm], (�) 50 mM [ERY], 100 mM [MBA] and 0.3 mg ml−1 [TAm]and (�) 10 mM [ERY], 120 mM [MBA] and 0.3 mg ml−1 [TAm]. Dotted lines showfieE
rvtts
5c
afptbV
Esse
Fig. 8. Example experimental and fitted progress curves for the reverse reac-tion following MBA formation with initial substrate concentrations of: (©) 10 mM[AP], 120 mM [ABT] and 0.15 mg ml−1 [TAm], (�) 20 mM [AP], 200 mM [ABT] and0.44 mg ml−1 [TAm], (�) 40 mM [AP], 100 mM [ABT] and 0.3 mg ml−1 [TAm]. For all
◦
substrates [45–47], but it was found to be several orders of magni-tude lower compared with other classes of TAms when used withnatural substrates ex vivo [24,32]. Product inhibition in the forward
Fig. 9. Examples of model verification comparing model predictions with additionalexperimental data sets. Progress curves for TAm mediated synthesis of ABT using
tted model based on Eq. (1) and final kinetic parameters in Table 2. For all thexperiments 0.2 mM PLP was used at 30 ◦C and pH 7.5 in 200 mM HEPES buffer.rror bars represent one standard deviation about the mean (n = 3).
esolution, which is hampered by a 50% theoretical yield. The pre-iously mentioned results are thus relevant, as they indicate thathe kinetics and equilibrium constants of the TAm mediated syn-hesis of specific amino-alcohols will be suitable for asymmetricyntheses where >95% yields could be achieved directly.
.3. Bottlenecks of the bioconversion and optimum reactiononditions
After evaluating the kinetic constants in Table 2, and performing sensitivity analysis for each parameter (data not shown), it wasound that one of the key obstacles to improve the amino-alcoholroductivity was the high value of KERY of 96 mM. For similar reac-ion conditions, Michaelis constants for pyruvate were reported toe one order of magnitude smaller than KERY using the �-TAm from. fluvialis and B. thuringiensis [45,46].
The higher stability of the complex E–PLP–MBA compared to
–PMP–MBA was evidenced by the value of the dissociation con-tant KiMBA of 4.0 × 10⁻³ mM, which was 3 orders of magnitudemaller compared to the value of KiERY of 1.0 mM. By analyzing thexpressions of the parameters as rate constants in Table 2, it canthe experiments 0.2 mM PLP was used at 30 C and pH 7.5 in 200 mM HEPES buffer.Dotted lines show model predictions based on Eq. (1) and final kinetic parametersin Table 2.
be concluded that the higher values of KERY and KiERY compared toKMBA and KiMBA make the second half reaction the limiting step ofthe overall bioconversion. Mutagenesis improving this step wouldbe very beneficial in improving the catalytic rate of the TAm syn-thesis of ABT, provided that the screening method used specificallycovers the second step of the bioconversion.
The value of the kinetic parameter kf, which is a function ofthe forward catalytic constant rates k3 and k7, was found to be97.4 min−1. This value of kf was of the same order of magnitudeas that reported for a similar �-TAm using MBA and pyruvate as
initial concentrations of: (�) 220 mM [ERY] and 40 mM [MBA], (©) 250 mM [MBA]and 40 mM [ERY]. Dashed lines represent kinetic model predictions based on Eq.(1) and the parameters listed in Table 2. [TAm] concentration was 0.4 mg ml−1 inwhole cell form, 0.2 mM PLP, 30 ◦C and pH 7.5 in 200 mM HEPES buffer. Error barsrepresent one standard deviation about the mean (n = 3).

l Engin
ripnobf[
toug(otddomhacTCnwtr(a
fitsEccreaib
6
deioTtvtdwmae
arma
[
[
[
[[
[
[
[
[
[
L. Rios-Solis et al. / Biochemica
eaction was found to be not so severe compared to other sim-lar �-TAm bioconversions [45–47]. In those works, some of theroduct inhibition constants were found to be one order of mag-itude smaller than the value of KiAP and KiABT of 1.1 and 3.1 mMbtained in this work respectively (Table 2). A low product inhi-ition of AP and ABT was also suggested in literature using a TAmrom Pseudomonas aeruginosa for the asymmetric synthesis of ABT19].
Several simulations predicted that high reaction yields of morehan 95% should be obtained using high equimolar concentrationsf substrates, with the condition that longer reactions times weresed than 35 h. However, the experimental data started to divergeradually from the predicted model data after longer reaction timesdata not shown). This may have been due to general toxicity effectsf the MBA on the whole cells or to the irreversible enzyme inac-ivation by MBA As it was shown in Fig. 6, 15% of the TAm waseactivated after being incubated for 35 h with 50 mM MBA. Thiseactivation percentage was considered negligible for the purposesf determining the kinetic parameters, however the deactivationay become more significant if longer residence times and also
igher concentrations of MBA were used. TAm inactivation by themino donor has also been reported in literature [55], and in someases whole cell TAm biocatalysts have been shown to maintain theAm more stable versus the inactivation of the amino donor [40,55].oncentrations of MBA of up to 50 mM have been used withoutoticeable toxic effect with growing cells [44]. Nevertheless in thisork concentrations of up to 250 mM where used. Further addi-
ion of PLP or TAm (individually) when the reaction stopped did notestore the catalytic activity. In contrast, addition of PLP and TAmtogether) did restore partially the activity, suggesting both enzymend PLP were inactivated or consumed after longer reaction times.
Finally, taking into account all the above findings, it was identi-ed that maintaining a high concentration of ERY while minimizinghe concentration of MBA would enhance the final yield of ABT. Theimulation in Fig. 9 that considered an excess of ERY (220 mM ofRY and 40 mM MBA with 0.4 mg ml−1 of TAm) predicted a 99%onversion with respect to the limiting substrate MBA in 500 minorresponding to the maximum theoretical yield achievable for theeaction. In contrast, only a 35% conversion was predicted using anxcess of MBA at the same enzyme concentration (250 mM of MBAnd 40 mM ERY with 0.4 mg ml−1 of TAm). The experimental resultsn Fig. 9 confirmed the predictions, showing very good agreementetween the experimental and predicted data sets.
. Conclusions
A systematic, microscale high-throughput procedure has beeneveloped in this work to rapidly determine the kinetic param-ters of challenging reversible enzymatic reactions with strongnhibition and where the reaction mechanism has not been previ-usly elucidated. The methodology was applied to the C. violaceumAm mediated synthesis of chiral amino-alcohol ABT, combiningraditional initial rates experiments to identify a solution in theicinity of the global minimum, with nonlinear regression methodso determine the exact location of the solution for kinetic parameteretermination. Statistical comparisons of different kinetic modelsere also included, which allowed new insights into the reactionechanism to be determined and in particular the formation of
dead end complex between the amino donor and the cofactornzyme complex.
Excellent agreement was found between the experimental data
nd the determined kinetic model, which revealed that the forwardeaction was strongly favoured. The optimum conditions to maxi-ize the reaction rate were found to be using an excess of the aminocceptor. Current work is evaluating a reactor configuration which
[
eering Journal 73 (2013) 38– 48 47
includes a fed batch addition of substrate MBA, to minimize thetoxic and inhibitory effect of the amino donor and hence increasebioconversion rate and yield.
Acknowledgements
The Mexican National Council for Science and Technology(CONACYT), the Mexican Ministry of Public Education (SEP) andthe Ministry of Higher Education of Malaysia (MOHE) are acknowl-edged for support of LR-S and MH. NB and CD acknowledge supportfrom the UCL Department of Biochemical Engineering. The UK Engi-neering and Physical Sciences Research Council (EPSRC) is thankedfor the support of the multidisciplinary Biocatalysis Integrated withChemistry and Engineering (BiCE) programme (GR/S62505/01) atUniversity College London (London, UK). Financial support fromthe 13 industrial partners supporting the BiCE programme is alsoacknowledged.
References
[1] N. Al-Haque, P.A. Santacoloma, W. Neto, P. Tufvesson, R. Gani, J.M. Woodley,A robust methodology for kinetic model parameter estimation for biocatalyticreactions, Biotechnol. Progr. 28 (2012) 1186–1196.
[2] B.E.C. Banks, K.G. Oldham, E.M. Thain, C.A. Vernon, Glutamic–aspartic transam-inase of pig heart muscle, Nature 183 (1959) 1187.
[3] K. Bartsch, R. Schneider, A. Schulz, Stereospecific production of the herbicidephosphinothricin (glufosinate): purification of aspartate transaminase fromBacillus stearothermophilus, cloning of the corresponding gene, aspC, and appli-cation in a coupled transaminase process, Appl. Environ. Microbiol. 62 (1996)3794–3799.
[4] H. Bisswanger, Enzyme Kinetics. Principles and Methods, 2nd ed., Wiley VCH,2008, pp. 138–145.
[5] D.G. Blackmond, Reaction progress kinetic analysis: a powerful methodologyfor mechanistic studies of complex catalytic reactions, Angew. Chem. 44 (2005)4302.
[6] J. Boruwa, J.C. Borah, S. Gogoi, N.C. Barua, A short asymmetric total synthesisof chloramphenicol using a selectively protected 1,2-diol, Tetrahedron Lett. 46(2005) 1743–1746.
[7] N.M. Brunhuber, J.S. Blanchard, The biochemistry and enzymology of aminoacid dehydrogenases, Crit. Rev. Biochem. Mol. Biol. 29 (1994) 415–467.
[8] B. Bulos, P. Handler, Kinetics of beef heart glutamic–alanine transaminase, J.Biol. Chem. 240 (1965) 3283.
[9] Y.P. Chao, Z.J. Lai, P. Chen, J.T. Chern, Enhanced conversion rate ofl-phenylalanine by coupling reactions of aminotransferases and phospho-enolpyruvate carboxykinase in Escherichia coli K-12, Biotechnol. Progr. 15(1999) 453–458.
10] B.H. Chen, A. Sayar, U. Kaulmann, P.A. Dalby, J.M. Ward, J.M. Woodley, Reactionmodelling and simulation to assess the integrated use of transketolase and�-transaminase for the synthesis of an aminotriol, Biocatal. Biotransform. 24(2006) 449–457.
11] B.H. Chen, E.G. Hibbert, P.A. Dalby, J.M. Woodley, A new approach to bioconver-sion reaction kinetic parameter identification, Am. Inst. Chem. Eng. J. 54 (2008)2155–2163.
12] B.H. Chen, M. Micheletti, F. Baganz, J. Woodley, G.J. Lye, An efficient approach tobioconversion kinetic model generation based on automated microscale exper-imentation integrated with model driven experimental design, Chem. Eng. Sci.64 (2009) 403–409.
14] P. Christen, D.E. Metzler, Transaminases, Wiley, New York, USA, 1998.15] D.D. Davies, R.J. Ellis, Glutamic-oxaloacetic transaminase of cauliflower, 1.
Purification and specificity, The Biochemical journal 78 (1961) 615–623.16] R.J. Ellis, D.D. Davies, Glutamic–oxaloacetic transaminase of cauliflower. 1.
Purification and specificity, Biochem. J. 78 (1961) 615–623.17] H. Hayashi, K. Inoue, T. Nagata, S. Kuramitsu, H. Kagamiyama, Escherichia coli
aromatic amino acid aminotransferase: characterization and comparison withaspartate aminotransferase, Biochemistry 32 (1993) 12229–12239.
18] C.P. Henson, W. Cleland, Kinetic studies of glutamic oxaloacetic transaminaseisozymes, Biochemistry 3 (1964) 338–345.
19] C.U. Ingram, M. Bommer, M.E.B. Smith, P.A. Dalby, J.M. Ward, H.C. Hailes, G.J.Lye, One-pot synthesis of amino-alcohols using a de-novo transketolase and b-alanine: pyruvate transaminase pathway in Escherichia coli, Biotechnol. Bioeng.96 (2007) 559–569.
20] S.W. Kaldor, V.J. Kalish, J.F. Davies, B.V. Shetty, J.E. Fritz, K. Appelt, J.A. Burgess,K.M. Campanale, N.Y. Chirgadze, D.K. Clawson, B.A. Dressman, S.D. Hatch, D.A.Khalil, M.B. Kosa, P.P. Lubbehusen, M.A. Muesing, A.K. Patick, S.H. Reich, K.S. Su,
J.H. Tatlock, Viracept (nelfinavir mesylate, AG1343): a potent, orally bioavail-able inhibitor of HIV-1 protease, J. Med. Chem. 40 (1997) 3979–3985.21] S. Katare, A. Bhan, J.M. Caruthers, W.N. Delgass, V. Venkatasubramanian, Ahybrid genetic algorithm for efficient parameter estimation of large kineticmodels, Comput. Chem. Eng. 28 (2004) (2004) 2569–2581.

4 l Engin
[
[
[
[
[
[
[
[
[
[
[
[
[
[
[
[
[
[
[
[
[
[
[
[
[
[
[
[
[
[
[
[
[
[
[
[
[
[
8 L. Rios-Solis et al. / Biochemica
22] U. Kaulmann, K. Smithies, M. Smith, H. Hailes, J. Ward, Substrate spectrum of�-transaminase from Chromobacterium violaceum DSM30191 and its potentialfor biocatalysis, Enzyme Microb. Technol. 41 (2007) 628–637.
23] D. Koszelewski, K. Tauber, K. Faber, W. Kroutil, Omega-Transaminases for thesynthesis of non-racemic alpha-chiral primary amines, Trends Biotechnol. 28(2010) 324–332.
24] S. Kuramitsu, K. Hiromi, H. Hayashi, Y. Morino, H. Kagamiyama, Pre-steady-state kinetics of Escherichia coli aspartate aminotransferase catalyzed reactionsand thermodynamic aspects of its substrate specificity, Biochemistry 29 (1990)(1990) 5469–5476.
25] S. Kwon, S. Ko, Synthesis of statine employing a general syn-amino alcoholbuilding block, Tetrahedron Lett. 43 (2002) 639–641.
26] B. Lain-guelbenzu, J. Cardenas, J. Muroz-blanco, Purification and properties of l-alanine aminotransferase from Chlamydomonas reinhardtii, Enzyme 887 (1991)881–887.
27] H. Law, C. Baldwin, B. Chen, J. Woodley, Process limitations in a whole-cellcatalysed oxidation: sensitivity analysis, Chem. Eng. Sci. 61 (2006) 6646–6652.
29] H.H. Lo, S.K. Hsu, W.D. Lin, N.L. Chan, W.H. Hsu, Asymmetrical synthesis ofl-homophenylalanine using engineered Escherichia coli aspartate aminotrans-ferase, Biotechnol. Progr. 21 (2005) 411–415.
31] G.J. Lye, P.A. Dalby, J.M. Woodley, Better biocatalytic processes faster: new toolsfor the implementation of biocatalysis in organic synthesis, Org. Process Res.Dev. 6 (2002) 434–440.
32] M. Markova, C. Peneff, M.J.E. Hewlins, T. Schirmer, R.A. John, Determinantsof substrate specificity in omega-aminotransferases, J. Biol. Chem. 280 (2005)36409–36416.
33] C.A. Markowski, E.P. Markowski, Conditions for the effectiveness of a prelimi-nary test of variance, Am. Stat. 44 (1990) 322–326.
34] A.R. Martin, D. Shonnard, S. Pannuri, S. Kamat, Characterization of free andimmobilized (S)-aminotransferase for acetophenone production, Appl. Micro-biol. Biotechnol. 76 (2007) 843–851.
35] P.K. Mehta, T.I. Hale, P. Christen, Aminotransferases: demonstration of homol-ogy and division into evolutionary subgroups, Eur. J. Biochem. 214 (1993)549–561.
36] R. Moros, H. Kalies, H.G. Rex, S. Schafvarczy, A genetic algorithm for generatinginitial parameter estimations for kinetic models of catalytic processes, Comput.Chem. Eng. 20 (1996) 1257–1270.
37] Y. Ni, R.R. Chen, Accelerating whole-cell biocatalysis by reducing outer mem-brane permeability barrier, Biotechnol. Bioeng. 87 (2004) 804–811.
38] P.W. van Ophem, S.D. Erickson, A. Martinez del Pozo, I. Haller, B.T. Chait, T.Yoshimura, K. Soda, D. Ringe, G. Petsko, J.M. Manning, Substrate inhibition of d-amino acid transaminase and protection by salts and by reduced nicotinamideadenine dinucleotide: isolation and initial characterization of a pyridoxo inter-mediate related to inactivation, Biochemistry 37 (1998) 2879–2888.
39] F. Ranaldi, What students must know about the determination of enzymekinetic parameters, Biochem. Educ. 27 (1999) 87–91.
40] L. Rios-Solis, M. Halim, A. Cázares, P. Morris, J.M. Ward, H.C. Hailes, P.A. Dalby,F. Baganz, G.J. Lye, A toolbox approach for the rapid evaluation of multi-stepenzymatic syntheses comprising a “mix and match” E. coli expression systemwith microscale experimentation, Biocatal. Biotransform. 29 (2011) 192–203.
41] M.D. Rozwadoska, An efficient synthesis of S-(+)-amphetamine, Tetrahedron:Asymmetry 4 (1993) 1619–1624.
42] U. Schell, R. Wohlgemuth, J.M. Ward, Synthesis of pyridoxamine 5′-phosphateusing an MBA:pyruvate transaminase as biocatalyst, J. Mol. Catal. B: Enzym. 59(2009) 279–285.
44] J.S. Shin, B.G. Kim, Kinetic resolution of alpha-methylbenzylamine withomicron-transaminase screened from soil microorganisms: application of a
[
eering Journal 73 (2013) 38– 48
biphasic system to overcome product inhibition, Biotechnol. Bioeng. 55 (1997)348–358.
45] J.S. Shin, B.G. Kim, Exploring the active site of amine:pyruvate aminotrans-ferase on the basis of the substrate structure-reactivity relationship: how theenzyme controls substrate specificity and stereoselectivity, J. Org. Chem. 67(2002) 2848–2853.
46] J.S. Shin, B.G. Kim, Kinetic modeling of �-transamination for enzymatic kineticresolution of �-methylbenzylamine, Biotechnol. Bioeng. 60 (1998) 534–540.
47] J.S. Shin, B.G. Kim, Substrate inhibition mode of �-transaminase from Vibriofluvialis JS17 is dependent on the chirality of substrate, Biotechnology 77 (2002)882–887.
48] M.E.B. Smith, B.H. Chen, E.G. Hibbert, U. Kaulmann, K. Smithies, J.L. Galman, F.Baganz, P.A. Dalby, H.C. Hailes, G.J. Lye, J.M. Ward, J.M. Woodley, M. Micheletti, Amultidisciplinary approach toward the rapid and preparative-scale biocatalyticsynthesis of chiral amino alcohols: a concise transketolase-/�-transaminase-mediated synthesis of (2S,3S)-2-aminopentane-1,3-diol, Org. Process Res. Dev.14 (2010) 99–107.
49] K. Smithies, M.E.B. Smith, U. Kaulmann, J.L. Galman, J.M. Ward, H.C. Hailes,Stereoselectivity of an �-transaminase-mediated amination of 1,3-dihydroxy-1-phenylpropane-2-one, Tetrahedron: Asymmetry 20 (2009) (2009) 570–574.
50] J.D. Stewart, Dehydrogenases and transaminases in asymmetric synthesis, Curr.Opin. Chem. Biol. 5 (2001) 120–129.
51] P.P. Taylor, D.P. Pantaleone, R.F. Senkpeil, I.G. Fotheringham, Novel biosyntheticapproaches to the production of unnatural amino acids using transaminases,Trends Biotechnol. 16 (1998) 412–418.
52] M.D. Truppo, J.D. Rozzell, N.J. Turner, Efficient production of enantiomericallypure chiral amines at concentrations of 50 g/L using transaminases, Org. ProcessRes. Dev. 14 (2010) (2010) 234–237.
53] J.M. Woodley, Choice of biocatalyst form for scalable processes, Biochem. Soc.Trans. 34 (2006) 301–303.
54] D.R. Yazbeck, C.A. Martinez, S. Hu, J. Tao, Challenges in the development ofan efficient enzymatic process in the pharmaceutical industry, Tetrahedron:Asymmetry 15 (2004) 2757–2763.
55] H. Yun, B.K. Cho, B.G. Kim, Kinetic resolution of (R, S)-sec-butylamineusing omega-transaminase from Vibrio fluvialis JS17 under reduced pressure,Biotechnol. Bioeng. 87 (2004) 772–778.
56] H. Yun, B.Y. Hwang, J.H. Lee, B.G. Kim, Use of enrichment culture for directedevolution of the Vibrio fluvialis JS17 transaminase which is resistant to productinhibition by aliphatic ketones, Appl. Environ. Microbiol. 71 (2005) 4220–4224.
57] G. Bhaskar, A short stereoselective synthesis of (−)-chloramphenicol and (+)thiamphenicol, Tetrahedron: Asymmetry 15 (2004) 1279–1283.
58] H. Hailes, P. Dalby, G.J. Lye, Biocatalytic approaches to ketodiols and aminodiols,CHIM OGGI 27 (2009) 28–31.
59] D.I. Stirling, The use of aminotransferases for the production of chiral aminoacids and amines, in: A.N. Collins, G.N. Sheldrake, J. Crosby (Eds.), Chirality inindustry, Wiley, New York, 1992, pp. 209–210.
60] S.D. Doig, S.C.R. Pickering, G.J. Lye, J.M. Woodley, The use of microscaleprocessing technologies for quantification of biocatalytic Baeyer-Villiger oxi-dation kinetics, Biotechnology and bioengineering 80 (2002) 42–49.
61] M. Micheletti, G.J. Lye, Microscale bioprocess optimisation, Current opinion inbiotechnology 17 (2006) 611–618.
62] J.D. Watson, Molecular Biology of the Gene, 2nd ed., Saunders, Philadelphia, PA,
1972.63] S.A. Cohen, D.P. Michaud, Synthesis of a fluorescent derivatizing reagent 6-aminoquinolyl-N-hydroxysuccinimidyl carbamate, and its application for theanalysis of hydrolysate amino acids via high-performance liquid chromatogra-phy, Analytical biochemistry 211 (1993) 279–289.