Translational and morphological effects of signalling alcohols ...
240
Translational and morphological effects of signalling alcohols on C. albicans A thesis submitted to the University of Manchester for the degree of Doctor of Philosophy in the Faculty of Life Sciences. 2014 Nkechi Egbe
-
Upload
khangminh22 -
Category
Documents
-
view
0 -
download
0
Transcript of Translational and morphological effects of signalling alcohols ...
Translational and morphological effects of signalling alcohols on C. albicans
A thesis submitted to the University of Manchester for the degree of Doctor of
Philosophy in the Faculty of Life Sciences.
2014
Nkechi Egbe

2
CONTENTS
CONTENTS ........................................................................................................................ 2
List of Figures ..................................................................................................................... 7
List of tables ........................................................................................................................ 9
List of Abbreviations ......................................................................................................... 10
Abstract ............................................................................................................................ 12
Declaration ........................................................................................................................ 13
Copyright statement ........................................................................................................... 13
Communications ................................................................................................................ 14
Acknowledgements ............................................................................................................ 15
1. Introduction ................................................................................................................... 16
1.1: The Problem of Fungal Pathogenicity ............................................................................. 16
1.2: Cellular Morphogenesis .................................................................................................. 19
1.3: Morphogenetic signalling pathways in Candida albicans ............................................... 22
1.3.1: The Mitogen-Activated protein kinase (MAP kinase) pathway in C. albicans. ....... 23
1.3.1.1 The MAP kinase module..................................................................................... 24
1.3.2: The cAMP – dependent Protein kinase pathway in C. albicans. .............................. 25
1.3.2.1 Upstream signalling components ........................................................................ 25
1.3.2.2 Adenylase cyclase, Phospodiestereses and cAMP levels .................................... 26
1.3.2.3 Protein kinase A (PKA) ...................................................................................... 27
1.3.2.4 Downstream effectors ......................................................................................... 28
1.3.2.5 Transcriptional repressors (Tup1, Nrg1 and Rfg1) and hyphal/pseudohyphal
growth ............................................................................................................................. 28
1.3.3 Tec1p and Cph2p: Convergent regulation of Cph1p and Efg1p ................................ 29
1.3.4: Summary of Cellular Morphogenesis ...................................................................... 32
1.4: The Cell Wall Integrity Pathway in C. albicans .............................................................. 33
1.4.1 Fusel Alcohols ........................................................................................................... 34
1.5: Protein Synthesis .............................................................................................................. 35
1.6: Translation pathway overview ......................................................................................... 36
1.6.1: Translation Initiation -the mechanism of translation initiation in Eukaryotes .......... 37
1.6.1.1 Formation of the 43S pre-initiation complex ...................................................... 39
1.6.1.2 mRNA preparation and selection ........................................................................ 40
1.6.1.3 43S preinitiation complex recruitment to the mRNA and mRNA scanning ....... 40
1.6.1.4 AUG recognition and 60S subunit joining .......................................................... 41
1.6.1.5 The eIF2 guanine nucleotide exchange cycle, eIF2B and the ternary complex .. 42
1.6.2 Translation initiation via other mechanisms -cellular internal ribosome entry sites .. 42
1.6.3 Translation Elongation ............................................................................................... 43
1.6.4 Translation Termination ............................................................................................. 45
1.6.5 Ribosome recycling.................................................................................................... 46
1.7 Detailed steps in the Translation Initiation pathway ......................................................... 46

3
1.7.1 The ternary complex cycle ......................................................................................... 46
1.7.1.1 Initiator tRNA ..................................................................................................... 47
1.7.1.2 eIF2 ..................................................................................................................... 47
1.7.2 eIF2B .......................................................................................................................... 48
The activity of translation initiation factors in C. albicans is less well understood. However
similar to S. cerevisiae ........................................................................................................... 48
1.7.3 mRNA selection pathway .......................................................................................... 51
1.7.3.1 eIF4E ................................................................................................................... 51
1.7.3.2 PABP ................................................................................................................... 52
1.7.3.3 eIF4A .................................................................................................................. 52
1.7.3.4 eIF4G .................................................................................................................. 53
1.8: Regulation of protein translation initiation ...................................................................... 56
1.8.1: Regulation by activation of the stress responsive eIF2α kinases .............................. 57
1.8.1.1 Mammalian eIF2α kinases .................................................................................. 58
1.8.1.2 eIF2α dephosphorylation .................................................................................... 59
1.8.1.3 Other mechanisms for eIF2B regulation ............................................................. 60
1.8.2 Regulation by eIF4E-binding proteins ....................................................................... 60
1.8.3 Amino acid starvation and GCN4 regulation ............................................................. 62
1.8.4: Translational response to membrane stress ............................................................... 67
1.9 Localisation of translation initiation factors ..................................................................... 68
1.9.1 Stress granules and processing bodies (P-bodies) ...................................................... 68
1.9.2 eIF2B Bodies ............................................................................................................. 68
1.10 Fusel alcohols .................................................................................................................. 70
1.10.1 The impact of fusel alcohols on protein translation ................................................. 71
1.10.2 Effect of alcohols on Candida albicans ................................................................... 73
1.10.3 Fusel alcohols induce morphological changes in yeast ............................................ 74
1.10.4 Alcohols induce morphological changes in Candida albicans ................................ 75
1.11 Farnesol a seisquiterepene alcohol .................................................................................. 76
1.11.1 Farnesol and quorum sensing in C. albicans ........................................................... 77
1.11.2 Mechanism of inhibition of hyphal growth by farnesol. .......................................... 79
1.12: Outline of Research ....................................................................................................... 80
2. Materials and Methods ................................................................................................... 82
2.1 Culture conditions ............................................................................................................. 82
2.1.1 Strains and growth conditions .................................................................................... 82
2.1.2 Monitoring the growth of yeast cultures .................................................................... 82
2.1.3 Bacterial strain and growth conditions ....................................................................... 83
2.1.4 Alcohol tolerance ....................................................................................................... 83
2.2 Morphogenesis assays ....................................................................................................... 83
2.2.1 Colony morphology in liquid media .......................................................................... 83
2.2.2. Colony morphology on solid media .......................................................................... 84
2.3 Manipulation of protein in vitro ........................................................................................ 85
2.3.1 Preparation of C. albicans cell extracts for Western analysis .................................... 85

4
2.3.2: Determination of protein concentration .................................................................... 85
2.3.3: Sodium Dodecyl Sulphate Polyacrylamide Gel Electrophoresis (SDS PAGE) ........ 86
2.3.4 Coomassie stain ......................................................................................................... 86
2.3.5: Western blotting ........................................................................................................ 86
2.3.6 [35
S] methionine incorporation assay ......................................................................... 87
2.3.7 GCN4 Reporter assays ............................................................................................... 88
2.3.8 Preparation of yeast cell extracts for Tandem Affinity Purification .......................... 88
2.3.9 Tandem Affinity Purification of proteins ................................................................... 89
2.3.10 Preparation of yeast cell extracts for FLAG-Affinity purification ........................... 89
2.3.11 FLAG Affinity purification of proteins.................................................................... 90
2.4 Polysome analysis ............................................................................................................. 91
2.4.1: Preparation of C. albicans cell extracts for polysome analysis ................................ 91
2.4.2: Preparation of sucrose gradients ............................................................................... 92
2.4.3: Sedimentation of polyribosomes ............................................................................... 92
2.5 Transformations ................................................................................................................ 94
2.5.1 Transformation of bacteria with plasmid DNA ......................................................... 94
2.5.2 Transformations into C. albicans ............................................................................... 94
2.6 Manipulation of DNA in vitro .......................................................................................... 95
2.6.1 Extraction of genomic DNA from yeast .................................................................... 95
2.6.2 Amplification of DNA by polymerase chain reaction ............................................... 95
2.6.3 Agarose gel electrophoresis ....................................................................................... 96
2.7 Microscopic analysis ......................................................................................................... 97
2.7.1 Slide preparation ........................................................................................................ 97
2.7.2 Epifluorescent microscopy ......................................................................................... 97
2.8 Formaldehyde cross-linked polysome analysis ................................................................. 98
2.8.1 Extract preparation ..................................................................................................... 98
2.8.2 Gradient fractionation and protein purification .......................................................... 98
2.9 RNA sequencing of polysome fractions ........................................................................... 98
2.9.1 Preparation of C. albicans extracts ............................................................................ 98
2.9.2 Extraction of RNA from the input and polysome fractions. ...................................... 99
2.9.3 Ribodepletion treatment to remove ribosomal RNA from the sample ....................... 99
2.9.3.1 Magnetic Beads preparation ................................................................................ 99
2.9.3.2 Treatment of the Total RNA sample with Ribo-Zero rRNA removal solution. 100
2.9.3.3 Magnetic Bead Reaction and rRNA Removal .................................................. 100
2.9.3.4 Purification of the rRNA-Depleted Sample ...................................................... 101
2.9.4 Assay for ribodepletion from RNA samples using Agilent RNA 6000 Nano Kit ... 101
2.9.4.1 Preparing the gel-dye mix ................................................................................. 101
2.9.4.2 Agilent RNA 6000 Nano Gel Electrophoresis .................................................. 101
2.9.4.3 Data analysis ..................................................................................................... 102
2.9.4.4 Quantitative real-time PCR ............................................................................... 103
2.10 Mass spectrometric analysis.......................................................................................... 103
2.10.3 Data Analysis ......................................................................................................... 104

5
3 Alcohols inhibit translation initiation in Candida albicans yet have opposing effects on
morphological transition ................................................................................................... 108
3.1 Introduction ..................................................................................................................... 108
3.2 Results ............................................................................................................................. 109
3.2.1 Different alcohols inhibit growth of both CAI4 and mutant (gcn2Δ) Candida albicans
.......................................................................................................................................... 109
3.2.2 Fusel alcohols and ethanol induce pseudohyphae formation in C. albicans, while
farnesol blocks it. .............................................................................................................. 114
3.2.3 Farnesol’s mode of action is predominant over butanol or serum ........................... 117
3.2.4 Inhibition of protein synthesis is a common response to alcohol ............................ 117
3.2.5 Fusel alcohols and farnesol inhibit translation initiation in a process that is
independent of the eIF2α kinase. ...................................................................................... 121
3.2.5 Does the signalling pathway that regulate morphogenesis also play a role in
translation initiation in C. albicans? ................................................................................. 126
3.2.6 Dephosphorylation of eIF2α by fusel alcohols and farnesol in C. albicans ........... 127
3.3 Discussion ....................................................................................................................... 133
4 Effects of various alcohols on the eukaryotic initiation factor 2B (eIF2B) ......................... 136
4.1 Introduction ..................................................................................................................... 136
4.2 Results ............................................................................................................................. 138
4.2.1 Butanol and ethanol induce the translation of GCN4 mRNA in a Gcn2p independent
manner in C. albicans ....................................................................................................... 138
4.2.2 Effect of alcohols on the cellular localisation of eIF2B ........................................... 143
4.2.2.1 Generating strains ............................................................................................. 143
4.2.3 Alcohols do not affect the localisation of eIF2B subunits to the eIF2B body ......... 147
4.2.4 Effect of alcohols on the dynamics of the eIF2B body ............................................ 147
4.2.5 Purification of eIF2B and eIF2 subunits from C. albicans for Mass spectrometry . 148
4.2.5.1 Strategy for V5S-His6x tagging of GCD1 in C. albicans ................................. 152
4.2.5.2 Purification of proteins from V5-6xHis tagged strains. .................................... 152
4.3.5.3 Construction of the 4X-FLAG-URA3dpl tagging cassette ................................ 156
4.2.5.4 FLAG affinity purification of eIF2B for analysis by mass spectrometry ......... 161
4.3 Discussion ....................................................................................................................... 165
5 Farnesol inhibits translation initiation in Candida albicans in a pathway that targets some
aspect of 48S preinitiation complex formation ................................................................... 168
5.1 Introduction ..................................................................................................................... 168
5.2 Results ............................................................................................................................. 169
5.2.1 MLY61 strain of S. cerevisiae exhibited similar translational responses to fusel
alcohol and farnesol as C. albicans ................................................................................... 169
5.2.2 Farnesol causes resedimentation of specific translation factors in MLY61 strain of S.
cerevisiae .......................................................................................................................... 173
5.2.3 Tandem affinity purification (TAP) of eIF4G1 ....................................................... 177
5.3 Discussion ....................................................................................................................... 181
6 RNA sequencing reveals a global change in gene expression following treatment with farnesol
in C. albicans .................................................................................................................. 183
6.1 Introduction ..................................................................................................................... 183

6
6.2 Results ............................................................................................................................. 184
6.2.1 RNA isolation from input and polysome samples ................................................... 184
6.2.2 Enrichment of mRNA and processing of enriched sample for RNA sequencing .... 184
6.3 Analysis of gene expression from the sequencing data .................................................. 188
6.4 Clarifying the translational regulation of TUP1 mRNA by q RT-PCR. ......................... 197
6.5 Validation of some of the transcriptional changes that are relevant to filamentation and
stress response using qRT-PCR ............................................................................................ 198
6.5 Discussion ....................................................................................................................... 201
7 General discussion ........................................................................................................ 203
7.1 Alcohols inhibit translation initiation in C. albicans in addition to exerting opposing
effects on growth morphology .............................................................................................. 204
7.1.1 Role of Sit4p in eIF2αP dephosphorylation ............................................................. 206
7.1.2 Alcohols affect morphogenesis ................................................................................ 207
7.2 Movement of the eIF2B body is impeded by fusel alcohol, but not farnesol ................. 208
7.2.1 Biochemical analysis of eIF2B ................................................................................ 209
7.3 The formation of the 48S preinitiation complex is affected by farnesol treatment. ........ 210
7.4 Transcriptomic analysis reveals a global change in gene expression following farnesol
treatment of C. albicans ........................................................................................................ 212
7.5 Concluding remarks and future perspectives .................................................................. 214
8. Bibliography ................................................................................................................ 217
9. Appendix ..................................................................................................................... 233
Word count: 55,656
7
List of Figures
Figure 1.1 Conserved MAP-Kinase and cAMP-dependent PKA pathways regulate
morphogenesis in C. albicans (30)
Figure 1.2 Eed1 mediates the elongation of germ tubes to hyphae (32)
Figure 1.3 Overview of Translation Initiation (38)
Figure 1.4 Structure of the ribosome showing the large and the small subunits (45)
Figure 1.5 Translational initiation control (57)
Figure 1.6 a A model for translational control of yeast GCN4 under non starvation
condition (64)
Figure 1.6 b A model for translational control of yeast GCN4 under starvation
condition (65)
Figure 1.7 Ehrlich pathway for fusel alcohol production from branched chain amino
acids. (71)
Figure 1.8 Chemical structure of farnesol (3,7,11-trimethyl-2,6,10-dodecatrien-1-ol)
(77)
Figure 2.1. An example of a polysome trace from actively translating cells and
following translation. (93)
Figure 3.1 Butanol inhibits growth of Candida albicans wildtype (CAI4) and mutant
(gcn2Δ) strains in a dose dependent manner (111)
Figure 3.2 Ethanol inhibits growth of Candida albicans wildtype (CAI4) and mutant
(gcn2Δ) strains in a dose dependent manner. (112)
Figure 3.3 The quorum sensing molecule, farnesol inhibits growth of Candida albicans
wildtype (CAI4) and mutant (gcn2Δ) strains in a dose dependent manner (113)
Figure 3.4 The effect of farnesol on filament formation in C. albicans competes with
the effect of serum or butanol. (115)
Figure 3.5 The effect of farnesol on filament formation in C. albicans competes with
that of serum or butanol (116)
Figure 3.6 Inhibition of protein synthesis in response to alcohol (119)
Figure 3.7 Translation initiation is inhibited by alcohols in the CAI4 strain (120)
Figure 3.8 Translation initiation is inhibited by alcohols in a gcn2Δ strain (123)
Figure 3.9 Polysome/monosome ratio of WT and gcn2∆ mutant strains shows similar
pattern of inhibition of translation for the two strains. (124)
Figure 3.10 Effect of farnsol and butanol on different transcriptional regulator mutants.
(125)
Figure 3.11 Butanol causes a dose dependent decrease in eIF2α serine 51
phosphorylation (eIF2α-P) in the wild type CAI4 strain. (130)
Figure 3.12 Ethanol seems to have no effect on the level of eIF2α serine 51
phosphorylation (eIF2α-P) in the wild type CAI4 strain. (131)
Figure 3.13 Farnesol causes a dose dependent decrease in eIF2α serine 51
phosphorylation (eIF2α-P) in the wild type CAI4 strain (132)
Figure 4.1 Alcohols impact on the general control pathway in C. albicans in a Gcn2p
independent manner (141)
Figure 4.2 Alcohols induce GCN4 expression in C. albicans in a Gcn2p independent
manner. (142)
Figure 4.3 Verification of GFP tagged CAI4 strain (145)
Figure 4.4 GFP tagging of GCD1 shows that eIF2Bγ is present in an eIF2B body. (146)
Figure 4.5 Alcohols do not affect the localisation of eIF2Bγ subunits to eIF2B bodies.
(149)

8
Figure 4.6 Butanol impedes the movement of eIF2B bodies. (150)
Figure 4.7 Butanol impedes movement of eIF2B bodies (151)
Figure 4.8 Verification of GCD1-V5-6xHis-tagged and SUI3 V5-6xHis-tagged CAI4
strains (154)
Figure 4.9 Affinity purification of V5-6xHis tagged eIF2B. (155)
Figure 4.10 Strategy for tagging the two alleles of C. albicans genes using the mini
Ura-blaster technique (158)
Figure 4.11 Verification of genomic C-terminal FLAG tagging of the first allele of
GCD1 in CAI4 strain (159)
Figure 4.12 Verification of genomic C-terminal FLAG tagging of the second allele of
GCD1 in CAI4 strain (160)
Figure 4.13 FLAG affinity purification of eIF2B (163)
Figure 5.1 Translational initiation is inhibited by farnesol similarly in CAI4 strain of C.
albicans and MLY61 strain of S. cerevisiae. (171)
Figure 5.2 Butanol and farnesol cause a dose dependent decrease in eIF2α serine 51
phosphatase (eIF2α-P) in the wild type S. cerevisiae MLY 61 strain. (172)
Figure 5.3 Protocol overview for formaldehyde crosslinking (175)
Figure 5.4 Farnesol affects the association of the specific translation factors with the
ribosomes (176)
Figure 5.5 Effect of farnesol on translation factors eIF4G and eIF4E was not observed
after probing with antibodies (179)
Figure 5.6 Farnesol causes the depletion of the factors that associate with the closed
loop complex downstream. (180)
Figure 6.1 Strategy of experiment for RNA sequencing of polyribosomal fractions
(186)
Figure 6.2 Flow chart for RNA sequencing (187)
Figure 6.3A Illumina Hiseq sequencing of input (total) RNA shows global changes at
the transcriptional level following farnesol treatment of C. albicans culture (193)
Figure 6.3B Illumina Hiseq sequencing of the input and polyribosomal fractions shows
global changes at the translation level following farnesol treatment of C. albicans
culture (194)
Figure 6.4A Functional annotation reveals differential regulation of certain categories
of genes (195)
Figure 6.4B Functional annotation reveals differential regulation of certain categories
of genes (196)
Figure 6.4C Functional annotation of mRNAs that are not coregulated at the
transcription and translation level. (197)
Figure 6.5 Farnesol causes redistribution of TUP1 mRNA from the polysome to the
submonosomal fraction (199)
Figure 6.6 Verification of gene expression analysis by quantitative real-time PCR
(qRT-PCR) (200)
Figure 7.1 Model for the impact of various alcohols on protein synthesis in C. albicans
and S. cerevisiae (216)

9
List of tables
Table 1.1 Distinguishing features of hyphae and pseudohyphae formed by C. albicans
(20)
Table 1.2 Protein subunits and gene names for eIF2, eIF2B, the protein kinase Gcn2p
and the transcription factor Gcn4p (50)
Table 1.3 The protein subunits and gene names of the eIF4F complex, as well as the
interacting proteins Pab1 and the ribosomal protein Rps3 (55)
Table 2.1 Sucrose solutions for gradient preparation (92)
Table 2.2 Candida albicans strains used in this study (105)
Table 2.3 S. cerevisiae strains (105)
Table 2.4 Plasmids used in this study (106)
Table 2.5 Primary antibodies used in this study (106)
Table 2.6 Oligonucleotides used in this study (106)
Table 3.1 Summary of effects of various alcohols on the physiology of C. albicans
strains (135)
Table 4.1 Identification of the eIF2B subunits by mass spectrometry (MS) analysis
(162).
Table 4.2 Treatment with butanol had no observable effect on the levels of eIF2B
subunits (164)
Table 6.1 Assessment of the sequencing reads mapping to different RNA types in the
samples (188)

10
List of Abbreviations
α Alpha
β Beta
∆ Delta
µ Micro
aa-tRNA Amino acid-bound tRNA
AIDS Acquired immune deficiency syndrome
ATF4 Activating transcription factor 4
ATP Adenosine triphosphate
bp Base pairs
C. albicans Candida albicans
cAMP Cyclic adenosine monophosphate
Cd2+
SO4 Cadmium sulphate
DEPC Diethylpyrocarbonate
DIC Differential interference contrast
DNA Deoxyribonucleic acid
dNTP Deoxyribonucleotide
DTT Dithiothreitol
ECL Electrochemiluminescence
EDTA Ethylenediaminetetraacetic acid
eEF Eukaryotic elongation factor
eIFs Eukaryotic initiation factor
eRF Eukaryotic release factor
ER Endoplasmic reticulum
FBS Fetal bovine serum
g Gram(s)
GAAC General amino acid control
GAPDH Glyceraldehyde-3-phosphate dehydrogenase
GCRE Gcn4-response elements
Gcn General control non-derepressible
Gcd General control derepressed
GDP Guanosine diphosphate
GEF Guanine nucleotide exchange activity
GFP Green fluorescent protein
GlcNAc N-acetylglucosamine
GRX1 Glutaredoxin genes
GTP Guanosine triphosphate
HEPES 4-(2-hydroxyethyl)-1-piperazineethanesulfonic acid
HisRS Histidyl tRNA synthetase
HIV Human immunodeficiency virus
H2O2 Hydrogen peroxide
HOG1 High osmolarity glycerol response 1
HRI Heme-regulated inhibitor
HRP Horseradish peroxidase
ISR Integrated stress response
IRES
k
Internal ribosome entry sites
Kilo (prefix)
l Litre(s)
LB Luria-Bertani media
M Milli (prefix)
M Molar
MAPK Mitogen-activated protein kinase
m7GTP 7-methyl-guanosine triphosphate
Met-tRNAMet
Initiator methionyl-tRNA
MFC Multi factor complex
MMS Methyl methanesulfonate

11
Mn Manganese
Mnk Mitogen activated protein kinase signal-integrating kinases
mRNA Messenger RNA
mRNP Messenger ribonucleoprotein
mTORC Mammalian target of rapamycin complex 1
n Nano (prefix)
N. crassa Neurospora crassa
NIH National institute of health
Nrf2 Nuclear factor (erythroid-derived 2)-like 2
OD Optical density
ORF Open reading frame
P Phosphorylation
PABP Poly(A)-binding protein
P-bodies Processing bodies
PCR Polymerase chain reaction
PEG Polyethylene glycol
PERK/PEK PKR endoplasmic reticulum eIF2α kinase
PKR Double stranded RNA-activated protein kinase
PMSF Phenylmethylsulfonylfluoride
Rev Revolution
RLUC Renilla luciferase
RNA Ribonucleic acid
ROS Reactive oxygen species
Rpm Revolutions per minute
rRNA Ribosomal RNA
RT-PCR Real time-PCR
SC Synthetic complete
S. cerevisiae Saccharomyces cerevisiae
SD Synthetic minimal
SG Stress granule
siRNA Small interfering RNA
Sod Superoxide dismutase
Spp Species
SUI Supressor of initiation
TAE Tris base, acetic acid, EDTA
TC Ternary complex
TCA Tricarboxylic acid
Tef1 Translation elongation factor 1
TEMED Tetramethylethylenediamine
TOR Target of rapamycin
tRNA Transfer RNA
Tm Melting temperature
uORF Upstream open reading frame
UTR Untranslated region
UV Ultraviolet
v/v Volume per volume
w/v Weight per volume
WT Wild-type
YEPD Yeast extract peptone dextrose
2-DE Two-dimensional gel electrophoresis
3AT 3-amino-1,2,4-triazole
4E-BP 4E-binding protein
5-FOA 5-fluoroorotic acid

12
Abstract
Candida albicans is a polymorphic yeast that can cause life threatening systemic
infections in immunocompromised individuals. One key attribute of C. albicans that
enhances its pathogenicity is the ability to switch morphologies between filamentous
and vegetative modes in response to specific environmental conditions. Stressful
changes in such cellular conditions commonly cause a rapid inhibition of global protein
synthesis leading to altered programmes of gene expression. In Saccharomyces
cerevisiae, fusel alcohols signal nitrogen scarcity and induce pseudohyphal growth
enabling yeast colonies to spread towards nutrient replete areas. These alcohols also
inhibit protein synthesis by targeting the translation initiation factor, eIF2B. eIF2B is
the guanine nucleotide exchange factor for eIF2, which supports eIF2-GTP production
and represents a key regulated step in translation initiation. eIF2-GTP interacts with
Met-tRNAiMet
to form the ternary complex which is essential for translation initiation.
Fusel alcohols target eIF2B leading to reduced levels of ternary complex and reduced
protein synthesis.
In Candida albicans, a variety of cell biological and genetic assays suggest that fusel
alcohols and ethanol inhibit protein synthesis by targeting the translation initiation
factor, eIF2B, and they also induce hyphal/pseudohyphal growth, a process that is
associated with pathogenesis in C. albicans. In contrast to fusel alcohols, farnesol, a
quorum sensing alcohol, does not appear to impact upon eIF2B activity. Rather,
biochemical and mass spectrometric analysis suggest farnesol affects the interaction of
the mRNA with the small ribosomal subunit during translation initiation. Further
elucidation of the effect of farnesol on C. albicans transcript levels and ribosome
association by next generation sequencing gave insight into the genes that are
differentially expressed following farnesol treatment. While genes involved in
morphological differentiation were generally repressed, those involved in protein
synthesis were upregulated, possibly as an adaptive response to inhibition of protein
synthesis by farnesol. Intriguingly, the regulation of these functional categories of genes
occurred in a co-ordinated manner at either the transcript level or at the level of
ribosome association, but rarely was gene expression regulated at both transcriptional
and post-transcriptional levels for the same gene.
Nkechi E. Egbe
The University of Manchester
A thesis submitted to the University of Manchester for the degree of Doctor of
Philosophy in the Faculty of Life Sciences. 2014
Translational and morphological effects of signalling alcohols on C. albicans
13
Declaration
No portion of the work referred to in the thesis has been submitted in support of an
application for another degree or qualification of this or any other university or other
institute of learning
Copyright statement
I. The author of this thesis (including any appendices and/or schedules to this
thesis) owns certain copyright or related rights in it (the “Copyright”) and s/he
has given The University of Manchester certain rights to use such Copyright,
including for administrative purposes.
II. Copies of this thesis, either in full or in extracts and whether in hard or
electronic copy, may be made only in accordance with the Copyright, Designs
and Patents Act 1988 (as amended) and regulations issued under it or, where
appropriate, in accordance with licensing agreements which the University has
from time to time. This page must form part of any such copies made.
III. The ownership of certain Copyright, patents, designs, trade marks and other
intellectual property (the “Intellectual Property”) and any reproductions of
copyright works in the thesis, for example graphs and tables (“Reproductions”),
which may be described in this thesis, may not be owned by the author and may
be owned by third parties. Such Intellectual Property and Reproductions cannot
and must not be made available for use without the prior written permission of
the owner(s) of the relevant Intellectual Property and/or Reproductions.
IV. Further information on the conditions under which disclosure, publication and
commercialisation of this thesis, the Copyright and any Intellectual Property
and/or Reproductions described in it may take place is available in the
University IP Policy (see
http://documents.manchester.ac.uk/DocuInfo.aspx?DocID=487), in any relevant
Thesis restriction declarations deposited in the University Library, The
University Library’s regulations (see
http://www.manchester.ac.uk/library/aboutus/regulations) and in The
University’s policy on Presentation of Theses

14
Communications
Nkechi Egbe, Mark P. Ashe. Understanding the mechanism of inhibition of protein
synthesis by signalling molecules in Candida albicans. Oral presentation-FLS PhD
Conference Manchester, 2014
Nkechi E. Egbe, Mark P. Ashe. Quorum sensing, protein synthesis and morphological
transitions in Candida albicans. Poster presentation- SGM Autumn Conference UK
2013
Nkechi E. Egbe, Mark P. Ashe. Different alcohols inhibit translation initiation by
distinct mechanisms in yeast correlating with effects on morphological transitions.
Poster presentation-Translation UK 2013
Nkechi E. Egbe, Mark P. Ashe. The impact of alcohols on translation initiation in the
human fungal pathogen Candida albicans. Poster presentation-Translation control
Cold Spring Harbor 2012
Nkechi E Egbe, Caroline M Paget, Hui Wang and Mark P Ashe. Alcohols inhibit
translation to regulate morphogenesis in C. albicans J Fung Genet Biol. In press
15
Acknowledgements
Firstly I want to thank my supervisor, Dr Mark Ashe who gave me this opportunity to
accomplish a key aim in my career. He inspired me with his vast knowledge on diverse
areas and was always willing to answer my questions regarding my research. He is a
model supervisor. Special thanks to my advisor, Prof Chris Grant for our useful
meetings and for providing strains. Many thanks to Prof Graham Pavitt for his input
during lab meetings and journal clubs. In addition I would like to thank Prof Alistair
Brown, Dr Stephen Milne and Prof Joe Heitman for providing some of the strains used
in this research.
I also want to acknowledge Prof Theodore White for suggesting RNA sequencing of
input and polysome fractions following farnesol treatment.
I am grateful to team MASHE (past and present): Jenny, Hui, Kazz, Claire, Jemma,
Pete, Hassan, Reem, Vittoria, Henry, Gbenga, Fabian, Kathy and Tawni for their help
and friendship. Special regards to the LOLA group: Lydia, Chris and Joe for helping out
with protocols on protein and RNA work.
Many thanks to the Grant and Pavitt lab members for their help in providing some of
the reagents I needed when our lab has run out. I say a huge thank you to Arunkumar,
my partner in Candida work; he has been very helpful, and also a good lab neighbour.
I would not have come this far in my programme without the help and prayers of my
family and brethren. To my husband and children: Chukwuka (Snr), Chukwuka(Jnr),
Chukwunonso, Uchenna and Chinenye; my sisters, brothers and mum, thank you all for
holding the fort for these four long years while I was away in search of the golden
fleece.
My regards to my sponsors, the Tertiary education Trust Fund for providing the funding
for this thesis.
To the Almighty God who has made all these possible, I say praise be to his holy name.

16
1. Introduction
1.1: The Problem of Fungal Pathogenicity
Yeasts belong to the large and diverse fungal kingdom. These ubiquitous
microorganisms appear in various forms and inhabit a whole range of different
environments. Fungi are heterotrophic organisms, which possess a chitinous cell wall
and sterol containing cell membranes. Several species are pathogens of human or other
animals and plants. The most frequently diagnosed fungal infections of humans are
caused by pathogens from the genera Candida, Aspergillus and Cryptococcus
(Richardson 2005). Single-celled yeasts belong to the phylum Ascomycota and this
phylum contains the order Saccharomycetales consisting of the most prominent genera
Saccharomyces and Candida. The genus Candida was formerly of the order
Cryptococcales. Traditionally, species within the genus have been classified and
identified on the basis of a limited number of morphological features such as production
of true hyphae, formation of chlamydospores and the assimilation of a range of nutrients
as the sole source of carbon or nitrogen. The genus Candida is the form genus
consisting of an array of yeast species in which no complete sexual cycle has been
observed (Kwon-Chung and Bennett 1992; Forche et al. 2008). Although an elaborate
mechanism for mating can still be operational (Kim and Sudbery 2011). In C. albicans,
mating occurs between diploid mating type-like (MTL) a and α strains to generate an
a/α tetraploid strain. The resulting tetraploids then undergo efficient, random
chromosome loss resulting in diploid cells. (Forche et al. 2008). Mating occurs both
under laboratory conditions and different invivo niches (Hull et al. 2000). Efficient
mating requires that the diploid cells of opposite mating type first switch morphology
from the more common ‘white’ phase to the ‘opaque’ phase and then undergo cell
fusion (Miller and Johnson 2002).

17
Candida species is a normal part of the human microflora. They usually reside as
commensal organisms on the skin, in the gastrointestinal tracts and/or in the
genitourinary tracts of mammalian hosts. As such, they can be detected in
approximately 50% of the human population in this form (Jarvis 1995).
However, Candida species especially C. albicans, is an opportunistic pathogen and if
the balance of the normal microflora is disrupted or the immune system is
compromised, as in cancer, transplant or AIDS patients, Candida infections pose a
specific and major problem; as they can quickly become the cause of morbidity.
Individuals with healthy immune systems limit Candida growth at mucosal sites. In
contrast, a compromised immune system often leads to mucocandidiasis, oral thrush or
systemic candidiasis in which the fungus can spread to all major organs of the body
(Pfaller and Diekema 2007). Candidiasis (infection caused by Candida species) is
increasing in an ever-expanding population of immunodeficient patients. As a result,
Candida species now rank among the top four microbes isolated from clinical
specimens (Pfaller and Diekema 2007) and mortality attributed to bloodstream
infections caused by Candida species approaches 35% (Pittet and Wenzel 1995).
Common risk factors for bloodstream candidiasis include extremes of age (low-birth
weight infants and the elderly), immunosuppression, malignancy with leukopenia,
major abdominal surgery, trauma, burns, chemotherapy or radiotherapy as well as
exposure to multiple antibacterial agents, central venous catheterization, prolonged
length of stay in intensive care units and parenteral nutrition (Jarvis 1995).
The most common species that cause candidiasis is C. albicans, but others, such as C.
glabrata, C. parapsilopsis and C. dublinensis, can be associated with disease; however,
C. albicans is generally regarded as the most virulent of all Candida species.
Pathogenesis of C. albicans requires differential expression of virulence factors at each
new stage of the process. Some of these virulence attributes are the ability to exist in

18
various morphologies, expression of surface adhesion molecules to colonise epithelial
surfaces, range of proteolytic enzymes such as secreted aspartyl proteinases (SAP) and
lipases, that are required for nutrient acquisition and invasion of epithelial surfaces
(Ross et al. 1990; Cutler 1991).
Candida albicans is a dimorphic pathogenic fungus alternating between the vegetative
(yeast) form and filamentous (pseudohyphae or hyphae) form.
Fusel alcohols such as 1-butanol, isoamyl alcohol, active amyl alcohol are products of
amino acid catabolism in yeast, and their production is associated with nitrogen
starvation. Fusel alcohols have been shown to affect various cellular processes such as
protein translation initiation in S. cerevisiae (Ashe et al. 2001) and morphogenesis
(pseudohyphal formation) in S. cerevisiae and C. albicans (Dickinson 1996).
Farnesol, an acyclic sesquiterpene alcohol is produced and secreted predominantly by
two species of Candida: Candida albicans and Candida dubliniensis. Apart from
transcriptional activation, farnesol has been shown to prevent yeast-to-hyphae transition
and most likely as a result inhibits the colonization of several matrices, such as
polystyrene or tissues by C. albicans (Ramage et al. 2002; Kruppa 2009).
Ethanol is a byproduct of the metabolism of glucose in S. cerevisiae, C. albicans and
other fungi. However C. albicans produce less ethanol than S. cerevisiae, as their
metabolism is more geared towards respiration. Ethanol has been shown to inhibit
protein translation in S. cerevisiae and induce germ tube formation in C. albicans
(Pollack and Hashimoto 1985). Ethanol also has a wide use in medical practice due its
antiseptic properties against a variety of micro-organisms including Candida species.

19
1.2: Cellular Morphogenesis
The ability to switch between unicellular yeast cells and filamentous forms, such as
hyphae and pseudohyphae, in response to diverse stimuli is important for fungal
pathogenicity (D'Souza and Heitman 2001). The hyphal form is particularly associated
with virulence attributes, including passage through host tissues and defence against
immune cells. (Fernandez-Arenas et al. 2007). However, there is no absolute
relationship between hyphal growth and pathogenesis because many clinically relevant
fungi including Histoplasma capsulatum and Coccidiodes imitis, are pathogenic in yeast
form and saprophytic in hyphal form (Nemecek et al. 2006; Wang et al. 2012).
Candida albicans undergoes reversible morphological transitions between ovoid,
unicellular budding cells (yeast cells) and chains of filamentous cells (pseudohyphae or
hyphae). It is also capable of producing chlamydospores usually believed to be dormant
growth forms (Odds 1988). Therefore, C. albicans has the ability to adopt a spectrum of
morphologies and mechanisms responsible for morphological switching have received a
great deal of attention (Reviewed in Sudbery et al. 2004).
During the switch from vegetative yeast-form growth to the hyphal form, the production
of germ tubes appears to represent a key first stage (Biswas and Morschhauser 2005).
The conversion of yeast form cells to pseudohyphae occurs as a result of polarized cell
division when yeast cells growing by budding have elongated without detaching from
adjacent cells. As a result, filaments composed of elongated cells with constrictions at
the septa are formed. Sometimes the buds elongate so much that they resemble true
hyphae. However as shown in Table 1.1, various subtle distinctions have been identified
between hyphae and pseudohyphae (Sudbery et al. 2004).

20
Table 1.1 Distinguishing features of hyphae and pseudohyphae formed by C.
albicans (Sudbery et al. 2004).
Despite the observed differences between hyphae and pseudohyphae, it is interesting
that similar environmental conditions induce these morphologies, with the balance
being tipped towards hyphae as the conditions become more extreme (Sudbery et al.
2004).
A second morphological switch involves the interconversion between white and opaque
forms of C. albicans. This is an epigenetic switch that allows rapid and reversible
switching between cells in white colonies that are round and cells in opaque colonies
that are ellipsoidal (Slutsky et al. 1987). Cells from white colonies are similar in shape,
size, and budding pattern to cells of common laboratory strains. In contrast, cells from
opaque colonies are elongate, or bean shaped, and twice as large as the white cells.
‘Opaque’ cells also undergo filamentation, but they do so in response of different
environmental cues than those of ‘white’ cells (Si et al. 2013).
Criterion Hyphae Pseudohypha
Shape Sides parallel Sides not parallel
Septa No constrictions at septal junctions Constrictions at mother-bud neck
and subsequent septal junctions
First septum within the germ tube First septum at the mother
bud neck
Cell width Width ~2µ Minimum width ≥ 2.8µ
Septins Septin ring within germ tube Septin ring at mother-bud neck
Filaments Less branches, cell cycle not Highly branched with cell cycle
synchronised synchrony

21
Under extreme non-optimal growth conditions rather than forming hyphae or
pseudophyphae, C. albicans can undergo the formation of chlamydospores, which are
round, retractile spores with a thick wall. These are thought to function as dormant
cellular forms (Raudonis and Smith 1982; Staib and Morschhäuser 2007).
The yeast to hyphae transition in C. albicans is induced in response to several
environmental conditions. Parameters that promote hyphal development in vitro include
temperatures above 37oC, a pH greater than 6.5, serum, proline or N-acetylglucosamine,
low dissolved oxygen concentrations and elevated CO2 concentrations, nitrogen or
carbon starvation; while high cells densities inhibit hyphal development (Brown and
Gow 1999; Klengel et al. 2005). It has become clear that an increase in temperature to
about 37oC is particularly important, being required before most of the above conditions
can impact on morphogenesis. An exception to this is embedded C. albicans cells which
form hyphae even at 25oC (Brown and Gow 1999). The production of unicellular yeast
forms is stimulated by lower temperatures and more acidic pH, absence of serum and
high concentrations of glucose.
Recently, quorum sensing has been described as a phenomenon contributing to
morphogenetic control in C. albicans. Dependence on cell density has been shown to be
one of the effects that contribute to yeast to hyphae transition in vitro; and this has been
termed the ‘inoculum effect’ (Kruppa 2009). The inoculum effect is observed when
yeast cells are diluted to concentrations less than 106 cells ml
-1 in culture medium;
conditions which induce germ tube formation. However, when cells are inoculated at
higher concentrations (›106 cells ml
-1), they remain predominantly in a yeast state. The
term inoculum effect has been associated with regulation by quorum sensing (Kruppa
2009) and one of the molecules that is considered important for this is farnesol, a
quorum sensing molecule (QSM) of C. albicans (Hornby et al. 2001).

22
Thus the morphological transitions are often a response of the fungus to changing
environmental conditions and it has been hypothesized that these form part of a
mechanism permitting adaptation to a different biological niche. Evidence supporting
this hypothesis includes the fact that strains of C. albicans defective in morphogenesis
are attenuated in terms of virulence and hence their capacity to cause systemic
candidiasis. These experiments correlated the avirulent phenotype of C. albicans
mutants with that of a failure to form hyphae in a mouse model (Lo et al. 1997).
However virulence is a complex trait with both the yeast and hyphal switching of C.
albicans thought to play vital roles in pathogenesis, as mutants lacking genes
responsible for the production of either trait are less virulent (Calderone and Fonzi
2001).
1.3: Morphogenetic signalling pathways in Candida albicans
Hyphal development in C. albicans is determined by a broad range of signals or culture
conditions in vivo. According to Liu (2001) many signalling pathways or regulators
have been found to influence filamentation in various in vitro hyphae-inducing
conditions. These signalling pathways are complex and comprise several pathways
encompassing crosstalk and feedback. Despite the diversity of external signals
promoting dimorphic transition in several fungal species, pathways transducing these
external signals to the cellular machinery are highly conserved (D'Souza and Heitman
2001). This has allowed the identification of components of these pathways based on
the insight gained from studies of pseudohyphae formation in S. cerevisiae (Lengeler et
al. 2000).
The major morphogenetic signalling pathways in C. albicans are: the Cek1p Mitogen-
Activated Protein Kinase pathway, the cyclic Adenosine Monophosphate (cAMP)-
dependent Protein Kinase A pathway, the Czf1p pathway (induced by embedding in a

23
solid matrix) (Brown and Gow 1999) and the Rim 101p pathway induced in response to
pH alterations (Liu 2001). In addition, two negative regulators of filamentous growth
act through the transcriptional regulator Tup1p (Braun and Johnson 1997) associated
with Nrg1p (Braun et al. 2001) and Rfg1p (Kadosh and Johnson 2001) respectively.
1.3.1: The Mitogen-Activated protein kinase (MAP kinase) pathway in C. albicans.
The first morphogenetic signalling components to be identified in C. albicans were
members of a mitogen activated protein (MAP) kinase pathway similar to the
pheromone signalling and morphogenetic signalling pathway in S. cerevisiae (Monge
et al. 2006). Mitogen-activated protein kinase signalling cascades are widely used
mechanisms in eukaryotic cells coupling environmental cues to transcriptional
regulation. Four MAPKs have been identified in C. albicans (Navarro-Garcia et al.
2005; Roman et al. 2009). They are the Cek1p-mediated pathway involved in
morphogenesis and hyphal formation (Whiteway 2000), the Cek2p pathway with a role
in mating (Chen et al. 2002). Others are the cell integrity pathway, culminating in the
Mkc1 MAPK, which plays a role in cell wall construction, the response to certain stress
conditions (Navarro-Garcia et al. 2005) and biofilm formation (Kumamoto 2005) and
the High Osmolarity Glycerol (HOG) pathway, which enables adaptation to both
osmotic and oxidative stress (Alonso-Monge et al. 1999; Arana et al. 2005).
The morphogenetic or Cek1p MAPK cascade of C. albicans comprising the Cst20p
(MAPK kinase kinase; PAK (P21-activated protein kinase) (Leberer et al. 1996); Hst7p
(MAPK kinase; MEK (MAPK/ERK kinase), Cek1 (MAPK) (Liu et al. 1994; Leberer et
al. 1996; Csank et al. 1997) are all required for hyphal morphogenesis, invasive hyphal
growth and virulence.

24
1.3.1.1 The MAP kinase module
The core of the MAPK pathway is a Map kinase module (Cst20p, Hst7p, Cek1p) which
is activated by Cst20p (Fig. 1.1). When upstream signals are fed into the MAPK kinase
kinase (Cst20p), it becomes phosphorylated and in turn phosphorylates the MAPK
kinase, which in turn phosphorylates the MAPK. A MAPK cascade normally transmits
and amplifies the signal to downstream transcription factors that generate a specific
adaptive response. (Monge et al. 2006). The transcription factor, Cph1p, which is
homologous to the Ste12p transciption factor in S. cerevisiae, lies downstream of the
MAPK module. (Liu et al. 1994). Null mutants of the MAPK pathway (Cst20, Hst7 or
Cek1) or the transcription factor Cph1 all display a defect in hyphal development on
solid medium in response to many inducing conditions (Liu 2001).
In addition to these components, homologous MAP Kinase Phosphatases, Cpp1p and
Cpp2p, have been identified which regulate filamentous growth in C. albicans (Csank et
al. 1997). Disruption of both alleles of the CPP1 gene results in a hyperfilamentous
phenotype. The cpp1/cpp2 mutant strains are also reduced for virulence in both
systemic and localized models of candidiasis (Csank et al. 1997). Activation of MAPK
pathway can occur through Cdc42p, which itself binds with high affinity to the Cst20
kinase (Leberer et al. 1997).
Cek1p MAPK activity and/or expression could also be regulated by quorum sensing
(QS). Two QS molecules tyrosol and farnesol recently identified in C. albicans have
been shown to be involved in morphogenesis (Hornby et al. 2001) and studies have
shown that farnesol reduces the levels of both the HTS7 and CPH1 mRNAs (Sato et al.
2004).
However, a key consideration that was recognised in early studies of this pathway in C.
albicans, is that in the presence of serum, all of the MAPK pathway mutants are able to
undergo filamentous growth, thus indicating that this pathway is neither the only

25
mechanism leading to hyphal formation nor is it likely to be the main one in
pathogenesis (Liu 2001).
1.3.2: The cAMP – dependent Protein kinase pathway in C. albicans.
The cAMP-PKA pathway also plays a crucial role in filamentation in S. cerevisiae, C.
albicans and other filamentous fungi (Lengeler et al. 2000). In C. albicans, an increase
in cAMP levels accompanies the yeast to hyphae transition, and inhibition of the cAMP
phosphodiesterase induces this transition (Sabie and Gadd 1992).
A number of homologues of S. cerevisiae cAMP-dependent PKA pathway components
have been identified in C. albicans including the transmembrane receptor Mep2p
(Biswas and Morschhauser 2005), the G-protein coupled receptor Gpr1p, the Gα protein
Gpa2p, the G-protein Ras1p, the adenylyl cyclase Cdc35p, the cAMP-dependent protein
kinase A and the transcriptional factor Flo8p (Leberer et al. 2001); reviewed in Biswas
et al. (2007) (Fig. 1.1).
1.3.2.1 Upstream signalling components
In S. cerevisiae, the cAMP-PKA pathway is activated by a G protein coupled receptor
(GPRC) system Gpr1p and the Gα protein Gpa2p; and this system is required for the
induction of pseudohyphal and invasive growth. More specifically, GPR1 and GPA2
mutants are deficient in this growth switch and this deficiency can be suppressed by the
addition of cAMP (Lorenz et al. 2000).
C. albicans GPA2 may function upstream of both the Cek1 MAPK pathway and the
cAMP-PKA pathway (reviewed in Biswas et al. 2007). GPA2 (the Gα protein) or GPR1
(the receptor) deletion strains of C. albicans show defects in morphogenesis which are
reversed by overexpression of downsteam components in the pathway or by addition of
26
dibutyryl-cAMP (dbcAMP). Epistasis analysis showed that GPA2 acts downstream of
GPR1 in the cAMP-PKA pathway (Miwa et al. 2004).
Another potential upstream component that might signal through PKA is C. albicans
Ras1p. By analogy with S. cerevisiae where Ras2p regulates morphogenesis pathways
(Biswas et al. 2007), ras1 mutants of C. albicans are impaired in hyphal growth under
a wide range of inducing conditions (Leberer et al. 2001) and this morphogenetic defect
can be reversed by supplementing the growth medium with cAMP or by overexpressing
components of the MAPK cascade (Leberer et al. 2001). This result highlights the
crosstalk that occurs between these in morphogenetic differentiation in C. abicans.
1.3.2.2 Adenylase cyclase, Phospodiestereses and cAMP levels
C. albicans CDC35 is a homologue of the S. cerevisiae adenylyl cyclase gene
CYR1/CDC35 (Rocha et al. 2001). The presence of a Ras1p binding domain in C.
albicans Cdc35p, suggests that, similar to other fungal isoforms, C. albicans Cdc35p
could be regulated by Ras1p. C. albicans cells deleted for both alleles of CDC35 had no
detectable cAMP levels, suggesting that this gene encodes the only adenylyl cyclase in
this organism. C. albicans cdc35 mutants are avirulent in a mouse model of infection,
are unable to form hyphae in most liquid and solid hyphae-inducing media; however,
they are slow growing (Rocha et al. 2001). The morphogenetic defect can be rescued by
exogenous cAMP, which points to a role for Cdc35p in the activation of the cAMP-
PKA pathway (Rocha et al. 2001).
Low and high-affinity phosphodieterase genes (PDE1 and PDE2) have also been
identified in C. albicans (Bahn et al. 2003; Jung et al. 2005). pde2 mutants have
increased sensitivity to cell wall and membrane perturbing agents, fail to produce
normal hyphae in liquid medium and form aberrant hyphae on solid medium (Jung et al.

27
2005). Under non-hyphae inducing conditions on agar media, the homozygous pde2
mutant forms wrinkled colonies consisting of mixtures of elongated yeast,
pseudohyphae and true hyphae. Germ tube formation in liquid media is also accelerated
in the pde2 mutant compared to wild-type strains. Therefore, Pde2p is viewed as a
negative regulator of cAMP signalling.
1.3.2.3 Protein kinase A (PKA)
The cAMP-dependent protein kinase (PKA) is crucial for growth and cellular
differentiation in eukaryotic cells. PKA consists of two catalytic subunits (Tpk1 and
Tpk2) that are inactivated by the binding of a heterodimer of regulatory subunits
(Bcy1). External signals increase intracellular levels of cAMP, which when bound to
the regulatory subunits liberates and thereby activates the catalytic subunits. PKA is
therefore thought to phosphorylate and activate the transcription factor Efg1 (Bockmühl
and Ernst 2001). C. albicans has only two PKA catalytic subunits, Tpk1p and Tpk2p.
Unlike S. cerevisiae in which only one of the three catalytic subunits is an activator and
the other two are inhibitors of pseudohyphal growth, both PKA isoforms in Candida
albicans are positive regulators of hyphal morphogenesis. However the phenotypic
outputs of the two PKA mutants differ, while tpk1 mutants are defective in hyphal
formation on solid media, tpk2 mutants are blocked for hyphal formation in liquid
medium (Sonneborn et al. 2000) . Epistasis analyses place both TPK1 and TPK2
downstream of RAS1 (Bockmuhl et al. 2001).
The regulatory subunits of PKA in S. cerevisiae and C. albicans are encoded by BCY1
genes. It has been shown that a Tpk1-GFP fusion is dispersed throughout the cell in the
bcy1 tpk2 double mutant, while it is normally localised in the nucleus in the wild-type
cells. This suggests that C. albicans Bcy1p may tether the PKA catalytic subunit to the

28
nucleus and thereby perform a vital role in regulating the enzymatic activity and
availability of PKA in response to growth (Cassola et al. 2004).
1.3.2.4 Downstream effectors
Efg1p, a basic helix-loop-helix (bHLH) protein similar to Phd1p and Sok2p of S.
cerevisiae, StuAP of Aspergillus nidulans and Asm1 of Neurospora crassa plays a
major role in hyphal morphogenesis (Ernst 2000). Serum-induced morphogenesis, a
process that is regulated by the PKA pathway, requires Efg1p. The efg1 null mutant
strain does not form hyphae under most inducing conditions and is defective in the
induction of hyphae-specific genes (Liu 2001). Efg1p is therefore considered an
activator of hyphal development as it is essential for the activation of hypha-specific
genes in C. albicans (Sohn et al. 2003). An efg1 cph1 double mutant strain has an
extreme filamentous growth defect and is essentially avirulent in a mouse model of
systemic infection (Lo et al. 1997). Another transcription factor, Flo8p, interacts with
Efg1 in vivo and is required for both morphogenesis and for virulence (Cao et al. 2006).
1.3.2.5 Transcriptional repressors (Tup1, Nrg1 and Rfg1) and
hyphal/pseudohyphal growth
As well as activators, transcriptional repressors are important downstream effectors of
signalling pathways. Tup1p has been described by Braun and Johnson (1997) to
negatively control filamentatous growth in C. albicans. Tup1p in association with either
Nrg1p or Rfg1p negatively regulates the expression of hypha-specific genes (Kadosh
and Johnson 2001; Murad et al. 2001; Kadosh and Johnson 2005). Nrg1p mRNA is
down regulated by serum and temperature (Braun et al. 2001); hence, the hyphal-
specific genes controlled by Nrg1p and Tup1p are likely induced as a result of this

29
down regulation. Thus a specific subset of C. albicans genes involved in filamentation
are repressed in a Tup1p dependent fashion, however; Nrg1p and another repressor
Mig1p also repress other C. albicans genes independently of Tup1p (Murad et al.
2001). Cells lacking any of these repressors grow constitutively as pseudohyphae, as the
expression of hypha-specific genes is constitutively derepressed (Sudbery 2011).
1.3.3 Tec1p and Cph2p: Convergent regulation of Cph1p and Efg1p
Tec1p, a member of the TEA/ATTS family of transcription factors, has been shown to
regulate hyphal development in C. albicans (Schweizer et al. 2000). In S. cerevisiae,
Tec1p and Ste12p (a homologue of Cph1p in C. albicans) form a transcription factor
complex to specifically activate genes involved in pseudohyphal growth (Madhani and
Fink 1997). In C. albicans however; TEC1 transcription is regulated by Cph2p and
Efg1p. Cph2p binds directly to two sterol regulatory element promoter elements
upstream of the TEC1 gene. Furthermore, ectopic expression of TEC1 suppresses the
defect of a CPH2 deletion in hyphal development.

30
Figure.1.1 Conserved MAP-Kinase and cAMP-dependent PKA pathways regulate
morphogenesis in C. albicans. Boxes represent transcriptional regulators, green colour
represents positive regulators and red colour represents negative regulators. Arrows
indicate positive regulation and bars negative regulation. Adapted from Sudbery (2011).

31
1.3.4: Hyphal Extention Pathway
The C. albicans epithelial escape and dissemination 1 (EED1) (Zakikhany et al. 2007)
and UME6 (Banerjee et al. 2008) play a crucial role in extension of germ tubes into
elongated hyphae and also in the maintenance of filamentous growth (Martin et al.
2011). Expression of UME6 depends on Eed1, which itself is a target of the
transcription factor Efg1 (Doedt et al. 2004) (Figure 1.2). Mutants lacking eed1 failed to
extend germ tubes into long filaments and switched back to yeast growth after 3 h of
incubation; however overexpression of UME6 restored the hyphal elongation. UME6
was found to be NRG1 repressed but under hyphae-inducing conditions may play a role
in suppressing NRG1 transcription (O'Connor et al. 2010; Martin et al. 2011). EED1
expression is regulated by Nrg1 and Tup1 as the expression of EED1 is upregulated in
nrg1∆ and tup1∆ mutants (Doedt et al. 2004; Martin et al. 2011). EED1 is a unique
species-specific gene of C. albicans as no homologous gene was found in any genome
sequence accessible via NCB1. Another important target of Ume6 is the kinase HGC1
encoding a hypha-specific G1 cyclin (Zheng et al. 2004). HGC1 was downregulated in
eed1∆ and this downregulation was bypassed by overexpression of Ume6 in eed1∆.
Hgc1 is involved in the phosphorylation of Efg1.

32
1.3.4: Summary of Cellular Morphogenesis
A variety of pathways have been identified which impact on morphogenesis leading to
alterations in the virulence of Candida albicans. Much of the work has relied upon
direct comparisons with S. cerevisiae pseudohyphal growth. Therefore, signal
transduction pathways that lead to changes in gene transcription during the switch to
pseudohyphal growth are well studied. It yet remains to be revealed whether control of
gene expression at the post-transciptional level plays a role in this switch (Gancedo
2001), particularly in the human pathogen, Candida albicans. As will be covered in
more detail in Section 1.10, a variety of alcohols which inhibit protein synthesis also
cause changes to morphogenesis, although it is not entirely clear which pathway(s) are
Figure 1.2 Eed1 mediates the elongation of germ tubes to hyphae. Environmental
signals transduced via the signalling regulators like Ras1p, Cph1p and Efg1 convert
yeast cells into germ tubes. Eed1 and Ume6 are required for the extention of the
germ tube into long hyphae. Arrows indicate positive regulation and bars negative
regulation Adapted from Martin et al. (2011).

33
involved and how the translational control connects with other aspects of the effects of
alcohols on cells.
1.4: The Cell Wall Integrity Pathway in C. albicans
It is well established that alcohols have chaotropic effects on membrane structure
(Ingram 1981; Ingram 1986). In C. albicans, several signaling pathways regulate cell
wall and membrane integrity (Lengeler et al. 2000; Kruppa and Calderone 2006).
Mkc1p (the homologue of S. cerevisiae Slt2p MAPK) is involved in regulating cell wall
integrity and is required for growth at elevated temperatures in C. albicans (Navarro-
Garcia et al. 1995). A C. albicans mkc1 null mutant exhibits increased susceptibility to
cell wall perturbing agents and to some inhibitors of cell wall synthesis. The mutant also
has defects in morphogenesis, has attenuated virulence and exhibits reduced cell
viability at 42oC (Navarro-Garcia et al. 1995; Diez-Orejas et al. 1997; Zhao et al.
2007). In S. cerevisiae, the analgous slt2Δ mutant is unable to form pseudohyphae and
to penetrate agar (Navarro-Garcia et al. 1998). The activation of Slt2p is triggered by
various oxidants, certain osmotic stresses, antifungal drugs (targeted at cell wall and
membrane synthesis), calcium ions, cold shock and alcohols (Martinez-Anaya et al.
2003; Navarro-Garcia et al. 2005). Mkc1p is phosphorylated in the presence of these
stress conditions; mostly by Pkc1p, but under certain conditions Hog1p is required for
Mkc1p phosphorylation, illustrating the interconnection between different MAPK
pathways in C. albicans (Navarro-Garcia et al. 2005).
By analogy with S. cerevisiae, the Hog1p MAP kinase pathway is presumed to play a
vital role in the biosynthesis of cell wall of C. albicans (Kruppa and Calderone 2006).
The Hog1p protein is thought to be important in regulating the phosphorylation of the
cell wall integrity MAP kinase Mkc1p (Arana et al. 2005). Finally, in reference to the
work in this thesis, Slt2p (Mpk1p), the cell integrity MAP kinase has been implicated in
34
the response of S. cerevisiae to fusel alcohols and Slt2p is activated upon exposure to
fusel alcohols (Martinez-Anaya et al. 2003).
1.4.1 Fusel Alcohols
Intriguingly, fusel alcohols impact on morphological transitions, the cell wall integrity
pathway and protein synthesis simultaneously in S. cerevisiae. A number of studies
have shown that the nutritional conditions that induce global regulation of protein
synthesis are also cues for various forms of filamentous growth in yeasts. For instance,
glucose depletion causes a rapid inhibition of translation initiation and also leads to
haploid invasive growth (Ashe et al. 2000; Cullen and Sprague 2000). In addition, the
effects of various alcohols and nitrogen limitation on translation initiation are
accompanied by a switch to pseudohyphal growth in the yeast, S. cerevisiae (Lorenz et
al. 2000; Ashe et al. 2001; Gancedo 2001).
A number of signal transduction networks in S. cerevisiae have been elucidated which
play a role in the switch from yeast form to pseudohyphal growth form (Gancedo 2001).
As described above, similar signal transduction pathways have also been identified in C.
albicans and other fungi. The question that remains to be addressed is whether control
of gene expression at the level of protein synthesis plays a role in the morphological
switch (Gancedo 2001).
Connections between protein synthesis and pseudohyphal growth have been suggested.
It was observed in S. cerevisiae that a minimal cycloheximide treatment results in a
lower proportion of pseudohyphal cells. The authors reasoned that the inhibition of
protein synthesis might be contributing to the block in the conversion of vegetative cells
to the pseudohyphal form (Kron et al. 1994). Ibrahimo et al. (2006), investigated
whether the regulation of translation initiation could play a role in the S. cerevisiae

35
pseudohyphal response. They showed that the disruption of the genes for either of the
yeast eIF4E binding proteins (Eap1p or Caf20p) or other key translational regulators
(GCN2 or GCN4) inhibits the capacity of yeast to undergo filamentous growth in
response to nitrogen limitation. Mutations in the 4E binding domains in both genes
prevent complementation of this phenotype, highlighting the importance of translational
control (Ibrahimo et al. 2006). To further highlight the connection between protein
synthesis and morphological transition in fungi, (Tripathi et al. 2002) reported that
Gcn4p plays a central role in coordinating morphogenetic and metabolic responses to
amino acid starvation in C. albicans.
1.5: Protein Synthesis
Proteins comprise one of the essential molecules vital for life processes. They account
for a large fraction of biological macromolecules, catalyse most of the reactions on
which life depends and serve numerous structural, transportational, regulatory and other
roles in all organisms. A high proportion of a cell’s energy budget and components are
devoted to protein synthesis. For instance, in rapidly growing bacterium protein
synthesis consumes 30-50% of the energy generated (Mathews et al. 2007). In addition,
a rapidly growing yeast cell contains nearly 200,000 ribosomes occupying as much as
30-40% of its cytoplasmic volume (Mathews et al. 2007).
The transfer of genetic information from DNA to protein occurs via mRNA. In
prokaryotes, co-transcriptional translation occurs, whereas in eukaryotes the two
processes of transcription (production of mRNA) and translation (production of
proteins) are separated as a consequence of eukaryotic cell having a defined nucleus.
The process of protein synthesis in both prokaryotes and eukaryotes occurs in three
steps: initiation, elongation and termination.

36
The requirements for high levels of energy, ribosomes, RNAs and other factors
necessitates that a process such as protein synthesis be closely monitored and regulated
by the cell in order to conserve energy and resources. Control occurs mostly at the
initiation stage of protein synthesis. This allows rapid, reversible and spatial control of
gene expression. In addition, response at this early stage means that cells respond
rapidly to environmental changes in order to prevent further wastage of energy and the
accumulation of intermediates as by-products.
1.6: Translation pathway overview
Translation is an extremely complex process by which the information content of
mRNA is converted to proteins. The process starts with translation initiation, where the
goal is to assemble a full ribosome on the mRNA with an initiator methionyl tRNA
(Met-tRNAi) in the peptidyl transferase (P) site of the ribosome. Ribosomes are highly
conserved between prokaryotes and eukaryotes and have three tRNA binding sites: the
acceptor (A) site, the peptidyl transferase (P) site and the exit (E) site. The process by
which ribosomes are recruited to mRNAs, however, varies between prokaryotes and
eukaryotes. Polycistronic mRNAs are commonly found in prokaryotes. Prokaryotic
mRNA contains a sequence called the Shine-Dalgarno sequence, which is
complementary to the 5ʹ end of the 16S rRNA subunit and located upstream of the AUG
start codon (Shine and Dalgarno 1975). In contrast, eukaryotic mRNA is modified by a
5′ cap and 3′ poly (A) tail. These modifications not only protect the mRNA from
degradation but also facilitate its recognition by the translation initiation machinery.
In eukaryotes, at least 11 translation initiation factors are involved in assembling a
translationally competent ribosome on the mRNA: while only three factors are involved
in prokaryotic translation initiation. After initiation in both prokaryotes and eukaryotes,
the appropriate aminoacylated tRNA enters the A site, a peptide bond is formed

37
between the amino acids and the ribosome translocates one codon along the mRNA. In
this manner, the mRNA is sequentially decoded into a chain of amino acids and
ultimately a protein. This entire process termed translation elongation is GTP-dependent
and, in eukaryotes, requires only three elongation factors (eEF1A, eEF1B, and eEF2)
(Taylor et al. 2007). Translation is terminated when a stop codon is translocated into the
ribosomal A site. The bond which links the last peptidyl-tRNA to the ribosomal P-site is
hydrolysed to release the protein and this is facilitated by the release factor eRF1 (Kapp
and Lorsch 2004). The process of eukaryotic translation is discussed in greater detail
below, this discussion however, will focus mainly on the initiation stage of translation
in eukaryotes as this is the stage where most regulation occurs and it is the stage
targeted by alcohols in S. cerevisiae.
1.6.1: Translation Initiation -the mechanism of translation initiation in Eukaryotes
Translation initiation is the process that leads to the assembly of an elongation
competent 80S ribosome on an mRNA in which the initiation codon is base paired with
the anticodon loop of aminoacylated initiator methionyl-transfer RNA (Met-tRNAiMet
)
in the ribosomal P site (Pestova et al. 2007; Jackson et al. 2010). The process requires
separated small (40S) and large (60S) ribosomal subunits, initiation factors and the
nucleotide triphosphates (ATP and GTP) (Pestova et al. 2007).

38
Fig.1.3. Overview of Translation Initiation: eIF2B catalyzes guanine nucleotide
exchange to produce eIF2-GTP. eIF2-GTP binds to Met-tRNAi
Met to form a Ternary
complex (TC). A multifactor complex made up of TC, eIFs 1, 1A, 3 and 5 binds to the
40S ribosomal subunit to form a 43S pre-initiation complex (PIC). The eIF4F (eIF4E,
eIF4G and eIF4A) complex forms a closed loop complex with the mRNA via the
interaction of 4G with 4E and Pab1p. PIC is recruited to mRNA by the eIF4F complex
and possibly Pab1p to form 48S initiation complex. The 48S complex selects the
appropriate AUG (initiation codon), followed by the joining of 60S ribosomal subunit to
form 80S initiation complex
The eukaryotic translation initiation mechanism most widely accepted is that based on
the scanning model (Kozak 1991), however, in some eukaryotes and under some
circumstances, another method of initiation has been proposed which is independent of
80S
S

39
the 5′ m7G-cap structure. This method of translation initiation on a few mRNAs
involves direct binding of the 40S ribosomal subunit to the mRNA at the internal
ribosome entry site (IRESs) located at or near to an AUG codon (reviewed in Hellen
and Sarnow (2001).
Prior to translation, the mRNA transcript must be synthesized in the nucleus and
processed by capping, splicing and polyadenylation, after which it is exported to the
cytoplasm. In addition the post-termination ribosomal complexes, which comprise an
80S ribosome still bound to mRNA, deacylated tRNA and eukaryotic release factor 1
(eRF1) (Jackson et al. 2010) must dissociate. Ribosomes are dissociated and are thought
to be released from the mRNA as free 60S and factor-associated 40S subunits to
provide a pool of separated ribosomal subunits needed for translation. This dissociation
is aided by the eukaryotic factors eIF3, eIF1 and eIF1A (Kolupaeva et al. 2005).
1.6.1.1 Formation of the 43S pre-initiation complex
Initiation of protein synthesis begins with the assembly of eIF2, GTP, Met-tRNAiMet
into a ternary complex. eIF2 in the GTP bound form interacts specifically with the
initiator methionyl tRNA. The resulting ternary complex is responsible for delivering
the Met-tRNAiMet
to the 40S subunit to form the 43S pre-initiation complex. Formation
of this complex is also promoted by eIF1, eIF1A and eIF3 (Hershey and Merrick 2000).
Some of these factors bind the 40S subunit before the ternary complex, likely as a result
of their prior role in subunit dissociation (Pestova et al. 2007). The initiation factors
e1F1, eIF3, eIF5 and eIF2- Met-tRNAiMet
can also form a multifactor complex (MFC)
which exists both free of and bound to the ribosome (Asano et al. 2000). Interactions
between the MFC components co-operatively increase their affinity for the 40S subunit.
The resulting 43S pre-initiation complex is competent for binding to the 5′ end of most
mRNAs.

40
1.6.1.2 mRNA preparation and selection
Recruitment of the 43S preinitiation complex to mRNA is mediated by members of the
eIF4F group of initiation factors, which is a heterotrimer containing eIF4A (an
ATPase/RNA helicase of the DEAD box family), eIF4G (a large modular protein which
functions as a scaffold that binds the other factors) and eIF4E (the cap binding protein)
(Pestova et al. 2007). mRNA selection for translation is prompted by eIF4E and Poly
(A) binding protein (PABP; Pab1p in yeast), which bind to the mRNA 5ʹ cap structure
and 3ʹ poly(A) tail respectively. These proteins both interact with separate domains of
eIF4G. eIF4G can therefore interact simultaneously with eIF4E and the Poly (A)
binding protein bridging across the 5′ cap and 3′ poly (A) tail structures to form a
closed-loop mRNP complex (Wells et al. 1998). This ‘circularisation’ of the mRNA
likely explains the synergistic effect of the mRNA cap and poly (A) tail structures on
translation initiation (Tarun and Sachs 1995; Wells et al. 1998). eIF4G also recruits the
eIF4A RNA helicase which has been proposed to function in the removal of secondary
structure from the 5′ end of the mRNA (Oberer et al. 2005).
1.6.1.3 43S preinitiation complex recruitment to the mRNA and mRNA scanning
One of the least well understood aspects of the translation initiation process is the
mechanism by which the primed closed loop mRNA complex interacts with the 43S
pre-initiation complex. In higher eukaryotes an interaction between eIF3 on the 43S
complex and eIF4G on the mRNA is thought to be critical (Lamphear et al. 1995;
Korneva et al. 2000). There is no report of similar interaction in S. cerevisiae. However,
it has been reported that yeast eIF5 can interact with the carboxy-terminal half of
eIF4G, and could act as a link between eIF3 and the mRNA (Asano and Hinnebusch
2001).
41
After the binding of the pre-initiation complex at the 5′ end of the mRNA, the complex
scans the mRNA in a 5′ to 3′ direction until a ‘start’ codon is encountered (Kozak
2005). In eukaryotes, the start codon is usually the first AUG triplet that the ribosome
encounters and is identified by virtue of complementarity to the Met-tRNAi anticodon
(reviewed in Kapp and Lorsch 2004).
1.6.1.4 AUG recognition and 60S subunit joining
Binding of the 40S ribosomal subunit to the start codon results in a pause in scanning
and triggers GTP hydrolysis on eIF2 by eIF5, a GTPase activating protein (GAP). This
process is regulated by the initiation factors eIF1, eIF1A and eIF3 which prevent
premature hydrolysis to limit initiation within poor sequence context or at non-AUG
start codons (Majumdar and Maitra 2005). Specific mutants in eIF1 are deficient in
discriminating correct start codons exhibiting increased initiation at UUG codons (Yoon
and Donahue 1992). eIF1 dissociation from the pre-initiation complex mediates release
of Pi following GTP hydrolysis on eIF2 upon AUG recognition, a process facilitated by
eIF1A (Cheung et al. 2007). eIF2.GDP, eIF5, eIF1 and eIF3 are thought to be released
from the complex following GTP hydrolysis, whereas eIF1A remains associated to
recruit eIF5B.GTP. GTP hydrolysis on eIF5B promotes eIF1A dissociation from the
ribosomal A site to drive 60S subunit joining leading to the formation of the 80S
initiation complex. This process leaves the initiator methionyl tRNA in the ribosomal P
site with its anticodon base-paired to the mRNA start codon (Lee et al. 2002). The
ribosomal A site is now accessible to an incoming aminoacylated tRNA (aa-tRNA)
during the elongation phase of translation (Hershey and Merrick 2000).

42
1.6.1.5 The eIF2 guanine nucleotide exchange cycle, eIF2B and the ternary
complex
After hydrolysis of GTP to generate eIF2.GDP, the release of GDP from eIF2 is very
slow, so to function in multiple rounds of initiation, eIF2 requires a guanine nucleotide
exchange factor (GEF), eIF2B. The exchange factor increases the rate of exchange of
GDP with GTP by at least ten-fold (Williams et al. 2001). Interestingly the guanine
nucleotide exchange step can occur at a defined cytoplasmic focus within the cell,
where eIF2B is a resident feature and eIF2 cycles rapidly through the focus (Campbell
et al. 2005). One possibility is that the eIF2/eIF2B focus could serve to concentrate
eIF2B, which is sub-stoichiometric to eIF2, to enable sufficient guanine exchange in
rapidly growing yeast cells (von der Haar and McCarthy 2002; Campbell et al. 2005).
After replacement of GDP with GTP on eIF2, the factor switches into a form with high
affinity for Met-tRNAiMet
(Kapp and Lorsch 2004). The affinity of the initiator
methionyl tRNA for eIF2.GTP is 15-fold tighter than for eIF2.GDP as measured using
S. cerevisiae components. This is important for release of the tRNA by eIF2.GDP
during start codon recognition (Kapp and Lorsch 2004). However a new regulatory
function of eIF5 in the recycling of eIF2 from its inactive eIF2.GDP form has recently
been described (Jennings and Pavitt 2010). eIF5 acts as a GDP dissociation inhibitor
(GDI) by stabilizing the binding of GDP to eIF2 and restricts the recycling of eIF2 to
ternary complex.
1.6.2 Translation initiation via other mechanisms -cellular internal ribosome entry
sites
During viral infection, apoptosis, heatshock or hypoxia, cap-dependent translation is
often compromised (Johannes et al. 1999; Qin and Sarnow 2004; Bushell et al. 2006).
Under such conditions, a subset of mRNAs are able to initiate translation in a 5′ cap

43
independent manner, through secondary structure elements within their 5′ UTR called
internal ribosomal entry sites (IRES). IRES elements are able to recruit the ribosome
directly to, or in close proximity to the start codon and coordinate translation initiation
with a limited number of translation initiation factors and IRES trans-acting factors
(ITAFs). mRNAs where translation is instigated by an IRES are generally not translated
efficiently under normal conditions, and may require a down regulation of cap-
dependent translation for their expression (Merrick 2004; Qin and Sarnow 2004). In
addition, many viral RNAs contain IRESs, which mediate their translation after viral
infection. The host cell translation is shut-off as the viral RNA often encodes proteases
that cleave initiation factors and the presence of the viral dsRNA triggers eIF2α
phosphorylation by the eIF2 kinase, PKR (See Section 1.8.1.1). Different viral IRESs
vary greatly in their translation initiation factor requirements. For instance, the EMCV
(encephalomyocarditis virus) IRES minimally requires eIF4A and the central domain of
eIF4GI, eIF2, eIF3 and eIF4B, whereas HCV (hepatitis C virus) IRES requires only
eIF2 (Pestova et al. 1996; Pestova et al. 1998) . In an extreme case the cricket paralysis
virus IRES requires no canonical translation initiation actors, not even the initiator
methionyl tRNA (Jan and Sarnow 2002). The differential factor requirements mean that
IRES-containing mRNAs are often resistant to conditions that reduce global translation
initiation. The fact that many of the proteins encoded by these mRNAs facilitate
recovery from stress provides a rationale for this alternative mechanism for translation
initiation.
1.6.3 Translation Elongation
Translation elongation is mediated by ribosomes and multiple soluble factors, most of
which are conserved across bacteria and eukaryotes. During elongation, the ribosome
catalyses the addition of new amino acids via the amino acylated-tRNA (aa-tRNAs) to a

44
growing polypeptide chain, according to the sequence of codons in the mRNA assisted
by eukaryotic elongation factors (eEFs) (Taylor et al. 2007). At the onset of translation
elongation, a Met-tRNAi is already present in the P site of the ribosome and the
eukaryotic elongation factor 1A (eEF1A; EF-Tu in bacteria) binds and recruits aa-
tRNAs to the A-site of the ribosome. The aa-tRNA, eEF1A and GTP exist as a ternary
complex. As a result of stringent codon-anticodon base pairing, only the cognate aa-
tRNA is accepted at the A site (Ogle et al. 2001). Codon-anticodon base pairing
produces a conformational change in eEF1A that leads to GTP hydrolysis of the ternary
complex. Upon GTP hydrolysis, the eEF1A.GDP complex is released from the
ribosome, leaving the aa-tRNA in the A site. Spontaneous GDP dissociation from
eEF1A is slow, so the eEF1Bαβγ complex, guanine nucleotide exchange factor,
stimulates the exchange of GDP for GTP maintaining the level of active eEF1A.GTP
(Slobin and Moller 1978). Peptide bond formation then occurs to leave the nascent
peptide fleetingly associated with the A site tRNA (Rodnina and Wintermeyer 2001).
Rapid translocation of the ribosome relative to the mRNAs and tRNAs leaves the A site
free to accept the next aa-tRNA (Taylor et al. 2007). This translocation step is
facilitated by eEF2 (EF-G in bacteria) which promotes ribosome movement along the
mRNA (Taylor et al. 2007). Fungal translation elongation is striking in its absolute
requirement for a third factor, the ATPase eEF3. eEF3 binds close to the E-site of the
ribosome and has been proposed to facilitate the removal of deacylated tRNA from the
E-site (Sasikumar and Kinzy 2014). The whole elongation cycle is repeated until a stop
codon is reached.

45
Figure 1.4 Structure of the ribosome showing the large and the small subunits. The
ribosomal tRNA binding sites are the aminoacyl (A), the peptidyl (P) and the exit (E).
Each of the ribosomal subunits contributes to these EPA sites. Adapted from Russel P.
J. (2010)
1.6.4 Translation Termination
Translation termination occurs when a stop codon is translocated into the ribosomal A
site. There are three stop codons in eukaryotes, UAA, UAG, and UGA (Kapp and
Lorsch 2004). The eukaryotic release factor 1 (eRF1) encoded by the SUP45 gene in S.
cerevisiae recognises the stop codons. One model is that eRF1 is a functional mimic of
the tRNAs and through its binding to the A site of the ribosome triggers the hydrolysis
of the peptidyl-tRNA, resulting in the release of the peptide chain. A second eukaryotic
release factor eRF3, encoded by the SUP35 gene in S. cerevisiae accelerates this
process in a GTP-dependent manner (Baierlein and Krebber 2010; Khoshnevis et al.
2010). Additional factors have also been described to play roles in this process. For
instance, the DEAD box RNA helicase Dbp5p has recently been shown to assist eRF1
in stop codon recognition and controls the subsequent eRF1-eRF3 interaction through
its dissociation from eRF1 (Gross et al. 2007).
46
1.6.5 Ribosome recycling
At the end of the termination stage the ribosome exists as an 80S complex on the
mRNA with a deacylated tRNA. For the ribosomal subunits to be used in another round
of translation, they must be dissociated and be recycled. eIF3, one of the factors
proposed to be involved in recycling, has anti-association activity in that it binds to the
40S subunit lowering the rate of association with 60S (Valasek et al. 2003). Under
stress conditions where translation initiation is inhibited, the idle ribosomal subunits
reassociate to form a large pool of non-translating 80S ribosomes. During recovery from
these stress conditions, these inactive ribosomes need to be mobilised for translation
restart. Dom34p-Hbs1p complex, together with the Rli1p NTPase have been implicated
in the dissociation of such inactive ribosomes (van den Elzen et al. 2014).
1.7 Detailed steps in the Translation Initiation pathway
Two specific aspects of the translation initiation pathway are of particular importance in
terms of both the work in this thesis and the regulation of translation initiation. These
are the ternary complex cycle and the selection of mRNA for translation. Therefore
these will be covered in greater detail in the following sections.
1.7.1 The ternary complex cycle
As described above, the ternary complex consists of eIF2.GTP bound to Met-tRNAiMet
.
This complex delivers the initiator methionyl tRNA and provides chemical energy in
the form of GTP for the structural rearrangements that occur following AUG
recognition. eIF2.GDP is recycled back to eIF2.GTP via the guanine nucleotide
exchange factor eIF2B.

47
1.7.1.1 Initiator tRNA
In all kingdoms of life, two different methionyl tRNAs are used in protein synthesis:
elongator methionyl tRNA (Met-tRNAeMet
) and initiator methionyl tRNA (Met-
tRNAiMet
). The Met-tRNAiMet
initiates protein synthesis, whereas Met-tRNAeMet
inserts
methionine at internal sites in the growing polypeptide during elongation ((Pestova et
al. 2007). Initiator methionyl tRNA reads the start codon, allowing the initiating
ribosome to begin translation in the correct location.
Initiator methionyl tRNA has a unique sequence and structural features that enable it to
be specifically recognized by eIF2 and excluded from binding to elongation machinery
(see 1.6.1.5). These features are important for productive binding in the P site (Pestova
et al. 2007). The base pair at position 1:72 in the acceptor stem is an important
contributor to initiator/elongator discrimination. In Met-tRNAiMet
, the A1:U72 base pair
at the top of the acceptor stem is crucial for binding to eIF2.GTP (Farruggio et al.
1996), while elongator tRNAs generally bear a G:C base pair in the 1:72 position. Two
initiator-specific G:C base pairs in the anticodon stem are also important for the binding
of the eIF2.GTP.MettRNAiMet
to the 40S subunit (Astrom et al. 1993).
1.7.1.2 eIF2
eIF2 is a highly conserved heterotrimeric complex consisting of α, β, and γ subunits
encoded by the yeast genes SUI2, SUI3 and GCD11 respectively (Hershey and Merrick
2000). Table 1.2 shows the nomenclature used for eIF2, eIF2B subunits, protein kinase
(Gcn2p) and transcription factor (Gcn4p) in both S. cerevisiae and C. albicans. The α
subunit of eIF2 contains a highly conserved region in which Ser51 can be
phosphorylated. A number of stress and metabolite-activated kinases phosphorylate
eIF2α, resulting in a stable, unproductive interaction with eIF2B (see section 1.8.1.1).
The β subunit of eIF2 is involved in binding to both eIF2B and eIF5. The catalytic

48
domain in the ε subunit of eIF2B and the C-terminus of eIF5 contain a conserved region
which binds to the same sequence in their common substrate, eIF2β (Asano et al. 1999;
Gomez and Pavitt 2000). The γ subunit has binding sites for GTP and Met-tRNAiMet
(Gaspar et al. 1994). Mutations of amino acids in eIF2γ proposed to be vital for tRNA
binding result in reduced affinity for Met-tRNAiMet
(Kapp and Lorsch 2004).
1.7.2 eIF2B
eIF2B is a heteropentameric complex consisting of α, β, γ, δ, and ε, encoded by GCN3,
GCD7, GCD1, GCD2 and GCD6 respectively. In S. cerevisiae all the eIF2B subunits,
apart from the α subunit, are essential for growth and mutations in these subunits can
lead to a temperature sensitive phenotype and derepression of GCN4 translation (Gcd-
phenotype) indicative of reduced ternary complex levels (Krishnamoorthy et al. 2001).
The eIF2B subunits are able to form two stable sub-complexes, a regulatory complex
consisting of the α, β and δ subunits and a catalytic complex consisting of the ε and γ
subunits (Pavitt et al. 1998). The regulatory subcomplex is able to bind eIF2, showing a
higher affinity for the phosphorylated form of this protein; however it lacks guanine
nucleotide exchange function. The catalytic subcomplex is sufficient for guanine
nucleotide exchange only and in fact shows a faster rate of exchange than the wild type.
This essential reaction is catalysed by the carboxy-terminal segment of eIF2Bε, which
interacts directly with the G domain of eIF2γ and with lysine-rich regions of eIF2β
(Gomez and Pavitt 2000; Gomez et al. 2002). Therefore, it has been proposed that the
regulatory subcomplex is required to mediate binding of eIF2 to eIF2B and to prevent
exchange on phosphorylated eIF2 (Pavitt et al. 1998).
The activity of translation initiation factors in C. albicans is less well understood.
However similar to S. cerevisiae only one C. albicans ORF (GCN2; orf19.6913)
encodes a protein with significant sequence similarity to S. cerevisiae Gcn2p (37%

49
identity). The C. albicans Gcn2p protein sequence contains pseudo kinase, eIF2α
kinase, and histidyl-tRNA synthetase-like domains. It also displays significant sequence
similarity to GCN2 eIF2α kinases from mammals, flies, and plants (Tournu et al. 2005).

50
Table 1.2 Protein subunits and gene names for eIF2, eIF2B, the protein kinase
Gcn2p and the transcription factor Gcn4p
Name of
protein
Mass in kDa Gene in
S. cerevisiae
Gene in
C. albicans
eIF2α/Sui2p 34.7 33.9 SUI2/YJR007W SUI2/C1_06960W_A
eIF2β/Sui3p 31.6 31.1 SUI3/YPL237W SUI3/C7_04130C_A
eIF2γ/Gcd11p 57.9 58.6 GCD11/YER025W GCD11/C5_02170_A
eIF2Bα/Gcn3p 34.0 35.1 GCN3/YKR026C GCN3/C7_01220W_A
eIF2Bβ/Gcd7p 42.6 41.0 GCD7/YLR291C GCD7/C2_03990W_A
eIF2Bγ/Gcd1p 65.7 54.3 GCD1/YOR260W GCD1/CR_03990C_A
eIF2Bδ/Gcd2p 70.8 55.9 GCD2/YGR083C GCD2/C3_07250W_A
eIF2Bε/Gcd6p 81.1 81.9 GCD6/YDR211W GCD6/C1_08600C_A
Gcn2p 190.1 200.9 GCN2/YDR283C GCN2/C7_01330_A
Gcn4p 31.3 35.4 GCN4/YEL009C GCN4/C2_09940W_A
SUI= Supressor of initiation
GCN=General control nonderepressible
GCD=General control derepressed
S. cerevisiae C. albicans

51
1.7.3 mRNA selection pathway
As described above the selection of mRNA relies upon interactions of the mRNA cap
and poly(A) tail with the translation machinery. eIF4E interacts with the cap and Pab1p
with the poly(A) tail. eIF4G serves as a scaffold between the two and also interacts
with the ATP-dependent RNA helicase eIF4A. In addition, eIF4E binding proteins (4E-
BPs) can competitively inhibit the interaction between eIF4G and eIF4E to regulate
translation initiation (see section 1.8.2). Table 1.3 shows the protein subunits and gene
names of the eIF4F complex, as well as the interacting proteins Pab1 and the ribosomal
protein Rps3 in S. cerevisiae and C. albicans.
1.7.3.1 eIF4E
The S. cerevisiae eIF4E is encoded by a single essential gene CDC33 (Altmann et al.
1987). The structural features of eIF4E shed light on the biological properties of this
factor. The amino terminal part of eIF4E is dispensable for cap recognition, for binding
to eIF4G and 4E-BP, for stimulation of cap-dependent translation, and for in vivo
functionality of the protein (Hernandez et al. 2005). On the other hand, the sequence
and three dimensional structure of eIF4E carboxy-terminal part contains all the residues
important for functionality and is highly conserved. Due to its central role in cap-
dependent translation, regulation of eIF4E activity is critical to normal cell growth
(Lachance et al. 2002; Richter and Sonenberg 2005). eIF4E binds directly to the cap
structure at the 5′ end of the mRNA. The binding site contains two tryptophan residues
which are stacked either side of the m7GTP nucleotide on the cap (Matsuo et al. 1997).

52
1.7.3.2 PABP
The single-copy essential gene PAB1 encodes yeast PABP (Sachs 2000). In yeast cell-
free extracts, a Pab1p-poly(A) complex interacts with eIF4G which in turn interacts
with eIF4E bound to the mRNA cap (Tarun and Sachs 1996). Mutations within the
yeast PAB1 gene resulted in an inhibition of translation and cell growth (Sachs and
Davis 1989). The poly(A) binding protein family carry four non-equivalent RNA-
recognition motifs (RRMs) and a C-terminal domain. In yeast Pab1p, RRMs 3 and 4
and the C-terminus do not contribute to the translational activities of the protein
(Kessler and Sachs 1998). Further dissection of eIF4G-Pab1p interaction revealed that
the first and second RRMs of Pab1p are needed for eIF4G binding and that substitution
of as few as two amino acids within RRM2 of Pab1p can prevent this binding (Kessler
and Sachs 1998; Otero et al. 1999). The consequence of the simultaneous association of
eIF4E and Pab1p with eIF4G is that the mRNA could become circularised. As a result
Pab1p would promote translation initiation by stabilisation of eIF4G on the mRNAs and
hence increased recruitment of the 43S complex to the mRNA. The so- called ‘closed
loop’ hypothesis is supported by the direct demonstration of circular polyribosomes in
electron micrographs of serial sections through rough ER membranes (Tarun and Sachs
1996; Sachs 2000). It has also been suggested that Pab1p may mediate translational
activation by inducing 60S subunit joining. The observation that 60S subunit protein
mutants suppress pab1∆ phenotypes provides some support for such a role (Sachs and
Davis 1989; Searfoss et al. 2001).
1.7.3.3 eIF4A
eIF4A is the archetypal member of the ATP-dependent RNA helicase family (Schmid
and Linder 1991; Schmid and Linder 1992). Conserved sequences within eIF4A couple
ATP binding and hydrolysis to RNA helicase activity in order to disrupt RNA-RNA

53
interactions; thereby ‘melting’ secondary RNA structures within a transcript (Tanner et
al. 2003; Marsden et al. 2006). The effect of mRNA secondary structure on translation
initiation is varied but can have an inhibitory role by disrupting initiation factor function
or ribosome transit on the RNA (Tanner et al. 2003; Marsden et al. 2006). An A66V
substitution in yeast eIF4A, which prevents ATP-hydrolysis, abolishes its ability to
rescue depleted translation extracts (Blum et al. 1992). The helicase activity of eIF4A is
enhanced through its interactions with eIF4G. In S. cerevisiae however, eIF4A is not as
stably associated with eIF4E and eIF4G. eIF4A interacts with the middle domain of
eIF4G through interactions in both N-terminal and C-terminal domains. This interaction
seems to stabilise the conformation of eIF4A and enhance the accessibility of its RNA
and ATP-binding surfaces (Oberer et al. 2005). A number of conditions have been
described that affect the association of eIF4A with the eIF4F complex or the helicase
activity of eIF4A. For instance, glucose starvation in yeast has been shown to lead to the
loss of eIF4A from the eIF4G-containing complex which is thought to inhibit global
translation initiation (Castelli et al. 2011). (Cruz-Migoni et al. 2011) recently showed
that the toxin produced by the bacterium, Burkholderia pseudomallei causes a
translational block by inhibiting the helicase activity of eIF4A and this manifests in the
human disease melioidosis. Furthermore during mitosis, intense phosphorylation of
Ser1232 in eIF4G by the cyclin dependent kinase 1:cyclin B complex strongly enhances
the interaction of eIF4A with the HEAT domain 2 of eIF4G and decreases the
association of eIF4G/eIF4A with RNA. This results in the inhibition of eIF4A helicase
activity leading to suppression of global translation (Dobrikov et al. 2013).
1.7.3.4 eIF4G
eIF4G is a large modular protein which in mammalian systems acts as scaffolding
protein with binding sites for eIF4E, eIF4A, eIF3 and PABP. In S. cerevisiae, there are

54
two isoforms of eIF4G; eIF4G1 and eIF4G2, which are 50% identical and encoded by
the genes TIF4631 and TIF4632. Deletion of both genes is lethal, but the presence of
either gene alone is sufficient to support growth (Goyer et al. 1993).Yeast cells deleted
for TIF4631, but not TIF4632 shows slow-growth (slg-) phenotype and translation
initiation defect (Clarkson et al. 2010) consistent with the fact that eIF4G1 is expressed
at higher levels than is eIF4G2 (Tarun and Sachs 1996; Clarkson et al. 2010). However
at high cell density, eIF4G2 mRNA is expressed at higher levels compared to eIF4G1
which may imply a preferential role in nutrient limited cells (Gasch et al. 2000). Yeast
eIF4G has binding sites for eIF4E, eIF4A and Pab1p, but not eIF3. In fact the eIF3e
subunit in mammalian cells that appears to be involved in binding to eIF4G is not
conserved in yeast (LeFebvre et al. 2006). Therefore, direct interactions between eIF4G
and eIF3 have not been shown, rather it has been suggested that eIF5 and eIF1 act as
bridges between eIF4G and the 43S complex to promote 48S complex formation (He et
al. 2003). The interaction between eIF4G and eIF4A is important in recruiting 43S
complex to the cap. Mammalian eIF4G contains two eIF4A binding domains, one in the
central domain and one in the C- terminal domain. The central domain binding site is
conserved in yeast, but the C-terminal binding domain is absent (Imataka and
Sonenberg 1997). The interaction between eIF4G and eIF4A is dependent on conserved
residues within the yeast eIF4G binding site and the central domain binding site
(Dominguez et al. 2001). It is becoming increasingly clear that eIF4A and possibly the
interaction with eIF4G may be a site of regulation for protein synthesis (as described
above).
C. albicans has only a single eIF4G gene encoded by TIF4631, and overexpression of
this gene causes hyperfilamentation (Lee et al. 2005). Interestingly, Candida eIF4G is
induced by conditions promoting hyphal growth and by macrophages (Lorenz et al.
2004).

55
The gene for Candida eIF4E has also been described (Lorenz et al. 2004; Lee et al.
2005; Feketova et al. 2010). This gene, CaCDC33, contains one CUG codon at position
116 of the amino acid residues (Feketova et al. 2010), but overall the sequence
similarity between CaCDC33 and ScCDC33 is 54% identical at the amino acid level.
Indeed a S. cerevisiae cdc33 null mutant is complemented by CaCDC33 in terms of
lethality (Feketova et al. 2010). Interestingly, eIF4E can naturally exist as Ca4E116ser
and Ca4E116Leu
(CUG codon at position 116 is encoded as serine or leucine) in C.
albicans. The mutation of the CUG codon into the universally serine-coding UCU
triplet alleviates the temperature sensitivity of the Ca4E translation initiation factor in
the S. cerevisiae. (Feketova et al. 2010).
Table 1.3 The protein subunits and gene names of the eIF4F complex, as well as
the interacting proteins Pab1 and the ribosomal protein Rps3
Name of protein Mass in kDa Gene in
S.cerevisiae
Gene in
C. albicans
eIF4G/Tif4631p 107 118.3 TIF4631/YGR162W TIF4631/C2_08760C_A
eIF4E/Cdc33p 24.2 31.1 CDC33/YOL139C EIF4E/CR_10490W_A
eIF4A/Tif1p 44.6 44.6 TIF1/YKR059W TIF1/C1_01350C_A
Pab1p 64.3 70.4 PAB1/YER165W PAB1/C1_03370W_A
Rsp3p 26.5 27.3 RPS3/YNL178W RPS3/CR_04810W_A
S. cerevisiae C. albicans

56
1.8: Regulation of protein translation initiation
The regulation of protein synthesis allows a rapid and dynamic cellular response to
stresses such as amino acid starvation, glucose starvation, viral infection, hypoxia, heat
shock and exposure to heavy metals. The vast majority of such stress conditions
regulate protein synthesis by targeting the translation initiation step (Simpson and Ashe
2012). This global inhibition has an immediate effect on protein levels and allows the
cell to re-channel resources toward stress survival (Yamasaki and Anderson 2008;
Simpson and Ashe 2012). Mechanisms by which translation initiation can be regulated
fall into two main categories: the control of eIF2 or of eIF4F, often by reversible protein
phosphorylation (Jackson et al. 2010) (Fig. 1.5).
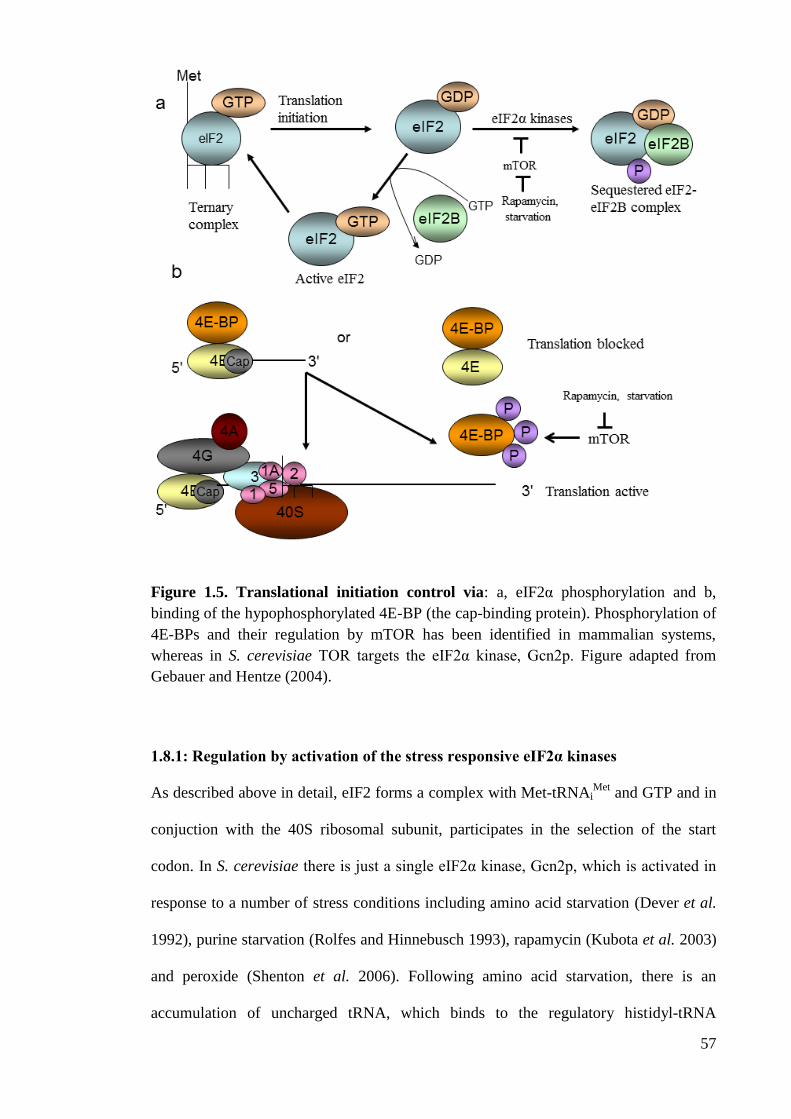
57
Figure 1.5. Translational initiation control via: a, eIF2α phosphorylation and b,
binding of the hypophosphorylated 4E-BP (the cap-binding protein). Phosphorylation of
4E-BPs and their regulation by mTOR has been identified in mammalian systems,
whereas in S. cerevisiae TOR targets the eIF2α kinase, Gcn2p. Figure adapted from
Gebauer and Hentze (2004).
1.8.1: Regulation by activation of the stress responsive eIF2α kinases
As described above in detail, eIF2 forms a complex with Met-tRNAiMet
and GTP and in
conjuction with the 40S ribosomal subunit, participates in the selection of the start
codon. In S. cerevisiae there is just a single eIF2α kinase, Gcn2p, which is activated in
response to a number of stress conditions including amino acid starvation (Dever et al.
1992), purine starvation (Rolfes and Hinnebusch 1993), rapamycin (Kubota et al. 2003)
and peroxide (Shenton et al. 2006). Following amino acid starvation, there is an
accumulation of uncharged tRNA, which binds to the regulatory histidyl-tRNA
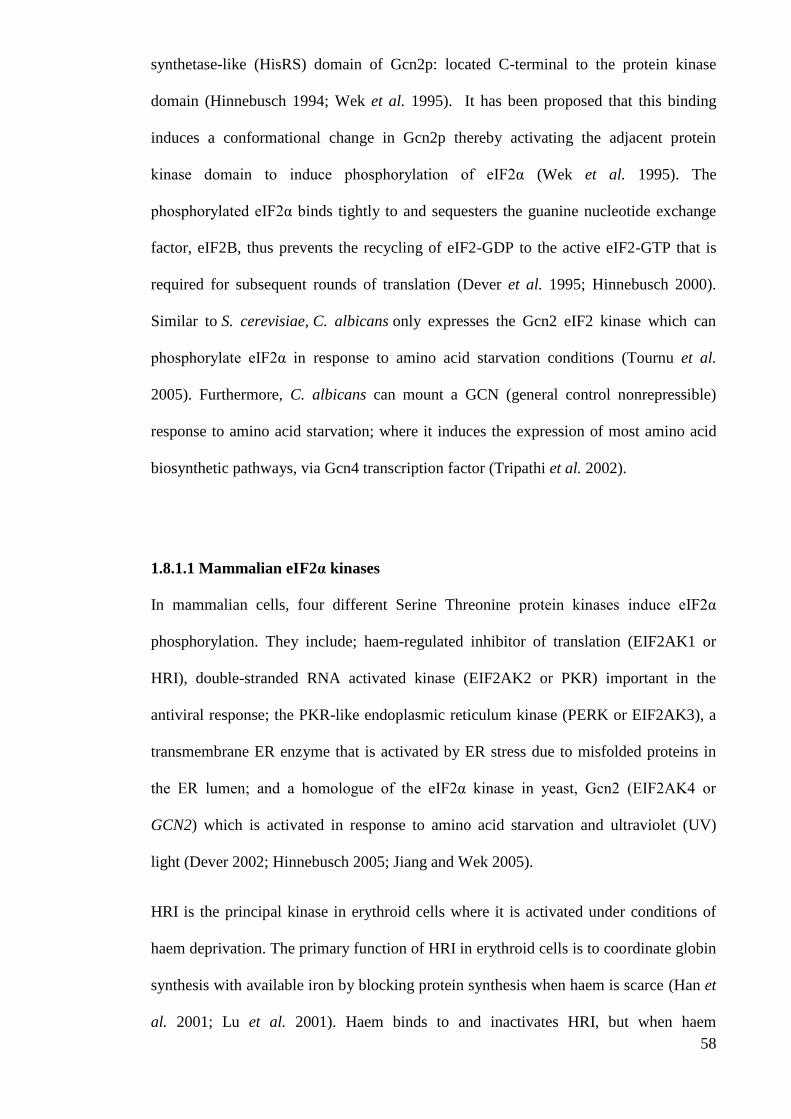
58
synthetase-like (HisRS) domain of Gcn2p: located C-terminal to the protein kinase
domain (Hinnebusch 1994; Wek et al. 1995). It has been proposed that this binding
induces a conformational change in Gcn2p thereby activating the adjacent protein
kinase domain to induce phosphorylation of eIF2α (Wek et al. 1995). The
phosphorylated eIF2α binds tightly to and sequesters the guanine nucleotide exchange
factor, eIF2B, thus prevents the recycling of eIF2-GDP to the active eIF2-GTP that is
required for subsequent rounds of translation (Dever et al. 1995; Hinnebusch 2000).
Similar to S. cerevisiae, C. albicans only expresses the Gcn2 eIF2 kinase which can
phosphorylate eIF2α in response to amino acid starvation conditions (Tournu et al.
2005). Furthermore, C. albicans can mount a GCN (general control nonrepressible)
response to amino acid starvation; where it induces the expression of most amino acid
biosynthetic pathways, via Gcn4 transcription factor (Tripathi et al. 2002).
1.8.1.1 Mammalian eIF2α kinases
In mammalian cells, four different Serine Threonine protein kinases induce eIF2α
phosphorylation. They include; haem-regulated inhibitor of translation (EIF2AK1 or
HRI), double-stranded RNA activated kinase (EIF2AK2 or PKR) important in the
antiviral response; the PKR-like endoplasmic reticulum kinase (PERK or EIF2AK3), a
transmembrane ER enzyme that is activated by ER stress due to misfolded proteins in
the ER lumen; and a homologue of the eIF2α kinase in yeast, Gcn2 (EIF2AK4 or
GCN2) which is activated in response to amino acid starvation and ultraviolet (UV)
light (Dever 2002; Hinnebusch 2005; Jiang and Wek 2005).
HRI is the principal kinase in erythroid cells where it is activated under conditions of
haem deprivation. The primary function of HRI in erythroid cells is to coordinate globin
synthesis with available iron by blocking protein synthesis when haem is scarce (Han et
al. 2001; Lu et al. 2001). Haem binds to and inactivates HRI, but when haem

59
availability is limited, it is released, activating HRI. HRI has also been shown to
respond to other stress conditions when present in other cell types (Lu et al. 2001).
Expression of PKR is induced by interferon, and the kinase is activated by binding
double stranded RNAs, as part of the cellular antiviral response. Two dsRNA-binding
motifs (dsRBMs) precede the protein kinase domain and it has been suggested that these
promote dimerization and kinase activation in the presence of dsRNA (Lee et al. 1993;
Garcia et al. 2007). Increased activation of HRI and PKR in cells can dramatically
inhibit almost all protein synthesis in the affected cells (Pavitt 2005).
PERK, a transmembrane ER (endoplasmic reticulum) spanning enzyme is activated by
ER stress due to misfolded proteins in the ER lumen. In response to the accumulation of
unfolded proteins in the ER, PERK activation should limit translation of proteins
destined for the ER, and other signals generated as part of the unfolded protein response
lead to activation of ER chaperone genes.
1.8.1.2 eIF2α dephosphorylation
Phosphorylated eIF2α is also targeted by protein phosphatases and it is possible that
regulation exists at this level too. In mammalian cells, the phosphatase PP1c (Latreille
and Larose 2006) and GADD34, dephosphorylate eIF2α in a negative feedback loop
(Novoa et al. 2003) as part of the integrated stress response. Indeed GADD34 is a
transcriptional target of ATF4 (see section 1.8.3). In an analogous manner, in yeast the
essential phosphatase Glc7p has been shown to antagonise Gcn2p activity and repress
GCN4 when over-expressed (Wek et al. 1992). It has also been suggested that type II
phosphatases may also be capable of dephosphorylating eIF2α (Taylor et al. 2010).

60
1.8.1.3 Other mechanisms for eIF2B regulation
In mammalian cells, direct phosphorylation of eIF2B has also been identified as an
important regulatory mechanism. For example in the absence of insulin, the kinase
GSK3 phosphorylates eIF2B, inhibiting its activity. Insulin stimulates eIF2B activity by
relieving this inhibition through inactivation of GSK3. GSK3 phosphorylation sites
have been identified within the catalytic domain of eIF2Bε at Ser535 and Ser539
(Welsh et al. 1998; Wang et al. 2001). In addition, in both yeast and higher cells,
volatile anaesthetics appear to inhibit protein synthesis via eIF2B (Palmer et al. 2006).
Furthermore, in yeast, fusel alcohols have been shown to inhibit translation initiation
via a mechanism involving eIF2B (Ashe et al. 2001).
In humans specific mutations in any of the genes encoding the five subunits of eIF2B
lead to the onset of a fatal autosomal recessive brain disease known as CACH
(childhood ataxia with central nervous system hypomyelination) also called vanishing
white matter leukodystrophy (Fogli et al. 2002; van der Knaap et al. 2002). The disease
is chronic, progressive and fatal but has a wide clinical spectrum. Often symptoms
become apparent after a head trauma or following stress conditions that may down-
regulate eIF2B function (Fogli et al. 2004). All the model systems developed to study
the disease, suggest that eIF2B activity is reduced in affected patients, with the degree
of reduction showing some correlation with the severity of the disease (reviewed in
Pavitt (2005).
1.8.2 Regulation by eIF4E-binding proteins
Cap-dependent translation can be regulated by the association of eIF4E with the eIF4E-
binding proteins (4E-BPs). There are three functionally equivalent 4E-BPs in mammals;
4E-BP1, 4E-BP2, and 4E-BP3 (Jackson et al. 2010), S. cerevisiae has two 4E-BPs and
C. albicans has a single 4E-BP. In mammalian cells, when hypo-phosphorylated, 4E-

61
BP1 binds to eIF4E (in a binary complex), which prevents eIF4E’s association with
eIF4G and therefore prevents translation initiation (Jackson et al. 2010).
Phosphorylation of 4E-BP1 on multiple sites, mainly by mammalian target of
rapamycin (mTOR), releases eIF4E for assimilation into eIF4F. Rapamycin addition
and nutrient stress inhibit the mTOR pathway leading to dephosphorylation of 4E-BP,
sequestration of eIF4E and a general down-regulation of 5′ cap-dependent protein
synthesis (Richter and Sonenberg 2005). These translational regulators are relevant to
human disease. For example, LRRK2, which is mutated in Parkinson’s disease, has
been shown to be a 4E-BP1 kinase. The altered LRRK2 activity may affect synapse
structure and function in Parkinson’s disease. Mutated forms of this protein show
increased kinase activity resulting in hyper-phosphorylation of 4E-BP1
Other 4E-BP binding proteins that are mRNA-specific have been found to play a role in
transcript-specific translational regulation. For instance, Maskin in Xenopus laevis and
Cup in Drosophila melanogaster are two such 4E-BPs that are targeted to specific
mRNAs by interaction with mRNA-binding proteins that are targeted to specific 3’UTR
sequences (Richter and Sonenberg 2005).
S. cerevisiae has two eIF4E binding proteins, Caf20p and Eap1p whose binding sites are
on the dorsal surface of eIF4E (Cosentino et al. 2000). Caf20p is a phosphoprotein of
about 20kDa, which shares a conserved region of eIF4G required for binding eIF4E.
Studies show that it competes with eIF4G for the same eIF4E binding site and inhibits
cap-dependent but not cap-independent translation (Altmann et al. 1997). Caf20p is
phosphorylated to various degrees under different conditions, suggesting a role in
translation control analogous to the mammalian 4E-BPs. Disruption of CAF20 has been
shown to stimulate a slight increase in the growth of yeast cells, but overexpression
causes a mild slow growth phenotype in yeast, consistent with a negative role in
translation (Altmann et al. 1997).

62
Eap1p also blocks Cap-dependent translation in yeast via competition with eIF4G.
Though Caf20p and Eap1p translationally regulate some mRNAs they are unlikely to
act as global translational regulators (Ibrahimo et al. 2006). Both of the yeast eIF4E-
binding proteins, are required for pseudohyphal growth as the mutants were shown to be
deficient in pseudohyphal growth in S. cerevisiae (Ibrahimo et al. 2006).
While cap-independent translation does occur, cap-dependent translation is believed to
be the major pathway for translation initiation in eukaryotes (McCarthy 1998).
Intriguinly in C. albicans, deletion of genes involved in catalayzing the formation of
mRNA cap structure including triphosphatase-encoding gene (CET1) and the mRNA
methyltransferase encoding gene (CCM1) does not cause lethality (Dunyak et al. 2002),
unlike the parallel mutations in S. cerevisae (Shibagaki et al. 1992; Tsukamoto et al.
1997). Therefore the m7GpppN mRNA cap structure is not absolutely required in C.
albicans and the mRNA cap probably contributes to efficiency but is not essential
(Dunyak et al. 2002).
C. albicans harbours just a single eIF4E binding protein, Caf20p, which represses CAP-
dependent translation and the protein is enriched during stationary phase (Kusch et al.
2008).
1.8.3 Amino acid starvation and GCN4 regulation
Probably the best characterised translational regulatory circuit in S. cerevisiae is the
general amino acid control pathway that is activated in response to amino acid
starvation, although other cellular stresses can also have an impact. In stressed yeast
cells Gcn2p phosphorylates eIF2α to reduce eIF2B activity and thereby lower the
abundance of Ternary Complex (TC) in the cell. The consequent reduction in TC
formation by eIF2α phosphorylation paradoxically stimulates translation of GCN4

63
mRNA while decreasing the rate of general translation. Gcn4p is a transcription factor
which up-regulates transcription of over 500 genes including many that encode amino
acid biosynthetic enzymes (Natarajan et al. 2001). This pathway is referred to as the
general amino acid control (GAAC) pathway (Hinnebusch 2005). The induction of
GCN4 translation is determined by four short open-reading frames (ORF) in the GCN4
mRNA leader region (Fig. 1.6 a,b) (Hinnebusch et al. 2004). According to the scanning
mechanism of translation initiation, each of the four upstream AUGs in the GCN4
mRNA leader should be selected as initiation sites prior to the start codon of the GCN4
ORF. Control of GCN4 mRNA translation is thought to occur via a reinitiation model.
The AUG start codon in uORF1 is the first to be recognised and translated. The
termination context of uORF1 is unusual and allows the ribosome to remain bound to
the mRNA after termination and to continue scanning (Grant and Hinnebusch 1994). In
non-starved cells, scanning ribosomes select the first AUG, translate the uORF1 and
resume scanning downstream.
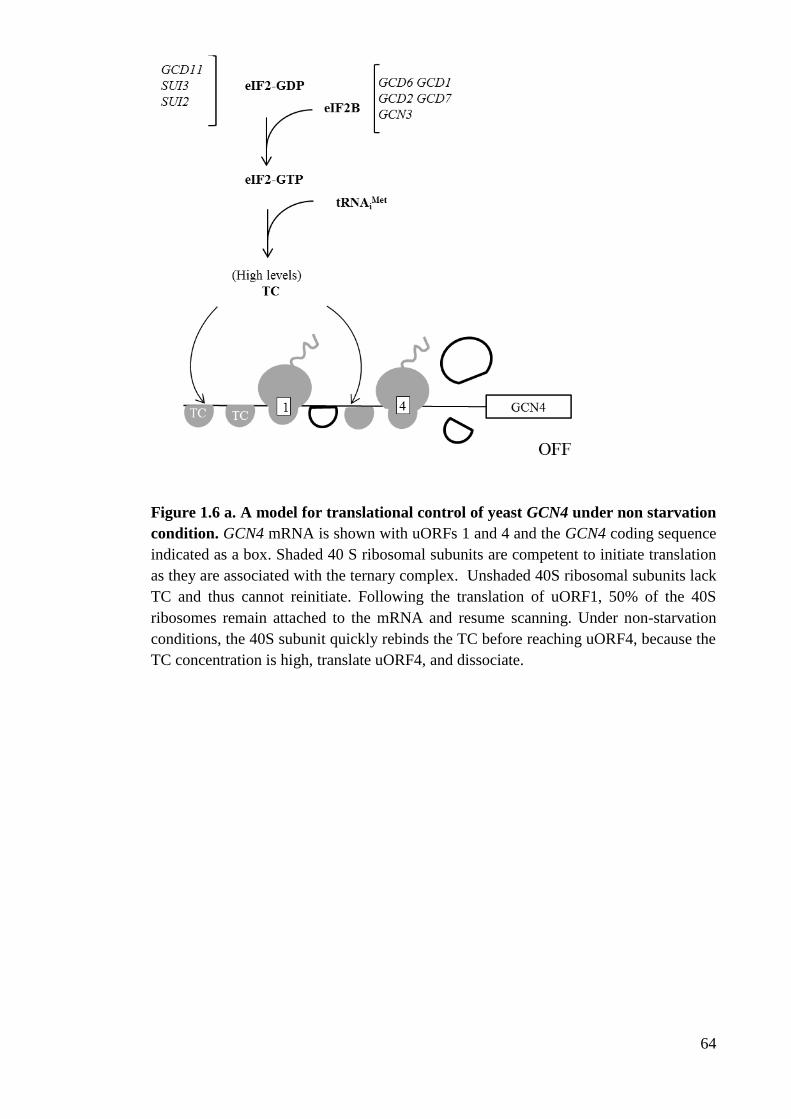
64
Figure 1.6 a. A model for translational control of yeast GCN4 under non starvation
condition. GCN4 mRNA is shown with uORFs 1 and 4 and the GCN4 coding sequence
indicated as a box. Shaded 40 S ribosomal subunits are competent to initiate translation
as they are associated with the ternary complex. Unshaded 40S ribosomal subunits lack
TC and thus cannot reinitiate. Following the translation of uORF1, 50% of the 40S
ribosomes remain attached to the mRNA and resume scanning. Under non-starvation
conditions, the 40S subunit quickly rebinds the TC before reaching uORF4, because the
TC concentration is high, translate uORF4, and dissociate.

65
Figure 1.6 b. A model for translational control of yeast GCN4 under starvation
condition. GCN4 mRNA is shown with uORFs 1 and 4 and the GCN4 coding sequence
indicated as a box. During amino acid starvation, eIF2α is phosphorylated by the protein
kinase Gcn2p, thus converting eIF2 from substrate to inhibitor of the GEF eIF2B and
reducing the eIF2-GTP level in the cell. As a result, TC levels are reduced. Following
the translation of uORF1, 50% of the 40S ribosomes remain attached to the mRNA and
resume scanning. Under starvation conditions, ~ 50% of the rescanning 40S ribosomes
fail to rebind the TC until scanning past uORF4, because the TC concentration is low
and reinitiate at GCN4. (Adapted from Hinnebusch 2005).
Since eIF2B activity is high and TC is abundant, all of the scanning 40S ribosomes
rebind TC before reaching uORF4, which permits its recognition and translation (Fig.
1.6 a). Unlike the uORF1, the termination context of the uORF4 termination codon
promotes dissociation of the ribosome, thereby preventing the ribosome from scanning
to the downstream GCN4 ORF (Grant and Hinnebusch 1994). However under

66
starvation conditions, there is a lower abundance of TC as eIF2B is sequestered by
phosphorylated eIF2 (Dever et al. 1995). While there remains a sufficient amount of TC
to permit translation of uORF1, it takes much longer to recruit TC onto the 40S
ribosomes scanning downstream from uORF1. This delay in the TC recruitment enables
about 50% of the 40S subunits to bypass uORF4, rebind TC in the interval between
uORF4 and GCN4. This permits recognition and reinitiation of translation at GCN4 (fig.
1.6b). Genetic evidence indicates that reinitiating ribosomes bypass uORFs 2 to 4 under
derepressing conditions because the distance between uORF1 and uORF4 is not large
enough to ensure that they rebind the factors required for reinitiation before reaching
uORF4 (Hinnebusch 2005).
It is important to note that conditions which induce eIF2 phosphorylation are not the
only means by which GCN4 can be translationally induced. Indeed any alteration in the
rate of ternary complex formation will cause such induction. Hence, a number of
Gcn2p-independent mechanisms for the regulation of GCN4 translation have been
discovered (Ashe et al. 2001). For example inhibition of eIF2B activity by fusel
alcohols in S. cerevisiae occurs independently of eIF2α phosphorylation, this also leads
to reduced TC levels and derepression of GCN4 translation (Ashe et al. 2001).
In the human pathogenic yeast C. albicans, the GCN4 mRNA leader contain three
uORFs. Intriguingly, recent findings show that a single inhibitory uORF (uORF3) is
sufficient for translational regulation of GCN4 in C. albicans (Sundaram and Grant
2014).
In mammals, similar mechanisms to GCN4 regulation exist; such that as well as
inhibiting general translation, the phosphorylation of eIF2α in response to a range of
stress conditions induces the translation of specific mRNAs. For example, the ATF4,
ATF5, CHOP and IBTKα mRNAs are induced by virtue of uORFs in a manner
analogous to GCN4 (Harding et al. 2000; Vattem and Wek 2004). The protein ATF4

67
forms part of an integrated stress response where it is involved in the feedback
regulation of protein synthesis via activation of the phosphatase GADD34 (see 1.8.1.2)
and it activates a cascade of transcriptional effects, for instance the transcription factor
CHOP is activated. In addition, ATF4 alters the transcription of many other genes
involved in amino acid metabolism, the response to oxidative stress and regulation of
apoptosis (Harding et al. 2000; Harding et al. 2003).
1.8.4: Translational response to membrane stress
Another pathway of translational regulation that could prove relevant to the cellular
response to alcohols is the response to membrane stress. The transport of lipids and
proteins between intracellular organelles is a highly regulated process. Perturbations to
this transport pathway result in changes to the lipid composition and mis-localisation of
membrane proteins. Exposure of S. cerevisiae to membrane stress causes the cells to
repress the transcription of genes encoding rRNA, tRNA and ribosomal proteins (Li et
al. 1999). In addition, perturbation of this pathway using the drug Chlorpromazine
causes a rapid and specific inhibition of translation. This regulation of translation
involves both eIF2α phosphorylation and the eIF4E binding protein Eap1p. GCN4
translation is upregulated in response to blocks in the membrane transport pathway;
however the mechanism by which eIF2α phosphorylation is induced is not clear. It has
been shown that eIF2α phosphorylation under membrane stress is not dependent on
Gcn2p because there is no accumulation of uncharged tRNAs in the cell. Therefore it
has been suggested that a protein phosphatase could be inhibited, giving rise to
increased levels of phosphorylated eIF2α (De Filippi et al. 2007). However, the capacity
of alcohols to trigger these effects has not been studied and it seems highly unlikely that
fusel alcohols are acting in a similar manner to Chlorpromazine as they lead to a
dephosphorylation of eIF2α (Taylor et al. 2010).

68
1.9 Localisation of translation initiation factors
1.9.1 Stress granules and processing bodies (P-bodies)
A variety of translation initiation factors and factors involved in mRNA maintenance
have been found to localise to a number of discrete cellular foci under different
conditions. Stress granules and processing bodies (P bodies) are two well described
examples of such bodies. Cellular stress induces the formation of stable mRNA and
mRNP aggregates, termed stress granules (SGs), that are induced in an eIF2α
phosphorylation dependent or independent manner (Anderson and Kedersha 2006). In
mammalian cells, eIF2α phosphorylation independent formation of SGs can be brought
about by drugs that affect either eIF4A’s or eIF4G’s activity (Low et al. 2005; Kim et
al. 2007). Stress granules harbour ribosomal proteins and early translation initiation
factors such as eIF2, eIF3, eIF4E and eIF4G (Kedersha et al. 1999). Stress granules are
dynamic and interact with other cytoplasmic proteins and also with processing bodies
(Kedersha et al. 1999). Distinct granules known as P bodies are found in both yeast and
mammalian systems. P-bodies have been defined as cytoplasmic bodies that harbour
many of the enzymes involved in the 5′ to 3′ pathway of mRNA decay and are
presumed to sort mRNA content according to cellular requirement (Sheth and Parker
2003; Kedersha et al. 2005). Stress granules are distinct from P-bodies in their
composition and function, however, several factors populate both structures in vivo
(Cougot et al. 2004).
1.9.2 eIF2B Bodies
Recent work has shown that eIF2B and eIF2 reside in a large cytoplasmic body termed
the eIF2B body (2B body) and this body represents a site where guanine nucleotide
exchange of eIF2-GDP to eIF2-GTP can occur (Campbell et al. 2005; Taylor et al.
2010). This localisation is specific for these factors and requires active translation.
69
Other initiation factors studied were found to be dispersed throughout the cytoplasm
during log-phase of growth in complete media (Taylor et al. 2010). Addition of
cycloheximide, which acts to inhibit translation initiation and elongation leads to the
eradication and dispersal of the eIF2/eIF2B foci, therefore indicating the requirement
for active translation for their formation.
Quantitative analysis of the proportion of cellular eIF2B and eIF2 found in these foci
showed that under unstressed conditions around 20% of eIF2 and 40% of eIF2B is
found within the eIF2B body. The dynamic cycling of eIF2 through the 2B body can be
assessed using FRAP (fluorescence recovery after photobleaching). FRAP analysis
showed that eIF2B remains a largely resident feature, whilst eIF2 shuttled through the
focus. This could indicate that these foci are sites of guanine nucleotide exchange.
Using FRAP, it was shown that amino acid starvation leads to a significant increase in
the half-time of recovery after photobleaching for eIF2 (Campbell et al. 2005). It can be
deduced from this that a stress known to reduce GEF activity of eIF2B, reduces the rate
of eIF2 shuttling onto foci (Campbell et al. 2005). In addition to this, the recovery of
gcn2∆ strain was unaffected when a similar experiment was carried out with the strain.
Butanol treatment also causes an increase in the half-time of recovery after
photobleaching, but the magnitude of this change is very much smaller than that
observed after amino acid starvation. Other conditions that inhibit guanine nucleotide
exchange, for example a GCN2-constitutive mutant, also reduce the rate of eIF2
shuttling (Campbell et al. 2005).
The 2B body was also shown to traverse almost all regions of the cytoplasm. Time lapse
microscopy was used to investigate the dynamics of the 2B body. It appears that the
body can cycle between two phases: a tethered non-mobile phase and a mobile diffusing
phase (Taylor et al. 2010). Treatment with fusel alcohols increases the length of time

70
that the body remains in a tethered state, thus reducing the movement of the body
around the cell (Taylor et al. 2010).
1.10 Fusel alcohols
It is well-established that Saccharomyces cerevisiae produces fusel alcohols. 1-butanol,
isoamyl alcohol and isobutanol are end products of catabolism of threonine, leucine and
valine respectively (Webb and Ingraham 1963; Dickinson 2000). Fusel alcohol
production from amino acids proceeds via the Ehrlich pathway. This pathway consists
of three enzymatic steps:
1. transamination to form an α-keto acid
2. decarboxylation to yield an aldehyde
3. reduction to a fusel alcohol
The decaboxylation step for the different fusel alcohols is carried out by different
pyruvate decarboxylases (Dickinson 2000) and a range of alcohol dehydrogenases
(ADHI, ADHII and ADHVI) with reductase activity have been implicated in the final
reduction of aldehydes to fusel alcohols (Dickinson 2000; Larroy et al. 2003).

71
α- ketoisocaproic
acidα- keto-β-methylvaleric
acid
α- ketoisovaleric
acid
leucine Isoleucine Valine
3-methylbutanal 2-methylbutanal Isobutanal
Isoamyl alcohol Active amyl alcohol Isobutanol
NH2 NH2
NH2
CO2 CO2 CO2
Pdc1pPdc5pPdc6pYd1080cp
Pdc1pPdc5pPdc6p
Yd1080cp
NAD+
NADH, H+
NAD+ NAD+
NADH, H+ NADH, H+
Figure 1.7 Ehrlich pathway for fusel alcohol production from branched chain
amino acids. Catabolism of branched-chain amino acids leads to the formation of fusel
alcohols
1.10.1 The impact of fusel alcohols on protein translation
A range of fusel alcohols including n-butanol and isoamyl alcohol have been shown to
rapidly inhibit translation initiation in yeast through an eIF2B-dependent yet eIF2α

72
phosphorylation independent mechanism (Ashe et al. 2001). The studies defined a role
for eIF2B in regulating translation in response to butanol. Two variants of the S.
cerevisiae W303-1A strains were identified which respond differently to the addition of
butanol and were termed ButS (butanol sensitive) and But
R (butanol resistance) strains.
The difference between the strains was traced to a mutation in the GCD1 gene, which
results in a P180S variation in the Gcd1p protein (the γ subunit of eIF2B) (Ashe et al.
2001). The inhibition of translation initiation exerted by the addition of butanol is
extremely rapid occurring within one minute as determined by polysome analysis and a
35S-methionine incorporation assay (Ashe et al. 2001). Intriguingly, this regulation of
translation inhibition does not occur via previously described mechanisms. This was
demonstrated by the use of mutants: a strain bearing an non-phosphorylatable form of
eIF2α (SUI2-S51A) and a strain without the eIF2α kinase (gcn2Δ), which are
translationally resistant to amino acid starvation; and TOR1-S1971I, which is resistant
to rapamycin treatment. These mutant strains were both translationally sensitive to
butanol in the ButS strain, thus indicating that the amino acid starvation and exposure to
rapamycin pathways of translational control are not the same as the butanol-dependent
pathway. Furthermore, it has been shown that fusel alcohols bring about a decrease in
the phosphorylation of eIF2α, in contrast to the effects of amino acid starvation (Taylor
et al. 2010), but similar to the effect of volatile anaesthetics (Palmer et al. 2005; Palmer
et al. 2006); however, this dephosphorylation is not essential for the inhibition of
translation by fusel alcohols (Ashe et al. 2001). Gene expression profiling has revealed
that as well as translation of GCN4 mRNA, other sets of genes are also upregulated in
response to butanol. These include genes that are required for the cell cycle, protein
synthesis, cellular transport and nitrogen metabolism. Therefore there is a correlation
between the physiological impact of butanol and the genes that are upregulated in
response to it (Smirnova et al. 2005). Furthermore, fusel alcohols were shown to

73
prevent the movement of this eIF2B body through the yeast cell cytoplasm, perhaps
because the alcohols stabilize a tethered form (Taylor et al. 2010).
All of the work performed on the impact of alcohols, particularly fusel alcohols, on
protein synthesis has centred on the budding yeast, S. cerevisiae. Therefore, the
question as to how these alcohols affect a Crabtree negative yeast like the human
pathogen, Candida albicans is unresolved.
1.10.2 Effect of alcohols on Candida albicans
There is increasing evidence that alcohols have profound effects on some clinically
relevant properties of Candida species and other pathogenic microorganisms. Fusel
alcohols are by products of amino acid catabolism in yeast and their production is
associated with nitrogen scarcity. In both S. cerevisiae and C. albicans, as well as
ethanol, fusel alcohols including isoamyl alcohol, isobutanol, active amyl alcohol and 1-
butanol are also formed (Webb and Ingraham 1963). C. albicans when grown in poor
nitrogen conditions can also utilize aromatic amino acids by the Erlich pathway and
form aromatic alcohols as a byproduct (Ghosh et al. 2008). Ethanol is one of the
products of the metabolism of glucose in C. albicans, but as a Crabtree negative yeast
species the production of biomass via respiration is the favoured metabolic route rather
than ethanol production from fermentation (Pronk et al. 1996; Piskur et al. 2006).
Hence, while C. albicans can utilize ethanol as a sole source of carbon, it is effectively
inhibited by quite low concentrations of ethanol compared to S. cerevisiae (Zeuthen et
al. 1988).

74
1.10.3 Fusel alcohols induce morphological changes in yeast
As already mentioned in section 1.4.1, a number of connections have been described
between the regulation of protein synthesis and filamentous growth in fungi. It was
found that minimal cycloheximide treatment which will normally cause a cessation of
protein synthesis also results in a lower proportion of pseudohyphal cells (Kron et al.
1994). In addition, studies have shown that nutritional conditions that elicit global
effects on protein synthesis also impact upon morphological transitions in yeast (Ashe
et al. 2000; Ashe et al. 2001; Gancedo 2001).
The formation of pseudohyphae can be induced in S. cerevisiae exposed to fusel
alcohols. Isoamyl alcohol and 1-butanol have been shown to induce pseudohyphal
formation in yeast and this may function as a foraging mechanism (Dickinson 1996). At
a concentration of 0.5% (v/v) in complex media, isoamyl alcohol was reported to induce
the formation of hypha-like extentions in haploid and diploid strains of S. cerevisiae,
however at a lower concentration of isoamyl alcohol (0.25%)(v/v) the cells formed
pseudohyphae (Dickinson 1996). The mechanism of fusel alcohol dependent
filamentous growth is quite different from that occurring during nitrogen-limited growth
because a distinct set of genes are involved. For example, butanol-induced
pseudohyphal growth is induced by the Swe1p-dependent morphogenesis checkpoint,
(Martinez-Anaya et al. 2003), and is independent of genes such as FLO8 and FLO11
that are required for pseudohyphal induction during nitrogen limitation (Lorenz et al.
2000). The morphogenesis checkpoint is a unique cell cycle checkpoint in budding
yeast that coordinates bud formation with mitosis and ensures that mitosis only occurs
after bud formation (Martinez-Anaya et al. 2003). It was also demonstrated that fusel
alcohol-induced filamentous growth is dependent on Pkc/Slt2p (Mpk1p), the cell
integrity MAP kinase and S1t2p is activated upon exposure to isoamyl alcohol
(Martinez-Anaya et al. 2003).

75
1.10.4 Alcohols induce morphological changes in Candida albicans
One of the major predictors of C. albicans virulence is the ability to switch from yeast
to pseudohyphal or hyphal morphology. The yeast to hyphal morphogenesis is induced
in response to various environmental cues (Lengeler et al. 2000). Alcohols have been
implicated in the induction of pseudohyphal morphogenesis in Candida albicans and
other pathogenic Candida species. Isoamyl alcohol was reported to induce the
formation of pseudohyphae in C. albicans when the cells are grown in YEPD
containing 0.6% (v/v) isoamyl alcohol, about 75% of the C. albicans cells formed
pseudohyphae within 24 h (Dickinson 1996). Another study suggests that tyrosol, an
aromatic alcohol secreted by Candida albicans during growth can reduce the lag phase
and accelerate germ tube formation in dilute cultures of C. albicans (Chen and Fink
2006), while other aromatic alcohols tested (trypthophol and phenylethanol) failed to
stimulate filamentation in C. albicans. However these aromatic alcohols stimulated
morphogenesis in S. cerevisiae cells by inducing the expression of FLO11 through a
Tpk2p-dependent mechanism (Chen and Fink 2006). Studies carried out using C.
albicans mutants defective in cAMP-dependent PKA pathway (efg1/efg1), MAP kinase
pathway (cph1/cph1), or both (cph1/cph1 efg1/efg1), showed that while their parent
strain (CAI-4) formed pseudohyphae in the presence of 100µM tyrosol, the mutant
strains failed to form pseudohyphae under the same conditions (Ghosh et al. 2008). This
observation suggests that the cAMP-PKA kinase and MAP kinase pathways are
involved in the induction of pseudohyphae by aromatic alcohols in C. albicans.
Furthermore, the observation that aromatic alcohols activate Gcn4p through an eIF2α
independent manner (Ghosh et al. 2008) correlates with the findings of Ashe et al.
(2001) using n-butanol in S. cerevisiae.
Ethanol has been reported to induce a number of morphological changes in fungi
including germ tube formation in C. albicans and this occurs without the addition of

76
nitrogen-containing nutrients (Pollack and Hashimoto 1985). In another study, four
strains of C. albicans were used to determine the concentration of ethanol that will
induce germ tube formation, the results show that germ tubes are formed by all four
strains at concentrations of ethanol of 0.25-1% (Zeuthen et al. 1988). At a concentration
of 4.0% ethanol or below 0.015% no germ tubes were formed. The effect of ethanol on
germ tube formation is connected to protein synthesis as it was observed that exposure
of cells to ethanol depressed normal protein synthesis, but increased the synthesis of
stress proteins (Zeuthen et al. 1988).
1.11 Farnesol a seisquiterepene alcohol
Fungi produce a whole range of volatile organic compounds comprising monoterpenes,
sesquiterpenes and diterpenes. Volatile sesquiterpenes have almost exclusively been
reported from Ascomyta and Basidiomycota. (Hibbett et al. 2007). Sesquiterpenes are
usually formed by fungi in the late growth phase. The formation of volatile
sesquiterpenes is often based on enzymes expressed in differentiated cells. Only a few
sesquiterpene alcohols have been reported from fungi, however, for several of them
some specific ecological functions are known.
Farnesol is a natural 15-carbon acyclic sesquiterpene alcohol (3,7,11-trimethyl-2,6,10-
dodecatrien-1-ol) produced from 5-carbon isoprene compounds in both plants and
animals. It has three carbon-carbon double bonds and exists in four isomers but only the
E,E isomer has QS molecule activity (Shchepin et al. 2005). Farnesol is produced by a
few fungal species: Candida albicans, (Hornby et al. 2001; Langford et al. 2009),
Candida dubliniensis, (Hornby et al., 2001), Aspergillus fumigatus (Dichtl et al. 2010)
and Ceratocystis coerulescens (Sprecher and Hanssen 1983).

77
Figure 1.8 Chemical structure of farnesol (3,7,11-trimethyl-2,6,10-dodecatrien-1-
ol)
1.11.1 Farnesol and quorum sensing in C. albicans
Candida albicans has the capacity to switch from a yeast form to a hyphal form. One of
the parameters that impacts upon the yeast-to-hyphal switch in vitro is cell density. This
phenomenon has been associated with regulation by Quorum sensing (QS) (Hornby et
al. 2001).
Quorum sensing is the regulation of gene expression and group behaviour in response to
changes in cell population density. QS molecules were first discovered in bacteria. They
can mediate the sensing of cell density and control group behaviour like virulence,
antibiotic production, conjugation and biofilm formation (Miller and Bassler 2001).
In C. albicans, two studies identified two related compounds, farnesoic acid [(2E,6E)-
3,7,11-trimethyldodeca-2,6,10-trienoic acid] and farnesol [(2E.6E)-3,7,11-
trimethyldodeca-2,6,10-trien-1-ol], as QS regulators of the yeast-to-hyphal switch
(Hornby et al. 2001; Oh et al. 2001). Farnesoic acid was only produced in C. albicans
10231, the strain background used in the study by Oh et al. (2001). Farnesoic acid was
shown to have only 3.3% of the activity (compared with farnesol) on farnesol-producing
strains of C. albicans (Shchepin et al. 2003). C. albicans produces farnesol from an
intermediate of the sterol biosynthetic pathway, farnesyl pyrophosphate (FPP).
Compounds that block sterol pathway beyond FPP, such as zaragozic acids, were shown
to cause an eightfold increase in intracellular and extracellular farnesol levels. (Hornby

78
et al. 2003) showed that FPP was converted to farnesol by incubating [1-3H] (E,E)-FPP
with a C. albicans cell homogenate in a modification of allylpyrophosphatse assay. No
farnesol was made when the cell extract was heated to 95°C for 10 min. This shows that
C. albicans possesses the enzymatic machinery to convert FPP to farnesol. (Hornby et
al. 2003). Also treatment with the antifungal, fluconazole (another sterol inhibitor),
resulted in a 13-fold increase in the amount of farnesol produced by C. albicans
(Hornby et al. 2003).
According to Hornby et al. (2001), the properties of farnesol as a QS molecule are
consistent with those expected of a fungal QS molecule. (a) It is extracellular, diffusible
and can be removed from cells by washing. (b) It is produced continually during growth
in amounts roughly proportional to cell mass. (c) It inhibits the formation of germ tubes
under germ tube inducing conditions. (d) It alters cell morphology but does not alter cell
growth at the physiological concentration (below 40µM). Thus its mode of action is
likely more specific than just general inhibition. (e) It is produced at all growth
temperatures and its production is dependent on cell growth and not on a particular
carbon or nitrogen source.
C. albicans produces farnesol as an extracellular autoregulatory compound and when
farnesol accumulates above a threshold level, it inhibits yeast-to-hyphal switch as well
as biofilm formation (Hornby et al. 2001; Ramage et al. 2002; Martins et al. 2007). In
their study, (Ramage et al. 2002) observed that budded yeast cells in a mature biofilm
could not germinate in culture media containing high concentrations of farnesol. This
observation suggested that at certain farnesol concentration, mycelia development is
inhibited and the resulting yeast cells are prone to detach from the biofilm. However
farnesol had minimal effect on mycelia formation or biofilm growth if introduced after
any of these processes has already begun. Thus farnesol inhibits hyphal initiation but

79
does not suppress hyphal elongation (Mosel et al. 2005). Farnesol can also affect the
expression of virulence genes (Cao et al. 2005).
Low concentrations of farnesol (twenty to fifty micromolar) inhibits or kills a range of
fungi, opaque C. albicans cells, several mammalian cell lines and some bacteria
(reviewed in Langford et al. 2009). The report that C. albicans can exhibit exceptional
tolerance to farnesol (Hornby et al. 2001) was challenged by Shirtliff et al. (2009) who
showed that C. albicans were killed at concentrations of farnesol as low as 40µM.
However the differences in growth conditions used in these studies were shown to be
responsible for the discrepancies observed with growth sensitivities of C. albicans to
farnesol (Langford et al. 2009). Log phase cells or cells grown in minimal media were
shown to be more sensitive to farnesol than stationary phase cells or cells grown in rich
media (Langford et al. 2009). To gain insight into the response of C. albicans to
farnesol, global gene expression analysis were performed (Cao et al. 2005; Cho et al.
2007). Although various experimental approaches were used in these studies, farnesol
commonly affected the genes that belong to functional categories such as stress
response, heat shock, drug resistance, amino acid and carbon metabolism, iron
transport, cell wall and cell cycle.
1.11.2 Mechanism of inhibition of hyphal growth by farnesol.
Sato et al. (2004) suggested that the farnesol-dependent inhibition of hyphal formation
involves the mitogen-activated protein kinase pathway, which regulates the expression
of transcription factor Cph1p and the MAPKK Hst7p. This was determined by reduction
in the transcript levels of the genes for the proteins involved in this pathway in the
presence of farnesol. However farnesol inhibited the yeast-to-hypha transition in a
cph1/cph1 mutant, suggesting that CPH1 is not a primary but rather a secondary target
of farnesol (Davis-Hanna et al. 2008). Other morphogenetic regulators may play a role

80
in the C. albicans response to farnesol. For instance Chk1p, a two-component signal
transduction histidine kinase has been implicated in the farnesol mediated inhibition of
hyphal growth (Kruppa et al. 2004). Chk1p could function via the Hog1p MAP kinase,
which was shown to be phosphorylated in the presence of farnesol (Kruppa et al. 2004).
Tup1p has also been implicated in the response to farnesol. It was shown that
expression of TUP1 was slightly increased in response to farnesol and strains lacking
TUP1 or NRG1 did not respond to farnesol but generated higher levels of farnesol than
the wild type cells (Kebaara et al. 2008). In addition, the Ras1p-cyclic AMP-protein
kinase signalling pathway has been identified in the farnesol response. Farnesol
treatment increased the mRNA levels of cAMP-repressed genes, suggesting that cAMP
levels were reduced in the presence of farnesol (Davis-Hanna et al. 2008). Furthermore,
Hall et al. (2011), showed that farnesol can directly affect the activity of the C. albicans
adenylyl cyclase, thereby reducing the cAMP output to inhibit morphogeneis. With
regard to the yeast-to-hyphae transition, it appears that the response to farnesol is
multifactorial as there is no specific signalling pathway controlled in this response and a
single receptor for farnesol has yet to be identified.
1.12: Outline of Research
A starting point for the work in this thesis was provided by the observations that fusel
alcohols induce morphological differentiation in Candida albicans, whereas farnesol
blocks this process. Morphological transition is one of the key virulence factors in the
Candida albicans, a human pathogen and a relative of non- pathogenic yeast, S
cerevisiae. The mechanism through which fusel alcohol and farnesol induce these
changes have not been characterised in C. albicans. During the course of the studies in
this thesis, both fusel alcohols and farnesol were found to inhibit global translation
initiation in Candida albicans. The research presented takes both biochemical and cell

81
biological approaches to follow the mechanism by which alcohols exert translational
control in C. albicans, by mainly focusing on the effects on translation initiation factors.
Furthermore alterations in transcription and translation of C. albicans exposed to
farnesol are studied using RNA sequencing of Total and polysome associated RNA,
respectively. In addition, the mechanisms by which alcohols mediate morphological
transition in C. albicans will be investigated. It is hoped that this will lead to a better
understanding of the link between alcohol induced translational control and
morphological transition in C. albicans. Given the connection between virulence and
morphogenesis it is possible that this work may ultimately inform potential treatment
strategies.

82
2. Materials and Methods
2.1 Culture conditions
2.1.1 Strains and growth conditions
The Candida albicans CAI4 strain (Fonzi and Irwin 1993), an isogenic derivative of the
parental wild-type clinical isolate (SC5314) (Gillum et al. 1984), was used throughout
this study unless otherwise indicated (see Table 2.2). The CAI4 strain is a URA3
auxotroph, but has been used extensively in studies of stress responses in C. albicans
without significant difference when compared to the parent strain (SC5314) except in
animal model of systemic candidiasis assays where absence of URA3 affected virulence
of the CAI4 strain (Staab and Sundstrom 2003). Candida strains were routinely cultured
at 30oC in YPD (1% (w/v) Yeast Extract, 2% (w/v) Bacto peptone and 2% (w/v)
glucose) to mid-logarithmic phase (~1.0x10⁷ cells/ml or optical density at 600 nm of
0.7). The alcohols (butanol, ethanol and farnesol) were added for 10 or 15 min to
particular concentrations in liquid or solid culture as stated in the results.
For radiolabelling experiments, C. albicans strains were grown in Synthetic Complete
Media (SCD) (Guthrie and Fink 1991) composed of 0.67% (w/v) Yeast Nitrogen Base
without amino acids (Formedium), 2% (w/v) glucose. The medium was supplemented
with synthetic complete amino acid drop out mix lacking methionine (Formedium).
Solid SCD and YPD agar plates were prepared as for liquid media, except for the
addition of 2% (w/v) Bacto Agar.
2.1.2 Monitoring the growth of yeast cultures
The growth of Candida albicans and Saccharomyces cerevisiae strains was determined
by measuring the optical density of the culture at a wavelength of 600 nm. For routine

83
OD measurements, 1ml of the culture was aliquoted into a disposable plastic cuvette
and the OD600 was measured using an Eppendorf Biophotometer plus
2.1.3 Bacterial strain and growth conditions
The DH5α Escherichia coli strain was used to amplify plasmid DNA for PCR and yeast
transformation. Cells were grown in Luria-Bertani (LB) media (10g/l Bacto-trypone and
sodium chloride, 0.5g/l Bacto yeast extract) at 37oC. Plasmid DNA was isolated using
the Qiagen Spin® Miniprep alkaline lysis kit according to manufacturers’ instructions.
Selection of plasmids was achieved by growth on LB+Carbenicillin plates. Carbenicillin
(Sigma) was added to LB at a concentration of 50µg/ml and 2% (w/v) Bacto Agar
(Melford) was included.
2.1.4 Alcohol tolerance
Strains were grown overnight to OD600 of 0.1 in YPD. 50ml cultures were set up in
250ml Erlenmeyer flasks containing butanol (0.5%, 1% and 2%); ethanol (2%, 4%, 6%
and 8%) and farnesol (40µM, 100µM, 200µM and 300µM). Control flasks had no
alcohol. The cultures were incubated on an orbital shaker (New Brunswick) for 6 h at
30oC. Growth was assessed at hourly intervals by measuring the OD600.
2.2 Morphogenesis assays
2.2.1 Colony morphology in liquid media
Overnight exponential C. albicans cultures were harvested, washed once in water and
resuspended in water to give an OD600 of 1.0. 50μl of the cell suspension was diluted
into 5ml YPD and the required concentrations of the appropriate alcohol (butanol,

84
ethanol and farnesol) were added. As controls, cells prepared in the same manner were
inoculated into 10% serum medium and into YPD without any of the alcohols. All of
the tubes were incubated at 37oC and 200 rpm on an orbital shaker (New Brunswick
Scientific). At various times during incubation (1 h, 2 h 4 h, 8 h and 24 h), cells were
mounted onto a microscopy slide and the morphology of the cells was monitored using
a Nikon Eclipse E600 a Nikon x10 and x40 objective and Axiocam MRm camera.
Images were acquired using Axiovision 4.5 software. The percentage of the cells
forming germ tubes or pseudohyphae were counted using a haemacytometer. Each
count was repeated for three different experiments and the mean of the three counts
recorded.
2.2.2. Colony morphology on solid media
To determine colony morphology on solid media, YPD agar supplemented with or
without the appropriate alcohol was used. Alcohols were added just before the agar
solidified to reduce their volatility. YPD agar with 10% serum was also prepared to
serve as a positive control. Log phase cells washed in water were diluted to give 101/ml-
104/ml of cells. 100μl of the lowest two dilutions were spread on the plates using sterile
glass beads. The plates were incubated at 37oC until colonies appeared. Colony
morphology was monitored using a Nikon Eclipse E600 with a Nikon x10 and x40
objective and Axiocam MRm camera. Images were acquired using Axiovision 4.5
software.

85
2.3 Manipulation of protein in vitro
2.3.1 Preparation of C. albicans cell extracts for Western analysis
50ml of an OD600 0.7 YPD-grown yeast culture was harvested in a Sigma 4K15
centrifuge at 5000хg for 5 min. The cell pellet was resuspended in 1ml of chilled 1 x
Buffer A (30mM Hepes.KOH pH 7.5, 100mM Potassium Acetate, 2mM Magnesium
Acetate, 1mM phenylmethylsulfonyl fluoride) and the cells harvested at 4oC in an
Eppendorf 5415D microfuge at 10,000хg for 2 min. The cell pellet was resuspended in
100μl of chilled 1 x Buffer A prior to the addition of 200μl of glass beads (425-600μm,
Sigma-Aldrich). The samples were mixed vigorously on a vortex mixer for 15 sec then
incubated in iced water for at least 40 sec. This step was repeated five times except the
final mix was extended to 25 sec. The samples were centrifuged at 10,000хg for 15 min
at 4oC. The final supernatant was collected and the protein concentration was measured
(see section 2.3.2). Protein extracts were routinely stored at -20oC in 2 x SDS loading
buffer (10% (v/v) Glycerol, 5% (v/v) mercaptoethanol, 3% (w/v) SDS, 62.5mM Tris-
Hcl pH 6.8, Bromophenol blue) and boiled at 95oC for 5 min prior to loading.
2.3.2: Determination of protein concentration
The total protein concentration of whole cell extracts was determined using the
Bradford method (Bradford 1976). This method is based on the fact that protein-dye
complexes cause a shift in the dye (Coomassie) absorption maximum from 465 to 595
nm. Absorption at 595 nm is proportional to protein concentration. A standard curve
was prepared using dilutions of bovine serum albumin (Sigma). 200µl of BioRad
Bradford reagent was added to 800µl of each sample and mixed thoroughly.
Absorbance readings were measured at OD595 and the values obtained were plotted
against the protein concentration to obtain a standard curve. To measure the protein
concentration of yeast samples, 10µl of a 1:10 dilution of yeast protein extract was

86
added to 790µl water and 200µl Bradford reagent. The OD595 of samples was measured
and protein concentration determined based on the standard curve.
2.3.3: Sodium Dodecyl Sulphate Polyacrylamide Gel Electrophoresis (SDS PAGE)
Protein electrophoresis was performed as described by Laemmli (1970), Sambrook and
Russel, (2001) using the BioRad Protean III mini gel apparatus. 10% polyacrylamide
resolving gels (364mM Tris-HCL pH 8.8, 0.1% (w/v) SDS), were routinely used. The
stacking gel composition was 125mM Tris-HCL pH6.8, 0.1% (w/v) SDS, 4% (v/v)
polyacrylamide (Sigma-Aldrich). Polymerisation was promoted by adding 11μl
TEMED (Sigma) and 30μl (10mg/ml) ammonium persulphate to a total gel volume of
5.5ml immediately prior to pouring. Gels were run at 130 V for 1 h in a reservoir of 1 x
protein running buffer (0.19M glycine, 25mM Tris base, 1% (w/v) SDS). Precision plus
protein All Blue standards (BioRad) were routinely used as size standards throughout
this study.
2.3.4 Coomassie stain
SDS PAGE resolving gels were removed from the gel running apparatus and soaked in
Simply Blue SafeStain (Invitrogen) for 1 h, then washed in water.
2.3.5: Western blotting
SDS PAGE resolving gels were removed from the gel running apparatus and immersed
in 1 x transfer buffer (20% (v/v) methanol, 25mM Tris base, 192mM glycine, 0.1%
(w/v) SDS). The blotting apparatus, consisting of four sponges, blotting paper and
Hybond-ECL nitrocellulose membrane (Pharmacia), was also soaked in 1 x transfer
buffer. These were assembled in the BioRad electroblotting apparatus such that proteins

87
would be transferred from the gel to the membrane. Electroblotting was performed at 25
V in 1 x transfer buffer for 2 h, cooled with an ice chamber. The membrane was
removed and immersed in blocking solution (1 x PBS (137mM sodium chloride, 10mM
sodium phosphate buffer pH 7.4, 2.7mM potassium chloride), 0.1% (v/v) Tween 20 and
5% (w/v) skimmed milk) for 1 h at room temperature. The membrane was subsequently
immersed in the same solution containing an antibody to the protein of interest (see
table 2.5) for at least 1 h. The membrane was then washed three times for 15 min each
in 1 x PBS Tween solution (137mM sodium chloride, 10mM sodium phosphate buffer
pH 7.4, 2.7mM potassium chloride and 0.1% (v/v) Tween 20). A source specific
horseradish peroxidise (HRP) conjugated secondary antibody, typically a 1:10,000
dilution in 1 x PBS Tween + 5% (w/v) skimmed milk was added for 1 h with rocking.
The membrane was then washed for 3 x 15 min in 1 x PBS Tween before addition of
equal volumes of ECL detection reagent (Thermo Scientific). The membrane was
overlaid with a strip of blotting paper then wrapped with the Saran wrap before
exposure to autoradiography film (Fuji, Japan).
2.3.6 [35
S] methionine incorporation assay
C. albicans strains were grown to OD600 of 0.7 in SCD medium lacking methionine
(0.67% (w/v) Yeast nitrogen base without amino acid (Formedium), 2% (w/v) glucose
and 0.2% synthetic Complete Amino acid Drop out-Met (Formedium). The culture was
split into two flasks and an appropriate quantity of a particular alcohol was added to one
of these. The two flasks were incubated for 10 min at 30oC, then methionine was added
to a final concentration of 60ng/ml, of which 0.5ng/ml was [35
S] methionine (cell-
labelling grade 1175 Ci/mmol; New England Nuclear, Boston, MA). Samples (1ml)
were taken and processed as described previously (Ashe et al. 2000). Briefly, 1ml
samples were added to 1ml of 20% trichloroacetic acid (TCA) at the various time points

88
and heated at 95°C for 20 min in a water bath. The protein precipitate was collected on
GFC filters (Whatman, GE Healthcare Buckinghamshire, UK), washed with 2ml of
10% TCA and then with 2ml of 95% ethanol, and counted in Scintisafe (Fisher,
Leicestershire, UK,) scintillation fluid using the Liquid Scintillation Analyzer
(Packard).
2.3.7 GCN4 Reporter assays
Luciferase assays to evaluate expression from the GCN4 and the GCRE reporters were
performed essentially as described by Srikantha et al. (1996). Briefly, cells were
harvested and extracted using RLUC buffer (0.5M NaCl, 0.1M K2HPO4 (pH 7.6), 1mM
Na2 EDTA, 0.6mM sodium azide, 1mM phenylmethylsulfonyl fluoride, 0.02% bovine
serum albumin). Luciferase assays were started by adding 1.25µM coelentrazine h
(Promega USA) to cell extracts, and activity was measured using GloMax 20/20
luminometer (Promega). Luciferase activity (RLU) is expressed as relative
luminescence per 10 sec/mg protein.
2.3.8 Preparation of yeast cell extracts for Tandem Affinity Purification
1litre of S. cerevisiae TAP-tagged strains at mid-log phase was harvested at 8,000хg for
4 min at 30oC in an Avanti J-20 centrifuge (Beckman Coulter). The supernatant was
removed and the yeast cell pellet was resuspended in 50ml of SC-His containing 3%
glucose. The cells were then transferred to a 50ml tube and pelleted at 5,000хg for 5
min at 4oC in a clinical centrifuge. All media was removed and yeast cells were flash
frozen in liquid nitrogen. 5ml of LOLA140 complete lysis buffer (20mM Tris-HCl (pH
8.0), 140mM NaCl, 1mM MgCl2, 0.5% NP40, 0.5mM DTT, 1mM PMSF, phospho
inhibitors (5mM NaF, 100µM Na3VO4) and protease inhibitor cocktail) was added to

89
the frozen cells, re-frozen again and stored at -80oC prior to processing. Cells were
ground to a fine powder in liquid nitrogen in a freezer mill (Spec 6870, SPEX, UK).
The powder was allowed to thaw on ice and clarified by centrifugation at 15000хg for
10 min at 4oC in a microcentrifuge (Eppendorf, Model 5414D) to give the whole cell
extract.
2.3.9 Tandem Affinity Purification of proteins
200µl of an IgG bead slurry (Dynabeads M-280 Tosylated - Invitrogen) was washed
twice in LOLA140 complete buffer. Then 10mg of whole cell extract was incubated
with the beads on a rotating wheel in the cold room for 20 min. Following this, 50µl of
supernatant (flowthrough) was removed for SDS-PAGE analysis. The conjugated beads
were washed 3 times for 15 min using 1ml of LOLA140 complete. NP40 was not
included in the buffer for the final wash step as the detergent interferes with mass
spectrometry. Bound proteins were eluted using the elution peptide (O(PEG)4-
DCAWHLGELVWCT) (Peptide Protein Research Limited). 200µl of elution buffer
(40mM Tris-HCl (pH8, 100mM NaCl, 1mM EDTA, 0.01% (v/v) Tween 20, 5%
ethanol) containing 2.1mM final concentration of the peptide was mixed with the beads
after the final wash and incubated with rotation at room temperature for 15 min. The
eluate was collected and concentrated using a YM13 ultracentrifugal filter (Millipore).
Samples were mixed with 2x SDS loading buffer and run on SDS-PAGE gel for either
Western analysis or stained with Coomassie for mass spectrometry.
2.3.10 Preparation of yeast cell extracts for FLAG-Affinity purification
4litre of mid-log phase C. albicans FLAG-Gcd1p strain was harvested at 8,000хg for 4
min at 30oC in an Avanti J-20 centrifuge (Beckman Coulter). All supernatant was

90
removed and the yeast were resuspended in 50ml of SC containing 3% glucose. The
suspension was transferred to 50ml tube and yeast were pelleted at 5,000хg for 5 min at
4oC in a clinical centrifuge. The spent media was removed and the yeast cells were
frozen in liquid nitrogen. 5ml of lysis buffer (30mM HEPES, 800mM KCl, 10% (v/v)
glycerol, 0.1% (v/v) Triton X-100, 5mM NaF, 1mM PMSF, 5mM β-mercaptoethanol,
1% (v/v) Calbiochem Set IV Protease Inhibitor Cocktail, 1µg/ml pepstatin, 1µg/ml
leupeptin, 1µg/ml aprotinin in dH2O pH 7.5) was added to the frozen cells, re-frozen
and stored at -80oC prior to processing. Cells were ground to a fine powder in liquid
nitrogen in a freezer mill (Spec 6870, SPEX, UK). The powder was allowed to thaw on
ice and 2ml of lysis buffer per gram of cell powder was added. The resulting mixture
was clarified by centrifugation at 5,000хg for 20 min at 4oC and the supernatant
collected into a new tube. The supernatant was further clarified by centrifugation at
20,000xg for 30 min at 4oC in a Biofuge stratos (Heraeus Instruments) to give the whole
cell extract.
2.3.11 FLAG Affinity purification of proteins
400µl of ANTI-FLAG M2 Magnetic beads (Sigma) was pre-washed twice with 1ml
lysis buffer. Whole cell extract (10g of total protein) was added to the beads and
incubated with rotation for 2 h at 4oC. The supernatant (flowthrough) was removed
from the beads, which were further washed twice in 25ml lysis buffer and twice in 25ml
low salt buffer (30mM HEPES, 100mM KCl, 10% (v/v) glycerol, 0.1% (v/v) Triton X-
100, 5mM NaF, 1mM PMSF, 5mM β-mercaptoethanol, 1% (v/v) Calbiochem Set IV
Protease Inhibitor Cocktail, 1µg/ml pepstatin, 1µg/ml leupeptin, 1µg/ml aprotinin in
dH2O pH 7.5). Bound proteins were eluted by incubation with 500µl elution buffer
(30mM HEPES, 100mM KCl, 10% (v/v) glycerol, 0.1% (v/v) Triton X-100, 5mM NaF,
1mM PMSF, 5mM β-mercaptoethanol, 1% (v/v) Calbiochem Set IV Protease Inhibitor

91
Cocktail, 1µg/ml pepstatin, 1µg/ml leupeptin, 1µg/ml aprotinin in dH2O pH 7.5,
0.1mg/ml 3X FLAG peptide (Sigma) for 30 min at 4oC with constant rotation and the
resulting eluate was collected.
2.4 Polysome analysis
2.4.1: Preparation of C. albicans cell extracts for polysome analysis
C. albicans cultures were grown to an OD600 of 0.7 and 50ml aliquots were either
maintained as untreated or a particular alcohol was added for 10 min. Cultures were
transferred to a pre-chilled tube containing 1ml of 50mg/ml cycloheximide
(Calbiochem). The cells were harvested by centrifugation at 4,000хg for 5 min at 4oC in
a clinical centrifuge (Sigma). Cells were washed in 25ml pre-chilled lysis buffer (20mM
HEPES pH7.4, 2mM Magnesium Acetate, 100mM Potassium Acetate, 1mg/ml
cycloheximide, 0.5mM dithiothreitol), pelleted by centrifugation at 4,000хg for 5 min
and resuspended in 800μl lysis buffer. Cells were pelleted at 10,000хg for 30 sec at 4oC
and resuspended in 200μl lysis buffer. 200μl of 425-600μm acid-washed glass beads
(Sigma-Aldrich) were added and the tubes were mixed vigorously for 6 x 20 sec
allowing cooling for at least 40 sec in iced water between each mixing step. The
resulting cell extract was centrifuged twice at 10,000хg for 5 min and 15 min at 4oC in a
microfuge and the OD260 was measured using NANODROP-8000 Spectrophotometer
(Thermo Scientific). The extract was snap frozen in liquid Nitrogen and stored at -80oC.
The same protocol was used for the preparation of S. cerevisiae polysomes extracts,
except that the concentration of cycloheximide required to prevent ribosomal run-off
was significantly lower. Hence, 500μl of 10mg/ml cycloheximide was added to the
chilled falcon tubes and the samples were left to chill on iced-water for 1 h before the
cells were harvested.

92
2.4.2: Preparation of sucrose gradients
15-50% (w/v) sucrose gradients were prepared using filter-sterilized diethyl
pyrocarbonate (DEPC)-treated sucrose solution (60% stock, made with water containing
200μl/L DEPC), and 10 x polysome buffer (100mM Tris Acetate, pH 7.4; 700mM
ammonium acetate, 40mM magnesium acetate). Individual solutions were prepared as
follows:
Table 2.1 Sucrose solutions for gradient preparation
2.25 ml amounts of the different sucrose solutions were dispensed, starting with 50%
solution, then 42%, 33%, 24% and finally 15% into SW41 polyallomer centrifuge tubes
(Beckman coulter) and flash frozen in liquid nitrogen between each layer. Gradients
were stored at -80oC and defrosted for 12 h at 4
oC prior to loading of the samples (Luthe
1983).
2.4.3: Sedimentation of polyribosomes
A volume equivalent to 2.5 OD260 units of the C. albicans or S. cerevisiae polysome
extract was layered onto the top of a 15-50% sucrose gradient. The gradients were
centrifuged in a SW41 rotor (Beckman Instruments) in an L-90K ultracentrifuge
(Beckman Instruments) for 2.5 h at 40,000хg. Gradients were collected and the
absorbance was continuously measured at 254 nm to generate polysome profiles using a
UV/Vis detector (ISCO UA-6) attached to a pump (Tris TM) and an Optical unit type II
60% sucrose solution (ml)
50% 42% 33% 24% 15%
5.0
41.6 35.0 27.3 20.0
5.0 5.0 5.0 5.0
3.4 10.0 17.3 25.0 32.0
10% Polysome buffer (ml)
DEPC (ml)
12.5

93
(Teledyne ISCO). An example polysome trace is shown in the figure below with the
various ribosomal peaks labelled.
Figure 2.1 An example of a polysome trace from actively translating cells and
following inhibition of translation. A. The 40S small ribosomal subunit, 60S large
ribosomal subunit, 80S monosome and polysomes are labelled. A trace from yeast
inhibited at the translation initiation step would show a redistribution from the
polysome peaks to the 80S/monosome peak. B. Possible changes in profile following
blocks to either initiation or elongation/termination.
Sedimentation of ribosomes in a 15-50% sucrose gradient
polyribosomes
40s60s
80s
A254
A
B

94
2.5 Transformations
2.5.1 Transformation of bacteria with plasmid DNA
0.5-1µl of purified plasmid was added to 70µl of thawed competent DH5α E. coli cells
and incubated on ice for 3 min. The bacterial cells were incubated at 42oC for 1.5-2 min,
then 600µl of LB media was added and the mix was incubated at 37oC for 30 min. The
cells were pelleted at 5000хg in a microfuge for 15 sec. Excess LB was removed to
leave 100-200µl, which was spread on LB carbenicillin agar plate.
2.5.2 Transformations into C. albicans
C. albicans cells were transformed using the lithium acetate procedure (Wilson et al.
1999). 50ml cultures were grown at 30oC in YPD to the equivalent of 5x10
6 cells/ml.
Cells were pelleted at 5000хg for 5 min in a clinical centrifuge and washed in 5ml
Lithium acetate (LATE) buffer (0.1M lithium acetate, 10mM Tris HCl (pH 7.5), 1mM
EDTA) before being resuspended in 500µl of LATE buffer. A transformation mix
consisting of 100µl cell suspension, 5µl salmon sperm DNA (10mg/ml) and 80µl PCR
product was prepared and incubated in a shaker incubator at 30oC for 30 min. Before
salmon sperm DNA was added to the transformation mix, the DNA was denatured by
boiling for 5 min then chilling on ice. Then 700µl of PLATE buffer (40% PEG4000 in
LATE buffer) was added to the culture, mixed briefly and incubated at 30oC overnight.
The samples were incubated at 42oC for 1 h before 3ml YPD media was added and the
cell suspension was incubated overnight at room temperature. The cells were pelleted
and most of the supernatant was tipped off, leaving 200µl, which was spread onto
selective solid media. Plates were incubated at 30oC for 3-5 days and transformants
were selected from these plates.

95
2.6 Manipulation of DNA in vitro
2.6.1 Extraction of genomic DNA from yeast
C. albicans was grown in appropriate media at 30oC to stationary phase. 5ml was
harvested by centrifugation at 16,000хg for 2 min in a microfuge. Pellets were
resuspended in 1ml of a pre-spheroplasting mix (1M sorbitol, 1mM EDTA and 30mM
dithiothreitol), then repelleted by centrifugation at 16,000хg for 5 min. The cells were
resuspended in 500µl of spheroplasting mix (1M sorbitol, 1mM EDTA, 15mM β-
mercapthoethanol and 0.235mg/ml lyticase), then incubated at 37oC for 20 min before
55µl of stop solution (3M NaCl, 100mM Tris pH7.5, 20mM EDTA) with 30µl of 20%
(w/v) SDS was added and mixed. An equal volume of phenol chloroform (1:1 (v/v) Tris
HCl, pH8.0 buffered) was added to the extract, mixed and the aqueous phase was
separated from the organic phase by centrifugation at 13,000хg for 2 min in a
microfuge. The aqueous layer was collected and the phenol-chloroform step was
repeated. An equal volume of chloroform was added, samples were mixed and
centrifuged at 16,000хg for 2 min in a microfuge. The aqueous layer was collected and
nucleic acids were precipitated by the addition of 2 volumes of ethanol. The samples
were centrifuged at 16,000хg for 15 min and the pellet was resuspended in 50µl of TE
buffer (10mM Tris pH7.5, 1mM EDTA pH8.0).
2.6.2 Amplification of DNA by polymerase chain reaction
Polymerase chain reaction (PCR) using an Expand High Fidelity kit (Roche) was
carried out to amplify cassettes used for genomic epitope tagging. Verification of
genomic integration was carried out using the same kit. Oligonucleotides used in this
study are listed in table 2.6.
96
In vitro amplification of DNA using the Expand High Fidelity kit were performed in
0.5ml thin walled microfuge tubes by adding 1µl of the desired DNA template (5-50ng)
with 1 x PCR buffer 2 (containing MgCl2), 2.5mM dNTPs, 0.2µM of each
oligonuctleotide primer, 3.4 U of DNA Expand polymerase and sterile distilled water to
a final volume of 50µl. Samples were then placed in a Biometra® T3 thermocycler and
subjected to the following reaction conditions:
1. Initial denaturation at 95oC for 3 min
2. Denaturation at 95oC for 15 sec
3. Annealing at the appropriate temperature for the oligonucleotide primers for 30 sec
4. Extension at 72oC for 1 min
5. Final extension at 72oC for 7 min
Stages 2-4 were repeated 30 times. Melting temperature ™ of the oligonucleotides was
estimated using the following formula; Tm=2[(A+T) +2(G+C)] where A, T, G and C
refer to the base composition of the oligonucleotide. If the Tm for two oligonucleotides
used in one reaction varied the lower value was used.
2.6.3 Agarose gel electrophoresis
DNA was separated according to its size via electrophoresis on agarose gels (1% (w/v)
agarose in 1 x TAE buffer (40mM Tris base, 20mM acetic acid, 1mM EDTA pH8.0)
containing 0.5µg/ml of Safe view nucleic acid stain (NBS Biologicals, UK). DNA
samples were mixed with 5µl of orange loading dye (25% Ficoll, 10mM EDTA and
25µg/ml orange G) and loaded onto the gel. Electrophoresis was carried out in a BioRad
electrophoresis chamber at 100V for 60 min DNA was visualized with a UV
transilluminator.

97
2.7 Microscopic analysis
2.7.1 Slide preparation
Cells were grown to an OD600 of 0.6 in YPD and harvested by centrifugation for 1 min
at 5000хg. Cell pellets were resuspended in 1x PBS containing particular concentrations
of alcohol or untreated and incubated for 15 min at 30oC. 1ml of cells was pelleted, the
supernatant was removed leaving approx. 100µl of culture. 5µl of cell suspension was
applied to a 0.01% (w/v) poly-lysine (Sigma) coated glass slides. A cover slip was
carefully lowered onto the slide and the edges sealed with a solvent based nail polish.
2.7.2 Epifluorescent microscopy
Real-time 2D deconvolved projections generated from continuous z-sweep acquisition
were generated using a Delta Vision RT microscope with an Olympus 100X/1.4 NA
differential interference contrast (DIC) oil Plan Apo objective and Roper Coolsnap HQ
(Photometrics) camera using Applied Precision Softworx 1.1 software and 2X2 binning
at room temperature. Z-sweep acquisition allowed fast visualisation of all planes whilst
minimizing fluorescent bleaching. Time course experiments were performed by
acquiring images every 5 sec over a two min time period. ImageJ was used to track and
quantitate the movement of the eIF2B body in the images acquired during the time
course. The values calculated for the mean total distance moved by the eIF2B body in
Chapter 4 were subjected to a two-sample t test to determine if the mean total distance
moved by the eIF2B body in cell treated with either 1% (v/v) butanol or 100µM
farnesol was significantly different from the movement of eIF2B body in untreated
cells. Where p˂0.05 the null hypothesis that there was no significant difference between
the means of the samples was rejected. Where p˃0.05 there was no evidence to reject
the null hypothesis.

98
2.8 Formaldehyde cross-linked polysome analysis
2.8.1 Extract preparation
Extracts for cross-linked sucrose density gradient analysis were made using the method
described by (Nielsen et al. 2004). 80ml of yeast culture grown to OD600 0.6 in YPD
was added to 15ml of crushed, frozen YPD media and 2.16ml of 40% formaldehyde.
After 1 h on ice, glycine was added to 0.1M. Cross-linked cells were harvested by
centrifugation and polysome extracts made as described in section 2.4.1, except that
cycloheximide was omitted from the buffers.
2.8.2 Gradient fractionation and protein purification
7.5 Abs260 units of cross-linked cell extract were separated on 15-50% (w/v) sucrose
gradients using the method described in section 2.4.1. 650µl gradient fractions were
collected using a Foxy Jr fraction collector (Isco) while the Abs254 was continuously
measured. Individual fractions were precipitated with 20% (w/v) tricarboxylic acid,
washed with 500µl acetone and resuspended in 50µl Laemmli buffer. Proteins were
analysed by SDS-PAGE and western blotting.
2.9 RNA sequencing of polysome fractions
2.9.1 Preparation of C. albicans extracts
C. albicans extracts for polysome analysis for RNA sequencing cultures were prepared
as was described in section 2.4.1 except that 100ml of cell culture was used. 1/4 of the
polysome extracts (approx. 100µl) was made up to 300µl with the polysome lysis buffer
and stored in the -80oC freezer to serve as the input fraction.
10 A260 units of the remaining extract (approx. 300µl) were separated on 15-50% (w/v)
sucrose gradients as described above except that the sensitivity was on the ISCO UA-6
detector was set at 1. 600µl gradient fractions were collected into tubes. Fractions 10-

99
15 harboured the polysomal material and were used to prepare RNA. The polysomal
samples were pooled after precipitating with isopropanol.
2.9.2 Extraction of RNA from the input and polysome fractions.
900µl of Trizol (Invitrogen) was added to the input fraction, whereas for the polysome
fractions, samples were split into two 300µl amounts and 900µl of Trizol was added to
each. The samples were stored in the -20oC freezer overnight, then thawed on ice,
mixed vigorously for 1 min and left at room temperature for 5 min. 0.2ml of chloroform
per 1ml of Trizol was added to the samples and mixed vigorously for 5 min then left at
room temperature for 10 min. Samples were then centrifuged at 15,000хg for 15 min at
4oC in a microfuge to separate the phases. The aqueous layer was transferred to a fresh
tube and 1µl of glycoblue was added (glycogen is co-precipitated with the RNA, but
does not inhibit first strand synthesis at concentrations ≤4mg/ml and does not inhibit
PCR). 500µl of 100% isopropanol for 1ml of Trizol reagent used was also added.
Samples were incubated at room temperature for 10 min and then centrifuged at 15,000
хg for 10 min at 4oC. The resulting pellet was washed in 1ml of 70% (w/v) ethanol in
DEPC treated water. The wash process was repeated, the samples were dried and then
resuspended in 10µl of nuclease free water. The RNA suspension was heated to 55oC
for 10 min and the RNA concentration was determined using a NanoDrop 8000
Spectrophotometer (Thermo Scientific).
2.9.3 Ribodepletion treatment to remove ribosomal RNA from the sample
2.9.3.1 Magnetic Beads preparation
Ribo-zero™ magnetic Gold kit for yeast was used for the ribodepletion. The magnetic
core kit was left at room temperature to equilibrate. For each Ribo-Zero reaction, 225µl
100
of the magnetic beads suspension was aliquoted into an RNase-free tube. The tube was
placed on magnet stand and the supernatant was removed. The bead was then washed
twice with 225µl of RNase-free water and resuspended in 65µl of bead resuspension
solution.
2.9.3.2 Treatment of the Total RNA sample with Ribo-Zero rRNA removal
solution
To each reaction set 1-5µg sample RNA, 8-10µl rRNA Removal solution and 4µl
Reaction buffer were added. The reaction was then made up to 40µl with RNase-free
water, mixed by pipetting and incubated first at 65oC for 10 min then at room
temperature for 5 min.
The volume of Ribo-Zero rRNA Removal solution used was calculated based on:
Amount of input total RNA Max volume of total RNA Volume of removal
solution
1-2.5µg 28µl 8µl
2.5-5µg 26µl 10µl
2.9.3.3 Magnetic Bead Reaction and rRNA Removal
The entire reaction was added to a tube containing the washed magnetic beads and
immediately mixed by pipetting. Following incubation at room temperature for 5 min,
the reaction was mixed vigorously for 10 sec and then incubated at 50oC for 5 min.
Samples were placed in the magnetic stand and the supernatant (rRNA-depleted sample)
was removed to a fresh RNase-free tube.

101
2.9.3.4 Purification of the rRNA-Depleted Sample
The volume of each sample was adjusted to 180µl using RNase-free water and the RNA
precipitated with 18µl of 3 M Sodium acetate, 2µl of 10mg/ml glycoblue and 600µl of
ice-cold 100% ethanol at -20oC for 1 h followed by centrifugation at 15,000хg in
microfuge for 30 min. The supernatant was carefully removed and the RNA pellet
washed with ice-cold 70% ethanol then centrifuged at 15,000хg for 5 min. This wash
step was repeated and any residual supernatant was removed. The RNA pellet was dried
at room temperature for 5 min then dissolved in RNase-free water and stored at -80oC.
2.9.4 Assay for ribodepletion from RNA samples using Agilent RNA 6000 Nano Kit
2.9.4.1 Preparing the gel-dye mix
The RNA 6000 Nano dye was allowed to equilibrate at room temperature for 30 min,
and mixed well. For each assay, 1µl of dye was added to 65µl of filtered RNA 6000
Nano gel matrix in a 0.5ml RNase-free tube. The solution was mixed well and
centrifuged at 15,000хg for 10 min.
2.9.4.2 Agilent RNA 6000 Nano Gel Electrophoresis
Electrophoresis was performed as described in the manufacturers (Agilent) manual
using the RNA 6000 Nano-chip. Briefly, 9µl of the gel-dye mix was loaded into the
appropriate wells, 5µl of RNA 6000 Nano marker was loaded in the sample wells and
the ladder well. 1µl of the prepared ladder was also loaded in the ladder well and 1µl of
the sample was loaded in each of the sample well on the chip. The chip was mixed
horizontally on the IKA vortexer (Agilent) for 1 min at 2400хg and run in the Agilent
2100 bioanalyzer for 5 min.

102
The ribodepleted RNA samples were then sent to the Genomic facilities of the
University of Manchester for RNA sequencing using the Illumina Hiseq RNA
sequencing technique. Briefly to generate the RNA-seq libraries, the RNA samples were
fragmented, then double-stranded complementary DNA (cDNA) was generated from
the fragmented RNA. Adapter sequences were added at either end of each cDNA
molecule using the TruSeq stranded mRNA LT sample Prep kits and RNA Adapter
indices (AR001-AR016, AR018-ARO23, AR025, AR027 (Illumina, USA)
The cDNA that have adapter molecules on both ends are then selectively enriched and
amplified by PCR using PCR Primer cocktails that anneal to the ends of the adapters.
Next, the cDNA library is validated to check the purity of the sample by running 1µg of
sample on an Agilent Technologies 2100 Bioanalyzer using the Agilent DNA 1000 chip
and then by quantified by qPCR. The cDNA library is sequenced using illumina HiSeq
sequencing platform.
2.9.4.3 Data analysis
Illumina HiSeq data was initially trimmed by removing low quality bases (quality
scores ‹ 20) from the 3′ end of all reads. Trimming was conducted using
TRIMMOMATIC (Bolger et al. 2014). Trimmed reads were mapped (aligned) to
Candida albicans SC5314 genome assembly and annotations
(www.candidagenome.org.Assembly version 21) using STAR mapper (Dobin et al.
2013). The mapped reads were counted for all annotated genes using bedtools (Quinlan
and Hall 2010). More specifically, two equations were obtained and these were applied
to arrive at a set of differentially expressed genes. For the change in transcript,
log2([TF/TU]) and for the change in translation (log2[PF/TF]/log
2[PU/TU]), with a cut
off value of ±1.0 for alteration in both the transcript and translation.

103
2.9.4.4 Quantitative real-time PCR
RNA samples from input and polysome fractions were prepared as in section 2.9.2.
except that the samples were spiked with Luciferse RNA to serve as a reference. RNA
(1-6µl of each sample) was reverse transcribed into cDNA using a Protoscript Moloney
murine leukemia virus (M-MuLV) RT-PCR kit and random hexamer primer (New
England Biolabs). Oligonucleotide primers (Table 2.6) were designed to specific
transcripts that are either differentially regulated transcriptionally or translationally in
the prescence of farnesol. Oligonucleotide primers were designed using the Primer3
software. Quantification was performed using the CFx Connect Real-Time system with
iTaq Universal SYBR Green Supermix (BioRad Laboratories). 10ng of cDNA was
added to 1x SYBR green RT-PCR buffer, 30nM of forward and reverse primer, and
nuclease-free water up to a volume of 10µl. Reactions were run with initial
denaturation of 95oC for 3 min, 5 sec at 95
oC, 30 sec at 60
oC and 40 cycles of 95-60
oC
and finally a melting curve. LUC was used as reference for this study. Samples were run
in triplicate and in each case signals were normalized to the untreated sample for each
primer pair. Data was analysed manually using the 2-∆∆Ct
method (Livak and Schmittgen
2001).
2.10 Mass spectrometric analysis
SDS PAGE resolving gels were removed from the gel running apparatus and soaked in
Simply Blue SafeStain (Invitrogen) for 1 h, then washed in water. Bands stained with
Coomassie were excised from SDS PAGE gels and dehydrated using acetonitrile
followed by vacuum centrifugation. Dried gel pieces were reduced with 10mM
dithiothreitol and alkylated with 55mM iodoacetamide. Gel pieces were then washed
alternately with 25mM ammonium bicarbonate followed by acetonitrile. This was
repeated, and the gel pieces dried by vacuum centrifugation. 100ng sequencing grade

104
trypsin (Sigma), diluted in 50mM ammonium bicarbonate, was added and the gel
samples were incubated overnight at 37 C. Following digestion, the supernatants were
removed to a fresh tube.
Digested samples were analysed by LC-MS/MS using an UltiMate® 3000 Rapid
Separation liquid chromatography (RSLC, Dionex Corporation, Sunnyvale, CA)
coupled to a LTQ Velos Pro (Thermo Fisher Scientific, Waltham, MA) mass
spectrometer.
Peptide mixtures were separated using a gradient from 92% solution A (0.1% formic
acid (FA) in water) and 8% solution B (0.1% FA in acetonitrile) to 33% solution B, in
44 min at 300nl min-1
, using a 250mm x 75μm i.d 1.7µM BEH (Ethylene Bridged
Hybrid) C18, analytical column (Waters). Peptides were selected for fragmentation
automatically by data dependent analysis.
2.10.3 Data Analysis
Data produced were searched using Mascot (Matrix Science UK), against the Uniprot
database with taxonomy of [S. cerevisie and C. albicans] selected. Data were validated
using Scaffold (Proteome Software, Portland, OR).

105
Table 2.2 Candida albicans strains used in this study
Table 2.3 S. cerevisiae strains
MLY61/YMK
1908
MATα/a ura3-52/ura3-52 (Lorenz et al. 2000)
YMK 2197 MATa; his3Δ 1; leu2Δ 0; met15Δ 0; ura3Δ 0;
HIS3+ Costello et al,
submitted
YMK 2198 MATa; his3Δ 1; leu2Δ 0; met15Δ 0; ura3Δ 0;
HIS3+; CDC33-TAP Costello et al,
submitted
YMK 2084 MATa; his3Δ 1; leu2Δ 0; met15Δ 0; ura3Δ 0;
TIF4631-TAP::His3 Open Biosystems
Strains Genotype Source
CAI4/YMK 1766 ura3/ura3::λimm434/ura3::λimm434 (Fonzi and Irwin
1993)
HTC52/YMK1767 ura3/ura3::λimm434/ura3::λimm434
gcn2::hisG/gcn2::hisG
(Tournu et al.
2005)
JKC19/YMK
1823
ura3/ura3::λimm434/ura3::λimm434
cph1::hisG/cph1::hisG-URA3-hisG
(Liu et al. 1994)
HLC52/YMK
1824
ura3/ura3::λimm434/ura3::λimm434
efg1::hisG/efg1::hisG-URA3-hisG
(Lo et al. 1997)
BCA2-10/YMK
1828
ura3/ura3::λimm434/ura3::λimm434
tup1::hisG/tup1::hisG-URA3-hisG
(Braun and
Johnson 1997)
YMK 1863 ura3/ura3::λimm434/ura3::λimm434 GCD1-
v5S-6xHis-NAT1
This study
YMK 1864 ura3/ura3::λimm434/ura3::λimm434 SUI3-
v5S-6XHis-NAT1
This study
YMK 2311 ura3/ura3::λimm434/ura3::λimm434-GCD1-
4XFLAG-dpl200::GCD1
This study
YMK 2312 ura3/ura3::λimm434/ura3::λimm434-GCD1-
4XFLAG-dpl200::GCD1-4xFLAG-URA3-
dpl200
This study
YMK 2313 ura3/ura3::λimm434/ura3::λimm434 GCD1-
GFP
This study
YMK 2314 ura3/ura3::λimm434/ura3::λimm434-GCRE-
LUC
(Sundaram and
Grant 2014)
YMK 2316 ura3/ura3::λimm434/ura3::λimm434-GCN4-
LUC
(Sundaram and
Grant 2014)

106
Table 2.4 Plasmids used in this study
Plasmid Main Features Source
pGFPNAT1/BMK
665
GFP (Milne et al. 2011)
pV5-NAT1/BMK
668
V5 (Milne et al. 2011)
BMK 691 4X FLAG –URA3 This study
Table 2.5 Primary antibodies used in this study
Target Secondary
Antiboby
Dilution Source
eIF2α phospho Rabbit 1:5000 Invitrogen
eIF4A Rabbit 1:10000 M. Ashe
eIF4G Rabbit 1:5000 M. Ashe
eIF4E Rabbit 1:5000 M. Ashe
eIF3 Rabbit 1:5000 M. Ashe
Protein A (PAP) HRP conjugate 1:5000 Sigma
GFP Rabbit 1:1000 Clontech
V5 Mouse 1:5000 Invitrogen
FLAG Mouse 1:1000 M. Ashe
Tef1 Rabbit 1:5000 C. Grant
Rps3p Rabbit 1:10000 M. Poole
Table 2.6 Oligonucleotides used in this study
Oligonucleotides Sequence Use
GFP-FCaGCD1 TACTGATGACGAAGATGAGAGCGAGTTTGAAGATGA
GTACACAGGAAACGAAGATGGTTTATTTGCCTATGG
TGGTGGTTCTAAAGGTGAAGAATTATT
Tagging
Forward
GFP-RCaGCD1 TCTATTTTCAGATACACTTATAATGTGTCTCTTTTCTG
TTTATTATCACAGTGGTATACTACTATATCAACGTTA
GTATCGAATCGACAGC
Tagging
Reverse
VFCaGCD1 AGCACCAACGAGGTAGCTCATA Verification
forward VRCaGCD1 GGATGAATCACTAGTTGTTACT Verification
reverse CaNAT1F ATATGTCTATGCCATGTCCAT Internal
forward GFP-UP CACCTTCACCGGAGACAG Internal
reverse V5-NAT1F(GCD1) TACTGATGACGAAGATGAGAGCGAGTTTGAAGATGA
GTACACAGGAAACGAAGATGGTTTATTTGCCTATAA
GGGCGAGCTTCGAGGTC
Tagging
Forward
V5-NAT1R(GCD1) TCTATTTTCAGATACACTTATAATGTGTCTCTTTTCTG
TTTATTATCACAGTGGTATACTACTATATCAACGTTA
GTATCGAATCGACAGC
Tagging
Reverse

107
V5-NAT1F (SUI3) TGGTTCTACGAGATCCGTGTCTTCGATCAAGACTGGG
TTCCAAGCCCAAATCGGGAAGAGAAAGAAGTTCAAG
GGCGAGCTTCGAGGTC
Tagging
Forward
V5-NAT1R (SUI3) TTCCCTACTATACATAGATGATAATACACAATGCAA
AAAAAAAAAAAATAGAAACCCAAAAGCTATACTGA
ACATCTCGACGTTAGTATCGAATCGACAGC
Tagging
Reverse
VFCaSUI3 GAAGATACATTATTGAATATGT Verification
forward VRCaSUI3 ATTCTACAGTATCAGAGCCAGG Tagging
Forward V5-S TGCAGGGCCGCAGCTTGC Verification
reverse 4XFLAG-
FCaGCD1
TGATGACGAAGATGAGAGCGAGTTTGAAGATGAGTC
ACAGGAAACGAAGATGGTTTATTTGCCTATGGTGGG
TTCTAAAGGTGAAGAATTATT
Tagging
Forward
4XFLAG-RCaGCD1 TCTATTTTCAGATACACTTATAATGTGTCTCTTTTCTG
TTTATTATCACAGTGGTATACTACTATATCAACGTTA
GTATCGAATCGCAGC
Tagging
Reverse
4XFLAG-FCa-SUI3 TGGTTCTACGAGATCCGTGTCTTCGATCAAGACTGGG
TTCCAAGCCCAAATCGGGAAGAGAAAGAAGTTCAAG
GGCGAGCTTCGAGGTC
Tagging
Forward
4XFLAG-RCa-SUI3 TTCCCTACTATACATAGATGATAATACACAATGCAA
AAAAAAAAAAAATAGAAACCCAAAAGCTATACTGA
ACATCTCGACGTTAGTATCGAATCGACAGC
Tagging
Reverse
RT-PCR LUC F ACGTCTTCCCGACGATGA
RT PCR For
LUC
RT-PCR LUC R GTCTTTCCGTGCTCCAAAAC RT PCR For
LUC
RT-PCR TUP1 F CTTGGAGTTGGCCCATAGAA RT PCR For
TUP
RTPCR-TUP1 R TGGTGCCACAATCTGTTGTT RT PCR For
TUP
RT PCR EFG1 F CCCCCATACCTTCCAATTCT RT PCR For
EFG1
RT-PCR EFG1 R CTCGTGGTCTGATTCCTGGT RT PCR For
EFG1
RT-PCR PDE1 F ACAATTGGCGCATGAATGTA
RT PCR For
PDE1
RT-PCR PDE1 R GCCACTAAGGGCAATTGAAA RT PCR For
PDE1
RT-PCR HSP21 F CCGACAAATACGTGGTTTCC RT PCR For
HSP21
RT-PCR HSP21 R GATCGGCATGAACTTTTGGT RT PCR For
HSP21
RT-PCR TIF4631 F CAGCAACTCCAGGTCAACAA
RT PCR For
TIF4631
RT-PCR TIF4631 R GAGGAGATGCGACAGGAGTC
RT PCR For
TIF4631

108
3 Alcohols inhibit translation initiation in Candida albicans yet have
opposing effects on morphological transition
3.1 Introduction
In budding yeast, amino acid starvation elicits a well-characterised mechanism of
translational control involving phosphorylation of eukaryotic initiation factor 2α (eIF2α)
via activation of eIF2α (Gcn2p) kinases (Dever et al. 1992). Phosphorylated eIF2α
interacts tightly with eIF2B and inhibits its guanine nucleotide exchange function. This
ultimately leads to the translation of GCN4 mRNA while decreasing the rate of general
translation. GCN signalling (or general amino acid control) has been best characterized
in Saccharomyces cerevisae (Hinnebusch 1988), although the GCN response has been
described for Candida albicans where it is involved in both morphogenesis and biofilm
formation (Tripathi et al. 2002).
C. albicans gcn2/gcn2 null mutants exhibit no detectable eIF2α kinase activity
indicating that GCN2 encodes the major eIF2α kinase activity in this fungus (Tournu et
al. 2005). Moreover the eIF2α kinase activity increased in wild-type cells on exposure
to 3AT (3-Amino triazole) suggesting that this Gcn2p kinase is activated in response to
amino acid starvation (Tripathi et al. 2002).
In S. cerevisiae, fusel alcohols also target eIF2B to bring about an inhibition in
translation initiation. However this regulation of translation initiation by fusel alcohols
is independent of the Gcn2p kinase (Ashe et al. 2001). In fact fusel alcohols lead to a
Sit4p-dependent dephosphorylation of eIF2α in S. cerevisiae rather than an increase in
phosphorylation (Griffiths and Ashe 2006; Taylor et al. 2010).
Fusel alcohols as well as ethanol have also been shown to induce morphological
changes in specific strains of S. cerevisiae (Dickinson 1996; Lorenz et al. 2000) and C.
albicans (Pollack and Hashimoto 1985).

109
In contrast, farnesol, is a long chain quorum sensing or signalling alcohol that has been
shown to block the switch from yeast to pseudohyphae or hyphae in Candida albicans,
(Hornby et al. 2001). Therefore, farnesol elicits an opposing effect to butanol in terms
of morphological switching in this important human pathogen. An important question is
whether butanol and farnesol affect translation initiation in Candida albicans and if so,
is this inhibition is independent of Gcn2 kinase, as was observed in S. cerevisiae.
In this chapter, the translational response of C. albicans to fusel alcohols, ethanol and
farnesol is investigated, and the inhibitory effects of farnesol on filament formation in
C. albicans in the presence of serum and butanol are analysed.
3.2 Results
3.2.1 Different alcohols inhibit growth of both CAI4 and gcn2Δ strains of Candida
albicans
Fusel alcohols and ethanol have been shown to inhibit growth of Saccharomyces
cerevisiae in a dose dependent manner (Griffiths and Ashe 2006). This growth
inhibition was shown both in the CAI4 and gcn2 null mutant. Alcohols are the product
of fermentative growth and one possibility is that crabtree positive yeast species (yeast
that preferentially ferment glucose) might present different alcohol sensitivities to
crabtree negative yeast (species that preferentially respire carbon sources). On this
account we set out to investigate the impact of alcohols on the growth of the crabtree
negative yeast species Candida albicans, both the CAI4 strain and the gcn2Δ mutant.
Three different alcohols were selected. Firstly ethanol as the major product of
fermentative growth. Secondly, 1-butanol (n-butanol) as a fusel alcohol that induces
pseudohyphal and hyphal-like growth both in S. cerevisiae and C. albicans. Finally,
farnesol was selected as a quorum sensing long chain alcohol that inhibits filamentous

110
growth in both yeasts. Cultures of the CAI4 and gcn2Δ C. albicans strains were grown
to mid-log phase (OD600 of 0.7) in rich media. The cells were diluted into pre-warmed
media and varying concentrations of each of the alcohols were then added to the
cultures. As shown in figures 3.1, 3.2 and 3.3 each of the alcohols gave a concentration
dependent inhibition of growth. More specifically, in the CAI-4 strain of Candida
albicans, growth was mildly inhibited by butanol concentrations of 0.5% butanol (v/v),
while 2% (v/v) butanol completely prevented the growth of the strain (Figure 3.1).
Higher concentrations of ethanol (6% and 8% (v/v)) were required to bring the same
level of growth inhibition (Figure 3.2). Much lower farnesol concentrations, e.g.
100µM, were required to cause growth inhibition. Interestingly, it was observed that the
same degree of growth inhibition observed in the wild type was also evident in the
gcn2Δ mutant. Finally, at very high concentrations of alcohol, the OD600 even decreased
slightly. One possible explanation for this, is that the higher alcohol concentrations
could be chaotropic to cell membranes and hence cause cell lysis (Salgueiro et al. 1988;
Bhaganna et al. 2010).
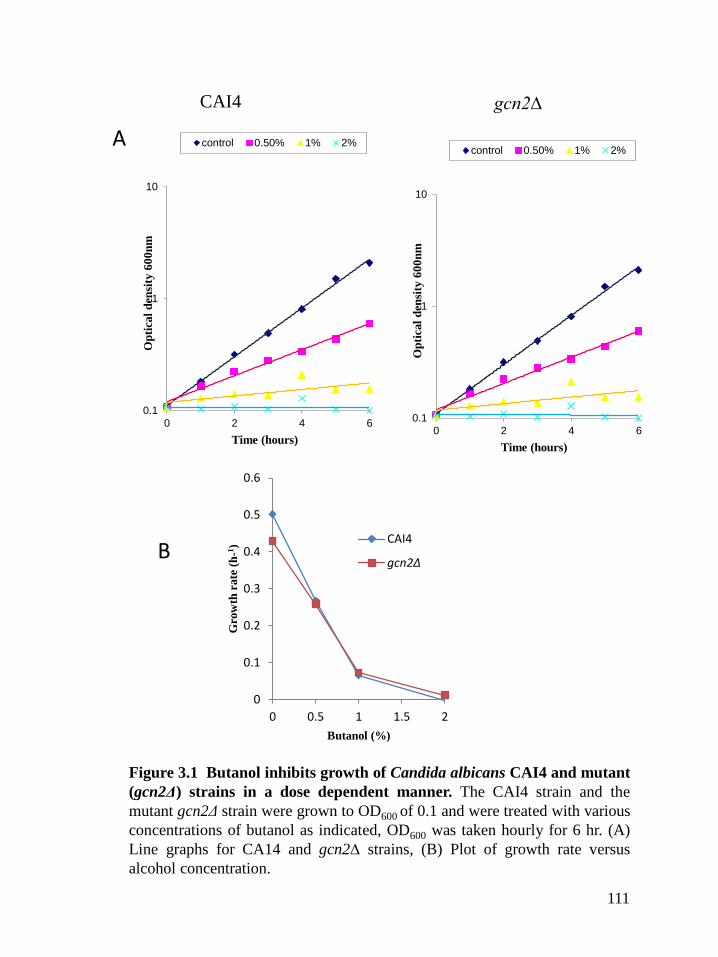
0.1
1
10
0 2 4 6
Op
tica
l d
ensi
ty 6
00
nm
Time (hours)
control 0.50% 1% 2%
0.1
1
10
0 2 4 6
Op
tica
l d
ensi
ty 6
00
nm
Time (hours)
control 0.50% 1% 2%
CAI4 gcn2∆
Figure 3.1 Butanol inhibits growth of Candida albicans CAI4 and mutant
(gcn2Δ) strains in a dose dependent manner. The CAI4 strain and the
mutant gcn2Δ strain were grown to OD600 of 0.1 and were treated with various
concentrations of butanol as indicated, OD600 was taken hourly for 6 hr. (A)
Line graphs for CA14 and gcn2∆ strains, (B) Plot of growth rate versus
alcohol concentration.
A
B
0
0.1
0.2
0.3
0.4
0.5
0.6
0 0.5 1 1.5 2
Gro
wth
rate
(h
-1)
Butanol (%)
CAI4
gcn2∆
111

0.1
1
10
0 1 2 3 4 5 6
Op
tica
l d
ensi
ty 6
00
nm
Time (hours)
control 2% 4% 6% 8%
0.1
1
10
0 1 2 3 4 5 6O
pti
cal
den
sity
60
0n
m
Time (hours)
control 2% 4% 6% 8%
CAI4 gcn2Δ
Figure 3.2 Ethanol inhibits growth of Candida albicans CAI4 and mutant
(gcn2Δ) strains in a dose dependent manner. The CAI4 strain and the
mutant gcn2Δ strain were grown to OD600 of 0.1 and were treated with various
concentrations of ethanol as indicated, OD600 was taken hourly for 6 hr. (A)
Line graphs for CA14 and gcn2∆ strains, (B) Plot of growth rate versus
alcohol concentration.
A
B
0
0.1
0.2
0.3
0.4
0.5
0 2 4 6 8
Gro
wth
ra
te (
h-1
)
Ethanol (%)
CAI4
gcn2∆
112

0.1
1
10
0 2 4 6O
pti
cal
den
sity
60
0n
m
Time (Hours)
control 10μM 40μM
100μM 200μM
0.1
1
10
0 2 4 6
Op
tica
l d
ensi
ty 6
00
nm
Time (Hours)
control 10μ 40μM
100μM 200μM
CAI4 gcn2Δ
Figure 3.3 The quorum sensing molecule, farnesol inhibits growth of
Candida albicans CAI4 and mutant (gcn2Δ) strains in a dose dependent
manner. The CAI4 strain and the mutant gcn2Δ strain were grown to OD600
of 0.1 and were treated with various concentrations of farnesol as indicated,
OD600 was taken hourly for 6 hr. (A) Line graphs for CA14 and gcn2∆ strains,
(B) Plot of growth rate versus alcohol concentration.
A
B
113
0
0.1
0.2
0.3
0.4
0.5
0.6
0 50 100 150 200
Gro
wth
rat
e (
h-1
)
Farnesol (µM)
CAI4
gcn2∆

114
3.2.2 Fusel alcohol and ethanol induce pseudohyphae formation in C. albicans,
while farnesol blocks it.
In addition to causing inhibition of growth, alcohols have also been shown to induce
morphological changes (pseudohyphae and germtube formation) in various fungal
species including various strains of Saccharomyces cerevisiae and Candida albicans.
For instance, S. cerevisiae in the ∑1278B background exhibits filamentous growth in
the presence of fusel alcohols (Dickinson 1996; Lorenz et al. 2000). Ethanol has also
been shown to induce pseudohyphal formation in Candida albicans (Zeuthen et al.
1988). It has been suggested that the fusel alcohols might signal nitrogen scarcity to the
cell (Dickinson 1996). Hence, pseudohyphae and germtube formation may allow these
non-motile organisms to forage for limiting nutrients (Gimeno et al. 1992). In addition,
for Candida species, it has been suggested that such growth patterns may provide a
means of evading the immune responses of their host (Lorenz et al. 2000).
We studied the morphology of C. albicans in the presence of the selected exogenous
alcohols in both liquid and solid media. Resting phase cells were inoculated into rich
media (YPD) at 37oC, with butanol, ethanol or farnesol added to concentrations of 0.5%
(v/v), 2% (v/v) and 40µM respectively. As a positive control, 10% serum was used to
induce hyphae, whereas cells growing in YPD alone remained in the yeast form at 37oC
(Figures 3.4 and 3.5).
Interestingly, addition of butanol, and ethanol to the growth media of both the CAI4 and
gcn2∆ mutant C. albicans strains induced morphological differentiation both in liquid
and solid growth media as presented in figures 3.4 and 3.5. Furthermore, about 50% of
the cells exposed to ethanol or butanol formed pseudohyphae in less than 4 h of
incubation in the liquid media as presented in figure 3.5B. However, for the farnesol
treated cells no germ tubes or pseudohyphae were formed.

YPD Agar
YPDA +
10% serum
YPDA +
0.5% Butanol
YPDA +
2% ethanol
A
B
Day 1
Day 2
YPDA + 10%
serum + 150 µM F
YPDA +0.5%
Ethanol + 70µM F
YPD Agar
Figure 3.4 The effect of farnesol on filament formation in C. albicans
predominates that of serum, butanol or ethanol. Serial dilutions of
overnight cultures of the CAI4 strain was spread onto YPDA medium
containing 0.5% (v/v) butanol, 2% ethanol or 10% serum agar plates for
filamentation assay (A) and 10% serum agar supplemented with 150µM
farnesol or YPDA containing 0.5% (v/v) butanol or 2% (v/v) ethanol
supplemented with 70µM farnesol for competition assay (B). Day 1 and 2
colonies were examined by microscopy and representative images are shown
as in Panel A and B.
YPDA +0.5%
butanol + 70µM F
115

YPD YPD + serum YPD + butanol
YPD + serum/F YPD + butanol/F YPD
0
20
40
60
80
100
120
serum serum/f serum/f
% c
ells
yeast pseudohyphae hyphae
Serum /150µMF
Serum
A
B
D
Figure 3.5 The effect of farnesol on filament formation in C. albicans
predominates that of serum, butanol or ethanol. Overnight cultures of the CAI4
strain was inoculated into prewarmed YP medium containing 0.5% (v/v) butanol, 2%
ethanol or 10% serum for filamentation assay (A) and 0.5% (v/v) butanol or 2% (v/v)
ethanol supplemented with 70µM farnesol or 10% serum supplemented with 100µM
or 150µM farnesol for competition assay (B, C and D). Cultures were grown in
shaker incubator at 37oC for 6 hr. Samples were taken every 2 hr and 4 hr to count the
cells using a cell counting chamber. Percentages given are an average (±SE)
calculated from 3 different counts. F means farnesol.
0
20
40
60
80
100
120
% c
ells
yeast pseudohyphae
Butanol Butanol /70µMF
Ethanol Ethanol /70µMF Serum
/100µMF
YPD + ethanol
YPD + ethanol/F
C
116

117
3.2.3 Farnesol’s mode of action is predominant over butanol or serum
A number of previous studies have shown that farnesol blocks germ tube formation in
C. albicans (Hornby et al. 2001; Nickerson et al. 2006). We set out to test if the
morphogenetic signals generated by serum or butanol can override farnesol’s action and
vice versa. Cells were grown in 10% serum at 37oC for 4 h and the percentage of cells
exhibiting yeast, pseudohyphal and hyphal forms was quantified. 10% serum alone gave
over 90% hyphal growth, while the addition of farnesol blocked the switch from yeast
to hyphae (Figures 3.4A and 3.5A). However, the amount of farnesol required to inhibit
hyphal growth was dramatically increased in the presence of serum (from 40µM to
150µM) (Figure 3.5C). In contrast, for the butanol- farnesol competition assay 70µM
farnesol was sufficient to block pseudohyphal formation in the butanol supplemented
media. This shows that farnesol’s effect was dominant to that of butanol as the cells
remained in yeast morphology when farnesol is introduced. (Figure 3.4 and 3.5).
However, the serum farnesol signalling pathways appear to be competing more
intensely. Throughout these assays the gcn2∆ strain responded similar to the wild type
in terms of the effects of serum, farnesol and the alcohols (data not shown).
3.2.4 Inhibition of protein synthesis is a common response to alcohol
Cells respond to changes in the extracellular environment by adjusting the levels of
proteins in the cell. A variety of alcohols have been shown to impact on synthesis of
proteins. For instance, following the addition of 0.5% isoamyl alcohol or 1% butanol to
yeast cells, there was 2-to-3-fold decrease in the rate of incorporation of [35
S]
methionine (Ashe et al. 2001). The inhibition of growth of the CAI4 and gcn2∆ mutant
strains of C. albicans by the alcohols in this study (Figures 3.1, 3.2 and 3.3) prompted
us to examine the rate of protein synthesis following alcohol treatment. To assess
whether protein synthesis is inhibited upon treatment with butanol, farnesol or ethanol,
118
the incorporation of exogenously added radiolabelled methionine ([35
S]-methionine)
was evaluated in the CAI4 and mutant strains of C. albicans. The data obtained shows
that both butanol (2% v/v) and ethanol (8% v/v) caused a 10-fold inhibition in
methionine incorporation to protein in both the CAI4 and gcn2Δ strains (Figures 3.6A,
B and C). Intriguingly, farnesol (300µM) also caused a 10-fold inhibition of protein
synthesis in the wild type, but had a more drastic effect on the gcn2Δ strain; inhibiting
methionine incorporation up to 30-fold (Figure 3.6B and C). Overall, these results
suggest that all of the alcohols used in this study dramatically inhibit protein synthesis
at very early stages after addition.

Figure 3.6 Inhibition of protein synthesis is a common response to
alcohol CAI4 and gcn2Δ cells were grown to exponential phase in SC-Met
media and treated with various alcohols as above for 15 min. Protein
synthesis was measured by pulse labelling with [35]S methionine for 10 min
and sample was taken every 2 min and processed. Each treatment was
analysed in triplicate. A and B are representative graphs for butanol
treatment. The CPM has been normalised to 1 by dividing by the value of
the untreated sample at 10 min. C is a summary plot that shows the ratio of
the treated to the untreated. Error bars indicate ± SEM.
0
0.2
0.4
0.6
0.8
1
1.2
0 5 10 15
Time (min)
ut
t
0
0.2
0.4
0.6
0.8
1
1.2
0 5 10 15
Time (min)
CAI4 gcn2Δ
Norm
ali
sed
co
un
ts p
er m
inu
te (
cpm
)
Norm
ali
sed
co
un
ts p
er m
inu
te (
cpm
)
A B
C
0
5
10
15
20
25
30
35
40
ut 2% (v/v )butanol 8% (v/v) ethanol 300µM farnesol
mean
fo
ld in
hib
itio
n o
f tr
an
sla
tio
n r
ate
CAI4
gcn2Δ
119

Butanol
Figure 3.7 Translation initiation is inhibited by alcohols in the CAI4
strain. Figure shows polysome analyses assessing the effect of alcohols on
translation initiation in the CAI4 strain of C. albicans. Yeast were grown in
YPD and various concentrations of alcohols were added as indicated for 15
min prior to extract preparation. Extracts were sedimented on 15-50% sucrose
gradients and the absorbance at 254nm was continuously measured. The
position of 40S, 60S and 80S peaks are labelled and the direction of
sedimentation is indicated.
untreated
80S
40S polysomes 60S
8% 2% 4% 6% untreated Ethanol
Farnesol
sedimentation
0.5% 1% 2%
40S
60S
80S
polysomes
untreated 40µM 100µM 200µM 300µM
CAI-4 strain
120

121
3.2.5 Fusel alcohols and farnesol inhibit translation initiation in a process that is
independent of the eIF2α kinase.
To further investigate the stage of protein synthesis that is targeted by the alcohols used
above and the mechanism through which these alcohols inhibit protein synthesis in C.
albicans, polysome profiling was used (See section 2.4. Materials and Methods).
Polysome profiling not only allows the level of protein synthesis to be investigated, but
can also pinpoint the step where translation is regulated (Ashe et al. 2001; Taylor et al.
2010).
Analysis of polysome distribution across a sucrose gradient for extracts from the CAI4
strain revealed that with increasing concentrations of either butanol, farnesol or ethanol,
a change in the polysome profile was observed (Figure 3.7). The 80S peak increased
dramatically and the polysome peaks were reduced. This change in profile is
characteristic of an inhibition of the translation initiation step (Hartwell and
McLaughlin 1969; Ashe et al. 2001). As indicated by the redistribution of area under
the polysome peaks to the 80S peak, the addition of butanol and farnesol effectively
inhibit translation at 2% (v/v) and 300µM respectively, whereas concentrations of
ethanol up to 8% (v/v) are required to inhibit translation initiation in this strain. The
correlation between the concentrations of alcohol required to inhibit growth and
translation (Figures 3.1, 3.2 and 3.3) is suggestive that the inhibition of protein
translation at the initiation stage could be the cause of growth inhibition of C. albicans
cells exposed to alcohols. It is also possible based on disparity in the concentration of
the different alcohols required to cause an inhibition of translation initiation that these
agents act by different mechanisms.
Given that all of the alcohols target translation at the initiation step and a predominant
mechanism of translation regulation that is conserved across all eukaryotes is the

122
activation of eIF2α kinases, the role of the only eIF2α kinase in C. albicans, Gcn2p was
investigated.
The S. cerevisiae Gcn2p homologue has been shown to mediate a number of responses
to cellular stress (Palam et al. 2011). A number of cellular stress conditions including
amino acid starvation (Dever et al. 1992), purine starvation (Rolfes and Hinnebusch
1993) and rapamycin (Kubota et al. 2003) activate the Gcn2p kinase to phosphorylate
the α subunit of the eIF2. The phosphorylated eIF2 binds tightly to and sequesters
eIF2B (the guanine nucleotide exchange factor) thereby preventing guanine nucleotide
exchange on eIF2 and ultimately inhibiting translation initiation (Dever et al. 1995;
Hinnebusch 2000). It has been shown previously that the regulation of translation by
butanol in S. cerevisiae targets eIF2B but does so in a Gcn2p-independent manner
(Ashe et al. 2001; Taylor et al. 2010). By using the gcn2Δ mutant of C. albicans, the
requirement for the Gcn2p kinase for alcohol dependent inhibition of translation can be
assessed.
A comparison of the polysome profiles from the gcn2 mutant relative to the CAI4
strain shows that there is no obvious difference in terms of inhibition of translation by
butanol, farnesol and ethanol (Figures 3.7 versus 3.8). Quantitation of the
polysome/monosme ratios confirms that there is little difference in the polysome
profiles of the CAI4 and gcn2∆strains of C. albicans (Figure 3.9). This shows that the
Gcn2 kinase plays little or no role in the inhibition of translation initiation by alcohols
in C. albicans. In fact for farnesol, the gcn2Δ mutant was even more inhibited than the
wild type (cf Figure 3.8C with Figure 3.7C, Figure 3.9). This difference also highlights
the possibility that these alcohols act on cells in very different fashions.

2% 6% untreated Ethanol
Figure 3.8 Translation initiation is inhibited by alcohols in a
gcn2Δ strain. Figure shows polysome analyses assessing the effect of
alcohols on translation initiation in a gcn2Δ strain of C. albicans.
Yeast were grown in YPD and various concentrations of alcohols were
added as indicated for 15 min prior to extract preparation. Extracts
were sedimented and gradients collected as in Figure 3.7.
Butanol
Farnesol
gcn2Δ mutant strain
untreated 40µM 100µM 200µM 300µM
untreated 0.5% 1% 2%
4% 8%
123

0
0.1
0.2
0.3
0.4
0.5
0.6
0.7
0.8
0.9
0 0.5 1 1.5 2
Po
lyso
me/
mo
no
som
e ra
tio
Butanol (v/v)
CAI4 gcn2Δ
0
0.2
0.4
0.6
0.8
1
1.2
0 2 4 6 8
Po
lyso
me/
mo
no
som
e ra
tio
Ethanol (v/v)
CAI4 gcn2Δ
0
0.2
0.4
0.6
0.8
1
1.2
0 100 200 300
poly
som
e/m
on
oso
me
rati
o
Farnesol (µM)
CAI4 gcn2∆
Figure 3.9 Polysome/monosome ratio of CAI4 and gcn2∆ (mutant)
strains shows similar pattern of inhibition of translation for the two
strains. The areas within the monosomal and the polysomal regions
were measured using ImageJ software (NIH). The values calculated
were plotted as shown in the figures.
124

ut 0.5% 1.0% 2.0% ut 0.5% 1.0% 2.0%
efg1Δ cph1Δ
efg1Δ
ut 100µM 200µM 300µM ut 100µM 200µM 300µM
cph1Δ
Butanol
Farnesol
Figure 3.10 Effect of farnesol and butanol on different
transcriptional regulator mutants. Polysome analysis was used to
assess the effect of alcohols on translation initiation in a efg1Δ and
cph1∆ strains of C. albicans. Yeast were grown in YPD and various
concentrations of the various alcohols were added as indicated for 15
min. Extracts were sedimented on 15-50% sucrose gradients and the
absorbance at 254nm was continuously measured.
125

126
3.2.5 Does the signalling pathway that regulate morphogenesis also play a role in
translation initiation in C. albicans?
One of the key virulence factors of C. albicans is its ability to undergo reversible
morphological transitions from the vegetative form to the filamentous form (Odds 1994;
Lo et al. 1997). Several signalling pathways control this morphogenesis in C. albicans
(See Section 1.3 in the introduction). These include the MAPK pathway, which is
dependent upon Cph1p; a homlogue of S. cerevisiae Ste12p (Liu et al. 1994); and the
Ras-cAMP signalling pathway, which requires functional Efg1p (Bockmühl and Ernst
2001). Both pathways are thought to activate filamentous growth in response to
starvation or serum addition. Under most experimental conditions, the transition from
yeast to hyphae is blocked in the cph1 efg1 double mutant (Lo et al. 1997), indicating
that the transduction of most environmental signals that control morphogenesis is
dependent upon Ras-cAMP and/or MAPK signalling.
In order to probe whether there is a connection between these signal transduction
pathways and the translational response of C. albicans to alcohols, we exposed the
efg1Δ and the cph1Δ strains of C. albicans to varying concentrations of butanol or
farnesol and assessed the translational response using polysome profiling. In terms of
the response to butanol, neither mutant showed any difference to the CAI4 strain in
terms of the redistribution of polysomes (cf Figure 3.7 with Figure 3.10). Therefore it
appears that neither Efg1p nor Cph1p is involved in the translational response of
Candida albicans to fusel alcohols.
Interestingly for farnesol, the efg1Δ strain showed some translational resistance to the
effects (Figure 3.10), whereas the cph1∆ strain was inhibited in the same manner as the
wild type (See Figure 3.7 for comparison). This resistance highlights a role for the Ras-
cAMP pathway in the inhibition of translation initiation following farnesol treatment.
Indeed, farnesol has been shown to target the Ras1-Cdc35-PKA-Efg1 dependent

127
pathway to inhibit transition from yeast to hypha in C. albicans (Davis-Hanna et al.
2008). It has also been shown that farnesol directly targets the adenylyl cyclase, Cyr1p,
to repress hypha formation and that exogenous cAMP restored filamentation in response
to host environmental cues (Hall et al. 2011). It yet remains to be assessed the effect of
exogenous cAMP on the translational resistance exhibited by the efg1∆ strain to
farnesol. In summary though, the differential sensitivity of the mutants highlights a
distinction between the responses of C. albicans to the different alcohols used in this
study.
3.2.6 Dephosphorylation of eIF2α by fusel alcohols and farnesol in C. albicans
Fusel alcohols have been shown to bring about an inhibition of translation initiation in
S. cerevisiae and C. albicans in a Gcn2p-independent manner (Ashe et al. 2001),
(Figure 3.8). Paradoxically, it was reported by Taylor et al. (2010), that fusel alcohols
lead to a dephosphorylation of eIF2α in S. cerevisiae rather than an increase in
phosphorylation. Initially, an attempt was made to detect phosphorylated eIF2α in C.
albicans by probing the whole cell extracts with phosphospecific antibodies to
phosphoserine 51 on eIF2α, but no signal was detected on western blots (e.g. Figure
3.11A, upper panel). Upon longer exposure, however, a basal signal that could be
phosphorylated eIF2α is just detectable (Figure 3.11A, middle panel). In response to
butanol treatment the level of this signal did not increase, in fact it was reduced. This is
reminiscent of the situation in S. cerevisiae where fusel alcohol treatment leads to eIF2α
dephosphorylation.
A variety of conditions are known to induce phosphorylation of eIF2α at serine 51 via
the kinase Gcn2p; such as the addition of rapamycin, amino acid starvation and
treatment with various antioxidants (Dever et al. 1992; Kubota et al. 2003; Mascarenhas
et al. 2008). On account of the low basal level, and to further explore the possibility

128
that eIF2α is dephosphorylated in response to butanol, the cells were exposed to 1mM
cadmium sulphate to induce phosphorylation of eIF2α (Mascarenhas et al. 2008). Under
these conditions, a robust signal was observed on the western blot that was not observed
for gcn2∆ strains. This band was the same size as the weak band observed in untreated
cells, suggesting that the weak band is indeed phosphorylated eIF2α. To explore
whether butanol induces dephosphorylation of eIF2α, cultures of a CAI4 strain and
gcn2Δ strain were first treated with 1mM Cadmium sulphate for 60 min to induce
detectable eIF2α phosphorylation, then treated with butanol for 15 min. As shown in
figure 3.11, high concentrations of butanol cause dephosphorylation of eIF2α. These
same high concentrations of butanol are required to give the maximal inhibition of
protein synthesis as judged by the polysome analysis (Figure 3.7). Therefore, the
inhibition of translation initiation by fusel alcohols is accompanied by and correlates
with a dephosphorylation of eIF2α.
In stark contrast to the effects of butanol on eIF2α dephosphorylation, concentrations of
ethanol that inhibit protein synthesis do not cause eIF2α dephosphorylation either with
or without the pretreatment with Cadmium (Figure 3.12). Once again this highlights a
difference between the response to these alcohols and suggests that they probably act by
different mechanisms.
Finally, the impact of farnesol on eIF2α dephosphorylation was assessed (Figure 3.13).
Similar to butanol, in the experiment where cells are pretreated with Cadmium to induce
high levels of phospho-eIF2α, high concentrations of farnesol possibly cause some
dephosphorylation of eIF2α. It should be noted however, that only 300µM farnesol gave
any observable effect. In contrast, from the polysome profiling maximal inhibition of
protein synthesis was already evident at 200µM farnesol. This suggests that even though
farnesol has a potential weak effect on eIF2α dephosphorylation, it is not connected to
the inhibition of protein synthesis.

129
Overall, these results confirm the gcn2∆ mutant data, in that none of the alcohols tested
causes an inhibition of translation initiation as a result of inducing eIF2α
phosphorylation. In fact butanol and possibly farnesol act to induce dephosphorylation
of eIF2α. Therefore, the possibility exists that these alcohols may be activating some
phosphatase to dephosphorylate eIF2. Indeed, in S. cerevisiae a mutant in SIT4, that
encodes a type 2A-related phosphatase exhibited virtually no dephosphorylation after
exposure to fusel alcohols (Taylor et al. 2010). It is possible that a similar mechanism
exists in C. albicans. While this may be interesting in terms of signal transduction, it is
unlikely to have any bearing on translational regulation as dephosphorylation of eIF2 is
activatory in terms of translation (Ashe et al. 2001; Taylor et al. 2010). Therefore, it
appears butanol and farnesol induce an inhibitory mechanism that dominates the effects
of eIF2α dephosphorylation.

eIF2αp
Phospho-eIF2α
Phospho-eIF2α
Tef1p
UT 2% 0% 0.5% 1% 2%
- - + + + +
10 min exposure
30 min exposure
Butanol
Cd2+ pretreatment
CAI4
- - + + + + +
UT 2% 0% 0.5% 1% 2% WT
Phospho-eIF2α
Tef1p
Cd2+ pretreatment
Butanol
gcn2Δ
Figure 3.11 Butanol causes a dose dependent decrease in eIF2α serine
51 phosphorylation (eIF2α-P) in the CAI4 strain. Protein extracts from
the CAI4 and the gcn2Δ strains were blotted and probed with antibodies to
Tef1 and a phosphospecific antibody to phosphoserine 51 on eIF2α. Strains
were grown on YPD to OD6oo of 0.7, pretreated with 1mM Cadmium for 1
hr. Various concentrations of butanol (v/v) were then added for 15 min after
which protein extracts were made.
130
A.
B.

Figure 3.12 Ethanol seems to have no effect on the level of eIF2α serine
51 phosphorylation (eIF2α-P) in the CAI4 strain. Protein extracts from
the CAI4 and the gcn2Δ strains were blotted and probed with antibodies to
Tef1 and a phosphospecific antibody to phosphoserine 51 on eIF2α. Strains
were grown on YPD to OD6oo of 0.7, pretreated with 1mM Cadmium for 1
hr. Various concentrations of ethanol (v/v) were then added for 15 min after
which protein extracts were made.
Phospho-eIF2α
Tef1p
UT 8% 0 % 2% 4% 6% 8%
Cd2+ pretreatment
Ethanol
10min exposure
30 min exposure
- - + + + + +
CAI4
Tef1p
gcn2Δ
Cd2+ pretreatment
UT 2% 4% 6% 8% CAI4
- + + + + +
Ethanol
Phospho-eIF2α
Phospho-eIF2α
131
A.
B.

UT 300 0 10 40 100 200 300
- - + + + + + +
10 min exposure
30 min exposure
Farnesol (µM)
Cd2+ pretreatment
Phospho-eIF2α
Phospho-eIF2α
Tef1
Figure 3.13 Farnesol causes a dose dependent decrease in eIF2α serine
51 phosphorylation (eIF2α-P) in the CAI4 strain. Protein extracts from
the CAI4 and the gcn2Δ were blotted and probed with antibodies to Tef1
and a phosphospecific antibody to phosphoserine 51 on eIF2α. Strains were
grown on YPD to OD6oo of 0.7, pretreated with 1mM Cadmium for 1 hr.
Various concentrations of farnesol (v/v) were then added for 15 min after
which protein extracts were made.
CAI4
Tef1
Phospho-eIF2α
UT 0 10 40 100 200 300 CAI4
- + + + + + + +
gcn2Δ
Cd2+ pretreatment
Farnesol (µM)
132
A.
B.

133
3.3 Discussion
The results described in this chapter show that a range of alcohols inhibit growth and
protein synthesis in strains of C. albicans in a dose-dependent manner. The inhibition of
protein synthesis occurred at the level of translation initiation as shown by the
polyribosomal profiles. There is a correlation in the concentrations required to inhibit
growth and translation initiation in the two strains of Candida albicans studied, as
shown in the growth curves and the polyribosomal profiles. Gcn2p is not involved in
this regulation of translation both in C. albicans and S. cerevisiae; thus there is an
inhibitory pathway that is independent of the eIF2α kinases. Previous work in S.
cerevisiae has identified a rapid inhibition of translation initiation caused by fusel
alcohols, which is accompanied by a characteristic change in polysome profile (Ashe et
al. 2001). As initiation is inhibited, ribosomes can no longer load onto transcripts and
ribosomes completing a translational cycle dissociate. This leads to a decrease in heavy,
polysome peaks with a concommitant rise in free ribosomes (Hartwell and McLaughlin
1969). Fusel alcohols target eIF2B to cause inhibition of translation initiation in S.
cerevisiae and this occur in a Gcn2p- independent manner (Ashe et al. 2001).
Butanol and possibly farnesol cause a dose dependent dephosphorylation of eIF2α in C.
albicans. This observation mirrors what was previously described for S. cerevisiae
following butanol treatment (Griffiths and Ashe 2006). However, ethanol seems not to
cause dephosphorylation, this finding serves to separate distinct modes of action for the
alcohols on protein translation.
Finally, alcohols also cause a range of effects on the morphology of C. albicans.
Butanol and ethanol induce a switch from vegetative growth to filamentous (germ-tube
and pseudohyphal) growth. Farnesol blocks filament development initiated by any of
three chemical triggers used in this study (serum, butanol and ethanol). Pseudohyphal
134
formation in S. cerevisiae in response to fusel alcohols have been described (Dickinson
1996; Lorenz et al. 2000).
An assessment of the translational response of key transcriptional mutants in the
morphological differentiaton pathway to butanol and farnesol, revealed that cAMP-
PKA pathway could be playing a mojor role in response of C. albicans to farnesol.
Previously it has been shown that farnesol acts via RAS- cAMP-PKA pathway to inhibit
morphogenesis in C. albicans (Davis-Hanna et al. 2008; Hall et al. 2011).

135
Table 3.1 Summary of effects of various alcohols on the physiology of C. albicans
strains
Alcohols

136
4 Effects of various alcohols on the eukaryotic initiation factor 2B
(eIF2B)
4.1 Introduction
Eukaryotic initiation factor 2B is the guanine nucleotide exchange factor for eIF2. It
promotes the exchange of GDP for GTP on eIF2. The resulting eIF2.GTP has the
capacity to interact with the initiator methionyl tRNA to form the ternary complex that
is a critical part of the translation initiation process (Proud 2005). Recognition of the
AUG start codon results in eIF5-dependent GTP hydrolysis on eIF2. eIF2B is required
to recycle the resulting eIF2.GDP back to its translationally competent GTP bound
form. eIF2B is therefore a key target of translational control mechanisms, as a decrease
in its activity leads to a depleted pool of GTP bound active eIF2 in the cell and therefore
a decrease in the rate of translation initiation (Dever et al. 1995).
As a result, several cellular stress conditions that inhibit the activity of eIF2B lead to
reduced ternary complex and the inhibition of protein synthesis. Paradoxically, such
stress conditions lead to the activation of the translation of specific mRNAs via short
upstream open reading frames (uORFs) (see Introduction 1.8.3). For instance, in S.
cerevisiae amino acid starvation leads to the phosphorylation of eIF2α by Gcn2p, which
converts eIF2.GDP from a substrate to an inhibitor of eIF2B to impede the formation of
ternary complex. As a result global protein synthesis is inhibited, while GCN4 mRNA
translation is activated via a complex mechanism involving four uORFs (See Section
1.8.3) (Hinnebusch 1993).
Studies from the Ashe laboratory in S. cerevisiae have shown that fusel alcohols, such
as 1-butanol, inhibit protein translation and activate GCN4 mRNA translation by a
different mechanism (Ashe et al. 2001). Instead of activating the Gcn2p kinase to
indirectly regulate eIF2B, these alcohols appear to impact on eIF2B more directly in a
Gcn2p independent manner. This proposed mechanism of action for the alcohols has

137
stemmed from a number of key observations. Firstly, mutant strains such as SUI2-S51A
and gcn2Δ, that are translationally resistant to amino acid starvation, are still sensitive to
fusel alcohols. In addition, a mutation in the γ subunit of eIF2B (GCD1-P180 to GCD1-
S180) was identified that confers greater sensitivity to fusel alcohols (Ashe et al. 2001).
Subsequently, a number of other mutations in the different eIF2B sub-unit genes have
been shown to impact on the resistance and sensitivity of yeast to fusel alcohols;
(Richardson et al. 2004; Taylor et al. 2010). Finally, a direct evaluation of the precise
levels of ternary complex after treatment with butanol shows that ternary complex levels
are reduced in butanol sensitive strains but unaffected in butanol resistant strains
(Taylor et al. 2010).
Other studies from the Ashe lab have focussed on the cellular localisation of eIF2B and
its G-protein eIF2 (Campbell et al. 2005; Campbell and Ashe 2006; Taylor et al. 2010).
It appears that both eIF2B and eIF2 co-localise to a discrete cytoplasmic focus within
the cell that has been termed the eIF2B body (Campbell et al. 2005). This localisation is
specific to these two initiation factors, as other initiation factors are found dispersed
throughout the cytoplasm (Campbell et al. 2005). The eIF2B body is thought to provide
a locally increased concentration of eIF2B and thus serves as a site for focussed guanine
nucleotide exchange on eIF2 (Campbell et al. 2005). Intriguingly, butanol addition to S.
cerevisiae cells at concentrations sufficient to inhibit protein synthesis has a negative
effect on the movement of the eIF2B body. This effect was more severe in butanol
sensitive relative to resistant strains, suggesting a role for the movement of the eIF2B
body in the response to butanol (Taylor et al. 2010).
Attempts have also been made in the Ashe lab to identify fusel alcohol dependent
covalent modifications in yeast eIF2B via mass spectrometric analysis. Such analyses
have identified a number of potential phosphorylation sites in eIF2Bɛ, eIF2Bα and
138
eIF2Bγ and mutations in one of the eIF2Bδ phosphorylation sites altered the sensitivity
of yeast to butanol (Taylor et al. 2010).
Given the results described above for S. cerevisiae, this chapter describes the study of
the effects of butanol, ethanol and farnesol on the activation of GCN4 mRNA, the
integrity and modification status of the eIF2B complex, and the presence/ movement of
the eIF2B body in the related pathogenic yeast, C. albicans.
4.2 Results
4.2.1 Butanol and ethanol induce the translation of GCN4 mRNA in a Gcn2p
independent manner in C. albicans
In S. cerevisiae, cellular stresses that inhibit translation initiation by reducing ternary
complex also lead to the translational induction of the GCN4 mRNA. A similar system
has been identified in C. albicans (Tripathi et al. 2002; Sundaram and Grant 2014).
Therefore, as alcohols caused an inhibition of translation initiation in C. albicans
(Section 3.2.5), the possibility exists that these alcohols could also act via a reduction of
the ternary complex and hence induce translation of the GCN4 mRNA. In S. cerevisiae
a GCN4-lacZ reporter construct containing the GCN4 promoter and the 5′ -untranslated
region driving expression of the lacZ gene was previously used to test whether Gcn4p is
induced upon butanol treatment (Ashe et al. 2001). The expression of the GCN4-lacZ
reporter was observed to increase ~3 fold following butanol treatment for 2 h. This
experiment formed part of the evidence that fusel alcohols target eIF2B to reduce
ternary complex levels.
Reporter genes that encode bioluminescence proteins, like luciferases, have provided a
very rapid method for analysing the regulation of gene expression (Bronstein et al.
1994). Srikantha et al. (1996) reported the development of a reporter system for C.
139
albicans using the luciferase gene RLUC of the sea pansy Renilla reniformis. The
reporter contains no CUG codons in its open reading frame, as Candida albicans and
other members of the CTG clade exhibit non-traditional codon use (Rocha et al. 2011);
they decode CUG as serine rather than leucine. Furthemore, the choice of Renilla
Luciferase as the reporter for this assay was made based on the fact that the reporter is
ATP-independent (Lorenz et al. 1991; Wurdinger et al. 2008; Huang et al. 2011).
Therefore RLUC reporter is well suited for use in C. albicans considering that the
filamentation system is regulated by cAMP. As a result, this cassette has been adapted
in two reporter constructs for use in the study of GCN4 regulation in C. albicans.
Firstly, a reporter has been constructed with five copies of the GCRE (General Control
Response Element) upstream of a basal promoter and the RLUC reporter gene. This
reporter allows the induction of Gcn4p responsive genes to be followed (Sundaram and
Grant 2014). Secondly, a GCN4-RLUC reporter has been developed in which the 5′-
leader sequence of GCN4 was cloned upstream of a luciferase reporter gene. This
reporter more directly assesses the translational regulation of the GCN4 mRNA
(Sundaram and Grant 2014).
Previously both the GCRE and GCN4 reporters have been integrated specifically into
the Candida albicans genome of CAI4 and gcn2∆ strains (Sundaram and Grant 2014).
These strains have been used here to assess how alcohols (1% butanol, 6% ethanol and
100µM farnesol) impact on this pathway. The rationale behind the concentrations of
alcohols used was that at these concentrations the alcohols do not completely inhibit
translation initiation so any induction of GCN4 should be observable based on similar
observations in S. cerevisiae. Indeed for the ethanol and butanol treatments there was
~3.6 and ~2.6-fold increase in GCRE-Luc expression, respectively after two hours.
However, for farnesol, no significant alteration relative to the basal level of GCRE-Luc
expression was observed (Figure 4.1A). For the GCN4-Luc reporter strain, ethanol and

140
butanol treatment once again gave an induction of ~1.65 and ~2.4-fold respectively,
whereas farnesol treatment gave no induction (Figure 4.2A). All of the increases
observed following butanol and ethanol treatment were also observed in the gcn2∆
mutant strain (Figure 4.1B and 4.2B).
These results are suggestive that the inhibition of translation initiation by ethanol and
butanol results from a decrease in the level of ternary complex. One possible
explanation for this is that, in an analogous manner to the action of fusel alcohols on S.
cerevisiae, ethanol and butanol act to inhibit eIF2B directly in a mechanism that does
not involve eIF2α phosphorylation. In contrast, for farnesol, the mechanism of
translational regulation appears to not involve changes in the activity of eIF2B and the
levels of the ternary complex. As the results from the ethanol and butanol experiments
thus far are very similar, in subsequent experiments a decision was made to focus on
butanol and compare the results directly to the impact of farnesol.

0
0.5
1
1.5
2
2.5
3
3.5
4
GC
RE
::L
uc
0
0.5
1
1.5
2
2.5
3
3.5
4
GC
RE
::L
uc
Figure 4.1 Alcohols impact on the general control pathway in C.
albicans in a Gcn2p independent manner. The CAI4 (A) and the
gcn2∆ mutant (B) strains were treated with the indicated
concentrations of alcohol for 2 h, and luciferase activity was measured
from the GCRE-Luc reporter gene. Error bars indicate ± SE.
A B
141

A B G
CN
4::
Luc
0
0.5
1
1.5
2
2.5
3
GC
N4::
Luc
Figure 4.2 Alcohols induce GCN4 expression in C. albicans in a Gcn2p
independent manner. The CAI4 (A) and the gcn2∆ mutant (B) strains
were treated with the indicated concentrations of alcohol for 2 h, and
luciferase activity was measured from the GCN4-Luc reporter gene. Error
bars indicate ± SE.
0
0.5
1
1.5
2
2.5
3
142

143
4.2.2 Effect of alcohols on the cellular localisation of eIF2B
4.2.2.1 Generating strains
Recent findings from the Ashe laboratory have shown that eIF2B exists in a large
cytoplasmic body in S. cerevisiae, which has been termed the eIF2B body (Campbell et
al. 2005). This body is mobile within the cell traversing almost all regions of the
cytoplasm. Intriguingly, the addition of butanol to cells, at concentrations sufficient to
inhibit protein synthesis, prevents the movement of the eIF2B body (Taylor et al. 2010).
Furthermore, in a specific butanol resistant strain treated with the same concentration of
butanol, the eIF2B body moves freely. Moreover, in other butanol resistant eIF2B
mutant strains, the eIF2B body is absent (Taylor et al. 2010). These results suggest a
connection between the eIf2B body and the regulation of translation initiation by fusel
alcohols in S. cerevisiae.
Therefore, to investigate the localisation of the eIF2B, in the diploid C. albicans CAI4,
one copy of the gene for the γ subunit of eIF2B (GCD1) was C-terminally tagged with
GFP using a standard PCR-mediated epitope tagging strategy (Knop et al. 1999). In this
method a cassette is generated with long primers that direct GFP (or other epitope tags)
such that they are directly integrated by homologous recombination into the genome in
frame with appropriate open reading frames. Positive transformants are selected by
virtue of the marker gene also present on the cassette. In this case the nourseothricin
acetyltransferase (NAT1) gene from Streptomyces noursei was used which gives
resistance to the antibiotic nourseothricin. Integration of the GFP-tag into the genome at
the correct site was verified using a PCR strategy on genomic DNA prepared from
potential transformants. The outline of this diagnostic PCR scheme is shown in figure
4.3, along with a table of expected product sizes. PCR products of the expected size
were obtained, indicating that the integration of the GFP-tag had occurred at the correct
site (Figure 4.3).

144
Western blotting was also used to confirm the GFP-tagging of the GCD1 gene across a
number of different potential transformants. Protein extracts were made from the
transformants and compared to those from an untagged control strain, and the blot was
probed using an antibody against the GFP protein. The GFP signal was detected at the
correct size in the GFP-tagged strain but no signal was detected in the untagged CAI4
strain (Figure 4.4 A).
Epiflourescence microscopy was used to visualize the tagged strain and the image
shown in Figure 4.4 B clearly shows that the majority of the cells harboured an eIF2B
body. It was also observed that the body was motile under untreated conditions. These
results almost precisely parallel what has been found in S. cerevisiae (Campbell et al.
2005; Taylor et al. 2010).

400
200
600
800
1000
1500
2000 2500 3000 3500
CAI4
Figure 4.3 Verification of GFP tagged CAI4 strain. Strains
were generated harbouring a genomically GFP-tagged copy of
GCD1 using the standard PCR mediated epitope tagging
method. A. Schematic of PCR amplifications to verify the
correct integration of the GFP tagging cassette into the GCD1
locus. B. Expected PCR sizes and C. an agarose gel
electrophoresis of PCR products generated by the amplification
are shown.
Primers Expected fragment sizes (bp)
Tagged Untagged
VFCaGCD1& GFP-UP
VRCaGCD1 & CaNAT1F
VFCaGCD1 & VRCaGCD1
319
570
3000 520
- -
GCD1
VFCaGCD1
VRCaGCD1 VRCaGCD1
VFCaGCD1
GCD1 GFP NAT
CaNAT1F
GFP-UP
A
B
C
CAI4 GCD1/
GCD1-GFP-NAT1
145

6 4 2 1 wt
α Gfp
αTef1p
transformants
Figure 4.4 GFP tagging of GCD1 shows that eIF2Bγ is
present in an eIF2B body. A) Western analysis was probed
with antibodies raised against GFP to confirm the tagging
and Tef1p was used as a loading control. B) Strain bearing
the GFP-tagged GCD1 was visualised with an epifluorescent
microscope showing a single large cytoplasmic body.
A
B
146

147
4.2.3 Alcohols do not affect the localisation of eIF2B subunits to the eIF2B body
Previous studies of translational stresses, such as amino acid starvation, in S. cerevisiae
have shown that despite an effect on shuttling of eIF2 through eIF2B bodies, they do
not impact on the ability of eIF2 or eIF2B to localise to the foci (Campbell et al. 2005).
In contrast, mutants in the α subunit of eIF2B have been described that lead to a
complete loss of the eIF2B body in S. cerevisiae. These mutants are also resistant to
both fusel alcohols and amino acid starvation. In this section, the effect of alcohols on
the localisation of eIF2B to eIF2B bodies was investigated using the GCD1-GFP tagged
strain.
Live cell epifluorescent microscopy was performed on mid-log phase C. albicans strain
CAI4 bearing a GFP tag on one copy of GCD1, to count and score cells for the absence
or presence of an eIF2B body. Figure 4.5A shows representative images of the
localisation pattern of the eIF2B subunit. Quantitation of the average number of cells
which contained an eIF2B body in either untreated cells or cells treated with 1% (v/v)
butanol or 100µM farnesol for 15 min shows that the treatments have no significant
effects on the capacity of the eIF2Bγ subunit to localise to eIF2B bodies (Figure 4.5B).
These results suggest that the integrity of the eIF2B body is unaffected by
concentrations of either butanol or farnesol that inhibit translation initiation.
4.2.4 Effect of alcohols on the dynamics of the eIF2B body
To investigate the impact of alcohols on the movement of eIF2B bodies, cells were
grown to logarithmic phase and briefly treated with a concentration of the various
alcohols that has been previously shown to inhibit translation initiation (see Figure 3.7).
Epiflourescence microscopy time-lapse experiments were performed by acquiring
images every 5 sec over a 2 min period. The movement of the eIF2B body across the
images was tracked and the total distance (µ) moved was calculated. Figure 4.6 shows

148
individual stills from a single time lapse microscopy experiment and an overlay of the
images from all 25 time points; this gives a representation of the extent of movement
over the time course. Quantitation of the average displacement shows that 1% butanol
causes total eIF2B body movement to drop by approximately 50%, while farnesol does
not appear to impact on this movement (Figure 4.7). As the eIF2B body moves less after
exposure to concentrations of fusel alcohols that also inhibit translation initiation, it
seems possible that as has been suggested in S. cerevisiae (Taylor et al. 2010), at least
part of the translational inhibition relates to increased tethering of the eIF2B body. It is
possible that the capacity of the eIF2B body to move rapidly around the cell may allow
a sustained level of translation initiation by maximising levels of ternary complex
throughout the cell.
4.2.5 Purification of eIF2B and eIF2 subunits from C. albicans for Mass
spectrometry
The cell biological approach described above further implicates eIF2B and/ or eIF2 in
the regulation of translation initiation by butanol but not by farnesol. In order to further
explore the impact of butanol on eIF2B, a biochemical approach was attempted. In the
first instance, the goal was to purify eIF2B and/or eIF2 from Candida albicans cells,
and a variety of different strategies were attempted.

Figure 4.5 Alcohols do not affect the localisation of eIF2Bγ
subunits to eIF2B bodies. Cells bearing GFP-tagged GCD1 were
visualised with an epifluorescent microscope. Cells were either
untreated or treated with 1% (v/v) butanol or 100µM farnesol for 15
min and the number of cells with eIF2B body were counted against
a total of 100 cells. Data represents quantification from 3 biological
repeats. Error bars indicate ±SE.
untreated 1% butanol 100µM farnesol
0
10
20
30
40
50
60
untreated 1% butanol 100µM
farnesol
Num
ber
of
eIF
2B
bodie
s/100 c
ells
untreated
1% butanol
100µM farnesol
A
B
149

Figure 4.6 Butanol impedes the movement of eIF2B bodies.
Cells were grown to mid-log phase in YPD and either maintained
as untreated, or treated with 1% (v/v) butanol or 100µM farnesol
for 15 min. Epiflourescent real-time 2D deconvolved projections
were generated from continuous z-sweep acquisition. Images of
cells were taken every 5 s over a 2 min time period. Representative
images are shown on the left and an overlay showing the position
of the body over the 2 min time course is shown on the right.
UT
1%
butanol
100µM
farnesol
Individual stills from time lapse Time lapse merge
150

Figure 4.7 Butanol impedes movement of eIF2B bodies. Images
of cells were taken as described in 4.6 and used to calculate the total
distance moved by the eIF2B body over a 2 minute period using
ImageJ software package (NIH). A bar chart shows the mean total
distance moved by the eIF2B bodies in µ. Values shown are
calculated from ≥ 20 cells ± SE. (* denotes a significant difference
from untreated sample p<0.003)
0
2
4
6
8
10
12
14
16
18
untreated 1% butanol 100µM
farnesol
Dis
tance
moved
(µ
)
untreated
1%
butanol
100µM
farnesol
*
151

152
4.2.5.1 Strategy for V5S-His6x tagging of GCD1 in C. albicans
The first approach taken was the use of a combined V5-6xHis epitope tag (Milne et al.
2011) to tag the eIF2Bγ and eIF2β proteins encoded by the GCD1 and SUI3 genes,
respectively. The double epitope tag combines the benefits of efficient detection through
the V5 epitope and protein purification using the 6xHis epitope. The V5-6xHis-NAT1
cassette was targeted to the relevant position on the GCD1 and SUI3 genes via
homologous recombination in the CAI4 strain of C. albicans (Figure 4.8A). Correct
integration was confirmed by PCR screening (Figure 4.8A, B and C). Western blotting
was also used to confirm tagging of the correct genes in the strain. The protein blots
were probed using antibodies raised against the V5 epitope (Figure 4.7 D), and bands of
the expected size (56.8kDa and 33.6kDa for GCD1 and SUI3 respectively) were
detected while no signal was detected in extracts from the untagged parent strain.
4.2.5.2 Purification of proteins from V5-6xHis tagged strains.
Repeated attempts were made to purify the tagged proteins using the V5 purification
method. V5 resin was used to bind the tagged protein and elution was carried out by
competition with the V5 peptide (Figure 4.9A). As this did not yield the expected set of
bands, protein purification was also carried out using the 6xHis tag. Ni-NTA agarose
beads were utilised and bound proteins were eluted with high concentrations of
imidazole. Repeated purifications using this strategy also did not yield the expected
sized bands (Figure 4.9B). Furthermore none of the subunits of eIF2B or eIF2 was
detected by mass spectrometry from purified samples.
There are a number of possible explanations that could explain the difficulty in
purifying the eIF2B and eIF2 proteins including insufficient protein levels or
inaccessibility of the epitope tag. In S. cerevisiae, an eIF2B purification system has
been developed, where all five eIF2B subunits are overexpressed from two plasmids,
153
and FLAG epitopes on eIF2Bγ allow purification (Mohammad-Qureshi et al. 2007). C.
albicans is an obligate diploid and autonomous plasmid systems developed for routine
use are unstable in this organism (Goshorn et al. 1992). Therefore, tagging just a single
copy of a gene, as for the V5-6xHis system above, will not permit maximal protein
expression, as the organism will also be expressing the untagged allele of the gene of
interest.
In an attempt to circumvent some of these potential bottlenecks, a different tagging
system was designed, similar to that which has been previously described in S.
cerevisiae. Firstly, to maximise tagged protein expression levels, it was decided that
both copies of the eIF2Bγ gene should be tagged. Secondly, the purifying epitope was
switched to FLAG and four copies were used in order to increase the binding of the
Flag antibody to the gene of interest. In order to genomically tag both alleles, a strategy
was adopted making use of a mini URA3 blaster (URA3-dpl200) cassette. This mini
URA3 blaster has short flanking repeats that permit PCR amplification of the cassette
for transformation, as well as homologous excision of the URA3 marker gene, such that
reuse is possible. Although the mini URA3 cassette was initially designed for gene
deletions in C. albicans (Wilson et al. 2000), here it was adapted for the sequential
FLAG-epitope tagging of two alleles of the GCD1 gene in C. albicans.

transformants
Sui3p-V5s
Tef1p
1 wt
Gcd1p-V5s
Tef1p
8 2 1 wt
CAI4 (untagged)
GCD1-V5S tagged M blank
SUI3-V5S (tagged)
CAI4 (untagged) M blank
Figure 4.8 Verification of GCD1-V5-6xHis-tagged and SUI3 V5-
6xHis-tagged CAI4 strains. Strains were generated harbouring
genomically V5-6xHis tagged copy of GCD1and SUI3 using the
standard PCR mediated epitope tagging method. A. Schematic of PCR
amplifications to verify the correct integration of the GFP tagging
cassette into the GCD1 locus. B. Expected PCR sizes for GCD1 and
SUI3 tagged genes respectively and C. Agarose gel electrophoresis of
PCR products generated by amplification are shown. D. Western
analysis of the extracts from the tagged strain. The immunoblots were
probed with antibodies against V5.
GCD1
VFCaGCD1
VRCaGCD1 VRCaGCD1
VFCaGCD1
GCD1 V5S NAT
CaNAT1F
V5S-UP
A
B
C
D
800 600
400
2500 3000
3500
2000
1500
1000
Primers
Expected fragment sizes (bp)
Tagged Untagged
VFCaGCD1& V5S
VR GCD1/SUI3 & CaNAT1F
VF GCD1/SUI3 & VRGCD/SUI3
591
503
2064 459
- -
Untagged
- -
GCD1-V5S SUI3-V5S
Tagged
556
515
2049 436
400
600
2000
1500
1000
800
3000 2500
154
a2 a1
a1
d2
b1
c2 d1
a2
b2
b1
b2
c1
c1 c2
d2 d2 d1 d1

100kDa
75kDa
50kDa
37kDa
25kDa
Mol. weight eIF2B subunits
Gcd6 81.9kDa
Gcd2 55.9kDa
Gcd1 54.3kDa
Gcd7 41.0kDa
Gcn3 35.1kDa
Figure 4.9 Affinity purification of V5-6xHis tagged eIF2B.
Affinity purified eIF2B was separated by Polyacrylamide gel
electrophoresis and stained with Coomassie. Affinity purification
was done with (A) V5 resin and (B) Ni-NTA agarose beads.
Molecular weight of V5-6xHis tag is 2.4kDa.
37kDa
50kDa
75kDa
100kDa
A B M M eluate eluate
155

156
4.3.5.3 Construction of the 4X-FLAG-URA3dpl tagging cassette
A cassette was therefore designed with four FLAG epitopes and URA3 as the selectable
marker. The URA3 marker was flanked by a 200bp segment of C. albicans URA3 3′
sequences to allow marker removal via homologous integration between the repeats.
The cassette, 4X-FLAG-URA3dpl200, was synthesized commercially (by Biomatik,
USA) and cloned into a standard vector (pBMH). A standard PCR based epitope
tagging strategy was taken to tag the GCD1 gene with the 4X-FLAG-URA3dpl cassette.
In short, primers were designed with regions complementary to an appropriate region of
the GCD1 gene, as well as a region that allows amplification of the 4X-FLAG-URA3dpl
cassette. An overview of the strategy for tagging both alleles of the GCD1 gene is
shown in Figure 4.10, while the precise site of integration for the PCR products is
shown in Figure 4.11A.
For the first GCD1 allele, correct integration of the Flag-tag into the genome was
verified using PCR reactions on genomic DNA purified from potential transformants
(Figure 4.11B). In addition, Western blotting was used to verify that a tagged protein of
the correct size (60 kDa) is present in protein extracts from the transformed strain but
not in extracts from the parental strain (Figure 4.12B).
In order to facilitate tagging of the second allele of the GCD1 gene, the URA3 marker
gene was first excised through homologous recombination between the 200bp flanking.
URA3 is a counter-selectable marker in that its loss can be selected for using 5-fluoro-
orotic acid (5FOA). Therefore, single colonies where the URA3 gene has potentially
been excised were selected on 5FOA plates to yield Ura- strains and URA3 loss was
verified using PCR on genomic DNA (Figure 4.11B).
The resulting strain was used in a second transformation with the 4X-FLAG-
URA3dpl200 cassette. Selection of transformants and verification of the correct
integration of the Flag-tag in the second allele of the gene was again performed using

157
PCR on genomic DNA preparations from potential transformants. The expected PCR
products generated from strains having two Flag-tagged alleles of GCD1 were obtained-
the lane labelled ‘1st and 2
nd’ contains a DNA band for the first tagged allele, a DNA
band for the second tagged allele yet no DNA band where the untagged allele migrates
(Figure 4.12A). Western analysis using an antibody raised against Flag protein also
showed approximately 2-fold higher levels of protein from the strain in which the two
GCD1 alleles were tagged relative to the strain where only one allele of the gene is
tagged (Figure 4.12B).

GCD1
GCD1
URA3
GCD1
Repeat for second allele
GCD1
Target gene
Target gene URA3
Figure 4.10 Strategy for tagging the two alleles of C. albicans genes
using the mini Ura-blaster technique. (A) 4XFLAG-URA3-dpl200
cassette, the locations of the epitope tag (stripped box ), ScCYC1
terminator (grey box), URA ORF (white box) and duplicated 3′
sequences (hatched boxes) are shown. (B) The schematic of the
sequential tagging of the two alleles of a gene.
dpl200 4xFLAG
Tagging of first allele
and selection on 5FOA
158
A
B

Figure 4.11 Verification of genomic C-terminal FLAG tagging
of the first allele of GCD1 in CAI4 strain. A. Schematic of PCR
strategy used to verify genomic integration of the FLAG-tag and
the expected PCR product sizes. B. Agarose DNA electrophoresis
of PCR products from 3 transformants. (a). refers to the
transformants bearing the whole tagging cassette, while (b) refers
to transformants that have lost the URA3 gene.
URA3 Tagged gene
VF VR
A.
Tagged gene
VR VF
(b)
Gene Expected product size
GCD1 (untagged gene)
a GCD1-4XFLAG-URA3dpl200
b GCD1-4XFLAG-dpl200
520 bp
2400 bp
1000 bp
600
800
1000
1500
2000
2500
3000
400
600
800
1000
1500
Untagged allele
URA3
looped
out
Untagged
allele
1st round of transformation
After 5OA wt transformants
B.
a
b
(a)
159

Figure 4.12 Verification of genomic C-terminal 4X FLAG
tagging of the second allele of GCD1 in CAI4 strain. A.
Agarose DNA electrophoresis of PCR products generated by
amplification of genome extracts. Product sizes are as presented
in Figure 4.9. B. Immunoblots on extracts generated from the
indicated strains. Immunoblots were probed with antibodies
generated against Flag protein. (1/2 and 2/2 refer to one and two
alleles of genes tagged with 4xFLAG epitope).
2500
3000
2000
1500
1000
800
600
400
200
WT
(untagged) 1st allele
1st & 2nd
allele
1st allele after
URA3 removal
Untagged
copy
A
M WT 1/2 1/2 2/2
Gcd1p-4xFlag
Tef1p
B
40
30
25
50
60
80
100
160

161
4.2.5.4 FLAG affinity purification of eIF2B for analysis by mass spectrometry
Protein extracts were made from cultures of the Flag-tagged strain and an untagged
strain and affinity purified using a modification of the FLAG affinity purification
method (Mohammad-Qureshi et al. 2007). In brief, extracts were incubated with a
Flag-agarose resin, washed and bound proteins were eluted using a Flag peptide (for full
purification methodology see Materials and Methods, section 2.3.10). The purified
proteins were separated by SDS PAGE alongside whole cell extract samples from the
tagged and untagged strains and visualized by staining with coomassie blue (Figure
4.13). From the gel, some of the protein bands are of the correct size for subunits of
eIF2B. In particular, it seems possible that the bands at ~80kDa and ~55kDa could be
eIF2B and eIF2B, especially given that eIF2B is the tagged subunit and work across
eukaryotes has shown that this subunit forms a catalytic sub-complex with eIF2B
(Koonin 1995).
In order to clarify which eIF2B subunits were present in the samples,
immunoprecipitated samples were briefly run into an SDS PAGE gel, stained and
protein bands were excised from the gel and analysed by mass spectrometry. Table 4.1
shows that eIF2B subunits were enriched in the sample, as shown by the number of
peptides present in samples generated from the tagged strains relative to untagged. In
particular, the eIF2B and subunits, which are known to form the catalytic sub-
complex, are heavily enriched in the tagged samples. Therefore, these data shows that
the double tagging of the two GCD1 alleles with 4xFLAG epitope has successfully
allowed at least a sub-complex of eIF2B to be purified.
The initial goal of the eIF2B purification was to ascertain whether treatment with 1%
(v/v) butanol affected either the level of the eIF2B subunits or the interaction of the
eIF2B subunits with other factors. To this end, Flag affinity chromatography was
carried out on protein extracts from the Flag tagged strain either untreated or from a

162
culture to which 1% (v/v) butanol had been added for 15 min. The resulting purified
proteins were run a little into SDS PAGE gel and protein bands were excised then
analysed by mass spectrometry. Table 4.2 shows that butanol did not have any
observable effect on the level of the eIF2B subunits as the level of the subunits
remained the same in the untreated and the 1% (v/v) butanol treated samples.
Table 4.1 Identification of the eIF2B subunits by mass spectrometry (MS) analysis
Identified proteins (45/56) Mol.
weight
NE1 NE2
untagged tagged
Orf19.407 GCD6 82kDa 3 50
Orf19.481 GCD1 54kDa 2 31
Orf19.6776 GCD2 56kDa 3 7
Orf19.6904 GCN3 35kDa 4 3
Orf19.825 GCD7 41kDa 4
The values shown are the exclusive peptide count indicating the
confidence of the identification. It can be seen that there are
significantly more peptides identified in sample NE2 for GCD6
and GCD1 indicating these proteins are enriched in sample NE2
relative to sample NE1.

50kDa
60kDa
80kDa
40kDa
30kDa
25kDa
1/2 2/2
input eluate
2/2 1/2
Mol. weight eIF2B subunits Gcd6 ɛ 81.9kDa
Gcd2 δ 55.9kDa Gcd1 γ 54.3kDa
Gcd7 β 41.0kDa Gcn3 α 35.1kDa
Figure 4.13 FLAG affinity purification of eIF2B. Coomassie
stained gels of FLAG affinity purified eIF2B from strains bearing
one copy of the 4xFLAG tag and strains bearing two copies of the
4xFLAG tag.
C. albicans eIF2B
subunits protein extracts
163

164
Table 4.2 Quantitave measure of the total spectrum counts shows that the levels of
the various eIF2B subunits were not altered by butanol treatment
Identified proteins Mol weight untreated treated
Orf19.407 GCD6 84kDa 269 298
Orf 19.481 GCD1 54kDa 202 254
Orf 19.825 GCD7 41kDa 4 4
Orf 19.6776 GCD2 56kDa 0 6
The values shown are the total spectrum count of each protein, which
includes data from peptides that have been analysed multiple times and is the
most relevant value for relative quantification. To be considered significant,
there needs to be a difference of at least 2-fold change and an absolute
difference of 10 peptides between conditions.

165
4.3 Discussion
The data presented in this chapter show that fusel alcohol and ethanol most likely
inhibit protein synthesis in a mechanism that involves the regulation of eIF2B, whereas
farnesol appears to act via a different pathway. Firstly, ethanol and fusel alcohols both
induce in a Gcn2p independent manner the translation of GCN4 mRNA. This assay is
often used as an in vivo indicator of ternary complex alterations and the guanine
nucleotide exchange reaction facilitated by eIF2B is critical for ternary complex
formation. On the other hand, farnesol has no effect on the translational activity of
GCN4 mRNA. Additionally, fusel alcohols impede the movement of the eIF2B body by
about 50% compared to the untreated sample, while farnesol had no apparent effect on
these dynamics.
In an effort to characterise the impact of fusel alcohols on eIF2B a biochemical strategy
was used to purify the eIF2B subunits from C. albicans by tagging the two alleles of
GCD1 with a 4xFLAG epitope tag. While subunits of eIF2B were identified in the
purifications, little evidence for changes in subunit abundance or covalent modifications
of eIF2B as a response to fusel alcohols was obtained. However, the peptide coverage
of the eIF2B complex was sparse, especially for the eIF2Bα, β and δ subunits, which
form the regulatory sub-complex; so any alteration to a specific covalent modification
on eIF2B might easily have remained undetected.
The response of C. albicans to butanol treatment is therefore similar to what has been
observed in S. cerevisiae. For instance, using a GCN4-LacZ reporter construct in S.
cerevisiae, (Ashe et al. 2001), showed that butanol induces the expression of GCN4
mRNA independently of the Gcn2p kinase. Interestingly, in C. albicans, treatment with
4-6% ethanol also elicits a similar response to butanol, whereas farnesol does not seem
to induce the translation of GCN4 mRNA, highlighting the difference between the
action of farnesol and the other alcohols.

166
In S. cerevisiae, eIF2B is present in a large cytoplasmic body termed the ‘eIF2B body’
(Campbell et al. 2005). While the integrity of this body is not affected by butanol, the
dynamics of its movement around the cytoplasm are significantly reduced. In mutants
that are resistant at the level of growth and translation to butanol, either the eIF2B body
is absent or its movement is unaffected by butanol (Taylor et al. 2010). In the data
presented here, C. albicans was also shown to harbour an eIF2B body and its movement
was significantly reduced by butanol. Once again this suggests that the regulation of
eIF2B to inihibit translation as a response to fusel alcohols is conserved between S.
cerevisiae and C. albicans. In contrast, to the results with fusel alcohols, neither the
ability of eIF2B to localise to the eIF2B body nor the dynamics of the body are affected
by farnesol. Similarly, in S. cerevisiae other stresses that are known to inhibit
translation initiation, such as amino acid or glucose starvation, do not affect either the
integrity or movement of the eIF2B body (Taylor et al. 2010).
Previously, it has been suggested that the function of the eIF2B body could be to
provide a concentrated site of guanine nucleotide exchange. This hypothesis was
supported by FRAP data showing that eIF2 shuttles through the body but that the rate of
shuttling in response to stresses targeting eIF2B, such as amino acid starvation, decrease
this shuttling (Campbell et al. 2005). The mechanism by which the eIF2B body moves
through the cell under normal conditions is not well understood, however one
possibility is that a concentrated core of eIF2B moves through the cell by simple
diffusion from areas of low to high eIF2.GDP. The decrease in eIF2B activity seen in
response to butanol could be due to the inhibition of movement of the eIF2B body or
alternatively the decrease in the movement of the eIF2B body may be the consequences
of a decrease in eIF2B activity. For example if movement of the eIF2B body was
dependent in some way on eIF2B activity, a reduction in eIF2B activity in response to
butanol would lead to a decrease in eIF2B body movement.

167
Overall, it appears in C. albicans that butanol targets eIF2B to cause an inhibition in
translation initiation. However, the biochemical purifications do not reveal how this
regulation is brought about. For farnesol, it seems that the regulatory mechanism is
distinct from that of the other alcohols and does not appear to act via eIF2B or the
regulation of ternary complex.

168
5 Farnesol inhibits translation initiation in Candida albicans in a
pathway that targets some aspect of 48S preinitiation complex
formation
5.1 Introduction
The isoprenoid alcohol, farnesol, a C. albicans cell-signalling molecule that participates
in the control of morphology also affects protein synthesis at the level of translation
initiation in a Gcn2p-independent manner (as shown in chapters 3 and 4). So a gcn2Δ
mutant was equally responsive to the effects of farnesol both in S. cerevisiae and in C.
albicans. However while other alcohols such as butanol cause an up-regulation of
GCN4 translation by inhibiting the activity of the eukaryotic initiation factor 2B (Ashe
et al. 2001), farnesol does not lead to the translational up-regulation of GCN4.
Seemingly then, farnesol does not appear to target eIF2B to cause an inhibition in
translation (see chapter 4)
Highly conserved mechanisms allow eukaryotic cells to globally reduce the level of
protein synthesis (Jackson et al. 2010). Besides the key eIF2B control, another step
where translation initiation is regulated across eukaryotes is at the mRNA selection
stage (Pavitt 2005; Richter and Sonenberg 2005; Wek et al. 2006).
The selection of mRNA relies on the interaction of a closed loop complex on the mRNA
with the 43S complex to form the 48S preinitiation complex and this requires protein-
protein interactions between components of the closed loop and 43S complexes
(Jackson et al. 2010). A number of stress conditions have been shown to affect the
formation of the 48S preinitiation complex. For instance in S. cerevisiae, glucose
starvation leads to a loss of eIF4A from the translation initiation machinery and
translational inhibition at a step after 48S complex formation (Castelli et al. 2011).
Furthermore, one of the yeast eIF4E binding proteins, Eap1p was also shown to be
involved in global mechanism targeting translation initiation as a result of oxidative
stress (Mascarenhas et al. 2008).

169
The mechanism by which farnesol acts on the translational machinery is currently
unknown. Though Uppuluri et al. (2007), reported a down regulation of genes regulated
by Gcn4p following treatment with 40µM of farnesol, and the level of the transcription
factor ATF4 is increased in human lung carcinoma H460 cells treated with farnesol (Joo
et al. 2007). Both of these effects could relate to transcriptional regulation, but might
also be explained by effects of farnesol on translational regulation. As farnesol does not
appear to regulate translation via eIF2B, the most logical next step in the translation
initiation pathway to investigate is the formation of 48S preinitiation complex.
5.2 Results
5.2.1 MLY61 strain of S. cerevisiae exhibited similar translational responses to
fusel alcohol and farnesol as C. albicans
One of the limitations of molecular studies in C. albicans is that many of the reagents
for protein studies are not readily available. For instance, while many of the antibodies
for studies on protein synthesis are available for the model yeast, S. cerevisiae, most of
these antibodies do not cross react with C. albicans translation factors and hence are not
suitable for the study of protein synthesis in C. albicans. Therefore, in order to further
investigate the step in the translation pathway that is targeted by farnesol, a decision
was made to work initially in S. cerevisae. The MLY61 strain of S. cerevisiae is a wild
type a/α diploid of Ʃ1278b genetic background (Lorenz et al. 2000). The MLY61 strain
was selected for this investigation, as like C. albicans it is a diploid yeast that forms
pseudohyphae in the presence of butanol. However, in order to validate the use of this
strain, we first needed to compare the effects of farnesol on translation initiation in
MLY61 and C. albicans using a range of translation assays.

170
The sensitivity of the MLY61 S. cerevisiae strain to both butanol and farnesol was
investigated using polysome analysis. Similar to the C. albicans CAI4 strain, the
MLY61 S. cerevisiae strain was sensitive to butanol at 2% (v/v) and to farnesol at a
concentration of 100µM (Figure 5.1). Furthermore, an investigation of the impact of
these alcohols on the levels of phosphorylated eIF2α revealed a similar pattern of
dephosphorylation in the S. cerevisiae MLY61 strain to that observed in C. albicans
following treatment with 2% butanol or 100µM farnesol after preatreatment with CdSO4
to induce initial phosphorylation (Compare Figure 5.2 with Figures 3.11 and 3.13). As
both the inhibition of translation initiation and the dephosphorylation of eIF2α in S.
cerevisiae and C. albicans is similarly dependent on the dose of butanol or farnesol, it
seems reasonable that the translational responses to butanol and farnesol are
mechanistically conserved across these species.

Figure 5.1 Translational initiation is inhibited by farnesol similarly
in CAI4 strain of C. albicans and MLY61 strain of S. cerevisiae.
Polysome analysis was used to assess the effect of farnesol on
translation initiation a CAI4 and MLY61 strain. Yeast were grown in
YPD and various concentrations of farnesol were added as indicated for
15 min prior to extract preparation. Extracts were sedimented on 15-
50% sucrose gradients and the absorbance at 254nm was continuously
measured.
MLY61
ut 40μM 100μM 200μM 300μM
CAI-4
ut 40μM 100μM 200μM 300μM
171

MLY 61
Figure 5.2 Butanol and farnesol cause a dose dependent decrease in
eIF2α serine 51 phosphatase (eIF2α-P) in the wild type S. cerevisiae
MLY 61 strain. Protein extracts from the wild type were blotted and
probed with antibodies to Tef1p and a phosphospecific antibody to
phosphoserine 51 on eIF2α. Strains were grown in YPD to OD600 of 0.7,
treated with 1mM Cadmium for 1 h. Various concentrations of butanol
(v/v) or farnesol (µM) were then added for 15 min after which protein
extracts were made.
Cd2+ pretreatment
Butanol
30 min exposure
UT 2% 0% 0.5% 1% 2%
- - + + + +
Phospho-eIF2αp
Tef1p
Phospho-eIF2α
Farnesol (µm)
Phospho-eIF2α 10 min exposure
30 min exposure
UT 300 0 40 100 200 300
- - - + + + +
Tef1p
Cd2+ pretreatment
172

173
5.2.2 Farnesol causes resedimentation of specific translation factors in MLY61
strain of S. cerevisiae
The ‘formaldehyde-polysome’ method has been used previously for analysing
translation complexes involved in the initiation stage of protein synthesis within the cell
(Nielsen et al. 2004; Hoyle et al. 2007; Castelli et al. 2011). Here cross-linking with
formaldehyde prior to cell lysis ensures that protein factors are maintained in complexes
during the subsequent polysome analysis (Figure 5.3). This stabilisation of weakly
interacting proteins allows the resolution of complexes that might otherwise be
disrupted by cellular lysis and sedimentation.
Mid log phase MLY61 S. cerevisiae cells grown in YPD were analysed using this
formaldehyde-polysome analysis. Continuous A254 measurements reveal polysome
profiles similar to those obtained using the more classical cycloheximide-dependent
polysome profiling technique (compare Figure 5.1 and Figure 5.4). Similarly, the
treatment of the cells with 100µM of farnesol for 15 min caused the same degree of
polysome run-off that was observed previously. The gradients were separated into
fractions, which were used for the production of protein samples for Western blotting
(Figure 5.3). These blots were probed using specific antibodies for S. cerevisiae
translation initiation factors.
It was noted that across the gradients the degree to which the eIF4G associates with the
small ribosomal subunit (40S) decreases early after farnesol treatment (Figure 5.4
fractions 1-3 untreated and 100 µM farnesol). In previous studies from our laboratory,
glucose starvation caused an accumulation of eIF4G in this region of the gradient at
early time points, whereas longer stress periods caused eIF4G and other components of
the closed loop complex to fall away from the ribosomal subunits to the top of the
gradient (Hoyle et al. 2007; Castelli et al. 2011).

174
During translation initiation the eIF4F factors (eIF4E, eIF4G and eIF4A), the mRNA
and Pab1p are thought to form a closed loop complex (Wells et al. 1998) and promote
formation of the 48S preinitiation complex. The data presented here for farnesol suggest
that this alcohol causes an alteration in protein-protein interactions that lie upstream of
48S complex formation. It is entirely possible that the observed depletion of eIF4G
results in reduced 48S formation resulting and an inhibition of translation initiation.

Figure 5.3 Protocol overview for formaldehyde
crosslinking
Grow to mid-log
phase.
Exposed to environmental
stress or untreated and
crosslinked with
formaldehyde
Lysed by vortexing/
RNA extraction
Western analysis
Seperation of fractions
along 15-50% sucrose
gradients by
centrifugation at
40,000rpm for 2.5 hours
1 2 3 4 5 6 7 8 9 10 11 12 13 14 15
Run on polysome machine
and collect fractions
TCA precipitation
15%
50%
175

1 2 3 4 5 6 7 8 9 10 11 12 13
40s
80s
60s
polysomes
untreated
40s
80s
polysomes
60s
1 2 3 4 5 6 7 8 9 10 11 12 13
eIF4G (118kDa)
eIF4E (24.2kDa)
Rps3 (16.5kDa)
Figure 5.4 Farnesol affects the association of the specific translation
factors with the ribosomes.
Sucrose density gradient analysis on extracts from strain MLY61 treated
with 100µM farnesol for 15 min. Immunoblots on gradient fractions probed
using antibodies against the indicated proteins are shown below the traces.
100µM farnesol
176

177
5.2.3 Tandem affinity purification (TAP) of eIF4G1
In order to further investigate how farnesol affects the formation of the 48S complex
and investigate how eIF4G becomes depleted from this region of a polysome gradient,
we undertook a modified tandem affinity purification strategy using TIF4631-TAP
(eIF4G1-TAP) tagged strain of S. cerevisiae.
The TAP method was developed by the Seraphin lab to allow the affinity purification of
specific proteins from whole cell extracts (Puig et al. 2001). In this method extracts are
sequentially passed over an IgG column, then eluted with Tev protease and further
purified on a Calmodulin column. In our lab a minimised form of this purification,
where just the first column is used and elution relies upon a peptide (Castelli et al.
2011). This minimises the time of incubation preserving weaker interactions. This
method was used to purify eIF4G1-TAP and eIF4E-TAP from S. cerevisiae strains
where the endogenous genes are TAP-tagged. Affinity purified and input samples were
analysed by Western blotting using antibodies against Rps3p. The rabbit HRP-
conjugated secondary antibody also detects the TAP-tagged protein by virtue of the
protein A moiety. The levels of Rps3p over background observed co-purifying with
either eIF4G or eIF4E remained similar in both the untreated and 100µM treated
samples (Figure 5.5A and B). Therefore, there was little evidence from this
immunopurification to support the reduced association of eIF4G with the 48S complex,
as observed on the formaldehyde sucrose density gradients. However, a substantial
contamination of the eluted samples with heavy and possibly light chain antibody
proteins was also observed (Figure 5.5A and B), which makes interpretation of these
data very difficult.
Therefore, in order to resolve whether farnesol leads to reduced 48S complex formation,
the experimental strategy was modified. Immunopurified samples from the eIF4G1-
TAP tagged strain of S. cerevisaie were analysed by mass spectrometry. Figure 5.6

178
shows that the relative number of peptides observed in these samples for eIF4G, eIF4E,
eIF4A and Pab1p; factors involved in the formation of the closed loop complex, were
largely unaffected by farnesol treatment. Interestingly, however, the number of peptides
recovered for the ribosomal proteins as well as eIF3, which are only associated with the
closed loop complex as part of the 48S complex or 80S complex is reduced dramatically
after farnesol treatment. These data support a model where farnesol targets the
formation of the 48S preinitiation complex to inhibit protein synthesis.

25
37
50
75
100
150
250
25
37
50
75
100
150
wt ut 100µM
farnesol
4G1-TAP
wt ut 100µM
farnesol
4E-TAP
wt ut 100µM
farnesol
eluate input
wt ut 100µM
farnesol
eluate input
Figure 5.5 Effect of farnesol on translation factors eIF4G and eIF4E
was not observed in immunoprecipitations.
Protein extracts were made from 1 litre cultures of strains harbouring the
(A) eIF4G-TAP or (B) eIF4E-TAP gene grown to mid-log phase. Purified
samples were resolved by SDS-PAGE and electroblotted onto
nitrocellulose membrane. Blots were probed with antibodies raised
against (A and B) Rps3.
A
B
protein Mol.
weight
eIF4G
-TAP
127kDa
eIF4E
-TAP
44.2kDa
Rps3p 26.2kDa
heavy chain
Rps3/light chain
179

0.7 0.75
0.7
0.92
0.7
0.02 0 0
0.18
0.3
0
0.36
0
0.16
0 0
0.17
0
0.11
0 0
0.1
0 0 0
0.2
0.4
0.6
0.8
1
1.2
UT 100µM Farnesol
Figure 5.6 Farnesol causes the depletion of ribosome associated
translation factors in immunoprecipitation of eIF4G1. Protein
extracts from eIF4G1-TAP tagged strain treated with 100µM farnesol
or untreated were resolved on SDS-PAGE gels, stained with coomassie
and sent for mass spectrometry. The figure shows no of unique
peptides that have been matched to the identified protein in the
sample. Untreated is normalised to 1, treated is fold change.
PAB,eIF4E,4G,4A eIF3 Small ribosomal subunits Large ribosomal subunits
Rel
ati
ve
no o
f u
niq
ue
pep
tid
es
180

181
5.3 Discussion
The studies presented in this chapter have shown that farnesol produced by only a few
species of Candida (Hornby et al. 2001), also has a repressive effect on protein
synthesis in yeast. Various studies into the effects of farnesol in other organisms have
revealed that farnesol impacts upon various developmental processes across Candida
species and other pathogenic fungi including Aspergillus spp. (Langford et al. 2009). In
addition, farnesol has also been shown to lead to cell-cycle arrest and growth inhibition
(Machida et al. 1999), increased ROS production and effects on mitochondria (Machida
et al. 1999), and cell death (Fairn et al. 2007). These effects have also been
demonstrated in C. albicans (Shirtliff et al. 2009). Dichtl et al. (2010) further suggest
that farnesol intereferes with the cell wall integrity pathway and many of the
components of this pathway are conserved across the fungal kingdom. Therefore, it is
perhaps not surprising to discover that farnesol similarly inhibited translation initiation
in the MLY61 strain of the budding yeast, S. cerevisiae (Figure 5.1). Equally this strain
showed a similar response to the effect of farnesol on eIF2α dephosphorylation as was
previously described for C. albicans (Figure 3.13 relative to Figure 5.2). In addition to
exhibiting similar translational responses to farnesol, some key physiological attributes
of MLY61 strain are similar to that of C. albicans (see section 5.2.1). These properties
of the MLY61 provide justification for its use to further elucidate the target of farnesol
in terms of the translational machinery.
Using the MLY61 strain, the mechanism by which farnesol elicits a global down-
regulation of translation initiation appears to involve alterations in the formation of the
48S preinitiation complex. There are precedents for regulatory mechanisms targeting
this step. For instance glucose starvation in yeast led to a decrease in eIF4E, eIF4G and
Pab1p cosedimentation with ribosomal components, which could be interpreted to mean
a decrease in the association between closed-loop complex and ribosomal species

182
(Hoyle et al. 2007). More recently Castelli et al. (2011) also showed that glucose
starvation in yeast leads to the loss of eIF4A from the eIF4G-containing preinitiation
complex explaining the resulting translational inhibition. Therefore, the effects of
farnesol that are described above, suggest that any alteration in the formation of the 48S
complex or its interaction with the mRNA ultimately leads to rapid inhibition of
translation at the initiation stage.
Data from mass spectrometry analysis of the eIF4G affinity purified samples also
provided significant insight into the physiological consequences of farnesol treatment.
A significant number of proteins were differentially present in the affinity purified
eIF4G as demonstrated by the peptide count (Figure 5.6). While the factors of the
closed-loop complex (eIF4A, eIF4G, eIF4A and Pab1p) remain similar in level,
anything associated with the ribosome goes down. Given that the closed loop complex
is perceived to be associated with high levels of translation initiation and, therefore, is a
target for translational regulation (Richter and Sonenberg 2005), these observations
suggest that farnesol targets the association of the ribosome with the mRNA, most
likely at the 48S preinitiation complex formation step of translation initiation.
183
6 RNA sequencing reveals a global change in gene expression following
treatment with farnesol in C. albicans
6.1 Introduction
The previous results chapters have revealed that farnesol inhibits morphological growth
as well as protein synthesis at the level of translation initiation in C. albicans. The
global level of protein synthesis occurring in a cell can be investigated by carrying out
polyribosomal analysis. This technique can highlight the stage of translation that is
regulated (Ashe et al. 2001), but reveals nothing about the identity of the mRNAs that
are being translated under different conditions. Furthermore, it is well-established that
farnesol impacts upon the transcriptome of both C. albicans and S. cerevisiae, so an in
depth understanding of gene regulation requires both the transcriptional and
translational impact of farnesol to be monitored at the level of individual genes and
mRNAs.
The recently developed RNA sequencing (RNA-seq) technology is revolutionizing our
ability to analyse transcriptomes (Wang et al. 2009). It is based on next-generation
sequencing platforms that were initially developed for high-throughput sequencing of
genomic DNA (Westermann et al. 2012). Previously, both microarray analysis and
RNA sequencing have been applied in the analysis of differential gene expression in
hyphae and biofilm formation by C. albicans cells exposed to farnesol (Cao et al. 2005;
Uppuluri et al. 2007; Nobile et al. 2012). RNA-seq technology generates data that is
more reproducible and sensitive than the various microarray platforms, therefore
resulting in more accurate measurements in gene expression changes (Xiang et al.
2010). Moreover the gene expression studies previously undertaken in C. albicans
following farnesol treatment only considered the transcriptional landscape. In this
chapter, RNA-seq has been used to analyse the impact of farnesol treatment at both the
transcript and translation level. The data revealed that mRNAs involved in oxidative
stress and translation were upregulated, while mRNAs involved in positive regulation of
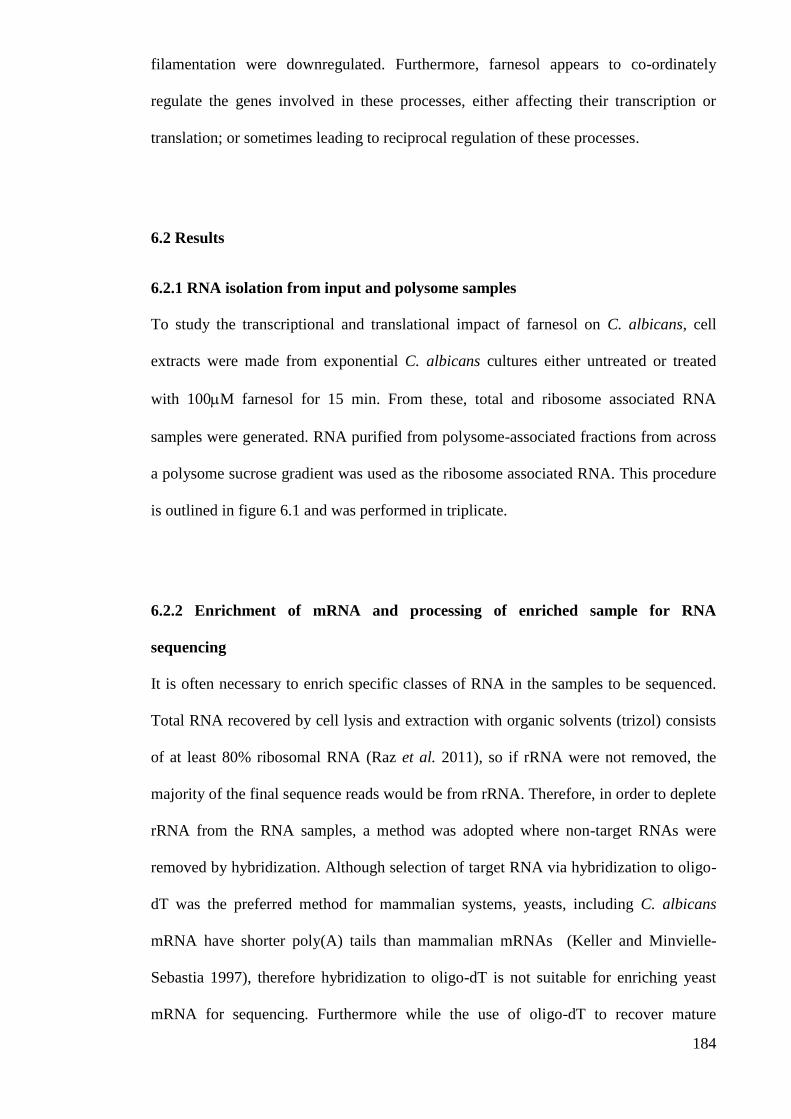
184
filamentation were downregulated. Furthermore, farnesol appears to co-ordinately
regulate the genes involved in these processes, either affecting their transcription or
translation; or sometimes leading to reciprocal regulation of these processes.
6.2 Results
6.2.1 RNA isolation from input and polysome samples
To study the transcriptional and translational impact of farnesol on C. albicans, cell
extracts were made from exponential C. albicans cultures either untreated or treated
with 100M farnesol for 15 min. From these, total and ribosome associated RNA
samples were generated. RNA purified from polysome-associated fractions from across
a polysome sucrose gradient was used as the ribosome associated RNA. This procedure
is outlined in figure 6.1 and was performed in triplicate.
6.2.2 Enrichment of mRNA and processing of enriched sample for RNA
sequencing
It is often necessary to enrich specific classes of RNA in the samples to be sequenced.
Total RNA recovered by cell lysis and extraction with organic solvents (trizol) consists
of at least 80% ribosomal RNA (Raz et al. 2011), so if rRNA were not removed, the
majority of the final sequence reads would be from rRNA. Therefore, in order to deplete
rRNA from the RNA samples, a method was adopted where non-target RNAs were
removed by hybridization. Although selection of target RNA via hybridization to oligo-
dT was the preferred method for mammalian systems, yeasts, including C. albicans
mRNA have shorter poly(A) tails than mammalian mRNAs (Keller and Minvielle-
Sebastia 1997), therefore hybridization to oligo-dT is not suitable for enriching yeast
mRNA for sequencing. Furthermore while the use of oligo-dT to recover mature

185
mRNAs reduces the proportion of RNA classes that do not have long poly-A stretches,
removal of ribosomal sequences via hybridization preserves non-polyadenylated RNAs
allowing one to investigate broader classes of RNAs.
The mRNA enrichment protocol used in this study is ribodepletion using the Ribo zero
rRNA removal kit (Epicentre, Illumina). This technique uses oligos that are
complementary to highly conserved ribosomal RNA sequences to bind and remove the
rRNA. As shown in Figure 6.2, the ribodepleted RNA samples were then fragmented
and converted to double stranded cDNA. Sequencing adapters were then ligated to both
the 3′ and 5′ ends of the double stranded cDNA and subsequently the cDNA library was
amplified by PCR using a primer cocktail that anneals to the ends of the adapters
(Illumina). The cDNA library was validated to check the purity of the sample by
running 1µg of sample on a DNA chip and then sequenced using high-throughput
illumina Hiseq sequencing.

Polyribosome separation
Total transcript
Level sequencing
Fractionated sample
sequencing
Bioinformatic Analysis
control
100µM
farnesol
control stress
Figure 6.1 Strategy of experiment for RNA sequencing of
polyribosomal fractions. Yeast were grown in YPD and treated with
100µM of farnesol or untreated for 15 min prior to cycloheximide
addition and extract preparation. Extracts were split into input and
polyribosomal fractions. Following polyribosome separation and RNA
extraction, the samples were ribodepleted and sent for illumina Hiseq
sequencing.
186
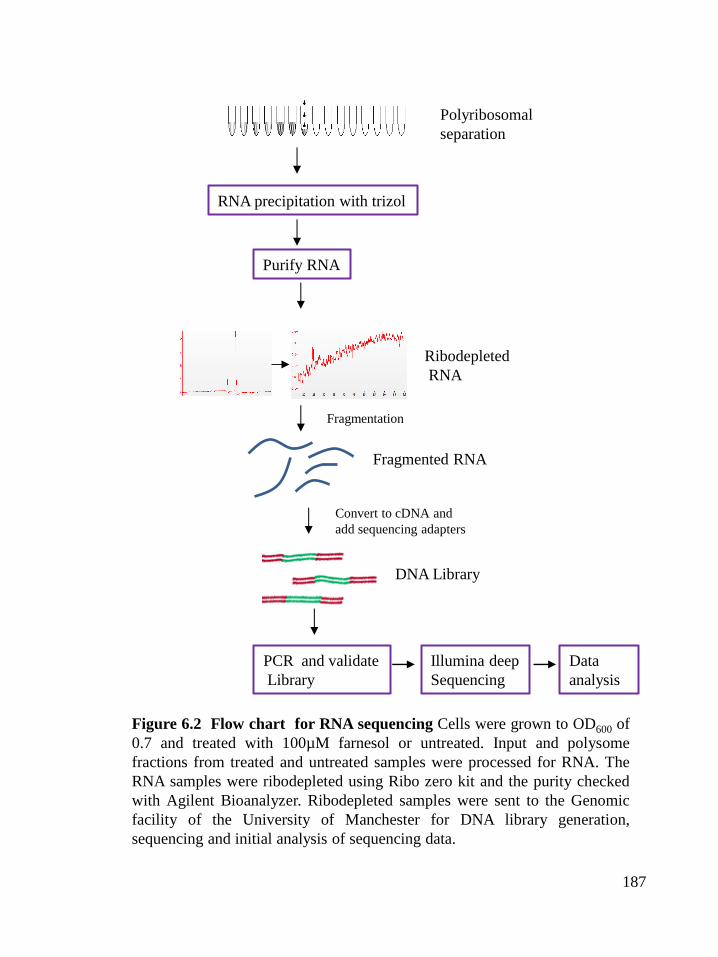
Figure 6.2 Flow chart for RNA sequencing Cells were grown to OD600 of
0.7 and treated with 100µM farnesol or untreated. Input and polysome
fractions from treated and untreated samples were processed for RNA. The
RNA samples were ribodepleted using Ribo zero kit and the purity checked
with Agilent Bioanalyzer. Ribodepleted samples were sent to the Genomic
facility of the University of Manchester for DNA library generation,
sequencing and initial analysis of sequencing data.
Polyribosomal
separation
RNA precipitation with trizol
Illumina deep
Sequencing
Ribodepleted
RNA
Fragmentation
Convert to cDNA and
add sequencing adapters
PCR and validate
Library
Fragmented RNA
DNA Library
Data
analysis
Purify RNA
187

188
6.3 Analysis of gene expression from the sequencing data
The sequencing data was analysed as described in materials and methods, section
2.9.4.3. RPKM (reads per kilobase per million mapped reads) values were determined
for all genes in each of the conditions tested. In order to assess the sequencing reads
mapping to different RNA types in the samples. Mapped reads per million per base pair
of RNA types in the sequenced data was calculated. The data as shown in table 6.1
suggests that the fractionation has been successful and gives evidence that the different
runs are reproducible. The input samples are highly enriched for the various RNA
species (snoRNA, ncRNA, tRNA and snRNA) compared to the polysome fractions
where these RNAs are more depleted.
Table 6.1 The depth of coverage per million sequenced reads for the RNA type.
Sample ID rRNA snoRNA ncRNA tRNA snRNA
InputUT1 20.6266 4.186745 11.85231 0.339016 15.87573
InputUT2 38.14159 3.136478 10.74961 0.290844 11.35054
InputUT3 21.94216 2.194619 10.24618 0.454221 7.34394
Input100uM-Farnesol1 39.14896 2.137437 12.54479 0.087663 9.903528
Input100uM-Farnesol2 42.3765 2.31221 14.19559 0.110736 10.62073
Polysome UT1 5.638171 0.705433 1.388306 0.010395 0.670995
Polysome UT2 2.697695 0.592301 1.062401 0.008674 0.592433
Polysome UT3 6.398139 0.880681 1.731622 0.013273 0.921996
Polysome 100uM-Farnesol2 8.23574 1.806252 2.371609 0.007332 2.010198
Polysome 100uM-Farnesol3 8.756714 2.041127 3.42422 0.009148 3.149637
This is the depth of coverage per million sequenced reads for the RNA type. The
mapped reads per million per bp of 𝑥RNA was calculated thus:
Reads mapping to 𝑥RNAs X 1,000,000/total reads in experiment.
The value was then divided by the total length of 𝑥RNAs in the genome

189
The normalisation to per million reads was done because the number of sequenced reads
varies from experiment to experiment.
In order to assess the impact of farnesol on gene expression, the sequencing data were
processed as described in materials and methods to generate two parameters: the change
in transcript level (log2[Total F/Total U]) and the change in translation state
(log2[polysome F/Total F]/log2[Polysome U/Total U]) following farnesol treatment. A
2-fold cut-off was applied to these ratios to define mRNAs that are significantly up
regulated or down regulated at the transcript level and/or at the translation level. At the
transcript level a total of 796 mRNAs were significantly altered, ≥2-fold with 330 up
regulated and 466 down regulated. In addition, at the translation level, a similar number
of mRNAs were significantly altered in their polysome association following treatment
with 100µM farnesol, ≥ 2-fold (477 up and 476 down) giving a total of 953 mRNAs that
were altered translationally. Scatter plots were used to visualise these data (Figure 6.3A
and B).
To further investigate the physiological consequence of farnesol treatment on C.
albicans, the Gene Ontology (GO) slim mapper (Candida Genome Database) tool was
used to provide functional classifications of the transcriptionally and translationally
altered mRNAs. This analysis revealed gene categories that were differentially altered.
Some of these gene categories exhibit responses at both transcriptional and translational
level, especially ‘the response to stress’, ‘translation’, ‘filamentous growth’, ‘cellular
respiration’, ‘cell cycle’, ‘signal transduction’ and ‘cytokinesis’. (Figure 6.3A,B and
6.4A and 6.4B).
Interestingly, as a functional class mRNAs involved in translation were upregulated
either transcriptionally or translationally. Given that in C. albicans farnesol inhibits
protein synthesis (see section 3.2.4) such that global protein production is repressed by
about 10-fold (see figure 3.6), the upregulation of mRNAs involved in translation may
190
serve as a feedback control mechanism. Such an idea has precedence in the literature:
for instance, under various stress conditions that inhibit global translation, cells up-
regulate the translation of specific mRNAs in order to overcome the inhibitory effect
(Natarajan et al. 2001).
Three other classes of mRNA were down-regulated at either the transcriptional or
translational level: those involved in filamentation, biofilm formation and cytokinesis
(Figure 6.4 A abd B). This observation perfectly correlates with the established effects
of farnesol on morphological transition and biofilm formation in C. albicans (Hornby et
al. 2001; Ramage et al. 2002; Uppuluri et al. 2007). Of particular interest is the effect of
farnesol on the TUP1 mRNA. Farnesol caused up-regulation of TUP1 mRNA at the
trancriptional level: an observation that has been made in previous studies using
microarrays (Cao et al. 2005; Kebaara et al. 2008). Tup1p is a transcriptional repressor
of filamentation genes, so the fact that the signalling molecule farnesol up-regulates this
gene is entirely consistent with the negative impact of farnesol on the transition to
filamentous growth in C. albicans. Other mRNAs that are required for morphological
differentiation were down-regulated transcriptionally by farnesol. For instance, mRNAs
encoding the secreted aspartyl proteinases (SAP8, SAP98), (also reported by Décanis et
al. (2011) and Cao et al. (2005)), the nucleotide phosphodiesterase (PDE1), the G-
protein receptor (GPR1), the transcription factor (TEC1,) and the adenylate cyclase
(CYR1). A complementary set of mRNAs that encode factors involved in filamentation
were down-regulated at the level of translation. For instance, mRNAs encoding the
cAMP dependent protein kinase catalytic subunit (TPK2), G-protein α subunit (GPA2),
agglutinins (ALS2 and ALS4) the transcriptional regulators (EFG1, FLO8 and CZF1)
Also the newly characterised gene, DEF1 or EED1, crucial for extension and
maintenance of filamentous growth and plays a role in epithelial cell escape,
dissemination in a tissue culture model and is regulated by Efg1p (Martin et al. 2011).

191
Interestingly, the EFG1 and EED1 mRNAs are translationally down-regulated along
with mRNAs involved in biofilm formation, cytokinesis and cell cycle. Farnesol
induced growth inhibition in S. cerevisiae cells has been characterised to consist of cell
cycle arrest concomitant with the downregulation of cell cycle gene expression
(Machida et al. 1999) . So the observation of the general downregulation of the mRNAs
involved in cytokinesis and cell cycle at the translation level could indicate that farnesol
affects cell cycle in C. albicans, as was previously observed in S. cerevisiae (Machida et
al. 1999). Also downregulation of mRNAs involved in signal transduction was observed
both at the transcriptional and translation level, this finding could be connected to the
effect of farnesol on filamentation. A puzzling aspect of the dataset is the fact that the
TUP1 mRNA appears translationally down-regulated even though transcript levels
increase. A further analysis of this mRNA is presented in section 6.5.
Among the mRNAs involved in stress response that were up-regulated transcriptionally
are those involved in oxidative stress response (SOD3, SOD4, SOD5, PRX1) and heat
shock proteins (HSP104, HSP12, HSP21 and HSP78) while the translation of the SOD4,
TRX1, and ATX1 mRNAs appears up-regulated. Farnesol has been shown to cause the
upregulation of proteins involved in protein folding and protection against
environmental and oxidative stress (Shirtliff et al. 2009). Exposure of cells to farnesol
causes the accumulation of reactive oxygen species (ROS) within 3 h (Shirtliff et al.
2009). Westwater et al. (2005) demonstrated that pre-treatment of C. albicans yeast cell
with farnesol led to increased survival to oxidative stress generated by H2O2 due to
increased expression of genes involved in oxidative stress resistance. C. albicans SODs
are the primary enzymatic antioxidants involved in protection against ROS (Zhu et al.
2011). Therefore, these data correlate well with the observation that farnesol induces the
up-regulation of mRNA involved in the oxidative stress response both at levels of
transcription and translation.

192
In addition, the upregulation of mRNAs involved in cellular respiration both at the level
of transcript and translation level could represent a response to the high levels of ROS
that have been described to result from farnesol treatment. For instance, the level of
ROS in farnesol-treated S. cerevisiae cells increases five to eight fold and this increase
was not observed in the respiration-deficient petite mutant ([rhoo]). These results
illustrate the role of the mitochondrial electron transport chain in facilitating growth in
the presence of farnesol (Machida et al. 1998).
Previous studies have shown that in response to stresses such as glucose starvation,
amino acid starvation and rapamycin treatment in S. cerevisiae (Castelli et al. 2011) a
specific subset of genes is co-regulated at both the transcriptional and the translational
level. This phenomenon has been termed ‘potentiation’ (Preiss et al. 2003). For the
farnesol experiments described here, however, only 6 such mRNAs were identified as
coregulated at both stages in the gene expression pathway, and many mRNAs were
increased transcriptionally while decreasing translationally (Figure 6.3A and B). One
possibility is that these transcriptionally induced mRNAs could serve as a store of
genetic material that could be rapidly mobilised should the cellular conditions improve.
Further analysis of these set of mRNAs using the CGD GO Slim mapper (Figure 6.4C)
shows that some of these mRNAs are those related to protein catabolic processes, drug
response, filamentation, stress response and biofilm formation: functions that are
consistent with the mRNA storage hypothesis.

Figure 6.3A Illumina Hiseq sequencing of input (total) RNA shows global
changes at the transcriptional level following farnesol treatment of C.
albicans culture. Figures show graphical plots depicting the transcript level
(log2[TF/TU]). A. Transcriptionally upregulated mRNAs in red and
transcriptionally downregulated mRNAs in green. A cutoff value of ±1.0 for
the change in transcript level was used. B. As A, except the mRNAs defined
as translationally regulated are highlighted on the plot: translationally up-
regulated in red and down-regulated in green.
Log
2 T
ota
l F
Log2 Total U
16.0
14.0
12.0
10.0
8.0
6.0
4.0
2.0
0.0 0.0 2.0 4.0 6.0 8.0 10.0 12.0 14.0 16.0
16.0
14.0
12.0
10.0
8.0
6.0
4.0
2.0
0.0 0.0 2.0 4.0 6.0 8.0 10.0 12.0 14.0 16.0
193

Log
2 [
Poly
som
e F
/Tota
l F
]
Figure 6.3B Illumina Hiseq sequencing of the input and polyribosomal
fractions shows global changes at the translation level following farnesol
treatment of C. albicans culture. Figure shows a graphical plots depicting the
change in translation state (log2[PF/TF]/log2[PU/TU]) following farnesol
treatment. A. Translationally upregulated mRNAs in red and downregulated
mRNAs in green. Cutoff value of 1.0 for the change in translation level was
used. B. As A, except the mRNAs defined as transcriptionally regulated are
highlighted on the plot: transcriptionally up-regulated in red and down-regulated
in green.
Log2[Polysome U/Total U]
194

0
5
10
15
20
25
30
org
anel
le o
rgan
isat
ion
tran
spo
rtR
esp
on
se t
o s
tres
sR
NA
met
abo
lic p
roce
sses
Re
spo
nse
to
ch
em
ical
Fila
me
nto
us
gro
wth
Pro
tein
mo
dif
icat
ion
pro
cess
esC
ell
cycl
eD
NA
met
abo
lic p
roce
ssR
esp
on
se t
o d
rug
Ve
scic
le m
edia
ted
tra
nsp
ort
Rib
oso
me
bio
gen
esis
Lip
id m
eta
bo
lic p
roce
ssC
arb
oh
ydra
te m
eta
bo
lism
Tran
slat
ion
Pat
ho
gen
esi
sP
rote
in c
atab
olic
pro
cess
Cyt
osk
ele
ton
org
anis
atio
nSi
gnal
tra
nd
uct
ion
Ce
ll w
all o
rgan
isat
ion
Ce
llula
r h
om
eo
stas
isB
iofi
lm f
orm
atio
nP
recu
rso
r m
etab
olit
es a
nd
…In
ters
pec
ies
inte
ract
ion
Ce
ll d
evel
op
men
tH
yph
al g
row
thC
yto
kin
esis
Ce
llula
r re
spir
atio
nP
rote
in f
old
ing
Thre
ad-l
ike
gro
wth
Co
nju
gati
on
Genes mapped to the GO Slim mapper
Total transcription up transcription down
Clu
ster
fre
qu
ency
Figure 6.4A Functional annotation of transcripts reveals differential
regulation of certain categories of genes. Data from RNA seq were
categorised based on differential regulation of transcription. The different
categories were annotated using the CGD Gene ontology Slim Mapper
according to functional categories for transcriptionally up and down regulated.
195

0
5
10
15
20
25
org
anel
le o
rgan
isat
ion
tran
spo
rtR
esp
on
se t
o s
tres
sR
NA
met
abo
lic p
roce
sses
Re
spo
nse
to
ch
em
ical
Fila
me
nto
us
gro
wth
Pro
tein
mo
dif
icat
ion
pro
cess
esC
ell
cycl
eD
NA
met
abo
lic p
roce
ssR
esp
on
se t
o d
rug
Ve
scic
le m
edia
ted
tra
nsp
ort
Rib
oso
me
bio
gen
esis
Lip
id m
eta
bo
lic p
roce
ssC
arb
oh
ydra
te m
eta
bo
lism
Tran
slat
ion
Pat
ho
gen
esi
sP
rote
in c
atab
olic
pro
cess
Cyt
osk
ele
ton
org
anis
atio
nSi
gnal
tra
nd
uct
ion
Ce
ll w
all o
rgan
isat
ion
Ce
llula
r h
om
eo
stas
isB
iofi
lm f
orm
atio
nP
recu
rso
r m
etab
olit
es a
nd
…In
ters
pec
ies
inte
ract
ion
Ce
ll d
evel
op
men
tH
yph
al g
row
thC
yto
kin
esis
Ce
llula
r re
spir
atio
nP
rote
in f
old
ing
Thre
ad-l
ike
gro
wth
Co
nju
gati
on
Genes mapped to the GO Slim mapper
Total Translation up Translation down
Clu
ster
fre
qu
ency
Figure 6.4B Functional annotation of genes at translational level reveals
differential regulation of certain categories of genes. Data from RNA seq
were categorised based on differential regulation of translation. The different
categories were annotated using the CGD Gene ontology Slim Mapper
according to functional categories for translationally up and down regulated.
196

0
2
4
6
8
10
12
14
16
Total transcription up/translation down
Figure 6.4C Functional annotation of mRNAs that are not
coregulated at the transcription and translation level.
mRNAs that were transcriptionally up regulated as well as
translationally downregulated were annotated according to
functional categories using the CGD Gene ontology Slim
Mapper.
197

198
6.4 Clarifying the translational regulation of TUP1 mRNA by q RT-PCR.
Of particular interest with regard to the impact of farnesol on filamentation is the
observation that TUP1 is up-regulated at the transcript level, yet appears down-
regulated at the level of translation. A quantitative real-time reverse transcriptase PCR
(qRT-PCR) analysis was used to further investigate the effect of farnesol on TUP1
mRNA across the polysome. The qRT-PCR data showed redistribution of the mRNA
from the polysomal region to the sub-polysomal region following treatment with
100µM farnesol (Figure 6.5). This agrees with the translational down-regulation of
TUP1 mRNA observed from the RNA-seq datasets. However, transcription of the TUP1
mRNA is increased 2.7-fold. It is possible this excess of mRNA in farnesol treated cells
is translated less well than the lower levels of mRNA in untreated cells simply as a
consequence of the overall level of mRNA. In this case, the transcriptional response
would play a more dominant role in determining the level of Tup1p protein in cells.
6.5 Validation of some of the transcriptional changes that are relevant to
filamentation and stress response using qRT-PCR
A qRT-PCR analysis was also used to further investigate the mRNAs that exhibited
altered profiles in the RNA-seq data at the transcript level. The analysis was performed
on a total of 6 genes and LUC mRNA was used as ‘spike-in’ control to allow
normalisation. TUP1 and EFG1 exhibited increased transcript levels following
treatment with 100µM farnesol, (Figure 6.6). PDE1 exhibited decreased transcript level,
whereas TRX1 and TIF4631 remained the same transcriptionally (Figure 6.6).
These data show that the trends evident in the RNA-seq datasets can be reproduced
using a qRT-PCR approach.

0
5
10
15
20
25
sedimentation
Untreated
Farnesol (100µM)
sedimentation
Sub-polysomal
Sub-polysomal
Polysomal
Polysomal
Figure 6.5 Farnesol causes redistribution of TUP1 mRNA from the polysome
to the submonosomal fraction. RNA was extracted from polyribosomal
fractions from A untreated sample and B sample treated with 100µM farnesol.
qRT-PCR was carried out on the cDNA samples using CFx Connect Real-Time
system with iTaq Universal SYBR Green Supermix (BioRad Laboratories). C
Percentage of mRNA in the monosome versus polysome fractions was quantified.
Error bars indicate ± SE.
0
5
10
15
20
% o
f m
RN
A
% o
f m
RN
A
A
B
40S 60S
40S 60S
80S
80S
0
10
20
30
40
50
60
70
80
90
100
untreated 100µMFarnesol
subpolysomal
polysomalC
% o
f R
NA
in
sam
ple
s
polysomes
polysomes
199

Figure 6.6 Verification of gene expression analysis by
quantitative real-time PCR (qRT-PCR). Data generated by RNA-
seq was plotted with calculations done for the same gene using qRT-
PCR. Values shown for the qRT-PCR are the means of three
determinations and error bars indicate ±SE.
200
-4
-3
-2
-1
0
1
2
3
4
5
TUP1 EFG1 PDE1 TIF4631
RNA seq
qRT-PCR

201
6.5 Discussion
C. albicans responds to farnesol, in part, by changing gene expression (Cao et al. 2005).
Extensive studies on the effects of farnesol on hyphal growth and biofilm formation
have generally focussed on the levels of mRNA transcripts (Cao et al. 2005; Cho et al.
2007; Uppuluri et al. 2007). However, as shown in Chapter 3, farnesol also impacts on
protein synthesis. Therefore in order to elucidate the likely impact of farnesol on cells
and provide insight into gene expression changes at both the transcript and translation
level following farnesol treatment, a global high throughput RNA sequencing analysis
of total and polysome associated RNA was undertaken.
RNA-seq analysis of C. albicans cells exposed to 100µM farnesol revealed a significant
number of mRNAs to be differentially expressed at the transcript and differentially
polysome associated. Most notable among the down-regulated mRNAs at both the
transcript (SAP8, SAP98, PDE1 GPR1, TEC1, CYR1) and polysome association (TPK2,
EFG1, FLO8, GPA2 CZF1, NDT80, DEF1, ALS2,ALS4) are those that play positive
roles in filamentation, and also biofilm formation reflecting the effect of farnesol as an
inhibitor of filament formation in C. albicans. This is consistent with previous findings
that farnesol prevents hyphal formation in a dose dependent manner (Hornby et al.
2001; Ramage et al. 2002). The results provide evidence that several hyphal associated
genes are differentially expressed both at the transcriptional and translational level. The
concept of potentiation was first described by Preiss et al. (2003) for S. cerevisiae.
Potentiation was not observed from the RNA seq data of the transcript and translation
state following farnesol treatment in C. albicans. Rather genes appear to be either
transcriptionally or translationally controlled. This perharps provides a flexible and co-
ordinated way to regulate the response to farnesol. Interestingly, TUP1 was observed to
be up-regulated at the level of transcription and it seems this may dominate over a
down-regualtion in polysome association. TUP1 encodes a global transcriptional co-

202
repressor. Deletion of the TUP1 gene causes hyper-filamentation under conditions that
favour yeast growth (Braun et al. 2000), therefore up-regulation of TUP1 may
contribute to the inhibition of filament formation in C. albicans.
mRNAs involved in protein synthesis were observed to be up-regulated both at the
transcriptional and at the level of polysome association. One possibility is that up-
regulation of the protein synthesis gene expression would serve an adaptive role
allowing cells to overcome the impact of farnesol as a translational inhibitor.
Overall, mRNAs involved in the response to stress were down-regulated, however,
some key mRNAs involved in the response to oxidative stress were up-regulated. This
is consistent with the observation that farnesol induces mild levels of oxidative stress in
C. albicans (Shirtliff et al. 2009; Zhu et al. 2011). Therefore, up-regulation of these
mRNAs could suggest that the farnesol treated cells are experiencing a specific
oxidative stress response and this could also account for the upregulation of mRNAs
involved in cellular respiration both at the level of transcript and translation level.
Overall, the results presented in this chapter suggest that as for many other stresses or
stimuli, the response to farnesol involves co-ordinate regulation of gene expression at
both the transcript level and at the level of translational control. Such a co-ordinated
response provides cells with greater flexibility in terms of the targeted regulation of
specific pathways or processes.
203
7 General discussion
A range of alcohols have been described as signalling molecules or metabolic end-
products across a variety of yeast species (Hornby et al. 2001; Chen et al. 2004; Chen
and Fink 2006). The aim of this research at the outset was to characterise the impact of
these alcohols on protein synthesis and filamentation in the pathogenic yeast species
Candida albicans. Once it became apparent that these alcohols all inhibit protein
synthesis yet have grossly different effects on filamentation, the precise mechanisms by
which these alcohols act became a priority study area.
The regulation of protein synthesis at the translation initiation stage, allows cells to
promptly modify protein levels and adapt to cellular stress. Previously it has been
shown that the target of fusel alcohols in S. cerevisiae is the eukaryotic initiation factor
2B, which is the guanine nucleotide exchange factor for eIF2 (Ashe et al. 2001; Taylor
et al. 2010). eIF2B has also been implicated in the translational inhibition caused by a
variety of cellular stress conditions such as amino acid starvation (Dever et al. 1992);
purine starvation (Rolfes and Hinnebusch 1993) and rapamycin (Kubota et al. 2003).
However, while these cellular stresses target eIF2B in a Gcn2p-dependent manner, the
mechanism by which fusel alcohols target eIF2B to inhibit translation initiation in S.
cerevisiae is Gcn2p-independent. The effect of fusel alcohols on translation initiation in
the human fungal pathogen, C. albicans therefore forms a key part of this thesis.
Another key regulated step in translation initiation is the formation of the 48S
preinitiation complex. eIF4E and Pab1p select mRNA via interaction with the 5ʹ cap and
3ʹ poly(A) tail, respectively. eIF4G interacts with both factors, promoting a closed loop
mRNP (Sachs 2000), which recruits the small ribosomal subunit via interactions with
eIF3, eIF5 and eIF1 to form the 48S preinitiation complex. A variety of stress
conditions have been shown to target these steps in the initiation pathway leading to

204
translational shut-off: for example glucose starvation (Hoyle et al. 2007) and
inactivation of mammalian target of rapamycin (Richter and Sonenberg 2005).
Investigations in this thesis into the impact of farnesol, a quorum sensing alcohol,
showed that farnesol caused an inhibition of translation initiation by a mechanism that
did not target eIF2B. Furthermore, mass spectrometry studies suggest that farnesol
targets formation of the 48S preinitiation complex. Finally, the consequences of farnesol
regulation in terms of both transcription and translation were investigated using next
generation sequencing technologies. These data suggest a co-ordinate regulation of
individual genes involved in processes such as filamentation and stress responses,
where genes are regulated either at the level of transcription or translation but not both,
or individual genes are reciprocally regulated such that when transcription is high
translation is low and vice versa.
7.1 Alcohols inhibit translation initiation in C. albicans in addition to exerting
opposing effects on growth morphology
After the initial observation that a variety of alcohols lead to the inhibition of translation
initiation (albeit at different concentrations) in C. albicans, a key question related to
how the alcohols were exerting these effects. A variety of stresses across eukaryotic
organisms lead to the inhibition of translation initiation via the activation of an eIF2
kinase. Like S. cerevisiae, C. albicans harbors a single eIF2 kinase, Gcn2p. This
kinase phosphorylates the α subunit of eIF2 in response to a range of stress conditions
including amino acid starvation in S. cerevisiae and the oxidative stress caused by the
addition of Cadmium in C. albicans (Sundaram and Grant 2014). Phosphorylated eIF2α
interacts tightly with and sequesters eIF2B causing it to become limiting and this is
ultimately inhibitory to protein synthesis. Even though fusel alcohol-dependent

205
translational inhibition in S. cerevisiae appears to target eIF2B, the process does not rely
upon Gcn2p or eIF2 phosphorylation (Ashe et al. 2001). So, both the SUI2 S5IA
strain, which is translationally resistant to amino acid starvation, and a gcn2Δ mutant
were still inhibited at the translational level by the addition of butanol (Ashe et al.
2001). Similarly in the present study, the CAI4 and gcn2Δ mutant strains of C. albicans
are both completely sensitive to butanol, farnesol and ethanol (Figures 3.6, 3.7, 3.8),
showing that the inhibition of translation initiation by alcohols in C. albicans does not
require the eIF2 kinase pathway. However, eIF2B has been demonstrated to be a key
player in the fusel alcohol response in S. cerevisiae. Firstly, various eIF2B mutants have
been shown to exhibit butanol-dependent phenotypes (Ashe et al. 2001; Richardson et
al. 2004; Taylor et al. 2010). Secondly, the level of a ternary complex that lies
downstream of eIF2B was reduced significantly by butanol in manner that correlated
with the relative sensitivity of eIF2B mutants (Taylor et al. 2010). Finally, butanol
caused increases in an eIF2B dependent GCN4-lacZ reporter system. A similar analysis
using GCRE-luciferase and GCN4-luciferase reporters shows that all of the alcohols
barring farnesol lead to increases in this system (Figures 4.1 and 4.2). Taken together,
these results are suggestive that short chain alcohols, particularly, butanol could be
targeting eIF2B to exert an effect on translation initiation in both S. cerevisiae and C.
albicans.
One possibility is that butanol and other alcohols could be exerting these effects via a
signalling pathway that involves eIF2B. Alternatively, it is possible that the alcohols are
acting in a more allosteric fashion by interacting directly with eIF2B to impact upon
activity.

206
7.1.1 Role of Sit4p in eIF2αP dephosphorylation
Studies from the Ashe laboratory have revealed some puzzling findings regarding the
dephoshorylation of eIF2α in the presence of fusel alcohols in S. cerevisaie (Taylor et
al. 2010). The effects observed run counter to the known mechanism by which eIF2
phosphorylation causes the inhibition of protein synthesis. The observed
dephosphorylation of eIF2α in response to alcohols occurs in a manner that correlates
with the inhibition of translation (Griffiths and Ashe 2006), so initially a link between
the two effects of the alcohols was considered. A deletion mutant in SIT4 (encoding a
type 2A-related phosphatase) was identified that exhibit virtually no eIF2α
dephosphorylation after cells have been exposed to fusel alcohols in S. cerevisiae
(Taylor et al. 2010). However, in this mutant the alcohols still cause the full inhibition
of protein synthesis. These data provided a direct demonstration that there is not a link
between the eIF2 dephosphorylation and the inhibition of protein synthesis (Taylor et
al. 2010).
In order to assess the level of similarity between the previous studies in S. cerevisiae
and the impact of alcohols in C. albicans, studies on the dephosphorylation of eIF2α
were undertaken. Butanol and farnesol were found to cause a dose-dependent
dephosphorylation of eIF2α in C. albicans (Figures 3.11 and 3.13), it is likely that this
effect could be either due to the inhibition of a kinase activity or the induction of a
phosphatase. Indeed given the homology of the C. albicans and S. cerevisiae SIT4
(89%), (Arndt et al. 1989; Lee et al. 2004) and the observation that C. albicans SIT4
complements a SIT4 deletion in S. cerevisiae (Lee et al. 2004), it is most likely that
Sit4p is involved in alcohol-induced dephosphorylation as was observed in C. albicans.
An intriguing correlation with the published literature lies in studies on the effects of
volatile anaesthetics on translation initiation in both yeast and mammalian cells (Palmer
et al. 2005), where striking similarities can be found to the observed effects of fusel

207
alcohols on C. albicans and S. cerevisiae. The volatile anaesthetic, isoflurane, was
observed to cause a 15-fold reduction in the level of phosphorylated eIF2α in the yeast
within 15 min of incubation. Also a decreased phosphorylation of the ribosomal protein
S6 (rpS6) and the kinase that phosphorylates rpS6 (p70s6k1
) was observed in mammalian
liver cells after exposure to the anesthetic, halothane (Palmer et al. 2006).
Intriguingly however, addition of ethanol concentrations that inhibit protein synthesis,
showed no dephosphorylation of eIF2α in C. albicans (Figure 3.12). This observation
provides further support for the interpretation that the dephosphorylation of eIF2 is
unrelated to the impact of the alcohols on translation initiation
7.1.2 Alcohols affect morphogenesis
Another observation with regard to the alcohols relates to their ability to impact upon
morphological transitions in C. albicans. A number of suggestions have been previously
made, regarding the physiological rationale underlying pseudohyphal growth and germ
tube formation. The altered growth pattern may allow yeast to forage for nutrients under
nutrient limiting conditions (Gimeno et al. 1992), it could facilitate escape from
accumulating toxic end-point metabolites (Gancedo 2001), 2001) and for Candida
species, it may provide a means to evade the host immune response. Here 0.25- 0.5%
(v/v) butanol was found to induce 50% pseudohyphae formation in C. albicans within 4
hours, while 1- 3% (v/v) of ethanol was required to elicit a similar effect (Figure 3.5B
and C). Studies presented here and elsewhere have shown that farnesol blocks germ
tube formation in C. albicans (Hornby et al. 2001; Ramage et al. 2002). One intriguing
question was whether the morphogenesis induced by serum, butanol or ethanol can
override farnesol’s inhibitory activity or vice versa. 150µM farnesol effectively blocked
the filamentation induced by serum, whereas lower concentrations were sufficient to
block ethanol- or butanol-induced filamentation (Figure 3.5B and C). These data are

208
consistent with previous work in C. albicans where morphogenesis induced by the
aromatic alcohol, tyrosol was blocked by farnesol in a dose-dependent manner (Ghosh
et al. 2008).
Intriguingly, deletion of the EFG1 gene, that encodes a transcriptional regulator
involved in the cAMP-PKA morphological differentiation pathway, exhibited some
resistance to the translational effects of farnesol in C. albicans. Previous studies have
found that the cAMP-PKA kinase and MAP kinase pathways are important for
pseudohyphal growth in response to aromatic alcohols in C. albicans (Ghosh et al.
2008). In addition, Sit4p was shown to play important roles during hyphal growth in C.
albicans by regulating protein translation (Lee et al. 2004). Therefore, it is at least
plausible that the translational and morphological impact of alcohols in C. albicans are
connected. However, it is important to note that for all of the alcohols used in this study,
the translational shut down occurs at higher concentrations than are required to cause
effects on the growth morphology. Therefore, key questions for the future will be how
alcohols induce morphological changes during growth and how this relates to their
effects on protein synthesis.
7.2 Movement of the eIF2B body is impeded by fusel alcohol, but not farnesol
In order to further investigate how the various alcohols bring about inhibition of
translation initiation, cell biological studies were initiated by comparison to what is
already known in S. cerevisiae. eIF2B and its G protein eIF2 have been shown to co-
localise to a discrete cytoplasmic foci in S. cerevisiae, termed the eIF2B body
(Campbell et al. 2005). In response to fusel alcohols the dynamic movement of this
body throughout the cell was inhibited in a manner that correlated both with the
concentration of the alcohol and the alcohol sensitivity of the strains at the level of
translation (Taylor et al. 2010). In this thesis, the data show that eIF2B also localises to

209
eIF2B bodies in C. albicans. Furthermore, the addition of butanol, ethanol or farnesol at
concentrations that inhibit translation initiation, did not impact on the ability of eIF2B
subunits to localise to these foci (Figure 4.5). However, butanol and ethanol both
affected the movement of the eIF2B body in a manner which correlated with their
effects on translation initiation (Figures 4.6 and 4.7). The mechanistic relationship
between alcohol dependent translational inhibition and the decreased movement of
eIF2B body remains unclear. One possibility is that the eIF2B serves as a centre for
guanine nucleotide exchange and inhibiting the movement of the body prevents the
factor being exposed to high concentrations of its substrate eIF2.GDP. Alternatively, as
the movement in S. cerevisiae has been found to occur as a result of diffusion and where
the 2B body remains static for periods it is likely due to tethering, it is possible that the
alcohols favour the tethered form of the 2B body, which for some reason precludes
guanine nucleotide exchange (Taylor et al. 2010). A similar pattern of movement has
been described for insulin granules (Ivarsson et al. 2004), movement of these granules
is sensitive to cooling, and a reduction in movement leads to a reduction in insulin
granule secretion, providing an example where the rate of movement of the granules
within the cell is necessary for cellular function (Ivarsson et al. 2004).
The inhibition of eIF2B body movement is not a general consequence of the
translational shut-down, as an inhibition was not observed following farnesol (Figures
4.6 and 4.7). The fact that farnesol treatment does not induce the expression of GCN4,
combined with its inability to regulate the movement of eIF2B bodies suggests that
farnesol does not target eIF2B to regulate translation initiation.
7.2.1 Biochemical analysis of eIF2B
To further investigate the possibility that butanol could be affecting the interaction of
eIF2B with other factors or that butanol treatment affected the level of eIF2B subunits,

210
strains of C. albicans wild type bearing a combined V5-6XHis epitopte tag on GCD1
and SUI3 genes were constructed. The aim of the epitope tagging was to purify eIF2B
and eIF2, but this strategy could not be pursued further as repeated attempts to purify
the tagged proteins failed. A tagging strategy to maximise the purification of the tagged
proteins by tagging the two copies of the gene (GCD1) with 4x FLAG epitope was
therefore designed largely based on purification schemes from S. cerevsiaie where Flag-
tagged eIF2B subunits are overexpressed from plasmids (Mohammad-Qureshi et al.
2007). Mass spectrometry on the immunopurified eIF2B samples identified the eIF2B
subunits, particularly the eIF2Bγ and ɛ subunits, which were over 30-fold enriched in
the tagged samples relative to samples from the untagged strain (Table 4.1). Therefore
the 4xFlag epitope tagging reagents for double tagging the two allelles of a gene
developed in this study could be adapted for epitope tagging of other genes in C.
albicans. However, because the other three subunits of eIF2B (α, β and δ) were not
consistently enriched, a biochemical analysis of the guanine nucleotide exchange
activity of the eIF2B complex was not possible. However, it may be possible in the
future to measure this activity for the / sub-complex and assess the impact of butanol
treatment on this activity. The finding that this catalytic sub-complex does not appear to
co-purify stiochiometrically with the regulatory sub-complex may also have biological
significance which could be explored in future experiments. For instance in S.
cerevisiae two of the three regulatory eIF2B genes are essential and the third is required
for translational control: Is this also true in Candida?
7.3 The formation of the 48S preinitiation complex is affected by farnesol
treatment.
The data in this thesis also provide insights into the mechanism by which farnesol elicits
an inhibition of translation initiation. As described above, the GCN4-luciferase reporter
211
experiments and 2B body studies are suggestive that eIF2B is not the regulatory target
for farnesol. Therefore, in an attempt to further understand the stage of translation
initiation regulated by farnesol, ribosomal complexes formed during translation
initiation were investigated using the formaldehyde-polysome analysis. For this analysis
a decision was made to switch to the MLY61 strain of S. cerevisae due to the absence in
Candida of antibodies with which to detect the components of the individual
translational complexes. Therefore, to validate this approach, experiments were
conducted showing that farnesol has a very similar impact on protein synthesis in the
MLY61 strain of S. cerevisiae (Figures 5.1 and 5.2). The subsequent formaldehyde-
polysome analysis revealed that the degree to which the eIF4G is associated with the
small ribosomal subunit (40S) decreases substantially following treatment with 100µM
farnesol (Figure 5.4). These data were verified and extended using an
immunoprecipitation strategy combined with a mass spectrometric analysis. More
specifically, following farnesol treatment immunopurified TAP-tagged eIF4G1 protein
co-purifies with many components of the closed loop complex, that interacts with
mRNA e.g. eIF4E and Pab1p, but fails to co-purify with the ribosomal proteins and
eIF3 (Figure 5.6), that are only associated with the closed loop complex as part of the
48S complex or 80S complex.
Many studies have reported translational control targeting steps upstream of mRNA
recruitment to the 43S ribosome complex to ultimately reduce 48S preinitiation
complex formation. For instance, glucose starvation causes a reorganisation of the
closed loop mRNP translation complex, whereby the cosedimentation of eIF4E, eIF4G
and Pab1p with ribosomal complexes is compromised (Hoyle et al. 2007). In addition,
phosphorylation of ribosomal protein L13a has been shown to inhibit 43S subunit
recruitment to mRNAs bearing the γ interferon inhibitor of translation element in rabbit
reticulocyte lysates (Kapasi et al. 2007). Patemine A (PatA) is a natural marine product

212
and has been shown to target eIF4A to disrupt the eIF4F complex by decreasing the
interaction between eIF4A and eIF4G while promoting the formation of a stable
complex between eIF4A and eIF4B. As a consequence, PatA blocks translation
initiation primarily by stalling the initiation complexes on mRNA (Low et al. 2005).
Furthermore another study showed that hippuristanol, another natural marine product,
inhibits translation initiation as a result of impaired eIF4A helicase activity and its
ability to interact with eIF4G (Lindqvist et al. 2008). Cruz-Migoni et al. (2011) recently
showed that the Burkholderia lethal factor 1, a toxin produced by the bacterium,
Burkholderia pseudomallei causes a translational block by inhibiting the helicase
activity of eIF4A and this manifests in the human disease melioidosis. Therefore, the
observed depletion of eIF4G from the 40S region of the gradient combined with the
mass spectrometric analysis of eIF4G containing complexes lend support to a model
where farnesol targets the formation of the 48S preinitiation complex to inhibit protein
synthesis.
7.4 Transcriptomic analysis reveals a global change in gene expression following
farnesol treatment of C. albicans
Advances in transcriptomic technology offer great promise in understanding the
molecular basis of stress responses in living cells. Previous global studies on the effect
of farnesol exposure at the level of gene expression have been based on alterations in
the level of transcripts alone (Cao et al. 2005; Uppuluri et al. 2007). As part of this
thesis, farnesol has been shown to cause a rapid inhibition of protein synthesis. This
means that in order to understand the changes in gene expression caused by farnesol a
decision was made to assess the level of polysome association as well as the level of
each transcript.

213
The data obtained from the transcriptomic and polysomal sequencing revealed that
genes associated with the functions in hyphal growth, biofilm formation and cell cycle
were down-regulated in response to farnesol (Figure 6.4A and B). One intriguing aspect
of these data is that many genes implicated in these functions appear to be either
regulated at the translational level or at the level of the transcript but not both. For some
genes there is even a reciprocal regulation of these processes. This contrasts with data
in S. cerevisiae for heat shock, rapamycin treatment, amino acid starvation and glucose
starvation where individual genes have been viewed as co-ordinately regulated in a
process that has been termed ‘potentiation’ (Preiss et al. 2003; Smirnova et al. 2005;
Castelli et al. 2011). The reason for this distinction is unclear, but may relate to the fact
that farnesol is more of a signalling molecule where a programmed response might be
required, whereas nutritional stresses require a ‘knee-jerk’ instantaneous and robust
response.
The TUP1 gene proved particularly interesting as it appeared up-regulated at the level
of transcription but down-regulated in terms of polysome association. These rather
puzzling data were confirmed using qRT-PCR. It seems possible that the increases at
the level of transcription overwhelm the translational machinery such that not all of the
new mRNA can be simultaneously assimilated for the production of protein. Hence, it
may appear that polysome association has been down-regulated. The anticipated
outcome under such circumstances would still be higher levels of the global
transcriptional co-repressor Tup1p protein. Previous studies have found that TUP1
deletion causes hyper-filamentation under conditions that favour yeast growth (Braun et
al. 2000), therefore an up-regulation of TUP1 in response to farnesol may contribute
significantly to the inhibition of filament formation in C. albicans by repressing
transcription of a range of filamentation genes. However, it remains unclear how genes
are regulated at the translational level in response to farnesol.

214
Three other functional classes of mRNA; those whose gene products are involved in
translation, cellular respiration and the response to oxidative stress were also up-
regulated in response to farnesol (Figure 6.4A and B). Once again, the mRNAs are
regulated either at the transcript level or at the level of polysome association, but rarely
both. As farnesol causes a 10-fold decrease in protein synthesis (see section 3.2.4), the
up-regulation of genes involved in protein synthesis could represent part of an adaptive
response by the cells to overcome the effect of farnesol on translation. In terms of
oxidative stress, Shirtliff et al. (2009) and Westwater et al. (2005), have previously
shown that exposure of C. albicans cells to farnesol caused the accumulation of reactive
oxygen species (ROS). Therefore, once again the up-regulation of genes involved in the
response to oxidative stress could represent an adaptive response to farnesol treatment.
Upregulation of mRNAs, whose gene products are involved in cellular respiration, both
at the transcript and translation level shows that farnesol could be impacting on the
respiratory machinery of C. albicans as was previously observed in S. cerevisiae
(Machida et al. 1998) .
.
7.5 Concluding remarks and future perspectives
The data presented in this study show that alcohols inhibit translation initiation in C.
albicans via different mechanisms. Fusel alcohols and ethanol appear to target eIF2B,
whereas 48S preinitiation complex formation is the likely target of farnesol. These
range of alcohols also differentially impact on one of the key virulence factors of this
important human fungal pathogen: morphological transition from yeast to hyphae or
pseudohyphae. Farnesol blocks the transition from yeast to hyphae even in the presence
of serum, whereas fusel alcohols and ethanol promote pseudohyphae and germ tube
formation. Future studies to investigate the connection between alcohol-induced
inhibition of protein synthesis and morphological differentiation will involve screening
215
deletion mutants in the morphological differential pathway or in translation initiation
factors for their translational or growth responses respectively in the presence of the
alcohols.
Farnesol has been shown to target some virulence features of C albicans and as such has
been studied as a possible agent for antifungal therapy. Data obtained here from RNA
sequencing has revealed that genes involved in filamentation were down-regulated at
either the transcriptional or translational level. Part of this regulation could be due to the
up-regulation of the TUP1 gene, which explains the transcriptional response, however,
an explanation for the translational regulation of these genes is still outstanding.
Mapping strategies will be required to precisely define the RNA sequences that dictate
the regulation of translation. These sequences can then be used to identify either based
on prior knowledge of RNA binding specificity, or experimentally via affinity
chromatography the proteins that interact with the sequence. Deletion mutation would
then allow the regulatory impact of these factors to be assessed following farnesol
treatment.
Interestingly the range of alcohols studied in this work are produced by C. albicans and
could be playing various in vivo roles in the adaptation, survival and perhaps virulence
of this opportunistic pathogen. Therefore elucidating mechanisms by which this range
of alcohols affect protein synthesis and morphological transition may help to advance
research on the development of novel antifungal agents that switch on endogenous cell
inhibitory mechanisms in this human pathogen.

216
Figure 7.1 Model for the impact of various alcohols on protein synthesis in C.
albicans and S. cerevisiae. The various alcohols had similar impact on protein
synthesis in C. albicans and S. cerevisiae. However S. cerevisiae being a Crabtree
positive yeast exhibited more tolerance to the translational effects of ethanol. In
addition while mild inhibition of translation initiation seems to induce pseudohyphal
formation, farnesol inhibited the process.
Ethanol/Butanol Farnesol
Phenotypic effects
e.g.
morphological
differentiation
40S
eIF2
GTP Met
5
3
1A
1 GDP
eIF2
GTP
eIF2
GDP GTP
eIF2B
eIF2B 48S complex
Protein synthesis

217
8. Bibliography
Alonso-Monge, R., Navarro-Garcia, F., Molero, G., Diez-Orejas, R., Gustin, M., et al. (1999).
"Role of the mitogen-activated protein kinase Hog1p in morphogenesis and virulence of
Candida albicans." J Bacteriol 181(10): 3058-3068.
Altmann, M., Handschin, C. and Trachsel, H. (1987). "mRNA cap-binding protein: cloning of
the gene encoding protein synthesis initiation factor eIF-4E from Saccharomyces
cerevisiae." Mol Cell Bio 7(3): 998-1003.
Altmann, M., Schmitz, N., Berset, C. and Trachsel, H. (1997). "A novel inhibitor of cap-
dependent translation initiation in yeast: p20 competes with eIF4G for binding to
eIF4E." Embo J 16(5): 1114-1121.
Anderson, P. and Kedersha, N. (2006). "RNA granules." J Cell Biol 172(6): 803-808.
Arana, D. M., Nombela, C., Alonso-Monge, R. and Pla, J. (2005). "The Pbs2 MAP kinase
kinase is essential for the oxidative-stress response in the fungal pathogen Candida
albicans." Microb 151(Pt 4): 1033-1049.
Arndt, K. T., Styles, C. A. and Fink, G. R. (1989). "A suppressor of a HIS4 transcriptional
defect encodes a protein with homology to the catalytic subunit of protein
phosphatases." Cell 56(4): 527-537.
Asano, K., Clayton, J., Shalev, A. and Hinnebusch, A. G. (2000). "A multifactor complex of
eukaryotic initiation factors, eIF1, eIF2, eIF3, eIF5, and initiator tRNA(Met) is an
important translation initiation intermediate in vivo." Genes Dev 14(19): 2534-2546.
Asano, K. and Hinnebusch, A. G. (2001). "Protein interactions important in eukaryotic
translation initiation." Methods Mol Biol 177: 179-198.
Asano, K., Krishnamoorthy, T., Phan, L., Pavitt, G. D. and Hinnebusch, A. G. (1999).
"Conserved bipartite motifs in yeast eIF5 and eIF2Bepsilon, GTPase-activating and
GDP-GTP exchange factors in translation initiation, mediate binding to their common
substrate eIF2." Embo J 18(6): 1673-1688.
Ashe, M. P., De Long, S. K. and Sachs, A. B. (2000). "Glucose depletion rapidly inhibits
translation initiation in yeast." Mol Biol Cell 11(3): 833-848.
Ashe, M. P., Slaven, J. W., De Long, S. K., Ibrahimo, S. and Sachs, A. B. (2001). "A novel
eIF2B-dependent mechanism of translational control in yeast as a response to fusel
alcohols." Embo J 20(22): 6464-6474.
Astrom, S. U., von Pawel-Rammingen, U. and Bystrom, A. S. (1993). "The yeast initiator
tRNAMet can act as an elongator tRNA(Met) in vivo." J Mol Biol 233(1): 43-58.
Bahn, Y. S., Staab, J. and Sundstrom, P. (2003). "Increased high-affinity phosphodiesterase
PDE2 gene expression in germ tubes counteracts CAP1-dependent synthesis of cyclic
AMP, limits hypha production and promotes virulence of Candida albicans." Mol
Microbiol 50(2): 391-409.
Baierlein, C. and Krebber, H. (2010). "Translation termination: new factors and insights." RNA
Biol 7(5): 548-550.
Banerjee, M., Thompson, D. S., Lazzell, A., Carlisle, P. L., Pierce, C., et al. (2008). "UME6, a
novel filament-specific regulator of Candida albicans hyphal extension and virulence."
Mol Biol Cell 19(4): 1354-1365.
Bhaganna, P., Volkers, R. J. M., Bell, A. N. W., Kluge, K., Timson, D. J., et al. (2010).
"Hydrophobic substances induce water stress in microbial cells." Microbial Biotech
3(6): 701-716.
Biswas, K. and Morschhauser, J. (2005). "The Mep2p ammonium permease controls nitrogen
starvation-induced filamentous growth in Candida albicans." Mol Microbiol 56(3):
649-669.
Biswas, S., Van Dijck, P. and Datta, A. (2007). "Environmental sensing and signal transduction
pathways regulating morphopathogenic determinants of Candida albicans." Microbiol
Mol Biol Rev 71(2): 348-376.
Biswas, S., Van Dijck, P. and Datta, A. (2007). "Environmental sensing and signal transduction
pathways regulating morphopathogenic determinants of Candida albicans."
Microbiol Mol Biol R 71(2): 348-376.

218
Blum, S., Schmid, S. R., Pause, a., Buser, P., Linder, P., et al. (1992). "Atp Hydrolysis by
Initiation Factor-4a Is Required for Translation Initiation in Saccharomyces-
Cerevisiae." Proc Natl Acad Sci USA 89(16): 7664-7668.
Bockmühl, D. P. and Ernst, J. F. (2001). "A potential phosphorylation site for an A-type kinase
in the Efg1 regulator protein contributes to hyphal morphogenesis of Candida
albicans." Genet 157(4): 1523-1530.
Bockmuhl, D. P., Krishnamurthy, S., Gerads, M., Sonneborn, A. and Ernst, J. F. (2001).
"Distinct and redundant roles of the two protein kinase A isoforms Tpk1p and Tpk2p in
morphogenesis and growth of Candida albicans." Mol Microbiol 42(5): 1243-1257.
Bolger, A. M., Lohse, M. and Usadel, B. (2014). "Trimmomatic: a flexible trimmer for Illumina
sequence data." Bioinformatics.
Bradford, M. M. (1976). "A rapid and sensitive method for the quantitation of microgram
quantities of protein utilizing the principle of protein-dye binding." Anal Biochem
72(1–2): 248-254.
Braun, B. R., Head, W. S., Wang, M. X. and Johnson, A. D. (2000). "Identification and
characterization of TUP1-regulated genes in Candida albicans." Genetics 156(1): 31-
44.
Braun, B. R. and Johnson, A. D. (1997). "Control of filament formation in Candida albicans by
the transcriptional repressor TUP1." Science 277(5322): 105-109.
Braun, B. R., Kadosh, D. and Johnson, A. D. (2001). "NRG1, a repressor of filamentous growth
in C.albicans, is down-regulated during filament induction." EMBO J 20(17): 4753-
4761.
Bronstein, I., Fortin, J., Stanley, P. E., Stewart, G. S. and Kricka, L. J. (1994).
"Chemiluminescent and bioluminescent reporter gene assays." Anal Biochem 219(2):
169-181.
Brown, A. J. and Gow, N. A. (1999). "Regulatory networks controlling Candida albicans
morphogenesis." Trends Microbiol 7(8): 333-338.
Bushell, M., Stoneley, M., Kong, Y. W., Hamilton, T. L., Spriggs, K. A., et al. (2006).
"Polypyrimidine tract binding protein regulates IRES-mediated gene expression during
apoptosis." Mol Cell 23(3): 401-412.
Calderone, R. A. and Fonzi, W. A. (2001). "Virulence factors of Candida albicans." Trends
Microbiol 9(7): 327-335.
Campbell, S. G. and Ashe, M. P. (2006). "Localization of the Translational Guanine Nucleotide
Exchange Factor eIF2B: A Common Theme for GEFs?" Cell Cycle In press.
Campbell, S. G., Hoyle, N. P. and Ashe, M. P. (2005). "Dynamic cycling of eIF2 through a
large eIF2B-containing cytoplasmic body: implications for translation control." J Cell
Biol 170(6): 925-934.
Cao, F., Lane, S., Raniga, P. P., Lu, Y., Zhou, Z., et al. (2006). "The Flo8 transcription factor is
essential for hyphal development and virulence in Candida albicans." Mol Biol Cell
17(1): 295-307.
Cao, Q., Huang, Y. S., Kan, M. C. and Richter, J. D. (2005). "Amyloid precursor proteins
anchor CPEB to membranes and promote polyadenylation-induced translation." Mol
Cell Biol 25(24): 10930-10939.
Cao, Y. Y., Cao, Y. B., Xu, Z., Ying, K., Li, Y., et al. (2005). "cDNA microarray analysis of
differential gene expression in Candida albicans biofilm exposed to
farnesol." Antimicrob Agents CH 49(2): 584-589.
Cassola, A., Parrot, M., Silberstein, S., Magee, B. B., Passeron, S., et al. (2004). "Candida
albicans lacking the gene encoding the regulatory subunit of protein kinase A displays a
defect in hyphal formation and an altered localization of the catalytic subunit." Eukaryot
Cell 3(1): 190-199.
Castelli, L. M., Lui, J., Campbell, S. G., Rowe, W., Zeef, L. A. H., et al. (2011). "Glucose
depletion inhibits translation initiation via eIF4A loss and subsequent 48S preinitiation
complex accumulation, while the pentose phosphate pathway is coordinately up-
regulated." Mol Biol Cell 22(18): 3379-3393.
Chen, H. and Fink, G. R. (2006). "Feedback control of morphogenesis in fungi by aromatic
alcohols." Genes Dev 20(9): 1150-1161.
Chen, H., Fujita, M., Feng, Q., Clardy, J. and Fink, G. R. (2004). "Tyrosol is a quorum-sensing
molecule in Candida albicans." Proc Natl Acad of Sci USA 101(14): 5048-5052.

219
Chen, J., Chen, J., Lane, S. and Liu, H. (2002). "A conserved mitogen-activated protein kinase
pathway is required for mating in Candida albicans." Mol Microbiol 46(5): 1335-1344.
Cheung, Y.-N., Maag, D., Mitchell, S. F., Fekete, C. A., Algire, M. A., et al. (2007).
"Dissociation of eIF1 from the 40S ribosomal subunit is a key step in start codon
selection in vivo." Genes Dev 21(10): 1217-1230.
Cho, T., Aoyama, T., Toyoda, M., Nakayama, H., Chibana, H., et al. (2007). "Transcriptional
Changes in Candida albicans Genes by Both Farnesol and High Cell Density at an
Early Stage of Morphogenesis inN-acetyl-D-glucosamine Medium." Nippon Ishinkin
Gakkai Zasshi 48(4): 159-167.
Cho, T., Aoyama, T., Toyoda, M., Nakayama, H., Chibana, H., et al. (2007). "Transcriptional
changes in Candida albicans genes by both farnesol and high cell density at an early
stage of morphogenesis in N-acetyl-D-glucosamine medium." 48(4): 159-167.
Clarkson, B. K., Gilbert, W. V. and Doudna, J. A. (2010). "Functional overlap between eIF4G
isoforms in Saccharomyces cerevisiae." PLoS One 5(2): e9114.
Cosentino, G. P., Schmelzle, T., Haghighat, A., Helliwell, S. B., Hall, M. N., et al. (2000).
"Eap1p, a novel eukaryotic translation initiation factor 4E-associated protein in
Saccharomyces cerevisiae." Mol Cell Biol 20(13): 4604-4613.
Cougot, N., Babajko, S. and Seraphin, B. (2004). "Cytoplasmic foci are sites of mRNA decay in
human cells." J Cell Biol 165(1): 31-40.
Cruz-Migoni, A., Hautbergue, G. M., Artymiuk, P. J., Baker, P. J., Bokori-Brown, M., et al.
(2011). "A Burkholderia pseudomallei toxin inhibits helicase activity of translation
factor eIF4A." Science 334(6057): 821-824.
Csank, C., Makris, C., Meloche, S., Schroppel, K., Rollinghoff, M., et al. (1997). "Derepressed
hyphal growth and reduced virulence in a VH1 family-related protein phosphatase
mutant of the human pathogen Candida albicans." Mol Biol Cell 8(12): 2539-2551.
Cullen, P. J. and Sprague, G. F., Jr. (2000). "Glucose depletion causes haploid invasive growth
in yeast." Proc Natl Acad Sci U S A 97(25): 13619-13624.
Cutler, J. E. (1991). "Putative virulence factors of Candida albicans." Ann Rev Microbil 45(1):
187-218.
D'Souza, C. A. and Heitman, J. (2001). "Conserved cAMP signaling cascades regulate fungal
development and virulence." FEMS Microbiol Rev 25(3): 349-364.
Davis-Hanna, A., Piispanen, A. E., Stateva, L. I. and Hogan, D. A. (2008). "Farnesol and
dodecanol effects on the Candida albicans Ras1-cAMP signalling pathway and the
regulation of morphogenesis." Mol Microbiol 67(1): 47-62.
De Filippi, L., Fournier, M., Cameroni, E., Linder, P., De Virgilio, C., et al. (2007). "Membrane
stress is coupled to a rapid translational control of gene expression in
chlorpromazine-treated cells." Curr Genet 52(3-4): 171-185.
Décanis, N., Tazi, N., Correia, A., Vilanova, M. and Rouabhia, M. (2011). "Farnesol, a fungal
quorum-sensing molecule triggers Candida albicans morphological changes by
downregulating the expression of different secreted aspartyl proteinase genes." The
open microbiol journ 5: 119.
Dever, T. E. (2002). "Gene-specific regulation by general translation factors." Cell 108(4): 545-
556.
Dever, T. E., Feng, L., Wek, R. C., Cigan, A. M., Donahue, T. F., et al. (1992).
"Phosphorylation of initiation factor 2 alpha by protein kinase GCN2 mediates gene-
specific translational control of GCN4 in yeast." Cell 68(3): 585-596.
Dever, T. E., Yang, W., Astrom, S., Bystrom, A. S. and Hinnebusch, A. G. (1995). "Modulation
of tRNA(iMet), eIF-2, and eIF-2B expression shows that GCN4 translation is inversely
coupled to the level of eIF-2.GTP.Met-tRNA(iMet) ternary complexes." Mol Cell Biol
15(11): 6351-6363.
Dichtl, K., Ebel, F., Dirr, F., Routier, F. H., Heesemann, J., et al. (2010). "Farnesol misplaces
tip-localized Rho proteins and inhibits cell wall integrity signalling in Aspergillus
fumigatus." Mol Microbiol 76(5): 1191-1204.
Dickinson, J. R. (1996). "'Fusel' alcohols induce hyphal-like extensions and pseudohyphal
formation in yeasts." Microbiol 142 ( Pt 6): 1391-1397.
Dickinson, J. R. (2000). "Branched-chain keto acid dehydrogenase of yeast." Method Enzymol
324: 389-398.

220
Diez-Orejas, R., Molero, G., Navarro-Garcia, F., Pla, J., Nombela, C., et al. (1997). "Reduced
virulence of Candida albicans MKC1 mutants: a role for mitogen-activated protein
kinase in pathogenesis." Infect Immun 65(2): 833-837.
Dobin, A., Davis, C. A., Schlesinger, F., Drenkow, J., Zaleski, C., et al. (2013). "STAR:
ultrafast universal RNA-seq aligner." Bioinformatics 29(1): 15-21.
Dobrikov, M. I., Dobrikova, E. Y. and Gromeier, M. (2013). "Dynamic regulation of the
translation initiation helicase complex by mitogenic signal transduction to eukaryotic
translation initiation factor 4G." Mol Cell Biol 33(5): 937-946.
Doedt, T., Krishnamurthy, S., Bockmühl, D. P., Tebarth, B., Stempel, C., et al. (2004). "APSES
proteins regulate morphogenesis and metabolism in Candida albicans." Mol Biol Cell
15(7): 3167-3180.
Dominguez, D., Kislig, E., Altmann, M. and Trachsel, H. (2001). "Structural and functional
similarities between the central eukaryotic initiation factor (eIF)4A-binding domain of
mammalian eIF4G and the eIF4A-binding domain of yeast eIF4G." Biochem J 355(Pt
1): 223-230.
Dunyak, D. S., Everdeen, D. S., Albanese, J. G. and Quinn, C. L. (2002). "Deletion of
individual mRNA capping genes is unexpectedly not lethal to Candida albicans and
results in modified mRNA cap structures." Eukaryot Cell 1(6): 1010-1020.
Ernst, J. F. (2000). "Transcription factors in Candida albicans - environmental control of
morphogenesis." Microbiol 146 ( Pt 8): 1763-1774.
Fairn, G. D., MacDonald, K. and McMaster, C. R. (2007). "A Chemogenomic Screen in
Saccharomyces cerevisiae Uncovers a Primary Role for the Mitochondria in Farnesol
Toxicity and Its Regulation by the Pkc1 Pathway." J Biol Chem 282(7): 4868-4874.
Farruggio, D., Chaudhuri, J., Maitra, U. and RajBhandary, U. L. (1996). "The A1 x U72 base
pair conserved in eukaryotic initiator tRNAs is important specifically for binding to the
eukaryotic translation initiation factor eIF2." Mol cell biol 16(8): 4248-4256.
Feketova, Z., Masek, T., Vopalensky, V. and Pospisek, M. (2010). "Ambiguous decoding of the
CUG codon alters the functionality of the Candida albicans translation initiation factor
4E." FEMS Yeast Res 10(5): 558-569.
Fernandez-Arenas, E., Cabezon, V., Bermejo, C., Arroyo, J., Nombela, C., et al. (2007).
"Integrated proteomics and genomics strategies bring new insight into Candida albicans
response upon macrophage interaction." Mol Cell Proteomics 6(3): 460-478.
Fogli, A., Dionisi-Vici, C., Deodato, F., Bartuli, A., Boespflug-Tanguy, O., et al. (2002). "A
severe variant of childhood ataxia with central hypomyelination/vanishing white matter
leukoencephalopathy related to EIF21B5 mutation." Neurology 59(12): 1966-1968.
Fogli, A., Schiffmann, R., Hugendubler, L., Combes, P., Bertini, E., et al. (2004). "Decreased
guanine nucleotide exchange factor activity in eIF2B-mutated patients." Eur J Hum
Genet 12(7): 561-566.
Fonzi, W. A. and Irwin, M. Y. (1993). "Isogenic strain construction and gene mapping in
Candida albicans." Genet 134(3): 717-728.
Forche, A., Alby, K., Schaefer, D., Johnson, A. D., Berman, J., et al. (2008). "The parasexual
cycle in Candida albicans provides an alternative pathway to meiosis for the formation
of recombinant strains." PLoS Biol 6(5): e110.
Gancedo, J. M. (2001). "Control of pseudohyphae formation in Saccharomyces cerevisiae."
FEMS Microbiol Rev 25(1): 107-123.
Garcia, M., Meurs, E. and Esteban, M. (2007). "The dsRNA protein kinase PKR: virus and cell
control." Biochimie 89(6): 799-811.
Gasch, A. P., Spellman, P. T., Kao, C. M., Carmel-Harel, O., Eisen, M. B., et al. (2000).
"Genomic Expression Programs in the Response of Yeast Cells to Environmental
Changes." Mol Biol Cell 11(12): 4241-4257.
Gaspar, N. J., Kinzy, T. G., Scherer, B. J., Hümbelin, M., Hershey, J. W., et al. (1994).
"Translation initiation factor eIF-2. Cloning and expression of the human cDNA
encoding the gamma-subunit." Journ Biol Chem 269(5): 3415-3422.
Gebauer, F. and Hentze, M. W. (2004). "Molecular mechanisms of translational control." Nat
Rev Mol Cell Biol 5(10): 827-835.
Ghosh, S., Kebaara, B. W., Atkin, A. L. and Nickerson, K. W. (2008). "Regulation of Aromatic
Alcohol Production in Candida albicans." Appl Environ Microbiol 74(23): 7211-7218.
221
Gillum, A., Tsay, E. H. and Kirsch, D. (1984). "Isolation of the Candida albicans gene for
orotidine-5′-phosphate decarboxylase by complementation of S. cerevisiae ura3 and E.
coli pyrF mutations." Mol Gen Genet 198(1): 179-182.
Gimeno, C. J., Ljungdahl, P. O., Styles, C. A. and Fink, G. R. (1992). "Unipolar cell divisions in
the yeast S. cerevisiae lead to filamentous growth: Regulation by starvation and RAS."
Cell 68(6): 1077-1090.
Gomez, E., Mohammad, S. S. and Pavitt, G. D. (2002). "Characterization of the minimal
catalytic domain within eIF2B: the guanine-nucleotide exchange factor for translation
initiation." EMBO J 21(19): 5292-5301.
Gomez, E. and Pavitt, G. D. (2000). "Identification of domains and residues within the epsilon
subunit of eukaryotic translation initiation factor 2B (eIF2B epsilon) required for
guanine nucleotide exchange reveals a novel activation function promoted by eIF2B
complex formation." Mol Cell Biol 20(11): 3965-3976.
Goshorn, A. K., Grindle, S. M. and Scherer, S. (1992). "Gene isolation by complementation in
Candida albicans and applications to physical and genetic mapping." Infect Immun
60(3): 876-884.
Goyer, C., Altmann, M., Lee, H. S., Blanc, a., Deshmukh, M., et al. (1993). "Tif4631 and
Tif4632 - 2 Yeast Genes Encoding the High-Molecular-Weight Subunits of the Cap-
Binding Protein Complex (Eukaryotic Initiation Factor-4F) Contain an RNA
Recognition Motif-Like Sequence and Carry out an Essential Function." Mol Cell Biol
13(8): 4860-4874.
Grant, C. M. and Hinnebusch, A. G. (1994). "Effect of sequence context at stop codons on
efficiency of reinitiation in GCN4 translational control." Mol cell biol 14(1): 606-618.
Griffiths, C. D. and Ashe, D. S. (2006). Translational Regulation in Saccharomyces Cerevisiae
in Response to Fusel and Amino Alcohols, University of Manchester.
Gross, T., Siepmann, A., Sturm, D., Windgassen, M., Scarcelli, J. J., et al. (2007). "The DEAD-
Box RNA Helicase Dbp5 Functions in Translation Termination." Science 315(5812):
646-649.
Guthrie, C. and Fink, G. R. (1991). Guide to yeast genetics and molecular biology. San Diego,
California, Academic Press.
Hall, R. A., Turner, K. J., Chaloupka, J., Cottier, F., De Sordi, L., et al. (2011). "The quorum-
sensing molecules farnesol/homoserine lactone and dodecanol operate via distinct
modes of action in Candida albicans." Eukaryot Cell 10(8): 1034-1042.
Han, A. P., Yu, C., Lu, L., Fujiwara, Y., Browne, C., et al. (2001). "Heme-regulated eIF2alpha
kinase (HRI) is required for translational regulation and survival of erythroid precursors
in iron deficiency." Embo J 20(23): 6909-6918.
Harding, H. P., Novoa, I., Zhang, Y., Zeng, H., Wek, R., et al. (2000). "Regulated translation
initiation controls stress-induced gene expression in mammalian cells." Mol Cell 6(5):
1099-1108.
Harding, H. P., Zhang, Y., Zeng, H., Novoa, I., Lu, P. D., et al. (2003). "An integrated stress
response regulates amino acid metabolism and resistance to oxidative stress." Mol Cell
11(3): 619-633.
Hartwell, L. H. and McLaughlin, C. S. (1969). "A mutant of yeast apparently defective in the
initiation of protein synthesis." Proc Natl Acad Sci U S A 62(2): 468-474.
He, H., von der Haar, T., Singh, C. R., Ii, M., Li, B., et al. (2003). "The yeast eukaryotic
initiation factor 4G (eIF4G) HEAT domain interacts with eIF1 and eIF5 and is involved
in stringent AUG selection." Mol Cell Biol 23(15): 5431-5445.
Hellen, C. U. and Sarnow, P. (2001). "Internal ribosome entry sites in eukaryotic mRNA
molecules." Genes Dev 15(13): 1593-1612.
Hernandez, G., Altmann, M., Sierra, J. M., Urlaub, H., del Corral, R. D., et al. (2005).
"Functional analysis of seven genes encoding eight translation initiation factor 4E
(eIF4E) isoforms in Drosophila." Mech Dev 122(4): 529-543.
Hershey, J. W. and Merrick, W. C. (2000). "Pathway and mechanism of initiation of protein
synthesis." Cold Spring Harbor monograph series 39: 33-88.
Hibbett, D. S., Binder, M., Bischoff, J. F., Blackwell, M., Cannon, P. F., et al. (2007). "A
higher-level phylogenetic classification of the Fungi." Mycolog Res 111(5): 509-547.
Hinnebusch, A. G. (1988). "Mechanisms of gene regulation in the general control of amino acid
biosynthesis in Saccharomyces cerevisiae." Microbiol Rev 52(2): 248-273.

222
Hinnebusch, A. G. (1993). "Gene-specific translational control of the yeast GCN4 gene by
phosphorylation of eukaryotic initiation factor 2." Mol Microbiol 10(2): 215-223.
Hinnebusch, A. G. (1994). "The eIF-2 alpha kinases: regulators of protein synthesis in
starvation and stress." Semin Cell Biol 5(6): 417-426.
Hinnebusch, A. G. (2000). Mechanisms and regulation of initiator methionyl-tRNA binding to
ribosomes. Translational control of gene expression. N. Sonenberg, J. W. B. Hershey
and M. B. Mathews. Cold Spring Harbor, New York, Cold Spring Harbor Laboratory
Press: 185-244.
Hinnebusch, A. G. (2005). "Translational regulation of GCN4 and the general amino acid
control of yeast." Annu Rev Microbiol 59: 407-450.
Hinnebusch, A. G., Asano, K., Olsen, D. S., Phan, L., Nielsen, K. H., et al. (2004). "Study of
translational control of eukaryotic gene expression using yeast." Ann N Y Acad Sci
1038: 60-74.
Hornby, J. M., Jensen, E. C., Lisec, A. D., Tasto, J. J., Jahnke, B., et al. (2001). "Quorum
sensing in the dimorphic fungus Candida albicans is mediated by farnesol." Appl
Environ Microbiol 67(7): 2982-2992.
Hornby, J. M., Kebaara, B. W. and Nickerson, K. W. (2003). "Farnesol biosynthesis in Candida
albicans: cellular response to sterol inhibition by zaragozic acid B." Antimicrob Agents
Chemother 47(7): 2366-2369.
Hoyle, N. P., Castelli, L. M., Campbell, S. G., Holmes, L. E. and Ashe, M. P. (2007). "Stress-
dependent relocalization of translationally primed mRNPs to cytoplasmic granules that
are kinetically and spatially distinct from P-bodies." J Cell Biol 179(1): 65-74.
Huang, R., Vider, J., Serganova, I. and Blasberg, R. G. (2011). "ATP binding cassette
transporters modulate both coelenterazine- and D-luciferin- based bioluminescence
imaging." Mol imaging 10(3): 215-226.
Hull, C. M., Raisner, R. M. and Johnson, A. D. (2000). "Evidence for mating of the" asexual"
yeast Candida albicans in a mammalian host." Science 289(5477): 307-310.
Ibrahimo, S., Holmes, L. E. and Ashe, M. P. (2006). "Regulation of translation initiation by the
yeast eIF4E binding proteins is required for the pseudohyphal response." Yeast 23(14-
15): 1075-1088.
Imataka, H. and Sonenberg, N. (1997). "Human eukaryotic translation initiation factor 4G
(eIF4G) possesses two separate and independent binding sites for eIF4A." Mol Cell
Biol 17(12): 6940-6947.
Ingram, L. (1981). "Mechanism of lysis of Escherichia coli by ethanol and other chaotropic
agents." J Bacteriol 146(1): 331-336.
Ingram, L. (1986). "Microbial tolerance to alcohols: role of the cell membrane." Trends Biotech
4(2): 40-44.
Ivarsson, R., Obermuller, S., Rutter, G. A., Galvanovskis, J. and Renstrom, E. (2004).
"Temperature-sensitive random insulin granule diffusion is a prerequisite for recruiting
granules for release." Traffic 5(10): 750-762.
Jackson, R. J., Hellen, C. U. and Pestova, T. V. (2010). "The mechanism of eukaryotic
translation initiation and principles of its regulation." Nat Rev Mol Cell Biol 11(2): 113-
127.
Jackson, R. J., Hellen, C. U. and Pestova, T. V. (2010). "The mechanism of eukaryotic
translation initiation and principles of its regulation." Nat Rev Mol Cell Biol 11(2): 113-
127.
Jan, E. and Sarnow, P. (2002). "Factorless Ribosome Assembly on the Internal Ribosome Entry
Site of Cricket Paralysis Virus." J Mol Biol 324(5): 889-902.
Jarvis, W. R. (1995). "Epidemiology of nosocomial fungal infections, with emphasis on
Candida species." Clin Infect Dis 20(6): 1526-1530.
Jennings, M. D. and Pavitt, G. D. (2010). "eIF5 has GDI activity necessary for translational
control by eIF2 phosphorylation." Nature 465(7296): 378-381.
Jiang, H.-Y. and Wek, R. C. (2005). "Phosphorylation of the α-subunit of the eukaryotic
initiation factor-2 (eIF2α) reduces protein synthesis and enhances apoptosis in response
to proteasome inhibition." J Biol Chem 280(14): 14189-14202.
Johannes, G., Carter, M. S., Eisen, M. B., Brown, P. O. and Sarnow, P. (1999). "Identification
of eukaryotic mRNAs that are translated at reduced cap binding complex eIF4F

223
concentrations using a cDNA microarray." Proc Natl Acad Sci U S A 96(23): 13118-
13123.
Joo, J. H., Liao, G., Collins, J. B., Grissom, S. F. and Jetten, A. M. (2007). "Farnesol-Induced
Apoptosis in Human Lung Carcinoma Cells Is Coupled to the Endoplasmic Reticulum
Stress Response." Cancer Res 67(16): 7929-7936.
Jung, W. H., Warn, P., Ragni, E., Popolo, L., Nunn, C. D., et al. (2005). "Deletion of PDE2, the
gene encoding the high-affinity cAMP phosphodiesterase, results in changes of the cell
wall and membrane in Candida albicans." Yeast 22(4): 285-294.
Kadosh, D. and Johnson, A. D. (2001). "Rfg1, a protein related to the Saccharomyces cerevisiae
hypoxic regulator Rox1, controls filamentous growth and virulence in Candida
albicans." Mol cell biol 21(7): 2496-2505.
Kadosh, D. and Johnson, A. D. (2005). "Induction of the Candida albicans filamentous growth
program by relief of transcriptional repression: a genome-wide analysis." Mol Biol Cell
16(6): 2903-2912.
Kapasi, P., Chaudhuri, S., Vyas, K., Baus, D., Komar, A. A., et al. (2007). "L13a blocks 48S
assembly: role of a general initiation factor in mRNA-specific translational control."
Mol Cell 25(1): 113-126.
Kapp, L. D. and Lorsch, J. R. (2004). "GTP-dependent recognition of the methionine moiety on
initiator tRNA by translation factor eIF2." J Mol Biol 335(4): 923-936.
Kapp, L. D. and Lorsch, J. R. (2004). "The molecular mechanics of eukaryotic translation."
Annu Rev Biochem 73: 657-704.
Kebaara, B. W., Langford, M. L., Navarathna, D. H., Dumitru, R., Nickerson, K. W., et al.
(2008). "Candida albicans Tup1 is involved in farnesol-mediated inhibition of
filamentous-growth induction." Eukaryot Cell 7(6): 980-987.
Kedersha, N., Stoecklin, G., Ayodele, M., Yacono, P., Lykke-Andersen, J., et al. (2005). "Stress
granules and processing bodies are dynamically linked sites of mRNP remodeling." J
Cell Biol 169(6): 871-884.
Kedersha, N. L., Gupta, M., Li, W., Miller, I. and Anderson, P. (1999). "RNA-binding proteins
TIA-1 and TIAR link the phosphorylation of eIF-2 alpha to the assembly of mammalian
stress granules." J Cell Biol 147(7): 1431-1442.
Keller, W. and Minvielle-Sebastia, L. (1997). "A comparison of mammalian and yeast pre-
mRNA 3′-end processing." Cur Opin Cell Biol 9(3): 329-336.
Kessler, S. H. and Sachs, A. B. (1998). "RNA recognition motif 2 of yeast Pab1p is required for
its functional interaction with eukaryotic translation initiation factor 4G." Mol Cell Biol
18(1): 51-57.
Khoshnevis, S., Gross, T., Rotte, C., Baierlein, C., Ficner, R., et al. (2010). "The iron-sulphur
protein RNase L inhibitor functions in translation termination." EMBO Rep 11(3): 214-
219.
Kim, J. and Sudbery, P. (2011). "Candida albicans, a major human fungal pathogen." J
Microbiol 49(2): 171-177.
Kim, W. J., Kim, J. H. and Jang, S. K. (2007). "Anti-inflammatory lipid mediator 15d-PGJ2
inhibits translation through inactivation of eIF4A." Embo J 26(24): 5020-5032.
Klengel, T., Liang, W. J., Chaloupka, J., Ruoff, C., Schroppel, K., et al. (2005). "Fungal
adenylyl cyclase integrates CO2 sensing with cAMP signaling and virulence." Curr Biol
15(22): 2021-2026.
Knop, M., Siegers, K., Pereira, G., Zachariae, W., Winsor, B., et al. (1999). "Epitope tagging of
yeast genes using a PCR‐based strategy: more tags and improved practical routines."
Yeast 15(10B): 963-972.
Kolupaeva, V. G., Unbehaun, A., Lomakin, I. B., Hellen, C. U. and Pestova, T. V. (2005).
"Binding of eukaryotic initiation factor 3 to ribosomal 40S subunits and its role in
ribosomal dissociation and anti-association." RNA 11(4): 470-486.
Koonin, E. V. (1995). "multidomain organization of eukaryotic guanine-nucleotide exchange
translation initiation-factor eif-2b subunits revealed by analysis of conserved sequence
motifs." Protein Sci 4(8): 1608-1617.
Korneva, E. A., Barabanova, S. V., Golovko, O. I., Nosov, M. A., Novikova, N. S., et al.
(2000). "C-fos and IL-2 Gene Expression in Rat Brain Cells and Splenic Lymphocytes
after Nonantigenic and Antigenic Stimuli." Ann N Y Acad Sci 917(1): 197-209.

224
Kozak, M. (1991). "Structural features in eukaryotic mRNAs that modulate the initiation of
translation." J Biol Chem 266(30): 19867-19870.
Kozak, M. (2005). "Regulation of translation via mRNA structure in prokaryotes and
eukaryotes." Gene 361: 13-37.
Krishnamoorthy, T., Pavitt, G. D., Zhang, F., Dever, T. E. and Hinnebusch, A. G. (2001). "Tight
binding of the phosphorylated alpha subunit of initiation factor 2 (eIF2alpha) to the
regulatory subunits of guanine nucleotide exchange factor eIF2B is required for
inhibition of translation initiation." Mol Cell Biol 21(15): 5018-5030.
Kron, S. J., Styles, C. A. and Fink, G. R. (1994). "Symmetric cell division in pseudohyphae of
the yeast Saccharomyces cerevisiae." Mol Biol Cell 5(9): 1003-1022.
Kruppa, M. (2009). "Quorum sensing and Candida albicans." Mycoses 52(1): 1-10.
Kruppa, M. and Calderone, R. (2006). "Two-component signal transduction in human fungal
pathogens." FEMS Yeast Res 6(2): 149-159.
Kruppa, M., Krom, B. P., Chauhan, N., Bambach, A. V., Cihlar, R. L., et al. (2004). "The two-
component signal transduction protein Chk1p regulates quorum sensing in Candida
albicans." Eukaryot Cell 3(4): 1062-1065.
Kubota, H., Obata, T., Ota, K., Sasaki, T. and Ito, T. (2003). "Rapamycin-induced translational
derepression of GCN4 mRNA involves a novel mechanism for activation of the eIF2
alpha kinase GCN2." J Biol Chem 278(23): 20457-20460.
Kumamoto, C. A. (2005). "A contact-activated kinase signals Candida albicans invasive growth
and biofilm development." Proc Natl Acad Sci U S A 102(15): 5576-5581.
Kusch, H., Engelmann, S., Bode, R., Albrecht, D., Morschhäuser, J., et al. (2008). "A proteomic
view of Candida albicans yeast cell metabolism in exponential and stationary growth
phases." Int Journ Med Microbiol 298(3–4): 291-318.
Kwon-Chung, K. J. and Bennett, J. E. (1992). "Medical mycology." Revista do Instituto de
Medicina Tropical de São Paulo 34: 504-504.
Lachance, P. E., Miron, M., Raught, B., Sonenberg, N. and Lasko, P. (2002). "Phosphorylation
of eukaryotic translation initiation factor 4E is critical for growth." Mol Cell Biol 22(6):
1656-1663.
Laemmli, U.K. (1970) "Cleavage of structural proteins during the assembly of the head of
bacteriophage T4" nature 227:680-685.
Lamphear, B. J., Kirchweger, R., Skern, T. and Rhoads, R. E. (1995). "Mapping of functional
domains in eukaryotic protein synthesis initiation factor 4G (eIF4G) with picornaviral
proteases. Implications for cap-dependent and cap-independent translational initiation."
J Biol Chem 270(37): 21975-21983.
Langford, M. L., Atkin, A. L. and Nickerson, K. W. (2009). "Cellular interactions of farnesol, a
quorum-sensing molecule produced by Candida albicans." Future Microbiol 4(10):
1353-1362.
Larroy, C., Rosario Fernandez, M., Gonzalez, E., Pares, X. and Biosca, J. A. (2003). "Properties
and functional significance of Saccharomyces cerevisiae ADHVI." Chem Biol Interact
143-144: 229-238.
Latreille, M. and Larose, L. (2006). "Nck in a complex containing the catalytic subunit of
protein phosphatase 1 regulates eukaryotic initiation factor 2alpha signaling and cell
survival to endoplasmic reticulum stress." J Biol Chem 281(36): 26633-26644.
Leberer, E., Harcus, D., Broadbent, I. D., Clark, K. L., Dignard, D., et al. (1996). "Signal
transduction through homologs of the Ste20p and Ste7p protein kinases can trigger
hyphal formation in the pathogenic fungus Candida albicans." Proc Natl Acad Sci
93(23): 13217-13222.
Leberer, E., Harcus, D., Dignard, D., Johnson, L., Ushinsky, S., et al. (2001). "Ras links cellular
morphogenesis to virulence by regulation of the MAP kinase and cAMP signalling
pathways in the pathogenic fungus Candida albicans." Mol Microbiol 42(3): 673-687.
Leberer, E., Ziegelbauer, K., Schmidt, A., Harcus, D., Dignard, D., et al. (1997). "Virulence and
hyphal formation of Candida albicans require the Ste20p-like protein kinase CaCla4p."
Curr Biol 7(8): 539-546.
Lee, C. M., Nantel, A., Jiang, L., Whiteway, M. and Shen, S. H. (2004). "The serine/threonine
protein phosphatase SIT4 modulates yeast-to-hypha morphogenesis and virulence in
Candida albicans." Mol Microbiol 51(3): 691-709.
225
Lee, J. H., Pestova, T. V., Shin, B.-S., Cao, C., Choi, S. K., et al. (2002). "Initiation factor
eIF5B catalyzes second GTP-dependent step in eukaryotic translation initiation." Proc
Nat Acad Sci 99(26): 16689-16694.
Lee, K. H., Jun, S., Hur, H. S., Ryu, J. J. and Kim, J. (2005). "Candida albicans protein analysis
during hyphal differentiation using an integrative HA-tagging method." Biochem
Biophys Res Commun 337(3): 784-790.
Lee, S. B., Melkova, Z., Yan, W., Williams, B. R., Hovanessian, A. G., et al. (1993). "The
interferon-induced double-stranded RNA-activated human p68 protein kinase potently
inhibits protein synthesis in cultured cells." Virol 192(1): 380-385.
LeFebvre, A. K., Korneeva, N. L., Trutschl, M., Cvek, U., Duzan, R. D., et al. (2006).
"Translation initiation factor eIF4G-1 binds to eIF3 through the eIF3e subunit." J Biol
Chem 281(32): 22917-22932.
Lengeler, K. B., Davidson, R. C., D'Souza, C., Harashima, T., Shen, W. C., et al. (2000).
"Signal transduction cascades regulating fungal development and virulence." Microbiol
Mol Biol Rev 64(4): 746-785.
Li, B., Nierras, C. R. and Warner, J. R. (1999). "Transcriptional elements involved in the
repression of ribosomal protein synthesis." Mol Cell Biol 19(8): 5393-5404.
Lindqvist, L., Oberer, M., Reibarkh, M., Cencic, R., Bordeleau, M.-E., et al. (2008). "Selective
pharmacological targeting of a DEAD box RNA helicase." PLoS One 3(2): e1583.
Liu, H. (2001). "Transcriptional control of dimorphism in Candida albicans." Curr Opin
Microbiol 4(6): 728-735.
Liu, H., Kohler, J. and Fink, G. R. (1994). "Suppression of hyphal formation in Candida
albicans by mutation of a STE12 homolog." Science 266(5191): 1723-1726.
Livak, K. J. and Schmittgen, T. D. (2001). "Analysis of relative gene expression data using real-
time quantitative PCR and the 2(-Delta Delta C(T)) Method." Methods 25(4): 402-408.
Lo, H.-J., Köhler, J. R., DiDomenico, B., Loebenberg, D., Cacciapuoti, A., et al. (1997).
"Nonfilamentous C. albicans Mutants Are Avirulent." Cell 90(5): 939-949.
Lo, H. J., Kohler, J. R., DiDomenico, B., Loebenberg, D., Cacciapuoti, A., et al. (1997).
"Nonfilamentous C. albicans mutants are avirulent." Cell 90(5): 939-949.
Lorenz, M. C., Bender, J. A. and Fink, G. R. (2004). "Transcriptional Response of Candida
albicans upon Internalization by Macrophages." Eukaryot Cell 3(5): 1076-1087.
Lorenz, M. C., Cutler, N. S. and Heitman, J. (2000). "Characterization of alcohol-induced
filamentous growth in Saccharomyces cerevisiae." Mol Biol Cell 11(1): 183-199.
Lorenz, W. W., McCann, R. O., Longiaru, M. and Cormier, M. J. (1991). "Isolation and
expression of a cDNA encoding Renilla reniformis luciferase." Proc Natl Acad Sci USA
88(10): 4438-4442.
Low, W.-K., Dang, Y., Schneider-Poetsch, T., Shi, Z., Choi, N. S., et al. (2005). "Inhibition of
Eukaryotic Translation Initiation by the Marine Natural Product Pateamine A." Mol
Cell 20(5): 709-722.
Lu, L., Han, A. P. and Chen, J. J. (2001). "Translation initiation control by heme-regulated
eukaryotic initiation factor 2alpha kinase in erythroid cells under cytoplasmic stresses."
Mol Cell Biol 21(23): 7971-7980.
Lu, L., Han, A. P. and Chen, J. J. (2001). "Translation initiation control by heme-regulated
eukaryotic initiation factor 2alpha kinase in erythroid cells under cytoplasmic stresses."
Mol cell biol 21(23): 7971-7980.
Luthe, D. S. (1983). "A simple technique for the preparation and storage of sucrose gradients."
Anal Biochem 135(1): 230-232.
Machida, K., Tanaka, T., Fujita, K.-i. and Taniguchi, M. (1998). "Farnesol-Induced Generation
of Reactive Oxygen Species via Indirect Inhibition of the Mitochondrial Electron
Transport Chain in the Yeast Saccharomyces cerevisiae." J Bacteriol 180(17): 4460-
4465.
Machida, K., Tanaka, T., Yano, Y., Otani, S. and Taniguchi, M. (1999). "Farnesol-induced
growth inhibition in Saccharomyces cerevisiae by a cell cycle mechanism."
Microbiology 145 ( Pt 2): 293-299.
Madhani, H. D. and Fink, G. R. (1997). "Combinatorial control required for the specificity of
yeast MAPK signaling." Science 275(5304): 1314-1317.
Majumdar, R. and Maitra, U. (2005). "Regulation of GTP hydrolysis prior to ribosomal AUG
selection during eukaryotic translation initiation." EMBO J 24(21): 3737-3746.

226
Marsden, S., Nardelli, M., Linder, P. and McCarthy, J. E. G. (2006). "Unwinding Single RNA
Molecules Using Helicases Involved in Eukaryotic Translation Initiation." J Mol Biol
361(2): 327-335.
Martin, R., Moran, G. P., Jacobsen, I. D., Heyken, A., Domey, J., et al. (2011). "The Candida
albicans-specific gene EED1 encodes a key regulator of hyphal extension." PLoS One
6(4): e18394.
Martinez-Anaya, C., Dickinson, J. R. and Sudbery, P. E. (2003). "In yeast, the pseudohyphal
phenotype induced by isoamyl alcohol results from the operation of the morphogenesis
checkpoint." J Cell Sci 116(Pt 16): 3423-3431.
Martins, M., Henriques, M., Azeredo, J., Rocha, S. M., Coimbra, M. A., et al. (2007).
"Morphogenesis control in Candida albicans and Candida dubliniensis through
signaling molecules produced by planktonic and biofilm cells." Eukaryot Cell 6(12):
2429-2436.
Mascarenhas, C., Edwards-Ingram, L. C., Zeef, L., Shenton, D., Ashe, M. P., et al. (2008).
"Gcn4 is required for the response to peroxide stress in the yeast Saccharomyces
cerevisiae." Mol Biol Cell 19(7): 2995-3007.
Mathews, M., Sonenberg, N. and Hershey, J. W. (2007). Translational control in biology and
medicine, CSHL Press.
Matsuo, H., Li, H., McGuire, A. M., Fletcher, C. M., Gingras, A. C., et al. (1997). "Structure of
translation factor eIF4E bound to m7GDP and interaction with 4E-binding protein." Nat
Struct Biol 4(9): 717-724.
McCarthy, J. E. G. (1998). "Posttranscriptional Control of Gene Expression in Yeast."
Microbiol Mol Biol Rev 62(4): 1492-1553.
Merrick, W. C. (2004). "Cap-dependent and cap-independent translation in eukaryotic systems."
Gene 332(0): 1-11.
Miller, M. B. and Bassler, B. L. (2001). "Quorum sensing in bacteria." Ann Rev Microbiol
55(1): 165-199.
Miller, M. G. and Johnson, A. D. (2002). "White-Opaque Switching in Candida albicans Is
Controlled by Mating-Type Locus Homeodomain Proteins and Allows Efficient
Mating." Cell 110(3): 293-302.
Milne, S. W., Cheetham, J., Lloyd, D., Aves, S. and Bates, S. (2011). "Cassettes for PCR-
mediated gene tagging in Candida albicans utilizing nourseothricin resistance." Yeast
28(12): 833-841.
Miwa, T., Takagi, Y., Shinozaki, M., Yun, C. W., Schell, W. A., et al. (2004). "Gpr1, a putative
G-protein-coupled receptor, regulates morphogenesis and hypha formation in the
pathogenic fungus Candida albicans." Eukaryot Cell 3(4): 919-931.
Mohammad-Qureshi, S. S., Haddad, R., Palmer, K. S., Richardson, J. P., Gomez, E., et al.
(2007). "Purification of FLAG-tagged eukaryotic initiation factor 2B complexes,
subcomplexes, and fragments from Saccharomyces cerevisiae." Methods Enzymol 431:
1-13.
Mohammad-Qureshi, S. S., Haddad, R., Palmer, K. S., Richardson, J. P., Gomez, E., et al.
(2007). "Purification of FLAG-Tagged eukaryotic initiation factor 2B complexes,
subcomplexes, and fragments from Sacchoromyces cerevisiae." Translation Initiation:
Cell Biology, High-Throughput Methods, and Chemical-Based Approaches 431: 1-13.
Monge, R. A., Roman, E., Nombela, C. and Pla, J. (2006). "The MAP kinase signal transduction
network in Candida albicans." Microbiology 152(Pt 4): 905-912.
Mosel, D. D., Dumitru, R., Hornby, J. M., Atkin, A. L. and Nickerson, K. W. (2005). "Farnesol
concentrations required to block germ tube formation in Candida albicans in the
presence and absence of serum." Appl Environ Microbiol 71(8): 4938-4940.
Murad, A. M., d'Enfert, C., Gaillardin, C., Tournu, H., Tekaia, F., et al. (2001). "Transcript
profiling in Candida albicans reveals new cellular functions for the transcriptional
repressors CaTup1, CaMig1 and CaNrg1." Mol Microbiol 42(4): 981-993.
Natarajan, K., Meyer, M. R., Jackson, B. M., Slade, D., Roberts, C., et al. (2001).
"Transcriptional profiling shows that Gcn4p is a master regulator of gene expression
during amino acid starvation in yeast." Mol Cell Biol 21(13): 4347-4368.
Navarro-Garcia, F., Alonso-Monge, R., Rico, H., Pla, J., Sentandreu, R., et al. (1998). "A role
for the MAP kinase gene MKC1 in cell wall construction and morphological
transitions in Candida albicans." Microbiology 144 ( Pt 2): 411-424.

227
Navarro-Garcia, F., Eisman, B., Fiuza, S. M., Nombela, C. and Pla, J. (2005). "The MAP kinase
Mkc1p is activated under different stress conditions in Candida albicans."
Microbiology 151(Pt 8): 2737-2749.
Navarro-Garcia, F., Sanchez, M., Pla, J. and Nombela, C. (1995). "Functional characterization
of the MKC1 gene of Candida albicans, which encodes a mitogen-activated protein
kinase homolog related to cell integrity." Mol cell biol 15(4): 2197-2206.
Nemecek, J. C., Wüthrich, M. and Klein, B. S. (2006). "Global Control of Dimorphism and
Virulence in Fungi." Science 312(5773): 583-588.
Nickerson, K. W., Atkin, A. L. and Hornby, J. M. (2006). "Quorum sensing in dimorphic fungi:
farnesol and beyond." App Environ Microbiol 72(6): 3805-3813.
Nielsen, K. H., Szamecz, B., Valasek, L., Jivotovskaya, A., Shin, B. S., et al. (2004). "Functions
of eIF3 downstream of 48S assembly impact AUG recognition and GCN4 translational
control." EMBO J 23(5): 1166-1177.
Nobile, C. J., Fox, E. P., Nett, J. E., Sorrells, T. R., Mitrovich, Q. M., et al. (2012). "A Recently
Evolved Transcriptional Network Controls Biofilm Development in Candida albicans."
Cell 148(1): 126-138.
Novoa, I., Zhang, Y., Zeng, H., Jungreis, R., Harding, H. P., et al. (2003). "Stress-induced gene
expression requires programmed recovery from translational repression." EMBO J
22(5): 1180-1187.
O'Connor, L., Caplice, N., Coleman, D. C., Sullivan, D. J. and Moran, G. P. (2010).
"Differential filamentation of Candida albicans and Candida dubliniensis is governed
by nutrient regulation of UME6 expression." Eukaryot Cell 9(9): 1383-1397.
Oberer, M., Marintchev, A. and Wagner, G. (2005). "Structural basis for the enhancement of
eIF4A helicase activity by eIF4G." Genes Dev 19(18): 2212-2223.
Odds, F. C. (1988). Candida and Candidosis, Elsevier Science Health Science Division.
Odds, F. C. (1994). "Pathogenesis of Candida infections." J Am Acad Dermatol 31(3, Part 2):
S2-S5.
Ogle, J. M., Brodersen, D. E., Clemons, W. M., Jr., Tarry, M. J., Carter, A. P., et al. (2001).
"Recognition of cognate transfer RNA by the 30S ribosomal subunit." Science
292(5518): 897-902.
Oh, K. B., Miyazawa, H., Naito, T. and Matsuoka, H. (2001). "Purification and characterization
of an autoregulatory substance capable of regulating the morphological transition in
Candida albicans." Proc Natl Acad Sci U S A 98(8): 4664-4668.
Otero, L. J., Ashe, M. P. and Sachs, A. B. (1999). "The yeast poly(A)-binding protein Pab1p
stimulates in vitro poly(A)-dependent and cap-dependent translation by distinct
mechanisms." EMBO J 18(11): 3153-3163.
Palam, L. R., Baird, T. D. and Wek, R. C. (2011). "Phosphorylation of eIF2 facilitates
ribosomal bypass of an inhibitory upstream ORF to enhance CHOP translation." J Biol
Chem 286(13): 10939-10949.
Palmer, L. K., Rannels, S. L., Kimball, S. R., Jefferson, L. S. and Keil, R. L. (2006). "Inhibition
of mammalian translation initiation by volatile anesthetics." Am J Physiol-Endocrinol
Metabol 290(6): E1267-E1275.
Palmer, L. K., Shoemaker, J. L., Baptiste, B. A., Wolfe, D. and Keil, R. L. (2005). "Inhibition of
translation initiation by volatile anesthetics involves nutrient-sensitive GCN-
independent and -dependent processes in yeast." Mol Biol Cell 16(8): 3727-3739.
Pavitt, G. D. (2005). "eIF2B, a mediator of general and gene-specific translational control."
Biochem Soc T 33(Pt 6): 1487-1492.
Pavitt, G. D., Ramaiah, K. V., Kimball, S. R. and Hinnebusch, A. G. (1998). "eIF2
independently binds two distinct eIF2B subcomplexes that catalyze and regulate
guanine-nucleotide exchange." Genes Dev 12(4): 514-526.
Pestova, T. V., Hellen, C. U. and Shatsky, I. N. (1996). "Canonical eukaryotic initiation factors
determine initiation of translation by internal ribosomal entry." Mol cell biol 16(12):
6859-6869.
Pestova, T. V., Lorsch, J. R. and Hellen, C. U. (2007). "4 The Mechanism of Translation
Initiation in Eukaryotes." Cold Spring Harbor Monograph Archive 48: 87-128.
Pestova, T. V., Shatsky, I. N., Fletcher, S. P., Jackson, R. J. and Hellen, C. U. (1998). "A
prokaryotic-like mode of cytoplasmic eukaryotic ribosome binding to the initiation

228
codon during internal translation initiation of hepatitis C and classical swine fever virus
RNAs." Genes Dev 12(1): 67-83.
Pfaller, M. A. and Diekema, D. J. (2007). "Epidemiology of invasive candidiasis: a persistent
public health problem." Clin Microbiol Rev 20(1): 133-163.
Piskur, J., Rozpedowska, E., Polakova, S., Merico, A. and Compagno, C. (2006). "How did
Saccharomyces evolve to become a good brewer?" Trends Genet 22(4): 183-186.
Pittet, D. and Wenzel, R. P. (1995). "Nosocomial bloodstream infections. Secular trends in
rates, mortality, and contribution to total hospital deaths." Arch Intern Med 155(11):
1177-1184.
Pollack, J. H. and Hashimoto, T. (1985). "Ethanol-induced germ tube formation in Candida
albicans." J Gen Microbiol 131(12): 3303-3310.
Preiss, T., Baron-Benhamou, J., Ansorge, W. and Hentze, M. W. (2003). "Homodirectional
changes in transcriptome composition and mRNA translation induced by rapamycin and
heat shock." Nat Struct Biol 10(12): 1039-1047.
Pronk, J. T., Yde Steensma, H. and Van Dijken, J. P. (1996). "Pyruvate Metabolism in
Saccharomyces cerevisiae." Yeast 12(16): 1607-1633.
Proud, C. G. (2005). "The eukaryotic initiation factor 4E-binding proteins and apoptosis." Cell
Death Differ 12(6): 541-546.
Puig, O., Caspary, F., Rigaut, G., Rutz, B., Bouveret, E., et al. (2001). "The tandem affinity
purification (TAP) method: a general procedure of protein complex purification."
Methods-a Companion to Methods in Enzymology 24(3): 218-229.
Qin, X. and Sarnow, P. (2004). "Preferential translation of internal ribosome entry site-
containing mRNAs during the mitotic cycle in mammalian cells." J Biol Chem 279(14):
13721-13728.
Quinlan, A. R. and Hall, I. M. (2010). "BEDTools: a flexible suite of utilities for comparing
genomic features." Bioinformatics 26(6): 841-842.
Ramage, G., Bachmann, S., Patterson, T. F., Wickes, B. L. and Lopez-Ribot, J. L. (2002).
"Investigation of multidrug efflux pumps in relation to fluconazole resistance in
Candida albicans biofilms." J Antimicrob Chemother 49(6): 973-980.
Ramage, G., Saville, S. P., Wickes, B. L. and Lopez-Ribot, J. L. (2002). "Inhibition of Candida
albicans biofilm formation by farnesol, a quorum-sensing molecule." Appl Environ
Microbiology 68(11): 5459-5463.
Ramage, G., VandeWalle, K., Bachmann, S. P., Wickes, B. L. and Lopez-Ribot, J. L. (2002).
"In vitro pharmacodynamic properties of three antifungal agents against preformed
Candida albicans biofilms determined by time-kill studies." Antimicrob Agents Ch
46(11): 3634-3636.
Raudonis, B. M. and Smith, A. G. (1982). "Germination of the chlamydospores of Candida
albicans." Mycopathologia 78(2): 87-91.
Raz, T., Kapranov, P., Lipson, D., Letovsky, S., Milos, P. M., et al. (2011). "Protocol
dependence of sequencing-based gene expression measurements." PLoS One 6(5):
e19287.
Richardson, J. P., Mohammad, S. S. and Pavitt, G. D. (2004). "Mutations causing childhood
ataxia with central nervous system hypomyelination reduce eukaryotic initiation factor
2B complex formation and activity." Mol Cell Biol 24(6): 2352-2363.
Richardson, M. D. (2005). "Changing patterns and trends in systemic fungal infections." J
Antimicrob Ch 56 Suppl 1: i5-i11.
Richter, J. D. and Sonenberg, N. (2005). "Regulation of cap-dependent translation by eIF4E
inhibitory proteins." Nature 433(7025): 477-480.
Richter, J. D. and Sonenberg, N. (2005). "Regulation of cap-dependent translation by eIF4E
inhibitory proteins." Nature 433(7025): 477-480.
Rocha, C. R., Schröppel, K., Harcus, D., Marcil, A., Dignard, D., et al. (2001). "Signaling
through adenylyl cyclase is essential for hyphal growth and virulence in the pathogenic
fungus Candida albicans." Mol Biol Cell 12(11): 3631-3643.
Rocha, R., Pereira, P. J. B., Santos, M. A. S. and Macedo-Ribeiro, S. (2011). "Unveiling the
structural basis for translational ambiguity tolerance in a human fungal pathogen." Proc
Natl Acad Sci 108(34): 14091-14096.
Rodnina, M. V. and Wintermeyer, W. (2001). "Fidelity of aminoacyl-tRNA selection on the
ribosome: kinetic and structural mechanisms." Annu Rev Biochem 70: 415-435.

229
Rolfes, R. J. and Hinnebusch, A. G. (1993). "Translation of the yeast transcriptional activator
GCN4 is stimulated by purine limitation: implications for activation of the protein
kinase GCN2." Mol Cell Biol 13(8): 5099-5111.
Roman, E., Alonso-Monge, R., Gong, Q., Li, D., Calderone, R., et al. (2009). "The Cek1
MAPK is a short-lived protein regulated by quorum sensing in the fungal pathogen
Candida albicans." FEMS Yeast Res 9(6): 942-955.
Ross, I. K., De Bernardis, F., Emerson, G. W., Cassone, A. and Sullivan, P. A. (1990). "The
secreted aspartate proteinase of Candida albicans: physiology of secretion and
virulence of a proteinase-deficient mutant." J Gen Microbiol 136(4): 687-694.
Russell, P. J. (2010) Structure of eukaryotic ribosomes iGenetics 3rd
ed.
Sabie, F. and Gadd, G. (1992). "Effect of nucleosides and nucleotides and the relationship
between cellular adenosine 3′∶ 5′-cyclic monophosphate (cyclic AMP) and germ tube
formation in Candida albicans." Mycopath 119(3): 147-156.
Sachs, A. B. (2000). Physical and functional interactions between the mRNA cap structure and
the poly(A) tail. Translational control of gene expression. N. Sonenberg, J. W. B.
Hershey and M. B. Mathews. Cold Spring Harbor, New York, Cold Spring Harbor
Laboratory Press: 447-465.
Sachs, A. B. and Davis, R. W. (1989). "The poly(A) binding protein is required for poly(A)
shortening and 60S ribosomal subunit-dependent translation initiation." Cell 58(5): 857-
867.
Salgueiro, S. P., Sa-Correia, I. and Novais, J. M. (1988). "Ethanol-Induced Leakage in
Saccharomyces cerevisiae: Kinetics and Relationship to Yeast Ethanol Tolerance and
Alcohol Fermentation Productivity." Appl Environ Microbiol 54(4): 903-909.
Sambrook, J. and Russel, D.W. (2001). Molecular Cloning A Laboratory Manual. Vol. 3. J.
Argentine, editor. Cold Spring Harbour Laboratory Press, New York.
Sasikumar, A. N. and Kinzy, T. G. (2014). "Mutations in the chromodomain-like insertion of
translation elongation factor 3 compromise protein synthesis through reduced ATPase
activity." J Biol Chem 289(8): 4853-4860.
Sato, T., Watanabe, T., Mikami, T. and Matsumoto, T. (2004). "Farnesol, a Morphogenetic
Autoregulatory Substance in the Dimorphic Fungus Candida albicans, Inhibits Hyphae
Growth through Suppression of a Mitogen-Activated Protein Kinase Cascade." Biol
Pharmaceut Bulletin 27(5): 751-752.
Schmid, S. R. and Linder, P. (1991). "Translation Initiation Factor-4a from Saccharomyces-
cerevisiae - Analysis of Residues Conserved in the D-E-a-D Family of RNA Helicases."
Mol Cell Biol 11(7): 3463-3471.
Schmid, S. R. and Linder, P. (1992). "D-E-A-D protein family of putative RNA helicases." Mol
Microbiol 6(3): 283-292.
Schweizer, A., Rupp, S., Taylor, B. N., Rollinghoff, M. and Schroppel, K. (2000). "The
TEA/ATTS transcription factor CaTec1p regulates hyphal development and virulence
in Candida albicans." Mol Microbiol 38(3): 435-445.
Searfoss, A., Dever, T. E. and Wickner, R. (2001). "Linking the 3' poly(A) tail to the subunit
joining step of translation initiation: relations of Pab1p, eukaryotic translation initiation
factor 5b (Fun12p), and Ski2p-Slh1p." Mol Cell Biol 21(15): 4900-4908.
Shchepin, R., Dumitru, R., Nickerson, K. W., Lund, M. and Dussault, P. H. (2005).
"Biologically active fluorescent farnesol analogs." Chem Biol 12(6): 639-641.
Shchepin, R., Hornby, J. M., Burger, E., Niessen, T., Dussault, P., et al. (2003). "Quorum
sensing in Candida albicans: probing farnesol's mode of action with 40 natural and
synthetic farnesol analogs." Chem Biol 10(8): 743-750.
Shenton, D., Smirnova, J. B., Selley, J. N., Carroll, K., Hubbard, S. J., et al. (2006). "Global
translational responses to oxidative stress impact upon multiple levels of protein
synthesis." J Biol Chem 281(39): 29011-29021.
Sheth, U. and Parker, R. (2003). "Decapping and decay of messenger RNA occur in cytoplasmic
processing bodies." Science 300(5620): 805-808.
Shibagaki, Y., Itoh, N., Yamada, H., Nagata, S. and Mizumoto, K. (1992). "mRNA capping
enzyme. Isolation and characterization of the gene encoding mRNA guanylytransferase
subunit from Saccharomyces cerevisiae." J Biol Chem 267(14): 9521-9528.

230
Shine, J. and Dalgarno, L. (1975). "Terminal-sequence analysis of bacterial ribosomal RNA.
Correlation between the 3'-terminal-polypyrimidine sequence of 16-S RNA and
translational specificity of the ribosome." Eur J Biochem 57(1): 221-230.
Shirtliff, M. E., Krom, B. P., Meijering, R. A., Peters, B. M., Zhu, J., et al. (2009). "Farnesol-
induced apoptosis in Candida albicans." Antimicrob Agents Ch 53(6): 2392-2401.
Si, H., Hernday, A. D., Hirakawa, M. P., Johnson, A. D. and Bennett, R. J. (2013). "Candida
albicans white and opaque cells undergo distinct programs of filamentous growth."
PLoS Pathog 9(3): e1003210.
Simpson, C. and Ashe, M. (2012). "Adaptation to stress in yeast: to translate or not?" Biochem
Soc T 40(4): 794.
Slobin, L. I. and Moller, W. (1978). "Purification and properties of an elongation factor
functionally analogous to bacterial elongation factor Ts from embryos of Artemia
salina." Eur J Biochem 84(1): 69-77.
Slutsky, B., Staebell, M., Anderson, J., Risen, L., Pfaller, M., et al. (1987). "" White-opaque
transition": a second high-frequency switching system in Candida albicans." J Bacteriol
169(1): 189-197.
Smirnova, J. B., Selley, J. N., Sanchez-Cabo, F., Carroll, K., Eddy, A. A., et al. (2005). "Global
gene expression profiling reveals widespread yet distinctive translational responses to
different eukaryotic translation initiation factor 2B-targeting stress pathways." Mol Cell
Biol 25(21): 9340-9349.
Sohn, K., Urban, C., Brunner, H. and Rupp, S. (2003). "EFG1 is a major regulator of cell wall
dynamics in Candida albicans as revealed by DNA microarrays." Mol Microbiol 47(1):
89-102.
Sonneborn, A., Bockmuhl, D. P., Gerads, M., Kurpanek, K., Sanglard, D., et al. (2000). "Protein
kinase A encoded by TPK2 regulates dimorphism of Candida albicans." Mol Microbiol
35(2): 386-396.
Sprecher, E. and Hanssen, H.-P. (1983). "Distribution and strain-dependent formation of volatile
metabolites in the genus Ceratocystis." Antonie van Leeuwenhoek 49(4-5): 493-499.
Srikantha, T., Klapach, A., Lorenz, W. W., Tsai, L. K., Laughlin, L. A., et al. (1996). "The sea
pansy Renilla reniformis luciferase serves as a sensitive bioluminescent reporter for
differential gene expression in Candida albicans." J Bacteriol 178(1): 121-129.
Staab, J. F. and Sundstrom, P. (2003). "URA3 as a selectable marker for disruption and
virulence assessment of Candida albicans genes." Trends Microbiol 11(2): 69-73.
Staib, P. and Morschhäuser, J. (2007). "Chlamydospore formation in Candida albicans and
Candida dubliniensis– an enigmatic developmental programme." Mycoses 50(1): 1-12.
Sudbery, P., Gow, N. and Berman, J. (2004). "The distinct morphogenic states of Candida
albicans." Trends Microbiol 12(7): 317-324.
Sudbery, P. E. (2011). "Growth of Candida albicans hyphae." Nat Rev Microbiol 9(10): 737-
748.
Sundaram, A. and Grant, C. M. (2014). "Oxidant-specific regulation of protein synthesis in
Candida albicans." Fung Genet Biol 67: 15-23.
Sundaram, A. and Grant, C. M. (2014). "A single inhibitory upstream open reading frame
(uORF) is sufficient to regulate Candida albicans GCN4 translation in response to
amino acid starvation conditions." RNA.
Sundaram, A. and Grant, C. M. (2014). "A single inhibitory upstream open reading frame
(uORF) is sufficient to regulate Candida albicans GCN4 translation in response to
amino acid starvation conditions." RNA 20(4): 559-567.
Tanner, N. K., Cordin, O., Banroques, J., Doère, M. and Linder, P. (2003). "The Q Motif: A
Newly Identified Motif in DEAD Box Helicases May Regulate ATP Binding and
Hydrolysis." Mol Cell 11(1): 127-138.
Tarun, S. Z., Jr. and Sachs, A. B. (1995). "A common function for mRNA 5' and 3' ends in
translation initiation in yeast." Genes Dev 9(23): 2997-3007.
Tarun, S. Z., Jr. and Sachs, A. B. (1996). "Association of the yeast poly(A) tail binding protein
with translation initiation factor eIF-4G." Embo J 15(24): 7168-7177.
Taylor, D. J., Nilsson, J., Merrill, A. R., Andersen, G. R., Nissen, P., et al. (2007). "Structures
of modified eEF2· 80S ribosome complexes reveal the role of GTP hydrolysis in
translocation." EMBO J 26(9): 2421-2431.

231
Taylor, E. J., Campbell, S. G., Griffiths, C. D., Reid, P. J., Slaven, J. W., et al. (2010). "Fusel
alcohols regulate translation initiation by inhibiting eIF2B to reduce ternary complex in
a mechanism that may involve altering the integrity and dynamics of the eIF2B body."
Mol Biol Cell 21(13): 2202-2216.
Tournu, H., Tripathi, G., Bertram, G., Macaskill, S., Mavor, A., et al. (2005). "Global role of the
protein kinase Gcn2 in the human pathogen Candida albicans." Eukaryot Cell 4(10):
1687-1696.
Tripathi, G., Wiltshire, C., Macaskill, S., Tournu, H., Budge, S., et al. (2002). "Gcn4 co-
ordinates morphogenetic and metabolic responses to amino acid starvation in Candida
albicans." Embo J 21(20): 5448-5456.
Tsukamoto, T., Shibagaki, Y., Imajoh-Ohmi, S., Murakoshi, T., Suzuki, M., et al. (1997).
"Isolation and characterization of the yeast mRNA capping enzyme beta subunit gene
encoding RNA 5'-triphosphatase, which is essential for cell viability." Biochem
Biophys Res Commun 239(1): 116-122.
Uppuluri, P., Mekala, S. and Chaffin, W. L. (2007). "Farnesol-mediated inhibition of Candida
albicans yeast growth and rescue by a diacylglycerol analogue." Yeast 24(8): 681-693.
Valasek, L., Mathew, A. A., Shin, B. S., Nielsen, K. H., Szamecz, B., et al. (2003). "The yeast
eIF3 subunits TIF32/a, NIP1/c, and eIF5 make critical connections with the 40S
ribosome in vivo." Genes Dev 17(6): 786-799.
van den Elzen, A. M., Schuller, A., Green, R. and Seraphin, B. (2014). "Dom34-Hbs1 mediated
dissociation of inactive 80S ribosomes promotes restart of translation after stress."
EMBO J 33(3): 265-276.
van der Knaap, M. S., Leegwater, P. A., Konst, A. A., Visser, A., Naidu, S., et al. (2002).
"Mutations in each of the five subunits of translation initiation factor eIF2B can cause
leukoencephalopathy with vanishing white matter." Ann Neurol 51(2): 264-270.
Vattem, K. M. and Wek, R. C. (2004). "Reinitiation involving upstream ORFs regulates ATF4
mRNA translation in mammalian cells." Proc Natl Acad Sci U S A 101(31): 11269-
11274.
von der Haar, T. and McCarthy, J. E. (2002). "Intracellular translation initiation factor levels in
Saccharomyces cerevisiae and their role in cap-complex function." Mol Microbiol
46(2): 531-544.
Wang, X., Paulin, F. E., Campbell, L. E., Gomez, E., O'Brien, K., et al. (2001). "Eukaryotic
initiation factor 2B: identification of multiple phosphorylation sites in the epsilon-
subunit and their functions in vivo." Embo J 20(16): 4349-4359.
Wang, X. L., Cai, H. P., Ge, J. H. and Su, X. F. (2012). "Detection of eukaryotic translation
initiation factor 4E and its clinical significance in hepatocellular carcinoma." World J
Gastroenterol 18(20): 2540-2544.
Wang, Z., Gerstein, M. and Snyder, M. (2009). "RNA-Seq: a revolutionary tool for
transcriptomics." Nat Rev Genet 10(1): 57-63.
Webb, A. D. and Ingraham, J. L. (1963). "Fusel oil." Adv. Appl. Microbiol 5: 317-353.
Wek, R. C., Cannon, J. F., Dever, T. E. and Hinnebusch, A. G. (1992). "Truncated protein
phosphatase GLC7 restores translational activation of GCN4 expression in yeast
mutants defective for the eIF-2 alpha kinase GCN2." Mol Cell Biol 12(12): 5700-5710.
Wek, R. C., Jiang, H. Y. and Anthony, T. G. (2006). "Coping with stress: eIF2 kinases and
translational control." Biochem Soc T 34(Pt 1): 7-11.
Wek, S. A., Zhu, S. and Wek, R. C. (1995). "The histidyl-tRNA synthetase-related sequence in
the eIF-2 alpha protein kinase GCN2 interacts with tRNA and is required for activation
in response to starvation for different amino acids." Mol cell biol 15(8): 4497-4506.
Wells, S. E., Hillner, P. E., Vale, R. D. and Sachs, A. B. (1998). "Circularization of mRNA by
Eukaryotic Translation Initiation Factors." Mol Cell 2(1): 135-140.
Wells, S. E., Hillner, P. E., Vale, R. D. and Sachs, A. B. (1998). "Circularization of mRNA by
eukaryotic translation initiation factors." Mol Cell 2(1): 135-140.
Welsh, G. I., Miller, C. M., Loughlin, A. J., Price, N. T. and Proud, C. G. (1998). "Regulation of
eukaryotic initiation factor eIF2B: glycogen synthase kinase-3 phosphorylates a
conserved serine which undergoes dephosphorylation in response to insulin." FEBS
Letters 421(2): 125-130.
Westermann, A. J., Gorski, S. A. and Vogel, J. (2012). "Dual RNA-seq of pathogen and host."
Nat Rev Microbiol 10(9): 618-630.

232
Westwater, C., Balish, E. and Schofield, D. A. (2005). "Candida albicans-conditioned medium
protects yeast cells from oxidative stress: a possible link between quorum sensing and
oxidative stress resistance." Eukaryot Cell 4(10): 1654-1661.
Whiteway, M. (2000). "Transcriptional control of cell type and morphogenesis in Candida
albicans." Curr Opin Microbiol 3(6): 582-588.
Williams, D. D., Pavitt, G. D. and Proud, C. G. (2001). "Characterization of the initiation factor
eIF2B and its regulation in Drosophila melanogaster." J Biol Chem 276(6): 3733-3742.
Wilson, R. B., Davis, D., Enloe, B. M. and Mitchell, A. P. (2000). "A recyclable Candida
albicans URA3 cassette for PCR product-directed gene disruptions." Yeast 16(1): 65-
70.
Wilson, R. B., Davis, D. and Mitchell, A. P. (1999). "Rapid Hypothesis Testing with Candida
albicans through Gene Disruption with Short Homology Regions." J Bacteriol 181(6):
1868-1874.
Wurdinger, T., Badr, C., Pike, L., de Kleine, R., Weissleder, R., et al. (2008). "A secreted
luciferase for ex-vivo monitoring of in vivo processes." Nat Methods 5(2): 171-173.
Xiang, H., Zhu, J., Chen, Q., Dai, F., Li, X., et al. (2010). "Single base-resolution methylome of
the silkworm reveals a sparse epigenomic map." Nat Biotech 28(5): 516-520.
Yamasaki, S. and Anderson, P. (2008). "Reprogramming mRNA translation during stress." Curr
Opin Cell Biol 20(2): 222-226.
Yoon, H. J. and Donahue, T. F. (1992). "The suil suppressor locus in Saccharomyces cerevisiae
encodes a translation factor that functions during tRNA(iMet) recognition of the start
codon." Mol cell biol 12(1): 248-260.
Zakikhany, K., Naglik, J. R., Schmidt‐Westhausen, A., Holland, G., Schaller, M., et al. (2007).
"In vivo transcript profiling of Candida albicans identifies a gene essential for
interepithelial dissemination." Cell microbiol 9(12): 2938-2954.
Zeuthen, M. L., Dabrowa, N., Aniebo, C. M. and Howard, D. H. (1988). "Ethanol tolerance and
the induction of stress proteins by ethanol in Candida albicans." J Gen Microbiol
134(5): 1375-1384.
Zhao, X., Mehrabi, R. and Xu, J.-R. (2007). "Mitogen-activated protein kinase pathways and
fungal pathogenesis." Eukaryot Cell 6(10): 1701-1714.
Zheng, X., Wang, Y. and Wang, Y. (2004). "Hgc1, a novel hypha‐specific G1 cyclin‐related
protein regulates Candida albicans hyphal morphogenesis." EMBO J 23(8): 1845-1856.
Zhu, J., Krom, B. P., Sanglard, D., Intapa, C., Dawson, C. C., et al. (2011). "Farnesol-induced
apoptosis in Candida albicans is mediated by Cdr1-p extrusion and depletion of
intracellular glutathione." PLoS One 6(12): e28830.

233
9. Appendix
Transcriptionally up regulated genes
GO-Slim term Cluster
frequency Genes annotated to the term
response to
stress
34 out of 312 genes, 10.9%
APR1, C1_02390W_A, C1_06600W_A, C1_07980C_A, C2
_10470C_A, C3_02290W_A, C3_04810C_A, C4_00390W_
A,C4_01720C_A, C4_07010C_A, C5_02110W_A, C5_0506
0C_A, CHT2, EAF7, EFG1, HMS1, HSP104, HSP12, HSP
21, HSP78,MAL2, MDJ1, MEP2, PGA14, PGA4, PRX1, R
PB4, SOD4, SOD5, SPT6, TIF34, TUP1, VID27, VRP1
response to
chemical
31 out of 312 genes, 9.9%
ACH1, C1_14190C_A, C5_02110W_A, C5_02480W_A, C6
_01400W_A, C7_00250C_A, CCS1, COQ5, EFG1, GAR1,
HMS1,HSP104, HSP21, LAC1, LEU4, MDG1, MEP2, ME
T4, NAG6, PGA14, PGA31, PGA4, PGA62, PRX1, RCA1, SOD4, SOD5,SPT6, TIF34, TUP1, VID27
filamentous
growth
27 out of 312
genes, 8.7%
AAF1, C1_05980W_A, C1_14190C_A, C3_02290W_A, C3
_06700C_A, C7_00120W_A, CDC11, CHT2, EFG1, HMS
1, HSP21,LAC1, LPD1, MAL2, MEP2, MNT2, PDA1, PG
A13, PGA59, RCA1, RPB4, SLR1, SPT6, SUN41, TUP1, V
ID27, VRP1
generation of
precursor
metabolites and
energy
22 out of 312
genes, 7.1%
ACO1, ACO2, C1_14190C_A, C2_07190C_A, C3_06700C
_A, C5_05230C_A, C6_00920W_A, CIT1, COQ5, CYT1, ETR1, FUM12,IDH2, KGD1, KGD2, MAM33, MDH1-
1, MRPS9, PDA1, QCR9, RIP1, SDH12
RNA metabolic
process
21 out of 312
genes, 6.7%
C2_09040W_A, C2_10560C_A, C3_00130C_A, C3_00730
W_A, C3_05150W_A, C4_00390W_A, C5_02480W_A, C7
_00070C_A,C7_00250C_A, C7_04290W_A, CR_01120C_
A, CR_10820W_A, DTD2, GAR1, HTS1, MSF1, NPL3, R
PB4, RPS24, SPL1, SPT6
cellular
respiration
20 out of 312
genes, 6.4%
ACO1, ACO2, C2_07190C_A, C3_06700C_A, C5_05230C
_A, C6_00920W_A, CIT1, COQ5, CYT1, ETR1, FUM12, IDH2, KGD1,KGD2, MAM33, MDH1-
1, MRPS9, QCR9, RIP1, SDH12
translation
20 out of 312 genes, 6.4%
C1_13060C_A, C2_07190C_A, C3_00450C_A, C3_04810C
_A, C4_03410W_A, C5_00030W_A, C5_00130C_A, CIC1,
HTS1,IMG2, MRPS9, MSF1, NPL3, RPL13, RPS19A, RP
S24, TIF34, TIF35, TUF1, YML6
pathogenesis
18 out of 312
genes, 5.8%
BGL2, CDC11, CRG1, EFG1, HET1, HMS1, HSP104, HS
P21, MNT2, NAG6, NCE102, RHD3, SAM37, SAP3, SLR
1, SOD5,SUN41, TUP1
carbohydrate
metabolic
process
17 out of 312
genes, 5.4%
BGL2, C1_14190C_A, C2_10200W_A, C6_04340W_A, C7
_00150W_A, CHT2, CIT1, HSP104, HSP21, INO4, MAL2
, MDH1-1,MNN11, MNT2, PDA1, PGA4, SRB1
cellular protein
modification
process
17 out of 312
genes, 5.4%
C1_14460W_A, C2_10200W_A, C4_01720C_A, C5_03640
W_A, C5_03700C_A, C5_05060C_A, C6_04340W_A, C7_
00070C_A,CR_01120C_A, EAF7, KNS1, MNN11, MNT2,
PTC7, PTP2, SRB1, TEP1
response to
drug
16 out of 312 genes, 5.1%
C1_14190C_A, C5_02480W_A, C6_01400W_A, C7_00250
C_A, COQ5, EFG1, GAR1, LAC1, LEU4, NAG6, PGA31,
PGA4,PGA62, TIF34, TUP1, VID27

234
cell
cycle
15 out of 312
genes, 4.8%
C1_00090W_A, C1_06600W_A, C1_07980C_A, C1_13290
W_A, C1_14190C_A, C2_10670W_A, C5_02110W_A, CD
C11, HSP12,PGA4, SEC13, SPT6, SUN41, TEP1, VRP1
cell wall
organization
14 out of 312 genes, 4.5%
BGL2, C1_00090W_A, C1_13290W_A, HWP1, MNT2, PGA13, PGA31, PGA4, PGA59, PGA62, RCA1, RHD3, SU
N41, TEP1
protein
catabolic
process
13 out of 312
genes, 4.2%
APR1, C1_14460W_A, C2_09930W_A, C2_10670W_A, C
4_01720C_A, C5_03570W_A, CIC1, CR_05800C_A, DDI1
, MDJ1,PRE5, SAP3, SEC13
interspecies
interaction
between
organisms
13 out of 312
genes, 4.2%
AAF1, ACO1, BGL2, C6_00920W_A, CYB2, EFG1, HWP
1, MNT2, SAP3, SOD4, SOD5, SUN41, TUP1
cellular
homeostasis
13 out of 312
genes, 4.2%
C1_00100C_A, C1_14190C_A, C2_10560C_A, C4_05890
W_A, C7_04010W_A, CCS1, CRG1, LAC1, LPD1, PDI1,
PRX1, SPL1,TEP1
DNA metabolic
process
12 out of 312
genes, 3.8%
C1_02390W_A, C1_07980C_A, C3_04810C_A, C4_00390
W_A, C4_01720C_A, C4_07010C_A, C5_00150C_A, C7_0
2420C_A,EAF7, RCA1, SPT6, TUP1
biofilm
formation
8 out of 312 genes, 2.6%
BGL2, C3_06700C_A, EFG1, HSP104, HWP1, MET4, MNT2, SUN41
Transcriptionally down regulated genes
response to
stress
53 out of 338
genes, 15.7%
ADAEC, APN2, BRG1, C1_02700C_A, C1_03870C_A, C
1_06040W_A, C1_11910W_A, C3_05010C_A, C3_07670
W_A, CCW14,CDR1, CDR2, CHK1, CR_01790C_A, CR
_03440W_A, CR_03590C_A, CSC25, CYR1, FET33, FG
R24, FGR46, GCR3, GCS1,GLN1, GPH1, GPR1, GPX2,
HGT1, HGT4, LIG4, MEC3, MEP1, NUP188, OSM2, PCD1, PCL1, PDS5, PHO112, PTC8, RAD32,RAD50, RH
B1, SIR2, SRR1, SSU1, SSU81, TAC1, TEC1, VPS15, VP
S52, WH11, WSC1, ZCF20
response to
chemical
49 out of 338
genes, 14.5%
AGO1, APN2, BMS1, C1_00830W_A, C2_02570W_A, C
2_06040C_A, C4_01090C_A, C4_03700W_A, C5_04610
W_A,C6_03050C_A, C7_01430C_A, CDR1, CDR2, CDR
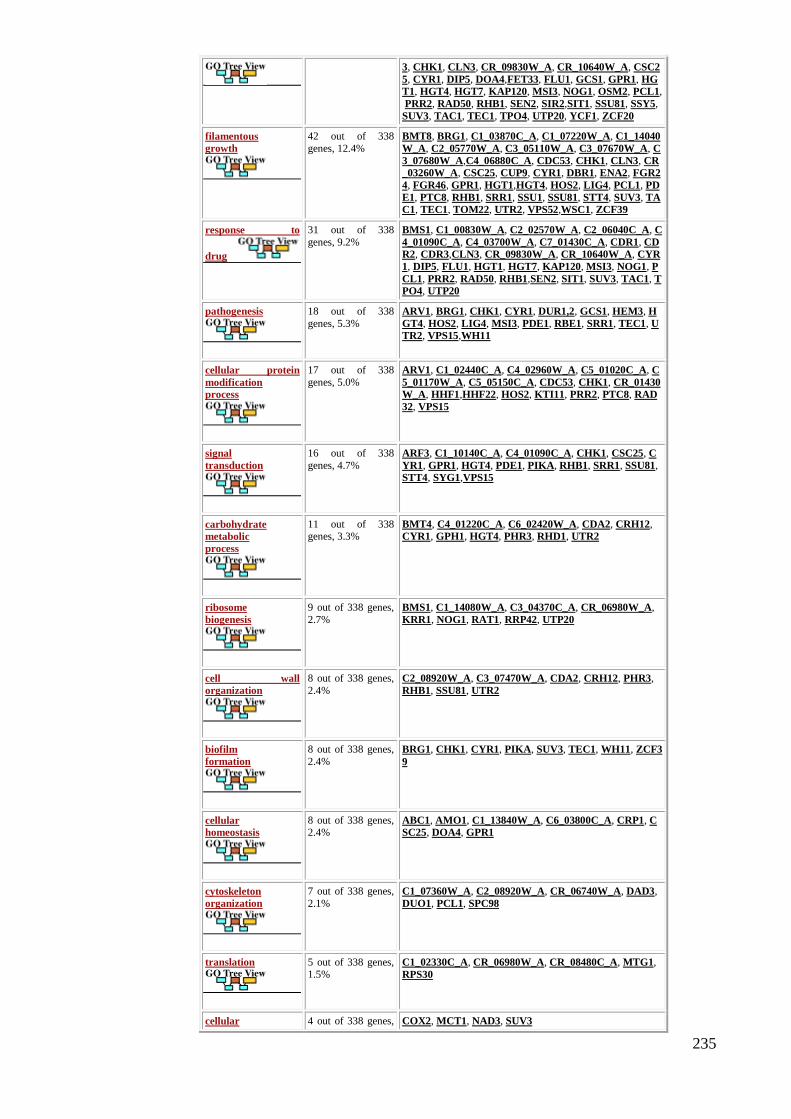
235
3, CHK1, CLN3, CR_09830W_A, CR_10640W_A, CSC2
5, CYR1, DIP5, DOA4,FET33, FLU1, GCS1, GPR1, HG
T1, HGT4, HGT7, KAP120, MSI3, NOG1, OSM2, PCL1,
PRR2, RAD50, RHB1, SEN2, SIR2,SIT1, SSU81, SSY5,
SUV3, TAC1, TEC1, TPO4, UTP20, YCF1, ZCF20
filamentous
growth
42 out of 338
genes, 12.4%
BMT8, BRG1, C1_03870C_A, C1_07220W_A, C1_14040
W_A, C2_05770W_A, C3_05110W_A, C3_07670W_A, C
3_07680W_A,C4_06880C_A, CDC53, CHK1, CLN3, CR
_03260W_A, CSC25, CUP9, CYR1, DBR1, ENA2, FGR2
4, FGR46, GPR1, HGT1,HGT4, HOS2, LIG4, PCL1, PD
E1, PTC8, RHB1, SRR1, SSU1, SSU81, STT4, SUV3, TA
C1, TEC1, TOM22, UTR2, VPS52,WSC1, ZCF39
response to
drug
31 out of 338
genes, 9.2%
BMS1, C1_00830W_A, C2_02570W_A, C2_06040C_A, C
4_01090C_A, C4_03700W_A, C7_01430C_A, CDR1, CD
R2, CDR3,CLN3, CR_09830W_A, CR_10640W_A, CYR
1, DIP5, FLU1, HGT1, HGT7, KAP120, MSI3, NOG1, P
CL1, PRR2, RAD50, RHB1,SEN2, SIT1, SUV3, TAC1, TPO4, UTP20
pathogenesis 18 out of 338
genes, 5.3%
ARV1, BRG1, CHK1, CYR1, DUR1,2, GCS1, HEM3, H
GT4, HOS2, LIG4, MSI3, PDE1, RBE1, SRR1, TEC1, UTR2, VPS15,WH11
cellular protein
modification
process
17 out of 338
genes, 5.0%
ARV1, C1_02440C_A, C4_02960W_A, C5_01020C_A, C
5_01170W_A, C5_05150C_A, CDC53, CHK1, CR_01430
W_A, HHF1,HHF22, HOS2, KTI11, PRR2, PTC8, RAD
32, VPS15
signal
transduction
16 out of 338
genes, 4.7%
ARF3, C1_10140C_A, C4_01090C_A, CHK1, CSC25, C
YR1, GPR1, HGT4, PDE1, PIKA, RHB1, SRR1, SSU81, STT4, SYG1,VPS15
carbohydrate
metabolic
process
11 out of 338 genes, 3.3%
BMT4, C4_01220C_A, C6_02420W_A, CDA2, CRH12, CYR1, GPH1, HGT4, PHR3, RHD1, UTR2
ribosome
biogenesis
9 out of 338 genes,
2.7%
BMS1, C1_14080W_A, C3_04370C_A, CR_06980W_A,
KRR1, NOG1, RAT1, RRP42, UTP20
cell wall
organization
8 out of 338 genes,
2.4%
C2_08920W_A, C3_07470W_A, CDA2, CRH12, PHR3,
RHB1, SSU81, UTR2
biofilm
formation
8 out of 338 genes,
2.4%
BRG1, CHK1, CYR1, PIKA, SUV3, TEC1, WH11, ZCF3
9
cellular
homeostasis 8 out of 338 genes, 2.4%
ABC1, AMO1, C1_13840W_A, C6_03800C_A, CRP1, CSC25, DOA4, GPR1
cytoskeleton
organization
7 out of 338 genes,
2.1%
C1_07360W_A, C2_08920W_A, CR_06740W_A, DAD3,
DUO1, PCL1, SPC98
translation 5 out of 338 genes, 1.5%
C1_02330C_A, CR_06980W_A, CR_08480C_A, MTG1,
RPS30
cellular 4 out of 338 genes, COX2, MCT1, NAD3, SUV3
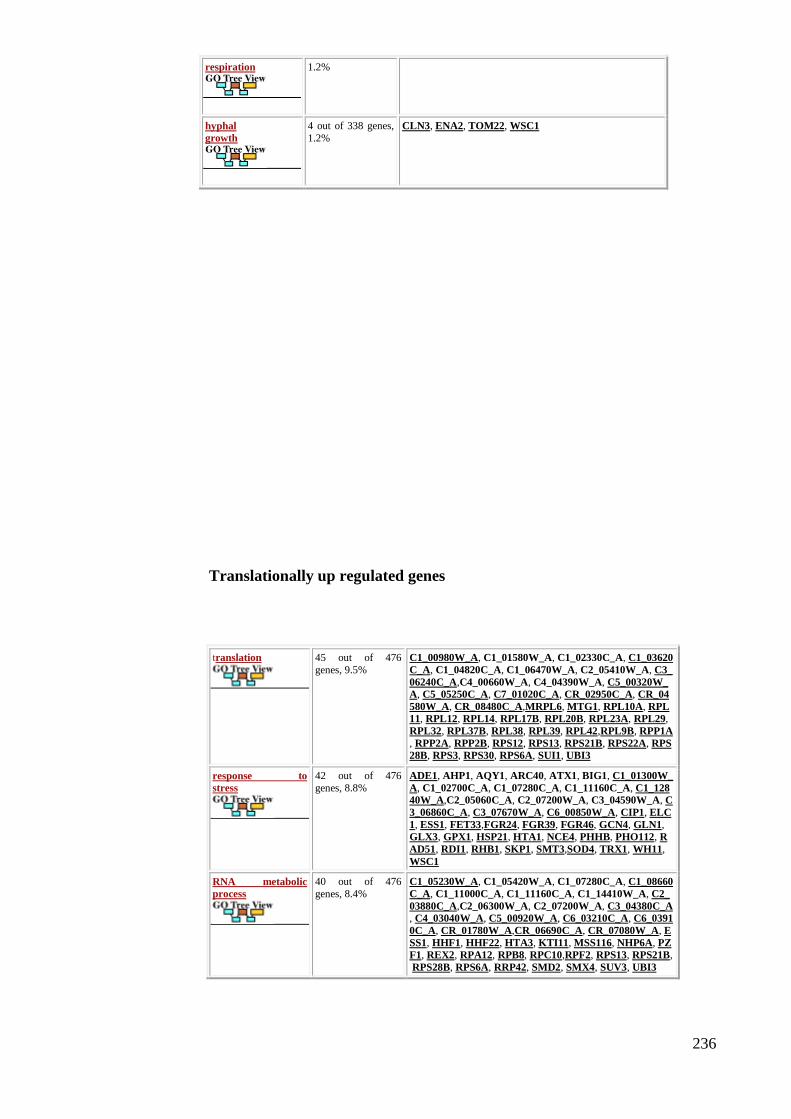
236
respiration 1.2%
hyphal
growth
4 out of 338 genes,
1.2%
CLN3, ENA2, TOM22, WSC1
Translationally up regulated genes
translation 45 out of 476
genes, 9.5%
C1_00980W_A, C1_01580W_A, C1_02330C_A, C1_03620
C_A, C1_04820C_A, C1_06470W_A, C2_05410W_A, C3_
06240C_A,C4_00660W_A, C4_04390W_A, C5_00320W_
A, C5_05250C_A, C7_01020C_A, CR_02950C_A, CR_04
580W_A, CR_08480C_A,MRPL6, MTG1, RPL10A, RPL
11, RPL12, RPL14, RPL17B, RPL20B, RPL23A, RPL29,
RPL32, RPL37B, RPL38, RPL39, RPL42,RPL9B, RPP1A
, RPP2A, RPP2B, RPS12, RPS13, RPS21B, RPS22A, RPS
28B, RPS3, RPS30, RPS6A, SUI1, UBI3
response to
stress
42 out of 476
genes, 8.8%
ADE1, AHP1, AQY1, ARC40, ATX1, BIG1, C1_01300W_
A, C1_02700C_A, C1_07280C_A, C1_11160C_A, C1_128
40W_A,C2_05060C_A, C2_07200W_A, C3_04590W_A, C
3_06860C_A, C3_07670W_A, C6_00850W_A, CIP1, ELC
1, ESS1, FET33,FGR24, FGR39, FGR46, GCN4, GLN1,
GLX3, GPX1, HSP21, HTA1, NCE4, PHHB, PHO112, R
AD51, RDI1, RHB1, SKP1, SMT3,SOD4, TRX1, WH11,
WSC1
RNA metabolic
process
40 out of 476
genes, 8.4%
C1_05230W_A, C1_05420W_A, C1_07280C_A, C1_08660
C_A, C1_11000C_A, C1_11160C_A, C1_14410W_A, C2_
03880C_A,C2_06300W_A, C2_07200W_A, C3_04380C_A
, C4_03040W_A, C5_00920W_A, C6_03210C_A, C6_0391
0C_A, CR_01780W_A,CR_06690C_A, CR_07080W_A, E
SS1, HHF1, HHF22, HTA3, KTI11, MSS116, NHP6A, PZ
F1, REX2, RPA12, RPB8, RPC10,RPF2, RPS13, RPS21B,
RPS28B, RPS6A, RRP42, SMD2, SMX4, SUV3, UBI3

237
response to
chemical
38 out of 476
genes, 8%
ADE1, ADO1, AHP1, ATX1, C1_00830W_A, C1_01300W
_A, C1_11000C_A, C1_11160C_A, C2_05060C_A, C3_06
860C_A,C6_00850W_A, C7_02080W_A, CIP1, CR_00430
C_A, CUP5, ERG11, FET33, FLU1, GCN4, GLX3, HGT7
, HSP21, PGA23,PRS1, RBP1, RHB1, RLP24, RPB8, RPF
2, RPL17B, SIT1, SKP1, SOD4, SST2, SUV3, TIP1, TRX1
, YCF1
cellular protein
modification
process
31 out of 476 genes, 6.5%
ANP1, ARV1, C1_03600W_A, C1_07280C_A, C1_08690
W_A, C1_09480W_A, C1_11160C_A, C3_03310C_A, C3_
06410C_A,C5_01020C_A, C5_01440C_A, C6_00270W_A,
CR_01430W_A, CYP1, ELC1, ESS1, GPI8, HHF1, HHF
22, HRT1, HTA1, KTI11,LTP1, OST1, RUB1, SKP1, SM
T3, TRX1, UBI3, VRG4, WBP1
filamentous
growth
26 out of 476
genes, 5.5%
ABG1, ARC40, BIG1, C1_11160C_A, C3_07670W_A, C4
_06880C_A, CUP5, DFG10, ESS1, FGR24, FGR39, FGR4
6, GCN4,HSP21, PHHB, RAD51, RDI1, RHB1, RHO2, S
MT3, SUV3, TOM22, TRX1, UTR2, VRG4, WSC1
cell
cycle
23 out of 476
genes, 4.8%
ABG1, AQY1, ARC40, C1_04690C_A, C1_08690W_A, C
2_01440C_A, C2_08160C_A, C3_07130W_A, C5_00920W
_A, CYP1,ESS1, FET33, HHF1, HHF22, HRT1, MLC1, NCE4, PHHB, RAD51, RHB1, SKP1, SMT3, WBP1
response to
drug
18 out of 476
genes, 3.8%
ADO1, C1_00830W_A, C1_11000C_A, ERG11, FLU1, H
GT7, PGA23, PRS1, RBP1, RHB1, RLP24, RPB8, RPF2, RPL17B, SIT1,SKP1, SUV3, TIP1
carbohydrate
metabolic
process
16 out of 476
genes, 3.4%
ANP1, BGL2, BIG1, C1_03600W_A, C2_04340C_A, C3_0
6410C_A, C3_06860C_A, C6_02420W_A, HSP21, MDH1,
MDH1-3,OST1, PMM1, UTR2, VRG4, WBP1
DNA metabolic
process 16 out of 476 genes, 3.4%
C1_02310C_A, C1_04690C_A, C1_07280C_A, C2_07200
W_A, C3_04590W_A, C4_06880C_A, C7_03650W_A, EL
C1, HHF1,HHF22, HTA1, HTA3, NCE4, RAD51, SMT3,
SUV3
protein
folding
15 out of 476
genes, 3.2%
C1_14090W_A, C4_05860W_A, C4_06160W_A, C5_0434
0W_A, C7_02470C_A, CPR3, CR_02380C_A, CYP1, ESS
1, HCH1,PHB2, PHO86, RBP1, TRX1, YKE2
cellular
respiration 14 out of 476 genes, 2.9%
C1_06050C_A, C1_08690W_A, C1_11880W_A, COX2, COX5, COX6, MDH1, NAD3, NAD4, NAD5, NAD6, PET10
0, QCR8, SUV3
cellular
homeostasis
12 out of 476
genes, 2.5%
AHP1, AMO1, ATX1, C1_01300W_A, C1_10750C_A, C5
_04340W_A, C7_02080W_A, CRD2, CR_10280W_A, CU
P5, SKP1,TRX1
signal
transduction
11 out of 476
genes, 2.3%
ARF3, C3_07130W_A, C4_02720C_A, HTA1, RBP1, RDI
1, RHB1, RHO2, SAR1, SST2, YPT7
protein catabolic
process
10 out of 476
genes, 2.1%
C1_01300W_A, C4_02470C_A, C4_06880C_A, ELC1, HR
T1, PRE10, PRE3, PUP3, SCL1, SKP1
cell wall
organization
8 out of 476 genes,
1.7%
ABG1, BGL2, C3_07470W_A, PHHB, PRS1, RHB1, RH
O2, UTR2

238
hyphal
growth
7 out of 476 genes,
1.5%
ABG1, RDI1, RHO2, SMT3, TOM22, VRG4, WSC1
biofilm
formation 7 out of 476 genes, 1.5%
ADH5, AQY1, BGL2, GCN4, SUV3, TRY3, WH11
Translationally down regulated genes
GO-Slim term Cluster
frequency Genes annotated to the term
response to
stress
83 out of 476
genes, 17.4%
ARP4, ATG9, BNA4, BNI4, C1_02390W_A, C1_0798
0C_A, C2_06530W_A, C2_08630C_A, C2_10850C_A,
C3_00570C_A,C3_05970C_A, C3_06630W_A, C4_00
030C_A, C4_01720C_A, C4_03810W_A, C4_03850W
_A, C4_05350W_A, C4_07220C_A,C7_00810W_A, C
7_01360C_A, CAS1, CAS5, CCT8, CDC27, CKA2, CNH1, CPP1, CRZ2, CR_00060C_A, CR_06780W_A,
CZF1,EAF3, EAF7, ECM25, EFG1, EPL1, ESC4, FG
R47, FGR50, GPA2, GSG1, GUP1, GZF3, HAP43, HAP5, HMS1, HRR25, LTV1,MEP2, NBP2, NDT80, O
PI1, PHO23, PIN4, PSY2, RAD3, RCN1, RFG1, RGD
1, RIM8, RPB4, RPG1A, RVS161, SET1, SET3,SFU1, SGS1, SKO1, SNT1, SPT20, SPT5, SPT6, SSN6, TC
O89, TFG1, TPK2, TUP1, UEC1, VID21, VID27, VR
P1, WAL1, YAF9
filamentous
growth
76 out of 476
genes, 16%
AAF1, ALS2, ALS4, ARG81, ARG83, BAS1, BEM1,
BNA4, BNI4, C1_06090C_A, C1_14190C_A, C3_0057
0C_A, C3_00790W_A,CAS5, CCN1, CCT8, CPP1, C
ZF1, DBF2, DEF1, ECM25, EFG1, ESC4, FGR44, F
GR47, FGR50, FLO8, GPA2, GUP1, GZF3,HAP5, HMS1, HXK1, KEL1, KIN2, KIS1, MEP2, MFG1, MS
S11, MSS4, NBP2, NDT80, PCL5, PEA2, PGA59, PIN
4, RFG1,RGD1, RGT1, RIM8, ROB1, RPB4, RVS161
, SET1, SET3, SFL1, SGS1, SKO1, SLR1, SNT1, SPT
5, SPT6, SSN6, TCC1, TEA1,TFG1, TPK2, TUP1, U
EC1, VID27, VRP1, WAL1, WHI3, YAK1, ZCF7, ZC
F8
RNA metabolic
process
67 out of 476
genes, 14.1%
BUD31, BUR2, C1_06090C_A, C1_07660W_A, C1_12
630C_A, C1_12750C_A, C1_13380W_A, C1_14470W
_A, C2_00410C_A,C2_02500W_A, C2_02770W_A, C
2_08630C_A, C2_09040W_A, C2_09650W_A, C2_101
40W_A, C3_00130C_A, C3_05800W_A,C3_06820C_
A, C4_00940W_A, C4_05230C_A, C4_05650W_A, C4
_06410W_A, C5_02480W_A, C7_00070C_A, C7_0025
0C_A,C7_00830C_A, C7_01400C_A, C7_02110W_A, C7_02660C_A, C7_03850W_A, C7_04260W_A, C7_0
4290W_A, CBF1,CR_01120C_A, CR_03230W_A, CR
_03910C_A, CR_09480W_A, CR_09800C_A, DAL81, EAF3, EST1, FYV5, GAR1, GTR1,HRR25, MED15,

239
MPP10, NDT80, NOP1, NOP8, NPL3, NSA2, PRP22,
RAD3, RMP1, ROB1, RPB4, RPP1, RRN3, SPT20,SP
T5, SPT6, SSF1, TEA1, TFG1, TIF4631, TRM9
response to
chemical
59 out of 476
genes, 12.4%
ARC18, ARG81, BEM1, C1_06090C_A, C1_14190C_
A, C2_10850C_A, C3_00790W_A, C3_01800C_A, C4
_00780C_A,C4_05230C_A, C5_02480W_A, C6_01400
W_A, C6_02430W_A, C7_00250C_A, C7_01360C_A,
C7_03850W_A, CAS5, CBF1,CCN1, CCT8, CKA2, CPP1, CRZ2, CR_02510W_A, DAL81, EFG1, FLO8, G
AR1, GAT1, GCN5, GPA2, GZF3, HAP5, HMS1,KIS
1, LTV1, MEP2, MET4, NAG6, NDT80, NRM1, OPI1
, PGA62, RGD1, RPG1A, SFL1, SFU1, SKO1, SPT20
, SPT6, SSN6,SWE1, TCO89, TEA1, TIF11, TPK2, T
RM9, TUP1, VID27
cell
cycle
58 out of 476
genes, 12.2%
AMN1, ARP4, ASK1, AXL1, BEM1, BNI4, BNR1, B
UD31, BUR2, C1_00090W_A, C1_06090C_A, C1_079
80C_A, C1_10350C_A,C1_12750C_A, C1_13380W_A
, C1_14190C_A, C2_06530W_A, C2_08020C_A, C2_0
8630C_A, C4_00030C_A, C4_02400C_A,C4_03850W
_A, C4_05230C_A, C4_07220C_A, C6_00260W_A, C6_03420W_A, C6_04120C_A, C7_03850W_A, CCN1,
CDC27,CR_02680W_A, DBF2, GCN5, GPA2, GSG1,
HRR25, HST1, KIN2, KIN3, KIP1, MBP1, MSS4, ND
T80, PEA2, PIN4, PSY2,RIM8, RVS161, SEC6, SET1
, SGS1, SPC19, SPT6, SWE1, VPS27, VRP1, WAL1,
ZDS1
response to
drug
33 out of 476
genes, 6.9%
ARC18, ARG81, C1_06090C_A, C1_14190C_A, C3_0
0790W_A, C4_05230C_A, C5_02480W_A, C6_01400
W_A, C7_00250C_A,C7_03850W_A, CAS5, CCN1, CCT8, CKA2, CR_02510W_A, EFG1, GAR1, GCN5, G
ZF3, HAP5, KIS1, NAG6, NDT80, PGA62,RPG1A, S
FL1, SSN6, SWE1, TEA1, TIF11, TRM9, TUP1, VID
27
cytoskeleton
organization
22 out of 476
genes, 4.6%
ARC18, ARP4, ASK1, BNR1, BUD14, C4_02400C_A,
C4_07220C_A, C6_00260W_A, C6_04120C_A, C7_0
0810W_A,CR_02680W_A, CR_08980C_A, DBF2, HR
R25, KIN2, KIN3, KIP1, MSS4, RVS161, SPC19, VR
P1, WAL1
signal
transduction
22 out of 476
genes, 4.6%
CKA2, CPP1, CR_06520C_A, DBF2, ECM25, GCN5,
GPA2, HMS1, KIN3, KIS1, MEP2, MSS4, OPI1, PK
H3, PSY2, RCN1,RGD1, RVS161, SAC7, SKO1, SPT
20, TPK2
biofilm
formation
18 out of 476
genes, 3.8%
ALS2, ARG81, CAS5, CRZ2, CZF1, DAL81, DEF1, E
FG1, FLO8, GUP1, MET4, MFG1, MSS11, NDT80, ROB1, TPK2, YAK1,ZCF8
cytokinesis
16 out of 476 genes, 3.4%
AXL1, BEM1, BNI4, BNR1, BUD31, C1_13380W_A, C2_08020C_A, C6_00260W_A, DBF2, KIN2, KIN3, P
EA2, RVS161, SEC6,VRP1, WAL1
hyphal
growth
16 out of 476
genes, 3.4%
ALS2, ALS4, BEM1, C1_06090C_A, CCN1, CPP1, D
BF2, EFG1, HXK1, KIN2, NBP2, NDT80, SLR1, TP
K2, TUP1, UEC1
carbohydrate
metabolic
process
12 out of 476
genes, 2.5%
C1_00810W_A, C1_14190C_A, C3_00790W_A, FGR
44, GPA2, GUP1, HXK1, MNN11, RGT1, TCO89, TP
K2, ZCF7
growth of
unicellular organism
as a thread of
attached
cells
11 out of 476
genes, 2.3%
C3_00790W_A, EFG1, GPA2, KIS1, MEP2, MSS4, P
EA2, RIM8, TEA1, TPK2, WHI3

240
pseudohyphal
growth
6 out of 476
genes, 1.3%
C3_00790W_A, EFG1, GPA2, MEP2, PEA2, WHI3