Application of the ADM1 model to advanced anaerobic digestion
11
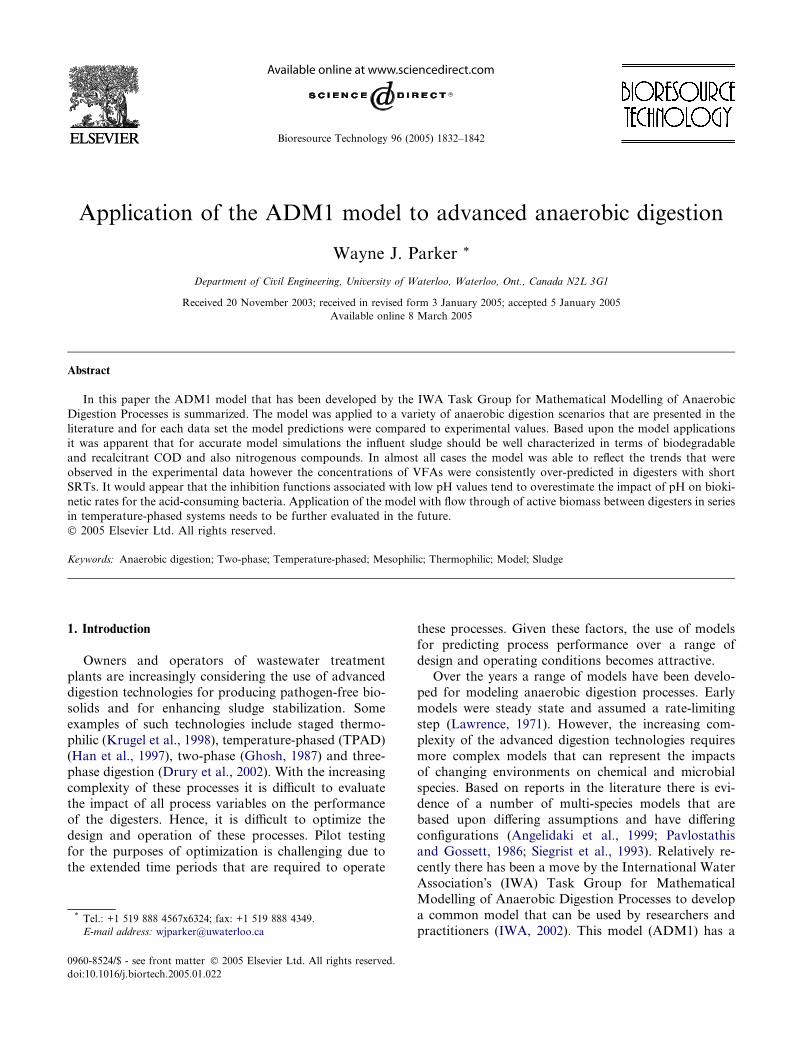
Application of the ADM1 model to advanced anaerobic digestion Wayne J. Parker * Department of Civil Engineering, University of Waterloo, Waterloo, Ont., Canada N2L 3G1 Received 20 November 2003; received in revised form 3 January 2005; accepted 5 January 2005 Available online 8 March 2005 Abstract In this paper the ADM1 model that has been developed by the IWA Task Group for Mathematical Modelling of Anaerobic Digestion Processes is summarized. The model was applied to a variety of anaerobic digestion scenarios that are presented in the literature and for each data set the model predictions were compared to experimental values. Based upon the model applications it was apparent that for accurate model simulations the influent sludge should be well characterized in terms of biodegradable and recalcitrant COD and also nitrogenous compounds. In almost all cases the model was able to reflect the trends that were observed in the experimental data however the concentrations of VFAs were consistently over-predicted in digesters with short SRTs. It would appear that the inhibition functions associated with low pH values tend to overestimate the impact of pH on bioki- netic rates for the acid-consuming bacteria. Application of the model with flow through of active biomass between digesters in series in temperature-phased systems needs to be further evaluated in the future. Ó 2005 Elsevier Ltd. All rights reserved. Keywords: Anaerobic digestion; Two-phase; Temperature-phased; Mesophilic; Thermophilic; Model; Sludge 1. Introduction Owners and operators of wastewater treatment plants are increasingly considering the use of advanced digestion technologies for producing pathogen-free bio- solids and for enhancing sludge stabilization. Some examples of such technologies include staged thermo- philic (Krugel et al., 1998), temperature-phased (TPAD) (Han et al., 1997), two-phase (Ghosh, 1987) and three- phase digestion (Drury et al., 2002). With the increasing complexity of these processes it is difficult to evaluate the impact of all process variables on the performance of the digesters. Hence, it is difficult to optimize the design and operation of these processes. Pilot testing for the purposes of optimization is challenging due to the extended time periods that are required to operate these processes. Given these factors, the use of models for predicting process performance over a range of design and operating conditions becomes attractive. Over the years a range of models have been develo- ped for modeling anaerobic digestion processes. Early models were steady state and assumed a rate-limiting step (Lawrence, 1971). However, the increasing com- plexity of the advanced digestion technologies requires more complex models that can represent the impacts of changing environments on chemical and microbial species. Based on reports in the literature there is evi- dence of a number of multi-species models that are based upon differing assumptions and have differing configurations (Angelidaki et al., 1999; Pavlostathis and Gossett, 1986; Siegrist et al., 1993). Relatively re- cently there has been a move by the International Water AssociationÕs (IWA) Task Group for Mathematical Modelling of Anaerobic Digestion Processes to develop a common model that can be used by researchers and practitioners (IWA, 2002). This model (ADM1) has a 0960-8524/$ - see front matter Ó 2005 Elsevier Ltd. All rights reserved. doi:10.1016/j.biortech.2005.01.022 * Tel.: +1 519 888 4567x6324; fax: +1 519 888 4349. E-mail address: [email protected] Bioresource Technology 96 (2005) 1832–1842
Transcript of Application of the ADM1 model to advanced anaerobic digestion
Bioresource Technology 96 (2005) 1832–1842
Application of the ADM1 model to advanced anaerobic digestion
Wayne J. Parker *
Department of Civil Engineering, University of Waterloo, Waterloo, Ont., Canada N2L 3G1
Received 20 November 2003; received in revised form 3 January 2005; accepted 5 January 2005
Available online 8 March 2005
Abstract
In this paper the ADM1 model that has been developed by the IWA Task Group for Mathematical Modelling of Anaerobic
Digestion Processes is summarized. The model was applied to a variety of anaerobic digestion scenarios that are presented in the
literature and for each data set the model predictions were compared to experimental values. Based upon the model applications
it was apparent that for accurate model simulations the influent sludge should be well characterized in terms of biodegradable
and recalcitrant COD and also nitrogenous compounds. In almost all cases the model was able to reflect the trends that were
observed in the experimental data however the concentrations of VFAs were consistently over-predicted in digesters with short
SRTs. It would appear that the inhibition functions associated with low pH values tend to overestimate the impact of pH on bioki-
netic rates for the acid-consuming bacteria. Application of the model with flow through of active biomass between digesters in series
in temperature-phased systems needs to be further evaluated in the future.
� 2005 Elsevier Ltd. All rights reserved.
Keywords: Anaerobic digestion; Two-phase; Temperature-phased; Mesophilic; Thermophilic; Model; Sludge
1. Introduction
Owners and operators of wastewater treatmentplants are increasingly considering the use of advanced
digestion technologies for producing pathogen-free bio-
solids and for enhancing sludge stabilization. Some
examples of such technologies include staged thermo-
philic (Krugel et al., 1998), temperature-phased (TPAD)
(Han et al., 1997), two-phase (Ghosh, 1987) and three-
phase digestion (Drury et al., 2002). With the increasing
complexity of these processes it is difficult to evaluatethe impact of all process variables on the performance
of the digesters. Hence, it is difficult to optimize the
design and operation of these processes. Pilot testing
for the purposes of optimization is challenging due to
the extended time periods that are required to operate
0960-8524/$ - see front matter � 2005 Elsevier Ltd. All rights reserved.
doi:10.1016/j.biortech.2005.01.022
* Tel.: +1 519 888 4567x6324; fax: +1 519 888 4349.
E-mail address: [email protected]
these processes. Given these factors, the use of models
for predicting process performance over a range of
design and operating conditions becomes attractive.Over the years a range of models have been develo-
ped for modeling anaerobic digestion processes. Early
models were steady state and assumed a rate-limiting
step (Lawrence, 1971). However, the increasing com-
plexity of the advanced digestion technologies requires
more complex models that can represent the impacts
of changing environments on chemical and microbial
species. Based on reports in the literature there is evi-dence of a number of multi-species models that are
based upon differing assumptions and have differing
configurations (Angelidaki et al., 1999; Pavlostathis
and Gossett, 1986; Siegrist et al., 1993). Relatively re-
cently there has been a move by the International Water
Association�s (IWA) Task Group for Mathematical
Modelling of Anaerobic Digestion Processes to develop
a common model that can be used by researchers andpractitioners (IWA, 2002). This model (ADM1) has a
W.J. Parker / Bioresource Technology 96 (2005) 1832–1842 1833
structure that is similar to the IWA activated sludge
models that have received acceptance by practitioners
over the last 10 years. The application of a version of
the model to municipal sludge digestion has been de-
scribed by Siegrist et al. (2002).
The objective of this study was to examine the appli-cation of the ADM1 model to advanced digestion tech-
nologies. This paper presents an overview of the model
structure and assumptions and defines important model
inputs. A description of the model application to exist-
ing data sets for a variety of anaerobic digester configu-
rations will be presented. The impact of modifying
process parameters on process performance, as pre-
dicted by the model, will be summarized. Difficultiesencountered in model use and recommendations for
modifications will be presented.
2. Model description
The ADM1 model is described in considerable detail
in the report prepared by the IWA Task Group forMathematical Modeling of Anaerobic Digestion Pro-
cesses (IWA, 2002). The following provides a brief over-
view of the model for the purposes of this discussion.
The ADM1 model is a structured model that reflects
Complex ParticulateOrganic Matter (Xc
Carbohydrates (Xch) Proteins (Xpr)
AminoAcids(Saa)
Methane (Sch4)
Sugars(Ssu)
Propionate (Spro)
Acetate (Sac)
Fig. 1. Conceptual mode
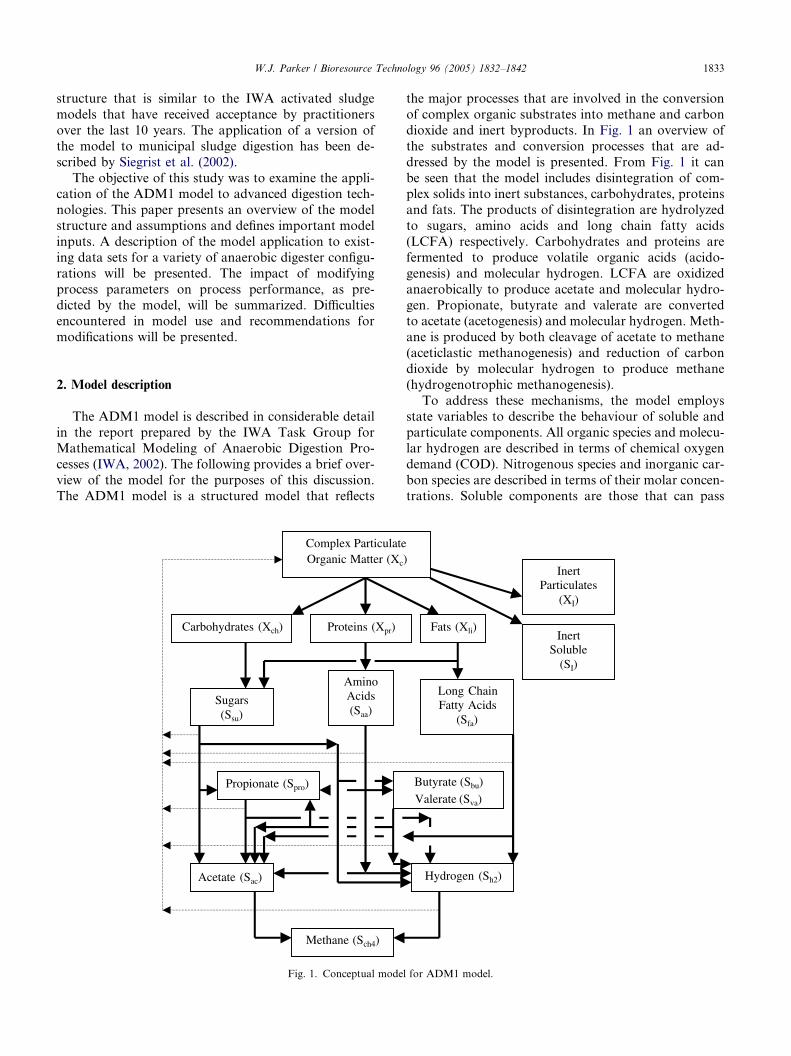
the major processes that are involved in the conversion
of complex organic substrates into methane and carbon
dioxide and inert byproducts. In Fig. 1 an overview of
the substrates and conversion processes that are ad-
dressed by the model is presented. From Fig. 1 it can
be seen that the model includes disintegration of com-plex solids into inert substances, carbohydrates, proteins
and fats. The products of disintegration are hydrolyzed
to sugars, amino acids and long chain fatty acids
(LCFA) respectively. Carbohydrates and proteins are
fermented to produce volatile organic acids (acido-
genesis) and molecular hydrogen. LCFA are oxidized
anaerobically to produce acetate and molecular hydro-
gen. Propionate, butyrate and valerate are convertedto acetate (acetogenesis) and molecular hydrogen. Meth-
ane is produced by both cleavage of acetate to methane
(aceticlastic methanogenesis) and reduction of carbon
dioxide by molecular hydrogen to produce methane
(hydrogenotrophic methanogenesis).
To address these mechanisms, the model employs
state variables to describe the behaviour of soluble and
particulate components. All organic species and molecu-lar hydrogen are described in terms of chemical oxygen
demand (COD). Nitrogenous species and inorganic car-
bon species are described in terms of their molar concen-
trations. Soluble components are those that can pass
)
Fats (Xli)
Long Chain Fatty Acids
(Sfa)
Butyrate (Sbu) Valerate (Sva)
Hydrogen (Sh2)
InertParticulates
(XI)
InertSoluble
(SI)
l for ADM1 model.
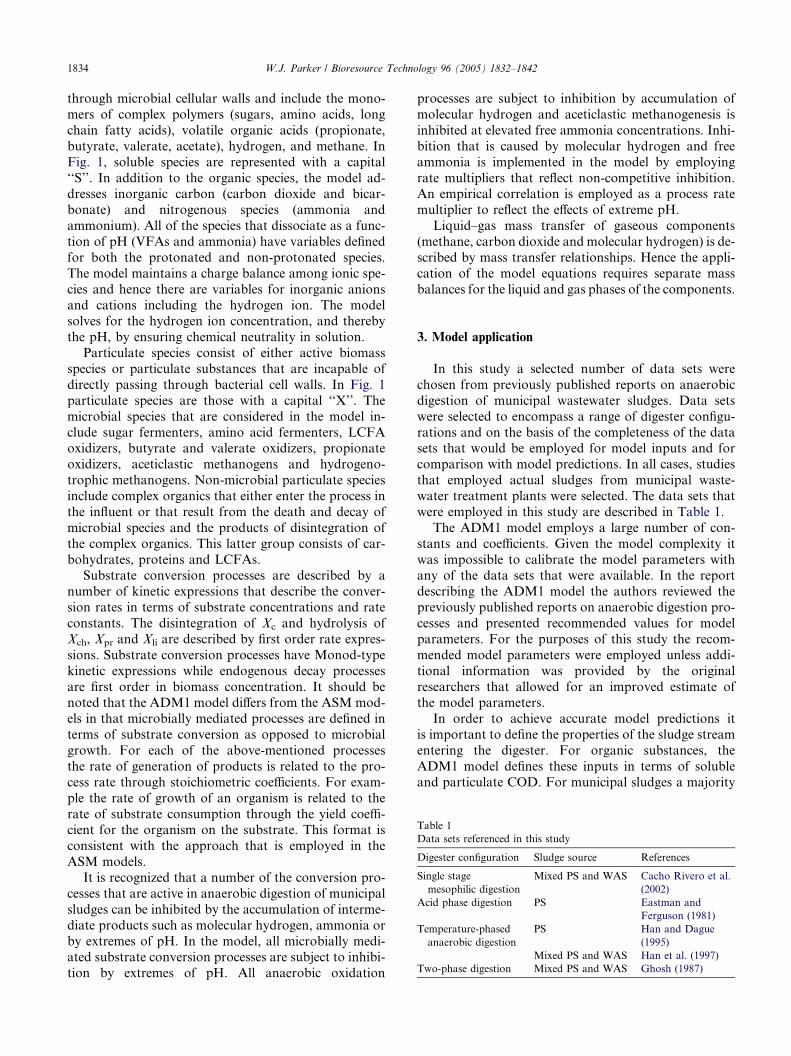
Table 1
Data sets referenced in this study
Digester configuration Sludge source References
Single stage
mesophilic digestion
Mixed PS and WAS Cacho Rivero et al.
(2002)
Acid phase digestion PS Eastman and
Ferguson (1981)
Temperature-phased
anaerobic digestion
PS Han and Dague
(1995)
Mixed PS and WAS Han et al. (1997)
Two-phase digestion Mixed PS and WAS Ghosh (1987)
1834 W.J. Parker / Bioresource Technology 96 (2005) 1832–1842
through microbial cellular walls and include the mono-
mers of complex polymers (sugars, amino acids, long
chain fatty acids), volatile organic acids (propionate,
butyrate, valerate, acetate), hydrogen, and methane. In
Fig. 1, soluble species are represented with a capital
‘‘S’’. In addition to the organic species, the model ad-dresses inorganic carbon (carbon dioxide and bicar-
bonate) and nitrogenous species (ammonia and
ammonium). All of the species that dissociate as a func-
tion of pH (VFAs and ammonia) have variables defined
for both the protonated and non-protonated species.
The model maintains a charge balance among ionic spe-
cies and hence there are variables for inorganic anions
and cations including the hydrogen ion. The modelsolves for the hydrogen ion concentration, and thereby
the pH, by ensuring chemical neutrality in solution.
Particulate species consist of either active biomass
species or particulate substances that are incapable of
directly passing through bacterial cell walls. In Fig. 1
particulate species are those with a capital ‘‘X’’. The
microbial species that are considered in the model in-
clude sugar fermenters, amino acid fermenters, LCFAoxidizers, butyrate and valerate oxidizers, propionate
oxidizers, aceticlastic methanogens and hydrogeno-
trophic methanogens. Non-microbial particulate species
include complex organics that either enter the process in
the influent or that result from the death and decay of
microbial species and the products of disintegration of
the complex organics. This latter group consists of car-
bohydrates, proteins and LCFAs.Substrate conversion processes are described by a
number of kinetic expressions that describe the conver-
sion rates in terms of substrate concentrations and rate
constants. The disintegration of Xc and hydrolysis of
Xch, Xpr and Xli are described by first order rate expres-
sions. Substrate conversion processes have Monod-type
kinetic expressions while endogenous decay processes
are first order in biomass concentration. It should benoted that the ADM1 model differs from the ASM mod-
els in that microbially mediated processes are defined in
terms of substrate conversion as opposed to microbial
growth. For each of the above-mentioned processes
the rate of generation of products is related to the pro-
cess rate through stoichiometric coefficients. For exam-
ple the rate of growth of an organism is related to the
rate of substrate consumption through the yield coeffi-cient for the organism on the substrate. This format is
consistent with the approach that is employed in the
ASM models.
It is recognized that a number of the conversion pro-
cesses that are active in anaerobic digestion of municipal
sludges can be inhibited by the accumulation of interme-
diate products such as molecular hydrogen, ammonia or
by extremes of pH. In the model, all microbially medi-ated substrate conversion processes are subject to inhibi-
tion by extremes of pH. All anaerobic oxidation
processes are subject to inhibition by accumulation of
molecular hydrogen and aceticlastic methanogenesis is
inhibited at elevated free ammonia concentrations. Inhi-
bition that is caused by molecular hydrogen and free
ammonia is implemented in the model by employing
rate multipliers that reflect non-competitive inhibition.An empirical correlation is employed as a process rate
multiplier to reflect the effects of extreme pH.
Liquid–gas mass transfer of gaseous components
(methane, carbon dioxide and molecular hydrogen) is de-
scribed by mass transfer relationships. Hence the appli-
cation of the model equations requires separate mass
balances for the liquid and gas phases of the components.
3. Model application
In this study a selected number of data sets were
chosen from previously published reports on anaerobic
digestion of municipal wastewater sludges. Data sets
were selected to encompass a range of digester configu-
rations and on the basis of the completeness of the datasets that would be employed for model inputs and for
comparison with model predictions. In all cases, studies
that employed actual sludges from municipal waste-
water treatment plants were selected. The data sets that
were employed in this study are described in Table 1.
The ADM1 model employs a large number of con-
stants and coefficients. Given the model complexity it
was impossible to calibrate the model parameters withany of the data sets that were available. In the report
describing the ADM1 model the authors reviewed the
previously published reports on anaerobic digestion pro-
cesses and presented recommended values for model
parameters. For the purposes of this study the recom-
mended model parameters were employed unless addi-
tional information was provided by the original
researchers that allowed for an improved estimate ofthe model parameters.
In order to achieve accurate model predictions it
is important to define the properties of the sludge stream
entering the digester. For organic substances, the
ADM1 model defines these inputs in terms of soluble
and particulate COD. For municipal sludges a majority

W.J. Parker / Bioresource Technology 96 (2005) 1832–1842 1835
of the organic loading is associated with the particulate
COD. The particulate COD entering the digester is de-
fined in terms of biodegradable (Xc) and non-biodegrad-
able components. Estimation of these parameters is
often challenging for many data sets as in many cases
the sludge COD is not reported and in almost all casesthe biodegradable fraction is not independently mea-
sured. In most cases the sludge is characterized in terms
of its volatile solids content.
The relationship between volatile solids content and
COD will depend upon the relative contribution of pri-
mary (PS) and waste activated sludge (WAS) to the
sludge composition (Parkin and Owen, 1986). Primary
sludges typically contain approximately 2.0 kg COD/kgVS while WAS typically has a value of 1.4 kg COD/kg
VS for this parameter. The inlet COD can therefore be
estimated on the basis of these typical values if the rela-
tive contributions of PS and WAS are known.
The biodegradable fraction of the sludge particulate
COD will also be a function of the sludge make-up.
Primary sludges have been estimated to have a COD
‘‘ultimate’’ biodegradability of 69% (Parkin and Owen,1986). The biodegradable fraction of WAS is dependent
upon the sludge age that is employed in the aeration
process (Gossett and Belser, 1982). Sludges that have ex-
tended solids residence times (SRT) in the aeration basin
will have been highly oxidized and hence will be rela-
tively recalcitrant to biodegradation in anaerobic diges-
tion. The ultimate biodegradability of WAS has been
found to range from 30% to 50% over the range of SRTstypically employed in wastewater treatment processes.
Hence, it is apparent that accurate application of the
model requires a detailed characterization of the inlet
sludge composition. The sludge composition should be
determined in terms of COD and the biodegradable
fraction should be determined. This latter parameter
could be determined through the use of a long term
batch digestion test to identify the maximum biodegrad-ability of the sludge. While there are no standard proto-
cols for such a test, existing anaerobic biodegradability
protocols could presumably be adapted for this purpose.
If the contribution of PS and WAS to the digester feed
were to vary substantially with time, then this testing
should be performed on the PS and WAS streams sepa-
rately. The properties of the composite sludge as a func-
tion of time could subsequently be estimated.The ADM1 model also estimates the behaviour of
nitrogen compounds in anaerobic digestion. In the cases
of municipal sludges the presence of ammonia nitrogen
in the inlet and the release of ammonia from decay of
solids has a substantial influence on the buffering of
pH. As will be demonstrated later in this paper the con-
centration of ammonia/ammonium in the inlet can have
a substantial impact upon the pH of acid-phase digestersthat have a relatively short SRT. In addition, the diges-
tion of highly concentrated sludges can result in the re-
lease of elevated concentrations of ammonia that can be
inhibitory to aceticlastic methanogens (IWA, 2002). It is
therefore important to characterize the concentration of
ammonia/ammonium in the digester inlet as well as the
nitrogen content of the sludges. It should be noted that
the ADM1 model does not maintain a perfect massbalance on nitrogen (Blumensaat and Keller, 2005).
Ammonium that is taken up by microbial growth is
not completely released during subsequent decay.
Hence, it can be expected that the model will underesti-
mate the concentrations of ammonium.
The data sets employed in this study did not contain
all of the information that was previously described.
Where necessary, typical values were assumed. The im-pact of these assumptions on model predictions will be
subsequently discussed.
3.1. Single stage mesophilic digestion
Cacho Rivero et al. (2002) reported a study that as-
sessed the impact of digester SRT on mesophilic an-
aerobic digestion of mixed PS and WAS. A series ofdigesters were operated over SRTs ranging from 5 to
40 days. In their paper the sludge COD, ammonia and
TKN content and VFA composition were detailed.
For this study, the biodegradable COD was estimated
by extrapolating the results that were obtained for ex-
tended SRTs. In their study COD removal, ammonia
and TKN content as well as VFA concentrations in
the digested sludges were reported and were employedfor comparison with the model predictions.
The comparison of the model predictions for effluent
COD, NH4/NH3-N, and VFAs is summarized in Fig. 2.
The error bars in Fig. 2 represent 1 standard deviation
of the experimental data. From Fig. 2 it can be seen that
the model was able to predict the effluent COD with
considerable accuracy. Nitrogen concentrations were
accurately predicted for the shorter SRTs and whilethe trend of increasing concentrations with increasing
SRT was reproduced, the absolute values that were pre-
dicted at longer SRTs were somewhat lower that the ob-
served values. The differences in nitrogen concentrations
may have been due to the lack of mass balance on nitro-
gen in the ADM1 model. It would be expected that
under conditions where there is substantial solids
destruction that the model would underestimate the con-centrations of ammonium-nitrogen.
The differences between the model predictions and the
observed results may also have resulted from differences
between the assumed and the actual protein content of
the sludge. The reference did not provide any informa-
tion on the distribution of carbohydrates, proteins and
lipids in the sludge and hence the default model values
were employed for this parameter.The model predictions for VFA concentrations were
relatively accurate for SRTs greater than or equal to

0
5
10
15
20
25
30
5 10 20 40
SRT (d)
CO
D (g
/L)
ModelExperimental
0
500
1000
1500
2000
2500
5 10 20 40
SRT (d)
NH
4/NH
3-N
(mg/
L)
ModelExperimental
0
200
400
600
800
1000
1200
1400
1600
1800
5 10 20 40
SRT (d)
Ace
tic A
cid
(mg/
L)
ModelExperimental
0
50
100
150
200
250
300
5 10 20 40
SRT (d)
Prop
ioni
c A
cid
(mg/
L)ModelExperimental
-20
0
20
40
60
80
100
5 10 20 40
SRT (d)
But
yric
Aci
d (m
g/L)
ModelExperimental
-60
-40
-20
0
20
40
60
80
100
5 10 20 40
SRT (d)
Vale
ric A
cid
(mg/
L)
ModelExperimental
Fig. 2. Comparison of model predictions with data of Cacho Rivero et al. (2002).
1836 W.J. Parker / Bioresource Technology 96 (2005) 1832–1842
10 days. However the model clearly overpredicted theconcentration of acetate while underpredicting the con-
centrations of propionate, butyrate and valerate. These
results suggest that the rates of oxidation of propionate,
butyrate and valerate were somewhat overestimated by
the model and this would partially, but not completely,
explain the elevated acetate concentrations. It would
appear that the rate at which acetate was converted to
methane at the lower SRT was somewhat under-estimated. This may have resulted from either underesti-
mation of the substrate consumption coefficients for
aceticlastic methanogenesis or an overestimation of the
inhibition of this activity by ammonia. The model pre-dicted a 40% reduction in the activity of these organisms
due to the presence of ammonia. The impact of reduced
rates of aceticlastic activity on model predictions would
be greatest at the lower SRTs.
3.2. Acid phase digestion
Eastman and Ferguson (1981) performed one of thefirst detailed studies on the acid-phase digestion of mu-
nicipal sludges. In their study, the impact of HRT was
assessed over a range from 9 to 36 h. The impact of seed
W.J. Parker / Bioresource Technology 96 (2005) 1832–1842 1837
culture was also evaluated. The model does not have the
capability to address this parameter and hence only the
tests that were conducted with raw sludge as the seed
were employed for this analysis. The model predictions
for ammonia/ammonium-N, pH and total volatile acids
(as acetate) were compared with the observed values inFig. 3.
From Fig. 3 it can be seen that the model somewhat
underpredicted the organic acid concentrations at the
lowest SRT of 9 h and overpredicted these values for
the longest SRT of 72 h. The underprediction of acid
0
2
4
6
8
10
12
9 18 36 72
SRT (hrs)
VFA
(g C
OD
/L)
ModelExperimental
0
1
2
3
4
5
6
7
9 18 36 72
SRT (hrs)
pH
ModelExperimental
0
100
200
300
400
500
600
700
800
9 18 36 72
SRT (hrs)
NH
4-N
(mg/
L)
ModelExperimental
Fig. 3. Comparison of model predictions with data of Eastman and
Ferguson (1981).
concentrations at 9 h is in agreement with the overesti-
mation of the effluent pH in this test. It would appear
that the model underestimated the rates of disintegra-
tion, hydrolysis and acidification under these relatively
extreme conditions of SRT and pH. It should be noted
that the model does not correct any of the disintegrationor hydrolysis rates for pH. Ghosh (1987) has demon-
strated that the rate of hydrolysis is influenced by pH.
An improvement of the model for addressing acid phase
digesters would be to include a rate correction term for
hydrolysis processes.
While not presented in Fig. 3 it must be noted that
although Eastman and Ferguson (1981) observed meth-
ane production at the longer SRTs the model did not pre-dict the generation of appreciable quantities of methane
under these conditions. The conversion of VFAs tometh-
ane in the experimental datamay explain the highermodel-
predicted VFA concentrations relative to the observed
values. The results suggest that methanogens are less sen-
sitive to pH than the pH inhibition functions suggest.
The ammonia-nitrogen concentrations were under-
predicted at the lowest SRTs and overpredicted at thehighest SRTs. These results tend to confirm the model
predictions of VFA concentrations since an underpre-
diction of solids destruction and hydrolysis, as indicated
by reduced VFAs, would also result in a reduced release
of ammonium.
3.3. Temperature-phased anaerobic digestion (TPAD)
TPAD processes consist of reactors operating at ther-
mophilic and mesophilic temperatures in series. While
either process may be first, the most common orientation
has the thermophilic digester ahead of the mesophilic di-
gester. For the purposes of this study two papers on
TPAD digestion were referenced; one that studied diges-
tion of PS alone (Han and Dague, 1995) and one that
studied a mix of PS and WAS (Han et al., 1997). In theformer paper the ratio of the volumes of the first and sec-
ond digesters was 1:2. In the latter paper two systems
were operated with system A having a ratio of volumes
of 1:2.5 while system B had a ratio of volumes of 1:5.
In all of the systems the mesophilic temperature was
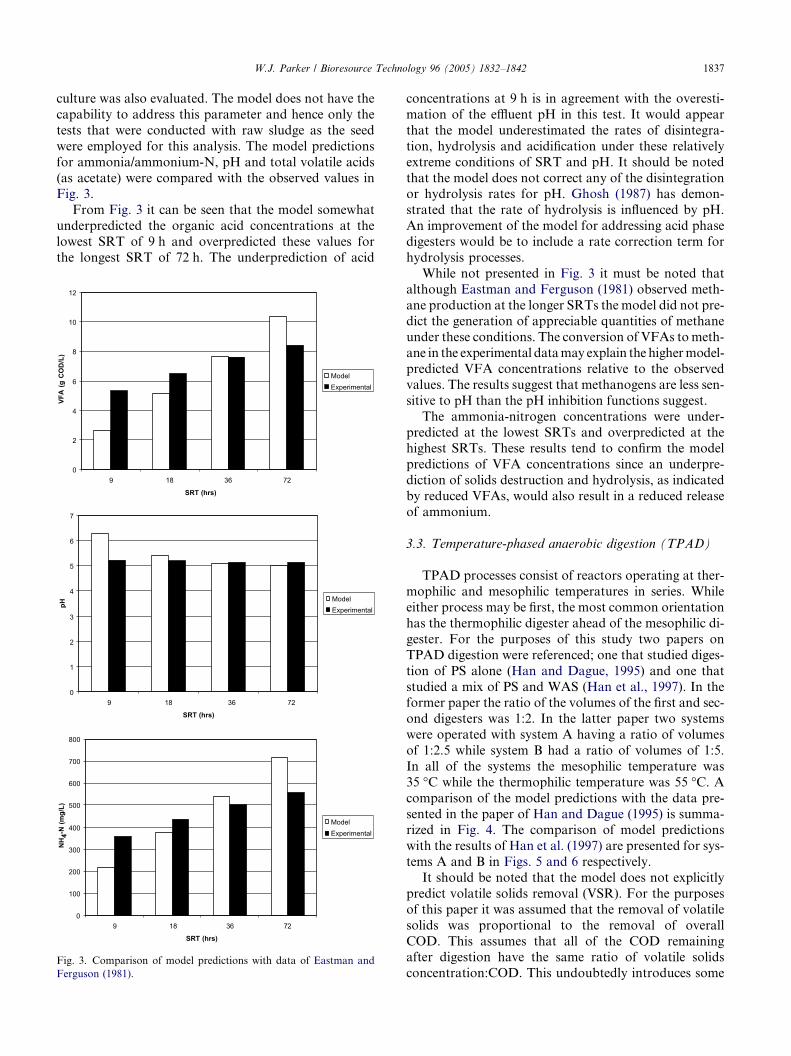
35 �C while the thermophilic temperature was 55 �C. Acomparison of the model predictions with the data pre-
sented in the paper of Han and Dague (1995) is summa-rized in Fig. 4. The comparison of model predictions
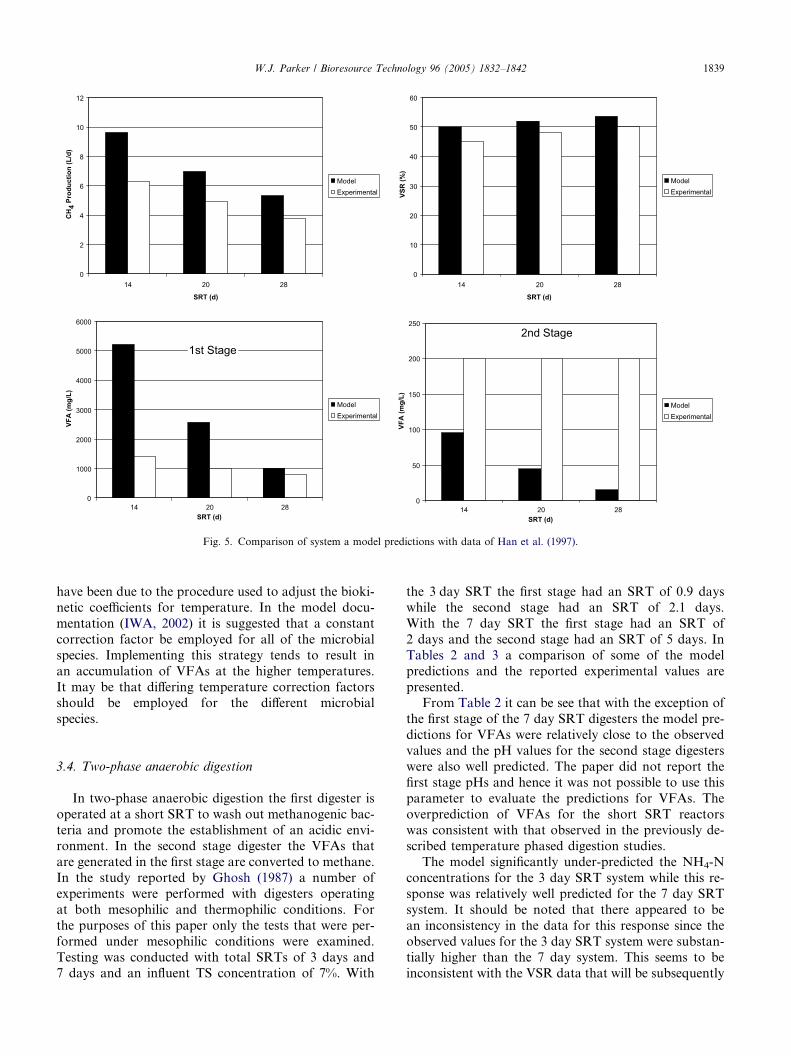
with the results of Han et al. (1997) are presented for sys-
tems A and B in Figs. 5 and 6 respectively.
It should be noted that the model does not explicitly
predict volatile solids removal (VSR). For the purposes
of this paper it was assumed that the removal of volatile
solids was proportional to the removal of overall
COD. This assumes that all of the COD remainingafter digestion have the same ratio of volatile solids
concentration:COD. This undoubtedly introduces some
0
2
4
6
8
10
12
14
16
10 11.5 12.5 13.6 15
SRT (d)
CH
4 Pr
oduc
tion
(L/d
)
ModelExperimental
0
10
20
30
40
50
60
10 11.5 12.5 13.6 15
SRT (d)
VSR
(%)
ModelExperimental
0
1000
2000
3000
4000
5000
6000
7000
8000
9000
10 11.5 12.5 13.6 15
SRT (d)
VFA
(mg/
L)
ModelExperimental
0
500
1000
1500
2000
2500
10 11.5 12.5 13.6 15
SRT (d)
VFA
(mg/
L)ModelExperimental
1st Stage2nd Stage
Fig. 4. Comparison of model predictions with data of Han and Dague (1995).
1838 W.J. Parker / Bioresource Technology 96 (2005) 1832–1842
error in the estimates however, there was generally insuf-
ficient data on the composition of the digester effluent to
perform a more refined conversion of COD to solids
concentrations.
The patterns with respect to the model predictions
and observed data that are presented in Figs. 4–6 are
consistent. In all three cases, the model overpredicted
the production of methane by the temperature-phasedprocesses. It should be noted that in the papers only
total methane production was reported and hence it
was not possible to compare methane production from
the two reactors separately. In all cases the extent of
overprediction was greatest for the lower SRTs and pre-
dictions improved for the longer SRTs. The predictions
for VSR were best for the results presented in Fig. 4
while in Figs. 5 and 6 the model consistently overpre-dicted the VSR. The overprediction of VSR was consis-
tent with the overprediction of methane generation. In
all three cases the model substantially overpredicted
the concentrations of VFAs in the thermophilic reactor.
The greatest overprediction was associated with the
shortest SRTs and the predictions improved at longer
SRTs. With the exception of the 10 day SRT in Fig. 4
the model tended to underpredict the concentrationsof VFAs in the mesophilic second stage digester.
The results suggest that for thermophilic conditions
the model overpredicts the generation of volatile fatty
acids and that this is accentuated at shorted SRTs. It
should be noted that at low SRTs the model predicted
substantial inhibition of the acetoclastic methanogens
due to low pH (IWA, 2002). It may be that the inhibi-
tion functions for this process were too severe.
Although the model predicted high VFA concentra-tions in the thermophilic phase reactor, it predicted that
essentially all of the VFAs could be converted in the sec-
ond phase mesophilic reactor. The predicted effluent
concentrations were actually lower than those that were
observed. It should be noted that in this modeling effort
the biomass that was present in the first phase reactor
was allowed to flow into the second phase reactor and
remain active at the new temperature. This may have re-sulted in the overprediction of activity in the latter reac-
tor as it is unlikely that all of the thermophilic biomass
leaving the first digester would remain viable in the sec-
ond stage digester. It may be more appropriate to as-
sume that the biomass entering the second digester
should be considered as biodegradable particulate or-
ganic matter.
The differences between the model predictions andthe observed values of the VFA concentrations may also
0
2
4
6
8
10
12
14 20 28
SRT (d)
CH
4 Pr
oduc
tion
(L/d
)
ModelExperimental
0
10
20
30
40
50
60
14 20 28
SRT (d)
VSR
(%)
ModelExperimental
0
1000
2000
3000
4000
5000
6000
14 20 28SRT (d)
VFA
(mg/
L)
ModelExperimental
0
50
100
150
200
250
14 20 28SRT (d)
VFA
(mg/
L)ModelExperimental
1st Stage 2nd Stage
Fig. 5. Comparison of system a model predictions with data of Han et al. (1997).
W.J. Parker / Bioresource Technology 96 (2005) 1832–1842 1839
have been due to the procedure used to adjust the bioki-
netic coefficients for temperature. In the model docu-
mentation (IWA, 2002) it is suggested that a constant
correction factor be employed for all of the microbial
species. Implementing this strategy tends to result in
an accumulation of VFAs at the higher temperatures.
It may be that differing temperature correction factorsshould be employed for the different microbial
species.
3.4. Two-phase anaerobic digestion
In two-phase anaerobic digestion the first digester is
operated at a short SRT to wash out methanogenic bac-
teria and promote the establishment of an acidic envi-ronment. In the second stage digester the VFAs that
are generated in the first stage are converted to methane.
In the study reported by Ghosh (1987) a number of
experiments were performed with digesters operating
at both mesophilic and thermophilic conditions. For
the purposes of this paper only the tests that were per-
formed under mesophilic conditions were examined.
Testing was conducted with total SRTs of 3 days and7 days and an influent TS concentration of 7%. With
the 3 day SRT the first stage had an SRT of 0.9 days
while the second stage had an SRT of 2.1 days.
With the 7 day SRT the first stage had an SRT of
2 days and the second stage had an SRT of 5 days. In
Tables 2 and 3 a comparison of some of the model
predictions and the reported experimental values are
presented.From Table 2 it can be see that with the exception of
the first stage of the 7 day SRT digesters the model pre-
dictions for VFAs were relatively close to the observed
values and the pH values for the second stage digesters
were also well predicted. The paper did not report the
first stage pHs and hence it was not possible to use this
parameter to evaluate the predictions for VFAs. The
overprediction of VFAs for the short SRT reactorswas consistent with that observed in the previously de-
scribed temperature phased digestion studies.
The model significantly under-predicted the NH4-N
concentrations for the 3 day SRT system while this re-
sponse was relatively well predicted for the 7 day SRT
system. It should be noted that there appeared to be
an inconsistency in the data for this response since the
observed values for the 3 day SRT system were substan-tially higher than the 7 day system. This seems to be
inconsistent with the VSR data that will be subsequently

0
1
2
3
4
5
6
7
8
9
10
12 17 24
SRT (d)
CH
4 Pr
oduc
tion
(L/d
)
ModelExperimental
0
10
20
30
40
50
60
12 17 24
SRT (d)
VSR
(%)
ModelExperimental
0
1000
2000
3000
4000
5000
6000
7000
12 17 24
SRT (d)
VFA
(mg/
L)
ModelExperimental
0
50
100
150
200
250
10 11.5 12.5
SRT (d)
VFA
(mg/
L)
ModelExperimental
1st Stage 2nd Stage
Fig. 6. Comparison of system B model predictions with data of Han et al. (1997).
Table 2
Comparison of volatile acids, pH And NH4-N for two phase digestion
Response SRT = 3 days SRT = 7 days
Stage 1 Stage 2 Stage 1 Stage 2
Vol. acids (mg/l)
Exper. NA 1680 1610–1810 109
Model 3811 1393 6711 180
pH
Exper. NA 7.2 NA 7.3
Model 5.8 7.0 5.2 7.3
NH4-N (mg/l)
Exper. NA 1820 NA 1049
Model 472 899 766 961
Table 3
Comparison of VSR for two phase digestion
Response VSR (%)
SRT = 3 days SRT = 7 days
Model 34.0 42.0
Experimental
MOPa 26.5 33.6
Weight of gasb 35.5 51.5
Theor. gas yieldc 28.3 43.4
a VS reduction was calculated as: VSR = 100 * (VS1 � VS0)/
[VS1 � (VS1 * VS0)].b VS reduction was calculated as VSR = 100 * (weight of gas/weight
of VS fed).c VS reduction was calculated as VSR = 100 * (observed gas yield/
theoretical gas yield of 1.078 SCFM/kg VS added).
1840 W.J. Parker / Bioresource Technology 96 (2005) 1832–1842
described which indicated higher solids reduction for the
longer SRT system.
The predicted VSR values along with three different
measures of VSR for the experimental data that were re-
ported in the original paper are presented in Table 3.From Table 3 it can be seen that the model predictions
were within the range of values that were reported in
the papers. It should however be noted that the range of
values reported in the paper was quite wide and hence
the assessment of the model predictions could not be very
rigorous.
4. Discussion
In this paper the predictions of the ADM1 model
using the default values for most of the model coeffi-cients were able to reflect most of the trends that were
reported for a variety of digester configurations. There
were however consistent deviations between the model
predictions and observed values for VFAs when the
W.J. Parker / Bioresource Technology 96 (2005) 1832–1842 1841
model was employed to predict the behaviour of low
SRT systems. In the two phase systems the model was
often able to perform reasonably in predicting second
stage concentrations of VFAs as with the longer SRTs
in these stages the rates of VFA conversion were able
to compensate for the high inlet concentrations ofVFAs. It would appear that there could be improve-
ments made to the model in the estimation of VFA con-
centrations under these conditions. It may be necessary
to more closely examine the relationship between pH
and rate coefficients in this regard.
For the purposes of this study it was often necessary
to estimate the values that were input into the model for
sludge characteristics such as COD, biodegradable frac-tion of the COD, TKN and NH4-N. These have a sub-
stantial influence on model predictions. If the model is
to be used as an analysis and design tool it would benefit
from more careful characterization of these parameters.
A standardized protocol for determining the anaerobi-
cally biodegradable fraction of the sludge COD would
assist in this regard.
The model predictions for VSR that were reported inthis paper assumed that the reductions in volatile solids
are proportional to the reductions in COD. However, it
is known that the COD content of volatile solids de-
pends upon the sludge source and its degree of stabiliza-
tion. Hence, the estimated values for VSR likely contain
error. The extent of this error has not been quantified
for this paper. For more accurate predictions of VSR
the COD contents of volatile solids in the feed sludgeshould be accurately characterized. In addition, the
use of typical values for the COD content of digested
sludge should be employed to convert predicted COD
concentrations to VS concentrations.
In this implementation of the model it was assumed
that for digesters in series the biomass which moved from
one digester to another would be active in the down-
stream reactor. This assumption should be valid fortwo-phase systems where the digester temperatures are
the same in both digesters. Implementation of the model
in this manner for temperature-phased configurations
requires more analysis as it is likely that the biomass
entering the second stage digester will be somewhat less
active than the model predicts.
5. Conclusions
The ADM1 model is a powerful tool for predicting
the behaviour of anaerobic digesters treating municipal
sludges. However, for successful simulation the feed
stream should be well characterized with respect to it�sCOD content and the biodegradable fraction of this
material. A standardized protocol for measuring thelatter parameter would further use of the model by the
industry. The ammonia and TKN concentrations
present in the feed need to be well characterized because
of their impact on pH buffering and inhibition func-
tions.
The model tended to overpredict VFA concentrations
for reactors that were operated at reduced SRTs. Thiswas observed for both mesophilic and thermophilic
digesters. The results suggest that the inhibition function
for pH may over emphasize the impact of reduced pH
on biological activity. In addition, the model does not
incorporate a pH function for the disintegration and
hydrolysis processes. This will have some impact on
low SRT systems that tend to operate at reduced pHs.
The relationship between COD and VS concentra-tions for digested sludges should be established. This
would improve the estimates of VSR since the model
only predicts COD concentrations.
Implementation of the model for temperature-phased
systems should be further examined since the current
implementation assumes that the biomass leaving the
upstream digesters can become active in the downstream
digesters at the downstream temperature. It does notseem that this would be likely for thermophiles entering
a mesophilic digester. The contribution of the incoming
biomass to the activity of the digesters should be further
quantified.
References
Angelidaki, I., Ellegard, L., Ahring, B.K., 1999. A comprehensive
model of anaerobic bioconversion of complex substrates to biogas.
Biotechnol. Bioeng. 63, 363–372.
Blumensaat, F., Keller, J., 2005. Modelling of two-stage anaerobic
digestion using the IWA Anaerobic Digestion Model No. 1
(ADM1). Water Res. 39, 171–183.
Cacho Rivero, J.A., Suidan, M.T., Ginestet, P., Audic, J.-M., 2002.
Effect of SRT on the anaerobic digestion of excess municipal
sludge. Proceedings of WEFTEC 2002, Chicago, IL.
Drury, D.D., Lee, S.A., Baker, C., 2002. Comparing three-phase
thermophilic continuous feed system to semi-batch feed/hold/draw
system. Proceedings of the 16th Annual WEF Residuals and
Biosolids Management Conference, Austin, Texas.
Eastman, J.A., Ferguson, J.F., 1981. Solubilization of particulate
organic carbon during the acid phase of anaerobic digestion. J.
WPCF 53, 352–366.
Ghosh, S., 1987. Improved sludge gasification by two-phase anaerobic
digestion. ASCE J. Environ. Eng. 113, 1265–1284.
Gossett, J.M., Belser, R.L., 1982. Anaerobic digestion of waste
activated sludge. ASCE J. Environ. Eng. 108, 1101–1120.
Han, Y., Dague, R.R., 1995. laboratory studies on the temperature-
phased anaerobic digestion of domestic wastewater sludges. Pro-
ceedings of WEFTEC 1995, Miami Beach, FL.
Han, Y., Sung, S., Dague, R.R., 1997. Temperature-phased anaerobic
digestion of wastewater sludges. Water Sci. Technol. 36, 367–374.
IWA 2002. Anaerobic Digestion Model No. 1 (ADM1), International
Water Association Scientific and Technical Report No. 13, IWA
Publishing, London, UK.
Krugel, S., Nemeth, L., Peddie, C., 1998. Extending thermophilic
anaerobic digestion for producing class a biosolids at the greater
1842 W.J. Parker / Bioresource Technology 96 (2005) 1832–1842
vancouver regional districts annacis island wastewater treatment
plant. Water Sci. Technol. 38, 409–416.
Lawrence, A.W., 1971. Application of process kinetics to design of
anaerobic processes. In: Gould, R.F. (Ed.), Anaerobic Biological
Treatment Processes, Advances in Chemistry Series No. 105.
American Chemical Society, Washington, DC.
Parkin, G.F., Owen, W.F., 1986. Fundamentals of anaerobic digestion
of wastewater sludges. ASCE J. Environ. Eng. 112, 867–920.
Pavlostathis, S.G., Gossett, J.M., 1986. A kinetic model for anaerobic
digestion of biological sludge. Biotechnol. Bioeng. 28, 1519–1530.
Siegrist, H., Renngli, D., Gujer, W., 1993. Mathematical modeling of
anaerobic mesophilic sewage sludge treatment. Water Sci. Technol.
27, 25–36.
Siegrist, H., Vogt, D., Garcia-Heras, J., Gujer, W., 2002. Mathemat-
ical model for meso and thermophilic anaerobic sewage sludge
digestion. Environ. Sci. Technol. 36, 1113–1123.