Anaerobic Bioconversion of Carbon Dioxide to Biogas in an Upflow Anaerobic Sludge Blanket Reactor
Upload
khangminh22Category
view
0download
0
University of WollongongResearch Online
University of Wollongong Thesis Collection University of Wollongong Thesis Collections
2014
Biomethane potential test for rapid assessment ofanaerobic digestion of sewage sludge: co-digestionwith glycerol and trace organic removalThanh NguyenUniversity of Wollongong
Research Online is the open access institutional repository for theUniversity of Wollongong. For further information contact the UOWLibrary: [email protected]
Recommended CitationNguyen, Thanh, Biomethane potential test for rapid assessment of anaerobic digestion of sewage sludge: co-digestion with glycerol andtrace organic removal, Master of Philosophy thesis, School of Civil, Mining and Environmental Engineering - Faculty of Engineeringand Information Sciences, University of Wollongong, 2014. http://ro.uow.edu.au/theses/4398


Faculty of Engineering and Information Sciences
School of Civil, Mining and Environmental Engineering
Biomethane potential test for rapid assessment of anaerobic
digestion of sewage sludge: co-digestion with glycerol and trace
organic removal
Thanh Nguyen
This thesis is presented as part of the requirements for the
award of the Degree of Master of Philosophy
from the University of Wollongong
March 2014

i
CERTIFICATION
I, Thanh Nguyen, hereby declare that this thesis, submitted in partial fulfilment of the
requirements for the award of Master of Engineering by Research Degree, to the
school of Civil, Mining and Environmental Engineering, Faculty of Engineering,
University of Wollongong is wholly my own work unless otherwise referred or
acknowledged. The document has not been submitted for qualification at any other
academic institution.
Thanh Nguyen
March 2014

ii
ABSTRACT
Anaerobic digestion (AD) is the most widely used treatment process for sewage
sludge stabilisation over concerns of public health. In addition, the production of
methane (CH4), a renewable fuel, has also shaped the prospective of AD within the
context of energy security and global warming. This dissertation thus aimed to
evaluate two main aspects of the AD process of sewage sludge. First, the potential of
enhancing biogas production was assessed when co-digesting sewage sludge with
glycerol. Glycerol is a by-product of biodiesel production and then rich in organic
carbon. Second, the capacity of removing trace organic compounds (TrOCs) was
examined.
Results reported here suggest the stability of anaerobic conversion determined the
ultimate CH4 yield, greatly affecting the assessment of CH4 potential. Alkalinity
buffer and inoculum over substrate (I/S) ratio were demonstrated to be important
factors in maintaining steady state of the AD process. The addition of NaHCO3
resulted in an increase of CH4 production of sewage sludge that could be ascribed to
well-buffered conditions for methanogens. A significant enhancement in CH4 yield
from sewage sludge was achieved with an increase of I/S ratio from 1/9 to 1/1.
Adequate quantity of inoculum for degrading substrate was responsible for such
improvement. Moreover, no disruption of CH4 production was found since only
0.25% and 0.5% glycerol of digested sludge (by volume) was applied. The obtained
ultimate CH4 yields of three types of glycerol were comparable, indicating that any
glycerol was possibly used as a potential co-substrate of sewage sludge.
Additionally, the identification of appropriate values of alkalinity and I/S ratio for an
optimal CH4 production was dependent on key characteristics (i.e. pH and alkalinity)
of sewage sludge and glycerol.
Experimental results from anaerobic co-digestion of raw primary sludge and glycerol
show that the addition of 0.5% and 1.0% of glycerol to raw primary sludge (by
volume) could improve the anaerobic sludge conversion in terms of the daily and
cumulative CH4 production. Carbon-rich content and high solubility of glycerol led
to an increase only within the first seven days. Despite the buffer supplementation,
the instability of the AD process was clearly observed in this batch test through
characteristics of the feeds and digestates (acidic pH and low alkalinity for example),

iii
suggesting a shock of organic loading due to insufficient inoculum and extra organic
matter from glycerol. The feasibility of glycerol as a co-substrate of raw primary
sludge was satisfactory to give rise to CH4 generation. On the other hand, excessive
addition of glycerol as a co-substrate may destabilise the AD process, and thus be
counter-productive.
The removal of TrOCs by AD was evaluated. The evolution of pH and alkalinity as
well as CH4 yields obtained from experiment data and kinetic analysis indicated a
steady state of methanogenesis in TrOC-spiked bottles after 1.6 days. In a two-phase
matrix (i.e. sludge and water), TrOCs could partition (adsorb) to the solid phase as
well as the water phase. Their distribution in these phases was examined using a two-
phase fate model, which considers mass transfer (i.e. sorption and desorption). In this
study, the removal of the investigated TrOCs is defined as anaerobic biodegradation.
Their various removal efficiencies were consistently related to their molecular
properties in terms of functional groups rather than other physicochemical properties.
Compounds with the inclusion of halogen, methoxy and amine/amide groups
exhibited an effective removal while low or no removal efficiencies were observed in
compounds possessing alkyl functional groups. Regarding compounds possessing
high biodegradability (kb> 0.001 L/gVS.d), water-solid partition coefficient (kp)
determined from the proposed two-phase fate model could describe their distribution
in the sludge phase better than their hydrophobicity (in terms of log D). For
biologically persistent compounds (kb< 0.001L/gVS.d), sorption properties, which
can be predicted by log D values, were responsible for the fate of organic
contaminants in sludge matrix.
An economic design at laboratory scale of biomethane potential testing could rapidly
assess the AD of sewage sludge. Results also demonstrated increased methane yields
when using glycerol as a co-substrate of sewage sludge and trace organic removal
efficiency under anaerobic conditions. These findings are of great importance for
scaling up AD facilities in real wastewater treatment plants.
Keywords: anaerobic digestion, anaerobic co-digestion, biomethane potential,
sewage sludge, glycerol, trace organic compounds, sorption.

iv
ACKNOWLEDGEMENTS
Completion of my Master by Research at the University of Wollongong has not been
achieved by my efforts alone, but memorably contributed by many wonderful people
to whom I must express my honest thanks.
My sincere gratitude is offered to Professor Long Duc Nghiem who gave me a
precious opportunity to carry out my research in his Strategic Water Infrastructure
Laboratory along with his enthusiastic guidance and support, which led to significant
improvement in my academic writing and research skills. I must also sincerely thank
Associate Professor Muttucumaru Sivakumar, my co-supervisor for his insightful
comments and suggestions throughout my course.
A word of thanks must be also recorded to other team members associated with the
Strategic Water Infrastructure Laboratory for their commitment and companionship
throughout my study. I would also like to offer special thanks to Dr. Jinguo Kang for
his help regarding trace organic analyses and gratitude to Kaushalya Wijekoon for
her suggestions and assistance in some of the laboratory analyses and system
operations.
I would also express my thanks to our laboratory technicians, Mr. Robert Rowlan,
Mr. Frank Crabtree and our laboratory manager Dr. Ling Tie for their whole-hearted
assistance from the very first days of setting up my experiment system.
Thanh Hoa Province Government, Vietnam and the University of Wollongong are
greatly thanked for offering me the Master scholarship.
To my family, my heartfelt thanks are expressed for their unconditional love and
belief.
v
TABLE OF CONTENTS
CERTIFICATION ........................................................................................................ i
ABSTRACT ................................................................................................................. ii
ACKNOWLEDGEMENTS ........................................................................................ iv
TABLE OF CONTENTS ............................................................................................. v
LIST OF FIGURES .................................................................................................. viii
LIST OF TABLES ..................................................................................................... xii
LIST OF ABBREVIATION ..................................................................................... xiv
1 INTRODUCTION .................................................................................................... 1
1.1 Background of the study ................................................................................. 1
1.2 Scope of study ................................................................................................. 3
1.3 Research objectives ......................................................................................... 3
1.4 Expected outcomes.......................................................................................... 4
1.5 Thesis outline .................................................................................................. 4
2 LITERATURE REVIEW.......................................................................................... 6
2.1 Sewage sludge ................................................................................................. 6
2.1.1 Types of sewage sludge ........................................................................... 6
2.1.2 Constituents of sewage sludge ................................................................. 9
2.2 Anaerobic sludge digestion ........................................................................... 11
2.2.1 Fundamentals of anaerobic digestion ..................................................... 11
2.2.2 Current status of the anaerobic digestion process .................................. 11
2.2.3 Factors influencing the anaerobic digestion process .............................. 14
2.2.4 Anaerobic digestion in sewage sludge treatment ................................... 18
2.3 Anaerobic co-digestion of sewage sludge with other substrates ................... 20
2.3.1 Advantages of anaerobic co-digestion in treating sewage sludge .......... 20
2.3.2 Current status of anaerobic co-digestion of sewage sludge and other
organic materials ................................................................................................ 21
2.4 The behaviour of trace organic contaminants during the anaerobic digestion
process .................................................................................................................... 29
2.4.1 Trace organic compounds and their effects ........................................... 29
2.4.2 Occurrence of emerging contaminants in sludge ................................... 30
2.4.3 Anaerobic digestion in the removal of trace organic compounds .......... 31
2.5 Summary ....................................................................................................... 34

vi
3 MATERIALS AND METHODS ............................................................................ 35
3.1 Materials ........................................................................................................ 35
3.1.1 Inoculum ................................................................................................ 35
3.1.2 Substrates ............................................................................................... 35
3.2 Experimental methods ................................................................................... 35
3.2.1 Biomethane potential test equipment ..................................................... 35
3.2.2 Experimental protocols .......................................................................... 36
3.2.3 Experimental description ....................................................................... 38
3.3 Analytical methods........................................................................................ 42
3.3.1 Basic parameters .................................................................................... 42
3.3.2 Chemical oxygen demand ...................................................................... 43
3.3.3 Methane yield calculation ...................................................................... 43
3.3.4 Trace organic analysis ............................................................................ 45
3.3.5 Viscosity of glycerol .............................................................................. 46
4 BIOMETHANE POTENTIALOF SEWAGE SLUDGE AND GLYCEROL ........ 48
4.1 Sewage sludge ............................................................................................... 48
4.1.1 Characteristics of sewage sludge ........................................................... 48
4.1.2 Effects of buffer supplement on the anaerobic treatment of sewage
sludge ................................................................................................................ 50
4.1.3 Methane production of sewage sludge ................................................... 56
4.2 Glycerol as a co-substrate ............................................................................. 62
4.2.1 Characteristics of pure and crude glycerol ............................................. 62
4.2.2 Variations of control parameters in the study of methanogenesis of
glycerol ............................................................................................................... 64
4.2.3 Methanogenic conversion of glycerol .................................................... 68
4.3 Summary ....................................................................................................... 74
5 ANAEROBIC CO-DIGESTION OF SEWAGE SLUDGE AND GLYCEROL .... 75
5.1 Characteristics of mixtures of sewage sludge and glycerol .......................... 75
5.2 Removal of volatile solids and chemical oxygen demand ............................ 79
5.3 Methane potential of co-digestion mixture of sewage sludge and glycerol .. 82
5.4 Summary ....................................................................................................... 90
6 FATE OF TRACE ORGANIC COMPOUNDS DURING ANAEROBIC
DIGESTION OF SEWAGE SLUDGE ...................................................................... 91

vii
6.1 Overall performance of AD of trace organics ............................................... 91
6.1.1 The variation of control parameters during over the digestion time ...... 91
6.1.2 Anaerobic conversion of trace organic compounds ............................... 94
6.2 Dynamics of trace organics under anaerobic sludge treatment ..................... 97
6.3 Removal performance of trace organic compounds under anaerobic sludge
treatment ............................................................................................................... 108
6.3.1 Overall removal of trace organic compounds ...................................... 108
6.3.2 Role of chemical structures .................................................................. 111
6.4 Fate of trace organic compounds in sludge matrix under anaerobic condition.
..................................................................................................................... 115
6.5 Summary ..................................................................................................... 120
7 CONCLUSIONS AND RECOMMENDATIONS ............................................... 121
7.1 Conclusions ................................................................................................. 121
7.2 Recommendations for future studies ........................................................... 123
viii
LIST OF FIGURES
Figure 1.The descriptive structure of thesis. ............................................................... 5
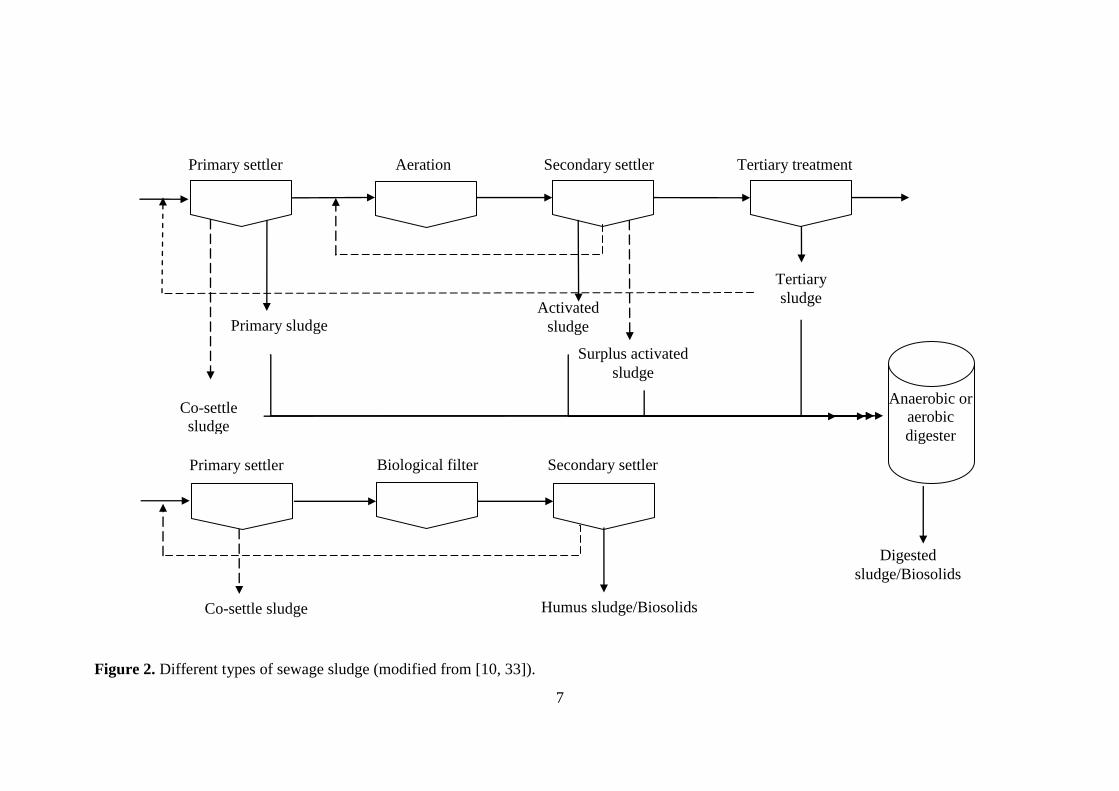
Figure 2. Different types of sewage sludge (modified from [10, 33]). ....................... 7
Figure 3. Different stages of AD process (modified from [4, 41, 42]). .................... 12
Figure 4. Factors influencing AD performance. ....................................................... 14
Figure 5. A picture of the BMP test system. ............................................................. 37
Figure 6. The schematic diagram of BMP test system. ............................................. 37
Figure 7. A picture of one BMP bottle unit used in this study. ................................. 38
Figure 8. Experimental roadmap. .............................................................................. 39
Figure 9. Hach equipment for COD determination: a) DBR200 COD Reactor and
b)DR/2000 Spectrophotometer. ......................................................................... 43
Figure 10. A schematic of sample preparation in solid and liquid phases GC-MS
analysis. .............................................................................................................. 46
Figure 11. A photograph of the Anton Paar Physica MCR 301 Rheometer. ............ 47
Figure 12. Cumulative CH4 yield and CH4 production rate for buffered and non-
buffered reactors with increasing buffer concentrations, 0, 15, and 30 mM
NaHCO3, respectively labelled as R-0, R-15, and R-30. .................................... 53
Figure 13. Temporal variations of cumulative CH4 production of the sample mixture
R1 (1/9 I/S) supplemented with increasing buffer concentrations, 0, 15, and 30
mM NaHCO3, respectively labelled as R-0, R-15, and R-30. ............................ 54
Figure 14. Plots of cumulative CH4 yields on COD basis and regression fitting
curves of the first order and modified Gompertz models. ................................. 55
Figure 15. Profile of methanogenesis of raw primary sludge in terms of production
and yield over experimental time; error bars refer to the standard deviation (n =
2). ....................................................................................................................... 58
Figure 16. Plots of experimental cumulative CH4 yield on VS basis and regression
fitting curves of the first order model and modified Gompertz model applied for
raw primary sludge. ............................................................................................ 60
Figure 17. Plots of experimental cumulative CH4 yield on VS basis and regression
fitting curve of the modified Gompertz model 2 applied for raw primary sludge.
............................................................................................................................ 60
Figure 18. Viscosity of pure glycerol and two types of crude glycerol (biodiesel and
BIA) as a function of temperature from 10 °C to 60 °C. ................................... 63

ix
Figure 19. Variations of total alkalinity and ratios of total organic acids and total
alkalinity as related to type and concentrations of glycerol; 0.25% and 0.5%
addition of pure (P), biodiesel (BID) and BIA glycerol were labelled as P-0.25,
P-0.5, BID-0.25, BID-0.5, BIA-0.25, and BIA-0.5 respectively; error bars refer
to the standard deviation (n=2). ......................................................................... 67
Figure 20. Cumulative CH4 yield and CH4 production rate of three different types of
glycerol, namely pure (P), biodiesel (BID) and BIA, at increasing
concentrations of 0.25% and 0.5%, respectively labelled as P-0.25, P-0.5, BID-
0.25, BID-0.5, BIA-0.25, and BIA-0.5. ............................................................. 69
Figure 21. Plots of cumulative CH4 yields on COD basis and regression fitting
curves of the first order and modified Gompertz models of pure glycerol at two
concentrations of 0.25% (P-0.25) and 0.5% (P-0.5). ......................................... 71
Figure 22. Plots of cumulative CH4 yields on COD basis and regression fitting
curves using the first order and modified Gompertz models of a) biodiesel
(BID) and b) BIA glycerol at 0.25% and 0.5% concentrations, respectively
labelled as BID-0.25, BID-0.5, BIA-0.25 and BIA-0.5. .................................... 72
Figure 23. Values of pH and alkalinity as related to the glycerol and buffer addition
before and after experimental time; R-15-0.5, R-15-1.0, R-30-0.5, R-30-1.0
refer to the mixture of 10% digested sludge and 90% raw primary sludge by
volume (R-0) supplemented with 15 (R-15) and 30 mM NaHCO3 (R-30), and
introduced with 0.5% and 1.0% glycerol each, respectively. ............................ 77
Figure 24. Changes of VS, CODs, and ratios of VS/TS and CODs/CODt in relation
with glycerol and buffer addition; R-15-0.5, R-15-1.0, R-30-0.5, R-30-1.0 refer
to the mixture of 10% digested sludge and 90% raw primary sludge by volume
(R-0) supplemented with 15 (R-15) and 30 mM NaHCO3 (R-30), and
introduced with 0.5% and 1.0% glycerol each, respectively. ............................ 78
Figure 25. Profile of solid content, including final VS concentrations, VS/TS ratio,
VS removal efficiency at the end of digestion; R-15-0.5, R-15-1.0, R-30-0.5, R-
30-1.0 refer to the mixture of 10% digested sludge and 90% raw primary sludge
by volume (R-0) supplemented with 15 (R-15) and 30 mM NaHCO3 (R-30), and
introduced with 0.5% and 1.0% glycerol each, respectively. ............................ 80
Figure 26. CODs concentrations and CODs/CODt ratios in digestates; R-15-0.5, R-
15-1.0, R-30-0.5, R-30-1.0 refer to the mixture of 10% digested sludge and 90%
x
raw primary sludge by volume (R-0) supplemented with 15 (R-15) and 30 mM
NaHCO3 (R-30), and introduced with 0.5% and 1.0% glycerol each,
respectively. ....................................................................................................... 81
Figure 27. Profile of daily and cumulative CH4 production in the co-digestion batch
test; R-15-0.5, R-15-1.0, R-30-0.5, R-30-1.0 refer to the mixture of 10%
digested sludge and 90% raw primary sludge by volume (R-0) supplemented
with 15 (R-15) and 30 mM NaHCO3 (R-30), and introduced with 0.5% and
1.0% glycerol each, respectively. ....................................................................... 83
Figure 28. Profile of cumulative CH4 production on basis of VS removal
(mLCH4/gVSremoval) and COD added (mLCH4/gCODadded); R-15-0.5, R-15-1.0,
R-30-0.5, R-30-1.0 refer to the mixture of digested sludge and raw primary
sludge (1/9 by volume) supplemented with 15 (R-15) and 30 mM NaHCO3 (R-
30), and introduced with 0.5% and 1.0% glycerol each, respectively. .............. 85
Figure 29. Plots of cumulative CH4 yields on COD basis and regression fitting
curves of the first order and modified Gompertz models; R-15-0.5, R-15-1.0
refer to the mixture of 1/9 I/S supplemented with 15 mM NaHCO3 (R-15) and
introduced with 0.5% and 1.0% glycerol respectively. ...................................... 86
Figure 30. Plots of cumulative CH4 yields on COD basis and regression fitting
curves of the first order and modified Gompertz models; R-30-0.5, R-30-1.0
refer to the mixture of digested sludge and raw primary sludge (1/9 by volume)
supplemented with 30 mM NaHCO3 (R-30) and introduced with 0.5% and 1.0%
glycerol respectively. ......................................................................................... 87
Figure 31. Profile of SMA of reference bottles and co-digestion bottles; R-15-0.5, R-
15-1.0, R-30-0.5, R-30-1.0 refer to the mixture of 1/9 I/S supplemented with 15
(R-15) and 30 mM NaHCO3 (R-30), and introduced with 0.5% and 1.0%
glycerol each, respectively. ................................................................................ 89
Figure 32. Profile of pH and alkalinity values in digested sludge bottles and spiked
digested sludge bottles at the particular digestion time. .................................... 93
Figure 33. Profile of CODs and ratio of CODs/CODt of digested sludge and digested
sludge spiked with TrOCs from ay 0 to day 35 of digestion. ............................ 94
Figure 34. Profile of daily and cumulative CH4 production of reference and TrOC-
spiked MBP bottles over 35 days; error bars refer to the standard deviation (n =
2). ....................................................................................................................... 95
xi
Figure 35. Plots of cumulative CH4 yields on VS basis and regression fitting curve
using the first order and modified Gompertz models applied for digested sludge,
TrOC-spiked digested sludge, and methanol. .................................................... 96
Figure 36. Distribution of the selected TrOCs in the water and solid phases of
digested sludge. .................................................................................................. 98
Figure 37. The schematic diagram of the fate of TrOCs in a sludge-water system. . 99
Figure 38. Plots of experimental data and fitting curvesof the two-phase fate model
for the selected TrOCs. .................................................................................... 103
Figure 39. Correlation between log D (pH = 8) and log kp of the selected TrOCs. 117
Figure 40. Relation among biodegradation rate constant (kb, L/gVS.d) water-solid
partition (kp, L/g) and log D (pH =8) of the selected TrOCs. .......................... 118
Figure 41. Correlation of log D (pH = 8) and kp of compounds showing low (a) and
high (b) biodegradability rates (kb). ................................................................. 119

xii
LIST OF TABLES
Table 1. Typical constituents of different types of sludge [2, 10]. ............................ 10
Table 2. Operational data of different anaerobic bioreactors used for different types
of agricultural waste [5, 44, 47, 50]. .................................................................. 15
Table 3. Advantages and disadvantages of anaerobic sludge digestion [5, 6, 10, 52,
62]. ..................................................................................................................... 19
Table 4. Biogas composition [9]. .............................................................................. 23
Table 5. Characteristics of certain co-substrates used for anaerobic digesting with
sewage sludge..................................................................................................... 25
Table 6. Co-digestion of sewage sludge with different substrates. ........................... 27
Table 7. Proposed limit values of TrOCs in sewage sludge [112-114]. .................... 31
Table 8. Experimental description of BMP bottles with increasing buffering
capacity. ............................................................................................................. 39
Table 9. Experimental description of BMP bottles with glycerol addition. .............. 40
Table 10. BMP bottles assessing BMP of different types of glycerol. ..................... 41
Table 11. Characteristics of raw, digested, and exhausted digested sludge. ............. 49
Table 12. Characteristics of sludge samples. ............................................................ 50
Table 13. Kinetic analysis of CH4 production in the batch test of buffer
enhancement. ...................................................................................................... 56
Table 14. Characteristics of raw primary sludge and sludge mixture. ...................... 57
Table 15. Kinetic analysis of CH4 production potential of raw primary sludge. ...... 61
Table 16. Physicochemical properties of pure and crude glycerol. ........................... 62
Table 17. Key properties of sample mixtures of three types of glycerol and sludge. 65
Table 18. Kinetic analysis of CH4 production during the batch test of BMP of
glycerol. .............................................................................................................. 73
Table 19. Physical and biochemical characteristics of sample mixtures in the
anaerobic co-digestion test. ................................................................................ 76
Table 20. Kinetic analysis of CH4 production on COD basis in the batch test of co-
digestion of raw primary sludge and glycerol. ................................................... 88
Table 21. Characteristics of digested sludge bottles and TrOC-spiked bottles
throughout the experimental time. ..................................................................... 92

xiii
Table 22. Kinetic analysis of CH4 production on VS basis in the batch test of the AD
treating trace organic contaminants. .................................................................. 97
Table 23. Calculated model parameters achieved from the two-phase fate model. 102
Table 24. Overall removal efficiencies of the selected TrOCs in comparison with
reported data under anaerobic and aerobic conditions. .................................... 109
Table 25. Relation of functional moieties and the removal efficiency of the selected
TrOCs. .............................................................................................................. 113
Table 26.Selected TrOCs and their relevant physicochemical properties. .............. 135

xiv
LIST OF ABBREVIATION
AD Anaerobic digestion
BMP Biomethane potential
COD Chemical oxygen demand
CODs Chemical oxygen demand – soluble fraction
CODt Chemical oxygen demand – total sample
EDCs Endocrine disrupting chemicals
GC–MS Gas chromatography – mass spectrometer
I/S Inoculum over substrate
MBR Membrane bioreactor
PPCPs Pharmaceutical and personal care products
SMA Specific methanogenic activity
SPE Solid phase extraction
TrOCs Trace organic compounds
TS Total solids
VFAs Volatile fatty acids
VS Volatile solids
WWTPs Wastewater treatment plants
1
1 INTRODUCTION
1.1 Background of the study
Since the 1990 North Sea Conference, where international agreement took place to
phase out the discharge of raw sewage sludge at sea, the treatment of sewage sludge
from wastewater treatment plants prior to environmental disposal has become a norm
in developed countries. There are several techniques for the treatment and
management of sewage sludge, including landfilling, incineration, composting, and
anaerobic digestion (AD) process [1, 2]. Among them, AD is the most commonly
used technique since biogas, which is a valuable form of renewable energy, can be
extracted from sewage sludge.
In recent years, the application of AD for sewage sludge treatment has grown rapidly
around the world. AD involves several sequential biochemical processes. Each stage
is consistently performed by a specific bacterial group in the absence of oxygen [3].
The production of biogas in AD offers several significant advantages over other
alternative technologies. These include biogas production, nutrient recovery, and
reduction of waste organic content and pathogen agents [4-6]. Recent development of
high-rate anaerobic systems has made AD an attractive technology for managing
organic wastes from agricultural production, as well as municipal and industrial
wastewater treatment [7]. AD can be applied to a range of feedstocks including solid
wastes from husbandry, food processing, and wastewater sludge [8, 9].
Sewage sludge can be described as a byproduct mixture of solids and water from
wastewater treatment [10]. By applying different treatment processes, the resulting
sewage sludge types completely differ in their characteristics. Constituents of sewage
sludge in terms of carbohydrate, lipids and protein are highly variable depending on
their origin [2]. The presence of significant concentrations of nitrogen, phosphorus
and potassium in sewage sludge make it possible for fertilising soil since these
elements are essential for plant growth.
AD instability is caused by fluctuations in organic loading rate, heterogeneity of
wastes or excessive inhibitors. Towards improving AD performance in biogas
production and accelerating the microbial activity for higher quality of biosolids,
various environmental conditions should be meticulously controlled. Additionally,
several studies have demonstrated that the hydrolysis phase is a rate-limiting step,
and directly affect the performance of AD [11-14].

2
Co-digestion of sewage sludge with higher degradable carbon source has become an
effective solution to enhance anaerobic degradation and biogas production. Anaerobic
co-digestion involves the simultaneous digestion of a homogenous mixture of two or
more substrates and has been promoted very recently in many WWTPs [15]. Not only
does this process accelerate the hydrolysis and biogas yield, it also offers many other
benefits, including dilution of potential toxic compounds, the supply of missing
nutrients, synergistic effects of microorganisms, increased load of biodegradable
organic matter, economic advantage of sharing equipment, and better biogas yield
[16, 17]. Of the organic waste materials investigated in the literature, crude glycerol
has been reported to be an ideal co-substrate for the anaerobic mineralisation of
sewage sludge [18-20]. Crude glycerol is highly soluble and rich in easily degradable
components.
Given that both biogas production and digestate quality from the anaerobic treatment
of sewage sludge were of great importance, considerations must also be given to the
fate of trace organic compounds (TrOCs) available in sewage sludge. The
accumulation of certain emerging organic compounds at trace levels onto sewage
sludge has been widely observed from WWTPs since adsorption is one of main
mechanisms responsible for their elimination during several wastewater treatment
processes [21-23]. For example, Samaras et al. [21] determined that while
biodegradation/biotransformation was responsible for trace organic removal from
wastewater the sorption tendency onto sludge particles contributed to the removal of
nonylphenol and triclosan from wastewater.
Studies reporting on the fate of these compounds during AD of sewage sludge have
aroused question over their occurrence in sewage sludge and their subsequent impact
on agricultural applications of biosolids. Unlike wastewater, sewage sludge was
regarded as a two-compartment matrix, including water and solid phases. As such,
under anaerobic sludge treatment process, every compound could undergo two main
routes, eliminated by abiotic and/or biotic removal mechanisms and/or accumulated
onto sludge particles. Several studies have indicated significant removal efficiencies
of some TrOCs including surfactants, pharmaceuticals, and personal care products by
AD treatment [22-27]. The author mainly attributed such efficient removal
performance to anaerobic biodegradation. Nonetheless, the behaviour of TrOCs in
two phases of sewage sludge and the relative impact of their behaviour on

3
biodegradability remained unclear. An extension of investigations on compounds
belonging to different usage groups with diverse physicochemical properties was of
necessary consequently. On the other hand, co-digestion of sewage sludge with
readily biodegradable substrates could enhance their anaerobic biodegradation
although to date there have been very little evidence to substantiate this hypothesis.
1.2 Scope of study
The increasing demand of renewable source of energy and adequate quality of
biosolids has provoked a great deal of work to formulate the feasible treatment
processes applied in WWTPs. In addition to sewage sludge stabilization, AD has
been known to produce biogas, which is a renewable fuel. Using organic materials as
co-substrate of sewage sludge is expected to enhance the efficiency of anaerobic
digesters. Furthermore, a more comprehensive understanding of key physiochemical
properties of the substrate, operational conditions, and biogas potential is of great
necessary prior to any large-scale operations.
The accumulation of TrOCs in biosolids is also a great challenge because they
severely affect the suitability of biosolids for land applications. Although the removal
of TrOCs by aerobic treatment has been extensively studied, little attention has been
paid to the anaerobic treatment. The assessment of their fate throughout the anaerobic
fermentation by batch-mode biomethane potential (BMP) tests can provide valuable
information on elimination capacities at different redox conditions.
1.3 Research objectives
BMP batch tests are conducted to evaluate the potential of the AD process in
producing biogas and treating TrOCs in sewage sludge. The outcomes will then
facilitate the performance of anaerobic digesters in water utilities in Australia and
around the world. The specific objectives of this research are:
Characterise sewage sludge and glycerol for parameters relating to the AD
process;
Assess the potential of methane (CH4) production of each sewage sludge and
glycerol;
Evaluate the generation of biogas during anaerobic co-digestion of sewage sludge
with glycerol; and

4
Evaluate the removal of TrOCs accumulated in sewage sludge from wastewater
treatment processes by the AD process.
1.4 Expected outcomes
The main expected outcome of this study is the better performance in terms of CH4
yield when co-digesting sewage sludge with other organic waste materials in lab-
scale batch experiments. Prior to this, data regarding the varied compositions of
sewage sludge and other organic waste materials will be identified; and the BMP of
each substrate is assessed. Another important outcome will be the extent of
elimination of some TrOCs by the anaerobic conversion.
1.5 Thesis outline
This thesis consists of seven chapters systematically shown in Figure 1. Chapter 1
gives an introduction of background and research objectives. Chapter 2 is a thorough
and updated review on the literature of AD and its applications on the co-digestion
together with publications of the fate of certain persistent compounds. Chapter 3
describes the research methods to fulfil specific objectives clarified in Chapter 1.
From Chapter 4 to Chapter 6, experimental results and data analysis are presented.
Chapter 7 will draw conclusions of this whole study and recommendations for future
studies.

5
Figure 1.The descriptive structure of thesis.

6
2 LITERATURE REVIEW
This chapter provides an overview of the current knowledge regarding anaerobic co-
digestion of sewage sludge and other organic waste materials. The AD process of
sewage sludge is firstly presented and discussed. This is followed by a
comprehensive review of CH4 production by anaerobically co-digesting sewage
sludge with other substrates. In addition, the behaviour of TrOCs during AD is also
summarised.
2.1 Sewage sludge
In the effort to improve effluent quality, WWTPs are built and upgraded. While these
plants can produce high effluent quality, sludge disposal remains an underlying issue.
These include the high cost of sludge treatment, which makes up more than 50% of
total wastewater treatment cost [28], and potential risks associated with sludge
disposal for the environment and human health [29].
Sewage sludge is a mixture of solids and semi-solids removed from the liquid stream
of WWTPs [30]. A more restricted definition is “a residual solid from sewage plants
treating domestic and urban wastewaters and from other sewage plants treating
wastewater of a composition similar to domestic and urban wastewaters” [10].
2.1.1 Types of sewage sludge
To assess options for sludge treatment and disposal, it is necessary to investigate
different kinds of sludges and their origins. A typical sewage treatment plant includes
preliminary, primary, secondary and tertiary processes [2]. During preliminary
treatment, large debris (sticks and papers for example), are removed and these do not
add to sewage sludge. On the other hand, residues from all the other processes are
collected as sludge (Figure 2).
Primary sludge is from the primary treatment process (commonly known as
sedimentation), containing high total solids (TS) content. The characteristics of
primary sludge varies considerably depending on the initial compositions of
wastewater, the efficiency of primary sedimentation and the usage of chemicals in
sedimentation, like coagulant aids [31]. Primary sludge can consist of oil, grease,
vegetable materials, faecal materials, papers, sanitary and medical waste, kitchen
wastes, and a variety of pathogens [32].
7
Figure 2. Different types of sewage sludge (modified from [10, 33]).
Primary settler Secondary settler Tertiary treatment
Co-settle
sludge
Aeration
Tertiary
sludge Activated
sludge
Surplus activated
sludge
Digested
sludge/Biosolids
Primary sludge
Secondary settler Biological filter Primary settler
Co-settle sludge Humus sludge/Biosolids
Anaerobic or
aerobic
digester

8
Treatment processes such as activated sludge process, trickling filter and rotating
biological contactors result in humus sludge or biological sludge [30]. Humus sludge
is the settled product from soluble waste in the primary effluent. This is a mixture of
microorganisms: sloughed bacteria and fungus under living or dead remains. Humus
sludge has an earthy smell and dark brown in colour.
Humus sludge from biological aerated filters and their variations, which have
different types of biological media, share certain characteristics with activated
sludge. In practice, humus sludge is returned to co-settle with primary sludge in the
primary settler.
Activated sludge is removed from the activated sludge process. Main components of
activated sludge are flocculated and synthesised solids and microorganisms [10]. Due
to the rate of recycling and other factors, activated sludge has low TS (1%) with the
colour ranging from grey, dark brown to black.
In the tertiary treatment step, the resulting sludge is called tertiary sludge. It has
fractions in common with the secondary sludge, which remains in the effluent of the
secondary treatment step and removed in the tertiary step. This sludge is normally
transferred to primary tanks and co-settle with primary sludge due to its small
amount.
Digested sludge, known as biosolids, is the product of biological digestion. This
process can be performed in a reactor with or without the presence of oxygen,
corresponding to the anaerobic or aerobic digestion processes. Biosolids contain
nutrient [34] thus should be considered as a resource. They may also contain
pathogens, which must be carefully managed for public health protection. Biosolids
classification is based on contaminant and stabilization grades. Once these grades are
evaluated, the beneficial use of biosolids can be divided into three categories:
Unrestricted, Restricted and Not Suitable for Use [35].
With respect to the pathogens, biosolids are classified as either Class A or Class B
according to the final part 503 regulations [34]. Class A biosolids contain a small
amount of pathogens. As such, sewage sludge must undergo treatment methods,
including composting, drying, and heat treatment, thermophilic AD process to
achieve Class A standards. Class B biosolids have a small level of pathogens and less
stringent requirements of treatment. Technologies, such as heating, composting,
9
digestion and pH adjustment, are in use to reduce the pathogen level to the point that
protects public health and environment.
There are other kinds of sludges resulting from other treatment processes. One of
them is physicochemical sludge coming from the physicochemical treatment of
wastewater. It is composed of flocs produced by chemical treatments like coagulants
and flocculants [33].
Combination of different sludge types is commonly utilised in sludge treatment. This
could be elucidated with diverse characteristics and compositions of mixed sludge,
facilitating downstream treatment processes. Regarding AD, the composition of
sewage sludge is a mixture of primary and secondary sludge [36-38].
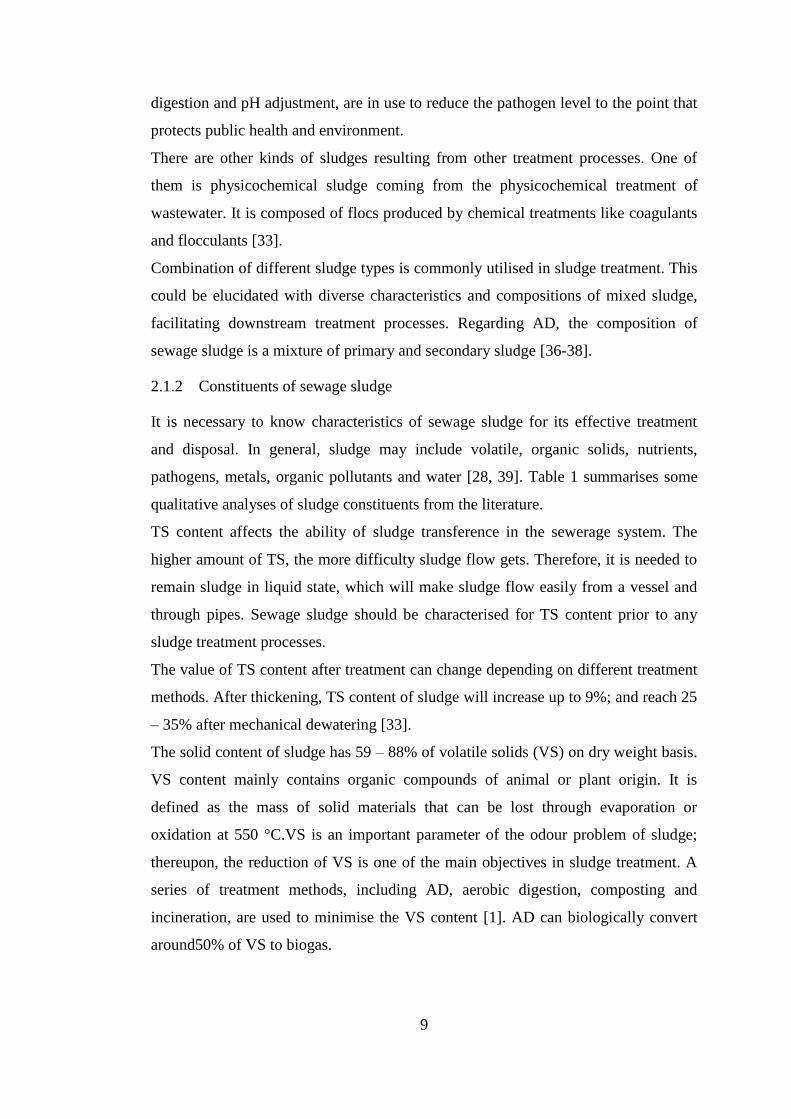
2.1.2 Constituents of sewage sludge
It is necessary to know characteristics of sewage sludge for its effective treatment
and disposal. In general, sludge may include volatile, organic solids, nutrients,
pathogens, metals, organic pollutants and water [28, 39]. Table 1 summarises some
qualitative analyses of sludge constituents from the literature.
TS content affects the ability of sludge transference in the sewerage system. The
higher amount of TS, the more difficulty sludge flow gets. Therefore, it is needed to
remain sludge in liquid state, which will make sludge flow easily from a vessel and
through pipes. Sewage sludge should be characterised for TS content prior to any
sludge treatment processes.
The value of TS content after treatment can change depending on different treatment
methods. After thickening, TS content of sludge will increase up to 9%; and reach 25
– 35% after mechanical dewatering [33].
The solid content of sludge has 59 – 88% of volatile solids (VS) on dry weight basis.
VS content mainly contains organic compounds of animal or plant origin. It is
defined as the mass of solid materials that can be lost through evaporation or
oxidation at 550 °C.VS is an important parameter of the odour problem of sludge;
thereupon, the reduction of VS is one of the main objectives in sludge treatment. A
series of treatment methods, including AD, aerobic digestion, composting and
incineration, are used to minimise the VS content [1]. AD can biologically convert
around50% of VS to biogas.

10
Table 1. Typical constituents of different types of sludge [2, 10].
Constituent Unit
Type of sludge
Untreated
primary
sludge
Digested
primary
sludge
Activated
sludge
Co-
settled
sludge
Total solids % 2.0 – 8.0 6.0 – 12.0 0.83 – 1.16 nd
Volatile solids % of TS 60 – 80 30 – 60 59 – 88 nd
Grease and fat
Ether soluble
Ether extract
% of TS
6 – 30
7 – 35
5 – 20
nd
nd
5 – 12
14.7
Protein % of TS 20 – 30 15 – 20 31 – 41 32
Total nitrogen
(TN) % of TS 1.5 – 4 1.6 – 6.0 2.4 – 5.0 3.5
Total
phosphorus % of TS 0.8 – 2.8 1.5 – 4.0 2.8 – 11.0 2.8
Potassium % of TS 0 – 1 0.0 – 3.0 0.5 – 0.7 0.2
Cellulose % of TS 8.0 – 15.0 8.0 – 15.0 nd nd
Iron % of TS 2.0 – 4.0 3.0 – 8.0 nd nd
Silica % of TS 15.0 – 20.0 10.0 – 20.0 nd nd
Alkalinity mgCaCO3/L 500 – 1500
2500 –
3500 580 – 1100 nd
Organic acids mg acetic
acids/L 200 – 2000 100 – 600
1100 –
1700 nd
pH 5.0 – 8.0 6.5 – 7.5 6.5 – 8.0 nd
nd = no data
Nitrogen exists in sludge in either inorganic forms such as an ammonium (NH4+) or
nitrate or a complex organic form. The concentrations of both inorganic and organic
nitrogen are dependent on the types of sludge and handling processes. In comparison
to organic nitrogen, inorganic nitrogen is reduced more easily by dewatering and
drying procedures. Some insoluble sludge constituents like phosphorous or calcium
remain in sludge, and are further decreased during dewatering. In contrast, potassium
and sodium, soluble constituents, will follow treated wastewater [10].
Numerous specific organic chemical contaminants are present in sewage sludge. Of
these compounds, trace organic contaminants such as pharmaceuticals and endocrine
disrupting chemicals (EDCs) are of concern since their applications may results in
greater risks to human and environment [32]. In a recent literature review, Harrison
et al. [40] examined available data on the presence of organic chemicals in sludge in
US. Data were reported to 516 potential organic pollutants, which were grouped into
15 classes and their range of concentration was also recorded.

11
Raw sewage sludge, which does not experience any treatment, is regarded as a
source of pathogens, including bacteria, viruses, fungi, yeast, and parasitic
microorganisms. They present a public health hazard, so their quantity should be
figured out. In reality, the quantity and types of pathogens vary depending on the
health status of a community.
2.2 Anaerobic sludge digestion
2.2.1 Fundamentals of anaerobic digestion
AD is a process in which organic matter can be biodegraded in the absence of
oxygen by a consortium of microorganisms. An important product of AD is biogas,
which mainly comprises CH4, carbon dioxide (CO2) and traces of other gases [3].
AD involved a series of biochemical reactions, which can be divided into four stages,
namely hydrolysis, acidogenesis, acetogenesis and methanogenesis (Figure 3). AD
has been extensively used to treat biodegradable organics and produce biogas [5].
AD is a sequential process involving several complex biochemical stages. Each stage
is consistently performed under activities of a specific group of bacteria or
interactions of different ones. In the hydrolysis step, hydrolytic microorganisms
hydrolyse polymer materials to form monomers, such as amino acids and glucose.
These monomers are subsequently converted into H2, CO2 and short-chain fatty acids
such as acetic, propionic, and butyric acids in the acidogenesis step. In the
acetogenesisstep, syntrophicacetogenic bacteria metabolize these volatile fatty acids
(VFAs) to produce precursors for the methanogenic fermentation. Finally, CH4 is
formed from either acetate or CO2 and H2 by methanogenic bacteria in the
methanogenesis step [4, 41, 42].
2.2.2 Current status of the anaerobic digestion process
Anaerobic conversion is a natural process occurring in various environments, such as
wetlands, rice fields, intestinal tracts of animals, marine or fresh water sediments.
Humans have harnessed this process to take benefits as energy, rapid decomposition
of organic waste, and stabilised residue for a long time. Historically, applications of
AD could be dated back to the 10th
century, when it was used to produce combustible
gases from sediments in lakes, ponds, and streams. The very first design for AD with
the full-scale application was conducted for domestic wastewater treatment in the

12
18th
century. The recovery of biogas from well-designed sewage treatment facilities
was established in 1895 in England, treating 230 m3/d of wastewater; and the
collected gas was used to fuel street lamps [41, 43].
Figure 3. Different stages of AD process (modified from [4, 41, 42]).
Over the last two decades, a great deal of the literature has been published on
feasible applications of AD for solid waste and wastewater treatment. Apart from
biogas production, AD proves much greater potential due to more intrinsic merits,
including energy saving, nutrient recovery, reduction of waste organic content and
pathogen populations as opposed to the conventional aerobic digestion [4-6]. As a
result, extensive applications of AD have been only revealed very recently with a
number of developing designs by focusing on more complicated devices and
operational techniques, and increased understandings of microbiology and
biochemistry. There are various anaerobic reactor types in practice, of which batch
Complex particulate
organic matter
Soluble organics (simple
sugars, alcohol, organic acids,
ketones, amino acids)
VFAs
Hydrolysis
Acidogenesis
Acetogenesis
CH4
H2, CO2 Acetate
Hydrogenotrophic
methanogenesis
Aceticlastic
methanogenesis

13
reactors are the simplest configuration. The one-stage continuously fed systems, the
two-stage and multistage continuously fed systems were more advanced reactors
applied for AD treatment [44].
The evolution of AD applications was also confirmed by a broad range of potential
substrates for this process. Anaerobic technology such as single-phase (conventional)
and two-phase anaerobic digesters was often used in the treatment of dairy
wastewater for high energy production and waste stabilization. In terms of low
content of suspended solids in dairy wastewater, the conventional anaerobic reactors
are generally nominated for treatment. Currently, numerous studies of dairy
wastewater treatment have shown a wide range of applicable anaerobic reactor
designs, including downflow fixed film, anaerobic filter, up-flow anaerobic sludge
blanket (UASB), hybrid UASB, anaerobic sequencing batch reactors (ASBR), ASBR
upflow packed-bed, rotating biological contact reactor, upflow anaerobic solid
removal reactor, multichamber bioreactor, continuously stirred tank reactor (CSTR).
At laboratory scale, the efficient removal of chemical oxygen demand (COD) of
these reactors could reach up more than 90% [6].The authors also reviewed the two-
phase anaerobic treatment, which was employed for dairy wastewater consisting of
high concentrations of non-filtered solids and lipids. The dominant reactor type was
CSTR and upflow filter, with CSTR used for acidogenesis stage and upflow filter
responsible for methanogenesis. Compared to conventional AD processes, the two-
phase shows better outcomes with various kinds of industrial wastewater. Sludge
produced from WWTPs has also aroused much consideration since some strict rules
of sludge disposals were adopted [41]. Due to advantages of AD, it has become one
of the promising solutions for sludge stabilisation and energy production [30, 45, 46].
Current improvements of high-rate anaerobic system have been drawing more
attention on AD performances in agricultural waste treatment, especially animal
residues [44] which have different characteristics from those of municipal and
industrial wastewater [7]. Anaerobic treatment of the poultry and livestock manure
waste, two other types of agricultural waste, were also of interest due to increasing
concerns of their disposal [47-49], there has been having more and more
investigations of the AD process on them. The type of reactors used for livestock
manure waste treatment include: batch, continuous one stage, and continuous two
stage reactors, tubular reactor, ASBR, AF or the plug flow reactor (PFR) as

14
described in Table 2. Many studies have also indicated that co-digestion of poultry
and swine manures with each other or with additional substrates like sewage sludge,
some industrial byproducts proves more beneficial in biogas production and even
more efficient in substrate treatment [5, 44, 47, 50].
2.2.3 Factors influencing the anaerobic digestion process
AD can be sensitive to several operating factors, including pH, alkalinity,
temperature, and characteristics of the substrates (Figure 4). To optimise the
efficiency of AD, these factors should be carefully regulated.
Figure 4. Factors influencing AD performance.
2.2.3.1 pH
pH fluctuation can influence biogas yield throughout AD. In the early stages (i.e.
hydrolysis, acidogenesis, and acetogenesis), pH decreases due to the formation of
organic acids. Once the methanogenesis step occurs, pH may increase slightly
because of the production of ammonia [42]. Below pH 6, inhibition of CH4-forming
bacteria can occur and the anaerobic process can be disrupted [8]. The pH inside
digesters is an important factor governing the growth of anaerobic microbes,
particularly methanogens, through its impact on enzyme activities. This is because
each group of microorganisms has its own appropriate pH for growth. Methanogenic
bacteria are more sensitive to pH and need a pH range between 6.5 and 7.8 [47]
while acid-forming bacteria can function in a wider pH range from 4.0 to 8.5 [51] but
prefer a pH of 5.5 to 6.5 [44, 52]. In operation, it is necessary to keep the pH close to
neutral since methanogenesis is the yield-limiting step. Lime addition is a common
technique to overcome pH reduction.
AD process
pH
Alkalinity
Temperature
C/N ratio
VFAs
Substrate Operating factors

15
Table 2. Operational data of different anaerobic bioreactors used for different types of agricultural waste [5, 44, 47, 50].
Agricultural
waste Reactor configuration
Reactor
volume OLR
HRT
(days)
Temperature
(°C)
COD or
VS removal
Biogas or CH4
yield
Poultry manure
Batch reactor, UASB,
pilot and full-scale
digesters
0.1 L – 95
m3
1.1 – 2.9
gCOD/L.d 0.5 – 305 25 – 55
32 – 78%
COD
31 – 548
mLCH4/gVS
3.6 – 368
mLbiogas/gVS
Cattle manure
Fixed-film reactor,
attached-film bioreactor,
anaerobic rotating
biological reactor, batch
reactors, downflow
anaerobic filter, fixed
dome plant, UASB,
CSTR, UAF, TPAD,
AHR, and two-stage
anaerobic systems
120 mL -
1300 m3
0.117 – 7.3
gVS/L.d 0.5 – 140
5 – 82
37.9 - 94%
COD
7.3 - 92%
VS
93 – 382
mLCH4/gVS
103 – 450
mLbiogas/gVS
Swine manure
Hybrid UASB, CSTR,
baffled, ASBR, batch
reactor, dispersed growth,
stirred batch, and PFR
125 mL –
565 L
0.9 – 15.4
gVS/L.d 0.9 – 113 22.6 – 60
57 – 78%
COD
22 – 360
mLCH4/gVS
207 – 249
mLbiogas/gVS
Organic loading rate (OLR); hydraulic retention time (HRT); up-flow anaerobic filter (UAF); continuously stirred tank reactor (CSTR);
anaerobic sequencing batch reactor (ASBR); anaerobic hybrid reactor (AHR); temperature-phased AD (TPAD); plug flow reactor (PFR)

16
2.2.3.2 Alkalinity
Alkalinity refers to the buffering capacity, which is important for regulating pH in
AD. Alkalinity originates from the degradation of organics in the form of CO2,
bicarbonate and ammonia [51]. The equilibrium of CO2 and bicarbonate will resist
the rapid changes in pH. Compared to pH, alkalinity or buffering capacity gives more
reliability for system stability since the possible accumulation of VFAs can lead to a
reduction in buffering capacity and pH [53].
The pH in an anaerobic system is controlled by CO2 in the gas phase and bicarbonate
in the liquid phase. Thereby, pH will increase when more bicarbonate is added. In
practice, when the digester pH decreases a net strong base, either sodium hydroxide
or calcium hydroxide [47] or carbonate salts, are utilised. They are able to remove
CO2 in the gas phase to convert into bicarbonate. Bicarbonate can be directly added
to eliminate the lag time and over organic dosing [44].
2.2.3.3 Temperature
AD strongly depends on temperature because not only does temperature affect the
physicochemical properties of substrates in digesters, but bacteria are also sensitive
to any changes in temperature. Therefore, it is essential to maintain constant
favourable temperatures for the growth of anaerobic microbes [8]. Insulation, water
baths or passive solar heating are used for temperature maintenance; and heat can be
added by using heat exchanges in the recycled slurry or heating coils or steam
injection in the digester [13]. Any fluctuation of temperature even small change from
30 to 32 °C [44], would lead to inactivation of bacteria, resulting in a decrease in
biogas production. Moreover, process failure can be observed at temperature changes
in excess of 1 °C per day [54].
There are three temperature ranges investigated for applications: psychrophilic
temperature from 10 to 20 °C, mesophilic temperature from 20 to 40 °C, and
thermophilic temperature between 40 and 60 °C [47]. Once sufficient retention time
for the CH4-producing bacteria is provided, anaerobic sludge digestion could be
operated successfully at psychrophilic temperature as low as 20 °C [44]. The main
discrepancy between mesophilic and thermophilic digestion lies in the CH4 yield. It
is documented that higher CH4 produced by thermophilic digestion compared to that
by mesophilic digestion in a given digester due to the fact that high temperature is

17
the preferred condition for methanogens growth [8, 55]. Another advantage of
thermophilic digestion is pathogen removal since certain pathogens could be killed at
high temperature. Moreover, thermophilic conditions were evaluated to facilitate the
balanced fermentation system in biogas production by [56]. The application of high
temperature, however, has some drawbacks, such as increase in free ammonia or
VFAs, which make the process more susceptible to inhibitors [54].
2.2.3.4 VFAs
VFAs created during AD are an important intermediate product and relates to the
imbalance of AD. High VFA concentration primarily causes the process failures with
respect to an imbalance among acidogenic, acetogenic and methanogenic organisms
[14]. Limiting concentration of VFAs for a stable performance of a anaerobic
digester was reported at13000 mg/L by Viéitez et al. [57]. Additionally, less effective
removal of COD is observed with increased VFA production [47]. In the acetogenic
stage, the VFA accumulation will lead to a decrease in pH, which directly inhibits
the growth of methanogens. If inhibition lasts in long time, acetogens will
predominate in digesters. As discussed, the addition of buffering is an effective
solution since this can resist pH drop and maintain sufficient VFA concentration for
subsequent reactions [44]. While acetic acid is the key substrate for methanogenesis,
it is determined that propionic and butyric acids are inhibitory to methanogenic
bacteria. So as to avoid digester failures, monitoring of VFA, especially butyric
acids, has been shown to stabilise the overall system [44].
2.2.3.5 Ammonia
The present of ammonia in digester results from the breakdown of nitrogen-
containing matter, mainly from protein and urea. Ammonia is regarded as one of
inhibitory substances to the AD process [58]. Between two forms of ammonia, NH4+
and free ammonia (NH3) in liquid, free ammonia has been identified as the main
cause of inhibition. The reason is the hydrophobic form of ammonia could easily
penetrate through cell walls, causing pH imbalance and enzyme malfunction [58].
This inhibition in general has been clearly observed in the methanogenesis stage.
Koster and Lettinga showed that along with the increase of ammonia concentrations
in the range of 4051 – 5734 mgNH3–N/L, acidogenic populations in the granular
sludge were hardly affected while the methanogenic population lost 56.5% of its

18
activity [59]. On basis of CH4 production, ammonia has stronger effect on
aceticlastic than hydrogenotrophic methanogens. It is suggested that the free
ammonia should be kept below 80 mg/L, while ammonium could reach up to 1500
mg/L without causing any inhibition [55]. It is pH and temperature that become
factors influencing the ammonia inhibition capacity through ammonia concentrations
[58]. The more pH increases, the more the amount of ammonia and less the amount
of ammonium are.
2.2.3.6 C/N ratio
The C/N ratio is a common parameter that has been thoroughly investigated by
numerous studies of AD. The C/N ratio represents the relative amount of organic
carbon measured by COD and nitrogen present in feedstock. The changes in the
specific CH4 yields and CH4 content consistently comply with the C/N ratio. Low
nitrogen content would lead to the inhibition of AD since anaerobic microbes needs
an adequate amount of nitrogen for their growth while organic carbon is considered
as a sole source for anaerobic activity. Increase in pH can result from low C/N ratio.
On the other hand, a high C/N ratio would directly result in a rapid conversion of
nitrogen and low biogas production. It has been elucidated that the ideal levels of
C/N ratio should be in the range of 20 – 30, typically approximately 25 [13]. For
instance, the peak values of CH4 yields were observed at a C/N ratio of 23 [60].
2.2.4 Anaerobic digestion in sewage sludge treatment
Through wastewater treatment systems, only liquid can be disposed of to the
environment while solids are collected for further treatment before discharge, of
which, sludge is by far the largest component in volume. Sludge is considered as
both a potential pollutant and a prospective source. Accordingly, sludge treatment
and disposal should be always an integrated part of wastewater treatment. Therefore,
it is imperative to seek environmentally sound and sustainable methods for sewage
sludge handling and disposal. Sustainable sludge treatment may be defined as “a
method that meets requirements of efficient recycling of resources without supply of
harmful substances to human or environment” [2]. Thereby, not only sludge
management but also research into innovative handling methods should concentrate
on three main objectives: (1) complete sludge treatment with regards to reduction of
sludge levels, (2) recovery of valuable products from sludge, regarding the nutrient

19
used as a soil conditioner or improver, and biogas production, and (3) choice of a
treatment method at an acceptable cost [28, 31].
In terms of disposal of excess sludge, the 1990 North Sea Conference consented to
an agreement of banning of the sludge dumping at sea and instead using biosolids in
agriculture. There is a need to find replacements for the dumping of sludge at sea.
The possible fate of excess sludge are landfill, incineration, spray irrigation, drying,
composting, and AD. They are towards the final goal – the transformation of
wastewater sludge into the innocuous and easily dewatered form. Several studies [54,
55, 61] have confirmed that AD is an ideal method compared to other methods of
sludge destabilisation based on its merits as shown in Table 3. This table also lists
some drawbacks of the anaerobic sludge digestion, which greatly demands
consideration.
Table 3. Advantages and disadvantages of anaerobic sludge digestion [5, 6, 10, 52,
62].
Advantages
- Production of CH4, a renewable source of energy, compensating energy for
maintaining the temperature of digesting sludge, and meeting requirements for
mixing; additionally, heat buildings, drive engines of aeration blowers or
generate electricity that can be used to run the sewage pumps
- Net reduction of mass and volume of sewage sludge during the conversion of
organics into CH4 and CO2 gas and water
- Transformation of solid content to stable, inoculum sludge
- Beneficial reuse in agriculture – soil conditioner or fertilizers: treated sludge
may contain N, P and other nutrients and organics can improve soil quality
- Inactivation of pathogens during AD
Disadvantages
- The high capital costs: large, covered tank as well as pumps for feeding and
circulating sludge, heat exchangers and compressor for gas mixing
- Long HRT necessary to develop and maintain the population of CH4-
producing bacteria
- The quality characteristics of supernatant from anaerobic sludge digestion are
poor, containing suspended solids, dissolved and particulate materials,
nitrogen and phosphorus

20
2.3 Anaerobic co-digestion of sewage sludge with other substrates
The efficiency of AD can be determined as the volume of produced biogas or the
amount of substrate depletion or the formation of intermediates and other final
products during. These performance indicators are inter-related, thus, it is generally
reliable to assess the performance of AD based on the biogas yield. The more
efficient the anaerobic treatment, the more biogas/CH4 production will be generated.
Biogas produced from AD facilitates a sustainable development of energy supply
both economically and environmentally. As compared to the energy yield of aerobic
degradation, anaerobic biomass conversion results in low energy, because which is
mainly stored in biogas. This energy is subsequently harvested in the presence of
oxygen by aerobic organisms or by humans through heating and other processes [63].
2.3.1 Advantages of anaerobic co-digestion in treating sewage sludge
With the aim of improving biogas quality and quantity, certain possible approaches,
including process design improvement, pretreatment of substrates, removal of toxic
components and co-digestion should be considered. Improving process design could
be performed via either increasing biomass retention since a dense mixture of
microorganisms is essential for the biochemical metabolism of complex substrates,
or advancing configuration and operation in terms of temperature and HRT. As an
obvious example, enhanced biogas production levels and COD/VS removal
efficiency of manure along with a series of bioreactor designs were reported (Table
2). Regarding sludge, Athanasoulia et al. [57] compared biogas production potentials
between a cascade of two methanogenic CSTR in a series, and a conventional one-
step CSTR reactor treating sewage sludge, concluding that the biogas production was
considerably improved by 9.5% to 40.1% in the serial digestion. In terms of VFAs,
values were higher in the cascade configuration, from 31.5% to 33.8%, in
comparison with the one-step process, from 36.2% to 40.7%. Another way to
increase biodegradability is the pretreatment of substrates which are hardly
hydrolysed with a high content of cellulose and hemicellulose [64]. Mechanical
destruction, heat treatment, and chemical treatment are pretreatment that techniques
have been extensively applied for domestic sludge [14, 46, 65, 66]. The removal of
toxic or inhibitory compounds in the feed prior to AD, contribute to increase biogas
yield. Ammonia levels can be decreased by free-ammonia stripping or bentonite

21
bound oil while ferric chloride and ferrous chloride pose their effect on precipitating
sulphate/sulphide [14, 67]. Up to now, results from the literature have clearly
demonstrated that the most successful way in improving biogas yield should be co-
digestion [68-71]. This can be explained by certain benefits of co-digestion: (1)
dilution of potential toxic compounds, (2) the supply of missing nutrients, (3)
synergistic effects of microorganisms, (4) increased load of biodegradable organic
matter, (5) economic advantage of sharing equipment, and (6) better biogas yield [16,
17]. AD has mainly taken place for the treatment of sewage sludge or other wastes.
Recently, for instance, manure from pigs, cows, and chicken is currently digested
with co-substrates, which include harvest residues, organic wastes, food wastes,
municipal bio-wastes, and energy crop for higher biogas production [8, 9].
2.3.2 Current status of anaerobic co-digestion of sewage sludge and other organic
materials
Although co-digestion could offer many benefits [69, 72], the application of co-
digestion of sewage sludge and other organic materials is still not well understood. In
recent years, much successful efforts have been made for such co-digestion in order
to upgrade the role of anaerobic degradation in stabilising sewage sludge and
produce feasible bioenergy as well [73].
The quality and composition of biogas produced could not be significantly changed
by OLR, HRT or other operational parameters but considerably depend on their
origin and substrate compositions, such as carbohydrates, protein, and lipids [74],
whose concentrations in sewage sludge were documented to be varied from one type
of sludge to another one (Table 1). Among them, lipids has been known as a very
promising substrate with regards of the CH4 production (i.e. 1014 mLCH4/gVS), but
requires more time for complete biodegradation. Meanwhile, proteins and
carbohydrates show faster conversion rate but lower biogas levels, i.e. 496
mLCH4/gVS and 415 mLCH4/gVS, respectively [8, 64, 75]. Through investigations
on 175 BMP assays, Labatut et al. [76] revealed that substrates rich in lipids and
easily biodegradable carbohydrates yield the highestCH4 potential, while others are
more recalcitrant with a high lignocellulosic fraction and pose the lowest gas
production rates. This could explain why hydrolysis has been reported as the rate-
limiting step in the AD of sewage sludge since proteins have been reported as the

22
rich composition in sewage sludge rather than carbohydrates and lipids. Therefore,
the addition of easily hydrolysed substrates to sewage sludge during AD must
initially accelerate the growth of microorganisms, speeding up the whole process as a
result. One of the key operating parameters of AD process, the C/N ratio, is another
concern related to sewage sludge. As discussed above, due to the low C/N, around 6
– 9, co-digestion of sewage sludge with high carbon content substrates is a necessity
for better anaerobic degradation and higher biogas production.
Taking the biogas production potential into account, any type of biomass containing
carbohydrates, proteins, fats, cellulose, and hemicelluloses as main components
could be typical substrates for AD [77]. As such, potential co-substrates for AD
should be categorised into harvest residues, including top and leaves of sugar beets,
organic wastes, food wastes, municipal biowaste from households, energy crop, and
sewage sludge [8, 9]. Table 2 summarises the biogas/CH4 production potential and
VS removal ability when mixing sewage sludge with some different promising
substrates, including fats, oil and grease (FOG), animal byproducts from the meat-
processing industry, and coffee waste, organic fraction from municipal solid wastes
(OFMSW), brewery sludge, manure, and glycerol. Anaerobic co-digestion has been
mainly performed at mesophilic temperature range, from 35 °C to 37 °C, with
various bioreactor systems. Operating at thermophilic temperature lowered the CH4
yield but enhanced VS removal. It is clear that the addition of co-substrates makes
AD achieve greater biogas production. The current studies have shown the
differences in biogas percentages in a mixture of biogas. In comparison, the highest
CH4 content was observed in the gas coming from the sewage digester, from 57.8%
to 65%, while the lowest CH4 and highest nitrogen content were found in the landfill
gas, from 37% to 62% [78-81]. From Table 4 of typical concentrations of biogases, it
can be seen that CH4 and CO2 are the predominant components resulting from
anaerobic degradation. Unlike CO2 which is more water soluble, CH4 is partially
non-soluble and takes up for the most part in gas phase [68]. Therefore, it might be
more reliable to assess CH4 potential rather than biogas potential.
Each co-substrate has its own CH4 production capacity. Sewage sludge, typically
primary sludge and waste activated sludge [70, 72], contains certain easily
degradable material [16]; and its CH4 production potential could be approximately
300 – 400 mLCH4/gVSadded [69, 71].

23
Table 4. Biogas composition [9].
Combustible ingredients Concentration (%)
CH4
H2
H2S
50 – 70
< 1
2
Non-combustible ingredients Concentrations (%)
CO2
H2O
O2
NH3
25 – 50
2 – 7
0 – 0.5
0 – 2
As mentioned above, lipids are the most attractive macromolecular component
during the anaerobic transformation for its high theoretical CH4 production.
Luostarinen et al. [82] reported that the CH4 yield potential of grease trap sludge
(GTW) is 918 mLCH4/gVSadded. The chemical and physical properties of GTW could
differ greatly depending on origin and grease abatement device (Table 5). Several
studies on this process observed an increase of 30% in biogas production and a
recovery of more than 50% in energy for on-site generation when directly adding
FOG, the top floatable layer of GTW, from the food industry [83, 84]. Although
FOG fraction in GTW is low, at average value of around 2 – 3% by volume [85], it
has been considered a potential feedstock for both AD and biodiesel production
processes due to its high fraction of lipids [72, 86]. However, lower pretreatment
expenses during the anaerobic FOG conversion makes it a more feasible option of
disposal compared to the biodiesel production [85].
In recent years, despite enhanced CH4 potential has been achieved by anaerobic co-
digestion of FOG and sewage sludge, several operational concerns of the inhibition
of methanogens due to FOG and its derivations have been stated. The detrimental
effects of FOG on methanogenic bacteria greatly attributed to the high content of
long chain fatty acids (LCFAs). There are three main mechanisms, including the
inhibition of aceticlastic and hydrogenotrophic methanogens due to the LCFAs
toxicity, the sludge flotation and biomass washout due to the adsorption of LCFAs
onto sludge, and the movement limitation of bacteria when its cell wall is covered by
a LCFAs layer [85-87]. Therefore, the AD process of FOG starts slowly. The CH4
production of FOG was only improved when FOG is mixed with sewage sludge. The
higher CH4 yield achieved from this digestion is illustrated in Table 6.

24
OFMSW is also a suitable co-substrate since it is the easily degradable content of up
to 40% in municipal solid wastes organic fraction, accounting for more than 40% of
municipal solid wastes (MSW) [88], is the easily degradable constituent. Concerns
related to the OFMSW management via conventional methods, include composting,
incineration, landfilling, and dumping [56]. Accordingly, anaerobic co-digestion of
OFMSW and sewage sludge becomes one valuable alternative to these approaches in
terms of energy recovery and environment security. Differences in characteristics of
OFMSW are caused by various sources. In one study carried out by Cabbai et al.
[89], source selected OFMSW from canteens, bakery, restaurants, supermarkets, and
households vary in compositions (Table 5). Compared to sewage sludge, OFMSW
has a higher C/N ratio and lipid load that elevate the initial stage of AD, which may
benefit CH4 production in case of co-digestion [88]. Significantly, higher CH4
productivity during co-digestion was observed under various conditions compared to
the single sludge anaerobic conversion (Table 6). Among several OFMSWs, food
waste in general is also considered the most variable substrate depending on its
origin, such as household, restaurants, markets, university dining hall, and
components, in terms of carbohydrates, proteins, and lipids [78]. Food waste
diversity in characteristics is also expressed in element compositions, in which
sufficient carbon content makes food waste the highly degradable substrates in AD.
In general, food waste has high VS/TS ratio (80 – 90%) and moisture content (75 –
85%), which makes landfill applications of food waste inadequate due to
environmental issues, namely odour release, toxic gas emission, and groundwater
contamination [90].
Instant coffee waste characteristics are mainly dependent on the production
procedure applied and raw matter used. In general, coffee waste mainly contains
carbohydrate in forms of fibres, namely lignin, cellulose, and hemi-cellulose
regardless of original materials used [91, 92]. On one hand, it has been reported from
the literature that AD of coffee waste was implemented at both mesophilic [92] and
thermophilic temperatures [35] for such high carbon content. These investigations,
on the other hand, indicated that the high concentration of solids and fibre could lead
to some problems such as clogging, but still yield the high CH4 composition of 70%.
This makes necessary to evaluate the AD performance of each kind of waste in an
anaerobic co-digestion with other substrates. The feasibility of anaerobic treatment of

25
coffee and sewage sludge was assessed, and resulting CH4 yield together with VS
reduction were shown relatively high (Table 6). The low CH4 yield of manure is
attributed to the high water content as well as high content of fibre, typical ranging
from 10 to 20 m3
of CH4 per tonne of treated manure [93].
Table 5. Characteristics of certain co-substrates used for anaerobic digesting with
sewage sludge.
Types of co-substrates Crude glycerol FOG OFMSW
Char
acte
rist
ics
TS (%) nd 1.8 – 97.2 8 – 70
VS/TS (%) nd 88.9 – 98.6 84.1 – 98.0
COD (g/L) 1, 054 – 1,216 nd nd
pH 5.0 ± 0.1 nd 3.7 – 4.6
Density (kg/L) 1.25 ± 0.1 nd nd
Electrical conductivity
(μS/cm)
4.2 ± 0.3 nd nd
TN (% of TS) nd nd 1.7 – 3.3
C/N nd nd 13.7 – 31.4
Com
ponen
ts
(% w
/w)
Carbohydrates nd 0.5 – 15 10.7 – 42.5
Protein nd 0.3 – 7 9.7 – 20.5
Fat nd 78 – 99.5 5.8 – 25.0
Glycerol 50 – 60 nd nd
Alkalis 12 – 16 nd nd
Methyl esters 15 – 18 nd nd
Methanol 8 – 12 nd nd
References [18-20] [85] [89]
nd = no data
Considered as a non-toxic, affordable, renewable and environmentally friendly
alternative to petroleum-derived fuels, biofuels, namely biodiesel and bioethanol,
have become the greatly demanded energy source. This led to the exponentially
increasing production of biofuels along with a surplus of crude glycerol since
glycerol is an inevitable co-product from not only biodiesel chemically and
enzymatically manufacturing [94], but bioethanol production also [95, 96]. Crude
glycerol is the main co-product in the biodiesel production. The ratio of produced
crude glycerol and biodiesel was estimated at 0.1 [18]. Consequently, such extra
crude glycerol has generated both a reduction in its market price, ten times as
reported recently by Yazdani et al. [95] and an environmental issue due to the
disposal of waste stream containing glycerol [18] as well as polluted wastewater

26
from purification processes [20]. There was a need of effective treatment processes
to transfer crude glycerol to higher valuable products that could improve economic
feasibility of biofuel industry. CH4 production by the anaerobic fermentation of
glycerol offers a great chance for energy supplementation in biofuel industry. It is the
high carbon content of crude glycerol that makes it an ideal substrate for anaerobic
conversion when the high production of biogas is taken into consideration.
Advantages of crude glycerol are the highly solubility since major components of are
pure glycerol, alkalis, methyl esters, and methanol as given in Table 5, as well as the
easy storage capacity of glycerol over a long time. It was reported that a large range
but low concentration of impurities, especially elements, caused by glycerol
purification processes and different used feedstocks have not exerted any significant
inhibitions to AD. The high salinity, sodium and potassium salts of crude glycerol
could have a negative effect on microbial activity [18]. The failure of the anaerobic
degradation of crude glycerol possibly results from the low concentration of N,
which is an essential element for microorganisms. However, the co-digestion with
sewage sludge completely turns it beneficial due to low C/N of sewage sludge. Until
now, little research work has been published regarding such co-metabolism. When
treating sewage sludge from WWTPs, Fountoulakis et al. [19] investigated that the
supplementation of glycerol can increase biogas production (Table 6) at
concentration of 1% by volume. Imbalance of the system was observed when adding
higher glycerol concentrations.

27
Table 6. Co-digestion of sewage sludge with different substrates.
Feedstock Bioreactor system Temperature
(°C) CH4/Biogas production
CH4/biogas
increase (%)
VS removal
(%) References
SS + FOG
(52 : 48) Semi-continuous
digester
35 449 mLCH4STP/gVSadded 195 45
[84] 52 512 mLCH4STP/gVSadded 160 51.2
SS 35 159 mLCH4STP/gVSadded - 25.2
52 197 mLCH4STP/gVSadded - 30.7
SS + GS (90 :
10) Continuous-pilot scale
digester 35
295 NmLCH4/gVSadded 9
45 – 58 [37] SS + GS (70 :
30) 344 NmLCH4/gVSadded 27
SS 271 NmLCH4/gVSadded - nd
SS + GS (54 :
46) Lab-scale digester 35 463 ± 48 mLCH4/gVSadded 66.5 59 – 70 [82]
SS 278 mLCH4/gVSadded - nd
SS + FOG
(80 : 20) Lab-scale single stage
digester 35
510 mLbiogas/gVSadded 18 57
[38] SS + FOG
(40 : 60) 640 mLbiogas/gVSadded 50 59
SS 430 mLbiogas/gVSadded - nd
SS + OFMSW
(50 : 50) Fed-batch digester
35 360 mLCH4/gVSadded 93.5 57
[56] 55 180 mLCH4/gVSadded 45 64
SS 35 186 mLCH4/gVSadded - 26.6
55 124 mLCH4/gVSadded - nd

28
Feedstock Bioreactor system Temperature
(°C) CH4/Biogas production
CH4/biogas
increase (%)
VS removal
(%) References
AS + Coffee
waste
Dual digestion system 35, 55 310 mLCH4/gVS nd 41 – 52 [97] Single stage digester 35 280 mLCH4/gVS nd 28 – 50
AS + Coffee
waste Batch assay 37
240 – 280
mLCH4STP/gVSadded nd 75 - 80 [91]
SS + ABP Lab-scale digester 35
400 ± 30 mLCH4/gVS nd nd [98] SS + ABP 410 ± 30 mLCH4/gVS nd nd
SS + brewery
(75 : 25)
Bench-scale CSTR 36 ± 0.2
510 mLbiogas/gVSremoval 27.5 16.4
[99] SS + brewery
(50 : 50) 610 mLbiogas/gVSremoval 52.5 18.2
SS + brewery
(25 : 75) 650 mLbiogas/gVSremoval 62.5 19.0
SS 400 mLbiogas/gVSremoval - 14.9
SS + FW +CM
(10 : 20 : 70)
Continuously stirred-
tank reactors 36 603 mLCH4/gVSadded nd nd [100]
SS + Gly
(99 : 1) CSTR 35 2353 ± 94 mLCH4/d 112.7 nd [19]
SS 1106 ± 36 mLCH4/d - nd
Standard temperature (0 °C) and pressure (1 atm) (STP); normal mL at 1 °C and 1 atm (NmL); sewage sludge (SS); grease trap sludge (GS);
activated sludge (AS); animal byproducts (ABP); food waste (FW); glycerol (Gly); and cattle manure (CM); nd = no data
29
2.4 The behaviour of trace organic contaminants during the anaerobic
digestion process
Concerns about the occurrence of TrOCs in wastewater and sewage sludge have
increased in recent years. It have been widely reported that their concentration levels,
removal rates as well as their behaviour significantly differ throughout wastewater
treatments. This could be explained by a variety of applied treatment processes,
operational conditions, and other factors such as temperature, pH and seasonality
[21, 22]. During wastewater treatment, TrOCs will appear in the supernatant to be
recycled in outlet and partly accumulate in sewage sludge [22, 25]. Carballa et al.
[25] conducted a comprehensive study on the behaviour of pharmaceutical and
personal care products (PPCPs) during wastewater treatment and detected most of
PPCPs, concluding that they were present in both the primary and secondary sludge
fed to anaerobic digesters. Samaras et al. [21] determined that the removal of such
TrOCs as nonylphenol and triclosan was attributed to the absorption mechanism onto
sludge while biodegradation/biotransformation was the significant mechanism for
contaminants such as ibuprofen, diclofenac, and ketoprofen.
2.4.1 Trace organic compounds and their effects
Although the classification of TrOCs has not been fully published, these compounds
could be simply divided into certain main categories, including pesticides,
pharmaceutically active compounds, and EDCs. This classification mainly depends
on their particular intended usage. That means their source might correlate to where
they have been employed. Through several routes, TrOCs could contaminate natural
water bodies, such as lakes, rivers and underground streams. Numerous documents
have reported the potential effects of TrOCs on human health, aquatic biota, and
environment [101]. Plants and animals could take up some anthropogenic organic
chemicals inside sludge, which might accumulate in the food chain. As such, some of
them potentially have severe effects on flora and fauna and soil as well. These effects
pertain to blocking or hampering functions of hormones in human and animals [101],
feminisation of male fishes by EDCs [102], estrogenic effects in rates caused by
bisphenol A [103].

30
2.4.2 Occurrence of emerging contaminants in sludge
Concentrations of TrOCs range between few ng/L to some g/L in wastewater, surface
water, groundwater and drinking water. While in sewage sludge from WWTPs, their
concentrations could reach up to a few mg/kg [21].
Differences in concentration are observed among different groups of compounds as
well as different countries and WWTPs. This is because their concentrations in
sludge widely depend on various factors. Concentrations of original compounds in
influent wastewater directly govern their final concentrations in sludge. Another
factor is their physicochemical properties, such as solubility and molecular weight.
Sludge characteristics and operational conditions applied in WWTPs also have great
effects on occurrence of TrOCs in sludge [104, 105].
The abundance of TrOCs in sludge has been reported at different levels. In general,
sludge is dominated with surfactants, of which linear alkyl benzene sulphonates
(LAS) has the highest concentrations in sludge due to their wide usage. Other two
surfactants taken into account are nonylphenolethoxylates and quaternary
ammonium-based compounds. Concentrations from few mg/kg to more than g/kg has
been reported as a range of surfactants in sludge [106]. Regarding PPCPs, the highest
concentrations in sludge belong to hydrophobic compounds, including triclosan,
triclocarban, and galaxolide. Their range of concentration vary from some μg/kg to
mg/kg [107]. Some TrOCs from industrial applications, brominated flame retardants,
organotins, and perfluorinated compounds have been detected at lower
concentrations, few μg/kg [108-110] in sludge compared to phthalic acid esters, in
the range of some mg/kg [111] while limited data have reported in the presence of
nanoparticles and benzothiazoles.
In the sector of agriculture, several guidelines stated the limiting concentrations of
these compounds in biosolids management. Accordingly, their concentrations in
sludge vary depending on a particular contaminant. EU, for instance, proposed their
acceptable levels in sludge prior to agricultural reuse as shown in Table 7.

31
Table 7. Proposed limit values of TrOCs in sewage sludge [112-114].
No TrOCs Limiting concentrations in sludge
prior to reuse (μg/g)
1 Linear alkylbenzenesulfonates 2600
2 Diethylhexylphthalates 100
3 Nonylphenolethoxylates 50
4 Dioxins and furans 0.0001
5 Organohalogens 500
6 Polychlorobiphenyls 0.8
7 Polycyclic aromatic hydrocarbons 6
2.4.3 Anaerobic digestion in the removal of trace organic compounds
The appearance of TrOCs in sewage sludge has been widely reported in the
literature. Their concentrations considerably differ among different groups of
compounds, ranging from some μg/kg to several g/kg [22]; even for the same group,
various concentration levels are often observed between different countries and
WWTPs. The detection of target compounds in sewage sludge raised the public
consideration of their possible threats to the environment and human health since
biosolids containing TrOCs has been currently applied for agricultural purposes.
Considerable efforts have been made to assess the fate of TrOCs during the sludge
treatment process in general and anaerobic sludge digestion. A question remains
whether their occurrence in sewage sludge would become one of inhibitions or a
potential substrate for AD.
Until now, most reported data in the literature have indicated that some surfactants
and pharmaceuticals, generally antibiotics, pose an inhibitive effect on AD, while
only minor impact caused by other contaminants. In a study investigating the effect
of LAS on the anaerobic sludge digestion, a partial and total inhibition of
methanogenic activities was observed at high concentrations of LAS homologues
[115]. By using a mixed, mesophilic methanogenic culture, Tezel et al. [116] showed
that quaternary ammonium-based compounds were more inhibitory to
methanogenesis, at and above 25mg/L, than acidogens. Several anaerobic microbes
could be sensitive to certain antibiotics at a wide range of concentrations, influencing
the overall AD performance. For example, carbamazepine, sulfamethoxazole and
diclofenac were studied at mesophilic conditions with a wide range of concentrations
by Fountoulakis et al. [117]. The authors observed 50% inhibition on methanogenic
activity from 30 mg/L to more than 400 mg/L. A higher range of concentrations of

32
antibiotics, between 24 mg/L and more than 1,000 mg/L, showed moderate inhibition
effects [118].
Little and even conflicting studies on the behaviour of trace organics by AD have
been carried out although PPCPs in sewage sludge have been described to be one of
the most ubiquitous contaminants [25]. Some PPCPs have been reported to exhibit
some resistance to the anaerobic conversion process. In the liquid phase of digested
sludge, most available PPCPs were observed to be persistent [119]. The authors
stated that diclofenac offered severe inhibition to AD at high concentrations while
the two other PPCPs had no effect even at the high concentrations. Nonetheless,
removal efficiencies of PPCPs during this digestion have also documented by a
variety of comprehensive studies, varying from very high removal to nearly no
removal. Excellent PPCPs removal was confirmed for naproxen, sulfamethoxazole,
roxithromycin and oestrogens at more than 85%, followed by galaxolide, tonalide
and diclofenac at 60%. The value ranged between 20 and 60% with the exception of
carbamazepine, which showed no degradation [24, 25]. These eliminations achieved
were attributed to sludge adaptation to AD. In another study on the fate of
pharmaceuticals, ibuprofen and naproxen removal were once confirmed with
considerably percentages more than 80% [21].
Regarding surfactants, it is believed that AD of sludge could degrade some persistent
compounds. LAS is one particular example with different removal reported in
several studies [25, 120, 121]. More data relating to the mechanism and removal
efficiencies of nonylphenolethoxylates during the anaerobic conversion have been
reported. In general, nonylphenolethoxylates is biotransformed into shortened chain
formations such as nonylphenolpolyethoxylates and nonylphenol [122].
Nonylphenolpolyethoxylate in some studies were metabolized into nonylphenol [27].
Nonylphenol could be degraded during the anaerobic sludge digestion process to
some extent [23, 26, 27]. There is little literature assessing the biodegradation
kinetics of these compounds with the exception of nonylphenol, whose
biodegradation followed the first order kinetic model [26].
The most striking example of contradictory results for the fate during the anaerobic
sludge treatment is the group of estrogenic compounds. The rationale likely lies in
inherent difficulties of analysing these compounds in sludge matrix and their unclear
behaviours. From equivalent loads of estrogens in both inlet and outlet of digesters,

33
Andersen et al. [123] concluded that estrogens were not degraded under
methanogenic conditions. 17-β-estradiol-3-sulphate and estrogen-3-sulphate
concentrations were even increased by activities of strictly anaerobic desulphating
strains [124]. For estrone, 17-β-estradiol, and estriol, a significant extent of removal
efficiencies was presented under thermophilic condition and various sludge retention
times [24] or with different types of sludge under mesophilic and thermophilic
conditions [23] at laboratory scale. Nevertheless, some authors confirmed the
opposite. From equivalent loads of estrogens in both inlet and outlet of digesters,
Andersen et al. [123] concluded that estrogens were not degraded under
methanogenic conditions. Using mass balance, Muller et al. [125] indicated that their
elimination were not effective (ca 40%) at the plant scale. There is little data
reporting the biodegradation of 17-α-ethinylestradiol during the sludge AD process
[126]. Even the mass flow in the outlet for 17-α-ethinylestradiol was observed to be
higher compared to the inlet in one recent study [125].
In sewage sludge, phthalic acid esters were detected in sludge at higher
concentrations in comparison to certain compounds mainly originating from
industrial applications, such as organotins and brominated flame retardants [22]. The
mechanism of anaerobic biodegradation pertaining to phthalates has aroused greater
consideration to date. Some literature has presented different removal efficiencies of
phthalates during sludge AD. Dimethyl, diethyl and di-n-butyl phthalate esters were
degraded within one week [127], nearly completely in a lab-scale experiment [128,
129]. It should be mentioned that the most hardly removed phthalic acid ester is
bis(2-ethylhexyl) phthalate, even persistent during the anaerobic biodegradation
[127]. By using mass balance in a full-scale WWTP, Marttinen et al. [130] showed
that the percentage of bis(2-ethylhexyl) phthalate removal just reached around 32%
via AD of sewage sludge. Only when some operational parameters, such as
temperature and type of inoculum and HRT are improved, the elimination in some
extent of this compound was identified [131, 132].
Most studies on TrOCs removal during the anaerobic sludge digestion process were
operated at the full-scale WWTP. This is probably the greater demand of assessing
the fate of TrOCs in the discharge flow. Although their eliminations at laboratory
scale have been poorly studied, the greater efficiencies have been recognised for
many compounds, which were reported to be refractory [23, 24, 128]. Some practical

34
methods, such as pretreatment processes or a combination of AD with other
treatments could be applied during recent years. The co-digestion of sludge with
some kinds of readily biodegradable carbon source was also indicated to enhance the
anaerobic biodegradation [26, 121], limited research regarding this enhancement has
been reported to date though. This may be explained by improving the overall
mechanism through accelerating the hydrolysis step. For example, Chang et al. [26]
demonstrated this effectiveness on nonylphenol removal, whereas the optimised
elimination of polycyclic aromatic hydrocarbons was suggested to reach via the co-
metabolism by Barret et al. [112].
2.5 Summary
The AD process, a sequential-stage process with several complex biochemical
processes involved in the absence of oxygen, has aroused much interest due to its
advantages including the production of renewable energy in the form of CH4 and
lower installation cost compared to its counterpart, the aerobic digestion process. The
efficiency and instability of anaerobic sludge degradation greatly depend on several
operating conditions (pH and temperature for example) and properties of sewage
sludge. Higher performance in terms of CH4 production has been achieved
anaerobically co-digesting sewage sludge with various organic waste materials. Of
them, glycerol was a considerable co-substrate due to high in solubility and rich in
easily degradable organic components, little research has been in the literature to date
though. In respect of removal efficiency by the AD process, more consideration must
be given to TrOCs occurring in sludge because of their detrimental effects on
ecosystem. Little and even conflicting studies on the elimination of TrOCs under
anaerobic condition have been assessed at laboratory scale although these trace
contaminants determine the suitability of biosolids for agricultural applications.

35
3 MATERIALS AND METHODS
This chapter details experimental design, experimental protocols, and analytical
methods applied throughout this study. Materials, namely inoculum, substrate and
selected TrOCs and their properties were also introduced.
3.1 Materials
3.1.1 Inoculum
Digested sludge from a Sydney Water sewage treatment plant was used as inoculum.
This inoculum was withdrawn from a full-scale anaerobic digester operating under
mesophilic condition. The digester was continuously fed with only primary sludge,
thus, the collected inoculum has already acclimatised with raw primary sludge. The
inoculum was stored at 4 °C in the dark until utilisation.
3.1.2 Substrates
Raw primary sludge was also collected from a Sydney Water sewage treatment plant.
Pure glycerol (>99%) was obtained from VWR International (Australia). Two kinds
of crude glycerol were also obtained from the biodiesel industry (through Sydney
Water). They are identified as Biodiesel and BIA, respectively. All substrates were
stored at 4 °C in the dark until utilisation to avoid any unexpected biochemical
reactions.
3.2 Experimental methods
3.2.1 Biomethane potential test equipment
The BMP test system constructed for this study consisted of fermentation bottles
submerged in a water bath and a biogas collection gallery (Figure 5 and Figure 6).
The fermentation bottle (Wiltronics Research Pty Ltd) was made of glass and had
volume of 1000 mL. Each bottle was equipped with a rubber bung and an S-shape
air-lock. The air-lock is filled with water to allow biogas to escape but prevent air
from entering the fermentation bottle (Figure 7). The bottle was submerged in the
water bath (Model SWB20D, Ratek Instrument Pty Ltd) to maintain the temperature
at a constant value. Each bottle was connected to a plastic valve and a gas collector
through flexible plastic tube. The biogas collector comprised a 1000 mL plastic

36
measuring cylinder and a plastic container containing NaOH solution for biogas
wash [20, 133, 134] at concentration of 1M in this study. To measure the volume of
CH4 generated from the fermentation bottle, the cylinder was first filled with 1M
[134] NaOH solution, and was inverted and then partially submerged into the NaOH
container. Biogas from the fermentation bottle was introduced into the submerged
part of the cylinder, thus, allowing the NaOH solution to absorb CO2 and H2S from
the biogas. The remaining CH4 gas displaced the NaOH solution inside cylinder and
the CH4 gas volume generated each day can be recorded. The water bath could hold
up to eight fermentation bottles. Up to eight CH4 measuring cylinders could also be
held by the biogas collection gallery. Thus, the constructed BMP test unit could
simultaneously hold eight fermentation bottles. Two identical systems were
constructed and used in this study.
3.2.2 Experimental protocols
To minimize oxygen contamination, prior to the BMP experiment, all fermentation
bottles were continuously flushed with N2 for 5 minutes before filling with 750 mL
of substrates and inoculum. The headspace in each bottle was 250 mL. The bottle
was flushed again with N2 and immediately sealed with the rubber stopper (Figure 7).
After placing into the shaking water bath, which was set at 35.0 ± 0.1 °C, the valve
was opened to allow biogas to enter the gas collection gallery. Shaking velocity of
the water bath was 70 – 75 strokes per minute. The experiment was terminated when
less than 5 mL of CH4 was produced over a day.

37
Figure 5. A picture of the BMP test system.
Figure 6. The schematic diagram of BMP test system.
-
-
-
-
Inverted
measuring
cylinder
Water bath
Bung
Fermentation
bottle
S-shape
air-lock
Plastic basin contains 1M NaOH

38
Figure 7. A picture of one BMP bottle unit used in this study.
3.2.3 Experimental description
The anaerobic batch experiments were initialised to perform BMP tests of substrates,
including single digestion of each raw primary sludge and glycerol, and their co-
fermentation under anaerobic condition. The AD system was then used to evaluate
the TrOC removal efficiency of anaerobic sludge treatment. Figure 8 presents the
experimental scheme of this investigation. Further details are given as following.

39
Figure 8. Experimental roadmap.
3.2.3.1 Batch tests on CH4 potential of sewage sludge and glycerol
Experimental protocol of a BMP assay to evaluate the effect of buffer addition on
AD of sewage sludge alone is described in Table 8. The BMP bottles were seeded
with a mixture of digested sludge and raw primary sludge (known as I/S ratio) of 1/9
by volume. Because of their low pH and alkalinity, 6.2 and 1228.6 mg/L
respectively, sodium bicarbonate (NaHCO3) was added into these bottles to gradually
enhance the buffering capacity at the beginning of AD process. NaHCO3 was added
at increasing concentrations, 15 and 30 mM. All these batch tests were conducted in
duplicate. Data were expressed as mean values.
Table 8. Experimental description of BMP bottles with increasing buffering
capacity.
No Labels of BMP
bottles I/S (by volume) Added NaHCO3 (mM)
1 R-0 1/9 0
2 R-15 1/9 15
3 R-30 1/9 30
Another bottle with only sludge mixtures was made as a baseline for comparison. A
blank bottle with digested sludge was prepared for CH4 yield from digested sludge
only to determine the net CH4 yield. During the experiment, CH4 volume was
recorded daily until CH4 production was detected at less than 5 mLCH4/d.
Anaerobic batch digestion set-up
Biomethane production of
substrates
Anaerobic batch digestion tests
Elimination of TrOCs
AD of three kinds
of glycerol
Anaerobic co-digestion of raw
primary sludge and glycerol
AD of raw
primary sludge

40
Another set-up was used to assess BMP of raw primary sludge under anaerobic
condition. The ratio between inoculum and substrate was increased up to 1/1 by
volume. Moreover, digested sludge used in this set-up was already degassed for the
best microbial activity, namely exhausted digested sludge. There were two BMP
bottles of this mixture but no blank sample as a result. These analyses were
conducted in duplicate. Reading of CH4 production was taken daily.
With the purpose of enhancing the CH4 yield, co-digestion was taken place with pure
glycerol (chemical grade) as a co-substrate for sewage sludge. Batch tests were also
conducted to examine how glycerol seeded bottles perform and stabilise. In terms of
performance, CH4 yield and CH4 production rate were evaluated. Mixture sludge at
ratio of I/S (1/9 by volume) was fed to all bottles in this experiment. Once again,
buffer supplement by NaHCO3 (15 and 30 mM) was applied. Unlike the previous
BMP assays, increasing percentages of pure glycerol (0.5% and 1.0% of raw primary
sludge) were added (Table 9). This addition did not change the whole working
volume. Other two reference bottles without pure glycerol were taken into account
for a baseline of CH4 generation with an introduction of 15 and 30 mM NaHCO3,
while CH4 yield of digested sludge only was given from the previous batch test.
Therefore, three sets of bottles, namely R-15 and R-30 for buffer supplement at 15
and 30 mM without added glycerol, R-15-0.5 and R-30-0.5 for 0.5% glycerol
treatments, and R-15-1.0 and R-30-1.0 for 1.0% glycerol treatments, were
established.
Table 9. Experimental description of BMP bottles with glycerol addition.
No Labels of BMP
bottles
I/S
(by volume)
Glycerol
(%of RS)
Added NaHCO3
(mM)
1 R-0 1/9 0 0
2 R-15 1/9 0 15
3 R-30 1/9 0 30
4 R-15-0.5 1/9 0.5 15
5 R-15-1.0 1/9 1.0 15
6 R-30-0.5 1/9 0.5 30
7 R-30-1.0 1/9 1.0 30
One more series of BMP bottles was set up for identifying the actual CH4 yield of
glycerol. In this case, three different kinds of glycerol, i.e. pure, biodiesel and BIA
glycerol, were utilized as a carbon source for anaerobic microorganisms or digested
sludge. They were determined their viscosity by a rheometer (Section 3.3.5). Their
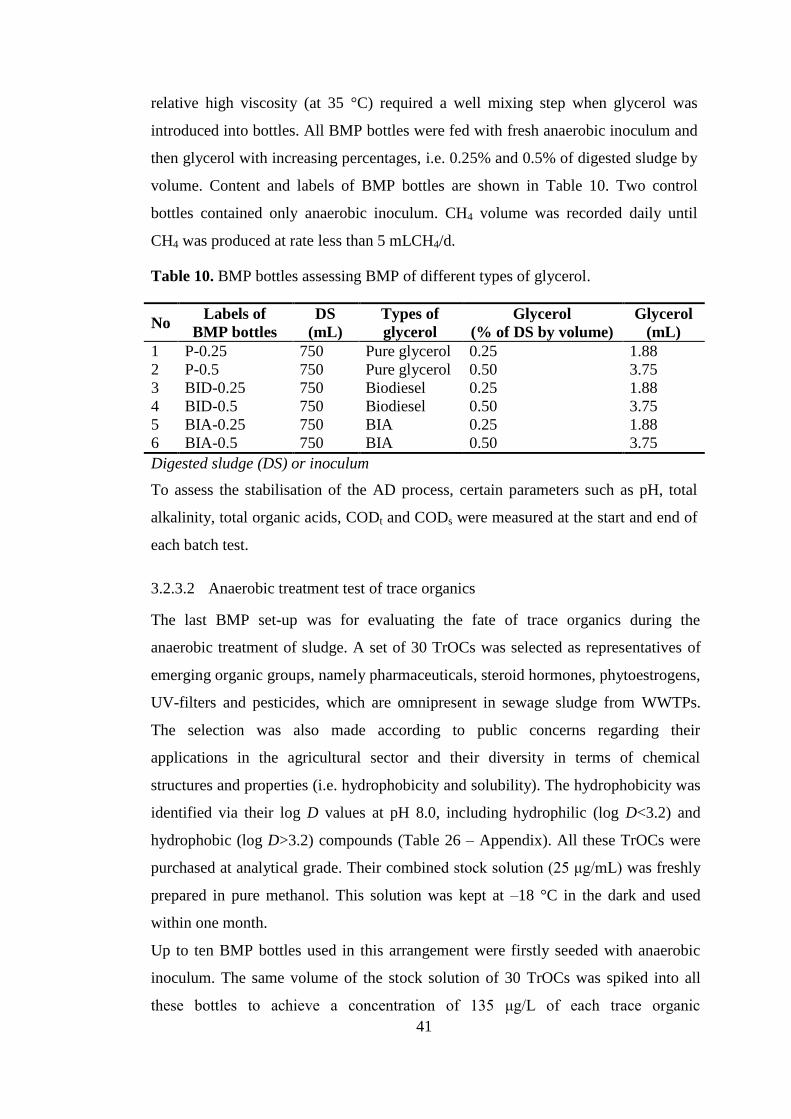
41
relative high viscosity (at 35 °C) required a well mixing step when glycerol was
introduced into bottles. All BMP bottles were fed with fresh anaerobic inoculum and
then glycerol with increasing percentages, i.e. 0.25% and 0.5% of digested sludge by
volume. Content and labels of BMP bottles are shown in Table 10. Two control
bottles contained only anaerobic inoculum. CH4 volume was recorded daily until
CH4 was produced at rate less than 5 mLCH4/d.
Table 10. BMP bottles assessing BMP of different types of glycerol.
No Labels of
BMP bottles
DS
(mL)
Types of
glycerol
Glycerol
(% of DS by volume)
Glycerol
(mL)
1 P-0.25 750 Pure glycerol 0.25 1.88
2 P-0.5 750 Pure glycerol 0.50 3.75
3 BID-0.25 750 Biodiesel 0.25 1.88
4 BID-0.5 750 Biodiesel 0.50 3.75
5 BIA-0.25 750 BIA 0.25 1.88
6 BIA-0.5 750 BIA 0.50 3.75
Digested sludge (DS) or inoculum
To assess the stabilisation of the AD process, certain parameters such as pH, total
alkalinity, total organic acids, CODt and CODs were measured at the start and end of
each batch test.
3.2.3.2 Anaerobic treatment test of trace organics
The last BMP set-up was for evaluating the fate of trace organics during the
anaerobic treatment of sludge. A set of 30 TrOCs was selected as representatives of
emerging organic groups, namely pharmaceuticals, steroid hormones, phytoestrogens,
UV-filters and pesticides, which are omnipresent in sewage sludge from WWTPs.
The selection was also made according to public concerns regarding their
applications in the agricultural sector and their diversity in terms of chemical
structures and properties (i.e. hydrophobicity and solubility). The hydrophobicity was
identified via their log D values at pH 8.0, including hydrophilic (log D<3.2) and
hydrophobic (log D>3.2) compounds (Table 26 – Appendix). All these TrOCs were
purchased at analytical grade. Their combined stock solution (25 μg/mL) was freshly
prepared in pure methanol. This solution was kept at –18 °C in the dark and used
within one month.
Up to ten BMP bottles used in this arrangement were firstly seeded with anaerobic
inoculum. The same volume of the stock solution of 30 TrOCs was spiked into all
these bottles to achieve a concentration of 135 μg/L of each trace organic
42
contaminant. A gentle stirring step was followed in 5 minutes to obtain a
homogenous spike. This concentration is equal to 5μg/gTS, as TS of anaerobic
inoculum was reported at 27 g/L in this batch test. This investigation was operated for
35 digestion days. At particular time intervals, 0, 2, 6, 9, 14, 21, 28, and 35 days, each
bottle was withdrawn for solid phase extraction (SPE) within 24 hours, and
subsequently TrOC analysis. In this series, two non-spiked bottles, containing only
inoculum, were integrated as blank samples. Stability of this anaerobic mineralization
of TrOCs were governed in terms of parameters, including CH4, TS, VS, COD, pH,
alkalinity, and ammonia nitrogen. All analyses were performed in duplicate.
3.3 Analytical methods
3.3.1 Basic parameters
pH was measured by using a Metrohm Advanced pH/Ion Meter at the room
temperature, around 25 °C. TS, VS, and alkalinity were measured according to the
Standard Methods [135].
For measuring TS and VS concentrations, sludge sample (20 mL) was transferred
into pre-weighted crucibles. The crucibles were then placed in a water bath for 1 hour
at 100 °C for dewatering before being placed in an oven for 24 hours at 105 °C. The
crucible was allowed to cool down to room temperature; and the total weight of the
crucibles and dried sample was measured. Accordingly, TS was determined as the
dried sludge retained in the crucibles. The crucible was then placed into an oven
(1400 furnace, Barnstead Thermolyne, Australia) preheated at 550 °C for 15 minutes.
The crucible was allowed to cool down to room temperature and weighted again to
determine VS concentration.
Supernatant collected from 50 mL sample after centrifugation was used for alkalinity
analysis using the titration method [135]. The solution H2SO4 of0.1N was used as the
titrating chemical and was calibrated using 0.05N Na2CO3. Titration was performed
to a pH end-point of 4.5. Alkalinity was calculated according to the following
equation:
mL sample
, N A /L) (mgCaCOAlkalinity
000503
(1)
where: A = mL of standard 0.1 N H2SO4 used, and
N = normality of standard 0.1N H2SO4

43
Total organic acids were measured by the method 5560C with distillation step
followed by titration step with standard 0.1N NaOH to the end-point pH of 8.3 [135].
Result, expressed by mg acetic acids/L, was from the following equation:
fmL sample
, N mL NaOH /L) cetic acidcids (mg aVolatile a
00060 (2)
where: N = normality of standard 0.1N NaOH, and
f = recovery factor for a given distillation apparatus
3.3.2 Chemical oxygen demand
The determination of CODs was performed by centrifuging a volume of sample (20
mL) and filtering through a Milipore HA membrane 0.45 μm pore size [136].
Approximately 10 mL of sample was also used to measure CODt. After appropriate
sample preparation, each sample and one blank (deionized water) were taken for 0.2
mL and introduced into High Range Plus COD Digestion Reagent vials (200 – 15000
mg/L), and heated at 150 °C in a Hach DBR200 COD Reactor for 2 hours. After this
digestion step, vials were cooled down to room temperature to proceed to
colorimetric determination by using a Hach DR/2000 spectrophotometer with
method 435 COD HR (Figure 9). The result was expressed as mg COD/L.
a) b)
Figure 9. Hach equipment for COD determination: a) DBR200 COD Reactor and
b)DR/2000 Spectrophotometer.
3.3.3 Methane yield calculation
During the experiments, the volume of CH4 generated can be calculated from
measurements of the change in liquid height in the column and container.
44
One blank bottle containing only DS with the equivalent volume of sample bottles
was included to account for the CH4 yield generated from inoculum alone. The net
CH4 volume was corrected by subtracting the CH4 volume in the blank from the CH4
volume in the sample at the same time of sampling:
of blank - CH of sample CHn (mL) productioNet CH 444 (3)
BMP, which is based on the chemical nature of substrates, was determined by
normalising the generated CH4 volume against the initial VS or COD weight basis:
ded (g)D or VS adMass of CO
(mL)tive CHNet cumula yield CHCumulative 4
4 (4)
Specific methanogenic activity (SMA) is calculated as the following [137]:
)./(350
dgVSgCODVSV
RSMA
inoculum (5)
where R is daily CH4 production (mLCH4/d), V and VSinoculum are volume and VS
concentration of inoculum (known as digested sludge), and 350 is a conversion factor
according to Mc Carty [138] that every one gram COD is theoretically converted into
350 mL CH4 in one anaerobic digester.
CH4 yield was modelled using the first order degradation equation according to
[139],
kt
o eGtG 1)( (6)
where G(t) is the cumulative CH4 yield at time t (mLCH4/gVSadded or
mLCH4/gCODadded), Go is the ultimate CH4 yield (mLCH4/gVSadded or
mLCH4/gCODadded), which is defined as the final volume of CH4 beyond which no
more CH4 is released, k is the first order rate constant, and t is the digestion time at
which the corresponding cumulative CH4 production is recorded.
The modified Gompertz equation was established by assuming that the CH4
production in batch condition is a function of growth rate of methanogenic bacteria
over time:
1
max
t)(λ
oG
eR
e
o eGG(t) (7)
where G(t) is the cumulative CH4 yield at time t (mLCH4/gVSadded or
mLCH4/gCODadded), Go is the ultimate CH4 yield (mLCH4/gVSadded or
mLCH4/gCODadded), Rmax is the maximum CH4 production rate (mL/d), λ is the

45
duration of lag phase (d), t is the digestion time at which the corresponding
cumulative CH4 production is recorded.
The fitness of these above equation in regulating the CH4 production was assessed
using the nonlinear curve-fitting tool of Matlab. At the same time, all parameters, the
standard error and the coefficient of determination or correlation coefficient (R2)
were also calculated.
Average values of CH4 yields in all experiments were statistically compared by using
one-way ANOVA (Analysis of Variance) in Excel. The calculated F value and
tabulated F value were compared to judge whether difference between two values is
significant or not. If the F value is greater than F critical or calculated P-value is
greater than level of significance (α), there is at least a significant difference between
two means. In this case, the least significant difference (LSD) of any of them was
calculated at α = 0.05 and α = 0.01 as following equation:
r
stLSD
22 (8)
where tα is tabulated value identified from the degree of freedom for error (df) and α,
s2 is the mean square for error (MS), and r is the number of replications on which the
means were computed. MS and df were calculated by using one-way ANOVA tool in
Excel.
3.3.4 Trace organic analysis
Concentrations of TrOCs in the liquid phase were measured by using the method
reported by Hai et al. [140]. The schematic procedure of these methods is described
in Figure 10.

46
Figure 10. A schematic of sample preparation in solid and liquid phases GC-MS
analysis.
Samples were analysed at the particular times during the experiment. At every single
analysis, standard TrOC solution samples were included for the accurate
measurement. At first, sludge samples were centrifuged to separate supernatant and
sludge pellet. In the supernatant, these compounds were initially extracted from 500
mL sample volume using Oasis HLB cartridges (Waters, Milford, MA, USA). They
were then eluted from the cartridges and the eluents were evaporated to dryness.
After that, the dry residues in the vials were derivatised, cooled to room temperature,
and subjected to gas chromatography–mass spectrometry (GC–MS) analysis using a
Shimadzu GC–MS (QP5000) system. TrOC concentrations in solid phase were
determined according to the method previously described by Wijekoon et al. [141].
An extraction step, including sludge pellet freeze-drying and ultrasonic solvent
extraction was used. Sample was then analysed using the same method for the liquid
phase. All analysis was conducted in duplicate.
3.3.5 Viscosity of glycerol
Viscosities of pure, biodiesel, and BIA glycerol as a function of temperature were
measured by using a Physcia MCR 301 Anton Paar Rheometer (Figure 11). The
Sludge samples
(750 mL)
Centrate Sludge pellet Centrifuge (3500 rpm, 4 o C, 10 min)
Freeze drying for 4h (0.5 g)
Ultrasonic solvent extraction
Decanted supernatant
Remaining sample
Centrifuge at 3500 rpm and 10
min
500 mL aqueous sample Dilute with MQ up to 500 mL
Filter through 0.45 µm filter paper and adjust
pH to 2 – 3
Filtrate (500 mL) for SPE GC – MS

47
rheometer was controlled by the RHEOPLUS/32 V3.40 software. The sample
volume was 1 mL.
Figure 11. A photograph of the Anton Paar Physica MCR 301 Rheometer.

48
4 BIOMETHANE POTENTIALOF SEWAGE SLUDGE AND GLYCEROL
This chapter first describes the key characteristics of sewage sludge and glycerol.
Thereafter, batch-mode BMP tests were performed in order to identify their
biodegradability with respect to CH4 yield. Effects of buffer supplement and
inoculum over substrate (I/S) ratio on CH4 yield and process stability were also
evaluated for sewage sludge, respectively. Meanwhile, the biodegradability of three
types of glycerol, namely pure, biodiesel and BIA, were assessed and compared.
4.1 Sewage sludge
4.1.1 Characteristics of sewage sludge
Key properties of raw primary sludge, digested sludge (which was used as
inoculum), and exhausted digested sludge are summarised in Table 11. The TS and
VS over TS ratio of raw primary sludge were 25.3 g/L (or 2.5%) and 90.4%,
respectively. The TS content of raw primary sludge reported here is consistent with
the literature (for example TS content in the range of 2.0 – 8.0%) as can be seen in
Table 1 of Chapter 2. The raw primary sludge used in this study has a high VS
fraction, which is evidence in a VS/TS ratio that is slightly higher than the range of
60 – 80% typically reported in the literature (Table 1). On the other hand, a lower
VS/TS ratio was found in the digested sludge (ca 60%) compared to raw primary
sludge. This is typical for inoculum. As expected, the digested sludge also had a
much lower soluble organic fraction than the raw primary sludge (i.e. 0.8 gCODs/L
compared to 2.7 gCODs/L).
Values of pH of the raw and digested sludge differ markedly from each other. Due to
the primary treatment process used in the sewage treatment plant, raw primary sludge
was relatively acidic (pH = 5.8) and had a low alkalinity (953.8 mgCaCO3/L). On the
other hand, a high pH and much higher buffering capacity (4185.7 mgCaCO3/L)
were observed in digested sludge. This high alkalinity value reflects the stability of
the AD process. Because of the production of VFAs, which accelerates the
acidification stage, inadequate buffering capacity system may lead to system failure.
In order to sustain the stability of anaerobic conversion process, the ratio of VFAs
and total alkalinity should be maintained at below 0.4 [142]. The VFA/total
alkalinity ratio of the digested sludge reported here was 0.17 (Table 11), indicating
that the inoculum were from a healthy anaerobic digester.

49
Ammonia concentration is another parameter to assess the biological performance of
the AD process. As can be seen from Table 11, raw primary sludge used in this study
had low ammonia content (i.e. 543 mg/L). Regarding the effect of ammonia nitrogen
levels on the anaerobic system, Procházka et al. [143] reported that inherent
buffering capacity inside the anaerobic digester is a function of organic acids,
ammonia and bicarbonate content (Section 2.2.3). While these authors confirmed the
inhibitive effect of high ammonia level of 4 g/L, to microorganism, they also
reported the low CH4 production resulted from 0.5 g/L ammonia nitrogen. These
conclusions were dependent on inoculum origin and types of substrates [58]. In the
present study, the inoculum has a high ammonia content (610 mg/L) which was
possibly produced during the methanogenesis step from nitrogen-containing
substrate [42].
After collection, digested sludge further incubated for 24 days to obtain exhausted
digested sludge (Section 2.2.3). VS/TS ratio of exhausted digested sludge was lower
than that of initial digested sludge. Moreover, its buffer capacity relatively increased
up to approximately 6000 mgCaCO3/L possibly due to the production of ammonia
(i.e. 890 mg/L). This incubation process was considered to be favourably operating
without any inhibition since the VFAs/alkalinity ratio was 0.18. Differences in terms
of pH and COD between initial and exhausted digested sludges were negligible.
Table 11. Characteristics of raw, digested, and exhausted digested sludge.
Characteristics Raw primary
sludge
Digested
sludge
Exhausted digested
sludge
TS (g/L) 25.3 21.3 – 27.0 22.9
VS (g/L) 22.9 13.6 – 17.5 13.4
VS/TS (%) 90.4 63.8 – 64.8 58.5
pH 5.8 7.6 7.6
Alkalinity (mgCaCO3/L) 923.8 4185.7 5947.6
CODt (g/L) 22.7 22.4 21.7
CODs (g/L) 2.7 0.8 0.8
CODs/CODt (%) 11.9 3.6 3.7
NH4+-N (mg/L) 543 610 890
Total organic acids
(mg/L) nd 703.8 1073.1
nd = no data

50
4.1.2 Effects of buffer supplement on the anaerobic treatment of sewage sludge
Batch tests were conducted to assess impacts of buffer on biodegradation of RS
under anaerobic condition (Section 3.2.3). Table 12 lists the average values of key
parameters of raw primary sludge and inoculum mixtures before and after the
experimental period.
An increase in pH and buffer capacity occurred along with increasing concentrations
of NaHCO3 or bicarbonate added (Table 12). The addition of NaHCO3 had no impact
on other parameters, including TS, VS, and COD. A slight increase of pH from 6.2 to
6.6 and 6.9 was a result when supplying 15 and 30 mM NaHCO3 into the initial
sludge mixture, respectively. Correspondingly, the buffer capacities increased from
1228 to 1952 and 2929 mgCaCO3/L. As previously discussed in Section 2.2.3, the
optimal pH range of anaerobic process are from 6 to 8. Meanwhile, alkalinity values
obtained here are in line with those (ca 1000 – 3000 mgCaCO3/L) in the literature
[144]. Therefore, the introduction of NaHCO3 facilitated the bacterial activity at the
start-up of digestion.
Table 12. Characteristics of sludge samples.
Characteristics Sludge mixtures
R-0 R-15 R-30
Conte
nt I/S (by volume) 1/9 1/9 1/9
Added NaHCO3 (mM) 0 15 30
Init
ial
val
ues
TS (g/L) 24.1 27.8 31.5
VS (g/L) 21.3 23.1 25.3
pH 6.2 6.6 6.9
Alkalinity (mgCaCO3/L) 1229 1952 2929
CODt (g/L) 31.4 31.7 29.7
CODs (g/L) 2.0 2.2 2.2
Fin
al v
alu
es TS (g/L) 17.7 17.0 18.3
VS (g/L) 14.0 12.6 12.2
pH 4.4 4.5 4.7
Alkalinity (mgCaCO3/L) 605 930 1442
CODt (g/L) 33.5 31.9 30.6
CODs (g/L) 10.8 12.1 12.6
VS removal (%) 34.1 45.7 51.5
Net CODs (g/L) 8.8 9.9 10.4
Net total alkalinity (mgCaCO3/L) 624 1022 1487
R-0, R-15, and R-30 refer to I/S mixture containing 0, 15, and 30 mM NaHCO3,
respectively

51
The cumulative CH4 generation per unit mass of VS or COD added as a function of
time are presented in Figure 12 and Figure 13, respectively. The obtained data can be
described by both the first order and modified Gompertz models (Figure 14). CH4
production occurred immediately at the beginning of the incubation process, due to
the acclimatisation of inoculum to raw primary sludge (Section3.2.3.1). The
cumulative CH4 production increased until day 6 to 8 and no further CH4 production
could be observed. The short duration of batch test in the present study is also
consistent with that reported by Lim et al. [145]. They concluded that all BMP
bottles ceased working after only 6 to 8 days of biogas production, resulting from
either due to adverse conditions developed or the substrates had been depleted [145].
Because of low VS removal (34.1 – 51.5%) observed after incubation, the effect of
unfavourable conditions, including acidic pH (ca 4) and low buffer capacities (605 –
1440 mgCaCO3/L) on methanogenesis was one of the reasons.
The peaks of CH4 production rates were at the first day of digestion for all BMP
bottles, calculated as 151.7, 296.8, and 291.8 mLCH4/gVSadded.d respectively for R-0,
R-15 and R-30 (Figure 12). This confirms the good adaptation of inoculum to
substrates. The lag times derived from the modified Gompertz model showed the
consistency with the practical observation, varying from zero for R-30 to 0.01 and
0.04 days correspondingly for R-0 and R-15 (Table 13). The data indicated that the
high bicarbonate concentration can shorten the lag phase of methanogenesis, which
was also confirmed by Lin et al. [146] as neutral pH in digester was reached. Hao et
al. [147] investigated the extension of lag phase at pH as low as 5.5. The addition of
NaHCO3, a source of easily degradable substrate, could cause this reduction of lag
phase. Lin et al. [146], however, reported that CH4 yield slow down with increasing
bicarbonate levels, which may be due to used higher-concentrated bicarbonates (150
and 200 mM). CH4 yield from buffered reactors was significantly higher than from
the reactors without bicarbonate addition, which may originate from higher buffer
capacity (15 and 30 mM). In turn, the difference of CH4 yields between bottles with
15 and 30 mM of bicarbonate, was found insignificant (P-value = 0.312 > 0.05,
LSDα=0.05 test1). Comparatively, the ultimate CH4 production did not rely on the level
of bicarbonate although there was a slight increase in COD, demonstrating that low
1Least of significant difference at α = 0.05, was computed using the single-factor ANOVA tool in
Excel 2010
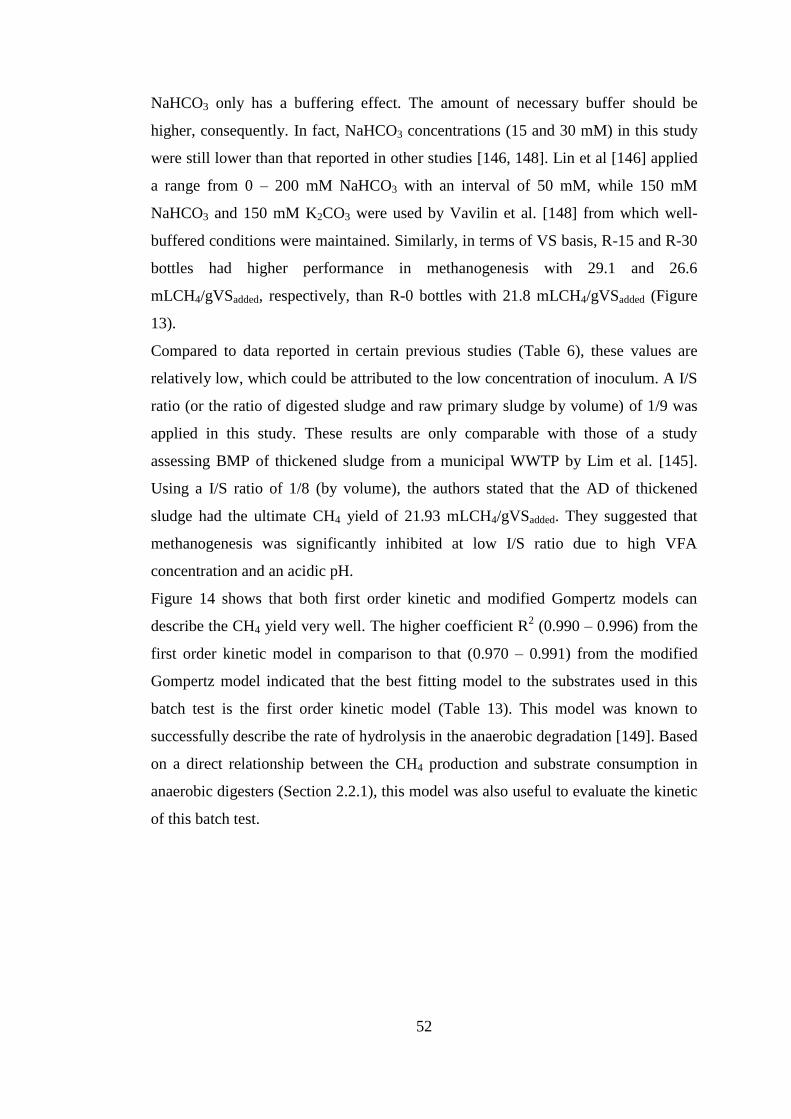
52
NaHCO3 only has a buffering effect. The amount of necessary buffer should be
higher, consequently. In fact, NaHCO3 concentrations (15 and 30 mM) in this study
were still lower than that reported in other studies [146, 148]. Lin et al [146] applied
a range from 0 – 200 mM NaHCO3 with an interval of 50 mM, while 150 mM
NaHCO3 and 150 mM K2CO3 were used by Vavilin et al. [148] from which well-
buffered conditions were maintained. Similarly, in terms of VS basis, R-15 and R-30
bottles had higher performance in methanogenesis with 29.1 and 26.6
mLCH4/gVSadded, respectively, than R-0 bottles with 21.8 mLCH4/gVSadded (Figure
13).
Compared to data reported in certain previous studies (Table 6), these values are
relatively low, which could be attributed to the low concentration of inoculum. A I/S
ratio (or the ratio of digested sludge and raw primary sludge by volume) of 1/9 was
applied in this study. These results are only comparable with those of a study
assessing BMP of thickened sludge from a municipal WWTP by Lim et al. [145].
Using a I/S ratio of 1/8 (by volume), the authors stated that the AD of thickened
sludge had the ultimate CH4 yield of 21.93 mLCH4/gVSadded. They suggested that
methanogenesis was significantly inhibited at low I/S ratio due to high VFA
concentration and an acidic pH.
Figure 14 shows that both first order kinetic and modified Gompertz models can
describe the CH4 yield very well. The higher coefficient R2 (0.990 – 0.996) from the
first order kinetic model in comparison to that (0.970 – 0.991) from the modified
Gompertz model indicated that the best fitting model to the substrates used in this
batch test is the first order kinetic model (Table 13). This model was known to
successfully describe the rate of hydrolysis in the anaerobic degradation [149]. Based
on a direct relationship between the CH4 production and substrate consumption in
anaerobic digesters (Section 2.2.1), this model was also useful to evaluate the kinetic
of this batch test.

53
0 5 10 15 20 25
0
50
100
150
200
0
50
100
150
200
250
300
0 5 10 15 20 25
0
50
100
150
200
CH
4 p
ro
du
cti
on
ra
te (
mL
CH
4/g
VS
ad
ded
.d)
0
50
100
150
200
250
300
Cu
mu
lativ
e C
H4
yie
ld (m
LC
H4
/gV
Sa
dd
ed)
0 5 10 15 20 25
0
50
100
150
200
CH4 production rate Cumulative CH4 yield
Time (d)
0
50
100
150
200
250
300
R1-15
R1-0
R1-30
Figure 12. Cumulative CH4 yield and CH4 production rate for buffered and non-
buffered reactors with increasing buffer concentrations, 0, 15, and 30 mM NaHCO3,
respectively labelled as R-0, R-15, and R-30.

54
0 5 10 15 20 25
0
100
200
300
400
0
10
20
30
0
100
200
300
Cu
mu
lati
ve C
H4 p
ro
du
cti
on
(m
LC
H4
)
Time (d)
Cu
mu
lati
ve C
H4
yie
ld
(mL
CH
4/g
VS
ad
ded
)
Cu
mu
lati
ve C
H4
yie
ld
(mL
CH
4/g
CO
Ds)
R1-0 R1-15 R1-30
Figure 13. Temporal variations of cumulative CH4 production of the sample mixture
R1 (1/9 I/S) supplemented with increasing buffer concentrations, 0, 15, and 30 mM
NaHCO3, respectively labelled as R-0, R-15, and R-30.

55
0 5 10 15 20 240
50
100
150
200
250
300
Time (d)
Cu
mu
lati
ve m
eth
an
e y
ield
(m
LC
H4
/gC
OD
s)
R-0
R-0 first order model
R-0 modified Gompertz model
R-15
R-15 first order model
R-15 modified Gompertz model
R-30
R-30 first order model
R-30 modified Gompertz model
Figure 14. Plots of cumulative CH4 yields on COD basis and regression fitting
curves of the first order and modified Gompertz models.
The greatest VS removal, 51.5%, was achieved in R-30 followed by 45.7% in R-0
and 34.1% in R-15. This low percentage of VS reduction suggests that an incomplete
digestion. Meanwhile, all BMP bottles resulted in a high acidic pH (ca 4.5) and low
alkalinity. A digester imbalance occurred due to low pH, which inhibited biomass
activity. This could be referring to the sharp accumulation of VFAs in the start-up of
the digestion course in combination with the insufficient buffer capacity [143, 145,
146]. This observation is in line with that in a study of Procházka et al. [143] who
demonstrated that incomplete substrate destruction with reference to VS removal of
53.6% was observed as a consequence of poor biomass activity, acidic pH, and high
VFA concentration although pH was neutralised by Na2CO3. The authors also
indicated even lower removal of substrate in other reactors without buffering agent,
only from 13.4% to 29.5% VS removal.
Stable performance of anaerobic treatment could be seen with regards of soluble
matter. In particular, initial and final concentrations of CODs and CODt were in the
proportion with increasing amount of supplemented NaHCO3 (Table 12). Whilst no
significant change was observed in CODt concentrations, the values of net CODs

56
(calculated as subtracting the final to initial CODs concentrations) showed an
increasing trend at the end of this batch tests, 8.8, 9.9, and 10.4 mg COD/L
respectively for bottles R-0, R-15, and R-30. Since CODs represents the extent of
solubilisation [84], this tendency could be mainly attributed to the VFA
accumulation since a decrease in total alkalinity (defined as the difference between
final and initial alkalinity) increased proportionally with an increase of
CODsconcentrations (Table 12). This reflects insufficient contributions of acid
consumers compared to acid formers, suggesting that there were a complete
conversion in the hydrolysis/acidification step and a stress situation in the
methanogenic stage. The same conclusion was also stated by Raposo et al. [142,
144].
Table 13. Kinetic analysis of CH4 production in the batch test of buffer
enhancement.
Models and results
(at 95% confidential interval) R-0 R-15 R-30
Experimental cumulative CH4 yield
(mLCH4/gCODs) 221.8 306.0 294.8
First order kinetic model
k (1/d) 0.688 0.896 0.848
R2
0.996 0.995 0.990
Predicted cumulative CH4 yield
(mLCH4/gCODs)
220.2 ±
2.0
302.5 ±
2.9
289.6 ±
3.8
Modified Gompertz model
Lag phase - λ (d) 0.04 0.01 0.00
R2
0.991 0.976 0.970
Maximum CH4 production rate - Rm
(mLCH4/gCODs.d)
97.8 ±
14.0
177.5 ±
45.0
160.8 ±
23.3
Predicted cumulative CH4 yield
(mLCH4/gCODs)
218.3 ±
2.8 300 ± 6.1
286.9 ±
6.4
In terms of the CH4 production and VS degradation, the NaHCO3 supplement
conclusively resulted in a higher performance. Nevertheless, the level of buffering
capacity applied here was still not adequate as can be seen in the short CH4
production duration (Figure 12) and low VS removal efficiency (Table 12).
4.1.3 Methane production of sewage sludge
Initial and final values of parameters of mixture of raw primary sludge and digested
sludge of 1/1 ratio by volume are summarised in Table 14. Exhausted digested

57
sludge used in this batch series was regarded as a healthy anaerobic consortium
rather than a source of substrate. That means CH4 yield was only derived from raw
primary sludge.
Table 14. Characteristics of raw primary sludge and sludge mixture.
Characteristics Raw primary sludge Sludge mixture
Init
ial
val
ues
TS (g/L) 38.9 32.4
VS (g/L) 34.4 25.2
VS/TS (%) 88.6 77.9
pH 5.8 8.1
Alkalinity (mgCaCO3/L) 923.8 3777.0
CODt (g/L) 48.9 35.3
CODs (g/L) 11.0 5.9
CODs/CODt (%) 22.5 16.7
Fin
al v
alues
TS (g/L) nd 16.8
VS (g/L) nd 10.7
VS/TS (%) nd 63.5
pH nd 7.9
Alkalinity (mgCaCO3/L) nd 5329
CODt (g/L) nd 12.5
CODs (g/L) nd 1.9
CODs/CODt (%) nd 15.2
Rem
oval
effi
cien
cies
(%)
TS nd 48.2
VS nd 57.7
CODt nd 64.8
CODs nd 68.8
nd = no data
Slightly lower solid and organic matter content were observed in the raw primary and
digested sludge mixture compared to those in raw primary sludge. The sludge
mixture thus showed lower ratios of VS/TS and CODs/CODt (i.e. 88.6% and 22.5%)
than those in raw primary sludge (i.e. 77.9% and 16.7%). In spite of this reduction,
the usage of 1/1 (v/v) ratio could offer sufficient bacterial activity from inoculum to
well degraded substrate from raw primary sludge. Moreover, the I/S ratio applied in
this batch test lead to an enhancement in buffer capacity in the sludge mixture. In
particular, pH values and alkalinity values in the sludge mixture were observed at 8.1
and 3777 mgCaCO3/L while those values in raw primary sludge were 5.8 and 923.8
mgCaCO3/L, respectively. It was then expected the stable performance of anaerobic
sludge conversion. Data of digestate characteristics also confirmed this process
stability. Neutral pH (7.9) and high alkalinity value (5329 mgCaCO3/L) remained in
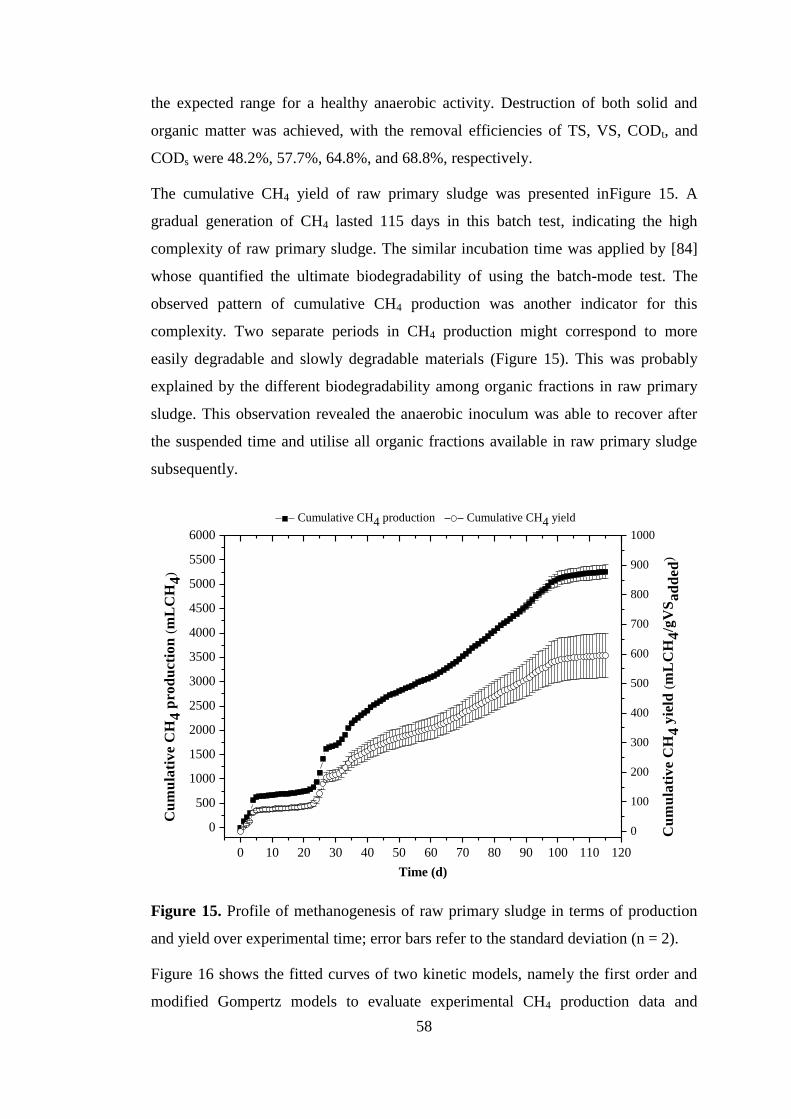
58
the expected range for a healthy anaerobic activity. Destruction of both solid and
organic matter was achieved, with the removal efficiencies of TS, VS, CODt, and
CODs were 48.2%, 57.7%, 64.8%, and 68.8%, respectively.
The cumulative CH4 yield of raw primary sludge was presented inFigure 15. A
gradual generation of CH4 lasted 115 days in this batch test, indicating the high
complexity of raw primary sludge. The similar incubation time was applied by [84]
whose quantified the ultimate biodegradability of using the batch-mode test. The
observed pattern of cumulative CH4 production was another indicator for this
complexity. Two separate periods in CH4 production might correspond to more
easily degradable and slowly degradable materials (Figure 15). This was probably
explained by the different biodegradability among organic fractions in raw primary
sludge. This observation revealed the anaerobic inoculum was able to recover after
the suspended time and utilise all organic fractions available in raw primary sludge
subsequently.
0 10 20 30 40 50 60 70 80 90 100 110 120
0
500
1000
1500
2000
2500
3000
3500
4000
4500
5000
5500
6000
Cumulative CH4 production Cumulative CH4 yield
Time (d)
Cu
mu
lati
ve C
H4
pro
du
cti
on
(m
LC
H4
)
0
100
200
300
400
500
600
700
800
900
1000
Cu
mu
lati
ve C
H4
yie
ld (
mL
CH
4/g
VS
ad
ded
)
Figure 15. Profile of methanogenesis of raw primary sludge in terms of production
and yield over experimental time; error bars refer to the standard deviation (n = 2).
Figure 16 shows the fitted curves of two kinetic models, namely the first order and
modified Gompertz models to evaluate experimental CH4 production data and

59
predict cumulative CH4 yields. Comparatively, the regression coefficients from the
first order equation could not be computed, demonstrating its failure in reflecting the
methanogenesis of such complex substrate as raw primary sludge. Meanwhile, by
using the modified Gompertz equation, the CH4 production seemed to be more
accurately described (R2 = 0.987). Moreover, Kim et al. [90] highly recommended to
use another modified Gompertz equation, namely the modified Gompertz model 2.
The authors demonstrated that this model could successfully describe the progress of
CH4 generation of a substrate with diverse organic fractions. In detail, this model was
developed by adding a secondary term reflecting the second lag time of slowly
degradable matter into the modified Gompertz equation. As such, the modified
Gompertz equation was rewritten as following:
1
2
1
1
22
21
1
1
t)(λG
eR
e
t)(λG
eR
e eGeGG(t) (9)
where G(t) is the cumulative CH4 yield at time t (mLCH4/gVSadded); G1 and G2 are
the CH4 production potential in the initial and secondary stages (mLCH4/gVSadded);
R1 and R2 are the maximum CH4 production rate at the initial and secondary stages
(mL/d); λ1 and λ1 are the duration of initial and secondary lag phases (d); t is the
duration of digestion at which the corresponding cumulative CH4 production is
recorded (d).
The curve-fitting plot of these models and corresponding regression parameters are
shown in Figure 16, Figure 17 and Table 15. In a comparison, results obtained from
the modified Gompertz model showed the high goodness of fit (R2 = 0.995). The
estimated lag times derived from this model were 8.4 and 23.1 days for the more
easily degradable and slowly degradable materials, respectively. Apart from a long
suspension in methanogenesis, the low maximum CH4 production rates were
estimated at the initial and secondary stages (i.e. 5.0 ± 0.1 and 12.2 ± 4.8
mLCH4/gVSadded.d). These observations implied that raw primary sludge possessed
organic fractions showing low CH4 production rates. The presence of slowly
biodegradable portion in sewage sludge was confirmed by Luostarinen et al. [82]
who found that the significant CH4 yield was only attained after 10 – 15 days at the
batch mode. The complexity of raw primary sludge used in this study was found. The
different ultimate CH4 yields was calculated from the modified Gompertz model 2
(Table 15).

60
0 20 40 60 80 100 120
0
100
200
300
400
500
600
Time (d)
Cu
mu
lati
ve m
eth
an
e y
ield
(m
LC
H4/g
VS
ad
ded
)
Experimental cumulative methane yield
The first order model
The modified Gompertz model
Figure 16. Plots of experimental cumulative CH4 yield on VS basis and regression
fitting curves of the first order model and modified Gompertz model applied for raw
primary sludge.
0 20 40 60 80 100 120
0
100
200
300
400
500
600
Time (d)
Cu
mu
lati
ve m
eth
an
e y
ield
(m
LC
H4
/gV
Sa
dd
ed
)
Experimental cumulative methane yield
The modified Gompertz equation 2
Figure 17. Plots of experimental cumulative CH4 yield on VS basis and regression
fitting curve of the modified Gompertz model 2 applied for raw primary sludge.

61
Nevertheless, the experimental and predicted ultimate CH4 yield was of high values,
reporting at 594.6 mLCH4/gVSadded (at digestion day 115) and 731.4 ± 38.5
mLCH4/gVSadded (from the modified Gompertz model), respectively. These values
were comparatively higher with a range reported in the literature (Table 6). This
discrepancy was probably due to various operational infrastructures, biogas
collection systems, and calculation methods applied. It was here highlighted that raw
primary sludge was one of potential substrate for CH4 yield.
Stability in methanogenesis of raw primary sludge was observed during this batch
test due to favourable anaerobic conditions (i.e. neutral pH and high buffer capacity).
Experimental results and kinetic analysis data here gave evidences for the complexity
of raw primary sludge in terms of organic fractions with different biodegradability.
Although raw primary sludge were also identified to possess a great potential of CH4
yield, low CH4 production rate and long lag phase made it unfavourable for a well-
established anaerobic digester. As such, the supplement of substrates rich in readily
biodegradable part was prospectively considered to simulate the methanogenesis of
raw primary sludge in particular and sewage sludge in general.
Table 15. Kinetic analysis of CH4 production potential of raw primary sludge.
Models and results (at 95% confidential interval) Raw primary sludge
Experimental cumulative CH4 yield (mLCH4/gVSadded) 594.6
Modified Gompertz model
Lag phase - λ (d) 2.412
R2
0.987
Maximum CH4 production rate - Rm
(mLCH4/gVSadded.d) 6.3 ± 0.2
Predicted ultimate CH4 yield (mLCH4/gVSadded) 731.4 ± 38.5
Modified Gompertz model2
Lag phase 1 – λ1 (d) 8.438
Lag phase 2 – λ2 (d) 23.12
R2
0.995
Maximum CH4 production rate – R1
(mLCH4/gVSadded.d) 5.0 ± 0.1
Maximum CH4 production rate – R2
(mLCH4/gVSadded.d) 12.2 ± 4.8
Predicted ultimate CH4 yield – G1
(mLCH4/gVSadded) 890.9 ± 109.8
Predicted ultimate CH4 yield – G2
(mLCH4/gVSadded) 98.5 ± 17.2

62
4.2 Glycerol as a co-substrate
4.2.1 Characteristics of pure and crude glycerol
Three different types of glycerol (namely pure, biodiesel and BIA) were used in this
investigation. Their key properties are summarised in Table 16.
In general, high solubility of glycerol in water made it readily bioaccessible to
microorganisms. The high COD levels (1030 – 1140 g/L) of glycerol, moreover,
indicated its high source of biodegradable carbon, the primary substrate for anaerobic
microbes. These observations are in good agreement with that previously reported
(Section 2.3.1).
Comparatively, crude glycerol investigated in this study had a similar range of
glycerol content with that published in the literature (Table 16). A typical crude
glycerol produced from homogeneous base-catalyzed transesterification possesses 50
– 60% of glycerol (Section 2.3.1). Thompson and He [150] reported that the purity of
crude glycerol from various vegetable oils is from 60 – 70%. In another study, the
purity of crude glycerol from seeds and beans was reported at between 78 – 84%
[151].
Table 16. Physicochemical properties of pure and crude glycerol.
Properties Pure Biodiesel BIA
Appearance Clear Amber Pale brown
Odour Odourless Grain like odour Mild odour
pH 6.7 4 8 – 9
Boiling point (°C) 290 >130 >130
Solubility in water Highly soluble Highly soluble Highly soluble
Na content (mg/L) 0 40 16,939
K content (mg/L) 0 119 454
Specific gravity (at 25 °C) 1.26 1.22–1.24 1.25
Glycerol content (%) ≥ 99 ~75-85 ~50
COD (gO2/L) 1048 1030 1140
BIA = BIA glycerol
Certain key physicochemical characteristics of glycerol can be related to their
impurities. Specific gravity is one instance. It has been determined that the specific
gravity of a 100% pure glycerol is about 1.26 at 25 °C. Of used glycerol, biodiesel
and BIA glycerol had a lower specific gravity (1.22 – 1.25) probably due to the

63
presence some lighter constituents than glycerol, such as hydrocarbons and water
[18, 150]. These impurities might be derived from biodiesel production. At the
operational temperature (35 °C), it was indicated that their viscosity was
proportionally increasing to their purity, with the highest viscosity being observed in
pure glycerol, followed by biodiesel and BIA (Figure 18).
10 15 20 25 30 35 40 45 50 55 60 650.0
0.3
0.6
0.9
0.0
0.3
0.6
0.9
0.0
0.3
0.6
0.9
Temperature (°C)
Pure glycerol
Vis
co
sity
(P
a.s
)
Biodiesel
BIA
10 15 20 25 30 35 40 45 50 55 60 65 700.00
0.01
0.02
0.03
0.04
0.05
0.06
0.07
Vis
co
sity
(P
a.s
)
Temperature (°C)
Figure 18. Viscosity of pure glycerol and two types of crude glycerol (biodiesel and
BIA) as a function of temperature from 10 °C to 60 °C.
Another marginal difference between pure and crude forms of glycerol is a variety of
elements. Sodium and potassium content were here reported at relative greater

64
quantities for BIA glycerol at 16939 and 454 mg/L respectively than for biodiesel
glycerol. They are resulted from catalysts used in processing and neutralisation step
[151]. Applying different biodiesel production processes and purifying approaches,
together with various sources of feedstocks, therefore, brought out a wide range of
purity of this versatile byproduct. Consequently, the presence of these impurities may
lead to the lower CH4 production (Section 2.3.2).
4.2.2 Variations of control parameters in the study of methanogenesis of glycerol
Glycerol was introduced into digested sludge at increasing percentages for evaluating
the kinetic and potential of their CH4 productions. Details of this batch test were
described in Section 3.2.3. Characteristics of this seed (labelled as R0), compositions
and some relevant features of sample mixtures are shown in Table 17. 0.25 and 0.5%
each glycerol were mixed with this fresh inoculum to make up sample mixtures.
They were labelled as P-0.25, P-0.5, BID-0.25, BID-0.5, BIA-0.25, and BIA-0.5
(with P, BID, and BIA denotes pure, biodiesel, and BIA glycerol, respectively).
It should be noted that the introduction of low quantity of glycerol into digested
sludge had a negligible impact on all parameters, except for COD and total organic
acids. Irrespectively of glycerol type, pH varied between 8.1 and 8.7. Likewise, there
was a slight fluctuation among buffer capacity values of all sample mixtures.
Compared to background values of digested sludge, including pH of 7.6 and
alkalinity of 4186 mgCaCO3/L, these obtained values were not significantly
different. In this set-up, all BMP bottles were operated with favourite start-up
conditions, including close to neutral pH and reasonably high alkalinity (ca from
3000 to 4000 mgCaCO3/L). As such, it was expected that methanogenesis lasts
longer to accomplish the ultimate CH4yields.
Both TS and VS content in the sample mixtures experienced a slight increase as
related with glycerol loads. In detail, background concentrations of TS and VS were
21.3 g/L and 13.6 g/L, lower than those of sample mixtures of 23.1 – 25.9 g/L and
15.2 – 17.3 g/L, correspondingly. Likewise, initial values of CODs were proportional
to increasing glycerol concentrations. The addition of 0.25% and 0.5% of glycerol
considerably enhanced the organic matter concentrations, around four times in CODs
concentration (Table 17). The ratio between CODs and CODt, so-called COD yields,
expressing the extent of solubilisation of samples. In the sample mixtures, this
fraction was in the range of 3.8 – 18.5%, greater than that of digested sludge (3.5%).

65
Table 17. Key properties of sample mixtures of three types of glycerol and sludge.
Characteristics Sludge samples
Inoculum (DS) P-0.25 P-0.5 BID-0.25 BID-0.5 BIA-0.25 BIA-0.5
Types of glycerol - Pure Pure Biodiesel Biodiesel BIA BIA
Glycerol (% of DS) - 0.25 0.5 0.25 0.5 0.25 0.5
Init
ial
val
ues
TS (g/L) 21.3 23.1 25.9 24.4 24.5 23.7 24.3
VS (g/L) 13.6 15.3 17.3 16.1 16.3 15.2 16.0
pH 7.6 8.7 8.6 8.7 8.1 8.7 8.7
Alkalinity (mgCaCO3/L) 4186 3521 3401 3928 3378 4331 3950
CODt (g/L) 22.4 23.3 25.8 23.9 26.0 23.0 27.1
CODs (g/L) 0.78 0.9 4.0 1.3 4.8 1.3 1.8
Total organic acids (mg/L) 703.9 1468 1781 1941 1964 2412 2699
CODs/CODt (%) 3.5 3.8 15.5 5.4 18.5 5.7 6.6
NH4+-N (mg/L) 610 nd nd nd nd nd nd
Fin
al v
alues
TS (g/L) 22.9 19.7 21.1 21.5 20.6 19.8 20.7
VS (g/L) 13.4 11.5 13.0 13.2 12.9 12.1 12.7
pH 7.7 8.1 8.1 8.0 8.2 8.2 8.2
Alkalinity (mgCaCO3/L) 5948 5023 5042 5140 5033 5316 5423
CODt (g/L) 21.7 17.0 19.2 22.4 19.5 17.4 16.7
CODs (g/L) 0.75 0.43 0.64 0.58 0.64 0.58 0.68
Total organic acids (mg/L) nd 892 817 799 920 1156 1232
NH4+-N (mg/L) nd 1015 1180 1171 1156
VS removal (%) nd 24.8 24.9 18.0 20.9 20.4 20.6
TS removal (%) nd 14.7 18.1 11.9 15.9 16.5 14.8
CODs removal (%) nd 52.2 84.0 54.0 86.6 54.0 61.8
Digested sludge (DS), nd = no data; all data are expressed as mean values; P-0.25, P-0.5, BID-0.25, BID-0.5, BIA-0.25, and BIS-0.5 refer to
mixtures of DS and pure (P), biodiesel (BID) and BIA glycerol at 0.25% and 0.5% each by volume, respectively

66
Simultaneously, the glycerol introduction increased the organic acid levels. This
observation suggests the availability of organic acid content in three types of
glycerol. As seen in Table 17, greater amount of organic acids was observed in crude
than pure glycerol, referring to higher impurity of crude glycerol. It was pointed out
in some studies that this constituent in residual glycerol could be derived from raw
materials and inhibit bacterial activity [151]. From Figure 19, nonetheless, it can be
seen that anaerobic digesters were expected to be constantly well performed without
any risk of acid accumulation since the ratio of total organic acids and alkalinity was
still within the satisfactory range (0.3 – 0.4).
Given that this anaerobic treatment process was launched with initial adequate
control parameters as discussed above, the stability of the anaerobic conversion was
able to be monitored in some extent by evaluating these parameters at the end. All
final values are presented in Table 17.
The final pH values still laid within the range for normal growth of methanogens (ca
8). Furthermore, relatively higher values of total alkalinity at the end, from 5023 to
5948 mgCaCO3/L. These values may implicate the stable performance of this AD
process. Due to the fact that equilibrium of buffer capacity is created by ammonia
nitrogen, organic acids, and CO2 [143], higher buffer capacities after incubation
could be elucidated by the production of ammonia nitrogen or by the consumption of
organic acids. Higher ammonia nitrogen concentrations at the end, up to around 1000
mg/L, were a consequence of biodegradation of the nitrogen-containing matter.
However, no clear relationship between ammonia nitrogen levels and load added as
well as glycerol types was obtained. Hence, these nitrogen-containing materials were
essentially originated from digested sludge but glycerol, a nitrogen-free substrate
[152]. Additionally, there was no accumulation of organic acids regardless of any
used glycerol, reflecting their effective degradation by anaerobic ecosystem. This
indicated no suppression of methanogenic activity happened and the hydrolytic-
acidogenic stage was successfully completed.
Correspondingly, all bottles showed a clear reduction of CODs. As related to
increasing glycerol concentrations, the CODs removal increased with from around 50
to 80% each kind of glycerol (Table 17). Additionally, removal efficiencies of CODt,
TS, and VS were also achieved at lower extent. All mixtures at different glycerol
types and concentrations showed the similar conversion performance of TS and VS,
11.9 – 18.5% of TS removal and 18.0 – 24.9% of VS removal. The values show
67
anaerobic digesters were healthily functioned at the methanogenesis step to consume
soluble matters from hydrolytic-acidogenic step. Another indicator of sustainable
working of current BMP bottles is the ratio of total organic acids and total alkalinity.
In the current batch test, this ratio ranged between 0.15 and 0.2 at the end of
digestion time, showing well-buffered systems (Figure 19).
P-0.25 P-0.5 BID-0.25 BID-0.5 BIA-0.25 BIA-0.25
1000
1500
2000
2500
3000
3500
4000
4500
5000
5500
P-0.25 P-0.5 BID-0.25 BID-0.5 BIA-0.25 BIA-0.25
0.00
0.05
0.10
0.15
0.20
0.25
0.30
0.35
0.40
0.45
0.50
To
tal
alk
an
ity
(m
gC
aC
O3/L
)
Initial values Final values
Th
e r
ati
o o
f to
tal
org
an
ic a
cid
s a
nd
alk
ali
nit
y
Figure 19. Variations of total alkalinity and ratios of total organic acids and total
alkalinity as related to type and concentrations of glycerol; 0.25% and 0.5% addition
of pure (P), biodiesel (BID) and BIA glycerol were labelled as P-0.25, P-0.5, BID-
0.25, BID-0.5, BIA-0.25, and BIA-0.5 respectively; error bars refer to the standard
deviation (n=2).
68
Considering all control parameters, 0.25% and 0.5% of each glycerol applied under
current conditions investigated in the present work are still not beyond the limit
concentration. This is a result of approaching a reasonable I/S ratio, ranging from
1.48 to 1.52 (gCOD/gVS) and from 1.49 to 1.59 (gCOD/gVS) respectively for 0.25%
and 0.5% addition of glycerol.
4.2.3 Methanogenic conversion of glycerol
Figure 20illustrates the cumulative CH4 yield as a function of digestion time with
different types and ratios of glycerol to digested sludge. Data reported here proved
that on average the usage of glycerol, a highly degradable carbon source, stimulated
the anaerobic conversion. CH4 production or substrate utilization rates of all glycerol
treatments mostly showed peaks for the first few days with the highest rate of 0.25%
pure glycerol (193.4 mLCH4/gCOD.d) at the first day. This indicated that anaerobic
microbes were quickly able to digest the glycerol. It could be ascribed to easily
biodegradability of glycerol.
All types of glycerol had the similar fashion of CH4 production, which increased
until around day 10, beyond that a gradual stable trend was reached (Figure 20).
However, two contrasting trends in rates of generating CH4were obtained when
anaerobically treating different types of glycerol. Pure and BIA glycerol showed
higher CH4 potential at lower concentration (0.25%). The time for acclimatisation
could be one of the reasons behind this behaviour. The longer lag phases were
observed in 0.5% compared to that in 0.25% addition of pure and BIA glycerol. This
is due to the fact that bacteria in digested sludge had no previous exposure to
glycerol. On the contrary, higher CH4 production of the digester treating 0.5% than
0.25% biodiesel glycerol was obtained (Figure 20). Residual glycerol from biodiesel
production process had a remarkable methanol content of 8 – 12% by weight [18, 96,
150]. Under anaerobic condition, this constituent is directly converted into CH4.
Accordingly, the more methanol biodiesel glycerol has, the more methanogenic
activity is accelerated.

69
0
100
200
300
400
500
600
700
800
0
50
100
150
200
0
100
200
300
400
500
600
700
800
0
50
100
150
200
0 5 10 15 20 25 30 35 40
0
100
200
300
400
500
600
700
800
0 5 10 15 20 25 30 35 40
0
50
100
150
200
Pure glycerol Pure glycerol
0.25 % each glycerol added 0.5 % each glycerol added
Biodiesel Biodiesel
Net
cu
mu
lati
ve C
H4 y
ield
(m
LC
H4/g
CO
D)
Net
da
ily
CH
4 y
ield
(m
LC
H4/g
CO
D.d
)
BIABIA
Time (d) Time (d)
Figure 20. Cumulative CH4 yield and CH4 production rate of three different types of glycerol, namely pure (P), biodiesel (BID) and BIA, at
increasing concentrations of 0.25% and 0.5%, respectively labelled as P-0.25, P-0.5, BID-0.25, BID-0.5, BIA-0.25, and BIA-0.5.

70
Like the CH4 production rates, similar observations were obtained with cumulative
CH4yield for all types of glycerol. On average, these experimental values were
calculated at 754.5, 449.1, 416.8, 639.5, 720.5, and 303.5 mLCH4/gCOD
respectively for P-0.25, P-0.5, BID-0.25, BID-0.5, BIA-0.25, and BIA-0.5, at day 35.
Data here revealed the comparatively higher performance of BMP bottles to the
values published. Siles López et al. [133] reported cumulative CH4 yields of pre-
treated glycerol achieved the highest point at the lowest loading. They stated that the
acidified glycerol treated with granular sludge exhibited the highest CH4 yield of 323
mLCH4/gCOD. The lowest CH4 yield observed in BIA treatment is in line with these
values. Meanwhile, there is a good agreement between the CH4 yield of 0.25% pure
glycerol and that value reported by Amon et al. [153].
As expected, the higher purity of glycerol, the greater CH4 production of BMP
bottles. The highest CH4 potential (754.5 mLCH4/gCOD) was reached with the pure
form of glycerol even at lower concentration, meanwhile the treatment of 0.5% BIA
resulted in the lowest performance in methanogenesis (303.5 mLCH4/gCOD). There
was, therefore, a correlation of CH4 yield with the impurity of glycerol. Among
substrates, BIA had the lowest pure glycerol and the highest quantity of sodium (16.9
gNa/L), negatively affecting the methanogenesis of this glycerol. Inhibition
concentrations of sodium have been reported widely in the literature [138, 154].
Under anaerobic condition, biomass activity and metabolism of anaerobic microbes
could be readily interfered and then inhibited by high sodium concentration. In the
biological sense, this phenomenon could be explained by the participation of Na+ in
channels on cell membrane and some metabolic steps. McCarty et al. [138]
investigated the effect of sodium concentrations on methanogens, indicating that
moderate to strong inhibition resulted from using 3.5 – 5.5 gNa/L and 8 gNa/L,
respectively. For anaerobic granular biomass, Rinzema et al. [154] reported the
decrease of10, 50, and 100% methanogenic activity was caused by sodium at
concentrations of 5, 10 and 14 g/L, respectively, under mesophilic temperature and
neutral pH.
Plots and kinetic coefficients of the first order and modified Gompertz models are
presented in Figure 21, Figure 22, and Table 18. The soundness of kinetic models
depends on the nature of compounds. It was stated that the first order kinetic model
was suitable for a very simple substrate [155] while the more complex substrate

71
mixture was successfully monitored by using the modified Gompertz model [90].
The complexity of feedstocks according to Kim et al. [90] was due to the mixing of
food waste and sewage sludge. To obtain higher correlation efficiencies, the authors
tested a modified Gompertz model. In this study, data confirmed the fitness of both
kinetic models to CH4 generation of pure and biodiesel glycerol with relative high
correlation (>91%). Results of these kinetic studies showed the short time taken for
initializing the CH4 generation. Regarding BIA, the first order kinetic model is better
fitting to the trend of CH4 production of 0.25% BIA. Alternatively, the modified
Gompertz model showed higher goodness of fit in predicting the methanogenesis of
0.5% BIA. It could be due to this model could not reflect the lag phase of batch tests
properly [90]. Longer lag phase in BMP bottles treating 0.5% BIA was probably
caused by its higher concentration of impurities compared to that of bottles with
0.25% BIA.
0 5 10 15 20 25 30 350
100
200
300
400
500
600
700
Time (d)
Cu
mu
lati
ve m
eth
an
e y
ield
(m
LC
H4
/gC
OD
)
P-0.25
P-0.25 first order kinetic model
P-0.25 modified Gompertz model
P-0.5
P-0.5 first order kinetic model
P-0.5 modified Gompertz model
Figure 21. Plots of cumulative CH4 yields on COD basis and regression fitting
curves of the first order and modified Gompertz models of pure glycerol at two
concentrations of 0.25% (P-0.25) and 0.5% (P-0.5).

72
a)
0 5 10 15 20 25 30 35
0
100
200
300
400
500
600
Time (d)
Cu
mu
lati
ve m
eth
an
e y
iled
(m
LC
H4
/gC
OD
)
BID-0.25
BID-0.25 first order kinetic model
BID-0.25 modified Gompertz model
BID-0.5
BID-0.5 first order kinetic model
BID-0.5 modified Gompertz model
b)
0 5 10 15 20 25 30 350
100
200
300
400
500
600
700
Time (d)
Cu
mu
lati
ve m
eth
an
e y
ield
(m
LC
H4/g
CO
D)
BIA-0.25
BIA-0.25 first order kinetic model
BIA-0.25 modified Gompertz model
BIA-0.5
BIA-0.5 first order kinetic model
BIA-0.5 modified Gompertz model
Figure 22. Plots of cumulative CH4 yields on COD basis and regression fitting
curves using the first order and modified Gompertz models of a) biodiesel (BID) and
b) BIA glycerol at 0.25% and 0.5% concentrations, respectively labelled as BID-
0.25, BID-0.5, BIA-0.25 and BIA-0.5.

73
Theoretical CH4 yield of pure glycerol used in this experiment is calculated at
approximately 428 mLCH4/gCOD using Buswell equation below [156]:
OHCOCHOHHC 224353 5.025.175.1)( (10)
by taking the specific gravity and COD values of pure glycerol of 1.26 and 1,148
gCOD/L, respectively, into account. Data obtained from experimental and predicted
kinetics showed an excess of CH4 yields compared to the theoretical value in case of
0.25% pure glycerol applied (i.e. more than 700 mLCH4/gCOD). Similar
observations were reported in a study on anaerobic co-digesting of glycerol with
sewage sludge [19]. The authors attributed this greater experimental CH4 yield to
active biomass. It was clear that the growth of anaerobic microbes, particularly
methanogens, were simulated by such readily degradable substrates as glycerol.
Meanwhile, the proximate in values of theoretical and practical CH4 yields when
treating 0.5% pure glycerol was found.
Table 18. Kinetic analysis of CH4 production during the batch test of BMP of
glycerol.
Models and kinetic
parameters
(at 95% confidential
intervals)
Pure glycerol Biodiesel
glycerol BIA glycerol
0.25% 0.5% 0.25% 0.5% 0.25% 0.5%
Experimental cumulative
CH4 yield
(mLCH4/gCOD)
754.5 449.1 416.8 639.5 720.5 303.5
First order kinetic model
First order rate constant
– k (1/d) 0.410 0.163 0.261 0.200 0.189 0.131
R2
0.982 0.934 0.941 0.983 0.921 0.915
Predicted cumulative CH4
yield – Go
(mLCH4/gCOD)
738.5 ±
8.7
458.2
± 18.6
390.4 ±
10.0
640.6
± 11.0
668.4 ±
24.6
314.2
± 19.6
Modified Gompertz model
Lag phase – λ (d) 0.154 1.558 0.000 0.185 0.000 3.057
R2
0.985 0.976 0.913 0.988 0.879 0.993
Maximum CH4
production rate – Rm
(mLCH4/gCOD.d)
208.3 ±
26.4
66.1 ±
9.0
72.5 ±
10.7
86.4 ±
8.2
93.6 ±
15.4
57.0 ±
6.3
Predicted cumulative CH4
yield – Go
(mLCH4/gCOD)
732.1 ±
7.8
442.6
± 7.7
381.4 ±
11.2
627.0
± 7.8
642.2 ±
24.9
292.9
± 3.6
On basis of data of control parameters as related to glycerol types and concentrations
suggests, the introduction of 0.25% and 0.5% of three types of glycerol still

74
demonstrated the adequate function of both hydrolytic-acidogenetic and
methanogenetic bacteria. On the other hand, the profile of both experimental and
predicted CH4 yields implicated an obvious dependence of CH4 yields of glycerol on
its degree of impurities (i.e. sodium concentration). It could be concluded that
glycerol could be considered as a feasible feedstock for the AD process owning to
their high CH4 potential. They might be potentially used as a high-yield co-substrate
for enhancing the anaerobic treatment of low-carbon substrates.
4.3 Summary
In this batch test, the potential of CH4 yields and process stability of the anaerobic
conversion of each sewage sludge and glycerol was tested with different buffer
concentrations and I/S ratios.
In terms of system stability, data from experimental observations indicated
methanogens was favoured by the buffer (NaHCO3) supplement. Compared to the
non-buffed bottles, higher performance in producing CH4 was recorded in bottles
with addition of 15 and 30 mM NaHCO3. Lag times estimated from the first-order
and modified Gompertz models gave evidence of such stimulation of CH4 conversion
by buffer addition. Buffer concentrations applied in this study was, however, still not
adequate for stable methanogenesis, possibly due to low inoculum. An increase of
I/S ratio from 1/9 to 1/1 led to the stability in the methanogenesis of raw primary
sludge due to favourable anaerobic conditions (i.e. neutral pH and high alkalinity),
implying an important role of I/S ratio. In this steady state, results of CH4 yield from
experimental data and kinetic analysis demonstrated a great CH4potential of raw
primary sludge. However, low CH4 production rate observed here suggested a need
of readily biodegradable substrate in order to accelerate the methanogenesis of raw
primary sludge in particular and sewage sludge in general.
Another series of BMP tests of glycerol, which has been stated a potential substrate
for anaerobic digestion, was carried out with the adequate inoculum
supplementation. Evaluation of control parameters among three types of glycerol at
different concentrations showed a stable function of anaerobic conversion. It could
be expected from their high experimental and predicted CH4 yields that glycerol
could be a feasible co-substrate for sewage sludge.

75
5 ANAEROBIC CO-DIGESTION OF SEWAGE SLUDGE AND GLYCEROL
A series of anaerobic co-digestion batch tests was performed using raw primary
sludge and glycerol as a co-substrate. It is hypothesized that the addition of glycerol
increases the carbon content of the feed mixtures, resulting in higher CH4 yield. The
effects of glycerol and buffer (NaHCO3) addition on system stability were
simultaneously assessed.
5.1 Characteristics of mixtures of sewage sludge and glycerol
The feeds, which was the mixtures of raw primary sludge and glycerol with the
supplement of buffer (NaHCO3) were characterised for their key characteristics in
Table 19. This table also presents relevant properties of the seed, or digested sludge,
and other sludge samples of raw primary sludge with and without supplied NaHCO3
for comparison. Experimental procedure in this batch test was stated in Section
3.2.3.1. The mixtures of DS and RS at ratio of 1/9 (R-0) was supplemented with 15
mM and 30 mM NaHCO3, one of which was then introduced with 0.5% and 1.0%
glycerol, respectively, labelled as R-15-0.5, R-15-1.0, R-30-0.5, and R-30-1.0.
Reference bottles containing increasing buffer concentrations and no glycerol were
also utilised for co-digestion evaluation. They were R-0, R-15 and R-30,
characteristics of which were discussed in Section 4.1.2.
Similar changes in TS and VS content were observed in BMP bottles supplemented
with NaHCO3 and glycerol. A slightly increase of VS and TS content in glycerol-
added BMP mixtures (i.e. 0.5% and 1.0% pyre glycerol) with buffer compared to
those adding only buffer (i.e. 15 and 30 mM NaHCO3). Consequently, when VS/TS
ratios were evaluated, no variation among these mixtures was observed, between
80.4% and 88.4% (Table 19).
There was no clear effect of the supplement of glycerol on both pH and alkalinity.
Changes of pH of buffered bottles with glycerol added and that of buffered bottles
including no glycerol was negligible irrespectively of glycerol concentrations (Table
19). At 15 mM NaHCO3 added, pH were 6.6 without glycerol addition and changed
to 6.5 after introducing 0.5% and 1.0% of glycerol. Correspondingly, these values
were 6.9 and 6.8 in case of 30 mM NaHCO3. Compared to pH variation, alkalinity
values experienced the same fashion (Figure 23), demonstrating only NaHCO3
proved its effect on enhancing buffer capacities of co-digestion mixtures as expected.

76
Table 19. Physical and biochemical characteristics of sample mixtures in the anaerobic co-digestion test.
Characteristics Sample mixtures
Inoculum (DS) R-0 R-15 R-15-0.5 R-15-1.0 R-30 R-30-0.5 R-30-1.0
Conte
nt I/S (by volume) nd 1/9 1/9 1/9 1/9 1/9 1/9 1/9
Glycerol (% of RS volume) nd Nd nd 0.5 1.0 nd 0.5 1.0
NaHCO3 (mM) nd Nd 15 15 15 30 30 30
Init
ial
val
ues
TS (g/L) 21.3 24.1 27.8 34.4 34.0 31.5 34.0 31.9
VS (g/L) 13.6 21.3 23.1 29.5 29.0 25.3 27.9 26.8
VS/TS (%) 63.8 88.4 83.1 85.8 85.3 80.3 82.1 84.0
pH 7.6 6.2 6.6 6.5 6.5 6.9 6.8 6.9
Alkalinity (mgCaCO3/L) 4186 1229 1952 1959 2090 2929 2709 2490
CODt (g/L) 22.4 31.4 31.7 34.5 37.3 29.7 37.8 39.9
CODs (g/L) 0.78 15.5 2.2 9.7 13.6 2.2 9.1 15.5
CODs/CODt (%) 3.5 6.4 6.9 28.2 24.0 7.4 36.4 38.9
Fin
al v
alues
TS (g/L) 22.9 17.7 17.0 27.5 25.9 18.3 24.2 26.8
VS (g/L) 13.4 14.0 12.6 22.4 20.8 12.2 17.8 21.1
VS/TS (%) 58.5 79.1 74.1 81.5 80.3 66.7 73.6 78.7
pH 7.7 4.4 4.5 4.4 4.4 4.7 4.6 4.9
Alkalinity (mgCaCO3/L) 5948 605 930 837 930 1442 1116 1758
CODt (g/L) 21.7 33.5 31.9 45.9 34.3 30.6 30.7 35.3
CODs (g/L) 0.75 10.8 12.1 13.7 14.0 12.6 15.0 16.4
CODs/CODt (%) 3.5 32.2 37.9 29.8 40.8 41.2 48.9 46.2
VS removal (%) nd 34.1 45.7 24.0 28.3 51.5 34.5 21.0
Digested sludge (DS); raw primary sludge (RS); nd = no data, all data are expressed as mean values; R-15-0.5, R-15-1.0, R-30-0.5, R-30-1.0
refer to the sludge mixture (R-0) supplemented with 15 (R-15) and 30 mM NaHCO3 (R-30), and introduced with 0.5% and 1.0% glycerol each,
respectively

77
R-0 R-15 R-15-0.5 R-15-1.0 R-30 R-30-0.5 R-30-1.0
0
1
2
3
4
5
6
7
pH
Initial pH Final pH Initial alkalinity Final alkalinity
500
1000
1500
2000
2500
3000
3500
4000
Alk
ali
nit
y (
mg
Ca
CO
3/L
)
Figure 23. Values of pH and alkalinity as related to the glycerol and buffer addition
before and after experimental time; R-15-0.5, R-15-1.0, R-30-0.5, R-30-1.0 refer to
the mixture of 10% digested sludge and 90% raw primary sludge by volume (R-0)
supplemented with 15 (R-15) and 30 mM NaHCO3 (R-30), and introduced with 0.5%
and 1.0% glycerol each, respectively.
As discussed previously (Section4.1.2), 15 and 30 mM NaHCO3had an important
role in well buffering the AD process by increasing pH and alkalinity levels without
causing any change of the other parameters. As such, the start-up of this co-digestion
test was facilitated with close to neutral pH and relatively high alkalinity due to the
NaHCO3 supplementation.
Apparently, increase of the biodegradable organic content for BMP bottles
weremainly contributed by organic matter of glycerol. Whilst the glycerol
supplementation caused a slight increase of TS, VS, and CODt, the liquid part of all
co-digestion mixtures had a considerably greater CODs compared to the mono-
digestion bottles (Table 19). Figure 24 shows thatCODs concentration increased
proportional to glycerol addition (i.e. 0.5 and 1.0% v/v glycerol added) at any buffer
concentrations (i.e. 15 and 30 mM NaHCO3). Soluble organic fraction (CODs) values
of mixtures were around four times and seven times higher respectively after adding
0.5 and 1.0% glycerol than mixtures without glycerol addition. Accordingly, there

78
was a corresponding increase in the ratio of CODs over CODt concentrations with the
addition of glycerol, indicating an improved extent of solubilisation in anaerobic co-
digesters. This observation was expected due to the high solubility and purity of
glycerol. There was a good agreement between data obtained here and that widely
reported elsewhere. Several studies have noticed that the introduction of glycerol had
a positive impact on the organic matter in sample mixtures[19, 20, 53, 152, 153, 157-
159]. According to Wohlgemut et al. [157], the COD load was gradually improved
by introducing increasing percentage of both pure and crude glycerol (i.e. 0.5, 1, 2
and 4% by weight) into reactors treating hog manure. A steady increase in COD level
was also stated by Astals et al. [53] when using crude glycerol as a co-fermentation
additive of pig manure. Siles et al. [20] carried out an increase COD load from 185 ±
5 gCODs/L to 300 ± 5 gCODs/L in the water phase by adding 15% glycerol (by
volume) to wastewater from biodiesel production. An even eight times higher in
CODs concentration was also observed in co-digestion bottles (3% crude glycerol
added) compared to reference digester [152, 158].
R-0 R-15 R-15-0.5 R-15-1.0 R-30 R-30-0.5 R-30-1.0
0
5
10
15
20
25
30
VS concentration CODs concentration VS/TS ratio CODs/CODt ratio
Co
ncen
tra
tio
n (
g/L
)
0
10
20
30
40
50
60
70
80
90
100
Ra
tio
(%
)
Figure 24. Changes of VS, CODs, and ratios of VS/TS and CODs/CODt in relation
with glycerol and buffer addition; R-15-0.5, R-15-1.0, R-30-0.5, R-30-1.0 refer to the
mixture of 10% digested sludge and 90% raw primary sludge by volume (R-0)

79
supplemented with 15 (R-15) and 30 mM NaHCO3 (R-30), and introduced with 0.5%
and 1.0% glycerol each, respectively.
Glycerol is highly soluble in water while NaHCO3 addition improves the buffer
capacity. Hence, they were expected to create favourable conditions for anaerobic
conversion in terms of system stability and CH4 production performance.
5.2 Removal of volatile solids and chemical oxygen demand
The characteristics of digestates in this batch test are presented in Table 19. Stability
and performance of single-digestion and co-digestion with glycerol of raw primary
sludge were evaluated via the variations of VS and COD.
In comparison to the feed, after anaerobic metabolism, the digestate of all BMP
bottles have a low pH value in the range of 4.5 – 4.9. This acidic pH range, which
could be interpreted as a build-up of organic acids, can induce the system instability
[142, 160-162]. It is not surprising that buffer capacities were deteriorated in all
digestates (Figure 23). Therefore, NaHCO3 concentrations in this study
unsatisfactorily buffered the AD process. Buffer supplementation, nevertheless, still
exhibited its function since significant differences of alkalinity levels were found
with different NaHCO3 concentrations added to the system. Available alkalinity
values were of 837 – 930 mgCaCO3/L at 15 mM NaHCO3 introduced while bottles
buffered with 30 mM NaHCO3 had alkalinity more than 1000 mgCaCO3/L.
Co-digestion bottles exhibited lower VS content removal than the reference bottles.
Final VS concentrations of BMP bottles with glycerol were significantly higher than
those of co-digestion BMP bottles (Figure 25). At 15 mM added buffer, in particular,
final VS values were 12.6 g/L, 22.4 g/L, and 20.8 g/L as 0%, 0.5%, and 1.0%
addition of glycerol. These observations could be elucidated by two factors. First, the
supplementary organic carbon source from glycerol simulated the biomass growth
related to an increase in VS content. This is also stated by Ma et al. [159] who found
a VS increase of 3 g/L in the UASB reactor with the glycerol supplementation after
33 digestion days. In a more recent study, Fountoulakis et al. [19] reported that an
increase of VS concentration, from 17.9 ± 0.8 g/L to 23.7 ± 0.7 g/L after adding
glycerol was a results of biomass growth stimulation. Second, some particulate
organic matter remained in the digestate of co-digestion bottles could be another
reason. This conclusion was clearly confirmed with data of VS/TS ratios, ranging
from 70% to 80%, which generally were of 60 – 70% in a typical anaerobic digester.

80
Therefore, the hydrolytic bacteria in reference bottles better functioned. Astals et al.
[158] had the same observation and explained by the fact that bacteria in co-digestion
reactors favourably utilised glycerol, while biomass might digest particulate organic
content in raw primary sludge in the absence of glycerol.
The variation of VS removed after digestion in relation to the addition of glycerol
isshown in Figure 25. There was no notable difference of VS removal efficiencies
between buffered and non-buffered BMP bottles. A decreasing trend of VS
destruction was found when BMP bottles were fed with increasing glycerol
concentration. Of BMP bottles buffered with 30 mM NaHCO3, the highest
performance of degrading VS was achieved at 51.5% in the bottle R-15, followed by
34.5% and 21.0% in R-30-0.5 and R-30-1.0 respectively. Likewise, at 15 mM
NaHCO3, bottles with 0%, 0.5%, and 1.0% glycerol added degraded 45.7%, 24.0%,
and 28.3% of available VS correspondingly. The VS elimination was one of
indicators of well hydrolysing particulate organic matter in substrate.
R-0 R-15 R-15-0.5 R-15-1.0 R-30 R-30-0.5 R-30-1.0
0
5
10
15
20
25
Fin
al
VS
co
ncen
tra
tio
ns
(g/L
)
Final VS concentration VS/TS ratio Removal efficiencies
0
10
20
30
40
50
60
70
80
90
100
VS
/TS
ra
tio
(%
)
0
10
20
30
40
50
60
70
80
90
100
Rem
ov
al
eff
icie
ncie
s (%
)
Figure 25. Profile of solid content, including final VS concentrations, VS/TS ratio,
VS removal efficiency at the end of digestion; R-15-0.5, R-15-1.0, R-30-0.5, R-30-
1.0 refer to the mixture of 10% digested sludge and 90% raw primary sludge by
volume (R-0) supplemented with 15 (R-15) and 30 mM NaHCO3 (R-30), and
introduced with 0.5% and 1.0% glycerol each, respectively.
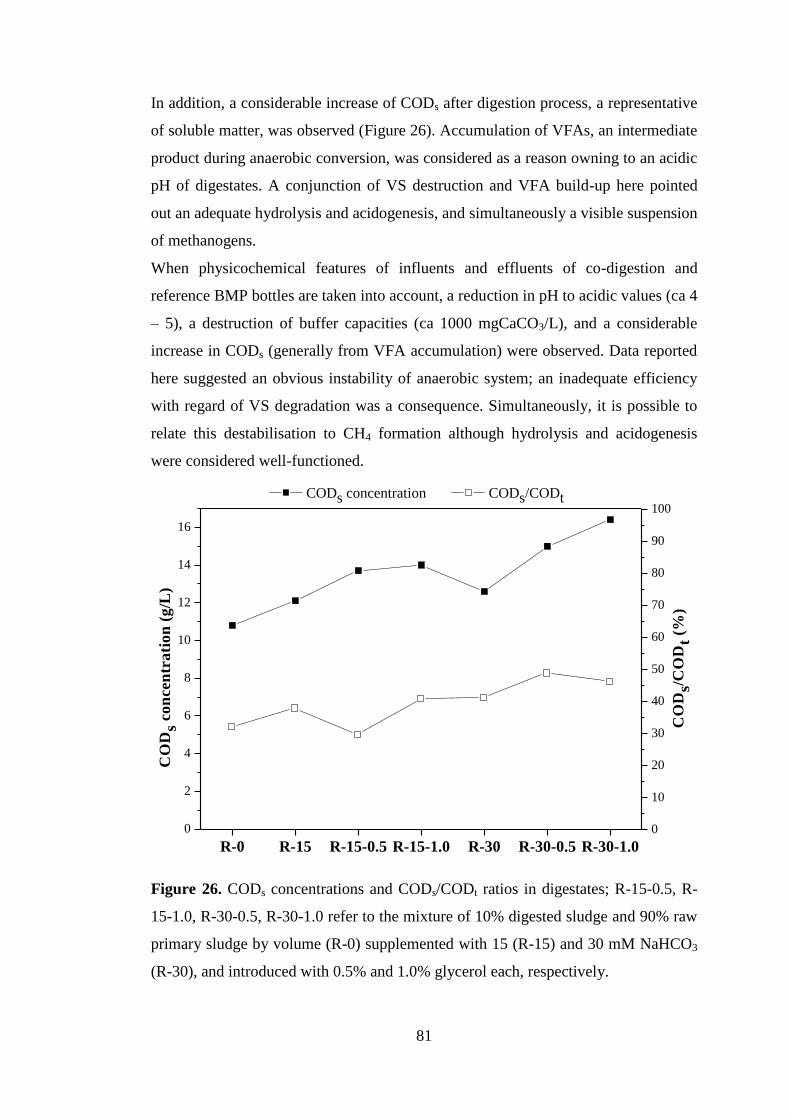
81
In addition, a considerable increase of CODs after digestion process, a representative
of soluble matter, was observed (Figure 26). Accumulation of VFAs, an intermediate
product during anaerobic conversion, was considered as a reason owning to an acidic
pH of digestates. A conjunction of VS destruction and VFA build-up here pointed
out an adequate hydrolysis and acidogenesis, and simultaneously a visible suspension
of methanogens.
When physicochemical features of influents and effluents of co-digestion and
reference BMP bottles are taken into account, a reduction in pH to acidic values (ca 4
– 5), a destruction of buffer capacities (ca 1000 mgCaCO3/L), and a considerable
increase in CODs (generally from VFA accumulation) were observed. Data reported
here suggested an obvious instability of anaerobic system; an inadequate efficiency
with regard of VS degradation was a consequence. Simultaneously, it is possible to
relate this destabilisation to CH4 formation although hydrolysis and acidogenesis
were considered well-functioned.
R-0 R-15 R-15-0.5 R-15-1.0 R-30 R-30-0.5 R-30-1.0
0
2
4
6
8
10
12
14
16
CO
Ds
co
ncen
tra
tio
n (
g/L
)
CODs concentration CODs/CODt
0
10
20
30
40
50
60
70
80
90
100
CO
Ds/
CO
Dt
(%)
Figure 26. CODs concentrations and CODs/CODt ratios in digestates; R-15-0.5, R-
15-1.0, R-30-0.5, R-30-1.0 refer to the mixture of 10% digested sludge and 90% raw
primary sludge by volume (R-0) supplemented with 15 (R-15) and 30 mM NaHCO3
(R-30), and introduced with 0.5% and 1.0% glycerol each, respectively.

82
5.3 Methane potential of co-digestion mixture of sewage sludge and glycerol
The extent and yield of CH4 production were experimentally observed during the
anaerobic co-digestion of raw primary sludge with glycerol in a comparison with
reference bottles. Their estimated results from two kinetic models were also included
in order to predict and evaluate the effects of glycerol on the CH4 conversion of raw
primary sludge.
CH4 production in all BMP bottles reached its peak at the first day of digestion time
(Figure 27). Higher peaks of CH4 production were observed with the co-digestion
bottles compared to the reference bottles (R-0) containing raw primary sludge only.
On average, with15 mM NaHCO3 supplement, the highest CH4 production rates were
reached at 267.5 and 255 mLCH4/d for R-15-0.5 and R-15-1.0, respectively, while
175 mLCH4/d was the highest rate of methanogenesis from R-0. This indicated that
bacteria immediately consumed glycerol. Thus, the addition of glycerol in the feed
accelerated the hydrolysis stage. These observations was probably ascribed to high
particulate matter in raw primary sludge, which are hardly transported into bacteria
cells for further degradation, lengthening CH4 production [56]. After getting the
peaks, CH4 production of co-digestion bottles appeared to significantly slow down
over time. Despite exhibiting the highest CH4 production at the first day (340
mLCH4/d), bottles introduced with 1.0% glycerol essentially ceased forming CH4 in
short digestion time, day 4 and around day 6 for 15 mM and 30 mM NaHCO3 added
bottles, respectively. As discussed previously, there was a clear relation of system
stability and CH4 production. In the digestate of R-30-1.0 bottles, unfavourable
conditions for methanogens, including a drop of pH (from 6.9 to 4.9) and a
destruction of buffer capacity (from 2490 to 1758 mgCaCO3/L) could elucidate the
short methanogenic activity. Correspondingly, these bottles showed the lowest VS
removal efficiency (21%) although they were fed with the highest glycerol (1.0%)
and buffer concentrations (30 mM NaHCO3). Similar tendency in terms of pH drop,
alkalinity decrease, and inadequate VS removal was observed with R-15-1.0 bottles
(Table 19). Meanwhile, bottles treating lower glycerol concentrations had the gradual
trend in generating CH4 and maintained digestion process until around day 14. There
would be hence a shock loading for a sustainable anaerobic metabolism with higher
dosage of glycerol (1.0%).

83
0
20
40
60
80
100
0
20
40
60
80
100
0 2 4 6 8 10 12 14 16 18 20
0
50
100
150
200
250
300
350
0 2 4 6 8 10 12 14 16 18 20
0
50
100
150
200
250
300
350
Cu
mu
lati
ve C
H4
yie
ld
(mL
CH
4/g
VS
rem
ov
al)
R-15 R-15-0.5 R-15-1.0
R-30 R-30-0.5 R-30-1.0
Cu
mu
lati
ve C
H4
yie
ld
(mL
CH
4/g
CO
Da
dd
ed
)
Time (d)
Time (d)
Figure 27. Profile of daily and cumulative CH4 production in the co-digestion batch test; R-15-0.5, R-15-1.0, R-30-0.5, R-30-1.0 refer to the
mixture of 10% digested sludge and 90% raw primary sludge by volume (R-0) supplemented with 15 (R-15) and 30 mM NaHCO3 (R-30), and
introduced with 0.5% and 1.0% glycerol each, respectively.

84
When glycerol content was augmented in co-digestion bottles from 0.5 – 1.0% (v/v)
of raw primary sludge, CH4 production on basis of COD fed was found significantly
higher in reference bottles compared to bottles containing glycerol. Irrespective of
buffer concentrations added, R-15 and R-30 bottles had around six and seven times
higher than corresponding bottles with 0.5% and 1.0% glycerol regarding cumulative
CH4 yields (Figure 28). In spite of an enhanced rapidly biodegradable organic
content in the feed, an incomplete conversion of substrate occurred in co-digestion
bottles, particularly in the methanogenesis. Insufficient buffer capacity for temporary
VFA accumulation was probably one explanation for this system failure. It was even
clear with a considerable increase of CODs in their digestates, which was mainly
contributed by VFAs generated from all bottles, especially glycerol-supplied bottles
(Table 19). The condition was not suitable for methanogenic activity due to the low
I/S ratio as reported normally less than 2 [144, 163]. The early termination of CH4
production and inadequate CH4 yields were a consequence of only 10% by volume of
digested sludge used in this investigation.
On the other hand, higher CH4 volume produced as one gram of VS degraded was
accomplished in bottles after the addition of glycerol in the feed throughout the
whole experimental time. When 30 mM NaHCO3was introduced into BMP bottles,
CH4 yields were 57.9, 70.8, and 95.3 mLCH4/gVSremoval from BMP bottles with 0%,
0.5%, and 1.0% addition of glycerol, respectively (Figure 28). Given the fact that the
CH4 production was proportional to the substrate destruction in a given anaerobic
reactor, data given here suggested that co-digesting raw primary sludge with glycerol
improved the anaerobic biodegradation of solid matter into CH4. Nonetheless, it was
again noted that the CH4 yields and VS removal efficiencies were low compared to
what have been previously reported (Table 6). This observation could explain the
system instability of all co-digestion and reference bottles as previously discussed
(Section 5.2).
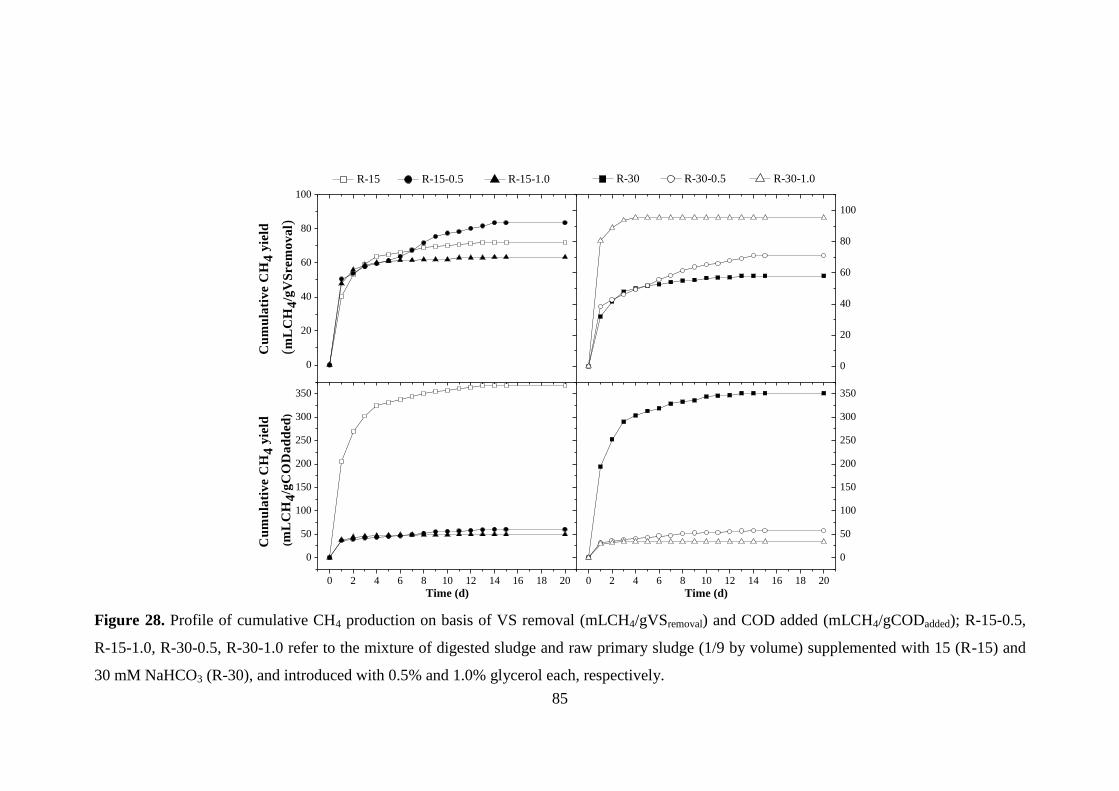
85
0
20
40
60
80
100
0
20
40
60
80
100
0 2 4 6 8 10 12 14 16 18 20
0
50
100
150
200
250
300
350
0 2 4 6 8 10 12 14 16 18 20
0
50
100
150
200
250
300
350
Cu
mu
lati
ve C
H4
yie
ld
(mL
CH
4/g
VS
rem
ov
al)
R-15 R-15-0.5 R-15-1.0
R-30 R-30-0.5 R-30-1.0
Cu
mu
lati
ve C
H4
yie
ld
(mL
CH
4/g
CO
Da
dd
ed
)
Time (d)
Time (d)
Figure 28. Profile of cumulative CH4 production on basis of VS removal (mLCH4/gVSremoval) and COD added (mLCH4/gCODadded); R-15-0.5,
R-15-1.0, R-30-0.5, R-30-1.0 refer to the mixture of digested sludge and raw primary sludge (1/9 by volume) supplemented with 15 (R-15) and
30 mM NaHCO3 (R-30), and introduced with 0.5% and 1.0% glycerol each, respectively.
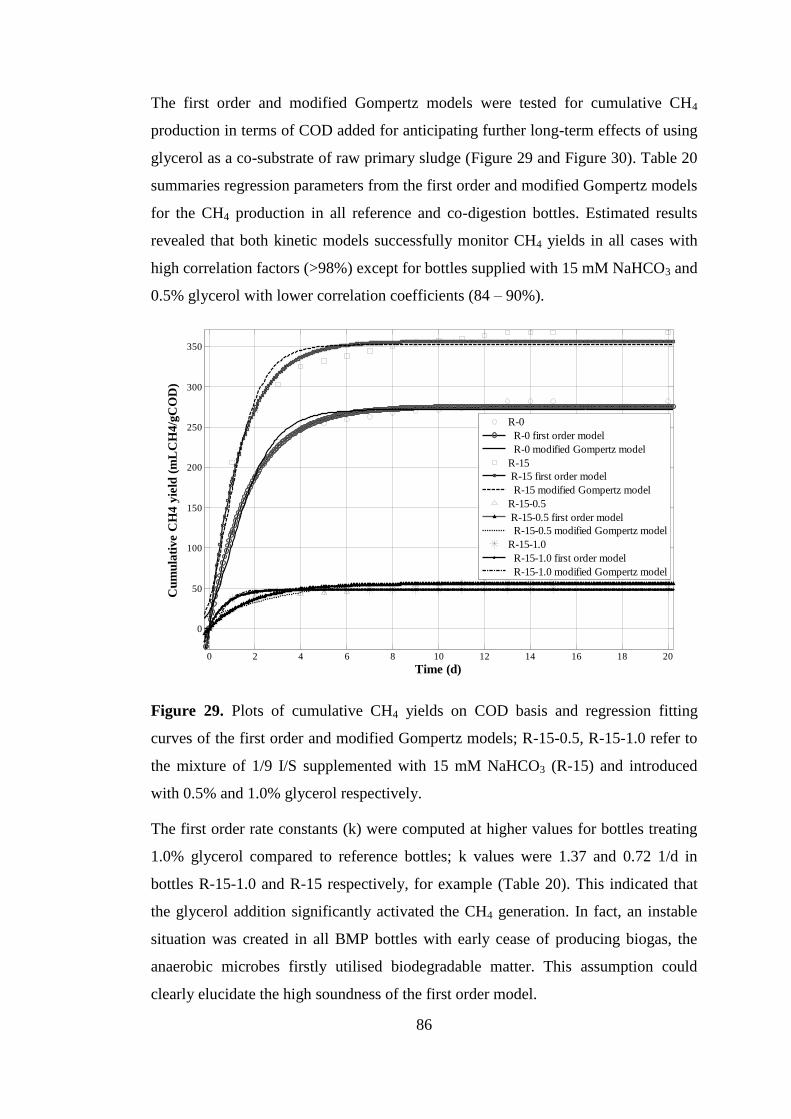
86
The first order and modified Gompertz models were tested for cumulative CH4
production in terms of COD added for anticipating further long-term effects of using
glycerol as a co-substrate of raw primary sludge (Figure 29 and Figure 30). Table 20
summaries regression parameters from the first order and modified Gompertz models
for the CH4 production in all reference and co-digestion bottles. Estimated results
revealed that both kinetic models successfully monitor CH4 yields in all cases with
high correlation factors (>98%) except for bottles supplied with 15 mM NaHCO3 and
0.5% glycerol with lower correlation coefficients (84 – 90%).
0 2 4 6 8 10 12 14 16 18 20
0
50
100
150
200
250
300
350
Time (d)
Cu
mu
lati
ve C
H4
yie
ld (
mL
CH
4/g
CO
D)
R-0
R-0 first order model
R-0 modified Gompertz model
R-15
R-15 first order model
R-15 modified Gompertz model
R-15-0.5
R-15-0.5 first order model
R-15-0.5 modified Gompertz model
R-15-1.0
R-15-1.0 first order model
R-15-1.0 modified Gompertz model
Figure 29. Plots of cumulative CH4 yields on COD basis and regression fitting
curves of the first order and modified Gompertz models; R-15-0.5, R-15-1.0 refer to
the mixture of 1/9 I/S supplemented with 15 mM NaHCO3 (R-15) and introduced
with 0.5% and 1.0% glycerol respectively.
The first order rate constants (k) were computed at higher values for bottles treating
1.0% glycerol compared to reference bottles; k values were 1.37 and 0.72 1/d in
bottles R-15-1.0 and R-15 respectively, for example (Table 20). This indicated that
the glycerol addition significantly activated the CH4 generation. In fact, an instable
situation was created in all BMP bottles with early cease of producing biogas, the
anaerobic microbes firstly utilised biodegradable matter. This assumption could
clearly elucidate the high soundness of the first order model.

87
0 2 4 6 8 10 12 14 16 18 20
0
50
100
150
200
250
300
350
Time (d)
Cu
mu
lati
ve C
H4
yie
ld (
mL
CH
4/g
CO
D)
R-0
R-0 first order model
R-0 modified Gompertz model
R-30
R-30 first order model
R-30 modified Gompertz model
R-30-0.5 vs. t
R-30-0.5 first order model
R-30-0.5 modified Gompertz model
R-30-1.0 vs. t
R-30-1.0 first order model
R-30-1.0 modified Gompertz model
Figure 30. Plots of cumulative CH4 yields on COD basis and regression fitting
curves of the first order and modified Gompertz models; R-30-0.5, R-30-1.0 refer to
the mixture of digested sludge and raw primary sludge (1/9 by volume)
supplemented with 30 mM NaHCO3 (R-30) and introduced with 0.5% and 1.0%
glycerol respectively.
In order to more properly evaluate the trend of CH4 formation over experimental
period, the modified Gompertz model was tested. From this model, two other
important parameters, including CH4 production rate and lag phase time, were
obtained. The lag phase time was clearly seen from 1.0 % glycerol-added bottles,
reported at 0.14 and 0.17 days with 15 and 30 mM NaHCO3, respectively; while the
other bottles immediately produced CH4. In co-digestion bottles, ultimate CH4 yields
decreased along with increased glycerol addition (0.5 and 1.0%). By contrast, the
maximum CH4 production rates seemed to be achieved higher with more glycerol
fed. CH4 production was therefore simulated but not well maintained over digestion
time. It is clear that the influence of glycerol addition on the methanogenesis with
respect to yields and stability. In a comparison with reference bottles, higher rates of
forming CH4 were obtained from R-15 and R-30 bottles; however, lower CH4
production rates were found in these buffered bottles with glycerol addition (Table
20). This is because the anaerobic conversion of glycerol led to rapid VFA
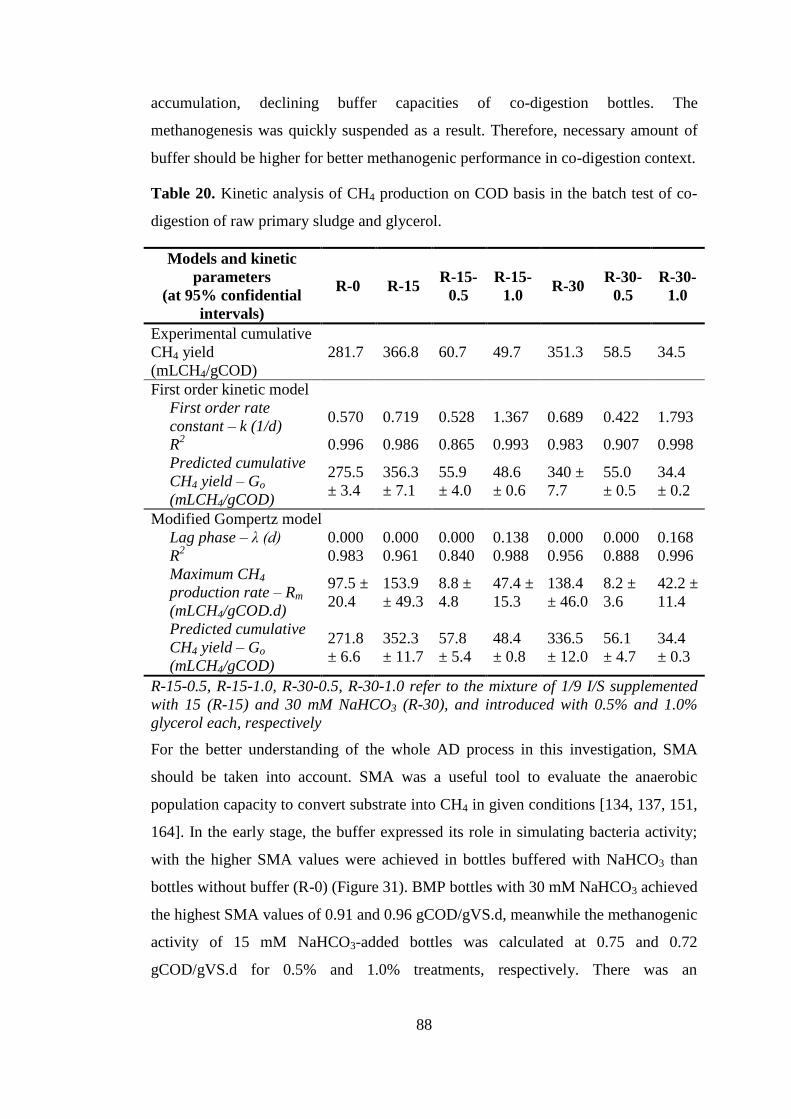
88
accumulation, declining buffer capacities of co-digestion bottles. The
methanogenesis was quickly suspended as a result. Therefore, necessary amount of
buffer should be higher for better methanogenic performance in co-digestion context.
Table 20. Kinetic analysis of CH4 production on COD basis in the batch test of co-
digestion of raw primary sludge and glycerol.
Models and kinetic
parameters
(at 95% confidential
intervals)
R-0 R-15 R-15-
0.5
R-15-
1.0 R-30
R-30-
0.5
R-30-
1.0
Experimental cumulative
CH4 yield
(mLCH4/gCOD)
281.7 366.8 60.7 49.7 351.3 58.5 34.5
First order kinetic model
First order rate
constant – k (1/d) 0.570 0.719 0.528 1.367 0.689 0.422 1.793
R2
0.996 0.986 0.865 0.993 0.983 0.907 0.998
Predicted cumulative
CH4 yield – Go
(mLCH4/gCOD)
275.5
± 3.4
356.3
± 7.1
55.9
± 4.0
48.6
± 0.6
340 ±
7.7
55.0
± 0.5
34.4
± 0.2
Modified Gompertz model
Lag phase – λ (d) 0.000 0.000 0.000 0.138 0.000 0.000 0.168
R2
0.983 0.961 0.840 0.988 0.956 0.888 0.996
Maximum CH4
production rate – Rm
(mLCH4/gCOD.d)
97.5 ±
20.4
153.9
± 49.3
8.8 ±
4.8
47.4 ±
15.3
138.4
± 46.0
8.2 ±
3.6
42.2 ±
11.4
Predicted cumulative
CH4 yield – Go
(mLCH4/gCOD)
271.8
± 6.6
352.3
± 11.7
57.8
± 5.4
48.4
± 0.8
336.5
± 12.0
56.1
± 4.7
34.4
± 0.3
R-15-0.5, R-15-1.0, R-30-0.5, R-30-1.0 refer to the mixture of 1/9 I/S supplemented
with 15 (R-15) and 30 mM NaHCO3 (R-30), and introduced with 0.5% and 1.0%
glycerol each, respectively
For the better understanding of the whole AD process in this investigation, SMA
should be taken into account. SMA was a useful tool to evaluate the anaerobic
population capacity to convert substrate into CH4 in given conditions [134, 137, 151,
164]. In the early stage, the buffer expressed its role in simulating bacteria activity;
with the higher SMA values were achieved in bottles buffered with NaHCO3 than
bottles without buffer (R-0) (Figure 31). BMP bottles with 30 mM NaHCO3 achieved
the highest SMA values of 0.91 and 0.96 gCOD/gVS.d, meanwhile the methanogenic
activity of 15 mM NaHCO3-added bottles was calculated at 0.75 and 0.72
gCOD/gVS.d for 0.5% and 1.0% treatments, respectively. There was an

89
independence between glycerol dosage and methanogenic activity, glycerol
accordingly caused no inhibitory effects on methanogenic consortium.
R-0 R-15 R-15-0.5 R-15-1.0 R-30 R-30-0.5 R-30-1.0
0.0
0.1
0.2
0.3
0.4
0.5
0.6
0.7
0.8
0.9
1.0
SM
A (
gC
OD
/gV
S.d
) The first day The first four days From day 5 onward
Figure 31. Profile of SMA of reference bottles and co-digestion bottles; R-15-0.5, R-
15-1.0, R-30-0.5, R-30-1.0 refer to the mixture of 1/9 I/S supplemented with 15 (R-
15) and 30 mM NaHCO3 (R-30), and introduced with 0.5% and 1.0% glycerol each,
respectively.
It has been reported that higher SMA values could result in higher the rates of CH4
generation on VS basis [137]. There was a clear correspondence between of SMA
and CH4 production rate as far as their patterns over the experimental time were
concerned. The maximum SMA values were at the first day for all co-digestion and
reference bottles, followed by a gradual decrease in bottles without glycerol but an
immediate drop in glycerol-contained feeds. Furthermore, when the SMA values in
this investigation were averaged for the first five digestion days, healthier biomass
activity was observed in bottles containing no glycerol (R-0, R-15, and R-30). From
day 5 onwards, on average, all BMP bottles remained low methanogenic activity;
even a suspension of CH4-forming bacteria was found in R-30-1.0 bottles (Figure
31). In the long-term operation, it can be concluded that this reduction in SMA was
associated to excess organic matter and the insufficient bacterial function, expressed

90
as the low I/S ratio of 1/9 by volume tested. This finding was confirmed by Souto et
al. [134] who found that SMA values were more dependent on the ratio of food and
microorganism than substrate concentration only. Moreover, considering SMA
greatly depends on the particular operational conditions and digestion duration [134,
145], it is evitable to further investigate various ratios of inoculum amount and
glycerol concentrations under definite conditions to determine the threshold for a
stable AD process.
In summary, the supplement of 0.5% and 1.0% of glycerol into raw primary sludge
was satisfactory in terms of CH4 production within the start-up stage. This
improvement resulted from the enhancement of organic source with regard to CODs,
the highly biodegradability and solubility of glycerol. Nonetheless, certain
characteristics of digestates, typical of higher CODs, acidic pH and inadequate
alkalinity as well as short methanogenic duration, indicated the incomplete anaerobic
biodegradation for the prolonged operation. Therefore, in terms of system stability,
additional carbon matter from glycerol only proved its positive effects on the
hydrolytic-acidogenetic stage rather than methanogenesis. These results indicated
that glycerol could be used as a co-substrate; however, the appropriate I/S ratio and
buffer supplementation should be further studied in order to prevent overloading and
attain the ultimate CH4 potential.
5.4 Summary
Data from this anaerobic co-digestion test of raw primary sludge and glycerol
pointed out that the addition of 0.5% and 1.0% of glycerol into raw primary sludge
was satisfactory in terms of daily and cumulative CH4 production within the start-up
stage. This improvement resulted from the enhancement of organic source with
regard to CODs, the highly biodegradability and solubility of glycerol. On the other
hand, certain characteristics of digestates, namely higher CODs, acidic pH and
inadequate alkalinity as well as short methanogenic duration, indicated the
incomplete anaerobic biodegradation for the long-term operation. These findings
indicated effects of I/S ratio and buffer supplementation on system stability and then
the ultimate CH4 potential. Their appropriate levels should be further investigated to
optimize CH4 generation of anaerobic co-digestion.

91
6 FATE OF TRACE ORGANIC COMPOUNDS DURING ANAEROBIC
DIGESTION OF SEWAGE SLUDGE
This chapter aims to evaluate the removal efficiency of TrOCs under anaerobic
condition and their biodegradation as well as distribution between the aqueous
(water) and solid (sludge) phases. The overall performance of the AD process was
examined with respect to biogas production and COD removal, followed by the
removal of these TrOCs and their behaviour in the water and solid phases.
6.1 Overall performance of AD of trace organics
The overall performance of the anaerobic degradation of trace organic-spiked sludge
was evaluated by focusing on the evolution of the variation of relevant parameters,
namely pH, alkalinity, ammonia nitrogen, organic acids, VS/TS ratio, VS and CODs,
and the production of CH4 throughout the digestion time.
6.1.1 The variation of control parameters during over the digestion time
Table 21 presents key characteristics of digested sludge and digested sludge spiked
with TrOCs. Data from BMP experiments using only digested sludge were used as
the reference. This table also shows the variations of these characteristics in TrOC-
spiked bottles at a particular time during the digestion time.
After spiking, no considerable change in most parameters was observed. In
particular, pH values were 7.8 for reference and TrOC-spiked bottles; accordingly,
alkalinity values in theses bottles were similar (4233 and 4316 mgCaCO3/L for
digested sludge without and with TrOCs, respectively). TS and VS content were
slightly higher in reference bottles compared to spiked bottles (27.0 gTS/L and 17.5
gVS/L in bottles before spiking and 25.8 gTS/L and 16.3 gVS/L after spiking,
respectively). However, the VS/TS ratio remained unchanged and was 64% in both
cases. CODs increased significantly with the addition of TrOCs, due to the addition
of the stock solution of TrOCs. The amount of TrOCs (135 μg/L) used here did not
cause any change in CODs concentration. The increase in CODs concentration is
from methanol, which was used as the solvent for the preparation of TrOC stock
solution.

92
Table 21. Characteristics of digested sludge bottles and TrOC-spiked bottles
throughout the experimental time.
Characteristics Sample mixtures
DS R-0 R-2 R-6 R-9 R-14 R-21 R-28 R-35
Conte
nt
Anaerobic
digested
sludge (mL)
750 750 750 750 750 750 750 750 750
TrOCs (μg/L) nd 135 135 135 135 135 135 135 135
Day of
sampling
(nth
day)
nd 0 2 6 9 14 21 28 35
Par
amet
ers
TS (g/L) 27.0 25.8 25.6 26.4 24.3 24.8 24.1 23.7 24.2
VS (g/L) 17.5 16.3 15.9 16.5 15.3 15.0 14.6 14.1 14.5
VS/TS (%) 64.9 63.3 62.1 62.2 62.9 60.4 60.5 59.7 59.9
pH 7.8 7.9 7.6 7.7 7.8 7.8 7.8 8.3 7.8
Alkalinity
(mgCaCO3/L) 4233 4316 4211 4389 4237 4115 4665 2374 2656
CODt (g/L) 28.4 26.0 29.6 28.2 21.3 23.1 20.7 21.7 19.5
CODs (g/L) 0.44 3.51 3.61 1.67 0.89 0.95 1.07 0.76 1.08
CODs/CODt
(%) 1.5 13.5 12.2 5.9 4.2 4.1 5.2 3.5 5.5
Digested sludge (DS); nd = no data; R-0, R-2, R-6, R-9, R-14, R-21, R-28, and R-35
refer to TrOC-spiked digested sludge bottles sampled at day 0, 2, 6, 9, 14, 21, 28,
and 35, respectively; All data are expressed as mean values
Throughout the experiment, values of chemical control parameters as a function of
time were in the desirable range for the AD process. The pH varied in the range of
7.6 – 8.3, which was favourable for the normal growth of anaerobic microbes. The
stable values of pH can be attributed the relatively high buffer capacities of TrOC-
spiked bottles with an initial alkalinity values of 4316 mgCaCO3/L. Figure 32
presents the variation of pH and alkalinity during the course of digestion. Alkalinity
values remained stable at the value of more than 4000 mgCaCO3/L until day 21 and
reduced to more than 2000 mgCaCO3/L for the remaining period of digestion. These
values are compatible with those previously reported for the normal growth of
anaerobic microbes [44].

93
Dig
este
d slu
dge
Day
0
Day
2
Day
6
Day
9
Day
14
Day
21
Day
28
Day
35
7.4
7.6
7.8
8.0
8.2
8.4
8.6
pH Alkalinity
pH
Digestion time
2000
2500
3000
3500
4000
4500
5000
Alk
ali
nit
y (
mg
Ca
CO
3/L
)
Figure 32. Profile of pH and alkalinity values in digested sludge bottles and spiked
digested sludge bottles at the particular digestion time.
Because digested sludge was used as the inoculum, the reductions in TS and VS over
35 days were small (Table 21). However, the removal of soluble organic matter
measured by CODs was significant (Figure 33). The solubilisation and acid
formation of methanol in the hydrolytic-acidogenic stage were responsible for such
increase. From day 2, a significant decrease in CODs could be observed reaching a
stable concentration at around 1gCODs/L after day 9. Due to an insignificant
variation of CODt over the digestion time, it is not surprising that the ratio of CODs
and CODt exhibited the same pattern with CODs during the course of incubation.

94
Dig
este
d slu
dge
Day
0
Day
2
Day
6
Day
9
Day
14
Day
21
Day
28
Day
35
0.0
0.5
1.0
1.5
2.0
2.5
3.0
3.5
4.0
CODs CODs/CODt
CO
Ds (
g/L
)
Digestion time
0
2
4
6
8
10
12
14
16
18
20
CO
Ds/C
OD
t (%
)
Figure 33. Profile of CODs and ratio of CODs/CODt of digested sludge and digested
sludge spiked with TrOCs from ay 0 to day 35 of digestion.
6.1.2 Anaerobic conversion of trace organic compounds
Figure 34 shows the daily and cumulative CH4 produced from tested bottles versus
those from reference bottles. Throughout the experiment, the similar performance of
methanogenesis in terms of daily production was observed in both reference and
spiked bottles. The only exception is that CH4 production from bottles containing
TrOCs was significantly higher to that of the reference bottles from day 4 to 9. This
initial high CH4 yield in TrOCs-spiked bottles could be attributed to the addition of
methanol, which was used as the solvent in preparing the TrOC stock solution.
Methanol is a readily amenable carbon source. After the biodegradation of methanol
in day 5 to day 8, which resulted in a high CH4 production rate, the process returned
to normal, and CH4 productions from the TrOC spiked and unspiked bottles were
similar. These results confirm that the addition of TrOCs in methanol did not cause
any inhibitory effects to the AD process.

95
0
500
1000
1500
2000
2500
3000
0 5 10 15 20 25 30 35
0
100
200
300
400
500
600
700
Cu
mu
lati
ve m
eth
an
e p
ro
du
cti
on
(m
LC
H4)
Digested sludge Digested sludge with TrOCs
Da
ily
meth
an
e p
ro
du
cti
on
(m
LC
H4/d
)
Time (d)
Figure 34. Profile of daily and cumulative CH4 production of reference and TrOC-
spiked MBP bottles over 35 days; error bars refer to the standard deviation (n = 2).
The first order and modified Gomperzt kinetic models were used to describe the CH4
yields as a function of time (Figure 35). The first order kinetic model could not
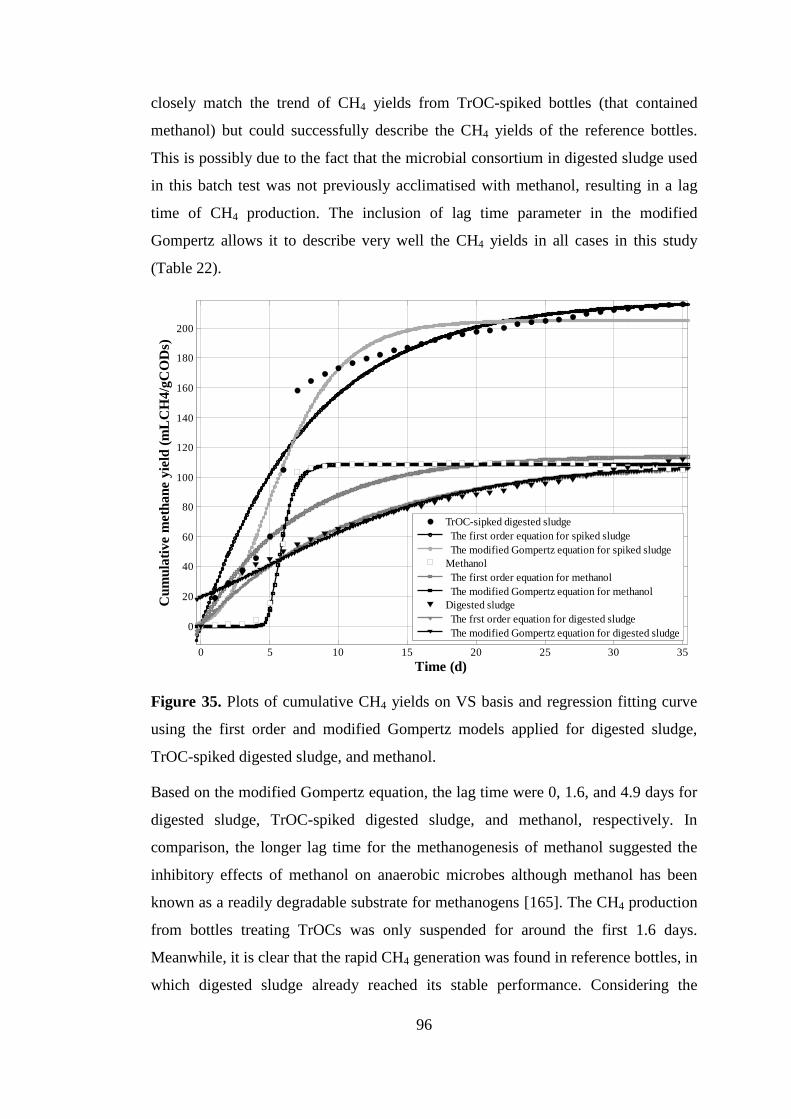
96
closely match the trend of CH4 yields from TrOC-spiked bottles (that contained
methanol) but could successfully describe the CH4 yields of the reference bottles.
This is possibly due to the fact that the microbial consortium in digested sludge used
in this batch test was not previously acclimatised with methanol, resulting in a lag
time of CH4 production. The inclusion of lag time parameter in the modified
Gompertz allows it to describe very well the CH4 yields in all cases in this study
(Table 22).
0 5 10 15 20 25 30 35
0
20
40
60
80
100
120
140
160
180
200
Time (d)
Cu
mu
lati
ve m
eth
an
e y
ield
(m
LC
H4/g
CO
Ds)
TrOC-sipked digested sludge
The first order equation for spiked sludge
The modified Gompertz equation for spiked sludge
Methanol
The first order equation for methanol
The modified Gompertz equation for methanol
Digested sludge
The frst order equation for digested sludge
The modified Gompertz equation for digested sludge
Figure 35. Plots of cumulative CH4 yields on VS basis and regression fitting curve
using the first order and modified Gompertz models applied for digested sludge,
TrOC-spiked digested sludge, and methanol.
Based on the modified Gompertz equation, the lag time were 0, 1.6, and 4.9 days for
digested sludge, TrOC-spiked digested sludge, and methanol, respectively. In
comparison, the longer lag time for the methanogenesis of methanol suggested the
inhibitory effects of methanol on anaerobic microbes although methanol has been
known as a readily degradable substrate for methanogens [165]. The CH4 production
from bottles treating TrOCs was only suspended for around the first 1.6 days.
Meanwhile, it is clear that the rapid CH4 generation was found in reference bottles, in
which digested sludge already reached its stable performance. Considering the

97
process performance in terms of parameter variations and CH4 yields, a steady state
of methanogenesis was created in TrOC-spiked bottles from day 1.6 onward.
Table 22. Kinetic analysis of CH4 production on VS basis in the batch test of the AD
treating trace organic contaminants.
Models and kinetic parameters
(at 95% confidential intervals)
TrOC-spiked
digested sludge
Digested
sludge Methanol
Experimental cumulative CH4 yield at
day 35 (mLCH4/gVSadded) 216.3 112.0 104.4
First order kinetic model
First order rate constant – k (1/d) 0.125 0.092 0.146
Correlation coefficient – R2
0.946 0.976 0.803
Predicted cumulative CH4 yield –
Go (mLCH4/gVSadded) 218.6 ± 10.5 109.5 ± 4.4
114.4 ±
10.7
Modified Gompertz model
Lag phase – λ (d) 1.591 0.000 4.897
Correlation coefficient – R2
0.974 0.933 0.996
Maximum CH4 production rate –
Rm (mLCH4/gVSadded.d) 24.7 ± 3.9 6.8 ± 0.6 57.0 ± 7.8
Predicted cumulative CH4 yield –
Go (mLCH4/gVSadded) 205.1 ± 4.9 101.8 ± 4.4 57.8 ± 5.4
6.2 Dynamics of trace organics under anaerobic sludge treatment
The digested sludge used in this study was obtained from a full-scale plant. Thus,
TrOCs were detected in the water and solid phases of digested sludge prior to spiking
(Figure 36). However, these background concentrations were small. With the
exception of carbamazepine and triclosan, their concentrations in the solid phase
were well below 5 µg/g.
In wastewater sludge, TrOCs could adsorb onto the solid phase (sludge) and remain
in the water phase [166]. Therefore, both water and solid contributions made up the
concentration of TrOCs in sludge samples. Concentrations of TrOCs in all sludge
samples are calculated as:
CwCsC (11)
and TSXCs (12)
where X (µg/g) and Cs (µg/L) refer to TrOC concentrations in solid phase; Cw
(µg/L) are the concentrations of TrOCs in liquid phase, and TS is the solid
concentration of samples (g/L).

98
0
5
10
15
20
25
30
35
Co
ncen
tra
tio
n i
n t
he w
ate
r p
ha
se (
µg
/L) Water phase
Clo
fibri
c ac
idS
alic
yli
c ac
idK
etopro
fen
Fen
opro
pN
apro
xen
Met
ronid
azole
Ibupro
fen
Pri
mid
one
Dic
lofe
nac
Gem
fibro
zil
Pro
poxur
Form
ononet
inE
nte
rola
ctone
Car
bam
azap
ine
Pen
tach
loro
phen
ol
Est
rone
Atr
azin
eA
met
ryn
Ben
zophen
one
Am
itri
pty
line
4-t
ert-
buty
lphen
ol
Oxyben
zone
Est
riol
Bis
phen
ol
A17-a
-et
hin
yle
stra
dio
l17-b
-est
radio
lT
ricl
osa
n17-b
-est
radio
l-17-a
ceta
te4-t
ert-
oct
ylp
hen
ol
Oct
ocr
yle
ne
0
1
2
3
4
5
6
7
8
9
10
Co
ncen
tra
tio
ns
in t
he s
oli
d p
ha
se (
µg
/g) Solid phase
Figure 36. Distribution of the selected TrOCs in the water and solid phases of
digested sludge.
During digestion, mass transfer of TrOCs between the aqueous and solid phases as
well as biodegradation regulated the evolution of their concentrations. Their mass
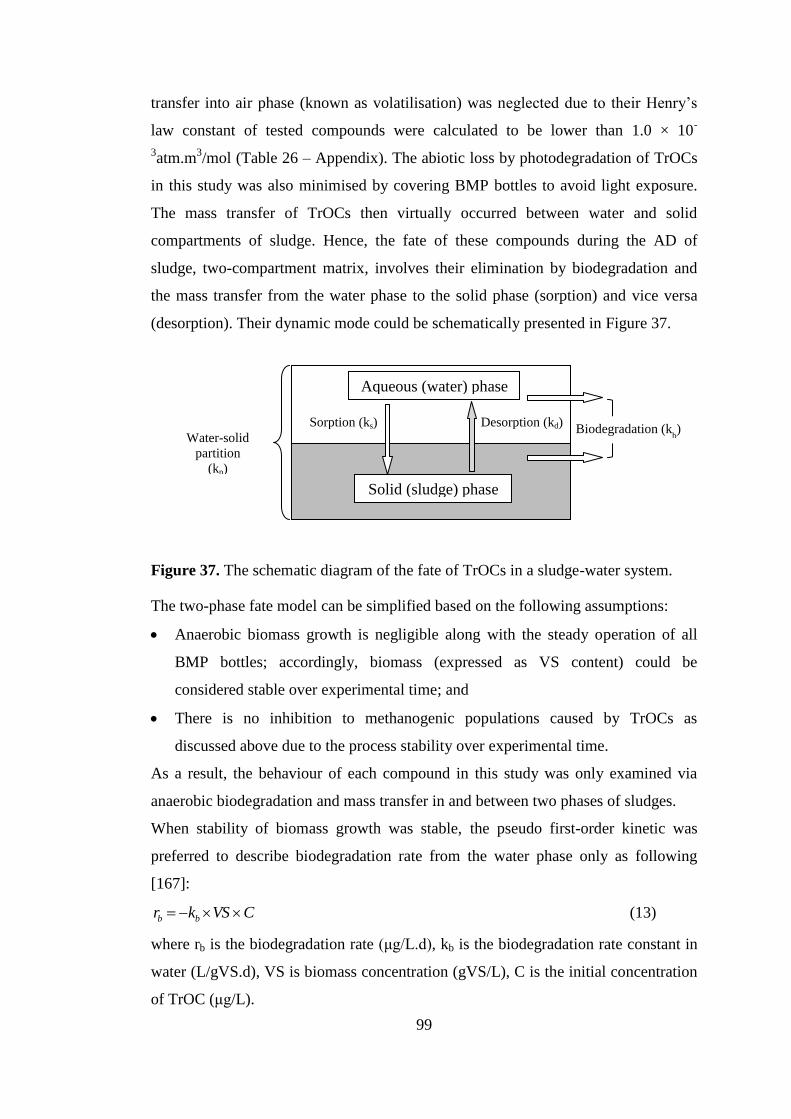
99
transfer into air phase (known as volatilisation) was neglected due to their Henry’s
law constant of tested compounds were calculated to be lower than 1.0 × 10-
3atm.m
3/mol (Table 26 – Appendix). The abiotic loss by photodegradation of TrOCs
in this study was also minimised by covering BMP bottles to avoid light exposure.
The mass transfer of TrOCs then virtually occurred between water and solid
compartments of sludge. Hence, the fate of these compounds during the AD of
sludge, two-compartment matrix, involves their elimination by biodegradation and
the mass transfer from the water phase to the solid phase (sorption) and vice versa
(desorption). Their dynamic mode could be schematically presented in Figure 37.
Figure 37. The schematic diagram of the fate of TrOCs in a sludge-water system.
The two-phase fate model can be simplified based on the following assumptions:
Anaerobic biomass growth is negligible along with the steady operation of all
BMP bottles; accordingly, biomass (expressed as VS content) could be
considered stable over experimental time; and
There is no inhibition to methanogenic populations caused by TrOCs as
discussed above due to the process stability over experimental time.
As a result, the behaviour of each compound in this study was only examined via
anaerobic biodegradation and mass transfer in and between two phases of sludges.
When stability of biomass growth was stable, the pseudo first-order kinetic was
preferred to describe biodegradation rate from the water phase only as following
[167]:
CVSkr bb (13)
where rb is the biodegradation rate (μg/L.d), kb is the biodegradation rate constant in
water (L/gVS.d), VS is biomass concentration (gVS/L), C is the initial concentration
of TrOC (μg/L).
Biodegradation (kb)
Solid (sludge) phase
Aqueous (water) phase
Sorption (ks) Desorption (kd)
Water-solid
partition
(kp)

100
The transfer rate between the water phase and solid phase followed the linear
isotherm. The sorption rate was calculated as:
CwTSkr ss (14)
where rs is the sorption rate (μg/gTS.d), ks is the sorption rate constant (L/gTS.d); TS
is total solid (gTS/L); and Cw is the initial concentration of TrOC in the water
phase(μg/L); meanwhile, desorption rate was:
Cskr dd (15)
where rs is the desorption rate (μg/L.d), kd is the desorption rate constant (1/d); Cs is
the initial concentration of TrOC in the solid phase (μg/L).
As an instantaneous equilibrium was created, there was an equal amount of TrOCs
transferring between two phases at an infinite time:
TSCw
Cs
k
kk
CskCwTSk
rr
d
sp
ds
ds
(16)
where kp is the water-solid partition coefficient (L/g).
The dynamic of each TrOC concentration with time was expressed as a differential
equation, in the water phase:
CVSkCsk
kCwTSk
dt
dCw
CVSkCskCwTSkt
C
dt
dCw
b
p
ss
bds
(17)
and in the solid phase:
Csk
kCwTSk
dt
dCs
CskCwTSkt
C
dt
dCs
p
ss
ds
(18)
The two-phase fate model associated to the dynamic of each TrOC compound in two
phases was expressed as a system of differential equations:
Csk
kCwTSk
dt
dCs
CVSkCsk
kCwTSk
dt
dCw
p
ss
b
p
ss
(19)

101
Optimisation of the model parameters in accordance with the experimental data was
carried out by using least-squares regression in Matlab.
The total concentration of one specific compound over time was the sum of
concentrations in the water and solid phases, expressed as:
CVSkdt
CsCwdb
)( (20)
The variation of TrOC concentrations over the digestion time followed the pseudo
first-order equation:
tVSk
otbeCC
(21)
whereCt and Co is the initial concentration (t = 0) and the remaining substrate
concentration at time t (µg/L), t is the time period (d), and kb is the biodegradation
rate constant (L/gVS.d), VS is biomass concentration (g/L).Co was the sum of the
available concentration in water and solid phases after TrOCs were spiked into
samples at the time t = 0:
ooo CwCsC (22)
Removal efficiency (R%) at time t was calculated as:
%100
o
to
C
CCR (23)
Their half-life time, defined as a time that 50% concentration of TrOCs remained, is
calculated as:
VSkt
b
2ln2/1 (24)
where t1/2 is half-life time (d).
Table 23 summarises value of ks, kp, kb, and t1/2 determined from the two phase fate
model using experimental data presented in Figure 38.

102
Table 23. Calculated model parameters achieved from the two-phase fate model.
Group Compound Log D at
pH = 8
Model parameters
ks kp kb t1/2
Phar
mac
euti
cals
Salicylic acid –1.14 0.169 0.011 0.0229 2.0
Ketoprofen –0.55 0.138 0.009 0.0009 51.2
Naproxen –0.18 0.175 0.016 0.1243 0.4
Metronidazole –0.14 0.080 0.116 0.0003 137.4
Ibuprofen 0.14 0.131 0.038 0.0000 -
Primidone 0.83 0.154 0.010 0.0009 50.0
Diclofenac 1.06 0.091 0.075 0.0042 11.1
Gemfibrozil 1.18 0.142 0.029 0.0003 162.8
Carbamazepine 1.89 0.092 0.102 0.0013 36.7
Amitriptyline 3.21 0.076 0.119 0.0000 -
Triclosan 4.92 0.078 0.148 0.0027 16.9
Ste
roid
horm
ones
Estriol 2.53 0.089 0.110 0.0005 84.0
Estrone 3.62 0.112 0.076 0.0018 25.1
17-α-ethinylestradiol 4.11 0.086 0.113 0.0005 92.4
17-β-estradiol 4.15 0.087 0.097 0.0034 13.4
17-β-estradiol-17-
acetate 5.11 0.129 0.056 0.0539 0.9
Pes
tici
des
Clofibric acid –1.29 0.129 0.039 0.0003 140.8
Fenoprop –0.28 0.124 0.021 0.0013 35.8
Propoxur 1.54 0.120 0.035 0.0026 18.1
Pentachlorophenol 2.19 0.065 0.140 0.0171 2.7
Atrazine 2.64 0.113 0.031 0.0078 5.9
Ametryn 2.97 0.078 0.115 0.0036 12.9
Indust
rial
chem
ical
s 4-tert-butylphenol 3.39 0.089 0.109 0.0000 -
Bisphenol A 3.64 0.088 0.112 0.0000 -
4-tert-octylphenol 5.18 0.083 0.117 0.0000 -
Phyto
estr
ogen
Enterolactone 1.88 0.130 0.016 0.0100 4.6
Formononetin 1.81 0.109 0.052 0.0202 2.3
UV
filt
ers Benzophenone 3.21 0.088 0.112 0.0000 -
Oxybenzone 3.42 0.156 0.058 0.1797 0.3
Octocrylene 6.89 0.081 0.118 0.0000 -
Sorption rate constant (ks, μg/L.d), water-solid partition coefficient (kp, L/g),
biodegradation rate constant (kb, L/gVS.d), half-life time (t1/2, d); values of log D at
pH = 8 were sourced from Scifinder Scholar database (ACD/Labs)

103
0 5 10 15 20 25 30 350
50
100
150
200
250
Time (d)
Conce
ntr
atio
n (
µg/L
)
Triclosan
Fitted curve for water phase concentration
Water phase concentration
Fitted curve for sludge phase concentration
Sludge phase concentration
0 5 10 15 20 25 30 35
0
10
20
30
40
50
60
70
80
90
100
Time (d)C
once
ntr
atio
n (
µg/L
)
Pentachlorophenol
Fitted curve for water phase concentration
Water phase concentration
Fitted curve for sludge phase concentration
Sludge phase concentration
0 5 10 15 20 25 30 35
0
50
100
150
200
250
300
350
Time (d)
Conce
ntr
atio
n (
µg/L
)
Metronidazole
Fitted curve for water phase concentration
Water phase concentration
Fitted curve for sludge phase concentration
Sludge phase concentration
0 5 10 15 20 25 30 350
20
40
60
80
100
120
140
160
180
Time (d)
Conce
ntr
atio
n (
µg/L
)
Amitriptyline
Fitted curve for water phase concentration
Water phase concentration
Fitted curve for sludge phase concentration
Sludge phase concentration
0 5 10 15 20 25 30 35
0
20
40
60
80
100
120
140
Time (d)
Conce
ntr
atio
n (
µg/L
)
Octocrylene
Fitted curve for water phase concentration
Water phase concentration
Fitted curve for sludge phase concentration
Sludge phase concentration
0 5 10 15 20 25 30 35
0
50
100
150
Time (d)
Conce
ntr
atio
n (
µg/L
)
4-tert-octylphenol
Fitted curve for water phase concentration
Water phase concentration
Fitted curve for sludge phase concentration
Sludge phase concentration
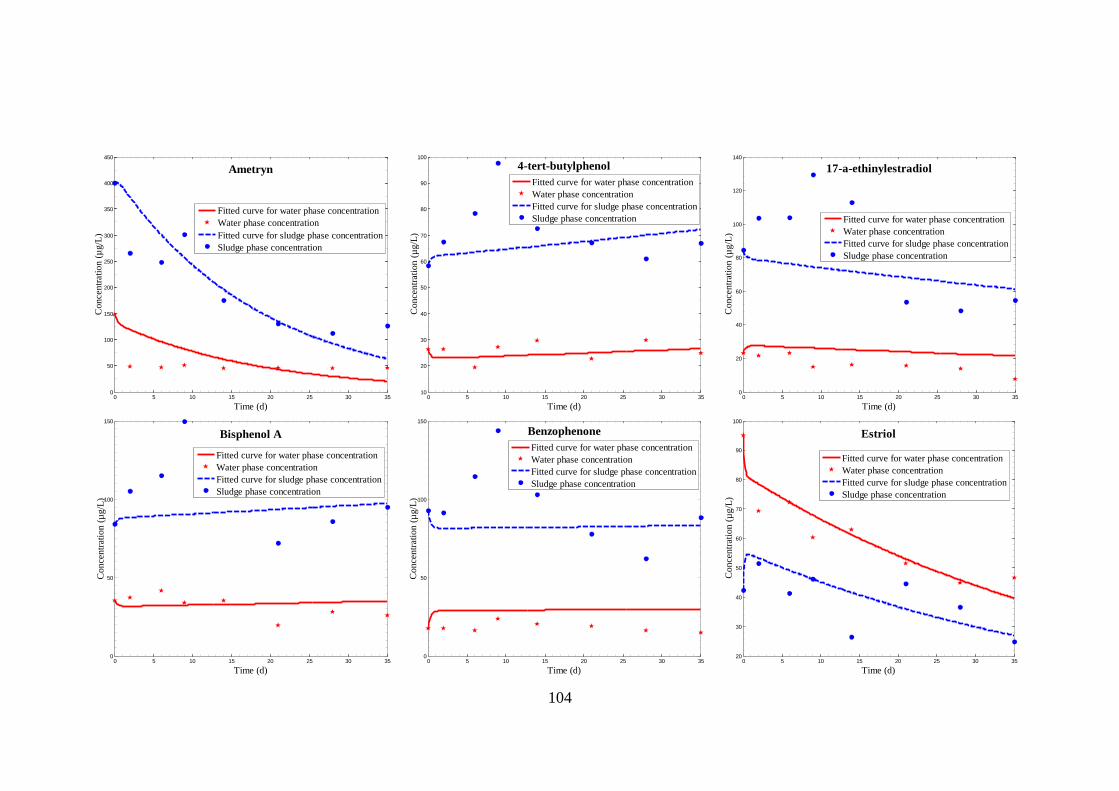
104
0 5 10 15 20 25 30 350
50
100
150
200
250
300
350
400
450
Time (d)
Conce
ntr
atio
n (
µg/L
)
Ametryn
Fitted curve for water phase concentration
Water phase concentration
Fitted curve for sludge phase concentration
Sludge phase concentration
0 5 10 15 20 25 30 35
10
20
30
40
50
60
70
80
90
100
Time (d)C
once
ntr
atio
n (
µg/L
)
4-tert-butylphenol
Fitted curve for water phase concentration
Water phase concentration
Fitted curve for sludge phase concentration
Sludge phase concentration
0 5 10 15 20 25 30 35
0
20
40
60
80
100
120
140
Time (d)
Conce
ntr
atio
n (
µg/L
)
17-a-ethinylestradiol
Fitted curve for water phase concentration
Water phase concentration
Fitted curve for sludge phase concentration
Sludge phase concentration
0 5 10 15 20 25 30 350
50
100
150
Time (d)
Co
nce
ntr
atio
n (
µg/L
)
Bisphenol A
Fitted curve for water phase concentration
Water phase concentration
Fitted curve for sludge phase concentration
Sludge phase concentration
0 5 10 15 20 25 30 35
0
50
100
150
Time (d)
Co
nce
ntr
atio
n (
µg/L
)
Benzophenone
Fitted curve for water phase concentration
Water phase concentration
Fitted curve for sludge phase concentration
Sludge phase concentration
0 5 10 15 20 25 30 35
20
30
40
50
60
70
80
90
100
Time (d)
Con
centr
atio
n (
µg
/L)
Estriol
Fitted curve for water phase concentration
Water phase concentration
Fitted curve for sludge phase concentration
Sludge phase concentration
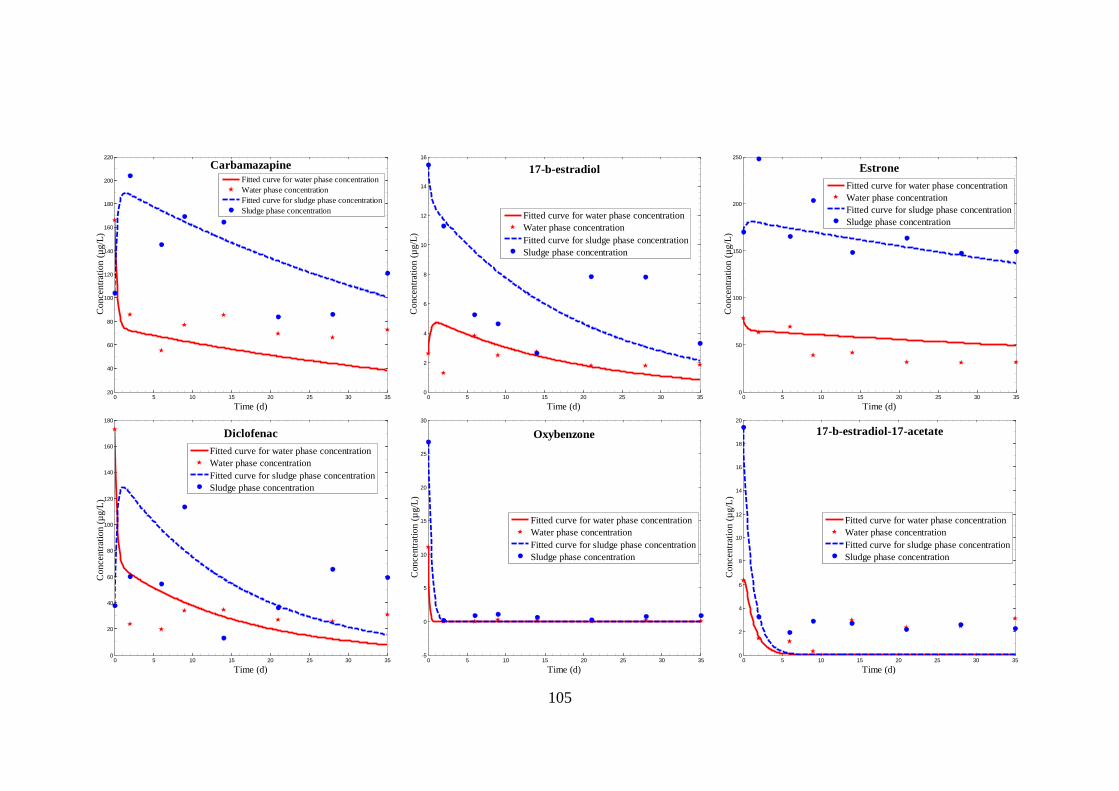
105
0 5 10 15 20 25 30 3520
40
60
80
100
120
140
160
180
200
220
Time (d)
Conce
ntr
atio
n (
µg/L
)
Carbamazapine
Fitted curve for water phase concentration
Water phase concentration
Fitted curve for sludge phase concentration
Sludge phase concentration
0 5 10 15 20 25 30 35
0
2
4
6
8
10
12
14
16
Time (d)C
once
ntr
atio
n (
µg/L
)
17-b-estradiol
Fitted curve for water phase concentration
Water phase concentration
Fitted curve for sludge phase concentration
Sludge phase concentration
0 5 10 15 20 25 30 35
0
50
100
150
200
250
Time (d)
Conce
ntr
atio
n (
µg/L
)
Estrone
Fitted curve for water phase concentration
Water phase concentration
Fitted curve for sludge phase concentration
Sludge phase concentration
0 5 10 15 20 25 30 350
20
40
60
80
100
120
140
160
180
Time (d)
Con
centr
atio
n (
µg
/L)
Diclofenac
Fitted curve for water phase concentration
Water phase concentration
Fitted curve for sludge phase concentration
Sludge phase concentration
0 5 10 15 20 25 30 35
-5
0
5
10
15
20
25
30
Time (d)
Co
nce
ntr
atio
n (
µg
/L)
Oxybenzone
Fitted curve for water phase concentration
Water phase concentration
Fitted curve for sludge phase concentration
Sludge phase concentration
0 5 10 15 20 25 30 35
0
2
4
6
8
10
12
14
16
18
20
Time (d)
Co
nce
ntr
atio
n (
µg
/L)
17-b-estradiol-17-acetate
Fitted curve for water phase concentration
Water phase concentration
Fitted curve for sludge phase concentration
Sludge phase concentration

106
0 5 10 15 20 25 30 350
20
40
60
80
100
120
Time (d)
Conce
ntr
atio
n (
µg/L
)
Enterolactone
Fitted curve for water phase concentration
Water phase concentration
Fitted curve for sludge phase concentration
Sludge phase concentration
0 5 10 15 20 25 30 35
0
25
50
75
100
125
150
Time (d)C
once
ntr
atio
n (
µg/L
)
Clofibric acid
Fitted curve for water phase concentration
Water phase concentration
Fitted curve for sludge phase concentration
Sludge phase concentration
0 5 10 15 20 25 30 35
0
20
40
60
80
100
120
140
Time (d)
Conce
ntr
atio
n (
µg/L
)
Ibuprofen
Fitted curve for water phase concentration
Water phase concentration
Fitted curve for sludge phase concentration
Sludge phase concentration
0 5 10 15 20 25 30 350
10
20
30
40
50
60
70
80
Time (d)
Co
nce
ntr
atio
n (
µg
/L)
Propoxur
Fitted curve for water phase concentration
Water phase concentration
Fitted curve for sludge phase concentration
Sludge phase concentration
0 5 10 15 20 25 30 35
0
20
40
60
80
100
120
140
Time (d)
Co
nce
ntr
atio
n (
µg
/L)
Atrazine
Fitted curve for water phase concentration
Water phase concentration
Fitted curve for sludge phase concentration
Sludge phase concentration
0 5 10 15 20 25 30 35
20
30
40
50
60
70
80
90
100
110
Time (d)
Co
nce
ntr
atio
n (
µg/L
)
Gemfibrozil
Fitted curve for water phase concentration
Water phase concentration
Fitted curve for sludge phase concentration
Sludge phase concentration

107
0 5 10 15 20 25 30 350
20
40
60
80
100
120
140
Time (d)
Conce
ntr
atio
n (
µg/L
)
Fenoprop
Fitted curve for water phase concentration
Water phase concentration
Fitted curve for sludge phase concentration
Sludge phase concentration
0 5 10 15 20 25 30 35
0
20
40
60
80
100
120
140
160
180
Time (d)C
once
ntr
atio
n (
µg/L
)
Naproxen
Fitted curve for water phase concentration
Water phase concentration
Fitted curve for sludge phase concentration
Sludge phase concentration
0 5 10 15 20 25 30 35
0
10
20
30
40
50
60
70
Time (d)
Conce
ntr
atio
n (
µg/L
)
Formononetin
Fitted curve for water phase concentration
Water phase concentration
Fitted curve for sludge phase concentration
Sludge phase concentration
0 5 10 15 20 25 30 350
50
100
150
Time (d)
Conce
ntr
atio
n (
µg/L
)
Salicylic acid
Fitted curve for water phase concentration
Water phase concentration
Fitted curve for sludge phase concentration
Sludge phase concentration
0 5 10 15 20 25 30 35
0
20
40
60
80
100
120
140
160
Time (d)
Conce
ntr
atio
n (
µg/L
)
Ketoprofen
Fitted curve for water phase concentration
Water phase concentration
Fitted curve for sludge phase concentration
Sludge phase concentration
0 5 10 15 20 25 30 35
0
10
20
30
40
50
60
70
Time (d)
Conce
ntr
atio
n (
µg/L
)
Primidone
Fitted curve for water phase concentration
Water phase concentration
Fitted curve for sludge phase concentration
Sludge phase concentration
Figure 38. Plots of experimental data and fitting curvesof the two-phase fate model for the selected TrOCs.

108
6.3 Removal performance of trace organic compounds under anaerobic
sludge treatment
6.3.1 Overall removal of trace organic compounds
Biodegradability under anaerobic condition of the TrOCs investigated here
represented by kb varies significantly (Table 24). Some TrOCs (i.e. primidone,
amitriptyline, 4-tert-butylphenol, bisphenol A, and 4-tert-octylphenol) are complete
recalcitrant to anaerobic digestion (kb ≈ 0 L/gVS.d) whilst several others (i.e.
formononetin, pentachlorophenol, enterolactone, salicylic acid, 17-β-estradiol-17-
acetate, naproxen, and oxybenzone) show significant biodegradability (kb> 0.01
L/gVS.d). The other TrOCs exhibit moderate removal capacity.
TrOC removal was determined after 35 days of anaerobic digestion and compared to
literature data obtained from both anaerobic and aerobic conditions (Table 24). Like
observations of biodegradation rates, above99% removal was achieved with all
phytoestrogens (i.e. formononetin, enterolactone), pentachlorophenol, salycilic acid,
17-β-estradiol-17-acetate, naproxen, and oxybenzone while industrial chemicals
showed no observable removal efficiency. For the other classes of TrOCs, the
removal efficiency varied over a wide range. Results reported in this study were
mostly comparable with data recorded in previous studies under anaerobic condition.
On the other hand, the anaerobic digestion is less effective for removing TrOCs
when compared to data from aerobic treatment processes reported in the literature
(Table 24).
Similar removal efficiency from this investigation and previous studies could be
observed with some pharmaceuticals and steroids. Of these TrOCs, however,
carbamazepine and diclofenac are exceptions. They have been reported either to be
resistant to biological removal under aerobic or anoxic conditions [25, 141, 168, 169]
or to be moderately removed only when the seed sludge was long acclimatised [25].
This study, by contrast, shows 48.3% and 88.8% removal of carbamazepine and
diclofenac, respectively, after 35 days of anaerobic digestion. The results here
suggest that carbamazepine and diclofenac are persistent to aerobic treatment but are
amendable to anaerobic biodegradation.
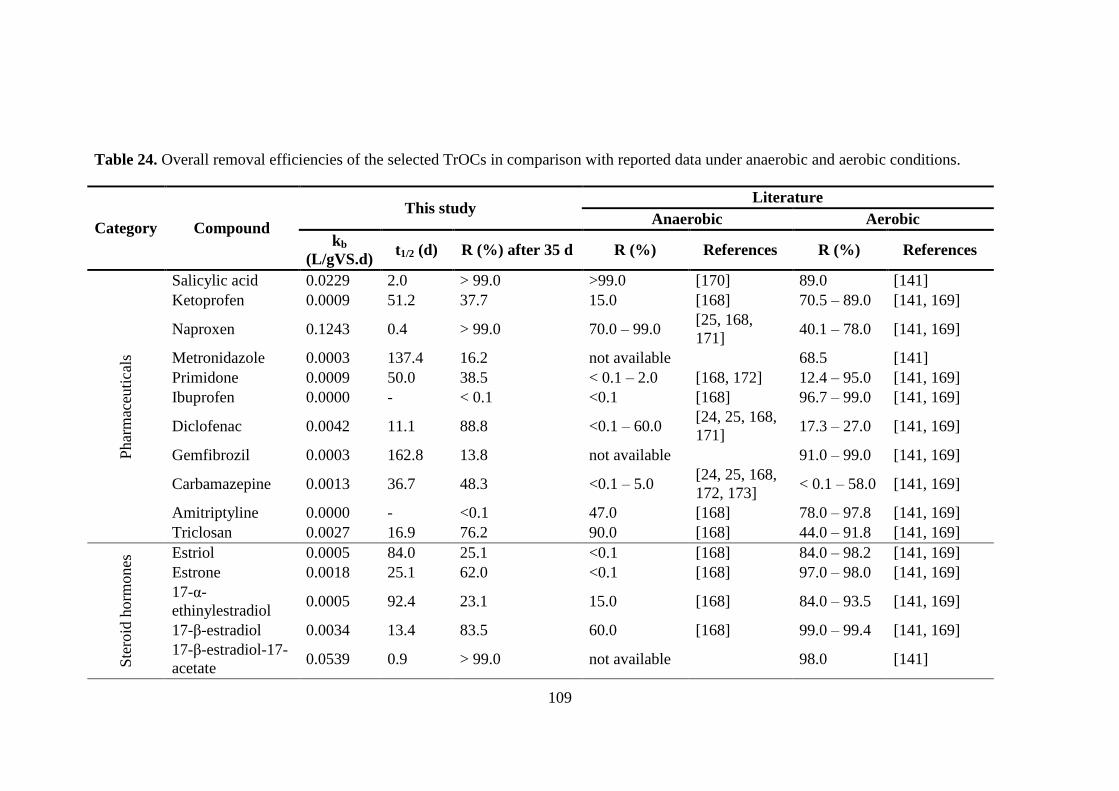
109
Table 24. Overall removal efficiencies of the selected TrOCs in comparison with reported data under anaerobic and aerobic conditions.
Category Compound
This study Literature
Anaerobic Aerobic
kb
(L/gVS.d) t1/2 (d) R (%) after 35 d R (%) References R (%) References
Phar
mac
euti
cals
Salicylic acid 0.0229 2.0 > 99.0 >99.0 [170] 89.0 [141]
Ketoprofen 0.0009 51.2 37.7 15.0 [168] 70.5 – 89.0 [141, 169]
Naproxen 0.1243 0.4 > 99.0 70.0 – 99.0 [25, 168,
171] 40.1 – 78.0 [141, 169]
Metronidazole 0.0003 137.4 16.2 not available 68.5 [141]
Primidone 0.0009 50.0 38.5 < 0.1 – 2.0 [168, 172] 12.4 – 95.0 [141, 169]
Ibuprofen 0.0000 - < 0.1 <0.1 [168] 96.7 – 99.0 [141, 169]
Diclofenac 0.0042 11.1 88.8 <0.1 – 60.0 [24, 25, 168,
171] 17.3 – 27.0 [141, 169]
Gemfibrozil 0.0003 162.8 13.8 not available 91.0 – 99.0 [141, 169]
Carbamazepine 0.0013 36.7 48.3 <0.1 – 5.0 [24, 25, 168,
172, 173] < 0.1 – 58.0 [141, 169]
Amitriptyline 0.0000 - <0.1 47.0 [168] 78.0 – 97.8 [141, 169]
Triclosan 0.0027 16.9 76.2 90.0 [168] 44.0 – 91.8 [141, 169]
Ste
roid
horm
ones
Estriol 0.0005 84.0 25.1 <0.1 [168] 84.0 – 98.2 [141, 169]
Estrone 0.0018 25.1 62.0 <0.1 [168] 97.0 – 98.0 [141, 169]
17-α-
ethinylestradiol 0.0005 92.4 23.1 15.0 [168] 84.0 – 93.5 [141, 169]
17-β-estradiol 0.0034 13.4 83.5 60.0 [168] 99.0 – 99.4 [141, 169]
17-β-estradiol-17-
acetate 0.0539 0.9 > 99.0 not available 98.0 [141]

110
Category Compound
This study Literature
Anaerobic Aerobic
kb
(L/gVS.d) t1/2 (d) R (%) after 35 d R (%) References R (%) References
Pes
tici
des
Clofibric acid 0.0003 140.8 15.8 not available 81.0 [141]
Fenoprop 0.0013 35.8 49.2 not available 83.0 [141]
Propoxur 0.0026 18.1 73.8 not available 58.0 [141]
Pentachlorophenol 0.0171 2.7 > 99.0 >99.0 [174] 83.0 [141, 175]
Atrazine 0.0078 5.9 98.4 7.0 [168] 4.4 – 36.0 [141, 169]
Ametryn 0.0036 12.9 84.7 not available 92.0 [141]
Indust
rial
chem
ical
s 4-tert-butylphenol 0.0000 - < 0.1 not available 91.0 [141]
Bisphenol A 0.0000 - < 0.1 0 – 32.0 [168, 176] 90.4 [141]
4-tert-octylphenol 0.0000 - < 0.1 not available 96.0 [141]
Phyto
estr
ogen
Formononetin 0.0100 4.6 > 99.0 >99.0 [177] 93.0 [141]
Enterolactone 0.0202 2.3 > 99.0 not available 92.0 [141]
UV
filt
ers
Benzophenone 0.0000 - < 0.1 not available 99.0 [141]
Oxybenzone 0.1797 0.3 > 99.0 >99.0 [178] 98.0 [141, 178,
179]
Octocrylene 0.0000 - < 0.1 not available 88.0 [141]
Removal efficiency (R), biodegradation rate constant (kb), and half-life time (t1/2).

111
In this investigation, negligible removal was observed for compounds, including
metronidazole, ibuprofen, benzophenone, 4-tert-butylpheol, octocrylene, and
bisphenol A. Previous studies examining aerobic conditions, nonetheless, reported
moderate to high removal of these TrOCs [141, 169, 176, 179-181]. The difference
between anaerobic and aerobic microbes can be a possible explanation for this
observation, suggesting higher capacity of degrading TrOCs of aerobic populations.
This could be clarified by identifying microbes involved in anaerobic digestion,
which was however beyond the scope of this study.
6.3.2 Role of chemical structures
The bioavailability of trace organics during anaerobic conversion depends on not
only distinct bacterial community and their synergic effects but also their
physicochemical features. Therefore, an assessment of the relative effects of TrOC
properties on their removal efficiencies was more focused in order to establish
certain applicable generalisations.
Results in this batch test exhibited the varied removal extent by anaerobic
biodegradation in both hydrophilic and hydrophobic compounds. Under aerobic
conditions, it was reported that the excellent removal were observed in hydrophilic
compounds (log DpH = 8< 3.2) [141, 169, 180]. This is because most of those aerobic
studies examined the decrease of TrOC concentrations only in the water phase. As
such, two main mechanisms, namely biodegradation in the water phase and sorption
from the water phase into solid phase were responsible for this change. On the other
hand, the removal of TrOCs in the current investigation was determined from their
concentrations in both the water and solid phases. Thus, biodegradation was the only
removal mechanism. Since these TrOCs were selected based on their diversity with
respect to origins, intended usages, and physicochemical features, it is essential to
examine the role of chemical structures in determining their biodegradability under
anaerobic sludge treatment.
A detailed examination of the chemical structures and properties of the selected
TrOCs was conducted to elucidate their biodegradability under anaerobic condition.
When chemical features in terms of the complexity of aromatic rings and properties
of functional groups were compared, it is noted that there was no clear association
between the nucleus complexity and the elimination capacity of selected TrOCs. This

112
is because the main tendency of bacterial activity is mostly to breakdown any
compound from exterior structure, followed by a further nucleus attack.
Considering electron donating (EDG) and electron withdrawing (EWG) groups play
a discernible role in electrophilic nucleus orientation, a great deal of research has
indicated greater effect of EDG than EWG on making organic compounds more
susceptible to biodegradation. The underlying rationale was that EDG is inclined to
drive molecules more susceptible to electrophilic attack by oxygenases of aerobic
microbes. This apparent correlation was successfully utilised to create feasible
frameworks for predicting the removal extent of given sets of TrOCs during the
aerobic treatment processes [141, 169, 182]. Nonetheless, this framework is not
suitable for assessing the biodegradability of TrOCs under an anaerobic condition.
Table 25 summarises key functional moieties that can influence the removal
efficiency of TrOCs in an anaerobic condition.
Anaerobic digestion showed excellent removal of formononetin, oxybenzone, and
naproxen (>99%). The inclusion of methoxy group in their structures could be
responsible for complete bioconversion of these three compounds. As previously
discussed, the readily biodegradability of methanol solvent was demonstrated to
enhance methanogenesis in TrOC-spiked bottles. The growth of specific bacterial
species selectively working on organic compounds analogous to methanol was
consequently stimulated. Therefore, these compounds were simultaneously
biotransformed with methanol from the start-up of digestion (i.e. t1/2 values of
oxybenzone, naproxen, and formononetin are 0.3, 0.4, and 4.6 days, respectively). In
a good agreement with the literature, Liu et al. [178] suggested that oxybenzone was
more favourably degraded by anaerobic incubation than other redox conditions,
achieving its complete removal after 42 days. In a more recent study of UV filters in
aquifers, the well degradation under aerobic and anaerobic conditions of this
compound were also observed by Liu et al. [179]. In order to enhance the
biodegradation of certain organic compounds in the absence of oxygen, the usage of
methanol as an electron donor in anaerobic metabolic pathways has been widely
investigated in the literature. By means of dehalogenation, a nearly complete
elimination of halogenated compounds in methanol-fed anaerobic digesters has been
recorded (i.e. more than 99% for hexachlorocyclohexane [183] and 2,4,6-
trichlorophenol [184]) compared to that of digesters fed with other electron donors.

113
Table 25. Relation of functional moieties and the removal efficiency of the selected
TrOCs.
Compounds containing chloride groups and/or amine/amide with the effective
removal
Fenoprop
Diclofenac
Triclosan
Pentachlorophenol
Atrazine
Primidone
Ametryn
Carbamazepine
Propoxur
Compounds containing methoxy groups with the high effective removal
Naproxen
Formononetin
Oxybenzone
Compounds containing long alkyl chain with low removal efficiency
Ibuprofen
4-tert-
butylphenol
Clofibric acid
4-tert-octylphenol
Octocrylene
Amitriptyline
In this investigation, a varied range of removal efficiencies was observed with
chlorinated TrOCs in the range of 15.8% to more than 99% (Table 25). The
increasing order of removal was observed with the greater extent of chlorination,
with the excellent removal of pentachlorophenol (more than 99%). This observation
is in a good agreement with the literature [175]. The high biodegradability this class
of compounds under anaerobic condition can be attributed to anaerobic metabolism
through the dehalogenation pathway. By contrast, aerobic microorganisms initialize
the degradation pathway of halogenated compounds via oxidation from other co-

114
existing functional groups [169]. This observation suggests that less halogenated
compounds are more readily biotransformed with oxygen exposure. On the other
hand, the inclusion of alkyl chain in chloride-containing compounds could affect
their conversion pathway, resulting lower removal efficiencies, for which clofibric
acid was a particular example (15.8% elimination).
The presence of amide/amine groups in TrOC chemical structures can affect their
removal under anaerobic condition. Some of TrOCs bearing amine/amide have been
shown to be poorly removed in previous studies. Carbamazepine was, partly
removed with efficiency of 48.3% in this investigation, considered as a typical
example of very persistent xenobiotic compounds regardless of redox conditions [25,
168, 172, 173]. The moderate removal (38.5%) was here recorded for primidone,
which was found to pass through soil to groundwater under anaerobic condition by
Ternes et al. [172]. Higher removal of such compounds as diclofenac and atrazine
(60% and 85%, respectively) may be also due to the co-existence of the chloride
group in their chemical structures, which was poorly removed by aerobic MBR
treatment [141, 169]. Propoxur and ametryn also presented high removal efficiencies
(i.e. 73.8% and 84.7%, respectively) as reported [141, 169], showing their highly
bioavailability to any redox conditions. Interestingly, amitriptyline bearing both
chloride and amine groups showed highly persistent to anaerobic degradation. This
behaviour could be ascribed to the existence of long alkyl group.
Negligible removal efficiency (kb ≈ 0 L/gVS.d) was observed with some compounds,
including ibuprofen, 4-tert butylphenol, 4-tert-octylphenol, octocrylene, bisphenol A,
amitriptyline, and benzophenone. Except for benzophenone, which has no functional
group, the inclusion of alkyl group (Table 25) in chemical structure of other
compounds was responsible for their poor biodegradation. It should be noted that
more than 70% dissipation of octocrylene was obtained after 77 incubation days with
anaerobic consortium in a native aquifer [179]. These contrasting observations here
may be associated to the distinct indigenous bacteria populations available in
aquifers and anaerobic sludge. To our best understanding, while investigations
regarding the biodegradation of 4-alkylphenols under anaerobic condition have been
still limited. Their great attenuation [180] and involved biodegradation pathways
[181] have been only studied in the context of aerobic processes. The inclusion of the
alkyl side chain was probably responsible for their poor removal. In the literature, a

115
negative effect of long alkyl chain on the biodegradation rate was demonstrated in
case of phthalate esters [185]. The concentration of bisphenol A seemed to be stable
during this anaerobic conversion. Bisphenol A was previously reported to be
insignificantly degraded by anaerobic consortium at efficiency of 37% [168] and
even persistent to anaerobic degradation [176]. A significant decrease in
concentration of this compound, by contrast, has been found under different aerobic
treatment processes [176, 180].
For steroid hormones, it is noted that the high biodegradation (>83.5%) was achieved
with 17-β-estradiol, while estrone exhibited the lower removal efficiency (62.0%) at
day 35. This observation could be attributed to possible oxidation of 17-β-estradiol to
estrone, which was observed in anaerobic sediments [23, 186]. The various extent of
biodegradation of members in this group has been widely but contrastingly reported.
A substantial level of estrone, and 17-β-estradiol was still detected in UASB effluent
whilst any type of sludges did not show the removal capacity of 7-α-ethinylestradiol
[126, 186]. By contrast, Carballa et al. [25] reported significant decreases in sum
concentrations of estrone and 17-β-estradiol (85%), and 17-α-ethinylestradiol (60%),
whose removal in this batch test was reported at 45%. Little was known about the
anaerobic biodegradation of 17-β-estradiol-17-acetate, which was here observed to
be effectively degraded (> 99%).
The existence of functional groups in chemical structures of TrOCs determined their
various biodegradation rates throughout the anaerobic conversion. In particular,
while the inclusion the halogen, methoxy and amine/amide groups rapidly simulated
the anaerobic degradation/transformation of TrOCs; the alkyl group was responsible
for their biological recalcitrance to anaerobic treatment.
6.4 Fate of trace organic compounds in sludge matrix under anaerobic
condition
The distribution of TrOCs in the water and solid phases during anaerobic treatment
can be presented by kp obtained from the two-phase fate model. Within anaerobic
treatment of sewage sludge, both kp values reported here and those reported in the
literature showed comparable sorption properties of respective TrOC groups.
Negligible adsorption (kp< 0.1 L/g) of pharmaceuticals such as naproxen, ibuprofen,
and diclofenac to the solid phase reported in the current investigation is consistent
with previous studies in case of primary and secondary sludge [187] and of digested

116
sludge [188]. A correspondence between high kp values and their high
hydrophobicity nature was only found in steroid hormones, of which 17-β-estradiol-
17-acetate was an exception. For the other compounds in this group, there is an
agreement of their high adsorption potential between this study and previous studies,
estimated kp values here were lower than values reported from the literature [189].
In the initial period of spiking, a fraction of investigated compounds was adsorbed
onto solid particles. Different sorption properties onto sludge particles were found
for these trace organics over the experimental time.
It was expected that the distribution of TrOCs was in a relation with their
physicochemical properties, particularly their hydrophobicity (log D). Figure 39,
however, shows a weak correlation between log D (pH = 8) and log kp of the TrOCs
investigated here (R2 = 0.427). The same observation was stated in the literature
although several previous attempts have been made to analyse the relationship
between log D and adsorption of substances into different environmental samples,
including activated sludge [190], primary and secondary sludge [187], and digested
sludge [188]. Even though pKa at the ambient pH was considered in modelling,
Carballa et al. [188] found a significant high deviation modelled values in case of
iopromide, sulfamethoxazole and roxithromycin. One possible explanation is that
sorption behaviour while depends on physicochemical properties of involved
chemicals and solid compositions, is still affected by other conditions, including pH,
temperature, and ion strength [191]. Sorption behaviour was also found to be
dependent on initial concentrations applied as reported in case of bisphenol A [189].
Another reason is that biodegradation factor was taken into account. As such, in view
of diverse TrOC groups selected in this anaerobic treatment study, their
hydrophobicity and distribution in two phases of sludge was then examined along
with different biodegradation rate.

117
-2 0 2 4 6 80.8
1.0
1.2
1.4
1.6
1.8
2.0
2.2
2.4
Linear regression
R2
= 0.427
log
kp
log D at pH =8
Figure 39. Correlation between log D (pH = 8) and log kp of the selected TrOCs.
The biodegradability of TrOCs is classified based on biodegradability rate (kb) as
illustrated in Figure 40. For compounds with negligible to low removal rates (kb ≤
0.001 L/gVS.d), their hydrophobicity (log D at pH = 8) and their partition (kp) in
sludge were comparable. There was a moderate relationship (R2 = 0.715) between
them as illustrated in Figure 41. In this occasion, the biodegradation rate had no
effect on their distribution in sludge system. Instead, the adsorption tendency of these
TrOCs was dependent on their hydrophobicity (known as log D). High
concentrations in the solid phase (kp> 0.1 L/g) of some compounds such as
octocrylene and 4-tert-butylphenol could be attributed to the inclusion of the alkyl
group, which referred to biological persistent TrOCs (Section 6.3.2). Similarly,
Ismail et al. [192] observed an increase of sorption capacity according to increasing
alkyl chain length in case of quaternary ammonium compounds. Therefore, the fate
in two-compartment sludge of biological persistent compounds could be predicted by
means of their hydrophobicity without any effect of biodegradability.
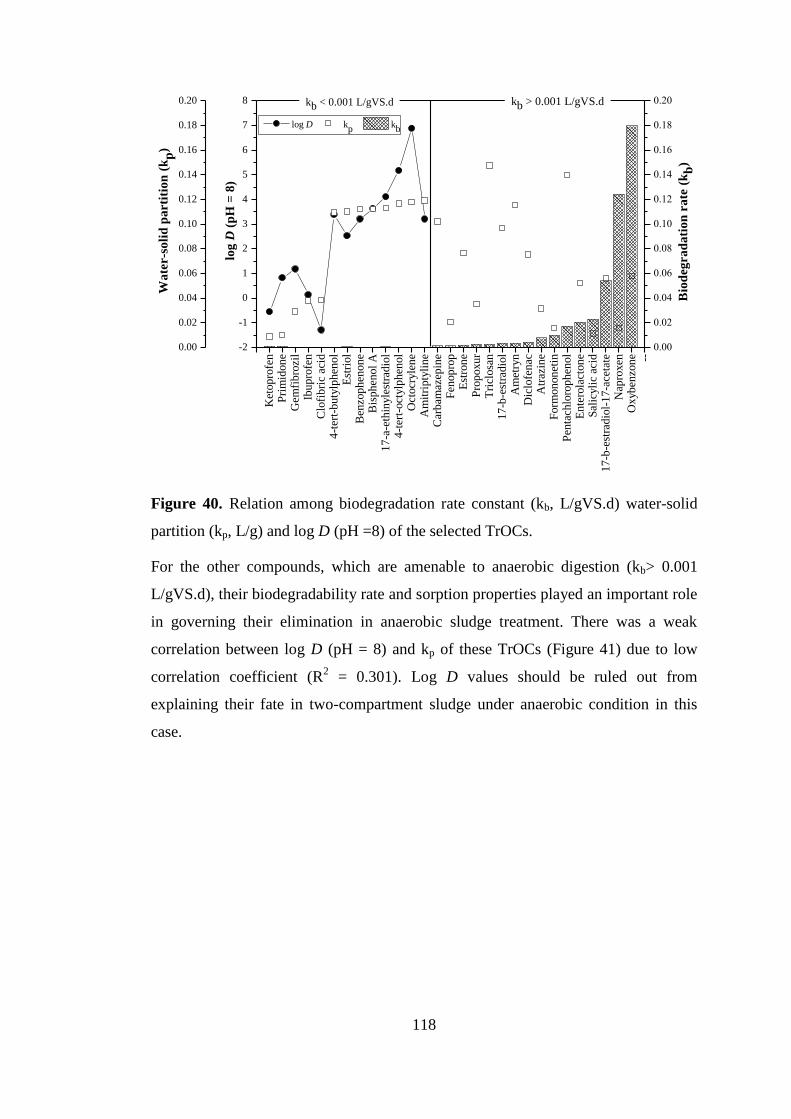
118
Ket
op
rofe
nP
rim
idon
eG
emfi
bro
zil
Ibu
pro
fen
Clo
fib
ric
acid
4-t
ert-
bu
tylp
hen
ol
Est
riol
Ben
zop
hen
on
eB
isp
hen
ol
A1
7-a
-eth
inyle
stra
dio
l4
-ter
t-oct
ylp
hen
ol
Oct
ocr
yle
ne
Am
itri
pty
lin
eC
arb
amaz
epin
eF
enop
rop
Est
ron
eP
rop
oxu
rT
ricl
osa
n1
7-b
-est
rad
iol
Am
etry
nD
iclo
fen
acA
traz
ine
Form
on
on
etin
Pen
tach
loro
ph
enol
En
tero
lact
on
eS
alic
yli
c ac
id1
7-b
-est
rad
iol-
17
-ace
tate
Nap
roxen
Oxyb
enzo
ne --
-2
-1
0
1
2
3
4
5
6
7
8
log D kp
kb
Wa
ter-s
oli
d p
arti
tio
n (
kp
)
log
D (
pH
= 8
)
0.00
0.02
0.04
0.06
0.08
0.10
0.12
0.14
0.16
0.18
0.20
0.00
0.02
0.04
0.06
0.08
0.10
0.12
0.14
0.16
0.18
0.20
Bio
deg
ra
da
tio
n r
ate
(k
b)
kb < 0.001 L/gVS.d kb > 0.001 L/gVS.d
Figure 40. Relation among biodegradation rate constant (kb, L/gVS.d) water-solid
partition (kp, L/g) and log D (pH =8) of the selected TrOCs.
For the other compounds, which are amenable to anaerobic digestion (kb> 0.001
L/gVS.d), their biodegradability rate and sorption properties played an important role
in governing their elimination in anaerobic sludge treatment. There was a weak
correlation between log D (pH = 8) and kp of these TrOCs (Figure 41) due to low
correlation coefficient (R2 = 0.301). Log D values should be ruled out from
explaining their fate in two-compartment sludge under anaerobic condition in this
case.

119
-2 -1 0 1 2 3 4 5 6 7 8
0.00
0.05
0.10
0.15
kp
Linear regression
R2
= 0.715
log D at pH =8
a. kb< 0.001 L/gVS.d
-2 -1 0 1 2 3 4 5 6
0.00
0.05
0.10
0.15
0.20
k
p
log D at pH =8
Linear regression
R2
= 0.301
b. kb> 0.001 L/gVS.d
Figure 41. Correlation of log D (pH = 8) and kp of compounds showing low (a) and
high (b) biodegradability rates (kb).

120
6.5 Summary
System stability of this anaerobic sludge digestion was confirmed by evaluating
temporal profile of control parameters and the CH4 production. Firstly, favourable
operating conditions in case of pH and buffer capacity (i.e. close to neutral pH and
high alkalinity of more than 4000 mgCaCO3/L, respectively) were observed in
TrOC-spiked bottles throughout the digestion time. Secondly, results of CH4
production obtained from experimental data and from the first order and modified
Gompertz kinetic models showed mostly similar CH4 generation between bottles
with and without TrOCs. Their differences, including higher CH4 production from
day4 to 9 and longer lag time of around 1.6 days in spiked bottles, resulted from the
usage of methanol as the solvent in TrOC preparation. A steady state of
methanogenesis was then created in TrOC-spiked bottles after 1.6 days.
Their various removal efficiencies were consistently related to their molecular
properties in terms of functional groups rather than other physicochemical properties.
Compounds with the inclusion of halogen, methoxy and amine/amide groups
exhibited an effective removal while lower to negligible elimination efficiencies
were observed in compounds possessing long alkyl group under same conditions. In
this study, the main removal mechanism of investigated TrOCs from sludge matrix
was anaerobic biodegradation. In terms of TrOC removal, the distribution of selected
TrOCs in water and solid phase was examined using the two-phase fate model.
Regarding compounds possessing high biodegradability (kb> 0.001L/gVS.d), kp
values instead of their hydrophobicity (namely log D) calculated from the proposed
two-phase fate model demonstrated a relation to their partition in the sludge phase.
For biologically persistent compounds to anaerobic conversion (kb< 0.001L/gVS.d),
sorption properties, which can be predicted by log D values, were responsible for
their fate of in sludge matrix.

121
7 CONCLUSIONS AND RECOMMENDATIONS
7.1 Conclusions
The treatment performance of sewage sludge under anaerobic condition was
investigated in this study. Firstly, a critical review on the up-to-date literature of the
AD process was concentrated on two key aspects, namely CH4 production
enhancement and TrOC removal efficiencies. Secondly, a series of batch tests with
respect to both aspects were conducted to envision the potential of glycerol as a co-
substrate in enhancing CH4 yields, and to widen the understanding of the capacity in
eliminating diverse TrOCs in sewage sludge under anaerobic condition. The main
conclusions were summarised as following.
In the first series of batch-mode biomethane potential (BMP) tests, the potential of
CH4 yields and process stability of each sewage sludge and glycerol was tested based
on their characteristics. Data from experimental observations indicated a significant
improvement in terms of yielding CH4and system stability by the buffer supplement
(NaHCO3). Compared to the non-buffed bottles, higher performance in producing
CH4 was recorded in bottles with addition of 15 and 30 mM NaHCO3. Estimated lag
times from kinetic analyses of the first-order and modified Gompertz models also
gave an evidence of such stimulation of CH4 generation by buffer addition. It is
noteworthy that buffer concentrations applied in this study were still not adequate to
initialise CH4 production. This instability could be attributed to insufficient
methanogenic activity.
BMP of raw primary sludge was alternatively tested by using 1/1 ratio rather than 1/9
ratio of I/S by volume. Stability in methanogenesis of raw primary sludge was
achieved during this batch test due to favourable anaerobic conditions (i.e. neutral
pH and high buffer capacity), revealing an important role of I/S ratio. Both
experimental results and kinetic analysis data demonstrated a great potential of raw
primary sludge in CH4 yield, low CH4 production rate and long lag phase made it
unfavourable for a well-established anaerobic digester though. The supplement of
substrates rich in readily biodegradable part was prospectively considered to
accelerate the methanogenesis of raw primary sludge in particular and sewage sludge
in general.

122
Another series of BMP tests of glycerol were carried out with the adequate inoculum
supplementation. Evaluation of control parameters among three types of glycerol at
different concentrations showed a stable function of anaerobic conversion. It could
be expected from the high experimental and predicted CH4 potential yields that any
glycerol should be considered a feasible co-substrate for sewage sludge. Their high
soluble organic fraction and solubility also supported this expectation.
Data from batch tests of anaerobic co-digestion of raw primary sludge and glycerol
pointed out that the addition of 0.5% and 1.0% of glycerol into raw primary sludge
was satisfactory in terms of daily and cumulative CH4 production within the start-up
stage. This improvement resulted from the enhancement of organic source with
regard to CODs, the highly biodegradability and solubility of glycerol. On the other
hand, certain characteristics of digestates, typical of higher CODs, acidic pH and
inadequate alkalinity as well as short methanogenic duration, indicated the
incomplete anaerobic biodegradation for the long-term operation. These findings
indicated the great effects of I/S ratio and buffer supplementation on system stability
and then the ultimate CH4 potential.
The last batch-mode BMP tests were performed to evaluate the removal efficiency of
selected TrOCs by anaerobic treatment. In terms of system stability, experimental
results and kinetic data of parameter variations and CH4 yields indicated a steady
state of methanogenesis, which was created after 1.6 days in TrOC-spiked bottles.
Biodegradation was the main mechanism for the removal of TrOCs during this AD
of sludge. The extent of biodegradability of TrOCs was related to their molecular
properties in terms of functional groups rather than other physicochemical properties.
Compounds with the inclusion of halogen, methoxy and amine/amide groups
exhibited an effective removal while low to no removal efficiencies were observed in
compounds possessing long alkyl group under same conditions. In general, the
distribution of selected TrOCs in sludge system under anaerobic conditions exhibited
a weak correlation to their hydrophobicity (log D). Particularly considering
biologically compounds persistent to anaerobic conversion, their water-solid partition
(kp) can be predicted by their log D. In case of TrOCs amenable to anaerobic
conversion, kp calculated from the proposed two-phase fate model are more
appropriate to describe their fate in sludge matrix than log D values.

123
7.2 Recommendations for future studies
Some suggestions for future studies were made over this research course.
Given the great effects of buffer supplement and I/S ratio on the system stability, it is
highly recommended to investigate appropriate I/S ratios and buffer concentrations
for a stable performance of methanogenic conversion, after which the ultimate CH4
yields of co-substrate mixtures will be attained.
It would be also necessary to evaluate the limit glycerol concentration beyond which
a shock of organic loading will happen under steady state of anaerobic processes.
Further, BMP of anaerobically co-digesting sewage sludge with other potential
organic materials, beverage rejects and food waste, as examples should be
extensively investigated. These findings at laboratory-scale batch mode are expected
to be valuable for larger scale operations in WWTPs in terms of economic benefits
and time saving.
Compounds possessing the methoxy group in their chemical structures effectively
eliminated with the presence of methanol under anaerobic condition, suggesting in
some extent a positive role of methanol in anaerobic biodegradation of TrOCs. This
suggestion deserves more studies to comprehensively examine a real effect of co-
digestion with readily biodegradable substrate on anaerobic metabolism of a
particular compound.
The observed significant variation from negligible to excellent removal capacity of
the anaerobic sludge treatment requires more understanding of main factors, which
govern the elimination of specific chemicals. The long-term exposure of inoculum to
TrOCs has been considered as an example. This aspect, however, has not been
included in this study. Such acclimatisation could be possibly envisioned through
more batch experiments using TrOC-acclimatised anaerobic sludge. Quantification
and identification of associated anaerobic populations responsible for degrading
TrOCs could be also endorsed in a broader context.
Modifications of the applied two-phase fate kinetic model should be made to develop
a novel mathematic model. Considering all possible factors associated to the
dynamics of TrOC concentrations over the digestion time, this model is expected to
more precisely predict their fate in sludge matrix under anaerobic condition, and their
attenuation subsequently.

124
REFERENCES
1. Bresters, A.R., Coulomb, I., Deak, B., Matter, B., Saabye, A., Spinosa, L., and Utvik, Å.Ø.,
Sludge Treatment and Disposal: Management Approaches and Experiences. Environmental
Issues Series. 1997: European Environment Agency.
2. Fytili, D. and Zabaniotou, A., Utilization of sewage sludge in EU application of old and new
methods—A review. Renewable and Sustainable Energy Reviews, 2008. 12(1): p. 116-140.
3. Clemens, J., Trimborn, M., Weiland, P., and Amon, B., Mitigation of greenhouse gas
emissions by anaerobic digestion of cattle slurry. Agriculture, Ecosystems &
Environment, 2006. 112(2–3): p. 171-177.
4. Wilkie, A.C., Anaerobic Digestion: Biology and Benefits, in Dairy Manure Management:
Treatment, Handling, and Community Relations. 2005: Natural Resource, Agriculture, and
Engineering Service, Cornell University, Ithaca, NY, 2005. p. 63-72.
5. Nasir, I.M., Mohd Ghazi, T.I., and Omar, R., Anaerobic digestion technology in livestock
manure treatment for biogas production: A review. Engineering in Life Sciences, 2012.
12(3): p. 258-269.
6. Demirel, B., Yenigun, O., and Onay, T.T., Anaerobic treatment of dairy wastewaters: a
review. Process Biochemistry, 2005. 40(8): p. 2583-2595.
7. Lorimor, J., Powers, W. & Sutton, A., Manure Characteristics. Manure Management System
Series. Section 1, MWPS (Midwest Plan Service)-18 Iowa State University Publ., Ames,
USA, 2000.
8. Castro, H., Queirolo, M., Quevedo, M., and Muxí, L., Preservation methods for the storage
of anaerobic sludges. Biotechnology Letters, 2002. 24(4): p. 329-333.
9. Müller, W.-R., Frommert, I., and Jörg, R., Standardized methods for anaerobic
biodegradability testing. Re/Views in Environmental Science & Bio/Technology, 2004. 3(2):
p. 141-158.
10. CIWEM, Sewage sludge : introducing treatment and management. Handbooks of UK
wastewater practice. 1995, London: Chartered Institution of Water and Environmental
Management. 118.
11. Myint, M., Nirmalakhandan, N., and Speece, R.E., Anaerobic fermentation of cattle manure:
Modeling of hydrolysis and acidogenesis. Water Research, 2007. 41(2): p. 323-332.
12. Rashed, I.G.A.-A., Akunna, J., El-Halwany, M.M., and Atiaa, A.F.F.A., Improvement in the
efficiency of hydrolysis of anaerobic digestion in sewage sludge by the use of enzymes.
Desalination and Water Treatment, 2010. 21(1-3): p. 280-285.
13. Ostrem, K., Greening waste: Anaerobic digestion for treating the organic fraction of
municipal solid wastes, in Department of Earth and Environmental Engineering. 2004,
Columbia University.
14. Boe, K., Dolin, C.T., and Middlet, J.C., Online monitoring and control of the biogas process,
in Institute of Environment & Resources. 2006, Technical University of Denmark
15. Braun, R. and Weillinger, A., Potential of Co-digestion. 2010: IEA Bioenergy.
16. Nakagawa, T., Sato, S., Yamamoto, Y., and Fukui, M., Successive changes in community
structure of an ethylbenzene-degrading sulfate-reducing consortium. Water Research, 2002.
36(11): p. 2813-2823.
17. Tang, Y.-Q., Matsui, T., Morimura, S., Wu, X.-L., and Kida, K., Effect of temperature on
microbial community of a glucose-degrading methanogenic consortium under
hyperthermophilic chemostat cultivation. Journal of Bioscience and Bioengineering, 2008.
106(2): p. 180-187.
18. Santibáñez, C., Varnero, M.T., and Bustamante, M., RESIDUAL GLYCEROL FROM
BIODIESEL MANUFACTURING, WASTE OR POTENTIAL SOURCE OF BIOENERGY: A
REVIEW. Chilean Journal of Agricultural Research, 2011. 71(3): p. 469-475.
125
19. Fountoulakis, M.S., Petousi, I., and Manios, T., Co-digestion of sewage sludge with glycerol
to boost biogas production. Waste Management, 2010. 30(10): p. 1849-1853.
20. Siles, J.A., Martín, M.A., Chica, A.F., and Martín, A., Anaerobic co-digestion of glycerol
and wastewater derived from biodiesel manufacturing. Bioresource Technology, 2010.
101(16): p. 6315-6321.
21. Samaras, V.G., Stasinakis, A.S., Mamais, D., Thomaidis, N.S., and Lekkas, T.D., Fate of
selected pharmaceuticals and synthetic endocrine disrupting compounds during wastewater
treatment and sludge anaerobic digestion. Journal of Hazardous Materials, 2013. 244–
245(0): p. 259-267.
22. Stasinakis, A.S., Review on the fate of emerging contaminants during sludge anaerobic
digestion. Bioresource Technology, 2012. 121(0): p. 432-440.
23. Paterakis, N., Chiu, T.Y., Koh, Y.K.K., Lester, J.N., McAdam, E.J., Scrimshaw, M.D.,
Soares, A., and Cartmell, E., The effectiveness of anaerobic digestion in removing estrogens
and nonylphenol ethoxylates. Journal of Hazardous Materials, 2012. 199–200(0): p. 88-95.
24. Carballa, M., Omil, F., Alder, A.C., and Lema, J.M., Comparison between the conventional
anaerobic digestion of sewage sludge and its combination with a chemical or thermal pre-
treatment concerning the removal of pharmaceuticals and personal care products. Water
Science and Technology, 2006. 53(8): p. 109-117.
25. Carballa, M., Omil, F., Ternes, T., and Lema, J.M., Fate of pharmaceutical and personal
care products (PPCPs) during anaerobic digestion of sewage sludge. Water Research, 2007.
41(10): p. 2139-2150.
26. Chang, B.V., Chiang, F., and Yuan, S.Y., Anaerobic degradation of nonylphenol in sludge.
Chemosphere, 2005. 59(10): p. 1415-1420.
27. Patureau, D., Delgenes, N., and Delgenes, J.P., Impact of sewage sludge treatment processes
on the removal of the endocrine disrupters nonylphenol ethoxylates. Chemosphere, 2008.
72(4): p. 586-591.
28. Rulkens, W., Sewage Sludge as a Biomass Resource for the Production of Energy: Overview
and Assessment of the Various Options†. Energy & Fuels, 2007. 22(1): p. 9-15.
29. Mesdaghinia, A.R., Panahi Akhavan, M., Vaezi, F., Naddafi, K., Moosavi, G.H. , Waste
Sludge Characteristics of a Wastewater Treatment Plant Compared with Environmental
Standards. Iranian J Publ Health 2012. 33(33): p. 55 - 59.
30. Arnaiz, C., Gutierrez, J.C., and Lebrato, J., Biomass stabilization in the anaerobic digestion
of wastewater sludges. Bioresource Technology, 2006. 97(10): p. 1179-1184.
31. Guyer, J.P., An Introduction to Sludge Handling, Treatment and Disposal. 2011: Continuing
Education and Development, Inc.
32. Fitzmorris, K.B.S., Fernando; O'Callaghan, Paul, Biosolids and Sludge Management. Water
Environment Research, 2009. 81(10): p. 1376-1393.
33. Milieux, Z.d., Sludge dewatering, S. FLOERGER, Editor. 2003, SNF FLOERGER.
34. Jarrell, K.F., Faguy, D., Hebert, A.M., and Kalmokoff, M.L., A general method of isolating
high molecular weight DNA from methanogenic archaea (archaebacteria). Canadian Journal
of Microbiology, 1992. 38(1): p. 65-68.
35. Kostenberg, D. and Marchaim, U., Solid waste from the instant coffee industry as a substrate
for anaerobic thermophilic digestion. Water Science and Technology, 1993. 27(2): p. 97-
107.
36. Yamada, T., Sekiguchi, Y., Imachi, H., Kamagata, Y., Ohashi, A., and Harada, H., Diversity,
Localization, and Physiological Properties of Filamentous Microbes Belonging to
Chloroflexi Subphylum I in Mesophilic and Thermophilic Methanogenic Sludge Granules.
Applied and Environmental Microbiology, 2005. 71(11): p. 7493 - 7503.
37. Davidsson, A., Lo¨vstedt, C., Jansen, J.l.C., Gruvberger, C., and Aspegren, H., Co-digestion
of grease trap sludge and sewage sludge. Waste Management, 2008. 28: p. 986 - 992.

126
38. Noutsopoulos, C., Mamais, D., Anroniou, K., and Avramides, C., Increase of biogas
production through co-digestion of lipids and sewage sludge. Global NEST Journal, 2012.
14(2): p. 133-140.
39. Zaha, C. and Dumitrescu, L., Sludge recycling - needs and trends Bulletin of the Transilvania
University of Brasov, Series I: Engineering Sciences, 2008. 1(50): p. 299-304.
40. Harrison, E.Z., Oakes, S.R., Hysell, M., and Hay, A., Organic chemicals in sewage sludges.
Science of the Total Environment, 2006. 367(2–3): p. 481-497.
41. Scragg, A.H., Environmental Biotechnology. 2005: Oxford University Press, 2005.
42. Verma, S., Anaerobic digestion of bidegradation organics in municipal solid wastes, in
Department of Earth & Environmental Engineering. 2002, Columbia University. p. 51.
43. Fang, H.H.P., Environmental Anaerobic Technology: Applications and New Developments.
2010: Imperial College Press. 421.
44. Ward, A.J., Hobbs, P.J., Holliman, P.J., and Jones, D.L., Optimisation of the anaerobic
digestion of agricultural resources. Bioresource Technology, 2008. 99(17): p. 7928-7940.
45. Rajagopal, R. and Béline, F., Anaerobic hydrolysis and acidification of organic substrates:
Determination of anaerobic hydrolytic potential. Bioresource Technology, 2011. 102(10): p.
5653-5658.
46. Tomei, M.C., Braguglia, C.M., Cento, G., and Mininni, G., Modeling of Anaerobic Digestion
of Sludge. Critical Reviews in Environmental Science and Technology, 2009. 39(12): p.
1003-1051.
47. Sakar, S., Yetilmezsoy, K., and Kocak, E., Anaerobic digestion technology in poultry and
livestock waste treatment- a literature review. Waste management & research, 2009. 27(1):
p. 3.
48. Sung, S. and Santha, H., Performance of temperature-phased anaerobic digestion (TPAD)
system treating dairy cattle wastes. Water Research, 2003. 37(7): p. 1628-1636.
49. Demirer, G. and Chen, S., Anaerobic Digestion of Dairy Manure in a Hybrid Reactor with
Biogas Recirculation. World Journal of Microbiology and Biotechnology, 2005. 21(8): p.
1509-1514.
50. Wu, W., Anaerobic Co-digestion of Biomass for Methane Production: Recent Research
Achievements. Iowa State University, 2007.
51. Hwang, M.H., Jang, N.J., Hyun, S.H., and Kim, I.S., Anaerobic bio-hydrogen production
from ethanol fermentation: the role of pH. Journal of Biotechnology, 2004. 111(3): p. 297-
309.
52. Khanal, S.K., Overview of Anaerobic Biotechnology, in Anaerobic Biotechnology for
Bioenergy Production. 2009, Wiley-Blackwell. p. 1-27.
53. Astals, S., Ariso, M., Galí, A., and Mata-Alvarez, J., Co-digestion of pig manure and
glycerine: Experimental and modelling study. Journal of Environmental Management, 2011.
92(4): p. 1091-1096.
54. Appels, L., Baeyens, J., Degrève, J., and Dewil, R., Principles and potential of the anaerobic
digestion of waste-activated sludge. Progress in Energy and Combustion Science, 2008.
34(6): p. 755-781.
55. Burton, C.H.T., C., Anaerobic treatment options for animal manures. 2 ed. Manure
management - Treatment Strategies for Sustainable Agriculture. 2003, Bedford, UK: Silsoe
Research Institute.
56. Del Borghi, A., Converti, A., Palazzi, E., and Del Borghi, M., Hydrolysis and thermophilic
anaerobic digestion of sewage sludge and organic fraction of municipal solid waste.
Bioprocess Engineering, 1999. 20(6): p. 553-560.
57. Viéitez, E.R. and Ghosh, S., Biogasification of solid wastes by two-phase anaerobic
fermentation. Biomass and Bioenergy, 1999. 16(5): p. 299-309.
127
58. Chen, Y., Cheng, J.J., and Creamer, K.S., Inhibition of anaerobic digestion process: A
review. Bioresource Technology, 2008. 99(10): p. 4044-4064.
59. Lettinga, G., van Velsen, A.F.M., Hobma, S.W., de Zeeuw, W., and Klapwijk, A., Use of the
upflow sludge blanket (USB) reactor concept for biological wastewater treatment, especially
for anaerobic treatment. Biotechnology and Bioengineering, 1980. 22(4): p. 699-734.
60. Zhu, D., Co-digestion of Different Wastes for Enhanced Methane Production. 2010, The
Ohio State University.
61. Arsova, L., Anaerobic digestion of food waste: Current status, problems and an alternative
product, in Department of Earth and Environmental Engineering. 2010, Columbia
University.
62. Jensen, P.D., Ge, H., and Batstone, D.J., Assessing the role of biochemical methane potential
tests in determining anaerobic degradability rate and extent. Water Science & Technology,
2011. 64(4): p. 880-886.
63. Schink, B., Energetics of syntrophic cooperation in methanogenic degradation.
Microbiology and molecular biology reviews : MMBR, 1997. 61(2): p. 262-280.
64. Hansen, T.L., Schmidt, J.E., Angelidaki, I., Marca, E., Jansen, J.l.C., Mosbæk, H., and
Christensen, T.H., Method for determination of methane potentials of solid organic waste.
Waste Management, 2004. 24(4): p. 393-400.
65. Ramin, M. and Huhtanen, P., Development of an in vitro method for determination of
methane production kinetics using a fully automated in vitro gas system—A modelling
approach. Animal Feed Science and Technology, 2012. 174(3–4): p. 190-200.
66. Carrère, H., Dumas, C., Battimelli, A., Batstone, D.J., Delgenès, J.P., Steyer, J.P., and Ferrer,
I., Pretreatment methods to improve sludge anaerobic degradability: A review. Journal of
Hazardous Materials, 2010. 183(1–3): p. 1-15.
67. Siddiqui, Z., Horan, N.J., and Anaman, K., Optimisation of C:N Ratio for Co-Digested
Processed Industrial Food Waste and Sewage Sludge Using the BMP Test. International
journal of chemical reactor engineering, 2011. 9(1).
68. Angelidaki, I. and Sanders, W., Assessment of the anaerobic biodegradability of
macropollutants. Re/Views in Environmental Science & Bio/Technology, 2004. 3(2): p. 117-
129.
69. Amann, R.I., Ludwig, W., and Schleifer, K.H., Phylogenetic identification and in situ
detection of individual microbial cells without cultivation. Microbiological Reviews, 1995.
59(1): p. 143-169.
70. Imachi, H., Sekiguchi, Y., Kamagata, Y., Ohashi, A., and Harada, H., Cultivation and In Situ
Detection of a Thermophilic Bacterium Capable of Oxidizing Propionate in Syntrophic
Association with Hydrogenotrophic Methanogens in a Thermophilic Methanogenic Granular
Sludge. Applied and Environmental Microbiology, 2000. 66(3608 - 3615).
71. LaPara, T.M., Nakatsu, C.H., and, P.L., and E., A.J., Phylogenetic analysis of bacterial
communities in mesophilic and thermophilic bioreactors treating pharmaceutical
wastewater. Appl Environ Microbiol., 2000. 66(9): p. 3951.
72. Ito, T., Okabe, S., Satoh, H., and Watanabe, a.Y., Successional development of sulfate-
reducing bacterial populations and their activities in a wastewater biofilm growing under
microaerophilic conditions. Appl Environ Microbiol., 2002. 68(1392 - 1402).
73. Rincón, B., Raposo, F., Borja, R., Gonzalez, J.M., Portillo, M.C., and Saiz-Jimenez, C.,
Performance and microbial communities of a continuous stirred tank anaerobic reactor
treating two-phases olive mill solid wastes at low organic loading rates. Journal of
Biotechnology, 2006. 121(4): p. 534-543.
74. Rothe, O. and Thomm, M., A simplified method for the cultivation of extreme anaerobic
Archaea based on the use of sodium sulfite as reducing agent. Extremophiles, 2000. 4(4): p.
247-252.

128
75. Ariesyady, H.D., Ito, T., and Okabe, S., Functional bacterial and archaeal community
structures of major trophic groups in a full-scale anaerobic sludge digester. Water Research,
2007. 41(7): p. 1554-1568.
76. Labatut, R.A., Angenent, L.T., and Scott, N.R., Biochemical methane potential and
biodegradability of complex organic substrates. Bioresource Technology, 2011. 102(3): p.
2255-2264.
77. Weiland, P., Biogas production: current state and perspectives. Applied Microbiology and
Biotechnology, 2010. 85(4): p. 849-860.
78. Lacovidou, E., Ohandja, D.-G., and Voulvoulis, N., Food waste co-digestion with sewage
sludge – Realising its potential in the UK. Journal of Environmental Management, 2012.
112(0): p. 267-274.
79. Stern, S.A., Krishnakumar, B., Charati, S.G., Amato, W.S., Friedman, A.A., and Fuess, D.J.,
Performance of a bench-scale membrane pilot plant for the upgrading of biogas in a
wastewater treatment plant. Journal of Membrane Science, 1998. 151(1): p. 63-74.
80. Bialek, K., Kim, J., Lee, C., Collins, G., Mahony, T., and O’Flaherty, V., Quantitative and
qualitative analyses of methanogenic community development in high-rate anaerobic
bioreactors. Water Research, 2011. 45(3): p. 1298-1308.
81. Lee, C., Kim, J., Hwang, K., O'Flaherty, V., and Hwang, S., Quantitative analysis of
methanogenic community dynamics in three anaerobic batch digesters treating different
wastewaters. Water Research, 2009. 43(1): p. 157-165.
82. Luostarinen, S., Luste, S., and Sillanpää, M., Increased biogas production at wastewater
treatment plants through co-digestion of sewage sludge with grease trap sludge from a meat
processing plant. Bioresource Technology, 2009. 100(1): p. 79-85.
83. Davidsson, Å., Lövstedt, C., la Cour Jansen, J., Gruvberger, C., and Aspegren, H., Co-
digestion of grease trap sludge and sewage sludge. Waste Management, 2008. 28(6): p. 986-
992.
84. Kabouris, J.C., Tezel, U., Pavlostathis, S.G., Engelmann, M., Dulaney, J., Gillette, R.A., and
Todd, A.C., Methane recovery from the anaerobic codigestion of municipal sludge and FOG.
Bioresource Technology, 2009. 100(15): p. 3701-3705.
85. Long, J.H., Aziz, T.N., Reyes Iii, F.L.d.l., and Ducoste, J.J., Anaerobic co-digestion of fat,
oil, and grease (FOG): A review of gas production and process limitations. Process Safety
and Environmental Protection, 2012. 90(3): p. 231-245.
86. Alves, M.M., Pereira, M.A., Sousa, D.Z., Cavaleiro, A.J., Picavet, M., Smidt, H., and Stams,
A.J.M., Waste lipids to energy: how to optimize methane production from long-chain fatty
acids (LCFA). Microbial Biotechnology, 2009. 2(5): p. 538-550.
87. Pereira, M.A., Sousa, D.Z., Mota, M., and Alves, M.M., Mineralization of LCFA associated
with anaerobic sludge: Kinetics, enhancement of methanogenic activity, and effect of VFA.
Biotechnology and Bioengineering, 2004. 88(4): p. 502-511.
88. Sosnowski, P., Wieczorek, A., and Ledakowicz, S., Anaerobic co-digestion of sewage sludge
and organic fraction of municipal solid wastes. Advances in Environmental Research, 2003.
7(3): p. 609-616.
89. Cabbai, V., Ballico, M., Aneggi, E., and Goi, D., BMP tests of source selected OFMSW to
evaluate anaerobic codigestion with sewage sludge. Waste Management, 2013. 33(7): p.
1626-1632.
90. Kim, H.-W., Han, S.-K., and Shin, H.-S., The optimisation of food waste addition as a
cosubstrate in anaerobic digestion of sewage sludge. Waste Management and Research,
2003(21): p. 515 - 526.
91. Neves, L., Oliveira, R., and Alves, M.M., Anaerobic co-digestion of coffee waste and sewage
sludge. Waste Management, 2006. 26(2): p. 176-181.

129
92. Dinsdale, R.M., Hawkes, F.R., and Hawkes, D.L., The mesophilic and thermophilic
anaerobic digestion of coffee waste containing coffee grounds. Water Research, 1996. 30(2):
p. 371-377.
93. Angelidaki, I. and Ellegaard, L., Codigestion of manure and organic wastes in centralized
biogas plants. Applied Biochemistry and Biotechnology, 2003. 109(1-3): p. 95-105.
94. Marchetti, J.M., Miguel, V.U., and Errazu, A.F., Possible methods for biodiesel production.
Renewable and Sustainable Energy Reviews, 2007. 11(6): p. 1300-1311.
95. Yazdani, S.S. and Gonzalez, R., Anaerobic fermentation of glycerol: a path to economic
viability for the biofuels industry. Current Opinion in Biotechnology, 2007. 18(3): p. 213-
219.
96. Khanal, S.K., Rasmussen, M., Shrestha, P., Van Leeuwen, H.J., Visvanathan, C., and Liu, H.,
Bioenergy and Biofuel Production from Wastes/Residues of Emerging Biofuel Industries.
Water Environment Research, 2008. 80(10): p. 1625-1647.
97. Lafitte-Trouqué, S. and Forster, C.F., Dual anaerobic co-digestion of sewage sludge and
confectionery waste. Bioresource Technology, 2000. 71(1): p. 77-82.
98. Luste, S. and Luostarinen, S., Anaerobic co-digestion of meat-processing by-products and
sewage sludge – Effect of hygienization and organic loading rate. Bioresource Technology,
2010. 101(8): p. 2657-2664.
99. Pecharaply, A., Parkpian, P., Annachhatre, A.P., and Jugsujinda, A., Influence of anaerobic
co-digestion of sewage and brewery sludges on biogas production and sludge quality.
Journal of Environemental Science and Health Part A, 2007. 42: p. 911 - 923.
100. Marañón, E., Castrillón, L., Quiroga, G., Fernández-Nava, Y., Gómez, L., and García, M.M.,
Co-digestion of cattle manure with food waste and sludge to increase biogas production.
Waste Management, 2012. 32(10): p. 1821-1825.
101. Bolong, N., Ismail, A.F., Salim, M.R., and Matsuura, T., A review of the effects of emerging
contaminants in wastewater and options for their removal. Desalination, 2009. 239(1–3): p.
229-246.
102. Jobling, S., Nolan, M., Tyler, C.R., Brighty, G., and Sumpter, J.P., Widespread sexual
disruption in wild fish. Environmental Science and Technology, 1998. 32(17): p. 2498-2506.
103. Ishido, M., Masuo, Y., Terasaki, M., and Morita, M., Rat hyperactivity by bisphenol A, but
not by its derivatives, 3-hydroxybisphenol A or bisphenol A 3,4-quinone. Toxicology Letters,
2011. 206(3): p. 300-305.
104. Stasinakis, A.S., Gatidou, G., Mamais, D., Thomaidis, N.S., and Lekkas, T.D., Occurrence
and fate of endocrine disrupters in Greek sewage treatment plants. Water Research, 2008.
42(6–7): p. 1796-1804.
105. Janex-Habibi, M.-L., Huyard, A., Esperanza, M., and Bruchet, A., Reduction of endocrine
disruptor emissions in the environment: The benefit of wastewater treatment. Water
Research, 2009. 43(6): p. 1565-1576.
106. Scrimshaw, M. and Jason, L., Fate and Behavior of Endocrine Disrupters in Sludge
Treatment and Disposal, in Endocrine Disrupters in Wastewater and Sludge Treatment
Processes. 2002, CRC Press.
107. Clara, M., Gans, O., Windhofer, G., Krenn, U., Hartl, W., Braun, K., Scharf, S., and
Scheffknecht, C., Occurrence of polycyclic musks in wastewater and receiving water bodies
and fate during wastewater treatment. Chemosphere, 2011. 82(8): p. 1116-1123.
108. Voulvoulis, N. and Lester, J.N., Fate of organotins in sewage sludge during anaerobic
digestion. Science of the Total Environment, 2006. 371(1–3): p. 373-382.
109. Schultz, M.M., Higgins, C.P., Huset, C.A., Luthy, R.G., Barofsky, D.F., and Field, J.A.,
Fluorochemical Mass Flows in a Municipal Wastewater Treatment Facility†. Environmental
Science & Technology, 2006. 40(23): p. 7350-7357.

130
110. Gerecke, A.C., Giger, W., Hartmann, P.C., Heeb, N.V., Kohler, H.-P.E., Schmid, P.,
Zennegg, M., and Kohler, M., Anaerobic degradation of brominated flame retardants in
sewage sludge. Chemosphere, 2006. 64(2): p. 311-317.
111. Clara, M., Windhofer, G., Hartl, W., Braun, K., Simon, M., Gans, O., Scheffknecht, C., and
Chovanec, A., Occurrence of phthalates in surface runoff, untreated and treated wastewater
and fate during wastewater treatment. Chemosphere, 2010. 78(9): p. 1078-1084.
112. Barret, M., Carrère, H., Delgadillo, L., and Patureau, D., PAH fate during the anaerobic
digestion of contaminated sludge: Do bioavailability and/or cometabolism limit their
biodegradation? Water Research, 2010. 44(13): p. 3797-3806.
113. EPA, N., Environmental guidelines: Use and disposal of biosolid products, C. Ang and J.
Sparkes, Editors. 1997: Sydney.
114. Barret, M., Delgadillo-Mirquez, L., Trably, E., Delgenes, N., Braun, F., Cea-Barcia, G.,
Steyer, J.P., and Patureau, D., Anaerobic Removal of Trace Organic Contaminants in Sewage
Sludge: 15 Years of Experience. Pedosphere, 2012. 22(4): p. 508-517.
115. Garcia, M.T., Campos, E., Sánchez-Leal, J., and Ribosa, I., Effect of linear alkylbenzene
sulphonates (LAS) on the anaerobic digestion of sewage sludge. Water Research, 2006.
40(15): p. 2958-2964.
116. Tezel, U., Pierson, J.A., and Pavlostathis, S.G., Fate and effect of quaternary ammonium
compounds on a mixed methanogenic culture. Water Research, 2006. 40(19): p. 3660-3668.
117. Fountoulakis, M., Drillia, P., Stamatelatou, K., and Lyberatos, G., Toxic effect of
pharmaceuticals on methanogenesis. Water Science & Technology, 2004. 50(5): p. 335.
118. Gartiser, S., Urich, E., Alexy, R., and Kümmerer, K., Anaerobic inhibition and
biodegradation of antibiotics in ISO test schemes. Chemosphere, 2007. 66(10): p. 1839-1848.
119. Khan, S.J. and Ongerth, J.E., Estimation of pharmaceutical residues in primary and
secondary sewage sludge based on quantities of use and fugacity modelling. Water Science
and Technology, 2002. 46(3): p. 105-113.
120. Angelidaki, I., Toräng, L., Waul, C.M., and Schmidt, J.E., Anaerobic bioprocessing of
sewage sludge, focusing on degradation of linear alkylbenzene sulfonates (LAS). 2004. p.
115-122.
121. Sanz, J.L., Culubret, E., De Ferrer, J., Moreno, A., and Berna, J.L., Anaerobic
biodegradation of linear alkylbenzene sulfonate (LAS) in upflow anaerobic sludge blanket
(UASB) reactors. Biodegradation, 2003. 14(1): p. 57-64.
122. Lu, J., Jin, Q., He, Y., Wu, J., Zhang, W., and Zhao, J., Anaerobic degradation behavior of
nonylphenol polyethoxylates in sludge. Chemosphere, 2008. 71(2): p. 345-351.
123. Andersen, H., Siegrist, H., Halling-Sørensen, B., and Ternes, T.A., Fate of Estrogens in a
Municipal Sewage Treatment Plant. Environmental Science & Technology, 2003. 37(18): p.
4021-4026.
124. Johnson, A.C. and Williams, R.J., A Model To Estimate Influent and Effluent Concentrations
of Estradiol, Estrone, and Ethinylestradiol at Sewage Treatment Works. Environmental
Science & Technology, 2004. 38(13): p. 3649-3658.
125. Muller, M., Combalbert, S., Delgenès, N., Bergheaud, V., Rocher, V., Benoît, P., Delgenès,
J.P., Patureau, D., and Hernandez-Raquet, G., Occurrence of estrogens in sewage sludge and
their fate during plant-scale anaerobic digestion. Chemosphere, 2010. 81(1): p. 65-71.
126. Des Mes, T.Z.D., Kujawa-Roeleveld, K., Zeeman, G., and Lettinga, G., Anaerobic
biodegradation of estrogens--hard to digest. Water Science & Technology, 2008. 57(8): p.
1177-1182.
127. Shelton, D.R., Boyd, S.A., and Tledje, J.M., Anaerobic biodegradation of phthalic acid
esters in sludge. Environmental Science and Technology, 1984. 18(2): p. 93-97.
131
128. Parker, W.J., Monteith, H.D., and Melcer, H., Estimation of anaerobic biodegradation rates
for toxic organic compounds in municipal sludge digestion. Water Research, 1994. 28(8): p.
1779-1789.
129. Gavala, H.N., Alatriste-Mondragon, F., Iranpour, R., and Ahring, B.K., Biodegradation of
phthalate esters during the mesophilic anaerobic digestion of sludge. Chemosphere, 2003.
52(4): p. 673-682.
130. Marttinen, S.K., Kettunen, R.H., Sormunen, K.M., and Rintala, J.A., Removal of bis(2-
ethylhexyl) phthalate at a sewage treatment plant. Water Research, 2003. 37(6): p. 1385-
1393.
131. Angelidaki, I. and Ahring, B.K., Methods for increasing the biogas potential from the
recalcitrant organic matter contained in manure. Water Science and Technology, 2000.
41(3): p. 189-194.
132. Benabdallah El-Hadj, T., Dosta, J., and Mata-Álvarez, J., Biodegradation of PAH and DEHP
micro-pollutants in mesophilic and thermophilic anaerobic sewage sludge digestion. 2006. p.
99-107.
133. Siles López, J.Á., Martín Santos, M.d.l.Á., Chica Pérez, A.F., and Martín Martín, A.,
Anaerobic digestion of glycerol derived from biodiesel manufacturing. Bioresource
Technology, 2009. 100(23): p. 5609-5615.
134. Souto, T., Aquino, S., Silva, S., and Chernicharo, C.L., Influence of incubation conditions on
the specific methanogenic activity test. Biodegradation, 2010. 21(3): p. 411-424.
135. APHA, Standard methods for the examination of water and wastewater. 21st ed. 2005:
Washington, D. C. : APHA-AWWA-WEF.
136. Rozzi, A. and Remigi, E., Methods of assessing microbial activity and inhibition under
anaerobic conditions: a literature review. Re/Views in Environmental Science &
Bio/Technology, 2004. 3(2): p. 93-115.
137. Pagés Díaz, J., Pereda Reyes, I., Lundin, M., and Sárvári Horváth, I., Co-digestion of
different waste mixtures from agro-industrial activities: Kinetic evaluation and synergetic
effects. Bioresource Technology, 2011. 102(23): p. 10834-10840.
138. McCarty, P.L., Anaerobic Waste Treatment Fundamentals. Public Works, 1964: p.
September, 107-112, October, 123-126, November, 91-91, December, 95-99.
139. Zhang, Y., Banks, C.J., and Heaven, S., Anaerobic digestion of two biodegradable municipal
waste streams. Journal of Environmental Management, 2012. 104(0): p. 166-174.
140. Hai, F.I., Li, X., Price, W.E., and Nghiem, L.D., Removal of carbamazepine and
sulfamethoxazole by MBR under anoxic and aerobic conditions. Bioresource Technology,
2011. 102(22): p. 10386-10390.
141. Wijekoon, K.C., Hai, F.I., Kang, J., Price, W.E., Guo, W., Ngo, H.H., and Nghiem, L.D., The
fate of pharmaceuticals, steroid hormones, phytoestrogens, UV-filters and pesticides during
MBR treatment. Bioresource Technology, 2013. 144(0): p. 247-254.
142. Raposo, F., Borja, R., Martín, M.A., Martín, A., de la Rubia, M.A., and Rincón, B., Influence
of inoculum–substrate ratio on the anaerobic digestion of sunflower oil cake in batch mode:
Process stability and kinetic evaluation. Chemical Engineering Journal, 2009. 149(1–3): p.
70-77.
143. Procházka, J., Dolejš, P., Máca, J., and Dohányos, M., Stability and inhibition of anaerobic
processes caused by insufficiency or excess of ammonia nitrogen. Applied Microbiology and
Biotechnology, 2012. 93(1): p. 439-447.
144. Raposo, F., Borja, R., Rincon, B., and Jimenez, A.M., Assessment of process control
parameters in the biochemical methane potential of sunflower oil cake. Biomass and
Bioenergy, 2008. 32(12): p. 1235-1244.
145. Lim, S. and Fox, P., Biochemical methane potential (BMP) test for thickened sludge using
anaerobic granular sludge at different inoculum/substrate ratios. Biotechnology and
Bioprocess Engineering, 2013. 18(2): p. 306-312.

132
146. Lin, Y., Lü, F., Shao, L., and He, P., Influence of bicarbonate buffer on the methanogenetic
pathway during thermophilic anaerobic digestion. Bioresource Technology, 2013. 137(0): p.
245-253.
147. Hao, L.-P., Lü, F., He, P.-J., Li, L., and Shao, L.-M., Predominant Contribution of
Syntrophic Acetate Oxidation to Thermophilic Methane Formation at High Acetate
Concentrations. Environmental Science & Technology, 2010. 45(2): p. 508-513.
148. Vavilin, V., Qu, X., Mazéas, L., Lemunier, M., Duquennoi, C., He, P., and Bouchez, T.,
Methanosarcina as the dominant aceticlastic methanogens during mesophilic anaerobic
digestion of putrescible waste. Antonie Van Leeuwenhoek, 2008. 94(4): p. 593-605.
149. Redzwan, G. and Banks, C., The use of a specific function to estimate maximum methane
production in a batch-fed anaerobic reactor. Journal of Chemical Technology and
Biotechnology, 2004. 79(10): p. 1174-1178.
150. Thompson, J.C. and He, B.B., Characterization of crude glycerol from biodiesel production
from multiple feedstocks. Applied Engineering in Agriculture, 2006. 22(2): p. 261-265.
151. Viana, M.B., Freitas, A.V., Leitão, R.C., and Santaella, S.T., Biodegradability and methane
production potential of glycerol generated by biodiesel industry. Water Science &
Technology, 2012. 66(10): p. 2217-2222.
152. Astals, S., Nolla-Ardèvol, V., and Mata-Alvarez, J., Thermophilic co-digestion of pig manure
and crude glycerol: Process performance and digestate stability. Journal of Biotechnology,
2013. 166(3): p. 97-104.
153. Amon, T., Amon, B., Kryvoruchko, V., Bodiroza, V., Pötsch, E., and Zollitsch, W.,
Optimising methane yield from anaerobic digestion of manure: Effects of dairy systems and
of glycerine supplementation. International Congress Series, 2006. 1293(0): p. 217-220.
154. Rinzema, A., van Lier, J., and Lettinga, G., Sodium inhibition of acetoclastic methanogens in
granular sludge from a UASB reactor. Enzyme and Microbial Technology, 1988. 10(1): p.
24-32.
155. Barthakur, A., Bora, M., and Singh, H.D., Kinetic model for substrate utilization and
methane production in the anaerobic digestion of organic feeds. Biotechnology Progress,
1991. 7(4): p. 369-376.
156. Buswell, A.M. and Neave, S.L., Laboratory studies of sludge digestion, A.M. Buswell,
Editor. 1930, Illinois Division of State Water Survey: Urbana, Illinois.
157. Wohlgemut, O., Cicek, N., Oleszkiewicz, J., and Sparling, R., Co-digestion of hog manure
with glycerol to boost biogas and methane production. Transactions of the ASABE, 2011.
54(2): p. 723-727.
158. Astals, S., Nolla-Ardèvol, V., and Mata-Alvarez, J., Anaerobic co-digestion of pig manure
and crude glycerol at mesophilic conditions: Biogas and digestate. Bioresource Technology,
2012. 110(0): p. 63-70.
159. Ma, J., Wambeke, M., Carballa, M., and Verstraete, W., Improvement of the anaerobic
treatment of potato processing wastewater in a UASB reactor by co-digestion with glycerol.
Biotechnology Letters, 2008. 30(5): p. 861-867.
160. Borja, R., Rincón, B., Raposo, F., Sánchez, E., and Martı́n , A., Assessment of kinetic
parameters for the mesophilic anaerobic biodegradation of two-phase olive pomace.
International Biodeterioration & Biodegradation, 2004. 53(2): p. 71-78.
161. Parawira, W., Murto, M., Read, J.S., and Mattiasson, B., Volatile fatty acid production
during anaerobic mesophilic digestion of solid potato waste. Journal of Chemical
Technology & Biotechnology, 2004. 79(7): p. 673-677.
162. Raposo, F., Banks, C.J., Siegert, I., Heaven, S., and Borja, R., Influence of inoculum to
substrate ratio on the biochemical methane potential of maize in batch tests. Process
Biochemistry, 2006. 41(6): p. 1444-1450.
163. Browne, J.D. and Murphy, J.D., Assessment of the resource associated with biomethane from
food waste. Applied Energy, 2013. 104(0): p. 170-177.

133
164. Creamer, K.S., Chen, Y., Williams, C.M., and Cheng, J.J., Stable thermophilic anaerobic
digestion of dissolved air flotation (DAF) sludge by co-digestion with swine manure.
Bioresource Technology, 2010. 101(9): p. 3020-3024.
165. Park, J.-H., Kim, S.-H., Park, H.-D., Lim, D.J., and Yoon, J.-J., Feasibility of anaerobic
digestion from bioethanol fermentation residue. Bioresource Technology, 2013(0).
166. Artola-Garicano, E., Borkent, I., Damen, K., Jager, T., and Vaes, W.H.J., Sorption Kinetics
and Microbial Biodegradation Activity of Hydrophobic Chemicals in Sewage Sludge:
Model and Measurements Based on Free Concentrations. Environmental Science &
Technology, 2002. 37(1): p. 116-122.
167. Urase, T. and Kikuta, T., Separate estimation of adsorption and degradation of
pharmaceutical substances and estrogens in the activated sludge process. Water Research,
2005. 39(7): p. 1289-1300.
168. Monsalvo, V.M., McDonald, J.A., Khan, S.J., and Le-Clech, P., Removal of trace organics
by anaerobic membrane bioreactors. Water Research, 2014. 49(0): p. 103-112.
169. Tadkaew, N., Hai, F.I., McDonald, J.A., Khan, S.J., and Nghiem, L.D., Removal of trace
organics by MBR treatment: The role of molecular properties. Water Research, 2011. 45(8):
p. 2439-2451.
170. Musson, S.E., Campo, P., Tolaymat, T., Suidan, M., and Townsend, T.G., Assessment of the
anaerobic degradation of six active pharmaceutical ingredients. Science of the Total
Environment, 2010. 408(9): p. 2068-2074.
171. Lahti, M. and Oikari, A., Microbial Transformation of Pharmaceuticals Naproxen,
Bisoprolol, and Diclofenac in Aerobic and Anaerobic Environments. Archives of
Environmental Contamination and Toxicology, 2011. 61(2): p. 202-210.
172. Ternes, T.A., Meisenheimer, M., McDowell, D., Sacher, F., Brauch, H.-J., Haist-Gulde, B.,
Preuss, G., Wilme, U., and Zulei-Seibert, N., Removal of Pharmaceuticals during Drinking
Water Treatment. Environmental Science & Technology, 2002. 36(17): p. 3855-3863.
173. Stamatelatou, K., Frouda, C., Fountoulakis, M.S., Drillia, P., Kornaros, M., and Lyberatos,
G., Pharmaceuticals and health care products in wastewater effluents: the example of
carbamazepine. Water Science & Technology: Water Supply, 2003. 3(4): p. 131-137.
174. Shen, D.-S., Liu, X.-W., and Feng, H.-J., Effect of easily degradable substrate on anaerobic
degradation of pentachlorophenol in an upflow anaerobic sludge blanket (UASB) reactor.
Journal of Hazardous Materials, 2005. 119(1–3): p. 239-243.
175. Ye, F.-X. and Li, Y., Biosorption and biodegradation of pentachlorophenol (PCP) in an
upflow anaerobic sludge blanket (UASB) reactor. Biodegradation, 2007. 18(5): p. 617-624.
176. Limam, I., Mezni, M., Guenne, A., Madigou, C., Driss, M.R., Bouchez, T., and Mazéas, L.,
Evaluation of biodegradability of phenol and bisphenol A during mesophilic and
thermophilic municipal solid waste anaerobic digestion using 13C-labeled contaminants.
Chemosphere, 2013. 90(2): p. 512-520.
177. Hur, H.-G. and Rafii, F., Biotransformation of the isoflavonoids biochanin A, formononetin,
and glycitein by Eubacterium limosum. FEMS Microbiology Letters, 2000. 192(1): p. 21-25.
178. Liu, Y.-S., Ying, G.-G., Shareef, A., and Kookana, R.S., Biodegradation of the ultraviolet
filter benzophenone-3 under different redox conditions. Environmental Toxicology and
Chemistry, 2012. 31(2): p. 289-295.
179. Liu, Y.-S., Ying, G.-G., Shareef, A., and Kookana, R.S., Degradation of Six Selected
Ultraviolet Filters in Aquifer Materials Under Various Redox Conditions. Groundwater
Monitoring & Remediation, 2013. 33(4): p. 79-88.
180. Nguyen, L.N., Hai, F.I., Kang, J., Price, W.E., and Nghiem, L.D., Removal of trace organic
contaminants by a membrane bioreactor–granular activated carbon (MBR–GAC) system.
Bioresource Technology, 2012. 113: p. 169-173.

134
181. Toyama, T., Kainuma, Y., Kikuchi, S., and Mori, K., Biodegradation of bisphenol A and 4-
alkylphenols by Novosphingobium sp. strain TYA-1 and its potential for treatment of polluted
water. Water Science & Technology, 2012. 66(10): p. 2202-2208.
182. Alturki, A.A., McDonald, J.A., Khan, S.J., Price, W.E., Nghiem, L.D., and Elimelech, M.,
Removal of trace organic contaminants by the forward osmosis process. Separation and
Purification Technology, 2013. 103: p. 258-266.
183. Bhatt, P., Kumar, M.S., Mudliar, S., and Chakrabarti, T., Enhanced biodegradation of
hexachlorocyclohexane in upflow anaerobic sludge blanket reactor using methanol as an
electron donor. Bioresource Technology, 2008. 99(7): p. 2594-2602.
184. Puyol, D., Mohedano, A.F., Sanz, J.L., and Rodríguez, J.J., Anaerobic biodegradation of
2,4,6-trichlorophenol by methanogenic granular sludge: role of co-substrates and
methanogenic inhibition. Water Science & Technology, 2009. 59(7): p. 1449-1456.
185. Hu, X. and Wan, J., Study of biodegradation properties of phthalate esters in aqueous
culture conditions. Journal of Synthetic Lubrication, 2006. 23(2): p. 71-80.
186. Czajka, C.P. and Londry, K.L., Anaerobic biotransformation of estrogens. Science of The
Total Environment, 2006. 367(2–3): p. 932-941.
187. Ternes, T.A., Herrmann, N., Bonerz, M., Knacker, T., Siegrist, H., and Joss, A., A rapid
method to measure the solid–water distribution coefficient (Kd) for pharmaceuticals and
musk fragrances in sewage sludge. Water Research, 2004. 38(19): p. 4075-4084.
188. Carballa, M., Fink, G., Omil, F., Lema, J.M., and Ternes, T., Determination of the solid–
water distribution coefficient (Kd) for pharmaceuticals, estrogens and musk fragrances in
digested sludge. Water Research, 2008. 42(1–2): p. 287-295.
189. Clara, M., Strenn, B., Saracevic, E., and Kreuzinger, N., Adsorption of bisphenol-A, 17β-
estradiole and 17α-ethinylestradiole to sewage sludge. Chemosphere, 2004. 56(9): p. 843-
851.
190. Byrns, G., The fate of xenobiotic organic compounds in wastewater treatment plants. Water
Research, 2001. 35(10): p. 2523-2533.
191. Spark, K.M. and Swift, R.S., Effect of soil composition and dissolved organic matter on
pesticide sorption. Science of The Total Environment, 2002. 298(1–3): p. 147-161.
192. Ismail, Z.Z., Tezel, U., and Pavlostathis, S.G., Sorption of quaternary ammonium compounds
to municipal sludge. Water Research, 2010. 44(7): p. 2303-2313.
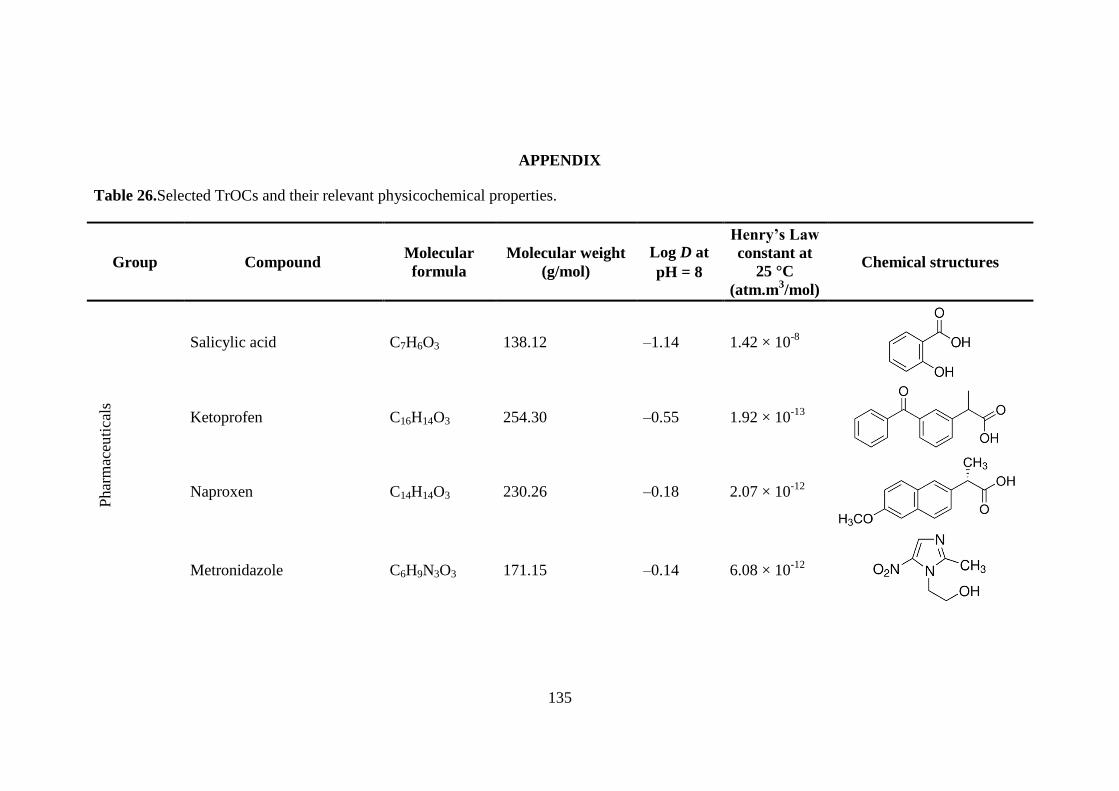
135
APPENDIX
Table 26.Selected TrOCs and their relevant physicochemical properties.
Group Compound Molecular
formula
Molecular weight
(g/mol)
Log D at
pH = 8
Henry’s Law
constant at
25 °C
(atm.m3/mol)
Chemical structures
Phar
mac
euti
cals
Salicylic acid C7H6O3 138.12 –1.14 1.42 × 10⁻⁸
Ketoprofen C16H14O3 254.30 –0.55 1.92 × 10⁻¹³
Naproxen C14H14O3 230.26 –0.18 2.07 × 10⁻¹²
Metronidazole C6H9N3O3 171.15 –0.14 6.08 × 10⁻¹²

136
Group Compound Molecular
formula
Molecular weight
(g/mol)
Log D at
pH = 8
Henry’s Law
constant at
25 °C
(atm.m3/mol)
Chemical structures
Ibuprofen C13H18O2 206.28 0.14 5.54 × 10⁻¹²
Primidone C12H14N2O2 218.25 0.83 1.16 × 10⁻¹⁴
Diclofenac C14H11Cl2NO2 296.15 1.06 2.69 × 10⁻¹¹
Gemfibrozil C15H22O3 250.33 1.18 1.83 × 10⁻¹¹
Carbamazepine C15H12N2O 236.27 1.89 9.41 × 10⁻¹²

137
Group Compound Molecular
formula
Molecular weight
(g/mol)
Log D at
pH = 8
Henry’s Law
constant at
25 °C
(atm.m3/mol)
Chemical structures
Amitriptyline C20H23N 277.40 3.21 1.24 × 10⁻¹⁰
Triclosan C12H7Cl3O2 289.54 4.92 9.49 × 10⁻⁶
Ste
roid
horm
ones
Estriol C18H24O3 288.38 2.53 1.75 × 10⁻¹¹
Estrone C18H22O2 270.37 3.62 9.61 × 10⁻¹⁰
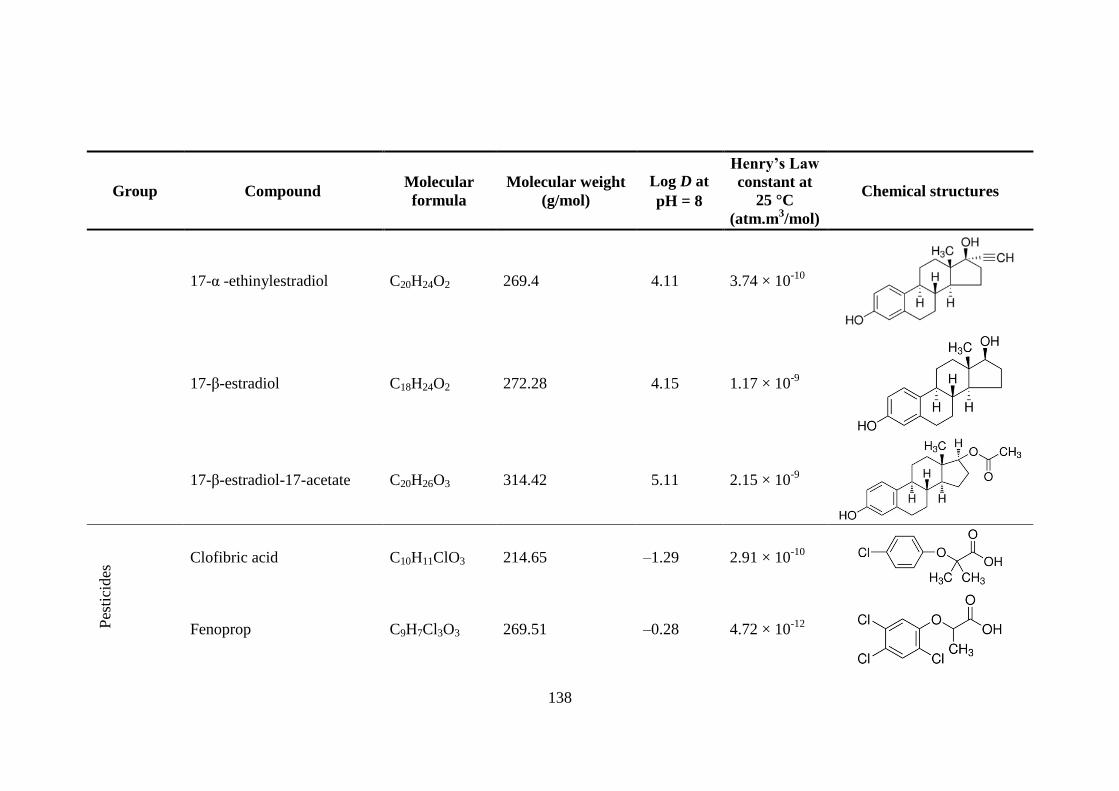
138
Group Compound Molecular
formula
Molecular weight
(g/mol)
Log D at
pH = 8
Henry’s Law
constant at
25 °C
(atm.m3/mol)
Chemical structures
17-α -ethinylestradiol C20H24O2 269.4 4.11 3.74 × 10⁻¹⁰
17-β-estradiol C18H24O2 272.28 4.15 1.17 × 10⁻⁹
17-β-estradiol-17-acetate C20H26O3 314.42 5.11 2.15 × 10⁻⁹
Pes
tici
des
Clofibric acid C10H11ClO3 214.65 –1.29 2.91 × 10⁻¹⁰
Fenoprop C9H7Cl3O3 269.51 –0.28 4.72 × 10⁻¹²

139
Group Compound Molecular
formula
Molecular weight
(g/mol)
Log D at
pH = 8
Henry’s Law
constant at
25 °C
(atm.m3/mol)
Chemical structures
Propoxur C11H15NO3 209.24 1.54 5.26 × 10⁻⁷
Pentachlorophenol C6HCl5O 266.34 2.19 1.82 × 10⁻⁷
Atrazine C8H14ClN5 215.68 2.64 5.22 × 10⁻⁸
Ametryn C9H17N5S 227.33 2.97 3.67 × 10⁻⁹

140
Group Compound Molecular
formula
Molecular weight
(g/mol)
Log D at
pH = 8
Henry’s Law
constant at
25 °C
(atm.m3/mol)
Chemical structures
Indust
rial
chem
ical
s
4-tert-butylphenol C10H14O 150.22 3.39 7.51 × 10⁻⁶
Bisphenol A C15H16O2 228.29 3.64 1.34× 10⁻⁹
4-tert-octylphenol C14H22O 206.32 5.18 8.67 × 10⁻⁶
Phyto
estr
ogen
Formononetin C16H12O4 268.26 1.81 2.91 × 10⁻¹⁰
Enterolactone C18H18O4 298.33 1.88 8.07 × 10⁻¹³

141
Group Compound Molecular
formula
Molecular weight
(g/mol)
Log D at
pH = 8
Henry’s Law
constant at
25 °C
(atm.m3/mol)
Chemical structures
UV
fil
ters
Benzophenone C13H10O 182.22 3.21 1.31 × 10⁻⁶
Oxybenzone C14H12O3 228.24 3.42 1.22 × 10⁻⁸
Octocrylene C24H27N 361.48 6.89 3.38 × 10⁻⁹
All values were sourced from Scifinder Scholar database (ACD/Labs)
Copyright © 2022 FDOKUMEN