Microwave processing of lignocellulosic biomass for ...
258
Microwave processing of lignocellulosic biomass for production of fuels Brigid Anne Lanigan Submitted for the degree of Doctor of Philosophy University of York Department of Chemistry 2010
-
Upload
khangminh22 -
Category
Documents
-
view
1 -
download
0
Transcript of Microwave processing of lignocellulosic biomass for ...

Microwave processing of lignocellulosic biomass for production of
fuels
Brigid Anne Lanigan
Submitted for the degree of Doctor of Philosophy
University of York
Department of Chemistry
2010


Abstract
Abstract
Current environmental issues and resource demands are driving the global
development of renewable energy. The work described in this thesis applies
green and energy efficient microwave technology to transform lignocellulosic
biomass into solid and liquid fuels suitable for application in coal burning power
plants or upgrading into transportation fuels.
Current thermochemical biofuel production (e.g. pyrolysis and gasification)
suffer many drawbacks such as high energy consumption and poor flexibility.
Herein, it is shown that by applying novel low temperature microwave
processing, fuels can be produced at temperatures up to 190 oC lower than
required in equivalent conventional thermal treatments.
Studies on the microwave activation of the major components of biomass give
insight into the mode of action. 180 oC was identified as the key temperature in
the degradation of cellulose. Softening of the amorphous region of cellulose at
this temperature enables microwave induced rearrangement increasing the
efficiency of microwave interaction resulting in acid catalysed decomposition. It
was shown possible to produce high calorific value chars at 150 oC lower than
previously expected. A reduction of 100 oC was observed in the degradation
temperature of hemicellulose.
The technology is versatile, effective on a variety of biomass species, and has a
favourable energy balance. In studies on whole biomass, the processing
conditions and energy usage were found to be favourable when compared with
conventional methods. Chars were produced at low temperatures with increased
calorific values and material properties in parallel with high quality bio-oils.
Pilot scale trials were also carried out proving the technology to be scalable and
open to industrial application.
This thesis shows for the first time the possibility to produce biofuels via
microwave processing, while operating at temperatures below 300 oC. The
impact of these findings is being further investigated at the dedicated microwave
facility at the University of York.


Contents
Table of Contents
Chapter 1: Introduction 1
1.1 Project Background .................................................................................. 2
1.2 Project Aims ............................................................................................. 3
1.3 Climate Change ........................................................................................ 4
1.4 Sustainable Development and Green Chemistry ..................................... 5
1.5 Biorefinery Concept ................................................................................. 7
1.6 Biomass composition ............................................................................... 8
1.7 Biomass for Energy Production ............................................................. 11
1.7.1 Biomass for liquid fuel ................................................................... 13
1.7.2 Biomass for solid fuel ..................................................................... 14
1.8 Biomass upgrading for energy production ............................................. 15
1.8.1 Thermochemical upgrading of biomass for energy production ..... 17
1.8.2 Gasification of biomass .................................................................. 18
1.8.3 Pyrolysis of biomass for liquid biofuel production ........................ 19
1.8.4 Torrefaction of biomass ................................................................. 21
1.9 Microwave Chemistry ............................................................................ 23
1.9.1 Microwave treatment of biomass ................................................... 25
1.9.2 Industrial application of microwave processes .............................. 28
1.10 Introduction to work in this thesis ....................................................... 28
1.11 References ............................................................................................ 30
Chapter 2: Microwave treatment of biomass components 33
2.1 Introduction ............................................................................................ 34
2.2 Composition of biomass ........................................................................ 34
2.2.1 Cellulose ......................................................................................... 35
2.2.2 Hemicellulose ................................................................................. 36
2.2.3 Lignin ............................................................................................. 37
2.3 Microwave treatment of biomass ........................................................... 38
2.4 Microwave treatment of cellulose .......................................................... 40
2.4.1 The “microwave-effect” ................................................................. 40

Contents
2.4.2 Effect of power and temperature on char formation ...................... 41
2.4.3 Cellulose char characterisation: Spectroscopic analysis .............. 44
2.4.4 Cellulose char characterisation: Elemental analysis .................... 49
2.4.5 Cellulose char characterisation: Thermal analysis ....................... 51
2.4.6 Cellulose char characterisation: Crystallinity ............................... 53
2.4.7 Isotope exchange studies ................................................................ 55
2.4.8 Discussion ...................................................................................... 56
2.5 Microwave treatment of hemicellulose .................................................. 59
2.5.1 Char formation ............................................................................... 59
2.5.2 Hemicellulose char characterisation: Spectroscopic analysis ...... 60
2.5.3 Structural analysis of hemicellulose: Elemental analysis .............. 62
2.5.4 Hemicellulose char characterisation: Thermal analysis ............... 62
2.5.5 Discussion ...................................................................................... 63
2.6 Microwave treatment of lignin .............................................................. 64
2.7 Conclusion ............................................................................................. 65
2.8 References .............................................................................................. 66
Chapter 3: Production of char through microwave treatment of biomass 69
3.1 Introduction ............................................................................................ 70
3.2 Process development .............................................................................. 70
3.3 Biomass for energy production .............................................................. 71
3.3.1 Dedicated energy crop: Miscanthus x giganteus ........................... 72
3.3.2 Agricultural residue: Wheat straw ................................................. 73
3.3.3 Industrial food waste: Cocoa husk ................................................. 74
3.4 Bio-char formation ................................................................................. 75
3.4.1 Properties of unprocessed biomass ................................................ 75
3.4.2 Bio-char from Miscanthus.............................................................. 76
3.4.3 Bio-char from wheat straw............................................................. 77
3.4.4 Bio-char from cocoa husk .............................................................. 80
3.5 Characterisation of bio-char ................................................................... 80
3.5.1 Miscanthus char ............................................................................. 81
3.5.2 Wheat straw char ........................................................................... 83

Contents
3.5.3 Cocoa husk char ............................................................................. 84
3.6 Fuel Properties ....................................................................................... 86
3.7 Conclusions & Future Work .................................................................. 88
3.8 References .............................................................................................. 90
Chapter 4: Production of bio-oil through microwave treatment of biomass 93
4.1 Introduction ............................................................................................ 94
4.2 Bio-oil from the microwave treatment of biomass ................................ 95
4.2.1 Experimental set-up ........................................................................ 96
4.2.2 Microwave treatment of wheat straw for production of bio-oil ....97
4.2.3 Properties of wheat straw bio-oil ................................................... 98
4.2.4 Composition of wheat straw microwave bio-oil ........................... 100
4.2.5 Influence of additives on microwave bio-oil ................................ 102
4.2.6 Influence of additives on bio-oil composition .............................. 104
4.3 Conclusions & Further work ................................................................ 109
4.5 References ............................................................................................ 111
Chapter 5: Short term studies 113
5.1 Introduction .......................................................................................... 114
5.2 Microwave treatment of lignin for preparation of materials ................ 114
5.2.2 Preparation of expanded material from lignin ............................ 116
5.2.3 Application of mesoporous lignin ................................................ 117
5.2.5 Reproducibility of Surface Area Results ...................................... 119
5.3 Pilot-scale trials of microwave treatment of biomass .......................... 120
5.4 References ............................................................................................ 125
Chapter 6: Concluding remarks and future work 127
Chapter 7: Experimental methods 135
7.1 Materials and reagents ......................................................................... 136

Contents
7.2 Sample preparation .............................................................................. 138
7.2.1 Study of direct microwave effect on cellulose (Chapter 2) .......... 138
7.2.2 Microwave treatment of biomass for char production (scale: <1 g)
............................................................................................................... 138
7.2.3 Preparation of conventional chars through slow pyrolysis and
torrefation ............................................................................................ 139
7.2.4 Microwave treatment of biomass for char and oil production (scale:
2-6 g) ..................................................................................................... 140
7.2.5 Microwave treatment of biomass for char and oil production (scale:
8-500 g) ................................................................................................ 140
7.2.6 Use of additives ............................................................................ 141
7.2.7 Microwave treatment of biomass for char and oil production (scale:
5-50 kg) ................................................................................................ 141
7.2.8 Formation of expanded materials from lignin ............................. 142
7.3 Characterisation of feedstocks and products ....................................... 143
7.3.1 Measurement of calorific value .................................................... 143
7.3.2 Infra-red analysis ......................................................................... 144
7.3.3 Deuteration of cellulose for analysis ........................................... 144
7.3.4 FTIR analysis of volatile components released during microwave
treatment .............................................................................................. 145
7.3.5 Elemental analysis of biomass and chars .................................... 145
7.3.6 Modulated differential scanning calorimetry ............................... 145
7.3.7 Solid-state 13C CP MAS NMR analysis of cellulose and cellulose
chars ...................................................................................................... 146
7.3.8 Characterisation of biomass composition .................................... 146
7.3.9 Analysis of conventional pyrolysis oil .......................................... 147
7.3.10 GC-MS analysis of microwave oils ............................................ 147
7.3.11 Elemental composition of microwave oils .................................. 148
7.3.12 Microwave oils water content .................................................... 148
7.3.13 Determination of acid number ................................................... 148
7.3.14 1H NMR of microwave oils ......................................................... 148
7.3.15 Surface area measurements ....................................................... 149
7.4 References ............................................................................................ 150

Contents
Appendices 151
Appendix 1: Calculations ...........................................................................153
Appendix 2: Published work ......................................................................167
Definitions 231

Contents

Tables and Figures
Tables and Figures
Table Title Page
Chapter1: Introduction
1.1 Potential benefits and challenges associated with renewable
feedstocks
6
1.2 The Twelve Principles of Green Chemistry 6
1.3 Typical Chemical Composition of Selected Lignocellulosic
Species
11
1.4 tan δ values of selected solvents at 25 oC 24
Chapter 2: Microwave treatment of biomass components
2.1 Points of comparison between microwave (mw) and conventional
(con) chars
46
2.2 Relationship between H/C ratio and structure 50
2.3 Points of comparison between microwave (mw) and conventional
(con) chars
60
Chapter 3: Production of char through microwave treatment of biomass
3.1 IR assignment of biomass 81
3.2 Calorific value of char relative to yield 87
Chapter 4: Production of bio-oil through microwave treatment of biomass
4.1 Comparison of key properties of crude petroleum and bio-oils
produced from the conventional pyrolysis and microwave
activation of biomass
99
4.2 Most significant peaks in GC of microwave wheat straw pyrolysis
oil
101
4.3 Mass balance of products from the low temperature microwave 103

Tables and Figures
activation of wheat straw pellets including presence of additives
4.4 Overview of wheat straw microwave bio-oils 109
Chapter 5: Short term studies
5.1 IUPAC Pore Classification 115
5.2 Properties of materials produced through microwave treatment
(200 W) of bioethanol lignin in the presence of NaOH (2 M)
116
5.3 Char preparation conditions and properties 123
Chapter 6: Concluding remarks and future work
6.1 Energy balance for production of fuels from biomass using
microwave processing
132
Appendix 1: Calculations
1 Elemental composition of cellulose and chars 153
2 Elemental composition of xylan and chars 154
3 Elemental composition of biomass and chars 155
4 Integral values within specified chemical shift ranges 158
5 Preliminary results of microwave processing of miscanthus and
spruce for production of bio-oil
159
6 Pilot scale microwave treatment of biomass: available operating
conditions, yields and characterisation
160

Tables and Figures
Figure Title Page
Chapter1: Introduction
1.1 EU renewable energy production targets 2
1.2 UK greenhouse gas emissions by sector 1990 % 2008 (MtCO2e) 5
1.3 Illustration of biorefinery concept 8
1.4 Outline of components of lignocellulosic biomass 8
1.5 Proposed structure of hemicellulose, cellulose and lignin 10
1.6 Carbon cycle 12
1.7 Production of liquid fuels from biomass 13
1.8 A) Energy generation from renewable sources (2005-2007)
B) Contribution of various types of biomass to production of
energy (electricity, heat and transport).
15
1.9 Products of thermochemical treatment of biomass 17
1.10 Application of products of biomass gasification39
19
1.11 Application of products of biomass pyrolysis39
20
1.12 Bio-oil 20
1.13 Diverse range of biomass available 21
1.14 Electromagnetic spectrum 23
1.15 Comparison of microwave irradiation and conventional heating 25
Chapter 2: Microwave treatment of biomass components
2.1 Structure of cellulose
A: stereochemistry within chain
B: planar view
C: extensive hydrogen bond network in cellulose
36
2.2 Structure of arabino-xylan showing complex branched nature of
polymer
37
2.3 Lignin building blocks 38
2.4 Initial microwave interaction with cellulose due to the presence of
H-bonding
39

Tables and Figures
2.5 Scheme of experimental set-up for estimation of direct microwave
effect on the cellulose. A) Construction of the cell. B) Image of
cellulose in capillary before (I) and after (II) microwave treatment.
C) Cellulose samples treated in the microwave from 150 – 220 ºC
under the sample processing condition as those in B.
41
2.6 Calorific value of char obtained from cellulose through traditional
and microwave pyrolysis
42
2.7 A: Gram Schmidt FTIR trace of the volatiles produced during the
microwave decomposition of high cellulose
B: IR spectra of evolved fractions
43
2.8 FTIR and 13
C MAS NMR of cellulose and microwave chars. 45
2.9 FTIR spectra of cellulose and pyrolysis chars prepared under
various conditions
47
2.10 13
C MAS NMR spectra of microwave char at 300 oC and
conventional char at 364 oC
49
2.11 Van Krevelen diagram showing the position of the cellulose chars 50
2.12 MDSC trace of cellulose showing heat flow signal and reversing
and non-reversing heat flow signals.
52
2.13 Derivative of the reversing heat flow signal. 53
2.14 FTIR spectrum of conventional cellulose chars 54
2.15 Relative crystallinity of cellulose samples produced by
conventional and microwave heating
55
2.16 Calorific value of microwave char of partially deuterated cellulose
compared to non-deuterated chars prepared under microwave and
conventional conditions
56
2.17 Mechanism of acid catalysed cellulose degradation 58
2.18 Calorific value of char obtained from xylan processed
conventionally and in the presence of microwaves.
59
2.19 FTIR spectrum of xylan chars prepared at various temperatures
under microwave and conventional conditions
61
2.20 Van Krevelen diagram showing the position of the xylan chars
relative to conventional fuels
62
2.21 DSC trace of xylan showing heat flow signal and reversing and 63

Tables and Figures
non-reversing heat flow signals.
2.22 Heating profile of lignin under microwave conditions 64
Chapter 3: Production of char through microwave treatment of biomass
3.1 Harvesting of Miscanthus × giganteus which grows as a tall
upright crop
73
3.2 Uses of straw in the UK 74
3.3 Cocoa husk sourced from Nestlé UK 74
3.4 Composition of biomass samples (based on oven dried weight) 75
3.5 Preparation of miscanthus chars A: under microwave conditions at
1200 W and 800W, B: comparison of chars prepared under
microwave (1200 W) and conventional conditions
77
3.6 Preparation of wheat straw chars under microwave conditions A)
WS 07 and WS 08 B) WS 07 and pellets
78
3.7 Preparation of wheat straw chars under microwave conditions (A:
WS 07, C: WS 08). Comparison of chars prepared under
microwave and conventional conditions (B: WS 07, D: WS 08)
79
3.8 A) Preparation of cocoa husk chars under microwave conditions.
B) Comparison of chars prepared under microwave and
conventional conditions
80
3.9 FTIR spectra of miscanthus and chars prepared through
microwave and conventional pyrolysis
82
3.10 FTIR spectra of wheat straw samples (WS 07 and WS 08) and
chars prepared through microwave and conventional pyrolysis
83
3.11 FTIR spectra of cocoa husk and chars prepared through
microwave and conventional pyrolysis
85
3.12 Krevelen diagram representing elemental composition of biomass
chars
86
3.13 Effect of storage on unprocessed cocoa husk and cocoa husk char 88

Tables and Figures
Chapter 4: Production of bio-oil through microwave treatment of biomass
4.1 Process for production of microwave bio-oil 97
4.2 Evolution of fractions during microwave treatment of wheat straw 98
4.3 FTIR spectrum of microwave pyrolysis wheat straw bio-oil 100
4.4 Comparison GC analysis of conventional (A) and microwave (B)
pyrolysis oil from wheat straw pellets
102
4.5 Model for pyrolysis of pure cellulose under vacuum 100
4.6 Distribution of functional groups in bio-oil based on 1H NMR
analysis of bio-oil from microwave treatment of wheat straw
pellets in the presence of additives
106
4.7 A) GC traces from qualitative analysis of microwave wheat straw
bio-oils in the presence and absence of additives. B) Assignment
of key peaks
108
Chapter 5: Short term studies
5.1 Outline of Microwave Gel Preparation Procedure 116
5.2 N2 Adsorption Isotherm Plot for expanded lignin sample (surface
area 69 m2g
-1)
117
5.3 Ferrocene / acetlyferrocene / diacetlyferrocene separation
A: Column of expanded lignin and GC trace of standards
B: Fraction during separation
C: Fractions collected from column
118
5.4 Continuous processing of biomass for production of high calorific
value products
120
5.5 Pilot scale biomass microwave trials.
A: Rotawave trial microwave
B: Wheat straw pyrolysis oil
C: Wheat straw pellets after microwave treatment
121
5.6 Schematic of Rotawave microwave processor 122
5.7 Fractions of liquid product of microwave treatment of wheat straw 124

Tables and Figures
Chapter 6: Concluding remarks and future work
6.1 Distributed energy production minimising energy used in transport
of biomass
130
6.2 Boundaries of energy calculations 131
Chapter 7: Experimental methods
7.1 Investigation of direct microwave effect 138
7.2 Typical heating profile for preparation of cellulose sample in CEM
discovery (scale < 1 g)
139
7.2 Apparatus set-up for microwave processing on 2 – 6 g scale 140
7.4 Typical thermogram collected for measurement of calorific value 143
7.5 Schematic of experimental set-up 145
7.6 1H NMR of microwave wheat straw bio-oil 149
Appendix 1
1 1H NMR of microwave wheat straw bio-oil 156
2 1H NMR of microwave wheat straw bio-oil in the presence of HCl 157
3 FTIR analysis of bio-oil from microwave treatment of wheat straw
pellets in the presence of additives
158

Tables and Figures

“...the stone age didn’t end because we ran out of stones. The oil age won’t end
because we run out of oil.”
Sheik Ahmed Zaki Yamani Saudi Arabian Minister of petroleum and mineral
resources (1962-1986)

Acknowledgements
Acknowledgments
In the course of my studies I received help from so many people I can never
thank them all by name. My supervisors Professor James Clark and Dr. Fabien
Deswarte were a great source of advice and guidance. James shared with me his
experience and creativity from which I profited greatly. I thank Fabien for his
continued support through the completion of my thesis despite having started a
new career in France, and for being a great friend too.
I doubt I ever would have finished the work described herein without the daily
support of Dr. Vitaly Budarin and Dr. Peter Shuttleworth. We had our
disagreements, but the laughter and team spirit we shared, and your constant flow
of inspiration made my thesis what it is. I also want to thank Dr. Simon Breeden
and Dr. Duncan MacQuarrie for all their help in completing this dissertation. For
all the fun that was had in the lab, I would like to thank all of my colleagues for
helping the days to pass so much faster, in particular, Dr Andrew Hunt and Jo
Parker, for the singing and dancing.
While learning the language associated with biomass and pyrolysis I also picked
up some useful bits of Spanish, Italian and even some Thai. Barby, Piero,
Michèle, Nontipa, Chema, Camino, Lorenzo, Olga, Javi, Marius, Jake and Ali;
you were my family during my time in York. You saw me through the good
times and the bad, and I doubt I could have lasted so long away from Ireland
without you.
I am also grateful to my colleagues at the Royal Society of Chemistry. My
managers were very understanding as I completed my write up and my
colleagues supportive and encouraging to get the task finished.
Finally, my greatest thanks are to my family. Over the last four years my family
has grown both in numbers and in strength. They have always been there for me
without question. My parents have been a constant source of support and
encouragement; giving me everything they could to help me to fulfil my goals, I
will be eternally grateful for this. And finally my little Hannah and Eoin, they
were the inspiration that got me through this thesis.

Declaration
Declaration
Some of the results presented in this thesis were obtained by, or in collaboration with other
workers, who are fully acknowledged in the list below. All other results are the work of the
author.
Brigid A. Lanigan
February 2011
Work Collaborator (based in Green Chemistry
Centre of Excellence, University of York
unless otherwise stated)
Chapter 2
2.4.1: Direct microwave effect Dr. V. Budarin, Dr. P. Shuttleworth
2.4.2: Preparation of conventional char Dr. V. Budarin
2.4.2: Measurement of calorific value (process
development)
Dr. V. Budarin, Dr. P. Shuttleworth
2.4.2: Microwave IR experiment Dr. V. Budarin, Dr. P. Shuttleworth
2.4.5: MDSC Dr. P. Shuttleworth
2.4.6: Crystallinity of cellulose Dr. V. Budarin
2.4.7: Isotope exchange studies Dr. V. Budarin
Chapter 3
3.4.1: XRF Jennie Dodson
Chapter 4
4.2.1 Process development Dr. V. Budarin
4.2.2 & 4.2.5 Preparation of microwave bio-oil Dr. V. Budarin
4.2.4: Preparation of pyrolysis bio-oil Dr. T. Bridgeman, University of Leeds
4.2.4: Acid number measurement Dr. P. Shuttleworth
4.2.4 Water content Dr. V. Budarin

Declaration
Chapter 5
5.3: Pilot scale trials Rotawave Ltd., Sandycroft, Deeside, Clwyd
Dr. V. Budarin, Dr. P. Shuttleworth, Dr. D.
Macquarrie
Solid state 13C MAS NMR was carried out by external services at the University of Durham.
Elemental analysis and GC-MS were carried out through University of York chemistry
department services.

Chapter 1: Introduction

Chapter 1: Introduction
2
1.1 Project Background
Climate change has been defined by the United Nations Framework Convention on
Climate Change (UNFCCC) as: “a change of climate which is attributed directly or
indirectly to human activity that alters the composition of the global atmosphere and
which is in addition to natural climate variability over comparable time periods”.1 There
are several theories as to the causes of climate change, but it is widely accepted that the
major driving force is the increased levels of green house gases, such as CO2 and
methane, being released into the atmosphere. In an attempt to reduce CO2 emissions,
the European Commission published a white paper in 1997 on the use of renewable
energy within the European Union. Targets were set requiring EU member states to
increase the role of renewable resources in total energy production to 12 % by 2010 and
ultimately to 20 % by 2020, with 33 % of electricity production needing to come from
renewable resources.2 As shown in Figure 1.1, it is estimated that the role of biomass in
energy production will need to increase by more than six-fold from the year 2000 level.2
As a result of the envisaged increased role of biomass in energy production, there is
increased interest in methods of improving the efficiency of the conversion of biomass
for energy production.
Fig. 1.1: EU renewable energy production targets2

Chapter 1: Introduction
3
By writing the Climate Change Bill into law in November 2008, the UK became the first
country to set a legally binding framework for significant carbon reductions over a
significant timeline. The Act sets targets to reduce the UK carbon emissions by 80 % in
2050 compared to 1990 levels, with an interim target of between 26 – 32 % by 2020.3
In April 2009 the Committee on Climate Change, along with the Department on Energy
and Climate Change, published carbon budgets which were subsequently passed into
legislation. These set out legally binding targets of a 34 % reduction of carbon
emissions by 2022 (relative to 1990), requiring an annual average emissions reduction
of 1.7 %.4 If these targets are to be reached, biomass will play a major role in the
immediate future and long term as second generation biofuels become more widely
available.
1.2 Project Aims
The core aim and focus of this project is to find novel methods of producing value added
products from biomass, in particular those that can be used for energy production, using
alternative green processing methods.
Summary of objectives:
o Study effects of microwave processing on biomass components in temperature
ranges associated with torrefaction and pyrolysis.
o Produce biomass-derived solid fuel through microwave processing for use in
energy production.
o Produce biomass-derived liquid chemical mixtures through green processing
methods for use in energy production.
o Examine methods of controlling properties of solid and liquid products through
process understanding.

Chapter 1: Introduction
4
1.3 Climate Change5
There are four main gases released by human activity: carbon dioxide, methane, nitrous
oxide and the halocarbons, all of which accumulate in the earth’s atmosphere and
contribute to global warming and climate change. Marked increases in the concentration
of all of these gases have been seen since the start of the industrial revolution when an
economy based on manual labour became dominated by industry and machines. Human
activity contributes in many ways to global climate change, but it is our increase in CO2
emissions which has had the biggest anthropogenic influence on the climate.
The level of CO2 in the atmosphere has increased mainly due to combustion of fossil
fuels, cement production, gas flaring, deforestation and changes in land usage. When
CO2 is released it enters the global atmospheric carbon cycle, being absorbed by
reservoirs such as the ocean and the terrestrial biosphere. In the past this process was in
balance, with the natural reservoirs capable of absorbing most of the CO2 released into
the atmosphere. Between 1990 and 1999 the emissions of CO2 as a result of fossil fuel
burning and cement production increased by 0.7 % per annum, however the rate of
increase has jumped from this level to about 3 % per annum between 1999 and 2005, a
much higher level of emissions than had previously been expected.5
Fossil fuel combustion is responsible for the majority of CO2 emissions caused by
mankind. Electricity generation is the largest emitter of CO2, accounting for
approximately 41 % of all CO2 emissions in the US in 2006, followed by the transport
sector at 33 %.6, 7
Similarly, in the UK, energy and transport are the sectors responsible
for the largest portions of CO2 emissions (Figure 1.2). Overall, emissions have fallen by
19.25 % since 1990 due to significant savings in waste management, industrial
processing and energy sectors. Transport emissions have in fact increased over this
period. Regardless of the reduction, energy production is still the largest contributor (35
% of total) and therefore a top priority along with transport when looking to cut
emissions.8 As a result, there is a significant drive in research and initiatives for the use

Chapter 1: Introduction
5
of renewable and sustainable fuels to facilitate the development of society while
minimising the impact on the environment.
Figure 1.2: UK greenhouse gas emissions by sector 1990 % 2008 (MtCO2e)8
1.4 Sustainable Development and Green Chemistry
The concept of sustainable development is something which goes hand in hand with
Green Chemistry. In 1987 sustainable development was defined by a United Nations
Commission on Environment as “...meeting the needs of the present without
compromising the ability of future generations to meet their own needs”.9
In order to achieve sustainable development mankind needs to move away from
petrochemical feedstocks to renewable alternatives. One potential pathway to the
production of alternative renewable products is the use of agricultural, forestry and
municipal waste materials.10
The move away from our reliance on petrochemical feedstocks to a more sustainable
society will result in a significant reduction in our impact on the environment. The
change to renewable feedstocks and materials will come with a number of challenges,
requiring a change, not only in the production methods, but also in the mindset of

Chapter 1: Introduction
6
industry and the public alike, however the potential associated benefits should speed the
transition (Table 1.1).
Table 1.1: Potential benefits and challenges associated with renewable feedstocks11
Benefits Challenges
Low environmental impact Natural variability
New opportunities Cost
New functionalities Complexity
Geographically diffuse Competition for food production
Renewable Unknown technology
The aims of this project are closely tied in with the concepts of renewable materials and
sustainability, but the key issue is to ensure that the production of these materials is
carried out using “green” methods and technology.
In 1996, IUPAC defined Green Chemistry as “the invention, design and application of
chemical products and processes to reduce or to eliminate the use and generation of
hazardous substances”.12
By assessing and taking into account the entire lifecycle of
products their environmental impact from “cradle to grave” can be minimised. The aims
of green chemistry are summarised by the “Twelve Principles of Green Chemistry” as
set out by Anastas and Warner (Table 1.2).13
Table 1.2: The Twelve Principles of Green Chemistry13
1. It is better to prevent waste than to treat or clean up waste after it is formed.
2. Synthetic methods should be designed to maximize the incorporation of all
materials used in the process into the final product.
3. Wherever practicable, synthetic methodologies should be designed to use and
generate substances that possess little or no toxicity to human health and the
environment.
4. Chemical products should be designed to preserve efficacy of function while
reducing toxicity.
5. The use of auxiliary substances should be made unnecessary wherever possible,
and innocuous when used.
Chapter 1: Introduction
7
6. Energy requirements should be recognised for their environmental and economic
impacts, and should be minimised. Synthetic methods should be conducted at
ambient temperature and pressure.
7. A raw material or feedstock should be renewable rather than depleting wherever
technically and economically practicable.
8. Unnecessary derivatisation should be avoided whenever possible.
9. Catalytic reagents are superior to stoichiometric reagents.
10. Chemical products should be designed so that at the end of their function they do
not persist in the environment and break down into innocuous degradation
products.
11. Analytical methodologies need to be further developed to allow for real-time, in-
process monitoring and control prior to the formation of hazardous substances.
12. Substances and the form of a substance used in a chemical process should be
chosen so as to minimise the potential for chemical accidents.
The production of fuel from renewable feedstocks relieves pressure being put on
depleting fossil fuel reserves. Using agricultural and forestry waste opens a new stream
of income for rural economies and enables avoidance of green house gas emissions
associated with their decay, making them ideal alternatives to current feedstocks.
1.5 Biorefinery Concept
In recent years, concerns have been rising in relation to our reliance on foreign fuel
supplies and the impact they are having on the environment. The concept of the
biorefinery has been put forward as a method of removing this dependency by not only
producing our own fuels from renewable feedstocks, but also chemicals and materials
through various conversion processes.
A biorefinery can be defined as “a facility that integrates conversion processes and
equipment to produce fuels, power, and chemicals from biomass”14
(Figure 1.3). It can
be seen as being analogous to the current day petroleum refinery in that it produces a
number of different fuels, commodity chemicals and platform molecules from the raw
material. In the case of a biorefinery, this starting material is some form of biomass,

Chapter 1: Introduction
8
which consists of carbohydrates, lignin, fats, proteins and various other chemicals
present at low levels.
Fig. 1.3 : Illustration of biorefinery concept14
The output of a biorefinery can be placed in two categories; high-volume products, such
as fuels, and low-volume chemicals, such as succinic acid, sorbitol and glycerol which
can be used as platform molecules in the polymer and pharmaceutical industries.15, 16
1.6 Biomass composition
The potential products which can be derived from biomass depend on its chemical
composition. Edible biomass contains starch as an energy store; the majority of first
generation biofuels have focussed on the conversion of the starch into liquid, e.g.
bioethanol. Second generation biofuels use non-food lignocellulosic biomass. It is made
up of polysaccharides (cellulose and hemicelluloses) and lignin which compose the cell
walls. Cell wall components are distinguished from extraneous (low molecular weight)
components such as extractives and inorganic components which are not seen as an
essential structural part of material (Figure 1.4).17
Fig. 1.4: Outline of components of lignocellulosic biomass17, 18

Chapter 1: Introduction
9
The role of each cell wall component can be represented by the simple analogy of
reinforced concrete. Cellulose is like the iron, giving the structure strength, lignin is the
concrete itself giving rigidity to the secondary cell wall structure, and the hemicellulose
is the binding agent, promoting interaction between the other two.19
Cellulose is a polymer containing long linear chains of 1,4-D-glucopyranose units,
connected by ß 1-4 linkages. Hemicelluloses are complex branched polysaccharides
containing a mixture of xylose, glucose, mannose, arbinose, methylglucuronic and
galacturonic acids as structural units (reviewed in 20, 21
). The relative abundance of the
structural units varies depending on the biomass species. For example hemicellulose
found in hardwood trees is predominately xylan with some glucomannan based while in
softwoods it contain a small amount of xylan, being mainly rich in
galactoglucomannan.18
The average molecular weight is lower than that of cellulose
at <30,000 as opposed to 100,000 average molecular weight reported for cellulose.21
Lignin is defined as “an amorphous, polyphenolic material arising from an enzyme-
mediated polymerisation of three phenylpropanoid monomers”.22
The resulting polymer
is highly resistant to degradation23
and is often cited as nature’s most abundant source of
aromatics. The three monomeric precursors of lignin are usually defined as (a) p-
coumaryl alcohol, (b) coniferyl alcohol, and (c) sinapyl alcohol which are linked by
carbon–carbon and ether bonds. The ratio of these units is also different depending on
the tree species, even varying in different parts of the same tree. In softwood lignin,
coniferyl alcohol is the major precursor (up to 95 % abundant) while p-coumaryl alcohol
is a minor constituent, with sinapyl alcohol present only in trace amounts.24
Hardwood
lignins are composed of coniferyl alcohol and sinapyl alcohol in different ratios.22
The
structures of cellulose, hemicellulose and lignin are shown in Figure 1.5.

Chapter 1: Introduction
10
Fig 1.5: Proposed structure of hemicellulose, cellulose and lignin18, 22

Chapter 1: Introduction
11
Table 1.3 shows the relative abundance of each of these components in a selection of
lignocellulosic materials.
Table 1.3: Typical Chemical Composition of Selected Lignocellulosic Species 24-26
Species Common
Name
Cell wall components Extraneous
components Cellulose Hemicellulose Lignin
Chestnut Oak 41 30 22 7
White Ash 49 22 23 5
Sycamore 43 27 25 4
White Spruce 40 31 28 2
Scots Pine 40 29 28 4
Corncob 51 31 15 4
Note: all values shown as percent oven dry mass.
1.7 Biomass for Energy Production
Conventional energy production relies on the combustion of fossil fuels, resulting in the
release of carbon which has been stored in the earth for several millennia. The release
of CO2 from energy production processes is contributing to the heating of the planet’s
atmosphere and hence climate change. The replacement of fossil fuels with biomass
results in a reduction of the net CO2 released during energy production. Indeed the CO2
released during combustion of biomass is equivalent to that captured through
photosynthesis during growth, as illustrated in Figure 1.6. As a result, the use of
biomass for energy production is generally accepted as being carbon neutral under these
terms. The energy used in growing, harvesting and transporting biomass and the
associated emissions must be acknowledged when assigning the carbon neutral status.
This must be done using renewable fuels in order minimise the related emissions.

Chapter 1: Introduction
12
Fig. 1.6: Carbon cycle
While biomass has been used as a solid fuel for millennia, the potential for further use in
energy production is significant. Biofuels can be defined as solid, liquid, or gaseous
fuels derived from organic matter. They are already used to produce electricity, heat
homes, as transport fuels and to heat industrial processes. Ethanol derived from biomass
is an established fuel in Brazil where it is produced on a large scale from sugar cane. In
the US and some European countries, industrial scale production of bioethanol has been
established using starch starting materials.27
The implementation of bioenergy has been found to have a positive socio-economic
impact. In developing countries, bioenergy is already the major energy source for
people at the subsistence level, bringing important income to vulnerable economies,
although poor practices may make this environmentally unsustainable. Amongst
developed countries, especially in the European Union, the image of bioenergy is swiftly
changing away from what used to be a ‘poor man’s fuel’. Studies have found modern
biomass-use systems can result in a better quality of life, through increased rural
employment and development, improved health through better wood stove design and
lower sulfur dioxide emissions due to reduced coal burning in power plants. On a
national scale, the increased employment leads to economic growth along with the
energy independence offered by bioenergy production.28
The rapid development of large
scale bioenergy production has become a victim of its own success as the “fuel versus

Chapter 1: Introduction
13
food” debate has grown. Brazilian ethanol is not seen as impacting on food supplies or
prices as sugar cane production has risen to meet demands, although the associated
changes in land usage impact negatively on the fuel’s “green credentials”. In the US
concerns have been growing as the lucrative corn for ethanol prices resulted in much of
the corn supply being diverted away from food and feed uses. In the EU biodiesel (the
major liquid bio-fuel) is often produced from rapeseed oil, again raising issues with
regard to diverting oils and fats from food production.29
Concerns have also been raised
with regard to the use of fertile agricultural land for the growth of fuels rather than food.
These resource intensive crops have been selected for fuel production as a result of the
ease of conversion of the starch and sugars into fuels. The global transition to biofuels
cannot succeed without capitalising on the potential of lignocellulosic biomass.20
The
US Department of Energy has reported the potential to produce 1.3 billion tonnes of
lignocellulosic biomass each year without interfering with current agriculture; this
would be equivalent to 270 billion litres of ethanol, 30 % of their transport fuel
requirements.30 In addition, the move to lignocellulosic biomass will result in
production of energy from agricultural, forestry and municipal waste, which may
otherwise be sent to landfill, and increased activity in the agricultural and forestry
sectors which have been in decline in recent years.
1.7.1 Biomass for liquid fuel
Transport systems throughout the developed world rely on the internal combustion
engine driven by volatile liquid fuels, 98 % of which are currently derived from fossil
fuels. In industrialised countries, transportation accounts for approximately 30 % of
CO2 emissions. As a result, there is renewed interest in the field of liquid biofuel
production (Figure 1.7).31
Figure 1.7: Production of liquid fuels from biomass

Chapter 1: Introduction
14
Biodiesel and bioethanol are leading the way in terms of alternative transport fuels. Use
of biofuels in the EU has increased exponentially over the last ten years. Bioethanol use
has increased 18 fold, while biodiesel use has increased by 13 times to over 3,500 ktoe
(kilo tonnes of oil equivalent) in 2006.32
Bio-oil from thermal treatment of biomass is one of the lower profile liquid biofuels. It
can be used for the production of chemicals as well as being a possible fuel. So far bio-
oils have successfully been tested in stationary engines and boilers, and have been
shown to be suitable for upgrading into high-quality hydrocarbon fuels.33
Until now the
energy and financial demands associated with pyrolysis and purification of bio-oil have
prevented bio-oils from becoming a competitive fuel source. Throughout this project
alternative thermal processing techniques have been studied in order to overcome this
obstacle to progress.
1.7.2 Biomass for solid fuel
Biomass is used without thermochemical pre-processing in 97 % of current bio-energy
production worldwide.34
It can be used directly in dedicated boilers or co-fired with
coal in existing power plants. Mixing biomass with coal reduces fossil-based carbon
emissions as the amount of coal burnt per unit energy is reduced, and also avoids the
methane or carbon dioxide produced during biomass decay. In terms of fuel properties,
biomass contains highly volatile components resulting in a highly reactive fuel.
Nonetheless, issues arise due to the high oxygen and moisture content which result in a
lower heating value. This, along with often high chlorine and inorganic content, has led
to problems with uptake of this technology.35
However, the suitability of biomass as a
fuel can be increased through pre-treatments such as torrefaction and slow pyrolysis to
produce a fuel or char with lower water content than the untreated material. All in all,
the production of a high quality fuel requires a high energy input. As a result this
project has attempted to couple the production of a quality char with oil production in a
low energy process, the aim being to maximise the benefit of the energy use by
generating two fuel products.

Chapter 1: Introduction
15
1.8 Biomass upgrading for energy production
In 2007 only 1.5 % of UK energy was produced from biomass and waste residues
(Figure 1.8A).36
Direct use accounted for a small proportion of this (Figure 1.8B).
Fig. 1.8: A) Energy generation from renewable sources (2005-2007) B) Contribution of
various types of biomass to production of energy (electricity, heat and transport).
(Note: “Animal biomass” includes farm waste, poultry litter, and meat and bone combustion. “Plant
biomass” includes straw and energy crops)36
With the increasing demand for biomass use in energy production, research is being
invested in pre-combustion biomass treatment methods to produce fuels to be burnt in
engines and power generation facilities. The current main biomass conversion
technologies are: 34, 35
o Destructive carbonisation of woody biomass to charcoal
o Thermal conversion of biomass and waste (e.g., gasification, pyrolysis,
torrefaction)
0
0.2
0.4
0.6
0.8
1
1.2
1.4
1.6
1.8
2
% of UK energy generation
2005 2006 2007
derived from renewable sources
derived from biomass
Landfill gas
Sewage sludge digestion
Municipal solid waste combustion
Wood combustion
Co-firing with fossil fuels
Animal Biomass
Plant Biomass
Bioethanol
Biodiesel
A B

Chapter 1: Introduction
16
o Generation of electricity by direct combustion or gasification and pyrolysis
(including co-firing with coal)
o Biological treatment of biomass and waste (e.g., fermentation, anaerobic
digestion)
o Biomass densification (e.g., peletisation, production of briquettes, torrefaction)
o Conversion of biomass to a pyrolytic oil for transport fuel
o Chemical conversion of biomass (e.g., biodiesel)
Chemical pre-treatment methods for biomass are generally divided into two categories
biochemical and thermochemical processes.
Biochemical processing involves the conversion of biomass to fermentable sugars for
the production of specific alcohols, such as ethanol and butanol. The process can be
carried out on small scales allowing localised processing and energy production. On the
other hand, the conversion tends to be slow, requiring a batch-wise manufacturing
process, and can only be used to convert polysaccharide components of biomass.
Thermochemical processing produces a range of products through the thermal decay and
chemical reformation of biomass. Transformations are carried out under differing
concentrations of oxygen, varying from the extremes of direct combustion in air through
gasification in low air levels, to pyrolysis in the absence of oxygen. This route suffers
from high capital and operational costs due to the high temperatures involved. In order
to benefit from economies of scale, these processes must operate on a large regional
basis requiring transport of feedstocks over long distances. Nonetheless,
thermochemical processing holds a clear benefit over biochemical as it can essentially
convert all the organic components of the biomass, fully capitalizing on its fuel and
chemical potential.31, 37, 38
It is therefore clear that what is needed in order to best use
biomass for energy production is a low temperature continuous process which can
maximise the conversion of the fuel and chemical potential of biomass into useful
products.

Chapter 1: Introduction
17
1.8.1 Thermochemical upgrading of biomass for energy production
Each of the three main thermal processes (gasification, pyrolysis and torrefaction)
converts the biomass to a preferred form which may then be used for energy production.
Figure 1.9 gives an overview of the applications of the products of thermal treatment
and decomposition of biomass.
Fig. 1.9: Products of thermochemical treatment of biomass.39
The use of biomass as a feedstock for energy conversion depends greatly on physical
properties and the nature of its chemical constituents. It is therefore important to
understand the thermal behaviour of the major components of biomass when
considering thermal upgrading treatments.
1. Hemicellulose is the first component to degrade. The first hemicellulose
decomposition step usually occurs below 250 oC, when a series of
depolymerisation reactions results in rearrangement of the glycosidic ring
structure.. These oligosaccharides and monosaccharides then decompose around
300 oC to produce a char, CO, CO2 and water as the main products.
2. Thermal degradation of lignin occurs over a wide temperature range with some
softening occurring below 200 oC, while char formation and volatilisation of
Chapter 1: Introduction
18
components can begin at 240 oC, temperatures as high as 600
oC are necessary
for complete thermal decomposition.40
3. The thermal degradation of cellulose requires the highest initiation temperature,
close to 300 oC, and is complete by 500
oC. Several different pathways have
been suggested for the decomposition process, as cellulose undergoes several
different dehydration, elimination, condensation and fragmentation reactions
resulting in the formation of a mixture of gases, a complex liquid portion and a
solid char residue.41,42
1.8.2 Gasification of biomass
Gasification is the conversion of solid biomass fuels into flammable gas mixtures, so-
called syngas, rich in CO, CO2, CH4 and H2 which can then be transformed into
chemicals and fuels (Equations 1-3) or used to heat industrial processes.
Equation 1: Fischer Tropsch transformation (2n+1)H2 + nCO → CnH(2n+2) + nH2O
Equation 2: Water gas shit reaction H2O + CO → H2 + CO2
Equation 3: Steam reforming H2O + CH4 → CO + 3H2
Under conventional heating conditions gasification is carried out between 750 – 1800
oC. The process is carried out by partial oxidation in air or by steam gasification.
Using oxygen as the oxidation medium results in gases of a medium heating value (~10
– 12 MJ m-3) which are significantly better than the results associated with oxidation in
air (~5 MJ m-3
). Steam gasification is a two step process with similar products but an
improved medium heating value of ~15 – 20 MJ m-3
. After production of the primary
gas, char residues are burnt in a second reactor to provide heat for the next gasification,
maximising the overall energy efficiency of the system. Steam gasification results in
higher levels of CH4 and hydrocarbons within the gas stream which increase the heating
value. The use of the gas, and the potential production of value-added products depends
on the levels of the various components within the stream which in turn determines the
heating value of the gas.38
Figure 1.10 shows the various potential applications of
medium and lower heating value gases.

Chapter 1: Introduction
19
Fig. 1.10: Application of products of biomass gasification38
One of the most successful biomass gasifiers currently in operation is located in
Güssing, Austria. The facility outputs 2 MW of electrical power along with 4.5 MW of
heat, providing sufficient energy for its municipal region, supplying electricity and heat
for the district heating grid. All of the biomass used (generally woodchips) is sourced
within five kilometres of the facility reducing the environmental impact of any feedstock
transport.43
1.8.3 Pyrolysis of biomass for liquid biofuel production
Pyrolysis results in the production of oil (up to 70 %), solid char and gas, by the thermal
decomposition of organic compounds in the absence of oxygen above 400 oC.
44 The
pyrolysis of biomass is a versatile process; the relative yields of the products can be
controlled through variation of system parameters such as heating rate, maximum
temperature and residence time.45 Fast pyrolysis usually heats the biomass to the
relatively moderate temperature of 500 oC at rates in the order of 10
3 oCs
-1. The short
residence time (~1 s) favours the production of a liquid portion (~75 %) over gas (~13
%) and char (~12 %). Increasing the residence time to 10 – 20 s results in a significant
change in the product distribution, (~50 % liquid, ~30 % gas and ~20 % char).38

Chapter 1: Introduction
20
In this case, the charcoal and gas are treated as by-products, with the major focus on use
of the liquid fraction as outlined in Figure 1.11.
Fig. 1.11: Application of products of biomass pyrolysis38
The liquid fraction, known as bio-oil, is a dark brown liquid
the composition of which varies greatly depending on the
biomass feedstock (Figure 1.12). Bio-oil contains a complex
mixture of oxygenated organic components, formed as a
result of degradation of holocellulose and lignin within the
biomass, along with a significant amount of water. The oil
forms a type of aqueous microemulsion containing many
reactive species, present due to the rapid quenching of the
system during fast pyrolysis. Fast pyrolysis bio-oil has a
higher heating value of 16 – 17 kJ g-1
, based on a water content of ~25 % wt. The liquid
contains several hundred chemicals in varying proportions including formaldehyde,
acetic acid, high molecular weight phenols, oligosaccharides and anhydrosugars. The
quantity of water present varies depending on the feedstock and preparation conditions
from ~ 15 – 50 % wt.38
Over 300 chemical compounds have been identified as bio-oil
components derived from the breakdown of hemicellulose, cellulose and lignin. In spite
of extensive effort, it is thought that only 40 – 50 % of bio-oil has been fully structurally
characterised. The structures present vary greatly depending on factors such as the
Fig. 1.12: Bio-oil

Chapter 1: Introduction
21
heating rate, rate of heat transfer through the sample and the nature of the biomass
itself.18
Bio-oils are not miscible with standard hydrocarbon fuels. As a result they require
special systems for utilisation. The simplest application for bio-oil is in stationary fuel
burners such as boilers, furnaces and turbines for electricity production but its high
viscosity, poor storage stability and corrosiveness stand in the way of the large scale
uptake.38
As a result much research has been carried out into processes which will make
it more suitable for the desired application. The main upgrading routes include
hydrogenation, esterification, hydrodeoxygenation, catalytic cracking of the pyrolysis
vapours, steam reforming and the physical emulsification of bio-oil with diesel, the
majority of which require complicated expensive procedures and rely on the use of
catalysts which are subject to fouling during processing.46-48
The only current
commercial use of bio-oil is as a liquid smoke for the flavouring of meat and fish
products. Fast pyrolysis is still a relatively new technology with few commercial
examples although much research worldwide is focused on getting the technology to the
stage when this will be possible.18
1.8.4 Torrefaction of biomass
Of all sources of CO2, the burning of fossil fuels for electricity production is responsible
for the greatest proportion of emissions; therefore the replacement of fossil fuels in
power production facilities is vital for the reduction of our impact on global warming.
Potential biomass fuels include short rotation woody crops (such as willow and
miscanthus), wood, agricultural waste, industrial residues, forestry waste, waste paper
and municipal waste (Figure 1.13).
Fig 1.13: Diverse range of biomass available

Chapter 1: Introduction
22
The use of biomass in energy production faces challenges due its low calorific value
when compared to oil or coal. While biomass is a cleaner fuel than coal, generally with
lower sulfur content, the corrosive properties of biomass ash and the formation of tar
during combustion can result in damage of burners and fouling of downstream
systems.49 The tar is produced as a by-product during the gasification of biomass; it
condenses as the vapour temperature reduces on leaving the gasification chamber. The
condensed tar can lead to blocking, fouling in duct, valve, and engine.50
The inherent
high moisture content and highly oxygenated nature of biomass means that the
efficiency of energy production is not optimised when used for direct combustion.
Biomass also raises material handling issues and is energy inefficient to transport in its
raw state due to the low energy density, and high water content.34, 49
Torrefaction is carried out at lower temperatures than other thermochemical processes,
usually between 200 – 300 oC under atmospheric conditions or in the absence of air. It
essentially corresponds to high temperature drying which results in a higher energy
density product due to the removal of low calorific value volatile components. The
resulting solid is then easier to handle and store due to the reduced water content and the
reduced risk of self heating due to the volatile content.40
The term torrefaction comes
from the process of roasting coffee beans to make them easier to grind. The main
product of torrefaction is a solid char residue. Volatile products are also evolved during
the thermal treatment process including carbon dioxide, carbon monoxide, water, acetic
acid and methanol, some of which condense to produce a yellowish liquid. The liquid
and gas phase contain relatively more oxygen compared to the original biomass, while
the char is typically characterised by lowered oxygen to carbon ratios resulting in the
increased calorific value. The product can be used as a direct combustion fuel in power
production or as a feed for gasification or pyrolysis.51

Chapter 1: Introduction
23
1.9 Microwave Chemistry
Since the late 1980s interest has been growing in the field of microwave-assisted
chemistry. Microwave irradiation lies between radio and infrared in the electromagnetic
spectrum in the frequency range of 0.3 to 300 GHz (Figure 1.14). Similar to domestic
microwaves, specialised chemistry microwave reactors operate at 2.45 GHz. The
advantage microwave chemistry offers is in the increased efficiency of heating the
material by “microwave dielectric heating effects”, which are dependent on the ability
of a material (solvent or reagent) to absorb the microwave energy and convert it into
heat.52,53
Fig. 1.14: Electromagnetic spectrum
There are two main mechanisms through which interaction occurs: dipolar polarisation
and ionic conduction. When polar molecules are exposed to a strong electric field, the
displaced positive and negative charges will orientate opposite to the direction of the
electric field. Heat is then dissipated as the distortions within the molecule relax to their
original orientation. The ability to convert electromagnetic energy into heat under given
microwave conditions is strongly dependent on the “loss factor”, expressed as tan δ.
This value is calculated as tan δ = ε’’/ ε’, where ε’’ is the dielectric loss, a measure of
the efficiency of conversion of electromagnetic energy to heat, and ε’ the dielectric
constant, which represents the molecule’s ability to be “polarized by the electric field”.
Table 1.4 shows the tan δ values of a variety of solvents, a high tan δ value is therefore
required for efficient absorption of the microwave energy and hence a greater rate of
heating. Microwave energy can also cause a heating effect through ionic conduction.

Chapter 1: Introduction
24
This process can occur when free ions are present in the substance; the electric field
caused by the microwave energy generates ionic motion causing rapid heating. 52
Table 1.4: tan δ values of selected solvents at 25 oC
Solvent tan δ value
Ethanol 0.941
Methanol 0.659
Water 0.123
Hexane 0.02
A microwave photon at this frequency is of too low energy to break chemical bonds
therefore microwaves should not be able to induce the chemical reactions that occur.
Increased rates and altered reaction pathways under microwave conditions have led to
theories of an additional microwave influence. Much discussion has surrounded these
so called “non-thermal” and “specific” microwave effects. Specific microwave effects
(such as selective heating of microwave absorbing reagents, formation of hotspots and
uniform heating of the sample) are generally agreed to be due to the accelerated rate of
heating which causes results that cannot be duplicated or achieved under conventional
conditions. Non-thermal effects are classed as accelerations which cannot be accounted
for by kinetics or specific microwave effects and are subject to widespread discussion
and controversy. Much more research is required to understand these phenomena.52, 54
Microwave chemistry offers many advantages over conventional methods of heating.
Overall the process is more energy efficient as microwave irradiation heats the whole
volume of a sample while conventional heating heats the sample in contact with the
reaction vessel before the bulk. Unlike conventional heating methods, the heating effect
is almost instantaneous, there is no time spent waiting for the source to heat up or cool
down. Microwave reactor operating systems allow easy control of pressure and
temperature to exact and steady values. The speed of microwave systems also allows for
quick screening of parameters and testing of new methods.52
The application of

Chapter 1: Introduction
25
microwave technology in high throughput reactions such as flow reactors55, 56
adds
further to the advantages of microwave irradiation.
Figure 1.15 compares the heating of biomass by microwave and conventional methods.
Conventional heating conducts the heat from the walls of the chamber through to the
centre of the sample, resulting in the core of the sample being cooler than the walls and
the surrounding gas above the sample. Microwave energy heats the entire sample, with
head space above remaining much cooler. As a result of the heating of the entire
sample, liquid fractions which are evolved during the process escape the bulk and
condense in the cool walls and space above, preventing secondary reactions and
alterations to the volatile components which could occur in a heated environment.
Fig. 1.15: Comparison of microwave irradiation (left) and conventional heating (right)52
1.9.1 Microwave treatment of biomass
The use of microwaves for treatment of biomass dates back to the early 1970s.
Examples of substrates employed in this type of slow pyrolysis are numerous and
include plant biomass such as wood or agricultural residues, plastics and municipal
waste.45, 57
The microwave treatment of cellulose and wood has been optimised for the
production of chemicals such as levoglucosan and levoglucosenone, both important
chiral precursors in the synthesis of natural products.58
Factors such as starting material
particle size, microwave power, irradiation time and source of biomass are all
considered to have an effect on the efficiency of microwave interactions.58-60

Chapter 1: Introduction
26
The specific effect of microwave energy on biomass has also been studied. The
microwave heating of materials is dependent on polarisability and dielectric loss factor.
For macromolecules, such as biomass components, the polarisation is considered to
occur in only small portions of the molecule as segments of the structure are not
responsive to microwave radiation. For high polymers, the areas which are polarisable
are further restricted by the rigidity of structures in the crystalline regions. As a result,
only amorphous regions can align to the applied electric field. Polymers, such as those
present in biomass, generally have a wide distribution of relaxation times (time taken to
revert to original orientation after polarisation), resulting in a smaller dielectric loss but
over a wide range of frequencies. In the case of cellulose the dielectric constant within
the microwave range gives an intermediate microwave heating value (tan δ ~ 0.2
depending on source). The susceptibility of a material to uniform microwave heating
may be completely independent of the thermal conductivity of the material, and is more
strongly influenced by the depth of penetration of the microwave into the material. For
cellulose at 2450 MHz, the depth is 2.4 m, therefore there is potential for fast processing
of cellulose in bulky samples.61
By comparison with cellulose, there is less literature to date relating to the behaviour of
lignin and hemicellulose under microwave conditions. It is known that the behaviour of
lignin is quite different to that of cellulose, as lignin possesses fewer groups which are
easily polarised, and a wider distribution of bond strengths.62
1.9.1.1 Microwave gasification of biomass
The calorific value of microwave gasification products of biomass have been
investigated for processes above 500 oC.
45, 57, 63 Microwave energy was used to gasify
sewage sludge up to a final reaction temperature of 1040 °C, with the aim to optimise
the fuel properties of the gas produced. The sludge was heated to 135 oC to remove
moisture, then rapidly heated to 1040 °C, at 5 °Cs-1
, where it was held for a residence
time of 10 min. It was found that microwave gasification produces more gas and less oil
than conventional thermal processes carried out under similar temperature conditions.
Additionally, the amount of hydrogen in the gas mixture was much higher adding to the

Chapter 1: Introduction
27
value of the gas produced. The calorific values of the collected fractions were up to 7,
37 and 10 kJ/g for char, oil and gas, respectively, while the typical heating values of
commercial fossil fuels are 32, 42 and 40 kJ/g for coal, oil and gas. While the heating
values for the oil do not compare favourably with that for coal, the yield was relatively
small, meaning that the greatest percentage of energy was accumulated in the char and
gas fractions optimising the energetic yield of the products.
1.9.1.2 Microwave pyrolysis of biomass for liquefaction
Microwave biomass pyrolysis for the production of a liquid fuel has been investigated
between temperatures of 260-600°C, with most results reporting the need for
temperatures above 350 oC. Using a maximum heating rate of 3.33
oCs
-1 under
microwave conditions and 6.67 oCs-1 in a furnace, the samples were held for 15 minutes
at the reaction temperature. Under these optimised conditions it was found that 50 % of
the biomass energy can be condensed into liquid products, 20 % in the char and the
remaining 30 % in the gas phase. Analysis of the pyrolysis oil in terms of water content,
density, pH, viscosity, elemental analysis and calorific value (CV) were reported to be
similar to bio-oils produced by traditional fast pyrolysis.64-66
1.9.1.3 Microwave pyrolysis of biomass for char production
Microwave-induced pyrolysis has also been investigated previously, focussing on the
production of char at lower temperatures than above. Slow pyrolysis of rice straw was
investigated using temperatures between 266 and 563 oC. While the calorific value of
the rice straw solid residue was no more than 20 kJ/g, and no better than those
achievable by thermal methods in this temperature range, the principle of char
production through low temperature microwave treatment was shown to be possible. As
a result of the poor calorific value of the chars, Huang et al. investigated alternative
applications for the solid, e.g. as absorbent, reporting surface areas of up to 270 m2g
-1.67

Chapter 1: Introduction
28
1.9.2 Industrial application of microwave processes
Microwave treatment of biomass can be used before and/or during extraction processes
to improve yields of secondary metabolites and aroma chemicals. The microwave acts
by heating water in the core of the material, and the resulting steam can then act to
induce opening of outer layers of the material.68
Microwave heating has found
industrial scale applications in a number of diverse areas. It is used to remove low
levels of moisture from soybeans before further processing, forcing unwanted hulls to be
released from the beans in a much more uniform product than conventional processing
methods. Other food processing applications include meat thawing and tempering,
dough treatment and pasta drying. The use of microwaves is also growing in the
processing of materials. Microwave treatment is used by the Goodyear tyre company
for rubber devulcanisation. The devulcanised rubber produced can then substitute up to
25 % new rubber, as opposed to only 5 % for rubber devulcanised by other methods.69
Microwave processing is also used for “the production of advanced ceramics, the
deposition of thermal barrier coatings, and the remediation of hazardous wastes” with
new applications constantly being researched.70
1.10 Introduction to work in this thesis
There is reasonable literature outlining both the thermal treatment of biomass and
microwave technology. However the potential application of microwaves in the thermal
upgrading of biomass has yet to be fully explored. In particular, low temperature (100 –
300 oC) microwave processing has received little attention. Therefore, there is extensive
scope to investigate and optimise this process, and to investigate the mechanisms of the
action. The work in this thesis is split into four areas:
Chapter 2 looks into the effect of microwave irradiation on the individual components of
biomass. The study focussed on cellulose, the most abundant biomass component on
earth. Thermal and spectroscopic investigations were used to study the mechanism of

Chapter 1: Introduction
29
degradation and product formation. Hemicellulose and lignin were also studied in terms
of char formation to gain a better understanding of the mechanism of char production.
In Chapter 3, the knowledge gained in the investigation of the components of biomass
was applied to whole biomass for the production of char. Three biomass types were
selected, namely miscanthus (energy crop), wheat straw (agricultural residue) and cocoa
husk (food industry waste).
Pyrolysis oils generated through microwave irradiation of wheat straw under various
conditions are discussed in Chapter 4. The oils produced were characterised and
compared to conventional fast pyrolysis oils, and microwave pyrolysis oils reported in
literature.
Finally, the industrial applicability of this technology is discussed in chapter 5. Results
from pilot-scale trials and energy calculations are used to access its suitability for use in
large scale applications.

Chapter 1: Introduction
30
1.11 References
1. IPIECA, Climate Change: A Glossary of Terms International Petroleum Industry
Environmental Conservation Association, 2001.
2. European Commission, 1997.
3. U.K. Parliament, The Stationery Office, London, 2008.
4. CCC, Meeting Carbon Budgets - the need for a step change, October 2009.
5. P. Forster, V. Ramaswamy, P. Artaxo, T. Berntsen, R. Betts, D. W. Fahey, J.
Haywood, J. Lean, D. C. Lowe, G. Myhre, J. Nganga, R. Prinn, G. Raga, M.
Schulz and R. Van Dorland, in Climate Change 2007: The Physical Science
Basis. Contribution of Working Group I to the Fourth Assessment Report of the
Intergovernmental Panel on Climate Change, eds. S. Solomon, D. Qin, M.
Manning, Z. Chen, M. Marquis, K. B. Averyt, M. Tignor and H. L. Miller,
Cambridge University Press, New York, 2007.
6. K. L. Denman, G. Brasseur, A. Chidthaisong, P. Ciais, P. M. Cox, R. E.
Dickinson, D. Hauglustaine, C. Heinze, E. Holland, D. Jacob, U. Lohmann, S.
Ramachandran, P. L. da Silva Dias, S. C. Wofsy and X. Zhang, in Climate
Change 2007: The Physical Science Basis. Contribution of Working Group I to
the Fourth Assessment Report of the Intergovernmental Panel on Climate
Change, eds. S. Solomon, D. Qin, M. Manning, Z. Chen, M. Marquis, K. B.
Averyt, M. Tignor and H. L. Miller, Cambridge University Press, New York,
2007, pp. 500-587.
7. U.S. Environmental Protection Agency, Inventory of the U.S. Greenhouse gas
emissions and sinks: 1990 - 2006, U.S. Environmental Protection Agency, 2008.
8. Department of Energy & Climate Change, UK climate change sustainable
development indicator: 2008 greenhouse gas emissions, final figures, 2010.
9. M. Lancaster, Green Chemistry : An Introductory Text Cambridge : Royal
Society of Chemistry, 2002.
10. J. H. Clark and D. J. Macquarrie, Handbook of Green Chemistry and
Technology, Blackwell Sciences Ltd, Oxford, 2002.
11. I. Bartle and N. Oliver, Green Chemistry, 1999, 6-9.
12. P. Anastas and P. Tundo, Green Chemistry: Challenging Perspectives, Oxford
University Press, 2000.
13. P. Anastas and J. Warner, Green Chemistry: Theory and Practice, Oxford
University Press, 1998.
14. National Renewable Energy Laboratory (US), Conceptual biorefinery:
http://www.nrel.gov/biomass/biorefinery.html, Last accessed: Aug 2007.
15. S. Fernando, S. Adhikari, C. Chandrapal and N. Murali, Energy & Fuels 2006,
20 1727-1737.
16. T. Werpy and G. Petersen, U.S. Department of Energy, 2004.
17. B. L. Browning, The Chemistry of Wood, Interscience Publishers, 1963.
18. D. Mohan, C. U. Pittman and P. H. Steele, Energy & Fuels, 2006, 20, 848-889.
19. N. Balgacem, Intensive Program: Biomaterials, Toulouse, France, 22 May
2007.
20. M. C. Y. Chang, Current Opinion in Chemical Biology, 2007, 11, 677-684.

Chapter 1: Introduction
31
21. H. B. Goyal, D. Seal and R. C. Saxena, Renewable and Sustainable Energy
Reviews, 2008, 12, 504-517.
22. S. Y. Lin and C. W. Dence, Methods in Lignin Chemistry (Springer Series in
Wood Science), Springer, 1992.
23. R. Hatfield and R. S. Fukushima, Crop Science, 2005, 45, 832-839.
24. R. Rowell, The Chemistry of Solid Wood American Chemical Society, 1984.
25. E. Sjostrom, Wood Chemistry: Fundamentals and Applications, Academic Press,
Inc., 1993.
26. N. Worasuwannarak, T. Sonobe and W. Tanthapanichakoon, J. Anal. Appl.
Pyrolysis, 2007, 78, 265 - 271.
27. B. Hahn-Hagerdal, M. Galbe, M. F. Gorwa-Grauslund, G. Liden and G. Zacchi,
TRENDS in Biotechnology, 2006, 24, 550-556.
28. J. Domac, K. Richards and S. Risovic, Biomass & Bioenergy, 2005, 28, 97-106.
29. T. D. Foust, A. Aden, A. Dutta and S. Phillips, Cellulose, 2009, 16, 547-565.
30. R. D. Perlack, L. L. Wright, A. Turhollow, R. Graham, B. Stokes and D. Erbach,
Biomass as a feedstock for a bioenergy and bioproducts industry: the technical
feasibility of a billion-ton annual supply (Tech. Rep. ORNL/TM-2006/66), US
Department of Energy and Oak Ridge National Laboratory, 2005.
31. L. D. Gomez, C. G. Steele-King and S. J. McQueen-Mason, New Phytologist,
2008, 178, 473-485.
32. R. Luque, L. Herrero-Davila, J. M. Campelo, J. H. Clark, J. M. Hidalgo, D.
Luna, J. M. Marinas and A. A. Romero, Energy & Environmental Science, 2008,
1, 542-564.
33. S. Czernik and A. V. Bridgwater, Energy & Fuels, 2004, 18, 590-598.
34. A. Demirbas, Progress in Energy and Combustion Science, 2004, 30, 219-230.
35. A. Demirbas, Energy Conversion and Management, 2003, 44, 1465-1479.
36. BERR, Digest of United Kingdom energy statistics 2008, TSO, 2008.
37. Y. Sun and J. Y. Cheng, Bioresource Technology, 2002, 83, 1-11.
38. T. Bridgwater, Journal of the Science of Food and Agriculture, 2006, 86, 1755-
1768.
39. K. Raveendran and A. Ganesh, Fuel, 1996, 75, 1715 - 1720.
40. P. C. A. Bergman, M. J. Prins, A. R. Boersma, K. J. Ptasinski, J. H. A. Kiel and
F. J. J. G. Janssen, Torrefaction for entrained-flow gasification of biomass,
Energy research Centre of the Netherlands: Biomass, 2005.
41. J. B. Wooten, J. I. Seeman and M. R. Hajaligol, Energy & Fuels, 2004, 18, 1-15.
42. J. H. A. Kiel, IEA Bioenergy Task 32 workshop “Fuel storage, handling and
preparation and system analysis for biomass combustion technologies”, Berlin,
7 May 2007.
43. ARGE Kompetenznetzwerk Energie aus Biomasse, Güssing biomass fuelled
combined heat and power plant http://www.renet.at/english/sites/guessing.php,
Accessed 02.02.10, 2010.
44. R. C. Brown, Intensive Program: Biomaterials, Toulouse, France, May 31,
2007.
45. A. Domínguez, J. A. Menéndez, Y. Fernández, J. J. Pis, J. M. V. Nabais, P. J. M.
Carrott and M. M. L. R. Carrott, Journal of Analytical and Applied Pyrolysis,
2007, 79, 128-135.

Chapter 1: Introduction
32
46. Y. Tang, W. Yu, L. Mo, H. Lou and X. Zheng, Energy & Fuels, 2008, 22, 3484-
3488.
47. X. Junming, J. Jianchun, S. Yunjuan and L. Yanju, Biomass & Bioenergy, 2008,
32, 1056-1061.
48. Z. Qi, C. Jie, W. Tiejun and X. Ying, Energy Conversion & Management, 2007,
48, 87-92.
49. M. J. Prins, K. J. Ptasinski and F. J. J. G. Janssen, Energy, 2006, 31, 3458-3470.
50. J. Duan, Y. H. Luo, N. Q. Yan and Y. Chen, Energy & Fuels, 2007, 21, 1511-
1516.
51. T. G. Bridgeman, J. M. Jones, I. Shield and P. T. Williams, Fuel, 2008, 87, 844-
856.
52. C. O. Kappe, Angew. Chem. Int. Ed., 2004, 43, 6250 - 6284.
53. R. Gedye, F. Smith, K. Westaway, H. Ali, L. Baldisera, L. Laberge and J.
Rousell, Tetrahedron Letters, 1986, 27, 279 - 282.
54. L. Perreux and A. Loupy, Tetrahedron, 2001, 57, 9199-9223.
55. B. A. Roberts and C. R. Strauss, Acc. Chem. Res., 2005, 38, 653 - 661.
56. N. S. Wilson, C. R. Sarko and G. P. Roth, Organic Process Research &
Development 2004, 8, 535 - 538.
57. A. Domínguez, J. A. Menendez, M. Inguanzo and J. J. Pis, Bioresource
Technology, 2006, 97, 1185-1193.
58. A. M. Sarotti, R. A. Spanevello and A. G. Suarez, Green Chemistry, 2007, 9,
1137-1140.
59. M. Miura, H. Kaga, T. Yoshida and K. Ando, J. Wood Sci., 2001, 47, 502-506.
60. M. Miura, H. Kaga, A. Sakurai, T. Kakuchi and K. Takahashi, J. Anal. Appl.
Pyrolysis, 2004, 71, 187-189.
61. G. G. Allan, B. Krieger-Brockett and D. W. Work, Journal of Applied Polymer
Science, 1980, 25, 1839-1859.
62. R. W. C. Chan and B. Krieger-Brockett, Journal of Applied Polymer Science,
1981, 26, 1533-1553.
63. J. A. Menendez, A. Dominguez, Y. Fernandez and J. J. Pis, Energy & Fuels,
2007, 21, 373-378.
64. F. Yu, S. P. Deng, P. Chen, Y. Liu, Y. Wang, A. Olsen, D. Kittelson and R.
Ruan, Applied Biochemistry and Biotechnology, 2007, 136-140 957-970.
65. F. Yu, R. Ruan, S. P. Deng, P. Chen and X. Lin, presented in part at the ASABE
Annual International Meeting, Portland, Oregan, 2006.
66. F. Yu, R. Ruan, P. Chen and S. Deng, presented in part at the ASABE Annual
International Meeting, Minneapolis, 2007.
67. Y. F. Huang, W. H. Kuan, S. L. Lo and C. F. Lin, Bioresource Technology,
2008, 8252-8258, 8252-8258.
68. D. Starmans and H. Nijhuis, Trends in Food Science & Technology 1996, 71,
192-197.
69. S. H. Schurr, C. C. Burwell, W. D. Devine and S. Sonenblum, in Electricity in
the American Economy: Agent of Technological Process, Greenwood Publishing
Group, 1990, pp. 168-169.
70. Y. V. Bykov, K. I. Rybakov and V. E. Semenov, J. Phys. D: Appl. Phys. , 2001,
34, R55–R75.

Chapter 2: Microwave treatment
of biomass components
Publications:
Budarin, V. L.; Clark, J. H.; Lanigan, B. A.; Shuttleworth, P.; Macquarrie, D. J.,
Microwave assisted decomposition of cellulose: A new thermochemical route for
biomass exploitation. Bioresource Technology 2010, 101 (10), 3776-3779.

Chapter 2: Microwave treatment of biomass components
34
2.1 Introduction
It is widely accepted that the thermal behaviour of biomass is strongly dependent on
its chemical composition and structure. The stages of primary pyrolysis, which take
place between 200-400 oC, can be correlated to the initial fast decomposition of
cellulosic components and the slower decomposition of lignin over a wide
temperature range.1 The decomposition pattern of biomass can be closely linked to
cellulose, hemicellulose and lignin content. Indeed, biomass rich in cellulose
behaves more similarly to pure cellulose, with high-lignin biomass demonstrating
behaviour closer to lignin itself.2, 3
A better understanding of the decompositional
behaviour of these major components will be vital for progress towards optimisation
of their conversion into useful products. Therefore, a better understanding of the
behaviour of these major biomass components under microwave irradiation, the
subject of this chapter, is crucial for progress towards efficient processing of
biomass. The properties of these products will viewed in comparison to those of
conventional slow pyrolysis under similar thermal conditions.
2.2 Composition of biomass
Lignocellulosic biomass consists of three structural polymers, typically about 35 to
50% cellulose, 20 to 35% hemicellulose, and 10 to 25% lignin depending on the
plant species, each of which are naturally resistant to processing.4 Lignocellulose is
a composite material, with high tensile strength and high rigidity provided by a
framework of cellulose microfibrils. This cellulose framework is in turn coated with
hemicellulose which binds to the surface of the microfibrils and acts as a plasticiser
preventing neighbouring fibrils from coming into contact with each other, and hence
maintaining a certain level of flexibility.5 This polysaccharide network is protected
by the final cell wall component, lignin, which forms a type of waterproof,
chemically resistant seal.5

Chapter 2: Microwave treatment of biomass components
35
2.2.1 Cellulose
Alpha cellulose is a polysaccharide having the general formula (C6H10O5)n and an
average molecular weight range of 300,000–500,000.6 Cellulose is formed by β-1,4
links between glucose rings resulting in its insolubility in water and most common
solvents, which poses challenges for processing.7 Conversion of cellulose to fuel
and lower molecular weight chemicals is strongly influenced by physical factors
such as the degree of polymerization, level of crystallinity and number of reducing
ends associated with the substrate. As a result of forming microfibril bundles of
linearly linked glucose units in the cell wall, an extensive inter-strand hydrogen-
bonding network occurs, giving rise to the crystallinity of the structure. The degree
of crystallinity in cellulose has a major influence on the susceptibility to
transformation, the more crystalline, the more difficult it is to access for conversion.
The overall rigidity of cellulose as a macromolecule makes it all the more resistant
to breakdown (summarized by 8).
As can be seen in Figure 2.1, the D-anhydroglucopyranose units of cellulose are
joined by β-type glycosidic linkages forming the long polymer chain. The linkages
cause alternate glucose rings to be rotated by 180o; consequently the arrangement is
very ordered, resulting in an extensive network of inter and intra molecular
hydrogen bonds, holding large numbers of chains together (Figure
2.1B)(summarized by 9). Faults in the order within chains lead to formation of
amorphous regions. These regions are believed to be more susceptible to chemical
conversions and are thought to be the points of association with hemicellulose.5, 9

Chapter 2: Microwave treatment of biomass components
36
Fig. 2.1: Structure of cellulose A: stereochemistry within chain B:planar view C:
extensive hydrogen bond network in cellulose (adapted from reference9)
Cellulose typically accounts for 35-50 % of lignocellulosic biomass making it the
most abundant biomolecule on earth and hence a key focus in the production of fuels
from biomass.4
2.2.2 Hemicellulose
Hemicellulose is a collection of complex polysaccharides in the cell wall, typically
accounting for up to 35 % of cell wall components. It is a branched polymer, the
structure of which varies greatly depending on the biomass type. Hemicellulose,

Chapter 2: Microwave treatment of biomass components
37
with an average molecular weight of 30,000, is built up of pentoses (xlyose,
arabinose) hexoses (mannose, glucose, galactose) and uronic acids. Hemicelluloses
formed of xylose and glucose dominate in the primary cell wall, while the secondary
cell wall is mostly arabinoxylose and xylose (Figure 2.2) (summarised in 8-10
)
Fig. 2.2: Structure of arabino-xylan showing complex branched nature of polymer
(adapted from reference 5)
Hemicellulose interacts with cellulose through further hydrogen bonding to the
glucan chain. The presence of side chains prevents formation of a crystalline
structure resulting in a higher solubility than cellulose.5
2.2.3 Lignin
Lignin is the most resistant component of the cell wall, essentially protecting
cellulose and hemicellulose from degradation. It is made up of three
phenylpropanoid monomers which form an amorphous polymer through enzyme
mediated conversion resulting in a variety of chemical bonds (Figure 2.3). Similarly
to hemicellulose, the structure of lignin is dependent on the biomass source. For
example, coniferyl alcohol is the major precursor in softwood lignin (up to 95 %

Chapter 2: Microwave treatment of biomass components
38
abundant), while hardwood lignins contain various ratios of coniferyl alcohol and
sinapyl alcohol.11, 12
Fig. 2.3: Lignin building blocks (adapted from reference 8)
Lignin is subject to much research interest as it offers a major potential source of
aromatic molecules if an efficient method can be found to break it down selectively.
It is currently used as a stabiliser in drilling muds and emulsions, and as a dispersant
in paints and dyes. The majority of lignin is seen as waste and burnt for energy
production leaving this tremendous renewable source of aromatic compounds
unexploited and ready for conversion to a useful product if a conversion process can
be developed.12
2.3 Microwave treatment of biomass
As discussed in Section 1.9.2, limited investigations have been carried out into the
specific effect of microwave energy on biomass. During microwave treatment the

Chapter 2: Microwave treatment of biomass components
39
initial interaction is due to the presence of hydrogen bonding between cellulose
layers as shown in Figure 2.4. As the microwave process continues the temperature
within the sample increases as a result of this interaction. The increased temperature
reduces the crystallinity within cellulose, increasing the freedom of movement and
polarisability of groups within the molecule.
Fig. 2.4: Initial microwave interaction with cellulose due to the presence of H-
bonding13
It is thought, that as the loss factor increases, i.e. the ability of cellulose to convert
microwave energy to heat, significant amounts of water are released through
chemical dehydration. The loss factor of water is about 60 times higher than that of
cellulose in the microwave region; as a result, the water molecules generated lead to
a significant increase in the microwave energy absorbed by the sample and
subsequently an increase in the rate of heating within the material.13
Cellulose, as the major component of biomass, was chosen as the case study for
investigation of the effect of microwave irradiation. As previously mentioned,
conversion of cellulose to fuel and chemicals is strongly influenced by a number of
physical factors such as degree of polymerization, level of crystallinity and number
of reducing ends associated with the substrate. Of these, degree of the crystallinity
in cellulose has the most significant influence on its susceptibility to transformation,
the greater the degree, the more difficult it is to access for conversion.8
Consequently, conversion of cellulose to other useful products could potentially be
improved if microwave irradiation can be used to reduce the level of crystallinity.

Chapter 2: Microwave treatment of biomass components
40
2.4 Microwave treatment of cellulose
The majority of reported microwave treatments of biomass have been carried out at
temperatures above 350 oC (typical for conventional pyrolysis), resulting in
gasification or liquefaction of the starting material to produce fuels.14-17
However
there is much debate in the field of microwave technology; while it is agreed that
they offer a more efficient method of heating, they also promote novel reaction
pathways or greatly accelerate reaction rates, as a result of a so-called non-thermal
effect.18
These novel pathways result in milder operating conditions such as reduced
temperature. Consequently, it is possible that the high temperatures and heating
rates in previous microwave pyrolysis studies may have masked important lower
temperature processes. Therefore, decomposition of cellulose at lower temperatures
(below 300 oC) was investigated.
2.4.1 The “microwave-effect”
In order to differentiate thermal and non-thermal events during microwave treatment
an experimental set-up was designed (Experimental section 7.2.1). As is shown in
Figure 2.5, a narrow packed column of cellulose (allowing homogeneous exposure
to microwave irradiation) was placed in a well stirred thermostated oil bath within
the microwave chamber (to ensure uniform heating throughout the sample). The top
portion of the cellulose was wrapped in aluminium foil to shield it from microwave
irradiation (Figure 2.5A). Visual examination of the sample after the experiment
showed the area which had been exposed to microwave irradiation had begun to
decompose, while the area above shows little colour change (Figure 2.5B). The
experiment was repeated using conventional heating. Little change was visible in
the cellulose after heating to similar temperatures. Further microwave experiments
were carried out over a range of oil bath temperatures between 150-220 oC (Figure
2.5C). While some decomposition of cellulose can be seen under microwave
irradiation at 150 oC, there is a marked change in the level of decomposition above
180 oC.

Chapter 2: Microwave treatment of biomass components
41
Fig. 2.5: Scheme of experimental set-up for estimation of direct microwave effect on
the cellulose. A) Construction of the cell. B) Image of cellulose in capillary before
(I) and after (II) microwave treatment. C) Cellulose samples treated in the
microwave from 150 – 220 ºC under the sample processing condition as those in B.
2.4.2 Effect of power and temperature on char formation
To gain a better understanding of the mechanism of the microwave effect on
cellulose, the influence of microwave processing temperature on the production of
char was investigated in parallel with conventional pyrolysis experiments.
Following the procedure described in experimental section 7.2.2, cellulose was
irradiated at temperatures between 120 – 300 oC. In parallel, cellulose was also
pyrolysed under conventional thermal conditions (between 150 – 450 oC). Figure

Chapter 2: Microwave treatment of biomass components
42
2.6 shows the comparison of the resulting chars based on their calorific values
measured following the procedure described in Experimental section 7.3.1.
Fig. 2.6: Calorific value of char obtained from cellulose through thermal and
microwave-assisted slow pyrolysis
It can be seen that through microwave irradiation, chars of similar calorific value
could be produced at temperatures 100 ºC lower than those produced using
conventional pyrolysis. While the increase in calorific value for conventional
pyrolysis chars follows a smooth trend, the rate of increase for the microwave chars
showed a jump at ~180 oC, in agreement with earlier qualitative observations (Figure
2.5). The maximum calorific value (34 kJg-1) was achieved through microwave
irradiation at 300 oC. This represents a significant process enhancement as
microwave irradiation has facilitated production of a biomass char with a calorific
value close to that of coal (32 – 42 kJg-1).19
The char formation process simultaneously resulted in the release of volatile
components which were subsequently condensed into a liquid. To investigate the
kinetics of liquid formation under microwave conditions, the volatiles evolved were

Chapter 2: Microwave treatment of biomass components
43
monitored by FTIR (Experimental section 7.3.4). The total absorption of IR
radiation by the evolved gases is represented by the Gram-Schmidt trace (Figure 2.7
A).
Fig. 2.7: A) Gram Schmidt FTIR trace of the volatiles produced during the
microwave decomposition of cellulose B) IR spectra of evolved fractions
The first fraction was observed at temperatures as low as 155 oC, within 2-3 minutes
of exposure to microwave irradiation. As can be seen in Figure 2.7 B, this fraction
contains high levels of water, organic acids and aldehydes. Thereafter, a sharp peak
is observed around 180 oC corresponding to an organic fraction with lower water

Chapter 2: Microwave treatment of biomass components
44
content and the release of CO and CO2. Finally, at 200 ºC, a third fraction of further
decomposition products was seen. The composition of the fractions was confirmed
by parallel studies on biomass (Chapter 4).
2.4.3 Cellulose char characterisation: Spectroscopic analysis
The chars produced by microwave irradiation were compared by FTIR and 13
C MAS
(Magic Angle Spin) NMR on the basis of preparation temperature (Figure 2.8).
Both showed a loss of signals corresponding to the glycosidic bonds of the cellulose
ring structure as preparation temperature increased.
The change of structure between 1370 – 900 cm-1
and 60 - 110 ppm show the break
down and re-arrangement of the glycosidic ring.20-24 FTIR studies showed a clear
increase in carboxyl groups and changes in the C-H region along with the
disintegration of the ring structure. It also showed the early stages of decomposition
at temperatures as low as 180 oC as the signals corresponding to non-glycosidic
carboxyl groups at 1035 cm-1
and 1057 cm-1
increases, and a second peak at ca 1611
cm-1 appears, consistent with a conjugated C=C bond.
The 13
C MAS NMR also showed the breakdown of the glycosidic ring structure with
increasing microwave preparation temperature. The final char shows predominately
aromatic and carbonyl nature as shown by the signals above 110 ppm.

Chapter 2: Microwave treatment of biomass components
45
Fig. 2.8: FTIR and 13
C MAS NMR of cellulose with microwave chars prepared at
180 oC, 250
oC and 300
oC.

Chapter 2: Microwave treatment of biomass components
46
Changes to the glycosidic region, along with the formation of ethylenic (C=C) and
carbonyl (C=O) bonds within the material is in agreement with reported data on the
thermal cellulose pyrolysis, and is thought to be as a result of cleavage and
dehydration reactions. These changess are thought to be formed as the oxygen
bonds in pyranose rings break, resulting in a structural rearrangement and often
release of volatile components.13
Comparison between chars prepared by microwave and thermal processes were
carried out looking at those 1) prepared at the same temperature, 2) with the same
calorific value and 3) those with the same elemental composition, corresponding to
the three pairs of data shaded (Table 2.1). The comparison showed several
interesting points, including an apparent disconnection between similar carbon
content and calorific value, as microwave chars with lower carbon content than
conventional chars have higher calorific values.
Table 2.1: Points of comparison between microwave (mw) and conventional (con)
chars
Samples
Preparation
Temperature
(oC)
Calorific Value
(kJg-1
)
Elemental Composition
%C
mw con mw con mw con
native n/a 14.65±1.25 42.77±0.01
a & b 300 305 35.34±1.04 26.49±3.42 68.41±0.005 44.19±0.02
a & c 300 450 35.34±1.04 31.2±0.1 68.41±0.005 75.33±0.085
a & d 300 364 35.34±1.04 27.97±0.54 68.41±0.005* 68.72±0.075*
*Hydrogen and oxygen content similar in both chars.
Further elemental composition data included in Appendix 1
Figure 2.9 shows the FTIR spectra of cellulose along with chars samples listed in
Table 2.1 a) microwave 300 oC, b) conventional 305
oC, c) 450
oC and d) 364
oC.
Microwave treatment of cellulose results in formation of char at 300 oC, while under

Chapter 2: Microwave treatment of biomass components
47
conventional thermal treatment conditions, cellulose is hardly altered at 300 oC. It is
necessary to use significantly higher temperatures (up to 180 oC greater than
microwave preparation) in order to cause a change in the nature of the carbonyl and
glycosidic bonds.
Fig. 2.9: FTIR spectra of cellulose and pyrolysis chars prepared under various
conditions
While the microwave char prepared at 300 oC (a) shows clear signs of breakdown of
the glycosidic structure of cellulose (1000 – 1500 cm-1
), the conventional char

Chapter 2: Microwave treatment of biomass components
48
prepared at the same temperature (b) is almost unaltered from the native cellulose.
Clear changes are visible in the conventional char prepared at 450 oC, (c) a new peak
is visible at 3060 cm-1
corresponding to aromatic character or olefinic C-H. This
peak is not seen in any of the other chars, although its prominence in this spectrum
may be as a result of the weaker OH and aliphatic CH stretches. New peaks can be
seen to be growing between 700 cm-1
and 800 cm-1
, in the microwave char (a) (300
oC) suggesting an increase in aromatic C-H groups present. These peaks can be seen
to be appearing in the conventional char prepared at 364 oC becoming clearer again
in the highest temperature char (c).
Perhaps the most interesting point of comparison is between the chars with the same
elemental composition (a- microwave 300 oC and d- conventional 364
oC as shown
in Figure 2.9 inset). Although both contain approximately the same level (± 0.2 %)
of both carbon and hydrogen, there are differences in the spectral characteristics of
each. The microwave char still shows peaks between 1050 – 1160 cm-1,
corresponding to OH vibrations of native cellulose,25
although the intensity is
weakened. These peaks have disappeared in the spectrum of the comparative
conventional sample. Conversely, the CH bending stretch at 1428 cm-1
has shifted
in the conventional char spectrum to 1437 cm-1
, while it has almost disappeared
entirely from the microwave char spectrum.25 Figure 2.10 shows the 13C MAS
NMR spectra of the samples. Although it is difficult to assign the differences
between the two spectra, there is some variation in the aromatic and carboxylic
regions. The differences between the two chars again suggest an alternative
degradation pathway for the cellulose when treated with microwaves rather than by
slow pyrolysis.

Chapter 2: Microwave treatment of biomass components
49
Fig. 2.10: 13
C MAS NMR spectra of microwave char at 300 oC and conventional
char at 364 oC
2.4.4 Cellulose char characterisation: Elemental analysis
The properties of fuels are often compared in terms of their O/C and H/C ratios. A
plot of these ratios, a so-called Van Krevelen diagram, indicates the suitability of the
material for fuel use.26
The lower the respective ratios the greater the energy content
of the material. Along with information relating to fuel properties, information on
reaction pathways can be obtained, as decarboxylation, dehydration,
dehydrogenation, hydrogenation and oxidation should result in a straight line plot
due to the related changes of ratios. As detailed in Table 2.2, the diagram can also
be used to elucidate information about the carbon skeleton of polymers.26

Chapter 2: Microwave treatment of biomass components
50
Table 2.2: Relationship between H/C ratio and structure26
H/C ratio Polymer skeleton
< 0.3 highly condensed aromatic ring structure
0.3 – 0.7 noncondensed aromatic structure
0.7 – 1.5 basic units consist of an aromatic nucleus with an aliphatic side
chain
1.5 – 1.7 cyclic aliphatic compound
1.7 - 2 alkane system
Figure 2.11 shows the Van Krevelen diagram of cellulose chars. By plotting O/C
and H/C ratios of the microwave and conventional chars it can be seen that
elemental loss process is similar under both conditions. Chars produced via low
temperature microwave processing result in a char with favourably low ratios. The
straight line plot also shows that both microwave and conventional chars undergo at
least one of the reactions listed above during degradation, although likely to be in a
different combination thereby resulting in the different calorific values.
Fig. 2.11: Van Krevelen diagram showing the elemental ratios of cellulose chars 27
(errors have not been displayed as they are negligible)

Chapter 2: Microwave treatment of biomass components
51
The ratios also show the transition of cellulose into an aromatic species at high char
preparation temperatures in agreement with data from 13
C MAS NMR and FTIR
(Figure 2.8).
2.4.5 Cellulose char characterisation: Thermal analysis
For any cellulose decomposition to occur, structural changes such as cold
crystallisation or melting are necessary. These structural changes may occur within
the crystalline or amorphous regions, with the possibility of a cooperative process
affecting both regions. Furthermore, one or more thermal events can occur
simultaneously, potentially masking what is truly occurring within the material. As a
result, modulated differential scanning calorimetry (MDSC) was used to investigate
the thermal behaviour of cellulose. As a technique, it offers increased sensitivity
over conventional DSC, along with better resolution, due to a low average heating
rate following a frequency dependent modulation.28
In addition, previous studies
have shown MDSC to be useful in the examination of microcrystalline cellulose.29
Similar to traditional DSC, MDSC detects changes and transitions within a sample
by measuring the difference in the amount of heat required to increase the
temperature of the sample and a reference as a function of temperature. When the
sample undergoes a phase transition more or less heat is needed to flow to it rather
than the reference to keep both at the same temperature. In the case of a melt or
glass transition, more heat flows to the sample due to the absorption of heat in the
endothermic process. Inversely less heat is needed to flow during crystallisation.
The modulated heating of MDSC allows for the detection of simultaneous events in
a material by exposing it to numerous heating rates. The total heat flow is
mathematically deconvoluted to yield calorimetric response to the perturbation from
the calorimetric response to the underlying temperature profile, none as the reversing
and nonreversing heat flows.
Figure 2.12 shows an overall heat flow signal and both a reversing and non-
reversing heat flow signal of the MDSC trace of cellulose. In the non-reversing heat

Chapter 2: Microwave treatment of biomass components
52
flow signal, which accounts for the kinetic component of the total heat flow, an
endothermic deviation in the base line starts around 100 ºC and peaks at 134 ºC.
This process may be attributed to the evaporation of any residual moisture within the
sample.
Fig. 2.12: MDSC trace of cellulose showing total heat flow signal and reversing and
non-reversing heat flow signals.
From 170 ºC there is a continual decrease in the total heat flow signal which is
believed to be due to depolymerisation of the material. This event coincides with
what can be seen in the reversing heat flow signal with a glass transition (Tg)
starting at approximately 185 ºC and returning to a steady state at 220 ºC, with the
point of inflection at 197 ºC. This transition is more clearly visible in the derivative
of the slope as shown in Figure 2.13. This transition is masked in the total heat flow
from the continual depolymerisation in the non reversing signal and is not seen using
conventional DSC analysis. Consequently, the depolymerisation of cellulose is
linked with loss of crystallinity resulting from the glass transition.

Chapter 2: Microwave treatment of biomass components
53
Fig. 2.13: Derivative of the reversing heat flow signal.
2.4.6 Cellulose char characterisation: Crystallinity
To verify the MDSC data, changes in the crystallinity of cellulose were monitored
by FT-IR, using a temperature controlled diffuse reflectance infrared Fourier
transform (DRIFT) apparatus. The crystalline structure of cellulose is usually
determined through X-ray diffraction, FT Raman, IR absorption and scanning
electron microscopy (SEM).30-33
While X-ray diffraction is useful for quantitative
analysis of the crystallinity index (CI), FTIR absorption is a very useful technique
because it gives extra useful information regarding internal bonding and spatial
conformations.21
The fixed vibrations of the crystalline structure result in sharp
bands which disappear on decrystallisation, while bands corresponding to the
amorphous region do not appear in the spectrum of a pure crystalline polymer.31
A
ratio of the intensity of two such bands can be taken as the crystallinity index, which
is a relative measure of how a sample varies between the extremes of completely
amorphous and totally crystalline. In this case, the crystallinity index was calculated
based on the ratio of the peaks at 1430 and 898 cm-1
. The bonds, which correspond
to CH2 bending at C6 (1430 cm-1
) and C-O-C stretching at the β-(1→ 4) glycosidic
linkage, have been reported to shift as a result of transformations in the crystalline
structure (Figure 2.14).21

Chapter 2: Microwave treatment of biomass components
54
Fig. 2.14: FTIR spectrum of conventional cellulose chars
While this method (Experimental section 7.3.2) offers a useful way to compare the
changes in crystallinity levels, the absolute values were found to be subject to
variation. Infrared is a sensitive technique, therefore changes in intensity may occur
due to experimental conditions such as particle size and varying levels of moisture
within the system. As a result, the data obtained has been used to produce an
indicative trend rather than an absolute measurement of crystallinity within the
samples.
IR studies were carried out on cellulose samples prepared at a range of temperatures
using microwave activation and conventional slow pyrolysis. Crystallinity rose in
microwave chars with increased preparation temperature, suggesting the amorphous
region is being decomposed preferentially and resulting in loss of the signal (at 898
cm-1
) from this region faster than from the crystalline region (Figure 2.15). This
indicates that the amorphous region is more affected by microwave irradiation as the
freedom of movement allows for better interaction.
In the case of chars produced under slow pyrolysis conditions, the change is much
less significant and in the opposite direction. The decrease of the crystallinity

Chapter 2: Microwave treatment of biomass components
55
correlates well with the MDSC information. With the increased molecular motion
within the amorphous region, as illustrated by the glass transition, a stress is induced
on the crystalline region resulting in a reduction in the level of crystallinity.
Fig. 2.15: Relative crystallinity of cellulose samples produced by conventional and
microwave heating at different temperatures
2.4.7 Isotope exchange studies
In order to further investigate the mechanism of microwave interaction with
cellulose, the biopolymer was partially deuterated. It is known that substitution of
protons by deuterium significantly reduces the rate of processes involving the H-
bonding network, therefore any changes in the behaviour of the cellulose may be
correlated to this substitution. Following reported methodology, experimental
section 7.3.3, cellulose was partially deuterated at 180 oC to restrict exchange mainly
within the amorphous region.34
Microwave chars were consequently prepared and
analysed in terms of calorific value following the same procedure for standard
cellulose. As can be seen in Figure 2.16, the deuterated cellulose activated by
microwave, decomposes slower than the protonated form, most likely due to the
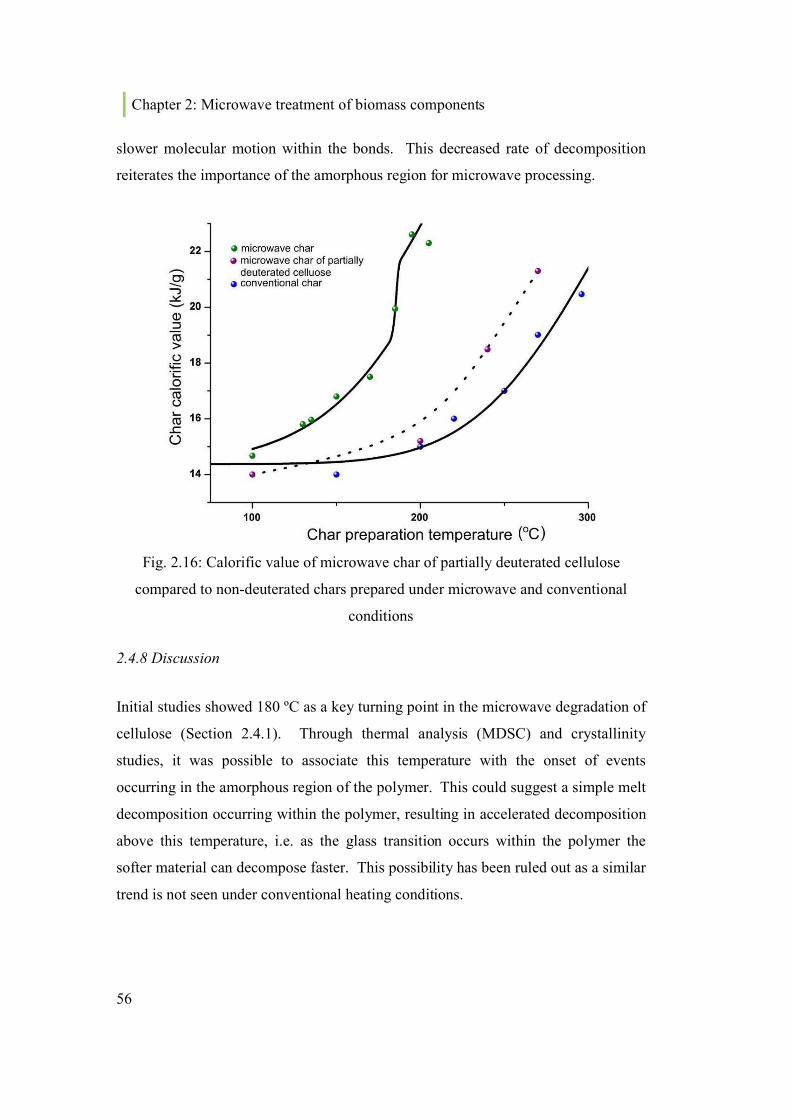
Chapter 2: Microwave treatment of biomass components
56
slower molecular motion within the bonds. This decreased rate of decomposition
reiterates the importance of the amorphous region for microwave processing.
Fig. 2.16: Calorific value of microwave char of partially deuterated cellulose
compared to non-deuterated chars prepared under microwave and conventional
conditions
2.4.8 Discussion
Initial studies showed 180 ºC as a key turning point in the microwave degradation of
cellulose (Section 2.4.1). Through thermal analysis (MDSC) and crystallinity
studies, it was possible to associate this temperature with the onset of events
occurring in the amorphous region of the polymer. This could suggest a simple melt
decomposition occurring within the polymer, resulting in accelerated decomposition
above this temperature, i.e. as the glass transition occurs within the polymer the
softer material can decompose faster. This possibility has been ruled out as a similar
trend is not seen under conventional heating conditions.

Chapter 2: Microwave treatment of biomass components
57
It can be said that above 180 oC the specific microwave effect becomes more
prominent as the rate of cellulose degradation increases significantly. The glass
transition which occurs, allows for increased molecular freedom within the
amorphous region of the material resulting in improved interaction between the
microwave energy and cellulose. As has been discussed (Section 1.9), there are two
main mechanisms through which interaction occurs: dipolar polarisation and ionic
conduction. Dipolar polarisation depends on polar groups within the material having
the necessary freedom of movement to align with the waves of the microwave
field.18
We can therefore assume that before the glass transition, the polar groups in
cellulose are more restrained by structural constraints and cannot rotate at the
frequency of the microwave resulting in the poorer interaction. After the transition,
as the number of groups capable of rotating increases, particularly in the amorphous
region, the rate of decomposition significantly increases, as illustrated by the change
around 180 oC.
It is known that cellulose exists as a microfibril network within the cell wall of
plants, with amorphous and crystalline regions which alternate at a period of
approximately 15 nm.35
Crystalline cellulose contains a very ordered hydrogen
bonded network within which a proton transport network is possible in the presence
of an electromagnetic field. Above the glass transition temperature, the electrical
conductivity of amorphous polymers increases greatly.35
This phenomenon can be
interpreted qualitatively in terms of the ionic current which is known to increase
remarkably with temperature as a result of the simultaneous breaking of two
hydrogen bonds, causing increased mobility within the hydrogen-bonding network.
In the case of cellulose the activation barrier has been identified as 44.4 kJ/mol.35, 36
Microwave energy has been reported to lower the activation energies in organic
synthesis, therefore it can be taken that it could also allow for a lower activation
energy for ionic conduction within cellulose.18, 37
This, along with the increased
mobility allowed by the glass transition, allows for increased motion of hydroxyls in
the amorphous region and as result increased acidity.

Chapter 2: Microwave treatment of biomass components
58
Acidic conditions have been shown to promote char formation under conventional
pyrolysis conditions.38, 39
The acidity in the amorphous region is increased as the
softening of the glass transition allows movement of protons within cellulose
resulting in an acid catalysed decomposition process (Figure 2.17). As these
components are produced the amorphous region will be further plasticised,
intensifying the microwave effect. At higher temperatures the crystalline region is
disrupted aiding further degradation and char formation.
Fig. 2.17: Mechanism of acid catalysed cellulose degradation40
The proposed mechanism of the microwave interaction with cellulose consists of the
following stages:
- a glass transition resulting in the softening of the amorphous region above
180 ºC
- microwave-induced dipolar polarisation and ionic conduction within the
amorphous region
- acid catalysed decomposition of the entire cellulose
- auto-catalytic microwave decomposition of cellulose
The proposed mechanism allows better understanding of the processes occurring
within biomass during microwave treatment.

Chapter 2: Microwave treatment of biomass components
59
2.5 Microwave treatment of hemicellulose
A short investigation was made into the behaviour of hemicellulose under
microwave conditions. Following the procedures used in the cellulose study
(Experimental section 7.2.2) chars were prepared using xylan, a saccharide
component of hemicellulose, as a model compound. Chars were prepared under
microwave and conventional conditions, and characterised in terms of their calorific
values and by MDSC, FTIR and elemental analysis.
2.5.1 Char formation
The influence of microwave temperature on the production of char was again
investigated in parallel with conventional pyrolysis experiments.
Following the procedure described in experimental section 7.2.2, xylan was
irradiated with microwave energy at temperatures between 120 – 300 oC, and under
conventional thermal conditions in the range 250 – 450 oC. The resulting chars were
compared based on calorific value as shown in Figure 2.18.
Fig. 2.18: Calorific value of char obtained from xylan processed conventionally and
in the presence of microwaves. (Errors have not been displayed as they are negligible)

Chapter 2: Microwave treatment of biomass components
60
A greater increase in the energy density of xylan can be achieved through
microwave treatment than through conventional thermal methods at the same
temperature. For xylan, the increase in calorific value between starting material and
the char with the highest calorific value is more than that achieved for cellulose, an
increase of circa 30 kJg-1 as opposed to 24 kJg-1. This is to be expected as the
thermal degradation of hemicellulose is well known to occur at lower temperatures
than cellulose.1 The first hemicellulose decomposition step usually occurs below 250
oC, when a series of depolymerisation reactions results in rearrangement of the
polysaccharide structure. These oligosaccharides and monosaccharides then
decompose around 300 oC to produce a char, CO, CO2 and water.41, 42
Also of interest is that the slope of both lines is parallel and do not diverge as they
do with cellulose (Figure 2.6) where the calorific value of the microwave chars
increases at a greater rate than those prepared under conventional conditions.
2.5.2 Hemicellulose char characterisation: Spectroscopic analysis
Again, following the analytical processes applied for cellulose, the microwave and
conventional chars were compared under three headings: those i) prepared at the
same temperature, ii) with the same calorific value and iii) those with the same
elemental composition (Table 2.3).
Table 2.3: Points of comparison between microwave (mw) and conventional (con)
chars
Preparation
Temperature (oC)
Calorific Value
(kJg-1
)
Elemental Composition
%C
mw con mw con mw con
xylan 15.9 39.5±0.04
300 300 43.24±0.69 34.395±0.93 66.66±0.05 60.48±0.05
260 300 37.54±1.26 38.42±0.195 61.43±0.72 60.48±0.05
note: Further elemental composition data included in Appendix 1

Chapter 2: Microwave treatment of biomass components
61
As was seen with cellulose, the structural changes within the char are similar under
microwave and conventional conditions although the changes occur at lower
temperatures after microwave treatment. As can be seen in Figure 2.19, changes in
the structure are apparent at 260 oC between 750-1900 cm
-1, indicating the break
down or rearrangement of the ring structure as discussed by Bilba and Ouensanga.43
In agreement with their data, the intensity of hydroxyl stretching (3000-3600 cm-1
)
decreases with temperature while the CH signal increases suggesting dehydration
and rearrangement of molecules leading to alkyl-carbonyl structure such as ketones
and aldehydes.43
Weak peaks can also be seen just above 3000 cm-1
in both the
conventional char prepared at 400 oC and microwave char at 300 oC, corresponding
to aromatic or olefinic C-H groups.
Fig. 2.19: FTIR spectrum of xylan chars prepared at various temperatures under
microwave and conventional conditions

Chapter 2: Microwave treatment of biomass components
62
2.5.3 Structural analysis of hemicellulose: Elemental analysis
A Van Krevelen diagram was created for the chars from xylan (Figure 2.20). The
plot of O/C vs. H/C ratio of chars produced via both microwave and conventional
processing lead to straight lines. The trend shows that while both undergo a
combination of decarboxylation, dehydration, dehydrogenation, hydrogenation or
oxidation, the reaction path may be different under the altered conditions.26
As
discussed in Table 2.2, the H/C ratio of the chars shows the structure does not
develop as much aromatic character as cellulose, in agreement with IR data.
Fig. 2.20: Van Krevelen diagram showing the elemental ratios of hemicellulose
chars 27 (Errors have not been displayed as they are negligible)
2.5.4 Hemicellulose char characterisation: Thermal analysis
MDSC was used to study thermal transitions in xylan. It was found that all phase
changes were detectable in the total heat flow, with the reversing and nonreversing
adding no extra information. Figure 2.21 shows the total heat flow for xylan. A
single thermal transition peaking at 168 oC was identified by its characteristic
appearance as a melt within the xylan. The low temperature of this melt is perhaps

Chapter 2: Microwave treatment of biomass components
63
partly accountable for the consistently parallel degradation pattern between
conventional and microwave degradation of hemicellulose, as there is little
opportunity below this temperature for the microwave effect to gain advantage This
is significantly different to the results found for cellulose and may contribute to the
differing trends observed in the calorific value measurements and Van Krevelen
diagram.
Fig. 2.21: MDSC trace of xylan showing total heat flow signal
Although cellulose and hemicellulose are both carbohydrates, the structures are
significantly different resulting in substantial differences in their behaviour under
both conventional and microwave treatment conditions, leading to chars with
appreciably different properties.
2.5.5 Discussion
The amorphous structure of xylan means that the knowledge gained elucidating the
mechanism of cellulose degradation cannot be directly applied to xylan, nor can the
extra analytical methods (e.g. crystallinity studies). As a result, the mechanism of
microwave degradation of hemicellulose (xylan) has not been identified. It may be

Chapter 2: Microwave treatment of biomass components
64
assumed though that similar to cellulose, the melt within the polymer, along with the
increased amorphous character of hemicellulose, enables increased molecular
freedom of movement within the polymer. Polar groups within the xylan are then
capable of dipolar polarisation, increasing ionic conduction, i.e. the interaction
between xylan and the microwave energy increases. This results in an apparent
lowering of the activation barrier for degradation and superior chars at lower
temperatures.
2.6 Microwave treatment of lignin
Lignin was found to have much lower activity under microwave irradiation than the
polysaccharides. As can be seen from Figure 2.22, the rate of heating of lignin
under microwave irradiation was significantly less than that of cellulose. This was
expected due the large sterically hindered complex structure, and lack of hydroxyl
groups necessary for efficient microwave interaction. Alternative treatments of
lignin were investigated and reported in Chapter 5.
Figure 2.22: Heating profile of lignin under microwave conditions

Chapter 2: Microwave treatment of biomass components
65
2.7 Conclusion
These results show, for the first time, the specific temperatures at which microwave
irradiation effects the rate of decomposition of cellulose and hemicellulose, yielding
high calorific value chars which would require much higher temperatures (~100 oC
higher) to produce under thermal conditions. This improvement is seen both in terms
of the lower temperature at which carbonisation occurs, in the maximum calorific
value of the final char, and in the properties of oils produced (Chapter 4). The
understanding gained can now be applied to a variety of biomass (Chapter 3) in
order to optimise the production of chars aimed at energy production as a renewable
alternative to coal.
In order to achieve sustainable development, mankind needs to become less reliant
on petrochemical feedstocks to renewable alternatives. Microwave processing of
biomass may represent an energy efficient route to solid (and liquid) fuels for the
development of a society which is no longer reliant on fossil fuels. Such a process
could potentially offer many benefits over traditional methods. Unlike coal, biomass
is renewable and readily available in the UK. Replacing coal with biomass could
therefore reduce the UK’s greenhouse gas emissions while improving energy
security.

Chapter 2: Microwave treatment of biomass components
66
2.8 References
1. J. H. A. Kiel, Torrefaction for biomass upgrading into commodity fuels,
Berlin, 2007.
2. T. Fisher, M. Hajaligol, B. Waymack and D. Kellogg, Journal of Analytical
and Applied Pyrolysis, 2002, 62, 331-349.
3. A. Gani and I. Naruse, Renewable Energy, 2007, 32, 649-661.
4. B. C. Saha, in Lignocellulose Biodegradation, American Chemical Society,
Washington, D.C., 2004, pp. 2 - 34.
5. L. D. Gomez, C. G. Steele-King and S. J. McQueen-Mason, New
Phytologist, 2008, 178, 473-485.
6. F. W. Lichtenthaler and S. Peters, Comptes Rendus Chimie, 2004, 7, 65-90.
7. A. F. Paresh L. Dhepe, 2008, vol. 1, pp. 969-975.
8. M. C. Y. Chang, Current Opinion in Chemical Biology, 2007, 11, 677-684.
9. P. L. Dhepe and A. Fukuoka, ChemSusChem, 2008, 1, 969-975.
10. B. C. Saha, Journal of Industrial Microbiology and Biotechnology, 2003, 30,
279-291.
11. R. Rowell, The Chemistry of Solid Wood American Chemical Society, 1984.
12. S. Y. Lin and C. W. Dence, Methods in Lignin Chemistry (Springer Series in
Wood Science), Springer, 1992.
13. G. G. Allan, B. Krieger-Brockett and D. W. Work, Journal of Applied
Polymer Science, 1980, 25, 1839-1859.
14. A. Domínguez, J. A. Menéndez, Y. Fernández, J. J. Pis, J. M. V. Nabais, P. J.
M. Carrott and M. M. L. R. Carrott, Journal of Analytical and Applied
Pyrolysis, 2007, 79, 128-135.
15. A. Domínguez, J. A. Menendez, M. Inguanzo and J. J. Pis, Bioresource
Technology, 2006, 97, 1185-1193.
16. J. A. Menendez, A. Dominguez, Y. Fernandez and J. J. Pis, Energy & Fuels,
2007, 21, 373-378.
17. F. Yu, S. P. Deng, P. Chen, Y. Liu, Y. Wang, A. Olsen, D. Kittelson and R.
Ruan, Applied Biochemistry and Biotechnology, 2007, 136-140 957-970.
18. C. O. Kappe, Angew. Chem. Int. Ed., 2004, 43, 6250 - 6284.
19. National Physical Laboratory, Kaye & Laby Tables of Physical & Chemical
Constants (http://www.kayelaby.npl.co.uk/chemistry/3_11/3_11_4.html) Last
accessed August 2010.
20. Y. Sekiguchi, J. S. Frye and F. Shafizadeh, Journal of Applied Polymer
Science, 1983, 28, 3513-3525.
21. S. Y. Oh, D. I. Yoo, Y. Shin, H. C. Kim, H. Y. Kim, Y. S. Chung, W. H.
Park and J. H. Youk, Carbohydrate Research, 2005, 340, 2376-2391.
22. S. H. D. Hulleman, J. M. Van Hazendonk and J. E. G. Van Dam,
Carbohydrate research, 1994, 261, 163-172.
23. S. Martin, G. Notburga, S. Ulrich, R. Tilmann and G. Michael, Biopolymers,
2006, 83, 546-555.
24. I. Pastorova, R. E. Botto, P. W. Arisz and J. J. Boon, Carbohydrate research,
1994, 262, 27-47.

Chapter 2: Microwave treatment of biomass components
67
25. M. Dawy and A.-A. A. Nada, Polymer-Plastics Technology and
Engineering, 2003, 42, 643 - 658.
26. S. A. Visser, Environmental Science & Technology, 1983, 17, 412-417.
27. P. McKendry, Bioresource Technology, 2002, 83, 47-54.
28. S. L. Simon, Thermochimica Acta, 2001, 374, 55-71.
29. K. M. Picker and S. W. Hoag, Journal of Pharmaceuical Sciences, 2002, 90,
342-349.
30. E. Dinand, M. Vignon, H. Chanzy and L. Heux, Cellulose, 2002, 9, 7-18.
31. R. T. O'Connor, E. F. DuPre and D. Mitcham, Textile Research Journal,
1958, 28, 382-392.
32. A. Jähn, M. W. Schröder, M. Füting, K. Schenzel and W. Diepenbrock,
Spectrochimica Acta Part A: Molecular and Biomolecular Spectroscopy,
2002, 58, 2271-2279.
33. R. H. Atalla and D. L. VanderHart, Solid State Nuclear Magnetic Resonance,
1999, 15, 1-19.
34. Y. Horikawa and J. Sugiyama, Cellulose, 2008, 15, 419-424.
35. K. Takahashi and H. Takenaka, Polymer Journal, 1983, 15, 625-629.
36. E. J. Murphy, Annals of the New York Academy of Sciences, 1965, 118, 727.
37. L. Perreux and A. Loupy, Tetrahedron, 2001, 57, 9199-9223.
38. C. Di Blasi, C. Branca and A. Galgano, Polymer Degradation and Stability,
2007, 92, 752-764.
39. V. Mamleev, S. Bourbigot, M. Le Bras and J. Yvon, Journal of Analytical
and Applied Pyrolysis, 2009, 84, 1-17.
40. G. Ponder, G. Richards and T. Stevenson, Journal of Analytical and Applied
Pyrolysis, 1992, 22, 217-229.
41. P. C. A. Bergman, M. J. Prins, A. R. Boersma, K. J. Ptasinski, J. H. A. Kiel
and F. J. J. G. Janssen, Torrefaction for entrained-flow gasification of
biomass, Energy research Centre of the Netherlands: Biomass, 2005.
42. J. H. A. Kiel, IEA Bioenergy Task 32 workshop “Fuel storage, handling and
preparation and system analysis for biomass combustion technologies”,
Berlin, 7 May 2007.
43. K. Bilba and A. Ouensanga, Journal of Analytical and Applied Pyrolysis,
1996, 38, 61-73.

Chapter 2: Microwave treatment of biomass components
68

Chapter 3: Production of char through
microwave treatment of biomass
Publications:
Lanigan, B.; Budarin, V.; Clark, J.; Shuttleworth, P.; Deswarte, F.; Wilson A.,
Microwave processing as a green and energy efficient technology for the
production of energy and chemicals from biomass and energy crops. Aspects of
Applied Biology 2008, 90, 277-282.

Chapter 3: Production of char through microwave treatment of biomass
70
3.1 Introduction
The word “biomass” is used to refer to a diverse group of resources including
various natural and processed materials such as wood, wood waste, agricultural and
industrial residues, municipal waste, herbaceous species, food waste and aquatic
plants. Biomass has been used for centuries to produce the energy needed to
survive, as a source of heat, light and in more recent times as a raw material for
electricity production; its direct combustion has played a vital role in the
development of society.1 There is now a move away from direct combustion of
biomass due to issues relating to high water content, inefficient combustion and
difficult material handling (Sections 1.7 & 1.8). As a result, methods to improve its
fuel properties are subject to widespread research. This chapter will focus on
applying the knowledge gained from the work described in Chapter 2 on individual
biomass components (i.e. cellulose, hemicellulose and lignin) to whole biomass.
The aim is to produce a high quality char suitable to replace coal in fossil fuel
burning power plants and will be compared to traditional torrefaction processes. By
focusing on non-food materials, the “food versus fuel” debate is avoided and the
potential to produce fuels from biomass without affecting food supplies is
demonstrated.
3.2 Process development
Biomass chars were prepared on two different scales. Firstly small scale
experiments (< 1 g biomass) were carried out using a mono-mode CEM Discovery
laboratory microwave as described in Experimental section 7.2.2. Temperature
measurements in this apparatus were found to be unreliable when using larger
masses due to poor mixing, although the small scale did allow for easy measurement
of mass loss which was monitored in proportion to calorific value. Larger scale
experiments (10 – 200 g) were carried out using a multi-mode Milestone SPMR
(Solid Phase Microwave Reactor) fitted with a VAC2000 vacuum module in series

Chapter 3: Production of char through microwave treatment of biomass
71
(Experimental section 7.2.5). This system rotates the sample within the microwave
chamber during treatment resulting in an improved interaction between the
microwave energy and the sample and, therefore more accurate overall temperature
reading. These measurements were used to study the relationship between increases
in calorific value, processing temperature and/or microwave residence time.
Conventional chars were produced through slow pyrolysis of biomass as outlined in
Experimental section 7.2.3. Calorific value was measured following the method
outlined in Experimental section 7.3.1, which was verified by analysis at external
facilities. The method was found to work well for samples which could be ground to
a small (< 250 µm) particle size. Some issues arose with regard to accuracy of the
measurements due to error between repeat measurements, for samples of larger
particle sizes. The use of larger sets of repeats did not improve the precision.
Therefore the method was used to determine trends, and produce relative values
rather than as an absolute measurement of calorific value of whole biomass.
3.3 Biomass for energy production
More than 10,000 times the current annual global energy consumption reaches the
Earth’s surface every year in the form of solar radiation. About 0.2 % of it (i.e. 20
times global energy consumption) is fixed by plant life, providing a potential source
of energy.2 As such, producing energy from biomass is generally seen as one of the
important components in meeting EU targets for reducing CO2 emissions and
increasing the use of renewable energy. The opportunity exists for increased
exploitation of biomass for energy but a process must be established which is
economic, energetically efficient and environmentally sustainable.
This chapter describes the processing of biomass from three different sources, a
dedicated energy crop, agricultural waste and industrial food waste. These three

Chapter 3: Production of char through microwave treatment of biomass
72
streams were chosen to investigate the versatility of microwave processing for the
production of fuels from biomass.
3.3.1 Dedicated energy crop: Miscanthus x giganteus
An ideal dedicated biomass crop should provide high-energy output for little energy
and agricultural input. It must be capable of producing large yields of biomass over
relatively short periods of time, while, in order to be environmentally viable, grow
on poor or difficult land with minimal labour and chemical inputs.3 A wide variety
of crops are under consideration for use in biofuel applications, the best known of
which are probably miscanthus, willow and rape seed. The choice of crop depends
on the growth conditions of the area and the expected requirements of the end user.
Miscanthus × giganteus (miscanthus) is a perennial rhizomatous grass, with a C4
photosynthetic pathway allowing for particularly efficient use of water, nutrients and
solar energy.4 Perennial rhizome crops also allow cycling of nutrients between the
portions of the plant which are above and below ground, reducing the need for
fertiliser. If harvested at the correct time, the material is low in inorganic mineral
content making it ideal for fuel use. Environmental impact of the initial planting is
also minimised as annual re-growth means it is spread over several years of fruitful
harvest.4
Miscanthus grows as an erect stem, with little side branching. Under European
growing conditions, the vigorous growth can amount to 2 m in the first year and up
to 4 m in subsequent years (Figure 3.1).5 It is suitable for cultivation in the UK, with
yields of up to 18.7 t ha−1
reported under good conditions.6

Chapter 3: Production of char through microwave treatment of biomass
73
Fig. 3.1: Harvesting of Miscanthus × giganteus which grows as a tall upright crop
Along with being used as an energy crop, it has been shown to be useful in terms of
carbon sequestration ability along with soil quality improvement, and providing
cover for wildlife. It is also a sterile hybrid species meaning it is incapable of
spreading wildly, preventing its invasion into established ecosystems.4 Miscanthus
is already being adopted in the UK as a future energy crop; planting rose from 3,356
ha in 2006 to over 12,000 ha to be planted from 20077, therefore any process for
treatment of biomass should be applicable to this feedstock.
3.3.2 Agricultural residue: Wheat straw
Agricultural plants such as cereals are grown worldwide for the grain, leaving the
straw residues as a low value side product. UK straw yields were estimated at 11.9
million tonnes in 2007, 54 % coming from wheat, followed by oilseed rape (21 %),
barley (20 %), oats (4 %), other cereals (1 %) and linseed (0.1 %). Straw is used in
various agricultural roles and is already used for energy production, but
approximately 2.5 million tonnes remains available for use (Figure 3.2).8 While a
portion of this is left in the field to maintain soil nutrient levels, there remains a
potential source of income for the rural economy if value can be added to make it
cost effective to process the straw for use.

Chapter 3: Production of char through microwave treatment of biomass
74
Figure 3.2: Uses of straw in the UK8
3.3.3 Industrial food waste: Cocoa husk
Research by the Waste & Resources Action Programme (WRAP) has revealed that
6.7 million tonnes of food is thrown away by UK consumers each year, contributing
to environmental problems associated with the disposal of organic waste.9 While it
is vital that consumer attitudes change to reduce the level of fresh food being
wasted, applications should be developed to find use for the unavoidable waste.
Cocoa husk (Figure 3.3) was chosen as the focus food waste in this study as it is
available as waste from local chocolate processing facilities in high volumes.10
Fig 3.3: Cocoa husk sourced from Nestlé UK
Cocoa is a major agricultural product in parts of Africa and the neotropics, from
where it is exported globally for chocolate production. Approximately 10 % by
weight of this cocoa is made up of the commercially valuable beans, the rest finds
use as low value animal feed or garden mulch. 11
Given that global production of
cocoa beans in 2008 was 4.3 million tonnes, approximately 43 million tonnes of
waste are available for potential transformation into higher value products.12

Chapter 3: Production of char through microwave treatment of biomass
75
Research is currently being carried out into the industrial scale production of pectins
from cocoa hulls.11
This development would boost development in the countries of
production but is not likely to be applied on site at the numerous chocolate
processing plants around the globe who handle residual husk wastes transported with
the beans. Direct use of the husks as a fuel faces problems due to the waxy surface
of the material making it difficult to grind or mill. Thermal transformation of this
product into an improved fuel, through a flexible and efficient process, may offer
them a suitable alternative to current waste disposal.
3.4 Bio-char formation
3.4.1 Properties of unprocessed biomass
Following the procedures outlined in Chapter 7.3.8, the biomass was characterised in
terms of cell wall components (total cellulose, hemicellulose and lignin), extractable
fractions and inorganic composition (Figure 3.4). Three forms of wheat straw were
studied to determine influence of further parameters on behaviour of biomass during
biomass processing.
Fig 3.4: Composition of biomass samples (based on oven dried weight)
Cocoa husk showed a significantly different composition in comparison to the other
biomass types studied. It has much higher levels of non cell wall components (likely

Chapter 3: Production of char through microwave treatment of biomass
76
to include fats from cocoa bean) and low amounts of silica, along with significant
amounts of potassium and magnesium.
It can also been seen that composition varies within species. While the level of cell
wall components is relatively similar, the three wheat straw samples have differing
levels of inorganic components.
Inorganic species are known to play a catalytic role in the thermal decomposition of
biomass therefore it is vital to know the ratios present in order to understand
processes occurring during the pyrolysis of biomass.13-18
3.4.2 Bio-char from Miscanthus
Following the procedure detailed in Experimental section 7.2.5, miscanthus was
exposed to microwave irradiation using a Milestone SPMR (Solid Phase Microwave
Reactor) fitted with a VAC2000 vacuum module in series. For purpose of
comparison, all chars were prepared by exposing the sample to a constant maximum
power setting of 1200 W for a designated amount of time. The temperature was
monitored but not controlled as the rate of heating is related to the dielectric
properties of the processed material and therefore varies between biomass types.
Char prepared at 160 oC (Figure 3.5) after 30 minutes at 1200 W resulted in a 90 %
increase in the calorific value of the material. As the temperature stabilised between
150 and 160 oC, the calorific value was also seen to stabilise suggesting the
temperature may have a more significant effect on the increased calorific value than
microwave residence time. This point was reinforced by comparison with a low
power experiment. Char was prepared by using microwave power set at 800 W.
This lower input of microwave energy resulted in a slower heating rate reaching a
maximum temperature of 125 oC after 25 min, 27
oC less than that achieved using
1200 W. Temperature was seen to be the major influence on the final properties of

Chapter 3: Production of char through microwave treatment of biomass
77
the char, with the char produced at 125 oC being similar to that produced in the same
temperature range in the presence of higher microwave energy (Figure 3.5A).
Fig. 3.5: Preparation of miscanthus chars A: under microwave conditions at 1200 W
and 800W, B: comparison of chars prepared under microwave (1200 W) and
conventional conditions
Following the method established for cellulose and hemicellulose (Chapter 2), the
increased char calorific value was studied in comparison with chars prepared under
conventional pyrolysis conditions (Figure 3.5B). At the maximum temperature
achievable under microwave conditions, the calorific value of the miscanthus char is
equivalent to that produced at temperatures 150 oC higher under conventional
conditions, offering potential energy savings and better economics.
3.4.3 Bio-char from wheat straw
Wheat straw chars were prepared from wheat straw samples from 2007 and 2008,
and wheat straw pellets. The effect of compositional variations within the same
biomass type and also the influence of bulk density were investigated.
Firstly, chars were prepared from the two samples of loose wheat straw from 2007
(WS 07) and 2008 (WS 08). Figure 3.4 shows the compositional variations between
the two samples. The most significant variation is in the potassium content, which is
20 % higher for WS 07 than WS 08. Chars were also prepared from commercially
available wheat straw pellets to study the effect of sample density on the process.

Chapter 3: Production of char through microwave treatment of biomass
78
Between the two loose straw samples, WS 07 heated marginally faster, reaching a
final temperature of approximately 10 oC higher some 700 s sooner than WS 08
(Figure 3.6A). The heating profile for the pellets is further accelerated due to the
dense structure of the material. As can be seen in Figure 3.6B, the pellets heated
extremely quickly, 0.6 oC s
-1, until reaching the system maximum of 200
oC
Fig. 3.6: Preparation of wheat straw chars under microwave conditions A) WS 07
and WS 08 B) WS 07 and pellets
Inorganic species in biomass have important influences on the thermal degradation
of biomass. Potassium in particular has been cited as playing an important role in
terms of rate and product yield during thermochemical breakdown of biomass,
although the influence is not fully understood.13, 15 As a result, the transformation
and release of potassium during pyrolysis has been subject to study. There appears
to be agreement in the literature as to the lowering of activation energies and
increasing char yields due to the release of potassium during decomposition of the
organic matrix. Under conventional conditions, a fraction of the potassium is
released between 200 - 400 oC and thought to be re-deposited as discrete particles of
KCl or dispersed in the char matrix. The effect of potassium can result in lowering
the average activation energy for pyrolysis by up to 50 kJ/mol, and shift the
temperature of peak conversion of lignin by 70 oC. The catalytic role of potassium
in char formation and combustion experiments has been observed for wheat straw,
therefore the above results for WS 07 and WS 08 are in agreement with reported
behaviour. 13-15, 19

Chapter 3: Production of char through microwave treatment of biomass
79
By pelletising the biomass before microwave treatment the transfer of heat within
the sample is maximised due to the increased surface contact within the sample.
This results in a faster rate of heating and producing a higher calorific value char
over a shorter period of time (Figure 3.6 B). Despite having low potassium content
more similar to WS 08, the pellets yield a higher calorific value char than WS 07 for
the same energy input. This suggests that peletisation might have a much greater
influence than inorganic content in terms of maximising the output of the microwave
process.
Figure 3.7 compares the microwave and thermal treatment of WS 07 and WS 08.
WS 07 resulted in a char with a calorific value of 21.6 kJg-1
– at a temperature some
160 oC lower than under conventional conditions. In the case of WS 08, this margin
is less but still significant with a difference close to 100 oC between the preparation
temperatures of chars of similar calorific value.
Fig. 3.7: Preparation of wheat straw chars under microwave conditions (A: WS 07,
C: WS 08). Comparison of chars prepared under microwave and conventional
thermal conditions (B: WS 07, D: WS 08)

Chapter 3: Production of char through microwave treatment of biomass
80
3.4.4 Bio-char from cocoa husk
As cocoa husk acts as a protective outer coating for the cocoa bean, it is higher in
lignin than wheat straw or miscanthus. As demonstrated in Chapter 2.6, the
interaction of lignin with microwave irradiation is poorer than that of other cell wall
components. As a result, the cocoa husk samples reached a maximum temperature of
just over 140 oC under the standard microwave processing conditions (Figure 3.8 A).
Fig. 3.8: A) Preparation of cocoa husk chars under microwave conditions. B)
Comparison of chars prepared under microwave and conventional conditions
Nonetheless, microwave treatment resulted in a greater increase in the calorific value
of the husk than conventional treatment at the same temperature. In fact, the
difference between microwave and conventional char is greatest for cocoa husk of
the three feedstocks. This shows that microwave treatment is an effective method of
increasing the calorific value of a variety of feedstocks.
3.5 Characterisation of bio-char
The chars and starting materials were studied using FT-IR to identify structural
changes occurring during the char formation. Table 3.1 shows the assignment of
peaks present in biomass correlated to characteristic peaks of structural components.

Chapter 3: Production of char through microwave treatment of biomass
81
Table 3.1: IR assignment of biomass 20, 21
Wavenumber
(cm-1
)
Assignment Corresponding structures Carbo-
hydrate
Lignin
3200–3700 O–H stretching Hydroxyl * *
2800–3000 C–H stretching Aliphatic structures * *
1650–1770 C=O stretching Carbonyl * *
1610–1680 C=C stretching Olefinic structures *
1450–1600 C=C stretching Aromatic structures *
1420–1480 C–H bending Aliphatic structures * *
1400–1430 O–H and C–H
bending
Hydroxyl, acid, phenol,
olefins and methyl *
1200–1300 C–O stretching Unsaturated ethers * *
1000–1200 C–H out-of-plane
bending Aromatic structures * *
1000–1160 C–O stretching Saturated ethers * *
1050–1160 C–O stretching Tertiary hydroxyl * *
1070–1120 C–O stretching Secondary hydroxyl * *
1000–1060 C–O stretching Primary hydroxyl * *
625–1000 C–H out-of-plane
bending
Olefinic and aromatic
structures * *
3.5.1 Miscanthus char
Figure 3.9 shows infrared spectra for chars prepared from miscanthus under both
conventional and microwave conditions. Conventional char prepared at 640 oC
shows significant changes between 3500 cm-1
and 1600 cm-1
as a result of
carbohydrate degradation. Remaining peaks between 1600 cm-1
and 1000 cm-1
are
due to residual lignin and the rearranged carbon skeleton of the high calorific value
char. The new peak at 1428 cm-1
corresponds to C=C skeletal stretches in a
condensed aromatic system, indicating increased aromatisation of the sample. In

Chapter 3: Production of char through microwave treatment of biomass
82
addition, two new peaks are also found at 880 cm-1
and 821 cm-1
consistent with
aromatic C-H out of plane bending vibrations.22
Fig. 3.9: FTIR spectra of miscanthus and chars prepared through microwave and
conventional pyrolysis
The conventional char prepared at 150 oC shows little sign of degradation, in
contrast to microwave char prepared at a similar temperature. It is clear from the
infra-red spectra, that the microwave treatment resulted primarily in the breakdown
of the carbohydrate components as peaks at 2928 cm-1
and 2855 cm-1
(C-H
stretching) reduce along with O-H and C-H bending signals in the region of 1400

Chapter 3: Production of char through microwave treatment of biomass
83
cm-1
and C-O at 1060 cm-1
. The lignin peaks at 1678 cm-1
and 1573 cm-1
appear
relatively unaffected, rising in intensity as the neighbouring carbohydrate peaks
decrease.
Under these conditions, microwave heating does not result in the total carbonisation
of miscanthus but it does illustrate the increased capacity of microwave heating to
produce a more charred product at lower temperatures.
3.5.2 Wheat straw char
The infra-red spectra of wheat straw and its chars show significant differences to
miscanthus (Figure 3.10)
Fig. 3.10: FTIR spectra of wheat straw samples (WS 07 and WS 08) and chars
prepared through microwave and conventional pyrolysis

Chapter 3: Production of char through microwave treatment of biomass
84
Wheat straw is known to be slightly lower in lignin than miscanthus (on average 18
% as opposed to 23 % 23, 24
) therefore the signals in the infra-red spectrum associated
with lignin are of lower relative intensity.
In WS 07, the conventional char prepared at 640 oC shows the same general
properties as the high temperature miscanthus char. The broad peak between 1272
cm-1
and 1070 cm-1
, along with the peaks at 877 cm-1
, 824 cm-1
and 757 cm-1
,
correlate to aromatic C-H stretching indicating a largely aromatic structure.
Both the microwave char (170 oC) and the conventional char prepared at 164
oC,
show breakdown of carbohydrate structure as the hydroxyl stretching vibration at
3359 cm-1
diminishes with treatment. The reduction of the aliphatic C-H stretching
peaks at 2926 cm-1
and 2863 cm-1
also indicate decreasing aliphaticity. While the
carbonyl stretching signal at 1730 cm-1 shifts significantly in the microwave and
conventional chars, it completely disappears from the high temperature char. This
suggests that the microwave char is further decomposed than that prepared at a
similar temperature under conventional conditions. The microwave char also shows
more significant levels of aromaticity with the growing peak at 1160 cm-1
.
WS 08 is broadly similar but decomposition of the carbohydrate structure is less at
low temperature. This can be assumed to be as a result of the lower potassium
content, resulting in an uncatalysed degradation mechanism limiting the extent of
degradation of the cell components in the biomass.
3.5.3 Cocoa husk char
While cocoa husk has higher lignin content than wheat straw the char formation
mechanism is similar to that of WS 07 (Figure 3.4). It has been found that mineral
content has a dominant effect on pyrolysis rather than lignin.17
Therefore these
similarities can be attributed to the high potassium content of cocoa husk (Figure
3.4). The microwave char (135 oC) shows greater signs of carbohydrate

Chapter 3: Production of char through microwave treatment of biomass
85
decomposition than the conventional char prepared at 150 oC (Figure 3.11). The
hydroxyl stretching vibration at 3299 cm-1
remains in the conventional char, while it
seen as a shoulder in the microwave char.
Fig. 3.11: FTIR spectra of cocoa husk and chars prepared through microwave and
conventional pyrolysis
The microwave char also shows significantly greater reduction of the aliphatic C-H
stretching peaks at 2926 cm-1 and 2855 cm-1. The carbonyl stretch at 1689 cm-1
again shows greater reduction in the microwave char over the conventional char.
Both chars show a relative increase in the level of olefinic C=C bonds as the signal
at 1596 cm-1
develops. The most significant difference is at 1060 cm-1
; the C-O
stretch has all but gone from the microwave char while it is largely unchanged in the

Chapter 3: Production of char through microwave treatment of biomass
86
conventional char. The conventional char prepared at 640 oC shows the same broad
properties as the high temperature chars of the other biomass species. The peaks at
877 cm-1
, 828 cm-1
and 765 cm-1
, correlate to aromatic C-H stretching, while the
peak at 1398 cm-1
indicates the presence of remaining O-H.
3.6 Fuel Properties
Elemental analysis was used to determine the suitability of the biomass chars as
fuels. As discussed in Chapter 2 (section 2.4.4), the properties of fuels are often
compared in terms of their O/C and H/C ratios in a Van Krevelen diagram. The
lower the respective ratios the greater the energy content of the material.25
Figure
3.12 shows the Van Krevelan diagram for the best chars produced via microwave
and conventional thermal treatment.
Fig 3.12: Van Krevelen diagram representing elemental composition of biomass
chars (see Appendix 1 for complete elemental analysis)
It is clear from the diagram that the extreme heating conditions afforded by
conventional treatment produce a char more suitable for fuel use, but it is vital that
this data be viewed in context. While thermal treatment increases the calorific value
of biomass, there is an inherent loss in mass as a result of the removal of moisture

Chapter 3: Production of char through microwave treatment of biomass
87
and volatile components. This loss must be balanced against the increasing calorific
value of the product. Table 3.2 shows the correlation between increasing calorific
value and decreasing char yields as represented by the energy yield.
Table 3.2: Calorific value of char relative to yield
Prepara-
tion
Temp
(oC)
Calorifi
c value
(kJ/g)
Char
yield
(%)
Energy
yield
(kJ/g)
Prepara-
tion
Temp
(oC)
Calorifi
c value
(kJ/g)
Char
yield
(%)
Energy
yield(kJ
/g)
Miscanthus:
Starting material: 12.96 kJ/g
Microwave char: Conventional char:
150 22.08 83.89 18.52 150 17.47 88.28 15.42
220 29.78 59.42 17.70 240 22.25 80.23 17.85
170 27.06 58.14 15.73 380 27.16 39.19 10.64
190 25.99 56.79 14.76 500 34.21 32.46 11.10
Wheat Straw:
Starting material: 14.95 kJ/g
Microwave char: Conventional
char:
150 19.63 88.20 17.31 150 17.31 93.31 16.15
220 27.59 63.91 17.63 380 21.62 37.22 8.05
640 29.45 28.39 8.36
Cocoa husk:
Starting material: 13.24 kJ/g
Microwave char: Conventional char:
170 20.115 73.04 14.69 150 15.67 89.67 14.05
190 31.7 72.66 23.03 240 20.10 73.26 14.73
150 28.44 68.87 19.58 500 34.21 35.6 12.21
220 28.82 67.30 19.40 640 31.39 32.49 10.20

Chapter 3: Production of char through microwave treatment of biomass
88
It can be seen that high calorific value chars give a lower energy yield (per gram of
starting material) than the original biomass due to significant mass losses.
Assuming that the char is the sole product of this process (not utilising gaseous or
liquid co-products), the final high calorific value of the product does not necessarily
warrant the energy spent in producing it. Therefore, while conventional chars have
better fuel properties than the microwave chars (Figure 3.12), the mass loss involved
in further increasing the calorific value is greater, making the overall balance more
favourable for microwave chars.
Along with increased energy density, char formation improves the material handling
properties of biomass. Figure 3.13 shows unprocessed cocoa husk and char, both of
which were stored in similar conditions for over a month. It is clear that the
unprocessed cocoa husk has suffered as a result of the storage showing signs of
growth of mould and as such may no longer be suitable for use, while the char
remains in good condition and is of higher calorific value. The char is also easily
ground into small particles (< 250 µm) making it ideal for burning in conventional
firing systems.
Figure 3.13: Effect of storage on unprocessed cocoa husk and cocoa husk char
3.7 Conclusions & Future Work
In Chapter 2, it was shown that the microwave treatment of cell wall components
can result in pyrolytic processes occurring at operating temperatures up to 150 oC

Chapter 3: Production of char through microwave treatment of biomass
89
lower than those required under conventional processing conditions. It has now
been shown that microwave processing can be used to treat whole biomass to
produce significant yields of increased calorific value chars at low temperatures. In
agreement with the results reported for biomass components, temperature savings of
up to 180 oC were possible when producing chars via microwave processing rather
than conventional slow pyrolysis. The application of this technology has the
potential to support transition to sustainable energy production with minimal
alteration of current fuel burning systems. The success of these laboratory results
led to scale up trials, which enabled further proof of the concept and its applicability
(Chapter 5.2). Following on from this work, methods to further improve the fuel
quality, such as reduction of ash levels require investigation. Mechanistic studies
should also be carried out in order to establish better understanding of processing
occur during microwave treatment of biomass.
Up to this point, energy savings have been assumed due to the increased efficiency
of lower operating temperatures, but a detailed study is necessary to ensure
microwave processing of biomass does in fact offer improved energy efficiency over
conventional processing. To this end, further potential energy outputs of the
microwave processing of biomass were investigated. It has been found to be
possible to produce a pyrolysis type bio-oil as a co-product as part of the char
formation process (Chapter 4). This energy output will be discussed along with that
of the char when constructing the overall energy balance of the system (Chapter 6).

Chapter 3: Production of char through microwave treatment of biomass
90
3.8 References
1. S. Yaman, Energy Conversion and Management, 2004, 45, 651-671.
2. R. E. H. Sims, R.N. Schock, A. Adegbululgbe, J. Fenhann, I.
Konstantinaviciute, W. Moomaw, H.B. Nimir, B. Schlamadinger, J. Torres-
Martínez, C. Turner, Y. Uchiyama, S.J.V. Vuori, N. Wamukonya and X.
Zhang, Chapter 4: Energy in Climate Change 2007: Mitigation.
Contribution of Working Group III to the Fourth Assessment Report of the
Intergovernmental Panel on Climate Change, 2007.
3. L. D. Gomez, C. G. Steele-King and S. J. McQueen-Mason, New
Phytologist, 2008, 178, 473-485.
4. E. Heaton, T. Voigt and S. P. Long, Biomass and Bioenergy, 2004, 27, 21-
30.
5. N. El Bassam, Energy plant species: their use and impact on environment
and development, Earthscan/James & James, 1998.
6. J. C. Clifton-Brown, I. Lewandowski, B. Andersson, G. Basch, D. G.
Christian, J. B. Kjeldsen, U. Jorgensen, J. V. Mortensen, A. B. Riche, K.-U.
Schwarz, K. Tayebi and F. Teixeira, Agron J, 2001, 93, 1013-1019.
7. Department for Environment Food and Rural Affairs, Creating value from
renewable materials: a strategy for non-food crops and uses—two year
progress report., 2006.
8. J. Copeland and D. Turley, National and regional supply/demand balance
for agricultural straw in Great Britain, Agri-Environment and Land Use
Strategy Team, Central Science Laboratory, 2008.
9. D. Johnson, N. Hipps and S. Hails, Helping Consumers Reduce Fruit and
Vegetable Waste: Final Report, Waste & Resources Action Programme
2008.
10. Nestle UK
http://www.nestle.co.uk/AboutNestle/Nestl%C3%A9Locations.htm
Accessed: 15.03.10.
11. H. Barazarte, E. Sangronis and E. Unai, Archivos Latinoamericanos de
Nutricion, 2008, 58, 64.
12. Food and Agriculture Organisation of the United Nations
http://faostat.fao.org/ Accessed: 15.03.10.
13. D. J. Nowakowski and J. M. Jones, Journal of Analytical and Applied
Pyrolysis, 2008, 83, 12-25.
14. P. R. Patwardhan, J. A. Satrio, R. C. Brown and B. H. Shanks, Bioresource
Technology, 2010, 101, 4646-4655.
15. A. Jensen, K. Dam-Johansen, M. A. Wojtowicz and M. A. Serio, Energy &
Fuels, 1998, 12, 929-938.
16. J. M. Encinar, F. J. Beltran, A. Ramiro and J. F. Gonzalez, Industrial &
Engineering Chemistry Research, 1997, 36, 4176-4183.
17. R. Fahmi, A. V. Bridgwater, L. I. Darvell, J. M. Jones, N. Yates, S. Thain
and I. S. Donnison, Fuel, 2007, 86, 1560-1569.

Chapter 3: Production of char through microwave treatment of biomass
91
18. T. Hosoya, H. Kawamoto and S. Saka, Journal of Wood Science, 2007, 53,
351-357.
19. D. J. Nowakowski, J. M. Jones, R. M. D. Brydson and A. B. Ross, Fuel,
2007, 86, 2389-2402.
20. K. Bilba and A. Ouensanga, Journal of Analytical and Applied Pyrolysis,
1996, 38, 61-73.
21. P. Fu, S. Hu, L. Sun, J. Xiang, T. Yang, A. Zhang and J. Zhang, Bioresource
Technology, 2009, 100, 4877-4883.
22. A.-N. A. El-Hendawy, Journal of Analytical and Applied Pyrolysis, 2006,
75, 159-166.
23. A. Demirbas, Progress in Energy and Combustion Science, 2004, 30, 219-
230.
24. S. Collura, B. Azambre, G. Finqueneisel, T. Zimny and J. V. Weber,
Environ. Chem. Lett. , 2006, 4, 75-78.
25. S. A. Visser, Environmental Science & Technology, 1983, 17, 412-417.

Chapter 3: Production of char through microwave treatment of biomass
92

Chapter 4: Production of bio-oil through
microwave treatment of biomass
Publications: Budarin, V. L.; Clark, J. H.; Lanigan, B. A.; Shuttleworth, P.; Breeden, S. W.;
Wilson, A. J.; Macquarrie, D. J.; Milkowski, K.; Jones, J.; Bridgeman, T.; Ross,
A., The preparation of high-grade bio-oils through the controlled, low temperature
microwave activation of wheat straw. Bioresource Technology 2009, 100 (23),
6064-6068.
Chapter 4: Production of bio-oil through microwave treatment of biomass
94
4.1 Introduction
In 2008, petroleum derived fuels accounted for 98 % of transportation fuels. The
associated carbon emissions and market insecurities bolstered interest in liquid
biofuels. First generation biofuels, based on food crops, such as maize, have come
under much negative attention due to the food versus fuel debate along with the high
resource demand in the crop production. As a result, interest has grown in the
production of second generation biofuels, i.e. those produced from lignocellulosic
biomass.1
Chemical methods for production of biofuels are generally divided into biochemical
and thermochemical processes.
Biochemical processing involves the conversion of biomass to fermentable sugars
for the production of specific alcohols, such as ethanol and butanol. While the
process has already been established for first generation biofuels, further progress is
necessary to optimise biochemical transformation of cellulosic components of
biomass.1 The conversion also tends to be slow, requiring batch-wise
manufacturing, and can only be used to convert polysaccharide components of
biomass.
Thermochemical processing produces a range of products through the thermal decay
and chemical reformation of biomass under differing concentrations of oxygen. In
this way, it is possible to maximise on the fuel and chemical potential of biomass by
acting on all components. Pyrolysis is a medium temperature thermochemical
process (typically 350-500 oC) focusing on the liquefaction of biomass. Bio-oil
produced from pyrolysis has potential applications as a hydrocarbon fuel, but faces
challenges in fuel applications due to unfavourable properties such as high acidity
and high water and alkali metal contents.2 Therefore, there is a need to optimise a
process for production of bio-oil with more favourable properties.

Chapter 4: Production of bio-oil through microwave treatment of biomass
95
The use of microwave energy to activate biomass dates back to the 1970s.3
Microwave treatment of biomass for the production of chemicals, in particular
levoglucosan, has been reported.4, 5
Thermochemical microwave treatment of
biomass has also been investigated for fuel production. Both gasification and
pyrolysis under microwave conditions have been reported at operating temperatures
above 300 oC.6-8
Following on from the results of the work reported in Chapters 2
and 3, here will be reported for the first time the possibility to produce bio-oils
through microwave processing of biomass below 200 oC. By maintaining low
temperatures, it has been shown that decomposition of the biomass is more
controlled resulting in a bio-oil with improved fuel properties relative to fast
pyrolysis bio-oil.9
4.2 Bio-oil from the microwave treatment of biomass
The widespread application of bio-oil as a fuel is dependent on its physical
properties such as ash and alkali content, heating value and viscosity. Ash present in
bio-oil can reduce the protective oxide surface of the engine, a process which may
be accelerated by alkali metal sulfates and chlorides. The heating value and
viscosity of bio-oil are heavily influenced by water content; therefore by controlling
this it should be possible to improve the quality of the oil. These parameters have
yet to be tuned to a satisfactory level using conventional processes.10
As a result the
application of microwave technology is being investigated due to the increased
control it can offer.
The majority of reported investigations have focused on the microwave pyrolysis of
biomass at temperatures within the standard pyrolysis range (350 – 600 oC). It has
been shown that microwave technology is capable of producing bio-oils of similar or
better properties than fast pyrolysis, but the energy demand associated with
processing at these temperatures is still significant.11-13

Chapter 4: Production of bio-oil through microwave treatment of biomass
96
The optimisation of microwave pyrolysis of cellulose and wood has been
investigated for production of levoglucosan. 4, 5, 14
The influence of parameters such
as power, irradiation time, particle size and biomass source was studied. While
product distribution in terms of water, oil, gas and char were monitored and oil
analysis carried out, the temperature of the process was not directly controlled, and
therefore, appears not to have been recognised for its influence.
Menendez et al8, 15-17
studied the calorific value of microwave pyrolysis products of
biomass processed at temperatures above 500 oC. Microwave energy was used to
pyrolyse sewage sludge at microwave power of 1000 W and a final reaction
temperature of 1000 °C, aiming to optimise the fuel properties of the gas produced.
It was found that microwave pyrolysis produced more gas and less oil than
conventional pyrolysis. Notably, the amount of hydrogen in the gas mixture was
much higher than under conventional conditions, suggesting a different degradation
mechanism during microwave pyrolysis. The calorific values for char, oil and gas
fractions were up to 7, 37 and 10 kJg-1
respectively. In comparison to typical values
for coal, oil and gas with 32, 42 and 14 kJ/kg these values are lower, although, the
highest yielding fraction, gas, compares favourably with the fossil fuel alternative.
Investigations described in this thesis (Chapter 3) showed it is possible to produce
char from microwave treatment of biomass working at temperature between 120 and
300 oC, resulting in a significant saving in energy input. The co-production of an oil
fuel product with char would further add to the value of the process. By operating at
lower temperatures than traditional pyrolysis it should be possible to increase energy
efficiency and process control in order to produce an oil with suitable properties for
preparation of fuel.
4.2.1 Experimental set-up
As described in experimental section 7.2.5, bio-oil was produced by exposing the
biomass sample to microwave irradiation in a Milestone ROTO-SYNTH Rotative
Solid Phase Microwave Reactor (Milestone Srl., Italy) fitted with a VAC 2000

Chapter 4: Production of bio-oil through microwave treatment of biomass
97
vacuum module in series (Figure 4.1). The maximum operating temperature was
200 oC.
As the biomass was heated within the rotating vessel in the microwave chamber, two
liquid fractions were seen to be produced. Firstly, an aqueous fraction was evolved
and collected at the water cooled condenser. Secondly, a dark pyrolysis-type bio-oil
was evolved and collected separately in the pressurised condenser chamber.
Remarkably, due to the nature of the process the bio-oil could be kept almost free of
the water.
Fig. 4.1: Process for production of microwave bio-oil
Bio-oils were produced from several different types of biomass including wheat
straw, miscanthus, cocoa husk, spruce wood and rolled oats. For the purpose of this
thesis, the oils produced from the processing of wheat straw have been chosen as the
main focus due to the availability of this feedstock in the UK and the ability to reach
higher temperatures when processing pellets.
4.2.2 Microwave treatment of wheat straw for production of bio-oil 18
Wheat straw pellets were exposed to microwave irradiation in the rotating reactor
vessel of the Milestone SMPR. As can be seen from Figure 4.2, changes in the

Chapter 4: Production of bio-oil through microwave treatment of biomass
98
process pressure give clear indications of the release of volatile components from the
biomass. Similar to the results presented in section 2.4.2, between 60-120 oC, an
aqueous fraction is produced with a relatively high acid content (low pH) over a
period of 5-10 minutes. Subsequently, while maintaining a relatively low
temperature, an organic fraction of low water and low acid content is produced over
a period of 1-2 minutes. As a result it is possible to collect two discrete liquid
fractions through this in-situ separation process. As will be discussed in section
4.2.3, the second fraction was analysed in terms of water content, acidity,
composition and calorific value (Experimental sections 7.3.11-14, 7.3.5, 7.3.1) to
establish its suitability for use as a fuel. As discussed in Chapter 3, the sample
could then be heated to higher temperatures to improve char properties but this was
found not to impact on liquid yields or properties as no further liquid is evolved after
the second peak.
Fig. 4.2: Evolution of fractions during microwave treatment of wheat straw
4.2.3 Properties of wheat straw bio-oil
Bio-oil produced through the microwave treatment of wheat straw was compared to
conventional pyrolysis bio-oil, crude petroleum and other reported microwave bio-
oils (Table 4.1). It can be seen that the properties of the wheat straw bio-oil
compares favourably to the typical properties of conventional pyrolysis bio-oils with

Chapter 4: Production of bio-oil through microwave treatment of biomass
99
comparable elemental composition. However, due to the in-situ separation of
aqueous components the major impurities (sulfur, alkali metals and acids) are
condensed in the aqueous fraction. This significant shift results in the levels of these
being lowered substantially in the organic fraction of the microwave oils, making
microwave bio-oil more suitable for upgrading for fuel use.19
Table 4.1: Comparison of key properties of crude petroleum and bio-oils produced
from the conventional pyrolysis and microwave activation of biomass
Property
Crude
petroleum19
aConventional
wheat straw
pyrolysis oil20-22
Microwave oil production
bCoffee
hull8
Corn
stover7
Wheat
straw
Yield (wt %) - 41-51 7.9 30.16 21±2.3
Water (%) <1 20-50 <1 15.2 <1
C (wt %) 85-87 43-55 67.3 60.1 58.9±0.2
H (wt %) 10-14 6.6-9 2.4 7.70 6.85±0.07
N (wt %) 0.1-2 0.1-1.25 3.1 2.02 1.15±0.01
O (wt %) 0.1-1.5 38-63 6.2 29.4 33.2±0.28
S (wt%) 0 0.1-0.3 0.3 0.15 0.02
Acid number (pH)c <1 (3-4) - (2.87) 1.4
HHV (kJ/g) 42 11-21 24.3 17.5 19.01±2.7
a oils produced between 500 to 530 oC b contains ~ 20 % ash
c values given in brackets refer to pH. Low acid number indicates low
concentrations of both organic and inorganic acids in the oil, i.e. pH value close to 7
As microwave pyrolysis is a relatively new field, there is little data available for
comparison in terms of properties. Yu et al.7 reported production of bio-oil from
corn stover with higher carbon and lower oxygen content than that produced under
conventional conditions (54 % and 38 % respectively). The higher oxygen to carbon
ratio (O/C) improves fuel properties although this improved quality came with a
reduced yield relative to conventional pyrolysis which produced up to 70 % oil
(including 15 % water).23
Conventional pyrolysis of coffee hulls under conditions
similar to those of the microwave pyrolysis showed little difference in the properties

Chapter 4: Production of bio-oil through microwave treatment of biomass
100
of the bio-oil.8 As such, microwave pyrolysis was shown to be comparable to
conventional pyrolysis; further optimisation of this process could possibly improve
the microwave processing performance.
4.2.4 Composition of wheat straw microwave bio-oil
FTIR characterisation was used to determine groups present in the crude wheat straw
microwave bio-oil (Figure 4.3 A). O–H stretching vibrations indicate the presence of
phenols, alcohols or residual water. Symmetrical and asymmetrical C–H stretching
vibrations at 2931 and 2959 cm−1
, together with C–H deformation vibrations around
1457 cm−1
correlate to the presence of alkane components. This is backed up by CH3
bending vibrations at 1363 cm−1
and 1457 cm−1
. Skeletal vibrations in aromatic
rings would be expected between 1500 and 1450 cm−1, meaning overlapping peaks
are probable. The C=O stretching vibration at 1712 cm−1
may correspond to ketone,
aldehyde or carboxylic acid groups present within the complex mixture. C=C
stretching bands can be seen around 1609 cm−1
indicating the presence of alkenes
and aromatics. Weak absorbances below 1000 cm−1
may be as a result of some
substituted aromatic groups.24
Fig. 4.3: A: FTIR spectrum and B: GC-MS trace of microwave pyrolysis wheat
straw bio-oil

Chapter 4: Production of bio-oil through microwave treatment of biomass
101
Qualitative GC-MS was carried out on the wheat straw microwave pyrolysis oil
(Figure 4.4 B). Through comparisons with library spectra (National Institute of
Standards and Technology 08 database), approximately 50 % of the total peak area
was accounted for by 10 peaks listed in Table 4.2. While several smaller furans
were present at low levels, substituted phenols accounted for the majority of
components present according to GC-MS. Further characterisation via LC-MS, ICP-
MS, atomic absorption and elemental analysis were attempted but the poor solubility
and viscous nature made these extremely difficult.
Table 4.2: Most significant peaks in GC-MS of microwave wheat straw pyrolysis oil
A separate comparison was carried out between the wheat straw pyrolysis oil
prepared under microwave and conventional conditions (600 oC) (Figure 4.4).
When analysed under identical conditions, conventional pyrolysis oils show the
typical product distribution of a metal (e.g. in situ potassium) catalysed
decomposition of a lignocellulosic biomass via an ionic mechanism (Figure 4.4 A).25
This includes significant levels of furfural, acetic acid, phenols and methoxyphenols

Chapter 4: Production of bio-oil through microwave treatment of biomass
102
but only small quantities of sugars. Furfural and acetic acid were also detected in
the microwave oil, but in much smaller relative amounts; with phenols,
methoxyphenols and their dimers much more dominant. The most notable point of
difference is in the yield of sugars such as levoglucosan and 1,4:3,6-dianhydro-D-
glucopyranose, along with small amounts of long chain acids. The high level of
levoglucosan visible in the microwave oil, has potential as a chemical or bio fuel
intermediates (e.g. levoglucosan to glucose for ethanol26
). Microwave processing
affords milder conditions causing less decomposition and hence a greater amount of
high molecular weight components in the bio-oil.
Figure 4.4: Comparison of GC-MS analysis of conventional (A) and microwave (B)
pyrolysis oil from wheat straw pellets
4.2.5 Influence of additives on microwave bio-oil
As discussed in Chapter 3.4.3, inorganic additives are known to have an effect on
the mechanism of biomass pyrolysis and as a result on the product distribution and
properties. In this chapter, the effect of simple inorganic additives on the microwave

Chapter 4: Production of bio-oil through microwave treatment of biomass
103
bio-oil yield and properties was investigated. Sulfuric acid, hydrochloric acid and
ammonia were chosen as simple inexpensive molecules which could easily be
introduced in low concentrations. An equal concentration of each additive was
mixed with the wheat straw pellets for several minutes and oven dried where
necessary before microwave processing (Experimental section 7.2.6). The product
distribution varied depending on the additive used (Table 4.3). As can be seen,
sulphuric acid caused a significant decrease in the oil yield, to the advantage of char
yield. Interestingly, the same quantity of hydrochloric acid had little effect on the oil
yield, while NH3 resulted in a greater char yield but had little influence on oil yield.
The effect was found to rely on the additive itself, rather than acid/base properties as
might be expected. It was noted that the calorific value of the bio-oil produced in
the presence of additives varied little from that of the standard microwave bio-oil
with all values falling within the error range.
Table 4.3: Mass balance of products from the low temperature microwave activation
of wheat straw pellets including presence of additives a
Wheat
Straw
Wheat
Straw +
H2SO4
Wheat
Straw +
HCl
Wheat
Straw +
NH3
Process temperature (oC) 130 140 140 165
Calorific Value of bio-oil 19.3 23.2 24.7 22.8
Product Distribution (mass %)
Char 29 44.4 31.8 40.7
Bio-oil 20.6 7.3 22.1 17.0
Aqueous Phase 36.4 32.9 27.1 22.3
Gas 14 15.4 19 20
a Results quoted are for highest yield of bio-oil recorded under these conditions.

Chapter 4: Production of bio-oil through microwave treatment of biomass
104
It has been reported that inorganic components within biomass support the formation
of gas and char over bio-oil.27
In a study of the pyrolysis behaviour of twelve
different biomass feedstocks, Raveendran et al reported that in the majority of cases,
lowering mineral content resulted in lower char yields and increased oil yields.28
The addition of inorganic species, such as NaCl, ZnCl2, NaOH, FeSO4 and KCl, has
been subject to widespread study in terms of impact on the yield and composition of
pyrolysis products.12, 29-35
In agreement with the results shown above, it was found
in all cases, that the additives resulted in increased char and gas formation to the
detriment of liquid yields. As a result, the use of additives in oil production has little
value in terms of yield, therefore the influence of additives on composition was
investigated.
4.2.6 Influence of additives on bio-oil composition
It is to be expected that the use of additives will also affect the composition of bio-
oils. Scott et al discovered the yield of anhydrosugars was significantly higher in the
absence of inorganic species proposing two alternative mechanisms for the pyrolysis
of cellulose. Accordingly, it was reported that in the absence of minerals, cellulose
decomposes via depolymerisation steps forming levoglucosan as the major product.
Alternatively, in the presence of minerals, low molecular weight compounds are
formed as the major product of decomposition. These findings have been supported
by further investigations although the exact mechanism and reason for the effect of
inorganic content on degradation remains unclear. 36-38
The compositions of the bio-oils produced from microwave pyrolysis of wheat straw
were studied using 1H NMR and GC-MS. The complex composition of the oils
meant it was difficult to determine the exact composition although the abundance of
specific groups of compounds was clearly demonstrated.

Chapter 4: Production of bio-oil through microwave treatment of biomass
105
4.2.6.1 1H NMR studies of bio-oil
As described in Experimental section 7.3.14, proton NMR spectra were recorded for
wheat straw bio-oils prepared in the presence and absence of additives. Although
the spectra were too complex to allow identification of individual components (see
Appendix 1), the integral values of selected regions were used to identify relative
quantities of functional groups in the oils following the procedure of Mullen et al
(Figure 4.6).23
Aliphatic protons, in the region of 0.5 to 1.5 ppm, account for approximately 14 %
of the protons in the standard microwave wheat straw bio-oil, as is expected for
grassy biomass.23 Addition of either sulfuric acid and ammonia led to a reduction in
this integral, while hydrochloric acid appears to have no influence.
Signals between 1.5 to 3.0 ppm correspond to protons on aliphatic carbons which are
alpha to a heteroatom or unsaturation. This is one of the most populated regions for
the standard microwave oil (27 %); in this case only sulphuric acid caused a notable
change in this region (18 %). Water in the samples would also be likely to resonate
in this region but as all the oils contain <1 wt% (measured according to procedure in
Experimental section 7.3.12) it was assumed not to cause significant interference.
The next region of the spectrum, 3.0 to 4.4 ppm, contributed a similar proportion of
the makeup of all the oils (~20 %) with hydrochloric acid showing the greatest
increase at just 6 % higher. Protons in this area are likely to be bonded to carbons
next to an aliphatic alcohol or ether group, or a methylene group bridging two
aromatic rings. The latter would suggest a partial decomposition of lignin resulting
in the presence of the oligomer in the sample.

Chapter 4: Production of bio-oil through microwave treatment of biomass
106
.
Fig. 4.6: Distribution of functional groups in bio-oil based on 1H NMR analysis of
bio-oil from microwave treatment of wheat straw pellets in the presence of additives.
(Note: the structures shown are representative of groups which may be present rather than individual
structures shown to be present.)
Proton signals between 4.4 and 6 ppm have been assigned to aromatic ether protons
of lignin degradation products, or many of the protons in carbohydrate-like
structures which would be expected. Again, this region saw little change except in
the presence of hydrochloric acid where the yield dropped from ~30 % to 22 %.

Chapter 4: Production of bio-oil through microwave treatment of biomass
107
The aromatic region of the spectrum (6 – 8.5 ppm) contained ~10 % of the protons
in all the bio-oils except that produced in the presence of sulphuric acid (21 %). The
downfield region of the spectrum (9.5 to 10 ppm) contains the smallest portion of
protons in all the bio-oils (0 to 3 %). This is to be expected as signals here
correspond to aldehydes and certain carboxylic acids, both of which have been
identified by IR as mainly condensing in the separate aqueous phase (Appendix 1
Figure 3).
It is clear from the NMR study that the use of additives not only affects yields, but
also has an effect on the product distribution in the bio-oils. The possibility to
control the distribution of components within bio-oil could potentially benefit further
transformation and upgrading processes. GC-MS of the bio-oils obtained gave
broadly similar profiles, but, in agreement with the 1H NMR, some changes were
evident (Section 4.2.6.2).
4.2.6.2 GC-MS studies of bio-oil
Figure 4.7 shows the GC-MS analysis of wheat straw microwave bio-oils. Due to
the complex mixture of compounds present the GC-MS was interpreted in terms of
the type of compound present, with absolute identification where possible.
H2SO4 results in a comparatively simpler product distribution than bio-oil produced
in the absence of additives or in the presence of NH3 and HCl. This is in agreement
with the NMR data which showed over 30 % of the peaks falling between 4.4 and 6
ppm. The GC shows two main peaks along with fewer small peaks and noise. The
peaks at 24.83 min and 29.98 min have been assigned respectively as a substituted
phenyl and an anhydrosugar from the decomposition of cellulose.

Chapter 4: Production of bio-oil through microwave treatment of biomass
108
Figure 4.7: A) GC traces from qualitative analysis of microwave wheat straw bio-
oils in the presence and absence of additives. B) Assignment of key peaks
In the case of HCl, a peak at 28.03 min is significantly larger than that at 29.98 min,
indicating an increased yield of the dimethoxyphenol over the anhydrosugars. This

Chapter 4: Production of bio-oil through microwave treatment of biomass
109
along with the overall product profile again suggests the salt influences reactions
rather than pH. In order to fully understand the implications of these results, repeat
experiments will be needed varying the concentration of additives in the samples.
4.3 Conclusions & Further work
Microwave activation of wheat straw provides a novel, low temperature route to bio-
oils with excellent key properties in terms of bio-fuel suitability (i.e. low water and
acid content, high calorific value). Relative to bio-oil prepared by conventional
pyrolysis, this low sulphur and acid content of microwave bio-oils are particularly
significant in increasing its suitability for fuel applications (Table 4.3). These results
show for the first time, that the use of low temperature microwave pyrolysis gives a
simpler product profile than conventional pyrolysis. These milder operating
conditions prevent further polymerisation or break down of volatile fractions. Table
4.4 summarises the properties of the oils produced by microwave processing of
wheat straw. The process has been applied to other biomass feedstocks including
miscanthus, and proved to be versatile method for production of bio-oil. Initial
investigations showed similar yields (21 % oil) as are reported for wheat straw
although further optimisation and characterisation needs to be carried out (Appendix
1 Table 4).
Table 4.4: Overview of wheat straw microwave bio-oils
Additive Oil yield
(wt%)
Composition Comments
None 20.6 Mainly aliphatic and
aromatic or carbohydrate
like products
Simpler product distribution
than conventional pyrolysis
H2SO4 7.3 Predominantly aromatic or
carbohydrate like products
Simplest product profile
making it most suitable for
purification or upgrading but
yield is very low

Chapter 4: Production of bio-oil through microwave treatment of biomass
110
HCl 22.1 Broad range of different
compounds
Broad range of components
may offer more options for
upgrade although separation
may be difficult
NH3 17.0 Broad range of different
compounds
Broad range of components
may offer more options for
upgrade although separation
may be difficult
It is evident that the presence of additives has an influence on the products of
microwave treatment of biomass. While it appears that this influence is independent
of the pH of the additive, other factors such as volatility, the dehydrating ability of
the species and its ability to interact with the microwave field may be involved. A
mechanistic study on the interaction of biomass with microwave energy should be
carried out in the future in order to form a proper understanding of the role of
additives in production of bio-oil.
As mentioned in Chapter 3, it is essential to be aware of the overall energy balance
when assessing the advantages of microwave processing of biomass. Chapter 5
describes the scale up experiments and the energy demand of increased scale
processing of biomass. All of this data is drawn together in Chapter 6 to discuss the
energetic merits of microwave processing of biomass compared to conventional
pyrolysis.

Chapter 4: Production of bio-oil through microwave treatment of biomass
111
4.5 References
1. L. D. Gomez, C. G. Steele-King and S. J. McQueen-Mason, New
Phytologist, 2008, 178, 473-485.
2. D. Mohan, C. U. Pittman and P. H. Steele, Energy & Fuels, 2006, 20, 848-
889.
3. G. G. Allan, B. Krieger-Brockett and D. W. Work, Journal of Applied
Polymer Science, 1980, 25, 1839-1859.
4. M. Miura, H. Kaga, T. Yoshida and K. Ando, J. Wood Sci., 2001, 47, 502-
506.
5. A. M. Sarotti, R. A. Spanevello and A. G. Suarez, Green Chemistry, 2007, 9,
1137-1140.
6. R. Ruan, P. Chen, R. Hemmingsen, V. Morey and D. Tiffany, International
Journal of Agricultural and Biological Engineering, 2008, 1, 64-68.
7. F. Yu, S. P. Deng, P. Chen, Y. Liu, Y. Wang, A. Olsen, D. Kittelson and R.
Ruan, Applied Biochemistry and Biotechnology, 2007, 136-140 957-970.
8. A. Domínguez, J. A. Menéndez, Y. Fernández, J. J. Pis, J. M. V. Nabais, P. J.
M. Carrott and M. M. L. R. Carrott, Journal of Analytical and Applied
Pyrolysis, 2007, 79, 128-135.
9. V. L. Budarin, K. J. Milkowski, P. Shuttleworth, B. Lanigan, J. H. Clark, D.
J. Macquarrie and A. J. Wilson, 2010, WO 2010/001137.
10. D. Chiaramonti, M. Bonini, E. Fratini, G. Tondi, K. Gartner, A. V.
Bridgwater, H. P. Grimm, I. Soldaini, A. Webster and P. Baglioni, Biomass
and Bioenergy, 2003, 25, 101-111.
11. F. Yu, R. Ruan, S. P. Deng, P. Chen and X. Lin, presented in part at the
ASABE Annual International Meeting, Portland, Oregan, 2006.
12. M. Chen, J. Wang, M. Zhang, M. Chen, X. Zhu, F. Min and Z. Tan, J. Anal.
Appl. Pyrolysis, 2008, 82, 145-150.
13. H. Lei, S. Ren and J. Julson, Energy & Fuels, 2009, 23, 3254-3261.
14. M. Miura, H. Kaga, A. Sakurai, T. Kakuchi and K. Takahashi, J. Anal. Appl.
Pyrolysis, 2004, 71, 187-189.
15. A. Domínguez, J. A. Menendez, M. Inguanzo and J. J. Pis, Bioresource
Technology, 2006, 97, 1185-1193.
16. J. A. Menendez, A. Dominguez, Y. Fernandez and J. J. Pis, Energy & Fuels,
2007, 21, 373-378.
17. J. A. Menendez, A. Dominguez, M. Inguanzo and J. J. Pis, Journal Of
Analytical And Applied Pyrolysis, 2005, 74, 406-412.
18. V. L. Budarin, J. H. Clark, B. A. Lanigan, P. Shuttleworth, S. W. Breeden,
A. J. Wilson, D. J. Macquarrie, K. Milkowski, J. Jones, T. Bridgeman and A.
Ross, Bioresource Technology, 2009, 100, 6064-6068.
19. Nexant, The Exploitation of Pyrolysis Oil in the Refinery Main Report, The
Carbon Trust, 2008.
20. R. Fahmi, A. V. Bridgwater, I. Donnison, N. Yates and J. M. Jones, Fuel,
2008, 87, 1230-1240.
21. J. Yanik, C. Kornmayer, M. Saglam and M. Yuskel, Fuel Processing
Technology, 2007, 88, 942-947.

Chapter 4: Production of bio-oil through microwave treatment of biomass
112
22. K. Sipilä, E. Kuoppala, L. Fagernäs and A. Oasmaa, Biomass and Bioenergy,
1998, 14, 103-113.
23. C. A. Mullen, G. D. Strahan and A. A. Boateng, Energy & Fuels, 2009, 23,
2707-2718.
24. C. Wang, Z. Du, J. Pan, J. Li and Z. Yang, Journal of Analytical and Applied
Pyrolysis, 2007, 78, 438-444.
25. D. J. Nowakowski, J. M. Jones, R. M. D. Brydson and A. B. Ross, Fuel,
2007, 86, 2389-2402.
26. S. Helle, N. M. Bennett, K. Lau, J. H. Matsui and S. J. B. Duff,
Carbohydrate Research, 2007, 342, 2365-2370.
27. Y. Sekiguchi and F. Shafizadeh, Journal of Applied Polymer Science, 1984,
29, 1267 - 1286.
28. K. Raveendran, A. Ganesh and K. C. Khilar, Fuel, 1995, 74.
29. G. Varhegyi, M. J. Antal, T. Szekely, F. Till and E. Jakab, Energy and Fuels
1988, 2, 267 - 272.
30. A. Jensen, K. Dam-Johansen, M. A. Wojtowicz and M. A. Serio, Energy and
Fuels, 1998, 12, 929 - 938.
31. H. Teng and Y. C. Wei, Industrial and Engineering Chemistry Research,
1998, 37, 3806 - 3811.
32. G. Varhegyi, E. Jakab, F. Till and T. Szekely, Energy and Fuels, 1989, 3,
755 - 760.
33. J. M. Encinar, F. J. Beltran, A. Ramiro and J. F. Gonzalez, Industrial and
Engineering Chemistry Research, 1997, 36, 4176 - 4183.
34. C. Yang, X. Lu, W. Lin, X. Yang and J. Yao, Chemical Research in Chinese
Universities, 2006, 22, 524 - 532.
35. M. Nik-Azar, M. R. Hajaligol, M. Sohrabi and B. Dabir, Fuel Processing
Technology, 1997, 51, 7 - 17.
36. D. S. Scott and J. Piskorz, The Canadian Journal of Chemical Engineering,
1982, 60, 666 - 674.
37. D. S. Scott, J. Piskorz and D. Radlein, Industrial and Engineering Chemistry
Process Design and Development 1985, 24, 581 - 588.
38. J. Piskorz, D. Radlein and D. S. Scott, Journal of Analytical and Applied
Pyrolysis, 1986, 9, 121 - 137.

Chapter 5: Short Investigations
Publications: Budarin, V. L.; Milkowski, K.J.; Shuttleworth, P.; Lanigan, B.; Clark, J.H.;
Macquarrie, D.J.; Wilson, A.J.; Patent Application: WO 2010/001137
Microwave torrefaction of Biomass, 2010.

Chapter 5: Short Investigations
114
5.1 Introduction
Throughout the course of the studies already described, some short term studies
were also carried out in order to further investigate applications of microwave
processing of biomass. This chapter covers two of the most interesting of these
projects, a set of pilot-scale trials of microwave treatment of biomass, and new
applications of lignin.
5.2 Microwave treatment of lignin for preparation of materials
Lignin is Nature’s greatest store of aromatic molecules. Finding an efficient and
environmentally benign way to unlock that store is a great challenge for chemists
and biologists.1
Lignin is available in several forms as a waste product from a variety of wood
handling processes. Traditionally seen as a by-product from the paper industry, as
lignosulfonate and Kraft Lignin, lignin is now posing a challenge to the integrated
biorefinery due to the difficulty in converting it into a valuable product stream. It is
generated through acid or enzyme hydrolytic pre-treatment of lignocellulosic
biomass, to isolate cellulosic material before fermentation for ethanol production.
Currently there is little application for the lignin. While it is used as a stabiliser in
drilling muds and emulsions, and as a dispersant in paints, dyes and clay, the
majority of lignin is seen as waste and burnt for energy production.
In this section, the production of expanded materials from lignin was investigated as
a novel use for the material.

Chapter 5: Short Investigations
115
5.2.1 Expanded Materials
According to IUPAC classification solids may be categorized as microporous,
mesoporous and macroporous depending on the average pore diameter (Table 5.1).2
Table 5.1: IUPAC Pore Classification2
Pore Type Pore Diameter
Micropore 0.5 – 2 nm
Mesopore 2 – 50 nm
Macropore > 50 nm
Studies on the surface area and pore structure of a solid surface may be carried out
by studying the adsorption of a gas or liquid onto the surface. When a solid in a
closed space is exposed to a gas at a definite pressure the solid begins to adsorb the
gas forming a monolayer on the surface. The fall in pressure in the system can then
be used to calculate the mass of gas adsorbed.3
Of particular interest in this investigation was the production of mesoporous
materials through expansion of lignin. Mesoporous materials have applications in
fields including catalysis, sensors, adsorbents, separation media, waste remediation
and shape selective electrodes.4 Previous work in the group had shown the
production of high surface area starches and carbonised starches, Starbon®5, 6
which
is currently being sold commercially by SigmaAldrich. Production of a mesoporous
lignin could lead to several new applications for this waste product.
Figure 5.1 shows the preparation procedure for the formation of expanded materials
from lignin which has been produced as a side product of bioethanol production. As
outlined in Chapter 7.2.8, conditions were varied in order to identify the optimum
procedure for gel formation.

Chapter 5: Short Investigations
116
5.2.2 Preparation of expanded material from lignin
Fig. 5.1: Outline of Microwave Gel Preparation Procedure
Some conditions were found to only result in the formation of an emulsion, while
other suspensions appeared completely unchanged after addition of acid. When a
gel was successfully formed, the properties of the product after the solvent exchange
process varied again. Table 5.2 shows the variation of product surface area in
relation to preparation conditions.
Table 5.2: Surface area of materials produced through microwave treatment (200 W)
of bioethanol lignin in the presence of NaOH (2 M)
Time 180 oC 190
oC 200
oC
5 min 9 m2g-1 21 m
2g-1 23 m
2g-1
10 min 12 m2g-1 14 m2g-1 58 m2g-1
15 min 18 m2g-1 18 m2g-1 44 m2g-1
20 min 19 m2g-1 45 m
2g-1 69 m
2g-1
Note: 1. Starting material surface area: Bioethanol Lignin < 1 m2g-1
2. Instrument accuracy dictates values < 10 m2g-1 are equivalent to 0 m
2g-1
3. Measurements made using Coulter SA3100 Surface Area and Pore Size Analyzer
(Experimental section 7.3.15)
Increased time and temperature resulted in increased surface area. Raising the
temperature by 20 oC (from 180
oC to 200
oC) resulted in surface area increases of
up to 50 m2g-1, with the time increase (from 5 min to 20 min) resulting in an average
increase of up to 46 m2g-1. The energy input of this process must be considered and

Chapter 5: Short Investigations
117
balanced against the benefits higher temperatures and residence times bring to the
product.
More in depth gas adsorption analysis of samples with surface area >20 m2g-1 was
carried out using a Micrometrics ASAP 2010 Surface Area and Pore Size Analyzer.
The amount of gas adsorbed by the solid sample depends on the equilibrium
temperature and pressure. The relationship between the “amount adsorbed by unit
mass of solid and the equilibrium pressure at a known temperature” is shown as an
adsorption isotherm. IUPAC have defined six adsorption isotherms for gas
physisorption as shown below.2 Figure 5.2 shows a typical isotherm for the samples
analysed. This type of isotherm indicates the presence of micropores, shown by the
initial vertical climb, and some mesoporous properties, shown by the hysteresis
loop.2
Fig. 5.2: N2 Adsorption Isotherm Plot for expanded lignin sample
(surface area 69 m2g-1)
5.2.3 Application of mesoporous lignin
The use of expanded lignin as a stationary phase for column chromatography was
tested by attempting to separate ferrocene/ acetylferrocene/diacetylferrocene on a
column of unmodified lignin (surface area 0 m2g-1) and a column of the expanded

Chapter 5: Short Investigations
118
material (surface area 58 m2g-1). This system was chosen due to the ease of visual
and GC identification of the different fractions upon elution from the column (Figure
5.3). The columns were eluted with solvents of varying polarity and fractions
collected. In the case of unmodified lignin, all components were removed from the
column by the solvent, hexane, showing little affinity between it and the components
to be separated. Modified lignin showed superior separation properties. Visual
inspection of isolated fractions showed expected variation in the colours of the
samples (Figure 5.3 C). The fractions were analysed by GC and showed good
separation of components with each fraction containing a single major component
(Figure 5.3 B).
Fig. 5.3: Ferrocene / acetylferrocene / diacetylferrocene separation (A) Column of
expanded lignin and GC trace of standards (B) Fraction during separation (C)
Fractions collected from column

Chapter 5: Short Investigations
119
These initial investigations were seen as a promising application of the expanded
material but no further work was carried out in this area due to issues with the
reproducibility of the surface area properties of the expanded materials.
5.2.5 Reproducibility of Surface Area Results
In order to be able to draw conclusive results from this study it would have been
necessary to achieve reproducible results. Several gels prepared using the same
conditions resulted in different surface areas with differences of up to 50 m2g-1
(Table 5.2). Elemental analysis of the material showed it to contain much lower
levels of carbon than would be expected and spectroscopic analysis offered little
indication of the makeup of the products. While the results included here were
promising it was decided to conclude this investigation to focus on the thermal
transformations of lignin and biomass in to fuel and chemicals (Chapters 2 to 4).
Possible future work in this area could look to further characterise the solid by
determining inorganic content and microscopic structure. The composition of the
solvent exchange washes should also be determined. This could provide an
interesting insight into the fate of organic components, perhaps containing break
down products of lignin which should be identified.

Chapter 5: Short Investigations
120
5.3 Pilot-scale trials of microwave treatment of biomass
The ideal biomass treatment process should be capable of handling large volumes
continuously, yielding high calorific value products with minimum energy input
(Figure 5.4).
Fig. 5.4: Continuous processing of biomass for production of high calorific value
products
Following the success of the lab work, funding was provided by Yorkshire Forward,
the Regional Development Agency, to carry out pilot scale studies as part of a proof
of concept project. Pilot-scale trials (5 – 25 kg of starting material) on the
continuous microwave processing of biomass were carried out using facilities at
Rotawave Ltd., Sandycroft, Deeside, Clwyd in August 2008 as described in
experimental section 7.2.7. Samples of rolled oats, wheat straw pellets and
miscanthus were processed for the isolation of oils and preparation of solid chars for
fuels. Figure 5.5 shows the scale of the tests. Biomass samples were loaded into the
microwave by bucket and products collected in similar quantities.

Chapter 5: Short Investigations
121
Fig. 5.5: Pilot scale biomass microwave trials. A: Rotawave trial microwave B:
Wheat straw pyrolysis oil C: Wheat straw pellets after microwave treatment.
Figure 5.6 shows a schematic of the microwave processor. Before loading samples,
the microwave chamber was flooded with nitrogen in order to provide an inert
environment. The sample was then introduced into the chamber via a screw feed,
where it was mixed and heated to between 80 – 100 oC before treatment in order to
maximise the efficiency of the process.
A
B C
A

Chapter 5: Short Investigations
122
Fig. 5.6: Schematic of Rotawave microwave processor
The biomass remained in the microwave for an average residence time of 15 minutes
before being discharged through an air locked valve. Due to the temperature of the
char product, it was necessary to discharge into water to prevent risk of combustion
upon exposure to air. This risk could be minimised in a purpose built system by
discharging the solid through cooled air lock systems. Volatile components were
drawn out and condensed via a water cooled condenser for collection. As the
microwave was not designed for the trapping of such large volumes of liquid the
condensation process was highly inefficient with significant amounts of product
being lost as gases. The liquid fraction was also highly diluted by water used to
clean the microwave between runs.
While the operating conditions were far from ideal, the scaled up studies produced
chars of similar calorific value to those produced in the lab (Table 5.3) along with
significant amounts of liquid which were not collected. These results showed low
temperature microwave processing to be a versatile and scalable method for
producing fuels from biomass.

Chapter 5: Short Investigations
123
Table 5.3 shows the preparation conditions and properties of the best chars produced
(see Appendix 1 Table 5 for additional information). In agreement with the
laboratory studies, the bulk properties of the biomass showed a strong influence on
the efficiency of the microwave interaction. The dense wheat straw pellets absorbed
the microwave energy well requiring a lower energy input to reach similar
temperatures as the other biomass feedstocks, while the diffuse miscanthus straw
required much higher energy inputs.
Table 5.3: Char preparation conditions and properties
Biomass
Type
Mass
(kg)
T
(oC)
Microwave
energy
expended
Bulk
density
Char
Calorific
Value
pilot scale
(kJ g-1)
Char
calorific
value
lab scale
(kJ g-1)
Elemental
composition
(%)
kJ kJ/kg C H N
Wheat straw
pellets 12
166
-
175
21,600 1,800 high 23.1 22.4 61 4 1.1
Miscanthus 2.4
160
-
165
8,550 4,800 low 22.4 24.6 52.7 3.2 1.1
Cocoa husk 4.3
151
-
190
14,520 3,400 medium 28.2 22.1 54 3 2.5
While the energy input is high when compared to other pre-treatment methods such
as peletisation (250 kW h tonne-1 vs. 28 kW h tonne-1), the production of additional
liquid and gas products and further optimisation of the process should result in a
favourable energy balance. Liquid fractions collected contained high levels of
water, this along with a lack of suitable storage conditions made it difficult to
accurately analyse the composition of the liquid fraction. The nature of the system
did not allow for proper cleaning between trials. As a result, high levels of cleaning
water and contaminants remained within the microwave and were carried over into
the liquid fraction of the subsequent run. Figure 5.7 shows the fractionation of the
collected liquid into various solvents as an approximation of the nature of the

Chapter 5: Short Investigations
124
mixture. Over 75 % of the mixture partitioned in the first water washes, including
dissolved water in the bio-oil. The resulting bio-oil was then washed sequentially
with hexane, toluene, dichloromethane, chloroform and ethylacetate.
Fig. 5.7: Fractions of liquid product of microwave treatment of wheat straw
The lowest proportion was soluble in hexane, the most non-polar solvent, as is to be
expected from the typical composition of bio-oils.7 The remainder partitioned
between the other solvents which varied in polarity from 2.4 (toluene) to 4.4
(ethylacetate) indicating the majority of components are polar in nature.8
Further optimisation of this process should provide a route to in-situ separation of
water from organic components during bio-oil production.
Studies on the scalability of this process are being continued in the purpose-built
microwave facility in the Green Chemistry Centre at the University of York.

Chapter 5: Short Investigations
125
5.4 References
1. J. H. Clark, V. Budarin, F. E. I. Deswarte, J. J. E. Hardy, F. M. Kerton, A. J.
Hunt, R. Luque, D. J. Macquarrie, K. Milkowski, A. Rodriguez, O. Samuel,
S. J. Tavener, R. J. White and A. J. Wilson, Green Chem., 2006, 8, 853-860.
2. K. S. W. Sing, D. H. Everett, R. A. W. Haul, L. Moscou, R. A. Pierotti, J.
Rouquerol and T. Siemieniewska, Pure & App!. Chem., 1985, 57, 603-619.
3. F. Rouquerol, J. Rouquerol and K. Sing, Adsorption by Powders & Porous
Solids: Principles, Methodology and Applications, Academic Press, 1999.
4. R. Ryoo, S. H. Joo and S. Jui, J. Phys. Chem. B 1999, 103, 7743 – 7746.
5. V. Budarin, J. H. Clark, F. E. I. Deswarte, J. J. E. Hardy, A. J. Hunt and F.
M. Kerton, Chem. Comm., 2005, 2903-2905.
6. V. Budarin, J. H. Clark, J. J. E. Hardy, R. Luque, K. Milkowski, S. J.
Tavener and A. J. Wilson, Angew. Chem. , 2006, 118, 3866 –3870.
7. H. B. Goyal, D. Seal and R. C. Saxena, Renewable and Sustainable Energy
Reviews, 2008, 12, 504-517.
8. Solvent polarity and miscibility: http://www.chemical-
ecology.net/java/solvents.htm last accessed 15.01.10.

Chapter 5: Short Investigations
126

Chapter 6: Concluding remarks
and future work

Chapter 6: Concluding remarks and future work
128
Biomass is a versatile and important source of energy, and a rich potential
feedstock for the chemical industry. In an attempt to alleviate fossil fuel usage
and reduce global CO2 emissions, it has been cited as a strong alternative.
Development of biofuels is being driven by worries over energy security, climate
change mitigation, and agricultural and economic development targets.
In terms of commercialisation of lignocellulose-based biofuels, it is still difficult
to determine which route will become most successful. The direct combustion of
biomass is a simple and straightforward method of accessing energy stored in
biomass, but material handling issues along with inorganic components and
moisture pose obstacles to widespread industrial scale application. As a result,
there is widespread interest in technology to upgrade the value of biomass as a
fuel. It is likely to be the case that several technologies will come into
widespread use depending on the regional situation. Climate and soil type will
determine the crops that are utilised, while the end use of the fuel will influence
the process.
Independent of all these factors will be the need to have a process which is
versatile, scalable and suitable for continuous production, while also being
energy efficient and environmentally benign. The patented work (Appendix 2)
described in this thesis has shown for the first time the ability to produce high
calorific value fuels from the microwave treatment of biomass at temperatures
below 300 oC.
1-3
This technology offers many advantages over current bioenergy systems.
Microwave technology is relatively mature and suitable for implementation on a
variety of scales.4 The benefits of microwave technology for fuel production
have been reported by many researchers,4-13
but the work described in this thesis
has gone beyond that previously reported by proving milder operating conditions
can produce quality products.
Microwave processing of biomass components was shown in Chapter 2 to reduce
the preparation temperature of high calorific value chars by up to 150 oC.
Through interactions with groups within the amorphous region of cellulose,

Chapter 6: Concluding remarks and future work
129
microwave-induced dipolar polarisation and ionic conduction leads to acid
catalysed decomposition of the entire cellulose. Similar increases in calorific
value of xylan chars were also observed at temperatures lower than those
required under slow pyrolysis conditions.
Building on this knowledge, it was shown that microwave processing can be
used to treat whole biomass to produce significant yields of high calorific value
chars (Chapter 3) and oils (Chapter 4) at low temperatures. Results were
reported for three diverse types of biomass available for use in the UK. Each one
produced high calorific value chars through microwave processing at low
temperatures. More in depth studies on microwave treatment of wheat straw
showed it is possible to produce bio-oils similar to those produced through
conventional fast pyrolysis. The success of the laboratory results led to scale up
trials, which enabled further proof of the concept and its applicability (Chapter
5.2).
The improvements reported in this thesis not only offer energy savings by
operating at low temperatures, but also reductions in capital costs as the system
does not need to be capable of tolerating extremes of temperatures. The work
has been shown scalable from less than 1 g to over 15 kg with minimal changes
to the operating conditions or loss of product quality. The operation of
microwave systems requires low skill training, with safety cut offs easily
automated. As a result microwave processing of biomass is a safe, scalable
option for the production of energy from biomass. The scalability also makes the
technology suitable for distributed energy production (Figure 6.1), an option
cited by many as being necessary to improve the overall economics of biofuel
production.

Chapter 6: Concluding remarks and future work
130
Fig. 6.1: Distributed energy production minimising energy used in transport of
biomass
By processing biomass and producing biofuels close to the source, there is
greater potential for economic benefits to be felt by the area. Implementation of
distributed energy production also reduces energy spent transporting the
moisture-rich low-density biomass. By transporting after processing, only
components which add to the energy value of the product will be taken.
To demonstrate the economic viability and further validate the merits of the
microwave system, a basic energy balance was calculated. Figure 6.2 shows the
calculation boundaries which were limited to energy used for field production,
storage and processing of the biomass but to exclude distribution of products to
users (e.g. power plants or pyrolysis oil upgrading facilities).14
The calculations
were based on established norms, assuming transport of material up to 150 km
before processing. The energy efficiency would be greater if distributed energy
generation were to be implemented.

Chapter 6: Concluding remarks and future work
131
Fig. 6.2: Boundaries of energy calculations
Table 6.1 shows the results of the energy balance calculated on the basis of
reported and experimental data (Appendix 1). These preliminary calculations
show enormous benefit. The energy value of the product is over 20 times that of
the energy inputs, with the final microwave processing stage contributing less
than 5 % of the overall energy input. This final processing step produces a
renewable solid fuel capable of being used as a direct substitute for fossil fuels,
while the liquid fraction is of superior quality to conventional pyrolysis oil and
suitable for direct use or upgrading into a hydrocarbon fuel. Energy inputs could
be decreased further by processing the material on a local level.

Chapter 6: Concluding remarks and future work
132
Table 6.1: Energy balance for production of fuels from biomass using microwave
processing
Energy (kJg-1) Miscanthus Wheat straw
pellets
Inputs:
Field production & harvesting 0.53 0.36
Processing & transport 0.36 0.42
Pellet production - 0.1
Microwave energy for optimised char
production (% of total)
0.043
(4.6 %)
0.0144
(1.6 %)
Total energy inputs 0.933 0.894
Char calorific value 24.59 22.00
Energy value of output/energy input (kJ/kJ) 26.4 24.6
Microwave energy for optimised char and
oil production (% of total)
- 0.0086
(0.96 %)
Total energy inputs 0.8886
Char calorific value - 21.2
Oil calorific value - 15.9
Average calorific value of products 18.9
Energy value of output/energy input (kJ/kJ) 21.3
Data reported on the energy efficiency of conventional pyrolysis, puts the energy
yield (energy value of output/energy input) at between 3 and 9 kJ/kJ depending
on the biomass type and pyrolysis system used.15, 16
As can be seen from table
6.1, this level is well below that found for the microwave processing of biomass
described in this thesis (21 – 26 kJ/kJ).
This work described is only the initial development and understanding of this
new process. These results have formed the basis of project proposals which
have gained £1.5 million of funding for the Department of Chemistry at the
University of York from the European Regional Development Fund, the Carbon

Chapter 6: Concluding remarks and future work
133
Trust and METRC (The N8 Molecular Engineering Translational Research
Centre).17-19
This money has supported the opening of a dedicated microwave
facility with dedicated research staff. Future research will focus on further
characterisation of pyrolysis products, in particular the bio-oil, in order to
provide deeper understanding of the mechanisms occurring within the biomass
during microwave treatment. A wider variety of biomass feedstocks must also
be investigated to prove the versatility of the system. Non fuel applications of
the products (e.g. high value chemicals) should be investigated along with new
applications for lignin as added value product streams.
Mankind has an ever increasing thirst for energy. A secure supply of energy will
be essential for development but must be realised with minimal environmental
impact. Society will have to move from an economy based on fossil fuels to a
more sustainable energy mix. This will require development of sustainable
energy solutions and more efficient ways of producing them.
The work reported here has shown for the first time, that microwave irradiation
at low temperatures can have a dramatic effect on the decomposition of major
components in plant biomass. This influence has been proven both in terms of
the temperature at which carbonisation occurs and the properties of the char and
oil produced. The process yields high quality products, which can strengthen the
case for the use of biomass for energy production both as a solid and liquid fuel.
The process has low energy consumption and can be easily adapted to a variety
of biomass. This technology has been proven as a green and flexible method of
upgrading biomass for energy applications, supporting progress to a society
which is no longer reliant on fossil fuels.

Chapter 6: Concluding remarks and future work
134
References
1. V. L. Budarin, J. H. Clark, B. A. Lanigan, P. Shuttleworth, S. W.
Breeden, A. J. Wilson, D. J. Macquarrie, K. Milkowski, J. Jones, T.
Bridgeman and A. Ross, Bioresource Technology, 2009, 100, 6064-6068.
2. V. L. Budarin, J. H. Clark, B. A. Lanigan, P. Shuttleworth and D. J.
Macquarrie, Bioresource Technology, 2010, 101, 3776-3779.
3. V. L. Budarin, K. J. Milkowski, P. Shuttleworth, B. Lanigan, J. H. Clark,
D. J. Macquarrie and A. J. Wilson, 2010, WO 2010/001137.
4. R. Ruan, P. Chen, R. Hemmingsen, V. Morey and D. Tiffany,
International Journal of Agricultural and Biological Engineering, 2008,
1, 64-68.
5. M. Chen, J. Wang, M. Zhang, M. Chen, X. Zhu, F. Min and Z. Tan, J.
Anal. Appl. Pyrolysis, 2008, 82, 145-150.
6. A. Domínguez, J. A. Menéndez, Y. Fernández, J. J. Pis, J. M. V. Nabais,
P. J. M. Carrott and M. M. L. R. Carrott, Journal of Analytical and
Applied Pyrolysis, 2007, 79, 128-135.
7. A. Domínguez, J. A. Menendez, M. Inguanzo and J. J. Pis, Bioresource
Technology, 2006, 97, 1185-1193.
8. H. Lei, S. Ren and J. Julson, Energy & Fuels, 2009, 23, 3254-3261.
9. M. Miura, H. Kaga, A. Sakurai, T. Kakuchi and K. Takahashi, J. Anal.
Appl. Pyrolysis, 2004, 71, 187-189.
10. M. Miura, H. Kaga, T. Yoshida and K. Ando, J. Wood Sci., 2001, 47,
502-506.
11. F. Yu, S. P. Deng, P. Chen, Y. Liu, Y. Wang, A. Olsen, D. Kittelson and
R. Ruan, Applied Biochemistry and Biotechnology, 2007, 136-140 957-
970.
12. F. Yu, R. Ruan, P. Chen and S. Deng, presented in part at the ASABE
Annual International Meeting, Minneapolis, 2007.
13. F. Yu, R. Ruan, S. P. Deng, P. Chen and X. Lin, presented in part at the
ASABE Annual International Meeting, Portland, Oregan, 2006.
14. G. Forsberg, Biomass and Bioenergy, 2000, 19, 17-30.
15. J. L. Gaunt and J. Lehmann, Environmental Science & Technology, 2008,
42, 4152-4158.
16. C. N. Hamelinck, R. A. A. Suurs and A. P. C. Faaij, Biomass and
Bioenergy, 2005, 29, 114-134.
17. Grass clippings: the fuel of tomorrow?:
http://www.york.ac.uk/chemistry/news/deptnews/grassclip/ last accessed
12.09.10.
18. York scientists work on alternative biofuel made from household waste
http://tiny.cc/YorkPress last accessed 12.09.10.
19. Carbon Trust Pyrolysis Challenge
http://www.carbontrust.co.uk/emerging-technologies/current-focus-
areas/pages/pyrolysis-challenge.aspx last accessed 12.09.10.

Chapter 7: Experimental methods

Chapter 7: Experimental methods
136
7.1 Materials and reagents
Sample Source Properties Characterisation
Miscanthus Charles Jackson
Ltd., Northampton
Milled
Particle size: ≥ 4 mm
Approximate moisture
content on arrival: 27 %
Fig 3.4, 3.9
Wheat straw Charles Jackson
Ltd., Northampton
Milled
Particle size: ≥ 4 mm
Approximate moisture
content on arrival: 19 %
Fig 3.4, 3.10
Wheat straw
pellets
Charles Jackson
Ltd., Northampton
8 mm pellets
Approximate moisture
content on arrival: 6 %
Fig 3.4
Cocoa husk Nestlé UK Non-uniform particles
Approximate moisture
content on arrival: 13 %
Fig 3.4, 3.11
Cellulose SigmaAldrich Form: fibres
Particle size: medium
Fig. 2.8, Table
2.1, Fig. 2.12
Lignin Processum
Biorefinery & Umeå
University, Sweden
Produced through acid
hydrolysis of pine wood.
Lignin (alkali) SigmaAldrich Mol wt: average ~10,000
total impurities: 4 %
sulfur
pH: 10.5 (3 wt. %)
Xylan (from
beech wood)
SigmaAldrich >90% xylose residues Table 2.3, Fig.
2.19, 2.21
sodium lauryl
sulfate
SigmaAldrich ACS reagent
Assay: ≥99.0 %

Chapter 7: Experimental methods
137
Total impurities:
≤0.06 meq/g Titr. Base
≤8.0 % NaCl + Na2SO4
≥96.0 % fatty alcohols
<4.0 % unsulfated alcohols
Ethylene –
diamine-
tetraacetic
acid disodium
salt dihydrate
SigmaAldrich ACS reagent
Assay: 99.0-101.0 %
total impurities:
≤0.005 % insoluble matter
≤0.1 % Nitrilotriacetic acid
([HOCOCH2]3N)
pH: 4.0-6.0 (25 °C, 5 %)
disodium
hydrogen
phosphate
SigmaAldrich ACS reagent
Assay: ≥99.0 %
total impurities:
≤0.002 % Chloride (Cl)
≤0.01 % insoluble matter
≤0.2 % loss on drying, 105 °C
pH: 8.7-9.3 (25 °C, 5 % in solution)
sodium
tetraborate
decahydrate
SigmaAldrich ACS reagent
Assay: ≥99.5 %
total impurities:
≤0.005 % insoluble matter
pH: 9.15-9.20 (25 °C, 0.01 M in solution)
Analytical grade acetone, ethanol and dichloromethane were obtained from Fisher
Scientific. Gases used for elemental analysis were high purity oxygen (BOC), with
CP-grade He as the inert carrier gas (BOC).
Before use, biomass samples were oven dried at 110 oC until a constant weight was
reached. Samples were then kept at atmospheric conditions before use resulting in
an average moisture content of 4 – 7 %.

Chapter 7: Experimental methods
138
7.2 Sample preparation
7.2.1 Study of direct microwave effect on cellulose (Chapter 2)
Using a glass pipette, sealed at one end, a narrow closely packed column of cellulose
was prepared. The upper half of the column was wrapped with aluminium foil to
protect from microwave energy. The column was then placed in a microwave tube
filled with tetradecane to ensure even distribution of heat throughout the tube
(Figure 7.1). The microwave tube was placed in a CEM Discovery laboratory
microwave (power: 300 W) and heated to 300 oC. The sample was visually
examined after heating to determine any differences in behaviour due to exposure to
microwave irradiation.
Fig. 7.1: Investigation of direct microwave effect
7.2.2 Microwave treatment of biomass for char production (scale: <1 g) (Chapter 2
& 3)
Biomass sample (200 mg) was weighed out into a microwave tube containing a
magnetic stirring flea, and then sealed using the microwave tube lid. The sample was
placed in a reaction tube in a CEM Discovery laboratory microwave. The sample
was irradiated under constant power of 300 W to reach the target temperature (100-

Chapter 7: Experimental methods
139
300 oC) after which the sample was immediately cooled, Figure 7.2 shows a typical
heating profile for cellulose. After microwave treatment, the sample was removed
from the vessel and washed with acetone to remove condensed volatile components.
The mass of solid lost as a result of microwave treatment was carefully monitored.
The calorific value of the dried solid was measured using a Stanton Redcroft STA
625 as outlined in 7.3.1.
Fig. 7.2: Typical heating profile for preparation of cellulose sample in CEM
discovery (scale < 1 g)
7.2.3 Preparation of conventional chars through slow pyrolysis and torrefation
(Chapter 2 & 3)
Conventional chars were prepared in a Netzsch STA 409. The raw material was
heated to a target temperature at a rate of 10 oCmin-1 under a flow of N2 (100
mLmin-1) in order to keep ramp rate similar to microwave preparation. The sample
was cooled quickly by increasing the flow of N2 to 500 mLmin-1
.

Chapter 7: Experimental methods
140
7.2.4 Microwave treatment of biomass for char and oil production (scale: 2-6 g)
(Chapter 3)
The biomass sample (2-6 g) was weighed out into a round bottom flask. Using a
system designed for this work, a two-necked adapter was attached to the round
bottom flask with one inlet allowing a flow of nitrogen to ensure no oxidation of the
materials during the run and the second connected to a water-cooled condenser to
collect the volatile products evolved. A dichloromethane trap was connected in
series with the round bottom flask to capture volatile components, as shown in
Figure 7.3.
Fig. 7.3: Apparatus set-up for microwave processing on 2 – 6 g scale
7.2.5 Microwave treatment of biomass for char and oil production (scale: 8-500g)
(Chapter 3 & 4)
Microwave treatment for samples greater than 8 g was carried out using a Milestone
ROTO SYNTH Rotative Solid Phase Microwave Reactor (Milestone Srl., Italy)
fitted with a VAC 2000 vacuum module in series which allows condensation and

Chapter 7: Experimental methods
141
collection of volatile components (Figure 4.1). Temperature was measured via
remote infrared sensor, and verified by thermocouple measurements during process
development. Both temperature and pressure readings were monitored on the
control panel.
Biomass (8 - 500 g) was weighed into the microwave vessel and placed in the
microwave. The sample was heated under vacuum in the presence of nitrogen.
Volatile components were collected after condensation in the vacuum unit.
Operating conditions were typically: power: 400-1200 W, temperature: 50-250 oC.
7.2.6 Use of additives (Chapter 4.2)
H2SO4:
Wheat straw pellets were agitated in an aqueous solution of sulphuric acid (5 %
w/w). The water was removed in vacu at 60 oC resulting in deposition of 5 % w/w
H2SO4 on the wheat straw sample.
NH3, HCl:
Ammonia and hydrochloric acid were introduced into the sample as gases produced
following the equations (1) and (2). The gas flowed through the sample which was
mixed repeatedly during the process to ensure even distribution throughout. The
final concentration of additive on the wheat straw was approx 5 % w/w as
determined by weighing the sample before and after process.
Equation (1): NH4Cl + NaOH → NH3 + NaCl + H2O
Equation (2): 2NaCl + H2SO4 → 2HCl + Na2SO4
7.2.7 Microwave treatment of biomass for char and oil production (scale: 5-50 kg)
(Chapter 5.2)
Pilot scale processing of biomass was carried out using the facilities at Rotawave
Ltd., Sandycroft, Clwyd. Biomass samples of up to 20 kg were fed into the rotary
microwave system, through the feed valve. The sample enters between the 2 valves

Chapter 7: Experimental methods
142
shown (Figure 5.6), where the system is flushed with N2 before addition to the
microwave chamber. The sample has an average residence time in the chamber of
15 minutes before discharge through a similar air locked system, maintaining an
inert processing environment.
7.2.8 Formation of expanded materials from lignin (Chapter 5.1)
Suspensions of lignin (100 g/L) were prepared in NaOH (2 N). The aqueous
mixture (4 mL) was heated in the microwave under various conditions
(Temperature: 180 – 200 oC; Time: 5 – 20 min; Power: 100-300 W). Sulfuric acid
(30% v/v) was added drop-wise to the resulting solution until a gel was seen to form.
A solvent exchange was carried out on the stable gel to produce powder (Figure 5.1).
Water was replaced with a lower surface tension solvent to prevent damaging the
structure during drying, by sequentially washing five times with ethanol (30 mL)
and three times with acetone (20 mL).1 The product was thereafter dried under
vacuum over night at 60 oC to yield a powder.

Chapter 7: Experimental methods
143
area under peak (mcal/mg) * 4.1868
dry mass (%)
7.3 Characterisation of feedstocks and products
7.3.1 Measurement of calorific value (Chapters 2-5)
Calorific value (low heating value) measurements were carried out on a Stanton
Redcroft Simultaneous Thermal analyzer, STA 625 using a method developed by
Dr. V. Budarin and Dr. P. Shuttleworth. A 50:50 mixture of biomass and palladium
oxide was heated at 5 ºC min-1
from 20 ºC to 625 ºC in a 50 mL min-1
flow of air and
the low heating value was calculated by integrating the resulting thermogram.
Figure 7.4 shows a typical thermogram, calorific value (CV) was calculated using
the formula below:
C.V. (J/g) =
Fig. 7.4: Typical thermogram collected for measurement of calorific value

Chapter 7: Experimental methods
144
Worked example:
Using the data shown in Figure 7.6, the calorific value can be calculated as:
The method was calibrated through measurement of calorific value of standard
carbohydrate materials and validated through comparison with external
measurements on twin samples (see Appendix 1 for external analysis data).
7.3.2 Infra-red analysis (Chapters 2 – 5)
Diffuse reflectance infrared Fourier transform (DRIFT) spectra were recorded on a
Bruker EQUINOX-55 instrument equipped with a liquid N2 cooled MCT detector.
The samples for DRIFT studies were prepared by grinding the analyte to a fine
powder using a pestle and mortar. Typically 0.2-0.5 wt % of sample in KBr (as a
diluent) was ground together. 1024 scans were used to compile each spectrum with a
resolution of 2 cm-1
.
DRIFT spectra were recorded for samples of cellulose at 10 - 15 oC temperature
intervals between 120 and 230 oC. The samples were loaded in a controlled
temperature chamber and measurements made under a flow of N2 using the
spectrometer setting listed above. The crystallinity index of samples was calculated
from the ratios of the absorbance bands A1430/A898.2, 3
7.3.3 Deuteration of cellulose for analysis (Chapter 2)
Cellulose samples were stirred overnight in D2O in a sealed vessel at 180 oC, the
temperature at which all hydroxyl groups in the amorphous region are replaced by
deuterium atoms.4 The cellulose was cooled, filtered and dried under vacuum before
use.

Chapter 7: Experimental methods
145
7.3.4 FTIR analysis of volatile components released during microwave treatment
(Chapter 2)
Cellulose was exposed to microwave irradiation using in the CEM Discovery open
vessel mode. Experiments were done under microwave power 300 W. As shown in
Figure 7.5, volatiles were captured and carried through a heated tube at 200 oC to a
heated cell within a Bruker EQUINOX-55 FTIR instrument equipped with a liquid
N2 cooled MCT detector. 32 scans were used for spectrum recording.
Fig. 7.5: Schematic of experimental set-up
7.3.5 Elemental analysis of biomass and chars (Chapters 2 – 5)
Elemental analysis based on carbon, hydrogen and nitrogen content was carried out
through the departmental service using an Exeter Analytical (Warwick, UK) CE440
Elemental Analyser, calibrated against acetanilide with a S-benzyl-thiouronium
chloride internal standard.
7.3.6 Modulated differential scanning calorimetry (Chapter 2)
Cellulose samples were weighed and sealed in T-Zero aluminium DSC pans topped
with lids containing a pin hole to allow loss of water vapour. The samples were

Chapter 7: Experimental methods
146
equilibrated at 5 oC for 10 min in the DSC chamber and then heated to 240
oC under
the following modulated conditions: underlying heating rate, 5 ºC/ minute, an
amplitude of ± 2 ºC, and a period of 60 seconds. The sample size used was between
15 and 20 mg.
7.3.7 Solid-state 13C CP MAS NMR analysis of cellulose and cellulose chars
(Chapter 2)
13
C CP MAS NMR spectra were obtained using a Varian VNMRS spectrometer
operating at 100.56 MHz for 13
C. Referencing for all spectra presented is made with
respect to tetramethylsilane, and was obtained at ambient temperature. Analysis was
performed under standard 13C CP MAS spectral acquisition was performed using a
1H π / 2 pulse of 40.0 µs length and 5.0 s recycle, at a spin rate 6.7 kHz. A 4.0 mm
zirconia rotor was used.
7.3.8 Characterisation of biomass composition (Chapter 3)
Ethanol-soluble components were determined by two sequential 250 mL ethanol
soxhlet extractions of 50 g of biomass. The amount extracted was determined by
removal of ethanol in vacu and measurement of the mass of the remaining residue.
Plant cell wall constituents were determined following the procedure outlined by
Soest et al. A neutral detergent solution was prepared by adding to 1 L of distilled
water: 30 g of sodium lauryl sulphate, 18.61 g ethylene diamine tetra acetic acid
sodium salt, 6.81 g sodium tetraborate decahydrate, 4.56 g sodium phosphate dibasic
and 10 mL 2-ethoxy ethanol. The solution was between pH 6.9 – 7.1. 100 ml of the
neutral detergent solution was added to 1 g of biomass in the presence of 2 ml
decahydrate naphthalene and 0.5 g sodium sulfite and refluxed for 1 hour. The solid
was the removed by filtration, washed repeatedly with hot water and dried in the
oven overnight. The mass of solid was taken to be equal to the total mass of cell
wall components and ash in the biomass.5

Chapter 7: Experimental methods
147
Ash content was determined by decomposing the residue in the presence of air at
550 oC until a stable mass was reached.
All values were represented as percentage mass of the starting material. Analysis
was done in duplicate and the average taken.
X-ray Fluorescence (XRF) analysis of feedstocks was carried out by compressing
(~1g) of ground samples of straw or char into a holder and analysed on a Horiba
XGT 7000 X-ray analytical microscope using a standardless independent parameters
method. Each measurement was repeated five times and the average was taken.
7.3.9 Analysis of conventional pyrolysis oil (Chapter 4)
Fast pyrolysis oil was prepared from wheat straw and analysed in-situ. For each
pyrolysis run, approximately 1 mg of sample was place in a 20 mm quartz silica tube
using quartz wool plugs and heated in the pyroprobe in a purge of helium at 20 °C
min-1
to the desired temperature (600 °C). The pyroprobe was held at maximum
temperature for 20 s.
GC was performed using a CDS Analytical Pyroprobe 2000 interfaced to an Agilent
Technologies 6890N Gas Chromatograph, using a CDS 1500 Interface. The oven
was fitted with a 61.3 m, 0.25 mm i.d., 0.25 µm phase (14% cyanopropylphenyl,
86% dimethyl polysiloxane) thickness Rtx 1701 capillary column. An Agilent
Technologies 5975B Inert XL Mass Selective Detector was coupled to the GC. The
oven temperature was held at 40 °C for the first 2 minutes of each run, then heated at
4 °C min-1
to 250 °C, then held at final temp for 30 min, with a total run time of
84.50 minutes. Products were identified by comparison with NIST 08 library.
7.3.10 GC-MS analysis of microwave oils (Chapter 4)
Microwave oils were diluted in methanol (10 mg/ml)for GC analysis and
automatically injected on to the GC using an Agilent 7683 Gas Chromatograph
(injector temperature: 300 oC, volume: 1 µl). The oven was fitted with a Chrompack

Chapter 7: Experimental methods
148
CP-WAX 57 CB polar column for improved separation. The oven temperature was
held at 60 °C for the first 2 minutes of each run, then heated at 6 °C min-1
to 150 °C,
and at 5.6 °C min-1
to 290 °C then held at final temp for 14 min, with a total run time
of 66 min. GC-MS characterisation was carried out under similar conditions using
electron ionisation techniques.
7.3.11 Elemental composition of microwave oils (Chapter 4)
Elemental composition was carried out as outlined for the starting material (7.3.5).
7.3.12 Microwave oils water content (Chapter 4)
Water content was determined using an automated Karl Fisher Coulometer (Mettler
Toledo DL32) by comparison to Karl Fischer Standard reagent (Fluka Chemicals).
Samples were diluted tenfold in methanol before being added to the reaction cell.
7.3.13 Determination of acid number (Chapter 4)
Acid number was measured as the mass of potassiumhydroxide (mg) required to
neutralise 1 g of analyte. The analyte was dissolved in methanol and titrated against
KOH of known concentration in the presence of phenolphthalein. The end point was
indicated by the colour change of colourless to pink. Due to the dark colour of the
analyte it was difficult at times to determine the exact end point. pH measurements
were made using universal indicator paper to validate acid number values.
7.3.14 1H NMR of microwave oils (Chapter 4)
Samples were prepared for 1H NMR analysis by dissolving approximately 10 mg of
sample in 2 mL of deuterated solvent (D2O and (CD3)2CO) . Spectra were recorded
on a JEOL 270 MHz NMR spectrometer using 128 scans in order to improve the
signal to noise ratio. The spectra were interpreted based on integrals of the areas
between 0.5 – 1.5 ppm, 1.5 – 3 ppm, 3 – 4.4 ppm, 4.4 – 6 ppm, 6 – 8.5 ppm and 9.5
– 10 ppm.6 A typical NMR spectrum is shown in Figure 7.6; the spectrum was

Chapter 7: Experimental methods
149
reintegrated in the chosen ranges using JEOL Delta software. The integral values
within specified chemical shift ranges are shown in Appendix 1.
Fig. 7.6: 1H NMR of microwave wheat straw bio-oil
7.3.15 Surface area measurements (Chapter 5)
Surface area measurements were made using a Coulter SA3100. All samples (20-
100 mg) were degassed at 60 oC prior to analysis. Nitrogen adsorption studies were
carried out at 77 K and analysed using the BET method to determine surface area of
the material. Further analysis was carried out on samples with surface area > 50
m2g
-1 using a Micromeritics ASAP 2010 under similar analysis conditions.

Chapter 7: Experimental methods
150
7.4 References
1. J. H. Clark, V. Budarin, F. E. I. Deswarte, J. J. E. Hardy, F. M. Kerton, A. J.
Hunt, R. Luque, D. J. Macquarrie, K. Milkowski, A. Rodriguez, O. Samuel,
S. J. Tavener, R. J. White and A. J. Wilson, Green Chem., 2006, 8, 853-860.
2. R. T. O'Connor, E. F. DuPre and D. Mitcham, Textile Research Journal,
1958, 28, 382-392.
3. S. Y. Oh, D. I. Yoo, Y. Shin, H. C. Kim, H. Y. Kim, Y. S. Chung, W. H.
Park and J. H. Youk, Carbohydrate Research, 2005, 340, 2376-2391.
4. Y. Horikawa and J. Sugiyama, Cellulose, 2008, 15, 419-424.
5. P. J. Van Soest and R. H. Wine, Journal of the Association of Official
Analytical Chemists, 1967, 50, 50-55.
6. C. A. Mullen, G. D. Strahan and A. A. Boateng, Energy & Fuels, 2009, 23,
2707-2718.

Appendices


Appendix 1: Supplementary Data
153
Chapter 2
Table 1: Elemental composition of cellulose and chars
Material
Preparation
Temperature
(oC)
C
(%) ±
H
(%) ±
N
(%)
Rest
(%) ±
Starting material 42.77 0.01 6.03 0.01 0.01 51.21 0.02
Microwave char
150 43.9 0.04 6.14 0 49.97 0.06
200 44.51 0.03 6.00 0.02 -0.04 49.53 0.03
225 45.43 0.05 5.90 0 -0.07 48.75 0.06
250 50.10 0.04 5.38 0.03 -0.04 44.56 0.06
270 64.25 0.01 4.34 0.01 0.01 31.39 0.04
300 68.41 0.01 4.11 0.01 27.37 0.02
Conventional char
220 43.60 0.03 6.11 0.05 50.3 0.01
296 43.79 0.02 6.05 0 50.17 0.03
305 44.19 0.02 6.05 0.01 -0.02 49.79 0.03
324 46.99 0.07 5.76 0.01 -0.06 47.31 0.07
334 51.81 0.02 5.41 0.02 -0.07 42.85 0.04
364 68.72 0.08 4.24 0.02 -0.03 27.08 0.1
450 75.33 0.09 2.5 0.05 0.03 22.15 0

Appendix 1: Supplementary Data
154
Table 2: Elemental composition of xylan and chars
Material
Preparation
Temperature
(oC)
C
(%) ±
H
(%) ±
N
(%)
Rest
(%) ±
Starting material 39.5 0.04 5.90 0.04 -0.01 54.61 0.08
Microwave char
180 43.36 0.07 5.70 0.05 - 50.95 0.07
200 46.30 0.13 5.62 - -0.03 48.11 0.1
220 52.48 0.06 5.39 0.03 0.02 42.11 0.08
240 56.3 0.05 5.15 0.01 0.04 38.51 0.05
260 61.43 0.72 4.95 0.10 0.04 33.57 0.64
300 66.66 0.05 4.72 0.03 -0.03 28.65 0.12
Conventional char
200 43.18 0.01 5.72 0.05 - 51.12 0.01
220 42.04 0.04 5.74 0.05 - 52.23 0.03
240 43.82 0.08 5.56 0.02 0.02 50.6 0.08
270 47.49 0.2 5.55 0.05 - 46.95 0.2
285 53.83 0.02 5.36 0 - 40.8 0.01
300 60.48 0 5.07 0.01 0.08 34.45 0.02
400 69.23 0.12 4.68 0.01 0.09 26 0.13
360 63.98 0.01 4.84 0.01 - 31.12 0.02

Appendix 1: Supplementary Data
155
Chapter 3
Table 3: Elemental composition of biomass and chars
Material
Preparation
Temperature
(oC)
C
(%) ±
H
(%) ±
N
(%)
Rest
(%) ±
Miscanthus
Starting material 41.88 0.32 5.29 0.02 0.7 52.18 0.59
Char
25 min
800 W 125 48.38 0.11 4.62 0.05 0.93 46.08 0.13
25 min
1200 W 152 50.16 0.1 4.40 0.01 0.92 44.53 0.08
conventional 640 59.38 0.68 1.86 0.05 0.76 38.01 0.69
Wheat straw
Starting material 40.21 0.23 5.34 0.12 0.7 53.76 0.5
Char
Pellet 5 min
1200 W 182 54.86 2.03 3.90 0.164 0.91 40.34 2.18
WS 07 25 min
1200 W 171 54.38 0.19 4.58 0.31 0.63 40.41 0.17
WS 08 25 min
1200 W 164 49.80 0.1 4.81 - 0.76 44.63 0.13
conventional 640 67.46 0.05 1.97 0.05 0.93 29.64 2.15
Cocoa husk
Starting material 42.24 0.2 5.4 0.01 2.9 49.4 0.14
Char
25 min
1200 W 143 47.35 0.32 4.38 0.08 3.32 44.96 0.42
conventional 640 59.21 0.01 1.8 0.01 2.29 36.7 0.05

Appendix 1: Supplementary Data
156
Chapter 4 & 7
Integration of NMR for Figure 4.6
Fig
. 1:
1H
NM
R o
f m
icro
wav
e w
hea
t st
raw
bio
-oil

Appen
dix
1: S
upplem
entary
Data
157
Fig. 2: 1H NMR of microwave wheat straw bio-oil in the presence of HCl

Appendix 1: Supplementary Data
158
Table 4: Integral values within specified chemical shift ranges
Sample
0.5-1.5
ppm
1.5-3
ppm
3-4.4
ppm
4.4-6
ppm
6-8.5
ppm
9.5-10
ppm
Wheat straw microwave
bio-oil 0.55 1.02 0.65 1.13 0.43 0.0489
Wheat straw + H2SO4 53.36 89.87 79.74 150.34 102.83 13.73
Wheat straw + HCl 38.53 74.96 70.2 60.4 29.36 0.94
Wheat straw + NH3 33.44 87.94 72.28 88.42 29.54 1
Fig. 3: FTIR analysis of bio-oil from microwave treatment of wheat straw pellets
in the presence of additives

Appendix 1: Supplementary Data
159
Table 5: Preliminary results of microwave processing of miscanthus and spruce
for production of bio-oil
Sample Mass
(g)
Microwave
power
(W)
Processing
temperature
(OC)
Yield
Char Aqueous Oil Gas*
Spruce 100 1200 140 32.7 35.8 18.1 13.4
Miscanthus 100 1200 100 29.4 17.7 21.3 31.6
*Gas yield calculated by difference

A
ppen
dix
1: S
upplem
entary
Data
160
Ch
ap
ter 5
Table 6: Pilot scale microwave treatment of biomass: available operating conditions, yields and characterisation
Elemental analysis of char (%)
Rest
33.85
42.01
40.62
Note: a) Approximate value (where given). Residues were trapped within system
b) High water content values due to residual water from system washes.
Yield of char was not recorded as samples were discharged into water
N
1.1
1.1
2.5
H
3.95
3.21
2.99
C
61.1
52.67
53.9
Microwave
energy
(kW)
3 - 6
5
2.5 – 4.5
4.5
3.5 - 6
4.6 – 7.5
Operating
temperature
(oC)
166 – 175
117 – 122
109 – 130
105 - 118
160 - 165
151 - 190
Water contentb
(% w/w of oil)
87
92
86
Oil
yielda
(% w/w)
29
17
Mass processed
(kg)
12
4.5 (+ 0.5 kg
H2O)
5 (+ 0.75 kg
H2O)
10.5
2.4
4.3
Biomass sample
Wheat straw
pellets
Oats
Oats
Oats
Miscanthus
Cocoa husk

Appendix 1: Supplementary Data
161
Chapter 6
Assumptions1, 2
:
Field production:
• Field operations, agrochemical inputs, and levels of production described
are typical of the UK.
• For agrochemical inputs the sum of the energy used in the manufacture
and distribution are taken into account.
• Regular non-annual activities are given a proportional value in the annual
C balance.
• Energy used in the manufacture and distribution of the machinery and
replacement parts is included.
• For all calculations it is assumed that 1 L of diesel fuel delivers 51.5 MJ
and emits 1.13 kg C on combustion (accounting for fuel used in the
distribution of diesel).
• A factor of 3.67 to convert from kg C to kg CO2.
Harvesting:
• 10 year average yield of miscanthus was assumed to be 12.3Mgdry matter
(DM) ha-1.
• The crop was harvested using agricultural mowers and baled using
Hesston-type machinery producing bales of approximately 500 kg each
prior to transportation.
• Wheat straw removal is recovered through baling and carting of straw.
Postharvest processing and transport:
• Emissions of 10.5 Mg h-1 are assumed for using a telescopic handler to
load bales prior to transportation.
• Energy use of 110 MJ Mg-1 straw or 8.001 kg CO2 Mg
–1 biomass was
assumed for transportation over an average distance of 150 km using a
large truck carrying 16 Mg of straw and an average fuel consumption of
32.8 L 100km-1.

Appendix 1: Supplementary Data
162
Standard conversions3: 1kW h = 3.6 MJ
Miscanthus:
Yield1 = 12.3 Mg ha
-1 of dry matter y
-1 (taken as average over 10 year growth
cycle)
Energy inputs:
Pre-treatment:
Field production (including planting, harvesting, = 6505 MJ ha-1 y
-1
baling and storage)1 = (6505/12.3) MJ Mg
-1
= 528.86 MJ Mg-1
= 0.53 kJ g
-1
Transport (average distance 150 km) and processing1= 4430 MJ ha
-1 y
-1
= (4430/12.3) MJ Mg-1
= 360.13 MJ Mg-1
= 0.36 kJ g
-1
Microwave processing:
Following the procedure outlined in 7.2.4, 50 g of miscanthus was exposed to
microwave irradiation for 30 min at a constant power of 1200 W to produce a
char of calorific value 24.59 kJg-1.
(1200 W)(0.5 hr) = (0.6 kW h)(3.6) = (2.6 kJ)/(50 g) = 0.043 kJ g-1

Appendix 1: Supplementary Data
163
Wheat straw:
Yield1 = 5.68 Mg ha
-1 of dry matter y
-1
Energy inputs:
Field production (including harvesting, baling = 2024 MJ ha-1 y
-1
and storage)1 = (2404/5.68) MJ Mg
-1
= 356.3 MJ Mg-1
= 0.36 kJ g
-1
Peletisation2 = 28 kW h tonne
-1
= (28)(3.6) MJ tonne-1
= 100.8 MJ tonne-1
= 0.1 kJ g-1
Transport (average distance 150 km) and processing1= 2410 MJ ha
-1 y
-1
= (2410/5.68) MJ Mg-1
= 424.29 MJ Mg-1
= 0.42 kJ g
-1
If peletisation is done prior to transport ~2.5 times less energy is used per tonne
due to the increased bulk density.4 As a result, the energy used for transport of
wheat straw pellets is (0.42/2.5) = 0.16 kJg-1.
Following the procedure outlined in 7.2.4, 50 g of wheat straw pellets were
exposed to microwave irradiation for 10 min at a constant power of 1200 W to
produce a char of calorific value 22.0 kJg-1.
(1200 W)(0.166 hr) = (0.2 kW h)(3.6) = (0.72 kJ)/(50 g) = 0.014 kJ g-1

A
ppen
dix
1: S
upplem
entary
Data
164
Chap
ter 7
Extern
al valid
ation o
f char an
alysis.
1691
Test Report: 08-000
Our Ref: CSL8073 SC3371
Supplier: Drax Power Ltd Test Date:
Grade: Pyrolisis Char Date Reported:
Date Sampled: 24.01.08 Sampling:
DPL10-08 Procedures used:
Method As As DryReference Units Received Analysed Dry Ash Free
calP/01 Total % 3.7 - - -
cplP/05 Free % 0.54 - - -
calP/03 Inherent % - 3.16 - -calP/01 Analysis % - 3.14 - -
calP/02 Ash % 17.5 17.6 18.1 -
calP/04 Volatile Matter % 22.7 22.9 23.6 28.8
calP/26 Fixed Carbon % 56.1 56.4 58.3 71.2 Trace Element Analysis
calP/01 Total Sulphur % 0.54 0.54 0.56 0.68 Element Result Limit
calP/06 Chlorine % 0.01 0.01 0.01 0.01 mg/kg mg/kg
astmD5373 Carbon % 66.4 66.8 68.9 84.2 Arsenic* 0.10 5
astmD5373 Hydrogen % 2.28 2.29 2.36 2.89 Cadmium* <0.01 3
calP/25 Hydrogen (calc.) % 3.52 3.54 3.65 4.46 Chromium* 0.4 30
astmD5373 Nitrogen % 5.84 5.87 6.06 7.40 Copper* 5.7 50
calP/07 Gross kJ/kg 26028 26175 27024 33003 Lead* 0.1 20
calP/25 Net(H calc.) kJ/kg 25144 - - - Mercury* <0.01 0.10
calP/25 Net(H det.) kJ/kg 25407 - - - Nickel* 0.4 30
- Energy MWh/t 7.058 - - - Vanadium* 0.1 20
Zinc* 67.9 80
Boron* 14 -
Fluorine* 3455 -
Report Authorised byBBBBBBBBBBBBBBBBBBBB RWE npower plc
G Maloney Oil and Fuel Laboratory Head Central Support Laboratories
Note: Drax Business Park
Tests marked* are externally sourced analysis Selby, North Yorkshire
Test results relate solely to the samples tested YO8 8PQ
The sampling, sample preparation, tests and associated comments in this report are not UKAS accredited Tel: 01757 613837
Fax: 01757 613840
Fuel Analysis Report
Results Basis
30/01/2008
03/03/2008
Samples taken by Client
As Method
T180 >8000
Hardgrove Index Unsuitable Sample
Ultimate
Proximate
Moisture
Calorif ic
Value

Appendix 1: Supplementary Data
165
References
1. J. L. Gaunt and J. Lehmann, Environmental Science & Technology, 2008,
42, 4152-4158.
2. C. N. Hamelinck, R. A. A. Suurs and A. P. C. Faaij, Biomass and
Bioenergy, 2005, 29, 114-134.
3. A. Thompson and B. Taylor, NIST Special Publication, 2008, 811, 23-24.
4. E. Areikin and D. Turley, Aspects of Applied Biology, 2008, 90, 331-335.

Appendix 1: Supplementary Data
166

Appendix 2: Published Work
167
Lanigan, B.; Budarin, V.; Clark, J.; Shuttleworth, P.; Deswarte, F.; Wilson A.,
Microwave processing as a green and energy efficient technology for the
production of energy and chemicals from biomass and energy crops. Aspects of
Applied Biology 2008, 90, 277-282.
Budarin, V. L.; Clark, J. H.; Lanigan, B. A.; Shuttleworth, P.; Breeden, S. W.;
Wilson, A. J.; Macquarrie, D. J.; Milkowski, K.; Jones, J.; Bridgeman, T.; Ross,
A., The preparation of high-grade bio-oils through the controlled, low
temperature microwave activation of wheat straw. Bioresource Technology 2009,
100 (23), 6064-6068.
Budarin, V. L.; Milkowski, K.J.; Shuttleworth, P.; Lanigan, B.; Clark, J.H.;
Macquarrie, D.J.; Wilson, A.J.; Patent Application: WO 2010/001137
Microwave torrefaction of Biomass, 2010. (Figures, examples and claims not
included)
Budarin, V. L.; Clark, J. H.; Lanigan, B. A.; Shuttleworth, P.; Macquarrie, D. J.,
Microwave assisted decomposition of cellulose: A new thermochemical route for
biomass exploitation. Bioresource Technology 2010, 101 (10), 3776-3779.
Budarin, V. L.; Shuttleworth, P.; Dodson, J. R.; Hunt, A. J.; Lanigan, B. A.;
Marriott, R.; Milkowski, K.J.; Wilson, A. J.; Breedon, S. W.; Fan, J.; Sin, E. H.;
Clark, J. H., Use of green chemical technologies in an integrated biorefinery
Energy & Environmental Science 2011, DOI: 10.1039/c0ee00184h


Aspects of Applied Biology 90, 2008
Biomass and Energy Crops III
277
Microwave processing as a green and energy efficient technology for
the production of energy and chemicals from biomass and energy
crops
By B LANIGAN, V BUDARIN, J CLARK, F DESWARTE, P SHUTTLEWORTH
and A WILSON
Green Chemistry Centre of Excellence, Department of Chemistry, University of York,
York, YO10 5DD UK
Summary
There is increasing interest in the use of renewable means of energy production to meet
society’s growing energy demands in a sustainable manner. Among the several options
available, a lot of attention has been focused on the production of energy through the
co-firing of biomass with coal in existing power stations. The largest coal fired power
plant in the UK, Drax Power Ltd, aim to produce 10% of their energy output from the
combustion of biomass by 2009. The use of biomass in electricity production faces
challenges due its high moisture content, comparatively low calorific value, relative
to coal, and material handling issues. Here we show that low temperature mobile
microwave technology can be used as an energy efficient method to significantly improve
the fuel properties of biomass feedstocks including calorific value, moisture content and
grindability.
Keywords: Biomass, microwave, calorific value, co-firing
Introduction
Conventional electricity production relies on the combustion of fossil fuels, resulting in the
release of carbon which has been stored in the earth for several millennia, which is contributing
to the heating of the planet’s atmosphere and hence climate change. Of all sources of CO2, the
burning of fossil fuels for electricity production is responsible for the greatest proportion of
emissions; therefore the replacement of fossil fuels is vital for the reduction of our impact on
global warming. The partial replacement of fossil fuels with biomass can be done with minimal
changes to conventional burners and results in a reduction of the net CO2 released during energy
production. The CO2 released during combustion of biomass is seen as being equivalent to that
captured through photosynthesis during growth, as illustrated in Fig. 1, reducing the carbon
footprint of energy production.
The use of biomass in energy production faces challenges due its low calorific value when
compared to oil or coal. Whilst biomass is a cleaner fuel than coal, generally with lower sulfur
content, the corrosive properties of biomass ash and the formation of tar during combustion can
result in damage of burners and fouling of down stream systems (Prins et al., 2006). The inherent
high moisture content and highly oxygenated nature of biomass means that the efficiency of
energy production is not optimised when used for direct combustion. Biomass also raises material
handling issues and is energy inefficient to transport in its raw state due to the low energy density,

278
and high water content (Demirbas, 2004, Prins et al., 2006).
Fig. 1. Carbon cycle.
When focussing on pre-treatment methods for biomass, there are three main thermal processes of
energy densification, namely: gasification, pyrolysis and torrefaction. Each process converts the
biomass to a preferred form which may then be used for energy production as outlined in Fig. 2.
Fig. 2. Thermal transformations of biomass for energy production.
Co-firing of biomass requires the feedstock to be transformed into a solid with physical
characteristics to coal, and preferably with a higher calorific value than is usually associated with
biomass. The energy consumed in the upgrading procedure is also a vital consideration, ensuring
more energy is not used in the treatment process than is gained from the increased calorific value
of the final fuel.
Microwave processing has been examined as a possible method of preparation of fuels from
biomass. Microwave chemistry offers many advantages over conventional methods of heating.
Overall the process is more energy efficient as microwave irradiation heats the whole volume of
a sample while conventional heating heats the sample in contact with the reaction vessel before
the bulk (Kappe, 2004). The application of microwave technology in high throughput reactions
such as flow reactors has proven the large scale applicability of microwave technology (Roberts
& Strauss, 2005; Wilson et al., 2004).
Microwave pyrolysis of biomass has been carried out on a variety of substrates. The majority

279
of work which has been carried out focuses on high temperature processes generally between
500–1000oC, producing char, oil and gas products with calorific values up to 7, 37 and 10 kJ g-1
respectively, while the typical values for petroleum derived fuels with 32, 42 and 14 kJ kg-1 for
coal, oil and gas (Domínguez et al., 2007, Domínguez et al., 2006; Menendez et al., 2007, Yu et
al., 2006).
In our work we chose to focus on low temperature processing of biomass for the production of
solid fuel for use in energy production.
Materials & Methods
Char preparation
Chars were prepared using a CEM Discovery laboratory microwave. The biomass was processed
in the “open vessel” mode under a flow of N2, with adequate stirring. Volatile components evolved
during processing were collected through a water cooled condenser connected in series to the
system. (U.K. Patent Application)
Measurement of calorific value
The calorific value of the resulting char was measured using a Stanton Redcroft STA 625. Solid
residue (~ 20 mg), that had been subjected to microwave irradiation, was weighed out. To this
sample, palladium oxide (~ 20 mg) was added. The mixture was ground using a pestle and mortar
until a very fine powder was formed. Approximately 2.5 mg of the mixture was added to an
aluminium STA sample cup, and then placed in the STA for analysis. The conditions of analysis
were 20 to 625ºC at 5ºC per minute in a flow of air (50 mL min-1).
Measurement of energy usage
Choosing cellulose as the key component of biomass, chars were prepared as outlined above on
a scale varying from 2–8 g of starting material in a CEM discovery microwave. Samples between
20–200 g were treated under similar conditions using a Milestone SPMR (Solid Phase Microwave
Reactor) System fitted with a VAC 2000 vacuum module in series which allows condensation
and collection of volatile components. The energy demand of the process was measured using a
domestic power metre.
Results
The results of microwave treatment of rape meal are outlined in Fig. 3. As is the standard
procedure for rape seeds, initial physical crushing produced a primary oil with possible application
in production of biodiesel. The resulting rape meal, which is usually used as animal feed, was
extracted via microwave steam-distillation at 100 oC to yield another portion of similar quality oil
along with residual water. Further processing of the rape meal at higher temperatures yielded a
secondary oil and char with higher calorific value than the starting material.
Analysis of rape meal char showed it to contain up to 17.5% ash, 3.7% moisture and all minerals
present were below safe levels.
The energy consideration for the microwave processing was monitored for char preparation on
varying scales. Fig. 4 shows the energy spent per gram of biomass processed at 280oC for the
production of a high calorific value char. The energy used per gram is shown to drop dramatically
with increased mass of sample.

280
Fig. 3. Results of microwave treatment of rape seed.
Fig. 4. Energy usage for char preparation per gram of starting material.
Discussion
As outlined in Table 1, the fuel product of our process possesses many advantages over untreated
biomass in terms of suitability for use co-firing with coal. Untreated biomass not only is a poor
fuel due low energy content per unit mass, but also as a result of the associated material handling
issues. Biomass fuels are known to self-heat during long-term storage, releasing harmful volatile
vapours which poses risks through inhalation and self ignition (Lehtikangas; 2000, Arshadi et al.,
2007). The diverse character of biomass in terms of its physical form may necessitate feedstock-
specific procedures when used untreated, as a result power plants may be tied to a specific
feedstock leaving them susceptible to seasonal variations in crop properties and yields. The final
solid product of our procedure is a dry fuel suitable for pelletisation and/or micronistation. The
suitability of the final product for micronisation is independent of feedstock, therefore offers
flexibility to the end user in terms of feedstocks used.

281
Table 1. Advantages of biomass treatment for production of a solid fuel
Disadvantages of biomass as solid fuel Advantages of treated biomass as solid fuel
High water content Low water content
Low energy density High calorific value
High O/C ratio Low O/C ratio
Poor long term stability Stable for long term storage
Risk of self-ignition on storage Stable for long term storage
Feedstock-specific material handling
Analysis of rape meal char was carried out in terms of the suitability of the char for fuel usage,
grindability, elemental composition, ash content and moisture content (Table 2). From the
perspective of materials handling, the solid was deemed suitable for co-firing with coal. The
calorific value, 24 kJ g-1, compares favourably to other fuels (Table 3).
Table 2. Properties of biomass char
Moisture content 3.7 %
Ash content 17.5 %
Sulphur 0.54 %
Chlorine 0.01 %
Table 3. Calorific value of selected solid fuels(Environmental Agency, 2008)
Fuel Calorific Value
kJg-1
Energy
MWh/t
Wood chips (30 % moisture) 12.6 3.5
Wood Pellets 18–20 5–5.6
House coal 27–31 7.5–8.6
Anthracite 33 9.2
Oil 42 11.7
The use of rape meal as a feedstock for fuel production also compares well from a financial point
of view as the cost of coal increases (Table 4). The cost of processing the rape meal to improve
the energy density of the char will add to the price of the solid fuel but this price is negated by the
saving in transport of the densified fuel.
Table 4. Price Comparison for Power Generation (Environmental Agency, 2008)
Fuel Price per tonnea Cost per kWh
Wood chips (30 % MC) £ 60 1.7 p/kWh
Wood Pellets £ 170 3.5 p/kWh
Coal £420 5.3 p/kWh
Rape meal £200b 2.8 p/kWha Price quoted June 2008. b Does not include cost of microwave processing

282
References
U.K. Patent Application, GB0812288.9. 2008. www.draxgroup.plc.uk.
Arshadi M, Nilsson D, Geladi P. 2007. Monitoring chemical changes for stored sawdust from pine
and spruce using gas chromatography-mass spectrometry and visible-near infrared spectroscopy.
Journal of Infrared Spectroscopy 15:319–386.
Demirbas A. 2004. Combustion characteristics of different biomass fuels. Progress in Energy
and Combustion Science 30:219–230.
Domínguez A, Menéndez J, Fernández Y, Pis J J, Nabais J M V, Carrott, P J M, Carrott M
M L R. 2007. Conventional and microwave induced pyrolysis of coffee hulls for the production
of a hydrogen rich fuel gas. Journal of Analytical and Applied Pyrolysis 79:128–135.
Domínguez A, Menendez J A, Inguanzo M, Pis J J. 2006. Production of bio-fuels by high
temperature pyrolysis of sewage sludge using conventional and microwave heating. Bioresource
Technology 97:1185–1193.
Environmental Agency. 2008. http://www.biomassenergycentre.org.uk.
Kappe O. 2004. Controlled Microwave Heating in Modern Organic Synthesis. Angewandte
Chemie International Edition, 43:6250–6284.
Lehtikangas P. 2000. Storage effects on pelletised sawdust, logging residues and bark. Biomass
and Bioenergy, 19:287–293.
Menendez, J A, Dominguez A, Fernandez, Y, Pis J J. 2007 Evidence of Self-Gasification during
the Microwave-Induced Pyrolysis of Coffee Hulls. Energy & Fuels 21:373–378.
Prins M J, Ptasinski K J, Janssen F J J G. 2006. More efficient biomass gasification via
torrefaction. Energy 31:3458–3470.
Roberts B A, Strauss C R. 2005 Toward Rapid, “Green”, Predictable Microwave-Assisted
Synthesis. Acc. Chem. Res. 38:653–661.
Wilson N S, Sarko C R, Roth G P. 2004 Development and Applications of a Practical Continuous
Flow Microwave Cell. Organic Process Research & Development 8:535–538.
Yu F, Ruan R, Deng S P, Chen P, Lin X. 2006 Microwave Pyrolysis of Biomass ASABE Annual
International Meeting. Portland, Oregan.

The preparation of high-grade bio-oils through the controlled, low
temperature microwave activation of wheat straw
Vitaly L. Budarin a, James H. Clark a,*, Brigid A. Lanigan a, Peter Shuttleworth a, Simon W. Breeden a,Ashley J. Wilson a, Duncan J. Macquarrie a, Kris Milkowski a, Jenny Jones b,Toby Bridgeman b, Andy Ross b
aGreen Chemistry Centre of Excellence, University of York, York YO10 5DD, UKb Energy and Resources Research Institute, Faculty of Engineering, University of Leeds, Leeds, UK
a r t i c l e i n f o
Article history:
Received 7 April 2009
Received in revised form 17 June 2009
Accepted 18 June 2009
Available online 16 July 2009
Keywords:
Biomass
Pyrolysis oil
Microwave
Wheat straw
a b s t r a c t
The low temperature microwave activation of biomass has been investigated as a novel, energy efficient
route to bio-oils. The properties of the bio-oil produced were considered in terms of fuel suitability.
Water content, elemental composition and calorific value have all been found to be comparable to and
in many cases better than conventional pyrolysis oils. Compositional analysis shows further differences
with conventional pyrolysis oils including simpler chemical mixtures, which have potential as fuel and
chemical intermediates. The use of simple additives, e.g. HCl, H2SO4 and NH3, affects the process product
distribution, along with changes in the chemical composition of the oils. Clearly the use of our low tem-
perature technology gives significant advantages in terms of preparing a product that is much closer to
that which is required for transport fuel applications.
Ó 2009 Elsevier Ltd. All rights reserved.
1. Introduction
The replacement of fossil resources with sustainable (renew-
able) sources of carbon is one of the major routes to a low carbon
solution for future global energy and chemicals supplies. The tran-
sition to a renewable based society brings with it substantial envi-
ronmental, economic and social benefits.
Several national and trans-national legislation, policy and
incentives have been set to increase the proportion of biomass
being used for energy production (Williams et al., 2006). Biomass
is a fully renewable, widely distributed resource that should
increasingly be used for the production of heat and power, liquid
fuels, chemicals and many (e.g. polymeric) materials. One way to
exploit the energy potential of biomass such as wheat straw is
through combustion. However, direct combustion is inefficient
due to low energy density and high water content (Demirbas,
2004).
Various biochemical and thermochemical processes have been
researched for the upgrading of biomass for fuel use. While both
methods of processing can be used to produce fuels and chemicals,
thermochemical processing can be seen as being the easiest to
adapt to current energy infrastructure. Pyrolysis is a medium tem-
perature process resulting in the liquefaction of the biomass into a
complex mixture of organic compounds. The pyrolysis products
face challenges in terms of fuel application due to unfavourable
properties such as high acidity, high water and alkali metal con-
tents making them difficult to exploit as fuels (Mohan et al., 2006).
It is clear that new, clean and efficient biomass conversion tech-
nologies are needed if we are to better exploit the carbon potential
of biomass.
Microwave technology has been shown to be an energy efficient
method for chemical processing and has become widely accepted
as a mild and controllable processing tool (Gronnow et al., 2005).
Microwaves are not only useful as alternative methods of heating;
there is also a good body of evidence to suggest they can cause spe-
cific molecular activations (De la Hoz et al., 2005). Microwave pro-
cessing has now been shown to be effective at pilot scale and at
large continuous processing scale, for example in waste treatment
(Clark and Sutton, 1996).
The use of microwaves to activate biomass dates back to the
1970s (Allan et al., 1980). Microwave reactors for on-farm process-
ing (to reduce transportation costs) have also been highlighted as a
future possibility. Among the published studies, the optimisation
of wood pyrolysis to maximise production of levoglucosan, a useful
chemical intermediate, has been described (Miura et al., 2001).
Optimising the calorific value of biomass pyrolysis products has
also been studied but reasonable values for bio-oils have inevitably
been at the cost of yield (Ruan et al., 2008). Almost all of the
0960-8524/$ - see front matter Ó 2009 Elsevier Ltd. All rights reserved.
doi:10.1016/j.biortech.2009.06.068
* Corresponding author.
E-mail address: [email protected] (J.H. Clark).
Bioresource Technology 100 (2009) 6064–6068
Contents lists available at ScienceDirect
Bioresource Technology
journal homepage: www.elsevier .com/locate /bior tech

published work in this area has been carried out at temperatures
above 350 °C with reported benefits including high rates of pyroly-
sis, good energy efficiency and better controllability than conven-
tional pyrolysis (Yu et al., 2007; Dominguez et al., 2007). In order
to maximise process efficiency and examine the possibility of im-
proved process control our studies focussed on microwave pro-
cessing at temperatures below 350 °C.
Low temperature microwave-induced pyrolysis has rarely been
reported and we report here our results from a study of the low
temperature microwave activation of wheat straw to produce
bio-oils. By working at low temperatures and by running the pro-
cess with continuous separation we hope to get better control over
the biomass decomposition and separate the undesirable water
and water-soluble components and thus get closer to fuel-ready
oils than has previously been achieved.
2. Methods
2.1. Raw materials
Wheat straw pellets were obtained from Charles Jackson Farms,
UK. Initial analysis of the pellets as received showed a moisture
content of approximately 10%. Elemental analysis based on carbon,
hydrogen and nitrogen content was carried out using an Exeter
Analytical (Warwick, UK) CE440 Elemental Analyser, calibrated
against acetanilide with a S-benzyl-thiouronium chloride internal
standard. CHN wt% of the starting material was 40.21%, 5.34%
and 0.7% respectively.
2.2. Use of additives
Wheat straw pellets were mixed in an aqueous solution of sul-
phuric acid (10% w/w) to ensure even distribution throughout the
sample. The water was removed in vacu at 60 °C. Ammonia and HCl
(3% v/v) were introduced into the sample as a gas. As previously,
the sample was mixed thoroughly.
2.3. Microwave processing of materials
The microwave treatment of wheat straw pellets was carried
out using a Milestone ROTO SYNTH Rotative Solid Phase Micro-
wave Reactor (Milestone Srl., Italy) fitted with a VAC 2000 vacuum
module in series. Average sample mass was between 150 and
200 g. Samples were exposed to a maximum microwave power
of 1200 W. The sample was heated at a rate of 17 °C/min to a max-
imum temperature of 180 °C, as measured by in situ temperature
probes. Process pressure was monitored at all times. Liquid frac-
tions were collected via the vacuum unit, which collected and con-
densed vapours produced during the process (Fig. 1).
2.4. py-GC–MS of wheat straw
Pyrolysis-GC was performed using a CDS Analytical Pyroprobe
2000 interfaced to an Agilent Technologies 6890 N Gas Chromato-
graph, using a CDS 1500 Interface. The oven was fitted with a
61.3 m, 0.25 mm i.d., 0.25 lm phase (14% cyanopropylphenyl,
86% dimethyl polysiloxane) thickness Rtx 1701 capillary column.
An Agilent Technologies 5975B Inert XL Mass Selective Detector
was coupled to the GC.
For each pyrolysis run, approximately 1 mg of sample was place
in a 20 mm quartz silica tube using quartz wool plugs and heated
in the pyroprobe in a purge of helium at 20 °C mÿ1 to the desired
temperature (600 °C). The pyroprobe was held at maximum tem-
perature for 20 s. The oven temperature was held at 40 °C for the
first 2 min of each run, then heated at 4 °C minÿ1 to 250 °C, then
held at final temp for 30 min, with a total run time of 84.50 min.
This process yields approximately 84% volatiles of the wheat straw
sample which is carried onto the column and 16% char (remaining
in the quartz silica tube).
2.5. Characterisation of liquid fractions
For GC–MS analysis of the microwave oils, approximately 1.0 g
of each oil was diluted in 15 ml of methanol. About 5 ll of this
solution was then automatically injected onto the GC column using
an Agilent 7683 series autosampler. The oils in solutions were ana-
lysed using the same column and operating under the same oven
heating regime as described above. Elemental composition was
carried out as outlined for the starting material. Acid number
was determined by titration. Water content was determined using
a Karl Fisher Coulometer (Mettler Toledo DL32) by comparison to
Karl Fischer Standard reagent (Fluka Chemicals).
3. Results and discussion
3.1. Yields of bio-oils
We have developed an improved microwave process for pro-
duction of oils from biomass. Taking advantage of a microwave
reactor equipped for continuous extraction we have found that,
Fig. 1. Schematic of microwave set-up for collection of liquid fractions. (1) Microwave reactor, (2) sample vessel, (3) system control and monitoring console, (4) water cooled
condenser for collection of organic fraction and (5) vacuum condenser for collection of aqueous fraction and low molecular weight components.
V.L. Budarin et al. / Bioresource Technology 100 (2009) 6064–6068 6065

by exposing the biomass to microwave energy within a rotating
reactor vessel, even distribution of the microwave energy within
the sample volume can be ensured. We also found that by operat-
ing under a vacuum it is possible to fractionate the liquid products
obtained from the process, as shown in Fig. 1. Unexpectedly
though, we have discovered that under these conditions, two sep-
arate processes of volatiles production occur.
By monitoring peaks in the process pressure, we can clearly see
the point at which the volatiles are released (Fig. 2). As a result it is
possible to collect two liquid fractions. The first pressure change
can be seen between 60 and 120 °C and has been correlated to
the evolution of an aqueous fraction containing relatively high lev-
els of acid. Thereafter, and while maintaining a relatively low tem-
perature, an organic fraction of low water and low acid content is
produced at temperatures as low as 120 °C (dependent on biomass
type and presence of additives) and in a very short period of 1–
2 min. Microwave processing of wheat straw pellets under these
conditions has yielded up to 21% of this organic fraction (water
content < 1%). We have concluded from our work that heating
the sample to further elevated temperatures has no positive influ-
ence on oil yields or properties.
3.2. Composition and properties of the bio-oils
The key parameters of the microwave bio-oils were measured
and compared to those of conventional pyrolysis as well as to
those of crude petroleum (Table 1). The differences between
our oil and the pyrolysis oil are striking. When compared with
conventional pyrolysis oil, microwave processing of biomass
has allowed for an alternative distribution of minerals between
the liquid fractions. As a result major impurities such as sulphur,
alkali metals and acids are collected in the aqueous fraction. The
subsequent levels of these impurities are all substantially lower
in the organic fraction of the microwave oils than in conven-
tional pyrolysis oil (less than 10% of the value in all cases). The
lower levels of impurities result in a bio-oil which is more ame-
nable to fuel use, (e.g. for blending in with petroleum after
upgrading). Comparisons with petroleum are not as favourable,
although the acidity and alkali metal content are favourable, both
of which are important factors when considering engine fouling.
The microwave oil may also be seen as a potential source of
chemicals as it is rich in aromatics and anhydro-sugars.
The preparation of bio-oils using microwave treatment at tem-
peratures within the normal pyrolysis range has been reported.
Comparison of the properties and composition of our oils with oth-
ers generated by microwave activation shows that the use of ele-
vated temperatures is unnecessary and possibly detrimental for
the production of bio-oil for fuel use. The bio-oil reported by Yu
et al. (2007) displays a similar carbon content to ours (60.1%),
but has a sulphur content that is seven times higher and a very
high acidity (reported as a pH of 2.87). The bio-oil produced by
Dominguez et al. (2007) while having a higher carbon content
(75%) and a good calorific value (34.4 kJ/mol) has a very high sul-
phur content (over thirty times ours) and was obtained in very
small yields (3%); no acidity value was reported.
Comparison of pyrolysis-GC–MS analysis on samples of wheat
straw using conventional high temperature (600 °C) pyrolysis
conditions and GC–MS analysis of our low temperature micro-
wave processing of wheat straw has shown noteworthy differ-
ences. The volatile composition from the former shows a
typical product distribution for a metal (e.g. in situ potassium)
catalysed decomposition of a lignocellulosic biomass via an ionic
mechanism (Nowakowski et al., 2007). This includes large
amounts of furfural and acetic acid (from the cellulosic compo-
nents), and phenols and methoxyphenols (from the lignin) but
only small quantities of sugars. For our microwave oil furfural
and acetic acid are also present, but in much smaller relative
amounts; phenols, methoxyphenols and their dimers are more
prominent. We also obtain relatively high yields of the sugars
levoglucosan and 1,4:3,6-dianhydro-D-glucopyranose, along with
small but significant amounts of long chain acids including hexa-
decanoic acid. The microwave-generated oil generally shows a
smaller number of prominent peaks and a remarkable one third
of the total peak area can be assigned to the two compounds
levoglucosan and 2,3-dihydrobenzofuran, both of which have va-
lue as chemical or bio fuel intermediates (e.g. levoglucosan to
glucose or citric acid (Zhuang et al., 2001; Helle et al., 2007))
(Table 2).
Fig. 2. Stages of liquid product formation during microwave process.
6066 V.L. Budarin et al. / Bioresource Technology 100 (2009) 6064–6068

3.3. Influence of additives on the composition and properties of the
bio-oils
We have found it possible to affect oil properties through the
use of simple additives which can also affect the oil yield (Table
3). This effect has been found to be dependent on the additive it-
self, rather than on properties such as pH as may be expected.
For example, the addition of sulphuric acid to the sample before
processing results in a significant decrease in the oil yield, to the
benefit of char yield. Interestingly, the addition of the same quan-
Table 1
Comparison of the key parameters of petroleum and bio-oils produced from the conventional pyrolysis and microwave activation of wheat straw.
Property Crude oil Nexant Ltd. (2008) Pyrolysis oil Nexant Ltd. (2008) Microwave oil
Dominguez et al. (2007) Yu et al. (2007) Current work
Water (%) – 15.2 <1
C (wt%) 85–87 45–55 74.8 60.1 58.9
H (wt%) 10–14 6–7 8.3 7.70 6.85
N (wt%) 0.1–2 0.3 7.8 2.02 1.15
O (wt%) 0.1–1.5 40–50 8.5 29.4 33.2
S (wt%) 0 0.5–5 0.6 0.15 0.02
Specific gravity 0.8–1.0 1.2–1.3 – – 1.2
Acid number <1 70–150 – pH 2.87 1.4
Alkali metal 50 100 – 7.6 5.71
LHV (kJ/g) 42 16–21 34.4 17.4 16–22
Table 2
Chemical composition of wheat straw MW-pyrolysis oil.
Compound Percentage area Retention time (min)
Acetic acid 0.84 7.194
Furfural 0.50 14.194
2-Furanmethanol 0.57 16.057
1,2-Cyclopentanedione, 3-methyl- 1.64 22.769
Phenol 2.00 24.154
Phenol, 2-methoxy- 2.73 24.703
Phenol, 2-methyl- 1.16 26.002
Phenol, 3-methyl- 1.23 27.370
Phenol, 4-methyl- 1.50 27.455
Phenol, 2-methoxy-4-methyl- 1.38 28.657
Phenol, 4-ethyl-2-methoxy- 1.57 31.701
1,4:3,6-Dianhydro-a-D-glucopyranose 1.27 32.943
Benzofuran, 2,3-dihydro- 10.66 33.715
Phenol, 2,6-dimethoxy- 4.54 35.586
Phenol, 2-methoxy-4-(1-propenyl)- 2.84 38.196
Vanillin 1.13 38.980
Hydroquinone 1.44 39.185
Ethanone, 1-(4-hydroxy-3-methoxyphenyl)- 0.92 41.566
4-Methyl-2,5-dimethoxybenzaldehyde 2.45 42.779
Homovanillyl alcohol 1.62 43.174
Levoglucosan 27.87 46.309
Phenol, 2,6-dimethoxy-4-(2-propenyl) 3.71 46.636
Ethanone, 1-(4-hydroxy-3,5-dimethoxyphenyl)- 1.07 49.456
Desaspidinol 1.30 50.641
n-Hexadec0anoic acid 0.75 51.871
Table 3
Mass balance of products from the low temperature microwave activation of wheat straw including presence of additives.
Wheat straw pellets Wheat straw pellets + H2SO4 Wheat straw pellets + HCl Wheat straw pellets + NH3
Process conditions
Microwave power 1000 1200 1200 1200
Process temperature 130 140 140 165
Product distribution (mass%)
Char 29 44.4 31.8 40.7
Organics 20.6 7.3 22.1 17.0
Water 36.4 32.9 27.1 22.3
Gas 14 15.4 19 20
Composition of oil (%)a
Desaspidinol 1.3 2.21 2.05 2.74
1,4:3,6-Dianhydro-a-D-glucopyranose 1.27 6.69 3.11 1.22
Levoglucosan 27.87 20.64 35.46 46.44
Levoglucosenone – 23.63 1.51 –
2-Methoxy-4-vinylphenol/benzofuran, 2,3-dihydro- 10.66 1.06 2.80 10.23
Phenol, 2,6-dimethoxy- 4.54 0.54 4.3 3.93
Phenol, 2,6-dimethoxy-4-(2-propenyl) 3.71
Phenol, 2-methoxy- 2.00 2.25 2.57 1.69
a Based on peak area in GC.
V.L. Budarin et al. / Bioresource Technology 100 (2009) 6064–6068 6067

tity of hydrochloric acid has minimal effect on the oil yield. On the
other hand, ammonia can be seen to behave in a similar manner to
sulphuric acid, resulting in a sacrifice of oil yield for greater quan-
tities of char.
GC–MS of the microwave-generated oils obtained from pro-
cesses with HCl, H2SO4 and NH3 as additives gave broadly similar
profiles but some significant changes were evident. The amount
of levoglucosan remained high in all cases but the relative yield
was seen to increase remarkably in the oil obtained by microwa-
ving wheat straw in the presence of ammonia. We believe that
these results support our proposition that by decomposing the bio-
mass at unusually low temperatures, we have been able to obtain
significantly different chemical products and simpler mixtures
which in one case leads to a mixture containing almost 50% of
one compound, a potentially important observation for future sus-
tainable chemical manufacturing.
3.4. Energy balance for the low temperature microwave process
The energy balance has been calculated for a production unit
operating at 6000 kg/h. The energy input includes straw drying
and low temperature activation (pyrolysis). These have been calcu-
lated on the basis of energies required to heat the different compo-
nents of the biomass (including water evaporation for the drying
stage) plus, in the case of the pyrolysis stage, the evaporation of
the organic compounds. The total energy input has been calculated
on the basis of an energy requirement of 474 kJ for the initial dry-
ing along with 1302 kJ for the microwave pyrolysis. The energy va-
lue of the oil produced based on a yield of 20.2% and a worst case
calorific value of 16,000 kJ/kg is 8.98 MJ, over five times the energy
input for the process, 1.78 MJ.
This clearly shows the favourable energy balance for the process
based only on the oil produced. When the energy of the char and
the gas is included the overall energy balance is considerably more
favourable.
4. Conclusions
The low temperature microwave activation of wheat straw pro-
vides a novel, energy efficient route to bio-oils with excellent key
properties for use as bio-fuels. Low sulphur, acid and alkali metal
content are particularly significant for fuel applications. Composi-
tional analysis shows further differences with conventional pyroly-
sis oils including simpler chemicalmixtures. Themicrowave oil also
possesses large percentages of a small number of compounds with
value as fuel and chemical intermediates. Simple additives can be
used to further change the oil properties and composition with
HCl causing a small increases in oil yields andNH3 causing a notable
process selectivity to yield large amounts of a single chemical.
Clearly the use of our low temperature technology gives signif-
icant advantages in terms of preparing a product that is much clo-
ser to that which is required for transport fuel applications, both
when compared to conventional pyrolysis oils and when compared
to bio-oils produced by high temperature microwave processing.
By working at lower temperatures we can also expect to see major
differences in chemical structure and content and with an eye on
possible higher value, chemical applications.
Acknowledgements
We thank Rotawave Ltd. for assisting in the energy balance
calculations based on their large-scale continuous microwave
processor.
Appendix A. Supplementary data
Supplementary data associated with this article can be found, in
the online version, at doi:10.1016/j.biortech.2009.06.068.
References
Allan, G.G., Krieger, B.B., Work, D.W., 1980. Dielectric loss microwave degradation ofpolymers: cellulose. Journal of Applied Polymer Science 25, 1839–1859.
Clark, D.E., Sutton, W.H., 1996. Microwave processing of materials. Annual Reviewof Materials Science 26, 299–331.
De la Hoz, A., Diaz-Ortiz, A., Moreno, A., 2005. Microwaves in organic synthesis.Thermal and non-thermal microwave effect. Chemical Society Review 34, 164–178.
Demirbas, A., 2004. Combustion characteristics of different biomass fuels. Progressin Energy and Combustion Science 30, 219–230.
Dominguez, A., Menendez, J.A., Fernandez, Y., Pis, J.J., Nabais, J.M.V., Carrott, P.J.M.,Carrott, M.M.L.R., 2007. Conventional and microwave induced pyrolysis ofcoffee hulls for the production of a hydrogen rich fuel gas. Journal of Analyticaland Applied Pyrolysis 79, 128–135.
Gronnow, M.J., White, R.J., Clark, J.H., Macquarrie, D.J., 2005. Energy efficiency inchemical reactions: a comparative study of different reaction techniques.Organic Process Research and Development 9, 516–518.
Helle, S., Bennett, N.M., Lau, K., Matsui, J.H., Duff, S.J.B., 2007. A kinetic model forproduction of glucose by hydrolysis of levoglucosan and cellobiosan frompyrolysis oil. Carbohydrate Research 342, 2365–2370.
Miura, M., Kaga, H., Yoshida, T., Ando, K., 2001. Microwave pyrolysis of cellulosicmaterials for the production on anhydrosugars. Journal of Wood Science 47,502–506.
Mohan, D., Pittman, C.U., Steele, P.H., 2006. Pyrolysis of wood/biomass for bio-oil: acritical review. Energy and Fuels 20, 848–889.
Nexant Ltd., 2008. Report 40661: The Exploitation of Pyrolysis Oil in the RefineryMain Report. Prepared for: The Carbon Trust.
Nowakowski, D.J., Jones, J.M., Brydson, R.M.D., Ross, A.B., 2007. Potassium catalysisin the pyrolysis behaviour of short rotation willow coppice. Fuel 86, 2389–2402.
Ruan, R., Chen, P., Hemmingsen, R., Morey, V., Tiffany, D., 2008. Size matters: smalldistributed biomass energy production systems for economic viability.International Journal of Agricultural and Biological Engineering 1, 64–68.
Williams, C.K., Davison, B.H., Britovsek, G., Cairney, J., Eckert, C.H., Frederick, W.J.,Hallett, J.P., Leak, D.J., Liotta, C.L., Mielenz, J.R., Murphy, R., Templer, R.,Tschaplinski, T., 2006. Biofuels in the European Union, A Vision for 2030 andBeyond, E.U. Report, EUR 22066.
Yu, F., Deng, S., Chen, P., Liu, Y., Wan, Y., Olson, A., Kittelson, D., Ruan, R., 2007.Physical and chemical properties of bio-oils from microwave pyrolysis of cornstover. Applied Biochemistry and Biotechnology 137, 597–970.
Zhuang, X.L., Zhang, H.X., Yang, J.Z., Qi, H.Y., 2001. Preparation of levoglucosan bypyrolysis of cellulose and its citric acid fermentation. Bioresource Technology79, 63–66.
6068 V.L. Budarin et al. / Bioresource Technology 100 (2009) 6064–6068


Short Communication
Microwave assisted decomposition of cellulose: A new thermochemical route
for biomass exploitation
Vitaly L. Budarin, James H. Clark *, Brigid A. Lanigan, Peter Shuttleworth, Duncan J. Macquarrie
Green Chemistry Centre of Excellence, University of York, York YO10 5DD, UK
a r t i c l e i n f o
Article history:
Received 6 October 2009
Received in revised form 23 December 2009
Accepted 24 December 2009
Available online 21 January 2010
Keywords:
Cellulose
Microwave
Biofuel
Mechanism
a b s t r a c t
A microwave assisted low temperature decomposition process has been developed for production of high
quality fuels from biomass. 180 °C was identified as key in the process mechanism, as the amorphous
region of cellulose softens allowing a microwave induced rearrangement. Proton transfer is then possible
under the microwave field resulting in acid catalysed decomposition. This low temperature process has
been shown to be suitable for scale-up, producing a high quality char for use as a coal replacement and
bio-oil suitable for upgrading to liquid fuel.
Ó 2009 Elsevier Ltd. All rights reserved.
1. Introduction
The world is facing an energy crisis due to increasing concern
related to fossil fuel use (environmental impact, finite availability,
security of supply); consequently it is vital to optimise the poten-
tial of biomass to power the future. Any future bio-refinery pro-
cesses, which are required, have to be more efficient and flexible
in using a variety of feedstocks in the same installation and have
the possibility to provide up to 30% of world fuel demand on the
base of lignocellulosic biomass without interfering with food
supplies.
Here we show that through understanding the mechanism of
microwave (MW) activation of key plant structural components
an energy efficient, low-temperature MW process (<200 °C) can
be used to enhance the energy value of biomass. The process con-
verts biomass into two energy concentrated fuels, a solid char
which has properties comparable with coal, and oils with proper-
ties superior to those achievable with conventional methods. Due
to the improved process efficiency and the high quality of the prod-
ucts this research offers the opportunity for significant economic
and environmental benefits, with adaptable technologies which
can be installed close to source (Ruan et al., 2008).
Microwave technology has gained acceptance as a mild and
controllable tool, allowing simple and rapid processing. Industrial
scale treatment of food and materials at temperatures below
200 °C has been established as a continuous tonne-scale process
with increased process selectivity (Clark and Sutton, 1996). Micro-
wave treatment of biomass has previously been reported for the
production of fuels. The processes, which were carried out at tem-
peratures associated with conventional pyrolysis (>350 °C), result
in gasification or liquefaction of the starting material to produce
fuels (Menendez et al., 2007). It is our belief that the high temper-
atures and heating rates in previous microwave pyrolysis studies
may be masking important lower temperature processes.
At low temperatures, the efficiency of microwave processes de-
pends greatly on the nature of the material being processed, in
terms of its physical form (structural arrangements, conductivity
and dielectric properties) (Kappe, 2004). Lignocellulosic biomass
consists of three structural polymers along with various extrane-
ous components (Saha, 2004). In this study cellulose, the major
component was chosen as the focus. In order to choose the param-
eters for microwave investigations it is important to know the
temperature points at which structural and molecular changes oc-
cur within cellulose.
2. Methods
2.1. Materials
Fibrous cellulose (medium) (Sigma Aldrich cat. No. C6288-
250G), deuterium oxide and potassium bromide (spectroscopic
grade) were used as received from Sigma Aldrich.
2.2. Microwave treatment for char production
Biomass sample (300 mg) was weighed out into a microwave
tube containing a magnetic follower, and then sealed using the
0960-8524/$ - see front matter Ó 2009 Elsevier Ltd. All rights reserved.
doi:10.1016/j.biortech.2009.12.110
* Corresponding author. Tel.: +44 0 1904 432559; fax: +44 0 1904 432705.
E-mail address: [email protected] (J.H. Clark).
Bioresource Technology 101 (2010) 3776–3779
Contents lists available at ScienceDirect
Bioresource Technology
journal homepage: www.elsevier .com/locate /bior tech

microwave tube lid. The sample was placed in a CEM Discovery
laboratory microwave. The sample was irradiated under varying
conditions (100–300W, 100–300 °C). The mass of solid lost was
carefully monitored by weighing the sample before and after
microwave treatment.
2.3. Modulated differential scanning calorimetry
The methodology was carried out in the same manner as (Picker
and Hoag, 2002).
2.4. FTIR analysis
Diffuse reflectance infrared Fourier transform (DRIFT) spectra
were recorded on a Bruker EQUINOX-55 instrument equipped with
a liquid N2 cooled MCT detector. The samples for DRIFTS studies
were prepared by mechanically grinding all reactants with KBr.
Spectra were recorded using 1024 scans at a 4 cmÿ1 resolution.
2.5. Measurement of calorific value
Calorific value (Low heating value) measurements were carried
out on a Stanton Redcroft Simultaneous Thermal analyzer, STA
625. A 50:50 mixture of biomass and Palladium oxide was heated
at 5 K minÿ1 from 20 °C to 625 °C in a 50 ml minÿ1 flow of air and
the low heating value was calculated by integrating the resulting
thermograms.
2.6. Deuteration of cellulose
The procedure was carried out in the same manner as (Horika-
wa and Sugiyama, 2008).
3. Results and discussion
In order to differentiate between any specific and non-specific
microwave effects an experimental set-up was designed to allow
the homogeneous exposure of biomass to microwave irradiation.
The experiment was based on a narrow packed column in a well
stirred oil bath within the microwave chamber with the top por-
tion of the cellulose protected from microwave irradiation using
aluminium foil (Fig. S1A). The cellulose which had been exposed
to microwave irradiation visibly began to decompose, while the
area above shows little or no decomposition (Fig. S1B). A range
of experiments were carried out between 150 and 220 °C. It was
found that after 180 °C cellulose started decomposing to a greater
extent producing a solid char along with an oily liquid fraction.
The effects of temperature on amorphous and crystalline re-
gions of medium fibre cellulose were followed by modulated dif-
ferential scanning calorimetry (MDSC). The MDSC trace showed
an overall heat flow signal and both a reversing and non-reversing
heat flow signal (see Supplementary material Fig. S2). In the non-
reversing heat flow signal, which accounts for the kinetic compo-
nent of the total heat flow, an endothermic deviation in the base
line starts around 100 °C, and peaks at 134 °C. This process may
be attributed to the evaporation of any residual moisture within
the sample. From 170 °C there is a continual decrease in the heat
flow of this signal which we believe is due to depolymerisation
of the material. This event coincides with a glass transition (Tg)
starting at 185 °C and returning to a steady state at 220 °C, with
the point of inflection at 197 °C (Fig. 1A). This transition is masked
in the total heat flow from the continual depolymerisation in the
non-reversing signal.
To verify the MDSC data, changes in the crystallinity of cellulose
were monitored by DRIFT, using a temperature controlled appara-
tus. The crystallinity index was calculated based on the ratio of
peaks at 1430 and 894 cmÿ1 (Oh et al., 2005). It was found that
the crystallinity index rapidly decreased at around 180 °C which
correlates well with the MDSC information. With the increased
molecular motion within the amorphous region, as illustrated by
the glass transition, a cooperative stress is induced on the crystal-
line region resulting in a reduction in the level of crystallinity.
To understand the mechanism of the MW effect on cellulose,
the influence of microwave temperature on the production of char
was investigated in parallel with conventional pyrolysis experi-
ments. By measuring calorific value, it can be seen that chars could
be produced at temperatures 100 °C lower than those produced
using conventional pyrolysis (Fig. 1B). The rate of increase in calo-
rific value of the microwave chars showed a jump ca. 180 °C, in
agreement with our earlier observations. It is also important to
note that the maximum calorific value of the char obtained in
the microwave experiments is ca. 10% greater than those produced
using conventional heating.
In order to further investigate the mechanism, the amorphous
region of cellulose was partially deuterated and chars produced
analysed as for ordinary cellulose. As can be seen in Fig. 1B, the
deuterated cellulose activated by microwave, decomposes slower
than the protonated form. This decreased rate of decomposition
on deuteration stresses the importance of the amorphous region
for microwave processing.
Fig. 1. (A): Reversing heat flow signal from the MDSC of cellulose showing the true
glass transition (inset), and the derivative of the reversing heat flow signal. (B):
Calorific value of char obtained from cellulose processed conventionally and in the
presence of microwaves. Also cellulose that was initially deuterated and then
microwave treated is shown. The calorific value derivative of the microwave treated
cellulose is shown emphasising a peak at 184 °C.
V.L. Budarin et al. / Bioresource Technology 101 (2010) 3776–3779 3777

DRIFT studies were carried out on the char samples prepared at
a range of temperatures using microwave activation. Crystallinity
rapidly increased at 180 °C, which again indicates the amorphous
region is more affected by microwave irradiation, and decomposes
in preference to the crystalline region, leading to more rapid loss of
signals from the amorphous cellulose fraction than from the crys-
talline regions.
The temperature of 180 °C has been identified as a key turning
point in the microwave degradation of cellulose; this understand-
ing allows the production of fuels at dramatically lower tempera-
tures than would be required under conventional conditions.
Thermal analysis, using MDSC has correlated the temperature to
a glass transition in the polymer. Above this temperature, the spe-
cific microwave effect becomes pronounced and the rate of degra-
dation of cellulose increases significantly. The combination of
experimental techniques proves that the MW degradation starts
within the amorphous region. The enhanced molecular freedom
within this region resulting from the glass transition allows im-
proved interaction between the microwave energy and cellulose.
The interaction depends on a process termed dipolar polarization
which involves the alignment of polar groups with the oscillating
MW field (Kappe, 2004). Below 180 °C the polar groups in cellulose
have less freedom so cannot rotate easily, resulting in a poorer
interaction. Above 180 °C, as the number of groups capable of
rotating increases particularly, but not exclusively, in the amor-
phous region the rate of decomposition increases.
It could be considered that the softer material can decompose
faster. If this were the case the same increase in rate of decompo-
sition would be seen in the conventional pyrolysis chars after
180 °C. The fact that there is no increase in rate at this temperature
under conventional conditions strengthens the argument for a spe-
cific non-thermal MW effect.
It is known that the structure of cellulose within the cell wall of
plants exists in a fibrillar form. Within these fibres the amorphous
and crystalline regions alternate at a period of approximately
15 nm (Fig. S3). Crystalline cellulose contains a very ordered
hydrogen bonded network within which a proton transport net-
work is possible in the presence of an electromagnetic field
(Fig. S4). The temperature coefficient of the electrical conductivity
of amorphous polymers increases greatly above the glass transition
temperature. This phenomenon can be interpreted qualitatively in
terms of the ionic current which is known to increase remarkably
between 150 and 180 °C due to activated segmental motion of the
amorphous chains (Takahashi and Takenaka, 1983). Below 180 °C
the hydrogen bond network within the amorphous regions is rela-
tively small and localized. For these reasons cellulose fibres could
be represented as alternating ionic conducting (crystalline) and
non-conducting (amorphous) regions. When the crystalline region
is placed within an electromagnetic field it will polarize, generat-
ing a charge on the crystalline interface (overall charge will be
zero).
The MW treatment of cellulose produces chars at significantly
lower temperatures than conventional pyrolysis (Fig. 1B). The
presence of acid has been found to promote char formation (Mam-
leev et al., 2009). It is our belief that after 180 °C the acidity in the
amorphous region is increased as the softening of the Tg allows
movement of protons from the crystalline region causing acid cat-
alyzed decomposition of cellulose (Figs. S3 and S4). Acid catalysed
pyrolysis is also reported to increase the yield of 1,6-anhydrosu-
gars in bio-oil (Dobele et al., 2003). Analysis of liquid fractions pro-
duced from our microwave treatment has shown significant levels
of such products along with the furans and substituted phenols
associated with conventional pyrolysis (Budarin et al., 2009). The
production of these components will further plasticise the amor-
phous region exacerbating the enhanced MW effect. Increasing
temperature and acidity will eventually disrupt the crystalline re-
gions of cellulose aiding its degradation to char and volatiles.
In terms of an industrial process, this procedure can be easily
adapted to a variety of biomass (see Fig. 2) producing a uniform
char which can be handled with ease by the end user. In order to
achieve sustainable development mankind needs to move away
from petrochemical feedstocks to renewable alternatives. Micro-
wave processing of biomass may be the route to solid and liquid
fuel for the development of a society which is no longer reliant
on fossil fuels.
4. Conclusion
The interaction of cellulose with microwave irradiation has
been investigated and a mechanism involving a phase transition
in cellulose was proposed. Our results show for the first time, that
microwave irradiation has a dramatic effect on the rate of decom-
position when cellulose softens; yielding products which would re-
quire much higher temperatures (100 °C higher) to produce under
conventional conditions. The mechanism of the specific microwave
Fig. 2. Changes in the calorific value (kJ gÿ1) of biomass species after heating to 280 °C conventionally and with microwave irradiation. (A) Original biomass. (B) After
conventional heating. (C) After MW activation. (D) General purpose coal.
3778 V.L. Budarin et al. / Bioresource Technology 101 (2010) 3776–3779

effect helps explain the low temperature at which carbonisation
occurs, in the maximum calorific value of the final char, and in
the properties of oils produced.
Appendix A. Supplementary material
Supplementary data associated with this article can be found, in
the online version, at doi:10.1016/j.biortech.2009.12.110.
References
Budarin, V.L., Clark, J.H., Lanigan, B.A., Shuttleworth, P., Breeden, S.W., Wilson, A.J.,Macquarrie, D.J., Milkowski, K., Jones, J., Bridgeman, T., Ross, A., 2009. Thepreparation of high-grade bio-oils through the controlled, low temperaturemicrowave activation of wheat straw. Bioresource Technology 100, 6064–6068.
Clark, D.E., Sutton, W.H., 1996. Microwave processing of materials. Annual Reviewof Materials Science 26, 299–331.
Dobele, G., Dizhbite, T., Rossinskaya, G., Telysheva, G., Meier, D., Radtke, S., Faix, O.,2003. Pre-treatment of biomass with phosphoric acid prior to fast pyrolysis - Apromising method for obtaining 1,6-anhydrosaccharides in high yields. Journalof Analytical and Applied Pyrolysis 68–69, 197–211.
Horikawa, Y., Sugiyama, J., 2008. Accessibility and size of Valonia cellulosemicrofibril studied by combined deuteration/rehydrogenation and FTIRtechnique. Cellulose 15, 419–424.
Kappe, C.O., 2004. Controlled microwave heating in modern organic synthesis.Angewandte Chemie, International Edition 43, 6250–6284.
Mamleev, V., Bourbigot, S., Le Bras, M., Yvon, J., 2009. The facts and hypothesesrelating to the phenomenological model of cellulose pyrolysis: Interdependenceof the steps. Journal of Analytical and Applied Pyrolysis 84, 1–17.
Menendez, J.A., Dominguez, A., Fernandez, Y., Pis, J.J., 2007. Evidence of self-gasification during the microwave-induced pyrolysis of coffee hulls. EnergyFuels 21, 373–378.
Oh, S.Y., Yoo, D.I., Shin, Y., Kim, H.C., Kim, H.Y., Chung, Y.S., Park, W.H., Youk, J.H.,2005. Crystalline structure analysis of cellulose treated with sodium hydroxideand carbon dioxide by means of X-ray diffraction and FTIR spectroscopy.Carbohydrate Research 340, 2376–2391.
Picker, K.M., Hoag, S.W., 2002. Characterization of the thermal properties ofmicrocrystalline cellulose by modulated temperature differential scanningcalorimetry. Journal of Pharmaceutical Sciences 90, 342–349.
Ruan, R., Chen, P., Hemmingsen, R., Morey, V., Tiffany, D., 2008. Size matters: Smalldistributed biomass energy production systems for economic viability.International Journal of Agricultural and Biological Engineering 1, 64–68.
Saha, B.C., 2004. Lignocellulose Biodegradation and Applications in BiotechnologyLignocellulose Biodegradation. American Chemical Society, Washington, D.C..pp. 2–34.
Takahashi, K., Takenaka, H., 1983. DC electrical conductivity of cellulose. PolymerJournal 15, 625–629.
V.L. Budarin et al. / Bioresource Technology 101 (2010) 3776–3779 3779

Use of green chemical technologies in an integrated biorefinery
Vitaly L. Budarin, Peter S. Shuttleworth, Jennifer R. Dodson, Andrew J. Hunt, Brigid Lanigan, Ray Marriott,
Kris J. Milkowski, Ashley J. Wilson, Simon W. Breeden, Jiajun Fan, Emily H. K. Sin and James H. Clark*
Received 24th June 2010, Accepted 12th October 2010
DOI: 10.1039/c0ee00184h
A new concept is demonstrated for an integrated close to zero waste wheat straw biorefinery combining
two novel green technologies, CO2 extraction and low temperature microwave pyrolysis, to produce
a variety of products, including energy and CO2 which can be internally recycled to sustain the
processes. CO2 adds value to the process by extracting secondary metabolites including fatty acids, wax
esters and fatty alcohols. Low temperature microwave pyrolysis (<200 �C) is shown to use less energy
and produce higher quality oils and chars than conventional pyrolysis. The oils can be fractionated to
produce either transport fuels or platform chemicals such as levoglucosan and levoglucosenone. The
chars are appropriate for co-firing. The quality of the chars was improved by washing to remove the
majority of the potassium and chlorine present, lowering their fouling potential. The economic
feasibility of a wheat straw biorefinery is enhanced by intergrating these technologies.
Introduction
Since the 1990s, decreasing fossil reserves, rising oil prices,
concerns over the security of supply, environmental impacts and
sustainability have led to a global policy shift back towards the
use of biomass as a local, renewable and low carbon feedstock.
The biorefinery concept that has emerged is analogous to today’s
petroleum refineries, integrated facilities for the conversion of
biomass into multiple value-added products including energy,
chemicals and materials.1 However, many of these focus on
single technologies and feedstocks such as starch or vegetable oils
that could compete with food or feed.2 Improvements are needed
to create flexible, zero waste networks, applicable to a variety of
low value local feedstocks. Biorefineries will then be able to
challenge the current status quo and develop novel inter-
connecting webs of products that can meet the demands of
existing and new industries.
There are a large variety of lignocellulosic materials containing
varying compositions of waxes, lignin, cellulose, hemicellulose
and inorganics that are ideal feedstocks for a biorefinery. Agri-
cultural residues, and in particular straw, are a major source of
available biomass in the UK.3 In order to simplify our system
and focus on how different innovative technologies can interact
with each other using one particular lignocellulosic feedstock,
wheat straw was chosen as a representative material.
The main technologies available to the biorefinery can be
classified as extraction, biochemical and thermochemical
processes. Currently, these methodologies are usually studied
independent of one another, with each jostling for primacy as the
biorefinery technology of the future. However, it is essential that
the strengths and weaknesses of all the technologies available are
recognised to enable the integration and blending of different
technologies and feedstocks to best maximise the diversity of
applications and products formed.
An integrated close to zero waste system exploiting a sequen-
tial process including extraction, followed by a combination of
biochemical and thermal processing, with internal recycling of
energy and waste gases is viewed as a model system (Fig. 1),
although we recognise the limits of the model without a more
complete process design study. Extraction of valuable phyto-
chemicals, prior to their destruction during biochemical and
thermal treatments, can significantly increase the overall finan-
cial returns.4
Biochemical routes offer advantages in terms of typically low
processing temperatures, and high selectivity and specificity of
components targeted and products generated. However, they
generally require pre-treatment of biomass,5 long processing
times, large amounts of space for batch systems, and difficult
Green Chemistry Centre of Excellence, Department of Chemistry, TheUniversity of York, Heslington, York, UK. E-mail: [email protected];Fax: +44 (0)1904 432705; Tel: +44 (0)1904 432559
Broader context
We demonstrate a new concept for an integrated zero waste wheat straw biorefinery combining two novel green technologies, CO2
extraction and low temperature microwave pyrolysis, to produce a variety of products, including energy and CO2 which can be
internally recycled to sustain the processes. CO2 adds value to the process by extracting secondary metabolites including fatty acids,
wax esters and fatty alcohols. Low temperature microwave pyrolysis (<200 �C) is shown to use less energy and produce higher
quality oils and chars than conventional pyrolysis. The oils can be fractionated to produce either transport fuels or platform
chemicals such as levoglucosan and levoglucosenone. The chars are appropriate for co-firing. The quality of the chars was improved
by washing to remove the majority of the potassium and chlorine present, lowering their fouling potential.
This journal is ª The Royal Society of Chemistry 2010 Energy Environ. Sci.
PAPER www.rsc.org/ees | Energy & Environmental Science
Dow
nlo
aded
on 1
6 N
ovem
ber
2010
Publi
shed
on 1
2 N
ovem
ber
2010 o
n h
ttp:/
/pubs.
rsc.
org
| doi:
10.1
039/C
0E
E00184H
View Online

lignin treatments and downstream processing such as distillation
which may be energy intensive.6 Alternative thermochemical
routes include gasification, pyrolysis and direct combustion to
produce oils, gas, char or ash. They are fast and typically
continuous systems.7 However, they are non-specific, affect all
components, and generally require high operating temperatures
(>500 �C), which reduce their energy efficiency and increase
capital investment. It is therefore clear that the strengths of
biochemical and thermochemical processing complement each
other and in an integrated system can deliver significant advan-
tages in terms of specificity of products, flexibility and efficiency.
Herein, we demonstrate the development of an integrated
wheat straw biorefinery through the use of green technologies
which can bring added benefits either through cost, flexibility,
controllability or energy efficiency. This study focuses on the
integration of two green technologies, extraction using super-
critical CO2 (scCO2), and low temperature microwave pyrolysis,
highlighting the mutual benefits of each and the potential for
linking them with biochemical processes. We draw comparisons
with traditional technologies and show how the concept of a near
to zero waste biorefinery leads to a diverse and intricate web of
products for different markets.
Experimental
Raw materials
Wheat straw (Claire, 2007) pellets were obtained from Charles
Jackson Farms, UK. Initial analysis of the pellets (7 mm dia-
meter) as received showed a moisture content of 10% and
a density of 1.2 g cmÿ3.
Supercritical carbon dioxide extraction
Supercritical carbon dioxide (scCO2) wax extractions were
carried out on air dried milled straw (30 g) using a Thar Tech-
nologies scCO2 rig at various temperatures (40–100 �C) and
pressures (100–300 bar) for 2 hours with a 40 g minÿ1 flow rate.
Microwave processing of materials
The microwave treatment of wheat straw pellets was carried out
using a Milestone ROTOSYNTH Rotative Solid Phase Micro-
wave Reactor (Milestone Srl., Italy) fitted with a VAC 2000
vacuum module in series. Average sample mass was between 150
and 200 g. Samples were exposed to a maximum microwave
power of 1200 W with an operating microwave frequency of
2.45 GHz (wavelength 12.2 cm) under fixed power conditions.
The process temperature was maintained below 180 �C as
measured by in situ and infrared temperature probes. These
measurements showed no significant difference between the
temperatures throughout the whole sample. The process pressure
was monitored at all times. Liquid fractions were collected via the
vacuum unit, which collected and condensed vapours produced
during the process.
Use of additives
Wheat straw pellets were agitated in an aqueous solution of
sulfuric acid (10% w/w). The water was removed in vacuo at
60 �C. Ammonia and HCl were introduced into the sample as
a gas. As previously, the sample was mixed thoroughly.
Char demineralisation
Microwave pyrolysed wheat straw char (�20 g, variety Claire)
was mixed with distilled water (150 ml) and heated in aMilestone
RotoSYNTH microwave at 100 �C for 10 minutes. The resulting
mixture was stirred overnight in a sealed bottle, filtered and
stored. The leached char was dried at 40 �C under vacuum.
Elemental analysis
Elemental analysis based on carbon, hydrogen and nitrogen
content was carried out using an Exeter Analytical (Warwick,
UK) CE440 Elemental Analyser, calibrated against acetanilide
with an S-benzyl-thiouronium chloride as internal standard.
CHN wt% of the starting material was 40.21, 5.34 and 0.7
respectively.
Characterisation of gas fraction
The apparatus for thermal decomposition of wheat straw pellets
consisted of a microwave connected to IR gas cell for monitoring
of gases, with the IR cell and transfer pipe heated at 200 �C. 5.0 g
of wheat straw were placed inside the microwave reactor and 300
W of microwave power applied during the experiment (six
minutes).
Characterisation of liquid fractions
Pyrolysis–GC was performed using a CDS Analytical Pyroprobe
2000 interfaced to an Agilent Technologies 6890 N Gas Chro-
matograph, using a CDS 1500 Interface. The oven was fitted with
a 61.3 m, 0.25 mm id, 0.25 mm phase (14% cyanopropylphenyl,
86% dimethylpolysiloxane) thickness Rtx 1701 capillary column.
An Agilent Technologies 5975B Inert XL Mass Selective
Detector was coupled to the GC.
For GC-MS analysis of the microwave oils, approximately
1.0 g of each oil was diluted in 15 ml of methanol. About 5 ml of
Fig. 1 Proposed model for integration of extraction, biochemical and
thermochemical processes into a single biorefinery internally recycling the
energy and extraction solvent required.
Energy Environ. Sci. This journal is ª The Royal Society of Chemistry 2010
Dow
nlo
aded
on 1
6 N
ovem
ber
2010
Publi
shed
on 1
2 N
ovem
ber
2010 o
n h
ttp:/
/pubs.
rsc.
org
| doi:
10.1
039/C
0E
E00184H
View Online

this solution were injected into the GC column. The oils in
solutions were analysed using the same column and operating
under the same oven heating regime as described above. TG-IR
analysis demonstrates that about 70 wt% of liquid fractions have
a boiling point below 250 �C and could be detected by the GC
method. Elemental composition was carried out as outlined for
the starting material. Acid number was determined by titration.
Water content was determined using a Karl Fischer Coulometer
(Mettler Toledo DL32) by comparison to Karl Fischer Standard
reagent (Fluka Chemicals). pH measurements of solutions were
performed using a Jenway 3505 pH meter.
Simultaneous thermal analysis
Thermogravimetric (TG) analysis and differential scanning
calorimetry (DSC) were carried out simultaneously on a PL
Thermal Sciences STA 625. Milled wheat straw or ground char
(1.5 mg) was accurately weighed into an aluminium cup and
analysed against an empty aluminium reference pan from 20 �C
to 625 �C at a heating rate of 5 K minÿ1 under a 60 ml minÿ1 flow
of air. For calorific value analysis powdered palladium oxide
(35 mg) was added to cover the surface of the straw or char to
ensure complete oxidation occurred. All chars were washed and
dried prior to analysis. Analyses were carried out in duplicate.
The calorific content was calculated using the following equation:
Joules gramÿ1¼ [4.18 � (100 ÿ residual%) � DQ]/Dm
X-Ray fluorescence
Ground samples of straw or char (�1 g) were compressed into
a holder and analysed on a Horiba XGT 7000 X-ray analytical
microscope using a standardless independent parameters
method. Each measurement was repeated five times and the
average was taken.
X-Ray diffraction
Finely ground char was analysed using a Bruker-AXS D8
Advance diffractometer with a Kristalloflex 760 X-ray generator.
Scans were taken with a step size of 0.007 from 10–75 2q. The
evaluation programme EVA and the Bruker CDS database were
used to identify the phases.
Inductively Coupled Plasma (ICP)
Inductively Coupled Plasma Atomic Emissions Spectroscopy
(ICP-AES) was carried out by Yara Analytical Services, York
and was analysed for 39 inorganic elements.
Results and discussion
Extraction with supercritical CO2
The first stage of our integrated biorefinery is the extraction of
valuable secondary metabolites. These are traditionally extracted
from straw using volatile organic solvents, which are environ-
mentally and toxicologically problematic, as well as being highly
unselective. CO2 combines effective isolation and fractionation
of valuable components with low environmental impact. It has
previously been demonstrated that the waxy cuticle layer of straw
can be selectively extracted using supercritical CO2 (scCO2).8 In
addition, scCO2 extraction leaves no solvent residue, meaning
that products are suitable for use in food, personal care or
pharmaceutical applications, giving it major commercial
advantages over traditional extraction methods. Industrial scale
use of scCO2 should be applicable within the biorefinery as it has
already been employed commercially for hop extraction, decaf-
feination of coffee and dry cleaning.15
We studied scCO2 extraction under varying temperatures and
pressures in comparison with hexane, a traditional solvent of
similar polarity. This revealed comparable wax yields (Fig. 2)
and composition (Table 1) for both solvents. Although, the
Fig. 2 Wax yield from wheat straw using different solvents and condi-
tions (scCO2 at 300 bar and 40 g minÿ1). The utilisation of this technology
within the biorefinery also enables the recycling of the internally gener-
ated clean CO2 from the biochemical treatment of sugars.
Table 1 Identification and application of main compounds found inhexane and scCO2 extracted wheat wax
IdentificationGroups ofcompounds Application Ref.
6,10,14-Trimethyl, 2-pentadecanone
Fatty acid Soaps, detergents,lubricating grease/oils,cleaning compounds/polishes
9,10
Palmitic acidLinoleic acidOleic acidStearic acidNonacosane Alkanes Paraffin waxes (can
replace petrochemicalderived)
11
Octadecanal Aldehydes Food flavouringsHentriacontane Alkanes Paraffin waxes (can
replace petrochemicalderived)
Fatty alcohol (branchedand/or unsaturated)
Surfactants, cosmetics 12
14,16-Hentriacontanedione
Diketones Metal chelators 13
14,18-Tritriacontanedione
Diketones Metal chelators
Octacosanylhexadecanoate
Wax esters Hard polishes, coatings,cosmetics, plasticisers
14
This journal is ª The Royal Society of Chemistry 2010 Energy Environ. Sci.
Dow
nlo
aded
on 1
6 N
ovem
ber
2010
Publi
shed
on 1
2 N
ovem
ber
2010 o
n h
ttp:/
/pubs.
rsc.
org
| doi:
10.1
039/C
0E
E00184H
View Online

chemical composition of the hexane and supercritical extracts
does not vary greatly, the proportions of unwanted co-extracted
components such as pigments, polar lipids and free sugars are
well-known to be far greater in hexane extracts than from scCO2.
The components that were identified in the wax extracts
included fatty acids, alkanes, aldehydes, diketones and wax
esters. These all have potential commercial applications
including uses as lubricants, food flavourings or replacements to
paraffin waxes or in cosmetics (Table 1). Although, supercritical
carbon dioxide extraction is an energy intensive process, use of
combined heat and power from the combustion of microwave
gas or chars could make the use of this extraction technique
a perfect green technology for incorporation into a wheat straw
biorefinery.
Low temperature microwave pyrolysis
An increasing number of patents in microwave (MW) assisted
biomass pyrolysis demonstrate that this technology is mature
and highly scalable. A significant body of this research has
focused on high temperature (>350 �C) microwave-mediated
pyrolysis, gasification and liquefaction of biomass. Microwave
technology may offer advantages over pyrolysis relying on
convection heating including increased decomposition rates,
better controllability, higher energy efficiency and better selec-
tivity in terms of the ratio of solid, can occur at much lower
temperatures than previously reported.15 This low temperature
microwave process is scalable, energy efficient and generates five
major types of products from lignocellulosic biomass.
(1) A high quality char with properties superior to those
achieved by most conventional methods and with an enhanced
energy value, feedabiliy and grindability, making it suitable for
use as a coal replacement.
(2) Bio-oil suitable for upgrading to liquid fuel.
(3) An aqueous solution of organic acids and aldehydes.
(4) An aqueous solution of sugars.
(5) A gas fraction containing combustible organic compounds,
which could be used for energy production.
In the microwave pyrolysis of the original untreated wheat
straw, gas was the lowest yielding fraction (c.a. 14 wt%), with
bio-oil and char yields of 20 and 30 wt% respectively, whilst the
aqueous fraction gave the highest yield (c.a. 35 wt%). The
significant amounts of water produced indicate a substantial
reduction of organic matter during the process. All of these
products have an important function within our biorefinery
concept.15,16 The flexiblity and controllabilty of this technology
as well as its portability and relative ease of installation at source
may present significant economic and environmental benefits.17
Furthermore, it has been shown that certain microwave assisted
reactions can take significantly less time and can occur at
comparatively lower temperatures.18–21 Our research in this area
shows thatMW assisted degradation of wheat straw and biomass
in general products has an important function within our bio-
refinery concept.
Gas fraction
Although it is the lowest yielding fraction, the gas formed could
have an indispensable role by providing some or all of the
internal energy required for both the scCO2 extraction, micro-
wave processing and additional biochemical modification.
In situ FTIR analysis of the volatiles formed during MW
pyrolysis clearly shows two major fractions being released
(Fig. 3). The first fraction at temperatures lower than 110 �C
(points I and II, Fig. 3A) contains low molecular weight
carboxylic acids and other aqueous soluble components (FTIR
Fig. 3 In situ FTIR analysis of volatiles during pyrolysis.
Energy Environ. Sci. This journal is ª The Royal Society of Chemistry 2010
Dow
nlo
aded
on 1
6 N
ovem
ber
2010
Publi
shed
on 1
2 N
ovem
ber
2010 o
n h
ttp:/
/pubs.
rsc.
org
| doi:
10.1
039/C
0E
E00184H
View Online

spectrum I and II, Fig. 3B), whilst the second (point III, Fig. 3A),
peaking around 180 �C, corresponds mainly to an organic frac-
tion with low water content (FTIR spectrum III, Fig. 3B). In
addition, it was proved by FTIR spectroscopy that MW irradi-
ation produces uncompressible gases such as carbon dioxide,
carbon monoxide and methane. The latter two could be recycled
internally for power generation. 180 �C was previously identified
as a key temperature in the degradation mechanism of cellulose
during microwave pyrolysis as at this point the amorphous
region of cellulose softens and increased mobility and polarity of
the cellulose molecules enhance susceptibility to microwaves.15
These data, showing the low temperature decomposition of
wheat straw around 180 �C, could indicate that cellulose is the
active component in MW pyrolysis of wheat straw.
Aqueous fraction
Our unique process understanding enables the separation of the
low temperature aqueous fraction from the organic matter. The
main components present in this fraction were identified by GC-
MS as formic acid, formaldehyde, acetic acid and acetaldehyde,
all of which are potential platform molecules for downstream
processing to valuable products. Alternative direct applications
could include use as a disinfectant or as a preservative for wood
thanks to the anti-bacterial and -microbial properties of form-
aldehyde.22,23 The in situ separation of the aqueous fraction also
improves the quality of the bio-oil formed.
Bio-oil
Bio-oil is potentially one of the most valuable products of wheat
straw microwave pyrolysis, as it has the potential to partly
replace crude oil for the production of transportation fuels and
chemicals.
Our previous work indicates that the low temperature micro-
wave bio-oil is much more similar in composition to crude oil
than other pyrolysis oils.16 It has a significantly decreased water
content than that observed for either higher temperature
microwave processes or conventional pyrolysis oils (including
water fraction), an improved acid value (pH 7) compared to
typical pyrolysis oils (pH 2.9) and a reduced metal concentration
(Fig. 4).24
This is due to the lower processing temperatures which
prevent rapid evaporation of water, resulting in the deposition
of the alkali metals in the char rather than in the organic oil.
The calorific value (CV), carbon and hydrogen content of the
bio-oil produced during the low temperature MW process are
at the top of the range of typical pyrolysis and microwave bio-
oils. Although the energy content is still not as high as for
crude oil, Menendez et al. have demonstrated that this can be
improved dramatically by judicious selection of process
parameters.25 All of the factors above indicate that low
temperature microwave bio-oil should need less downstream
processing in comparison to thermal convection pyrolysis oils
to be upgraded as a replacement for crude oil to produce fuels
and chemicals.
An understanding of the chemical composition of the oils is
also essential to evaluate the potential for producing valuable
chemicals in the biorefinery. The composition of MW bio-oil is
significantly different from conventional pyrolysis (Fig. 5). In the
bio-oil obtained by fast pyrolysis, at a temperature of 600 �C,
furans and phenols dominate.
Fig. 4 Comparison of microwave oil characteristics with competing fuel
technologies.24
Fig. 5 Gas chromatograms of oils generated by pyrolysis in a conven-
tional fast pyrolysis system at 600 �C (including water fraction) (A)
compared to a microwave system (B) and microwave pyrolysis in the
presence of 5% of sulfuric acid (C).
This journal is ª The Royal Society of Chemistry 2010 Energy Environ. Sci.
Dow
nlo
aded
on 1
6 N
ovem
ber
2010
Publi
shed
on 1
2 N
ovem
ber
2010 o
n h
ttp:/
/pubs.
rsc.
org
| doi:
10.1
039/C
0E
E00184H
View Online

The major hydrocarbon component in the MW pyrolysis oil is
benzofuran, 2,3-dihydro (Fig. 5, structure VI). Noteworthy is the
high yield of monosaccharides, such as levoglucosan (Fig. 5,
structure IV), generated during MW pyrolysis. The former are
useful in the pharmaceutical industry as therapeutic or prophy-
lactic agents,26 as inhibitors for lipoperoxide production27 and as
cytoprotective agent.28 It was found that the sugars could be
separated from the pyrolysis oil by simple water extraction into
a second aqueous fraction. This opens up the possibility of taking
sugars from the pyrolysis oil and upgrading them using more
specific biochemical routes. Levoglucosan (Fig. 5, structure IV) is
attractive for use directly or indirectly as a feedstock for the
fermentation industry. It has been shown that levoglucosan
produced by pyrolysis of cellulose can be fermented to citric acid
by Aspergillus niger CBX-209.29 Furthermore, levoglucosan itself
has been identified as a key renewable platform molecule due to
the anhydro group which makes the ring structure much more
rigid than that of a normal glucose molecule, allowing for more
selective chemistry on the remaining free hydroxy groups.30
Levoglucosan is an important starting material for the synthesis
of stereoregular polysaccharides possessing biological activity,
such as the anti-human immunodeficiency virus and blood anti-
coagulants. The derivatives of the stereoregular polysaccharides
can be used for chiral stationary phases in high-performance
liquid chromatography.31
Additives. Acid and base additives were tested to observe their
influence on both the fractionation of the major products and the
composition of the bio-oil. It was possible to adsorb HCl and
NH3 from the gas phase onto the straw, improving diffusion and
mixing, preventing the need for drying the biomass/additive
mixture.
Furthermore, the use of acid and base additives strongly
influenced the mass balance between the different product groups
(Table 2). For example, sulfuric acid reduces the bio-oil yield by
three times, in favour of biochars, and ammonia increases the
char fraction by nearly 40%. These results could be explained by
polymerisation of bio-oil in the presence of acid–base catalysts.
The use of additives therefore adds flexibility to this tech-
nology, enabling some controllability over the distribution of the
desired products and composition of the oil to permit adjust-
ments of outputs from the biorefinery depending on the markets.
The additives had a strong impact on the distribution of
chemical compounds in the bio-oil. Under acidic conditions,
levoglucosenone (Fig. 5, structure V) was formed, with the
highest relative content achieved on addition of sulfuric acid
(Fig. 5C). Levoglucosenone has previously been utilised as
a starting material in the synthesis of 2,3-dideoxyribose, used as
a medicine,32 serricornine (sex pheromone of the tobacco
beetle),33 hydroxylactones (an appetite satisfying ingredient),34
and optical active compounds.35 It is significant that in the
presence of sulfuric acid the benzofuran concentration in the
MW oil is reduced whilst the concentration of the high boiling
point phenolic compounds is increased.
Under basic conditions the product distribution within the
bio-oil is simple and clean, with the levoglucosan content double
than without additives. Ammonia did not influence the benzo-
furan concentration, but significantly reduced the quantity of
phenolic compounds.21
Char
As indicated in Table 2, char is one of the major products of
microwave pyrolysis and can be increased as a percentage of the
product by the use of additives. It is a source of energy via
combustion. This can provide the internal energy for the bio-
refinery as well as the carbon dioxide for the scCO2 extraction
process. However, the large amounts of alkali ash remaining in
the microwave char following pyrolysis could cause problems.
The high potassium and chlorine content of wheat straw has
created problems in commercial combustion boilers36–38 due to
the formation of glassy deposits39 and corrosion of surfaces by
alkali salts40 reducing the lifetime of combustion equipment. We
believe that a demineralization step could be a valuable addition
to the wheat straw biorefinery to improve the performance of
combustion. Char washing was chosen, due to the low energy
requirement for drying, based on previous studies on extraction
of conventional pyrolysis chars.41
Knowledge about the extraction of microwave chars and the
influence of this demineralization on char combustion properties,
final ash structure and the nature of extracts formed is limited.
Therefore, to complement our wheat straw biorefinery concept
we carried out initial studies into these processes. Leaching was
carried out on chars directly following microwave pyrolysis of
wheat straw at elevated temperatures in water. Significant
changes are observed in the total ash content and combustion
profiles of the microwave pyrolysis chars before and after
leaching (Fig. 6). Demineralisation by aqueous extraction
appears to reduce the ash residue by a third. In addition, both
char oxidation peaks (>350 �C) are shifted to higher tempera-
tures in the char washed sample, which is generally associated
with the removal of potassium, reducing its catalytic effect, in
studies of washed straw.42 The presence of two char oxidation
peaks could imply some char heterogeneity and the changes in
the relative contributions of the two char oxidation peaks to the
combustion profiles might suggest different decomposition
pathways depending on the inorganic content of the char.
Analysis of the changing elemental nature of the chars
confirms the predominant removal of potassium, along with
chlorine and minor amounts of other elements, following
aqueous extraction (Fig. 7B).
The inorganic content of the chars compared to the original
straw was calculated by normalizing the element percentage to
the relative ash content. Minor reductions in the ash content
Table 2 Influence of 3% w/w of additives on mass balance of pyrolysis
Additive
Products characteristics
CharOrganicfraction
Aqueousfraction Gas
Yield(%)
CV/kJgÿ1
Yield(%)
CV/kJgÿ1
Yield(%) pH
Yield(%)
Original 29 27.2 21 15.9 36 4.1 14H2SO4 44 29.7 7 16.4 33 3.7 16HCl 35 28.6 16 17.9 35 2.8 14NH3 41 26.5 17 17.7 22 4.6 20
Energy Environ. Sci. This journal is ª The Royal Society of Chemistry 2010
Dow
nlo
aded
on 1
6 N
ovem
ber
2010
Publi
shed
on 1
2 N
ovem
ber
2010 o
n h
ttp:/
/pubs.
rsc.
org
| doi:
10.1
039/C
0E
E00184H
View Online

correspond to a reduction in chlorine content, as HCl or in
association with the organic phase.1 Following the char wash,
50% of the potassium, 80% of the chlorine and 35% of the sulfur
are extracted, whilst only minor amounts of calcium and silicon
are removed, as confirmed by ICP analysis. This indicates that
the major elements indicative of problems in biomass combus-
tion, potassium and chlorine, have been significantly reduced by
char demineralisation.
Also of great importance is the effect of washing on the
calorific value of the chars (Fig. 7A). Unsurprisingly, the chars
show a much increased calorific value relative to the straws,
whilst removal of inorganics also slightly improves the heating
value by increasing the concentration of combustible organic
material in the sample. In addition, the extraction of wax
improves the energy content of the straw slightly by removing
a lower calorific component and some of the moisture content of
the straw.
The extraction solution was found to be strongly coloured,
indicating the possible solubilisation of sugar components along
with the mineral salts. GC-MS analysis of the silylated extracts
(done by standard procedure43) suggested the presence of several
lipid, hemicellulose and cellulose decomposition products
(Fig. 8). Octanoic acid and glycerol are both products of fatty
acid decomposition which could be present due to the break-
down of lipids from the intracellular walls of the straw. Levo-
glucosan is a product of the decomposition of cellulose44 as
observed in the bio-oil formed from microwave pyrolysis, whilst
arabinose and xylitol are both precursors of hemicellulose. The
extracted solution had a neutral pH of 7.4, which indicates that it
could be used directly as a fermentation broth for the selective
modification of the predicted fatty acid and sugar derived
compounds present. This again provides another opportunity to
add value to the biorefinery and reduce waste by the incorpo-
ration of biochemical processes to specifically target these
components for modification.
These results show that the washing of microwave pyrolysis
chars removes potassium, chlorine and remaining decomposition
products. This has benefits for the straw/lignocellulosic bio-
refinery, increasing the calorific value of the char, modifying the
combustion process and reducing the main inorganic compo-
nents responsible for slagging and corrosion in the boiler and
producing a solution potentially suitable for direct fermentation
to produce higher value chemicals.
Process economics and energy efficiency
Extraction of wheat straw with supercritical CO2 produces
a high quality wax. Removal of co-extracted water produces
a material almost devoid of any other extractives and exhibiting
a narrow melting point range.45 In contrast, the removal of
hexane is a high cost and hazardous step and further purifica-
tion is required to obtain a wax of equivalent quality to that
obtained with scCO2. Direct comparison of extraction costs
between hexane and supercritical CO2 is rarely possible as the
Fig. 6 STA profiles of char before and after washing showing the
changes in energy on combustion and the mass loss profile (inset).
Fig. 7 Calorific value (A) and elemental content (B) of straws and chars
initially, after scCO2 extraction and after washing.
Fig. 8 Gas chromatograms of silylated compounds in leached micro-
wave char solution.
This journal is ª The Royal Society of Chemistry 2010 Energy Environ. Sci.
Dow
nlo
aded
on 1
6 N
ovem
ber
2010
Publi
shed
on 1
2 N
ovem
ber
2010 o
n h
ttp:/
/pubs.
rsc.
org
| doi:
10.1
039/C
0E
E00184H
View Online

total cost of extraction and subsequent removal of solvent and
product purification varies depending on the raw material and
product of extraction. A number of products have been the
subject of economic studies46 and in some instances the use of
supercritical CO2 has been shown to be significantly cheaper
than using hexane.47 This is almost always as a result of
expensive post-extraction steps including solvent removal and
purification for hexane rather than the direct extraction costs.
As part of an integrated biorefinery the use of CO2 could be an
appropriate choice of solvent being captured as a product of
fermentation and the process energy may be obtained by
combustion of other solid waste streams or liquid biofuels.
Although it is undoubtedly true that the capital cost of
a supercritical CO2 extractor of equal capacity to a hexane
extractor is significantly higher, the lower operating costs
should result in a shorter payback time and the greener
credentials of the technology should encourage investment.
The microwave process is very tolerant of water compared to
conventional pyrolysis and is suitable for most biomass types
without pre-drying. Preliminary energy balance calculations
based on the thermodynamic properties of the structural
components of wheat straw during the decomposition process
indicated a energy requirement of 1.8 kJ gÿ1 for microwave
pyrolysis compared to 2.7 kJ gÿ1 for thermal convectional
pyrolysis. Experimentally we proved that the microwave energy
requirement decreased from 100 kJ gÿ1 to 2.2 kJ gÿ1 as the sample
mass increased from 0.2 g to 200 g wheat straw (Fig. 9). Pilot
scale studies (30 kg hÿ1), showed a further increase in energy
efficiency, requiring as little as 1.9 kJ gÿ1 biomass. Low
temperature microwave pyrolysis therefore produces better
quality oils and chars than conventional pyrolysis at 1.5 times the
energy efficiency.
Fig. 9 Energy required per gram of sample for pyrolysis with increasing
sample size.
Fig. 10 Integrated wheat straw biorefinery utilising supercritical CO2 and low temperature microwave pyrolysis to produce a range of products and
showing the mass balance of the system.
Energy Environ. Sci. This journal is ª The Royal Society of Chemistry 2010
Dow
nlo
aded
on 1
6 N
ovem
ber
2010
Publi
shed
on 1
2 N
ovem
ber
2010 o
n h
ttp:/
/pubs.
rsc.
org
| doi:
10.1
039/C
0E
E00184H
View Online

Conclusions
We have shown the potential for developing a zero waste wheat
straw biorefinery (Fig. 10) incorporating two green chemical
technologies, supercritical CO2 and low temperature microwave
pyrolysis. In addition, we recognised the potential impact of the
presence of inorganic components in the products, and as such
incorporated a new aqueous extraction process to improve
combustion properties of the pyrolysis char and generate further
useful products.
The external wax on the surface of the straw is extracted prior
to processing, adding economic value to the system.
Low temperature microwave pyrolysis generates four major
product fractions. The main aqueous fraction has possible uses
as a disinfectant or antifungal agent. While the solid char and
bio-oil can both be upgraded by water treatment, solubilising
sugars and inorganic components, to increase end value. The
remaining organic bio-oil may be a suitable starting material for
the production of transportation fuels. Gaseous streams from the
processing of biomass and combustion of the char can internally
generate the CO2 required for scCO2 extraction and the energy
for the whole system. The use of additives is shown to further
increase the flexibility of the system.
Overall, we demonstrate the possibility to integrate several
green processes to transform a single starting material into
a large variety of products at different levels of the value-volume
pyramid.
Acknowledgements
The authors would like to acknowledge the help ofMeg Stark for
her help with microscopy, the University of York Research &
Enterprise office and Charles Jackson farms. The authors would
also like to thank the European Regional Development Fund
(ERDF) in Yorkshire and the Humber, the Carbon Trust,
Yorkshire Forward, Science City York, Defra Link and HGCA
for their financial support. We are grateful to Professor Jenny
Jones for discussions and data.
References
1 National Renewable Energy Laboratory (NREL), http://www.nrel.gov/biomass/biorefinery.html.
2 R. Luque, L. Herrero-Davila, J. M. Campelo, J. H. Clark,J. M. Hidalgo, D. Luna, J. M. Marinas and A. A. Romero, EnergyEnviron. Sci., 2008, 1, 542–564.
3 J. Copeland and D. Turley, National and Regional Supply/DemandBalance for Agricultural Straw in Great Britain, NNFCC, York, 2008.
4 D. Perkis, W. E. Tyner, P. V. Preckel and S. Brechbill, SpatialOptimization and Economies of Scale for Cellulose to EthanolFacilities in Indiana, Proceedings of a Joint Conference of the FarmFoundation and USDA’s Office of Energy Policy and New Uses titledRisk, Infrastructure and Industry Evolution, ed. B. C. English,R. J. Menard, and K. Jensen, Berkeley California, June 24–25, 2008.
5 M. Galbe and G. Zacchi, in Biofuels, Springer-Verlag, Berlin, 2007,pp. 41–65.
6 B. Kamm, P. R. Gruber and M. Kamm, Biorefineries-IndustrialProcess and Products, Wiley-VCH, Dar, 2006, vol. 1, p. 71.
7 A. V. Bridgwater and G. V. C. Peacocke, Fast pyrolysis processes forbiomass, Renewable Sustainable Energy Rev., 2000, 4, 1–73.
8 F. E. I. Deswarte, J. H. Clark, J. J. E. Hardy and P. M. Rose, GreenChem., 2006, 8, 39–42.
9 N. A. Ruston, J. Am. Oil Chem. Soc., 1952, 29, 495–498.10 K. Hill, Pure Appl. Chem., 2000, 72, 1255–1264.
11 S. P. Srivastava, J. Handoo, K. M. Agrawal and G. C. Joshi, J. Phys.Chem. Solids, 1993, 54, 639–670.
12 U. Schuchardt, R. Sercheli and R. M. Vargas, J. Braz. Chem. Soc.,1998, 9, 199–210.
13 B. J. Hall and J. S. Brodbelt, J. Am. Soc. Mass Spectrom., 1999, 10,402–413.
14 E. R. Gunawan, M. Basri, M. B. A. Rahman, A. B. Salleh andR. Rahman, Enzyme Microb. Technol., 2005, 37, 739–744.
15 V. L. Budarin, J. H. Clark, B. A. Lanigan, P. Shuttleworth andD. J. Macquarrie, Bioresour. Technol., 2010, 101, 3776–3779.
16 V. L. Budarin, J. H. Clark, B. A. Lanigan, P. Shuttleworth,S. W. Breeden, A. J. Wilson, D. J. Macquarrie, K. Milkowski,J. Jones, T. Bridgeman and A. Ross, Bioresour. Technol., 2009, 100,6064–6068.
17 F. Yu, S. Deng, P. Chen, Y. Liu, Y. Wan, A. Olson, D. Kittelson andR. Ruan, Appl. Biochem. Biotechnol., 2007, 136–140, 957–970.
18 S. A. Galema, Chem. Soc. Rev., 1997, 26, 233–238.19 L. Zong, S. Zhou, N. Sgriccia, M. C. Hawley and L. C. Kempel,
J. Microw. Power Electromagn. Energy, 2003, 38, 49–74.20 T. Razzaq and C. O. Kappe, ChemSusChem, 2008, 1, 123–132.21 A. Corsaro, U. Chiacchio, V. Pistara and G. Romeo, Curr. Org.
Chem., 2004, 8, 511–538.22 D. Mourant, B. Riedl, D. Rodrigue, D. Q. Yang and C. Roy, J. Appl.
Polym. Sci., 2007, 106, 1087–1094.23 K. Munro, J. Lanser and R. Flower, Appl. Environ. Microbiol., 1999,
65, 873–876.24 Report 40661, The Exploitation of Pyrolysis Oil in the Refinery main
Report, Prepared for The Carbon Trust, March 2008.25 A. Domnguez, J. A. Menendez, Y. Fernandez, J. J. Pis, J. M. Valente
Nabais, P. J. M. Carrott andM. M. L. Ribeiro Carrott, J. Anal. Appl.Pyrolysis, 2007, 79, 128–135.
26 A. K. Ishikawa, A. Kato, et al., 2,3-Dihydrobenzofuran derivatives,US Pat., 6686389, February 03, 2004.
27 S. Ohkawa, T. Hahimoto, T. Tadatoshi, Dihydrobenzofuranderivatives for the preparing thereof and agents, US Pat., 07008940,March 07, 2006.
28 A. K. Ishikawa, A. Kato, et al., 2,3-Dihydrobenzofuran derivatives,US Pat., 6403639, June 11, 2002.
29 X. L. Zhuang, H. X. Zhang, J. Z. Yang and H. Y. Qi, Bioresour.Technol., 2001, 79, 63–66.
30 K.M. Belyk, W. R. Leonard, D. R. Bender and D. L. Hughes, J. Org.Chem., 2000, 65, 2588–2590.
31 K. Takahashi, H. Satoh, T. Satoh, T. Kakuchi, M. Miura, A. Sasaki,M. Sasaki and H. Kaga, Chem. Eng. J. (Amsterdam, Neth.), 2009,153, 170–174.
32 M. Shibagaki, K. Takahashi, et al., Method of preparinglevoglucosenone, US Pat., 5041566, August 20, 1991.
33 M. S. Miftakhov, F. A. Valeev and I. N. Gaisina, Russ. Chem. Rev.,1994, 63, 869–882.
34 T. Sakata, K. Fukagawa, K. Ookuma, K. Fujimoto, H. Yoshimatsu,A. Yamatodani and H. Wada, Brain Research, 1990, 537, 303–306.
35 F. Shafizadeh, M. G. Essig and D. D. Ward, Carbohydr. Res., 1983,114, 71–82.
36 A. Demirbas, Prog. Energy Combust. Sci., 2004, 30, 219–230.37 J. N. Knudsen, P. A. Jensen, W. G. Lin, F. J. Frandsen and K. Dam-
Johansen, Energy Fuels, 2004, 18, 810–819.38 Y. Q. Wu, S. Y. Wu, Y. Li and J. S. Gao, Energy Fuels, 2009, 23,
5144–5150.39 B. M. Jenkins, R. R. Bakker and J. B. Wei, Biomass Bioenergy, 1996,
10, 177–200.40 P. A. Jensen, B. Sander and K. Dam-Johansen, Biomass Bioenergy,
2001, 20, 447–457.41 P. A. Jensen, B. Sander and K. Dam-Johansen, Biomass Bioenergy,
2001, 20, 431–446.42 D.Vamvuka, S. Troulinos andE.Kastanaki,Fuel, 2006, 85, 1763–1771.43 N. Le Barc’H, J. M. Grossel, P. Looten and M. Mathlouthi, Food
Chem., 2001, 74, 119–124.44 A.M. Sarotti, R. A. Spanevello and A. G. Su�arez,Green Chem., 2007,
9, 1137–1140.45 F. E. I. Deswarte, J. H. Clark, J. J. E. Hardy and P. M. Rose, Green
Chem., 2006, 8, 39–42.46 E. Reverchon and L. Sesti Oss�eo, J. Am. Oil Chem. Soc., 1994, 71(9),
1007–1012.47 G. R. List, J. F. Friedrich and J. W. King, Oil Mill Gazet., 1989,
93(12), 28–34.
This journal is ª The Royal Society of Chemistry 2010 Energy Environ. Sci.
Dow
nlo
aded
on 1
6 N
ovem
ber
2010
Publi
shed
on 1
2 N
ovem
ber
2010 o
n h
ttp:/
/pubs.
rsc.
org
| doi:
10.1
039/C
0E
E00184H
View Online

Abbreviations
Abbreviations
The following abbreviations are included in the text in addition to the Mendeleev periodic
table symbols and SI units.
BERR Department of Business, Enterprise and Regulatory Reform
CCC Committee on Climate Change (Independent UK government advisors)
DECC Department of Energy and Climate Change (UK)
DRIFT Diffuse reflectance infrared fourier transform
EU European Union
FT Fourier transform
GC Gas chromatography
GC-MS Gas chromatography coupled with mass spectrometry
ICP-MS Inductively coupled plasma coupled with mass spectrometry
IR Infra-red
IPIECA Global oil and gas industry association for environmental and social issues
IUPAC International Union for Pure and Applied Chemistry
LC-MS Liquid chromatography coupled with mass spectrometry
MtCO2e Megatonne carbon dioxide equivalents
NMR Nuclear magnetic resonance spectroscopy
ppm parts per million
SEM scanning electron microscopy
STA Simultaneous thermal analysis
UNFCCC United Nations Framework Convention on Climate Change
WS Wheat straw