Fungal pretreatments for lignocellulosic biomass anaerobic ...
Upload
khangminh22Category
view
1download
0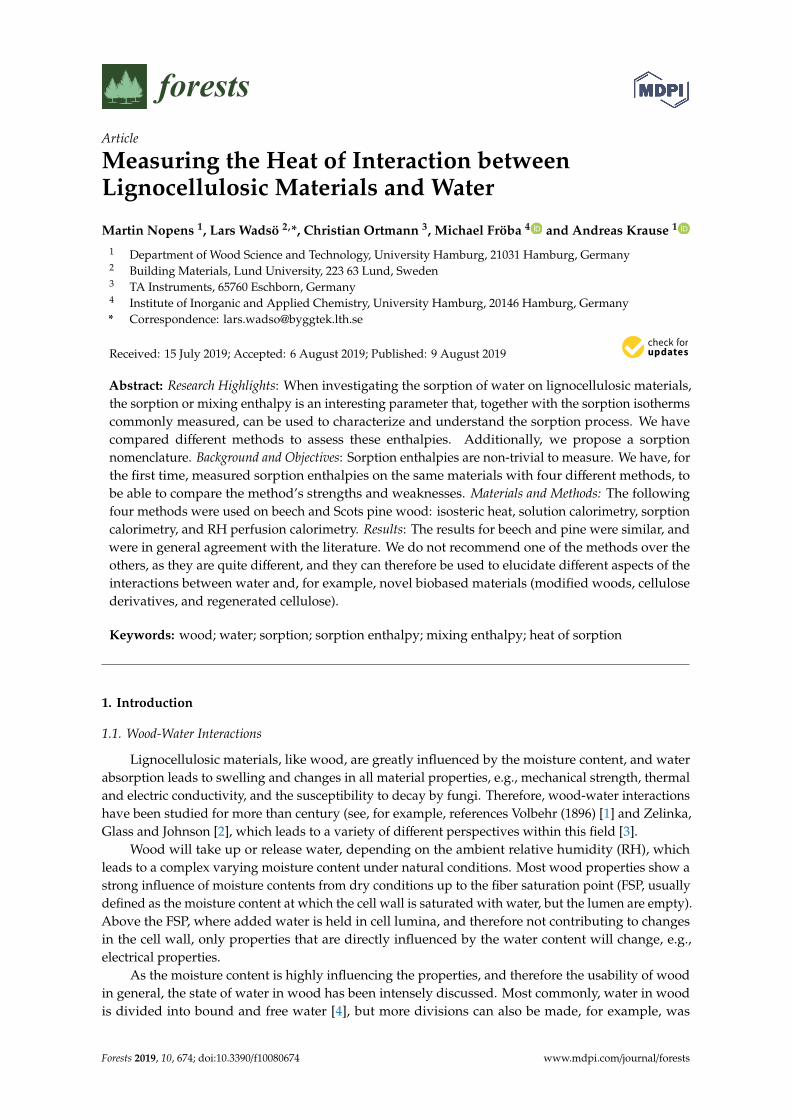
Article
Measuring the Heat of Interaction betweenLignocellulosic Materials and Water
Martin Nopens 1, Lars Wadsö 2,*, Christian Ortmann 3, Michael Fröba 4 and Andreas Krause 1
1 Department of Wood Science and Technology, University Hamburg, 21031 Hamburg, Germany2 Building Materials, Lund University, 223 63 Lund, Sweden3 TA Instruments, 65760 Eschborn, Germany4 Institute of Inorganic and Applied Chemistry, University Hamburg, 20146 Hamburg, Germany* Correspondence: [email protected]
Received: 15 July 2019; Accepted: 6 August 2019; Published: 9 August 2019�����������������
Abstract: Research Highlights: When investigating the sorption of water on lignocellulosic materials,the sorption or mixing enthalpy is an interesting parameter that, together with the sorption isothermscommonly measured, can be used to characterize and understand the sorption process. We havecompared different methods to assess these enthalpies. Additionally, we propose a sorptionnomenclature. Background and Objectives: Sorption enthalpies are non-trivial to measure. We have, forthe first time, measured sorption enthalpies on the same materials with four different methods, tobe able to compare the method’s strengths and weaknesses. Materials and Methods: The followingfour methods were used on beech and Scots pine wood: isosteric heat, solution calorimetry, sorptioncalorimetry, and RH perfusion calorimetry. Results: The results for beech and pine were similar, andwere in general agreement with the literature. We do not recommend one of the methods over theothers, as they are quite different, and they can therefore be used to elucidate different aspects of theinteractions between water and, for example, novel biobased materials (modified woods, cellulosederivatives, and regenerated cellulose).
Keywords: wood; water; sorption; sorption enthalpy; mixing enthalpy; heat of sorption
1. Introduction
1.1. Wood-Water Interactions
Lignocellulosic materials, like wood, are greatly influenced by the moisture content, and waterabsorption leads to swelling and changes in all material properties, e.g., mechanical strength, thermaland electric conductivity, and the susceptibility to decay by fungi. Therefore, wood-water interactionshave been studied for more than century (see, for example, references Volbehr (1896) [1] and Zelinka,Glass and Johnson [2], which leads to a variety of different perspectives within this field [3].
Wood will take up or release water, depending on the ambient relative humidity (RH), whichleads to a complex varying moisture content under natural conditions. Most wood properties show astrong influence of moisture contents from dry conditions up to the fiber saturation point (FSP, usuallydefined as the moisture content at which the cell wall is saturated with water, but the lumen are empty).Above the FSP, where added water is held in cell lumina, and therefore not contributing to changesin the cell wall, only properties that are directly influenced by the water content will change, e.g.,electrical properties.
As the moisture content is highly influencing the properties, and therefore the usability of woodin general, the state of water in wood has been intensely discussed. Most commonly, water in woodis divided into bound and free water [4], but more divisions can also be made, for example, was
Forests 2019, 10, 674; doi:10.3390/f10080674 www.mdpi.com/journal/forests

Forests 2019, 10, 674 2 of 21
the water in cellulose classified as free water, freezing bound water or non-freezing bound water byBerthold et al. [5]. This classification assumed that the non-freezing bound water is directly bound tothe cellulose by hydrogen bonds, while the freezing bound water is indirectly bound to the sorptionsites [6]. More recently, it has been assumed that only non-freezing bound water is present in woodbelow the FSP [7]. In the past, several explanations for the accessibility of hydroxyl groups and thenumber of water molecules that were connected to each OH-group have been proposed [8].
To distinguish and calculate the quantity of water molecules that are connected to the hydroxylgroups within the wood matrix, the energy at which the absorbed water bonds to the wood structureis of interest. The most common energy-measurable is the enthalpy change, i.e., the heat exchange atconstant pressure. Enthalpies of the wood-water interaction have been determined in several studies inthe past, see, for example, Volbehr (1896) [1], Stamm and Loughborough (1935) [9], Weichert (1963) [10],Simpson (1973) [11] (these references are discussed in Skaar [3]), and its meaning and importance wasalso discussed, for example by Skaar (1988) [3]; Rees (1960) [12] thorough review on heat of sorption ofmoisture in textiles should also be mentioned.
In this paper, we give a detailed overview of the available methods for determining the enthalpyof interaction between water and wood and other bio-based materials. The general advantages anddisadvantages for all methods are presented and discussed. As we have found that it is difficult(or in some cases impossible) to compare the published enthalpy results for wood-water interaction,as methods, definitions, and units are not always clear; we start by introducing the nomenclatureand definitions that we use. Although it is the aim of this study to give an overview of methods toquantify the heats associated with wood-water interactions, we also note that the main use of thediscussed methods in the future will not be to measure on wood, as such, wetting, sorption, and mixingenthalpies are known, but to assess the properties of new bio-based materials, including modifiedwood and cellulose derivatives.
1.2. Nomenclature
Table 1 gives a summary of the nomenclature that we use in the present paper. As much aspossible, we follow the recommendations of the International Union of Pure and applied Chemistry(IUPAC) [13]. Although the main focus of this paper is on the interaction between lignocellulosicmaterials and water, we also give the nomenclature in general terms here, i.e., of the sorption of anyvapor in/on any solid. The approach that is presented does not have any limitations from the specificmode of interaction between the vapor and the solid; it can be adsorption (on surfaces), capillarycondensation in a pore system, or the taking up of vapor or liquid molecules in a swelling material.
In the present paper, we use an extended definition of the term RH for both the state of watervapor in the air and the state of water absorbed in a material. The RH of a material is then equal tothe RH of a gas phase in equilibrium with it. Thus, we use RH as the term water activity is used inother fields. Note that at temperature and pressure conditions close to NTP (normal temperature andpressure, 20 ◦C, and 1 atm) that we have, for example, in the measurements in the present paper, thenumerical values of RH, and water activity at equilibrium are very similar [14].

Forests 2019, 10, 674 3 of 21
Table 1. Symbols and nomenclature (cf. Figure 1 below). Relative vapor pressure (and relativehumidity) is commonly defined as the ratio of the vapor pressure to the saturation vapor pressure.Note that relative humidity and moisture content are often expressed as per cent (%), and gwood andgsolid refers to the mass of dry material in this paper.
Symbol General Property Water Related Property Units
c Vapor content Moisture content gvapor gsolid−1, gwater gwood
−1
∆condh Condensation enthalpy J gvapor−1, J gwater
−1
∆mixh Mixing enthalpy J gvapor−1, J gwater
−1
∆sorph Sorption enthalpy J gvapor−1, J gwater
−1
∆weth Wetting enthalpy J gsolid−1, J gwood
−1
∆vaph Vaporization enthalpy J gvapor−1, J gwater
−1
m Mass g
ϕ Relative vapor pressure Relative humidity Pa Pa−1
Word Meaning
Absorption Uptake of vapor or liquid by a solidAdsorption Sorption of vapor on a surface
Condensation Phase change from vapor to liquidDesorption Loss of vapor by a solid
Mixing Uptake of liquid by a solidSorption Exchange of vapor between solid and gas phases
Vaporization Phase change from liquid to vaporWetting Uptake of liquid by a solid until saturation
1.3. Perspective on Sorption
Sorption thermodynamics is complicated by the fact that the sorption enthalpy, for example, fora wood-water system, is a function of the moisture content (or the RH). We will illustrate this byfirst discussing the parallel, but in some ways simpler, case of non-covalent binding that is foundwhen small molecules (often called ligands, typically drug molecules) bind to proteins in aqueousenvironments. For the common case, where there is only one binding site (1:1 binding), classicalchemistry gives the chemical process and its binding enthalpy, and the equilibrium constant accordingto the law of mass action:
P + L⇔ PL, ∆bindH
Kbind =[PL][P][L]
The two constants Kbind and ∆bindH are all that is needed to describe the 1:1 binding process, as everybinding event will produce the same heat and bind with the same strength. The binding enthalpy isconveniently expressed in units of J mol−1, and the moles can refer to either the protein or the ligand,as it is a 1:1 binding (we can recommend references [15] for those who are interested in ligand-proteinbinding).
A sorption process is similar to the above binding process, as a small vapor molecule binds to alarger entity. However, there are also several differences:
A. The larger entity does not have a defined molecular mass, at least not if it is a material, like wood,so we need to work with specific units (J g−1) when the denominator refers to the material.
B. The enthalpy when a vapor molecule binds to a solid is not a constant, but it depends on howmany molecules have previously been sorbed on the solid, i.e., the moisture content. Chemically,the sorption process may be similar to the ligand-protein binding process (both are typicallyhydrogen bonding), but while all the protein molecules and their binding sites are identical,vapor can be bound in accessible porous materials in many different ways.
Forests 2019, 10, 674 4 of 21
C. Chemical thermodynamics states that processes spontaneously take place when they result in adecrease in the Gibbs energy. This “driving force” has contributions from two terms: enthalpyand entropy. The enthalpic contributions reflect the strength of the binding. For ligand-proteinbinding processes in an aqueous environment, there can also be large entropical contributions,from the loss of conformational degrees of freedom in the molecules involved and that watermolecules are expelled from the binding site [16]. Such phenomena can also take place duringsorption on, for example, bio-molecules. Some sorption processes can then be said to be entropydriven, see, for example, reference [15]. This phenomenon is limited for vapor sorption onrelatively rigid solids, like wood.
Figure 1. Graphical description of the terms used in the paper. (a) A sorption isotherm. (b) Enthalpiesrelated to solid-vapor interactions (figure based on [3]). (c) Wetting enthalpy.
1.4. Sorption Isotherms
Figure 1a shows a schematic sorption isotherm, a description of how much vapor is sorbed by asolid as a function of the relative vapor pressure of the vapor. This diagram and our analysis are validat isothermal equilibrium conditions, and in the absence of sorption hysteresis (we either look at onlyabsorption or only desorption).
The slope of the sorption isotherm is a measure of how much is taken up by the solid when theRH is increased. This is often called the sorption capacity and it has a similar function as Kbind for thebinding process.
1.5. Sorption and Mixing
The heat of sorption is a general term often used in wood science for the heat production that isassociated with the sorption processes. However, we will use the term enthalpy; an enthalpy changeis the heat exchange with the environment associated with processes at constant pressure (the mostcommon situation in sorption applications). The enthalpy change (∆h) during any process is seen as theproduction (∆h < 0) or consumption (∆h > 0) of heat (the sign convention in chemical thermodynamicsdictates that processes are seen from the point of view of the system that undergoes a process). We canmeasure enthalpy changes that are associated with sorption processes, but there is no natural zeropoint for the enthalpy of for example water. By convention, the physical state at 25 ◦C and 0.1 MPais often taken as the reference state, so for water, h = 0 for the liquid state (do not confuse this withformation enthalpies used for chemical reactions).
As illustrated in Figure 1b, sorption is when a solid takes up vapor, and mixing is when a solidtakes up liquid. The enthalpy that is associated with the transfer of one unit mass of vapor to a sample

Forests 2019, 10, 674 5 of 21
is the sorption enthalpy ∆sorph and it is the sum of the condensation enthalpy ∆condh and a mixingenthalpy ∆mixh [1] (all have units of J gwater
−1):
∆sorph(c) = ∆condh + ∆mixh(c) (1)
The sorption enthalpy and the mixing enthalpy are functions of the moisture content at which thesorption/mixing takes place, while the condensation enthalpy is constant at isothermal conditions.
We prefer to work with mixing enthalpies that only contain information about the small (vapor)molecule’s interactions with the solid, not the condensation of the vapor itself, as sorption enthalpiesinclude the high condensation enthalpy. As it is difficult to realize the mixing of liquid water and asolid in practice, the mixing enthalpy is evaluated by subtracting the condensation enthalpy from ameasured sorption enthalpy as is shown in Figure 1b.
The reason that it is difficult to directly measure mixing enthalpy is that it is difficult to add aliquid to a solid without getting large hysteresis effects. The place where the liquid first meets the solidwill get high concentrations (absorption), but later dry (desorption), as the liquid will be redistributedto other parts of the sample. Thus, the state of the whole sample will never be homogeneous. Despitethis, the mixing enthalpy is the most sensitive measure of the interaction between a vapor moleculeand an accessible porous solid, and, as mentioned above, it can be calculated from other measures.
The mixing enthalpy can be seen as an “excess enthalpy”, which shows how much more heat thata sorption process produces than when the same mass of vapor condenses. Also note that we use thethermodynamic sign convention (for example, in Figure 1b), so that if heat is lost by the system to thesurroundings (heat is produced) the enthalpy is negative. Enthalpies of sorption and condensation aretherefore always negative; enthalpies of mixing are negative except in cases where mainly driven byentropy effects [17].
The mixing enthalpy has units of J gwater−1. It is the heat that is produced when a gram of liquid
water is absorbed by an infinite mass of the solid at constant moisture content. This heat is often onlyattributed to the change of state of the water molecules that are sorbed, but it is actually the responseof the whole system that includes the wood, the previously sorbed water, and the water that is sorbedinto the wood substance.
1.6. Wetting
As discussed above, the direct addition of a small amount of liquid to a porous solid results inconditions that are not well defined. However, there is one measurement with liquid addition that haswell defined start and end points, and that is when the whole sample absorbs water until saturated.Such a process is called heat of wetting and it is related to measurements of heats of solution (see forexample reference [18]).
The main variable that can be changed is its initial moisture content when making heat of wettingmeasurements on a solid. The heat produced during wetting is highest for a dry solid (withoutany sorbed molecules), decreases as the moisture content increases, and then becomes zero for analready wetted (saturated) solid. Figure 1c shows how the wetting enthalpy is a function of the initialmoisture content.
When a wetting measurement is made, a certain amount of heat Qwet (J) is produced. If this heatis divided by the dry mass of the solid, m0 (g), we will get the wetting enthalpy ∆weth (J gsolid
−1):
∆weth =Qwet
m0(2)

Forests 2019, 10, 674 6 of 21
There is a relation between the mixing enthalpy and the wetting enthalpy, as is illustrated inFigure 1b,c. The wetting enthalpy at moisture content ci is integral to the mixing enthalpy from c1 toinfinity (saturation):
∆weth(ci) =
∞∫c=ci
∆mixh dc (3)
The converse equation is when the mixing enthalpy is calculated as the derivative of the wettingenthalpy as a function of moisture content:
∆mixh(ci) =∆weth(ci)
dc(4)
but it is difficult to use this in practice, as it is difficult to measure heat of wetting well enough totake an accurate derivative of the curve (the derivation is therefore often made on a curve fit of themeasured data). The integration of Equation (3) is mathematically much more benign.
It should be noted that the mixing enthalpy and the wetting enthalpy have different units: mixingenthalpy is in joules per gram vapor (or liquid), while wetting enthalpy is in joules per gram (dry) solid.
1.7. Clausius-Clapeyron Equation
A commonly used method to determine sorption enthalpies is the application of theClausius–Clapeyron equation on sorption isotherms. This method is still rather common—probablybecause it does not require any heat measurements and isosteric heats for wood are regularly published,see for example [19].
With this method, the so called isosteric heat is calculated; the name refers to that the calculationrequires the knowledge of how the RH changes with temperature at constant moisture content(isosteric = at constant coverage; the term refers to the case of adsorption). In practice, the isostericheat equals the sorption or the mixing enthalpy (depending on how the equation is formulated).The Clausius–Clapeyron equation with the mixing enthalpy is [20]:
d ln(ϕ)d(1/T) c
= −∆mixh
R(5)
Here, T is temperature (K) and R is the gas constant (8.314 J mol−1 K−1).The isosteric method is usually applied on a set of sorption isotherms measured at different
temperatures. The Clausius–Clapeyron equation can then only be used if one can interpolate betweenthe curves. In literature, the sorption isotherms are usually fitted to an isotherm equation, for example,GAB, Dent [21], or Hailwood–Horrobin [22]. The curve fitting will give smooth curves that are easy toapply Equation (5) on, but the shape that is induced by the isotherm models may influence the result.An alternative way to generate data for the isosteric method is to use a sorption instrument that cansimultaneously change the temperature and keep the moisture content constant; such instruments doexist, but it is not clear if they can measure good enough data for isosteric calculations.
Although the Clausius–Clapeyron equation is thermodynamically valid, its application is nottrivial as sorption isotherm data is often not good enough to permit the determination of precise mixingenthalpies. Three reasons for this are [12]:
1. The sorption isosteres (ln(ϕ) as a function of 1/T) should be linear. In practice they are oftenmore or less non-linear, possibly because of measurement errors or the use of non-optimalfitting equations.
2. The enthalpy is assumed to be constant with temperature, which it strictly is not.3. The Clausius–Clapeyron assumes that the sorption is reversible, which it probably is not because
of hysteresis.
Forests 2019, 10, 674 7 of 21
Similar problems with the related van’t Hoff equation have been noted for the determinationof other types of enthalpies, see, for example, the discussion in reference [23]. A value from adirect measurement of an enthalpy should in most cases be preferred to a value that is calculated byClausius–Clapeyron or van’t Hoff equations (Skaar 1988) [3].
1.8. Literature Data
The literature contains several studies with results of isosteric calculations and heat of wettingmeasurements; we will only show results from one study here, as an example. It is common to curvefit the results of the sorption, mixing and wetting measurements to exponential functions. Skaar [3]gives equations that represent the results of Stamm and Loughborough [9] (isosteric method, sitkaspruce, 50 ◦C), as:
∆mixh = −1180 exp(−14c) (6)
This equation can be integrated (Equation (3)) to:
∆weth = 84 exp(−14c) (7)
∆mixh(t) = ∆vaph(
Psorp(t)
Pcond(t)− 1
)These enthalpies have an apparent accuracy that is doubtful, as it is assumed that the enthalpies
are related to moisture content by exponential functions, which is something that is only probablyapproximate. The data on which Equations (6) and (7) are based have also been criticized for not beingof the quality that is needed for, e.g., sorption enthalpy calculations [2]. However, we have still usedthese two equations as examples against which we discuss our results.
The mixing enthalpy of the first absorbed water molecules (at zero moisture content) has beennoted in several studies to be similar for different types of organic materials and substances. Rees(1960) [12] noted that, for different textile materials, “all the evidence points to a finite value [...]at zero regain of about 290 cal/g” and Skaar [3] gives similar values for wood (this value is about1200 J gwater
−1). Kocherbitov [24], who has made sorption calorimetry measurements on a range ofbiochemical substances, found that the mixing enthalpy at zero moisture content was close to −18 kJmol−1 (1000 J gwater
−1) [25]. These values are close to the enthalpy of hydrogen bonds between O-Hand O [26].
Some studies give somewhat different values of mixing and wetting enthalpy for wood than thevalues that are given above, but it is doubtful that this is because different woods have different valuesof these parameters; it can also be caused by experimental deficiencies.
2. Materials
Commercial kiln-dried beech (Fagus sylvatica L.) and Scots pine (Pinus sylvestris L.) milled with aRetsch mill SM1 to a particle size lower than 4 mm in length and 1 mm in diameter was used for all thecalorimetric measurements. Wood samples from the same sources with a sample size of 20 mm (length)× 20 mm (width) and 1.5 mm in height (longitudinal direction) were used to measure the sorptionisotherm for both the isosteric calculations and for the evaluation of the RH perfusion calorimetryresults. Tris (hydroxymethyl) aminomethane (TRIS) from Serva (research grade) and hydrochloricacid (0.1 mol/L, for laboratory use) from Chemsolute were used for the calibration of the solutioncalorimeter. Deionized water was used for all solution calorimetry measurements.
3. Methods
We have used four methods to assess the enthalpies of wood-water interactions on beech and pinewood: the isosteric method, solution calorimetry, sorption calorimetry, and RH perfusion calorimetry.

Forests 2019, 10, 674 8 of 21
All, except for the first method, involve direct measurements of heat. The first two methods (isostericheat and solution calorimetry) have been frequently used to study the water-wood interactions, whilesorption calorimetry and RH perfusion calorimetry are used for the first time for wood in this work.Here, we describe the four methods briefly; Table 2, which gives an overview of the methods.
Table 2. An overview of the discussed and used methods.
Isosteric Method SolutionCalorimetry Sorption Calorimetry RH Perfusion
Calorimetry
What is measured? Sorption isotherms atdifferent temperatures
The temperaturedifference when asample is wetted
The thermal powers ofvaporization and sorptionwhen a sample is humidified
The heats producedwhen the RH around asample is changed
Calculationprocedure
The Clausius-Clapeyronequation (Equation (5))
The heat producedwhen wood iswetted (saturated)with water(Equation (2))
Three equations (Equations(9)–(11)) are used
Integration of each peakand combination withmoisture content changefrom isotherm (Equation(12))
What enthalpy iscalculated? Sorption/mixing enthalpy Wetting enthalpy Sorption/mixing enthalpy Sorption/mixing
enthalpy
Equipment Sorption balance Solutioncalorimeter Sorption calorimeter Isothermal calorimeter
and RH-perfusion cell
Advantages Sorption balances are rathercommon instruments
Solutioncalorimeters arerather commoninstruments
Rather quick measurement(1–2 days); gives bothisotherm and enthalpy
Can be used for anyRH-step; can be used inboth absorption anddesorption
Disadvantages
It is not clear if thetheoretical assumptions arefulfilled; the isotherm dataneeds to be of high quality;measurements takes a longtime (month)
Results need to bedifferentiated togive mixingenthalpy; manysamples need to bemeasured
Very uncommon instrument;some uncertainties about theinterpretation of the results
Rather commoninstrument, but the RHperfusion system is notcommon; relatively largeuncertainties in severalinput factors
3.1. Isosteric Method
We used a commercial balance SPSx-1µ-High-Load (ProUmid, Germany) for measuring thegravimetric sorption isotherms at 20, 30, and 40 ◦C. The samples were at first and in between everystep equilibrated at the isotherm temperature and 0% RH for 48 h. The sorption measurements wereperformed in absorption at 0-5-10-20-30-40-50-60-70-80% RH with 12 h at each level, which resulted infinal mass change rates between 0.0007 and 0.0018% min.−1.
For each temperature, the moisture content was calculated based on the mass that was measuredat the end of the initial drying step at 0% RH. As these 0% RH masses differed slightly, we made theisosteric calculations both on the data as measured with different dry mass reference points at differenttemperatures and while using a dry mass measured at 50 ◦C for all temperatures.
The isosteric heat of sorption was calculated in two steps. The first step was either curve fittingwhile using the Hailwood–Horrobin model or linear interpolation between the measurement points.In the second step, Equation (5) was used to assess the sorption/mixing enthalpy. The derivative ofEquation (5) was calculated from a linear curve fit of three data points at each moisture content.
3.2. Solution Calorimetry
Another common technique for studying wood-water interactions is solution calorimetry, inwhich the heat production is measured when a specimen is placed in water, so that its moisture contentincreases up to saturation. The name of the instrument comes from that its most common use is tomeasure heats of solution of compounds in water, but such instruments can also be used to measureheats of reaction, mixing, dilution, and wetting. The principle of the technique is to condition waterand a solid sample separately in a calorimeter, and then determine the heat that is produced when thetwo are brought in contact with each other. Most such instruments are semi-adiabatic calorimeters, inwhich the temperature that is increase brought about by the process of interest is measured. There arecommercial solution calorimeters from several manufacturers on the market.

Forests 2019, 10, 674 9 of 21
The wetting enthalpy ∆weth (J gwood−1) is calculated from the measured heat and the dry mass of
the sample (Equation (2)). The measurements can be made with different initial moisture contents.The highest wetting enthalpy is found when the dry samples are measured; as the moisture content ofsamples increase, the wetting enthalpy will decrease. For samples that are already wet (saturated), thewetting enthalpy is zero. By making measurements on samples with different moisture contents, themoisture content dependence of the wetting enthalpy can be found, and this can be used to calculatethe mixing enthalpies as a function of the moisture content. One usually needs to fit the results to anequation to do this without getting excessive noise. When we did this—while using an exponentialequation (cf. Equation (7))—we both used the same weighing factors on all data points, and appliedhigh weighing factors on the data at zero moisture content to make the curve pass closer to thesedata points.
In our measurements, the wood samples were preconditioned via absorption at different RHsin climate chambers for at least three days to different set initial moisture contents. The dry sampleswere prepared by storing the wood at 103 ◦C in a drying oven for at least 24 h. We used a 1455Solution Calorimeter from Parr Instrument Company (Moline, IL, USA) to determine the wettingenthalpy. All of the equipment was stored at stable temperature prior to the measurements. The sampleand 100 mL deionized water were placed in the measuring cell of the calorimeter, while using aninitial measurement time for stable baseline prior to the initiation of the wetting of at least 15 min.Subsequently, injection was performed. Afterwards an additional baseline time of at least 15 min. wasused. Data evaluation was performed with Origin Version 9.1. Two linear curve fits were calculated todetermine baseline parts before and after reaction. The difference between these two temperature lineswas used as temperature increase ∆T to determine the heat of wetting:
Qwet = Ca × ∆T (8)
The apparent heat capacity of the instrument Ca (J K−1) was determined while using TRIS andhydrochloric acid.
3.3. Sorption Calorimetry
The sorption calorimeter that we have used is a specialized instrument for solid-vapor interactionstudies. In the instrument, two isothermal heat conduction calorimeters (a double twin calorimeter) [27]simultaneously and separately measure the heat production rate (thermal power) of the vaporization ofwater from a vapor source and of the absorption of the same vapor in a sample. During a measurement,water is vaporized at the source, diffuses down a tube that determines the mass increase rate of thesample, and is then absorbed by the sample.
The thermal power of vaporization Pvap (W) and the thermal power of sorption Psorp (W) arecontinuously measured. Counting both of these as positive for exothermal processes, Psorp is positiveand Pvap is negative. From these two thermal powers, it is possible to evaluate how a triplet ofinformation changes throughout the measurement: sample relative humidity ϕ, moisture content c(gwater gwood
−1), and mixing enthalpy ∆mixh (J gwater−1) [28]:
ϕ(t) = 1−Pvap(t)
Pmax(9)
c(t) = c0 +1
m0 · ∆vaph
t∫τ=0
Pvap(τ) dτ (10)
∆mixh(t) = ∆vaph(
Psorp(t)
Pcond(t)− 1
)(11)

Forests 2019, 10, 674 10 of 21
Here, Pmax (W) is the maximal thermal power of vaporization in the device, i.e., when a measurementis made with a drying agent that keeps the water activity at zero in the sample position; c0 (gwater
gdry sample−1) is the initial moisture content of the sample (usually zero); m0 (g) is the dry mass of the
sample; and, ∆condh (J gvapor−1) is the condensation enthalpy of water. Equations (9)–(11) are based on
Fick’s law of diffusion (Equation (9)), a mass balance (Equation (10)), and a thermal power balance(Equation (11)). Thus, the method is only based on a few fundamental physical principles, and can beregarded as robust in this respect.
A new and unpublished prototype sorption calorimeter was used. It is based on the samemeasurement principles as the sorption calorimeters that were described in references [28], but in thenew instrument all parts except a vaporization cup (for the water) and a sorption cup (for the sample)are fixed in the calorimeter. The sample masses were 21–46 mg, the samples were dried for about 24 hat 100 ◦C and vacuum, and the measurements were made at 25 ◦C.
In this prototype, the sample cup was smaller when compared to previous instruments and thewood powders therefore formed a plug of about 5 mm height. There is some uncertainty on how closeto equilibrium the measurements were made because of internal diffusion resistances in the plug (seeSection 5.3).
The evaluation procedure is described in reference [28]. The calorimeter was calibrated withelectrical heaters and the maximal output signal (about 800 µW) was measured with drying agents(molecular sieves). The Tian correction was applied to remove the effect of the thermal inertia of thecalorimeter [29]. An initial correction [28] was made, but no diffusion time-lag correction was used(it does not improve the result of a measurement on wood). As the accuracy of the enthalpy resultsdeteriorates at higher RHs, no mixing enthalpies above 80% RH are reported.
3.4. RH Perfusion Calorimetry
A fourth method to directly measure heats that are associated with wood-water interactions is byflowing gas with step-wise increasing or decreasing RH over samples in an isothermal calorimeter,which is an instrument that measures the thermal power. This technique has been available for someyears, but it is mainly used for quantifying amorphicity in pharmaceutical powders, for polymorphismstudies, and for changing the RH inside the calorimetric vials for stability and compatibility studies [30].We have used the instrument to step up and step down the RH of the nitrogen gas flowing through thecalorimetric vial with the wood sample. When the RH is increased, water vapor will be absorbed, sothat the wood can reach a new equilibrium state, and the calorimeter will measure the heat that isassociated with that event. The sorption/mixing enthalpy can be calculated if this heat is combinedwith the change in moisture content from a separate isotherm measurement.
The primary result from the calorimeter is the thermal power P (W) as a function of time.The thermal power result for each RH-step can be integrated to give heats Q (J). From the sorptionisotherm that was measured in a separate measurement, we can calculate the change in moisturecontent, ∆c. If we divide the heat by the dry mass and the moisture content change, we get the sorptionenthalpy:
∆sorph =Q
m0 · ∆c(12)
which has units of J gwater−1. This is the mean sorption enthalpy in the moisture content region of
the RH-step.The measurements were made in a nanocalorimeter in a TAM IV thermostat (TA Instruments,
New Castle, DE, USA) and the RH of the atmosphere in the calorimeter was controlled by a Gas FlowControl Kit (TA Instruments, New Castle, DE, USA). Samples of about 12 mg of wood particles wereweighed, placed in the calorimeter ampoule, and dry nitrogen was then purged over the sample untilthe thermal power signal from the calorimeter became stable (stability criterion: 300 nW/h drift, 100 nWstandard deviation). The flow rate was set to 200 mL/h, which is the highest flow rate recommendedto allow for the gas to equilibrate to the measuring temperature. The next RH-step was made 1 h
Forests 2019, 10, 674 11 of 21
after stability was reached. The following RHs were used: 0-5-10-20-50-80-90-95-100% and the sameRH-levels back to 0% RH. It should be noted that other types of calorimetric instruments, in which thevapor is delivered to the sample in other ways, can also be used for similar measurements, see, forexample, reference [31].
In the evaluation, each thermal power peak was integrated and the resulting heat was divided bythe dry mass. We adjusted the measured mass, assuming that the sample moisture content was 8%, asthe sample masses were determined in as-is conditions before the drying in the calorimeter. We thendivided by the assumed moisture content change to calculate the sorption enthalpies, calculating thisfrom the 20 ◦C isotherms that are seen in Figure 2 (below). Finally, the condensation enthalpy wassubtracted to give the mixing enthalpy.
Forests 2019, 10, x FOR PEER REVIEW 11 of 21
the thermal power signal from the calorimeter became stable (stability criterion: 300 nW/h drift, 100
nW standard deviation). The flow rate was set to 200 mL/h, which is the highest flow rate
recommended to allow for the gas to equilibrate to the measuring temperature. The next RH-step
was made 1 h after stability was reached. The following RHs were used: 0-5-10-20-50-80-90-95-100%
and the same RH-levels back to 0% RH. It should be noted that other types of calorimetric
instruments, in which the vapor is delivered to the sample in other ways, can also be used for similar
measurements, see, for example, reference [31].
In the evaluation, each thermal power peak was integrated and the resulting heat was divided
by the dry mass. We adjusted the measured mass, assuming that the sample moisture content was
8%, as the sample masses were determined in as-is conditions before the drying in the calorimeter.
We then divided by the assumed moisture content change to calculate the sorption enthalpies,
calculating this from the 20 °C isotherms that are seen in Figure 2 (below). Finally, the condensation
enthalpy was subtracted to give the mixing enthalpy.
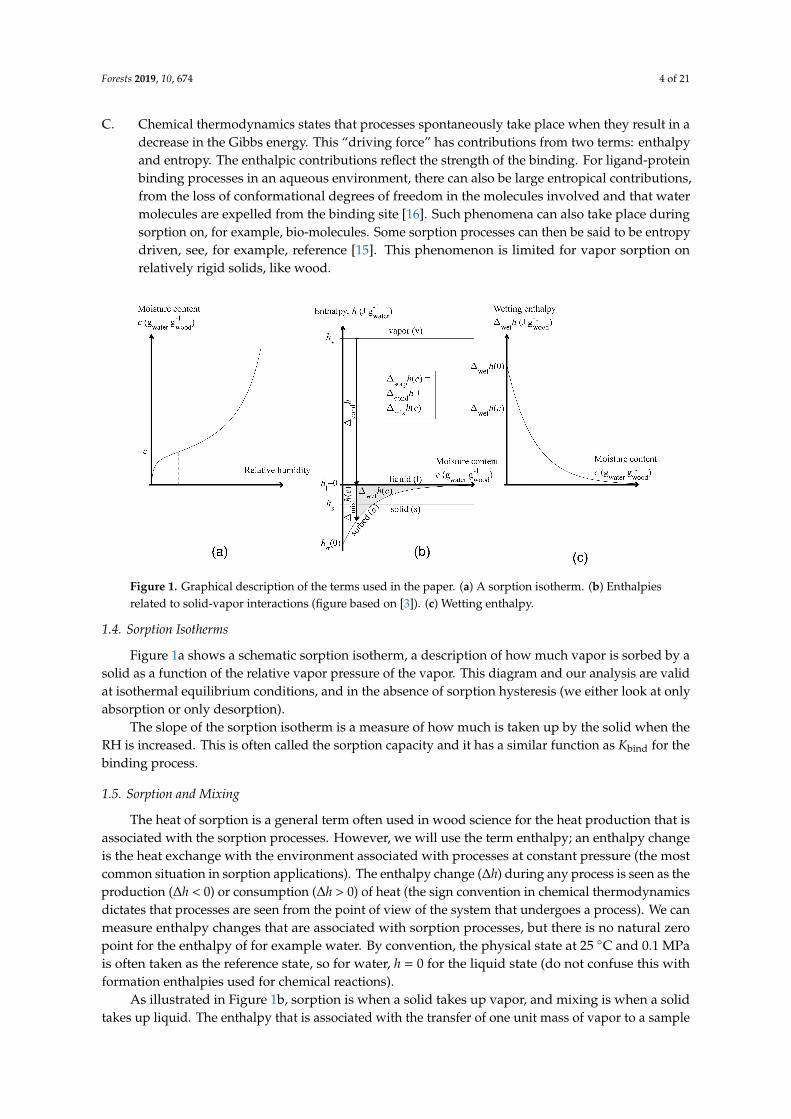
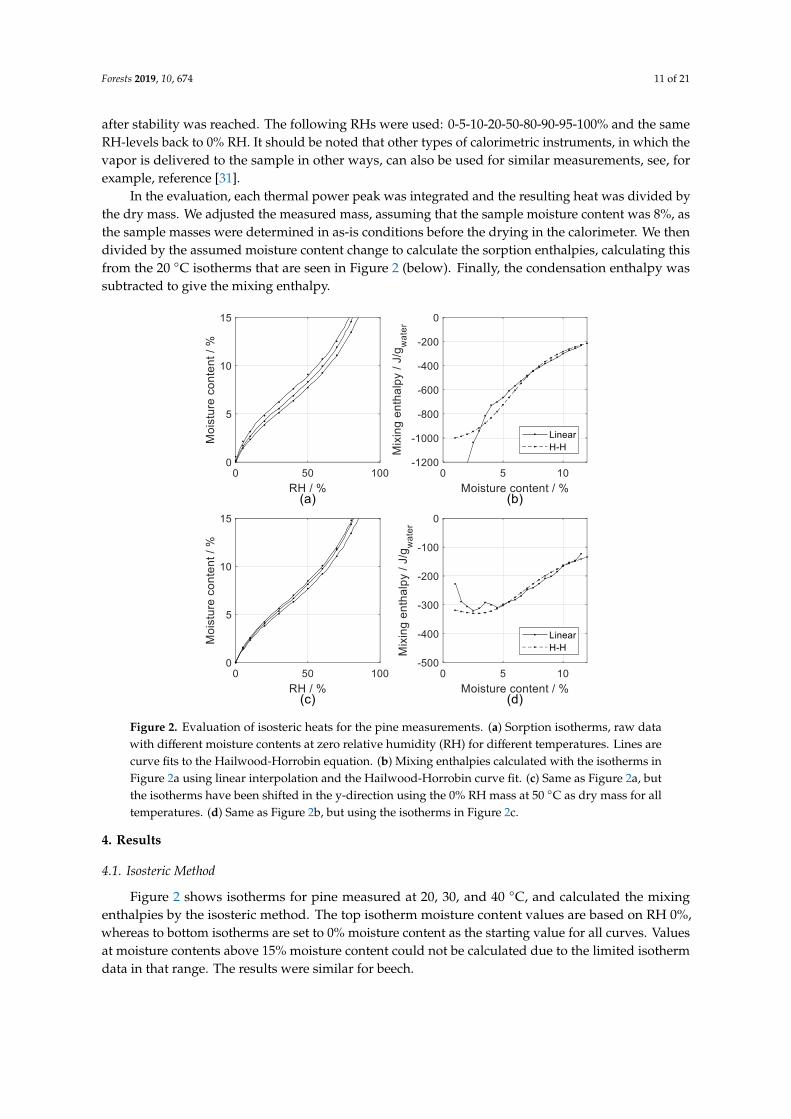
Figure 2. Evaluation of isosteric heats for the pine measurements. (a) Sorption isotherms, raw data
with different moisture contents at zero relative humidity (RH) for different temperatures. Lines are
curve fits to the Hailwood-Horrobin equation. (b) Mixing enthalpies calculated with the isotherms in
Figure 2a using linear interpolation and the Hailwood-Horrobin curve fit. (c) Same as Figure 2a, but
the isotherms have been shifted in the y-direction using the 0% RH mass at 50 °C as dry mass for all
temperatures. (d) Same as Figure 2b, but using the isotherms in Figure 2c.
4. Results
4.1. Isosteric Method
Figure 2 shows isotherms for pine measured at 20, 30, and 40 °C, and calculated the mixing
enthalpies by the isosteric method. The top isotherm moisture content values are based on RH 0%,
whereas to bottom isotherms are set to 0% moisture content as the starting value for all curves. Values
at moisture contents above 15% moisture content could not be calculated due to the limited isotherm
data in that range. The results were similar for beech.
Figure 2. Evaluation of isosteric heats for the pine measurements. (a) Sorption isotherms, raw datawith different moisture contents at zero relative humidity (RH) for different temperatures. Lines arecurve fits to the Hailwood-Horrobin equation. (b) Mixing enthalpies calculated with the isotherms inFigure 2a using linear interpolation and the Hailwood-Horrobin curve fit. (c) Same as Figure 2a, butthe isotherms have been shifted in the y-direction using the 0% RH mass at 50 ◦C as dry mass for alltemperatures. (d) Same as Figure 2b, but using the isotherms in Figure 2c.
4. Results
4.1. Isosteric Method
Figure 2 shows isotherms for pine measured at 20, 30, and 40 ◦C, and calculated the mixingenthalpies by the isosteric method. The top isotherm moisture content values are based on RH 0%,whereas to bottom isotherms are set to 0% moisture content as the starting value for all curves. Valuesat moisture contents above 15% moisture content could not be calculated due to the limited isothermdata in that range. The results were similar for beech.

Forests 2019, 10, 674 12 of 21
4.2. Heat of Wetting
Figure 3a shows the combined results from the heat of wetting measurements on beech and pine.It is seen that the results are similar for the two species. Four pine measurements (crosses) were judgedto be outliers; possibly water vapor had leaked into the sample chamber before the measurementstarted. The wetting enthalpy results were fitted to two functions (see figure caption), which weredifferentiated to provide the mixing enthalpies that are seen in Figure 3b. The measured values forbeech and pine at zero moisture content are in the range of 55 to 70 J gwood
−1, and at 20% moisture
content the wetting enthalpy is close to zero for both species.
Figure 3. Results from heat of wetting measurements. (a) Measured wetting enthalpy of beech (opencircles) and pine (filled triangles) as a function of initial moisture content. Crosses are considered to beoutliers and are not included in the evaluation. Two curve fittings are shown; the solid curve is theleast square curve fit to the exponential function; the dashed line has been forced to go through a meanvalue of the points at zero moisture content. (b) Calculated mixing enthalpy.
4.3. Sorption Calorimetry
Figure 4 shows the result of six measurements with the sorption calorimeter. Sorption isothermsand mixing enthalpies are both measured in the same measurement. The sorption isotherms are similarto the isotherms that are given in Figure 2, but they are not sigmoidal because they lack the initial sharprise in the isotherm; this odd behavior is discussed in the Discussion. The mixing enthalpy curves areonly shown up to a moisture content corresponding to 80% RH. The absolute mixing enthalpy at 0%RH is in the range 700–900 J gwater
−1.
Figure 4. Results from six measurements using a sorption calorimeter: (a) Sorption isotherms.(b) Mixing enthalpies. In both plots, black curves are beech and gray curves are pine.

Forests 2019, 10, 674 13 of 21
4.4. RH Perfusion Calorimetry
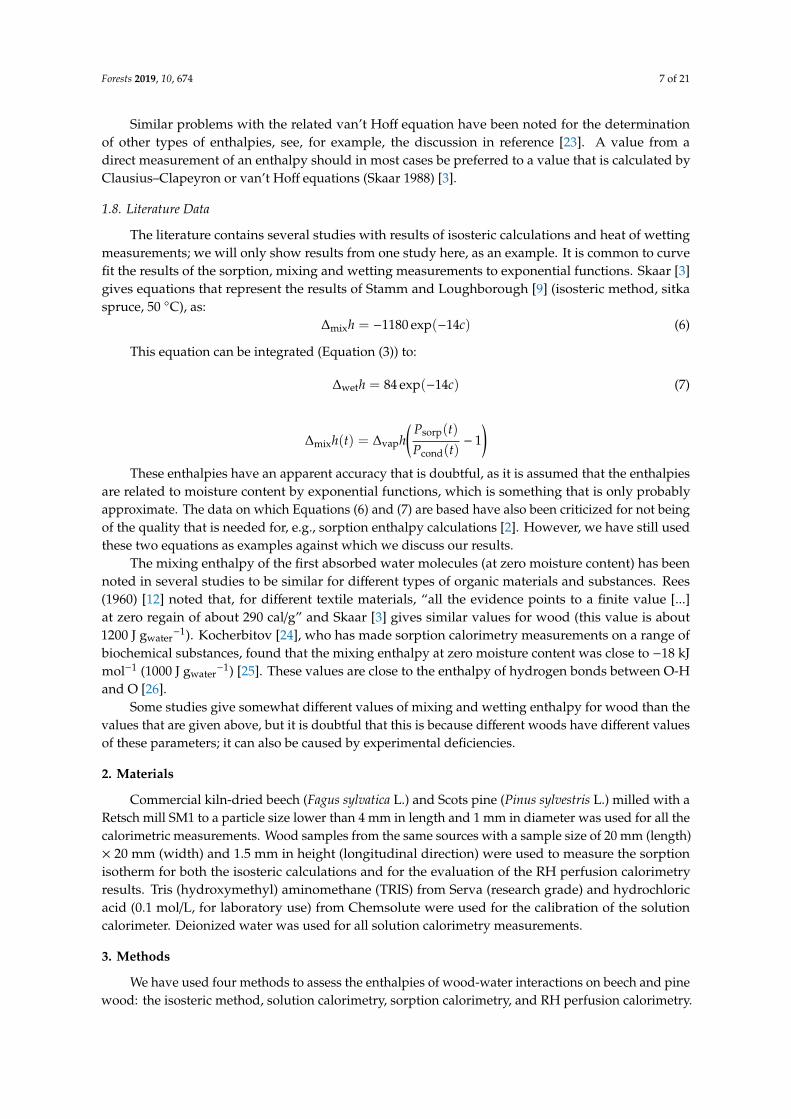
Figure 5a,b shows the RH and the thermal power from a measurement with a 12 mg sample ofpine. It is clearly seen that each change in RH results in heat being released (absorption) or taken up(desorption). We need to divide the heat (Figure 5c) with the change in moisture content to calculatethe sorption enthalpy for the RH-range of a peak (Equation (12)) As this was only a test measurement,we have only made the mixing enthalpy calculation for the two largest absorption steps for pine, asshown in Table 3. The differences seen between the calculated results and the literature values aremost probably explained by the uncertainties of this test measurement, see Section 5.4.
Figure 5. Results from vapor flow method for a 12 mg sample of pine. (a) The RH program. (b) Theresulting thermal power peaks (the arrow shows the exothermal direction, heat production). (c) Thetotal heat (integrated thermal power); the numbers are the heats (J gwood
−1) determined for each step.
Table 3. Evaluation of two absorption steps for the RH perfusion calorimetry measurement on pine.The literature values are calculated from Equation (6). Note that the lower measured mixing enthalpyvalue has the wrong sign (see Section 5.4).
RH-Step c/gwater gwood−1 Q J
gwood−1
∆sorph/Jgwater−1
∆mixh/J gwater−1
Initial Final Difference Calc. Lit.
20→50% 0.042 0.085 0.043 121 −2800 −360 −49050→80% 0.085 0.148 0.063 135 −2150 300 −240
5. Discussion
5.1. Isosteric Method
As measured isotherms contain random errors, it may be difficult to directly use them to dothe isosteric evaluation with Equation (5). Therefore, it is common to use a sorption isotherm fittingfunction for creating smooth sorption isotherms. This will give smooth results, but the curve fittingmay introduce errors, as the used equations may, to some extent, dictate the shape of the isotherms.
Forests 2019, 10, 674 14 of 21
Linear interpolation (as we also used) does not introduce the bias of an assumed fitting function, butwill lead to a noisier result. Our use of linear interpolation or the Hailwood–Horrobin model showsimilar mixing enthalpies at moisture contents that are above 3%, but large deviations are noticeable atlower moisture contents.
The two versions of the isotherms gave quite different mixing enthalpies at 0% RH, indicatingthat the isosteric heat method is sensitive to the quality of the isotherm data. While usingthe Hailwood–Horrobin curve fit, the maximum absolute mixing enthalpy at dry conditions isapproximately 1000 1 and 300 J gwater
−1, respectively, for the two versions of the isotherms. As 1000 Jgwater
−1 is close to the literature value (Equation (3)), it seems that the curve fitted original data fromthe sorption balance was appropriate for use with the isosteric method, even if the 0% RH moisturecontents were not correct. A reason for this is that the curve fit is not influenced at all by the moisturecontent value at 0% RH, as the Hailwood–Horrobin isotherm equation always passes through theorigin (see Figure 2a). In contrast, the linear interpolation—which gives similar values above 3%moisture content—does not work at all at lower moisture content.
Here, it should be mentioned that our use of the Hailwood–Horrobin sorption isotherm equationis rather arbitrary and does not indicate that the physical interpretation of sorption that the authors ofthis equation made are correct for the wood-water case. As many of the equations used to fit woodsorption data have the same mathematical form—which fits wood isotherms well—we could insteadhave used the mathematical equation without the physical interpretations that come along with thename. Such an approach, called the ABC-isotherm, has been proposed by Zelinka et al. [32]
The correction of the isotherms to a common dry moisture content were not successful, as itresulted in much lower absolute mixing enthalpies than that found in literature, especially at lowmoisture contents. We repeat that this highlights that the use of the Clausius–Clapeyron equationdemands very good isotherm data.
The application of the isosteric method to sorption on complex materials, like wood, has beenquestioned in literature for a long time. The main criticism is based on the derivation of theClausius–Clapeyron equation being made under simplified/ideal conditions. An example is thecondition of reversibility, which does not seem to be present in the wood-water system, in which stronghysteresis/scanning effects are present. Reversibility may be observed for absorption on inorganiccrystal surfaces, but it does not exist for organic materials with bulk sorption [12]. Another problemwith the application of the Clausius–Clapeyron equation to the wood-water system is that wood hassignificant swelling/shrinkage [33]. A third problem is that the isosteric method needs equilibriumisotherms [34], and it is known that the result of an isotherm measurement is influenced by how theRH is changed (for example, how long time that is spent at each RH level).
Glass et al. [35] recommend the use of 0.0003% min.−1 as equilibrium moisture content (EMC)criterium for measuring sorption isotherms. Our values (0.0007 to 0.0018% min−1) are above thatthreshold and this could be an explanation for the seen deviations in the isosteric results. Even if someof our results are in agreement with the literature, the dependence of curve fitting and dry mass shouldbe further investigated; applying the isosteric method to swelling organic materials is possible, but itslimitations should be further investigated [35,36].
In summary, the isosteric method is a classical method that has yielded some of the most usedenthalpy results in literature for the wood-water system. It is convenient for those who can measuresorption isotherms, but that do not have appropriate calorimeters. However, the method is sensitive tosmall errors in the measured isotherms, so great care must be taken during measurements, and thewood-water system does not fulfill the theoretical foundations of the Clausius–Clapeyron equation.
5.2. Solution Calorimetry
Our wetting enthalpy for dry beech and pine (66 J gwood−1) corresponds rather well with the
literature. Hearmon and Burcham [37] found about 62 J gwood−1 for dry Douglas fir. Dieste et al. [22]
found about 48 J gwood−1 for dry beech wood when using the same calorimeter as in our investigations.

Forests 2019, 10, 674 15 of 21
75–87 J gwood−1 were reported for dry pine wood by Kelsey [38]. In general, the wetting enthalpy seems
to be independent of the species [39], so the differences between the above studies could be caused byexperimental non-idealities. Additionally, the degree of grinding has influence on the absolute valueof the wetting enthalpy [37].
It should be noted that the wetting enthalpy of dry materials is mainly a function of theirhygroscopicity. This is, for example, clearly seen in the compilation that is given by Rees [12], in whichthe wetting enthalpies of dry viscose and cotton are approx. 110 and 45 J gsolid
−1. This is in goodagreement with that the moisture content of viscose is about twice that of cotton throughout the wholeRH-range [40].
At least for the evaluation of mixing enthalpies from wetting enthalpies, the data has to be fitted toan equation. Most commonly, an exponentially decaying function is used, but such a function will, ofcourse, also put some constraints on the results. With the application of curve fitting, also values closeto 0% RH—which are difficult to experimentally assess with solution calorimetry—can be determined.
It should be noted that the individual data points might need to have different weighing factors ina curve fit to obtain an optimal shape of the curve. We needed to apply higher weighing factors to thedata points at dry conditions, otherwise the curve gave a seemingly too high value for dry conditions.
Solution calorimetry is a robust method, but needs a good sample preconditioning at differentclimates. The method is also time consuming as many measurements have to be made to collectenough data to construct the wetting enthalpy vs. moisture content relationship.
5.3. Sorption Calorimetry
The sorption calorimetric results agreed rather well with the literature data, but the absolutemixing enthalpy at zero moisture content was slightly lower than most literature results, and there wasa lack of a sharp rise in the isotherm at low RHs (cf. Figure 2). This type of problem can be caused bythat the sample is not dry at the start of the measurement, but this is probably not the case here, asit was dried for 24 h in vacuum at 100 ◦C, and not exposed to the ambient conditions for more thana few seconds during the charging. Possibly, it was the internal diffusion resistance in the samplethat was responsible for these deviations; the small sample holder was filled with a 5 mm plug of thesample particles and the internal diffusion resistance in such a sample is not accounted for by theevaluation equations.
The present measurements were made on samples with masses in the range 21–45 mg. The rate ofsorption was such that the RH increased from 0 to 25, 50, and 75% RH in 2, 5, and 11 h, respectively,for the largest sample, and about twice as fast for the smallest sample. These are rather high masschange rates for sorption calorimetry and the results may therefore not be equilibrium results (cf.discussion above). However, there was no correlation between the sample size and the results, andthis is normally an indication that the measurements were made close to equilibrium.
Sorption calorimetry is an interesting technique, as it measures both the sorption isotherm and themixing enthalpy in one measurement, which typically takes only two days. The continuous curves bothisotherm and enthalpy will also show discrete phenomena like stoichiometric hydrate formation [41]and, although such phenomena do not take place in wood, it may be of interest for studies on otherbio-based materials.
Note that the rate of diffusion is controlled by the difference in RH between the water source andthe sample (and the size of the tube through which the diffusion takes place). Thus, the rate of changeof RH (the scanning rate) is controlled by the sample. When the sample has taken up water to increaseits RH, the rate of diffusion will decrease to accommodate the fact that the vapor pressure differencebetween top and bottom has changed.
Of the three parameters measured (RH, moisture content, mixing enthalpy), the RH is theparameter that is most easily disturbed by kinetic effects, such as internal diffusion resistances inthe sample. The moisture content and the mixing enthalpy should therefore be seen as the mainmeasurables. It should be noted that a similar situation often exists in other types of sorption

Forests 2019, 10, 674 16 of 21
measurements: water uptake is easily measured by a balance, but it is often more difficult to knowwhether the corresponding (equilibrium) RH has been reached.
5.4. RH Perfusion Calorimetry
RH perfusion calorimetry is an interesting method for studying solid-vapor relations.The experimental approach is quite straight forward, only small (mg) samples are needed, andit is easy to start an experiment, which automatically runs and only takes about a week.
The results that are presented in Figure 5 are the first measurements of this type to be made. It isseen that the thermal power peaks and the heats of each peak look good, but the evaluated results didnot agree well with literature data, as seen in Table 2 (the results were similar for beech). We believethat this type of measurement can be used to measure the mixing enthalpies, but to do so the methodneeds to be optimized and possibly improved in several respects:
• In this type of measurement, the results of a blank run (without sample) should be subtractedfrom the sample result, as there will also be sorption and the corresponding heats on the internalsurfaces of the vial (this was not done in the present measurements).
• This method should probably not be used with small steps in RH, like the 0-5-10% RH that weused, as this generates small peaks and small moisture content changes, and large uncertainties inthe results.
• The RH that is generated by the equipment needs to be calibrated over the whole RH range,especially at low RHs, where the mass flow controllers that the RH generation is based on can beless reliable. We made a one-point calibration at 75% RH (that gave 0.9% RH higher value, whichis good).
• The drying of the samplse may need to be improved; it is not clear what the initial state ofthe sample was after the initial drying at a set value of 0% RH at 25 ◦C. Possibly, the sampleshould be externally dried, for example, in a vacuum oven, and then quickly transferred to thecalorimetric vial.
Some of the thermal power peaks show significant tailing, which indicates that the samples werenot at equilibrium with the RH of the gas at the end of an RH-step. This is similar to what is oftenseen with, for example, wood in sorption balances. Two possible sources of the seen tailing are thatthe gas flow rate in the calorimeter is low (200 mL/h), cf. reference [42], and that wood can takean unexpectedly long time to come close to equilibrium, because of internal constraints on waterabsorption and desorption [43].
As the sorption isotherm is needed in the evaluation, the calorimetric results have to be combinedwith a sorption isotherm that is measured by some other technique. As isotherms can look slightlydifferent, depending on how they were measured, it may be necessary to find an isotherm techniquethat has similar mass change characteristics as the calorimetric method. We used the isotherms at20 ◦C that were measured for the isosteric calculations. The second calculation in Table 2—that gave amixing enthalpy with the wrong sign-used a moisture content difference of 0.063; if this differencewould have been 0.050 instead, the calculation would have given the literature value. The reason forthis sensitivity is that we are interested in the mixing enthalpy, and this is calculated by subtracting thevaporization enthalpy from the sorption enthalpy; a small difference between two large numbers hasrelatively high uncertainty.
We believe that RH perfusion calorimetry should be further investigated as a tool for studying theinteraction between lignocellulosic materials and water.
5.5. General
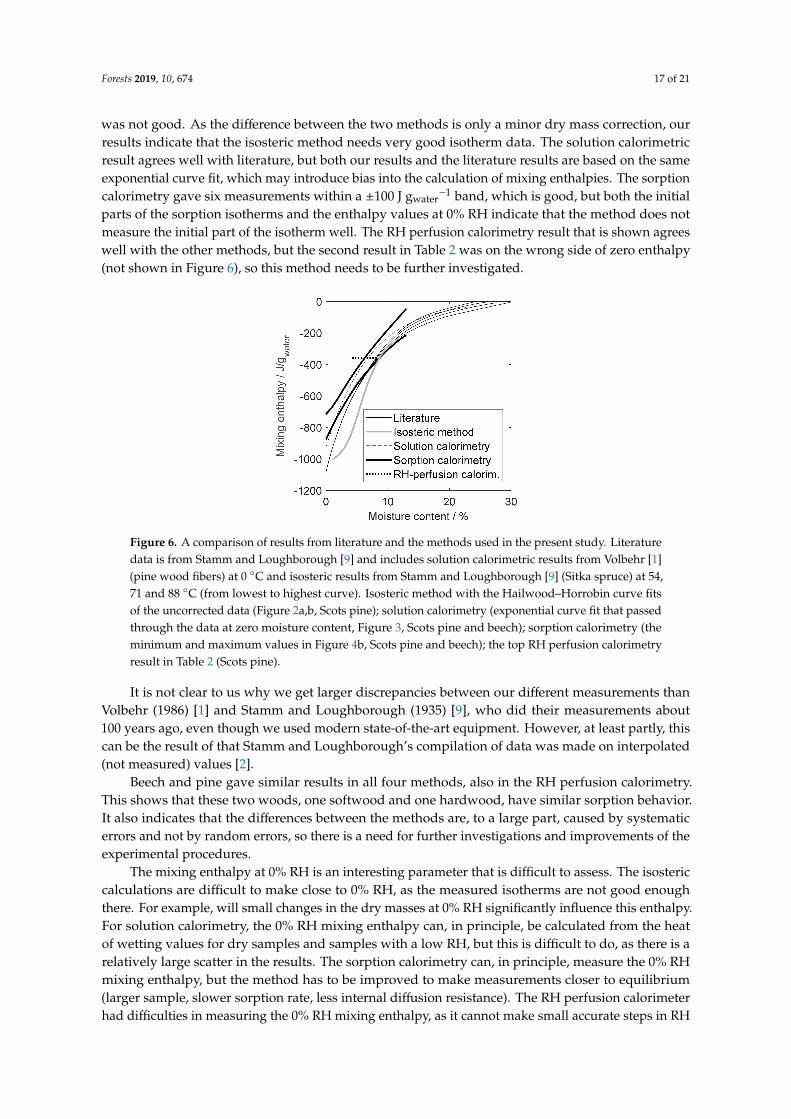
Figure 6 shows a comparison of the results from the four methods and literature data. It isseen that there is a fair agreement, but also differences. For the isosteric method, only one curve isshown in Fig. 6, as we believe that one of the methods that we used to determine the used isotherms
Forests 2019, 10, 674 17 of 21
was not good. As the difference between the two methods is only a minor dry mass correction, ourresults indicate that the isosteric method needs very good isotherm data. The solution calorimetricresult agrees well with literature, but both our results and the literature results are based on the sameexponential curve fit, which may introduce bias into the calculation of mixing enthalpies. The sorptioncalorimetry gave six measurements within a ±100 J gwater
−1 band, which is good, but both the initialparts of the sorption isotherms and the enthalpy values at 0% RH indicate that the method does notmeasure the initial part of the isotherm well. The RH perfusion calorimetry result that is shown agreeswell with the other methods, but the second result in Table 2 was on the wrong side of zero enthalpy(not shown in Figure 6), so this method needs to be further investigated.
Figure 6. A comparison of results from literature and the methods used in the present study. Literaturedata is from Stamm and Loughborough [9] and includes solution calorimetric results from Volbehr [1](pine wood fibers) at 0 ◦C and isosteric results from Stamm and Loughborough [9] (Sitka spruce) at 54,71 and 88 ◦C (from lowest to highest curve). Isosteric method with the Hailwood–Horrobin curve fitsof the uncorrected data (Figure 2a,b, Scots pine); solution calorimetry (exponential curve fit that passedthrough the data at zero moisture content, Figure 3, Scots pine and beech); sorption calorimetry (theminimum and maximum values in Figure 4b, Scots pine and beech); the top RH perfusion calorimetryresult in Table 2 (Scots pine).
It is not clear to us why we get larger discrepancies between our different measurements thanVolbehr (1986) [1] and Stamm and Loughborough (1935) [9], who did their measurements about100 years ago, even though we used modern state-of-the-art equipment. However, at least partly, thiscan be the result of that Stamm and Loughborough’s compilation of data was made on interpolated(not measured) values [2].
Beech and pine gave similar results in all four methods, also in the RH perfusion calorimetry.This shows that these two woods, one softwood and one hardwood, have similar sorption behavior.It also indicates that the differences between the methods are, to a large part, caused by systematicerrors and not by random errors, so there is a need for further investigations and improvements of theexperimental procedures.
The mixing enthalpy at 0% RH is an interesting parameter that is difficult to assess. The isostericcalculations are difficult to make close to 0% RH, as the measured isotherms are not good enoughthere. For example, will small changes in the dry masses at 0% RH significantly influence this enthalpy.For solution calorimetry, the 0% RH mixing enthalpy can, in principle, be calculated from the heatof wetting values for dry samples and samples with a low RH, but this is difficult to do, as there is arelatively large scatter in the results. The sorption calorimetry can, in principle, measure the 0% RHmixing enthalpy, but the method has to be improved to make measurements closer to equilibrium(larger sample, slower sorption rate, less internal diffusion resistance). The RH perfusion calorimeterhad difficulties in measuring the 0% RH mixing enthalpy, as it cannot make small accurate steps in RH

Forests 2019, 10, 674 18 of 21
close to 0% RH. It seems that all four methods have their problems when it comes to assessing the0% RH mixing enthalpy, but that the simultaneous use of more than one method will lead to morecertain values.
The sorption enthalpy is the sum of the condensation enthalpy and the mixing enthalpy, and themixing enthalpy is the sum of the enthalpies of all different processes that take place when liquidwater is taken up by the wood. One way to look at this is to divide the mixing enthalpy into threeparts that are related to the changes that take place for the absorbed water, the already absorbed water,and the wood. Often, these components are defined in other ways, for example as heat of swelling. Still,it should be remembered that the methods discussed in this paper could only assess the result of thesum of all the processes taking place during sorption.
The four methods are different when it comes to the study of the effect of hysteresis and scanningon the mixing enthalpy. Most straight-forward is RH perfusion calorimetry, as it is possible to makesteps in both absorption and desorption with this method. Solution calorimetry can also be used forthis by conditioning samples to different RHs by absorption and desorption before a measurement [37].Sorption calorimetry is normally only made in absorption, but there is one study showing that itis possible to also undertake desorption measurements in limited RH ranges [44]. For isostericcalculations, both absorption and desorption (and scanning) data can, in principle, be used, but it seemsthat this violates the assumptions (reversibility, equilibrium) of the Clausius–Clapeyron equation.
A problem for those interested in sorption thermodynamics is that it is often difficult to understandwhat other scientists mean in their papers. Five problems are most common:
• Different terminology is used. For example, are the terms differential heat and integral heat [3]sometimes used for what we have called mixing enthalpy and wetting enthalpy, respectively;differential heat of swelling [9] is our mixing enthalpy; and, the term isosteric heat is typically thesame as our mixing enthalpy, but used if the isosteric method has been used.
• Different symbols are used; for example are Q, H, ∆H, and ∆h used for enthalpy change. We preferto use Q for a measured heat and ∆h for a calculated specific enthalpy change.
• Different sign conventions are used. We have followed the thermochemical convention thatlooks at processes from the standpoint of the system, so heat production (loss of heat by thesystem) gives negative enthalpy. However, it is common to instead show, e.g., mixing enthalpiesas positive.
• A minor issue is the use of calories in the older literature, but as long as the units are writtenout, the multiplication by 4.184 J cal−1 converts heats and enthalpies from calories to joules (theSI-unit).
• All of the sorption and mixing enthalpies can be based either on gram or on mole, as it is the waterthat they refer to; wetting enthalpies for wood can only be given per mass of wood, as wood hasno molar mass. If an enthalpy has units of J g−1, it is thus not possible to know whether it is Jgwood
−1 (a wetting enthalpy) or J gwater−1 (a mixing or sorption enthalpy), so we encourage the
use of sub-indices to indicate this.
Because of the above problems, it is important to clearly state what nomenclature that is used.
6. Conclusions
The mixing enthalpy is a robust measure that can be used for the characterization of the interactionbetween lignocellulosic materials and water. For the first time, a comparison of four different methodsfor determining sorption enthalpy on one material (wood) was made. The results were similar for thetwo woods investigated, and they are in general accordance with the literature, but there is a significantscatter in the result. The four methods all have their advantages and disadvantages, and it is goodto use more than one method in parallel. The isosteric method—which is based on the temperaturedependence of sorption isotherms—should be used with some caution.
Forests 2019, 10, 674 19 of 21
Author Contributions: Conceptualization, M.N., L.W., M.F. and A.K.; methodology, M.N. and L.W.; measurements,M.N., L.W. and C.O.; writing—original draft preparation, L.W., M.N..; writing—review and editing, L.W., M.N.,C.O, M.F. and A.K., visualization, L.W.
Funding: L.W. was supported by Calmetrix and C.O. was supported by TA Instruments.
Acknowledgments: We would like thank Frederik Schüler (University Hamburg) for the heat ofwetting measurements.
Conflicts of Interest: The authors declare no conflict of interest, except that C.O. (TA Instruments) and L.W. (alsoat Calmetrix) work for companies that manufacture calorimetric instruments.
References
1. Volbehr, B. Untersuchungen über die Quellung der Holzfaser; Druck von Schmidt and Klaunig: Kiel, Germany,1896.
2. Glass, S.V.; Zelinka, S.L.; Johnson, J.A. Investigation of Historic Equilibrium Moisture Content Data from the ForestProducts Laboratory; FPL-GTR-229; USDA Forest Service: Washington, DC, USA, 2014; p. 37.
3. Skaar, C. Wood-Water Relations; Springer: Berlin/Heidelberg, Germany; New York, NY, USA, 1988;ISBN 3642736858.
4. Engelund, E.T.; Thygesen, L.G.; Svensson, S.; Hill, C.S. A critical discussion of the physics of wood–waterinteractions. Wood Sci. Technol. 2013, 47, 141–161. [CrossRef]
5. Berthold, J.; Desbrières, J.; Rinaudo, M.; Salmén, L. Types of adsorbed water in relation to the ionic groupsand their counter-ions for some cellulose derivatives. Polymer 1994, 35, 5729–5736. [CrossRef]
6. Ping, Z.H.; Nguyen, Q.T.; Chen, S.M.; Zhou, J.Q.; Ding, Y.D. States of water in different hydrophilicpolymers—DSC and FTIR studies. Polymer 2001, 42, 8461–8467. [CrossRef]
7. Thygesen, L.G.; Engelund, E.T.; Hoffmeyer, P. Water sorption in wood and modified wood at high values ofrelative humidity. Part I: Results for untreated, acetylated, and furfurylated Norway spruce. Holzforschung2010, 64, 315–323. [CrossRef]
8. Rautkari, L.; Hill, C.; Curling, S.; Jalaludin, Z.; Ormondroyd, G. What is the role of the accessibility of woodhydroxyl groups in controlling moisture content? J. Mater. Sci. 2013, 48, 6352–6356. [CrossRef]
9. Stamm, A.J.; Loghborough, K.W. Thermodynamics of the Swelling of Wood. J. Phys. Chem. C 1935,39, 121–132. [CrossRef]
10. Weichert, L. Untersuchungen über das Sorption-und Quellungsverhalten von Fichte, Buche undBuchen-Preßvollholz bei Temperaturen zwischen 20◦ und 100◦C. Eur. J. Wood Wood Prod. 1963, 21, 290–300.[CrossRef]
11. Simpson, W.T. Predicting Equilibrium Moisture Content of Wood by Mathematical Models. Wood Fiber Sci.1973, 5, 41–49.
12. Rees, W.H.; Hearle, J.W.S. Moisture in Textiles. Heat of Absorption; Textile Institute: Manchester, UK;Butterworths Scientific Publications: London, UK, 1960.
13. Cohen, E.R.; Cvitas, T.; Frey, J.; Holmstrom, B.; Kuchitsu, K.; Marquardt, R.; Mills, I.; Pavese, F.; Quack, M.;Stohner, J.; et al. Quantities, Units and Symbols in Physical Chemistry, 3rd ed.; IUPAC and RSC Publishing:Cambridge, UK, 2007; ISBN 978-0-85404-433-7.
14. Gál, S. Über die Ausdrucksweisen der Konzentration des Wasserdampfes beiWasserdampf-Sorptionsmessungen. HCA 1972, 55, 1752–1757. [CrossRef]
15. Vuignier, K.; Schappler, J.; Veuthey, J.-L.; Carrupt, P.-A.; Martel, S. Drug-protein binding: A critical review ofanalytical tools. Anal. Bioanal. Chem. 2010, 398, 53–66. [CrossRef]
16. Freire, E. Isothermal titration calorimetry: Controlling binding forces in lead optimization. Drug Discov.Today Technol. 2004, 1, 295–299. [CrossRef] [PubMed]
17. Markova, N.; Sparr, E.; Wadsö, L.; Wennerström, H. A Calorimetric Study of Phospholipid Hydration.Simultaneous Monitoring of Enthalpy and Free Energy. J. Phys. Chem. B 2000, 104, 8053–8060. [CrossRef]
18. Marabi, A.; Mayor, G.; Raemy, A.; Bauwens, I.; Claude, J.; Burbidge, A.; Wallach, R.; Saguy, I.S. Solutioncalorimetry: A novel perspective into the dissolution process of food powders. Food Res. Int. 2007,40, 1286–1298. [CrossRef]
Forests 2019, 10, 674 20 of 21
19. Simon, C.; Esteban, L.; Palacios, P.D.; Garcia Fernández, F.; García-Iruela, A. Thermodynamic propertiesof the water sorption isotherms of wood of limba (Terminalia superba Engl. and Diels), obeche (Triplochitonscleroxylon K. Schum.), radiata pine (Pinus radiata D. Don) and chestnut (Castanea sativa Mill.). Ind. Crop. Prod.2016, 94, 122–131. [CrossRef]
20. Sirota, N. Certain Problems of Polymorphism (II) Generalized Clausius-Clapeyron Equation and Ostwald’sStep Rule. Cryst. Res. Technol. 1987, 22, 1343–1381. [CrossRef]
21. Bahar, R.; Azzouz, S.; Remond, R.; Ouertani, S.; Elaieb, M.T.; El Cafci, M.A. Moisture sorption isothermsand thermodynamic properties of Oak wood (Quercus robur and Quercus canariensis): Optimization of theprocessing parameters. Heat Mass Transf. 2016, 46, 304. [CrossRef]
22. Dieste, A.; Krause, A.; Militz, H. Modification of Fagus sylvatica (L.) with 1, 3-dimethylol-4,5-dihydroxyethylene urea (DMDHEU): Part 1. Estimation of heat adsorption by the isosteric method(Hailwood-Horrobin model) and by solution calorimetry. Holzforschung 2008, 62, 577. [CrossRef]
23. Mizoue, L.S.; Tellinghuisen, J. Calorimetric vs. van’t Hoff binding enthalpies from isothermal titrationcalorimetry: Ba2+-crown ether complexation. Biophys. Chem. 2004, 110, 15–24. [CrossRef]
24. Kocherbitov, V. Salt-saturated salt solution as a standard system for sorption calorimetry. Thermochim. Acta2004, 421, 105–110. [CrossRef]
25. Albèr, C.; Engblom, J.; Falkman, P.; Kocherbitov, V. Hydration of hyaluronan: Effects on structural andthermodynamic properties. J. Phys. Chem. B 2015, 119, 4211–4219. [CrossRef]
26. Benson, S.W. Some Observations on the Structures of Liquid Alcohols and Their Heats of Vaporization. J. Am.Chem. Soc. 1996, 118, 10645–10649. [CrossRef]
27. Wadsö, L.; Markova, N. A double twin isothermal microcalorimeter. Thermochim. Acta 2000, 360, 101–107.[CrossRef]
28. Wadsö, L.; Markova, N. A method to simultaneously determine sorption isotherms and sorption enthalpieswith a double twin microcalorimeter. Rev. Sci. Instrum. 2002, 73, 2743. [CrossRef]
29. Wadso, L. Operational issues in isothermal calorimetry. Cem. Concr. Res. 2010, 40, 1129–1137. [CrossRef]30. Miller, D.P.; Lechuga-Ballesteros, D. Rapid Assessment of the Structural Relaxation Behavior of Amorphous
Pharmaceutical Solids: Effect of Residual Water on Molecular Mobility. Pharm. Res. 2006, 23, 2291–2305.[CrossRef] [PubMed]
31. Ostrovskii, V.E.; Gostev, B.V. Heat effects and rates and molecular mechanisms of water sorption byperfluorinated polymer materials bearing functional groups. J. Therm. Anal. 1996, 46, 397–416. [CrossRef]
32. Zelinka, S.L.; Glass, S.V.; Thybring, E.E. Myth versus reality: Do parabolic sorption isotherm models reflectactual wood–water thermodynamics? Wood Sci. Technol. 2018, 52, 1701–1706. [CrossRef]
33. Willems, W. Equilibrium thermodynamics of wood moisture revisited: Presentation of a simplified theory.Holzforschung 2016, 70, 963–970. [CrossRef]
34. Willems, W. Hydrostatic pressure and temperature dependence of wood moisture sorption isotherms.Wood Sci. Technol. 2014, 48, 483–498. [CrossRef]
35. Glass, S.V.; Boardman, C.R.; Thybring, E.E.; Zelinka, S.L. Quantifying and reducing errors in equilibriummoisture content measurements with dynamic vapor sorption (DVS) experiments. Wood Sci. Technol. 2018,52, 909–927. [CrossRef]
36. Glass, S.V.; Boardman, C.R.; Zelinka, S.L. Short hold times in dynamic vapor sorption measurementsmischaracterize the equilibrium moisture content of wood. Wood Sci. Technol. 2016, 51, 243–260. [CrossRef]
37. Kajita, H. Heat of wetting of wood in water. I. Kyoto Pref. Univ. Bull. 1977, 20, 49–61.38. Kelsey, K.E.; Clarke, L.N. the heat of sorption of water in wood. Aust. J. Appl. Sci. 1955, 7, 161–175.39. Hearmon, R.F.S.; Burcham, J.N. Specific Heat and Heat of Wetting of Wood. Nature 1955, 176, 978. [CrossRef]40. Kajita, H. Heat of Wetting of the Constituents of Wood in Water. J. Soc. Mat. Sei. Jpn. 1977, 26, 417–423.
[CrossRef]41. Hearle, J.W.S.; Peters, R.H. Moisture in Textiles; Textile Institute: Manchester, UK; Butterworths Scientific
Publications: London, UK, 1960.42. Wadsö, L. Principles of a microcalorimetric technique for the study of mould activity as a function of relative
humidity. J. Therm. Anal. 1997, 49, 1053–1060. [CrossRef]

Forests 2019, 10, 674 21 of 21
43. Wadsö, L. Describing non-Fickian water-vapour sorption in wood. J. Mater. Sci. 1994, 29, 2367–2372.[CrossRef]
44. Kocherbitov, V.; Wadsö, L. A desorption calorimetric method for use at high water activities. Thermochim.Acta 2004, 411, 31–36. [CrossRef]
© 2019 by the authors. Licensee MDPI, Basel, Switzerland. This article is an open accessarticle distributed under the terms and conditions of the Creative Commons Attribution(CC BY) license (http://creativecommons.org/licenses/by/4.0/).
Copyright © 2022 FDOKUMEN