Diapycnal oxygen supply to the tropical North Atlantic oxygen minimum zone
Upload
khangminh22Category
view
3download
0
Int. J. Electrochem. Sci., 16 (2021) Article Number: 211111, doi: 10.20964/2021.11.45
International Journal of
ELECTROCHEMICAL SCIENCE
www.electrochemsci.org
Electrochemical Determination of Chemical Oxygen Demand in
Mixed Organic Solution by Al/SnO2-TiO2 Electrode
Xiaojiao Li 1, 2, Yan Shang 3, Carlos Fernandez 4, Tingting Pei 1, Linshan Wang 1,*
1 College of Sciences, Northeastern University, Shenyang 110819, P.R. China. 2 School of Materials Science and Engineering, Northeastern University, Shenyang 110819, P.R.
China. 3 Chemical Experiment Center, Department of Basic Science, JilinJianzhu University, Changchun
130118, P.R. China. 4 School of Pharmacy and Life Sciences, Robert Gordon University, AB107GJ, Aberdeen, UK. *E-mail: [email protected]
Received: 9 August 2021 / Accepted: 10 September 2021 / Published: 10 October 2021
Chemical oxygen demand (COD) is one of the most significant parameters in water-quality analysis,
such as wastewater effluent monitoring. However, COD determination faces challenges of long
measuring time and the use of toxic substances. In this work, an Al/SnO2-TiO2 composite film electrode
was prepared using the sol-gel method and dip-coating method for electrochemical determination of
COD. The electrocatalytic reaction kinetics of the different organic substances on the electrode was
studied in a three-electrode system. It was observed that the electrocatalytic reactions of all tested organic
compounds on the Al/SnO2-TiO2 electrode fitted the first-order kinetics. Based on the reaction rate
constants at different temperatures, the activation energies for electrocatalytic oxidations of methylene
blue and rhodamine B were 9.92 kJ/mol and 14.7 kJ/mol, respectively. It was confirmed that dynamic
behaviors of different organic substances on the electrode surface were different from each other. In
addition, seven single-component organic solutions, four two-component organic solutions, and three
three-component organic solutions were selected as the target standard solutions for the COD
measurement experiments. Initial working currents measured by chronocoulometry were taken as the
index of the value of COD of the target solutions within the operating voltage range of 1.5~3.5 V (vs.
SCE). In the range of 20~100 mg/L, COD values of either single-component or multiple-component
solutions were linearly related to the initial working currents. For solutions composed of different
organic compounds with the identical COD concentration, each of their initial working currents was
different from the others and increased with the working voltage. It could be concluded that the initial
working currents measured by chronocoulometry was depended on COD concentration, applied voltage,
as well as the composition of the tested solutions. By comparing the COD measurement results, using
potassium hydrogen phthalate solution as the simulated wastewater, of the presented method with those
of the standard potassium dichromate method, the accuracy and reproducibility of this method had also
been approved. Therefore, we report a simple, rapid, and environmentally friendly COD determination
method using an Al/SnO2-TiO2 electrode, which is feasible for single- and multiple-component organic
solutions.
Int. J. Electrochem. Sci., 16 (2021) Article Number: 211111
2
Keywords: Chemical oxygen demand; Electrochemical method; Multi-component solution; Al/SnO2-
TiO2 electrode
1. INTRODUCTION
Chemical oxygen demand (COD) is one of the most widely used parameters of water-quality
analysis [1]. For industrial sewage and domestic wastewater, the traditional COD method is currently
used for the COD detecting or monitoring, namely the potassium dichromate method. The potassium
dichromate method measures COD by refluxing the sample for 2 hours under strong-acid conditions
with the addition of silver salt as a catalyst. After that, ferrous ammonium sulfate is used as a titration
reagent. The amount of ferrous ammonium sulfate consumed is obtained from titration, and finally, the
concentration of oxygen consumed is calculated [2, 3]. In addition, the chloride ions in the solution are
likely to react with silver sulfate to produce precipitation, which leads to a deviation in the measurement
results. Therefore, mercury sulfate is used to form a complex for eliminating the interference of chloride
ions. Despite the advantages of accurate results, the potassium dichromate method, as a standard method
for COD analysis and detection, also has obvious shortcomings, such as complicated operation steps,
long experiment time, secondary pollution, difficulty to automate monitoring. [2-4].
To overcome the shortcomings of the potassium dichromate method, researchers have done lots
of work to develop fast and environmentally friendly COD analysis and detection methods, which are
commonly divided into three categories [1, 5-7]. The first category is designed on the basis of the
traditional potassium dichromate method [8, 9]. It is improved by shortening the analysis time, reducing
the consumption of chemical reagents, and replacing the titration method with spectrophotometry. Jirka
[8] et al. developed a semi-automatic measurement method based on the traditional potassium
dichromate method. The method used closed glass digestion instead of reflux and measured Cr3+ by
spectrophotometry instead of measuring Cr(VI) by titration. It could digest water samples in batches;
the digestion time reduced from 120 min to 15 min; the consumption of chemical reagents is 5% of the
traditional method; the measurement accuracy also improved. However, secondary pollution was
fundamentally unavoided in this type of method. The second category directly or indirectly determines
COD using photometry, such as ultraviolet-visible spectrophotometry[5, 10, 11]. Matsche [12] reported
that the absorbance of wastewater at 260 nm is linearly related to the COD value of wastewater. The
significant merits of the spectrophotometric method for measuring COD consist in being fast and
needing no chemical additives that may bring out secondary pollution. However, the result in this type
of method is easily affected by the turbidity and composition of the water sample, so the measurement
accuracy is difficult to guarantee. The third category is upon the electrocatalytic oxidation method, which
can be divided into three types, including electrochemical (EC) [13-21], photoelectrochemical (PEC)
[22-24], and photocatalytic (PC) [25-29].
The PC method is directly oxidizing organic matter under chemical catalyst and ultraviolet light.
The principle of this method is based on the reduction of dissolved oxygen concentration in water body
is proportional to COD concentration. The main disadvantages of the PC method are low photocatalytic
efficiency and poor reproducibility [25-29]. Compared with the PC method, the oxidation capacity and
Int. J. Electrochem. Sci., 16 (2021) Article Number: 211111
3
efficiency of the PEC method have been improved. But the use of illumination equipment has increased
the complexity and manufacturing cost of the analysis and detection equipment. Because TiO2 has
excellent photoelectrochemical properties, the PEC method usually uses TiO2 as one of the electrode
compositions. However, the preparation process is very complicated, and the cost is high. There are
many kinds of electrodes for EC method (such as Cu [3, 30], CoO, Pt/PbO2 [31, 32], glassy carbon/NiCu,
Ti/Sb-SnO2/PbO2 [16], boron-doped diamond [33]). However, there are few reports on the use of
electrodes containing TiO2 for COD determination by the EC method [2] (Ti/TiO2 [24]). Compared with
other electrodes, the electrodes with TiO2 are more promising for the EC method because of the superior
oxidative abilities of TiO2, low cost, non-toxic nature, short analysis time, etc. [34-38]. In addition, it
also has a high-efficiency photoelectric conversion performance, which can be applied in the utilization
of solar energy. Therefore, for the EC method, the electrode with TiO2, as a promising COD analysis and
detection technology, needs to develop in the research of electrode preparation and electrode reaction
mechanism.
To deeply study the research, we had prepared an Al/SnO2-TiO2 electrode by sol-gel method and
dip-coating method. The preparation and composition of the electrode, the electrode reaction kinetics of
different organic matters on the electrode surface, and its application in COD determination of single-
and multi-component organic solutions are described in detail below.
2. MATERIALS AND METHODS
2.1 Materials
Aluminum sheet (Al sheet), tetrabutyl titanate, stannic chloride, sulfuric acid (H2SO4, 98 wt%),
phenol (PhOH), aniline (An), propanedioic acid (PDA), and sodium acetate (NaAc) were purchased
from Sinopharm Chemical Reagent Co., Ltd., China. Sodium sulfate (Na2SO4), methyl orange (MO),
methylene blue (MB), glucose (GLc), and rhodamine B (RhB) were brought from Damao Chemical
Reagent Factory, Tianjin, China. Oxalic acid, acetic acid (HAc), potassium hydrogen phthalate (KHP),
and anhydrous ethanol were from Shenyang Chemical Reagent Factory, Shenyang, China. Silver sulfate
(Ag2SO4) and potassium dichromate (K2Cr2O7) were purchased from Shenyang Xinxing Reagent
Factory, Shenyang, China. Moreover, distilled water was used for all purposes.
2.2 Preparation of an Al/SnO2-TiO2 electrode
The Al/SnO2-TiO2 composite film electrode was coated with SnO2-TiO2 film on an Al matrix by
sol-gel method combined with dip-coating. The Al sheet was polished with 400#, 800#, and 1500#
sandpaper in order, to remove oxide from the surface and polish smooth. Then it was rinsed with
deionized water, dry, and reserve. The sample was immersed in 5 wt.% Na2CO3 solution and ultrasonic-
cleaned for 20~30 min to remove oil stains. Then it was placed in 10% oxalic acid solution and heated
in a water bath at 90 ℃ for 2~3 h for acid etching. The pretreated Al sheet was rinsed with deionized
water and stored in a 1% oxalic acid solution.

Int. J. Electrochem. Sci., 16 (2021) Article Number: 211111
4
A tetrabutyl titanate solution was prepared by dissolving 34 mL tetrabutyl titanate and 23 mL
acetic acid in 100 mL anhydrous ethanol under constant stirring for 30 min. A homogeneous tin source
solution was obtained by dissolving 22 mL stannic chloride aqueous solution (0.1 mol/L) in 50 mL
ethanol. The tin source solution was slowly added into the tetrabutyl titanate solution. The mixed solution
was heated at 60 ℃ in a water bath for 30 min to finally achieve a light-yellow transparent colloid with
4 wt% tin. The gel was evenly coated on the treated Al matrix three time by dip-coating [39, 40]. After
natural drying, it was calcined at 500 ℃ for 1 h in a muffle furnace and then cooled naturally.
2.3 Instrumental characterization and electrochemical measurement
A field emission scanning electron microscope (FE-SEM, SSX- 550, Shimazu Co., Japan)
was used to observe the morphological information of the electrode surface. The crystal structure of the
electrode surface coating was measured with the X-ray diffractometer (XRD, Empyrean, PANalytical
Co., Netherlands) using Cu target. The scanning range was 20°~80° under Ni filter tube voltage 45 kV
and tube current 100 mA. The test results were processed by MDI Jade 6.0 analysis software. A double
beam ultraviolet-visible spectrophotometer (UV-vis, TU-1901, Beijing Puxi General Instrument Co.,
Ltd., China) was used to analyze the solution absorbance. The absorbances of methylene blue and
rhodamine B were analyzed by UV-vis at 664 and 230 nm wavelengths, respectively. The degradation
rate (η, %) and activation energy (Ea, kJ/mol) of the detected solution were calculated by the following
Equation 1 and the Arrhenius formula (Equation 2), respectively.
η (%)=A0-At
A0
(1)
lnk=-Ea
RT+lnA (2)
Herein, A0 and At are the absorbance of the initial standard organic solution and the degraded
organic solution at a degradation time t [37, 41]. Moreover, k is the reaction rate constant, T stands for
the absolute temperature (K), R is the molar gas constant (8.314 J/mol·K), and A represents the pre-
exponential factor.
Chronocoulometry was applied to measure the anodic oxidation current of the standard organic
solution in the three-electrode system on an electrochemical workstation (CS350, Wuhan Kester
Instrument Co., Ltd., China). The prepared Al/SnO2-TiO2 film electrode, a porous graphite electrode,
and a standard calomel electrode (SCE) were employed as the working electrode, the auxiliary electrode
and the reference electrode, respectively. A 0.1 mol/L sodium sulfate solution was used as a supporting
electrolyte. The standard solutions for detection were a series of organic solutions with known COD
concentrations, prepared by dissolving quantitative target organic matters (such as rhodamine B, phenol,
and aniline) into the supporting electrolyte [42].
The same three-electrode system was employed for electrocatalytic degradation, electrolysis
kinetics and COD determination by Al/SnO2-TiO2 film electrode. For studying on kinetic mechanism of
electrolysis, the target organic solutions of methylene blue and rhodamine B were of 50 mg/L COD
concentration. For COD determination experiments, the COD value of the target organic solution ranged
from 20 mg/L to 100 mg/L. The relationship of COD vs. ΔI, the current was detected in the three-

Int. J. Electrochem. Sci., 16 (2021) Article Number: 211111
5
electrode system under different voltages (1.5 V, 2.0 V, 2.5 V, 3.0 V, and 3.5 V) for single-, two-, and
three-component solutions. The single-component solutions included phenol (PhOH), propanedioic acid
(PDA), sodium acetate (NaAc), potassium hydrogen phthalate (KHP), methylene blue (MB), methyl
orange (MO), and glucose (GLc). The two-component solutions in the COD ratio of 1:1 included
aniline/rhodamine B (An/RhB), potassium hydrogen phthalate, phenol (KHP/PhOH), sodium acetate,
glucose (NaAc/GLc), and methylene blue/methyl orange (MB/MO). The three-component solutions in
the COD ratio of 1:1:1 included aniline/sodium acetate/glucose (An/NaAc/GLc), potassium hydrogen
phthalate/rhodamine B/methyl orange (KHP/RhB/MO), and methylene blue/phenol/acetic acid
(MB/PhOH/HAc).
3. RESULTS AND DISCUSSION
3.1 Morphology characterization
Figure 1 shows the SEM diagram of the Al-based SnO2-TiO2 electrode prepared by dip-coating
with three layers. There are many bulges and grooves on the surface, which is conducive to increasing
the specific surface area of the electrode surface. The electrode can provide lots of active sites, thereby
enhancing the adsorption capacity of organic molecules and naturally forming Schottky-type contacts
[43]. The high surface area of the prepared Al/SnO2-TiO2 electrode lays a foundation for the catalytic
performance of the electrode [44].
Figure 1. SEM image of the Al/SnO2-TiO2 film electrode
3.2 Composition analysis
In order to further study the material of the composite electrode prepared by the sol-gel method
combined with dip-coating, the electrode was characterized by XRD. Figure 2 shows the XRD pattern
of the Al-based SnO2-TiO2 electrode. The diffraction peaks of Al, rutile TiO2, anatase TiO2, and SnO2
were displayed, according to the PDF card No. 04-0787 of Al, No. 73-1765 of the rutile phase TiO2, No.
21-1272 of the anatase phase, and No. 41-1445 of the cassiterite phase SnO2 [45, 46]. The strong peak
at 2θ=44.09° exhibited that the crystal type of TiO2 film electrode sintered at 500℃ mainly exists in
10μm

Int. J. Electrochem. Sci., 16 (2021) Article Number: 211111
6
rutile type. It was ascribed that after calcining about 330~650 ℃, rutile phase and anatase phase coexist
in crystal of TiO2. Generally, after calcining at 500~700 ℃, the rutile TiO2 was achieved with the highest
catalytic activity compared with the amorphous and anatase TiO2 [44, 47, 48]. In addition, the presence
of Al was due to the hollow holes in the oxide layer, through which the X-ray could contact the Al matrix,
reflecting its crystal characteristics. Therefore, the XRD pattern indicated that the composition of the
oxide layer of the composite film electrode was mainly rutile TiO2 and cassiterite SnO2.
20 40 60 80
0
200
400
600
800
1000
1
2
1
Inte
nsi
ty
2θ (degree)
1.Rutile,syn.TiO2
2.Al
3.Anatase,syn.TiO2
4.SnO2
4
3
Figure 2. XRD pattern of the Al/SnO2-TiO2 film electrode
3.3 Chronocoulometry study
The work current was determined by chronocoulometry. The chronocoulometric curves in Figure 3
were determined in KHP solutions with different concentrations of 0~500 mg/L containing 0.1 mol/L
Na2SO4. Figure 3 shows the charge in Coulombs as a function of time. The slopes were the values of the
currents. The net current (ΔI) was the difference between the work current of the sample and that of the
blank. The higher the concentration of the solution applied, the higher the net current measured.
Figure 3. Chronocoulometric curves of KHP solutions with different concentrations
0 5 10 15 20 25 30
-2.5
-2.0
-1.5
-1.0
-0.5
0.0
Q (
10
-4C
)
T (s)
0.1 mol/L Na2SO
4
20 mg/L COD
40 mg/L COD
60 mg/L COD
80 mg/L COD
100 mg/L COD
Int. J. Electrochem. Sci., 16 (2021) Article Number: 211111
7
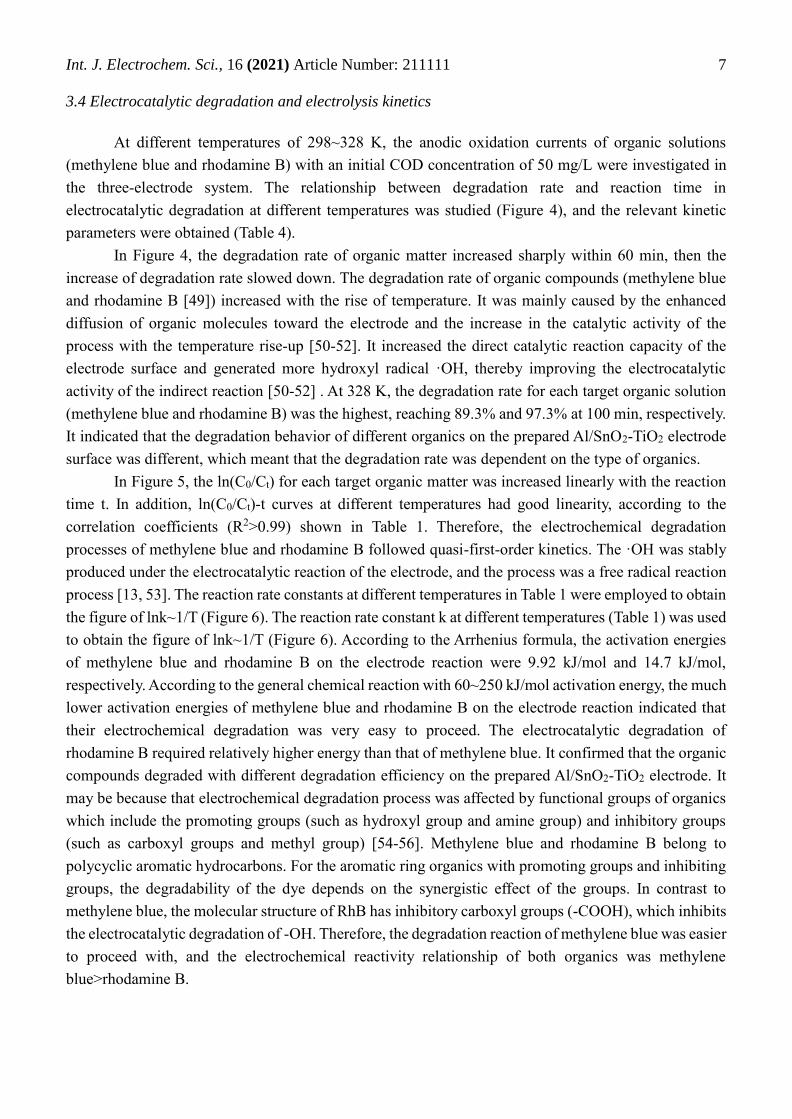
3.4 Electrocatalytic degradation and electrolysis kinetics
At different temperatures of 298~328 K, the anodic oxidation currents of organic solutions
(methylene blue and rhodamine B) with an initial COD concentration of 50 mg/L were investigated in
the three-electrode system. The relationship between degradation rate and reaction time in
electrocatalytic degradation at different temperatures was studied (Figure 4), and the relevant kinetic
parameters were obtained (Table 4).
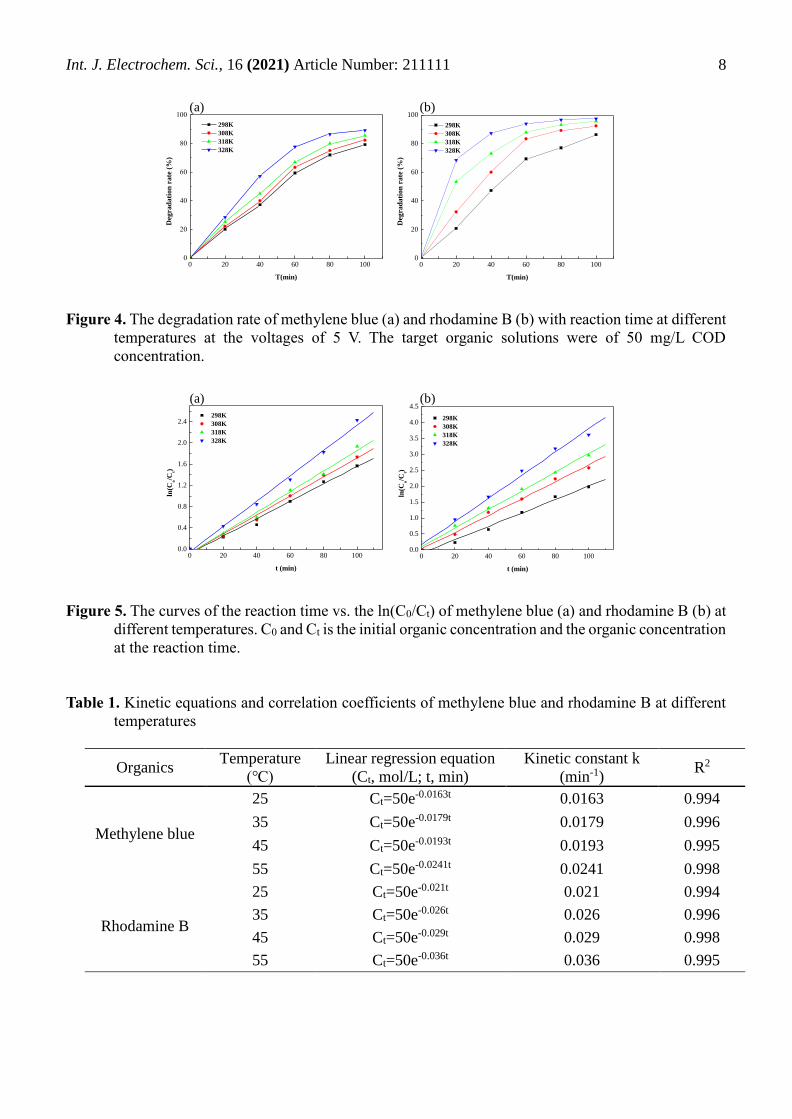
In Figure 4, the degradation rate of organic matter increased sharply within 60 min, then the
increase of degradation rate slowed down. The degradation rate of organic compounds (methylene blue
and rhodamine B [49]) increased with the rise of temperature. It was mainly caused by the enhanced
diffusion of organic molecules toward the electrode and the increase in the catalytic activity of the
process with the temperature rise-up [50-52]. It increased the direct catalytic reaction capacity of the
electrode surface and generated more hydroxyl radical ·OH, thereby improving the electrocatalytic
activity of the indirect reaction [50-52] . At 328 K, the degradation rate for each target organic solution
(methylene blue and rhodamine B) was the highest, reaching 89.3% and 97.3% at 100 min, respectively.
It indicated that the degradation behavior of different organics on the prepared Al/SnO2-TiO2 electrode
surface was different, which meant that the degradation rate was dependent on the type of organics.
In Figure 5, the ln(C0/Ct) for each target organic matter was increased linearly with the reaction
time t. In addition, ln(C0/Ct)-t curves at different temperatures had good linearity, according to the
correlation coefficients (R2>0.99) shown in Table 1. Therefore, the electrochemical degradation
processes of methylene blue and rhodamine B followed quasi-first-order kinetics. The ·OH was stably
produced under the electrocatalytic reaction of the electrode, and the process was a free radical reaction
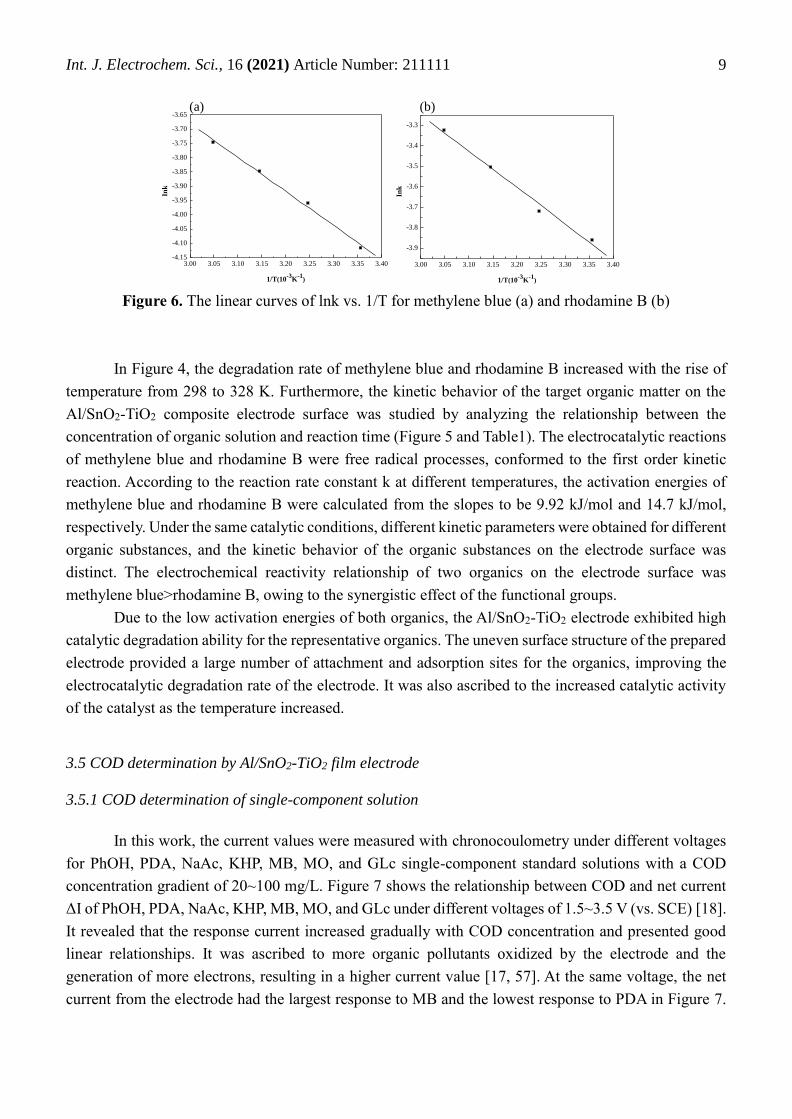
process [13, 53]. The reaction rate constants at different temperatures in Table 1 were employed to obtain
the figure of lnk~1/T (Figure 6). The reaction rate constant k at different temperatures (Table 1) was used
to obtain the figure of lnk~1/T (Figure 6). According to the Arrhenius formula, the activation energies
of methylene blue and rhodamine B on the electrode reaction were 9.92 kJ/mol and 14.7 kJ/mol,
respectively. According to the general chemical reaction with 60~250 kJ/mol activation energy, the much
lower activation energies of methylene blue and rhodamine B on the electrode reaction indicated that
their electrochemical degradation was very easy to proceed. The electrocatalytic degradation of
rhodamine B required relatively higher energy than that of methylene blue. It confirmed that the organic
compounds degraded with different degradation efficiency on the prepared Al/SnO2-TiO2 electrode. It
may be because that electrochemical degradation process was affected by functional groups of organics
which include the promoting groups (such as hydroxyl group and amine group) and inhibitory groups
(such as carboxyl groups and methyl group) [54-56]. Methylene blue and rhodamine B belong to
polycyclic aromatic hydrocarbons. For the aromatic ring organics with promoting groups and inhibiting
groups, the degradability of the dye depends on the synergistic effect of the groups. In contrast to
methylene blue, the molecular structure of RhB has inhibitory carboxyl groups (-COOH), which inhibits
the electrocatalytic degradation of -OH. Therefore, the degradation reaction of methylene blue was easier
to proceed with, and the electrochemical reactivity relationship of both organics was methylene
blue>rhodamine B.
Int. J. Electrochem. Sci., 16 (2021) Article Number: 211111
8
Figure 4. The degradation rate of methylene blue (a) and rhodamine B (b) with reaction time at different
temperatures at the voltages of 5 V. The target organic solutions were of 50 mg/L COD
concentration.
Figure 5. The curves of the reaction time vs. the ln(C0/Ct) of methylene blue (a) and rhodamine B (b) at
different temperatures. C0 and Ct is the initial organic concentration and the organic concentration
at the reaction time.
Table 1. Kinetic equations and correlation coefficients of methylene blue and rhodamine B at different
temperatures
Organics Temperature
(℃)
Linear regression equation
(Ct, mol/L; t, min)
Kinetic constant k
(min-1) R2
Methylene blue
25 Ct=50e-0.0163t 0.0163 0.994
35 Ct=50e-0.0179t 0.0179 0.996
45 Ct=50e-0.0193t 0.0193 0.995
55 Ct=50e-0.0241t 0.0241 0.998
Rhodamine B
25 Ct=50e-0.021t 0.021 0.994
35 Ct=50e-0.026t 0.026 0.996
45 Ct=50e-0.029t 0.029 0.998
55 Ct=50e-0.036t 0.036 0.995
0 20 40 60 80 1000
20
40
60
80
100
Deg
rad
ati
on
rate
(%
)
T(min)
298K
308K
318K
328K
0 20 40 60 80 1000
20
40
60
80
100
Deg
rad
ati
on
ra
te (
%)
T(min)
298K
308K
318K
328K
(a) (b)
0 20 40 60 80 1000.0
0.4
0.8
1.2
1.6
2.0
2.4
ln(C
o/C
t)
t (min)
298K
308K
318K
328K
0 20 40 60 80 1000.0
0.5
1.0
1.5
2.0
2.5
3.0
3.5
4.0
4.5
ln
(Co/C
t)
t (min)
298K
308K
318K
328K
(a) (b)
Int. J. Electrochem. Sci., 16 (2021) Article Number: 211111
9
Figure 6. The linear curves of lnk vs. 1/T for methylene blue (a) and rhodamine B (b)
In Figure 4, the degradation rate of methylene blue and rhodamine B increased with the rise of
temperature from 298 to 328 K. Furthermore, the kinetic behavior of the target organic matter on the
Al/SnO2-TiO2 composite electrode surface was studied by analyzing the relationship between the
concentration of organic solution and reaction time (Figure 5 and Table1). The electrocatalytic reactions
of methylene blue and rhodamine B were free radical processes, conformed to the first order kinetic
reaction. According to the reaction rate constant k at different temperatures, the activation energies of
methylene blue and rhodamine B were calculated from the slopes to be 9.92 kJ/mol and 14.7 kJ/mol,
respectively. Under the same catalytic conditions, different kinetic parameters were obtained for different
organic substances, and the kinetic behavior of the organic substances on the electrode surface was
distinct. The electrochemical reactivity relationship of two organics on the electrode surface was
methylene blue>rhodamine B, owing to the synergistic effect of the functional groups.
Due to the low activation energies of both organics, the Al/SnO2-TiO2 electrode exhibited high
catalytic degradation ability for the representative organics. The uneven surface structure of the prepared
electrode provided a large number of attachment and adsorption sites for the organics, improving the
electrocatalytic degradation rate of the electrode. It was also ascribed to the increased catalytic activity
of the catalyst as the temperature increased.
3.5 COD determination by Al/SnO2-TiO2 film electrode
3.5.1 COD determination of single-component solution
In this work, the current values were measured with chronocoulometry under different voltages
for PhOH, PDA, NaAc, KHP, MB, MO, and GLc single-component standard solutions with a COD
concentration gradient of 20~100 mg/L. Figure 7 shows the relationship between COD and net current
ΔI of PhOH, PDA, NaAc, KHP, MB, MO, and GLc under different voltages of 1.5~3.5 V (vs. SCE) [18].
It revealed that the response current increased gradually with COD concentration and presented good
linear relationships. It was ascribed to more organic pollutants oxidized by the electrode and the
generation of more electrons, resulting in a higher current value [17, 57]. At the same voltage, the net
current from the electrode had the largest response to MB and the lowest response to PDA in Figure 7.
3.00 3.05 3.10 3.15 3.20 3.25 3.30 3.35 3.40-4.15
-4.10
-4.05
-4.00
-3.95
-3.90
-3.85
-3.80
-3.75
-3.70
-3.65
Ink
1/T(10-3
K-1
)
3.00 3.05 3.10 3.15 3.20 3.25 3.30 3.35 3.40
-3.9
-3.8
-3.7
-3.6
-3.5
-3.4
-3.3
Ink
1/T(10-3
K-1
)
(a) (b)

Int. J. Electrochem. Sci., 16 (2021) Article Number: 211111
10
Thus, the linear COD vs. ΔI relationship of the different organic compounds was different under the
same conditions. As shown in Figure 7, the electrochemical reactivity relationship of the target organic
matters was PDA<NaAc<PhOH<GLc<MO<KHP<MB. Therefore, the net current was affected not only
by the COD concentration but also by the type of organic matter. In addition, the ranges of the net current
of MB in 100 min of electrolysis are 5.8~12.8 μA, 20.8~55.2 μA, 46.9~113.3 μA, 89.5~194.2 μA,
155.6~362.7 μA at the voltages of 1.5 V, 2.0 V, 2.5 V, 3.0 V, and 3.5 V, respectively. It indicated that with
the increase of voltage, the net current values of the target organic solutions increased correspondingly.
Figure 7. The linear curves of the net current (ΔI) vs. the COD concentration of the single-component
organic solutions at the voltages of 1.5 V (a, b), 2.0 V (c, d), 2.5 V (e, f), 3.0 V (g, h), and 3.5 V
(i, j), measured by the prepared Al/SnO2-TiO2 electrode. The PhOH, PDA, NaAc, KHP, MB, MO,
and GLc represent phenol, propanedioic acid, sodium acetate, potassium hydrogen phthalate,
methylene blue, methyl orange, and glucose, respectively.
20 40 60 80 100
6
12
18
24
30
36
42
20 40 60 80 100
40
80
120
160
200
240
280
320
360
△I(
10
-4A
)
COD(mg/L)
(a)
PhOH
CAC
NaAc
△I(
10
-4A
)
COD(mg/L)
(b)
KHP
MB
MO
GLc
20 40 60 80 1000
2
4
6
8
10
12
14
20 40 60 80 1000
2
4
6
8
10
12
14
△I(
10
-4A
)
COD(mg/L)
(a)
PhOH
CAC
NaAc
△I(
10
-4A
)
COD(mg/L)
(b)
KHP
MB
MO
GLc
20 40 60 80 100
2
4
6
8
10
12
14
16
20 40 60 80 100
10
20
30
40
50
60
△I(
10
-4A
)
COD(mg/L)
(a)
PhOH
CAC
NaAc
△I(
10
-4A
)
COD(mg/L)
(b)
KHP
MB
MO
GLc
20 40 60 80 100
4
8
12
16
20
20 40 60 80 100
20
40
60
80
100
120
△I(
10
-4A
)
COD(mg/L)
(a)
PhOH
CAC
NaAc
△I(
10
-4A
)
COD(mg/L)
(b)
KHP
MB
MO
GLc
20 40 60 80 100
4
8
12
16
20
24
28
20 40 60 80 10020
40
60
80
100
120
140
160
180
200
220
△I(
10
-4A
)
COD(mg/L)
(a)
PhOH
CAC
NaAc
△I(
10
-4A
)
COD(mg/L)
(b)
KHP
MB
MO
GLc
20 40 60 80 100
4
8
12
16
20
24
28
20 40 60 80 10020
40
60
80
100
120
140
160
180
200
220
△I(
10
-4A
)
COD(mg/L)
(a)
PhOH
CAC
NaAc
△I(
10
-4A
)
COD(mg/L)
(b)
KHP
MB
MO
GLc
(a) (b) (c) (d)
(e) (f) (g) (h)
(i) (j)
PD
A PD
A
PD
A PD
A
PD
A

Int. J. Electrochem. Sci., 16 (2021) Article Number: 211111
11
Table 2. Linear regression equations of the net current (ΔI) and the COD concentration for the target
organic solutions
Voltage
(V·vs. SCE) 1.5 2.0 2.5
Linear regression
equation
(ΔI, µA;
COD, mg/L)
R2
Linear regression
equation
(ΔI, µA;
COD, mg/L)
R2
Linear regression equation
(ΔI, µA;
COD, mg/L)
R2
PhOH ΔI=0.1010 COD+3.7706 0.998 ΔI=0.1049 COD+4.9563 0.988 ΔI=0.1177 COD+5.8384 0.974
PDA ΔI=0.0202 COD+0.4853 0.969 ΔI=0.0649 COD+0.5641 0.973 ΔI=0.0844 COD+1.9301 0.996
NaAc ΔI=0.0772 COD+2.5856 0.988 ΔI=0.0837 COD+4.9956 0.997 ΔI=0.1263 COD+7.6423 0.992
KHP ΔI=0.0645 COD+3.1497 0.996 ΔI=0.2309 COD+8.2145 0.998 ΔI=0.4603 COD+14.9617 0.995
MB ΔI=0.0885 COD+4.0875 0.994 ΔI=0.4281 COD+10.905 0.995 ΔI=0.8421 COD+28.0631 0.994
MO ΔI=0.0619 COD+0.4191 0.992 ΔI=0.1512 COD+6.4967 0.994 ΔI=0.2213 COD+10.4567 0.996
GLc ΔI=0.0274 COD+0.2554 0.994 ΔI=0.0529 COD+8.1001 0.991 ΔI=0.1188 COD+8.9911 0.981
Voltage
(V·vs. SCE) 3.0 3.5
Linear regression equation
(ΔI, µA; COD, mg/L) R2
Linear regression equation
(ΔI, µA; COD, mg/L) R2
PhOH ΔI =0.1336 COD+6.9763 0.997 ΔI=0.2148 COD+6.8624 0.992
PDA ΔI =0.1684 COD+1.5619 0.994 ΔI=0.1945 COD+3.2386 0.984
NaAc ΔI =0.1785 COD+9.2659 0.991 ΔI=0.2699 COD+11.9135 0.992
KHP ΔI =0.7987 COD+31.6747 0.996 ΔI=1.3338 COD+55.7747 0.991
MB ΔI =1.5623 COD+47.102 0.992 ΔI=2.6093 COD+94.942 0.995
MO ΔI =0.4113 COD+22.656 0.993 ΔI=0.6763 COD+23.957 0.989
GLc ΔI =0.2038 COD+18.491 0.991 ΔI=0.2738 COD+25.691 0.994
The PhOH, PDA, NaAc, KHP, MB, MO, and GLc represent phenol, propanedioic acid, sodium acetate,
potassium hydrogen phthalate, methylene blue, methyl orange, and glucose, respectively.
As the voltage increase, the electrocatalytic effect of the used Al/SnO2-TiO2 electrode was
significantly improved to degrade organic matter and produce electrons through the electrode reaction,
thereby affecting the current [1, 50, 58-61]. Moreover, Table 1 lists the linear regression equations of
COD and ΔI of the seven target organic solutions under different voltages. It demonstrated the regression
equation of each organic solution was different, and the high correlation coefficient R2 reflected the high
degree of correlation between the two variables of COD and ΔI.
3.5.2 COD determination of two-component solution
To further determine the relationship of COD vs. ΔI, the current was detected in the three-

Int. J. Electrochem. Sci., 16 (2021) Article Number: 211111
12
electrode system under different voltages for two-component solutions with a COD concentration
gradient of 20~100 mg/L. Two kinds of organic matters were mixed in a COD ratio of 1:1 to prepare the
two-component solutions of An/RhB, KHP/PhOH, NaAc/GLc, and MB/MO [62, 63].
Figure 8 shows the relationship between COD and △I for the two-component solutions at 1.5V,
2.0V, 2.5V, 3.0V, and 3.5V. The changing trend of each two-component solution was very stable and
consistent with that of single-component organic solutions. The net current value of each mixed solution
linearly increased with the increase of COD value in the range of 20~100 mg/L. The figure also shows
that the overall net current value increased with the voltage increase. The net current was different for
the different two-component organic solutions with the same COD concentration. Table 2 shows the
linear regression equations of COD and △I of the two-component mixed organic solutions under
different voltages. The regression equation of each organic solution was different and had a good linear
relationship (R2>0.98). Therefore, the results re-showed that the net current was affected by COD,
voltage, and the type of the organic pollutant. It was attributed that the molecular structure of the target
organic matter can affect the generation of electrons, thereby affecting the current [57, 64-66].
Figure 8. The linear curves of ΔI and COD of the two-component mixed solutions of An/RhB,
KHP/PhOH, NaAc/GLc, and MB/MO in the COD ratio of 1:1 at the voltages of 1.5 V (a), 2.0 V
(b), 2.5 V (c), 3.0 V (d), and 3.5 V (e). An, RhB, KHP, PhOH, NaAc, GLc, MB, and MO represent
aniline, rhodamine B, potassium hydrogen phthalate, phenol, sodium acetate, glucose, methylene
blue, and methyl orange, respectively.
Table 3. Linear regression equations of net current ΔI and COD value of the two-component solutions
of An/RhB, KHP/PhOH, NaAc/GLc, and MB/MO.
Voltage
(V·vs. SCE) 1.5 2.0 2.5
Linear regression
equation R2
Linear regression
equation R2
Linear regression equation
(ΔI, µA; R2
20 40 60 80 100
1
2
3
4
5
6
7
8
9
10
11
12
13
14
△I(
10
-4A
)
COD(mg/L)
(An、RhB)
(KHP、PhOH)
(NaAc、GLc)
(MB、MO)
20 40 60 80 1005
10
15
20
25
30
35
40
45
50
△I(
10
-4A
)
COD(mg/L)
An/RhB
KHP/PhOH
NaAc/GLc
MB/MO
20 40 60 80 10010
20
30
40
50
60
70
80
△I(
10
-4A
)
COD(mg/L)
An/RhB
KHP/PhOH
NaAc/GLc
MB/MO
20 40 60 80 100
15
30
45
60
75
90
105
120
△I(
10
-4A
)
COD(mg/L)
An/RhB
KHP/PhOH
NaAc/GLc
MB/MO
20 40 60 80 10020
40
60
80
100
120
140
160
180
△I(
10
-4A
)
COD(mg/L)
An/RhB
KHP/PhOH
NaAc/GLc
MB/MO
(a) (b) (c)
(d) (e)
20 40 60 80 1005
10
15
20
25
30
35
40
45
50
△I(
10
-4A
)
COD(mg/L)
An/RhB
KHP/PhOH
NaAc/GLc
MB/MO

Int. J. Electrochem. Sci., 16 (2021) Article Number: 211111
13
(ΔI, µA;
COD, mg/L)
(ΔI, µA;
COD, mg/L)
COD, mg/L)
An/RhB ΔI=0.0845 COD+0.3497 0.982 ΔI=0.2145 COD+7.5497 0.986 ΔI=0.3664 COD+12.772 0.989
KHP/PhOH ΔI=0.0125 COD+1.4875 0.991 ΔI=0.3534 COD+11.987 0.994 ΔI=0.5044 COD+26.912 0.994
NaAc/GLc ΔI=0.0639 COD+0.4391 0.992 ΔI=0.1169 COD+7.1191 0.989 ΔI=0.2668 COD+9.919 0.997
MB/MO ΔI=0.0274 COD+0.2554 0.994 ΔI=0.0624 COD+6.5554 0.994 ΔI=0.1174 COD+9.854 0.989
Voltage
(V·vs. SCE) 3.0 3.5
Linear regression equation
(ΔI, µA; COD, mg/L) R2
Linear regression equation
(ΔI, µA; COD, mg/L) R2
An/RhB ΔI=0.5464 COD+17.572 0.991 ΔI=0.7064 COD+41.1717 0.991
KHP/PhOH ΔI=0.8243 COD+33.912 0.996 ΔI=0.9544 COD+73.712 0.995
NaAc/GLc ΔI=0.3569 COD+16.519 0.989 ΔI=0.4769 COD+36.319 0.995
MB/MO ΔI=0.2024 COD+15.755 0.995 ΔI=0.3024 COD+32.965 0.990
An, RhB, KHP, PhOH, NaAc, GLc, MB, and MO represent aniline, rhodamine B, potassium hydrogen
phthalate, phenol, sodium acetate, glucose, methylene blue, and methyl orange, respectively.
3.5.3 COD determination of three-component solution
In this section, the Al/SnO2-TiO2 electrode was used to measure the COD of three-component
mixed solutions. The COD ratio of the measured organic matters was 1:1:1 in the three-component
solution. At the voltages of 1.5 V, 2.0 V, 2.5 V, 3.0 V, and 3.5 V (vs. SCE), the current variation values
of the three-component organic solutions in the COD range of 20~100 mg/L were measured by
chronocoulometry and shown in Figure 9. With the increase of COD value, △I value increased. The
current ranged from 1.1~1.8 μA to 91.1~236.1 μA at the operating voltages from 1.5 V to 3.5 V. The
current variation range was maximum at 3.5 V, which meant that the net current increased most rapidly
compared with the results at other voltages. It was attributed to the increase of the direct oxidation and
the generation of more hydroxyl radicals (·OH) which improved the efficiency of indirect oxidation and
increased the net current [1, 50, 58, 67, 68]. In addition, the figure shows that the net current value of
the An/NaAc/GLc solution was the highest, while that of the MB/PhOH/HAc solution was the lowest.
It also indicated that at the same COD concentration, the oxidation current values of the mixed solutions
with different types of organic substances on the Al/SnO2-TiO2 electrode were different. It further
demonstrated the different relationships of COD vs. △I and the different catalytic degradation
capabilities of the three-component mixed solutions, owing to the different functional groups. Table 4
lists the linear regression equations of COD vs. △I for the four three-component organic solutions under
different voltages. In Table 4, the regression equation of each organic solution was different and had a
linear relationship (R2>0.99). And the slope of the linear regression equation of the An/NaAc/GLc
solution was the largest, compared with the other two mixed organic solutions. Therefore, within the
COD range of 20~100 mg/L, the current increase rate of the An/NaAc/GLc solution was the largest due
to the significant improvement of the electrocatalytic reactivity.

Int. J. Electrochem. Sci., 16 (2021) Article Number: 211111
14
Figure 9. The linear curves of ΔI and COD of the three-component mixed solutions of An/NaAc/GLc,
KHP/RhB/MO, and MB/PhOH/HAc in the COD ratio of 1:1:1 at the voltages of 1.5 V (a), 2.0 V
(b), 2.5 V (c), 3.0 V (d), and 3.5 V (e). An, NaAc, GLc, KHP, RhB, MO, MB, PhOH, and HAc
represent aniline, sodium acetate, glucose, potassium hydrogen phthalate, rhodamine B, methyl
orange, methylene blue, phenol, and acetic acid, respectively.
Table 4. Linear regression equations of net current ΔI and COD value of the three-component mixed
solutions of An/NaAc/GLc, KHP/RhB/MO, and MB/PhOH/HAc.
Voltage
(V·vs. SCE) 1.5 2.0 2.5
Linear regression
equation
(ΔI, µA;
COD, mg/L)
R2
Linear regression
equation
(ΔI, µA;
COD, mg/L)
R2
Linear regression
equation
(ΔI, µA;
COD, mg/L)
R2
An/NaAc/GLc ΔI=0.0061 COD+1.2237 0.988 ΔI=0.2561 COD+5.4237 0.991 ΔI=0.4161 COD+8.6237 0.994
KHP/RhB/MO ΔI=0.0043 COD+1.1701 0.989 ΔI=0.1543 COD+2.4307 0.989 ΔI=0.3343 COD+5.4301 0.995
MB/PhOH/HAc ΔI=0.0029 COD+1.0749 0.992 ΔI=0.0779 COD+2.3749 0.994 ΔI=0.2029 COD+5.2749 0.995
Voltage
(V·vs. SCE) 3.0 3.5
Linear regression equation
(ΔI, µA; COD, mg/L) R2
Linear regression equation
(ΔI, µA; COD, mg/L) R2
An/NaAc/GLc ΔI=0.4261 COD+37.223 0.988 ΔI=1.5310 COD+89.124 0.994
KHP/RhB/MO ΔI=0.3343 COD+25.431 0.995 ΔI=0.9743 COD+84.231 0.993
MB/PhOH/HAc ΔI=0.2028 COD+25.274 0.991 ΔI=0.7729 COD+78.474 0.993
An, NaAc, GLc, KHP, RhB, MO, MB, PhOH, and HAc represent aniline, sodium acetate, glucose,
potassium hydrogen phthalate, rhodamine B, methyl orange, methylene blue, phenol, and acetic acid,
respectively.
20 40 60 80 1001.1
1.2
1.3
1.4
1.5
1.6
1.7
1.8
1.9
△I(
10
-4A
)
COD(mg/L)
An/NaAc/GLc
KHP/RhB/MO
MB/PhOH/HAc
20 40 60 80 100
5
10
15
20
25
30
35
△I(
10
-4A
)
COD(mg/L)
An/NaAc/GLc
KHP/RhB/MO
MB/PhOH/HAc
20 40 60 80 1005
10
15
20
25
30
35
40
45
50
△I(
10
-4A
)
COD(mg/L)
An/NaAc/GLc
KHP/RhB/MO
MB/PhOH/HAc
20 30 40 50 60 70 80 90 100 110
30
40
50
60
70
80
△I(
10
-4A
)
COD(mg/L)
An/NaAc/GLc
KHP/RhB/MO
MB/PhOH/HAc
20 40 60 80 100
90
120
150
180
210
240
△I(
10
-4A
)
COD(mg/L)
An/NaAc/GLc
KHP/RhB/MO
MB/PhOH/HAc
(a) (b) (c)
(d) (e)

Int. J. Electrochem. Sci., 16 (2021) Article Number: 211111
15
Thus, it re-confirmed the types of organics that affected the electrochemical process on the
prepared Al/SnO2-TiO2 electrode surface due to their molecular structure and electrochemical reactivity.
3.5.4. Correlation analysis of COD with standard potassium dichromate method
The applicability of the COD determination was analyzed by comparing the Al/SnO2-TiO2
electrode method with the standard potassium dichromate method. By simulating the wastewater with
potassium hydrogen phthalate, the COD concentration of the prepared solution ranged from 20 mg/L to
100 mg/L. As shown in Figure 10, there was a good correlation between the experimental COD value
and the standard COD value of the solution measured by the two methods. In the case of a valid test
range, the Pearson correlation coefficient [61] was used as a measure of the correlation strength between
the COD values obtained from the electrochemical (CODEC) method and the standard (CODCr) method
[69]. The linear equation obtained by fitting was y=0.445+1.0334x, r=0.994, indicating a high degree of
consistency between the two methods. The almost identical slope value indicated that both of the
methods could accurately measure the COD value. The applicability of the electrochemical method for
measuring COD was strongly supported by the high correlation and the identical slopes.
20 40 60 80 1000
20
40
60
80
100
120
CO
DE
C (
mg
/L)
CODCr (mg/L)
Standard Method
EC Method
Figure 10. The correlation between the Al/SnO2-TiO2 composite electrode electrochemical (CODEC)
method and the standard potassium dichromate (CODCr) method for COD measurement.
Table 5 shows the comparison of the recently developed electrodes containing TiO2 for COD
determination in previously reported literature and summarizes the electrode preparation method, target
organic substance, operation time, etc. In Table 5, it can be found that some research mentioned the
detection of the multi-component solution, but the study for the type of organic matter was limited [70,
71]. However, more extensive research is of great importance for an actual COD determination. This
work achieved a complete and comprehensive study on electrochemical determination of COD,
especially for the measurement of more single-component and multi-component solutions. The
preparation method of the Al/SnO2-TiO2 electrode is easy, fast, and beneficial to mass production without

Int. J. Electrochem. Sci., 16 (2021) Article Number: 211111
16
any complicated operations or expensive instruments, compared to the others in Table 5. The COD
determination using the prepared electrode in this work took a shorter operation time than other detection
listed in the table. Future research should include the development of electrode preparation, the study of
influence factors of electrocatalytic degradation of organic solutions on the electrode, etc., to in-deep
research and improve the electrochemical method for COD determination.
Table 5. Comparison of the electrodes containing TiO2 for COD determination in previously reported
literature
Detection
method Electrode
Preparation
method
Linearity
range
(mg/L)
Target organic substance Operation
time (s) Reference
PEC Ti/TiO2
photoelectrode Laser Anneal 50~2000 S: KHP >30 [4]
PEC using
flow injection
Ti/TiO2
photoelectrode Laser Anneal 5~1000 S: KHP >100 [72]
PEC Ti/TiO2/PbO2
photoelectrode
Dip-coating
combined with
laser anneal
20~2500 S: KHP >30 [73]
PEC Mixed-phase TiO2
electrode Dip-coating 0~200
S: KHP, GLc, GrA, SuA, PDA;
M: GLc/GtA - [70]
EC Ti/Sb–SnO2/PbO2
composite electrode
Electrochemical
deposition 0.5~200 S: GLc, Su, Np, HQ, p-HbA, Te >30 [16]
EC Ti/TiO2 electrode Anodic oxidation 20~2500 S: KHP 100 [2]
EC Ti/TiO2 nanotube
array electrode
Secondary anodic
oxidation 5~150
S: An, RhB, KHP;
M: An/KHP, An/RhB, RhB/KHP,
An/RhB/KHP
60 [71]
EC
Al/SnO2-TiO2
composite film
electrode
Sol-gel method
combined with
dip-coating
20~100
S: PhOH, PDA, NaAc, KHP, MB,
MO, GLc,
M: An/RhB, KHP/PhOH, NaAc/GLc,
MB/MO, An/NaAc/GLc,
KHP/RhB/MO, MB/PhOH/HAc
20 This work
PEC represents photoelectrocatalysis and EC represents electrochemical catalysis. S and M stand for
single- and multi-component organic solutions, respectively. In addition, KHP represents potassium
hydrogen phthalate, and the similar representative names include An – aniline, GLc – glucose, GrA –
glutaric acid, HQ – hydroquinone, MB – methylene blue, MO – methyl orange, NaAc – sodium acetate,
Np –nitrophenol, PDA – propanedioic acid, p-HbA – p-hydroxybenzoic acid, PhOH – phenol, RhB –
rhodamine B, Su – sucrose, SuA – succinic acid, Te – tetracycline.
In summary, in the COD range of 20~100 mg/L, the net current values of seven single-component,
four two-component, and three three-component organic solutions were measured by the three-electrode
chronocoulometry under different voltages. The linear regression equations between △I and COD were
obtained with high correlation coefficients R2. In the COD range of 20~100 mg/L, the COD value was
proportional to the anodic oxidation current △I. At the same COD concentration, the oxidation current
of the different organic solutions was different, which proved that the catalytic current was related to the
type of organic solution. In addition, the linear relationship between △I and COD was different for

Int. J. Electrochem. Sci., 16 (2021) Article Number: 211111
17
different kinds of organic solutions under the same conditions, indicating that the electrocatalytic kinetics
of organic substances on the Al/SnO2-TiO2 composite electrode surface was different [59]. As the voltage
increased, the catalytic current increased. It indicated that the increase in voltage promoted generating
more free radicals(·OH) and improved the catalytic efficiency [57, 64, 65]. In addition, the Al/SnO2-
TiO2 composite electrode test system had good reproducibility and stability through the relative standard
deviation analysis of the verification results through repeated experiments of simulated wastewater with
potassium hydrogen phthalate. The electrochemical method using the Al/SnO2-TiO2 composite electrode
was compared with the standard COD method (potassium dichromate method). The high correlation and
the identical slopes indicated a high degree of consistency between both measured COD values,
demonstrating that both approaches could accurately measure the same COD value[60].
4. CONCLUSION
The Al/SnO2-TiO2 composite film electrode was successfully prepared with three SnO2-TiO2
layers doped 4 wt.% Sn by sol-gel method combined with dip-coating. Confirmed by SEM, the electrode
had a large specific surface area due to the uneven surface. The composition of the oxide layer of the
electrode surface mainly consisted of the rutile phase TiO2 and the cassiterite phase SnO2. The
electrocatalytic kinetics of the electrode reaction was studied for the different organic matter (methylene
blue and rhodamine B). The experimental results showed that the ln(C0/Ct)-T curve for each organic
solution had a good linearity, and the correlation coefficient was above 0.99. The electrocatalytic reaction
of organic compounds on the electrode surface fitted the first-order kinetics. According to the reaction
rate constant k at different temperatures, the activation energies of the organic solutions (methylene blue
and rhodamine B) were calculated to be 9.92 kJ/mol and 14.7 kJ/mol, respectively. It demonstrated the
different dynamic behavior of the organic substances on the electrode surface. For COD determination,
the net current value of the standard organic solution was measured under different voltages, among a
COD concentration gradient of 20~100 mg/L. The target organic solutions in this experiment included
seven single-component and seven multi-component organic solutions. The results obtaining from the
COD measurement of the single-component and multi-component organic solutions were consistent. In
the COD range of 20~100 mg/L, the anodic oxidation current was proportional to the COD value of the
organic solution. At the same COD concentration, the oxidation current of different organic substances
was different, reproving that the electrocatalytic kinetic behavior for organic substances on the electrode
surface was different. Thus, in the electrocatalytic oxidation determination of COD, the oxidation current
was affected by the working voltage, the COD concentration of organic matter, and the species of organic
matter. Therefore, this report offered a simple, fast, and environmental-friendly way of COD
determination by the Al/SnO2-TiO2 electrode method. The prepared composite electrode could also be
applied in electrochemical degradation of water pollutions for wastewater treatment and other
electrochemical processes such as an online monitor for wastewater containing organic pollutants.

Int. J. Electrochem. Sci., 16 (2021) Article Number: 211111
18
References
1. Q. Zheng, B. Zhou, J. Bai, L. Li, Z. Jin, J. Zhang, J. Li, Y. Liu, W. Cai and X. Zhu, Adv. Mater., 20
(2008) 1044.
2. Y. Ge, Y. Zhai, D. Niu, Y. Wang, C. Fernandez, T. Ramakrishnappa, X. Hu and L. Wang, Int. J.
Electrochem. Sci., 11 (2016) 9812.
3. C. R. Silva, C. D. C. Conceição, V. G. Bonifácio, O. F. Filho and M. F. S. Teixeira, J. Solid State
Electrochem., 13 (2009) 665.
4. J. Li, L. Zheng, L. Li, G. Shi, Y. Xian and L. Jin, Electroanaly., 18 (2006) 1014.
5. S. Lee and -. H. K. Ahn, Water Sci. Technol., 50 (2004) 57.
6. S. Dong, X. Chen, X. Zhang and G. Cui, Coord. Chem. Rev., 257 (2013) 1946.
7. Y. Moriya, T. Takata and K. Domen, Coord. Chem. Rev., 257 (2013) 1957.
8. M. A. Jirka and J. M. Carter, Anal. Chem., 47 (1975) 1397.
9. A. Cuesta, L. J. Todoli and A. Canals, Spectrochimica Acta Part B 51 (1996) 1791.
10. H. Wang, Q. Guan, J. Li and T. Wang, Catal. Today, 236 (2014) 121.
11. J. N. Louvet, B. Homeky, M. Casellas, M. N. Pons and C. Dagot, Chemosphere, 91 (2013) 648.
12. N. Matsché and K. Stumwöhrer, Water Sci. Technol., 33 (1996) 211.
13. J. Wang, C. Wu, K. Wu, Q. Cheng and Y. Zhou, Anal. Chim. Acta, 736 (2012) 55.
14. R. Bogdanowicz, J. Czupryniak, M. Gnyba, J. Ryl, T. Ossowski, M. Sobaszek, E. M. Siedlecka and
K. Darowicki, Sensor. and Actuat. B-Chem., 189 (2013) 30.
15. T. Kondo, Y. Tamura, M. Hoshino, T. Watanabe, T. Aikawa, M. Yuasa and Y. Einaga, Anal. Chem.,
86 (2014) 8066.
16. C. Ma, F. Tan, H. Zhao, S. Chen and X. Quan, Sensor. and Actuat. B-Chem., 155 (2011) 114.
17. Q. H. Nguyen, T. Watari, T. Yamaguchi, Y. Takimoto, K. Niihara, J. P. Wiff and T. Nakayama, Int.
J. Electrochem. Sci., 15 (2020) 39.
18. O. M. Pacheco-Álvarez, M. O. Rodríguez-Narváez, K. Wrobel, R. Navarro-Mendoza, L. J. Nava-
Montes de Oca and M. J. Peralta-Hernández, Int. J. Electrochem. Sci., 13 (2018) 11549.
19. Q. Chen, Int. J. Electrochem. Sci., (2018) 7301.
20. Q. H. Nguyen, Y. Kawamura, T. Watari, K. Niihara, T. Yamaguchi and T. Nakayama, Int. J.
Electrochem. Sci., 15 (2020) 493.
21. H. Zhu, Int. J. Electrochem. Sci., (2021) ArticleID:210526.
22. H. Yu, H. Wang, X. Quan, S. Chen and Y. Zhang, Electrochem. Commun., 9 (2007) 2280.
23. Y. Zhou, T. Jing, Q. Hao, Y. Zhou and S. Mei, Electrochim. Acta, 74 (2012) 165.
24. Q. Mu, Y. Li, Q. Zhang and H. Wang, Sensor. and Actuat. B-Chem., 155 (2011) 804.
25. A. Zhang, M. Zhou and Q. Zhou, Anal. Chim. Acta, 686 (2011) 133.
26. S. Li, F. Zheng, S. Cai, W. Liang and Y. Li, Sensors and Actuators B 188 (2013) 280.
27. C. Li and G. Song, Sensor. and Actuat. B-Chem., 137 (2009) 432.
28. Z. Zhang, Y. Yuan, Y. Fang, L. Liang, H. Ding and L. Jin, Talanta, 73 (2007) 523.
29. J. Li, L. Li, L. Zheng, Y. Xian and L. Jin, Talanta, 68 (2006) 765.
30. T. Carchi, B. Lapo, J. Alvarado, P. J. Espinoza-Montero, J. Llorca and L. Fernandez, Sensors, 19
(2019) 1.
31. S. Ai, M. Gao, Y. Yang, J. Li and L. Jin, Electroanaly., 16 (2004) 404.
32. H. Mo, Y. Tang, X. Wang, J. Liu, D. Kong, Y. Chen, P. Wan, H. Cheng, T. Sun, L. Zhang, M.
Zhang, S. Liu, Y. Sun, N. Wang, L. Xing, L. Wang, Y. Jiang, X. Xu, Y. Zhang and X. Meng,
Electrochim. Acta, 176 (2015) 1100.
33. N. Abdessamad, H. Akrout and L. Bousselmi, Environ. Technol., 36 (2015) 3201.
34. Z. Yi, Y. Zeng, H. Wu, X. Chen, Y. Fan, H. Yang, Y. Tang, Y. Yi, J. Wang and P. Wu, Results Phys.,
15 (2019) 102609.
35. H. Cheshideh and F. Nasirpouri, J. Electroanal. Chem., 797 (2017) 121.
36. S. Ramasundaram, M. G. Seid, W. Lee, C. U. Kim, E. J. Kim, S. W. Hong and K. J. Choi, J.

Int. J. Electrochem. Sci., 16 (2021) Article Number: 211111
19
Hazard. Mater., 340 (2017) 300.
37. S. Chen, L. Zhou, T. Yang, Q. He, P. Zhou, P. He, F. Dong, H. Zhang and B. Jia, Chemosphere, 261
(2020) 128201.
38. M. Song, H. Cao, Y. Zhu, Y. Wang, S. Zhao, C. Huang, C. Zhang and X. He, Chem. Phys. Lett., 747
(2020) 137355.
39. L.-C. Chen, F.-R. Tsai, S.-H. Fang and Y.-C. Ho, Electrochim. Acta, 54 (2009) 1304.
40. Z.-x. Fan, Y.-c. Sun and J.-l. Chen, Chinese Journal of Semiconductors, 22 (2001) 1382.
41. Y. Zhang, P. He, L. Zhou, F. Dong, D. Yang, H. Lei, L. Du, L. Jia and S. Zhou, Ecotoxicol. Environ.
Saf., 188 (2020) 109921.
42. S. Chen, J. Li, L. Liu, Q. He, L. Zhou, T. Yang, X. Wang, P. He, H. Zhang and B. Jia,
Chemosphere, 256 (2020) 127139.
43. Y. Liu, B. Zhou, J. Bai, J. Li, J. Zhang, Q. Zheng, X. Zhu and W. Cai, Appl. Catal. B-Environ., 89
(2009) 142.
44. M. Zhou, J. Yu, S. Liu, P. Zhai and L. Jiang, J. Hazard. Mater., 154 (2008) 1141.
45. R. Daghrir, P. Drogui, I. Ka and M. A. El Khakani, J. Hazard. Mater., 199-200 (2012) 15.
46. R. Daghrir, P. Drogui, A. Dimboukou-Mpira and M. A. El Khakani, Chemosphere, 93 (2013) 2756.
47. S. Millesi, R. Lo Nigro, M. Pedroni, A. Speghini and A. Gulino, J. Phys. Chem. B, 119 (2015)
23743.
48. C. A. Martínez-Huitle, M. A. Rodrigo, I. Sirés and O. Scialdone, Chem. Rev., 115 (2015) 13362.
49. Q. Dai, L. Jiang and X. Luo, Int. J. Electrochem. Sci., 12 (2017) 4265.
50. Z. Chen, G. Xie, Z. Pan, X. Zhou, W. Lai, L. Zheng and Y. Xu, J. Alloys Compd., 851 (2021)
156834.
51. S. Garcia-Segura, J. D. Ocon and M. N. Chong, Process Saf. Environ., 113 (2018) 48.
52. C. Shao, F. Zhang, X. Li, J. Zhang, Y. Jiang, H. Cheng and K. Zhu, J. Electroanal. Chem., 832
(2019) 436.
53. M. Zhou, Z. Wu and D. Wang, J. Environ. Sci. Health., Part A, 37 (2007) 1263.
54. R. Mei, C. Zhu, Q. Wei, L. Ma, W. Li, B. Zhou, Z. Deng, Z. Tong, G. Ouyang and C. Jiang, J.
Electrochem. Soc., 165 (2018) H324.
55. I. C. da Costa Soares, D. R. da Silva, J. H. O. do Nascimento, S. Garcia-Segura and C. A.
Martínez-Huitle, Environmental Science and Pollution Research, 24 (2017) 24167.
56. W. Chen, W. Li, F. Liu, D. Miao, L. Ma, X. Gao, Q. Wei, K. Zhou, Z. Yu and Y. Yu, Journal of
Environmental Chemical Engineering, 8 (2020) 104348.
57. T. Xu, J. Song, W. Lin, B. Fu, X. Guo, X. Huang, H. Wu and X. Zhang, Appl. Energ., 281 (2021)
115913.
58. P. Saha, H. Bruning, T. V. Wagner and H. H. M. Rijnaarts, Chemosphere, 259 (2020) 127491.
59. G. S. Yan and T. J. Hupp, The Journal of Physical Chemistry, 100 (1996) 6867.
60. C. Wang, J. Wu, P. Wang, Y. Ao, J. Hou and J. Qian, Sensor. and Actuat. B-Chem., 181 (2013) 1.
61. B. Qiu, Y. Zhou, Y. Ma, X. Yang, W. Sheng, M. Xing and J. Zhang, Scientific Reports, 5 (2015) 1.
62. H. Xu, A. Li and X. Cheng, Int. J. Electrochem. Sci., 6 (2011) 5114.
63. T. Zayas, M. Picazo, U. Morales, E. Torres and L. Salgado, Int. J. Electrochem. Sci., 10 (2015)
7840.
64. M. Chen, S. Pan, C. Zhang, C. Wang, W. Zhang, Z. Chen, X. Zhao and Y. Zhao, Chem. Eng. J., 399
(2020) 125756.
65. D. Yu, X. Zhu, Z. Xu, X. Zhong, Q. Gui, Y. Song, S. Zhang, X. Chen and D. Li, ACS Appl. Mater.
Inter., 6 (2014) 8001.
66. V. Vaiano, D. Sannino and O. Sacco, Chapter 9 - The use of nanocatalysts (and nanoparticles) for
water and wastewater treatment by means of advanced oxidation processes, in Nanotechnology in
the Beverage Industry, A. Amrane, et al., Editors. 2020, Elsevier. p. 241.
67. Z. Cao, D. Wen, H. Chen and J. Wang, Int. J. Electrochem. Sci., 11 (2016) 4018.
68. M. Jović, D. Stanković, D. Manojlović, I. Anđelković, A. Milić, B. Dojčinović and G. Roglić, Int.

Int. J. Electrochem. Sci., 16 (2021) Article Number: 211111
20
J. Electrochem. Sci., 8 (2013) 168
69. H. Zhang, Z. Xu, S. Wang and X. Fan, Int. J. Electrochem. Sci., 15 (2020) 12462.
70. S. Zhang, L. Li and H. Zhao, Environ. Sci. Technol., 43 (2009) 7810.
71. X. Li, L. Wang and L. Wang, Water Sci. Technol., (2021).
72. J. Li, L. Zheng, L. Li, G. Shi, Y. Xian and L. Jin, Meas. Sci. Technol., 18 (2007) 945.
73. J. Li, L. Zheng, L. Li, G. Shi, Y. Xian and L. Jin, Electroanalysis., 18 (2006) 2251
© 2021 The Authors. Published by ESG (www.electrochemsci.org). This article is an open access
article distributed under the terms and conditions of the Creative Commons Attribution license
(http://creativecommons.org/licenses/by/4.0/).
Copyright © 2022 FDOKUMEN