Low Cost Chemical Oxygen Demand Sensor Based on ...
22
Accepted Manuscript Original article Low Cost Chemical Oxygen Demand Sensor Based on Electrodeposited Nano- Copper Film Hamdy H. Hassan, Ibrahim H.A. Badr, H.T.M. Abdel-Fatah, Esmat M.S. Elfeky, Ali Mostafa PII: S1878-5352(15)00214-2 DOI: http://dx.doi.org/10.1016/j.arabjc.2015.07.001 Reference: ARABJC 1716 To appear in: Arabian Journal of Chemistry Received Date: 17 April 2015 Accepted Date: 1 July 2015 Please cite this article as: H.H. Hassan, I.H.A. Badr, H.T.M. Abdel-Fatah, E.M.S. Elfeky, A. Mostafa, Low Cost Chemical Oxygen Demand Sensor Based on Electrodeposited Nano-Copper Film, Arabian Journal of Chemistry (2015), doi: http://dx.doi.org/10.1016/j.arabjc.2015.07.001 This is a PDF file of an unedited manuscript that has been accepted for publication. As a service to our customers we are providing this early version of the manuscript. The manuscript will undergo copyediting, typesetting, and review of the resulting proof before it is published in its final form. Please note that during the production process errors may be discovered which could affect the content, and all legal disclaimers that apply to the journal pertain.
-
Upload
khangminh22 -
Category
Documents
-
view
5 -
download
0
Transcript of Low Cost Chemical Oxygen Demand Sensor Based on ...
Accepted Manuscript
Original article
Low Cost Chemical Oxygen Demand Sensor Based on Electrodeposited Nano-
Copper Film
Hamdy H. Hassan, Ibrahim H.A. Badr, H.T.M. Abdel-Fatah, Esmat M.S.
Elfeky, Ali Mostafa
PII: S1878-5352(15)00214-2
DOI: http://dx.doi.org/10.1016/j.arabjc.2015.07.001
Reference: ARABJC 1716
To appear in: Arabian Journal of Chemistry
Received Date: 17 April 2015
Accepted Date: 1 July 2015
Please cite this article as: H.H. Hassan, I.H.A. Badr, H.T.M. Abdel-Fatah, E.M.S. Elfeky, A. Mostafa, Low Cost
Chemical Oxygen Demand Sensor Based on Electrodeposited Nano-Copper Film, Arabian Journal of Chemistry
(2015), doi: http://dx.doi.org/10.1016/j.arabjc.2015.07.001
This is a PDF file of an unedited manuscript that has been accepted for publication. As a service to our customers
we are providing this early version of the manuscript. The manuscript will undergo copyediting, typesetting, and
review of the resulting proof before it is published in its final form. Please note that during the production process
errors may be discovered which could affect the content, and all legal disclaimers that apply to the journal pertain.
1
Low Cost Chemical Oxygen Demand Sensor Based on Electrodeposited Nano-Copper Film Hamdy H. Hassan1 a, Ibrahim H. A. Badra, b,, Abdel-Fatah, H. T Mc, Esmat M. S. Elfeky d
, Ali Mostafaa
a Chemistry Department, Faculty of Science, Ain-Shams University, Cairo, Egypt.
b Present address:
Taibah University, Faculty of Science, Department of Chemistry, Al Madenah Al Monwarah, KSA. c Central Chemical Laboratories, Egyptian Electricity Holding Company, Sabtia, Cairo, Egypt
d Holding Company for Water and Waste water (HCWW), Cairo, Egypt
Abstract
A commercially available copper electrical cable and pure Cu disk were used as substrates for the
electrodeposition of copper nanoparticles (nano-Cu). The surface morphology of the prepared nano-
Cu/Cu electrodes were investigated by scanning electron microscope (SEM), energy dispersive X-ray
spectrometer (EDX). The bare copper substrates and the nano-copper modified electrodes were utilized and optimized for electrochemical assay of chemical oxygen demand (COD) using glycine as a standard.
A comparison was made among the four electrodes (i.e., bare and nano-Cu coated copper cable and pure
copper disk) as potential COD sensors. The oxidation behavior of glycine was investigated on the surface of the prepared sensors using linear sweep voltammetry (LSV). The results indicate significant
enhancement of the electrochemical oxidation of glycine by the deposited nano-Cu. The effects of
different deposition parameters, such as Cu2+
concentration, deposition potential, deposition time, pH, and scan rate on the response of the prepared sensors were investigated. Under optimized conditions, the
optimal nano-Cu based COD sensor exhibited a linear range of 2 to 595 ppm, lower limit of detection
(LOD) as low as 1.07 ppm (S/N = 3). The developed method exhibited high tolerance level to Cl- ion
where 1.0 M Cl- exhibited minimal influence. The sensor was utilized for the detection of COD in
different real water samples. The results obtained were validated using the standard dichromate method.
Keywords: COD; LSV; electrochemical sensors; nano-Cu.
1 Corresponding Author: Ain Shams University, Faculty of Science, Department of Chemistry, Cairo,
Egypt. E-mail: [email protected]
Contents
1. Introduction…………………………………………….…………………………………....…2
2. Experimental…………………………………………………………………………………...3
2.1. Reagents………………………………………………………………………………... …3
2.2. Instruments………………………………………………………………………………....3
2.3. Electrochemical preparation of nano-Cu sensing film…………………………….……….3
2.4. Detection of COD using standard dichromate method……………...………….………….5
2.5. Determination of COD using the prepared COD ……………………………….…….…...5
3. Results and discussion…………………………………………………………………….…....6
3.1. Electrochemical behavior of copper electrode........................................................…...6
3.2. Optimization of the electrodeposition parameters of nano-Cu…………….………………7
3.3. Effect of varying scan rate………………………………………………………………...10
3.4. Amperometric detection of COD………………………………………………………….11 3.5. Stability and Reproducibility of the proposed electrochemical sensors…………….….…13
3.6. Selectivity towards inorganic interferences………………………………………….……14
3.7. Analysis of real samples and recovery study……………………………………….……..14
3.8. Comparison with different electrodes for COD determination……………………...…….15
4. Conclusion.....................................................................................................................17
5. Acknowledgement....................................................................................................…...17
6. References……………………….…………………………………..................................….17
2
1. Introduction
Assay of organic compounds in water is crucial for water quality assessment and pollution control
(American Public Health Association, 1998). COD is a critical marker to indicate the pollution level of
water (Association of Official Analytical Chemists, 1990). It is defined as the number of oxygen
equivalents consumed in the oxidation of organic compounds using strong oxidizing agents. The
traditional method estimates COD via the oxidative degradation of organic matter present in water or
waste water with strong oxidizing agents such as dichromate or permanganate (Moore and Walker,
1965; Lee et al., 2000; Korenaga and Ikatsu, 1982; Korenaga et al., 1993; Tian and Wu 1992).
Unfortunately, this method involves several disadvantages, such as, low sensitivity, low precision, a large
sample volume, and a high consumption of expensive (e.g. Ag2SO4), corrosive (concentrated H2SO4) and
toxic (e.g., HgSO4) chemicals. Moreover, the traditional method involves a time-consuming reflux
process (2–4 h), which makes it non-applicable for high through-put screening (Lee et al., 1999).
Great deals of efforts have been devoted to improve the traditional method for COD measurement by
utilizing ultraviolet spectroscopy (Kong and Wu 2009), fluorescence spectroscopy (Hur et al., 2010),
and chemiluminescence methods (Liu et al., 2008; Yao et al., 2009). Such methods are amenable to flow
injection techniques, which greatly improve analysis efficiency. However, digestion procedure with
corrosive solvent is unavoidable. Recently, simple, rapid, and sensitive photocatalytic (Zhu et al., 2006;
Li and Song, 2009) and photoelectrocatalytic (Zhang S.et al., 2009; Zhang J., et al., 2009) methods
have been proposed to determine COD, particularly illuminated TiO2 materials due to their strong
oxidation ability and green credentials. Nevertheless, photo generated electron hole pairs recombine
easily and the use of a UV light source increases the running cost for COD measurement (Yu et al.,
2009).
The ability to detect COD in a rapid, sensitive, operationally simple, and cost-effective manner will
impact human health and safety. Consequently, increasing attention has been paid to electrochemical
methods using different electrodes, because of their high sensitivity, short analysis time, low cost and
handling convenience. In many cases, however, the direct oxidation of organic species in aqueous
solution using simple metal or carbon electrodes is not possible, because the high electrical potentials
required for the oxidation of organic compounds usually results in the oxidation of water. Therefore, a
proper choice of a suitable electrode material for this purpose is very important. So far, a number of
novel electrode materials have been reported to oxidize organic compounds. For instance, the following
electrodes were reported for the electrochemical detection of COD: copper electrode modified with
copper nanoparticles (Yang et al., 2011); an activated copper electrode (Silva et al., 2009); a glassy
carbon electrode (GCE) coated with Ni nanoparticles (Jing et al., 2012; Cheng et al., 2011), (NiCu)
alloy (Zhou et al., 2012), or cobalt oxide film (Wang et al., 2012); boron-doped diamond electrode
(BDD) (Yu et al., 2007); Pt electrodes modified with PbO2 (Westbroek and Temmerman 2001; Ai et
al., 2004; Li et al., 2005) , or F-PbO2 (Li et al., 2005); Ti electrodes coated with nano-TiO2 (Li et al.,
2006; Li et al., 2007), Rh2O3 (Li et al., 2006), or TiO2/PbO2 (Li et al., 2006b); a graphite-polystyrene
composite electrode containing Ag2O/CuO (Orozco et al., 2008).
The performance characteristics of those electrochemical sensors were assessed using standard
reagents (e.g., glucose, glycine and potassium hydrogen phthalate) to evaluate COD values. Since the
electrochemical behavior of COD standards is strongly dependent on the substrate and electroactive film
3
deposited on the electrode surface, the study of alternate substrates that may lead to the development of an
improved COD sensor is a worthwhile venture.
Herein, we report the development of simple, inexpensive, and sensitive electrochemical sensors for
determination of COD using copper cable and pure copper disk substrates coated with nano-copper films
prepared using potentiostatic deposition and fast scan cyclic voltammetry (FSCV).
2. Experimental
2.1. Reagents
All chemicals were of analytical grade and used as received. CuSO4.5H2O, H2SO4, NaOH, K2Cr2O7,
Ag2SO4, HgSO4, and (NH4)2Fe (SO4)2 were purchased from the techno pharma chemicals (Spain).
Glycine was purchased from ADWIC laboratory chemicals (Egypt). The stock solution of glycine (75
mg/L) was prepared using doubly distilled water. Doubly distilled water was used in preparation of all
solutions.
2.2. Instruments
Electrochemical preparations and measurements were performed on a Potentiostat/Galvanostat (EG&G
Princeton Applied Research, Model 273A). A conventional three-electrode system was employed. The
working electrode was either a pure copper disk with a 1.5 mm diameter (1.77 mm2) or commercially
available/house-hold electrical Cu-cable with a diameter of 8 mm (50.24 mm2). The reference electrode
was Ag/AgCl/ (3.00 M KCl) and the counter electrode was a platinum cable. Scanning Electron
Microscopy was performed with (SEM; FEI INSPECT S50) and the chemical composition of the
modified electrode was determined using energy dispersive X-ray spectrometer (EDX; BRUKER).
2.3. Electrochemical preparation of nano-Cu sensing film
Prior to electrodeposition, Cu-cable and Cu-disk electrodes were polished with 60 mesh emery paper
and rinsed thoroughly in bi-distilled water. Then the copper sensing film was electrodeposited under
potentiostatic conditions at constant potential (deposition potential, DP) −1.0 V for certain time
(deposition time, Dt) 180s from 4mM CuSO4.5H2O/1mM H2SO4 bath for Cu-electrode and 240s from
8mM CuSO4.5H2O/1 mM H2SO4 bath for Cu-disk electrode.
In case of fast scan cyclic voltammetric preparation (FSCV), the potential scan window was between -
0.10 V to -1.30 V for 30 cycles at 100 mV/s for Cu-cable electrode. In case of Cu-disk electrode a
potential scan window was between potential range -0.80 V to -1.80 V at 100 mV/s and 20 cycles. The
resulting electrodes were rinsed with doubly distilled water to remove any adsorbed species before use.
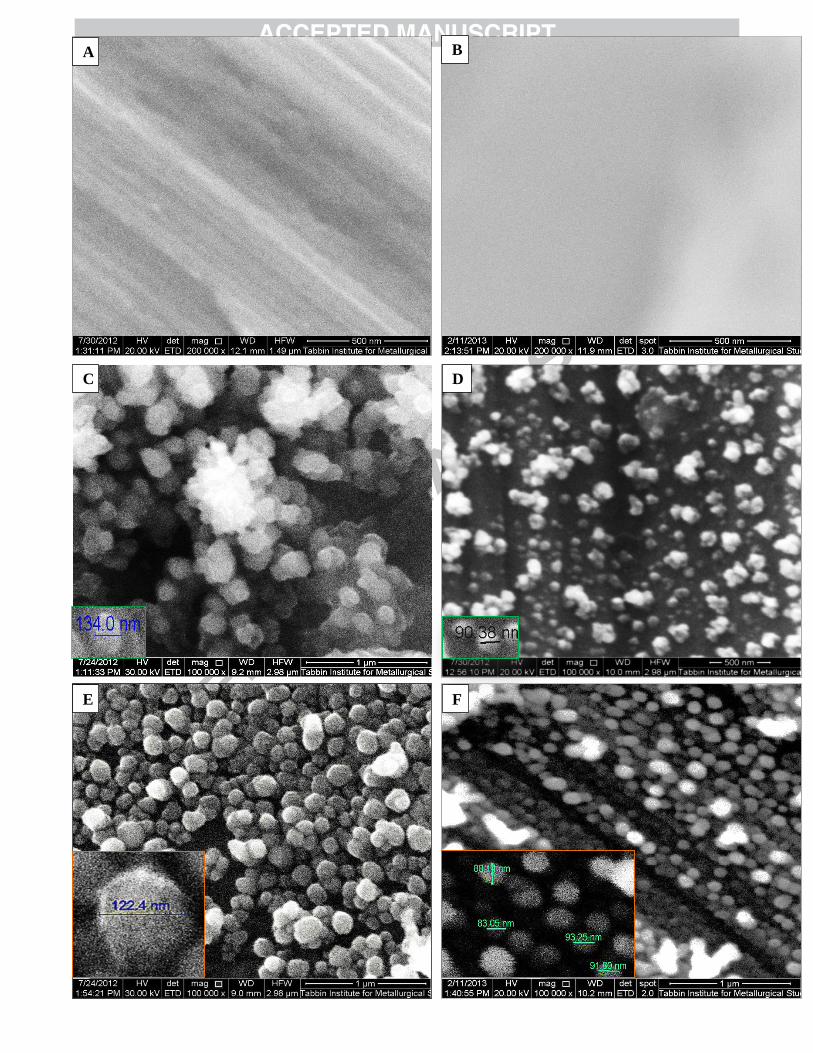
SEM was employed to investigate the morphology of bare and nano-Cu/Cu modified copper
electrodes. Fig. 1 Shows the SEM images of Cu-cable (A) and Cu-disk (B), nano-Cu/Cu-cable (C) and
nano-Cu/Cu-disk (D) prepared by potentiostatic conditions, as well as the nano-Cu/Cu-cable (E) & nano-
Cu/Cu-disk (F) prepared using the FSCV deposition. SEM images clearly indicated that copper electrodes
are coated with copper nano-particles with a diameter ranging from 40-125 nm.
4
B
C D
F E
A
A
A
5
Fig. 1 SEM images of Cu.cable and Cu.disk electrodes (A, B); nano-Cu/Cu-cable & nano-Cu/Cu-disk
prepared by potentiostatic deposition (C, D); nano-Cu/Cu-cable & nano-Cu/Cu-disk prepared by FSCV
(E, F), respectively. Inset: shows the diameter of Cu-particles.
The electrodeposited nano-Cu film prepared by FSCV appeared to be continuous and uniform over the
entire substrate surface without any noticeable cracks, which could ensure high electrochemical stability
of the prepared nano-copper based film.
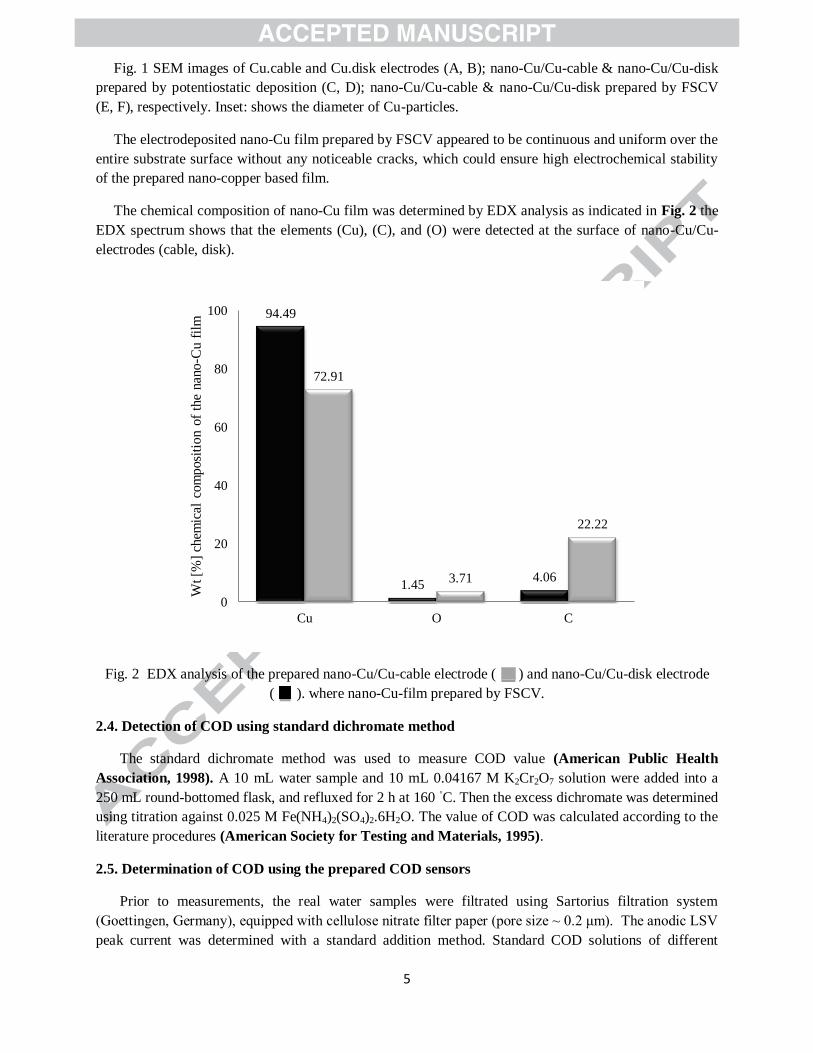
The chemical composition of nano-Cu film was determined by EDX analysis as indicated in Fig. 2 the
EDX spectrum shows that the elements (Cu), (C), and (O) were detected at the surface of nano-Cu/Cu-
electrodes (cable, disk).
Fig. 2 EDX analysis of the prepared nano-Cu/Cu-cable electrode ( ) and nano-Cu/Cu-disk electrode
( ). where nano-Cu-film prepared by FSCV.
2.4. Detection of COD using standard dichromate method
The standard dichromate method was used to measure COD value (American Public Health
Association, 1998). A 10 mL water sample and 10 mL 0.04167 M K2Cr2O7 solution were added into a
250 mL round-bottomed flask, and refluxed for 2 h at 160 ◦C. Then the excess dichromate was determined
using titration against 0.025 M Fe(NH4)2(SO4)2.6H2O. The value of COD was calculated according to the
literature procedures (American Society for Testing and Materials, 1995).
2.5. Determination of COD using the prepared COD sensors
Prior to measurements, the real water samples were filtrated using Sartorius filtration system
(Goettingen, Germany), equipped with cellulose nitrate filter paper (pore size ~ 0.2 μm). The anodic LSV
peak current was determined with a standard addition method. Standard COD solutions of different
94.49
1.45 4.06
72.91
3.71
22.22
0
20
40
60
80
100
Cu O C
Wt [%
] ch
emic
al c
om
posi
tion o
f th
e nan
o-C
u f
ilm
6
concentrations in the range 20 - 40 mg/L were added to a series of 100 mL flasks, each containing 5 mL
of filtered fresh water sample. Then the volume of each flask was made up to 100 mL using 0.075 M
NaOH. The testing solution was placed into an electrochemical cell for the determination of COD. All
experiments were carried out at ambient temperature.
3. Results and discussion
3.1. Electrochemical behavior of copper electrode
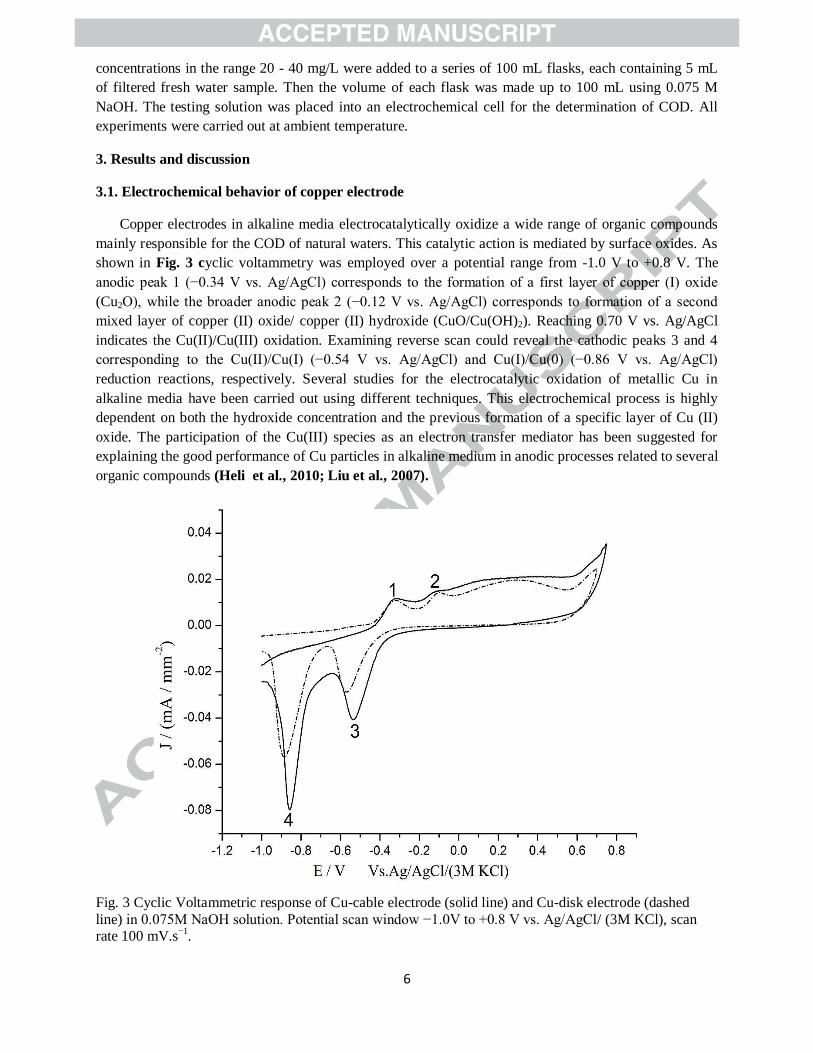
Copper electrodes in alkaline media electrocatalytically oxidize a wide range of organic compounds
mainly responsible for the COD of natural waters. This catalytic action is mediated by surface oxides. As
shown in Fig. 3 cyclic voltammetry was employed over a potential range from -1.0 V to +0.8 V. The
anodic peak 1 (−0.34 V vs. Ag/AgCl) corresponds to the formation of a first layer of copper (I) oxide
(Cu2O), while the broader anodic peak 2 (−0.12 V vs. Ag/AgCl) corresponds to formation of a second
mixed layer of copper (II) oxide/ copper (II) hydroxide (CuO/Cu(OH)2). Reaching 0.70 V vs. Ag/AgCl
indicates the Cu(II)/Cu(III) oxidation. Examining reverse scan could reveal the cathodic peaks 3 and 4
corresponding to the Cu(II)/Cu(I) (−0.54 V vs. Ag/AgCl) and Cu(I)/Cu(0) (−0.86 V vs. Ag/AgCl)
reduction reactions, respectively. Several studies for the electrocatalytic oxidation of metallic Cu in
alkaline media have been carried out using different techniques. This electrochemical process is highly
dependent on both the hydroxide concentration and the previous formation of a specific layer of Cu (II)
oxide. The participation of the Cu(III) species as an electron transfer mediator has been suggested for
explaining the good performance of Cu particles in alkaline medium in anodic processes related to several
organic compounds (Heli et al., 2010; Liu et al., 2007).
Fig. 3 Cyclic Voltammetric response of Cu-cable electrode (solid line) and Cu-disk electrode (dashed
line) in 0.075M NaOH solution. Potential scan window −1.0V to +0.8 V vs. Ag/AgCl/ (3M KCl), scan rate 100 mV.s
−1.
7
An alkaline medium is required to enhance the electro catalytic activity of several transition metals
(Liu et al., 2007; Burke et al., 1998; Zhao et al., 2011; Silva et al., 2005). Therefore, the effect of the
alkalinity on the electrocatalytic oxidation of glycine at nano-Cu/Cu-electrode was investigated. The
oxidation current of glycine gradually increases with increasing NaOH concentration from 0.055 to 0.10
M. This could be explained by the ease of oxidation of organic compounds at high pH values (Yu et al.,
2007, Zhao et al., 2007). Concomitantly, the over-potential for oxygen evolution would be lowered, and
oxygen evolution gradually turned into the main reaction. Therefore, at high NaOH concentrations (>0.1
M) a large background noise was obtained and lots of gas bubbles were observed on the surface of the
nano-Cu/Cu(cable, disk) modified electrode, causing difficulty in the measurement of low current signal.
These results are consistent with previous findings (Zhou et al., 2012; Wang et al., 2012; Yu et al.,
2007; Zhao et al., 2007). A concentration of 0.075-0.1 M NaOH were therefore chosen as the optimal
concentrations for the electrocatalytic oxidation at nano-Cu films.
Cu(III) is central in the electro catalytic oxidation of organic compounds in basic medium. The
expected electro catalytic oxidation of organic compounds (e.g., glycine) at the copper electrodes in basic
medium as follows (Zhou et al., 2012; Heli et al., 2010),
Cu + 2OH − → Cu(OH)2 + 2e
−
Cu(OH)2 + OH −
→ Cu(III)OOH. + H2O + e
−
Cu(III)OOH. + Organics(red) + H2O → Cu(OH)2 + Organics(oxid) + OH
−
3.2. Optimization of the electrodeposition parameters of nano-Cu film
The effect of different deposition variables on the sensitivity of nano-Cu/Cu electrodes towards
glycine was investigated. Controlled potential reduction of nano-Cu particles was achieved at -1.0 V from
acidic bath of CuSO4.5H2O/1 mM H2SO4 at specified reduction time of 180 s. The effect of such variables
on the responses of nano-Cu/Cu electrodes towards the oxidation of glycine was investigated by
measuring the oxidation peak, observed in LSV, of 75 mg/L glycine, prepared in 0.075M NaOH. Effect
of each variable was represented graphically by plotting the change in this variable versus the oxidation
peak to determine optimal conditions for the preparation of nano-Cu/Cu modified electrode. Fig. 4
showed the effect of bath composition on the catalytic activity of the prepared nano-sensors. As can be
seen in Fig. 4 maximum oxidation current was achieved by electrodeposition from 4mM CuSO4 bath
composition for Cu-cable and 8 mM CuSO4 for Cu-disk (Yang et al., 2011).

8
Fig. 4 Effect of bath composition on the oxidation current response of 75 mg/L glycine prepared in
0.075M NaOH in case of nano-Cu/Cu-cable ( ) and nano-Cu/Cu-disk ( )
The influence of deposition time on the electrocatalytic activity of nano-Cu film based sensors was
also studied. As shown in Fig. 5, the oxidation current of glycine increases remarkably when the
deposition time extends from 0 s to 180 s at Cu-cable electrode and from 0 to 240 s for Cu-disk electrode.
Longer deposition times than did not enhance the oxidation peak current. Therefore, the electrodeposition
was performed at controlled potential of -1.0 V for 180 s from 4 mM CuSO4/1 mM H2SO4 in case of Cu-
cable, while for Cu-disk the electrodeposition was performed for 240 s from 8 mM CuSO4/1 mM H2SO4.
Fig. 5 Influence of deposition time of Cu particles on the oxidation peak current of 75 mg/L glycine in
case of nano-Cu/Cu-cable ( ) and nano-Cu/Cu-disk ( ).
0
0.01
0.02
0.03
0.04
0 4 8 12 16 20 24 28
J /
(m
A.m
m-2
)
Cu2+ (mM)
0
0.005
0.01
0.015
0.02
0.025
-60 0 60 120 180 240 300 360
J / (
mA
.mm
-2)
Deposition time / s
9
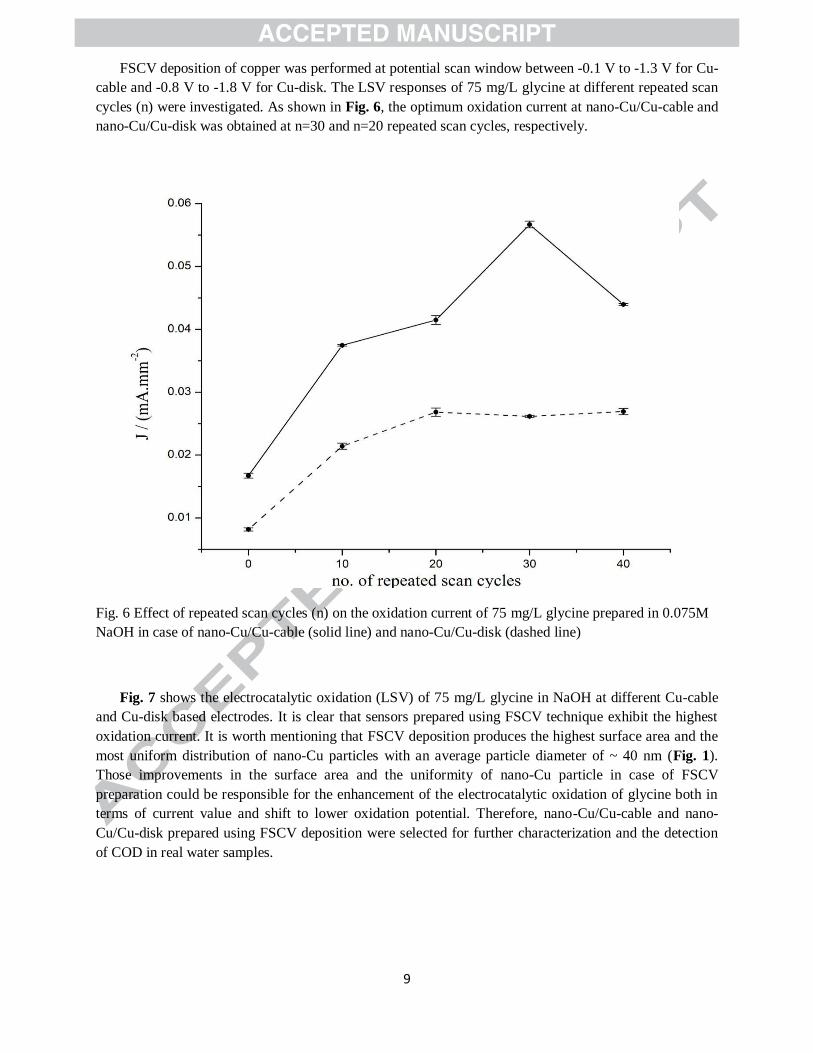
FSCV deposition of copper was performed at potential scan window between -0.1 V to -1.3 V for Cu-
cable and -0.8 V to -1.8 V for Cu-disk. The LSV responses of 75 mg/L glycine at different repeated scan
cycles (n) were investigated. As shown in Fig. 6, the optimum oxidation current at nano-Cu/Cu-cable and
nano-Cu/Cu-disk was obtained at n=30 and n=20 repeated scan cycles, respectively.
Fig. 6 Effect of repeated scan cycles (n) on the oxidation current of 75 mg/L glycine prepared in 0.075M
NaOH in case of nano-Cu/Cu-cable (solid line) and nano-Cu/Cu-disk (dashed line)
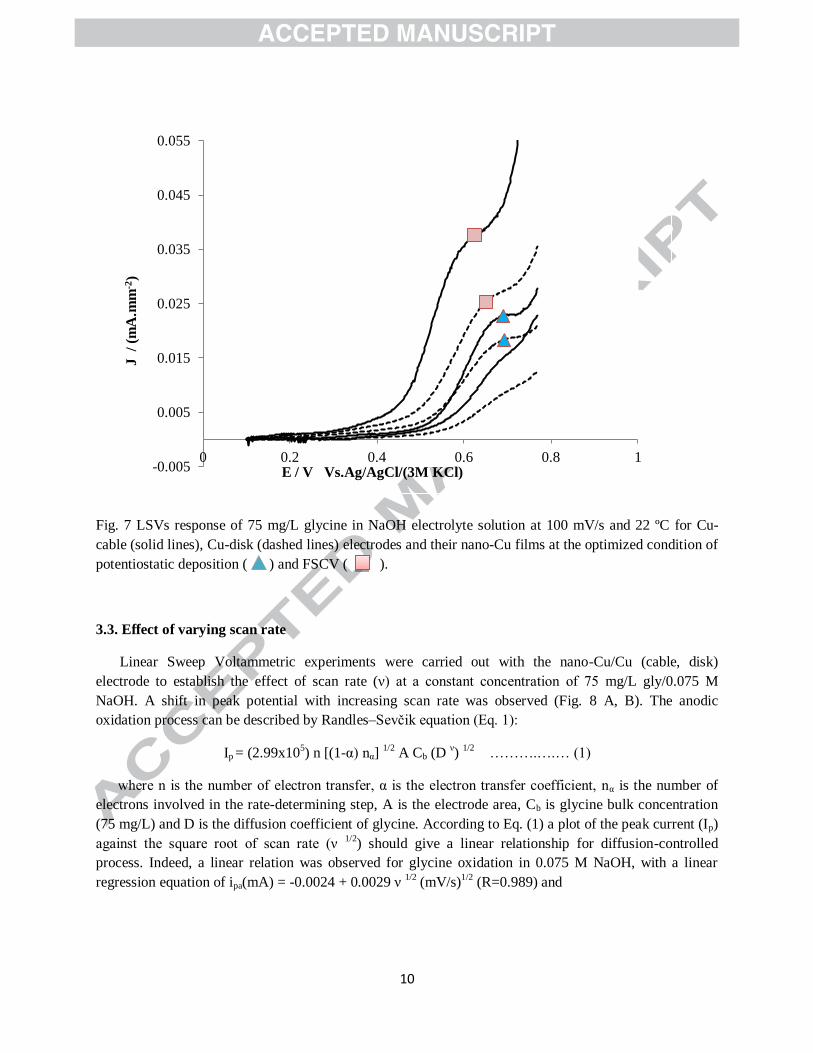
Fig. 7 shows the electrocatalytic oxidation (LSV) of 75 mg/L glycine in NaOH at different Cu-cable
and Cu-disk based electrodes. It is clear that sensors prepared using FSCV technique exhibit the highest
oxidation current. It is worth mentioning that FSCV deposition produces the highest surface area and the
most uniform distribution of nano-Cu particles with an average particle diameter of ~ 40 nm (Fig. 1).
Those improvements in the surface area and the uniformity of nano-Cu particle in case of FSCV
preparation could be responsible for the enhancement of the electrocatalytic oxidation of glycine both in
terms of current value and shift to lower oxidation potential. Therefore, nano-Cu/Cu-cable and nano-
Cu/Cu-disk prepared using FSCV deposition were selected for further characterization and the detection
of COD in real water samples.
10
-0.005
0.005
0.015
0.025
0.035
0.045
0.055
0 0.2 0.4 0.6 0.8 1
J /
(mA
.mm
-2)
E / V Vs.Ag/AgCl/(3M KCl)
Fig. 7 LSVs response of 75 mg/L glycine in NaOH electrolyte solution at 100 mV/s and 22 ºC for Cu-
cable (solid lines), Cu-disk (dashed lines) electrodes and their nano-Cu films at the optimized condition of
potentiostatic deposition ( ) and FSCV ( ).
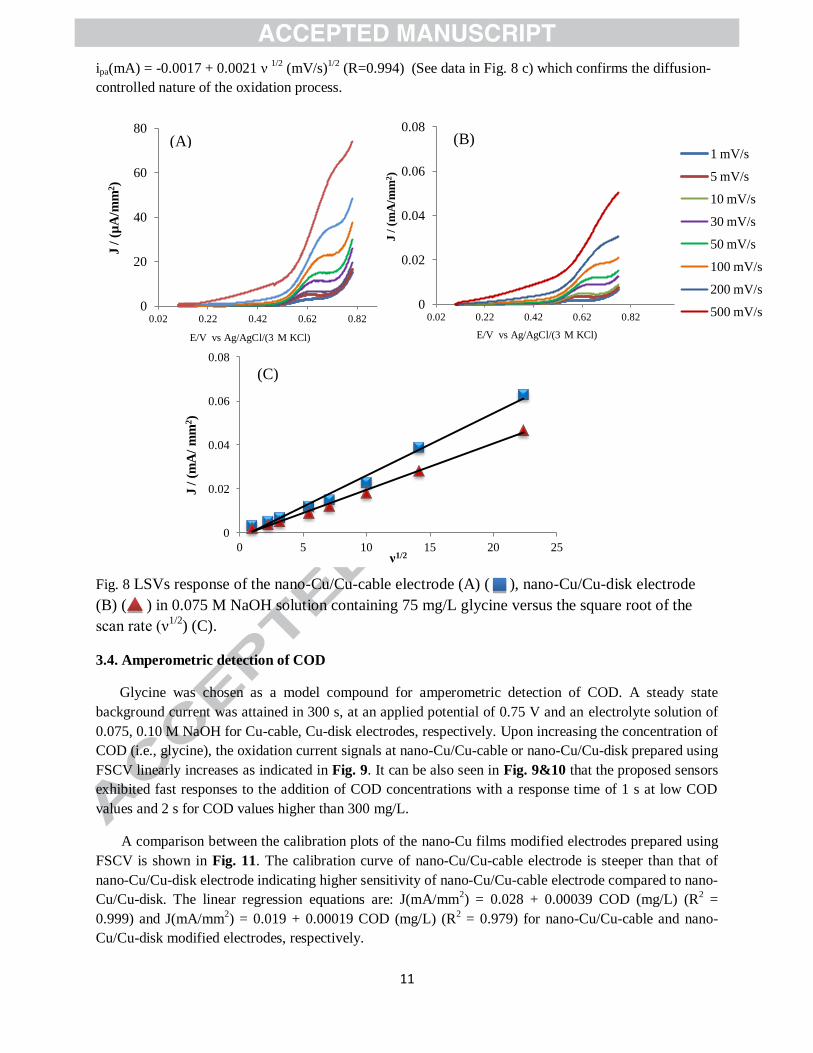
3.3. Effect of varying scan rate
Linear Sweep Voltammetric experiments were carried out with the nano-Cu/Cu (cable, disk)
electrode to establish the effect of scan rate (ν) at a constant concentration of 75 mg/L gly/0.075 M
NaOH. A shift in peak potential with increasing scan rate was observed (Fig. 8 A, B). The anodic
oxidation process can be described by Randles–Sevčik equation (Eq. 1):
Ip = (2.99x10⁵) n [(1-α) nα]
1/2 A Cb (D
ν)
1/2 ……….….… (1)
where n is the number of electron transfer, α is the electron transfer coefficient, nα is the number of
electrons involved in the rate-determining step, A is the electrode area, Cb is glycine bulk concentration
(75 mg/L) and D is the diffusion coefficient of glycine. According to Eq. (1) a plot of the peak current (Ip)
against the square root of scan rate (ν 1/2
) should give a linear relationship for diffusion-controlled
process. Indeed, a linear relation was observed for glycine oxidation in 0.075 M NaOH, with a linear
regression equation of ipa(mA) = -0.0024 + 0.0029 ν 1/2
(mV/s)1/2
(R=0.989) and
11
ipa(mA) = -0.0017 + 0.0021 ν 1/2
(mV/s)1/2
(R=0.994) (See data in Fig. 8 c) which confirms the diffusion-
controlled nature of the oxidation process.
Fig. 8 LSVs response of the nano-Cu/Cu-cable electrode (A) ( ), nano-Cu/Cu-disk electrode
(B) ( ) in 0.075 M NaOH solution containing 75 mg/L glycine versus the square root of the
scan rate (ν1/2
) (C).
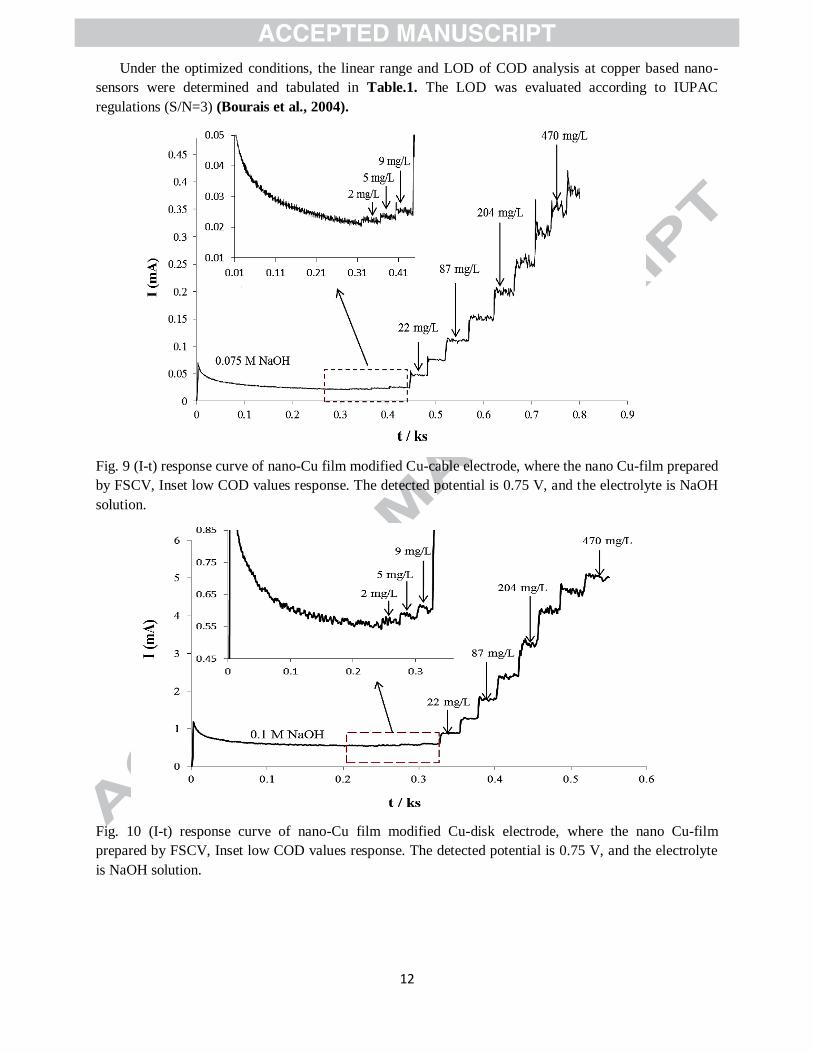
3.4. Amperometric detection of COD
Glycine was chosen as a model compound for amperometric detection of COD. A steady state
background current was attained in 300 s, at an applied potential of 0.75 V and an electrolyte solution of
0.075, 0.10 M NaOH for Cu-cable, Cu-disk electrodes, respectively. Upon increasing the concentration of
COD (i.e., glycine), the oxidation current signals at nano-Cu/Cu-cable or nano-Cu/Cu-disk prepared using
FSCV linearly increases as indicated in Fig. 9. It can be also seen in Fig. 9&10 that the proposed sensors
exhibited fast responses to the addition of COD concentrations with a response time of 1 s at low COD
values and 2 s for COD values higher than 300 mg/L.
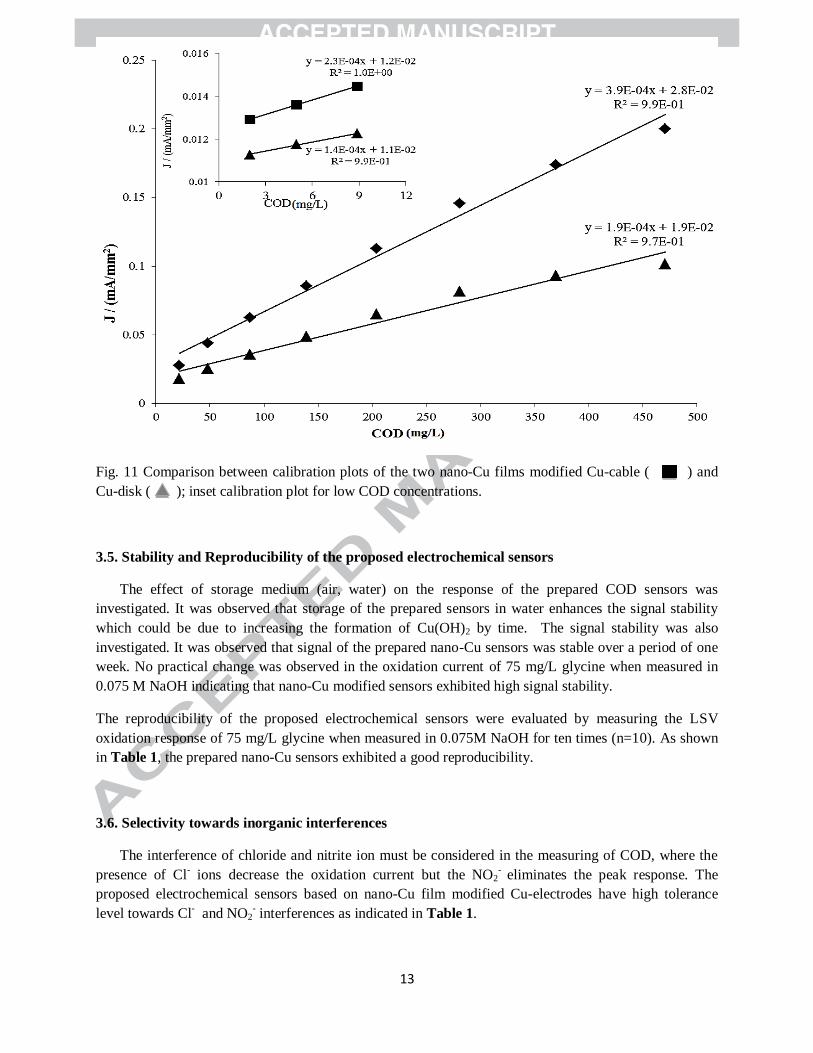
A comparison between the calibration plots of the nano-Cu films modified electrodes prepared using
FSCV is shown in Fig. 11. The calibration curve of nano-Cu/Cu-cable electrode is steeper than that of
nano-Cu/Cu-disk electrode indicating higher sensitivity of nano-Cu/Cu-cable electrode compared to nano-
Cu/Cu-disk. The linear regression equations are: J(mA/mm2) = 0.028 + 0.00039 COD (mg/L) (R
2 =
0.999) and J(mA/mm2) = 0.019 + 0.00019 COD (mg/L) (R
2 = 0.979) for nano-Cu/Cu-cable and nano-
Cu/Cu-disk modified electrodes, respectively.
0
20
40
60
80
0.02 0.22 0.42 0.62 0.82
J /
(µ
A/m
m2)
E/V vs Ag/AgCl/(3 M KCl)
1 mV/s
5 mV/s
10 mV/s
30 mV/s
50 mV/s
100 mV/s
200 mV/s
500 mV/s
(A)
0
0.02
0.04
0.06
0.08
0 5 10 15 20 25
J / (
mA
/ m
m2)
ν1/2
(C)
0
0.02
0.04
0.06
0.08
0.02 0.22 0.42 0.62 0.82
J / (
mA
/mm
2)
E/V vs Ag/AgCl/(3 M KCl)
1 mV/s
5 mV/s
10 mV/s
30 mV/s
50 mV/s
100 mV/s
200 mV/s
500 mV/s
(B)
12
Under the optimized conditions, the linear range and LOD of COD analysis at copper based nano-
sensors were determined and tabulated in Table.1. The LOD was evaluated according to IUPAC
regulations (S/N=3) (Bourais et al., 2004).
Fig. 9 (I-t) response curve of nano-Cu film modified Cu-cable electrode, where the nano Cu-film prepared
by FSCV, Inset low COD values response. The detected potential is 0.75 V, and the electrolyte is NaOH
solution.
Fig. 10 (I-t) response curve of nano-Cu film modified Cu-disk electrode, where the nano Cu-film
prepared by FSCV, Inset low COD values response. The detected potential is 0.75 V, and the electrolyte
is NaOH solution.
13
Fig. 11 Comparison between calibration plots of the two nano-Cu films modified Cu-cable ( ) and
Cu-disk ( ); inset calibration plot for low COD concentrations.
3.5. Stability and Reproducibility of the proposed electrochemical sensors
The effect of storage medium (air, water) on the response of the prepared COD sensors was
investigated. It was observed that storage of the prepared sensors in water enhances the signal stability
which could be due to increasing the formation of Cu(OH)2 by time. The signal stability was also
investigated. It was observed that signal of the prepared nano-Cu sensors was stable over a period of one
week. No practical change was observed in the oxidation current of 75 mg/L glycine when measured in
0.075 M NaOH indicating that nano-Cu modified sensors exhibited high signal stability.
The reproducibility of the proposed electrochemical sensors were evaluated by measuring the LSV
oxidation response of 75 mg/L glycine when measured in 0.075M NaOH for ten times (n=10). As shown
in Table 1, the prepared nano-Cu sensors exhibited a good reproducibility.
3.6. Selectivity towards inorganic interferences
The interference of chloride and nitrite ion must be considered in the measuring of COD, where the
presence of Cl- ions decrease the oxidation current but the NO2
- eliminates the peak response. The
proposed electrochemical sensors based on nano-Cu film modified Cu-electrodes have high tolerance
level towards Cl- and NO2
- interferences as indicated in Table 1.
y = 2.3E-04x + 1.2E-02
R² = 1.0E+00
y = 1.4E-04x + 1.1E-02
R² = 9.9E-01
J (
mA
/mm
2)
COD (ppm)

14
a potentiostatic deposition,
bFSCV deposition
3.7. Analysis of real samples and recovery study
The analysis of real water samples (e.g., drinking, lake, Nile River, waste water) was carried out
using the proposed method and the standard dichromate method for COD. Data obtained indicated good
agreement between the prepared COD sensors and the standard method with a low relative error (Table
2). A highly significant correlation (r = 0.997 & 0.9906, p < 0. 001, n = 5) was observed for the analysis
using nano-Cu/Cu-cable and nano-Cu /Cu-disk sensors. Moreover, the results confirmed that the prepared
sensors exhibited good recovery between (99 – 111%) as indicated in Table 2 which could provide a
promising tool for determination of COD in water quality control and pollution evaluation.
Table 1 Comparison between electroanalytical features of nano-Cu/Cu-cable and nano-Cu/Cu-disk
sensors.
Nano-Cu sensor Cu-cable sensors Cu-disk sensors
Electroanalytical feature
Nano-Cu/Cu-cable a
Nano-Cu /Cu-cable b Nano-Cu/Cu-disk
a Nano-Cu/Cu.disk
b
Limit of Detection
(LOD) (mg/L) 2.4 2.6 1.5 1.2
Linear range (mg/L) 2-595 2-595 2-369.9 2-280.9
Sensitivity (J, mg/L) 3.0E-04 4.1E-04 1.6E-04 2.0E-04
Reproducibility
(RSD %) 2.4 1.1 1.6 1.3
Tolerance level
towards inorganic
interference
1.0 M Cl-
0.01 M NO2-
0.8 M Cl-
0.01 M NO2-
15
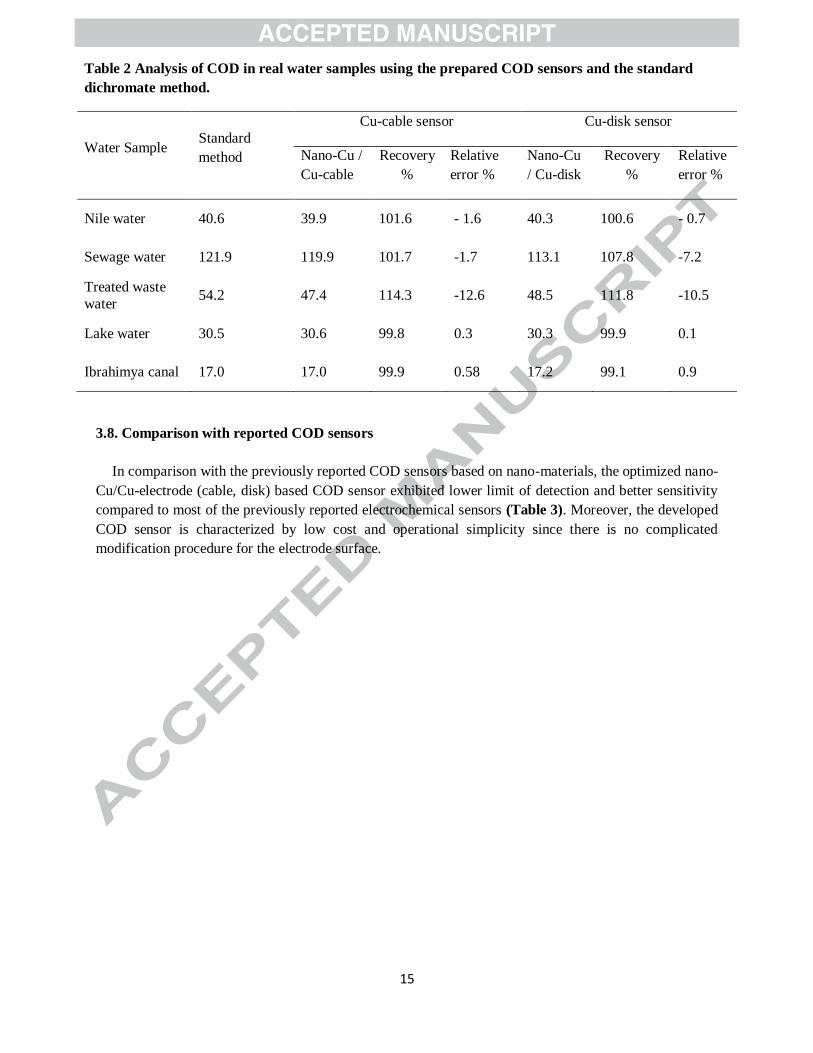
Table 2 Analysis of COD in real water samples using the prepared COD sensors and the standard
dichromate method.
Water Sample Standard
method
Cu-cable sensor Cu-disk sensor
Nano-Cu /
Cu-cable
Recovery
%
Relative
error %
Nano-Cu
/ Cu-disk
Recovery
%
Relative
error %
Nile water 40.6 39.9 101.6 - 1.6 40.3 100.6 - 0.7
Sewage water 121.9 119.9 101.7 -1.7 113.1 107.8 -7.2
Treated waste
water 54.2 47.4 114.3 -12.6 48.5 111.8 -10.5
Lake water 30.5 30.6 99.8 0.3 30.3 99.9 0.1
Ibrahimya canal 17.0 17.0 99.9 0.58 17.2 99.1 0.9
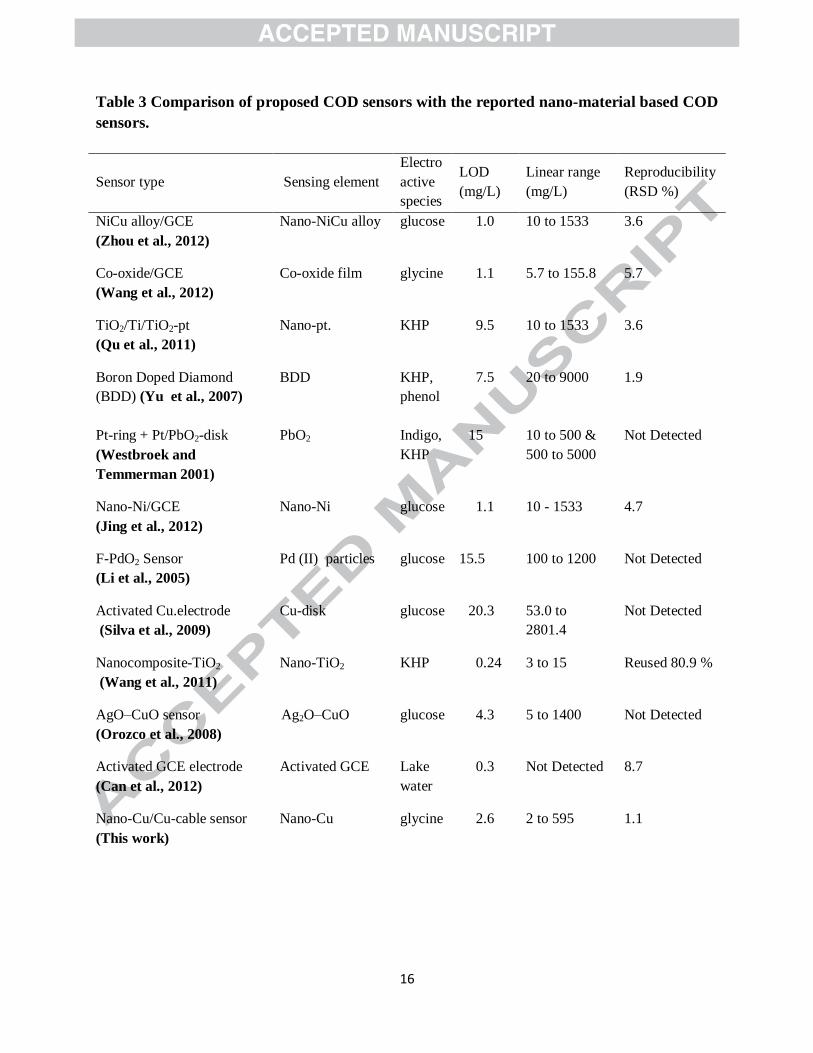
3.8. Comparison with reported COD sensors
In comparison with the previously reported COD sensors based on nano-materials, the optimized nano-
Cu/Cu-electrode (cable, disk) based COD sensor exhibited lower limit of detection and better sensitivity
compared to most of the previously reported electrochemical sensors (Table 3). Moreover, the developed
COD sensor is characterized by low cost and operational simplicity since there is no complicated
modification procedure for the electrode surface.
16
Table 3 Comparison of proposed COD sensors with the reported nano-material based COD
sensors.
Sensor type Sensing element
Electro
active
species
LOD
(mg/L)
Linear range
(mg/L)
Reproducibility
(RSD %)
NiCu alloy/GCE
(Zhou et al., 2012)
Nano-NiCu alloy glucose 1.0 10 to 1533 3.6
Co-oxide/GCE
(Wang et al., 2012)
Co-oxide film glycine 1.1 5.7 to 155.8 5.7
TiO2/Ti/TiO2-pt
(Qu et al., 2011)
Nano-pt. KHP 9.5 10 to 1533 3.6
Boron Doped Diamond
(BDD) (Yu et al., 2007)
BDD KHP,
phenol
7.5 20 to 9000 1.9
Pt-ring + Pt/PbO2-disk
(Westbroek and
Temmerman 2001)
PbO2 Indigo,
KHP
15 10 to 500 &
500 to 5000
Not Detected
Nano-Ni/GCE
(Jing et al., 2012)
Nano-Ni glucose 1.1 10 - 1533 4.7
F-PdO2 Sensor
(Li et al., 2005)
Pd (II) particles glucose 15.5 100 to 1200 Not Detected
Activated Cu.electrode
(Silva et al., 2009)
Cu-disk glucose 20.3 53.0 to
2801.4
Not Detected
Nanocomposite-TiO2
(Wang et al., 2011)
Nano-TiO2 KHP 0.24 3 to 15 Reused 80.9 %
AgO–CuO sensor
(Orozco et al., 2008)
Ag2O–CuO glucose 4.3 5 to 1400 Not Detected
Activated GCE electrode
(Can et al., 2012)
Activated GCE Lake
water
0.3 Not Detected 8.7
Nano-Cu/Cu-cable sensor
(This work)
Nano-Cu glycine 2.6 2 to 595 1.1
17
4. Conclusion
Electrodeposition via FSCV preparation produces uniform, mono dispersed and stable nano-Cu sensors. The prepared sensors exhibited low limit of detection, excellent reproducibility, high tolerance
level towards Cl- as main interfering ion, and fast response time. Moreover the prepared COD sensors are
easy to fabricate and operate as well as they exhibit stable responses for a reasonable time. The prepared sensors exhibited a detection limit of about 2 mg/L which could enable the analysis of COD in surface
waters (e.g., lakes, rivers). The prepared nano-Cu modified COD sensors were fully optimized in terms of
electrochemical parameters. The analytical utility of the optimized nano-Cu modified sensors was demonstrated by the analysis of COD is real water samples. Results obtained were found to be in good
agreement with the standard COD method which could enable the use of the prepared sensors in routine
analysis of real water samples.
5. Acknowledgment
Authors wish to thank Scientific Research Sector at Ain Shams University (Grant 08-010) for
financial support.
6. References
Ai, S., Gao, M., Yang, Y., Li, J., Jin, L., 2004. Electrocatalytic sensor for the determination of chemical
oxygen demand using a lead dioxide modified electrode. Electroanalysis 16. 404–409
American Public Health Association, (1998). Stand Methods for the Examination of Water and
Wastewater, 20th
edn., American Public Health Association, Washington, DC.
American Society for Testing and Materials, (1995). Standard Test Methods for Chemical Oxygen
Demand (dichromate oxygen demand) of Water. D1252-95, American Soc. Testing & Materials,
Philadelphia, Pa.
Association of Official Analytical Chemists, (1990). Official methods of analysis, 15th edn., Kenneth
Helrick, Arlington, Virginia, USA.
Bourais, I., Amine, A., Brett, C. M. A., 2004. Combination of Gold-Modified Electrode and α-
Amyloglucosidase for Simultaneous Determination of Starch and Glucose. Anal. Lett., 37, 1529-1543.
Burke, L.D., Bruton, G.M., Collins, J.A., 1998. The redox properties of active sites and the importance of
the latter in electrocatalysis at copper in base. Electrochimica Acta, 44, 1467–1479.
Can, W., Shijin, Y., Bin, L., Qin, C., Kangbing, W., 2012. Sensitive and rapid monitoring of water
pollution level based on the signal enhancement of an activated glassy carbon electrode. Anal. Methods,
4, 2715-2720.
18
Cheng, Q., Wu, C., Chen, J.W., Zhou, Y.K., Wu, K.B., 2011. Electrochemical Tuning the Activity of
Nickel Nanoparticle and Application in Sensitive Detection of Chemical Oxygen Demand. J. Phys. Chem.
C, 115, 22845-22850.
Heli, H., Faramarzi, F., Jabbari, A., Parsaei, A., Moosavi-Movahedi, A. A., 2010. Electrooxidation and
Determination of Etidronate using Copper Nanoparticles and Microparticles modified Carbon Paste
Electrodes. J. Braz. Chem. Soc., 21, 16-24.
Hur, J., Lee, B. M., Lee, T. H., Park, D. H., 2010. Estimation of Biological Oxygen Demand and
Chemical Oxygen Demand for Combined Sewer Systems Using Synchronous Fluorescence Spectra.
Sensors, 10, 2460 – 2471.
Jing, T., Zhou, Y., Hao, Q., Zhou, Y., Mei, S., 2012. A nano-nickel electrochemical sensor for sensitive
determination of chemical oxygen demand. Anal. Methods, 4, 1155–1159.
Kong, H., Wu, H., 2009. A rapid determination method of chemical oxygen demand in printing and
dyeing wastewater using ultraviolet spectroscopy, Water Environ. Res., 81, 2381–2386.
Korenaga, T., Ikatsu, H., 1982. The determination of chemical oxygen demand in waste-waters with
dichromate by flow injection analysis. Anal. Chim. Acta, 141, 301–309.
Korenaga, T., Zhou, X., Okada, K., Moriwake, T., 1993. Determination of chemical oxygen demand by a
flow-injection method using cerium (IV) sulphate as oxidizing agent. Anal. Chim. Acta, 272, 237–244.
Lee, K.H., Ishikawa, T., McNiven, S.J., Nomura, Y., Hiratsuka, A., Sasaki, S., Arikawa, Y., Karube, I.,
1999. Evaluation of chemical oxygen demand (COD) based on coulometric determination of
electrochemical oxygen demand (EOD) using a surface oxidized copper electrode, Anal. Chim. Acta, 398,
161-171.
Lee, K.H., Kim, Y.C., Suzuki, H., Ikebukuro, K., Hashimoto, K., Karube, I., 2000. Disposable Chemical
Oxygen Demand Sensor Using a Microfabricated Clark-Type Oxygen Electrode with a TiO2 Suspension
Solution, Electroanalysis, 12, 1334–1338.
Li, C., Song, G., (2009). Photocatalytic degradation of organic pollutants and detection of chemical
oxygen demand by fluorescence methods, Sens. Actuator B-Chem., 137, 432–436.
19
Li, J.Q., Li, L.P., Zheng, L., Xian, Y.Z., Ai, S.Y., Jin, L.T., 2005. Amperometric determination of
chemical oxygen demand with flow injection analysis using F-PbO2 modified electrode. Anal. Chim.
Acta, 548, 199–204.
Li, J.Q., Li, L.P., Zheng, L., Xian, Y.Z., Jin, L.T., 2006. Rh2O3/Ti electrode preparation using laser anneal
and its application to the determination of chemical oxygen demand. Meas. Sci. Technol., 17, 1995–2000.
Li, J.Q., Zheng, L., Li, L.P., Shi, G.Y., Xian, Y.Z., Jin, L.T., 2006. Ti/TiO2 Electrode Preparation Using
Laser Anneal and Its Application to Determination of Chemical Oxygen Demand. Electroanal., 18, 1014–
1018.
Li, J.Q., Zheng, L., Li, L.P., Shi, G.Y., Xian, Y.Z., Jin, L.T., 2007. Determination of chemical oxygen
demand using flow injection with Ti/TiO2 electrode prepared by laser anneal. Meas. Sci. Technol., 18,
945–951.
Liu, J., Ye, J., Xu, C., Ping Jiang, S., Tong, Y., 2007. Kinetics of ethanol electrooxidation at Pd
electrodeposited on Ti. Electrochem. Commun., 9, 2334–2339.
Liu, W., Zhang, Z., Zhang, Y., 2008. Chemiluminescence micro-flow system for rapid determination of
chemical oxygen demand in water. Microchim. Acta, 160, 141– 146.
Moore, W.A., Walker, W.W., 1965. Determination of Low Chemical Oxygen Demands of Surface
Waters by Dichromate Oxidation. Anal. Chem., 28, 164– 167.
Orozco, J., Fernández-Sánchez, C., Mendoza, E., Baeza, M., Céspedes, F., Jiménez-Jorquera, C., 2008.
Composite planar electrode for sensing electrochemical oxygen demand. Anal. Chim. Acta, 607, 176–
182.
Qu, X., Tian, M., Chen, S., liao, B., Chen, A., 2011. Determination of chemical oxygen demand based on
novel photoelectrobifunctional electrodes. Electroanal., 23, 1267-1275.
Silva, C.R., Conceicao, C.D.C., Bonifácio, V.G., Filho, Q.F., Teixeira, M.F.S., 2009. Determination of
the chemical oxygen demand (COD) using a copper electrode: a clean alternative method. J. Solid State.
Electrochem., 13, 665-669.
Silva, C.R., Vieira, H.J., Canaes, L.S., Nóbrega, J.A., Fatibello-Filho, O., 2005. Flow injection
spectrophotometric method for chloride determination in natural waters using Hg(SCN)2 immobilized in
epoxy resin. Talanta, 65, 965–970.

20
Tian, L.C., Wu, S.W., 1992. Determination of chemical oxygen demand in aqueous environmental
samples by segmented flow-injection analysis. Anal. Chim. Acta, 261, 301–305.
Wang, J., Wu, C., Wu, K., Cheng, Q., Zhou, Y., 2012. Electrochemical sensing chemical oxygen demand
based on the catalytic activity of cobalt oxide film. Anal. Chim. Acta, 736, 55– 61.
Wang, H., Zhong, S., He, Y., Song, G., 2011. Molecular sieve 4A–TiO2–K2Cr2O7 coexisted system as
sensor for chemical oxygen demand. Sens. Actuator B-Chem., 160, 189-195.
Westbroek, P., Temmerman, E., 2001. In line measurement of chemical oxygen demand by means of
multipulse amperometry at a rotating Pt ring—Pt/PbO2 disk electrode. Anal. Chim. Acta, 437, 95–105.
Yang, J.Q., Chen, J.W., Zhou, Y.K., Wu, K.B., 2011. A nano-copper electrochemical sensor for sensitive
detection of chemical oxygen demand, Sens. Actuator B-Chem., 113, 78-82.
Yao, H., Wu, B., Qu, H., Cheng, Y., 2009. A high throughput chemiluminescence method for
determination of chemical oxygen demand in waters. Anal. Chim. Acta, 633, 76–80.
Yu, H., Ma, C., Quan, X., Chen, S., Zhao, H., 2009. Flow Injection Analysis of Chemical Oxygen
Demand (COD) by Using a Boron-Doped Diamond (BDD) Electrode. Environ. Sci. Technol., 43 (2009)
1935–1939.
Yu, H.B., Wang, H., Quan, X., Chen, S., Zhang, Y.B., 2007. Amperometric determination of chemical
oxygen demand using boron-doped diamond (BDD) sensor. Electrochem. Commun., 9, 2280-2285.
Zhang, J., Zhou, B., Zheng, Q., Li, J., Bai, J., Liu, Y., Cai, W., 2009. Photoelectrocatalytic COD
determination method using highly ordered TiO2 nanotube array. Water Res., 43, 1–7.
Zhang, S., Li, L., Zhao, H., Li, G., 2009. A portable miniature UV-LED-based photoelectrochemical
system for determination of chemical oxygen demand in wastewater. Sens. Actuator B-Chem., 141, 634–
640.
Zhao, C., Shao, C., Li, M., Jiao, K., 2007. Flow-injection analysis of glucose without enzyme based on
electrocatalytic oxidation of glucose at a nickel electrode. Talanta, 71, 1769-1773.
21
Zhao, Y., Zhan, L. , Tian, J. , Nie, S. , Ning, Z. , 2011. Enhanced electrocatalytic oxidation of methanol
on Pd/polypyrrole–graphene in alkaline medium. ElectrochimicaActa, 56, 1967–1972.
Zhou, Y., Jing, T., Hao, Q., Zhou, Y., Mei, S., 2012. A sensitive and environmentally friendly method for
determination of chemical oxygen demand using NiCu alloy electrode. Electrochimica Acta, 74, 165 –
170.
Zhu, L., Chen, Y., Wu, Y., Li, X., Tang, H., 2006. A surface-fluorinated-TiO2–KMnO4 photocatalytic
system for determination of chemical oxygen demand. Anal. Chim. Acta, 571, 242–247.