The Estimation of Chemical Oxygen Demand of Erhai Lake ...
13
water Article The Estimation of Chemical Oxygen Demand of Erhai Lake Basin and Its Links with DOM Fluorescent Components Using Machine Learning Yuquan Zhao 1,2 , Jian Shen 1,2,3, * , Jimeng Feng 1,2,3 , Zhitong Sun 4 , Tianyang Sun 2,3 , Decai Liu 2,3 , Mansong Xi 5 , Rui Li 6 and Xinze Wang 1,2,3, * Citation: Zhao, Y.; Shen, J.; Feng, J.; Sun, Z.; Sun, T.; Liu, D.; Xi, M.; Li, R.; Wang, X. The Estimation of Chemical Oxygen Demand of Erhai Lake Basin and Its Links with DOM Fluorescent Components Using Machine Learning. Water 2021, 13, 3629. https://doi.org/10.3390/w13243629 Academic Editor: Matthew P. Miller Received: 2 November 2021 Accepted: 15 December 2021 Published: 16 December 2021 Publisher’s Note: MDPI stays neutral with regard to jurisdictional claims in published maps and institutional affil- iations. Copyright: © 2021 by the authors. Licensee MDPI, Basel, Switzerland. This article is an open access article distributed under the terms and conditions of the Creative Commons Attribution (CC BY) license (https:// creativecommons.org/licenses/by/ 4.0/). 1 School of Environmental Science and Engineering, Shanghai Jiao Tong University, Shanghai 200240, China; [email protected] (Y.Z.); [email protected] (J.F.) 2 National Observation and Research Station of Erhai Lake Ecosystem in Yunnan, Dali 671000, China; [email protected] (T.S.); [email protected] (D.L.) 3 Yunnan Dali Research Institute of Shanghai Jiao Tong University, Dali 671000, China 4 Institute of Water Resource Sciences, Northwest Agriculture and Forestry University, Xianyang 712100, China; [email protected] 5 Dali Erhai Lake Research Institute, Dali 671000, China; [email protected] 6 Yunnan Institute of Water & Hydropower Engineering Investigation, Design and Research, Kunming 650233, China; [email protected] * Correspondence: [email protected] (J.S.); [email protected] (X.W.) Abstract: Water quality estimation tools based on real-time monitoring are essential for the effective management of organic pollution in watersheds. This study aims to monitor changes in the levels of chemical oxygen demand (COD, CODMn) and dissolved organic matter (DOM) in Erhai Lake Basin, exploring their relationships and the ability of DOM to estimate COD and CODMn. Excitation emission matrix–parallel factor analysis (EEM–PARAFAC) of DOM identified protein-like component (C1) and humic-like components (C2, C3, C4). Combined with random forest (RF), maximum fluorescence intensity (Fmax) values of components were selected as estimation parameters to establish models. Results proved that the COD of rivers was more sensitive to the reduction in C1 and C2, while CODMn was more sensitive to C4. The DOM of Erhai Lake thrived by internal sources, and the relationship between COD, CODMn, and DOM of Erhai Lake was more complicated than rivers (inflow rivers of Erhai Lake). Models for rivers achieved good estimations, and by adding dissolved oxygen and water temperature, the estimation ability of COD models for Erhai Lake was significantly improved. This study demonstrates that DOM-based machine learning can be used as an alternative tool for real-time monitoring of organic pollution and deepening the understanding of the relationship between COD, CODMn, and DOM, and provide a scientific basis for water quality management. Keywords: water quality estimation; machine learning models; random forest; EEM–PARAFAC; DOM; COD; CODMn 1. Introduction With the acceleration of the industrialization process, the problem of organic pollution in receiving river basins has become increasingly prominent [1,2]. Organic pollution to Erhai Lake Basin, a local drinking water source, has caused deterioration of the aquatic ecosystem and poses a threat to human health [3]. Therefore, continuous water quality monitoring and evaluation for organic matter are essential for rapid pollution control, to ensure the reliability of drinking water, and to help understand the ecosystem functioning of the basin. Traditionally, chemical oxygen demand (COD and CODMn) tests are widely used to determine the organic content of watersheds [4]. The main difference between COD and CODMn test methods lies in the oxidant. COD uses potassium dichromate as Water 2021, 13, 3629. https://doi.org/10.3390/w13243629 https://www.mdpi.com/journal/water
-
Upload
khangminh22 -
Category
Documents
-
view
3 -
download
0
Transcript of The Estimation of Chemical Oxygen Demand of Erhai Lake ...
water
Article
The Estimation of Chemical Oxygen Demand of Erhai LakeBasin and Its Links with DOM Fluorescent Components UsingMachine Learning
Yuquan Zhao 1,2, Jian Shen 1,2,3,* , Jimeng Feng 1,2,3, Zhitong Sun 4, Tianyang Sun 2,3, Decai Liu 2,3, Mansong Xi 5,Rui Li 6 and Xinze Wang 1,2,3,*
�����������������
Citation: Zhao, Y.; Shen, J.; Feng, J.;
Sun, Z.; Sun, T.; Liu, D.; Xi, M.; Li, R.;
Wang, X. The Estimation of Chemical
Oxygen Demand of Erhai Lake Basin
and Its Links with DOM Fluorescent
Components Using Machine
Learning. Water 2021, 13, 3629.
https://doi.org/10.3390/w13243629
Academic Editor: Matthew P. Miller
Received: 2 November 2021
Accepted: 15 December 2021
Published: 16 December 2021
Publisher’s Note: MDPI stays neutral
with regard to jurisdictional claims in
published maps and institutional affil-
iations.
Copyright: © 2021 by the authors.
Licensee MDPI, Basel, Switzerland.
This article is an open access article
distributed under the terms and
conditions of the Creative Commons
Attribution (CC BY) license (https://
creativecommons.org/licenses/by/
4.0/).
1 School of Environmental Science and Engineering, Shanghai Jiao Tong University, Shanghai 200240, China;[email protected] (Y.Z.); [email protected] (J.F.)
2 National Observation and Research Station of Erhai Lake Ecosystem in Yunnan, Dali 671000, China;[email protected] (T.S.); [email protected] (D.L.)
3 Yunnan Dali Research Institute of Shanghai Jiao Tong University, Dali 671000, China4 Institute of Water Resource Sciences, Northwest Agriculture and Forestry University, Xianyang 712100, China;
[email protected] Dali Erhai Lake Research Institute, Dali 671000, China; [email protected] Yunnan Institute of Water & Hydropower Engineering Investigation, Design and Research,
Kunming 650233, China; [email protected]* Correspondence: [email protected] (J.S.); [email protected] (X.W.)
Abstract: Water quality estimation tools based on real-time monitoring are essential for the effectivemanagement of organic pollution in watersheds. This study aims to monitor changes in the levelsof chemical oxygen demand (COD, CODMn) and dissolved organic matter (DOM) in Erhai LakeBasin, exploring their relationships and the ability of DOM to estimate COD and CODMn. Excitationemission matrix–parallel factor analysis (EEM–PARAFAC) of DOM identified protein-like component(C1) and humic-like components (C2, C3, C4). Combined with random forest (RF), maximumfluorescence intensity (Fmax) values of components were selected as estimation parameters toestablish models. Results proved that the COD of rivers was more sensitive to the reduction in C1and C2, while CODMn was more sensitive to C4. The DOM of Erhai Lake thrived by internal sources,and the relationship between COD, CODMn, and DOM of Erhai Lake was more complicated thanrivers (inflow rivers of Erhai Lake). Models for rivers achieved good estimations, and by addingdissolved oxygen and water temperature, the estimation ability of COD models for Erhai Lake wassignificantly improved. This study demonstrates that DOM-based machine learning can be used asan alternative tool for real-time monitoring of organic pollution and deepening the understandingof the relationship between COD, CODMn, and DOM, and provide a scientific basis for waterquality management.
Keywords: water quality estimation; machine learning models; random forest; EEM–PARAFAC;DOM; COD; CODMn
1. Introduction
With the acceleration of the industrialization process, the problem of organic pollutionin receiving river basins has become increasingly prominent [1,2]. Organic pollution toErhai Lake Basin, a local drinking water source, has caused deterioration of the aquaticecosystem and poses a threat to human health [3]. Therefore, continuous water qualitymonitoring and evaluation for organic matter are essential for rapid pollution control, toensure the reliability of drinking water, and to help understand the ecosystem functioningof the basin. Traditionally, chemical oxygen demand (COD and CODMn) tests are widelyused to determine the organic content of watersheds [4]. The main difference betweenCOD and CODMn test methods lies in the oxidant. COD uses potassium dichromate as
Water 2021, 13, 3629. https://doi.org/10.3390/w13243629 https://www.mdpi.com/journal/water
Water 2021, 13, 3629 2 of 13
the oxidant, while CODMn uses potassium permanganate, but both methods demandhigh-quality personnel, expensive or poisonous reagents, and long analysis time, limitingtheir application for rapid continuous safety monitoring [5–7].
Recently, fluorescence technology has introduced a wide prospect of applications in thefield of hydrological monitoring, due to the small amount of sample required, fast analysisspeed, and pollutant-free analysis [8,9]. Excitation emission matrix–parallel factor analysis(EEM–PARAFAC) has been found effective in reflecting the composition and source ofdissolved organic matter (DOM), but its application in the estimation of water qualityparameters in human affected basins has not been fully explored [10–13]. In addition,understanding the relationship between COD, CODMn, and DOM is helpful to provide abasis for water quality management. Past studies have shown a direct relationship betweenDOM, COD, and CODMn, which indicates that DOM may be used as a COD and CODMnestimation tool in hydrological monitoring [14,15].
Clarifying the contribution of DOM components to COD and CODMn is conduciveto the proposal of scientific water quality management measures, but due to the spatialand temporal heterogeneity and dynamic nature of COD and CODMn in Erhai Lake Basin,traditional regression methods can have difficulties considering the non-linear relationship,which may exist between COD, CODMn and DOM [16]. To capture non-linear relationshipsthat are common in environmental processes, machine learning has recently begun tobe used for hydrological monitoring, since it includes algorithms and models that canprovide multivariate, nonlinear, nonparametric regression or classification methods [17].In addition, machine learning models can be trained for several key environmental qualityparameters and the final environmental outcomes, using the current archived data, and canfurther predict future results after inputting new parameters [18]. This shows the potentialof using DOM to quickly predict COD and CODMn on site. The study by Peterson et al.(2018) in the Missouri–Mississippi River system proved that machine learning modelsoutperform regression models in predicting water quality parameters, which will help toimprove the reliability of estimated COD and CODMn data [19].
Erhai Lake is the second-largest freshwater lake in southwestern China and is animportant source of drinking water, irrigation, tourism, and fisheries for Dali (Yunnan,China) [20]. Therefore, understanding the dynamic changes of organic matter contentand realizing the real-time monitoring of COD and CODMn are of great significancefor the water quality management of Erhai Lake Basin. Herein, we collected 651 watersamples from the Erhai Lake Basin in 12 months, used EEM–PARAFAC to obtain the maincomponents of DOM and the maximum fluorescence intensity (Fmax) of each component.Using machine learning algorithms, we trained and modeled the gained data sets. Theaims of this study were to (1) analyze seasonal changes of COD, CODMn, and DOMin Erhai Lake Basin; (2) compare the difference in the contribution of different DOMfluorescent components to COD and CODMn; (3) test the ability of DOM to estimate CODand CODMn.
2. Material and Methods2.1. Study Area and Sample Collection
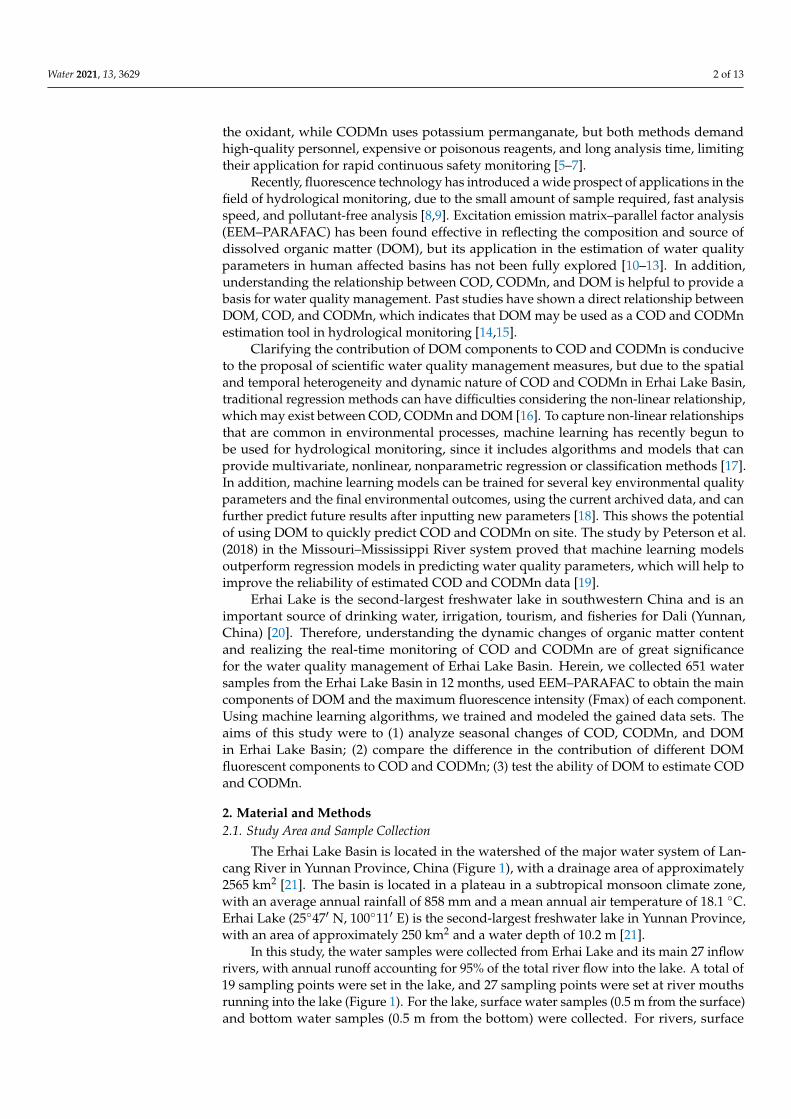
The Erhai Lake Basin is located in the watershed of the major water system of Lan-cang River in Yunnan Province, China (Figure 1), with a drainage area of approximately2565 km2 [21]. The basin is located in a plateau in a subtropical monsoon climate zone,with an average annual rainfall of 858 mm and a mean annual air temperature of 18.1 ◦C.Erhai Lake (25◦47′ N, 100◦11′ E) is the second-largest freshwater lake in Yunnan Province,with an area of approximately 250 km2 and a water depth of 10.2 m [21].
In this study, the water samples were collected from Erhai Lake and its main 27 inflowrivers, with annual runoff accounting for 95% of the total river flow into the lake. A total of19 sampling points were set in the lake, and 27 sampling points were set at river mouthsrunning into the lake (Figure 1). For the lake, surface water samples (0.5 m from the surface)and bottom water samples (0.5 m from the bottom) were collected. For rivers, surface
Water 2021, 13, 3629 3 of 13
samples (0.2 m from the surface) were collected [22,23]. Water samples were collectedmonthly in 2020 ( 65 sites, provided that the rivers were not dried up). Water temperature(WT) and pH were measured with HACH HQ40d, and different portable dissolved oxygenmeters (YSI550A, Yellow Springs, OH, USA) were used for the measurement of dissolvedoxygen (DO). Water samples were collected with a LIMNOS water sampler and weretemporarily stored in 1L PVC bottles. The water sample was first sieved (250 mesh) andthen placed in an HPDE container that was preliminarily soaked in 0.1 mol L−1 HCL for24 h and rinsed with Milli-Q water (Millipore Co., Bedford, MA, USA). The determinationof all indicators was completed within 24 h.
Water 2021, 13, 3629 3 of 13
In this study, the water samples were collected from Erhai Lake and its main 27
inflow rivers, with annual runoff accounting for 95% of the total river flow into the lake.
A total of 19 sampling points were set in the lake, and 27 sampling points were set at river
mouths running into the lake (Figure 1). For the lake, surface water samples (0.5 m from
the surface) and bottom water samples (0.5 m from the bottom) were collected. For rivers,
surface samples (0.2 m from the surface) were collected [22,23]. Water samples were
collected monthly in 2020 ( 65 sites, provided that the rivers were not dried up). Water
temperature (WT) and pH were measured with HACH HQ40d, and different portable
dissolved oxygen meters (YSI550A, Yellow Springs, OH, USA) were used for the
measurement of dissolved oxygen (DO). Water samples were collected with a LIMNOS
water sampler and were temporarily stored in 1L PVC bottles. The water sample was first
sieved (250 mesh) and then placed in an HPDE container that was preliminarily soaked
in 0.1 mol L−1 HCL for 24 h and rinsed with Milli-Q water (Millipore Co., Bedford, MA,
USA). The determination of all indicators was completed within 24 h.
Figure 1. Study area and sampling sites.
2.2 Analytical Measurements
2.2.1. Water Quality Index
COD was determined following the potassium dichromate index method [24].
CODMn was analyzed by the potassium permanganate index method [25]. Total nitrogen
(TN) and ammonia (NH4-N) concentrations were determined by alkaline potassium
persulfate digestion–UV spectrophotometric method (The Chinese National Standard
HJ636-2012) [26]. The dissolved organic nitrogen (DON) concentration is the value
obtained by subtracting the dissolved inorganic nitrogen from the total dissolved nitrogen
[26]. Total phosphorus (TP) and orthophosphate concentrations were measured by using
the ammonium molybdate spectrophotometric method (The Chinese National Standard
GB11893-89) [27]. Water for Chlorophyll a (Chla) was first filtered through a 0.45 μm glass
fiber membrane, and then, the sample membrane was extracted with 90% acetone for 24
h and measured colorimetrically [28].
2.2.2. DOM Measurements and Analyses
Figure 1. Study area and sampling sites.
2.2. Analytical Measurements2.2.1. Water Quality Index
COD was determined following the potassium dichromate index method [24]. CODMnwas analyzed by the potassium permanganate index method [25]. Total nitrogen (TN)and ammonia (NH4-N) concentrations were determined by alkaline potassium persul-fate digestion–UV spectrophotometric method (The Chinese National Standard HJ636-2012) [26]. The dissolved organic nitrogen (DON) concentration is the value obtained bysubtracting the dissolved inorganic nitrogen from the total dissolved nitrogen [26]. Totalphosphorus (TP) and orthophosphate concentrations were measured by using the ammo-nium molybdate spectrophotometric method (The Chinese National Standard GB11893-89) [27].Water for Chlorophyll a (Chla) was first filtered through a 0.45 µm glass fiber membrane,and then, the sample membrane was extracted with 90% acetone for 24 h and measuredcolorimetrically [28].
2.2.2. DOM Measurements and Analyses
Before the measurement, a pre-burned (500 ◦C, 4 h) Whatman GF/F glass fiber filter(GE Healthcare, Pittsburgh, PA, USA) was used to preliminarily filter the water samples;then, a 0.45 µm glass fiber membrane rinsed with ultrapure water was used to further filterthe water samples. The filtered water samples were stored in a brown glass bottle. Themeasurement was completed within 24 h.
Water 2021, 13, 3629 4 of 13
In order to build excitation–emission matrices (EEMs), the measurement of the fluo-rescence intensity was carried out in a fluorescence spectrophotometer (RF-6000, Japan),across excitation wavelengths ranging from 260 to 400 nm (2 nm increments) and emissionwavelengths ranging from 300 to 600 nm (1 nm increment). Bandpass was set at 5 nm, andthe scanning speed was 6000 nm/min. Milli-Q ultrapure water was used to calibrate thethree-dimensional fluorescence spectrum of the sample, thereby reducing the influence ofinstrument and Raman scattering [29]. The fluorescence data were used to calculate thefluorescent index (FI), freshness index (β/α), humification index (HIX), and spontaneoussource index (BIX) (Table S1) [8,12,30–32].
PARAFAC can decompose the matrix data of the three-dimensional fluorescence spec-trum into discrete variables to obtain the main components in the complex mixtures ofDOM fluorophores [9]. This study was based on the method of Stedmon and Bro (2008),using the DOMFlour toolbox to carry out the analysis in MATLAB R2020a (The Math-Works, Inc., Natick, MA, USA) [33]. The inner-filter effects were corrected by the formulareported by Larsson et al. (2007) [34]. EEMs were normalized before model validation, andthe appropriate number of components was verified by split-half analysis and randominitialization, as suggested by Murphy et al. (2013) [35]. Split-half validation was per-formed on 4-, 5-, 6-, and 7-component models, and the 4-component model was validated,while others were not. The PARAFAC analysis finally separated the multiple fluorescencecomponents and their respective maximum fluorescence intensity (Fmax). The Sum ofFmax (SOF) for C1-C4 was used to indicate the total fluorescence of the DOM sample.The final results of DOM components were further uploaded to the OpenFluor network(https://openfluor.lablicate.com/, accessed on 6 June 2021), and the criteria for match-ing components were set at 95% similarity and assessed through Tucker’s CongruenceCoefficient [36].
2.3. Machine Learning
COD, CODMn, and the Fmax values of DOM components were trained by randomforest (RF). RF is a machine learning algorithm for classification and regression that consistsof a set of decision trees [37]. In RF regression, it first extracts bootstrap samples from theoriginal data and then generates regression trees by using the classification and regressiontree (CART) [38]. After the best split on each node is completed, multiple estimations ontarget variables are produced. By voting them, we obtain a final output [37,39]. As one ofthe well-known machine learning algorithms, RF has the advantages of high estimativeperformance, the ability to capture the nonlinear dependencies between predictor anddependent variables, and the ability to handle highly correlated predictor variables [40–42].
RF models were constructed through Anaconda 3 (v5.2.0) (Anaconda Inc., Austin, TX,USA), and the program code was written by Python programing language. In this study,80% of randomly selected data were used in the training phase of the model, and the other20% examined the model performance. The RandomForestRegressor function of the libraryScikit-Learn was used to build estimative models. Using the GridSearchCV function fromthe Scikit-Learn library, a grid search was implemented to gain a set of the ideal valueof the parameters (Table S2). Then, fivefold cross validation (CV) was used to establishand validate the estimation results (Figure S1). The entire training data set was randomlydivided into 5 subsets, 4 of which were used for model training and to make estimationsfor the subsets not involved in training. The whole process was repeated 5 times untileach subset was tested [37]. Further, R square (R2), root-mean-squared error (RMSE), andresidual estimation deviation (RPD) were calculated to judge the generalizing capabilityof the model [43]. If the RPD value was greater than 2, the model was considered to be astable and accurate estimative model, while a value between 1.4 and 2 indicated that themodel had a certain estimative ability but still had room for improvement; a value lessthan 1.4 indicated that the model had almost no estimative ability [44].
Water 2021, 13, 3629 5 of 13
In this study, we followed the following steps for data analysis and modeling:
1. Firstly, EEM–PARAFAC was used to analyze the water samples of the Erhai LakeBasin and identify the main DOM components. The seasonal differences in the COD,CODMn, DOM components, and the fluorescence index of the rivers and Erhai Lakewere explored. The four seasons in this study were defined as spring (February–April),summer (May–July), autumn (August–October), and winter (November–January ofnext year).
2. Secondly, RF was used to train the Fmax values of DOM components and correspond-ing COD and CODMn data. Considering that there may be differences between riversand Erhai Lake, the models were established separately [15].
3. Thirdly, using RF, the Fmax of each component of the DOM would be sequentiallyreduced (Fmax was reduced in steps of 10% until it became 0) for COD and CODMnestimation. This was to explore the differences in the effects of DOM components onCOD and CODMn.
4. Finally, the effectiveness of adding new environmental variables to the models inimproving the prediction ability of COD and CODMn was explored.
2.4. Other Statistical Analysis
By using SPSS Statistics 26.0 software (IBM Corp., Armonk, NY, USA), Pearson’scorrelation analysis was used to evaluate the correlation between the parameters, andone-way ANOVA (analysis of variance) was used for each variable to determine if thedifferences in the means between sampling depths were statistically significant. Significantcorrelations in the statistics were evaluated using p values. The descriptive statistics andgraph production of the data were carried out in origin 2020b and ArcGIS 10.8.
3. Results and Discussion3.1. Seasonal Changes of COD, CODMn, and DOM
Using PARAFAC, we identified four DOM components in Erhai Lake Basin—oneprotein-like component (C1) and three humic-like components (C2, C3, and C4) (Figure S2,Table S3). The one-way ANOVA test showed that there was no significant variation in eachvariable among different depths (p > 0.05) (Table S4); thus, for all variables, the averagevalues of surface water and bottom water are discussed in this section (Table S5).
With the arrival of summer, C1 reached its peak in the lake (Figure 2). This has beenassociated with an increase in biological activity in summer, which promotes the increase inthe protein-like component [45]. The spatial distribution of DOM in summer suggested thatC1 was more internally affected (Figure S3). For example, C1 values in the middle samplingsites (2 and 18) were higher than that of the sampling sites (1, 11, 12, 13, and 14) near theriver mouth. This was consistent with the endogenous influence indicated by FI, whichreached the highest value in summer. The relative abundance of humic-like substances inthe rivers reached the highest value in summer, which was similar to the results of previousstudies in temperate rivers and related to the rainfall [46,47]. The mean annual rainfallof Erhai Lake Basin is 858 mm, of which 90% falls in the wet season between May andOctober [20]. Studies have shown an increased abundance of humus components of DOMfollowing rainstorm events, as more rainfall in summer may promote the release of soilorganic matter into the river and terrestrial plants in the form of humus substances [48,49].In addition, the SOF of the lake was on an upward trend throughout the year, while that ofthe rivers began to decline after reaching a peak in summer (Figure S4). This indicated thatafter summer, the DOM level in the Erhai Lake was not mainly controlled by the rivers.Combined with the FI value of Erhai Lake, close to 1.8 instead of 1.4, we believe that theDOM of Erhai Lake thrived by internal sources (extracellular release and leachate frombacteria and algae).
Water 2021, 13, 3629 6 of 13
Water 2021, 13, 3629 6 of 13
was not mainly controlled by the rivers. Combined with the FI value of Erhai Lake, close
to 1.8 instead of 1.4, we believe that the DOM of Erhai Lake thrived by internal sources
(extracellular release and leachate from bacteria and algae).
COD and CODMn have been widely used to evaluate organic content in water
systems [50,51]. Similar to other lakes in China, our results showed that COD and CODMn
of the lake reached their peak in summer, which may be related to phytoplankton detritus
and the release of dissolved organic matter from phytoplankton [52–55]. Although the
humic-like components in rivers reached their peak in summer, COD and CODMn had a
certain degree of decline, compared with spring, and the downward trend of COD was
more obvious. The protein-like component may contribute to more COD. Therefore, with
the decrease in C1 in summer, COD was also reduced to a certain extent. In addition, the
amount of water brought in summer may have diluted the concentration of organic matter
in the river to a certain extent so as to reduce COD [56]. Although both COD and CODMn
were indirect expressions of the oxidation degree of organic matter, the correlation
between COD and CODMn in rivers was obviously stronger than that in Erhai Lake
(Tables S6 and S7). COD measured by the potassium dichromate method can express most
of the reducing substances in the water body and oxidation rate can reach 90%, while the
CODMn value obtained based on the potassium permanganate method can only reflect
some reducing substances that were easily oxidized [57–59]. Therefore, a lower correlation
means there were more complex substances that were not easily oxidized in the water
body. These results indicated that the organic matter in the Erhai Lake may be more
complex and include more substances not easy to be oxidized by potassium
permanganate. The correlation results of DOM, COD, and CODMn were also quite
different in the rivers and Erhai Lake. COD, CODMn, and DOM components had a good
correlation in rivers. Correlation coefficients were all greater than 0.6, in which the
correlation coefficients of humic-like components, and CODMn were all greater than 0.8,
indicating that the humic-like components and CODMn had a close relationship in the
rivers. There was no strong positive correlation (correlation coefficient > 0.6) between
COD, CODMn, and DOM in Erhai Lake. In summer, there were high COD and CODMn
values in the north of Erhai Lake, while humic-like components (C2, C3, and C4) were
mainly concentrated in the south, and the protein-like component (C1) was widely
distributed in the whole lake (Figure S4). These results implied that relying on DOM to
estimate COD and CODMn in the lake may have poor accuracy.
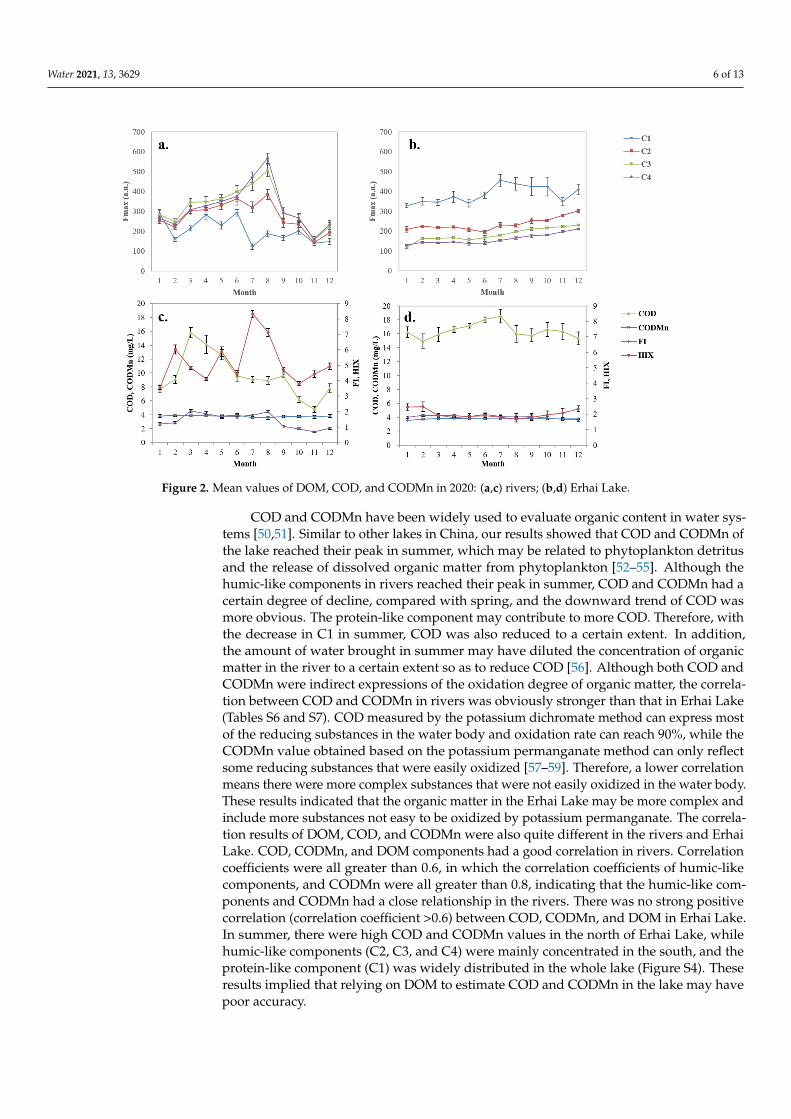
Figure 2. Mean values of DOM, COD, and CODMn in 2020: (a,c) rivers; (b,d) Erhai Lake.
COD and CODMn have been widely used to evaluate organic content in water sys-tems [50,51]. Similar to other lakes in China, our results showed that COD and CODMn ofthe lake reached their peak in summer, which may be related to phytoplankton detritusand the release of dissolved organic matter from phytoplankton [52–55]. Although thehumic-like components in rivers reached their peak in summer, COD and CODMn had acertain degree of decline, compared with spring, and the downward trend of COD wasmore obvious. The protein-like component may contribute to more COD. Therefore, withthe decrease in C1 in summer, COD was also reduced to a certain extent. In addition,the amount of water brought in summer may have diluted the concentration of organicmatter in the river to a certain extent so as to reduce COD [56]. Although both COD andCODMn were indirect expressions of the oxidation degree of organic matter, the correla-tion between COD and CODMn in rivers was obviously stronger than that in Erhai Lake(Tables S6 and S7). COD measured by the potassium dichromate method can express mostof the reducing substances in the water body and oxidation rate can reach 90%, while theCODMn value obtained based on the potassium permanganate method can only reflectsome reducing substances that were easily oxidized [57–59]. Therefore, a lower correlationmeans there were more complex substances that were not easily oxidized in the water body.These results indicated that the organic matter in the Erhai Lake may be more complex andinclude more substances not easy to be oxidized by potassium permanganate. The correla-tion results of DOM, COD, and CODMn were also quite different in the rivers and ErhaiLake. COD, CODMn, and DOM components had a good correlation in rivers. Correlationcoefficients were all greater than 0.6, in which the correlation coefficients of humic-likecomponents, and CODMn were all greater than 0.8, indicating that the humic-like com-ponents and CODMn had a close relationship in the rivers. There was no strong positivecorrelation (correlation coefficient >0.6) between COD, CODMn, and DOM in Erhai Lake.In summer, there were high COD and CODMn values in the north of Erhai Lake, whilehumic-like components (C2, C3, and C4) were mainly concentrated in the south, and theprotein-like component (C1) was widely distributed in the whole lake (Figure S4). Theseresults implied that relying on DOM to estimate COD and CODMn in the lake may havepoor accuracy.
Water 2021, 13, 3629 7 of 13
3.2. Performance of Models and Variable Importance
A Pearson’s correlation analysis was performed on all variables (Tables S6 and S7). Theresults showed that the DOM components (C1, C2, C3, and C4) had a significant positivecorrelation with each other, which indicated that there may be a potential multicollinearityproblem between the independent variables. This was one of the reasons why we choseRF to build the model because it had been proved that this machine learning method wasequally applicable to highly correlated variables [60,61].
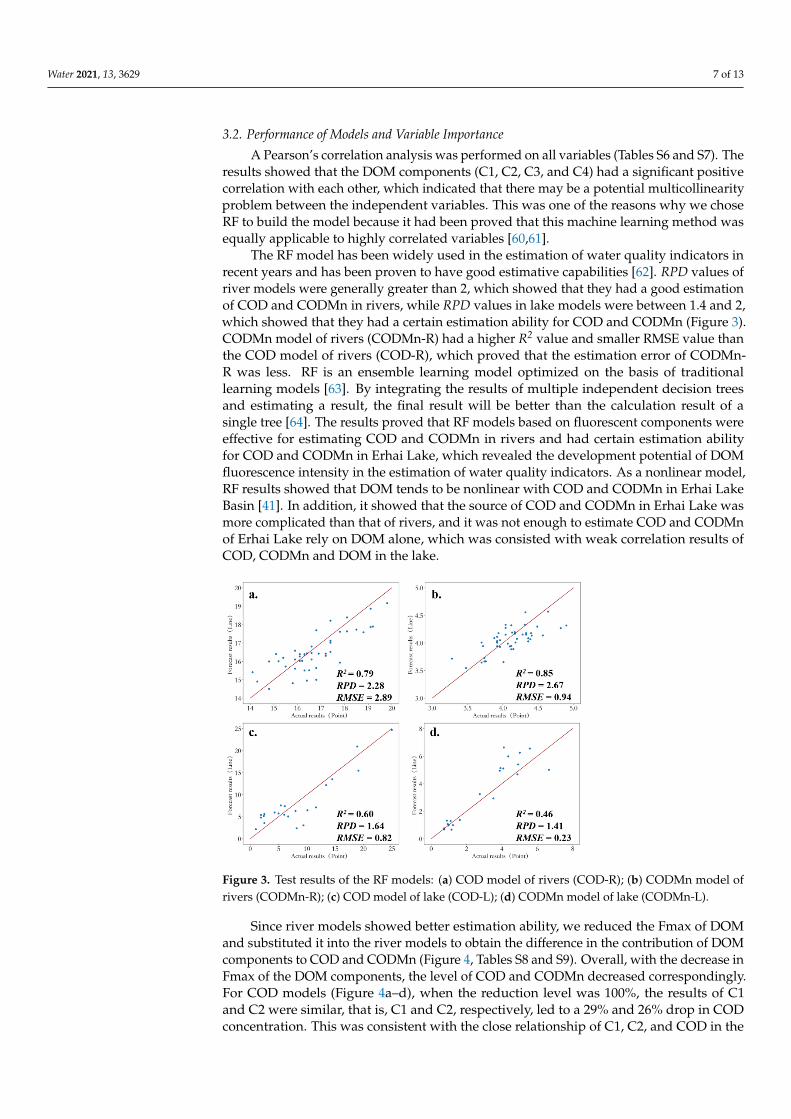
The RF model has been widely used in the estimation of water quality indicators inrecent years and has been proven to have good estimative capabilities [62]. RPD values ofriver models were generally greater than 2, which showed that they had a good estimationof COD and CODMn in rivers, while RPD values in lake models were between 1.4 and 2,which showed that they had a certain estimation ability for COD and CODMn (Figure 3).CODMn model of rivers (CODMn-R) had a higher R2 value and smaller RMSE value thanthe COD model of rivers (COD-R), which proved that the estimation error of CODMn-R was less. RF is an ensemble learning model optimized on the basis of traditionallearning models [63]. By integrating the results of multiple independent decision treesand estimating a result, the final result will be better than the calculation result of asingle tree [64]. The results proved that RF models based on fluorescent components wereeffective for estimating COD and CODMn in rivers and had certain estimation abilityfor COD and CODMn in Erhai Lake, which revealed the development potential of DOMfluorescence intensity in the estimation of water quality indicators. As a nonlinear model,RF results showed that DOM tends to be nonlinear with COD and CODMn in Erhai LakeBasin [41]. In addition, it showed that the source of COD and CODMn in Erhai Lake wasmore complicated than that of rivers, and it was not enough to estimate COD and CODMnof Erhai Lake rely on DOM alone, which was consisted with weak correlation results ofCOD, CODMn and DOM in the lake.
Water 2021, 13, 3629 8 of 13
reduction in C4, which suggested that C4 may be easily oxidized by potassium
permanganate [68,69]. The results showed that COD was more sensitive to the reduction in
C1 and C2, while CODMn was more sensitive to the reduction in C4, which suggested that
we should pay attention to the change in C1, C2, and C4 and reduce their concentration in
water to prevent possible organic pollution in Erhai Lake Basin.
Figure 3. Test results of the RF models: (a) COD model of rivers (COD-R); (b) CODMn model of
rivers (CODMn-R); (c) COD model of lake (COD-L); (d) CODMn model of lake (CODMn-L).
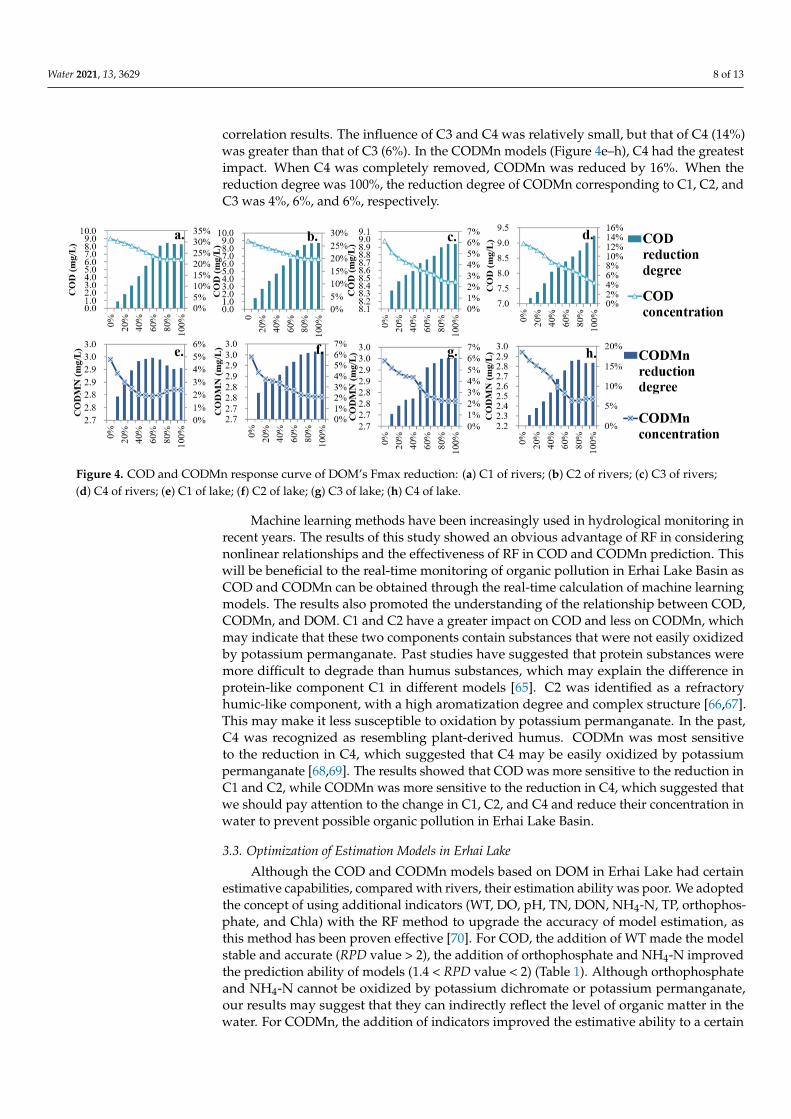
Figure 4. COD and CODMn response curve of DOM’s Fmax reduction: (a) C1 of rivers; (b) C2 of rivers; (c) C3 of rivers;
(d) C4 of rivers; (e) C1 of lake; (f) C2 of lake; (g) C3 of lake; (h) C4 of lake.
3.3. Optimization of Estimation Models in Erhai Lake
Although the COD and CODMn models based on DOM in Erhai Lake had certain
estimative capabilities, compared with rivers, their estimation ability was poor. We
adopted the concept of using additional indicators (WT, DO, pH, TN, DON, NH4-N, TP,
orthophosphate, and Chla) with the RF method to upgrade the accuracy of model
estimation, as this method has been proven effective [70]. For COD, the addition of WT
made the model stable and accurate (RPD value > 2), the addition of orthophosphate and
NH4-N improved the prediction ability of models (1.4 < RPD value < 2) (Table 1). Although
orthophosphate and NH4-N cannot be oxidized by potassium dichromate or potassium
permanganate, our results may suggest that they can indirectly reflect the level of organic
Figure 3. Test results of the RF models: (a) COD model of rivers (COD-R); (b) CODMn model ofrivers (CODMn-R); (c) COD model of lake (COD-L); (d) CODMn model of lake (CODMn-L).
Since river models showed better estimation ability, we reduced the Fmax of DOMand substituted it into the river models to obtain the difference in the contribution of DOMcomponents to COD and CODMn (Figure 4, Tables S8 and S9). Overall, with the decrease inFmax of the DOM components, the level of COD and CODMn decreased correspondingly.For COD models (Figure 4a–d), when the reduction level was 100%, the results of C1and C2 were similar, that is, C1 and C2, respectively, led to a 29% and 26% drop in CODconcentration. This was consistent with the close relationship of C1, C2, and COD in the
Water 2021, 13, 3629 8 of 13
correlation results. The influence of C3 and C4 was relatively small, but that of C4 (14%)was greater than that of C3 (6%). In the CODMn models (Figure 4e–h), C4 had the greatestimpact. When C4 was completely removed, CODMn was reduced by 16%. When thereduction degree was 100%, the reduction degree of CODMn corresponding to C1, C2, andC3 was 4%, 6%, and 6%, respectively.
Water 2021, 13, 3629 8 of 13
reduction in C4, which suggested that C4 may be easily oxidized by potassium
permanganate [68,69]. The results showed that COD was more sensitive to the reduction in
C1 and C2, while CODMn was more sensitive to the reduction in C4, which suggested that
we should pay attention to the change in C1, C2, and C4 and reduce their concentration in
water to prevent possible organic pollution in Erhai Lake Basin.
Figure 3. Test results of the RF models: (a) COD model of rivers (COD-R); (b) CODMn model of
rivers (CODMn-R); (c) COD model of lake (COD-L); (d) CODMn model of lake (CODMn-L).
Figure 4. COD and CODMn response curve of DOM’s Fmax reduction: (a) C1 of rivers; (b) C2 of rivers; (c) C3 of rivers;
(d) C4 of rivers; (e) C1 of lake; (f) C2 of lake; (g) C3 of lake; (h) C4 of lake.
3.3. Optimization of Estimation Models in Erhai Lake
Although the COD and CODMn models based on DOM in Erhai Lake had certain
estimative capabilities, compared with rivers, their estimation ability was poor. We
adopted the concept of using additional indicators (WT, DO, pH, TN, DON, NH4-N, TP,
orthophosphate, and Chla) with the RF method to upgrade the accuracy of model
estimation, as this method has been proven effective [70]. For COD, the addition of WT
made the model stable and accurate (RPD value > 2), the addition of orthophosphate and
NH4-N improved the prediction ability of models (1.4 < RPD value < 2) (Table 1). Although
orthophosphate and NH4-N cannot be oxidized by potassium dichromate or potassium
permanganate, our results may suggest that they can indirectly reflect the level of organic
Figure 4. COD and CODMn response curve of DOM’s Fmax reduction: (a) C1 of rivers; (b) C2 of rivers; (c) C3 of rivers;(d) C4 of rivers; (e) C1 of lake; (f) C2 of lake; (g) C3 of lake; (h) C4 of lake.
Machine learning methods have been increasingly used in hydrological monitoring inrecent years. The results of this study showed an obvious advantage of RF in consideringnonlinear relationships and the effectiveness of RF in COD and CODMn prediction. Thiswill be beneficial to the real-time monitoring of organic pollution in Erhai Lake Basin asCOD and CODMn can be obtained through the real-time calculation of machine learningmodels. The results also promoted the understanding of the relationship between COD,CODMn, and DOM. C1 and C2 have a greater impact on COD and less on CODMn, whichmay indicate that these two components contain substances that were not easily oxidizedby potassium permanganate. Past studies have suggested that protein substances weremore difficult to degrade than humus substances, which may explain the difference inprotein-like component C1 in different models [65]. C2 was identified as a refractoryhumic-like component, with a high aromatization degree and complex structure [66,67].This may make it less susceptible to oxidation by potassium permanganate. In the past,C4 was recognized as resembling plant-derived humus. CODMn was most sensitiveto the reduction in C4, which suggested that C4 may be easily oxidized by potassiumpermanganate [68,69]. The results showed that COD was more sensitive to the reduction inC1 and C2, while CODMn was more sensitive to the reduction in C4, which suggested thatwe should pay attention to the change in C1, C2, and C4 and reduce their concentration inwater to prevent possible organic pollution in Erhai Lake Basin.
3.3. Optimization of Estimation Models in Erhai Lake
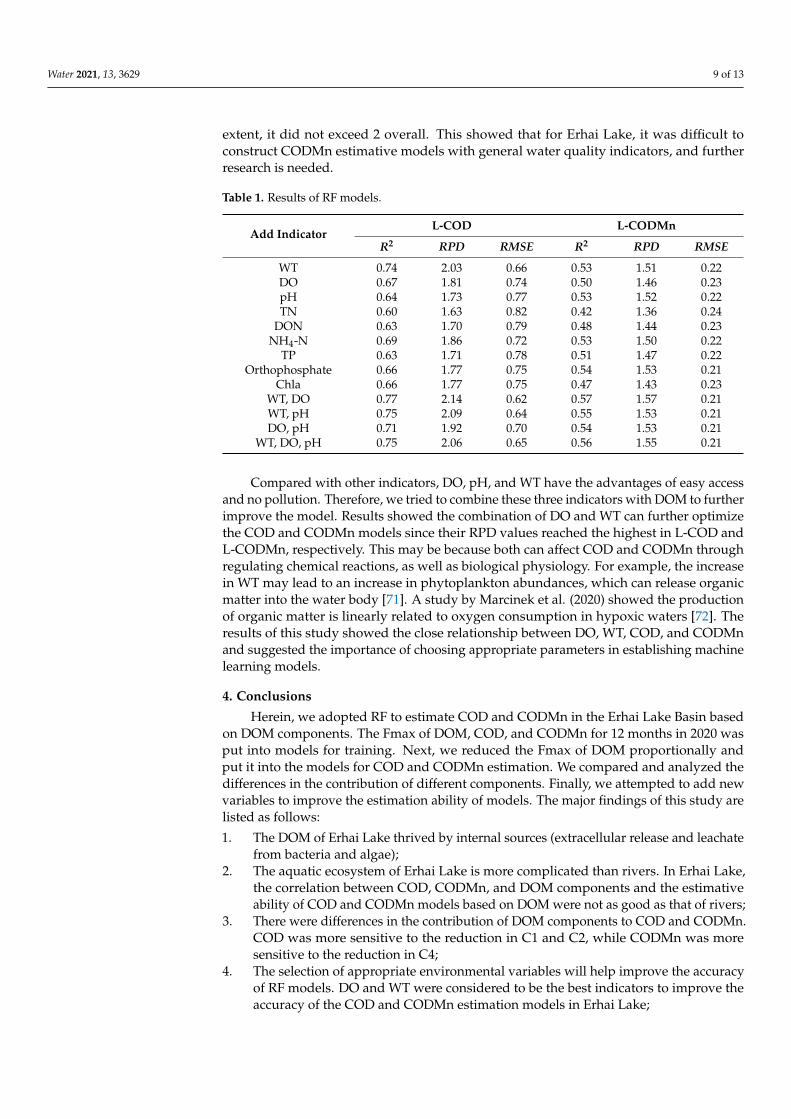
Although the COD and CODMn models based on DOM in Erhai Lake had certainestimative capabilities, compared with rivers, their estimation ability was poor. We adoptedthe concept of using additional indicators (WT, DO, pH, TN, DON, NH4-N, TP, orthophos-phate, and Chla) with the RF method to upgrade the accuracy of model estimation, asthis method has been proven effective [70]. For COD, the addition of WT made the modelstable and accurate (RPD value > 2), the addition of orthophosphate and NH4-N improvedthe prediction ability of models (1.4 < RPD value < 2) (Table 1). Although orthophosphateand NH4-N cannot be oxidized by potassium dichromate or potassium permanganate,our results may suggest that they can indirectly reflect the level of organic matter in thewater. For CODMn, the addition of indicators improved the estimative ability to a certain
Water 2021, 13, 3629 9 of 13
extent, it did not exceed 2 overall. This showed that for Erhai Lake, it was difficult toconstruct CODMn estimative models with general water quality indicators, and furtherresearch is needed.
Table 1. Results of RF models.
Add IndicatorL-COD L-CODMn
R2 RPD RMSE R2 RPD RMSE
WT 0.74 2.03 0.66 0.53 1.51 0.22DO 0.67 1.81 0.74 0.50 1.46 0.23pH 0.64 1.73 0.77 0.53 1.52 0.22TN 0.60 1.63 0.82 0.42 1.36 0.24
DON 0.63 1.70 0.79 0.48 1.44 0.23NH4-N 0.69 1.86 0.72 0.53 1.50 0.22
TP 0.63 1.71 0.78 0.51 1.47 0.22Orthophosphate 0.66 1.77 0.75 0.54 1.53 0.21
Chla 0.66 1.77 0.75 0.47 1.43 0.23WT, DO 0.77 2.14 0.62 0.57 1.57 0.21WT, pH 0.75 2.09 0.64 0.55 1.53 0.21DO, pH 0.71 1.92 0.70 0.54 1.53 0.21
WT, DO, pH 0.75 2.06 0.65 0.56 1.55 0.21
Compared with other indicators, DO, pH, and WT have the advantages of easy accessand no pollution. Therefore, we tried to combine these three indicators with DOM to furtherimprove the model. Results showed the combination of DO and WT can further optimizethe COD and CODMn models since their RPD values reached the highest in L-COD andL-CODMn, respectively. This may be because both can affect COD and CODMn throughregulating chemical reactions, as well as biological physiology. For example, the increasein WT may lead to an increase in phytoplankton abundances, which can release organicmatter into the water body [71]. A study by Marcinek et al. (2020) showed the productionof organic matter is linearly related to oxygen consumption in hypoxic waters [72]. Theresults of this study showed the close relationship between DO, WT, COD, and CODMnand suggested the importance of choosing appropriate parameters in establishing machinelearning models.
4. Conclusions
Herein, we adopted RF to estimate COD and CODMn in the Erhai Lake Basin basedon DOM components. The Fmax of DOM, COD, and CODMn for 12 months in 2020 wasput into models for training. Next, we reduced the Fmax of DOM proportionally andput it into the models for COD and CODMn estimation. We compared and analyzed thedifferences in the contribution of different components. Finally, we attempted to add newvariables to improve the estimation ability of models. The major findings of this study arelisted as follows:
1. The DOM of Erhai Lake thrived by internal sources (extracellular release and leachatefrom bacteria and algae);
2. The aquatic ecosystem of Erhai Lake is more complicated than rivers. In Erhai Lake,the correlation between COD, CODMn, and DOM components and the estimativeability of COD and CODMn models based on DOM were not as good as that of rivers;
3. There were differences in the contribution of DOM components to COD and CODMn.COD was more sensitive to the reduction in C1 and C2, while CODMn was moresensitive to the reduction in C4;
4. The selection of appropriate environmental variables will help improve the accuracyof RF models. DO and WT were considered to be the best indicators to improve theaccuracy of the COD and CODMn estimation models in Erhai Lake;
Water 2021, 13, 3629 10 of 13
5. As an integrated learning model composed of multiple learning, RF showed anadvantage to consider nonlinear relationships between COD, CODMn, and DOM,which proved its potential in hydrological monitoring.
The RF model showed accurate training and validation results for the estimation ofCOD and CODMn. This can reduce the experimental cost and time. Through an in-depthunderstanding of seasonal changes in COD, CODMn, and DOM, the differences in thecontribution of DOM components to COD and CODMn, which were conducive to takingtargeted response measures to potential organic pollution, so as to create a better waterquality ecological environment. Our research showed the potential of DOM and machinelearning in constructing water quality estimation models. In the future, we propose toinvest a wider range of monitoring data into existing models to improve stability and applymore water quality index estimation models to the pollution assessment system of theaquatic environment to reduce testing costs, speed up testing time, and avoid potentialpollutants problems.
Supplementary Materials: The following are available online at https://www.mdpi.com/article/10.3390/w13243629/s1, Figure S1. The sketch map of 5-fold cross validation. Figure S2. PARAFACmodel output showing fluorescence signatures of the four DOM components. Figure S3. Spatialdistribution of COD, CODMn and DOM in Summer. a: C1; b: C2; c: C3; d: C4; e: COD; f: CODMn.Figure S4. Sum of Fmax for C1-C4. Table S1. Spectral parameter description. Table S2. Values of theparameters contained in the grid search. Table S3. Characteristics of four PARAFAC components.Table S4. Seasonal Changes of COD, CODMn and DOM. Table S5. ANOVA of variables. Table S6.Correlation coefficient of COD, CODMn and DOM in rivers. Table S7. Correlation coefficient of COD,CODMn and DOM in lake. Table S8. COD response of DOM’s Fmax reduction. Table S9. CODMnresponse of DOM’s Fmax reduction.
Author Contributions: Conceptualization, Y.Z. and J.S.; methodology, Y.Z. and Z.S.; software, Z.S.;validation, Y.Z. and J.S.; investigation, T.S., D.L., M.X. and R.L.; resources, J.F.; data curation, T.S. andY.Z. writing—original draft preparation, Y.Z.; writing—review and editing, Y.Z. and J.S.; visualization,Y.Z.; supervision, J.S. and X.W.; project administration, J.F.; funding acquisition, J.S., J.F. and X.W.All authors have read and agreed to the published version of the manuscript.
Funding: This research was funded by the Ministry of Ecology and Environment of the People’sRepublic of China (The Yangtze River Eco-environmental Protection and Restoration Joint ResearchProject, No. 2019-LHYJ-01-0202-52) and the Bureau of Erhai Lake Management of the Dali PrefectureGovernment (General Research Fund, No. TPDL-2019-C211-B).
Data Availability Statement: The data sets analyzed during the current study are available fromYunnan Erhai Lake Ecosystem Observation and Research Station, but restrictions apply to theavailability of these data, which were used under license from Yunnan Erhai Lake EcosystemObservation and Research Station and therefore are not publicly available. Data are, however,available from the authors upon reasonable request.
Acknowledgments: The authors would like to acknowledge the support of the client project teamand their collaborative effort with the wider project team, which included Yunnan Erhai LakeEcosystem Observation and Research Station, Yunnan Dali Research Institute of Shanghai Jiao TongUniversity, Dali Erhai Lake Research Institute, and Yunnan Institute of Water and HydropowerEngineering Investigation, Design, and Research.
Conflicts of Interest: The authors declare they have no conflict of interest.
References1. Lefebvre, O.; Moletta, R. Treatment of organic pollution in industrial saline wastewater: A literature review. Water Res. 2006, 40,
3671–3682. [CrossRef] [PubMed]2. McCabe, K.M.; Smith, E.M.; Lang, S.Q.; Osburn, C.L.; Benitez-Nelson, C.R. Particulate and Dissolved Organic Matter in
Stormwater Runoff Influences Oxygen Demand in Urbanized Headwater Catchments. Environ. Sci. Technol. 2021, 55, 952–961.[CrossRef]
3. Voulvoulis, N.; Arpon, K.D.; Giakoumis, T. The EU Water Framework Directive: From great expectations to problems withimplementation. Sci. Total Environ. 2017, 575, 358–366. [CrossRef] [PubMed]
Water 2021, 13, 3629 11 of 13
4. Zhao, Y.; Song, K.; Li, S.; Ma, J.; Wen, Z. Characterization of CDOM from urban waters in Northern-Northeastern China usingexcitation-emission matrix fluorescence and parallel factor analysis. Environ. Sci. Pollut. Res. 2016, 23, 15381–15394. [CrossRef]
5. Abuzaid, N.S.; Al-Malack, M.H.; El-Mubarak, A.H. Alternative Method for Determination of the Chemical Oxygen Demand forColloidal Polymeric Wastewater. Bull. Environ. Contam. Toxicol. 1997, 59, 626–630. [CrossRef]
6. Kim, Y.C.; Sasaki, S.; Yano, K.; Ikebukuro, K.; Hashimoto, K.; Karube, I. Photocatalytic sensor for the determination of chemicaloxygen demand using flow injection analysis. Anal. Chim. Acta 2001, 432, 59–66. [CrossRef]
7. Saarinen, T.; Vuori, K.-M.; Alasaarela, E.; Kløve, B. Long-term trends and variation of acidity, CODMn and colour in coastal riversof Western Finland in relation to climate and hydrology. Sci. Total Environ. 2010, 408, 5019–5027. [CrossRef]
8. Cory, R.M.; McKnight, D.M. Fluorescence Spectroscopy Reveals Ubiquitous Presence of Oxidized and Reduced Quinones inDissolved Organic Matter. Environ. Sci. Technol. 2005, 39, 8142–8149. [CrossRef]
9. Stedmon, C.; Markager, S.; Bro, R. Tracing dissolved organic matter in aquatic environments using a new approach to fluorescencespectroscopy. Mar. Chem. 2003, 82, 239–254. [CrossRef]
10. Coble, P.G.; Green, S.; Blough, N.V.; Gagosian, R.B. Characterization of dissolved organic matter in the Black Sea by fluorescencespectroscopy. Nature 1990, 348, 432–435. [CrossRef]
11. Warner, I.M.; Christian, G.D.; Davidson, E.R.; Callis, J.B. Analysis of multicomponent fluorescence data. Anal. Chem. 1977, 49,564–573. [CrossRef]
12. Mcknight, D.M.; Boyer, E.; Westerhoff, P.K.; Doran, P.T.; Kulbe, T.; Andersen, D. Spectrofluorometric characterization of dissolvedorganic matter for indication of precursor organic material and aromaticity. Limnol. Oceanogr. 2001, 46, 38–48. [CrossRef]
13. Morgane, D.; Retelletti, B.S.; Rafael, G.-A. Characterization of aquatic organic matter: Assessment, perspectives and researchpriorities. Water Res. 2019, 163, 114908.
14. Wang, S.; Zhang, B.; Fu, Z.; Guo, Y.; Jiang, X. Effects of the virgin forests to the dissolved organic matters in small forestedwatershed: A case study of the Tangwang River in Northeast China. Environ. Sci. Pollut. Res. 2021, 28, 39268–39281. [CrossRef][PubMed]
15. Yao, X.; Zhang, Y.; Zhu, G.; Qin, B.; Feng, L.; Cai, L.; Gao, G. Resolving the variability of CDOM fluorescence to differentiate thesources and fate of DOM in Lake Taihu and its tributaries. Chemosphere 2010, 82, 145–155. [CrossRef]
16. Zhang, Y.; Pulliainen, J.; Koponen, S.; Hallikainen, M. Application of an empirical neural network to surface water qualityestimation in the Gulf of Finland using combined optical data and microwave data. Remote Sens. Environ. 2002, 81, 327–336.[CrossRef]
17. Lary, D.; Alavi, A.H.; Gandomi, A.; Walker, A.L. Machine learning in geosciences and remote sensing. Geosci. Front. 2016, 7, 3–10.[CrossRef]
18. Ghahramani, Z. Probabilistic machine learning and artificial intelligence. Nature 2015, 521, 452–459. [CrossRef] [PubMed]19. Peterson, K.T.; Sagan, V.; Sidike, P.; Cox, A.L.; Martinez, M. Suspended Sediment Concentration Estimation from Landsat Imagery
along the Lower Missouri and Middle Mississippi Rivers Using an Extreme Learning Machine. Remote Sens. 2018, 10, 1503.[CrossRef]
20. Ji, N.; Wang, S.; Zhang, L. Characteristics of dissolved organic phosphorus inputs to freshwater lakes: A case study of Lake Erhai,southwest China. Sci. Total Environ. 2017, 601–602, 1544–1555. [CrossRef] [PubMed]
21. Guo, H.; Liu, L.; Huang, G.; Fuller, G.; Zou, R.; Yin, Y. A system dynamics approach for regional environmental planning andmanagement: A study for the Lake Erhai Basin. J. Environ. Manag. 2001, 61, 93–111. [CrossRef] [PubMed]
22. ISO 5667-6:2016. Water Quality—Sampling Part 6: Guidance on Sampling of Rivers and Streams; International Standard Iso: Geneva,Switzerland, 2016.
23. ISO 5667-5:1991. Water Quality—Sampling Part 5: Guidance on Sampling of Drinking Water and Water Used for Food and BeverageProcessing; International Standard Iso: Geneva, Switzerland, 1991.
24. Greenberg, A.E.; Trussell, R.R.; Clesceri, L.S.; AWW Association. Standard methods for the examination of water and wastewater:Supplement to the sixteenth edition. Am. J. Public Health Nations Health 2005, 56, 387.
25. Adams, V.D. Water and Wastewater Examination Manual; CRC Press LLC: Boca Raton, FL, USA, 1990.26. Xu, B.; Li, J.; Huang, Q.; Gong, Q.; Li, L. Impacts of land use patterns and typhoon-induced heavy rainfall event on dissolved
organic matter properties in the South Tiaoxi River, China. Environ. Earth Sci. 2016, 75, 632. [CrossRef]27. Lyu, J.C.; Lin, G.H.; Fan, Z.Y.; Lin, W.X.; Dai, Z. Suitable plant combinations for ecological floating beds in eutrophic subtropical
coastal wetlands under different salinities: Experimental evidences. Int. J. Environ. Sci. Technol. 2020, 17, 4505–4516. [CrossRef]28. Jin, X.C.; Tu, Q.Y. The Standard Methods for Observation and Analysis in Lake Eutrophication; China Environmental Science Press:
Beijing, China, 1990. (In Chinese)29. Murphy, K.R.; Butler, K.D.; Spencer, R.G.M.; Stedmon, C.A.; Boehme, J.R.; Aiken, G.R. Measurement of Dissolved Organic Matter
Fluorescence in Aquatic Environments: An Interlaboratory Comparison. Environ. Sci. Technol. 2010, 44, 9405–9412. [CrossRef]30. Parlanti, E.; Wörz, K.; Geoffroy, L.; Lamotte, M. Dissolved organic matter fluorescence spectroscopy as a tool to estimate biological
activity in a coastal zone submitted to anthropogenic inputs. Org. Geochem. 2000, 31, 1765–1781. [CrossRef]31. Ohno, T. Fluorescence inner-filtering correction for determining the humification index of dissolved organic matter. Environ. Sci.
Technol. 2002, 36, 742–746. [CrossRef] [PubMed]32. Huguet, A.; Vacher, L.; Relexans, S.; Saubusse, S.; Froidefond, J.; Parlanti, E. Properties of fluorescent dissolved organic matter in
the Gironde Estuary. Org. Geochem. 2008, 40, 706–719. [CrossRef]
Water 2021, 13, 3629 12 of 13
33. Stedmon, C.A.; Bro, R. Characterizing dissolved organic matter fluorescence with parallel factor analysis: A tutorial.Limnol. Oceanogr. Methods 2008, 6, 572–579. [CrossRef]
34. Larsson, T.; Wedborg, M.; Turner, D. Correction of inner-filter effect in fluorescence excitation-emission matrix spectrometry usingRaman scatter. Anal. Chim. Acta 2007, 583, 357–363. [CrossRef]
35. Murphy, K.R.; Stedmon, C.A.; Graeber, D.; Bro, R. Fluorescence spectroscopy and multi-way techniques. PARAFAC. Anal. Methods2013, 5, 6557–6566. [CrossRef]
36. Murphy, K.R.; Stedmon, C.A.; Wenig, P.; Bro, R. OpenFluor—An online spectral library of auto-fluorescence by organic compoundsin the environment. Anal. Methods 2013, 6, 658–661. [CrossRef]
37. Breiman, L. Random Forests. Mach. Learn. 2001, 45, 5–32. [CrossRef]38. Gislason, P.O.; Benediktsson, J.A.; Sveinsson, J.R. Random Forests for land cover classification. Pattern Recognit. Lett. 2006, 27,
294–300. [CrossRef]39. Cha, D.; Park, S.; Kim, M.S.; Kim, T.; Hong, S.W.; Cho, K.H.; Lee, C. Prediction of Oxidant Exposures and Micropollutant
Abatement during Ozonation Using a Machine Learning Method. Environ. Sci. Technol. 2020, 55, 709–718. [CrossRef]40. Biau, G.; Scornet, E. A random forest guided tour. TEST 2016, 25, 197–227. [CrossRef]41. Boulesteix, A.-L.; Janitza, S.; Kruppa, J.; König, I.R. Overview of random forest methodology and practical guidance with
emphasis on computational biology and bioinformatics. Wiley Interdiscip. Rev. Data Min. Knowl. Discov. 2012, 2, 493–507.[CrossRef]
42. Ziegler, A.; Koenig, I.R. Mining data with random forests: Current options for real-world applications. Wiley Interdiscip. Rev. DataMin. Knowl. Discov. 2014, 4, 55–63. [CrossRef]
43. Williams, C. Variables Affecting Near-Infrared Reflectance Spectroscopic Analysis. In Near-Infrared Technology in The Agriculturaland Food Industries; CiNii: Tokyo, Japan, 1987; pp. 143–166.
44. Chang, C.-W.; Laird, D.A.; Mausbach, M.J.; Hurburgh, C.R. Near-Infrared Reflectance Spectroscopy-Principal ComponentsRegression Analyses of Soil Properties. Soil Sci. Soc. Am. J. 2001, 65, 480–490. [CrossRef]
45. Amaral, V.; Romera-Castillo, C.; Forja, J. Dissolved Organic Matter in the Gulf of Cádiz: Distribution and Drivers of Chromophoricand Fluorescent Properties. Front. Mar. Sci. 2020, 7, 126. [CrossRef]
46. Fellman, J.B.; Hood, E.; Edwards, R.T.; D′Amore, D.V. Changes in the concentration, biodegradability, and fluorescent propertiesof dissolved organic matter during stormflows in coastal temperate watersheds. J. Geophys. Res. Space Phys. 2009, 114. [CrossRef]
47. Lee, S.-A.; Kim, G. Sources, fluxes, and behaviors of fluorescent dissolved organic matter (FDOM) in the Nakdong River Estuary,Korea. Biogeosciences 2018, 15, 1115–1122. [CrossRef]
48. Hood, E.; Gooseff, M.; Johnson, S.L. Changes in the character of stream water dissolved organic carbon during flushing in threesmall watersheds, Oregon. J. Geophys. Res. Space Phys. 2006, 111. [CrossRef]
49. Yang, L.; Guo, W.; Chen, N.; Hong, H.; Huang, J.; Xu, J.; Huang, S. Influence of a summer storm event on the flux and compositionof dissolved organic matter in a subtropical river, China. Appl. Geochem. 2013, 28, 164–171. [CrossRef]
50. Murakami, M.; Sato, N.; Anegawa, A.; Nakada, N.; Harada, A.; Komatsu, T.; Takada, H.; Tanaka, H.; Ono, Y.; Furumai, H.Multiple evaluations of the removal of pollutants in road runoff by soil infiltration. Water Res. 2008, 42, 2745–2755. [CrossRef][PubMed]
51. Lee, J.; Lee, S.; Yu, S.; Rhew, D. Relationships between water quality parameters in rivers and lakes: BOD5, COD, NBOPs, andTOC. Environ. Monit. Assess. 2016, 188, 252. [CrossRef]
52. Zhang, Y.-L.; Yang, L.-Y.; Qin, B.-Q.; Gao, G.; Luo, L.-C.; Zhu, G.-W.; Liu, M.-L. Spatial distribution of COD and the correlationswith other parameters in the northern region of Lake Taihu. Huanjing Kexue 2008, 29, 1457–1462. [PubMed]
53. Zhao, Q.; Mao, W. The Distribution of Phytoplankton in Yanming Lake Wetland and Its Response to Water Quality Characteristics.Ecol. Environ. Sci. 2020, 29, 1654–1661.
54. Geng, M.; Niu, Y.; Liao, X.; Wang, K.; Yang, N.; Qian, Z.; Li, F.; Zou, Y.; Chen, X.; Deng, Z.; et al. Inter-annual and intra-annualvariations in water quality and its response to water-level fluctuations in a river-connected lake, Dongting Lake, China. Environ.Sci. Pollut. Res. 2021, 28. in press. [CrossRef]
55. Li, F.; Qiu, Z.; Zhang, J.; Liu, C.; Cai, Y.; Xiao, M.; Zhu, L. Temporal variation of major nutrients and probabilistic eutrophicationevaluation based on stochastic-fuzzy method in Honghu Lake, Middle China. Sci. China Ser. E Technol. Sci. 2019, 62, 417–426.[CrossRef]
56. Han, J.; Bae, Y.-J.; An, K.-G. Spatial and Temporal Variability of Water Quality in Geum-River Watershed and Their InfluInfluencesby Landuse Pattern. Korean J. Ecol. Environ. 2010, 43, 385–399.
57. Qi, W.; Lu, S.; Yang, L. Relationship between removal and transformation of macromolecular weight organics during watersupply treatment process by contrasting COD and CODMn. Technol. Water Treat. 2006, 32, 39–42.
58. Jia, L.; Jin, L.; Wan, Y. Research on the Correlation between COD_(Cr) and COD_(Mn) in Sewage Wastewater in Huaihe RiverBasin. Water Resour. Prot. 1998, 4, 24–27.
59. Tian, J.J.; Hu, Y.G.; Zhang, J. Chemiluminescence detection of permanganate index (CODMn)bya luminol-KMnO4 based reaction.J. Environ. Sci. 2008, 20, 252–256. [CrossRef]
60. Dormann, C.F.; Elith, J.; Bacher, S.; Buchmann, C.; Carl, G.; Carré, G.; Marquéz, J.R.G.; Gruber, B.; Lafourcade, B.; Leitão, P.J.; et al.Collinearity: A review of methods to deal with it and a simulation study evaluating their performance. Ecography 2013, 36, 27–46.[CrossRef]
Water 2021, 13, 3629 13 of 13
61. Strobl, C.; Boulesteix, A.-L.; Kneib, T.; Augustin, T.; Zeileis, A. Conditional variable importance for random forests. BMC Bioinform.2008, 9, 307. [CrossRef]
62. Tyralis, H.; Papacharalampous, G.; Langousis, A. A Brief Review of Random Forests for Water Scientists and Practitioners andTheir Recent History in Water Resources. Water 2019, 11, 910. [CrossRef]
63. Zhang, C.; Ma, Y. Ensemble Machine Learning: Methods and Applications; Springer Science & Business Media: Berlin/Heidelberg,Germany, 2012; 329p.
64. Diaz-Uriarte, R.; de Andres, S.A. Gene selection and classification of microarray data using random forest. BMC Bioinform. 2006,7, 3. [CrossRef]
65. Yu, H.X.; Luo, X.; Ma, L.; Tan, W. Effects of the Constructed Wetland on Dissolved Organic Matter Properties in the DrainageChannel of Domestic Sewage Treatment Plant in Winter. In Proceedings of the 2nd International Conference on Civil Engineering,Environment Resources and Energy Materials, Changsha, China, 18–20 September 2020.
66. Murphy, K.R.; Ruiz, G.M.; Dunsmuir, W.T.M.; Waite, T.D. Optimized Parameters for Fluorescence-Based Verification of BallastWater Exchange by Ships. Environ. Sci. Technol. 2006, 40, 2357–2362. [CrossRef]
67. Gu, Z.P.; Chen, W.; Wang, F.; Li, Q. Transformation and degradation of recalcitrant organic matter in membrane bioreactorleachate effluent by the O-3/H2O2 process. Environ. Sci. Water Res. Technol. 2019, 5, 1748–1757. [CrossRef]
68. Peleato, N.M.; Sidhu, B.S.; Legge, R.L.; Andrews, R.C. Investigation of ozone and peroxone impacts on natural organic mattercharacter and biofiltration performance using fluorescence spectroscopy. Chemosphere 2017, 172, 225–233. [CrossRef] [PubMed]
69. Yan, C.; Sheng, Y.; Ju, M.; Ding, C.; Li, Q.; Luo, Z.; Ding, M.; Nie, M. Relationship between the characterization of natural colloidsand metal elements in surface waters. Environ. Sci. Pollut. Res. 2020, 27, 31872–31883. [CrossRef] [PubMed]
70. Sakamoto, T. Incorporating environmental variables into a MODIS-based crop yield estimation method for United States cornand soybeans through the use of a random forest regression algorithm. ISPRS J. Photogramm. Remote Sens. 2020, 160, 208–228.[CrossRef]
71. Huber, V.; Wagner, C.; Gerten, D.; Adrian, R. To bloom or not to bloom: Contrasting responses of cyanobacteria to recent heatwaves explained by critical thresholds of abiotic drivers. Oecologia 2012, 169, 245–256. [CrossRef] [PubMed]
72. Marcinek, S.; Santinelli, C.; Cindric, A.M.; Evangelista, V.; Gonnelli, M.; Layglon, N.; Mounier, S.; Lenoble, V.; Omanovic, D.Dissolved organic matter dynamics in the pristine Krka River estuary (Croatia). Mar. Chem. 2020, 225, 103848. [CrossRef]