Chlorophyll retrieval with MERIS Case-2-Regional in perialpine lakes
Rapid field estimation of biochemical oxygen demandin a subtropical eutrophic urban lake with chlorophylla fluorescence
Zhen Xu & Y. Jun Xu
Received: 5 May 2014 /Accepted: 17 November 2014# Springer International Publishing Switzerland 2014
Abstract Development of a technique for rapid fieldestimation of biochemical oxygen demand (BOD) isnecessary for cost-effective monitoring and manage-ment of urban lakes. While several studies reported theusefulness of laboratory tryptophan-like fluorescencetechnique in predicting 5-day BOD (BOD5) of waste-water and leachates, little is known about the predict-ability of field chlorophyll fluorescence measurementsfor BOD of urban lake waters that are constantly ex-posed to the mixture of chemical compounds. This studywas conducted to develop a numeric relationship be-tween chlorophyll a fluorescence and BOD for a eutro-phic urban lake that is widely representative of lakewater conditions in the subtropical southern USA.FromOctober 2012 to September 2013, in situ measure-ments at the studied lake were made every 2 weeks onchlorophyll a fluorescence and other water quality pa-rameters including water temperature, pH, dissolvedoxygen, and specific conductivity. Water samples weretaken for 5-day BOD and 10-day BOD (BOD10) analy-sis with and without incubation. The results showed aclear seasonal trend of both BOD measurements beinghigh during the summer and low during the winter.There was a linear, positive relationship between chlo-rophyll a fluorescence and BOD, and the relationshipappeared to be stronger with the 10-day BOD (r2=0.83)than with the 5-day BOD (r2=0.76). BOD dropped each
day with declining chlorophyll a fluorescence, suggest-ing that die-off of phytoplankton has been the mainconsumption of oxygen in the studied lake. Ambientconditions such as rainfall and water temperature mayhave partially affected BOD variation.
Keywords Water quality monitoring . Biochemicaloxygen demand . Chlorophyll a . Field fluorescence .
Water quality . Eutrophication
Introduction
In the USA, about 44 % of all lakes and 59 % of man-made lakes are classified to be in poor biological con-dition (US EPA 2009). The main reason for the waterquality degradation has been attributed to excess nutri-ents and organic inputs to the lake water bodies, whichcan lead to algal bloom and hence dissolved oxygen(DO) depletion (Carpenter et al. 1998). This could beespecially serious for urban lakes where the large im-pervious surface of the urban environment increasesnutrient runoff and waste discharges with oxygen-consuming chemicals (Whitehead et al. 2009).
Oxygen is needed for aquatic life, and the amount ofoxygen dissolved in a water body is therefore an impor-tant water quality parameter. Low DO has been identi-fied as a serious water quality problem (Caraco and Cole2002). When DO falls below 5 mg/L, sensitive speciesof fish and invertebrates can be negatively impacted,and at DO levels below 2 mg/L, an oxygen depletionstage known as hypoxia, most fish species could be
Environ Monit Assess (2015) 187:4171DOI 10.1007/s10661-014-4171-1
Z. Xu :Y. J. Xu (*)School of Renewable Natural Resources, Louisiana StateUniversity Agricultural Center,Baton Rouge, LA 70803, USAe-mail: [email protected]
negatively impacted (Frodge et al. 1990). Hypoxia inwater bodies is a growing problem worldwide that isassociated with negative impacts not only on sensitivespecies of fish and invertebrates, but also on metal,nitrogen, and phosphorus transformations (Kemp et al.1990, Breitburg 1992, Hamilton et al. 1997, Gray et al.2002, Harrison et al. 2005, Stevens et al. 2006).
One factor leading to low DO is organic pollution thatcan adversely affect the health of the aquatic system byconsuming a large amount of DO in water, resulting inhypoxic conditions. Normally, organic consumption ofDO in an aquatic system is presented as biochemicaloxygen demand (BOD). BOD measures the amount ofoxygen consumed within a certain period of time bybiodegradable organic matter in a water column.Therefore, BOD of an aquatic system is an importantparameter frequently used in the assessment of waterquality, as well as for developing management strategiesfor water quality protection (Basant et al. 2010). BODmeasurements are commonly given as a 5- to 20-day test,with a 5-day test being the most common period, alsoknown as BOD5. As a laboratory-based biodegradationtest, it delays analysis of potential pollution events. IfBOD can be estimated rapidly using a real-time monitor-ing technique, it would be of great usefulness to environ-mental managers and regulators in predicting the degreeof organic pollution and taking prompt actions.
Fluorometric method has long been used to investi-gate chlorophylls’ reaction to toxic chemical com-pounds (e.g., Christoffers and Ernst 1983, Brack andFrank 1998). Several recent studies have used fluores-cence techniques as a portable tool for rapid determina-tion of the presence of biodegradable organic matter. Itis a rapid testing technique that does not use chemicalreagents and requires little sample preparation (Hudsonet al. 2008). Fluorescence spectroscopy, such as excita-tion–emission matrix (EEM) spectroscopy, has beenused in several laboratory studies on dissolved organicmatter in natural waters including marine waters (Coble1996), rivers (Patel-Sorrentino et al. 2002, Hudson et al.2008), ground waters (Baker and Genty 1999), andlakes (Cammack et al. 2004). Some researchers testedthe possibility of using fluorescence as a surrogate forBOD (Cârstea et al., 2012). This method has beensuccessfully applied to identify microbial communitiesin water and to establish the correlation between a waterbody’s BOD5 and the microbial activity in it (Baker andInverarity 2004, Hudson et al. 2008, Kwak et al. 2013).In the recent decade, studies have been conducted on the
relationship between BOD5 and tryptophan-like fluores-cence (λexCitation=280 nm, λemission 350 nm) for waterscollected from rivers (Comber et al. 1996, Baker andInverarity 2004, Hudson et al. 2008), sewage (Comberet al. 1996, Reynolds and Ahmad 1997, Ahmad andReynolds 1999, Reynolds 2002, Baker and Curry 2004,Hudson et al. 2008), and industrial effluents (Comberet al. 1996, Hudson et al. 2008). Some researchers (e.g.,Kwak et al. 2013) developed an algorithm to predictBOD5 of water samples using a fluorescence reading.Up to now, this approach has been only applied in labo-ratory settings mostly to wastewater samples with a widerange of BOD5 concentrations (Kwak et al. 2013).
Many urban water bodies are monitored by localcommunities and volunteers. A rapid BOD testingmethod with fluorescence can be not only time- andcost-saving, but it offers a tool for predicting potentialoxygen depletion. To our knowledge, no report exists ona numeric relation between BOD and field chlorophyll afluorescence (λexCitation=460 nm, λemission 685 nm)measurements. Many urban lakes receive large quanti-ties of storm runoff from turf and paved surfaces. Insome cases, the turf has received fertilizer treatments.Some of the fertilizer, along with grass clippings andleaf litter, may be mobilized due to rainfall or irrigationand can then flow into nearby water bodies. Therefore,urban lakes can be especially affected by organic pol-lutants or the eutrophication caused by them.Determining BOD with field fluorescence measure-ments can be a cost-effective tool for rapid assessmentof water quality.
This study was conducted in a shallow, eutrophicurban lake over the period from October 2012 toSeptember 2013. The objectives of this study wereto (1) assess trends of BOD, chlorophyll fluores-cence, and chlorophyll a concentration in the lakeenvironment; (2) develop a numeric relationshipbetween BOD and fluorescence; and (3) test otherambient factors that may affect BOD in the similarenvironment.
Methods
Site description
The study was conducted at University Lake, located inBaton Rouge, LA, USA (latitude 30° 24′ 50″ N; longi-tude 91° 10′ 00″ W) on the Louisiana State University
4171, Page 2 of 14 Environ Monit Assess (2015) 187:4171
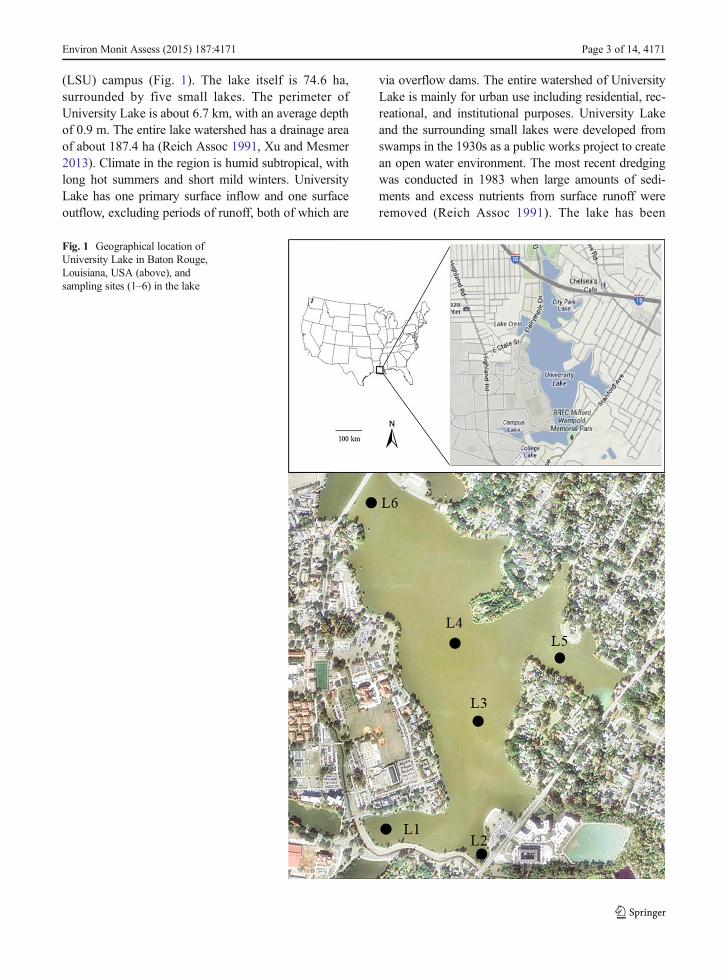
(LSU) campus (Fig. 1). The lake itself is 74.6 ha,surrounded by five small lakes. The perimeter ofUniversity Lake is about 6.7 km, with an average depthof 0.9 m. The entire lake watershed has a drainage areaof about 187.4 ha (Reich Assoc 1991, Xu and Mesmer2013). Climate in the region is humid subtropical, withlong hot summers and short mild winters. UniversityLake has one primary surface inflow and one surfaceoutflow, excluding periods of runoff, both of which are
via overflow dams. The entire watershed of UniversityLake is mainly for urban use including residential, rec-reational, and institutional purposes. University Lakeand the surrounding small lakes were developed fromswamps in the 1930s as a public works project to createan open water environment. The most recent dredgingwas conducted in 1983 when large amounts of sedi-ments and excess nutrients from surface runoff wereremoved (Reich Assoc 1991). The lake has been
Fig. 1 Geographical location ofUniversity Lake in Baton Rouge,Louisiana, USA (above), andsampling sites (1–6) in the lake
Environ Monit Assess (2015) 187:4171 Page 3 of 14, 4171
reported as eutrophic, as its water showed high concen-trations of nitrogen and phosphorus (Mesmer, 2010).
Field measurements
In this study, six sampling locations were identified torepresent the lake (Fig. 1). Location 1 was near a heavytraffic road. Location 2 was at a pier near the outflowdam of the lake next to a parking area. Locations 3 and 4generally represented the deep water area of the lake.Location 5 was the only site at the eastern part of thelake, and location 6 was near the inflow of the lake,close to a two-lane busy highway.
From October 2012 to September 2013, biweeklyfield trips were made to conduct in situ measurementson fluorescence and water quality at the six samplingsites. Fluorescence was measured with an AquaFluor®handheld fluorometer (Turner Designs, CA, USA) andwas reported as arbitrary fluorescence units (AFUs). AnAFU is a unit of measurement used for in vivo chloro-phyll analysis which is the detection of chlorophyll inlive algal cells in water. In this technique, the excitationlight from the fluorometer passes through the untreatedsample of water, causing the chlorophyll within the cellsto fluorescence. Then, the fluorometer reports the nor-malized variable fluorescence after a 5-s scan.
During each field trip, a set of in situ water qualityparameters was measured at the six sites using an YSI556 multi-probe meter (YSI Inc., Yellow Springs, OH,USA). The parameters included water temperature, pH,conductivity, and DO. In addition, a 2000-mL watersample was collected from each site and the sampleswere stored in a cooler with wet ice during the transpor-tation for later laboratory analysis. At three near-shoresites (i.e., L2, L5, and L6; Fig. 1), measurements weretaken about 3 m from the shoreline on the lake bottomand water samples were taken by a sampler at about10 cm below water surface. For the three far-shore sites(i.e., L1, L3, and L4; Fig. 1), water samples were col-lected using a kayak at about 10 cm below water surfaceand measurements were taken at 35 cm below thesurface.
Laboratory measurements
Water samples were taken from the six locations in thelake and at different dates to develop a relationshipbetween fluorometer reading and chlorophyll a concen-tration. Extraction and analysis of chlorophyll a from
the water samples were done at the WetlandBiogeochemis t ry Analyt ica l Services , LSUDepartment of Oceanography and Coastal Sciences,using a Turner Designs TD-700 Fluorometer (TurnerDesigns, Sunnyvale, CA, USA) following the protocolsof Arar and Collins (1997). Extracted chlorophyll con-centrations (in μg/L) were then correlated with in vivochlorophyll fluorescence (AFU) from the AquaFluor®handheld fluorometer. A strong linear relationship hasbeen found for the studied lake between in vivo chloro-phyll fluorescence (AFU) and extracted chlorophyll aconcentration (Chl-α, in μg/L), which can be given asfollows:
Chl‐a ¼ 0:3944 �AFUþ 1:0039 r2 ¼ 0:9827� �
ð1ÞWater samples from each sampling date were ana-
lyzed at the Watershed Hydrology Laboratory, LSUSchool of Renewable Natural Resources, for 5- and10-day BODs, reported as BOD5 and BOD10, respec-tively. Laboratory procedure followed a modified ver-sion of section 5210B of APHA’s “Standard Methodsfor the Examination of Water and Wastewater” (APHA2005). The modification to the standard method includ-ed a daily sample re-aeration if DO concentration wasbelow 3.00 mg/L due to no dilution being performed.BOD samples were stored at room temperature (20±2 °C) in an incubator (Thermo Scientific Imperial IIIStandard Incubator, Thermal Scientific Inc., TX, USA).In the laboratory, DO of all BOD samples was measuredwith an YSI 5100 DO meter (YSI Inc., Yellow Springs,OH, USA).
Starting from June 2013, BOD was measured everyday to determine the reduction rate in biochemical oxy-gen consumption of the lake water samples. At the sametime, additional samples were also used for a dailyfluorescence measurement to assess the relationshipbetween oxygen consumption and the change in waterfluorescence; these samples were stored in separateBOD bottles.
Ambient data collection and analysis
To document ambient lake water conditions, daily cli-matic records from a near-by weather station (Ben HurStation, the Louisiana Agriclimatic Information System)were gathered for the study period. The weather station islocated approximately 5 km east of the study site, and the
4171, Page 4 of 14 Environ Monit Assess (2015) 187:4171
weather records included daily rainfall, maximum airtemperature, and minimum air temperature (Table 1).
Regression analysis was employed to determine therelationship between biochemical oxygen demand (inmg/L) and in situ fluorescence in AFU. The generalequation for data collected from all six sites is given asfollows:
BOD ¼ bþ k �AFU ð2Þwhere b and k are the regression parameters. Best fittingparameters were found with the SAS StatisticalSoftware package (SAS Institute, Cary, NC). All statis-tical analyses were performed.
Results and discussion
Seasonality of fluorescence and chlorophylla concentration
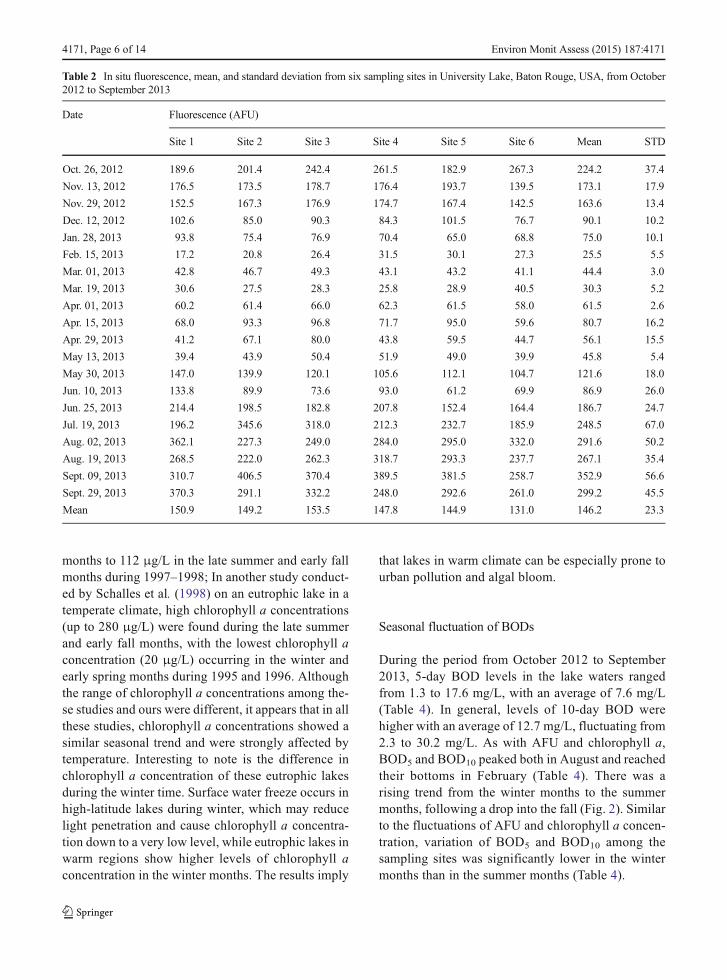
From October 2012 to September 2013, the studiedshallow urban lake showed a large variation in thechlorophyll a fluorescence, with a range from 17.2 to406.5 AFU (Table 2). The fluorometric unit appearedhighest in September and lowest in February, displayinga trend of AFU rising from the winter months to thesummer months and then declining from the fall into thewinter (Table 2). Considerable variation in AFU existedalso among the sampling sites, and the variation wassignificantly lower in the winter months than in thesummer months (Table 2).
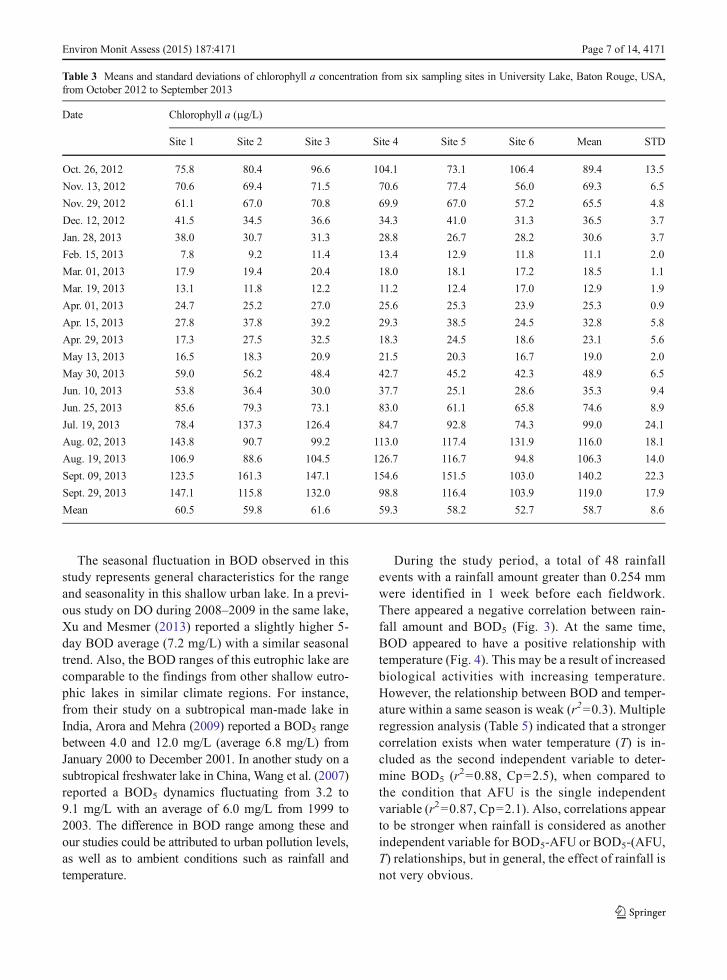
Concurrently, chlorophyll a concentrations fluctuatedgreatly over the year, ranging from 7.8 to 161.3 μg/L withan average of 47.5 μg/L during the studied period(Table 3). The highest concentration occurred inSeptember 2013, and the lowest was found in February
2013 (Table 3). Chlorophyll a concentration was con-sistently low during the late winter and early spring,rose up rapidly in the late spring, and reached the peakin the late summer blooms following a decline in latefall (Table 3). Variation in chlorophyll a concentrationwas significantly lower in the late winter and earlyspring and was significantly higher in the late summerblooms (Table 3).
Based on a 1-year monitoring of nutrient inputsfrom stormwater into University Lake, Mesmer(2010) reported an average concentration of total ni-trogen (TN, sum of organic nitrogen + nitrate nitrogen+ nitrite nitrogen + ammonia nitrogen) of 3.14 mg/Land an average concentration of total phosphorus (TP)of 0.383 mg/L. Based on both Carlson’s Trophic StateIndex for lake waters (1977) and the classification forstream trophic state proposed by Dodds et al. (1998),this shallow urban lake should be considered as eu-trophic. When classifying trophic state of lake waters,although TN, TP, and Secchi depth are considered,priority is often given to the estimation associatedwith chlorophyll a since it is the most accurate pa-rameter for predicting algal biomass (Gregor andMarsalek 2004). Based on Carlson’s TSI, the bound-ary value of chlorophyll a between eutrophic andhypereutrophic is 56 μg/L. Accordingly, UniversityLake was hypereutrophic throughout the summer andfall, as the chlorophyll a concentrations during theperiod were constantly above 66 μg/L.
The seasonality of chlorophyll a concentrationassessed in this study is in agreement with findingsfrom other studies conducted in temperate andsubarctic shallow eutrophic lakes. For example, in astudy conducted by French and Petticrew (2007) onshallow eutrophic lakes located in subarctic northcentral British Columbia, chlorophyll a concentra-tions ranged from <1 μg/L in the winter and spring
Table 1 Monthly weather data for University Lake in Baton Rouge, USA, from July 2008 to June 2009 and from October 2012 toSeptember 2013
Parameters Mean Max Min Std.
2008–2009 Monthly max air temp. (°C) 25.9 33.3 17.9 5.6
Monthly min air temp. (°C) 14.1 22.4 5.4 6.5
Monthly precipitation (mm) 103.9 230.9 11.2 70.5
2012–2013 Monthly max air temp. (°C) 25.0 32.3 17.6 5.9
Monthly min air temp. (°C) 13.0 22.7 1.2 7.4
Monthly precipitation (mm) 156.4 397.0 13.7 98.4
Environ Monit Assess (2015) 187:4171 Page 5 of 14, 4171
months to 112 μg/L in the late summer and early fallmonths during 1997–1998; In another study conduct-ed by Schalles et al. (1998) on an eutrophic lake in atemperate climate, high chlorophyll a concentrations(up to 280 μg/L) were found during the late summerand early fall months, with the lowest chlorophyll aconcentration (20 μg/L) occurring in the winter andearly spring months during 1995 and 1996. Althoughthe range of chlorophyll a concentrations among the-se studies and ours were different, it appears that in allthese studies, chlorophyll a concentrations showed asimilar seasonal trend and were strongly affected bytemperature. Interesting to note is the difference inchlorophyll a concentration of these eutrophic lakesduring the winter time. Surface water freeze occurs inhigh-latitude lakes during winter, which may reducelight penetration and cause chlorophyll a concentra-tion down to a very low level, while eutrophic lakes inwarm regions show higher levels of chlorophyll aconcentration in the winter months. The results imply
that lakes in warm climate can be especially prone tourban pollution and algal bloom.
Seasonal fluctuation of BODs
During the period from October 2012 to September2013, 5-day BOD levels in the lake waters rangedfrom 1.3 to 17.6 mg/L, with an average of 7.6 mg/L(Table 4). In general, levels of 10-day BOD werehigher with an average of 12.7 mg/L, fluctuating from2.3 to 30.2 mg/L. As with AFU and chlorophyll a,BOD5 and BOD10 peaked both in August and reachedtheir bottoms in February (Table 4). There was arising trend from the winter months to the summermonths, following a drop into the fall (Fig. 2). Similarto the fluctuations of AFU and chlorophyll a concen-tration, variation of BOD5 and BOD10 among thesampling sites was significantly lower in the wintermonths than in the summer months (Table 4).
Table 2 In situ fluorescence, mean, and standard deviation from six sampling sites in University Lake, Baton Rouge, USA, from October2012 to September 2013
Date Fluorescence (AFU)
Site 1 Site 2 Site 3 Site 4 Site 5 Site 6 Mean STD
Oct. 26, 2012 189.6 201.4 242.4 261.5 182.9 267.3 224.2 37.4
Nov. 13, 2012 176.5 173.5 178.7 176.4 193.7 139.5 173.1 17.9
Nov. 29, 2012 152.5 167.3 176.9 174.7 167.4 142.5 163.6 13.4
Dec. 12, 2012 102.6 85.0 90.3 84.3 101.5 76.7 90.1 10.2
Jan. 28, 2013 93.8 75.4 76.9 70.4 65.0 68.8 75.0 10.1
Feb. 15, 2013 17.2 20.8 26.4 31.5 30.1 27.3 25.5 5.5
Mar. 01, 2013 42.8 46.7 49.3 43.1 43.2 41.1 44.4 3.0
Mar. 19, 2013 30.6 27.5 28.3 25.8 28.9 40.5 30.3 5.2
Apr. 01, 2013 60.2 61.4 66.0 62.3 61.5 58.0 61.5 2.6
Apr. 15, 2013 68.0 93.3 96.8 71.7 95.0 59.6 80.7 16.2
Apr. 29, 2013 41.2 67.1 80.0 43.8 59.5 44.7 56.1 15.5
May 13, 2013 39.4 43.9 50.4 51.9 49.0 39.9 45.8 5.4
May 30, 2013 147.0 139.9 120.1 105.6 112.1 104.7 121.6 18.0
Jun. 10, 2013 133.8 89.9 73.6 93.0 61.2 69.9 86.9 26.0
Jun. 25, 2013 214.4 198.5 182.8 207.8 152.4 164.4 186.7 24.7
Jul. 19, 2013 196.2 345.6 318.0 212.3 232.7 185.9 248.5 67.0
Aug. 02, 2013 362.1 227.3 249.0 284.0 295.0 332.0 291.6 50.2
Aug. 19, 2013 268.5 222.0 262.3 318.7 293.3 237.7 267.1 35.4
Sept. 09, 2013 310.7 406.5 370.4 389.5 381.5 258.7 352.9 56.6
Sept. 29, 2013 370.3 291.1 332.2 248.0 292.6 261.0 299.2 45.5
Mean 150.9 149.2 153.5 147.8 144.9 131.0 146.2 23.3
4171, Page 6 of 14 Environ Monit Assess (2015) 187:4171
The seasonal fluctuation in BOD observed in thisstudy represents general characteristics for the rangeand seasonality in this shallow urban lake. In a previ-ous study on DO during 2008–2009 in the same lake,Xu and Mesmer (2013) reported a slightly higher 5-day BOD average (7.2 mg/L) with a similar seasonaltrend. Also, the BOD ranges of this eutrophic lake arecomparable to the findings from other shallow eutro-phic lakes in similar climate regions. For instance,from their study on a subtropical man-made lake inIndia, Arora and Mehra (2009) reported a BOD5 rangebetween 4.0 and 12.0 mg/L (average 6.8 mg/L) fromJanuary 2000 to December 2001. In another study on asubtropical freshwater lake in China, Wang et al. (2007)reported a BOD5 dynamics fluctuating from 3.2 to9.1 mg/L with an average of 6.0 mg/L from 1999 to2003. The difference in BOD range among these andour studies could be attributed to urban pollution levels,as well as to ambient conditions such as rainfall andtemperature.
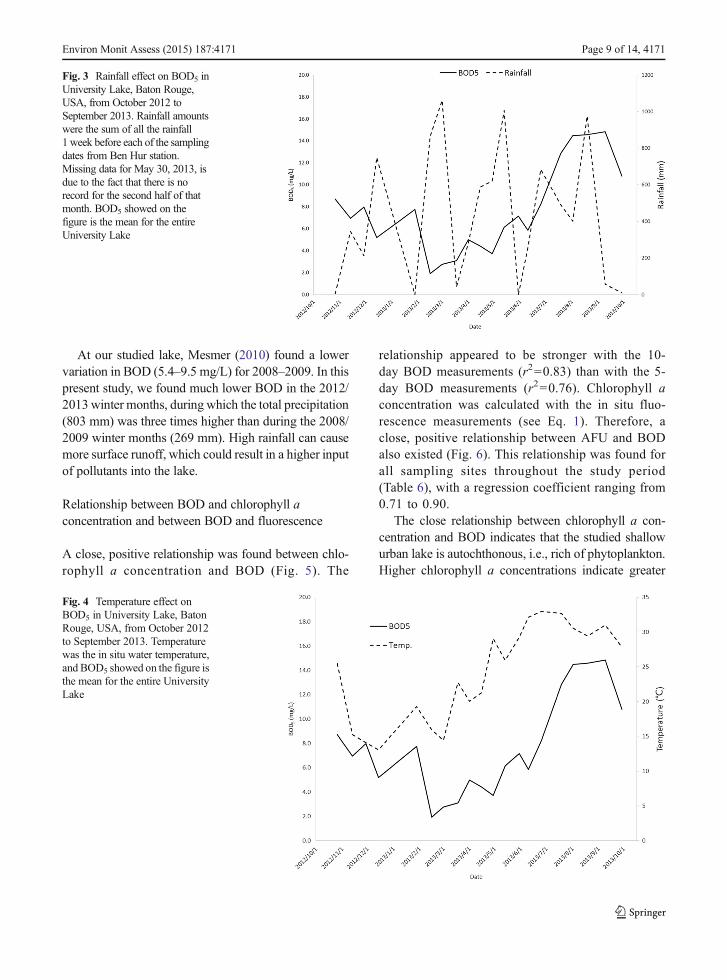
During the study period, a total of 48 rainfallevents with a rainfall amount greater than 0.254 mmwere identified in 1 week before each fieldwork.There appeared a negative correlation between rain-fall amount and BOD5 (Fig. 3). At the same time,BOD appeared to have a positive relationship withtemperature (Fig. 4). This may be a result of increasedbiological activities with increasing temperature.However, the relationship between BOD and temper-ature within a same season is weak (r2=0.3). Multipleregression analysis (Table 5) indicated that a strongercorrelation exists when water temperature (T) is in-cluded as the second independent variable to deter-mine BOD5 (r2=0.88, Cp=2.5), when compared tothe condition that AFU is the single independentvariable (r2=0.87, Cp=2.1). Also, correlations appearto be stronger when rainfall is considered as anotherindependent variable for BOD5-AFU or BOD5-(AFU,T) relationships, but in general, the effect of rainfall isnot very obvious.
Table 3 Means and standard deviations of chlorophyll a concentration from six sampling sites in University Lake, Baton Rouge, USA,from October 2012 to September 2013
Date Chlorophyll a (μg/L)
Site 1 Site 2 Site 3 Site 4 Site 5 Site 6 Mean STD
Oct. 26, 2012 75.8 80.4 96.6 104.1 73.1 106.4 89.4 13.5
Nov. 13, 2012 70.6 69.4 71.5 70.6 77.4 56.0 69.3 6.5
Nov. 29, 2012 61.1 67.0 70.8 69.9 67.0 57.2 65.5 4.8
Dec. 12, 2012 41.5 34.5 36.6 34.3 41.0 31.3 36.5 3.7
Jan. 28, 2013 38.0 30.7 31.3 28.8 26.7 28.2 30.6 3.7
Feb. 15, 2013 7.8 9.2 11.4 13.4 12.9 11.8 11.1 2.0
Mar. 01, 2013 17.9 19.4 20.4 18.0 18.1 17.2 18.5 1.1
Mar. 19, 2013 13.1 11.8 12.2 11.2 12.4 17.0 12.9 1.9
Apr. 01, 2013 24.7 25.2 27.0 25.6 25.3 23.9 25.3 0.9
Apr. 15, 2013 27.8 37.8 39.2 29.3 38.5 24.5 32.8 5.8
Apr. 29, 2013 17.3 27.5 32.5 18.3 24.5 18.6 23.1 5.6
May 13, 2013 16.5 18.3 20.9 21.5 20.3 16.7 19.0 2.0
May 30, 2013 59.0 56.2 48.4 42.7 45.2 42.3 48.9 6.5
Jun. 10, 2013 53.8 36.4 30.0 37.7 25.1 28.6 35.3 9.4
Jun. 25, 2013 85.6 79.3 73.1 83.0 61.1 65.8 74.6 8.9
Jul. 19, 2013 78.4 137.3 126.4 84.7 92.8 74.3 99.0 24.1
Aug. 02, 2013 143.8 90.7 99.2 113.0 117.4 131.9 116.0 18.1
Aug. 19, 2013 106.9 88.6 104.5 126.7 116.7 94.8 106.3 14.0
Sept. 09, 2013 123.5 161.3 147.1 154.6 151.5 103.0 140.2 22.3
Sept. 29, 2013 147.1 115.8 132.0 98.8 116.4 103.9 119.0 17.9
Mean 60.5 59.8 61.6 59.3 58.2 52.7 58.7 8.6
Environ Monit Assess (2015) 187:4171 Page 7 of 14, 4171
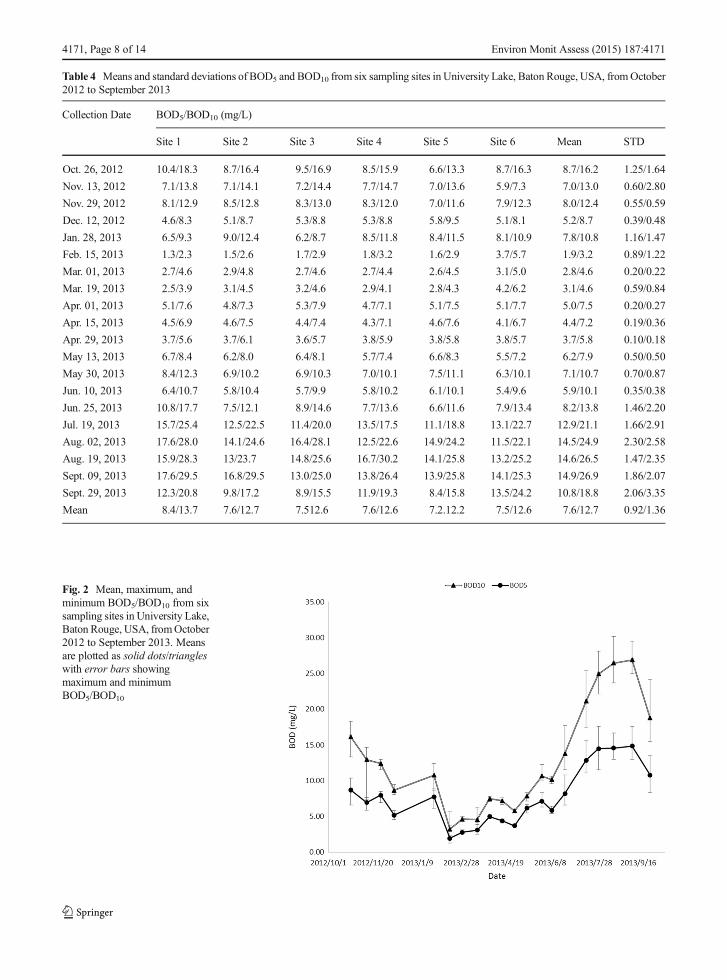
Table 4 Means and standard deviations of BOD5 and BOD10 from six sampling sites in University Lake, Baton Rouge, USA, fromOctober2012 to September 2013
Collection Date BOD5/BOD10 (mg/L)
Site 1 Site 2 Site 3 Site 4 Site 5 Site 6 Mean STD
Oct. 26, 2012 10.4/18.3 8.7/16.4 9.5/16.9 8.5/15.9 6.6/13.3 8.7/16.3 8.7/16.2 1.25/1.64
Nov. 13, 2012 7.1/13.8 7.1/14.1 7.2/14.4 7.7/14.7 7.0/13.6 5.9/7.3 7.0/13.0 0.60/2.80
Nov. 29, 2012 8.1/12.9 8.5/12.8 8.3/13.0 8.3/12.0 7.0/11.6 7.9/12.3 8.0/12.4 0.55/0.59
Dec. 12, 2012 4.6/8.3 5.1/8.7 5.3/8.8 5.3/8.8 5.8/9.5 5.1/8.1 5.2/8.7 0.39/0.48
Jan. 28, 2013 6.5/9.3 9.0/12.4 6.2/8.7 8.5/11.8 8.4/11.5 8.1/10.9 7.8/10.8 1.16/1.47
Feb. 15, 2013 1.3/2.3 1.5/2.6 1.7/2.9 1.8/3.2 1.6/2.9 3.7/5.7 1.9/3.2 0.89/1.22
Mar. 01, 2013 2.7/4.6 2.9/4.8 2.7/4.6 2.7/4.4 2.6/4.5 3.1/5.0 2.8/4.6 0.20/0.22
Mar. 19, 2013 2.5/3.9 3.1/4.5 3.2/4.6 2.9/4.1 2.8/4.3 4.2/6.2 3.1/4.6 0.59/0.84
Apr. 01, 2013 5.1/7.6 4.8/7.3 5.3/7.9 4.7/7.1 5.1/7.5 5.1/7.7 5.0/7.5 0.20/0.27
Apr. 15, 2013 4.5/6.9 4.6/7.5 4.4/7.4 4.3/7.1 4.6/7.6 4.1/6.7 4.4/7.2 0.19/0.36
Apr. 29, 2013 3.7/5.6 3.7/6.1 3.6/5.7 3.8/5.9 3.8/5.8 3.8/5.7 3.7/5.8 0.10/0.18
May 13, 2013 6.7/8.4 6.2/8.0 6.4/8.1 5.7/7.4 6.6/8.3 5.5/7.2 6.2/7.9 0.50/0.50
May 30, 2013 8.4/12.3 6.9/10.2 6.9/10.3 7.0/10.1 7.5/11.1 6.3/10.1 7.1/10.7 0.70/0.87
Jun. 10, 2013 6.4/10.7 5.8/10.4 5.7/9.9 5.8/10.2 6.1/10.1 5.4/9.6 5.9/10.1 0.35/0.38
Jun. 25, 2013 10.8/17.7 7.5/12.1 8.9/14.6 7.7/13.6 6.6/11.6 7.9/13.4 8.2/13.8 1.46/2.20
Jul. 19, 2013 15.7/25.4 12.5/22.5 11.4/20.0 13.5/17.5 11.1/18.8 13.1/22.7 12.9/21.1 1.66/2.91
Aug. 02, 2013 17.6/28.0 14.1/24.6 16.4/28.1 12.5/22.6 14.9/24.2 11.5/22.1 14.5/24.9 2.30/2.58
Aug. 19, 2013 15.9/28.3 13/23.7 14.8/25.6 16.7/30.2 14.1/25.8 13.2/25.2 14.6/26.5 1.47/2.35
Sept. 09, 2013 17.6/29.5 16.8/29.5 13.0/25.0 13.8/26.4 13.9/25.8 14.1/25.3 14.9/26.9 1.86/2.07
Sept. 29, 2013 12.3/20.8 9.8/17.2 8.9/15.5 11.9/19.3 8.4/15.8 13.5/24.2 10.8/18.8 2.06/3.35
Mean 8.4/13.7 7.6/12.7 7.512.6 7.6/12.6 7.2.12.2 7.5/12.6 7.6/12.7 0.92/1.36
Fig. 2 Mean, maximum, andminimum BOD5/BOD10 from sixsampling sites in University Lake,Baton Rouge, USA, fromOctober2012 to September 2013. Meansare plotted as solid dots/triangleswith error bars showingmaximum and minimumBOD5/BOD10
4171, Page 8 of 14 Environ Monit Assess (2015) 187:4171
At our studied lake, Mesmer (2010) found a lowervariation in BOD (5.4–9.5 mg/L) for 2008–2009. In thispresent study, we found much lower BOD in the 2012/2013winter months, during which the total precipitation(803 mm) was three times higher than during the 2008/2009 winter months (269 mm). High rainfall can causemore surface runoff, which could result in a higher inputof pollutants into the lake.
Relationship between BOD and chlorophyll aconcentration and between BOD and fluorescence
A close, positive relationship was found between chlo-rophyll a concentration and BOD (Fig. 5). The
relationship appeared to be stronger with the 10-day BOD measurements (r2=0.83) than with the 5-day BOD measurements (r2=0.76). Chlorophyll aconcentration was calculated with the in situ fluo-rescence measurements (see Eq. 1). Therefore, aclose, positive relationship between AFU and BODalso existed (Fig. 6). This relationship was found forall sampling sites throughout the study period(Table 6), with a regression coefficient ranging from0.71 to 0.90.
The close relationship between chlorophyll a con-centration and BOD indicates that the studied shallowurban lake is autochthonous, i.e., rich of phytoplankton.Higher chlorophyll a concentrations indicate greater
Fig. 3 Rainfall effect on BOD5 inUniversity Lake, Baton Rouge,USA, from October 2012 toSeptember 2013. Rainfall amountswere the sum of all the rainfall1 week before each of the samplingdates from Ben Hur station.Missing data for May 30, 2013, isdue to the fact that there is norecord for the second half of thatmonth. BOD5 showed on thefigure is the mean for the entireUniversity Lake
Fig. 4 Temperature effect onBOD5 in University Lake, BatonRouge, USA, from October 2012to September 2013. Temperaturewas the in situ water temperature,and BOD5 showed on the figure isthe mean for the entire UniversityLake
Environ Monit Assess (2015) 187:4171 Page 9 of 14, 4171
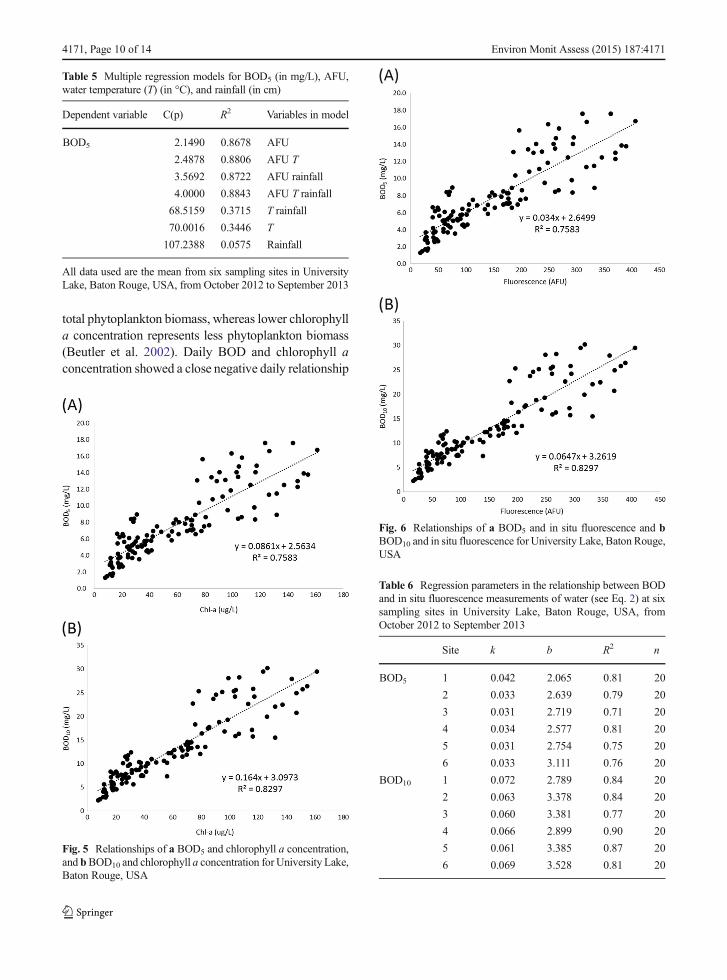
total phytoplankton biomass, whereas lower chlorophylla concentration represents less phytoplankton biomass(Beutler et al. 2002). Daily BOD and chlorophyll aconcentration showed a close negative daily relationship
Fig. 6 Relationships of a BOD5 and in situ fluorescence and bBOD10 and in situ fluorescence for University Lake, Baton Rouge,USA
Fig. 5 Relationships of a BOD5 and chlorophyll a concentration,and bBOD10 and chlorophyll a concentration for University Lake,Baton Rouge, USA
Table 5 Multiple regression models for BOD5 (in mg/L), AFU,water temperature (T) (in °C), and rainfall (in cm)
Dependent variable C(p) R2 Variables in model
BOD5 2.1490 0.8678 AFU
2.4878 0.8806 AFU T
3.5692 0.8722 AFU rainfall
4.0000 0.8843 AFU T rainfall
68.5159 0.3715 T rainfall
70.0016 0.3446 T
107.2388 0.0575 Rainfall
All data used are the mean from six sampling sites in UniversityLake, Baton Rouge, USA, from October 2012 to September 2013
Table 6 Regression parameters in the relationship between BODand in situ fluorescence measurements of water (see Eq. 2) at sixsampling sites in University Lake, Baton Rouge, USA, fromOctober 2012 to September 2013
Site k b R2 n
BOD5 1 0.042 2.065 0.81 20
2 0.033 2.639 0.79 20
3 0.031 2.719 0.71 20
4 0.034 2.577 0.81 20
5 0.031 2.754 0.75 20
6 0.033 3.111 0.76 20
BOD10 1 0.072 2.789 0.84 20
2 0.063 3.378 0.84 20
3 0.060 3.381 0.77 20
4 0.066 2.899 0.90 20
5 0.061 3.385 0.87 20
6 0.069 3.528 0.81 20
4171, Page 10 of 14 Environ Monit Assess (2015) 187:4171
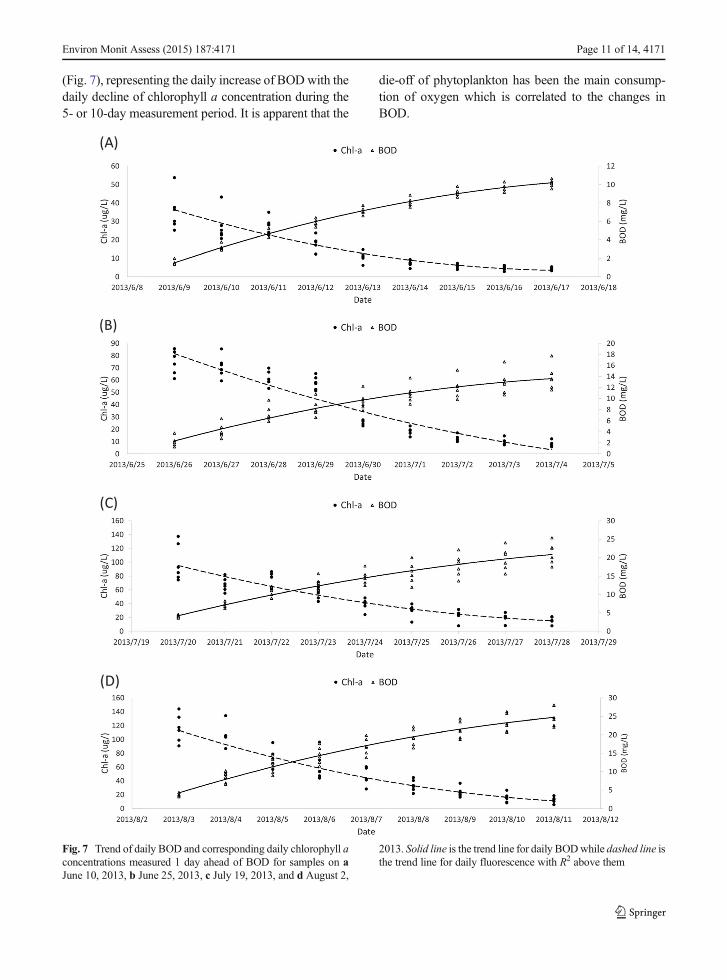
(Fig. 7), representing the daily increase of BODwith thedaily decline of chlorophyll a concentration during the5- or 10-day measurement period. It is apparent that the
die-off of phytoplankton has been the main consump-tion of oxygen which is correlated to the changes inBOD.
Fig. 7 Trend of daily BOD and corresponding daily chlorophyll aconcentrations measured 1 day ahead of BOD for samples on aJune 10, 2013, b June 25, 2013, c July 19, 2013, and d August 2,
2013. Solid line is the trend line for daily BODwhile dashed line isthe trend line for daily fluorescence with R2 above them
Environ Monit Assess (2015) 187:4171 Page 11 of 14, 4171
With high chlorophyll a concentration which is themost important variable to determine the lake trophicstate, not only LSUUniversity Lake, but also many othereutrophic lakes are supposed to be autochthonous. In thatcase, organic pollutants responsible for BOD are mainlyformed within the water system, through derivation frompolymerization and degradation of existing dissolvedorganic matter, release from living and dead organismsand through microbial syntheses within the body water(Thomas 1997, Cârstea 2012). By the origin, this type oforganic pollutants is very different from allochthonousorganic pollutants in the sewage in the wastewater plants.Allochthonous organic pollutant is the fraction that isformed outside the water system and transported insidethrough discharge of human wastes, farm wastes, leach-ates, and so on (Hudson et al. 2007, Cârstea 2012).
The positive relationship between chlorophyll aconcentrations and BOD has been reported by a fewstudies for shallow eutrophic lakes. In a study conductedin temperate eutrophic lake, Taihu Lake, in China,Wanget al. (2007) reported a significantly positive correlationbetween phytoplankton biomass and COD, BOD, andTP in spring, summer, and autumn. Zhang and Qin(2001) investigated the same lake and pointed out thatCOD and BOD values were closely correlated withphytoplankton biomass in the most eutrophic part ofTaihu Lake that was strongly affected by anthropogenicactivities. However, until now, we found no report of aquantitative equation that uses chlorophyll a concentra-tion to predict BOD or vice versa.
The relatively high accuracy for predicting BOD withchlorophyll a concentration found in our study indicatesthat in situ chlorophyll a fluorescence can be a cost-effective, rapid approach in urban water quality monitor-ing. By application of the chlorophyll fluorescence (i.e.,λexCitation=460 nm and λemission 685 nm) for the real-timemonitoring of water quality in eutrophic lakes, chloro-phyll a concentrations and BOD can be estimated simul-taneously in situ in few seconds without sample prepa-ration and laboratory analysis such as EEM spectrosco-py. Since the relationship exists due to the autochthonousorganic pollutants, it should work well in eutrophic waterbodies, which fills in the blank for former fluorescencespectroscopy studies that focus mainly on tryptophan-like fluorescence (λexCitation=280 nm, λemission 350 nm)in the sewage including mostly allochthonous organicpollutants (Reynolds and Ahmad 1997, Ahmad andReynolds 1999, Reynolds 2002, Baker and Curry2004, Baker and Inverarity 2004, Hudson et al. 2008).
Variability in the AFU/BOD relationship existed andshould be taken into consideration. As Table 5 shows,even within a small lake, the sites have different AFU/BOD relationships, and the correlations of AFU withBOD are stronger at some sites than others. This coin-cides with similar characteristics for variations of BOD,AFU, and chlorophyll a of being higher at their peaks inthe summer months and lower on the bottoms in thewinter months that indicates a locally distinct distributionof phytoplankton, especially in the algal bloom time, inthe studied lake. For a larger water body or lakes indifferent climate regions, enormous variability can existin both the surface water and effluents/runoffs to it,causing more difference in the AFU/BOD relationship.Similar local variability is also mentioned in a study forrelationship between tryptophan-like fluorescence andBOD5 by Hudson and other researchers from water sam-ples collected in South West England area (∼1700 km2)(Hudson et al. 2007). They applied a geographicallyweighted regression to present the geographical variabil-ity. Here, it is suggested that the comparison between site-specific and local fluorescence/BOD5 relationships andwhole watershed fluorescence/BOD5 relationship shouldbe applied to further support the application of chloro-phyll fluorescence in water quality assessment.
Ambient conditions such as rainfall and water temper-ature may also partially affect BOD variation. This agreeswith the finding from a previous study (Xu and Mesmer2013) conducted in the same lake during 2008-2009.Seasonal BOD5 trend in 2008–2009 showed smallervariation than the one in this present study, which canbe explained by a larger variation of water temperatureand rainfall during this study period (Table 1). In additionto temperature and rainfall, other ambient factors that canaffect water light conditions, such as cloudiness andradiation, may influence field fluorescence reading, there-fore causing variation in the BOD–fluorescence relation.Except for ambient conditions, other possible factors thatwould affect the BOD–fluorescence relation pointed outby other researcher include pH and salinity due to theinfluence in fluorophore and intramolecular reactions(Cârstea 2012). However, those factors did not showsignificance in this study.
Conclusions
This study assessed the range and seasonal fluctuationof field chlorophyll fluorescence, chlorophyll a
4171, Page 12 of 14 Environ Monit Assess (2015) 187:4171
concentration, and 5- and 10-day BODs in a subtropical,eutrophic urban lake during the period from October2012 to September 2013. Based on the measurements,we developed a simple model for predication of BODwith field chlorophyll fluorescence measurements. Theprediction model produced relatively high accuracy inestimating 5- and 10-day BODs. This fluorometric ap-proach can be especially applicable to eutrophic waters,as it effectively detects chlorophyll concentrations. Thestudy is the first trial to have used field chlorophyllfluorescence for rapid BOD estimation through a nu-meric relationship. We suggest that this approach befurther tested for eutrophic waters in subtropical andother climate regions.
Acknowledgments This study partially benefited from USDAMcIntire–Stennis funds. The authors acknowledge ChristopherMariani’s assistance with field water sampling and AbramDaSilva’s assistance with the laboratory analysis of chlorophylla. Thanks also go to the Louisiana Agriclimatic InformationSystem for making the long-term weather data available for thisstudy.
References
Ahmad, S. R., & Reynolds, D. M. (1999). Monitoring of waterquality using fluorescence technique: prospect of on-lineprocess control. Water Research, 33(9), 2069–2074.
APHA. (2005). Standard methods for the examination of waterand wastewater (21st ed.). Washington: American PublicHealth Association.
Arar, E. J., & Collins, G. B. (1997). In vitro determination ofchlorophyll a and pheophytin a in marine and freshwateralgae by fluorescence. Method 445.0. Cincinnati: NationalExposure Research Laboratory, USEPA.
Arora, J., &Mehra, N. K. (2009). Seasonal dynamics of zooplank-ton in a shallow eutrophic, man-made hyposaline lake inDelhi (India): role of environmental factors. Hydrobiologia,626(1), 27–40.
Assoc, R. (1991). City Park/University Lakes Management Plan.Baton Rouge: Applied Technology Research Corporation.
Baker, A., & Curry, M. (2004). Fluorescence of leachates fromthree contrasting landfills. Water Research, 38(10),2605–2613.
Baker, A., & Genty, D. (1999). Fluorescence wavelength andintensity variations of cave waters. Journal of Hydrology,217(1–2), 19–34.
Baker, A., & Inverarity, R. (2004). Protein-like fluorescence in-tensity as a possible tool for determining river water quality.Hydrological Processes, 18(15), 2927–2945.
Basant, N., Gupta, S., Malik, A., & Singh, K. P. (2010). Linear andnonlinear modeling for simultaneous prediction of dissolvedoxygen and biochemical oxygen demand of the surface
water—a case study. Chemometrics and IntelligentLaboratory Systems, 104(2), 172–180.
Beutler, M., Wiltshire, K. H., Meyer, B., Moldaenke, C., Luring,C., Meyerhofer, M., Hansen, U. P., & Dau, H. (2002). Afluorometric method for the differentiation of algal popula-tions in vivo and in situ. Photosynthesis Research, 72(1),39–53.
Brack, W., & Frank, H. (1998). Chlorophyll a fluorescence: a toolfor the investigation of toxic effects in the photosyntheticapparatus. Ecotoxicology and Environmental Safety, 40,34–41.
Breitburg, D. L. (1992). Episodic hypoxia in Chesapeake Bay—interacting effects of recruitment, behavior, and physicaldisturbance. Ecological Monographs, 62(4), 525–546.
Cammack, W. K. L., Kalff, J., Prairie, Y. T., & Smith, E. M.(2004). Fluorescent dissolved organic matter in lakes: rela-tionships with heterotrophic metabolism. Limnology andOceanography, 49(6), 2034–2045.
Caraco, N. F., & Cole, J. J. (2002). Contrasting impacts of a nativeand alien macrophyte on dissolved oxygen in a large river.Ecological Applications, 12(5), 1496–1509.
Carlson, R. E. (1977). A trophic state index for lakes. LimnologyOceanography, 22, 361–369.
Carpenter, S. R., Caraco, N. F., Correll, D. L., Howarth, R. W.,Sharpley, A. N., & Smith, V. H. (1998). Nonpoint pollutionof surface waters with phosphorus and nitrogen. EcologicalApplications, 8(3), 559–568.
Cârstea, E.M. (2012). Fluorescence spectroscopy as a potentialtool for in-situ monitoring of dissolved organic matter insurface water systems. In N. Balkis (ed.) Water pollution,InTech, Rijeka
Cârstea, E. M., Ghervasea, L., Pavelescua, G., & Iojăb, C. I.(2012). Dissolved organic matter fluorescence and severalmetals concentration in a freshwater system. ProcediaEnvironmental Sciences, 14, 41–48.
Christoffers, D., & Ernst, W. (1983). The in-vivo fluorescence ofchlorella fusca as a biological test for the inhibition of pho-tosynthesis. Toxicological and Environmental Chemistry, 7,61–71.
Coble, P. G. (1996). Characterization of marine and terrestrialDOM in seawater using excitation emission matrix spectros-copy. Marine Chemistry, 51(4), 325–346.
Comber, S. D. W., Gardner, M. J., & Gunn, A. M. (1996).Measurement of absorbance and fluorescence as potentialalternatives to BOD. Environmental Technology, 17(7),771–776.
Dodds, W. K., Jones, J. R., & Welch, E. B. (1998).Suggested classification of stream trophic state: distri-butions of temperate stream types by chlorophyll, totalnitrogen, and phosphorus. Water Research, 32(5),1455–1462.
French, T. D., & Petticrew, E. L. (2007). Chlorophyll aseasonality in four shallow eutrophic lakes (northernBritish Columbia, Canada) and the critical roles of inter-nal phosphorus loading and temperature. Hydrobiologia,575, 285–299.
Frodge, J. D., Thomas, G. L., & Pauley, G. B. (1990).Effects of canopy formation by floating and submergentaquatic macrophytes on the water-quality of two shal-low pacific-northwest lakes. Aquatic Botany, 38(2–3),231–248.
Environ Monit Assess (2015) 187:4171 Page 13 of 14, 4171
Gray, J. S.,Wu, R. S. S., &Or, Y. Y. (2002). Effects of hypoxia andorganic enrichment on the coastal marine environment.Marine Ecology Progress Series, 238, 249–279.
Gregor, J., & Marsalek, B. (2004). Freshwater phytoplankton quan-tification by chlorophyll alpha: a comparative study of in vitro,in vivo and in situ methods.Water Research, 38(3), 517–522.
Hamilton, S. K., Sippel, S. J., Calheiros, D. F., & Melack, J. M.(1997). An anoxic event and other biogeochemical effects ofthe Pantanal wetland on the Paraguay River. Limnology andOceanography, 42(2), 257–272.
Harrison, J. A., Matson, P. A., & Fendorf, S. E. (2005). Effects of adiel oxygen cycle on nitrogen transformations and green-house gas emissions in a eutrophied subtropical stream.Aquatic Sciences, 67(3), 308–315.
Hudson, N., Baker, A., & Reynolds, D. (2007). Fluorescenceanalysis of dissolved organic matter in natural, waste andpolluted waters—a review. River Research and Applications,23(6), 631–649.
Hudson, N., Baker, A., Ward, D., Reynlds, D. M., Brunsdon, C.,Carliell-Marquet, C., & Browning, S. (2008). Can fluores-cence spectrometry be used as a surrogate for the biochemicaloxygen demand (BOD) test in water quality assessment? Anexample from South West England. Science of the TotalEnvironment, 391(1), 149–158.
Kemp, W. M., Sampou, P., Caffrey, J., Mayer, M., Henriksen, K.,& Boynton, W. R. (1990). Ammonium recycling versusdenitrification in Chesapeake Bay sediments. Limnologyand Oceanography, 35(7), 1545–1563.
Kwak, J., Khang, B., Kim, E., & Kim, H. (2013). Estimation ofbiochemical oxygen demand based on dissolved organiccarbon, UV absorption, and fluorescence measurements.Journal of Chemistry, 9.
Mesmer, R. (2010). Impact of urban runoff of phosphorus, nitro-gen and dissolved oxygen in a shallow subtropical lake.Master Thesis, Louisiana State University and Agriculturaland Mechanical College.
Patel-Sorrentino, N., Mounier, S., & Benaim, J. Y. (2002).Excitation-emission fluorescence matrix to study pH influ-ence on organic matter fluorescence in the Amazon basinrivers. Water Research, 36(10), 2571–2581.
Reynolds, D. M. (2002). The differentiation of biodegradable andnon-biodegradable dissolved organic matter in wastewatersusing fluorescence spectroscopy. Journal of ChemicalTechnology and Biotechnology, 77(8), 965–972.
Reynolds, D. M., & Ahmad, S. R. (1997). Rapid and directdetermination of wastewater BOD values using a fluores-cence technique. Water Research, 31(8), 2012–2018.
Schalles, J. F., Gitelson, A. A., Yacobi, Y. Z., & Kroenke, A. E.(1998). Estimation of chlorophyll a from time series mea-surements of high spectral resolution reflectance in an eutro-phic lake. Journal of Phycology, 34(2), 383–390.
Stevens, P. W., Blewett, D. A., & Casey, J. P. (2006). Short-termeffects of a low dissolved oxygen event on estuarine fishassemblages following the passage of Hurricane Charley.Estuaries and Coasts, 29(6A), 997–1003.
Thomas, J. D. (1997). The role of dissolved organic matter, par-ticularly free amino acids and humic substances, in freshwa-ter ecosystems. Freshwater Biology, 38(1), 1–36.
US EPA. (2009). National lakes assessment: a collaborative sur-vey of the nation’s lakes. Washington: EnvironmentalProtection Agency.
Wang, X. L., Lu, Y. L., He, G. Z., Han, J. Y., & Wang, T. Y.(2007). Exploration of relationships between phytoplank-ton biomass and related environmental variables usingmultivariate statistic analysis in a eutrophic shallow lake:a 5-year study. Journal of Environmental Sciences-China,19(8), 920–927.
Whitehead, P. G., Wilby, R. L., Battarbee, R. W., Kernan, M., &Wade, A. J. (2009). A review of the potential impacts ofclimate change on surface water quality. HydrologicalSciences Journal-Journal Des Sciences Hydrologiques,54(1), 101–123.
Xu, Y. J., & Mesmer, R. (2013). The dynamics of dissolvedoxygen and metabolic rates in a shallow subtropical urbanlake, Louisiana, USA. In A. Berit (Ed.), Understandingfreshwater quality problems in a changing world (pp. 212–219). Wallingford: IAHS Publication 361.
Zhang, Y. L., &Qin, B. Q. (2001). Study prospect and evolution ofeutrophication in Taihu Lake. Shanghai EnvironmentalSciences, 20, 263–265.
4171, Page 14 of 14 Environ Monit Assess (2015) 187:4171
Copyright © 2022 FDOKUMEN