Social distances towards the new immigrants in Bulgaria
16
I NTERNATI ONAL NEIWORK MIGRATIONS FROM AND TO SOUTHEASTERN EUROPE edited by Anna Krasteva, Anelia Kasabova and Diana Karabinova Longo Editore Ravenna
Transcript of Social distances towards the new immigrants in Bulgaria
EU~OPE ~~
INTERNATIONAL NEIWORK
MIGRATIONS FROM AND TO SOUTHEASTERN EUROPE edited by Anna Krasteva, Anelia Kasabova and Diana Karabinova
Longo Editore Ravenna
Scientific Committee Stefano Bianchini, George Sch6pflin, Anna Krasteva,
Dusan Janjic, Alia Jaz'kova, Craig Nation, Zarko Puhovski, Rudolf Rizman, Paul Shoup, Milica Uvalic,JVera VangeliJ
Editor-in-Chief: Stefano Bianchini Publications Coordinator : Sara Barbieri
Managing Editor: Andrea Brandani Graphic Designer: Stefani a Adani
Cover Illustration: Courtesy of Kallina Krasteva-Brailsford
The book is published with the support of the Federal Ministry of Science and Research of the Republic of Austria
in the framework of its SEE science cooperation initiative
\'! AC• 0 WUBWANA .,) SOFIA
AUSll! AKSCIENCEAl<D RESEAl!CH LIASOtl OFFICE 8M a
Austrian Federal Ministry of Science and Research
And with the contribution ot CERMES (Centre fc r Migration, Refugees and Ethnic Studies), New Bulgarian University
ct!2ttts CENTRE FOR EUROPEAN REFUGEES.
M IGRATION AND ETHNIC STUDIES
Depanment of Political Sciences New Bulgarian University
ISBN 978-88-8063-622-9
©Copyright 2010 A. Longo Editore Via P. Costa, 33, 48100 Ravenna Tel. (0544) 217026 Fax 217554 e-mail: [email protected]
V'NNI .\01\IdO-editme .it ~\ ~~~'\\\<;; ~e<;;e~en
Printed in Italy
roduction
Alexey Pamporov
SOCIAL DISTANCES TOWARDS THE NEW IMMIGRANTS IN BULGARIA
algarians are proud oftheir ethnic tolerance. Saving the lives of Bulgarian during WWII and undergoing a peaceful post-communist transition alongconflicts in the Western Balkans, Bulgarians got used to living with the
... e that Bulgaria is "the most tolerant nation in the Balkans". Our study chal=es this position. We ask two questions: "Are there some hidden racial and
-:~ic prejudices behind the tolerance mask?" and "If the Bulgarians are toler~ toward the so-called traditional minorities in the country such as Turks, Roma : psies), Armenians and Jews, are they tolerant in the same degree to new migrant groups rapidly emerging in the past years?" The sociological concept of social distance was introduced in order to de
ribe and compare racial stereotypes and prejudices. It concerns "the grades d degrees of understanding and intimacy which characterize personal and so
._,al relations generally"'. In two consecutive articles, the sociologist Emory Bogardus discussed the reasons for the emergence of social distances2 and pro-
ed his "race distance scale"3.
Social distance research was introduced in Bulgaria as late as the beginning
1 R. E. Park, "The Concept of Social Distance as Applied to the Study of Racial Attitudes and Racial Relations", in Journal of Applied Sociology, Vol. 8, 1924, pp. 339-44.
2 E. Bogardus, "Social Distance and its Origins", in Journal of Applied Sociology, Vol. 9, No.9, 1925 , pp. 216-26.
3 E. Bogardus, "Measuring Social Distances" , in Journal of Applied Sociology, 1925, Vol. 9, No. 1, pp. 299-309.
80 Alexe'
of the nineteen-nineties, after the collapse of the socialist regime. Ne\ e-[ it raised great interest and was applied to seven surveys in the period 1992 and 2007. Unfortunately, the first survey used an adjusted scale th ..... and partially mislead the respondents' answers, but later surveys repe~ order to provide comparison with the first. There were several proble wrongly translated sintagm "work besides", which pushed this item do scale; 2) the removal of the original matrix design that targeted spontane hierarchical ordering of the ethnic groups based on their social prestige:limited number of ethnic groups included (four to six) that made the contra.:. tigious- non prestigious" even sharper-4. In order to overcome these weat. the research team of the Open Society Institute, Sofia, tested a versior. Bogardus scale that stays closer to the original matrix in two consecut: veys by initially increasing the number of ethnic groups included to fourtee of Society 3, December 2007) and later to eighteen (Open Bus 1, Februa.I} ::
2. Living area distances
The living area distances were measured by a seven degree scale". constructing this scale, we considered some recent developments in the distance measurement? as well as the outcomes of the previous surveys ·~ garia. The scale was applied to several clusters of ethnic/national groups li Bulgaria: 1) traditional minorities: Roma, Pomaks, Armenians and Jews:::: norities from neighbouring countries: Turks, Greeks, Serbs, Macedonia!' Romanians; 3) migrants from countries who most often apply for Bulgaria: zenship8 not covered by the first two groups: Besarabian Bulgarians (u
4 A. Pamporov, "ETHW-IeCKHTe ,llHCTaHIJ,HH a obnrapHll npe3 2007 r. [Ethnic Dish Bulgaria in 2007]", in Mtaoume xopa 6 E6poneiicKa EMzapuR [Young People in E. U. .\!, Bulgaria], edited by P. E. Mitev and T. Kotzeva, Sofia, CPS, 2007, pp. 266-85, sum English.
5 The stable and reliable outcome of the given surveys lead the team to design larger re tools, splitting the scale into two parts, living area distances and working area distances, as • • to increase the number of groups to twenty-four, listed in alphabetical order. The research ou. presented later in this piece comes from the Open Bus Survey - 2, June 2008. It uses an<> representative sample based on 1144 respondents, interviewed face to face at their home,. confidence level is 95% and the confidence interval is 2.9%.
6 Would you agree for members of the following national and ethnic groups, living in Bul= to: get married; for you or your children to get married to; be guests in your home; live next d your home; live in your neighbourhood; live in your settlement; live in your region; live in Bulg -
7 M. Y. Lee, S. G. Sapp, M. C. Ray, "The Reverse Social Distance Scale", in The Jounz... Social Psychology, No. 136 (I), Feb 1996, pp. 17-24; Ph. Ethington, "The Intellectual Con,r.~
tion of"Social Distance": Toward a Recovery of Georg Simmel's Social Geometry", in Cyber. Epistemology, History, Teaching, Article 30, put online on 16 September 1997, modified or: February 2007, URL: http://www.cybergeo.E.U./index227.html. Consulted on 21 June 200-H. Randall, S. Delbridge, "Perceptions of Social Distance in an Ethnically Fluid Community .. Sociological Spectrum, Vol. 25, No. I, 2005, pp. 103-22.
8 According to a Council of Ministers ' report on migration (July 2007), application
Social Distances Towards the New Immigrants in Bulgaria 81
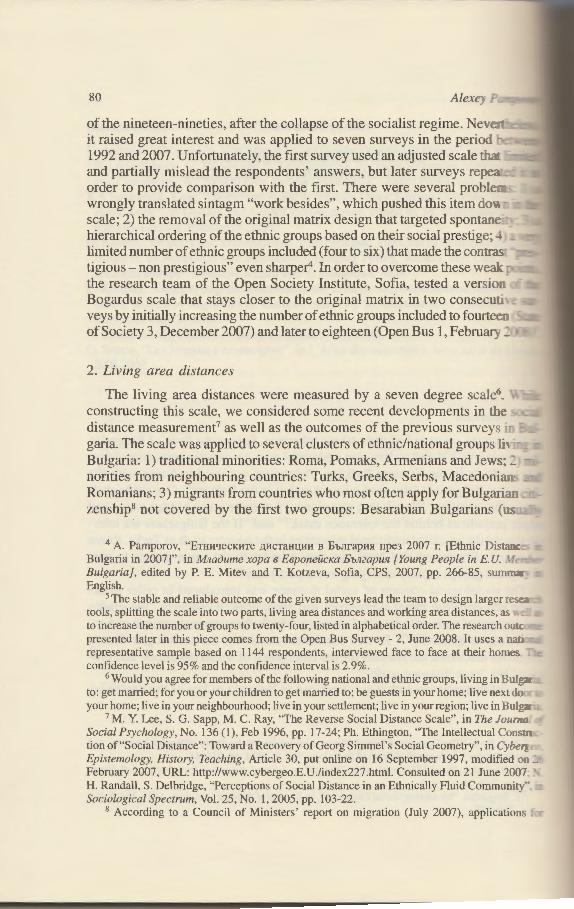
Fig. 1 Proportion of "yes" responses to the question: "Would you agree for yourself or your children to marry (minority)?"
EU citizens 42.7% Russians 36.9%
Englishmen 34.4% Besarabian Bulgarians 28.7%
Macedonians 26.0% Serbs 25.7%
Armenians 24.2% Greeks 24.1%
Pomaks 22.6% Ukrainians 21.7%
Turks 21.7%
Romanians 21.3% Jews 20%
Japanese 16.7% Roma 13.6%
Chinese 12.5% Vietnamese
QO
11.5% Q Q
Albanians 11.5% t"'-1 ~
Arabs 11.4% c: =
U.S. & E.U. of African desc. 11.1 % ......
Latin Americans of African desc. 10.7% ei
!;: 0
Kurds 10.7% rJ? -Sub-Saharan Africans 10.3% 00 0
_.,----..
citizens of Moldova or Ukraine), Ukrainians, Russians and Albanians; 4) migrants from South Eastern Asia- Japanese, Chinese and Vietnamese; 5) migrants that are typical for the European Union countries - Arabs, Kurds and Sub-Saharan Africans9
• However, in order to test a hypothesis that some Bulgarians may have a certain degree of racist attitudes towards black immigrants, we included both Latin Americans of African descent and U.S. and E.U. citi-zens of African descent. Moreover, in order to measure the feeling of affiliation with the E.U., we also included in the list the generalized description "E.U. citizens". The list of ethnic groups and nationalities was completed by Bulgarians as a majority group and by Britons, because Britons constitute a significant number of the new immigrants in Bulgaria, although they do not apply for citizenship 10
•
Bulgarian citizenship for 2006 range as follows: Macedonia- 8240, Moldova- 2467, Serbia- 716, Israel - 508, Ukraine- 506, Russia- 439, Albania- 421.
9 The Bulgarian version of the study uses the term "negroes" [negri], which is in common use in Bulgaria and has no pejorative meaning. The offensive term is the Bulgarian word for "black".
10 According to a Council of Ministers' report on migration (July 2007), the applications for
82 Alexey Pampor
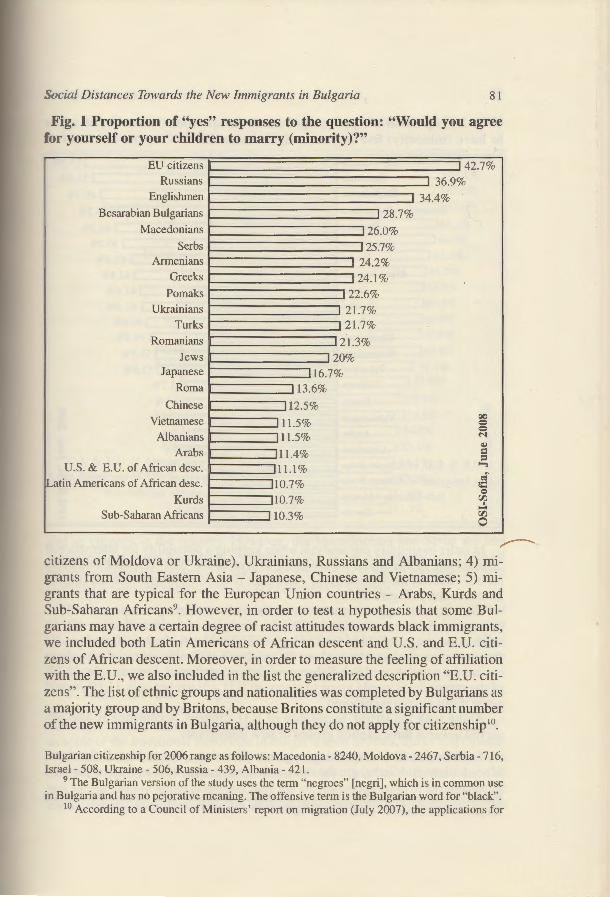
Fig. 2 Proportion of "yes" responses to the question: "Would you agrh to have (minority) live in your neighbourhood?"
EU citizens 53 .~ -
Russians Sl.Sq Englishmen 49.1 'k
Besarabian Bulgarians 46.5% Pomaks 46.2%
Armenians 45.2% Turks 43 .6%
Macedonians 42.8% Serbs 41.9%
Greeks 41.3% Jews 40.6%
Ukrainians 39.4%
Romanians 38.5% Japanese 37.8% Chinese 31.7%
Roma 31.3% QC
Vietnamese 30.3% 0 0
Arabs 29.9% M Q,l
Albanians 29.0% c :I
U.S. & E.U. of African desc. 28.4% ,...., of
Latin Americans of African desc. 28.1 % 0:: 0
Sub-Saharan Africans 27.4% "'? .... Kurds 26.6%
rJ)
------
0
In order to simplify our analysis while keeping a possibility for international comparison, in this article we are going to present the "yes" response outcome for only three of the studied items- marriage (Figure 1), neighbourhood (Figure 2) and country (Figure 3).
The outcome suggests lowest social distances and strong acceptance ofE.U. citizens in all degrees of the scale. This is a clear sign of the identification ofE.U. citizens as "our people" and for a lack of or minimal level of ethnic prejudices. At the same time, the hypothesis about the existence of significant racial prejudices toward the population of Sub-Saharan origin was confirmed. For example, 42.7o/c of the respondents would agree to marry an E. U. citizen but only 11.1% would agree if this citizen is coloured.
Along with the strong acceptance of E.U. citizens, acceptance is also observed towards three explicit groups of new immigrants:
1. Orthodox Slavic speaking migrants (Russians, Besarabian Bulgarians, Macedonians and Serbs) are the most welcomed group, both as marital partners
Bulgarian residence permits for 2006 range as follows: Macedonia- 2252, Turkey- 2051 , United Kingdom- 1840, Russia- 1075, Greece- 697.
g
.:
J..
.r.
I
I
I
.1/ Distances Towards the New Immigrants in Bulgaria 83
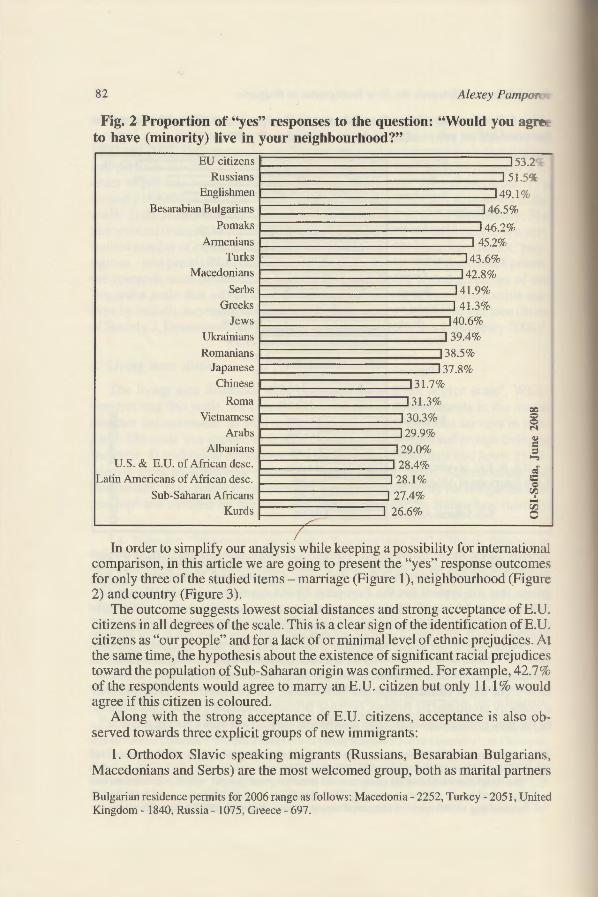
Jg. 3 Proportion of "yes" responses to the question: "Would you agree have (minority) live in Bulgaria?"
EU citizens 71.7% Pomaks 67.6%
Russians 67.0% Besarabian Bulgarians 67.0%
Armenians =::J65.3% Englishmen :=::l64.7%
Macedonians 63.5% Serbs ::::J61.8%
Greeks 61.5% Turks ::=::161.5%
Japanese :::::160.9% Jews ::::J60.8%
Ukrainians ::::J60.8% Romanians ::J 58.1 %
Roma :J 57.3%
Chinese ]55.9% ClO
Vietnamese ]55.8% Q Q
Arabs 54.0% M
~
Albanians 53.1 % c = ....,
U.S. & E.U. of African desc. 52.5% ci / 1;_atin Americans of African desc. 52.2% 1.:: 0
Sub-Saharan Africans 51.9% '1 .... I Kurds 51.3% 00
0 ---- --
:md as citizens in the country. However, the Macedonians and Serbs are less preferred than some traditional minorities (such as the Armenians and Turks) if neighbourhood co-residence is taken into account. It is worth mentioning here that the Ukrainians, surprisingly, do not belong to this group.
2. There are two clusters of ethnicities forming the aggregate of the most unwelcome ethnicities: (a) people of African heritage, regardless of their region of origin: Africa, Latin America or E.U. and U.S.; (b) Muslim immigrants: Albanians, Arabs and Kurds. The Kurds are the most unwelcome immigrant group from all ethnic groups included in the survey questionnaire.
3. South East Asians- Japanese, Chinese and Vietnamese- form a cluster of somewhat unwelcome immigrants. Moreover, Japanese are not so desired for marriage, but as citizens of the country they should be considered as "welcome" as some of the traditional minorities in Bulgaria such as Jews, Turks and Greeks.
Besides the overall trend of the survey, there are some notable differences observed from a socio-demographic point of view. In order to fit the format of this article, we are going to present only the average proportion of agreement for each category, after excluding the answers concerning Bulgarian majority. The
84 Alexey Pam
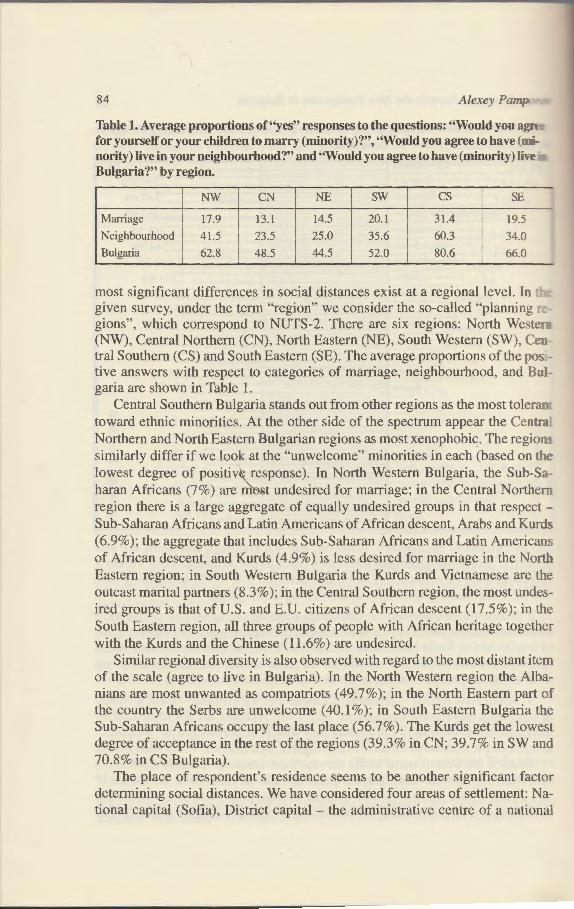
Table 1. Average proportions of"yes" responses to the questions: "Would you for yourself or your children to marry (minority)?", "Would you agree to have ( nunority) live in your neighbourhood?" and "Would you agree to have (minority) lh t: Bulgaria?" by region.
NW CN NE sw cs SE
Marriage 17.9 13.1 14.5 20.1 31.4 19.5
Neighbourhood 41.5 23.5 25 .0 35.6 60.3 34.0
Bulgaria 62.8 48.5 44.5 52.0 80.6 66.0 - - - ·-
most significant differences in social distances exist at a regional level. In given survey, under the term "region" we consider the so-called "planning ,, -gions", which correspond to NUTS-2. There are six regions: North Weste. (NW), Central Northern (CN), North Eastern (NE), South Western (SW), Ce tral Southern (CS) and South Eastern (SE). The average proportions of the po~ ,_ tive answers with respect to categories of marriage, neighbourhood, and Bu.,garia are shown in Table 1.
Central Southern Bulgaria stands out from other regions as the most tolera.-: toward ethnic minorities. At the other side of the spectrum appear the Centr. 1
Northern and North Eastern Bulgarian regions as most xenophobic. The regior. similarly differ if we look at the "unwelcome" minorities in each (based on th lowest degree of positivfl\. response). In North Western Bulgaria, the Sub-Sc.haran Africans (7%) are nmst undesired for marriage; in the Central Northerr region there is a large aggregate of equally undesired groups in that respect -Sub-Saharan Africans and Latin Americans of African descent, Arabs and Kurd (6.9% ); the aggregate that includes Sub-Saharan Africans and Latin American of African descent, and Kurds (4.9%) is less desired for marriage in the North Eastern region; in South Western Bulgaria the Kurds and Vietnamese are the outcast marital partners (8.3% ); in the Central Southern region, the most undesired groups is that of U.S. and E.U. citizens of African descent (17 .5% ); in the South Eastern region, all three groups of people with African heritage together with the Kurds and the Chinese (11.6%) are undesired.
Similar regional diversity is also observed with regard to the most distant item of the scale (agree to live in Bulgaria). In the North Western region the Albanians are most unwanted as compatriots (49.7%); in the North Eastern part of the country the Serbs are unwelcome (40.1 %); in South Eastern Bulgaria the Sub-Saharan Africans occupy the last place (56.7% ). The Kurds get the lowest degree of acceptance in the rest of the regions (39.3% in CN; 39.7% in SW and 70.8% in CS Bulgaria).
The place of respondent's residence seems to be another significant factor determining social distances. We have considered four areas of settlement: National capital (Sofia), District capital -the administrative centre of a national
Distances Towards the New Immigrants in Bulgaria 85
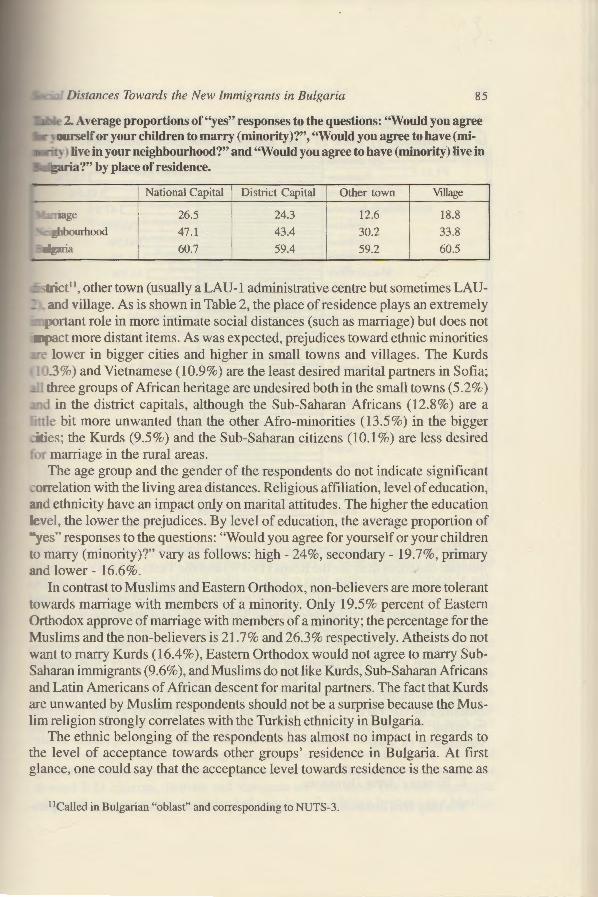
1. Average proportions of "yes" responses to the questions: "Would you agree _ourself or your children to marry (minority)?", "Would you agree to have (mi-- ~I live in your neighbourhood?" and "Would you agree to have (minority) live in
·a?" by place of residence.
National Capital District Capital Other town Village
'.!::_....,..tge 26.5 24.3 12.6 18.8
'-! ;:~bourhood 47.1 43.4 30.2 33.8
~a 60.7 59.4 59.2 60.5
ct 11, other town (usually a LAU-1 administrative centre but sometimes LAU
- . ..illd village. As is shown in Table 2, the place of residence plays an extremely portant role in more intimate social distances (such as marriage) but does not pact more distant items. As was expected, prejudices toward ethnic minorities
e lower in bigger cities and higher in small towns and villages. The Kurds 111.3%) and Vietnamese (I 0.9%) are the least desired marital partners in Sofia; . three groups of African heritage are undesired both in the small towns (5.2%) J in the district capitals, although the Sub-Saharan Africans (12.8%) are a
··le bit more unwanted than the other Afro-minorities (13.5%) in the bigger 1es; the Kurds (9.5%) and the Sub-Saharan citizens (10.1%) are Jess desired r marriage in the rural areas. The age group and the gender of the respondents do not indicate significant
wrrelation with the living area distances. Religious affiliation, level of education, :md ethnicity have an impact only on marital attitudes. The higher the education evel, the lower the prejudices. By level of education, the average proportion of
··yes" responses to the questions: "Would you agree for yourself or your children o marry (minority)?" vary as follows: high- 24%, secondary- 19.7%, primary
Jlld lower- 16.6%. In contrast to Muslims and Eastern Orthodox, non-believers are more tolerant
towards marriage with members of a minority. Only 19.5% percent of Eastern Orthodox approve of marriage with members of a minority; the percentage for the :\1uslims and the non-believers is 21.7% and 26.3% respectively. Atheists do not want to marry Kurds (16.4%), Eastern Orthodox would not agree to marry SubSaharan immigrants (9 .6% ), and Muslims do not like Kurds, Sub-Saharan Africans and Latin Americans of African descent for marital partners. The fact that Kurds are unwanted by Muslim respondents should not be a surprise because the Muslim religion strongly correlates with the Turkish ethnicity in Bulgaria.
The ethnic belonging of the respondents has almost no impact in regards to the level of acceptance towards other groups' residence in Bulgaria. At first glance, one could say that the acceptance level towards residence is the same as
11 Called in Bulgarian "oblast" and corresponding to NUTS-3.
86 Alexey Pamp•
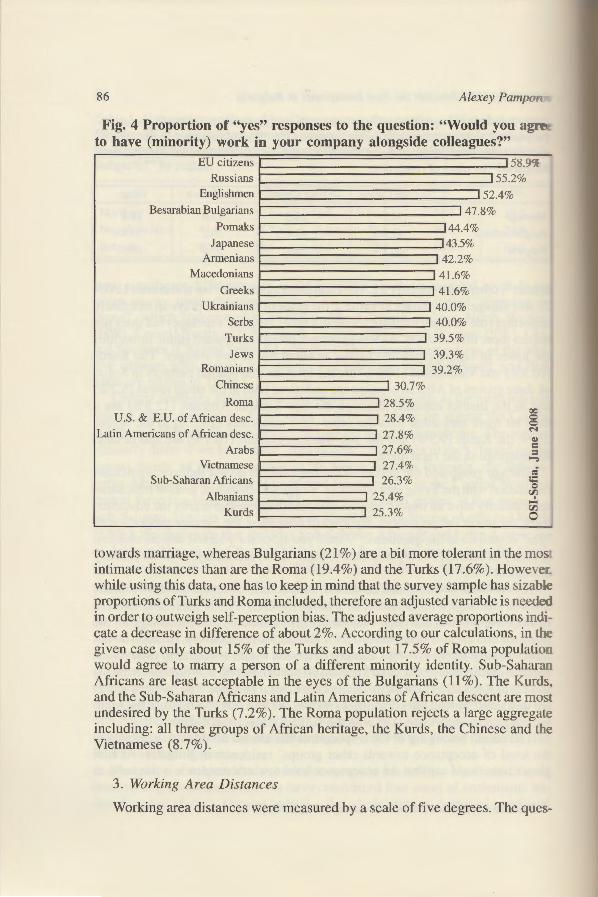
Fig. 4 Proportion of "yes" responses to the question: "Would you agrt.:: to have (minority) work in your company alongside colleagues?"
EU citizens 58.9' Russians 55.2'X-
Englishmen 52.4% Besarabian Bulgarians 47.8%
Pomaks 44.4% Japanese 43.5%
Armenians 42.2% Macedonians 41.6%
Greeks 41.6% Ukrainians 40.0%
Serbs 40.0%
Turks 39.5%
Jews 39.3% Romanians 39.2%
Chinese 30.7%
Roma 28.5% ~
U.S. & E.U. of African desc. 28.4% c c Latin Americans of African desc. 27.8%
N
"' Arabs 27.6% = Vietnamese 27.4%
Sub-Saharan Africans 26.3% li:
Albanians 25.4% ~ ~ Kurds 25 .3% c
'--
towards marriage, whereas Bulgarians (21 %) are a bit more tolerant in the mo · intimate distances than are the Roma (19.4%) and the Turks (17.6%). However while using this data, one has to keep in mind that the survey sample has sizable proportions of Turks and Roma included, therefore an adjusted variable is neede~ in order to outweigh self-perception bias. The adjusted average proportions indicate a decrease in difference of about 2%. According to our calculations, in the given case only about 15% of the Turks and about 17.5% of Roma populatior would agree to marry a person of a different minority identity. Sub-Sahara.-:. Africans are least acceptable in the eyes of the Bulgarians (11 %). The Kurd . and the Sub-Saharan Africans and Latin Americans of African descent are mo:,> undesired by the Turks (7.2%). The Roma population rejects a large aggregate including: all three groups of African heritage, the Kurds, the Chinese and the Vietnamese (8.7%).
3. Working Area Distances
Working area distances were measured by a scale of five degrees. The que' -
~ ;::"f
~
-7.
~
e'-
jl
I I
tal Distances Towards the New Immigrants in Bulgaria 87
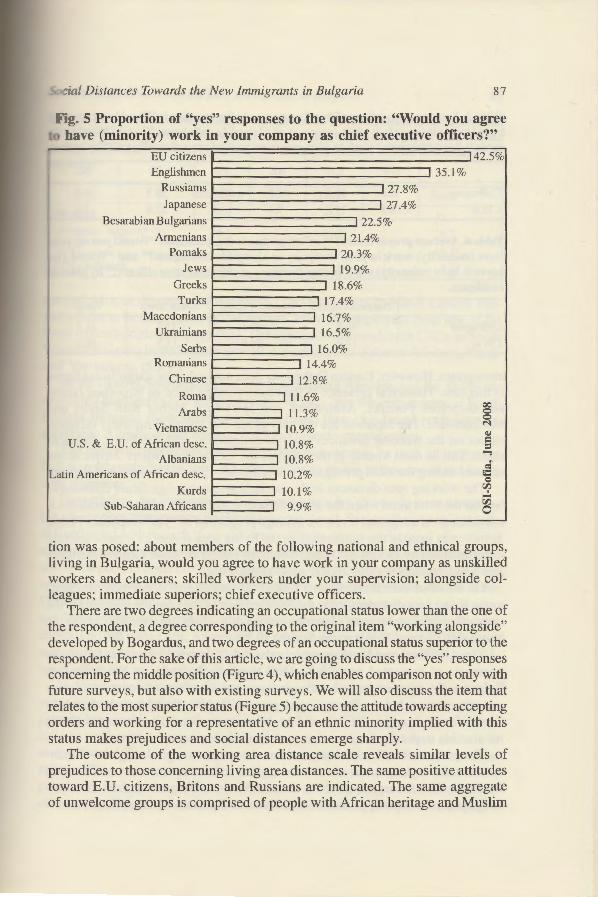
Fig. 5 Proportion of "yes" responses to the question: "Would you agree have (minority) work in your company as chief executive officers?"
EU citizens 42.5%1
Englishmen 35.1% Russiams 27.8% Japanese 27.4%
Besarabian Bulgarians 22.5% Armenians 21.4%
Pomaks 20.3% Jews 19.9%
Greeks 18.6% Turks 17.4%
Macedonians 16.7% Ukrainians 16.5%
Serbs 16.0% Romanians 14.4%
Chinese 12.8%
Roma 11.6% QO
Arabs 11.3% <:> <:>
Vietnamese 10.9% N
j ~
U.S. & E.U. of African desc. 10.8% = = ~ Albanians 10.8% .;
Latin Americans of African desc. 10.2% c 0
Kurds 10.1 % '1 .... Sub-Saharan Africans 9.9% 00
0
tion was posed: about members of the following national and ethnical groups, living in Bulgaria, would you agree to have work in your company as unskilled workers and cleaners; skilled workers under your supervision; alongside colleagues; immediate superiors; chief executive officers.
There are two degrees indicating an occupational status lower than the one of the respondent, a degree corresponding to the original item "working alongside" developed by Bogardus, and two degrees of an occupational status superior to the respondent. For the sake of this article, we are going to discuss the "yes" responses concerning the middle position (Figure 4 ), which enables comparison not only with future surveys, but also with existing surveys. We will also discuss the item that relates to the most superior status (Figure 5) because the attitude towards accepting orders and working for a representative of an ethnic minority implied with this status makes prejudices and social distances emerge sharply.
The outcome of the working area distance scale reveals similar levels of prejudices to those concerning living area distances. The same positive attitudes toward E.U. citizens, Britons and Russians are indicated. The same aggregate of unwelcome groups is comprised of people with African heritage and Muslim
88
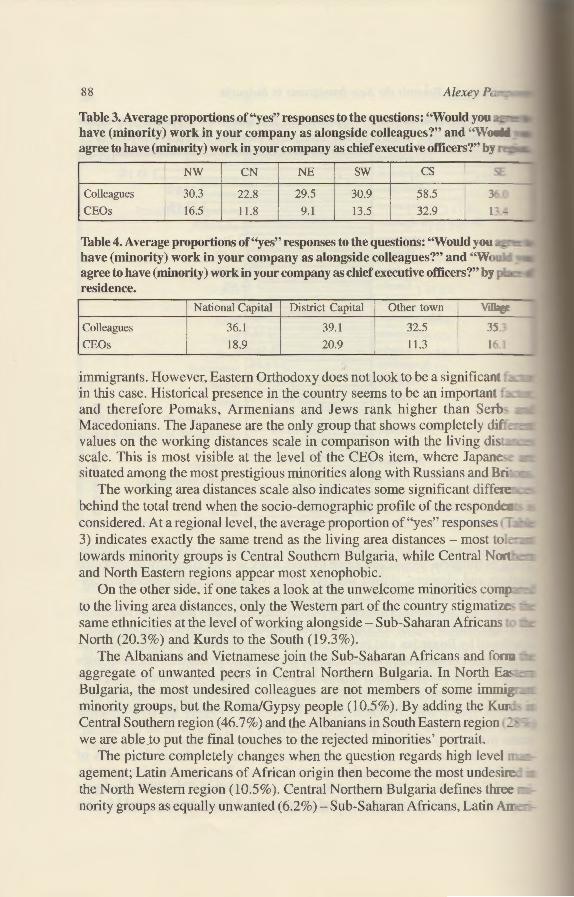
Table 3. Average proportions of ''yes" responses to the questions: ''Would you . have (minority) work in your company as alongside colleagues?" and "Wo agree to have (minority) work in your company as chief executive officers?" b~
NW CN NE sw cs ~
Colleagues 30.3 22.8 29.5 30.9 58.5 36.C CEOs 16.5 11.8 9.1 13.5 32.9 ~ ~ !
Table 4. Average proportions of ''yes" responses to the questions: "Would you az: have (minority) work in your company as alongside colleagues?" and "Wo agree to have (minority) work in your company as chief executive officers?" b~ residence.
National Capital District Capital Other town \ -4'!
Colleagues 36.1 39.1 32.5 35. ~
CEOs 18.9 20.9 11.3 16.1
immigrants. However, Eastern Orthodoxy does not look to be a significan· -in this case. Historical presence in the country seems to be an important · and therefore Pomaks, Armenians and Jews rank higher than Serb Macedonians. The Japanese are the only group that shows completely d1: values on the working distances scale in comparison with the living di scale. This is most visible at the level of the CEOs item, where Japane situated among the most prestigious minorities along with Russians and B -
The working area distances scale also indicates some significant diffe.~ behind the total trend when the socio-demographic profile of the respondeconsidered. At a regional level, the average proportion of "yes" response" T; 3) indicates exactly the same trend as the living area distances - most t1 ~
towards minority groups is Central Southern Bulgaria, while Central f\, ·;-and North Eastern regions appear most xenophobic.
On the other side, if one takes a look at the unwelcome minorities corr: to the living area distances, only the Western part of the country stigmatize same ethnicities at the level of working alongside- Sub-Saharan African• · North (20.3%) and Kurds to the South (19.3%).
The Albanians and Vietnamese join the Sub-Saharan Africans and fo .. aggregate of unwanted peers in Central Northern Bulgaria. In North E Bulgaria, the most undesired colleagues are not members of some imm.= minority groups, but the Roma/Gypsy people (10.5%). By adding the Ku:Central Southern region ( 46.7%) and the Albanians in South Eastern region .: we are able to put the final touches to the rejected minorities' portrait.
The picture completely changes when the question regards high level . agement; Latin Americans of African origin then become the most undesw the North Western region (10.5%). Central Northern Bulgaria defines thrtX nority groups as equally unwanted (6.2%)- Sub-Saharan Africans, Latin A
Distances Towards the New Immigrants in Bulgaria 89
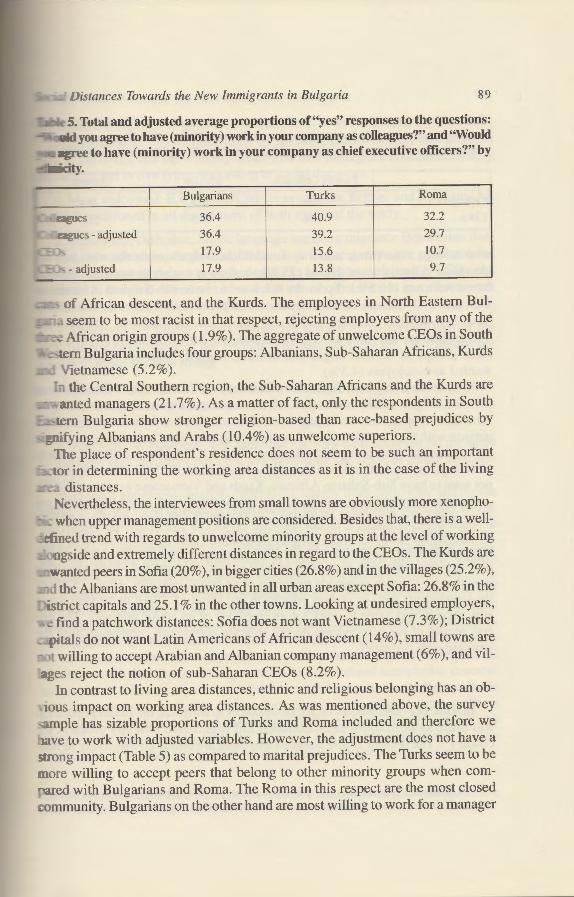
5. Total and adjusted average proportions of"yes" responses to the questions: .._.1.'1 you agree to have (minority) work in your company as coUeagues?" and ''Would
ee to have (minority) work in your company as chief executive officers?" by • "t~y.
Bulgarians Turks Roma
36.4 40.9 32.2
36.4 39.2 29.7
17.9 15.6 10.7
-adjusted 17.9 13.8 9.7
f African descent, and the Kurds. The employees in North Eastern Bul-eem to be most racist in that respect, rejecting employers from any of the
~~African origin groups (1.9%). The aggregate of unwelcome CEOs in South em Bulgaria includes four groups: Albanians, Sub-Saharan Africans, Kurds 'ietnamese (5.2%).
n the Central Southern region, the Sub-Saharan Africans and the Kurds are anted managers (21. 7% ). As a matter of fact, only the respondents in South ern Bulgaria show stronger religion-based than race-based prejudices by
_ .. lfying Albanians and Arabs (10.4%) as unwelcome superiors. The place of respondent's residence does not seem to be such an important or in determining the working area distances as it is in the case of the living
~ .... distances . . -;evertheless, the interviewees from small towns are obviously more xenopho-
~ ''hen upper management positions are considered. Besides that, there is a well!ned trend with regards to unwelcome minority groups at the level of working ngside and extremely different distances in regard to the CEOs. The Kurds are ·'anted peers in Sofia (20% ), in bigger cities (26.8%) and in the villages (25.2% ), the Albanians are most unwanted in all urban areas except Sofia: 26.8% in the trict capitals and 25.1% in the other towns. Looking at undesired employers,
c find a patchwork distances: Sofia does not want Vietnamese (7 .3% ); District itals do not want Latin Americans of African descent (14%), small towns are
twilling to accept Arabian and Albanian company management (6% ), and vil=:es reject the notion of sub-Saharan CEOs (8.2% ).
In contrast to living area distances, ethnic and religious belonging has an obwus impact on working area distances. As was mentioned above, the survey ..1mple has sizable proportions of Turks and Roma included and therefore we
ve to work with adjusted variables. However, the adjustment does not have a rrong impact (Table 5) as compared to marital prejudices. The Turks seem to be ~ore willing to accept peers that belong to other minority groups when com
ared with Bulgarians and Roma. The Romain this respect are the most closed ~ommunity. Bulgarians on the other hand are most willing to work for a manager
90 Alexey Pampor-
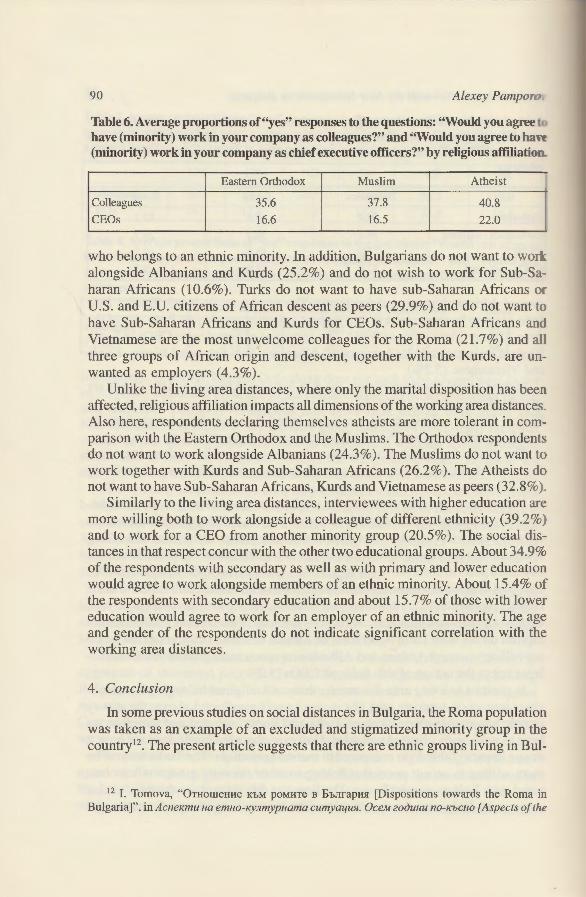
Table 6. Average proportions of"yes" responses to the questions: "Would you agree t have (minority) work in your company as colleagues?" and ''Would you agree to ha' (minority) work in your company as chief executive officers?" by religious affiliatio
Eastern Orthodox Muslim Athei st
Colleagues 35.6 37.8 40.8
CEOs 16.6 16.5 22.0 I who belongs to an ethnic minority. In addition, Bulgarians do not want to wor alongside Albanians and Kurds (25.2%) and do not wish to work for Sub-Saharan Africans (10.6%). Turks do not want to have sub-Saharan Africans or U.S . and E.U. citizens of African descent as peers (29.9%) and do not want tc have Sub-Saharan Africans and Kurds for CEOs. Sub-Saharan Africans and Vietnamese are the most unwelcome colleagues for the Roma (21.7%) and al! three groups of African origin and descent, together with the Kurds, are unwanted as employers (4.3%).
Unlike the living area distances, where only the marital disposition has been affected, religious affiliation impacts all dimensions of the working area distance~.
Also here, respondents deClaring themselves atheists are more tolerant in comparison with the Eastern Orthodox and the Muslims. The Orthodox respondent do not want to work alongside Albanians (24.3%). The Muslims do not want to work together with Kurds and Sub-Saharan Africans (26.2%). The Atheists do not want to have Sub-Saharan Africans, Kurds and Vietnamese as peers (32.8% ).
Similarly to the living area distances, interviewees with higher education are more willing both to work alongside a colleague of different ethnicity (39.2%) and to work for a CEO from another minority group (20.5% ). The social distances in that respect concur with the other two educational groups. About 34.9% of the respondents with secondary as well as with primary and lower education would agree to work alongside members of an ethnic minority. About 15.4% of the respondents with secondary education and about 15.7% of those with lower education would agree to work for an employer of an ethnic minority. The age and gender of the respondents do not indicate significant correlation with the working area distances.
4. Conclusion
In some previous studies on social distances in Bulgaria, the Roma population was taken as an example of an excluded and stigmatized minority group in the countryl 2
• The present article suggests that there are ethnic groups living in Bul-
12 I. Tomova, "OTHOWeHHe KbM pOMHTe B bbJJrapH» [Dispositions towards the Roma in Bulgaria]", in AcneKmu Ha emHo-KyRmypHama cumya!JWI. OceM zoouHu no-KoCHO [Aspects of the
Distances Towards the New Immigrants in Bulgaria 9 I
that are exposed to greater prejudice. emg small size communities, they are invisible victims of intolerant attitudes :n the living and the worldng areas. The new immigrant communities may egorized in five types, according to social distances:
~lost welcomed: E.U. White/Caucasian citizens, Britons and Russians. All ell positioned in all dimensions of both scales of the study. _
.: Welcomed; Orthodox, Slavic language spealdng migrants: Besarabian Bul.illS. Macedonians, Serbs and Ukrainians. These groups are preferred for
:nage and as colleagues to work alongside, but not as welcome as CEOs and ents in Bulgaria. The level of social distances places them in a cluster with
Hional minorities, such as the Armenians and Jews.
3. Unwelcome:Chinese. The Chinese are always in the second part of the list but never settle at the bottom. The distances toward the Chinese are
lar to those towards Roma .
..+.Most Unwelcome: All groups of African origin regardless of their citizenp: all Muslim immigrant groups- Arabs, Albanians and Kurds; Vietnamese. ese groups settled at the bottom of the ranldng.
-. Ambivalent: Japanese. The Japanese are very well accepted on the scale · worldng area distances but very low settled on the scale of living area dis
.1nces. Bulgaria's geographic regions differ significantly from each other and region
ems to be the most important determinant factor regarding prejudice levels. Therefore, we would like to call the decision maker's attention to the need for regionally integrated policies towards combating stereotypes and prejudices, es
cially focusing on negative attitudes in Central Northern and North Eastern Bulgaria. This should be taken into account also by the authorities in small towns.
It appears that ethnic Bulgarians have at least a partial right to be proud of lheir ethnic tolerance, as far as they appear quite tolerant towards significant mtercultural mile-stones- those of marriage and accepting others' superiority in lhe workplace. In that respect some extensive policy work with Roma is needed. On one hand they are victim of prejudices- taking the last place of the traditional minorities- on the other hand they seem to be a closed and xenophobic community, which is tolerant only to the traditional minorities and absolutely rejects the new immigrants. As a matter of fact, the entire society needs intense work on fighting racial prejudice, a need visible through the positions of people of African origin (even those coming from the E.U. and U.S.) in all dimensions of both scales as well as from the position of the Japanese on the living area scale.
Ethno-Cultural Situation. Eight Years Later], edited by V. Rusanov, Sofia, AKSES/Open Society, 2000, pp. 28 I -3 I 8; A. Pamporov, op. cit.
92 AlexeY P,
ACKNOWLEDGMENTS
I would like to acknowledge the data processing assistance of Dr .. = Belcheva and Petya Braynova. I appreciate the review and comments of 1.
Dimitrova. Her suggestions notably improved the work.
BJBLJOGRAPHY
E. Bogardus, "Measuring Social Distances", in Journal of Applied Sociology. \"ol 1, 1925, pp. 299-309.
E. Bogardus, "Social Distance and its Origins", in Journal of Applied Sociolof:_ Vol. 9, No.9, pp. 216-26.
E. Bogardus, Social Distance, Los Angeles, Antioch Press, 1925. Ph. Ethington, "The Intellectual Construction of "Social Distance": Toward a R~
of Georg Simmel's Social Geometry", in Cybergeo, Epistemology, History, Tel Article 30, put online on 16 September 1997, modified on 26 February 2007. URL /www.cybergeo.eu/index227.html. Consulted on 21 June 2007.
M. Y. Lee, S. G. Sapp, M. C. Ray, "The Reverse Social Distance Scale", in The Jou n Social Psychology, No. 136 (1), Feb. 1996, pp. 17-24.
A. Pamporov, "ETHH4eCKHTe ,nHCTaHUHH B 6bnrapH51 npe3 2007 r. [Ethnic Dis tan~~ Bulgaria in 2007]", in Mllaoume xopa 6 EeponeucKa EbflzapuR [Young People· Member Country Bulgaria], edited by P.-E. Mitev and T Kotzeva, Sofia, CP 266-85.
R. E. Park, "The Concept of Social Distance as Applied to the Study of Racial Atti · and Racial Relations", in Journal of Applied Sociology, Vol. 8, 1924, pp. 339-44.
N.H. Randall, S. Delbridge, "Perceptions of Social Distance in an Ethnically Fluid C munity", in Sociological Spectrum, Vol. 25, No. l, 2005, pp. 103-22.
I. Tomova, "OTHoweHHe KbM pOMHTe B obnrapH51 [Dispositions towards the Rom ... Bulgaria]", in AcneKmu Ha emHo-Ky!lmypHama cumyal{UR. Oce.M zoouHu no-KbCHO [. pects of the Ethno-Cultural Situation. Eight Years Later], edited by V. Rusanov, SoAKSES/Open Society, pp. 281-318.


![TOURISM | Greece - Bulgaria: People & Statistics [GR]](https://static.fdokumen.com/doc/165x107/6321d64d61d7e169b00c591b/tourism-greece-bulgaria-people-statistics-gr.jpg)