Shifts in landslide frequency–area distribution after forest conversion
11
Shifts in landslide frequency–area distribution after forest conversion in the tropical Andes Marie Guns a,b, *, Veerle Vanacker a a Universite ´ catholique de Louvain, Earth and Life Institute, Georges Lemaıˆtre Centre for Earth and Climate Research, Place Louis Pasteur 3 boıˆte L4.03.08, 1348 Louvain-la-Neuve, Belgium b Fund for Scientific Research – FNRS, Rue d’Egmont 5, 1000 Brussels, Belgium Introduction Active mountain ranges are not pristine environments. Anthropogenic disturbances have largely altered the landscape pattern in many mountain ranges worldwide (Lambin et al., 2001). In Andean regions, the intermontane valleys have always been a privileged place to live due to its favourable climatic and topographic conditions. The demographic growth and agrarian land reforms of the last century have though forced rural peasants to migrate towards remote mountain areas characterised by steep slopes (Molina et al., 2008). This spatial redistribution of the rural population induced rapid deforestation (Lambin and Geist, 2003; Hansen et al., 2010). Within South America, Ecuador suffered the highest rate of deforestation (1.7% of the remaining forest area) during the period 2000–2005 (Mosandl et al., 2008). The impact of anthropogenic disturbance on landslide occur- rence has been clearly demonstrated for several case-studies worldwide (Alca ´ ntara-Ayala et al., 2006; Garcı ´a-Ruiz et al., 2010; Guns and Vanacker, 2013). Deforestation (i.e. conversion of native forest to arable land or grassland) has been identified as the main trigger for shallow landslide activity (Glade, 2003). These studies are mainly based on landslide inventories from aerial photographs or remote sensing data, and often focus solely on the total number of landslides. Looking at the total number of landslides alone does not allow one to get a comprehensive insight into the overall anthropogenic impact on landslide denudation (Korup, 2005). The total number of landslides might be unrelated to the overall landslide denudation, as this process is mainly controlled by very large, infrequent landslides (Densmore et al., 1997). This has recently been demonstrated by Brardinoni et al. (2009) for mountain drainage basins in coastal British Columbia, and by Agliardi et al. (2013) for the European Alps. Therefore, it is Anthropocene xxx (2014) xxx–xxx A R T I C L E I N F O Article history: Received 2 October 2013 Received in revised form 11 July 2014 Accepted 4 August 2014 Keywords: Landslides Magnitude–frequency Landslide frequency–area distribution Geomorphic work Land cover change Andes A B S T R A C T The impact of anthropogenic disturbance on landslide occurrence has been clearly demonstrated for several case-studies worldwide. Deforestation has been identified as the main trigger for landslide activity. These studies are mainly based on landslide inventories from aerial photographs or remote sensing data, and often focus solely on the total number of landslides. Looking at the total number of landslides alone does not allow us to get a comprehensive insight into the overall anthropogenic impact on landslide denudation. In this study, we analysed the anthropogenic impact on landslide frequency–area distributions. Three small catchments of about 11–30 km 2 were selected within the Ecuadorian Andes. They have a similar topographic setting but differ in their land cover dynamic. Our data show that human disturbances significantly alter the landslide frequency–area distributions. Human-induced land cover change is associated with an increase of the total number of landslides and a shift of the frequency–area distribution towards smaller landslides. However, the frequency of large landslides is not affected by anthropogenic disturbances. When analysing the geomorphic work realised by landslides in different environments, it becomes clear that the majority of landslide-induced sediment is coming from anthropogenic environments. The strong increase in the frequency of small landslides in anthropogenic environments thus plays an important role in enhancing the overall landslide denudation rate in tropical mountain regions. ß 2014 Elsevier Ltd. All rights reserved. * Corresponding author at: Universite ´ catholique de Louvain, Earth and Life Institute, Georges Lemaı ˆtre Centre for Earth and Climate Research, Place Louis Pasteur 3 boı ˆte L4.03.08, 1348 Louvain-la-Neuve, Belgium. E-mail address: [email protected] (M. Guns). G Model ANCENE-48; No. of Pages 11 Please cite this article in press as: Guns, M., Vanacker, V., Shifts in landslide frequency–area distribution after forest conversion in the tropical Andes. Anthropocene (2014), http://dx.doi.org/10.1016/j.ancene.2014.08.001 Contents lists available at ScienceDirect Anthropocene jo ur n al ho m epag e: ww w.els evier .c om /lo cat e/an c en e http://dx.doi.org/10.1016/j.ancene.2014.08.001 2213-3054/ß 2014 Elsevier Ltd. All rights reserved.
Transcript of Shifts in landslide frequency–area distribution after forest conversion

Anthropocene xxx (2014) xxx–xxx
G Model
ANCENE-48; No. of Pages 11
Shifts in landslide frequency–area distribution after forest conversionin the tropical Andes
Marie Guns a,b,*, Veerle Vanacker a
a Universite catholique de Louvain, Earth and Life Institute, Georges Lemaıtre Centre for Earth and Climate Research, Place Louis Pasteur 3 boıte L4.03.08, 1348
Louvain-la-Neuve, Belgiumb Fund for Scientific Research – FNRS, Rue d’Egmont 5, 1000 Brussels, Belgium
A R T I C L E I N F O
Article history:
Received 2 October 2013
Received in revised form 11 July 2014
Accepted 4 August 2014
Keywords:
Landslides
Magnitude–frequency
Landslide frequency–area distribution
Geomorphic work
Land cover change
Andes
A B S T R A C T
The impact of anthropogenic disturbance on landslide occurrence has been clearly demonstrated for
several case-studies worldwide. Deforestation has been identified as the main trigger for landslide
activity. These studies are mainly based on landslide inventories from aerial photographs or remote
sensing data, and often focus solely on the total number of landslides. Looking at the total number of
landslides alone does not allow us to get a comprehensive insight into the overall anthropogenic impact
on landslide denudation.
In this study, we analysed the anthropogenic impact on landslide frequency–area distributions. Three
small catchments of about 11–30 km2 were selected within the Ecuadorian Andes. They have a similar
topographic setting but differ in their land cover dynamic. Our data show that human disturbances
significantly alter the landslide frequency–area distributions. Human-induced land cover change is
associated with an increase of the total number of landslides and a shift of the frequency–area
distribution towards smaller landslides. However, the frequency of large landslides is not affected by
anthropogenic disturbances. When analysing the geomorphic work realised by landslides in different
environments, it becomes clear that the majority of landslide-induced sediment is coming from
anthropogenic environments. The strong increase in the frequency of small landslides in anthropogenic
environments thus plays an important role in enhancing the overall landslide denudation rate in tropical
mountain regions.
� 2014 Elsevier Ltd. All rights reserved.
Contents lists available at ScienceDirect
Anthropocene
jo ur n al ho m epag e: ww w.els evier . c om / lo cat e/an c en e
Introduction
Active mountain ranges are not pristine environments.Anthropogenic disturbances have largely altered the landscapepattern in many mountain ranges worldwide (Lambin et al., 2001).In Andean regions, the intermontane valleys have always been aprivileged place to live due to its favourable climatic andtopographic conditions. The demographic growth and agrarianland reforms of the last century have though forced rural peasantsto migrate towards remote mountain areas characterised by steepslopes (Molina et al., 2008). This spatial redistribution of the ruralpopulation induced rapid deforestation (Lambin and Geist, 2003;Hansen et al., 2010). Within South America, Ecuador suffered the
* Corresponding author at: Universite catholique de Louvain, Earth and Life
Institute, Georges Lemaıtre Centre for Earth and Climate Research, Place Louis
Pasteur 3 boıte L4.03.08, 1348 Louvain-la-Neuve, Belgium.
E-mail address: [email protected] (M. Guns).
Please cite this article in press as: Guns, M., Vanacker, V., Shifts in lantropical Andes. Anthropocene (2014), http://dx.doi.org/10.1016/j.an
http://dx.doi.org/10.1016/j.ancene.2014.08.001
2213-3054/� 2014 Elsevier Ltd. All rights reserved.
highest rate of deforestation (�1.7% of the remaining forest area)during the period 2000–2005 (Mosandl et al., 2008).
The impact of anthropogenic disturbance on landslide occur-rence has been clearly demonstrated for several case-studiesworldwide (Alcantara-Ayala et al., 2006; Garcıa-Ruiz et al., 2010;Guns and Vanacker, 2013). Deforestation (i.e. conversion of nativeforest to arable land or grassland) has been identified as the maintrigger for shallow landslide activity (Glade, 2003). These studiesare mainly based on landslide inventories from aerial photographsor remote sensing data, and often focus solely on the total numberof landslides. Looking at the total number of landslides alone doesnot allow one to get a comprehensive insight into the overallanthropogenic impact on landslide denudation (Korup, 2005). Thetotal number of landslides might be unrelated to the overalllandslide denudation, as this process is mainly controlled by verylarge, infrequent landslides (Densmore et al., 1997). This hasrecently been demonstrated by Brardinoni et al. (2009) formountain drainage basins in coastal British Columbia, and byAgliardi et al. (2013) for the European Alps. Therefore, it is
dslide frequency–area distribution after forest conversion in thecene.2014.08.001

Table 1General characteristics for the three sites.
Llavircay catchment Pangor catchment
Virgen Yacu catchment Panza catchment
Catchment area 24.80 km2 10.70 km2 29.84 km2
Location Eastern Ecuadorian Cordillera Western Ecuadorian Cordillera
Elevation 2017 m–3736 m 1438 m–4427 m
Geology Phyllite, shale and quartzite Andesite, rhyolite, limestone, conglomerate and chert
Climate Warm and humid Mesothermic semi-humid to humid
Precipitation 1330 mm (few inter-annual variability) 1400 mm (high inter-annual variability)
Forest conversion Rapid deforestation between 1960s and 1970s Deforestation started before 1960s Recent deforestation (still ongoing)
M. Guns, V. Vanacker / Anthropocene xxx (2014) xxx–xxx2
G Model
ANCENE-48; No. of Pages 11
important to include information on the landslide frequency–areadistribution to assess the potential impact of anthropogenicdisturbances on landslide denudation.
Landslide frequency–area distributions quantify the number oflandslides that occur at different sizes (Malamud et al., 2004). Theyhave been used to quantify total denudation by landsliding (Hoviuset al., 1997) or to estimate landslide hazards as landslide size isoften a proxy for landslide magnitude (Galli et al., 2008; Guzzettiet al., 2005, 2006). Two types of landslide inventories are generallyused to estimate the landslide frequency–area distribution of aregion: (i) substantially complete landslide-event inventories thattake into account the majority of landslides triggered by onespecific event (e.g. an earthquake), or (ii) multi-temporal (alsocalled historical) inventories regrouping all landslides observedwithin a specific period of time (Malamud et al., 2004). Sometimeslandslide inventories are divided into two groups: (i) landslidesand (ii) rocks falls (Malamud et al., 2004); or (i) recent and (ii) oldlandslides (Van Den Eeckhaut et al., 2007). To our knowledge, fewauthors used land cover as a distinction between groups to analyselandslide frequency–area distribution.
In this study, the main objective is to analyse the anthropo-genic impact on landslide frequency–area distributions. Threesecondary objectives can be identified: (i) establishing the
Fig. 1. Detailed land cover map of Virgen Yacu catchment for 19
Please cite this article in press as: Guns, M., Vanacker, V., Shifts in lantropical Andes. Anthropocene (2014), http://dx.doi.org/10.1016/j.an
frequency-size characteristics of landslides in this region, (ii)comparing these frequency–size statistics to the existing litera-ture and (iii) discussing the implications of these frequency-sizestatistics on denudation. Our main hypothesis is that anthropo-genic disturbances mainly increase the frequency of smalllandslides, so that the overall landslide-related denudation inactive mountain ranges is sensitive to human-induced vegetationdisturbances. A tectonically active mountain range with rapidland cover change was selected for this study. Within theEcuadorian Andes, three small catchments of about 11–30 km2
were selected. They have a similar topographic setting, and arecharacterised by rapid deforestation in the last five decades.However, they differ in their land cover dynamic (Table 1). InVirgen Yacu, deforestation started before the 1960s, and short-rotation plantations are now the dominant land use pressure(Fig. 1). The Llavircay catchment underwent rapid deforestation inthe 1960s and 1970s, and agricultural land use is now prevalent(Fig. 2). In contrast, the Panza catchment is characterised by arecent deforestation phase, where conversion from natural forestto agricultural land is still ongoing (Fig. 3). Combining the threecatchments allows us to get a complete picture of the potentialimpact of anthropogenic disturbances in land cover for theEcuadorian Andes.
63, 1977, 1989 and 2010. Landslides are represented in red.
dslide frequency–area distribution after forest conversion in thecene.2014.08.001

Fig. 2. Detailed land cover map of Llavircay catchment for 1963, 1973, 1983 and 1995. Landslides (centre of the shear plane) are represented in red.
M. Guns, V. Vanacker / Anthropocene xxx (2014) xxx–xxx 3
G Model
ANCENE-48; No. of Pages 11
Study areas
Three sites were selected for this study (Table 1). The Llavircaycatchment (24 km2), the first site, is located in the EasternEcuadorian Cordillera. The two other study sites, the Virgen Yacuand Panza catchments (respectively 11 and 30 km2) are locatedwithin the Pangor catchment (283 km3) in the Western Cordillera(Fig. 4). Topography is rather similar in the three sites. Elevationvaries from 1438 m to 4427 m in Pangor and from 2017 m to3736 m in Llavircay. Rivers are deeply incised and slope gradientsare very steep (Fig. 4) with half of the slopes having slope gradientsabove 258 in Pangor and with one third of the Llavircay slopesabove the mean angle of internal friction (estimated at 308according to Basabe, 1998). The bedrock geology is composed ofmeta-volcanic and meta-sedimentary rocks; with andesite, rhyo-lite, limestone, conglomerate and chert in Pangor and phyllite,shale and quartzite in Llavircay.
The Pangor catchment is exposed to the Pacific Ocean andinfluenced by El Nino. The climate can be described as equatorialmesothermic semi-humid to humid (Pourrut, 1994). Mean annualprecipitation is about 1400 mm but there is a high inter-annualvariability, with annual precipitation ranging between 475 mm(2002) and 3700 mm (1994) (INAMHI, 2009). On the other hand,the Llavircay catchment is subjected to a warm and humid tropicalclimate (Winckell et al., 1997) with mean annual precipitation ofabout 1330 mm and few inter-annual variability (INAMHI, 2009).
Materials and methods
Land cover maps
Detailed land cover maps of the three sites were constructedfrom aerial photographs, field surveys and a very high resolutionimage (for Pangor only). Aerial photographs at a 1:60,000 scale
Please cite this article in press as: Guns, M., Vanacker, V., Shifts in lantropical Andes. Anthropocene (2014), http://dx.doi.org/10.1016/j.an
were available from the Instituto Geografico Militar for the years1963, 1977 and 1989 (for Pangor) and 1963, 1973, 1983 and 1995(for Llavircay). The very high resolution WorldviewII image wastaken the 10th of September 2010 and has a spatial resolution of2 m for multi-spectral bands and 0.5 m for panchromatic band.Field trips were realised in 2008, 2010 and 2011 to complete andvalidate the detailed land cover mapping. The land coverclassification on aerial photographs was performed manuallyusing a WILD stereoscope following Vanacker et al. (2000). TheWorldview image was classified using visual interpretation ofdifferent false colour composite (band compositing) in ArcGIS.
Spectral response patterns, texture analysis of the photographs(Lillesand and Keifer, 1994; Gagnmon, 1974) and field validationallowed to distinguish eight land cover classes (Figs. 1–3): (i)natural forest, characterised by a very high tree density, (ii)degraded forest, characterised by a medium to low tree density,(iii) bushes or so called matorral, (iv) extensive agricultural landcharacterised by low inputs of labour and capital, (v) intensiveagricultural land, (vi) paramo, (vii) pine plantation and (viii)harvested pines. The land cover on landslide scars was determinedbased on the land cover in the surrounding areas to avoid possiblebias due to any modification of vegetation cover after landslideoccurrence. The land cover information was digitised on orthor-ectified images in ArcGIS software to obtain land cover maps foreach year analysed.
In order to focus on the impact of humans, the eight land coverclasses were regrouped into two broad classes: (i) (semi-)naturalenvironments and (ii) human-disturbed environments. The (semi-)natural land cover is here defined as the land cover that is not oronly slightly affected by anthropogenic disturbances, and iscomposed of natural forest and paramo. The human-disturbedland cover includes all land cover types that result from humanoccupation (degraded forest, matorral, agricultural land and pineplantations).
dslide frequency–area distribution after forest conversion in thecene.2014.08.001
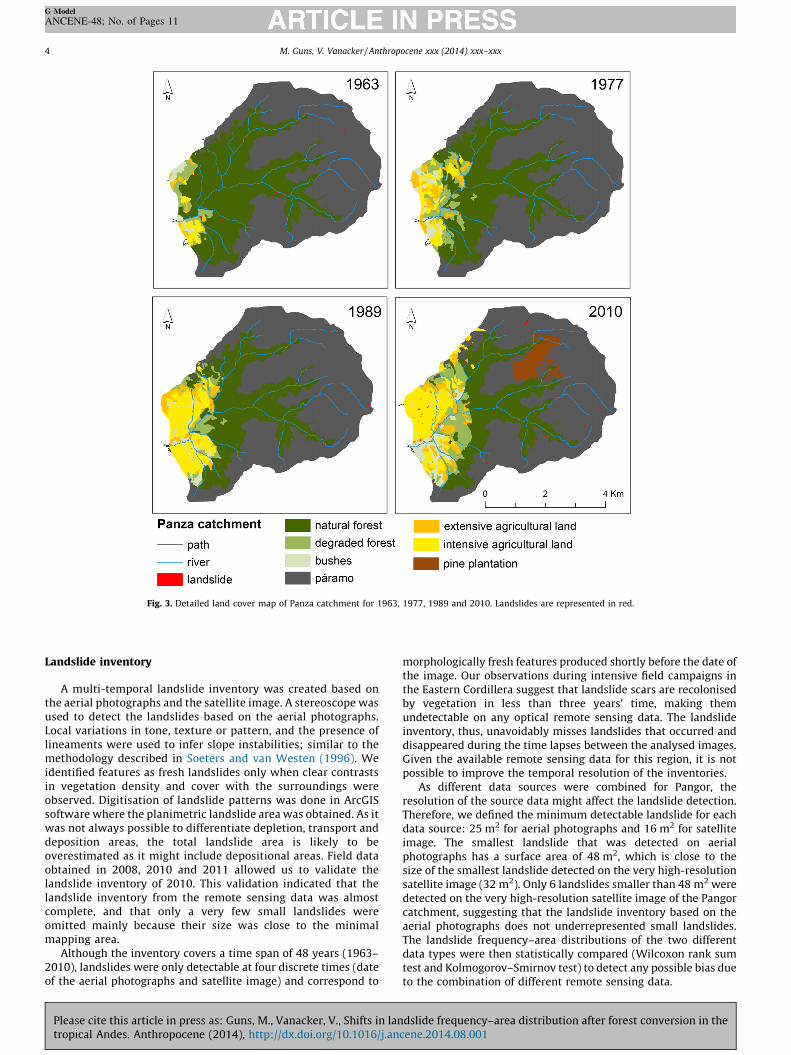
Fig. 3. Detailed land cover map of Panza catchment for 1963, 1977, 1989 and 2010. Landslides are represented in red.
M. Guns, V. Vanacker / Anthropocene xxx (2014) xxx–xxx4
G Model
ANCENE-48; No. of Pages 11
Landslide inventory
A multi-temporal landslide inventory was created based onthe aerial photographs and the satellite image. A stereoscope wasused to detect the landslides based on the aerial photographs.Local variations in tone, texture or pattern, and the presence oflineaments were used to infer slope instabilities; similar to themethodology described in Soeters and van Westen (1996). Weidentified features as fresh landslides only when clear contrastsin vegetation density and cover with the surroundings wereobserved. Digitisation of landslide patterns was done in ArcGISsoftware where the planimetric landslide area was obtained. As itwas not always possible to differentiate depletion, transport anddeposition areas, the total landslide area is likely to beoverestimated as it might include depositional areas. Field dataobtained in 2008, 2010 and 2011 allowed us to validate thelandslide inventory of 2010. This validation indicated that thelandslide inventory from the remote sensing data was almostcomplete, and that only a very few small landslides wereomitted mainly because their size was close to the minimalmapping area.
Although the inventory covers a time span of 48 years (1963–2010), landslides were only detectable at four discrete times (dateof the aerial photographs and satellite image) and correspond to
Please cite this article in press as: Guns, M., Vanacker, V., Shifts in lantropical Andes. Anthropocene (2014), http://dx.doi.org/10.1016/j.an
morphologically fresh features produced shortly before the date ofthe image. Our observations during intensive field campaigns inthe Eastern Cordillera suggest that landslide scars are recolonisedby vegetation in less than three years’ time, making themundetectable on any optical remote sensing data. The landslideinventory, thus, unavoidably misses landslides that occurred anddisappeared during the time lapses between the analysed images.Given the available remote sensing data for this region, it is notpossible to improve the temporal resolution of the inventories.
As different data sources were combined for Pangor, theresolution of the source data might affect the landslide detection.Therefore, we defined the minimum detectable landslide for eachdata source: 25 m2 for aerial photographs and 16 m2 for satelliteimage. The smallest landslide that was detected on aerialphotographs has a surface area of 48 m2, which is close to thesize of the smallest landslide detected on the very high-resolutionsatellite image (32 m2). Only 6 landslides smaller than 48 m2 weredetected on the very high-resolution satellite image of the Pangorcatchment, suggesting that the landslide inventory based on theaerial photographs does not underrepresented small landslides.The landslide frequency–area distributions of the two differentdata types were then statistically compared (Wilcoxon rank sumtest and Kolmogorov–Smirnov test) to detect any possible bias dueto the combination of different remote sensing data.
dslide frequency–area distribution after forest conversion in thecene.2014.08.001

Fig. 4. Slope of Pangor catchment with its two selected subcatchments and Llavircay catchment and their general localisation in Ecuador.
M. Guns, V. Vanacker / Anthropocene xxx (2014) xxx–xxx 5
G Model
ANCENE-48; No. of Pages 11
Landslide frequency–area distribution
Landslide inventories provide evidence that the abundance oflarge landslides in a given area decreases with the increase of the sizeof the triggered landslide. Landslide frequency–area distributionsallow quantitative comparisons of landslide distributions betweenlandslide-prone regions and/or different time periods. Probabilitydistributions model the number of landslides occurring in differentlandslide area (Schlogel et al., 2011). Two landslide distributionswere proposed in literature: the Double Pareto distribution (Starkand Hovius, 2001), characterised by a positive and a negative powerscaling, and the Inverse Gamma distribution (Malamud et al., 2004),characterised by a power-law decay for medium and large landslidesand an exponential rollover for small landslides. To facilitatecomparison of our results with the majority of literature available,we decided to use the maximum-likelihood fit of the Inverse Gammadistribution (Eq. (1) – Malamud et al., 2004).
pðAL; r; a; sÞ ¼ 1
aG ðrÞa
AL � s
� �rþ1
exp � a
AL � s
� �(1)
where AL is the area of landslide, and the parameters r, a and s
control respectively the power-law decay for medium and largevalues, the location of maximum probability, and the exponentialrollover for small values. G(r) is the gamma function of r.
To analyse the potential impact of human disturbances onlandslide distributions, the landslide inventory was split into twogroups. The first group only contains landslides that are located in(semi-)natural environments, while the second group containslandslides located in anthropogenically disturbed environments.The landslide frequency–area distribution was fitted for eachgroup, and the empirical functions were compared statistically
Please cite this article in press as: Guns, M., Vanacker, V., Shifts in lantropical Andes. Anthropocene (2014), http://dx.doi.org/10.1016/j.an
using Wilcoxon and Kolmogorov–Smirnov tests. The webtooldeveloped by Rossi et al. (2012) was used here to estimate theInverse Gamma distribution of the landslide areas directly from thelandslide inventory maps. This tool is available as a standard OpenGeospatial Consortium Web Processing Service.
Geomorphic work
The geomorphic work is defined as the product of magnitudeand frequency and gives the total amount of material displaced bya geomorphic event (Guthrie and Evans, 2007). It allows one toevaluate the influence of high-frequency, low-magnitude events incomparison with infrequent, but high-magnitude events. Themagnitude of the landslide is here approximated by its landslidevolume. The latter is estimated based on the empirical relationship(Eq. (2)) between landslide area and landslide volume establishedin Guns (2013).
V ¼ 0:237A1:42 (2)
where V is the landslide volume (m3) and A is the landslide area (m2).The geomorphic work is then calculated by multiplying the
landslide volume (m3) with the landslide probability density (m�2)and the total number of landslides in the data set.
Results
Land cover change
The land cover is characterised by paramo, natural forest,degraded forest, shrubs and bushes, tree plantations, pasture, andannual crops. Paramo is the natural shrub and grassland found at
dslide frequency–area distribution after forest conversion in thecene.2014.08.001

M. Guns, V. Vanacker / Anthropocene xxx (2014) xxx–xxx6
G Model
ANCENE-48; No. of Pages 11
high altitudes in the tropical equatorial Andes (Luteyn, 1999).Andean and sub-Andean natural forest can be found at remotelocations. It is dominated by trees such as Juglans Regia, Artocarpus
Altilis and Elaeis Guineensis. Degraded forest land is widely present.This secondary forest typically lost the structure and speciescomposition that is normally associated with natural forest. Shrubsand bushes result from an early phase of natural regeneration onabandoned agricultural fields or after wild fires or clearcuts. Treeplantations, only presented in Pangor, are mainly constituted byPinus radiata and Pinus patula. Pastures are destined towards milkproduction and agricultural lands towards crops of potato, maize,wheat and bean (in Pangor only). More details on land cover andland cover change can be found in Guns and Vanacker (2013).
In Llavircay, about half of the natural forest (692 ha) disappearedbetween 1963 and 1995 (Fig. 2) with the highest rate of deforestation(42.5 ha y�1) in the period 1963–1973. A fifth of the total area wasconverted to degraded forest between 1963 and 1995. No land coverchange was observed at the highest altitudes (above 3800 m) wherethe paramo ecosystem was well preserved. The total area of pasturesincreased by 40% between 1963 and 1995, and it covered about onequarter of Llavircay catchment in 1995 (Fig. 2). In Pangor, the twosubcatchments strongly differ in their forest cover dynamics, withrapid deforestation occurring in the Panza catchment and short-rotation plantations in the Virgen Yacu catchment. Land cover changein Virgen Yacu catchment between 1963 and 1989 is rather small incomparison to the 1989–2010 period (Fig. 1). Between 1963 and 1989,the major change observed is an increase of agricultural lands by 6% ofthe total catchment area. However, between 1989 and 2010, plantingof pines modified drastically the landscape: 14% of the total catchmentarea was converted into pine plantations at the detriment of paramograsslands and agricultural lands (Fig. 1). In total, 118 ha of (semi-)natural environments were converted during the last 50 years. Whilenatural or degraded forest is absent in the Virgen Yacu (Fig. 1), itrepresented 40% of total area in Panza catchment in 1963 and 29% in2010 (Fig. 3). Average deforestation rate of natural dense forestbetween 1963 and 2010 equals 0.8%. Forests were mainly converted toagricultural lands (Fig. 3), which increased by 5.7 times in 50 years.Recently 145 ha of paramo were converted into pine plantations. Theintroduction of this exotic tree species was first promoted by theEcuadorian government and, later, by international programs for fuelwood demand, industrial purpose and mitigation climate changeimpacts through carbon sequestration (Farley, 2010; Vanacker et al.,2007; Balthazar et al., 2014).
Landslide inventories
The multi-temporal inventory for Llavircay counts 189 land-slides (Fig. 2) for a total mapped landslide area of 1.8 � 105 m2.According to field observations, the majority of the landslides areshallow landslides with their sliding plane within the regolith. Themulti-temporal inventory for Pangor counts 316 landslides in total
Table 2Landslide characteristics for the three sites based on the historical inventories.
Llavircay catchmen
Year 1963–1995
Catchment area (km2) 24.80
Total number of landslides 189
Total landslide area (m2) 181,766
Landslide density (number of landslides/km2) 7.62
Proportion of region covered by landslides (%) 0.73
Landslide mean area (m2) 962
Landslide median area (m2) 424
Minimum landslide area (m2) 12
Maximum landslide area (m2) 11,054
Please cite this article in press as: Guns, M., Vanacker, V., Shifts in lantropical Andes. Anthropocene (2014), http://dx.doi.org/10.1016/j.an
(Figs. 1 and 3) for a total mapped landslide area of 1.7 � 105 m2 (ofwhich 3 � 104 m2 corresponds to reactivations). 153 landslideswere observed in the Virgen Yacu catchment, and 163 landslides inthe Panza catchment. In contrast to the Llavircay site, fieldobservations revealed the presence of deep-seated bedrocklandslides, mainly located on the riverbanks of incised rivers.
Landslides are on average bigger in the eastern site than in thewestern sites (Table 2). Frattini and Crosta (2013) discussed theeffect of cohesion and friction on landslide size distribution.Following their hypothesis, the larger size of the landslides in theLlavircay basin could be related to the bedrock geology, which iscomposed of phyllite and shales. These rocks are more susceptibleto deep-seated landslides compared to the stiff volcanic rocks ofthe Pangor basin.
Landslide frequency in Llavircay is within the range of thelandslide frequency observed in Pangor subcatchments. Thelandslide frequency is higher in the Virgen Yacu (14.30 land-slides/km2) than in the Panza catchment (5.46 landslides/km2); andthe landslide area is generally larger (median and mean) in theVirgen Yacu catchment (Table 2). A three-week long field validationof the landslide inventory of 2010 indicated that only very few smalllandslides were omitted in the remotely sensed dataset. Therefore,we cannot fully attribute these differences to uncertainties thatcould be associated with landslide detection under forest cover. Ourdata rather suggest this difference in landslide frequency is linked todifferent land cover dynamics between the two catchments. In theVirgen Yacu subcatchment, 10% of the landslides that occurredbetween 1963 and 2010 are detected in the paramo, which can beconsidered as a (semi-)natural environment. All other landslides areobserved in anthropogenic environments with the majority oflandslides (i.e. 70%) in the matorral and 17% of the landslides in shortrotation pine plantations. In contrast, in the Panza subcatchment,34% of the total number of landslides is located in a (semi-)naturalenvironment (i.e. 13% in paramo and 21% in natural dense forest)while 48% of the landslides is observed in agricultural land. InLlavircay, a quarter of the total landslides are observed in naturalenvironments.
Landslide frequency–area distribution
The multi-temporal landslide inventories include raw data thatare derived from different remote sensing data. To ensure that thedata source has no effect on the landslide frequency–areadistribution, landslide inventories of different data sources werecompared. Only the (semi-)natural environments were selected forthis analysis, to avoid confounding with land use effects. Weobserve no significant difference in landslide area between theinventory derived from aerial photographs and the one derivedfrom very high resolution remote sensing data (Wilcoxon rank sumtest: W = 523, p-value = 0.247). Moreover, the landslide frequen-cy–area distributions are independent of the source of the
t Pangor catchment
Virgen Yacu catchment Panza catchment
1963–2010
10.70 29.84
153 163
92,266 76,819
14.30 5.46
0.86 0.26
603 471
335 239
32 37
8522 6423
dslide frequency–area distribution after forest conversion in thecene.2014.08.001

Fig. 5. Landslide frequency–area distribution for Pangor (n = 316) and Llavircay
(n = 189) using maximum-likelihood fit for Inverse Gamma and Double Pareto
distribution.
M. Guns, V. Vanacker / Anthropocene xxx (2014) xxx–xxx 7
G Model
ANCENE-48; No. of Pages 11
landslide inventory data (Kolmogorov–Smirnov test: D = 0.206, p-value = 0.380). As the landslide inventory is not biased by the datasource, we used the total landslide inventories to analyse thelandslide frequency–area distribution. The number of landslideoccurrences in the two sites in the Pangor catchment was too lowto calculate the probability density functions. Therefore, thelandslide inventories from both sites (Virgen Yacu and Panza) werecombined to get a complete landslide inventory that is largeenough to capture the complexity of land cover dynamics presentin the Pangor catchment. However, Llavircay and Pangor (includ-ing Virgen Yacu and Panza) are analysed distinctively as to detectpotential variations resulting from different climatic regimes.
Fig. 5 gives the landslide frequency–area distribution for thelandslide inventories of the Llavircay and Pangor site. It also showsthat the double Pareto distribution of Stark and Hovius (2001) andthe Inverse Gamma distribution of Malamud et al. (2004) providesimilar results. The probability density for medium and largelandslides obeys a negative power law trend. The power law tailexponent (r + 1) is equal for the double Pareto distribution and forthe Inverse Gamma distribution, respectively 2.28 and 2.43 inPangor and 2 and 2.18 in Llavircay (Table 3). The model parameter
Table 4Parameters estimated for the Inverse Gamma model for the probability density of landsli
parenthesis are standard errors (e) of parameter.
Site Type of environment Number of landslides a (e
Llavircay Anthropogenic 142 244
(Semi-)natural 47 890
Pangor Anthropogenic 245 278
(Semi-)natural 71 408
Table 3Parameters estimated for the Inverse Gamma and the double Pareto models for the prob
Panza catchments combined) (n = 316). Values in parenthesis are standard errors (e) of
Site Model a (e) (m2)
Llavircay Inverse Gamma 374.81 (5.20)
Double Pareto –
Pangor Inverse Gamma 310.11 (2.76)
Double Pareto –
Please cite this article in press as: Guns, M., Vanacker, V., Shifts in lantropical Andes. Anthropocene (2014), http://dx.doi.org/10.1016/j.an
values are obtained by maximum likelihood estimation, but theyare similar to those obtained by alternative fitting techniques suchas Kernel Density or Histogram Density estimation. Besides, themodel parameter values that we obtain here for the tropical Andesare very similar to previously published parameter estimates(Malamud et al., 2004; Van Den Eeckhaut et al., 2007). In a reviewof frequency distributions of landslide areas in mountainousregions, Van Den Eeckhaut et al. (2007) showed that the averagevalue of exponent (r + 1) equals 2.3 � 0.56.
A rollover is present for the smallest landslides suggesting,following Guzzetti et al., 2002, that the landslide inventory iscomplete. The size (area) of the most frequent landslide isestimated to range between 102 m2 and 123 m2 (Table 3), andis about 4–5 times the minimum observable landslide size. The sizeof the most abundant landslide in our inventories is smallcompared to those stated in the literature (about 400 m2 forrainfall-triggered event-based landslide inventories and about11,000 m2 for historical landslide inventories, see review in VanDen Eeckhaut et al., 2007). The difference with the historicalinventories is not surprising, as they infer the number of landslidesthat occurred over geological or historical times; and are known tounderestimate the number of small landslides (Guzzetti et al.,2002).
The difference with other rainfall-triggered event-basedinventories (reported in Malamud et al., 2004) is more puzzling.We suggest that the location of the rollover at small landslide sizein our study area can be attributed to the strong humandisturbance in this mountainous environment, but more data onthe area-frequency distribution of rainfall-triggered landslideevents are need to make a conclusive statement.
Discussion
Human impact on landslide frequency–area distribution
To analyse the impact of human disturbances on landslidedistribution, landslide inventories were split into two groups: (i)landslides located in a (semi-)natural environment and (ii)landslides located in an anthropogenic environment. Results ofthe Inverse Gamma model fits are given in Fig. 6A and B. Statisticaltests reveal that the landslide frequency–area distributions aresignificantly different between the two groups (two sampleKolmogorov–Smirnov test: D = 0.4076, p-value = 7.47 � 10�6 forLlavircay and D = 0.173, p-value = 0.0702 for Pangor, with themaximal deviation occurring for the smallest landslide areas). Theparameters controlling power-law decay for medium and largevalues, r, are similar for both distributions in each site (Table 4).
de area in anthropogenic environment and in (semi-)natural environment. Values in
) (m2) s (e) (m2) r + 1 (e) Rollover (m2)
.30 (3.65) �27.14 (1.74) 2.03 (0.14) 93
.50 (58.37) �94.28 (13.62) 2.06 (0.56) 338
.22 (3.28) �13.91 (2.34) 2.41 (0.18) 102
.85 (13.25) �14.29 (11.83) 2.47 (0.32) 151
ability density of landslide area for Llavircay (n = 189) and Pangor (Virgen Yacu and
parameter.
s (e) (m2) r + 1 (e) Rollover (m2)
�49.42 (1.85) 2.18 (0.16) 123
2.56 (1.26) 2.00 (0.15) 102
�17.39 (1.69) 2.43 (0.16) 110
2.95 (1.57) 2.28 (0.10) 104
dslide frequency–area distribution after forest conversion in thecene.2014.08.001

Fig. 6. Landslide frequency–area distribution, landslide volume and geomorphic work for Llavircay (right) and Pangor (left) using landslides located in an anthropogenic
environment (black) and in (semi-) natural environment (green).
M. Guns, V. Vanacker / Anthropocene xxx (2014) xxx–xxx8
G Model
ANCENE-48; No. of Pages 11
A clear shift towards smaller values is observed for landslidesthat are located in anthropogenic environments (black line inFigs. 6A, B and 7). The rollover is estimated at 102 m2 in the humandisturbed environment; and 151 m2 in the (semi-)natural envi-ronment in Pangor (Table 4). The shift is even more visible inLlavircay where the rollover equals 93 m2 in the anthropogenicenvironment and 547 m2 in the (semi-)natural one. Even whentaking the standard errors (1 s.e.) on the three parameter estimatesinto account in the calculation of the rollover, we observe that theshift in rollover values between the anthropogenic and (semi-)natural environment is very robust for Llavircay (where the
Please cite this article in press as: Guns, M., Vanacker, V., Shifts in lantropical Andes. Anthropocene (2014), http://dx.doi.org/10.1016/j.an
rollover ranges between 85 m2 and 102 m2 for an anthropogenicenvironment, and between 239 m2 and 447 m2 for the (semi-)natural environment). A similar finding is obtained for Pangor.Although, with smaller difference between the anthropogenic and(semi-)natural environment, with rollover values between (92 m2
and 112 m2) and between (125 m2 and 182 m2) respectively.This indicates that small landslides are more frequently
observed in anthropogenic environments than in (semi-)naturalones. However, the occurrence of large landslides is not affected byhuman disturbances, as the tails of the landslide frequency–areamodel fits are very similar (Fig. 6A and B). The difference in the
dslide frequency–area distribution after forest conversion in thecene.2014.08.001
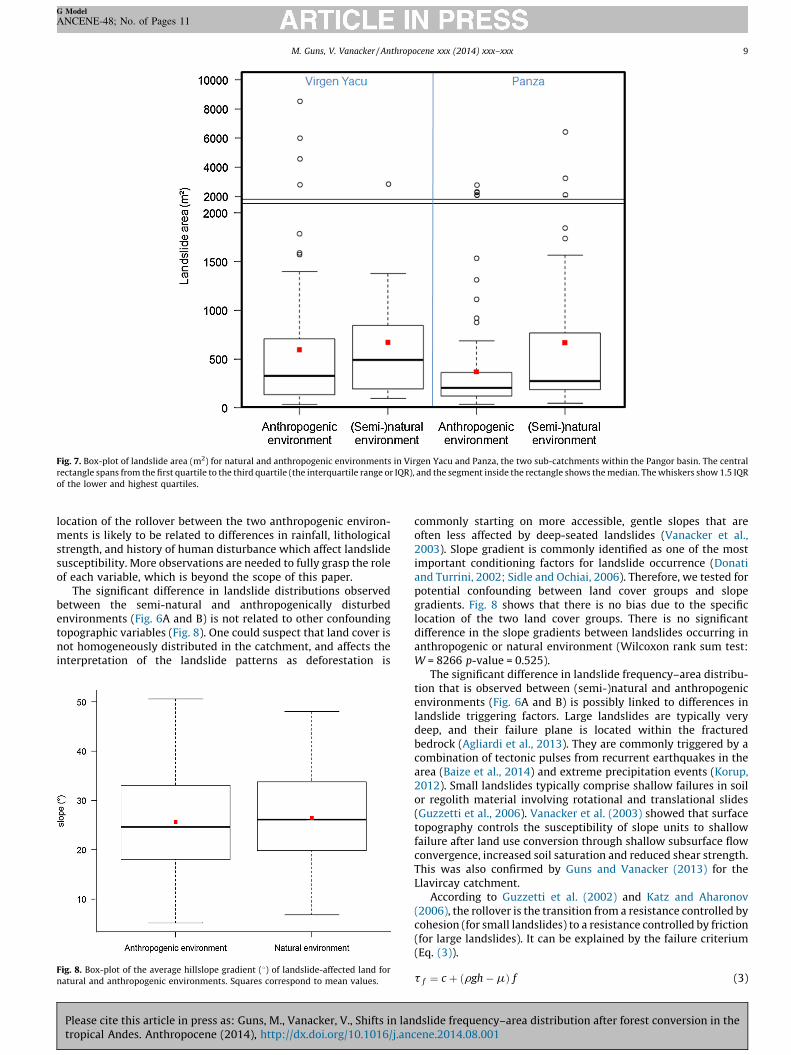
Fig. 7. Box-plot of landslide area (m2) for natural and anthropogenic environments in Virgen Yacu and Panza, the two sub-catchments within the Pangor basin. The central
rectangle spans from the first quartile to the third quartile (the interquartile range or IQR), and the segment inside the rectangle shows the median. The whiskers show 1.5 IQR
of the lower and highest quartiles.
M. Guns, V. Vanacker / Anthropocene xxx (2014) xxx–xxx 9
G Model
ANCENE-48; No. of Pages 11
location of the rollover between the two anthropogenic environ-ments is likely to be related to differences in rainfall, lithologicalstrength, and history of human disturbance which affect landslidesusceptibility. More observations are needed to fully grasp the roleof each variable, which is beyond the scope of this paper.
The significant difference in landslide distributions observedbetween the semi-natural and anthropogenically disturbedenvironments (Fig. 6A and B) is not related to other confoundingtopographic variables (Fig. 8). One could suspect that land cover isnot homogeneously distributed in the catchment, and affects theinterpretation of the landslide patterns as deforestation is
Fig. 8. Box-plot of the average hillslope gradient (8) of landslide-affected land for
natural and anthropogenic environments. Squares correspond to mean values.
Please cite this article in press as: Guns, M., Vanacker, V., Shifts in lantropical Andes. Anthropocene (2014), http://dx.doi.org/10.1016/j.an
commonly starting on more accessible, gentle slopes that areoften less affected by deep-seated landslides (Vanacker et al.,2003). Slope gradient is commonly identified as one of the mostimportant conditioning factors for landslide occurrence (Donatiand Turrini, 2002; Sidle and Ochiai, 2006). Therefore, we tested forpotential confounding between land cover groups and slopegradients. Fig. 8 shows that there is no bias due to the specificlocation of the two land cover groups. There is no significantdifference in the slope gradients between landslides occurring inanthropogenic or natural environment (Wilcoxon rank sum test:W = 8266 p-value = 0.525).
The significant difference in landslide frequency–area distribu-tion that is observed between (semi-)natural and anthropogenicenvironments (Fig. 6A and B) is possibly linked to differences inlandslide triggering factors. Large landslides are typically verydeep, and their failure plane is located within the fracturedbedrock (Agliardi et al., 2013). They are commonly triggered by acombination of tectonic pulses from recurrent earthquakes in thearea (Baize et al., 2014) and extreme precipitation events (Korup,2012). Small landslides typically comprise shallow failures in soilor regolith material involving rotational and translational slides(Guzzetti et al., 2006). Vanacker et al. (2003) showed that surfacetopography controls the susceptibility of slope units to shallowfailure after land use conversion through shallow subsurface flowconvergence, increased soil saturation and reduced shear strength.This was also confirmed by Guns and Vanacker (2013) for theLlavircay catchment.
According to Guzzetti et al. (2002) and Katz and Aharonov(2006), the rollover is the transition from a resistance controlled bycohesion (for small landslides) to a resistance controlled by friction(for large landslides). It can be explained by the failure criterium(Eq. (3)).
t f ¼ c þ ðrgh � mÞ f (3)
dslide frequency–area distribution after forest conversion in thecene.2014.08.001

M. Guns, V. Vanacker / Anthropocene xxx (2014) xxx–xxx10
G Model
ANCENE-48; No. of Pages 11
where tf is the failure shear stress of the landslide’s basal slidingsurface, c is the cohesive strength of the mobilised material, r is thedensity of the soil/rock, g is the Earth’s gravitational acceleration, h
is the depth of the basal surface, m is the water pore pressure in thesoil/rock and f is the coefficient of friction on the basal surface. Thegravitational body force is proportional to the depth (h). For small(and shallow) landslides, the second term of Eq. (3) is small andslope failure is mostly controlled by the cohesive strength.Contrariwise, friction is more important for large (and deep-seated) landslides. Guns and Vanacker (2013) discussed how landcover change induced by human activities can modify soil physicaland hydraulic properties, such as rainfall interception, evapo-transpiration, water infiltration, soil hydraulic conductivity, rootcohesion and apparent cohesion related to suction underunsaturated conditions. By modifying vegetation cover throughagricultural practices, humans modify the root cohesion of soilwhich controls failure resistance of small landslides. This mightexplain the displacement of the rollover on the landslidedistribution as the rollover is suggested to reflect the transitionfrom a resistance controlled by cohesion to a resistance controlledby friction (Guzzetti et al., 2002). The fact that the rollover hereoccurs at rather small landslide areas might result from the thinsoils developed on meta-volcanic and meta-sedimentary rocks.
Human impact on landslide-related denudation
Our results (Fig. 6A and B) showed that human-induced landcover change is associated with an increase of the total number oflandslides and a clear shift of the frequency–area distributiontowards smaller landslides. However, the frequency of largelandslides is not affected by anthropogenic disturbances, as the tailof the empirical probability density model fits is not differentbetween the two environment groups. Graphs C and D (Fig. 6)represent the overall geomorphic work realised by the landslides.
The area under the curve is a first estimate of the total amount ofsediment produced by landslides in each land cover group. In bothsites, landslides that are located in anthropogenic environmentsproduce more sediments than landslides in (semi-)natural environ-ments. However, the most effective geomorphic event, i.e. the peakof the graphs C and D (Fig. 6), is smaller in anthropogenicenvironments. In (semi-)natural environments, the landslides thatare geomorphologically most effective are bigger, but less frequent.
As the frequency probability of smaller anthropogenic landslidesis much higher, the total landslide-produced sediment budget isdominated by sediment produced by anthropogenically-inducedlandslides. This result is consistent for the two sites, Pangor andLlavircay (Fig. 6 graphs C and D). When normalising the geomorphicwork by the total area of anthropogenic or (semi-) naturalenvironments present in each catchment, similar results areobtained. In graphs E and F of Fig. 6, it is shown that the geomorphicwork is mainly produced by landslides located in anthropogenicenvironments. This observation is even stronger in Pangor.
Our data clearly show that the shift in the landslide frequency–area distribution (Fig. 6A and B) due to human impact should betaken into consideration when studying landslide denudation, asthe majority of the landslide produced sediments does not comefrom large landslides. As such, our conclusions do not agree withSugai and Ohmori (2001) and Agliardi et al. (2013) who stated thatlarge and rare landslides dominate geomorphic effectiveness inmountainous areas with significant uplift. The divergence inconclusions may be firstly due to the definition of a large event aswe know that the larger landslides in our two sites are two ordersof magnitude smaller than those reported in earlier studies(Guzzetti et al., 2006; Larsen et al., 2010). Secondly, our frequencystatistics are based on data collected during the last 50 years,period of time during which no giant landslides were observed.
Please cite this article in press as: Guns, M., Vanacker, V., Shifts in lantropical Andes. Anthropocene (2014), http://dx.doi.org/10.1016/j.an
However, field observations of very old landslide scars suggest thatlandslides of two to three orders of magnitude bigger can bepresent in the area. Thus, the time period under consideration inthis study is probably too small to reflect exhaustive observationsof this stochastic natural phenomenon, as it lacks giant landslidesthat can be triggered by seismic activity.
Conclusion
The originality of this study is to integrate anthropogenicdisturbances through historical land cover data in the analysis oflandslide frequency–area distribution. Three sites, located in thetropical Andean catchment, were selected because of their differentland cover dynamics. Landslide inventories and land cover mapswere established based on historical aerial photographs (from 1963to 1995) and on a very high-resolution satellite image (2010).
Our data showed that human disturbances significantly alterthe landslide frequency–area distributions. We observed signifi-cant differences in the empirical model fits between (semi-)naturaland anthropogenic environments. Human-induced land coverchange is associated with an increase of the total number oflandslides and a clear shift of the frequency–area distributiontowards smaller landslides. However, the frequency of largelandslides (104 m2) is not affected by anthropogenic disturbances,as the tail of the empirical probability density model fits is notdifferent between the two environments groups.
When analysing the geomorphic work realised by landslides indifferent environments, it becomes clear that the majority oflandslide-induced sediment is coming from anthropogenic envir-onments. The strong increase in the frequency of small landslidesin anthropogenic environments thus plays an important role inenhancing the overall landslide denudation rate in tropicalmountain regions. As our landslide frequency-magnitude analysisis based on data that were obtained during a 50-year period, theydo not necessarily reflect the long-term change in denudation rateafter human disturbances. More research is needed to get acomprehensive understanding of the impact of human activities onlandslide-induced sediment fluxes on longer time-scales.
Acknowledgements
Data collection and logistic support for this project wasprovided through the Belgian Science Policy, Research Programfor Earth Observation Stereo II, contract SR/00/133, as part of theFOMO project (remote sensing of the forest transition and itsecosystem impacts in mountain environments). M. Guns wasfunded through a PhD fellowship from the Fonds National de laRecherche Scientifique (FRS-FNRS, Belgium), and the Prize forTropical Geography Yola Verhasselt of the Royal Academy forOverseas Sciences (Belgium). The authors would like to thank Dr. A.Molina (University of Goettingen, Germany) and Dr. VincentBalthazar for their precious help during fieldwork and Dr. AlainDemoulin for its advices.
References
Agliardi, F., Crosta, G.B., Frattini, P., Malusa, M.G., 2013. Giant non-catastrophiclandslides and the long-term exhumation of the European Alps. Earth Planet.Sci. Lett. 365, 263–274.
Alcantara-Ayala, I., Esteban-Chavez, O., Parrot, J.F., 2006. Landsliding related toland-cover change: a diachronic analysis of hillslope instability distribution inthe Sierra Norte, Puebla, Mexico. Catena 65, 152–165.
Baize, S., Audin, L., Winter, T., Alvarado, A., Pilatasig, L., Taipe, M., Reyes, P., Kauff-man, P., Yepes, H., 2014. First paleoseismic results for the Pallatanga fault(Central Ecuador), a major structure of the South-American crust. Geomorphol-ogy, http://dx.doi.org/10.1016/J.geomorph.2014.03.020.
Balthazar, V., Vanacker, V., Molina, A., Lambin, E.F., 2014. Impacts of forest coverchange on ecosystem services in high Andean mountains. Ecol. Indicators,http://dx.doi.org/10.1016/j.ecolind.2014.07.043 (in press).
dslide frequency–area distribution after forest conversion in thecene.2014.08.001

M. Guns, V. Vanacker / Anthropocene xxx (2014) xxx–xxx 11
G Model
ANCENE-48; No. of Pages 11
Basabe, P., 1998. Prevencion de desastres naturales en la Cuenca del Paute – Informefinal: Proyecto Precupa. Swiss Disaster Relief Unit (SDR/CSS), Cuenca, Ecuador.
Brardinoni, F., Hassan, M.A., Rollerson, T., Maynard, D., 2009. Colluvial sedimentdynamics in mountain drainage basins. Earth Planet. Sci. Lett. 284, 310–319.
Densmore, A.L., Anderson, R.S., McAdoo, B.G., Ellis, M.A., 1997. Hillslope evolutionby bedrock landslides. Science 275, 369–372.
Donati, L., Turrini, M.C., 2002. An objective method to rank the importance of thefactors predisposing to landslides with the GIS methodology: application to anarea of the Apennines (Valnerina; Perugia, Italy). Eng. Geol. 63, 277–289.
Farley, K., 2010. Pathways to forest transition: local case studies from the Ecuador-ian Andes. J. Lat. Am. Geogr. 9, 7–26.
Frattini, P., Crosta, G.B., 2013. The role of material properties and landscapemorphology on landslide size distributions. Earth Planet. Sci. Lett. 361, 310–319.
Gagnmon, H., 1974. La photo aerienne son interpretation dans les etudes del’environnement et de l’amenagement du territoire Montreal, Canada.
Galli, M., Ardizzone, F., Cardinali, M., Guzzetti, F., Reichenbach, P., 2008. Comparinglandslide inventory maps. Geomorphology 94, 268–289.
Garcıa-Ruiz, J.M., Beguerıa, S., Alatorre, L.C., Puigdefabregas, J., 2010. Land coverchanges and shallow landsliding in the flysch sector of the Spanish Pyrenees.Geomorphology 124, 250–259.
Glade, T., 2003. Landslide occurrence as a response to land use change: a review ofevidence from New Zealand. Catena 51, 297–314.
Guns, M., 2013. Sediment Dynamics in Tropical Mountain Regions: Influence ofAnthropogenic Disturbances on Sediment Transfer Mechanisms. (PhD thesis)-Universite catholique de Louvain, Faculty of Sciences 158 pp.
Guns, M., Vanacker, V., 2013. Forest cover change trajectories and their impact onlandslide occurrence in the tropical Andes. Environ. Earth Sci. 70, 2941–2952.
Guthrie, R.H., Evans, S.G., 2007. Work, persistence, and formative events: thegeomorphic impact of landslides. Geomorphology 88, 266–275.
Guzzetti, F., Galli, M., Reichenbach, P., Ardizzone, F., Cardinali, M., 2006. Landslidehazard assessment in the Collazzone area, Umbria, Central Italy. Nat. HazardsEarth Syst. Sci. 6, 115–131.
Guzzetti, F., Malamud, B.D., Turcotte, D.L., Reichenbach, P., 2002. Power-law corre-lations of landslide areas in central Italy. Earth Planet. Sci. Lett. 195, 169–183.
Guzzetti, F., Reichenbach, P., Cardinali, M., Galli, M., Ardizzone, F., 2005. Probabilis-tic landslide hazard assessment at the basin scale. Geomorphology 72, 272–299.
Hansen, M.C., Stehman, S.V., Potapov, P.V., 2010. From the cover: quantification ofglobal gross forest cover loss. Proc. Natl. Acad. Sci. 107, 8650–8655.
Hovius, N., Stark, C.P., Allen, P.A., 1997. Sediment flux from a mountain belt derivedby landslide mapping. Geology 25, 231.
INAMHI, 2009. Anuario hidrologico y meteorologico 1970–2009. Instituto Nacionalde Meteorologıa en Hidrologıa.
Katz, O., Aharonov, E., 2006. Landslides in vibrating sand box: what controls types ofslope failure and frequency magnitude relations? Earth Planet. Sci. Lett. 247,280–294.
Korup, O., 2005. Large landslides and their effect on sediment flux in South West-land, New Zealand. Earth Surf. Process. Landf. 30, 305–323.
Korup, O., 2012. Earth’s portfolio of extreme sediment transport events. Earth–Sci.Rev. 112, 115–125.
Lambin, E.F., Geist, H.J., 2003. Regional differences in tropical deforestation. Envi-ronment 45, 22–36.
Lambin, E.F., Turner, B.L., Geist, H.J., Agbola, S.B., Angelsen, A., Bruce, J.W., Coomes,O.T., Dirzo, R., Fischer, G., Folke, C., George, P.S., Homewood, K., Imbernon, J.,
Please cite this article in press as: Guns, M., Vanacker, V., Shifts in lantropical Andes. Anthropocene (2014), http://dx.doi.org/10.1016/j.an
Leemans, R., Li, X., Moran, E.F., Mortimore, M., Ramakrishnan, P.S., Richards, J.F.,Skanes, H., Steffen, W., Stone, G.D., Svedin, U., Veldkamp, T.A., Vogel, C., Xu, J.,2001. The causes of land-use and land-cover change: moving beyond the myths.Glob. Environ. Change 11, 261–269.
Larsen, I.J., Montgomery, D.R., Korup, O., 2010. Landslide erosion controlled byhillslope material. Nat. Geosci. 3, 247–251.
Lillesand, T.M., Keifer, J.W., 1994. Remote Sensing and Image Interpretation NewYork.
Luteyn, J.L., 1999. Paramos: a checklist of plant diversity, geographical distribution,and botanical literature. The New York Botanical Garden, Bronx, New York.
Malamud, B.D., Turcotte, D.L., Guzzetti, F., Reichenbach, P., 2004. Landslide inven-tories and their statistical properties. Earth Surf. Process. Landf. 29, 687–711.
Molina, A., Govers, G., Poesen, J., Vanhemelryck, H., Debievre, B., Vanacker, V., 2008.Environmental factors controlling spatial variation in sediment yield in acentral Andean mountain area. Geomorphology 98, 176–186.
Mosandl, R., Gunter, S., Stimm, B., Weber, M., 2008. Ecuador suffers the highestdeforestation rate in South America. In: Beck, E., Bendix, J., Kottke, I., Makeschin,F., Mosandl, R. (Eds.), Gradients in a Tropical Mountain Ecosystem of Ecuador.Springer, Berlin/Heidelberg, pp. 37–40.
Pourrut, P., 1994. L’eau en Equateur: Principaux acquis en Hydroclimatologie. In:Institut Francais de recherche Scientifique Pour le Developpement en Coopera-tion.
Rossi, M., Cardinali, M., Fiorucci, F., Marchesini, I., Mondini, A.C., Santangelo, M.,Ghosh, S., Riguer, D.E.L., Lahousse, T., Chang, K.T., Guzzetti, F., 2012. A tool for theestimation of the distribution of landslide area. In: R. Geophysical ResearchAbstracts, vol. 14, EGU2012-4938-1, EGU General Assembly 2012, Vienna,Austria, 22–27 April 2012 (Abstract, Poster).
Schlogel, R., Torgoev, I., De Marneffe, C., Havenith, H.-B., 2011. Evidence of achanging size-frequency distribution of landslides in the Kyrgyz Tien Shan,Central Asia. Earth Surf. Process. Landf. 36, 1658–1669.
Sidle, R.C., Ochiai, H., 2006. Landslides: processes. Predict. Land Use 55–62.Soeters, R., van Westen, C.J., 1996. Slope instability recognition, analysis and
zonation. In: Turner, K., Schuster, R.L. (Eds.), Landslides Investigation andMitigation. Transportation Research Board, Special Report 247.
Stark, C.P., Hovius, N., 2001. The characterization of landslide size distributions.Geophys. Res. Lett. 28, 1091–1094.
Sugai, T., Ohmori, H., 2001. Magnitude–frequency distribution of landslide mass inuplifting mountains. Trans. Jpn. Geomorphol. Union 22, 229.
Van Den Eeckhaut, M., Poesen, J., Govers, G., Verstraeten, G., Demoulin, A., 2007.Characteristics of the size distribution of recent and historical landslides in apopulated hilly region. Earth Planet. Sci. Lett. 256, 588–603.
Vanacker, V., Govers, G., Tacuri, E., Poesen, J., Dercon, G., Cisneros, F., 2000. Usingsequential aerial photographs to detect land-use changes in the Austro Ecua-doriano. Rev. Geogr. Alp. 88, 65–75.
Vanacker, V., Vanderschaeghe, M., Govers, G., Willems, E., Poesen, J., Deckers, J., DeBievre, B., 2003. Linking hydrological, infinite slope stability and land usechange models through GIS for assessing the impact of deforestation onlandslide susceptibility in High Andean watersheds. Geomorphology 52,299–315.
Vanacker, V., von Blanckenburg, F., Govers, G., Molina, A., Poesen, J., Deckers, J.,Kubik, P., 2007. Restoring dense vegetation can slow mountain erosion to nearnatural benchmark levels. Geology 35, 303.
Winckell, A., Zebrowski, C., Sourdat, M., 1997. Las regiones y paisages del EcuadorQuito, Ecuador.
dslide frequency–area distribution after forest conversion in thecene.2014.08.001