Conversion-testimonies.pdf - The University of Manchester ...
Upload
khangminh22Category
view
1download
0
LEARNING OBJECTIVESAfter studying this chapter, you should:
• Understand the basic elements and procedures encompassing a tradi-tional production process.
• Understand the data flows and proce-dures in a traditional cost accounting system.
• Be familiar with the accounting controls found in a traditional environment.
• Understand the principles, operating features, and technologies that char-acterize lean manufacturing.
• Understand the shortcomings of traditional accounting methods in a world-class environment.
• Be familiar with the key features of activity based costing and value stream accounting.
• Be familiar with the information systems commonly associated with lean manufacturing and world-class companies.
A company’s conversion cycle transforms (converts) input resources, such as raw materials, labor, and overhead, into finished products or services for sale. The con-version cycle exists conceptually in all organizations,
including those in service and retail industries. It is most for-mal and apparent, however, in manufacturing firms, which is the focus of this chapter. We begin with a review of the tradi-tional batch production model, which consists of four basic pro-cesses: (1) plan and control production, (2) perform production operations, (3) maintain inventory control, and (4) perform cost accounting. The discussion focuses on the activities, documents, and controls pertaining to these traditional processes. The chap-ter then examines manufacturing techniques and technologies in world-class companies. Many firms pursuing world-class status follow a philosophy of lean manufacturing. This approach evolved from the Toyota Production System (TPS). The goal of lean manu-facturing is to improve efficiency and effectiveness in product design, supplier interaction, factory operations, employee man-agement, and customer relations. Key to successful lean manu-facturing is achieving manufacturing flexibility, which involves the physical organization of production facilities and the employ-ment of automated technologies, including computer numerical controlled (CNC) machines, computer-integrated manufacturing (CIM), automated storage and retrieval systems (AS/RS), robot-ics, computer-aided design (CAD), and computer-aided manufac-turing (CAM). The chapter then examines problems associated with applying standard cost accounting techniques in a highly automated environment. The key features of two alternative accounting models are discussed: (1) activity-based costing (ABC) and (2) value stream accounting. The chapter concludes with a discussion of the information systems commonly associated with
Chapter 7
The Conversion Cycle
Part II Transaction Cycles and Business Processes 333
lean manufacturing and world-class companies. Materials requirements planning (MRP) sys-tems are used to determine how much raw materials are required to fulfill production orders. Manufacturing resources planning (MRP II) evolved from MRP to integrate additional function-ality into the manufacturing process, including sales, marketing, and accounting. Enterprise resource planning (ERP) systems take MRP II a step further by integrating all aspects of the business into a set of core applications that use a common database.
The Traditional Manufacturing EnvironmentThe conversion cycle consists of both physical and information activities related to manu-facturing products for sale. The context-level data flow diagram (DFD) in Figure 7-1 illustrates the central role of the conversion cycle and its interactions with other busi-ness cycles. Production is triggered by customer orders from the revenue cycle and/or by sales forecasts from marketing. These inputs are used to set a production target and pre-pare a production plan, which drives production activities. Purchase requisitions for the raw materials needed to meet production objectives are sent to the purchases procedures (expenditure cycle), which prepares purchase orders for vendors. Labor used in produc-tion is transmitted to the payroll system (expenditure cycle) for payroll processing. Man-ufacturing costs associated with intermediate work-in-process and finished goods are sent to the general ledger and financial reporting system.
Revenue CycleExpenditure
Cycle
Purchase Requisitions
MarketingSystem
ConversionCycle
SalesForecast
Sales Orders
Labor Usage
General Ledgerand Financial
Reporting System
WorkInProcess
FinishedGoods
FIGURE 7-1 Conversion Cycle in Relation to Other Cycles

334 Chapter 7 The Conversion Cycle
Depending on the type of product being manufactured, a company will employ one of the following production methods:
1. Continuous processing creates a homogeneous product through a continuous series of standard procedures. Cement and petrochemicals are produced by this manufacturing method. Typically, under this approach firms attempt to maintain finished-goods inven-tory at levels needed to meet expected sales demand. The sales forecast in conjunction with information on current inventory levels triggers this process.
2. Make-to-order processing involves the fabrication of discrete products in accordance with customer specifications. This process is initiated by sales orders rather than depleted inventory levels.
3. Batch processing produces discrete groups (batches) of product. Each item in the batch is similar and requires the same raw materials and operations. To justify the cost of setting up and retooling for each batch run, the number of items in the batch tends to be large. This is the most common method of production and is used to manufacture products such as automobiles, household appliances, canned goods, automotive tires, and textbooks. The discussion in this chapter is based on a batch processing environment.
Batch Processing SystemThe DFD in Figure 7-2 provides a conceptual overview of the batch processing system, which consists of four basic processes: plan and control production, perform produc-tion operations, maintain inventory control, and perform cost accounting. As in previ-ous chapters, the conceptual system discussion is intended to be technology-neutral. The tasks described in this section may be performed manually or by computer. The figure also depicts the primary information flows (documents) that integrate these activities and link them to other cycles and systems. Again, system documents are technology-neutral and may be hard copy or digital. We begin our study of batch processing with a review of the purpose and content of these documents.
Documents in the Batch Processing System
A manufacturing process such as that in Figure 7-2 could be triggered by either indi-vidual sales orders from the revenue cycle or by a sales forecast the marketing system provides. For discussion purposes, we will assume the latter. The sales forecast shows the expected demand for a firm’s finished goods for a given period. For some firms, marketing may produce a forecast of annual demand by product. For firms with sea-sonal swings in sales, the forecast will be for a shorter period (quarterly or monthly) that can be revised in accordance with economic conditions.
The production schedule is the formal plan and authorization to begin production. This document describes the specific products to be made, the quantities to be pro-duced in each batch, and the manufacturing timetable for starting and completing production. Figure 7-3 contains an example of a production schedule.
The bill of materials (BOM), an example of which is illustrated in Figure 7-4, specifies the types and quantities of the raw material (RM) and subassemblies used in produc-ing a single unit of finished product. The RM requirements for an entire batch are determined by multiplying the BOM by the number of items in the batch.
A route sheet, illustrated in Figure 7-5, shows the production path that a particu-lar batch of product follows during manufacturing. It is similar conceptually to a BOM. Whereas the BOM specifies material requirements, the route sheet specifies the
•
•
•
•
Part II Transaction Cycles and Business Processes 335
FIGU
RE 7
-2
Sal
es O
rder
Sys
tem
(Rev
enu
eC
ycle
)P
urc
has
eS
yste
m(E
xpen
dit
ure
Cyc
le)
Co
st S
tan
dar
ds
HR
an
d P
ayro
llS
yste
m(E
xpen
dit
ure
Cyc
le)
Pla
n a
nd
Co
ntr
ol
Pro
du
ctio
n
Per
form
Pro
du
ctio
nO
per
atio
ns
Mai
nta
inIn
ven
tory
Co
ntr
ol
Per
form
Co
stA
cco
un
tin
g
Inve
ntor
yLe
vel
Wo
rk In
Pro
cess
Sal
es O
rder
s
Mar
keti
ng
Sys
tem
Sal
esF
orec
ast
Pur
chas
e R
equi
sitio
n
Pro
duct
ion
Sch
edul
e, W
ork
Ord
er,
Mov
e T
icke
t, M
ater
ials
Req
uisi
tion
Pay
roll
Tim
eC
ard
Pur
chas
eR
equi
sitio
n
Mat
eria
lsR
equi
sitio
n,C
ompl
eted
Wor
kO
rder
Job
Tim
e C
ards
, Mov
e T
icke
ts
Mat
eria
ls R
equi
sitio
n
Bill
of
Mat
eria
ls
OH
,la
bor,
mat
eria
l
RM
Inve
nto
ry
Labo
r, m
ater
ials
,O
H a
lloca
tion
Usa
geLe
vels
FG
Inve
nto
ry
Pro
duct
ion
Leve
lG
ener
al L
edg
erS
yste
m
Jour
nal
Vou
cher
Jour
nal
Vou
cher
Wor
kO
rder
Ro
ute
Sh
eet
BO
M
RS
DFD
of B
atch
Pro
duct
ion
Proc
ess
sequence of operations (machining or assembly) and the standard time allocated to each task.
The work order (or production order) draws from BOMs and route sheets to specify the materials and production (machining, assembly, and so on) for each batch. These, together with move tickets (described next), initiate the manufacturing process in the production departments. Figure 7-6 presents a work order.
•

336 Chapter 7 The Conversion Cycle
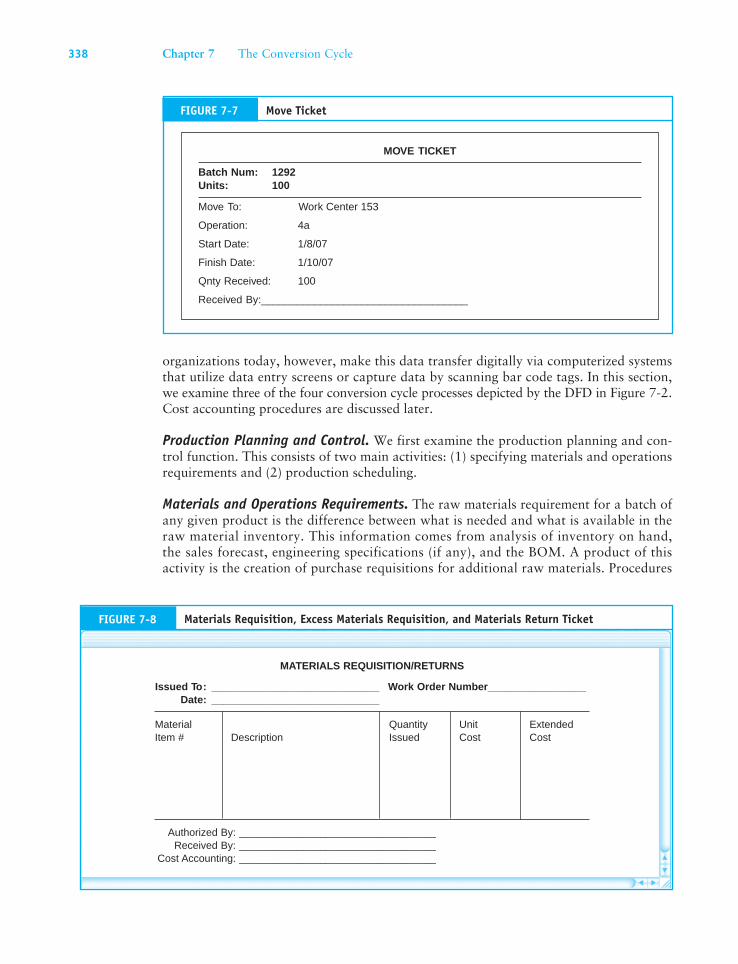
A move ticket, shown in Figure 7-7, records work done in each work center and authorizes the movement of the job or batch from one work center to the next.
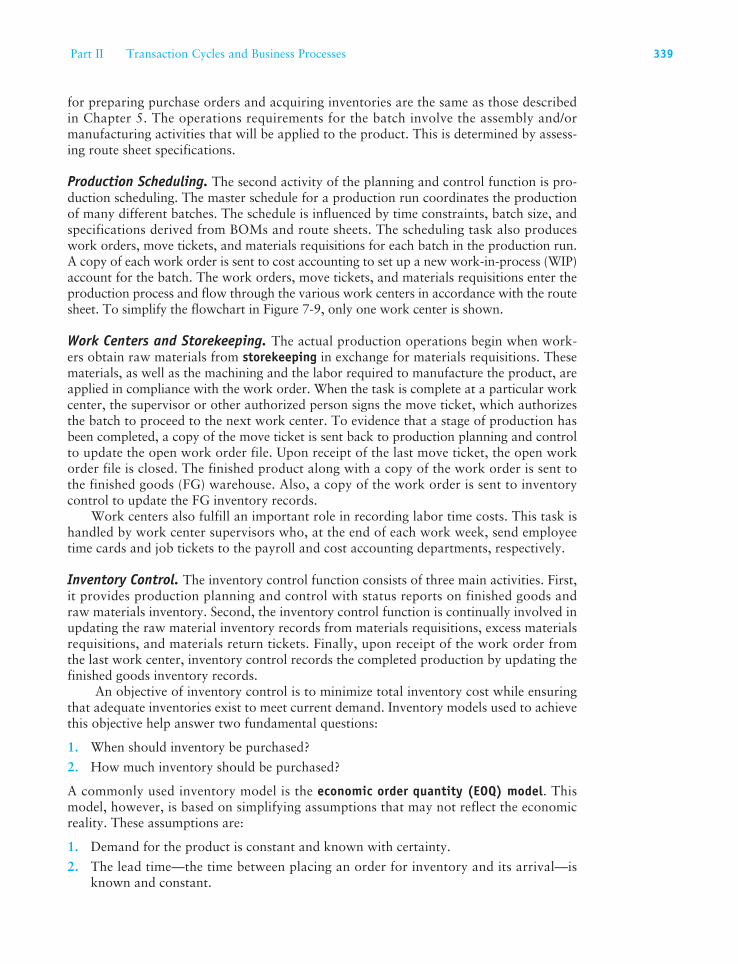
A materials requisition authorizes the storekeeper to release materials (and subassem-blies) to individuals or work centers in the production process. This document usually specifies only standard quantities. Materials needed in excess of standard amounts require separate requisitions that may be identified explicitly as excess materials req-uisitions. This allows for closer control over the production process by highlighting excess material usage. In some cases, less than the standard amount of material is used in production. When this happens, the work centers return the unused materials to the
•
•
FIGURE 7-3 Production Schedule
ABC COMPANY PRODUCTION SCHEDULE JAN 2007OPER #1 OPER #2 OPER #3
Batch QntyNum Units Start Complete Start Complete Start Complete
1237 800 1/2/07 1/5/07 1/8/07 1/23/07
1567 560 1/3/07 1/8/07 1/9/07 1/15/07 1/16/07 1/18/07
1679 450 1/2/07 1/5/07 1/8/07 1/10/07
4567 650 1/5/07 1/10/07 1/11/07 1/15/07 1/16/07 1/23/07
5673 1000 • • • • • •
• • • • • • • •
• • • • • • • •
BILL OF MATERIALSPRODUCT NORMAL BATCH
ENGINE TR6 QNTY2500 CC 100
Material QuantityItem Num Description Reg/Unit Product
28746 Crank shaft
387564 Main bearing set 4
735402 Piston 6
663554 Connecting rods 6
8847665 Rod bearing set 6
663345 Core plug 2" 6
663546 Core plug 1 1/2" 4
1
FIGURE 7-4 Bill of Materials
Part II Transaction Cycles and Business Processes 337
storeroom accompanied by a materials return ticket. Figure 7-8 presents a format that could serve all three purposes.
Batch Production ActivitiesThe flowchart in Figure 7-9 provides a physical view of the batch processing system. The flowchart illustrates the organization functions involved, the tasks performed in each function, and the documents that trigger or result from each task. To emphasize the phys-ical flows in the process, documents are represented in Figure 7-9 as hard copy. Many
ROUTE SHEETPRODUCT
ENGINE TR62500 CC
WorkCenter Operation Description Set Up Process
101 1a Mill block and fit studs .6 1.6
153 4a Clean block and fit crank .3 1.5
154 1 Fit pistons and bearings .1 .7
340 2 Fit water pump, fuel .1 1.4pump, oil pump, and cylinder head
StandardTime/Unit
FIGURE 7-5 Route Sheet
WORK ORDER #5681
PART NAME: Drawing #ENGINE CRANK SHAFT CS-87622
MATERIAL:CRANK CASTING
Work Actual Unit Units InspCenter Operation Description Set Up Proc Proc Compltd Scrap #
184 21 Draw castings from stores — 2.2 2.5 100 0
186 23 Turn journals and mainbearings per specs 2.3 14.9 16.00 99 1
156 01 Balance crank 4.0 21.5 32.00 99 0
• • • • • • • • •
• • • • • • • • •
Standard Hrs
FIGURE 7-6 Work Order
338 Chapter 7 The Conversion Cycle
organizations today, however, make this data transfer digitally via computerized systems that utilize data entry screens or capture data by scanning bar code tags. In this section, we examine three of the four conversion cycle processes depicted by the DFD in Figure 7-2. Cost accounting procedures are discussed later.
Production Planning and Control. We first examine the production planning and con-trol function. This consists of two main activities: (1) specifying materials and operations requirements and (2) production scheduling.
Materials and Operations Requirements. The raw materials requirement for a batch of any given product is the difference between what is needed and what is available in the raw material inventory. This information comes from analysis of inventory on hand, the sales forecast, engineering specifications (if any), and the BOM. A product of this activity is the creation of purchase requisitions for additional raw materials. Procedures
Move Ticket
MOVE TICKET
Batch Num: 1292Units: 100
Move To: Work Center 153
Operation: 4a
Start Date: 1/8/07
Finish Date: 1/10/07
Qnty Received: 100
Received By:___________________________________
FIGURE 7-7
MATERIALS REQUISITION/RETURNS
Issued To: _____________________________ Work Order Number_________________Date: _____________________________
Material Quantity Unit ExtendedItem # Description Issued Cost Cost
Authorized By: __________________________________Received By: __________________________________
Cost Accounting: __________________________________
FIGURE 7-8 Materials Requisition, Excess Materials Requisition, and Materials Return Ticket
Part II Transaction Cycles and Business Processes 339
for preparing purchase orders and acquiring inventories are the same as those described in Chapter 5. The operations requirements for the batch involve the assembly and/or manufacturing activities that will be applied to the product. This is determined by assess-ing route sheet specifications.
Production Scheduling. The second activity of the planning and control function is pro-duction scheduling. The master schedule for a production run coordinates the production of many different batches. The schedule is influenced by time constraints, batch size, and specifications derived from BOMs and route sheets. The scheduling task also produces work orders, move tickets, and materials requisitions for each batch in the production run. A copy of each work order is sent to cost accounting to set up a new work-in-process (WIP) account for the batch. The work orders, move tickets, and materials requisitions enter the production process and flow through the various work centers in accordance with the route sheet. To simplify the flowchart in Figure 7-9, only one work center is shown.
Work Centers and Storekeeping. The actual production operations begin when work-ers obtain raw materials from storekeeping in exchange for materials requisitions. These materials, as well as the machining and the labor required to manufacture the product, are applied in compliance with the work order. When the task is complete at a particular work center, the supervisor or other authorized person signs the move ticket, which authorizes the batch to proceed to the next work center. To evidence that a stage of production has been completed, a copy of the move ticket is sent back to production planning and control to update the open work order file. Upon receipt of the last move ticket, the open work order file is closed. The finished product along with a copy of the work order is sent to the finished goods (FG) warehouse. Also, a copy of the work order is sent to inventory control to update the FG inventory records.
Work centers also fulfill an important role in recording labor time costs. This task is handled by work center supervisors who, at the end of each work week, send employee time cards and job tickets to the payroll and cost accounting departments, respectively.
Inventory Control. The inventory control function consists of three main activities. First, it provides production planning and control with status reports on finished goods and raw materials inventory. Second, the inventory control function is continually involved in updating the raw material inventory records from materials requisitions, excess materials requisitions, and materials return tickets. Finally, upon receipt of the work order from the last work center, inventory control records the completed production by updating the finished goods inventory records.
An objective of inventory control is to minimize total inventory cost while ensuring that adequate inventories exist to meet current demand. Inventory models used to achieve this objective help answer two fundamental questions:
1. When should inventory be purchased?
2. How much inventory should be purchased?
A commonly used inventory model is the economic order quantity (EOQ) model. This model, however, is based on simplifying assumptions that may not reflect the economic reality. These assumptions are:
1. Demand for the product is constant and known with certainty.
2. The lead time—the time between placing an order for inventory and its arrival—is known and constant.
340 Chapter 7 The Conversion Cycle
3. All inventories in the order arrive at the same time.
4. The total cost per year of placing orders is a variable that decreases as the quanti-ties ordered increase. Ordering costs include the cost of preparing documentation, contacting vendors, processing inventory receipts, maintaining vendor accounts, and writing checks.
5. The total cost per year of holding inventories (carrying costs) is a variable that in-creases as the quantities ordered increase. These costs include the opportunity cost of invested funds, storage costs, property taxes, and insurance.
6. There are no quantity discounts. Therefore, the total purchase price of inventory for the year is constant.
AssessInventory
Requirements
Marketing
BOM
RouteSheet
InventoryStatus
EngineeringSpecs
PurchasingRouteSheet
BOM
PrepareProduction
ControlDocuments Production
Schedule
PurchaseReq
Engineering
Job TimeTickets
PayrollTimeCard
MoveTickets
Cost Acctg
Payroll
Material Req
Excess Mat'l
Mat'l Returns
ProductionSchedule
WorkOrder
WorkOrder
PG Warehouse
ProductionSchedule
Work OrderOpenWork
Orders
SalesForecast
A
Cost Acctg
BOM
RS
ProductionScheduling
C
B
C
Close OutOpen WorkOrder File
Materials andOperationsRequirements
Production Planning and Control Work Centers
Initiate ProductionActivities upon Receiptof Control Documents,Prepare TimekeepingDocuments, and DistributeDocuments to Users
OpenWork
Orders
MoveTickets
MaterialReq
FIGURE 7-9 Batch Production Process

Part II Transaction Cycles and Business Processes 341
The objective of the EOQ model is to reduce total inventory costs. The significant parameters in this model are the carrying costs and the ordering costs. Figure 7-10illustrates the relationship between these costs and order quantity. As the quantity ordered increases, the number of ordering events decreases, causing the total annual cost of ordering to decrease. As the quantity ordered increases, however, average inventory on hand increases, causing the total annual inventory carrying cost to increase. Because the total purchase price of inventory is constant (Assumption 6), we minimize total inventory costs by minimizing the total carrying cost and total ordering costs. The combined total cost curve is minimized at the intersection of the ordering-cost curve and the carrying-cost curve. This is the EOQ.
Excess Mat'l
Material Returns
Material Req
ReviewRecords
Excess Mat'l
Mat'l Returns
MaterialReq
Material Req
Excess Mat'l
Mat'l Returns
MaterialsInventoryRecords
InventoryStatus
Excess Mat'l
Material Returns
Material Req
UpdateInventoryRecords
MaterialsInventoryRecords
JournalVoucher
General Ledger
A
PurchaseRequisition
Mat'l Returns
Excess Mat'l
Mat'l Req
FinishedGoods
Inventory
Cost Acctg
JournalVoucher
B
UpdateInventoryRecords
Issue Raw Materialsto Work Centersin Exchangefor MaterialRequisitions
Storekeeping Inventory Control
FileWork Order
FIGURE 7-9 Batch Production Process (Continued)

342 Chapter 7 The Conversion Cycle
The following equation is used to determine the EOQ:
Q = √ ___
2DS
___ H
Where: Q = economic order quantity D = annual demand in units S = the fi xed cost of placing each order H = the holding or carrying cost per unit per year
To illustrate the use of this model, consider the following example: A company has an annual demand of 2,000 units, a per-unit order cost of $12, and a
carrying cost per unit of 40 cents. Using these values, we calculate the EOQ as follows:
Q = √ ___
2DS
___ H
Q = √ _________
2(2,000)(12)
________ 0.40
Q = √ _______
120,000
Q = 346
Now that we know how much to purchase, let’s consider the second question: When do we purchase?
The reorder point (ROP) is usually expressed as follows:
ROP = I 3 dwhere : I = lead time
d = daily demand (total demand/number of working days)
MinimumInventory
Cost
Total Setup (Order) Cost Curve
Total Holding Cost Curve
OptimalOrderQuantity
Order Quantity
Total CombinedCost Curve
Annual Cost
FIGURE 7-10 The Relationship of Total Inventory Cost and Order Quantity
Part II Transaction Cycles and Business Processes 343
In simple models, both I and d are assumed to be known with certainty and are constant. For example, if:
d = 5 units, and I = 8 days, then
ROP = 40 units.
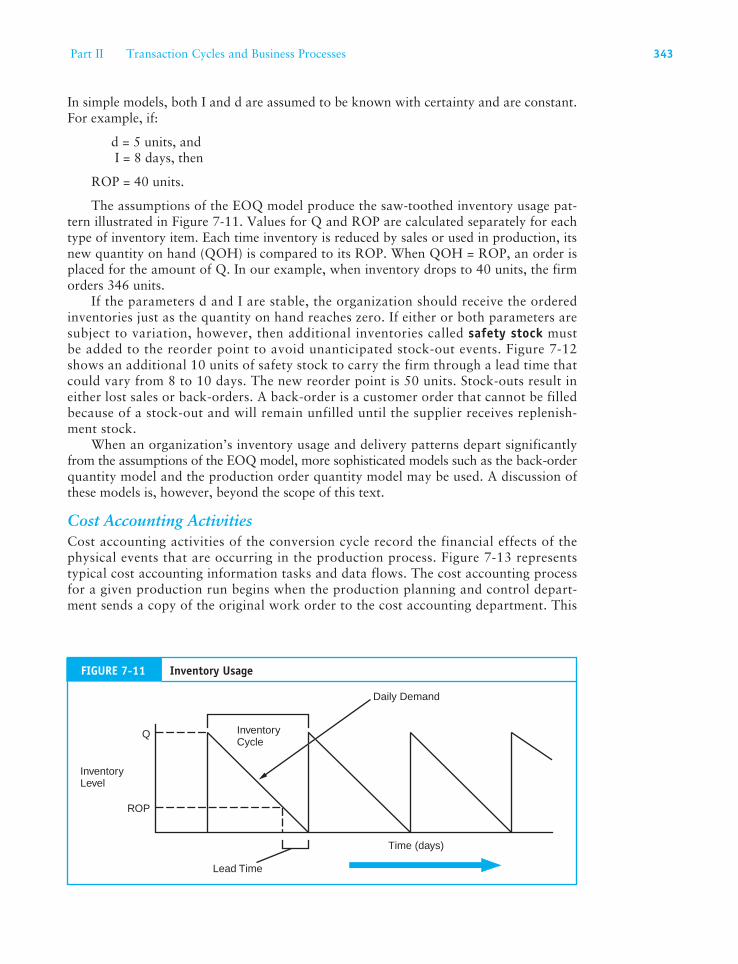
The assumptions of the EOQ model produce the saw-toothed inventory usage pat-tern illustrated in Figure 7-11. Values for Q and ROP are calculated separately for each type of inventory item. Each time inventory is reduced by sales or used in production, its new quantity on hand (QOH) is compared to its ROP. When QOH = ROP, an order is placed for the amount of Q. In our example, when inventory drops to 40 units, the firm orders 346 units.
If the parameters d and I are stable, the organization should receive the ordered inventories just as the quantity on hand reaches zero. If either or both parameters are subject to variation, however, then additional inventories called safety stock must be added to the reorder point to avoid unanticipated stock-out events. Figure 7-12 shows an additional 10 units of safety stock to carry the firm through a lead time that could vary from 8 to 10 days. The new reorder point is 50 units. Stock-outs result in either lost sales or back-orders. A back-order is a customer order that cannot be filled because of a stock-out and will remain unfilled until the supplier receives replenish-ment stock.
When an organization’s inventory usage and delivery patterns depart significantly from the assumptions of the EOQ model, more sophisticated models such as the back-order quantity model and the production order quantity model may be used. A discussion of these models is, however, beyond the scope of this text.
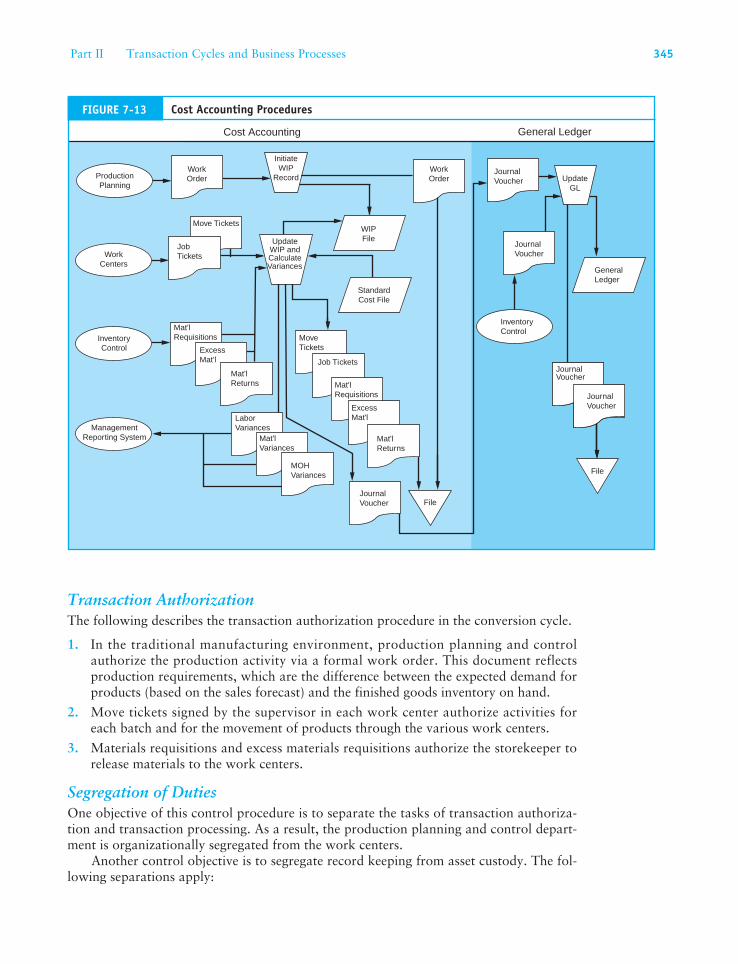
Cost Accounting ActivitiesCost accounting activities of the conversion cycle record the financial effects of the physical events that are occurring in the production process. Figure 7-13 represents typical cost accounting information tasks and data flows. The cost accounting process for a given production run begins when the production planning and control depart-ment sends a copy of the original work order to the cost accounting department. This
Inventory Cycle
Inventory Level
ROP
Q
Lead Time
Time (days)
Daily Demand
Inventory UsageFIGURE 7-11

344 Chapter 7 The Conversion Cycle
marks the beginning of the production event by causing a new record to be added to the work-in- process (WIP) file, which is the subsidiary ledger for the WIP control account in the general ledger.
As materials and labor are added throughout the production process, documents reflecting these events flow to the cost accounting department. Inventory control sends copies of materials requisitions, excess materials requisitions, and materials returns. The various work centers send job tickets and completed move tickets. These documents, along with standards provided by the standard cost file, enable cost accounting to update the affected WIP accounts with the standard charges for direct labor, material, and man-ufacturing overhead (MOH). Deviations from standard usage are recorded to produce material usage, direct labor, and MOH variances.
The receipt of the last move ticket for a particular batch signals the completion of the production process and the transfer of products from WIP to the FG inventory. At this point cost accounting closes the WIP account. Periodically, summary information regarding charges (debits) to WIP, reductions (credits) to WIP, and variances are recorded on journal vouchers and sent to the general ledger (GL) department for posting to the control accounts.
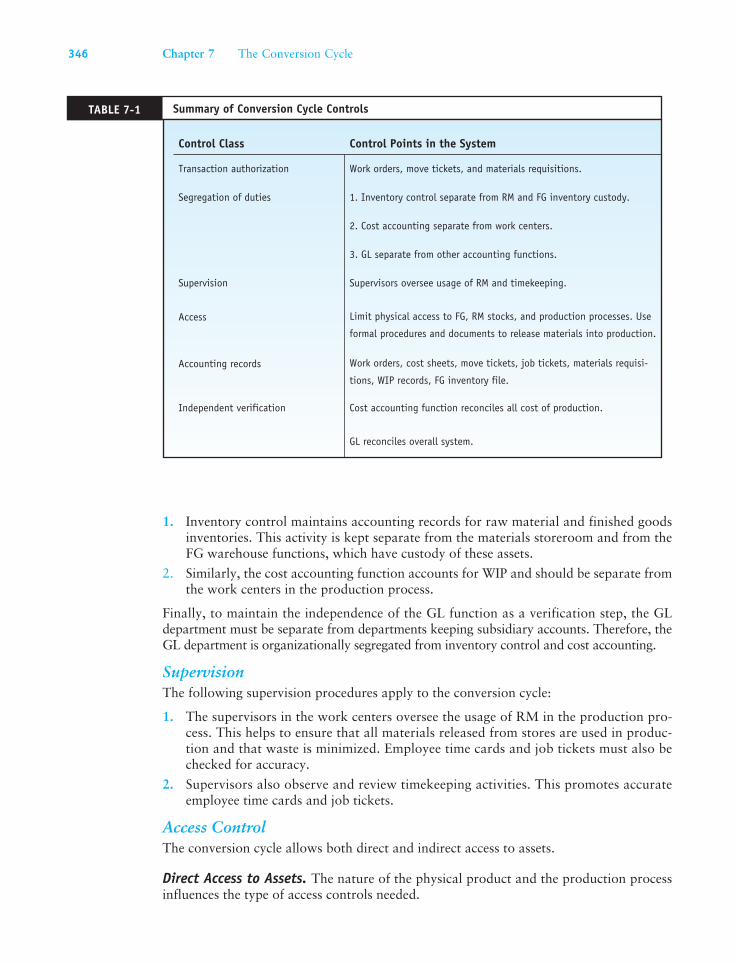
Controls in the Traditional EnvironmentRecall from previous chapters the six general classes of internal control activities: transac-tion authorization, segregation of duties, supervision, access control, accounting records, and independent verification. Specific controls as they apply to the conversion cycle are summarized in Table 7-1 and further explained in the following section.
Units ofInventory
ROP = 50
Time
Lead timevaries from8 to 10 days
Safety Stock
d = 5 unitsper day
10
0
Q =
346
uni
ts
The Use of Safety Stock to Prevent Stock-OutsFIGURE 7-12
Part II Transaction Cycles and Business Processes 345
Move Tickets
ProductionPlanning
WorkCenters
InventoryControl
ManagementReporting System
WorkOrder
WIPFile
JournalVoucher
StandardCost File
UpdateGL
Journal Voucher
InitiateWIP
RecordWorkOrder
UpdateWIP andCalculateVariances
JournalVoucher
InventoryControl
JournalVoucher
GeneralLedger
JobTickets
Mat'lRequisitions
ExcessMat'l
Mat'lReturns
MoveTickets
Mat'lReturns
Job Tickets
Mat'lRequisitions
ExcessMat'l
JournalVoucher
General Ledger
LaborVariances
Mat'lVariances
MOHVariances
File
Cost Accounting
File
JournalVoucher
Journal Voucher
Transaction AuthorizationThe following describes the transaction authorization procedure in the conversion cycle.
1. In the traditional manufacturing environment, production planning and control authorize the production activity via a formal work order. This document reflects production requirements, which are the difference between the expected demand for products (based on the sales forecast) and the finished goods inventory on hand.
2. Move tickets signed by the supervisor in each work center authorize activities for each batch and for the movement of products through the various work centers.
3. Materials requisitions and excess materials requisitions authorize the storekeeper to release materials to the work centers.
Segregation of DutiesOne objective of this control procedure is to separate the tasks of transaction authoriza-tion and transaction processing. As a result, the production planning and control depart-ment is organizationally segregated from the work centers.
Another control objective is to segregate record keeping from asset custody. The fol-lowing separations apply:
FIGURE 7-13 Cost Accounting Procedures
346 Chapter 7 The Conversion Cycle
1. Inventory control maintains accounting records for raw material and finished goods inventories. This activity is kept separate from the materials storeroom and from the FG warehouse functions, which have custody of these assets.
2. Similarly, the cost accounting function accounts for WIP and should be separate from the work centers in the production process.
Finally, to maintain the independence of the GL function as a verification step, the GL department must be separate from departments keeping subsidiary accounts. Therefore, the GL department is organizationally segregated from inventory control and cost accounting.
SupervisionThe following supervision procedures apply to the conversion cycle:
1. The supervisors in the work centers oversee the usage of RM in the production pro-cess. This helps to ensure that all materials released from stores are used in produc-tion and that waste is minimized. Employee time cards and job tickets must also be checked for accuracy.
2. Supervisors also observe and review timekeeping activities. This promotes accurate employee time cards and job tickets.
Access ControlThe conversion cycle allows both direct and indirect access to assets.
Direct Access to Assets. The nature of the physical product and the production process influences the type of access controls needed.
TABLE 7-1 Summary of Conversion Cycle Controls
Control Class Control Points in the System
Transaction authorization Work orders, move tickets, and materials requisitions.
Segregation of duties 1. Inventory control separate from RM and FG inventory custody.
2. Cost accounting separate from work centers.
3. GL separate from other accounting functions.
Supervision Supervisors oversee usage of RM and timekeeping.
Access Limit physical access to FG, RM stocks, and production processes. Use
formal procedures and documents to release materials into production.
Accounting records Work orders, cost sheets, move tickets, job tickets, materials requisi-
tions, WIP records, FG inventory file.
Independent verification Cost accounting function reconciles all cost of production.
GL reconciles overall system.
Part II Transaction Cycles and Business Processes 347
1. Firms often limit access to sensitive areas, such as storerooms, production work centers, and FG warehouses. Control methods used include identification badges, security guards, observation devices, and various electronic sensors and alarms.
2. The use of standard costs provides a type of access control. By specifying the quanti-ties of material and labor authorized for each product, the firm limits unauthorized access to those resources. To obtain excess quantities requires special authorization and formal documentation.
Indirect Access to Assets. Assets, such as cash and inventories, can be manipulated through access to the source documents that control them. In the conversion cycle, critical docu-ments include materials requisitions, excess materials requisitions, and employee time cards.A method of control that also supports an audit trail is the use of prenumbered documents.
Accounting RecordsAs we have seen in preceding chapters, the objective of this control technique is to establish an audit trail for each transaction. In the conversion cycle this is accomplished through the use of work orders, cost sheets, move tickets, job tickets, materials requisitions, the WIP file, and the FG inventory file. By prenumbering source documents and referencing these in the WIP records, a company can trace every item of FG inventory back through the production process to its source. This is essential in detecting errors in production and record keeping, locating batches lost in production, and performing periodic audits.
Independent VerificationVerification steps in the conversion cycle are performed as follows:
1. Cost accounting reconciles the materials and labor usage taken from materials requi-sitions and job tickets with the prescribed standards. Cost accounting personnel may then identify departures from prescribed standards, which are formally reported as variances. In the traditional manufacturing environment, calculated variances are an important source of data for the management reporting system.
2. The GL department also fulfills an important verification function by checking the total movement of products from WIP to FG. This is done by reconciling journal vouchers from cost accounting and summaries of the inventory subsidiary ledger from inventory control.
3. Finally, internal and external auditors periodically verify the RM and FG inventories on hand through a physical count. They compare actual quantities against the inven-tory records and make adjustments to the records when necessary.
World-Class Companies and Lean ManufacturingThe traditional conversion cycle described in the previous section represents how many manufacturing firms operate today. Over the past three decades, however, rapid swings in consumer demands, shorter product life cycles, and global competition have radically changed the rules of the marketplace. In an attempt to cope with these changes, manufac-turers have begun to conduct business in a dramatically different way. The term world-class defines this modern era of business. The pursuit of world-class status is a journey without destination because it requires continuous innovation and continuous improve-ment. A recent survey of corporate executives revealed that 80 percent of them claim to be pursuing principles that will lead their companies to world-class status. Skeptics argue, however, that as few as 10 or 20 percent of these firms are truly on the right path.

348 Chapter 7 The Conversion Cycle
What Is a World-Class Company?The following features characterize the world-class company:
World-class companies must maintain strategic agility and be able to turn on a dime. Top management must be intimately aware of customer needs and not become rigid and resistant to paradigm change.
World-class companies motivate and treat employees like appreciating assets. To acti-vate the talents of everyone, decisions are pushed to the lowest level in the organiza-tion. The result is a flat and responsive organizational structure.
A world-class company profitably meets the needs of its customers. Its goal is not simply to satisfy customers, but to positively delight them. This is not something that can be done once and then forgotten. With competitors aggressively seeking new ways to increase market share, a world-class firm must continue to delight its customers.
The philosophy of customer satisfaction permeates the world-class firm. All of its activities, from the acquisition of raw materials to selling the finished product, form a chain of customers. Each activity is dedicated to serving its customer, which is the next activity in the process. The final paying customer is the last in the chain.
Finally, manufacturing firms that achieve world-class status do so by following a phi-losophy of lean manufacturing. This involves doing more with less, eliminating waste, and reducing production cycle time.
The following section reviews the principles of lean manufacturing. The remainder of the chapter examines the techniques, technologies, accounting procedures, and information systems that enable it.
Principles of Lean ManufacturingLean manufacturing evolved from the Toyota Production System (TPS), which is based on the just-in-time (JIT) production model. This manufacturing approach is in direct opposition to traditional manufacturing, which is typified by high inventory levels, large production lot sizes, process inefficiencies, and waste. The goal of lean production is improved efficiency and effectiveness in every area, including product design, sup-plier interaction, factory operations, employee management, and customer relations. Lean involves getting the right products to the right place, at the right time, in the right quantity while minimizing waste and remaining flexible. Success depends, in great part, on employees understanding and embracing lean manufacturing principles. Indeed, the cultural aspects of this philosophy are as important as the machines and methodologies it employs. The following principles characterize lean manufacturing.
Pull Processing. Products are pulled from the consumer end (demand), not pushed from the production end (supply). Under the lean approach, inventories arrive in small quanti-ties from vendors several times per day, just in time to go into production. They are pulled into production as capacity downstream becomes available. Unlike the traditional push process, lean does not create batches of semifinished inventories at bottlenecks.
Perfect Quality. Success of the pull processing model requires zero defects in raw material, work-in-process, and finished goods inventory. Poor quality is very expensive to a firm. Consider the cost of scrap, reworking, scheduling delays, and extra inventories to compensate for defective parts, warranty claims, and field service. In the traditional
•
•
•
•
•

Part II Transaction Cycles and Business Processes 349
manufacturing environment, these costs can represent between 25 and 35 percent of total product cost. Also, quality is a basis on which world-class manufacturers compete. Qual-ity has ceased to be a trade-off against price. Consumers demand quality and seek the lowest-priced quality product.
Waste Minimization. All activities that do not add value and maximize the use of scarce resources must be eliminated. Waste involves financial, human, inventory, and fixed assets. The following are examples of waste in traditional environments, which lean man-ufacturing seeks to minimize.
Overproduction of products, which includes making more than needed and/or pro-ducing earlier than needed.
Transportation of products farther than is minimally necessary.
Bottlenecks of products waiting to move to the next production step.
Idle workers waiting for work to do as production bottlenecks clear.
Inefficient motion of workers who must walk more than necessary in the completion of their assigned tasks.
Islands of technology created by stand-alone processes that are not linked to upstream or downstream processes.
Production defects that require unnecessary effort to inspect and/or correct.
Safety hazards that cause injuries and lost work hours and associated expenses.
Inventory Reduction. The hallmark of lean manufacturing firms is their success in inventory reduction. Such firms often experience annual inventory turnovers of 100 times per year. While other firms carry weeks and even months of inventories, lean firms have only a few days or sometimes even a few hours of inventory on hand. The three common problems outlined below explain why inventory reduction is important.
1. Inventories cost money. They are an investment in materials, labor, and overhead that cannot be realized until sold. Inventories also contain hidden costs. They must be transported throughout the factory. They must be handled, stored, and counted. In addition, inventories lose value through obsolescence.
2. Inventories camouflage production problems. Bottlenecks and capacity imbalances in the manufacturing process cause WIP inventory to build up at the choke points. Inventories also build up when customer orders and production are out of sync.
3. Willingness to maintain inventories can precipitate overproduction. Because of setup cost constraints, firms tend to overproduce inventories in large batches to absorb the allocated costs and create the image of improved efficiency. The true cost of this dys-functional activity is hidden in the excess inventories.
Production Flexibility. Long machine setup procedures cause delays in production and encourage overproduction. Lean companies strive to reduce setup time to a minimum, which allows them to produce a greater diversity of products quickly, without sacrificing efficiency at lower volumes of production.
Established Supplier Relations. A lean manufacturing firm must have established and cooperative relationships with vendors. Late deliveries, defective raw materials, or incor-rect orders will shut down production immediately since this production model allows no inventory reserves to draw upon.
•
•
•
•
•
•
•
•

350 Chapter 7 The Conversion Cycle
Team Attitude. Lean manufacturing relies heavily on the team attitude of all employees involved in the process. This includes those in purchasing, receiving, manufacturing, shipping—everyone. Each employee must be vigilant of problems that threaten the continuous flow operation of the production line. Lean requires a constant state of quality control along with the authority to take immediate action. When Toyota first introduced TPS, its production employees had the authority to shut down the line when defects were discovered. In the early days, the line was often shut down to bring attention to a problem. Whether caused by a defective part from a vendor or a faulty machine in a cell, the problem was properly addressed so that it did not recur. After an adjustment period, the process stabilized.
Techniques and Technologies that Promote Lean ManufacturingModern consumers want quality products, they want them quickly, and they want vari-ety of choice. This demand profile imposes a fundamental conflict for traditional man-ufacturers, whose structured and inflexible orientation renders them ineffective in this environment. In contrast, lean companies meet the challenges of modern consumerism by achieving manufacturing flexibility. This section examines techniques and technologies that lean manufacturing firms employ to achieve manufacturing flexibility.
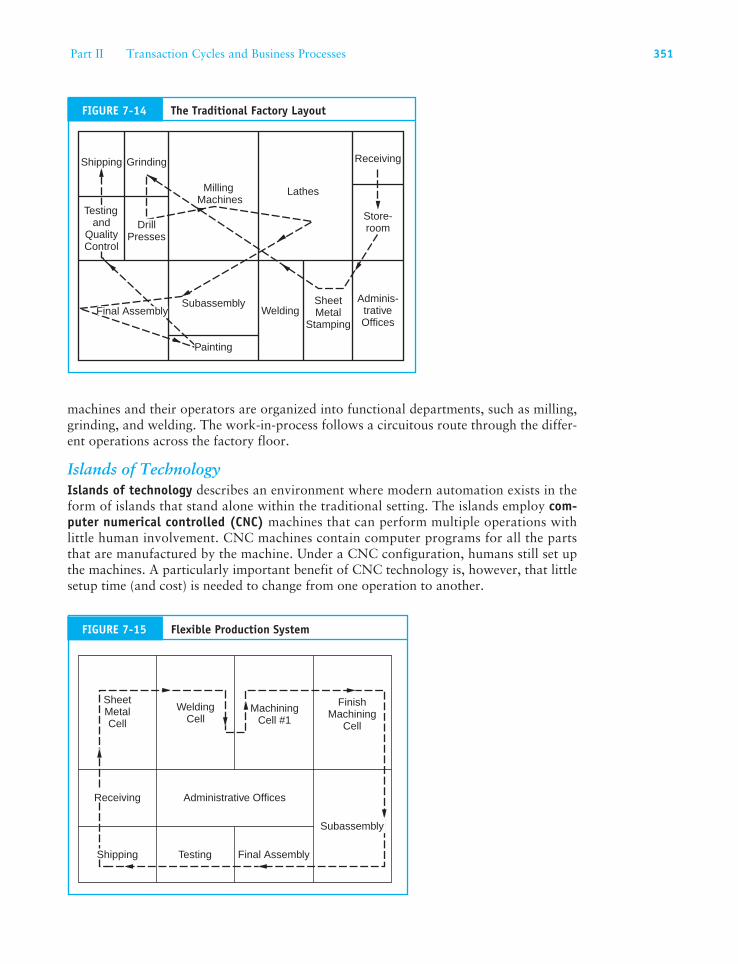
Physical Reorganization of the Production FacilitiesTraditional manufacturing facilities tend to evolve in piecemeal fashion over years into snakelike sequences of activities. Products move back and forth across shop floors, and upstairs and downstairs through different departments. Figure 7-14 shows a traditional factory layout. The inefficiencies inherent in this layout add handling costs, conversion time, and even inventories to the manufacturing process. Furthermore, because produc-tion activities are usually organized along functional lines, this structure tends to create parochialism among employees, promoting an us-versus-them mentality, which is con-trary to a team attitude.
A much simplified facility, which supports flexible manufacturing, is presented in Figure 7-15. The flexible production system is organized into a smooth-flowing stream of activities. Computer-controlled machines, robots, and manual tasks that comprise the stream are grouped together physically into factory units called cells. This arrangement shortens the physical distances between the activities, which reduces setup and processing time, handling costs, and inventories flowing through the facility.
Automation of the Manufacturing ProcessAutomation is at the heart of the lean manufacturing philosophy. By replacing labor with automation, a firm can reduce waste, improve efficiency, increase quality, and improve flexibility. The deployment of automation, however, varies considerably among manufacturing firms. Figure 7-16 portrays automation as a continuum with the tradi-tional manufacturing model at one end and the fully CIM model at the other.
Traditional ManufacturingThe traditional manufacturing environment consists of a range of different types of machines, each controlled by a single operator. Because these machines require a great deal of setup time, the cost of setup must be absorbed by large production runs. The
Part II Transaction Cycles and Business Processes 351
machines and their operators are organized into functional departments, such as milling, grinding, and welding. The work-in-process follows a circuitous route through the differ-ent operations across the factory floor.
Islands of TechnologyIslands of technology describes an environment where modern automation exists in the form of islands that stand alone within the traditional setting. The islands employ com-puter numerical controlled (CNC) machines that can perform multiple operations with little human involvement. CNC machines contain computer programs for all the parts that are manufactured by the machine. Under a CNC configuration, humans still set up the machines. A particularly important benefit of CNC technology is, however, that little setup time (and cost) is needed to change from one operation to another.
Flexible Production SystemFIGURE 7-15
SheetMetalCell
Testing
WeldingCell
MachiningCell #1
FinishMachining
Cell
Administrative OfficesReceiving
Shipping Final Assembly
Subassembly
Grinding
MillingMachines
Lathes
Receiving
Adminis-trativeOffices
Shipping
Testingand
QualityControl
Subassembly
Painting
WeldingSheetMetal
Stamping
Store-roomDrill
Presses
Final Assembly
The Traditional Factory LayoutFIGURE 7-14

352 Chapter 7 The Conversion Cycle
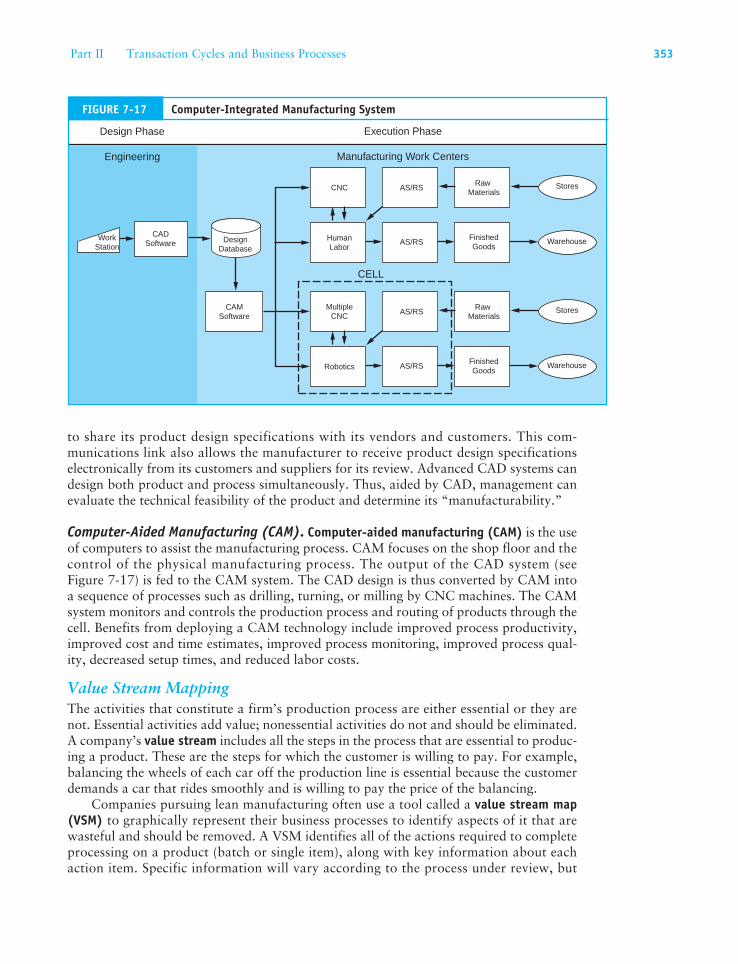
Computer-Integrated ManufacturingComputer-integrated manufacturing (CIM) is a completely automated environment with the objective of eliminating non-value-added activities. A CIM facility makes use of group technology cells comprised of various types of CNC machines to produce an entire part from start to finish in one location. In addition to CNC machines, the process employs automated storage and retrieval systems and robotics. CIM supports flexible manufactur-ing by allowing faster development of high-quality products, shorter production cycles, reduced production costs, and faster delivery times. Figure 7-17 depicts a CIM environ-ment and shows the relationship between various technologies employed.
Automated Storage and Retrieval Systems (AS/RS). Many firms have increased pro-ductivity and profitability by replacing traditional forklifts and their human operators with automated storage and retrieval systems (AS/RS). AS/RS are computer- controlled conveyor systems that carry raw materials from stores to the shop floor and finished products to the warehouse. The operational advantages of AS/RS technology over manual systems include reduced errors, improved inventory control, and lower storage costs.
Robotics. Manufacturing robots are programmed to perform specific actions over and over with a high degree of precision and are widely used in factories to perform jobs such as welding and riveting. They are also useful in hazardous environments or for perform-ing dangerous and monotonous tasks that are prone to causing accidents.
Computer-Aided Design (CAD). Engineers use computer-aided design (CAD) to design better products faster. CAD systems increase engineers’ productivity, improve accuracy by automating repetitive design tasks, and allow firms to be more responsive to market demands. Product design has been revolutionized through CAD technology, which was first applied to the aerospace industry in the early 1960s.
CAD technology greatly shortens the time frame between initial and final design. This allows firms to adjust their production quickly to changes in market demand. It alsoallows them to respond to customer requests for unique products. The CAD systems often have an interface to the external communication network to allow a manufacturer
Progression of automation toward world-class status
Islands ofTechnologyTraditional
ComputerIntegratedManufacturing
The Automation ContinuumFIGURE 7-16
Part II Transaction Cycles and Business Processes 353
to share its product design specifications with its vendors and customers. This com-munications link also allows the manufacturer to receive product design specifications electronically from its customers and suppliers for its review. Advanced CAD systems can design both product and process simultaneously. Thus, aided by CAD, management can evaluate the technical feasibility of the product and determine its “manufacturability.”
Computer-Aided Manufacturing (CAM). Computer-aided manufacturing (CAM) is the use of computers to assist the manufacturing process. CAM focuses on the shop floor and the control of the physical manufacturing process. The output of the CAD system (see Figure 7-17) is fed to the CAM system. The CAD design is thus converted by CAM into a sequence of processes such as drilling, turning, or milling by CNC machines. The CAM system monitors and controls the production process and routing of products through the cell. Benefits from deploying a CAM technology include improved process productivity, improved cost and time estimates, improved process monitoring, improved process qual-ity, decreased setup times, and reduced labor costs.
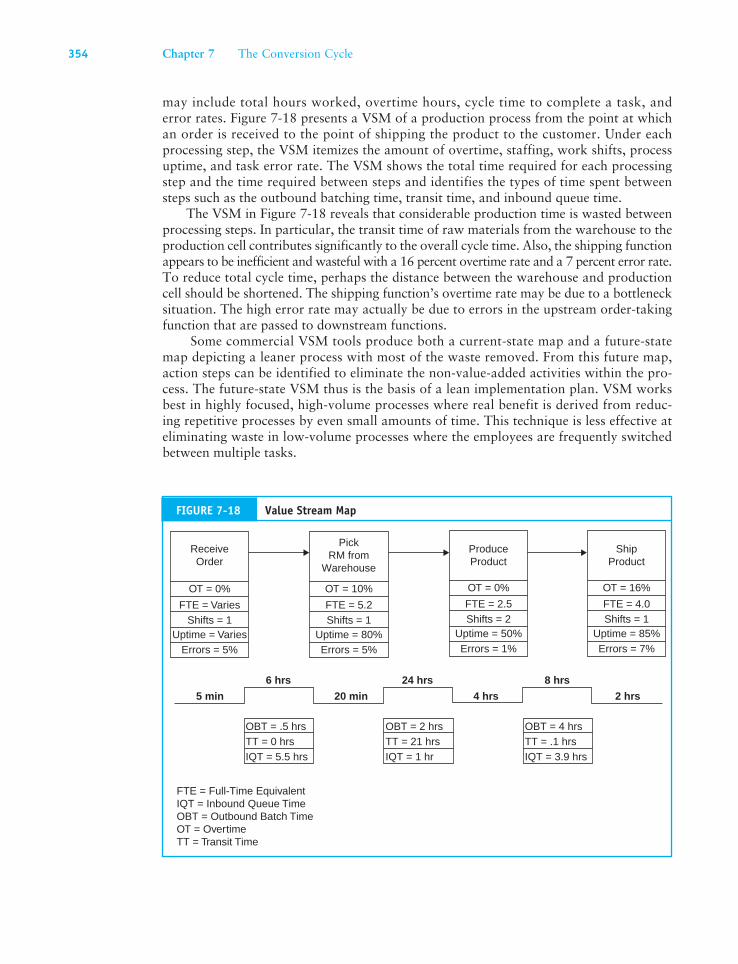
Value Stream MappingThe activities that constitute a firm’s production process are either essential or they are not. Essential activities add value; nonessential activities do not and should be eliminated. A company’s value stream includes all the steps in the process that are essential to produc-ing a product. These are the steps for which the customer is willing to pay. For example, balancing the wheels of each car off the production line is essential because the customer demands a car that rides smoothly and is willing to pay the price of the balancing.
Companies pursuing lean manufacturing often use a tool called a value stream map (VSM) to graphically represent their business processes to identify aspects of it that are wasteful and should be removed. A VSM identifies all of the actions required to complete processing on a product (batch or single item), along with key information about each action item. Specific information will vary according to the process under review, but
Warehouse
Stores
Warehouse
StoresCNC AS/RSRaw
Materials
HumanLabor
AS/RSFinishedGoods
AS/RSMultiple
CNCRaw
Materials
Robotics AS/RSFinishedGoods
DesignDatabase
CADSoftware
CAMSoftware
Engineering
Design Phase Execution Phase
Manufacturing Work Centers
WorkStation
CELL
Computer-Integrated Manufacturing SystemFIGURE 7-17
354 Chapter 7 The Conversion Cycle
may include total hours worked, overtime hours, cycle time to complete a task, and error rates. Figure 7-18 presents a VSM of a production process from the point at which an order is received to the point of shipping the product to the customer. Under each processing step, the VSM itemizes the amount of overtime, staffing, work shifts, process uptime, and task error rate. The VSM shows the total time required for each processing step and the time required between steps and identifies the types of time spent between steps such as the outbound batching time, transit time, and inbound queue time.
The VSM in Figure 7-18 reveals that considerable production time is wasted between processing steps. In particular, the transit time of raw materials from the warehouse to the production cell contributes significantly to the overall cycle time. Also, the shipping function appears to be inefficient and wasteful with a 16 percent overtime rate and a 7 percent error rate. To reduce total cycle time, perhaps the distance between the warehouse and production cell should be shortened. The shipping function’s overtime rate may be due to a bottleneck situation. The high error rate may actually be due to errors in the upstream order-taking function that are passed to downstream functions.
Some commercial VSM tools produce both a current-state map and a future-state map depicting a leaner process with most of the waste removed. From this future map, action steps can be identified to eliminate the non-value-added activities within the pro-cess. The future-state VSM thus is the basis of a lean implementation plan. VSM works best in highly focused, high-volume processes where real benefit is derived from reduc-ing repetitive processes by even small amounts of time. This technique is less effective at eliminating waste in low-volume processes where the employees are frequently switched between multiple tasks.
Value Stream MapFIGURE 7-18
OT = 0%
FTE = VariesShifts = 1
Uptime = VariesErrors = 5%
OBT = .5 hrs
FTE = Full-Time EquivalentIQT = Inbound Queue TimeOBT = Outbound Batch TimeOT = OvertimeTT = Transit Time
5 min 20 min 4 hrs 2 hrs
8 hrs24 hrs6 hrs
TT = 0 hrsIQT = 5.5 hrs
OT = 10%
FTE = 5.2Shifts = 1
Uptime = 80%Errors = 5%
OT = 0%
FTE = 2.5Shifts = 2
Uptime = 50%Errors = 1%
OT = 16%
FTE = 4.0Shifts = 1
Uptime = 85%Errors = 7%
OBT = 2 hrsTT = 21 hrsIQT = 1 hr
OBT = 4 hrsTT = .1 hrsIQT = 3.9 hrs
ReceiveOrder
PickRM from
Warehouse
ProduceProduct
ShipProduct
Part II Transaction Cycles and Business Processes 355
Accounting in a Lean Manufacturing EnvironmentThe lean manufacturing environment carries profound implications for accounting. Tra-ditional information produced under conventional accounting techniques does not adequately support the needs of lean companies. They require new accounting methods and new information that:
1. Shows what matters to its customers (such as quality and service).
2. Identifies profitable products.
3. Identifies profitable customers.
4. Identifies opportunities for improvement in operations and products.
5. Encourages the adoption of value-added activities and processes within the organiza-tion and identifies those that do not add value.
6. Efficiently supports multiple users with both financial and nonfinancial information.
In this section, we examine the nature of the accounting changes underway. The discus-sion reviews the problems associated with standard cost accounting and outlines two alternative approaches: (1) activity-based costing and (2) value stream accounting.
What’s Wrong with Traditional Accounting Information?Traditional standard costing techniques emphasize financial performance rather than manufacturing performance. The techniques and conventions used in traditional manu-facturing do not support the objectives of lean manufacturing firms. The following are the most commonly cited deficiencies of standard accounting systems.
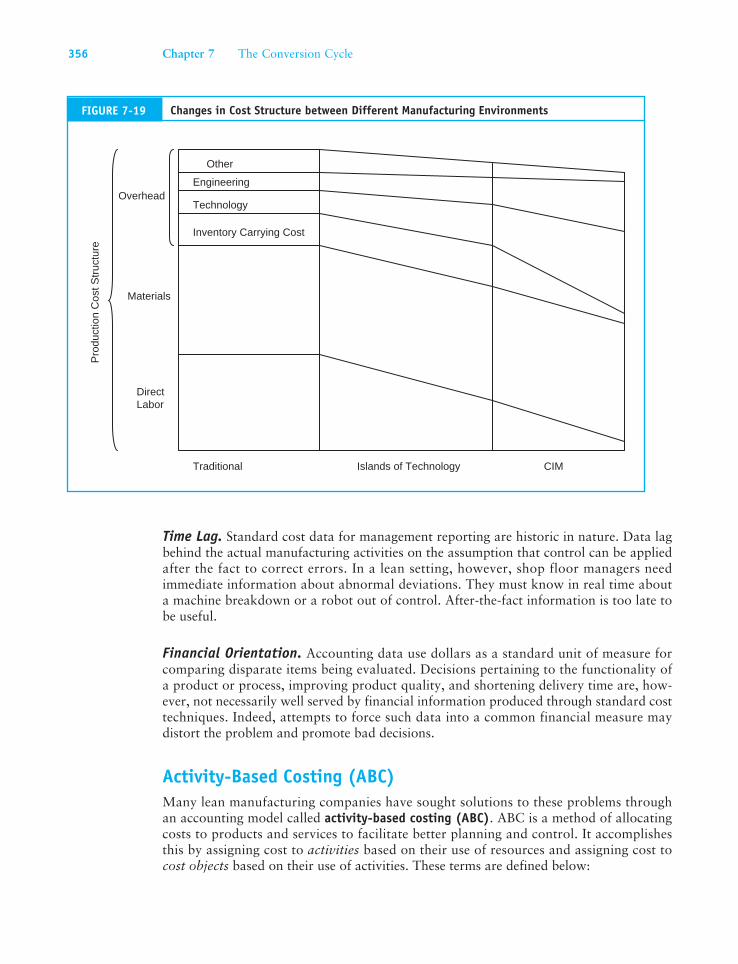
Inaccurate Cost Allocations. An assumption of standard costing is that all overheads need to be allocated to the product and that these overheads directly relate to the amount of labor required to make the product. A consequence of automation is the restructuring of manufacturing cost patterns. Figure 7-19 shows the changing relation-ship between direct labor, direct materials, and overhead cost under different levels of automation. In the traditional manufacturing environment, direct labor is a much larger component of total manufacturing costs than in the CIM environment. Overhead, on the other hand, is a far more significant element of cost under automated manufactur-ing. Applying standard costing leads to product cost distortions in a lean environment, causing some products to appear to cost more and others to appear to cost less than they do in reality. Poor decisions regarding pricing, valuation, and profitability may result.
Promotes Nonlean Behavior. Standard costing motivates nonlean behavior in opera-tions. The primary performance measurements used in standard costing are personal effi-ciency of production workers, the effective utilization of manufacturing facilities, and the degree of overhead absorbed by production. In addition, standard costing conceals waste within the overhead allocations and is difficult to detect. To improve their personal performance measures, management and operations employees are inclined to produce large batches of products and build inventory. This built-in motivation is in conflict with lean manufacturing.
356 Chapter 7 The Conversion Cycle
Time Lag. Standard cost data for management reporting are historic in nature. Data lag behind the actual manufacturing activities on the assumption that control can be applied after the fact to correct errors. In a lean setting, however, shop floor managers need immediate information about abnormal deviations. They must know in real time about a machine breakdown or a robot out of control. After-the-fact information is too late to be useful.
Financial Orientation. Accounting data use dollars as a standard unit of measure for comparing disparate items being evaluated. Decisions pertaining to the functionality of a product or process, improving product quality, and shortening delivery time are, how-ever, not necessarily well served by financial information produced through standard cost techniques. Indeed, attempts to force such data into a common financial measure may distort the problem and promote bad decisions.
Activity-Based Costing (ABC)Many lean manufacturing companies have sought solutions to these problems through an accounting model called activity-based costing (ABC). ABC is a method of allocating costs to products and services to facilitate better planning and control. It accomplishes this by assigning cost to activities based on their use of resources and assigning cost to cost objects based on their use of activities. These terms are defined below:
CIMIslands of TechnologyTraditional
DirectLabor
Materials
Overhead
Pro
duct
ion
Cos
t Str
uctu
re
Other
Technology
Engineering
Inventory Carrying Cost
FIGURE 7-19 Changes in Cost Structure between Different Manufacturing Environments
Part II Transaction Cycles and Business Processes 357
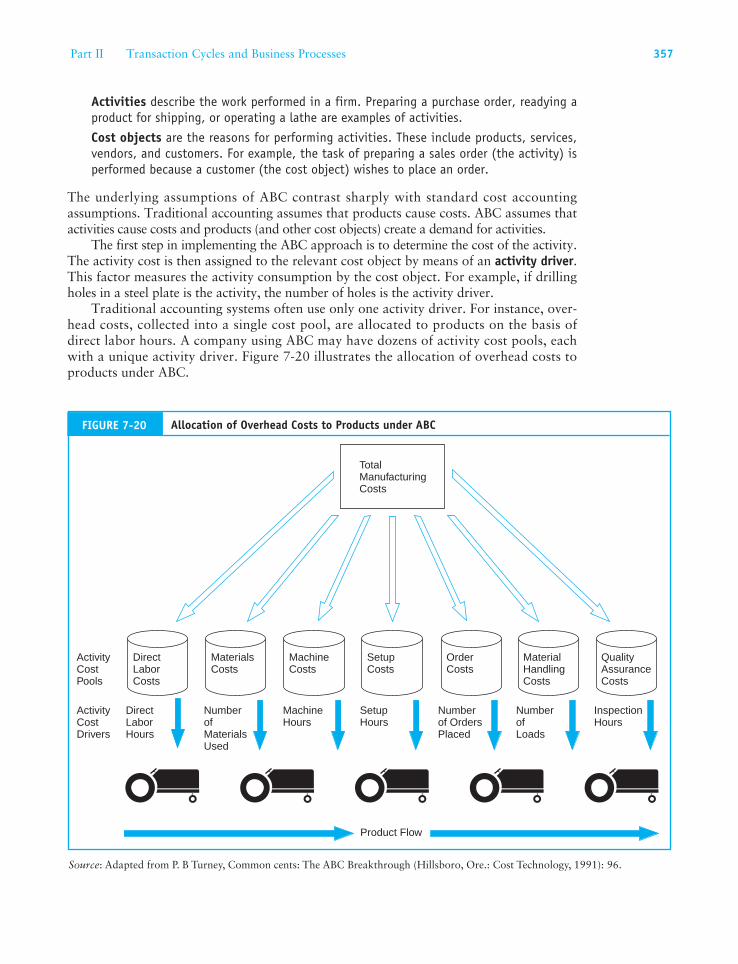
Activities describe the work performed in a firm. Preparing a purchase order, readying a product for shipping, or operating a lathe are examples of activities.
Cost objects are the reasons for performing activities. These include products, services, vendors, and customers. For example, the task of preparing a sales order (the activity) is performed because a customer (the cost object) wishes to place an order.
The underlying assumptions of ABC contrast sharply with standard cost accounting assumptions. Traditional accounting assumes that products cause costs. ABC assumes that activities cause costs and products (and other cost objects) create a demand for activities.
The first step in implementing the ABC approach is to determine the cost of the activity. The activity cost is then assigned to the relevant cost object by means of an activity driver. This factor measures the activity consumption by the cost object. For example, if drilling holes in a steel plate is the activity, the number of holes is the activity driver.
Traditional accounting systems often use only one activity driver. For instance, over-head costs, collected into a single cost pool, are allocated to products on the basis of direct labor hours. A company using ABC may have dozens of activity cost pools, each with a unique activity driver. Figure 7-20 illustrates the allocation of overhead costs to products under ABC.
QualityAssuranceCosts
MaterialHandlingCosts
OrderCosts
SetupCosts
MachineCosts
MaterialsCosts
DirectLaborCosts
DirectLaborHours
NumberofMaterialsUsed
MachineHours
SetupHours
Numberof OrdersPlaced
NumberofLoads
InspectionHours
Product Flow
TotalManufacturingCosts
ActivityCostPools
ActivityCostDrivers
FIGURE 7-20 Allocation of Overhead Costs to Products under ABC
Source: Adapted from P. B Turney, Common cents: The ABC Breakthrough (Hillsboro, Ore.: Cost Technology, 1991): 96.
358 Chapter 7 The Conversion Cycle
Advantages of ABCABC allows managers to assign costs to activities and products more accurately than standard costing permits. Some advantages that this offers are:
More accurate costing of products/services, customers, and distribution channels.
Identifying the most and least profitable products and customers.
Accurately tracking costs of activities and processes.
Equipping managers with cost intelligence to drive continuous improvements.
Facilitating better marketing mix.
Identifying waste and non-value-added activities.
Disadvantages of ABCABC has been criticized for being too time-consuming and complicated for practical applications over a sustained period. The task of identifying activity costs and cost driv-ers can be a significant undertaking that is not completed once and then forgotten. As products and processes change so do the associated activity costs and drivers. Unless sig-nificant resources are committed to maintaining the accuracy of activity costs and the appropriateness of drivers, cost assignments become inaccurate. Critics charge that rather than promoting continuous improvement, ABC creates complex bureaucracies within organizations that are in conflict with the lean manufacturing philosophies of process simplification and waste elimination.
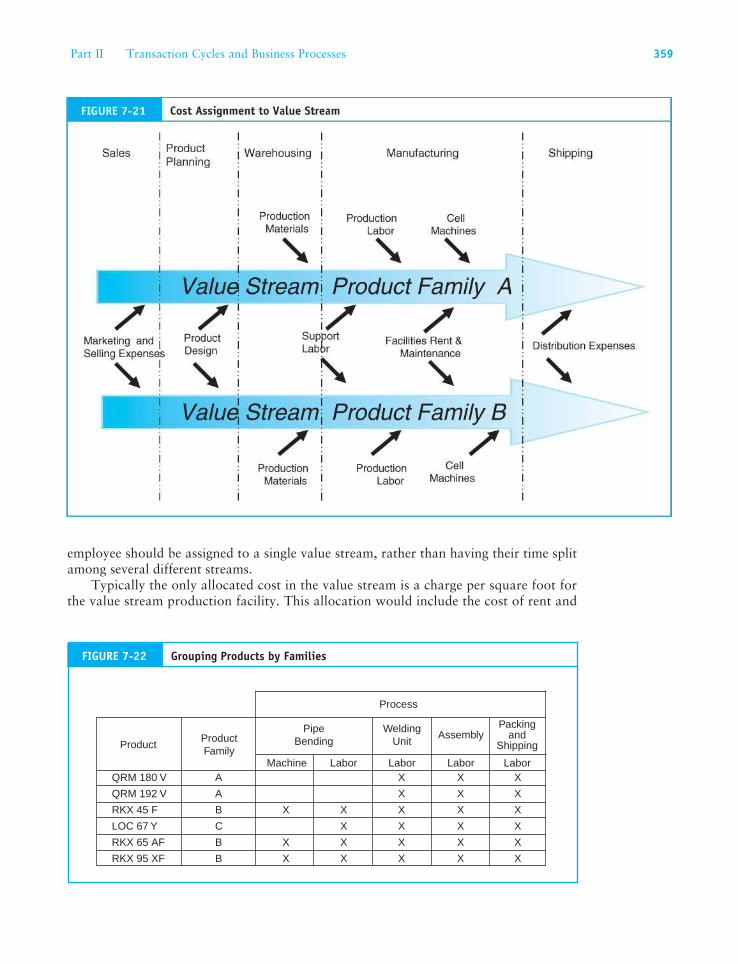
Value Stream AccountingThe complexities of ABC have caused many firms to abandon this method in favor of a sim-pler accounting model called value stream accounting. Value stream accounting captures costs by value stream rather than by department or activity, as illustrated in Figure 7-21.
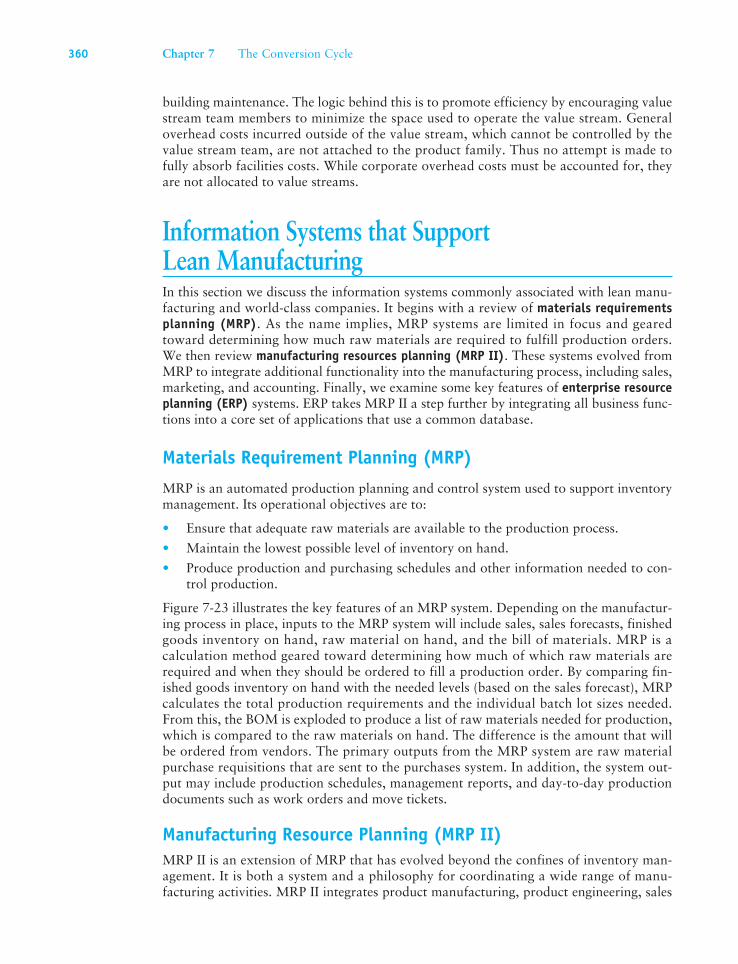
Notice that value streams cut across functional and departmental lines to include costs related to marketing, selling expenses, product design, engineering, materials purchasing, distribution, and more. An essential aspect in implementing value stream accounting is defining the product family. Most organizations produce more than one product, but these often fall into natural families of products. Product families share common pro-cesses from the point of placing the order to shipping the finished goods to the customer. Figure 7-22 illustrates how multiple products may be grouped into product families.
Value stream accounting includes all the costs associated with the product family, but makes no distinction between direct costs and indirect costs. Raw material costs are calculated based on how much material has been purchased for the value stream, rather than tracking the input of the raw material to specific products. Thus the total value stream material cost is the sum of everything purchased for the period. This simplified (lean) accounting approach works because raw material and WIP inventories on hand are low, representing perhaps only one or two days of stock. This approach would not work well in a traditional manufacturing environment where several months of inventory may carry over from period to period.
Labor costs of employees who work in the value stream are included whether they design, make, or simply transport the product from cell to cell. Labor costs are not allocated to individual products in the traditional way (time spent on a particular task). Instead, the sum of the wages and direct benefits paid to all individuals working in the value stream is charged to the stream. Support labor such as maintenance of machines, production planning, and selling are also included. Wherever possible, therefore, each
•
•
•
•
•
•
Part II Transaction Cycles and Business Processes 359
employee should be assigned to a single value stream, rather than having their time split among several different streams.
Typically the only allocated cost in the value stream is a charge per square foot for the value stream production facility. This allocation would include the cost of rent and
Process
ProductProductFamily
Machine Labor Labor Labor Labor
PipeBending
WeldingUnit
AssemblyPacking
andShipping
QRM 180 V
QRM 192 V
RKX 45 F
RKX 95 XF
RKX 65 AF
LOC 67 Y
A X
X
X
X
X
X
X
X
X
X
X
X
X
X
X
X
X
X
X
X
X
X
X
X
X
A
B
B
B
C
Grouping Products by FamiliesFIGURE 7-22
360 Chapter 7 The Conversion Cycle
building maintenance. The logic behind this is to promote efficiency by encouraging value stream team members to minimize the space used to operate the value stream. General overhead costs incurred outside of the value stream, which cannot be controlled by the value stream team, are not attached to the product family. Thus no attempt is made to fully absorb facilities costs. While corporate overhead costs must be accounted for, they are not allocated to value streams.
Information Systems that Support Lean ManufacturingIn this section we discuss the information systems commonly associated with lean manu-facturing and world-class companies. It begins with a review of materials requirements planning (MRP). As the name implies, MRP systems are limited in focus and geared toward determining how much raw materials are required to fulfill production orders. We then review manufacturing resources planning (MRP II). These systems evolved from MRP to integrate additional functionality into the manufacturing process, including sales, marketing, and accounting. Finally, we examine some key features of enterprise resource planning (ERP) systems. ERP takes MRP II a step further by integrating all business func-tions into a core set of applications that use a common database.
Materials Requirement Planning (MRP)
MRP is an automated production planning and control system used to support inventory management. Its operational objectives are to:
Ensure that adequate raw materials are available to the production process.
Maintain the lowest possible level of inventory on hand.
Produce production and purchasing schedules and other information needed to con-trol production.
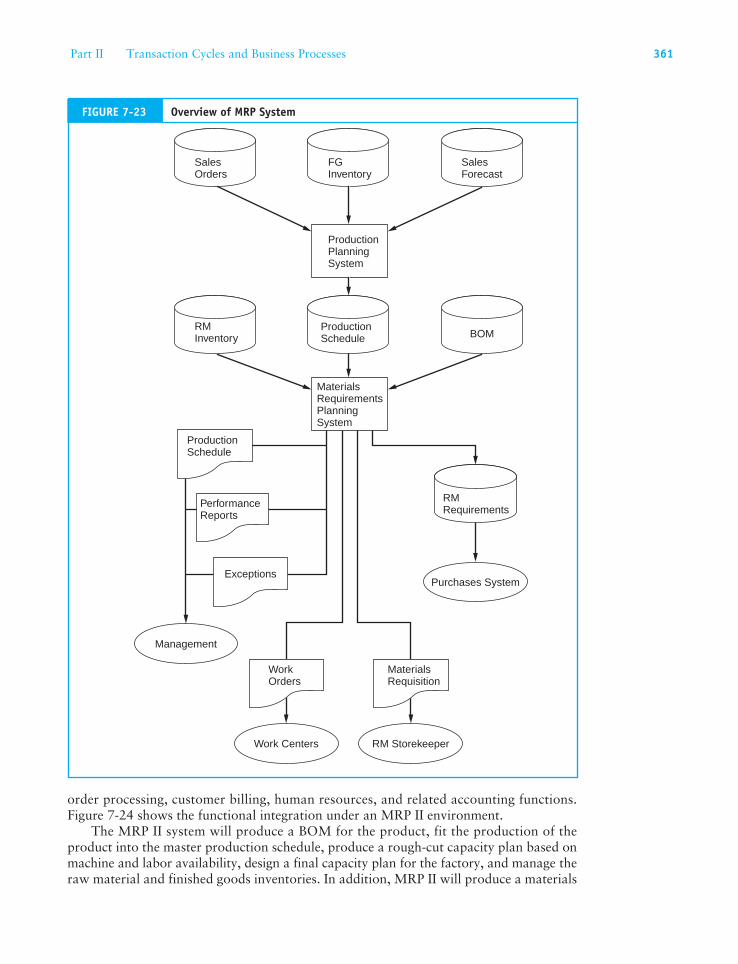
Figure 7-23 illustrates the key features of an MRP system. Depending on the manufactur-ing process in place, inputs to the MRP system will include sales, sales forecasts, finished goods inventory on hand, raw material on hand, and the bill of materials. MRP is a calculation method geared toward determining how much of which raw materials are required and when they should be ordered to fill a production order. By comparing fin-ished goods inventory on hand with the needed levels (based on the sales forecast), MRP calculates the total production requirements and the individual batch lot sizes needed. From this, the BOM is exploded to produce a list of raw materials needed for production, which is compared to the raw materials on hand. The difference is the amount that will be ordered from vendors. The primary outputs from the MRP system are raw material purchase requisitions that are sent to the purchases system. In addition, the system out-put may include production schedules, management reports, and day-to-day production documents such as work orders and move tickets.
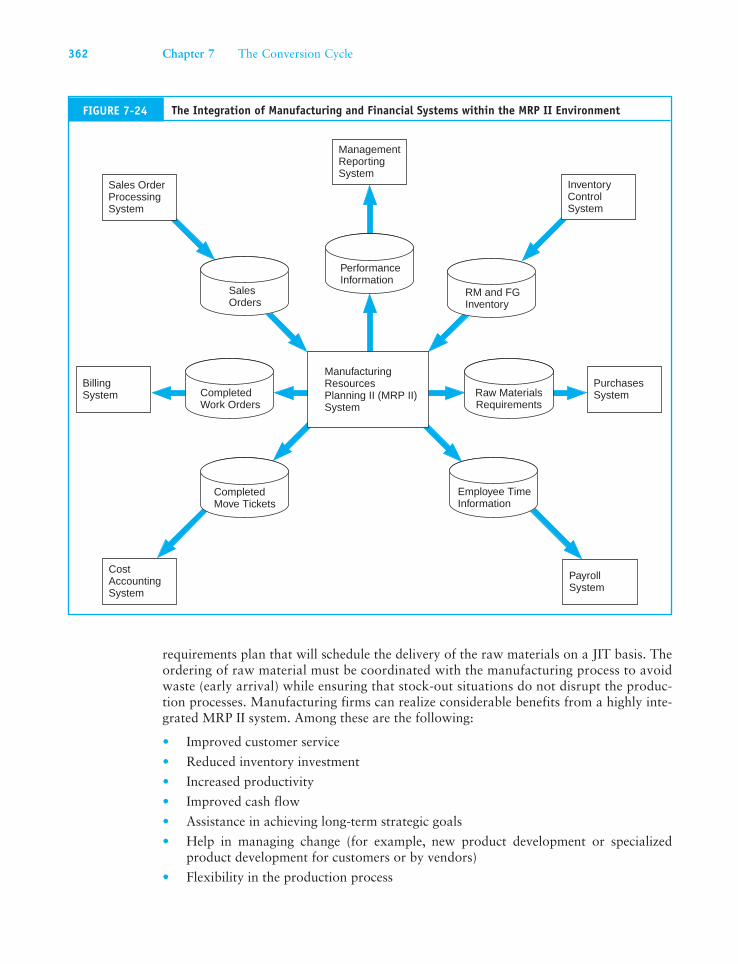
Manufacturing Resource Planning (MRP II)MRP II is an extension of MRP that has evolved beyond the confines of inventory man-agement. It is both a system and a philosophy for coordinating a wide range of manu-facturing activities. MRP II integrates product manufacturing, product engineering, sales
•
•
•
Part II Transaction Cycles and Business Processes 361
order processing, customer billing, human resources, and related accounting functions. Figure 7-24 shows the functional integration under an MRP II environment.
The MRP II system will produce a BOM for the product, fit the production of the product into the master production schedule, produce a rough-cut capacity plan based on machine and labor availability, design a final capacity plan for the factory, and manage the raw material and finished goods inventories. In addition, MRP II will produce a materials
MaterialsRequirementsPlanningSystem
ProductionPlanningSystem
ProductionSchedule
PerformanceReports
Exceptions
WorkOrders
MaterialsRequisition
Purchases System
Management
RM StorekeeperWork Centers
RMInventory
ProductionSchedule BOM
SalesOrders
FGInventory
SalesForecast
RMRequirements
Overview of MRP SystemFIGURE 7-23
362 Chapter 7 The Conversion Cycle
requirements plan that will schedule the delivery of the raw materials on a JIT basis. The ordering of raw material must be coordinated with the manufacturing process to avoid waste (early arrival) while ensuring that stock-out situations do not disrupt the produc-tion processes. Manufacturing firms can realize considerable benefits from a highly inte-grated MRP II system. Among these are the following:
Improved customer service
Reduced inventory investment
Increased productivity
Improved cash flow
Assistance in achieving long-term strategic goals
Help in managing change (for example, new product development or specialized product development for customers or by vendors)
Flexibility in the production process
•
•
•
•
•
•
•
SalesOrders
ManagementReportingSystem
PurchasesSystem
PayrollSystem
BillingSystem
PerformanceInformation
Sales OrderProcessingSystem
CompletedWork Orders
Raw MaterialsRequirements
Employee TimeInformation
RM and FGInventory
InventoryControlSystem
CostAccountingSystem
ManufacturingResourcesPlanning II (MRP II)System
CompletedMove Tickets
FIGURE 7-24 The Integration of Manufacturing and Financial Systems within the MRP II Environment
Part II Transaction Cycles and Business Processes 363
Enterprise Resource Planning (ERP) SystemsIn recent years MRP II has evolved into large suites of software called ERP systems. ERP integrates departments and functions across a company into one system of integrated ap-plications that is connected to a single common database. This enables various departments to share information and communicate with each other. An ERP system is comprised of function-specific modules that reflect industry best practices. Designed to interact with the other modules (for example, accounts receivable, accounts payable, purchasing, etc.), these commercial packages support the information needs of the entire organization, not just the manufacturing functions. An ERP can calculate resource requirements, schedule production, manage changes to product configurations, allow for future planned changes in products, and monitor shop floor production. In addition, the ERP provides order en-try, cash receipts, procurement, and cash disbursement functions along with full financial and managerial reporting capability.
A lean manufacturing company will have an ERP system that is capable of external communications with its customers and suppliers through electronic data interchange (EDI). The EDI communications link (via Internet or direct connection) will allow the firm to electronically receive sales orders and cash receipts from customers, send invoices to customers, send purchase orders to vendors, receive invoices from vendors and pay them, as well as send and receive shipping documents. EDI is a central element of many electronic commerce systems. We will revisit this important topic in Chapter 12.
Similarities in functionality between ERP and MRP II systems are quite apparent. Some argue that very little real functional difference exists between the two concepts. Indeed, the similarities are most noticeable when comparing top-end MRP II systems with low-end ERP packages. A primary distinction, however, is that the ERP has evolved beyond the manufacturing marketplace to become the system of choice among nonmanufacturing firms as well. On the other hand, cynics argue that changing the label from MRP II to ERP enabled software vendors to sell MRP II packages to nonmanufacturing companies.
The market for ERP systems was for many years limited by high cost and complex-ity to only the largest companies and was dominated by a few software vendors such as SAP, J.D. Edwards, Oracle, and PeopleSoft. In recent years this market has expanded tremendously with the entry of many small vendors targeting small and mid-sized customers with less expensive and more easily implemented ERP systems. The importance of the ERP phenomenon warrants separate treatment that goes beyond the scope of this chap-ter. In Chapter 11, therefore, we will examine ERP systems and related topics, including supply chain management (SCM) and data warehousing.
364 Chapter 7 The Conversion Cycle
K e y T e r m s
activities (357)activity driver (357)activity-based costing (ABC) (356)automated storage and retrieval systems (AS/RS) (352)bill of materials (BOM)(334)computer numerical controlled (CNC) (351)computer-aided design (CAD) (352)computer-aided manufacturing (CAM) (353)computer-integrated manufacturing (CIM) (352)cost objects (357)economic order quantity (EOQ) model (339)electronic data interchange (EDI) (363)enterprise resource planning (ERP) (360)islands of technology (351)just-in-time (JIT) (348)lean manufacturing (348)manufacturing flexibility (350)
manufacturing resources planning (MRP II) (360)materials requirements planning (MRP) (360)materials requisition (336)move ticket (336)product family (358)production schedule (334)pull processing (348)reorder point (342)robotics (332)route sheet (334)safety stock (343)storekeeping (339)Toyota Production System (TPS) (348)value stream (353)value stream accounting (358)value stream map (VSM) (353)work order (335)world-class company (348)
R e v i e w Q u e s t i o n s
1. Define the conversion cycle. 2. What activities are involved in the batch pro-
cessing system? 3. Distinguish between continuous, batch, and
made-to-order processing.
4. What documents trigger and support batch processing systems?
5. What are the primary determinants for both materials and operations requirements?
SummaryThis chapter examined the conversion cycle, whereby a company transforms input resources (that is, materials, labor, and capital) into marketable products and services. The principal aim was to highlight the changing manufacturing environment of the contemporary business world and to show how it calls for a shift away from traditional forms of business organization and activities toward a world-class way of doing business. We saw how companies that are attempting to achieve world-class status must pursue a lean manufacturing philosophy.
Key to successful lean manufacturing is achieving manufacturing flexibility, which involves the physi-cal organization of production facilities and the employment of automated technologies. We also saw that achieving lean manufacturing requires significant departures from traditional standard costing techniques. In response to deficiencies in traditional accounting methods, lean manufacturing companies have adopted alternative accounting models including activity based costing and value stream accounting. The chapter concluded with a discussion of three information systems commonly associated with lean manufacturing: (1) materials requirements planning (MRP), (2) manufacturing resources planning (MRP II), and enter-prise resource planning (ERP).
Part II Transaction Cycles and Business Processes 365
D i s c u s s i o n Q u e s t i o n s
1. Discuss the importance to the cost accounting department of the move ticket.
2. How realistic are the assumptions of the EOQ model? Discuss each assumption individually.
3. Explain why the EOQ is the intersection of the ordering-cost curve and the carrying-cost curve.
4. Supervisors in the work centers oversee the usage of RM in production; explain why the work centers do not keep the records of the WIP.
5. Explain how prenumbered documents help to provide indirect access control over assets.
6. What role does the GL department play in the conversion cycle?
7. Describe the characteristic of a world-class company.
8. How does automation help achieve manufac-turing flexibility?
9. Identify three areas where the consumer directly uses CAD software applications to aid in designing the product.
10. How can poor quality be expensive to the firm, especially if low-cost raw materials are
used to reduce cost of goods sold and raise net income?
11. Discuss how an emphasis on financial perfor-mance of cost centers, as measured by tradi-tional cost accounting information, may lead to inefficient and ineffective production output.
12. How can ABC be used to switch the manage-ment of business activities from a custodial task to a continuous improvement activity?
13. How are cost structures fundamentally different between the traditional and CIM environments?
14. How can a firm control against excessive quan-tities of raw materials being used in the manu-facturing process?
15. What is a value stream map (VSM)?16. Discuss the advantages of ABC.17. Discuss the disadvantages of ABC.18. Explain why traditional cost allocation meth-
ods fail in a CIM environment.19. Explain the concept of a product family and its
relationship to value stream accounting.20. Explain the relationship between MRP II and
ERP.
6. What are the objectives of inventory control in the production process?
7. What document triggers the beginning of the cost accounting process for a given production run?
8. What documents are needed for cost account-ing clerks to update the WIP accounts with standard charges?
9. What types of management reports are pre-pared by the cost accounting system?
10. What document signals the completion of the production process?
11. What functions should be separated to segre-gate record keeping from asset custody?
12. Give an example for each of the following control activities in the conversion cycle: transaction au-thorization, segregation of duties, and access.
13. Distinguish between CAD and CAM.14. What is meant by the statement, “Inventories
camouflage production problems and can cause overproduction”? What is wrong with overpro-duction if you already own the RM?
15. What a re the pr imary goa l s o f l ean manufacturing?
16. Distinguish between activities and cost objects in ABC.
17. Differentiate between essential and nonessen-tial activities.
18. What is meant by the term is lands of technology?
19. Define computer integrated manufacturing (CIM).
20. Define the term value stream.
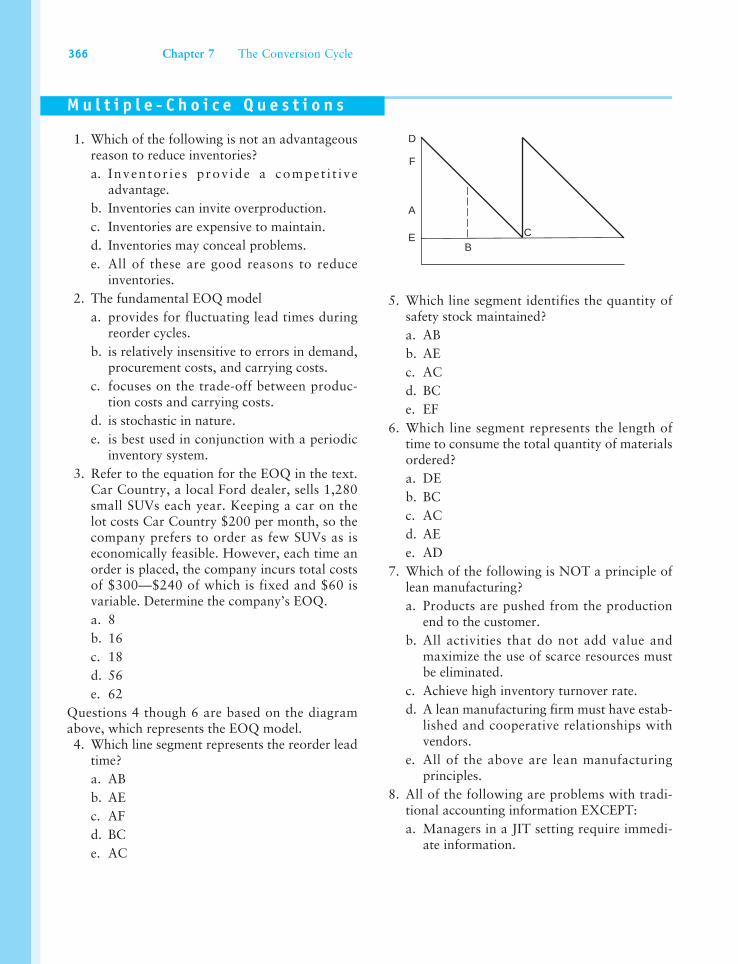
366 Chapter 7 The Conversion Cycle
1. Which of the following is not an advantageous reason to reduce inventories?
a. Inventor ie s prov ide a compet i t ive advantage.
b. Inventories can invite overproduction. c. Inventories are expensive to maintain. d. Inventories may conceal problems. e. All of these are good reasons to reduce
inventories. 2. The fundamental EOQ model a. provides for fluctuating lead times during
reorder cycles. b. is relatively insensitive to errors in demand,
procurement costs, and carrying costs. c. focuses on the trade-off between produc-
tion costs and carrying costs. d. is stochastic in nature. e. is best used in conjunction with a periodic
inventory system. 3. Refer to the equation for the EOQ in the text.
Car Country, a local Ford dealer, sells 1,280 small SUVs each year. Keeping a car on the lot costs Car Country $200 per month, so the company prefers to order as few SUVs as is economically feasible. However, each time an order is placed, the company incurs total costs of $300—$240 of which is fixed and $60 is variable. Determine the company’s EOQ.
a. 8 b. 16 c. 18 d. 56 e. 62Questions 4 though 6 are based on the diagram above, which represents the EOQ model. 4. Which line segment represents the reorder lead
time? a. AB b. AE c. AF d. BC e. AC
5. Which line segment identifies the quantity of safety stock maintained?
a. AB b. AE c. AC d. BC e. EF 6. Which line segment represents the length of
time to consume the total quantity of materials ordered?
a. DE b. BC c. AC d. AE e. AD 7. Which of the following is NOT a principle of
lean manufacturing? a. Products are pushed from the production
end to the customer. b. All activities that do not add value and
maximize the use of scarce resources must be eliminated.
c. Achieve high inventory turnover rate. d. A lean manufacturing firm must have estab-
lished and cooperative relationships with vendors.
e. All of the above are lean manufacturing principles.
8. All of the following are problems with tradi-tional accounting information EXCEPT:
a. Managers in a JIT setting require immedi-ate information.
M u l t i p l e - C h o i c e Q u e s t i o n s
F
D
A
EB
C
Part II Transaction Cycles and Business Processes 367
b. The measurement principle tends to ignore standards other than money.
c. Variance analysis may yield insignificant values.
d. The overhead component in a manufactur-ing company is usually very large.
e. All of these are problems associated with traditional accounting information.
9. Which of the following is NOT a problem associated with standard cost accounting?
a. Standard costing motivates management to produce large batches of products and build inventory.
b. Applying standard costing leads to product cost distortions in a lean environment.
c. Standard costing data are associated with excessive time lags that reduce its usefulness.
d. The financial orientation of standard costing may promote bad decisions.
e. All of the above are problems with standard costing.
10. Which one of the following statements is true? a. ERP evolved directly from MRP. b. ERP evolved into MRP and MRP evolved
into MRP II. c. MRP II evolved from MRP and MRP II
evolved into ERP. d. None of the above is true.
P r o b l e m s
1. Document FlowchartDiagram the sequence in which the following source documents are prepared.a. bill of materialsb. work orderc. sales forecastd. materials requisitione. move ticketf. production scheduleg. route sheet
2. Economic Order QuantityOut Camping is a manufacturer of supplies and has several divisions, one of which is the tent division that produces the deluxe tent Away From Home. Fourteen thousand of these tents are made each year. This model of tent incorporates two zipping doors in each model. Zippers for these doors are purchased from Zippy Zippers. Out Camping began this year with 500 zippers in inventory, but is now adopting an EOQ approach to inventory. A review of last year’s records reveals the follow-ing information concerning each order placed with Zippy Zippers: variable labor—$12; variable supplies—$1; fixed computer costs—$4; fixed office expenses—$2; fixed mailing
expenses—$2; and fixed supplies—$1. No differences are expected this year. Last year, the cost of carrying one zipper in inventory for the entire year was $1, but Out Camping has recently negotiated a new lease on its ware-house, and the cost of carrying each zipper is now expected to increase by 25 cents. Out Camping also found that it took seven days from the time an order was sent to Zippy until the zippers were received.
Required: a. Compute EOQ. b. Compute ROP. Presume Out Camping has
a desire to reduce its ending inventory to one-half of this year’s beginning amount and that the company produces the Away From Home model 140 days each year.
3. World-Class CompaniesVisit your school’s library (either in person or online) and perform a search on the keywords world-class companies and manufacturing. Find five companies that claim to be world-class manufacturing companies and state the innovation(s) these companies have under-taken to become world-class.
368 Chapter 7 The Conversion Cycle
4. Internal ControlExamine the flowchart below and determine any control threats. Specifically discuss the con-trol problems, the possible dangers, and any corrective procedures you would recommend.
5. Manufacturing ProcessesConsider a pizzeria that sells pizza, pasta, lasagna, meatball sandwiches, and sodas. Dis-cuss the methods in which the products would be manufactured under
a. the traditional manufacturing environment. b. CIM.
6. Zero Defects ProcessPlaythings, a toy manufacturer specializing in toys for toddlers, is considering switching to a JIT manufacturing process. The CEO has been talking with the production consultants, who tell her that a new philosophy must be embraced: If a defective part of an out-of- control process is detected, no more units should be made until the process is corrected.
The consultants estimate that the produc-tion process may occasionally be shut down anywhere from 30 minutes to 7 hours. Discuss the advantages and disadvantages of such a system.
7. Activity DriversCut It Up, Inc., is a manufacturer of wooden cutting boards that are sold through a chain of kitchen stores. For years, the company has allocated overhead based on total machine hours. A recent assessment of overhead costs has shown that these costs are now in excess of 40 percent of the company’s total costs. As an attempt to better control overhead, Cut It Up is adopting an ABC system. Each cutting board goes through the following processes:a. Cutting—Boards are selected from inven-
tory and are cut to the required width and length. Imperfections in boards (such as knots or cracks) are identified and removed.
ProductionPlanning Work Centers Inventory Control Cost Accounting System
Work Order
JournalVoucher
Move Ticket
Job Ticket
MaterialRequisitions
ExcessMaterial
MaterialReturns
Work Order
MaterialsInventoryRecords
LaborVariance
MaterialsVariance
General Ledger
Mgmt Reports
ManufacturingOverheadVariance
Update
Prepare
Prepare
Problem 4:Internal Control
Part II Transaction Cycles and Business Processes 369
b. Assembly—Cut wooden pieces are laid out on clamps, a layer of glue is applied to each piece, and the glued pieces are clamped together until the glue sets.
c. Shaping—Once the glue has set, the boards are sent to the shaping process, where they are cut into unique shapes.
d. Sanding—After being shaped, the cutting boards must be sanded smooth.
e. Finishing—Sanded cutting boards receive a coat of mineral oil to help preserve the wood.
f. Packing—Finished cutting boards are placed in boxes of 12. The boxes are
sealed, addressed, and sent to one of the kitchen stores.
Required:What do you suppose are components of overhead for this company? Determine a logi-cal cost driver for each process.
8. Lean Manufacturing PrinciplesWrite an essay outlining the key principles of lean manufacturing.
I n t e r n a l C o n t r o l C a s e s
1. Nautilus Water Pumps, Inc.—Internal Controls Assessment
(Prepared by Scott Pasquale and Kyle Smith, Lehigh University)Nautilus Water Pumps, Inc., manufactures automotive water pumps. Since 1988 it has supplied the Big Three (Ford Motor Company, General Motors, and Chrysler) North American auto manufacturers. Nautilus has recently bro-ken into the American-made Japanese car mar-ket. The company now supplies Toyota, Nissan, and Honda with automotive water pumps for their assembly operations in North America.
Conversion CycleAt the start of the year each automobile man-ufacturer provides Nautilus with an order that is based on budgeted sales predictions. However, this order is guaranteed for only the first month; after that each automobile manufacturer can revise orders on a monthly basis. Nautilus’s current system requires orders for RM to be placed with suppliers on a quarterly basis. While the order provides a general idea of what is to be expected, orders from the automobile manufacturers can increase or decrease dramatically after the initial month.
Under the current batch production process in the conversion cycle, the blanket order is
sent directly to the production, planning, and control phase. In this phase, the material and operation requirements are determined. It is here that the necessary production documents (bills of materials, route sheets) are created and combined with inventory status reports from inventory control and the required engineering specifications from the engineering department in order to create a purchase requisition. Cur-rently, the production-scheduling phase falls under the responsibility of the work center. At the work center, the supervisor in charge pre-pares work orders, move tickets, and materi-als requisitions. These documents are sent to the cost accounting department and are also used to create an open work order file. The work center also retains copies of these docu-ments so they can be used to initiate produc-tion activities. Under the current system, once production is initiated, any excess material is immediately scrapped. The work center also prepares the necessary time-keeping docu-ments (payroll time card and job tickets) and sends this information to the cost accounting department as well. Upon completion of the production cycle, the production schedule and move tickets are used to close the open work order file, while one copy of the work order is sent to the FG warehouse and another is sent to inventory control.

370 Chapter 7 The Conversion Cycle
At the start of the production phase, a copy of the materials requisition is sent to storekeeping so that the necessary RM can be issued to the work center. A copy of the mate-rials requisition is kept on file in storekeeping.
Inventory control is involved in the batch production process throughout the entire operation. It releases the inventory status document to production, planning, and control so that materials and operations requirements can be determined. A copy of the materials requisition document is received from storekeeping so that inventory files can be updated. Once files are updated, the materials requisition is sent to cost accounting, while the updated files are also used to prepare a jour-nal voucher that is sent to the GL department. A copy of the materials requisition, purchase requisition, and work order documents are kept on file in inventory control.
Once the cost accounting department has received all the necessary information from the other departments, the work-in-process (WIP) file is updated. All work center documents (move tickets, job tickets, materials requisitions, excess materials, and materials returns), along with a copy of the work order, are filed in the cost accounting department. At the end of the phase the cost accounting department prepares a journal voucher and sends it to the GL department. This journal voucher, along with the one sent by inventory control, is used to update the GL. Both journal vouchers are kept on file in the GL department.
Required:a. Create a data flow diagram (DFD) of the
current system.b. Create a document flowchart of the existing
system.c. Analyze the internal control weaknesses in
the system. Model your response accord-ing to the six categories of physical control activities specified in SAS 78.
d. Prepare a system flowchart of a redesigned computer-based system that resolves the control weaknesses you identified.
2. SAGA Fly Fishing, Inc.—Internal Controls AssessmentSAGA Fly Fishing, Inc., is a manufacturer of high-quality fly fishing equipment that includes rods, reels, fly lines, nets, drift boats, waders, and other equipment. It also produces low-end and moderately priced spinning rods and saltwater fishing equipment, which it sells under a different brand name to protect the high-quality image associated with its Fly Fishing division. Its home office/fly fishing production plant is located near Manchester, New Hampshire. The spinning and saltwa-ter manufacturing plants are in upstate New York. In total, SAGA employs 1,500 work-ers. SAGA distributes its products worldwide through three distribution centers. Sales are currently $200 million per year and growing.
Although equipped with up-to-date pro-duction and shop floor machinery, SAGA’s Manchester plant’s inventory management, production planning, and control procedures employ little computer technology.
The process begins in the storekeeping department, where Mr. Holt controls the inven-tory and maintains the inventory records. He checks daily on the inventory control files to assess the RM inventory needs and sends an inventory status report to production plan-ning and control.
The production planning and control department is led by Mr. Brackenbury. Once the inventory status report is received, as well as the sales forecasts from marketing, Mr. Brackenbury takes a copy of the BOM and route sheet and assesses the inventory requirements. If the inventory amounts are adequate, Mr. Brackenbury prepares a pro-duction schedule, work order, move tickets, and materials requisitions, which he sends to the work centers. Mr. Brackenbury then sends a purchase requisition to the purchasing and storekeeping departments.
Mr. Brackenbury also heads the vari-ous work centers, and the supervisors of the different work centers report to him. These supervisors, upon receipt of the aforemen-tioned documents, send the materials requisitions
Part II Transaction Cycles and Business Processes 371
to the storekeeping department, and Mr. Holt sends the necessary materials to the work cen-ter. He then files a copy of the materials req-uisition and updates the RM inventory ledger. At the end of each day, he sends a copy of the materials requisitions to the cost accounting department. He also sends a journal voucher for the use of materials and a journal voucher for FG to the GL department.
In the work centers, the managers of each center collect the employees’ time cards and send them to cost accounting, along with a copy to payroll. They also send the job and move tickets, which outline the various costs that have been incurred, to cost accounting.
Ms. Kay, who heads the cost account-ing department, collects all of the data, de-termines the overall cost, compares it to the standard costs, and determines the variances. Only the total variances are compared; the in-formation is then used to evaluate managers and supervisors of the various departments. Ms. Kay updates the WIP files and FG inven-tory files. She then creates a journal voucher and sends it to the GL department.
In the GL department, the information from the journal vouchers is entered in the GL computer program, where the files are up-dated. The journal vouchers are filed.
Required:a. Create a data flow diagram of the current
system.b. Create a document flowchart of the exist-
ing system.c. Analyze the internal control weaknesses in
the system. Model your response accord-ing to the six categories of physical control activities specified in SAS 78.
d. Prepare a system flowchart of a redesigned computer-based system that resolves the control weaknesses you identified.
3. General Manufacturing Inc.—Internal Controls AssessmentThe production process at General Manufac-turing Inc., involves the planning, schedul-ing, and controlling of the physical products
through the manufacturing process. General’s manufacturing process begins in the produc-tion planning and control department, where June determines the materials and operations requirements and combines information from various departments to assess inventory re-quirements needed to produce a product. Marketing provides the sales forecast, engi-neering provides the engineering specifica-tions, and the storeroom provides the RM inventory status. June reviews this informa-tion to prepare a purchase requisition docu-ment, which she sends to purchasing. June then reviews the BOM and route sheets and prepares the following documents: work or-ders, move tickets, and materials requisitions. Three copies of each document are prepared. One copy of the work order, move ticket, and materials requisitions documents is sent to cost accounting. The remaining two copies are sent to Mike, the supervisor in the work center.
Once Mike receives the production con-trol documents, he initiates the production process. Mike sends a copy of the materials requisitions to the inventory storeroom in ex-change for necessary RM. When additional RM is need for a job in process, they are ob-tained by calling Steve, the storeroom clerk. Materials in excess of those needed for pro-duction are kept in the work center and used in the future. When the job passes through all production stages and is complete, Mike sends the finished product to the FG ware-house. He files one copy each of the work order, move ticket, and materials requisition, and sends the remaining copies of the work order and move ticket to the cost accounting department. One of Mike’s duties is to review the job tickets and the employee timecards, which are sent to cost accounting and payroll, respectively.
Steve, in the inventory storeroom, accepts materials requisitions from the work center employees and releases the RM to the work centers. Steve files a copy of the materials requisitions and updates the RM inventory records. At the end of the day he creates a
372 Chapter 7 The Conversion Cycle
journal voucher that is sent to Ronica in the cost accounting department.
Ronica receives the following docu-ments: work orders, move tickets, and materi-als requisitions from the production planning department; job tickets, work orders, and move tickets from the work center; and jour-nal vouchers from the inventory storeroom. Ronica uses these to initiate a work-in-process (WIP) account and to update the WIP as work progresses, to calculate variances, and to up-date the GL accounts. Ronica files all docu-ments in the department.
Required:a. Create a data flow diagram of the current
system.b. Create a document flowchart of the exist-
ing system.c. Analyze the internal control weaknesses in
the system. Model your response accord-ing to the six categories of physical control activities specified in SAS 78.
d. Prepare a system flowchart of a redesigned computer-based system that resolves the control weaknesses you identified.
4. Bumper Cars, Ltd.—Inventory Management and Control(Prepared by Julie Fisch and Melinda Bowman, Lehigh University)In 1983, Mr. Amusement created Bumper Cars, Ltd., a company whose main concern was the manufacture and repair of the exte-rior shells of bumper cars used in amusement parks. Although the company functioned on a small scale for a few years, it has recently ex-panded to some new areas, including larger-scale amusement parks like Coney Island. Despite the recent increase in business, Bum-per Cars still operates as a small company with limited technology invested in computer systems. Many departments run totally man-ual systems. Because of the expansion, how-ever, Mr. Amusement has taken a serious look at the setup of his company and determined that some problems exist. The most pressing problem is in the area of inventory manage-ment and control.
Inventory Control DepartmentAt Bumper Cars, RM is stored in a warehouse until it is transferred to the production de-partment for manufacturing. The inventory control department, which consists of three workers employed under the inventory man-ager, Ms. Coaster, works with the inventory at the RM stage. Each worker’s responsibilities involve periodic inventory counts, along with the day-to-day jobs of storing and transferring inventory. Each day, when the workers trans-fer the inventory to WIP, they also attempt to keep track of the levels of inventory to inform the purchasing department to reorder if the stock of materials becomes too low. How-ever, in their attempt to achieve efficient and speedy transfers of RM to manufacturing, the workers find it difficult and inconvenient to constantly check for low levels of inventory. As a result, the inventory frequently runs out before the workers reorder, which causes a gap in RM needed for production.
Production DepartmentThe production department receives the goods from inventory control, then puts them into production. Recently, Mr. Ferris, the production manager, complained to the president about the inconvenience caused by the lack of RM at crucial periods of produc-tion. As he stated at an important manage-rial meeting:
“Each week, we have a certain number of orders that must be filled, along with an indeterminable and changing number of repair requests. When we receive these orders, we immediately start work in order to fill our quotas on time. Lately, however, my work-ers have been handicapped by the fact that the RM is not available to put into produc-tion at the times we need it. During these lags, production stops, workers become idle, and back-orders pile up. Although we inform the inventory control and purchases depart-ments of the problem right away, it still takes time for them to order and get the inventory to the warehouse. Then, it takes even more time for them to get the inventory to us in production. As a result, when we finally receive
Part II Transaction Cycles and Business Processes 373
the necessary materials, my workers are forced to work overtime and at an unreasonable rate to meet demand. This up-and-down method of working is bad for general morale in my department. My workers tend to become lazy, expecting a lag to occur. Also, requests for repairs become nearly impossible to fulfill because we never know if the materials needed to fix the problem will be available. Usually we fall so far behind on regular production during these lags that we must concentrate all our efforts just to meet daily demand. As a result, our repair business has dropped steadily over the past year. I feel that these production lags are extremely detrimental to our expanding business, and we should immediately work on finding a solution.”
Possible SolutionsAs a result of Mr. Ferris’s complaints, Bum-per Cars realized that some changes must be made. Basically, the company determined that both the inventory control and produc-tion departments needed reorganization at a reasonable cost. Another managerial meeting of all the department heads took place spe-cifically to discuss this problem. Each man-ager came to the meeting with his or her own ideas for a possible solution. Mr. Flume, the controller, aggressively suggested that a new company-wide computer system be installed. This system would solve the inventory con-trol problems by keeping up-to-date records of the inventory available at any given time. At the same time, the system could be set up to reduce paperwork in the accounting and finance departments. In addition, this com-puter could link all the departments and thus alleviate communication breakdowns. Finally, the computer could be linked to the company from which Bumper Cars ordered its inven-tory, so that as soon as materials became low, it could immediately reorder before a problem developed.
At this point in the meeting, the president, Mr. Amusement, jumped up and exclaimed:
“Wait a minute! This system would solve our problems. But as you all know, we are not a large company. The cost of implementing a company-
wide computer system would be excessive. We would have to consider research, installation, maintenance, and repair costs involved in developing a complex system such as this one. When you take everything into consideration, I’m not sure if the costs would greatly exceed the benefits. Let’s search for some other less costly, but still efficient, solutions.”
Mr. Ferris, the production manager, then offered a second possible solution. After agreeing that a computer system might be too expensive, he went on to suggest:
“My main problem is meeting demand after a backlog has occurred: another possible solu-tion might be to hire temporary workers to help alleviate the overload problem. These workers would not cost much because they would not receive benefits. Yet they would help solve the immediate problem. They would then be trained for production, so if people leave the production department, it would be easy to find replacements. As a result, production could continue with a minimum of problems and lags.”
The managers discussed Mr. Ferris’s sug-gestion for a few minutes. Then Ms. Coaster, the inventory control manager, stood up and offered a third solution for the inventory problems. She explained:
“Although Mr. Ferris’s plan might work, I feel that the real root of the problem lies in my department rather than in the area of produc-tion. It seems that the problem is that my employees have too many tasks to perform all at once. Therefore, what we really need are more employees in the inventory control department to continually check and recheck inventory levels. Then my other employees could concentrate solely on the transfer of RM to production. By this separation of tasks, I feel we could efficiently solve our inventory problems. Also, the cost of hiring a few more people would not be excessive.”
By the end of the meeting, management still had not made a decision. They had iden-tified the need to reorganize, but they could not decide which approach would be the best for the company.

374 Chapter 7 The Conversion Cycle
Required:Using the information about Bumper Cars, Ltd., along with your knowledge, either agree or disagree with the various solutions that the company’s employees suggest. Discuss what you feel is the best solution for the company’s inventory problem.
5. Blades R Us—Comprehensive Case(Prepared by Edward P. Kiernan and Abigail Olken, Lehigh University)Blades R Us is a growing manufacturing firm that produces high-pressure turbine blades. The company supplies these to airline compa-nies as replacement parts for use in large com-mercial jet engines. The high-pressure turbine is the segment of the engine that undergoes the most stress and heat. This requires that these parts be replaced frequently, so Blades R Us operates a relatively large firm with con-stant demand for its products. It operates out of Philadelphia, Pennsylvania, with a work-force of approximately 1,000 employees. Its annual output is based on demand, yet at full capacity, it has the ability to produce 100,000 blades a year. The company’s largest suppliers are casting houses, which take a rough shape of the final product to very demanding speci-fications given by Blades. Blades R Us then does the final detail work to bring it to FAA regulations.
The general business environment of Blades R Us is one in which it sees expan-sion in its future. This is because of the recent boom in the commercial airline industry. In addition, with the recent attention to airline safety and the discovery of bogus parts used in engines, the airlines will be doing better checks and needing to replace parts more fre-quently to ensure safety.
Blades R Us has been around for some time, and therefore has no computer-operated accounting systems. Some of the problems the company faces include (a) lack of inventory control; (b) keeping track of items in pro-duction or production that was completed in one day; (c) a need for trends and tracking of the largest customers so that future demand
might be more accurate; (d) supervisory issues dealing with theft of parts, near substandard parts, and hiding of scrap; and (e) large inven-tories on hand of both FG and RM.
Procurement ProceduresThe company reviewed the records associated with the RM inventory files. Mr. Sampson, the inventory manager, was in charge of this procedure. Once he finished his manual review of the inventory, he issued two purchase req-uisitions. He kept one of the purchase requisi-tions in the inventory department, filing it in a cabinet. He sent the second purchase requi-sition to the purchasing department.
Ms. Connolly in the purchasing depart-ment would take the requisition and complete a purchase order in triplicate. One copy was sent to the supplier, the second was filed in the purchases department filing cabinet, and the third was sent back to Mr. Sampson in the inventory, department. Mr. Sampson would use this PO to update his inventory records so he knew exactly how much inventory was on hand at all times. Once the inventory was updated, the PO was put in the filing cabinet in the inventory department with the original purchase requisition.
The supplier would receive the PO and send the requested blades, including a pack-ing slip with the shipment. At the same time shipment was made, the supplier would also send an invoice to the AP department.
In receiving, Mr. Hiro simply used the packing slip that was included with the goods to make three copies of the receiving report. The first copy was sent to the purchasing depart-ment, where it was filed. The second copy was sent to accounts payable (AP), and Mr. Hiro filed the third copy in the filing cabinet.
The AP department would file the receiv-ing report until the invoice from the supplier arrived. Then Mr. Maldonado would check both the receiving report and invoice to make sure everything sent was actually received. Mr. Maldonado would then hand off the docu-ments to Mr. Bailey so that he could do the
Part II Transaction Cycles and Business Processes 375
appropriate posting and filing of the checked documents. Mr. Bailey would post the changes to the voucher register and purchases journal, sending a journal voucher to the GL depart-ment after the purchases journal was updated. Mr. Bailey would then put the receiving report and invoice in the appropriate file. Also in AP, Mr. Dresden would scan the records to see when it was time to write checks to the dif-ferent vendors. Whenever a due date arrived, Mr. Dresden would write a check in two cop-ies. The first copy would be filed in the cabinet, and the other would be sent to the appropri-ate vendor. Then Mr. Dresden would update the AP subsidiary ledger and send an account summary to the GL department.
The GL department was a tight ship. Mr. Callahan would receive the account sum-mary and journal voucher and then post the necessary changes to the GL. After posting, the documents were filed in the GL department.
Conversion Cycle ProceduresThe conversion cycle at Blades R Us begins with the production planning and control department receiving the inventory levels from the FG warehouse. If the number of a given part in the FG warehouse is below the set minimum, then production for the part is to be run. The production planning and control department gathers the BOM and the route sheet for that part and makes up the produc-tion schedule and work orders. A copy of the work order, route sheet, BOM, and produc-tion schedule is filed at the production plan-ning and control department. A copy of the production schedule, work order, and BOM is sent to the work centers.
Once the work centers receive the paper-work from the production planning and con-trol department, production is initiated. The work order is sent to the FG warehouse, and the production schedule and route sheet are filed. Time cards are filled, out and given to the payroll department. Materials requisition forms are filled out in order to attain the nec-essary materials—one is filed, and the other is sent to the inventory control department.
When inventory control receives the mate-rials requisition, they send the desired mate-rial to the work center, update the inventory records, and then file the material requisition. The inventory control department makes the decision to buy RM based on a predetermined minimum of parts in inventory and a set order number. The inventory records are periodi-cally reviewed, and when the number of a part in inventory falls below the set minimum, a purchase requisition is completed. One copy is sent to the purchasing department and the other is filed. The purchasing department sends inventory control a purchase order, which it then uses to update its inventory records. The purchase order is then filed.
Blades R Us has made the decision to try to become a world-class company. It realizes that it will have to make many fundamen-tal changes to achieve this goal. One of the first steps that they have decided to take is to implement an MRP system. They feel this will help them to keep better track of their inventories, WIP, and customer demands and trends. They also realize that there are many weaknesses in the other pieces of their conver-sion cycles, and they would like to take steps in improving those as well.
Required: a. Create a data flow diagram of the current
system. b. Create a document flowchart of the existing
system. c. Analyze the internal control weaknesses
in the system. Model your response accord-ing to the six categories of physical con-trol activities specified in SAS 78.
d. Prepare a system flowchart of a redesigned computer-based system that resolves the control weaknesses you identified.
6. Automotive Component Corporation—Activity-Based Costing Case(Prepared by Trey Johnston, Lehigh University)Automotive Component Corporation (ACC) began in 1955 as a small machine shop
376 Chapter 7 The Conversion Cycle
supplying the Big Three automakers. The business is now a $2 billion component manu-facturing firm. During the three decades from 1955 to 1985, ACC expanded from a com-mon machine shop to a modern manufactur-ing operation with CNC machines, automatic guided vehicles (AGVs), and a world-class quality program. Consequently, ACC’s direct-labor cost component has decreased significantly since 1955 from 46 percent to 11 percent. ACC’s current cost structure is as follows:
Manufacturing overhead 43.6% Materials 27.1% Selling and administrative 17.8% expenses Labor 11.5%
Despite efforts to expand, revenues leveled off and margins declined in the late 1980s and early 1990s. ACC began to question its in-vestment in the latest flexible equipment and even considered scrapping some. Bill Brown, ACC’s controller, explains.
“At ACC, we have made a concerted effort to keep up with current technology. We invested in CNC machines to reduce setup time and setup labor and to improve quality. Although we accomplished these objectives, they did not translate to our bottom line. Another in-vestment we made was in AGVs. Our opinion at the time was that the reduction in labor and increased accuracy of the AGVs com-bined with the CNC machines would allow us to be competitive on the increasing number of small-volume orders. We have achieved success in this area, but once again, we have not been able to show a financial benefit from these programs. Recently, there has been talk of scrapping the newer equipment and returning to our manufacturing practices of the early eighties. I just don’t believe this could be the right answer but, as our mar-gins continue to dwindle, it becomes harder and harder to defend my position.”
With these sentiments in mind, Bill decided to study the current costing system at ACC in detail. He had attended a seminar recently that
discussed some of the problems that arise in traditional cost accounting systems. Bill felt that some of the issues discussed in the meeting directly applied to ACC’s situation.
The speaker mentioned that ABC was a tool that corporations could use to better identify their true product costs. He also men-tioned that better strategic decisions could be made based on the information provided from the activity-based reports. Bill decided to form an ABC team to look at the prospect of imple-menting ABC at ACC. The team consisted of two other members: Sally Summers, a product engineer with a finance background, and Jim Schmidt, an industrial engineer with an MBA.
Sally had some feelings about the current state of ACC:
“ACC is a very customer-focused company. When the automakers demanded small-volume orders, we did what we could to change our manufacturing processes. The problem is that no one realized that it takes just as long for the engineering department to design a 10-component part and process for a small-volume order as it does for a 10-component, large-volume order. Our engineering depart-ments cannot handle this kind of workload much longer. On top of this, we hear rumors about layoffs in the not-too-distant future.”
Jim felt similarly:
“Sally is correct. As an industrial engineer, I get involved in certain aspects of production that are simply not volume dependent. For example, I oversee first-run inspections. We run a predetermined number of parts before each full run to ensure the process is under control. Most of the inspections we perform on the automobile components are looking for burrs, which can severely affect fit or function downstream in our assembly pro-cess. Many times, we can inspect sample part runs right on the line. The real consumption of resources comes from running a sample batch, not by inspecting each part.”
To begin its study, the team obtained a cost report from the plant’s cost accountant. A summary of the product costs is as follows:
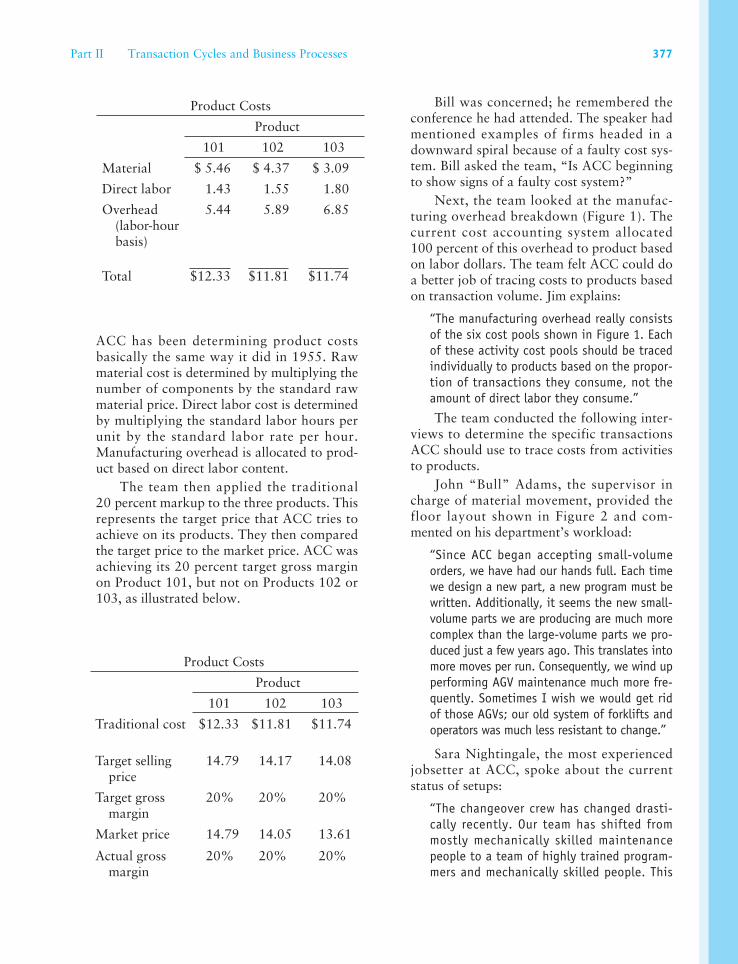
Part II Transaction Cycles and Business Processes 377
ACC has been determining product costs basically the same way it did in 1955. Raw material cost is determined by multiplying the number of components by the standard raw material price. Direct labor cost is determined by multiplying the standard labor hours per unit by the standard labor rate per hour. Manufacturing overhead is allocated to prod-uct based on direct labor content.
The team then applied the traditional 20 percent markup to the three products. This represents the target price that ACC tries to achieve on its products. They then compared the target price to the market price. ACC was achieving its 20 percent target gross margin on Product 101, but not on Products 102 or 103, as illustrated below.
Bill was concerned; he remembered the conference he had attended. The speaker had mentioned examples of firms headed in a downward spiral because of a faulty cost sys-tem. Bill asked the team, “Is ACC beginning to show signs of a faulty cost system?”
Next, the team looked at the manufac-turing overhead breakdown (Figure 1). The current cost accounting system allocated 100 percent of this overhead to product based on labor dollars. The team felt ACC could do a better job of tracing costs to products based on transaction volume. Jim explains:
“The manufacturing overhead really consists of the six cost pools shown in Figure 1. Each of these activity cost pools should be traced individually to products based on the propor-tion of transactions they consume, not the amount of direct labor they consume.”
The team conducted the following inter-views to determine the specific transactions ACC should use to trace costs from activities to products.
John “Bull” Adams, the supervisor in charge of material movement, provided the floor layout shown in Figure 2 and com-mented on his department’s workload:
“Since ACC began accepting small-volume orders, we have had our hands full. Each time we design a new part, a new program must be written. Additionally, it seems the new small-volume parts we are producing are much more complex than the large-volume parts we pro-duced just a few years ago. This translates into more moves per run. Consequently, we wind up performing AGV maintenance much more fre-quently. Sometimes I wish we would get rid of those AGVs; our old system of forklifts and operators was much less resistant to change.”
Sara Nightingale, the most experienced jobsetter at ACC, spoke about the current status of setups:
“The changeover crew has changed drasti-cally recently. Our team has shifted from mostly mechanically skilled maintenance people to a team of highly trained program-mers and mechanically skilled people. This
Product Costs
Product
101 102 103
Material $ 5.46 $ 4.37 $ 3.09
Direct labor 1.43 1.55 1.80
Overhead (labor-hour basis)
5.44 5.89 6.85
Total $12.33 $11.81 $11.74
Product Costs
Product
101 102 103
Traditional cost $12.33 $11.81 $11.74
Target selling price
14.79 14.17 14.08
Target gross margin
20% 20% 20%
Market price 14.79 14.05 13.61
Actual gross margin
20% 20% 20%
378 Chapter 7 The Conversion Cycle
shift has greatly reduced our head count. Yet the majority of our work is still spent on setup labor time.”
Phil Johnson, the shipping supervisor, told the team what he felt drove the activity of the shipping department:
“The volume of work we have at the ship-ping department is completely dependent on the number of trucks we load. Recently, we have been filling more trucks per day with less volume. Our workload has increased, not decreased. We still have to deal with all of the paperwork and administrative hassles for each shipment. Also, the smaller trucks they use these days are side-loaders, and our loading docks are not set up to handle these trucks. Therefore, it takes us a while to coor-dinate our docks.”
Once the interviews were complete, the team went to the systems department to request basic product information on the three prod-ucts ACC manufactured. The information is shown in Figure 3.
Required:The team has conducted all of the required interviews and collected all of the necessary information in order to proceed with its ABC pilot study.
a. The first three steps in an activity-based cost implementation are to define the resource categories, activity centers, and first-stage resource drivers. These steps have already been completed at ACC, and the results are displayed in Figure 1. Using the infor-mation from the case, perform the next step for the implementation team and de-termine the second-stage cost drivers ACC should use in its ABC system. Support your choices with discussion.
b. Using the second-stage cost drivers identified in part (a), compute the new product costs for Products 101, 102, and 103.
c. Modify Figure 2 and include the cost driv-ers identified in part (a).
d. Compare the product costs computed under the current cost accounting system to the product costs computed under the activity-based system.
e. Explain the differences in product cost.f. Given the new information provided by
the ABC system, recommend a strategy ACC should pursue to regain its margins, and comment on specific improvements that would reduce ACC’s overhead burden in the long run.

Part II Transaction Cycles and Business Processes 379
Receiving(101, 102, & 103)
DrillPresses
(101) Grinding(101 & 102)
Storeroom(101, 102, & 103)
Shipping(101, 102, & 103)
IntermediateInspection
(101 & 102)
FinalInspection
(101, 102, & 103)
Grinding(103)
DrillPresses
(102 & 103)
CNC(101, 102, & 103)
FinalAssembly
(101, 102, & 103)
Case 6:Figure 2
Case 6:Figure 1
First-Stage Resource Drivers
Second-Stage Cost Drivers
DLH175.84/DLH
PRODUCTS
Activity CostPool
ResourceCategory MOH
$377,618
Engineering$72,050
Machine$103,883
Inspection$58,871
Material Handling$65,252
Setup$27,377
Shipping$50,148
19.08% 27.51% 15.59% 17.28% 7.25% 13.28%
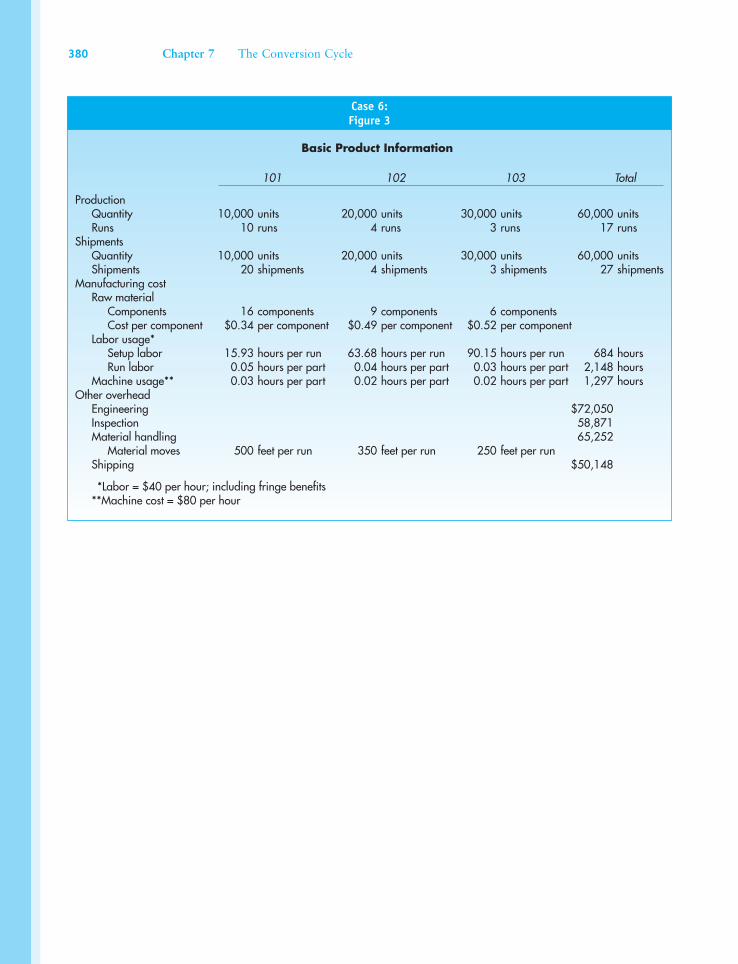
380 Chapter 7 The Conversion Cycle
Basic Product Information
101 102 103 Total
ProductionQuantity 10,000 units 20,000 units 30,000 units 60,000 units
snur71snur3snur4snur01snuRShipments
Quantity 10,000 units 20,000 units 30,000 units 60,000 unitsShipments 20 shipments 4 shipments 3 shipments 27 shipments
Manufacturing costRaw material
Components 16 components 9 components 6 componentsCost per component $0.34 per component $0.49 per component $0.52 per component
Labor usage*Setup labor 15.93 hours per run 63.68 hours per run 90.15 hours per run 684 hoursRun labor 0.05 hours per part 0.04 hours per part 0.03 hours per part 2,148 hours
Machine usage** 0.03 hours per part 0.02 hours per part 0.02 hours per part 1,297 hoursOther overhead
Engineering $72,050Inspection 58,871Material handling 65,252
Material moves 500 feet per run 350 feet per run 250 feet per runShipping $50,148
*Labor = $40 per hour; including fringe benefits**Machine cost = $80 per hour
Case 6:Figure 3
Copyright © 2022 FDOKUMEN