Selective calcium sensitivity in immature glioma cancer stem cells
19
RESEARCH ARTICLE Selective Calcium Sensitivity in Immature Glioma Cancer Stem Cells Shimei Wee 1. , Maria Niklasson 2.¤ , Voichita Dana Marinescu 3 , Anna Segerman 3 , Linne ´ a Schmidt 3 , Annika Hermansson 3 , Peter Dirks 4 , Karin Forsberg-Nilsson 3 , Bengt Westermark 3 , Lene Uhrbom 3 , Sten Linnarsson 2 , Sven Nelander 3 , Michael Anda ¨ng 1 * 1. Department of Physiology and Pharmacology, Karolinska Institutet, 171 77 Stockholm, Sweden, 2. Department of Medical Biochemistry and Biophysics, Karolinska Institutet, 171 77 Stockholm, Sweden, 3. Department of Immunology, Genetics and Pathology, Uppsala University, 751 85 Uppsala, Sweden, 4. The Hospital for Sick Children, University of Toronto, Toronto, Canada * [email protected] . These authors contributed equally to this work. ¤ Current address: Department of Immunology, Genetics and Pathology, Uppsala University, 751 85 Uppsala, Sweden Abstract Tumor-initiating cells are a subpopulation in aggressive cancers that exhibit traits shared with stem cells, including the ability to self-renew and differentiate, commonly referred to as stemness. In addition, such cells are resistant to chemo- and radiation therapy posing a therapeutic challenge. To uncover stemness- associated functions in glioma-initiating cells (GICs), transcriptome profiles were compared to neural stem cells (NSCs) and gene ontology analysis identified an enrichment of Ca 2+ signaling genes in NSCs and the more stem-like (NSC- proximal) GICs. Functional analysis in a set of different GIC lines regarding sensitivity to disturbed homeostasis using A23187 and Thapsigargin, revealed that NSC-proximal GICs were more sensitive, corroborating the transcriptome data. Furthermore, Ca 2+ drug sensitivity was reduced in GICs after differentiation, with most potent effect in the NSC-proximal GIC, supporting a stemness-associated Ca 2+ sensitivity. NSCs and the NSC-proximal GIC line expressed a larger number of ion channels permeable to potassium, sodium and Ca 2+ . Conversely, a higher number of and higher expression levels of Ca 2+ binding genes that may buffer Ca 2+ , were expressed in NSC-distal GICs. In particular, expression of the AMPA glutamate receptor subunit GRIA1, was found to associate with Ca 2+ sensitive NSC-proximal GICs, and decreased as GICs differentiated along with reduced Ca 2+ drug sensitivity. The correlation between high expression of Ca 2+ channels (such as GRIA1) and sensitivity to Ca 2+ drugs was confirmed in an additional nine novel GIC lines. Calcium drug sensitivity also correlated with expression of the NSC markers OPEN ACCESS Citation: Wee S, Niklasson M, Marinescu VD, Segerman A, Schmidt L, et al. (2014) Selective Calcium Sensitivity in Immature Glioma Cancer Stem Cells. PLoS ONE 9(12): e115698. doi:10. 1371/journal.pone.0115698 Editor: Alfredo Quinones-Hinojosa, Johns Hopkins University, United States of America Received: July 24, 2014 Accepted: November 26, 2014 Published: December 22, 2014 Copyright: ß 2014 Wee et al. This is an open- access article distributed under the terms of the Creative Commons Attribution License, which permits unrestricted use, distribution, and repro- duction in any medium, provided the original author and source are credited. Data Availability: The authors confirm that all data underlying the findings are fully available without restriction. All relevant data are within the paper and Supporting Information files. Funding: Swedish Childhood Cancer foundation PR2013-0084 ( www.barncancerfonden.se), Swedish Cancer Foundation CAN 2011/783 ( www. cancerfonden.se), Swedish Research Council 2011-4567 (vr.se), Karolinska Institutet ( www.ki.se), Linnaeus center in Developmental Biology for Regenerative Medicine ( www.dbrm.se). SW was partially funded by the Karolinska Institutet PhD scholarship program. MN was funded by a post- doc scholarship from the Swedish Cancer Foundation. The funders had no role in study design, data collection and analysis, decision to publish, or preparation of the manuscript. Competing Interests: The authors have declared that no competing interests exist. PLOS ONE | DOI:10.1371/journal.pone.0115698 December 22, 2014 1 / 19
-
Upload
independent -
Category
Documents
-
view
0 -
download
0
Transcript of Selective calcium sensitivity in immature glioma cancer stem cells

RESEARCH ARTICLE
Selective Calcium Sensitivity in ImmatureGlioma Cancer Stem CellsShimei Wee1., Maria Niklasson2.¤, Voichita Dana Marinescu3, Anna Segerman3,Linnea Schmidt3, Annika Hermansson3, Peter Dirks4, Karin Forsberg-Nilsson3,Bengt Westermark3, Lene Uhrbom3, Sten Linnarsson2, Sven Nelander3, MichaelAndang1*
1. Department of Physiology and Pharmacology, Karolinska Institutet, 171 77 Stockholm, Sweden, 2.Department of Medical Biochemistry and Biophysics, Karolinska Institutet, 171 77 Stockholm, Sweden, 3.Department of Immunology, Genetics and Pathology, Uppsala University, 751 85 Uppsala, Sweden, 4. TheHospital for Sick Children, University of Toronto, Toronto, Canada
. These authors contributed equally to this work.
¤ Current address: Department of Immunology, Genetics and Pathology, Uppsala University, 751 85 Uppsala,Sweden
Abstract
Tumor-initiating cells are a subpopulation in aggressive cancers that exhibit traits
shared with stem cells, including the ability to self-renew and differentiate,
commonly referred to as stemness. In addition, such cells are resistant to chemo-
and radiation therapy posing a therapeutic challenge. To uncover stemness-
associated functions in glioma-initiating cells (GICs), transcriptome profiles were
compared to neural stem cells (NSCs) and gene ontology analysis identified an
enrichment of Ca2+ signaling genes in NSCs and the more stem-like (NSC-
proximal) GICs. Functional analysis in a set of different GIC lines regarding
sensitivity to disturbed homeostasis using A23187 and Thapsigargin, revealed that
NSC-proximal GICs were more sensitive, corroborating the transcriptome data.
Furthermore, Ca2+ drug sensitivity was reduced in GICs after differentiation, with
most potent effect in the NSC-proximal GIC, supporting a stemness-associated
Ca2+ sensitivity. NSCs and the NSC-proximal GIC line expressed a larger number
of ion channels permeable to potassium, sodium and Ca2+. Conversely, a higher
number of and higher expression levels of Ca2+ binding genes that may buffer Ca2+,
were expressed in NSC-distal GICs. In particular, expression of the AMPA
glutamate receptor subunit GRIA1, was found to associate with Ca2+ sensitive
NSC-proximal GICs, and decreased as GICs differentiated along with reduced Ca2+
drug sensitivity. The correlation between high expression of Ca2+ channels (such as
GRIA1) and sensitivity to Ca2+ drugs was confirmed in an additional nine novel GIC
lines. Calcium drug sensitivity also correlated with expression of the NSC markers
OPEN ACCESS
Citation: Wee S, Niklasson M, Marinescu VD,Segerman A, Schmidt L, et al. (2014) SelectiveCalcium Sensitivity in Immature Glioma CancerStem Cells. PLoS ONE 9(12): e115698. doi:10.1371/journal.pone.0115698
Editor: Alfredo Quinones-Hinojosa, Johns HopkinsUniversity, United States of America
Received: July 24, 2014
Accepted: November 26, 2014
Published: December 22, 2014
Copyright: � 2014 Wee et al. This is an open-access article distributed under the terms of theCreative Commons Attribution License, whichpermits unrestricted use, distribution, and repro-duction in any medium, provided the original authorand source are credited.
Data Availability: The authors confirm that all dataunderlying the findings are fully available withoutrestriction. All relevant data are within the paperand Supporting Information files.
Funding: Swedish Childhood Cancer foundationPR2013-0084 (www.barncancerfonden.se),Swedish Cancer Foundation CAN 2011/783 (www.cancerfonden.se), Swedish Research Council2011-4567 (vr.se), Karolinska Institutet (www.ki.se),Linnaeus center in Developmental Biology forRegenerative Medicine (www.dbrm.se). SW waspartially funded by the Karolinska Institutet PhDscholarship program. MN was funded by a post-doc scholarship from the Swedish CancerFoundation. The funders had no role in studydesign, data collection and analysis, decision topublish, or preparation of the manuscript.
Competing Interests: The authors have declaredthat no competing interests exist.
PLOS ONE | DOI:10.1371/journal.pone.0115698 December 22, 2014 1 / 19

nestin (NES) and FABP7 (BLBP, brain lipid-binding protein) in this extended
analysis. In summary, NSC-associated NES+/FABP7+/GRIA1+ GICs were
selectively sensitive to disturbances in Ca2+ homeostasis, providing a potential
target mechanism for eradication of an immature population of malignant cells.
Introduction
Glioblastoma multiforme (GBM) is a highly malignant form of brain cancer with
poor prognosis for affected individuals. Despite the combination of surgery,
chemotherapy and radiotherapy, more than 90% of the patients show recurrence
[1], and the median survival remains as low as 14–16 months [2]. Although
malignant glioma tumors are highly heterogenous, a subpopulation of immature
cells, termed glioma initiating cells (GICs) [2–6] coexist with more differentiated
cell populations. GICs have been shown to be resistant to radio- and
chemotherapy and are believed to be responsible for the tumor relapse [7].
Reflecting the immaturity of GICs and their ability to differentiate [8], these cells
have been shown to share a stem cell (stemness)-associated gene expression with
stem cell populations, such as teratoma-forming normal embryonic stem cells [9–
11], and it is proposed that GICs continuously resupply the bulk tumor cells
through self-renewal and differentiation [11, 12]. Much of the drug development
research for GBM treatment has focused on targeting bulk cells, most of which
lack tumor-initiating capacity. A major challenge that remains is increasing the
efficacy of cancer treatment targeting GICs as these cells exhibit resistance to
chemo- and radiotherapy using current strategies.
Although several signaling pathways such as Notch, Hedgehog-Gli, RTK-Akt,
BMP/TGF-b, WNT-b-catenin and STAT3 have been shown to support self-
renewal of stem cells and immature cancer cells [13], potential therapeutic targets
that can selectively eradicate GICs are few [14]. An alternative strategy to render
GICs less aggressive was demonstrated by BMP induced differentiation therapy
[8]. Also dopamine D2 receptor antagonists have been identified to drive
differentiation of relatively differentiation-resistant leukemic and breast tumor
initiating cells [15].
Ion channels have long been assigned the role of governing basic cellular
processes in addition to electrical excitability and for example potassium and Ca2+
channel signaling control diverse functions as proliferation and migration in stem
cells and cancer cell lines [16, 17]. Ca2+ has also been implicated in cancer cell
survival [18]. Recently, it was also shown that interference with a Ca2+ channel
subunit was able to drive liver tumor-initiating cells into apoptosis [19].
In this study, we set to investigate mechanisms unique for the stemness-
associated functions in glioma cells and conclude that stem-like cells are more
sensitive to Ca2+ disturbances compared to more mature cell types.
Calcium Sensitivity in Glioma Stem Cells
PLOS ONE | DOI:10.1371/journal.pone.0115698 December 22, 2014 2 / 19

Materials and Methods
Cell culture
GliNS1, G179NS and G166NS GIC lines were grown in culture as previously
described [6, 11]. Briefly, the cells were first grown as spheres in the first week
before transferring to laminin-coated dishes, where they were grown as adherent
monolayers in serum-free human Neurocult NS-A basal media (StemCell
Technologies) supplemented with Glutamax, Hepes, N2, B27 (Invitrogen), EGF
(10 ng/ml) and bFGF (10 ng/ml) (R&D Systems). GICs were grown to
subconfluence, dissociated using TrypLExpress (Invitrogen), and then split 1:2–
1:4. 2/3 of medium was replaced with fresh medium every 3–4 days. For
differentiation, cells were cultured in DMEM/F12 media supplemented with 10%
fetal bovine serum (FBS; Gibco, Life Technologies)) for two weeks
Novel human malignant glioblastoma initiating cell (GIC) cultures (U3NNN-
MG series of GIC lines) used in this study are part of the Uppsala University
Human Glioma Cell Culture (HGCC) collection, which comprises well-
characterized GBM-derived cancer initiating cell cultures (Xie et al 2014,
manuscript in preparation). This work was approved by the Uppsala ethical
review board (2007/353). All GIC lines were used between passages 15 and 30.
Cell assays
GliNS1, G179NS and G166NS GIC lines, both undifferentiated and differentiated,
were seeded on day 1 at 20% density onto laminin-coated 96 or 384 black well, flat
bottom microplates (Corning). Compounds were added to the plates on day 2,
followed by incubation for 48 hrs. FBS differentiated cells received serum-free
media (50% human Neurocult NS-A basal media, 50% Neurobasal media (Gibco,
Life Technologies), supplemented with Glutamax, Hepes, B27, J N2, no growth
factors) during chemical compound treatment. DMSO was used as negative
control. Viability assay was performed using the CellTiterGlo assay (Promega,
Madison, WI) according to the manufacturer’s recommendations. Briefly, assay
reaction buffer was added to the wells using an automated multipipette, followed
by shaking the microplate for 30 seconds and 7 min incubation in the dark.
Luciferase intensity reading was then taken using Victor2 (Perkin Elmer) with a
setting of 1 s luminescence reading per well. Z-factor was calculated for each
experiment. For every cell line (GliNS1, G179NS, G166NS and hf5205NS), at least
3 replicates were analyzed. Statistical calculations were performed with
GraphPadPrism (GraphPad Software, Inc. San Diego, CA, USA). Dose-response
data were processed using log-linear interpolation to obtain log IC50 values.
Drug assays in novel GIC lines (U3NNN-MG series) were seeded in 384-well
microplates (BD Falcon Optilux Cat. #353962) 24 hours prior to treatment using
a Multidrop 384 liquid dispenser (ThermoScientific, Sweden). To ensure growth
phase at end of the assay (,70% confluency) cells were seeded at a density ranging
between 2000–4000 cells/well. Drugs were transferred using the ECHO550 non-
contact liquid dispenser (Labcyte, USA) to a 384 V- bottom polypropylene plate.
Calcium Sensitivity in Glioma Stem Cells
PLOS ONE | DOI:10.1371/journal.pone.0115698 December 22, 2014 3 / 19

The drugs were then diluted in medium and transferred using the MDT 384 head
on a Janus automated workstation (PerkinElmer, USA) to the cell plates. Drugs
were tested in 11-point dose dilution series and assayed for viability after 72 hours
of treatment on an EnVision Multilabel reader (PerkinElmer, USA) using
resazurin (R7017, SigmaAldrich, Stockholm, Sweden), at the excitation/emission
wave- length 560/590 nm [20]. As a positive control, the drug doxorubicin was
screened with the same dose-response curve setting, and wells containing negative
DMSO controls at 4 different concentrations were assayed as well. The effect on
viability of each drug dose was calculated as a viability ratio W5 Ytreated/
Ycontrol, where Y represents the average fluorescence signal.
RNA extraction, transcriptome and data analysis
Two replicates were analyzed for the undifferentiated and differentiated cell lines
GliNS1, G166NS and G179NS, while three replicates were analyzed for DMSO,
A23187 and Thapsigargin treated GliNS1 and G166NS. Total RNA was extracted
from cells grown to subconfluency using the RNeasy Mini Kit (Qiagen), following
the manufacturer’s instructions. Fluorometric quantitation of RNA concentration
and quality was done using the Qubit RNA assay kit (Invitrogen). We used 300 ng
of total RNA in the preparation of the TruSeq library, for which we used the
Illumina Low-Throughput TruSeq RNA Sample Preparation Kit protocol
resulting in barcoded cDNA. 50 ng of barcoded TruSeq products were used for
Illumina RNA sequencing. Samples were sequenced on an Illumina HiSeq 2000
sequencer as single-end 51-nucleotide reads according to the manufactures
protocol. Raw reads were mapped to the reference human genome and
normalized data was generated for each genomic feature using STRT software
[21]. Briefly, raw reads were aligned using Bowtie [22]. Mapped reads were
normalized using reads per KB per million reads (RPKM) normalization method
[23] whereas unmapped reads were removed. Differential gene expression analysis
was done in R-studio using the DESeq package [24] and a script adopted from a
previous paper [25]. Benjamini adjusted p-values were used for data analysis. Data
analysis was done using Qlucore Omics Explorer 2.0 (Qlucore AB), PRISM 6
(GraphPad Software), DAVID (http://david.abcc.ncifcrf.gov) and GeneVenn
(http://genevenn.sourceforge.net).
The Uppsala U3NNN-MG cell lines were not analyzed in replicates. For each
cell line total RNA was extracted from cultured cells using the RNeasy Mini kit
(Qiagen) and was labeled and hybridized on Affymetrix GeneChip Human Exon
1.0 ST arrays following the instructions of the manufacturer. The expression
values were RMAnormalized using the Affymetrix Expression Console software.
Immunofluorescent staining
Cells cultured attached on cover glass were fixed in 4% paraformaldehyde (PFA)
for 15 min at room temperature (RT) followed by antibody incubation at 4 C
overnight. The following primary antibodies were used: rabbit anti-glial fibrillary
Calcium Sensitivity in Glioma Stem Cells
PLOS ONE | DOI:10.1371/journal.pone.0115698 December 22, 2014 4 / 19

acidic protein (GFAP) (DAKO Cytomation) and mouse anti-beta III tubulin
(Tuj1) (Millipore). The cells were then incubated with fluorescence-labeled
secondary antibodies anti-rabbit Alexa Fluor 555 and Alexa Fluor 488
(Invitrogen) for 1 hr at RT. Nuclei were counterstained with DAPI and mounted
using Immumount (DAKO). Images of stained cells were acquired with an
Olympus FV1000 confocal microscope and processed with Adobe Photoshop
CS5.1 software.
Western blot analysis
Cells were lysed in RIPA buffer and protein concentration was quantified using
the Bicinchoninic Acid (BCA) Protein Assay Kit (SigmaAldrich; Pierce, Rockford,
US). Equal amounts of protein samples were separated by electrophoresis using
10% Mini-PROTEAN TGX gels (Bio-Rad) or 4–12% Bis-Tris polyacrylamide
gradient gel (NuPAGE, Invitrogen) under reducing conditions and transferred
onto a PVDF membrane (Bio-Rad) or nitrocellulose membrane (Hybond-ECL,
GE Healthcare, Sweden). Membranes were blocked in 5% milk for 1 hour and
incubated overnight at 4 C with the following primary antibodies: rabbit anti-
GRIA1 antibody (Abcam), rabbit anti-S100 alpha 6 antibody (Abcam), mouse
anti-BLBP antibody (Millipore) and mouse anti-beta actin antibody (Abcam).
The membranes were then incubated with the appropriate horseradish
peroxidase-labeled secondary antibody (SigmaAldrich; GE Healthcare) before
being revealed by chemiluminescence (Clarity Western ECL Substrate, Bio-Rad;
SuperSignal West Pico Chemiluminescent Substrate (Pierce, Rockford, US)). The
band intensities were quantified using ImageJ (NIH, USA).
Results
Transcriptome profiling identifies stemness-related Ca2+
gene
expression in GICs
To determine the relationship between human GIC lines and human fetal neural
stem cells (NSC), we re-analyzed the microarray data from a previous study by
Pollard et al [11]. While the first principal component segregated normal brain
from NSCs and GICs (see [11]), the second principal component ranked GICs in
relation to their similarity to NSCs, potentially reflecting aspects of stemness
(Fig. 1A). The stemness-associated gene SOX2, the NSC marker BLBP (brain
lipid-binding protein, encoded by the FABP7 gene) as well as the neuronal marker
TUBB3 (Tubulin beta III), which may reflect high potency for concomitant
neuronal differentiation, were expressed the highest in NSCs, and expression
levels decreased in the order of the GliNS1 group . G179NS . G166NS (Fig. 1B).
While the GliNS1 line was transcriptionally related to NSCs (NSC-proximal), the
G166NS line, constituted the distal end of the ranking relative to NSCs (NSC-
distal), expressing markers shared with microglia and reactive astrocytes and
Calcium Sensitivity in Glioma Stem Cells
PLOS ONE | DOI:10.1371/journal.pone.0115698 December 22, 2014 5 / 19

Calcium Sensitivity in Glioma Stem Cells
PLOS ONE | DOI:10.1371/journal.pone.0115698 December 22, 2014 6 / 19
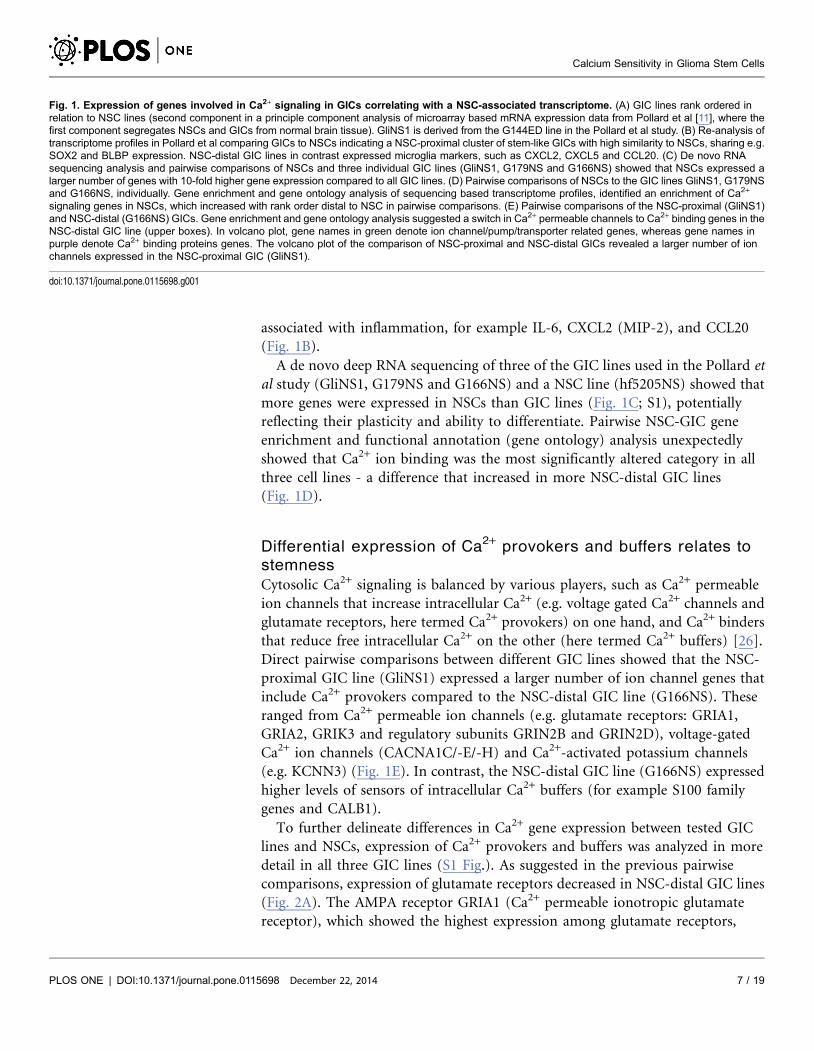
associated with inflammation, for example IL-6, CXCL2 (MIP-2), and CCL20
(Fig. 1B).
A de novo deep RNA sequencing of three of the GIC lines used in the Pollard et
al study (GliNS1, G179NS and G166NS) and a NSC line (hf5205NS) showed that
more genes were expressed in NSCs than GIC lines (Fig. 1C; S1), potentially
reflecting their plasticity and ability to differentiate. Pairwise NSC-GIC gene
enrichment and functional annotation (gene ontology) analysis unexpectedly
showed that Ca2+ ion binding was the most significantly altered category in all
three cell lines - a difference that increased in more NSC-distal GIC lines
(Fig. 1D).
Differential expression of Ca2+
provokers and buffers relates to
stemness
Cytosolic Ca2+ signaling is balanced by various players, such as Ca2+ permeable
ion channels that increase intracellular Ca2+ (e.g. voltage gated Ca2+ channels and
glutamate receptors, here termed Ca2+ provokers) on one hand, and Ca2+ binders
that reduce free intracellular Ca2+ on the other (here termed Ca2+ buffers) [26].
Direct pairwise comparisons between different GIC lines showed that the NSC-
proximal GIC line (GliNS1) expressed a larger number of ion channel genes that
include Ca2+ provokers compared to the NSC-distal GIC line (G166NS). These
ranged from Ca2+ permeable ion channels (e.g. glutamate receptors: GRIA1,
GRIA2, GRIK3 and regulatory subunits GRIN2B and GRIN2D), voltage-gated
Ca2+ ion channels (CACNA1C/-E/-H) and Ca2+-activated potassium channels
(e.g. KCNN3) (Fig. 1E). In contrast, the NSC-distal GIC line (G166NS) expressed
higher levels of sensors of intracellular Ca2+ buffers (for example S100 family
genes and CALB1).
To further delineate differences in Ca2+ gene expression between tested GIC
lines and NSCs, expression of Ca2+ provokers and buffers was analyzed in more
detail in all three GIC lines (S1 Fig.). As suggested in the previous pairwise
comparisons, expression of glutamate receptors decreased in NSC-distal GIC lines
(Fig. 2A). The AMPA receptor GRIA1 (Ca2+ permeable ionotropic glutamate
receptor), which showed the highest expression among glutamate receptors,
Fig. 1. Expression of genes involved in Ca2+ signaling in GICs correlating with a NSC-associated transcriptome. (A) GIC lines rank ordered inrelation to NSC lines (second component in a principle component analysis of microarray based mRNA expression data from Pollard et al [11], where thefirst component segregates NSCs and GICs from normal brain tissue). GliNS1 is derived from the G144ED line in the Pollard et al study. (B) Re-analysis oftranscriptome profiles in Pollard et al comparing GICs to NSCs indicating a NSC-proximal cluster of stem-like GICs with high similarity to NSCs, sharing e.g.SOX2 and BLBP expression. NSC-distal GIC lines in contrast expressed microglia markers, such as CXCL2, CXCL5 and CCL20. (C) De novo RNAsequencing analysis and pairwise comparisons of NSCs and three individual GIC lines (GliNS1, G179NS and G166NS) showed that NSCs expressed alarger number of genes with 10-fold higher gene expression compared to all GIC lines. (D) Pairwise comparisons of NSCs to the GIC lines GliNS1, G179NSand G166NS, individually. Gene enrichment and gene ontology analysis of sequencing based transcriptome profiles, identified an enrichment of Ca2+
signaling genes in NSCs, which increased with rank order distal to NSC in pairwise comparisons. (E) Pairwise comparisons of the NSC-proximal (GliNS1)and NSC-distal (G166NS) GICs. Gene enrichment and gene ontology analysis suggested a switch in Ca2+ permeable channels to Ca2+ binding genes in theNSC-distal GIC line (upper boxes). In volcano plot, gene names in green denote ion channel/pump/transporter related genes, whereas gene names inpurple denote Ca2+ binding proteins genes. The volcano plot of the comparison of NSC-proximal and NSC-distal GICs revealed a larger number of ionchannels expressed in the NSC-proximal GIC (GliNS1).
doi:10.1371/journal.pone.0115698.g001
Calcium Sensitivity in Glioma Stem Cells
PLOS ONE | DOI:10.1371/journal.pone.0115698 December 22, 2014 7 / 19

Fig. 2. Ca2+ provoker and buffer expression in NSC-proximal and NSC-distal GIC lines. Analysis of expression of Ca2+ provokers such as one of thepermeable glutamate receptor subunits GRIA1 (A) or Ca2+ buffer S100A6 (B), ranked the 3 GIC lines (GliNS1 and G166NS, n55 each. G179NS, n52.)according to Ca2+ drug sensitivity, with glutamate channels, such as GRIA1, predicting higher sensitivity and buffer expression predicting lower sensitivity(***p,0.001; Unpaired two-tailed t-test). (C) Western blot analysis showed GRIA1 and S100A6 protein expression, with b-actin as loading control. (D)Protein expression levels of GRIA1 were expressed as percentage fold change when compared against to GliNS1 (n53) and (E) S100A6 protein expressionlevels were expressed as percentage fold change when compared against G166NS (n53) (***p,0.001; **p,0.01, *p,0.05 One-way ANOVA).
doi:10.1371/journal.pone.0115698.g002
Calcium Sensitivity in Glioma Stem Cells
PLOS ONE | DOI:10.1371/journal.pone.0115698 December 22, 2014 8 / 19

ranked the GIC lines identically to the order GliNS1. G179NS. G166NS seen in
the PCA analysis (Fig. 1A) based on comparison with NSC gene expression. In
contrast, expression of Ca2+ buffers/effectors increased with an inverse rank order
of GliNS1 ,G179NS ,G166NS (Fig. 2B). This was particularly striking for the
S100A6 gene that was most abundantly expressed in G166NS. Similar to the
mRNA data, western blot analysis of GRIA1 revealed a 70% and more than 95%
lower expression in G179NS and G166NS respectively when compared to the
NSC-proximal GliNS1 line (Fig. 2B and 2E). The western blot analysis of S100A6
showed a 45% and 90% lower expression in G179NS and GliNS1, respectively,
when compared to the NSC-distal G166NS line (Fig. 2C, 2D and 2E).
GIC Ca2+
drug sensitivity correlates with transcriptome proximity
to NSCs
In addition Ca2+ provokers and buffers, plasma membrane localized Ca2+
transporters, such as sodium-calcium exchangers (NCX) belonging to the SLC8
family and the SERCA (sarco/endoplasmic reticulum Ca2+ ATPase) pump
localized in the endoplasmic reticulum (ER) membrane, actively remove cytosolic
Ca2+ to maintain homeostasis [27–30]. To explore potential functional
implications of a differential expression of Ca2+ ion channels and Ca2+ binding
genes, we next performed a drug-mediated challenge of Ca2+ homeostasis and
signaling, in the GIC lines. Cells were exposed to either to the target independent
cation (Ca2+) ionophore A23187 or the SERCA pump inhibitor Thapsigargin
(Fig. 3), which increase cytosolic Ca2+ levels by two different mechanisms: A23187
by allowing Ca2+ to cross the normally impermeable cell membrane, and
Thapsigargin by blocking import of Ca2+ into the ER. The GIC lines showed
differences in sensitivity for both A23187 and Thapsigargin (Fig. 3A and 3B,
respectively), remarkably with a rank order between the lines identical to that of
the NSC-rooted transcriptome rank order, with the NSC-proximal GliNS1 being
more sensitive than G179NS, while the NSC-distal G166NS was least sensitive to
both drugs. Functional analyses thus show that NSC-proximal GICs with a higher
expression of Ca2+ provokers, are more sensitive to disturbances in cytosolic Ca2+
regulation than GICs with a NSC-distal phenotype that express higher levels of
Ca2+ buffers.
Reduced Ca2+
drug sensitivity upon GIC differentiation
As sensitivity to Ca2+ drugs was associated with a NSC-like expression profile the
question whether differentiation of GICs would affect Ca2+ sensitivity was
investigated. To this end, three GIC lines were subjected to a differentiation
protocol using fetal bovine serum (FBS). Validation of differentiation was done by
transcriptome analysis of the GIC lines and their differentiated progeny using
RNA sequencing (S1 Table). Principal component analysis of the global data set
showed that changes in the transcriptome were distinct and segregated
significantly between undifferentiated GICs and differentiated GICs (diffGICs)
Calcium Sensitivity in Glioma Stem Cells
PLOS ONE | DOI:10.1371/journal.pone.0115698 December 22, 2014 9 / 19

(Fig. 4A). Interestingly, GRIA1 expression that correlated with Ca2+ drug
sensitivity, decreased in all GIC lines during differentiation (Fig. 4B), which
suggested that differentiation status might affect Ca2+ sensitivity. Functional Ca2+
sensitivity was therefore assayed using A23187 (10 uM, 48 hours) in differentiated
GICs and compared to undifferentiated GICs revealing a clearly reduced effect on
cell viability in all GIC lines upon differentiation and with the strongest effect in
the drug sensitive NSC-proximal GIC line (GliNS1)(Fig. 4C). These findings
further support the data that Ca2+ sensitivity is associated with immature NSC-
like GICs.
Fig. 3. Sensitivity to drugs targeting Ca2+ homeostasis follows GIC transcriptome rank order relative to NSCs. (A) Dose response analysis (0.01–40 mM) of the Ca2+ ionophore A23187 and (B) the SERCA Ca2+ pump inhibitor Thapsigargin showed that Ca2+ drug sensitivity rank ordered withtranscriptome similarity to NSCs, with highest sensitivity in the NSC-proximal GICs. NSC proximal GIC was more sensitive to (C) 40 mM A23187 and (D)0.156 mM Thapsigargin treatments as compared to the NSC distal lines (*p,0.05; Unpaired two-tailed t-test). NSC-proximal GICs n53 and NSC-distal GICsn54.
doi:10.1371/journal.pone.0115698.g003
Calcium Sensitivity in Glioma Stem Cells
PLOS ONE | DOI:10.1371/journal.pone.0115698 December 22, 2014 10 / 19

Gene expression correlating with Ca2+
drug sensitivity
To explore potential additional genes correlating with Ca2+ sensitivity,
transcriptome data from nine novel GIC lines (derived in an independent
laboratory) was compared to Ca2+ sensitivity data from exposure to Thapsigargin
(72 h exposure)(Fig. 5A and S2 Table). 7 out of the 9 lines have been shown to
recapitulate the parent tumor (S3 Table). Analysis of correlation (Pearson)
between NSC-markers and sensitivity to Thapsigargin (1 uM) revealed a
significant correlation for nestin (NES) (Fig. 5B, outlier marked in red was
excluded from the analysis) and brain lipid-bindig protein (BLBP/FABP7)
Fig. 4. Decreased sensitivity to A23187 during GIC differentiation correlating with decrease in GRIA1 expression. (A) RNA sequencingtranscriptome mapping followed by principal component analysis verified segregation between undifferentiated and differentiated GICs (GliNS1, G179NSand G166NS). Right panel shows immunofluorescent stainings of the differentiation markers GFAP (red) and Tuj1 (green) upon FBS treatment. (B)Comparison of GRIA1 expression levels in undifferentiated and differentiated GICs (n56) revealed a reduction in fold change in GRIA1 expression uponserum-induced differentiation in all GIC lines. (***p,0.001; Unpaired two-tailed t-test). (C) Cell viability analysis of relative sensitivity to the Ca2+ ionophoreA23187 after differentiation showed increased viability upon differentiation of the NSC-proximal GIC line GliNS1 (*p,0.05; Unpaired two-tailed t-test).
doi:10.1371/journal.pone.0115698.g004
Calcium Sensitivity in Glioma Stem Cells
PLOS ONE | DOI:10.1371/journal.pone.0115698 December 22, 2014 11 / 19

Calcium Sensitivity in Glioma Stem Cells
PLOS ONE | DOI:10.1371/journal.pone.0115698 December 22, 2014 12 / 19

(Fig. 5C) mRNA expression, while no correlation was found for SOX2 (data not
shown). Western blot analysis further verified that calcium drug sensitive lines
(U3017-MG and U3084-MG) expressed more BLBP protein than less sensitive
lines (U3013-MG and U3035-MG) (Fig. 5D). The correlation analysis also
confirmed a correlation between sensitivity to Thapsigargin and GRIA1
expression (Fig. 5E), which was corroborated by analysis of protein levels by
western blot, as GRIA1 protein expression was only detected in the sensitive GICs
(Fig. 5F). Further gene enrichment and gene ontology analyses implied genes
involved in cell cycle regulation, oxygen, RNA and macromolecule metabolism,
and not unexpectedly Ca2+-mediated signaling as correlating with Ca2+ drug
sensitivity (Fig. 6A).
To identify genes in this data set that also associated with a NSC-proximal
stemness signature in GICs, the set was further filtered for genes, which also (1)
had a higher expression in GliNS1 compared to G166NS and (2) were
downregulated upon differentiation (Fig. 6B). This retrieved a short-list of nine
genes, two of which code for ion channels that may increase cytosolic Ca2+ (Ca2+
provokers), i.e. GRIA1 and the inward rectifier K+ channel KCNJ4, which may
participate in maintaining a depolarized membrane potential required to activate
voltage-gated Ca2+ channels and Ca2+ permeable glutamate receptors. In
summary, the correlation between functional Ca2+ drug sensitivity and gene
expression suggests participation towards sensitivity to drug-elicited Ca2+
overload, by a network of genes involved in maintaining Ca2+ homeostasis and
membrane potential.
Drug reactome analysis identifies Ca2+-induced gene expression
in the global transcriptome
To identify intracellular responses to Ca2+ underlying the differential level of Ca2+
sensitivity in GICs, the NSC-proximal GliNS1 and NSC-distal G166NS were
exposed to A23187 for 7 hours, followed by transcriptome analysis by RNA
sequencing (‘‘drug reactome mapping’’)(S4 Table). In the most Ca2+ drug
sensitive GIC line GliNS1, genes with significantly altered expression (Benjamini
adjusted p-value ,0.05) were analyzed by gene enrichment and gene ontology,
which showed that cell cycle related genes were altered (Fig. 7B and S2 Fig.),
suggesting cell cycle arrest prior to cell death. Not unexpectedly, genes involved in
ER stress response were also enriched, as were genes in RNA metabolic processes.
Fig. 5. Genome wide correlation analysis between Ca2+ drug sensitivity and gene expression. (A) Nine novel GIC lines were subjected toThapsigargin dose response analysis (0.1–100 mM), showing different response to moderate drug doses. (B, C) Plot of correlation between cell viability afterCa2+ drug exposure (Thapsigargin, 1 uM) and (B) NES and (C) FABP7/BLBP mRNA expression. U3047-MG was considered an outlier in the NES graph(marked in red) and excluded form the analysis. (D) Western blot analysis showing BLBP (FABP7) protein expression in selected Thapsigargin sensitive(U3017-MG and U3084-MG) and less sensitive (U3013-MG and U3035-MG) cell lines, with b-actin as loading control. (E) Plot of correlation between cellviability after Ca2+ drug exposure (Thapsigargin, 1 uM) and GRIA1 mRNA expression. (F) Western blot analysis showing GRIA1 protein expression inselected Thapsigargin sensitive (U3017-MG and U3084-MG) and less sensitive (U3013-MG and U3035-MG) cell lines. b-actin was used as loading control.
doi:10.1371/journal.pone.0115698.g005
Calcium Sensitivity in Glioma Stem Cells
PLOS ONE | DOI:10.1371/journal.pone.0115698 December 22, 2014 13 / 19

Fig. 6. Gene expression correlating with high Ca2+ sensitivity in 9 GIC lines. (A) A correlation analysis of genome wide mRNA expression (microarrayanalysis) and sensitivity to Thapsigargin (1 uM) in 9 additional GIC lines, retrieved 785 genes correlating with Ca2+ drug sensitivity. Gene enrichment andontology analyses identified involvement of genes affecting proliferation, oxygen and RNA metabolism, catabolism and Ca2+-mediated signaling. (B) 385genes positively correlating with high sensitivity were filtered first for genes also expressed higher in the NSC-proximal GIC line GliNS1 and thereafter alsobeing downregulated in this line upon differentiation, which was found to reduce Ca2+ drug sensitivity, retrieving a set of nine genes, including the AMPAreceptor coding GRIA1.
doi:10.1371/journal.pone.0115698.g006
Calcium Sensitivity in Glioma Stem Cells
PLOS ONE | DOI:10.1371/journal.pone.0115698 December 22, 2014 14 / 19

Calcium Sensitivity in Glioma Stem Cells
PLOS ONE | DOI:10.1371/journal.pone.0115698 December 22, 2014 15 / 19

Interestingly, RNA metabolic process involved genes were also correlating with
Thapsigargin sensitivity in the previous experiment (Fig. 6A).
Genes with altered expression after drug exposure were plotted against mean
expression value (before drug exposure) to identify robustly altered genes with a
potential biological significance. Strikingly, the GliNS1 line induced a clearly
higher global transcriptome fold change than the less sensitive G166NS (Fig. 7A
and 7C) suggesting a more potent onset of Ca2+ signaling in sensitive GICs. This
may be the consequence by an inability to effectively reduce cytosolic Ca2+ levels.
Interestingly, a very similar set of genes were altered in both the NSC-proximal
(GliNS1) and the NSC-distal (G166NS) GIC lines, including Ca2+-binding genes
acting as buffers (e.g. HSPA5 and HSP90B1) and Ca2+ related ER stress response
(e.g. HERPUD1 and CALR). Also Ca2+-activated transcription factors (e.g
NFATC2) were induced in both lines (Fig. 7A and 7C), suggesting that increased
cytosolic Ca2+ could trigger a positive feedback mechanism. Interestingly, the
G166NS line uniquely upregulated a set of anti-apoptotic genes, such as TP53
(coding for p53) and BCL2 genes (Fig. 7D), providing an explanation for lower
sensitivity to e.g. Thapsigargin in addition to lower expression of Ca2+ permeable
ion channels and higher expression of Ca2+ buffers.
Discussion
Our study identified a stemness-associated sensitivity in GICs related to Ca2+
homeostasis and signaling. This finding was functionally validated by increasing
cytosolic Ca2+ using the ionophore A23187, which causes uncontrolled uptake of
Ca2+ over the plasma membrane, and Thapsigargin, which causes elevated
cytosolic Ca2+ via depletion of Ca2+ stored in ER. GICs with a NSC-like
transcriptome profile were more sensitive to disrupted Ca2+ homeostasis and
undifferentiated GICs were more sensitive than differentiated GICs. The degree of
similarity in the transcriptome profile of individual GIC lines and NSCs correlated
with Ca2+ sensitivity. In contrast, NSC-distal GICs, expressing markers of reactive
astrocytes and microglia, expressed higher levels of Ca2+ buffers and were
comparatively less sensitive to Ca2+ drugs. Ca2+ signaling is well known to be
critical for normal somatic cells and embryonic [31] and adult stem cells [32] as
well as cancer cells, controlling diverse functions, such as proliferation, migration
and apoptosis [26, 33]. However, the elevated sensitivity to Ca2+ that we identified
appears to correlate uniquely to stemness (e.g. expression of nestin and BLBP),
suggesting that certain functions in NSC-like immature cancer cells, are affected
Fig. 7. Transcriptome analysis of drug response in GliNS1 and G166NS. Transcriptional response to increased cytosolic Ca2+ (A23187), wasinvestigated by RNA sequencing after 7 hours of drug exposure in the NSC-proximal GIC line GliiNS1 and the NSC-distal line G166NS. Volcano plots ofsignificantly (p,0.05) altered gene expression in GliNS1 (A) and G166NS (C) with shared induced genes marked in red and green (Ca2+ activatedtranscription factor NFATC2). Note the differences in x-axis indicating higher all global induction of gene expression in GliNS1. (B) Gene enrichment andgene ontology analysis of genes with a significant change in expression (p,0.05) in GliNS1, identified genes involved in cell cycle progression as well asER/golgi associated functions and cellular stress response. (D) Gene enrichment analysis of genes downregulated at least 3-fold in GliNS1 and upregulatedat least 1.5-fold in G166NS.
doi:10.1371/journal.pone.0115698.g007
Calcium Sensitivity in Glioma Stem Cells
PLOS ONE | DOI:10.1371/journal.pone.0115698 December 22, 2014 16 / 19

differently by perturbing Ca2+ homeostasis than are more differentiated mature
cells.
An important component in the observed Ca2+-sensitivity appeared to be
capacity to reduce cytosolic Ca2+, either via lower expression of Ca2+ channels or
via expression of Ca2+ buffers, such as S100 proteins. In this context the AMPA
receptor subunit GRIA1 appeared as an interesting marker predicting sensitivity
and potentially involved mechanistically in increasing sensitivity by allowing Ca2+
influx in response to glutamate. GRIA1 is a marker of GICs, as previously
published [34], and we validate this finding by showing that GRIA1 is
downregulated upon differentiation. This suggests that a network of genes
involved in maintaining Ca2+ homeostasis and membrane potential in immature
cells, may contribute to the observed differential sensitivity to Ca2+ overload.
Interestingly, Ca2+ drug reactome analysis identified upregulated expression of
a set of Ca2+ binding proteins and Ca2+-activated transcription factors, suggesting
a positive feedback loop of Ca2+-responsive transcription that may be expected to
further increase a Ca2+ transcriptional response. This is somewhat surprising,
unless Ca2+ transcriptional response also includes functions to reduce or abort an
intracellular calcium surge. A comparison between GliNS1 and the slightly less
Ca2+ sensitive GIC line G166NS was made to potentially identify genes that may
correlate with Ca2+ overload and hence may protect the cells. The drug reactome
profile unique for G166NS identified genes protecting from apoptosis, thus
contributing to the relative lower sensitivity to Ca2+ overload and giving an
alternative explanation than interplay between Ca2+ provokers and buffers.
We recently reported a novel target in GICs critical for cell volume homeostasis
[14]. However reports of GIC selective drug target are scarce and large scale
chemical screens of GICs did not identify compounds that potently and selectively
affected viability in GICs [11]. Stemness-associated Ca2+ sensitivity may be a novel
such target with ability to eradicate a potentially malignant subpopulation in
brain tumors. In this context, nestin, BLBP and GRIA1 are potential biomarkers
predicting sensitivity to this drug in brain tumor cells.
Supporting Information
S1 Fig. Analysis of expression of Ca2+ provokers such as permeable glutamate
receptor subunits (A) or Ca2+ buffers (B) in GliNS1, G179NS and G166NS.
doi:10.1371/journal.pone.0115698.s001 (TIF)
S2 Fig. Overview of genes involved in cell cycle progression with direction of
altered expression indicated in red (upregulation) or green (downregulation).
doi:10.1371/journal.pone.0115698.s002 (TIF)
S1 Table. Illumina mRNA sequencing data in simple reads of undifferentiated
and differentiated GICs.
doi:10.1371/journal.pone.0115698.s003 (XLSX)
Calcium Sensitivity in Glioma Stem Cells
PLOS ONE | DOI:10.1371/journal.pone.0115698 December 22, 2014 17 / 19

S2 Table. Top hits of pearson correlation analysis of genes and sensitivity to
Thapsigargin in novel GIC cell lines.
doi:10.1371/journal.pone.0115698.s004 (XLSX)
S3 Table. A list of the novel GIC cell lines, their tumor initiating property and
the median survival in mice (n55–10 mice per line).
doi:10.1371/journal.pone.0115698.s005 (XLSX)
S4 Table. Differential gene expression analysis of vehicle control vs A23187
treated GliNS1 and vehicle control vs A23187 treated G166NS.
doi:10.1371/journal.pone.0115698.s006 (XLSX)
Acknowledgments
We are grateful to the team behind the Uppsala Human Glioma Cell Culture
biobank. We also want to thank Clara Willis and Malin Nordmark for help with
illustrations.
Author ContributionsConceived and designed the experiments: SW MN MA. Performed the
experiments: SW MN AH LS SL. Analyzed the data: SW MN VM SL. Contributed
reagents/materials/analysis tools: AS PD KF-N BW LU SN. Wrote the paper: SW
MN AS MA.
References
1. Choucair AK, Levin VA, Gutin PH, Davis RL, Silver P, et al. (1986) Development of multiple lesionsduring radiation therapy and chemotherapy in patients with gliomas. J Neurosurg 65: 654–658.
2. Wen PY, Kesari S (2008) Malignant gliomas in adults. N Engl J Med 359: 492–507.
3. Galli R, Binda E, Orfanelli U, Cipelletti B, Gritti A, et al. (2004) Isolation and characterization oftumorigenic, stem-like neural precursors from human glioblastoma. Cancer Res 64: 7011–7021.
4. Hemmati HD, Nakano I, Lazareff JA, Masterman-Smith M, Geschwind DH, et al. (2003) Cancerousstem cells can arise from pediatric brain tumors. Proc Natl Acad Sci U S A 100: 15178–15183.
5. Ignatova TN, Kukekov VG, Laywell ED, Suslov ON, Vrionis FD, et al. (2002) Human cortical glialtumors contain neural stem-like cells expressing astroglial and neuronal markers in vitro. Glia 39: 193–206.
6. Singh SK, Clarke ID, Terasaki M, Bonn VE, Hawkins C, et al. (2003) Identification of a cancer stemcell in human brain tumors. Cancer Res 63: 5821–5828.
7. Chen J, Li Y, Yu TS, McKay RM, Burns DK, et al. (2012) A restricted cell population propagatesglioblastoma growth after chemotherapy. Nature 488: 522–526.
8. Piccirillo SG, Reynolds BA, Zanetti N, Lamorte G, Binda E, et al. (2006) Bone morphogeneticproteins inhibit the tumorigenic potential of human brain tumour-initiating cells. Nature 444: 761–765.
9. Ben-Porath I, Thomson MW, Carey VJ, Ge R, Bell GW, et al. (2008) An embryonic stem cell-like geneexpression signature in poorly differentiated aggressive human tumors. Nat Genet 40: 499–507.
10. Holmberg J, He X, Peredo I, Orrego A, Hesselager G, et al. (2011) Activation of neural and pluripotentstem cell signatures correlates with increased malignancy in human glioma. PLoS One 6: e18454.
Calcium Sensitivity in Glioma Stem Cells
PLOS ONE | DOI:10.1371/journal.pone.0115698 December 22, 2014 18 / 19

11. Pollard SM, Yoshikawa K, Clarke ID, Danovi D, Stricker S, et al. (2009) Glioma stem cell linesexpanded in adherent culture have tumor-specific phenotypes and are suitable for chemical and geneticscreens. Cell Stem Cell 4: 568–580.
12. Park DM, Rich JN (2009) Biology of glioma cancer stem cells. Mol Cells 28: 7–12.
13. Huang Z, Cheng L, Guryanova OA, Wu Q, Bao S (2010) Cancer stem cells in glioblastoma–molecularsignaling and therapeutic targeting. Protein Cell 1: 638–655.
14. Kitambi SS, Toledo EM, Usoskin D, Wee S, Harisankar A, et al. (2014) Vulnerability of glioblastomacells to catastrophic vacuolization and death induced by a small molecule. Cell 157: 313–328.
15. Sachlos E, Risueno RM, Laronde S, Shapovalova Z, Lee JH, et al. (2012) Identification of drugsincluding a dopamine receptor antagonist that selectively target cancer stem cells. Cell 149: 1284–1297.
16. Haas BR, Sontheimer H (2010) Inhibition of the Sodium-Potassium-Chloride Cotransporter Isoform-1reduces glioma invasion. Cancer Res 70: 5597–5606.
17. Prevarskaya N, Skryma R, Shuba Y (2010) Ion channels and the hallmarks of cancer. Trends Mol Med16: 107–121.
18. Monteith GR, Davis FM, Roberts-Thomson SJ (2012) Calcium channels and pumps in cancer:changes and consequences. J Biol Chem 287: 31666–31673.
19. Zhao W, Wang L, Han H, Jin K, Lin N, et al. (2013) 1B50-1, a mAb raised against recurrent tumor cells,targets liver tumor-initiating cells by binding to the calcium channel alpha2delta1 subunit. Cancer Cell 23:541–556.
20. Nociari MM, Shalev A, Benias P, Russo C (1998) A novel one-step, highly sensitive fluorometric assayto evaluate cell-mediated cytotoxicity. J Immunol Methods 213: 157–167.
21. Islam S, Kjallquist U, Moliner A, Zajac P, Fan JB, et al. (2011) Characterization of the single-celltranscriptional landscape by highly multiplex RNA-seq. Genome Res 21: 1160–1167.
22. Langmead B, Trapnell C, Pop M, Salzberg SL (2009) Ultrafast and memory-efficient alignment of shortDNA sequences to the human genome. Genome Biol 10: R25.
23. Mortazavi A, Williams BA, McCue K, Schaeffer L, Wold B (2008) Mapping and quantifyingmammalian transcriptomes by RNA-Seq. Nat Methods 5: 621–628.
24. Anders S, Huber W (2010) Differential expression analysis for sequence count data. Genome Biol 11:R106.
25. Ramskold D, Kavak E, Sandberg R (2012) How to analyze gene expression using RNA-sequencingdata. Methods Mol Biol 802: 259–274.
26. Berridge MJ, Bootman MD, Roderick HL (2003) Calcium signalling: dynamics, homeostasis andremodelling. Nat Rev Mol Cell Biol 4: 517–529.
27. Khananshvili D (2013) The SLC8 gene family of sodium-calcium exchangers (NCX) - structure,function, and regulation in health and disease. Mol Aspects Med 34: 220–235.
28. Sammels E, Parys JB, Missiaen L, De Smedt H, Bultynck G (2010) Intracellular Ca2+ storage inhealth and disease: a dynamic equilibrium. Cell Calcium 47: 297–314.
29. Blaustein MP, Lederer WJ (1999) Sodium/calcium exchange: its physiological implications. Physiol Rev79: 763–854.
30. Mogami H, Tepikin AV, Petersen OH (1998) Termination of cytosolic Ca2+ signals: Ca2+ reuptake intointracellular stores is regulated by the free Ca2+ concentration in the store lumen. Embo Journal 17:435–442.
31. Kapur N, Mignery GA, Banach K (2007) Cell cycle-dependent calcium oscillations in mouse embryonicstem cells. Am J Physiol Cell Physiol 292: C1510–1518.
32. Resende RR, Adhikari A, da Costa JL, Lorencon E, Ladeira MS, et al. (2010) Influence ofspontaneous calcium events on cell-cycle progression in embryonal carcinoma and adult stem cells.Biochim Biophys Acta 1803: 246–260.
33. Clapham DE (2007) Calcium signaling. Cell 131: 1047–1058.
34. Oh MC, Kim JM, Safaee M, Kaur G, Sun MZ, et al. (2012) Overexpression of calcium-permeableglutamate receptors in glioblastoma derived brain tumor initiating cells. PLoS One 7: e47846.
Calcium Sensitivity in Glioma Stem Cells
PLOS ONE | DOI:10.1371/journal.pone.0115698 December 22, 2014 19 / 19