Evolution of Cardiac Calcium Waves from Stochastic Calcium Sparks
18
Evolution of Cardiac Calcium Waves from Stochastic Calcium Sparks Leighton T. Izu,* W. Gil Wier, and C. William Balke* Departments of *Medicine and Physiology, University of Maryland School of Medicine, Baltimore, Maryland 21201 USA ABSTRACT We present a model that provides a unified framework for studying Ca 21 sparks and Ca 21 waves in cardiac cells. The model is novel in combining 1) use of large currents (;20 pA) through the Ca 21 release units (CRUs) of the sarcoplasmic reticulum (SR); 2) stochastic Ca 21 release (or firing) of CRUs; 3) discrete, asymmetric distribution of CRUs along the longitudinal (separation distance of 2 mm) and transverse (separated by 0.4 – 0.8 mm) directions of the cell; and 4) anisotropic diffusion of Ca 21 and fluorescent indicator to study the evolution of Ca 21 waves from Ca 21 sparks. The model mimics the important features of Ca 21 sparks and Ca 21 waves in terms of the spontaneous spark rate, the Ca 21 wave velocity, and the pattern of wave propagation. Importantly, these features are reproduced when using experimentally measured values for the CRU Ca 21 sensitivity (;15 mM). Stochastic control of CRU firing is important because it imposes constraints on the Ca 21 sensitivity of the CRU. Even with moderate (;5 mM) Ca 21 sensitivity the very high spontaneous spark rate triggers numerous Ca 21 waves. In contrast, a single Ca 21 wave with arbitrarily large velocity can exist in a deterministic model when the CRU Ca 21 sensitivity is sufficiently high. The combination of low CRU Ca 21 sensitivity (;15 mM), high cytosolic Ca 21 buffering capacity, and the spatial separation of CRUs help control the inherent instability of SR Ca 21 release. This allows Ca 21 waves to form and propagate given a sufficiently large initiation region, but prevents a single spark or a small group of sparks from triggering a wave. GLOSSARY Most symbols were defined in the companion paper (Izu et al., 2001). Here we list new symbols and those that occur frequently in this paper. x, y spatial coordinates (mm) t time coordinate (ms) C free Ca 21 concentration (mM) D Cx , D Cy Ca 21 diffusion coefficients along x and y (mm 2 /ms) S stochastic switching function equaling either 0 or 1 P max maximum probability of Ca 21 spark occurrence/calcium release unit/ms P probability of Ca 21 spark occurrence/calcium release unit/ms n Hill coefficient in definition of P K Ca 21 sensitivity parameter in definition of P (mM) , x , , y spatial separation of Ca 21 release units (CRUs) along x and y (mm) s molar flux of CRU for 2- dimensional diffusion domains (pmol/ms/mm) I SR current through the CRU (pA) T open duration of current flow through CRU (ms) C 0 baseline Ca 21 concentration (mM) w waiting time distribution p(t , t) probability of a CRU not firing in time t , t P(X $ 1, t , t) probability of at least one CRU firing in time t , t INTRODUCTION Slowly (;100 mm/s) propagating waves of elevated Ca 21 concentration (Ca 21 waves) appear to be a ubiquitous find- ing and have been observed in a wide diversity of cell types including skeletal (Endo, et al., 1970) and cardiac muscle (Fabiato and Fabiato, 1972), medaka eggs (Ridgway, et al., 1977), and astrocytes (Cornell-Bell and Finkbeiner, 1991). In cardiac atrial cells that lack transverse tubules (T tu- bules), physiological activation of the myofibrils in the interior of the cell depends on the propagation of a Ca 21 wave from the sarcolemma to the cell’s center (Berlin, 1995; Hu ¨ser et al., 1996). In cardiac ventricle cells, Ca 21 waves are not physiological and are believed to be a patho- logical manifestation of Ca 21 overload and might trigger ventricular arrhythmias (Lakatta and Guarnieri, 1993). Ca 21 waves are a natural consequence of regenerative Ca 21 release by the sarcoplasmic reticulum or Ca 21 -in- duced Ca 21 -release (CICR) (Endo, et al., 1970; Ford and Podolsky, 1970). All models of Ca 21 waves in skeletal and cardiac muscle have CICR at their core and the evolution of Ca 21 wave models reflects the growth of knowledge of excitation– contraction coupling in muscle. For example, an early mathematical model of Ca 21 waves (Backx et al., 1989) distributed Ca 21 release sites uniformly throughout the cytoplasm. However, in normal muscle cells, Ca 21 release sites are distributed in discrete bands at the z-lines (Carl, 1995). With the discovery of Ca 21 sparks (Cheng et al., 1993) the discrete nature of Ca 21 release was resolved to the opening of a few ryanodine receptors (RyRs) on the z-line in cardiac muscle (Shacklock et al., 1995). In addi- Received for publication 24 May 2000 and in final form 16 October 2000. Address reprint requests to Leighton T. Izu, University of Maryland School of Medicine, Department of Medicine Division of Cardiology, 22 South Green St., Baltimore, MD 21201-1595. Tel.: 410-706-2675; Fax: 410-706- 8610; E-mail: [email protected]. © 2001 by the Biophysical Society 0006-3495/01/01/103/18 $2.00 103 Biophysical Journal Volume 80 January 2001 103–120
-
Upload
independent -
Category
Documents
-
view
1 -
download
0
Transcript of Evolution of Cardiac Calcium Waves from Stochastic Calcium Sparks

Evolution of Cardiac Calcium Waves from Stochastic Calcium Sparks
Leighton T. Izu,* W. Gil Wier,† and C. William Balke*†
Departments of *Medicine and †Physiology, University of Maryland School of Medicine, Baltimore, Maryland 21201 USA
ABSTRACT We present a model that provides a unified framework for studying Ca21 sparks and Ca21 waves in cardiaccells. The model is novel in combining 1) use of large currents (;20 pA) through the Ca21 release units (CRUs) of thesarcoplasmic reticulum (SR); 2) stochastic Ca21 release (or firing) of CRUs; 3) discrete, asymmetric distribution of CRUs alongthe longitudinal (separation distance of 2 mm) and transverse (separated by 0.4–0.8 mm) directions of the cell; and 4)anisotropic diffusion of Ca21 and fluorescent indicator to study the evolution of Ca21 waves from Ca21 sparks. The modelmimics the important features of Ca21 sparks and Ca21 waves in terms of the spontaneous spark rate, the Ca21 wavevelocity, and the pattern of wave propagation. Importantly, these features are reproduced when using experimentallymeasured values for the CRU Ca21 sensitivity (;15 mM). Stochastic control of CRU firing is important because it imposesconstraints on the Ca21 sensitivity of the CRU. Even with moderate (;5 mM) Ca21 sensitivity the very high spontaneous sparkrate triggers numerous Ca21 waves. In contrast, a single Ca21 wave with arbitrarily large velocity can exist in a deterministicmodel when the CRU Ca21 sensitivity is sufficiently high. The combination of low CRU Ca21 sensitivity (;15 mM), highcytosolic Ca21 buffering capacity, and the spatial separation of CRUs help control the inherent instability of SR Ca21 release.This allows Ca21 waves to form and propagate given a sufficiently large initiation region, but prevents a single spark or a smallgroup of sparks from triggering a wave.
GLOSSARY
Most symbols were defined in the companion paper (Izu etal., 2001). Here we list new symbols and those that occurfrequently in this paper.
x, y spatial coordinates (mm)t time coordinate (ms)
C free Ca21 concentration (mM)DCx, DCy Ca21 diffusion coefficients alongx
andy (mm2/ms)S stochastic switching function
equaling either 0 or 1Pmax maximum probability of Ca21 spark
occurrence/calcium release unit/msP probability of Ca21 spark
occurrence/calcium release unit/msn Hill coefficient in definition of PK Ca21 sensitivity parameter in
definition of P (mM),x, ,y spatial separation of Ca21 release
units (CRUs) alongx andy (mm)s molar flux of CRU for 2-
dimensional diffusion domains(pmol/ms/mm)
ISR current through the CRU (pA)Topen duration of current flow through
CRU (ms)C0 baseline Ca21 concentration (mM)w waiting time distribution
p(t , t) probability of a CRU not firing intime t , t
P(X $ 1, t , t) probability of at least one CRUfiring in time t , t
INTRODUCTION
Slowly (;100 mm/s) propagating waves of elevated Ca21
concentration (Ca21 waves) appear to be a ubiquitous find-ing and have been observed in a wide diversity of cell typesincluding skeletal (Endo, et al., 1970) and cardiac muscle(Fabiato and Fabiato, 1972), medaka eggs (Ridgway, et al.,1977), and astrocytes (Cornell-Bell and Finkbeiner, 1991).In cardiac atrial cells that lack transverse tubules (T tu-bules), physiological activation of the myofibrils in theinterior of the cell depends on the propagation of a Ca21
wave from the sarcolemma to the cell’s center (Berlin,1995; Huser et al., 1996). In cardiac ventricle cells, Ca21
waves are not physiological and are believed to be a patho-logical manifestation of Ca21 overload and might triggerventricular arrhythmias (Lakatta and Guarnieri, 1993).
Ca21 waves are a natural consequence of regenerativeCa21 release by the sarcoplasmic reticulum or Ca21-in-duced Ca21-release (CICR) (Endo, et al., 1970; Ford andPodolsky, 1970). All models of Ca21 waves in skeletal andcardiac muscle have CICR at their core and the evolution ofCa21 wave models reflects the growth of knowledge ofexcitation–contraction coupling in muscle. For example, anearly mathematical model of Ca21 waves (Backx et al.,1989) distributed Ca21 release sites uniformly throughoutthe cytoplasm. However, in normal muscle cells, Ca21
release sites are distributed in discrete bands at thez-lines(Carl, 1995). With the discovery of Ca21 sparks (Cheng etal., 1993) the discrete nature of Ca21 release was resolvedto the opening of a few ryanodine receptors (RyRs) on thez-line in cardiac muscle (Shacklock et al., 1995). In addi-
Received for publication 24 May 2000 and in final form 16 October 2000.
Address reprint requests to Leighton T. Izu, University of Maryland Schoolof Medicine, Department of Medicine Division of Cardiology, 22 SouthGreen St., Baltimore, MD 21201-1595. Tel.: 410-706-2675; Fax: 410-706-8610; E-mail: [email protected].
© 2001 by the Biophysical Society
0006-3495/01/01/103/18 $2.00
103Biophysical Journal Volume 80 January 2001 103–120

tion, Cheng et al. (1993, 1996), speculated that Ca21 wavesarise from the collective firing of Ca21 sparks.
Contemporary models of Ca21 sparks and Ca21 wavesrestrict Ca21 release to thez-lines (Keizer et al., 1998;Keizer and Smith, 1998; Izu et al., 1999; Lukyanenko et al.,1999). However, understanding the relationship betweenCa21 sparks and Ca21 waves in living cells has been com-plicated by asymmetries in cell structure, asymmetries in theCa21 spark profile, anisotropic diffusion of the Ca21-boundfluo-3, uncertainties regarding the Ca21 sensitivity of theCa21 release units (CRU), and the Ca21 currents required togenerate Ca21 sparks.
In this paper, we present a model that provides a unifiedframework for studying both Ca21 sparks and Ca21 waves.The following are key elements in this model.
1. Large CRU currents. By using relatively large CRUcurrents (5–20 pA; Izu et al., 2001) the model generatesrealistic Ca21 sparks and realistic Ca21 waves whilemaintaining CRU Ca21-sensitivities compatible with ex-perimental measurements (Lukyanenko and Gyo¨rke,1999).
2. Stochastic triggering of Ca21 release. Previous modelsof Ca21 waves (except Keizer and Smith, 1998) haveused a deterministic rule for triggering Ca21 release;release occurred when the Ca21 concentration exceededsome fixed valueC*. The use of stochastic instead ofdeterministic dynamics is important for two reasons.First, sparks occur spontaneously and randomly (Chenget al., 1993) so a unified framework for studying sparksand waves must provide for the stochastic firing of theCRUs. Second, deterministic and stochastic systems canbehave very differently when the Ca21 sensitivity of theCRUs is high. In a deterministic system, waves can occureven when the sensitivity is arbitrarily high. However, ina stochastic system, even with moderately high CRUCa21 sensitivity (;5 mM), the large number of sponta-neous sparks would trigger so many Ca21 waves at oncethat observing a well-defined wave would be almostimpossible.
3. Asymmetric distribution of discrete CRUs, and4. anisotropic diffusion of Ca21 and of mobile buffers. An
important difference between our model and that ofKeizer and coworkers (Keizer et al., 1998; Keizer andSmith, 1998) is how the Ca21 buffers (endogenous andCa21 indicator) are handled. The Keizer models do notinclude buffers, and they compensate for the absence ofbuffers by reducing the free Ca21 diffusion coefficient;10 fold. We will show that buffers endow the systemwith a property we call “superadditivity” that has pro-found effects on Ca21 signaling, which extend muchfurther than simply slowing Ca21 diffusion.
The effect of three of the four key features in this modelon Ca21 wave propagation has been investigated by others.The effect of discrete, asymmetric distribution of CRUs was
studied by Bugrim et al. (1997) and anisotropic Ca21 dif-fusion was addressed by Kargacin and Fay (1991) andGirard et al. (1992). Keizer and Smith (1998) examined theeffect of stochastic firing of CRUs on wave propagation.What is novel in our model is the combination of large CRUcurrents, stochastic triggering of CRU release, asymmetricdistribution of CRUs, and anisotropic diffusion.
METHODS
Figure 1 shows the geometry of our model.A is the 3-dimensional (3D)schematic of a ventricular cell. Thex-direction is the cell’s longitudinalaxis. The three vertical planes occur at thez-lines and are spaced a distance,x (52 mm) apart. The black dots in they–z plane are the CRUs. Thehorizontal plane is the 2-dimensional (2D) slice on which we will carry outour simulations. At present, we cannot do a full 3D simulation because oflimitations in computational power. Figure 1B shows CRUs in ay–zplane.Ca21 release by discrete CRUs will generate concentration gradients in alldirections. To eliminate gradients alongz, the discrete CRUs alongz arereplaced by line sources that extend from2` , z , ` and spaced adistance of,y (0.4 or 0.8mm) alongy as shown in Fig. 1C. These infiniteline sources induce symmetry inz making planes at anyz equivalent,thereby reducing the problem from three to two dimensions. Figure 1Dshows the plane on which the model is defined. The line sources intersectthe x–y plane and at regular intervals of,x alongx and,y alongy. Theseintersections are called lattice sites.
The model equations are the same as Eqs. 2–7 in Izu et al. (2001), thatdescribe the so-called “Smith buffer model.” Apart from the restriction totwo spatial dimensions, the only difference here is the differential equationfor the free Ca21 concentrationC(x, y, t) that is now
C~x, y, t!
t
5 DCx
2C
x2 1 DCy
2C
y2 1 RB~C, FB! 1 RD~C, FD! 2 Jp
1 Jleak 1 Oi, j
s~xi , yj!S~xi , yj , t; Topen!d~x 2 xi!d~y 2 yj!.
(1)
The summation term is new to this paper. Each term in the summationrepresents a point source (the CRU) located at the lattice site (xi, yj) thatproduces a molar fluxs. The lattice sites are spaced,x apart (2mm, thesarcomere length) along the longitudinal axis of the cell (x-axis) and,y
apart (0.4 or 0.8mm) in the transverse direction (y-axis). Figure 3,inset,and Fig. 4 show the lattice. CRUs on a column (fixedx) are said to be onaz-line. S is a stochastic function taking values of either 0 or 1, so switchesthe CRU on (firing) or off. AfterSbecomes 1, it stays at this value for timeTopen. The probability that the CRU will fire in timeDt is P(C(x, y, t), K,n) z Dt, whereP is the probability of firing per unit time.P is a function ofthe ambient Ca21 concentrationC(xi, yj, t) and is given by
P~C~x, y, t!, K, n! 5PmaxC
n
K n 1 Cn. (2)
P was determined as follows. Letr be the number of sparks/100mmlinescan/ms. Assume that the microscope’s lateral (y) and axial resolution(z) is 0.5 and 1mm, respectively. If CRUs are arranged in a square latticeon thez-line plane with spacing,y 5 0.8mm, then there will be;2 CRUs(or ;6 for ,y 5 0.4) in a 0.5mm 3 1 mm confocal sample area at eachz-line. Assuming a sarcomere length of,x 5 2 mm, then, in a 100-mm
104 Izu et al.
Biophysical Journal 80(1) 103–120
confocal linescan, there areNCRU 5 2 CRU/z-line 3 50 z-lines/100mmlinescan5 100 CRU/100mm linescan. ThenP 5 r/NCRU. Note thatPmax
has units of sparks/ms/CRU. The spark rate, the Hill coefficientn 5 1.6and the Ca21-sensitivity factorK 5 15 mM are taken from Lukyanenkoand Gyorke (1999). Using a spark frequency of 10 sparks/100mm lines-can/s at a Ca21 concentration of 100 nM, forNCRU 5 1 CRU/mm, Pmax
equals 0.3/CRU/ms (or 0.05/CRU/ms for,y 5 0.4). Note thatPmax is keptat these values (0.3 or 0.05) in simulations whereK is varied.
The source strengths requires some explanation. Because a line sourceis not equivalent to a linear array of discrete CRUs (shown in Fig. 1B), weneed to somehow adjust the molar flux of the line source to approximatethe molar flux of a point source. If Ca21 were being released from a CRUinto a 3D volume, thens3 5 ISR/2F, whereISR is the current andF is theFaraday. Note thats3 has units of mole/ms. Because the model is 2D,s 5s2 has units of mole/ms/mm. What value should we use fors2 in place ofs3? Although no value ofs2 will give the identical space–time Ca21
distribution in 2D ass3 will in 3D, we define an “equivalent” sourcestrengths2 as one that gives the same concentration ass3 at r 5 r# (theEuclidean distance) andt 5 t# in a linear system. LetC(r, t, d) be theconcentration at (r, t) in d 5 2, 3 dimensions. ThenC(r, t, 3) 5 (s3/(4pDr))erfc(z), C(r, t, 2) 5 (s2/(4pD))E1(z
2) wherez 5 r/=4Dt and E1 isthe exponential integral (Appendix A). Forr# 5 0.5mm, t# 5 5 ms, andD 50.2 mm2/ms (the geometric mean ofDCx andDCy), s2 5 0.64s3/mm. Weused this numerical conversion in all our simulations. With this conversionfactor, the sparks in the 2D model has about the same spatial spread andtime course as the 3D spark. For example, forISR 5 20 pA the sparkFWHM alongx at the end of 5 ms was 2mm in 3D (Izu et al., 2001) and1.9 mm in 2D.
We will vary ISR, Topen, K, and,y. The remaining parameters use thefollowing (standard) values (see Izu et al., 2001 for references):,x 5 2 mm
(Shacklock et al., 1995),n 5 1.6 (Lukyanenko and Gyo¨rke, 1999),HB 5123mM, kB
1 5 100/mM/ms, kB2 5 100/ms,HD 5 50 mM, kD
1 5 80 mM/s,kD
2 5 90/s,Vp 5 200 mM/s, Kp 5 184 nM, np 5 4, DCx 5 0.3 mm2/ms,DCy 5 0.15mm2/ms,DDx 5 0.02mm2/ms, andDDy 5 0.01mm2/ms, andC0 5 0.1 mM.
We used the reaction of Ca21 with fluo-3 described by Smith et al.(1998) instead of the more complex set of reactions proposed by Harkinset al. (1993) because of computational limitations. In our companion paper(Izu et al., 2001), we found that the Harkins buffer model produced sparkswith more realisticF/Fo and slightly larger spatial spread than did theSmith model. However, computations took considerably longer with theHarkins model and required a finer spatial discretization than the Smithmodel, making the computational costs prohibitive. We consider possibleramifications of using the Harkins model in the Discussion.
Numerical methods
The model equations were discretized and numerically solved using Fac-simile as described in Izu et al. (2001). The stochastic opening of a CRUwas simulated as follows. At regular intervals of timeDt (typically 1 ms),a uniformly distributed random numberu between 0 and 1 is generated.Note that, asC 3 `, P/Pmax3 1 so the probability thatu is less thanP/Pmax approaches 1. Thus, the CRU fires whenu , P/Pmax by settingSto 1, andS remains unity forTopenms. After closing, the channel does notreopen.
The computational grid was a rectangle 20mm 3 20mm with mesh sizeof 0.1 mm along bothx andy directions. We were constrained to use thesesmall domains because a typical simulation of 150 ms takes;24 hrs on a400 MHz Pentium II processor with 256 MB RAM, and computation time
FIGURE 1 Geometry of model.(A) Three-dimensional schematic of a cardiac ventricular cell. The longitudinal axis of the cell is in thex-direction. Thethree vertical planes represent thez-lines and are spaced a distance of,x (5 2 mm) apart. They–z plane at thez-line contain the CRUs (dots) that aresymmetrically spaced along they andz directions. The horizontal plane shown in the center is the domain on which the model equations are defined. (B)An individual y–z plane and its CRUs. Ca21 release by discrete CRUs will generate concentration gradients in all directions. To eliminate gradients alongz, the discrete CRUs alongz are replaced by line sources that extend from2` , z , ` as shown inC. (D) The 2D slice of the ventricular cell with CRUsrepresented by line sources spaced,x apart alongx and,y (5 0.4 or 0.8mm) alongy.
Ca21 Sparks and Waves 105
Biophysical Journal 80(1) 103–120

grows faster than computational area. Neumann boundary conditions wereimposed on all edges.
RESULTS
The basic principle behind wave evolution in this model issimple. Waves originate and are sustained as Ca21 releasedfrom one or more CRUs diffuse to neighboring CRUs andraise the probability that these neighbors will release Ca21
(or “fire”) and, in turn, induce other neighbors to fire. Ourmodel of Ca21 waves is analogous to piles of gunpowderwherein igniting one pile may ignite the neighboring pile.The probability that the neighbor will ignite depends onhow far the piles are from each other (,x, ,y), the rate ofheat production (ISR), the total amount of heat producedfrom each pile (ISR3 Topen), and the thermal stability of thegunpowder (K). The challenge is to get a quantitative un-derstanding of the conditions needed to initiate a wave, ofhow the wave evolves, the wave velocity, etc.
We start by analyzing a deterministic linear model forwaves on lattices even though it turns out to be inadequatefor understanding waves in muscle cells for the followingreasons.
1. The linear analysis is a natural first attempt becauselinear systems are simple and exactly solvable. So if theyprove to be accurate descriptions of waves in nonlinearsystems, then virtually everything about waves will beknown.
2. Because the linear solution is given in terms of knownfunctions (see Eq. 3), it provides a standard to check theaccuracy of the numerical algorithm used to solve themodel equations.
3. Most importantly, the failure of the linear approximationto accurately predict properties of waves in the nonlinearsystem reveals an essential difference between nonlinearand linear systems: superadditivity. We examine theorigin of superadditivity and show its importance inunderstanding waves in cells.
Next, we examine the propagation of a Ca21 wave andextract the basic steps in the propagation of waves onrectangular lattices. Because the firing of CRUs is stochas-tic, we need to develop the probabilistic machinery to esti-mate whether a given set of model parameters will be ableto support a wave, predict the wave’s speed, and estimatethe number of CRUs required to trigger a wave.
Linear systems
We would know virtually everything about waves if wecould predict the Ca21 concentration at any point (x, y, t)given the history of firings of CRUs. This prediction is notpossible in nonlinear systems but is possible in linear sys-tems. Linear systems, endowed with the property of addi-tivity, allow us to calculateC(x, y, t) knowing the space–
time distribution of Ca21 from a single spark.C(x, y, t) isgiven by
C~x, y, t! 5 Oi,j
qij
4pÎDxDy
E1~xi 2 x, yj 2 y, t 2 tij , Topen!
1 C0. (3)
The addend, derived in Appendix A, gives the space–timeCa21 distribution for a single CRU with constant molar fluxqij that is open for timeTopen. Note that the solution takesaccount of anisotropic diffusion. The summation is takenover all sites that have fired.tij is the time the channel at(xi, yj) had fired. This fundamental equation contains all theinformation about wave propagation on discrete lattices in alinear deterministic system.
The analytic power of linear systems stems from theability to predict the Ca21 concentration at any point (x, y, t)due to the firing of an arbitrary distribution of CRUs giventhe Ca21 distribution due to a single CRU. The objectivehere is to fit the Ca21 distribution from a single spark in thepresence of buffers and pump (nonlinear system) to that ofa linear system (see Appendix A),
C~x, y, t! 5q
4pÎDxDy
E1~x, y, t, Topen!, (4)
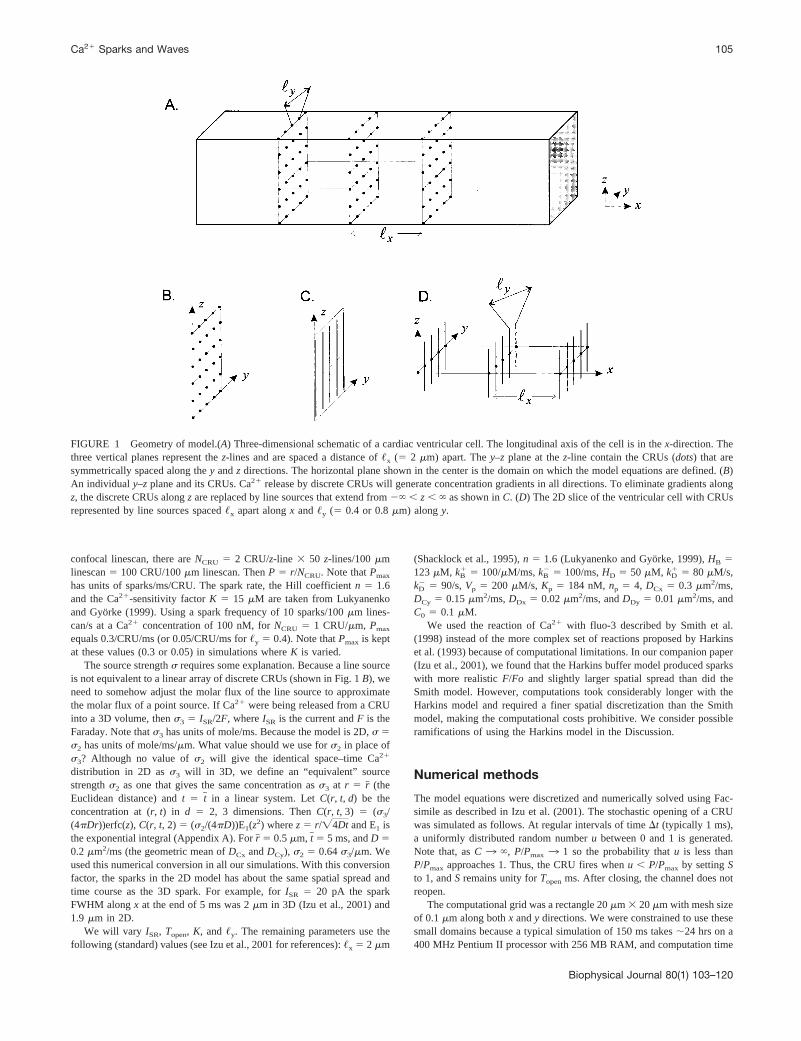
that defines an equivalent fluxq and diffusion coefficientDx. Dy always equaledDx/2. Figure 2,A andB, show theconcentration profiles from the simulations (circles) and thefitted function (solid curve) at t 5 5 ms (left profile) and 10ms (right profile) after the channel opens. PanelA shows theprofile alongx, andB, the profile alongy. Figure 2,C andD, show q and Dx; in a linear system, these parameterswould be time independent. Note that the values ofDx andq determined from thex profile (up triangle) andy profile(down triangle) are almost identical. This equality is impor-tant because it means that the Ca21 concentration at anarbitrary point (x, y, t) can be calculated using Eq. 3 using asingle pair (q, Dx) for any given moment. Time-dependentchanges inq andDx simply arise from fitting the solution tothe nonlinear problem to that of a linear problem. If thebuffers were absent, then the system would be linear andqandDx would be invariant. There is no simple physiologicalinterpretation for the time dependency ofq andDx.
It is important to observe in Fig. 2 that the Ca21 concen-tration is a very steep function of distance; it drops 1000-fold within 1.5 mm from the source. A CRU atx 5 2 mmwould “see” a Ca21 concentration of just 179 nM, 10 msafter the channel opens. Even if this concentration could bemaintained indefinitely, the mean waiting time for the CRUto fire is 1/P(179 nM, 15mM, 1.6) 5 3.98 s (see AppendixB), so a single spark is unlikely to trigger a spark at anadjacent sarcomere. This calculation is in accord withParker et al.’s (1996) observation that the probability of aspark triggering another 2mm away was zero.
106 Izu et al.
Biophysical Journal 80(1) 103–120
Triggering of sparks on adjacent sarcomeres is thesinequo nonof wave propagation in our model. Thus multiplechannels must fire within a short time interval to raise theCa21 concentration at an adjacent sarcomere enough totrigger Ca21 release. We calculatedC(x, y, t) using Eq. 3andq, Dx values att 5 10 ms for different configurations ofsimultaneously firing CRUs shown in Fig. 3. The channelconfigurations are labeled (a) 1 3 1, (b) 1 3 3, (c) 1 3 7,(d) 2 3 7, and (e) 1 3 9, where the first and second num-bers refer to the number of columns and rows of CRUs,respectively. The inset in Fig. 3 shows a schematic of thelattice, the arrangement of CRUs in a 23 3 configuration.The CRUs in a column are symmetrically displaced aboutthe origin so, for example, the coordinates of the 3 CRUs inthe 13 3 configuration are (0, 0), (0,1,y), and (0,2ly),where ,y 5 0.8 mm. The rationale for choosing theseconfigurations will become evident later. For configuration(d) the 2 columns are atx 5 0 and22 mm. Fig. 3A showsthe concentration along thex-axis (y 5 0) at t 5 10 ms forconfigurations (a–e). Because of the steep Ca21 concentra-tion profile, the firing of additional CRUs inb–edo not addsubstantially to the concentration due to the single CRU at
the origin (a, lower curve). At this resolution, the profilesfor channel configurations b, c, d, and e are indistinguish-able. Thus the linear model predicts that none of theseconfigurations of firing channels could raise the Ca21 con-centration atx 5 2 mm sufficiently to substantially increasethe probability of firing within 10 ms.
Superadditivity in buffered systems
A buffered system behaves differently, however. Fig. 3Bshows Ca21 concentration profiles derived from simulationsof the nonlinear system (buffers reactions and pump in-cluded) for the same five configurations (the graphs forcande are virtually identical). In contrast to the linear sys-tem, the firing of the flanking CRUs greatly increased theCa21 concentration along thex-axis.
The concentration profiles in Fig. 3A are expected if theeffect of two or more sparks were additive. However, Fig.3 B shows that the actual concentration exceeds the ex-pected values. We call this propertysuperadditivity.Su-peradditivity arises simply because the free Ca21 buffers
FIGURE 2 Determination of “equivalent”q andDx. Single spark profiles from simulations (circles) were fit to Eq. 4 by adjustingq andDx. (A) Theprofile alongx at t 5 5 ms (r , 0) andt 5 10 ms (r . 0). (B) Similar to A, but shows the profile alongy. The best fit values ofq andDx as functionsof t are shown inC andD. Up-triangles show the fit of the spark profile alongx; down-triangles, alongy. Simulations carried out usingISR5 20 pA,Topen510 ms.
Ca21 Sparks and Waves 107
Biophysical Journal 80(1) 103–120

become depleted. The addition ofm moles of Ca21 causes adrop in the available free buffer, so subsequent additions ofmmoles result in a larger increase in the Ca21 concentration.
A consequence of superadditivity important for understand-ing Ca21 wave propagation is that, when CRUs fire simulta-neously, the range of Ca21 signaling increases tremendously.This is seen in Fig. 3B and is also illustrated in Fig. 3C,wherethe concentration at (x 5 2 mm, y 5 0) is plotted against time.Note the tremendous amplification in the Ca21 concentrationas more CRUs fire. The maximum concentration attained 2mm away from a single spark is 278 nM (a), whereas, at thesame distance from the center of seven sparks (c), the maxi-mum concentration is 11.3mM, 41 times larger.
Wave propagation in nonlinear systems
For a linear (additive) system, we can make a priori predic-tions of wave properties, such as the wave speed based on
the properties of a single spark. However, because of su-peradditivity in buffered systems, such predictions are notpossible. This does not mean, however, that there are nopredictive tools for nonlinear waves. Instead, the probabi-listic tools we will develop below require more informationthan that provided from a single spark as input data andrequire some knowledge of how waves propagate on lat-tices. Thus we first examine in detail how a wave propa-gates on a rectangular lattice. Once we understand the basicsteps of wave propagation, we can set up approximations tothe Ca21 distribution in a wave, which are used in theprobabilistic equations. These equations are used to predictwave properties, such as whether waves can exist for agiven set of parameters and the wave velocity.
Before proceeding, let us explain why we need thesepredictive tools and why we cannot rely solely on numericalsolutions of the nonlinear model equations. The primaryreason is that these tools give us insight into the factors that
FIGURE 3 Ca21 concentration (C(x, y, t)) in (A) additive and (B, C) superadditive systems. (A) and (B) show the Ca21 spatial distribution alongx at y 50 at t 5 10 ms due to firing of CRUs in the following configurations: (a) 13 1, (b) 13 3, (c) 13 7, (d) 23 7, and (e) 13 9. Inset, a schematic of thelattice with a 23 3 configuration of CRUs. The darker circle indicates the CRU at the origin. In an additive system (A) simultaneous firing of multipleCRUs (b–e) do not add significantly to the Ca21 concentration from a single CRU (a). A buffered system exhibits superadditivity, and the Ca21 distributiondue to firing of multiple CRUs is remarkably different. Note that there is little difference due to firing of 7 or 9 CRUs (c, e). (C) The temporal behaviorof the Ca21 concentration atx 5 2, y 5 0 in a buffered system. Simulation parameters:ISR 5 20 pA, Topen 5 10 ms.
108 Izu et al.
Biophysical Journal 80(1) 103–120

shape the evolution of waves. The second reason is prag-matic. A typical simulation takes about 24 hrs of computa-tion time, so we rely on our predictive tools to guide us inmaking judicious parameter choices. The input data for theprobabilistic equations require only about 1 hr to compute.
Basic steps in propagating waves on discreterectangular lattices
Figure 4 shows how a Ca21 wave propagates on a discreterectangular lattice. The 11 images are of the Ca21 concen-tration distribution in thex–y plane att 5 0, 26, 29, 34, 38,55, 65, 75, 85, 95, and 105 ms (left to right, top to bottom).The white dots are the locations of the CRUs spaced 2mmapart longitudinally and 0.8mm apart transversely. Thewhite curves show whereC is between 10mM and 20mM.The origin is at the lower left corner. Att 5 0, C(x, y, 0) 50.1mM except on the 43 4 mm2 square at the origin whereC 5 30 mM. Note that the buffers are in equilibrium withthe Ca21 everywhere. We pick up the progress of the waveat t 5 26 ms where we see five firing CRUs atx 5 6 mm;
the CRU aty 5 2.4 mm fired att 5 15 ms and is no longerreleasing Ca21. At this time there is a “wall” of high Ca21
concentration (white curve) bearing down on the CRUs atx 5 8 mm. The next three images att 5 29, 34, and 38 msillustrate the rapid activation of six contiguous CRUs alongx 5 8 mm. This rapid activation is shown also in the 12thimage, which is a transverse linescan throughx 5 8 mm.This linescan image is oriented with they-coordinate in thesame direction as thex–y images, so there is a point-to-pointcorrespondence with thex–y image. The six contiguousCRUs fire in rapid succession, giving rise to the nearly flatapex of the transverse wave.
In the 5th image (t 5 38 ms), there is the wall of highCa21 concentration approaching the CRUs atx 5 10mm. Intime, CRUs atx 5 10mm will fire, sending out another wallof Ca21 to x 5 12 mm, thus regenerating the cycle of wavepropagation.
The sequence of events just described—firing of 5–7contiguous CRUs in rapid succession, generating a wall ofhigh Ca21 that, in turn, triggers CRU firing at the nextsarcomere—is the basic pattern for Ca21 wave propagation
FIGURE 4 Wave propagation on rectangular lattices. These snapshots of Ca21 distribution in thex–y plane were taken at 0, 26, 29, 34, 38, 55, 65, 75,85, 95, and 105 ms (left to right, top to bottom). The white dots are the locations of the CRUs spaced 2mm apart longitudinally and 0.8mm aparttransversely. The white curves show where 10mM , C , 20 mM. The simulation starts withC set to 30mM on 0 , x , 4 mm, 0 , y , 4 mm (image1); buffers (endogenous and fluo-3) are in equilibrium with Ca21. Elsewhere, all chemical species are set to their baseline values. Images 2–5 illustrate howCa21 waves propagate on rectangular lattices. Image 2 shows a “wall” of high Ca21 concentration (white curve) bearing down on the column of CRUsat x 5 8 mm. This wall of Ca21 causes the nearly simultaneous activation of about 7 CRUs (images 3–5). The sequence of firings alongx 5 8 is shownin the transverse linescan (image 12, time flows fromleft to right). The near simultaneous firing of;6 CRUs shows up as the flat part of the linescan image.Subsequently, CRUs alongy fire sequentially at nearly regular intervals, seen as the sloping part of the linescan image. About 5–7 contiguous CRUs areneeded to raise the Ca21 concentration high enough to trigger CRUs 2mm away at the next column to sustain the wave as was seen in the previous figure.Note spontaneous sparks occur in images 6, 10, and 11. “Jumping” of the wave from one column to the next is not evident in these static images; thissolution and others in the form of MPEG movies can be downloaded from our ftp site ftp://ntcv.umaryland.edu/pub/izu/. (The readme.txt file gives a guideto the movies.) The scale bar in panel 12 represents 50 ms.
Ca21 Sparks and Waves 109
Biophysical Journal 80(1) 103–120

on lattices. To generate enough Ca21 to saturate the buffersand to sufficiently raise the Ca21 concentration at the nextsarcomere, about 5–7 CRUs must fire in rapid succession aswas seen in Fig. 3C, illustrating superadditivity.
The rapid firing of 5–7 contiguous CRUs on az-lineshows up as the flat apex in a transverse linescan image(image 12,left-hand side). However, after this initial flurryof firings, subsequent firings on thatz-line occur in astep-by-step fashion at regular intervals as shown in thesloping edge of the linescan image.
Images 6–11 are taken at 10-ms intervals and illustratethe steady progression of the wave. Two spontaneous sparksare seen in image 6 (t 5 55 ms) at (10, 9.6) (near the center)and at (18, 14.4). The elliptical diffusion of Ca21 is clearlyseen in the (10, 9.6) spark. These sparks do not trigger firingfrom adjacent sarcomeres 2mm away. In the 10th (t 5 95ms) image image a spark occurs at (18, 13.6) and, in the11th (t 5 105 ms) image, sparks occur at (18, 15.2) and(18, 12.8). The sparks at (18, 13.6), (18, 15.2), and(18, 12.8) were probably triggered by the spark at(18, 14.4). Using the probabilistic equations in the nextsection, we calculate the probability of these CRUs firing tobe;0.5. In contrast, the probability of firing of a CRU farfrom the (18, 13.6) spark, say at (12, 14.4), during 55, t ,105 is only 0.014. Animated images of the simulationshown in Fig. 4 and other simulations, in the form of MPEGmovies, can be downloaded from our ftp site ftp://ntcv.u-maryland.edu/pub/izu/.
Wave statistics
Earlier deterministic models for Ca21 wave propagation(Backx et al., 1989; Keizer et al., 1998; Lukyanenko et al.,1999) assumed that the CRU fires as soon as the local Ca21
concentration exceeds the thresholdC*. In a stochasticsystem, this would be true ifn were so large thatP(C, K, n)would be nearly a step function withC* ' K. Becausen ;2, however,P(C, K, n) has a shallow slope, so there is adistribution of times before a CRU fires. Thus exactly whena CRU will fire cannot be known, so, instead, we calculatethe probability of firing within some time interval.
If the Ca21 concentration at a CRU is fixed atC# , then thewaiting time before it fires follows an exponential distribu-tion and the mean waiting time (MWT) before firing is1/P(C# , K, n). This standard result is not applicable to study-ing waves because the Ca21 concentration at a CRU varieswith time. In Appendix B, we derive, assuming time-vary-ing P(C, K, n), expressions forp(x, y, t , t), the probabilitythat a CRU at (x, y) does not fire in timet , t (Eq. B3);w(x, y, t), the waiting time distribution (Eqs. B5 and B8); theMWT before the CRU fires (Eq. B6), andP(X $ 1, t , t),the probability that at least one CRU has fired in timet ,t (Eq. B7).
Effect of ISR and Topen on waves
We apply these formulas to study the effectsISR andTopen
have on waves. First, we approximate the Ca21 distributionin a wave whose front is at columni 5 0 by two methods.In methoda we simultaneously fire two columns of sevencontiguous CRUs (y 5 ,y j, j 5 23, . . . , 3,x 5 2,x andx 5 0); in methodb we fire one column of seven CRUs(y 5 ,y j, j 5 23, . . . ,x 5 0) and set the initial Ca21 (andthe other chemical species) to a high value, comparable tothat seen in waves, in the regionx , 0, 23,y , y , 3,y.The choice of seven CRUs comes from observing, in Ca21
waves, that;5–7 CRUs must fire on columni before anyCRU on columni 1 1 fires. In methodb, the choice of theinitial Ca21 concentration is arbitrary, but the range isguided by results from some simulations. The distribution ina was chosen to approximate the distribution in a nascentwave, whereas that inb, a well-developed wave. Needless tosay, both methods approximate the concentrations in a wavevery crudely, but they nevertheless provide useful guides inchoosing model parameters for simulations. The time costof these rough calculations,;1–2 hrs, is well warrantedbefore carrying out an;24–36-hr simulation.
Method a underestimates the velocity because the Ca21
concentration gradient onx , 0 is greater than that in a wave,so less Ca21 flows to the CRUs on columni 1 1. Methodboverestimates the velocity because, in a wave, the CRUs on thewave front fire in rapid succession but not simultaneously asassumed in methodb. Thus, the velocity from the simulation isbracketed by the estimates from the two methods.
Each CRU at (x 5 2, y 5 0.8j), j 5 23, 22, . . . , 2, 3sees a changing Ca21 concentration similar to that in curved in Fig. 3C. Knowing C(x 5 2, y 5 0.8j, t), we thencalculate the probability that at least one CRU atx 5 2 willfire within t ms, P(X $ 1, t . t). The waiting time distri-bution (WTD)w before a CRU atx 5 2 fires is then used tocalculate the MWT for firing.
Figure 5A shows the probability of at least one firing and5 B the waiting time distributions for different combinationsof (ISR, Topen). The curves labeled with circles, squares, anddown-triangles derive fromISR 5 20 pA andTopen5 8, 7,and 5 ms, respectively. The curve with up-triangles comesfrom (15, 8). Thea andb sublabels signify the method usedto generate the concentration distributions. These curvesillustrate the striking sensitivity ofP(X $ 1, t , t) and theWTDs to ISR andTopen.
First consider the case whereISR 5 20 pA andTopen5 8ms (circles). Using the distribution of methoda, we see (Aa)the probability of firing starts rising starting;10 ms afterthe channels atx 5 0 andx 5 22 have fired, and, by 20 ms,it is almost certain that at least one CRU atx 5 2 has fired.The WTD w (Ba) also rises rapidly, peaks at 15 ms, thendeclines rapidly. The decline ofw to almost zero beyond;25 ms means that the probability of needing to wait morethan 25 ms before a CRU fires is virtually zero. The MWT
110 Izu et al.
Biophysical Journal 80(1) 103–120

for this distribution is 15.896 4.47 ms, from which weestimate the longitudinal velocity bynx 5 ,x/MWT 5 2mm/15.89 ms5 126 mm/s.
The parallel calculations ofP(X $ 1, t , t) andw usingthe distribution of methodb are given inAb and Bb. TheCRUs atx 5 2 see a higher Ca21 concentration than in methodabecause the shallower concentration gradient onx, 0 causesthe large amount of Ca21 in the reservoir (x , 0,23,y , y ,3,y) and Ca21 released from the CRUs to flowmostly rightward. Not surprisingly then,P(X $ 1, t , t)approaches 1 more quickly, andw is sharper for methodb. TheMWT is now 10.066 1.91 ms and the estimated velocity is199 mm/s. The wave velocity measured in a simulated wave(see below) with these parameters was 155mm/s, which isbetween the estimates from methodsa andb.
Firing properties change dramatically whenTopen de-creases by just 3 ms from 8 ms to 5 ms (down triangles).Whereas the probability of CRU firing atx 5 2 was almost1 at t 5 20 ms forTopen 5 8 ms, whenTopen 5 5 ms, theprobability of firing does not reach 0.5 until 80 ms usingmethoda or 37 ms using methodb. Note the waiting timedistributions are very broad with a barely perceptible peak
at 22 ms (Bb) and 47 ms (Ab). The MWTs are 69.03635.40 ms (a) and 40.636 30.22 ms (b). The broad waitingtime distributions mean that a CRU atx 5 2 will have anequally low chance of firing at almost any time after;10ms after CRUs atx 5 22 andx 5 0 have fired.
We do not expect waves to propagate with perfect regu-larity in a stochastic system, but there must be a modicumof predictability. The broadening of the waiting time distri-bution curves signals loss of predictability. For the param-eter pairs (20, 5) and (15, 8),down- and up-triangles,thewaiting time distributions are so broad that they preclude areasonable estimate of the time a wave front will reach thenext column of CRUs. Hence these calculations indicatethat Ca21 waves are unlikely to occur with these parametercombinations. These predictions were confirmed by simu-lations started with methoda.
Physiological meaning of the waitingtime distributions
We get a clearer understanding of the physiological mean-ing of the WTDs by examining them in conjunction with
FIGURE 5 Probability of firing (Aa, Ab) and waiting time distributions (Ba, Bb) for different combinations of (ISR, Topen). The sublabels (a,b) refer tothe method the Ca21 concentration in the wave was approximated (see text).Circles, (ISR, Topen) 5 (20, 8); squares,(20, 7); up-triangle, (15, 8);down-triangle,(20, 5).
Ca21 Sparks and Waves 111
Biophysical Journal 80(1) 103–120

linescan images of Ca21 waves shown in Fig. 6. The threewaves were produced with parameter combinations (ISR 520 pA, Topen 5 8 ms) (panelAa), (20, 5) [panelBa], and(5, 32) (panelCa). These linescans are oriented with timeflowing from left to right, and the linescan was along thelongitudinal axis aty 5 2.4 mm. In PanelA the wave
produces a sharp edge in the linescan image whose slope(measured with respect to the horizontal) equals the wavevelocity of 155mm/s. The sharpness of the edge stems fromthe almost perfectly regular firing intervals between CRUsshown in the accompanying time plot of the Ca21 concen-tration at the release sites atx 5 6, 8, 10, . . . , 18mm (Fig.
FIGURE 6 Regularity of wave propagation for different (ISR, Topen). Local variations in the wave velocity are reflected in the longitudinal linescan imagesAa (ISR 5 20, Topen5 8), Ba (20, 5), andCa (5, 32). InAa, the wave front progresses fromz-line to z-line (bright spots showing CRU firing) at a regularpace, giving rise to a sharp edge in the linescan image.Ab is the corresponding time plot of log(C(x, y 5 2.4, t)) for x 5 6, 8, 10, . . . , 16mm showingthe wave moving with almost deterministic precision despite the firing of CRUs being a random variable. The mean time between firings is 14.1 ms withstandard deviation (SD) of only 2.1 ms. This great regularity is predicted from the very narrow waiting time distribution (WTD), curve A,panel D,calculated using an approximation of the Ca21 distribution in a wave using methodb (see text for explanation).Ba shows a ragged wave indicating veryirregular wave propagation caused by reducingTopenby just 3 ms to 5 ms. The time plot of log(C(x, y 5 2.4, t)) (Bb) shows not only large variability inthe time of CRU firing but also the local Ca21 concentration at the time of firing (circles). Note that the CRU atx 5 12 sees a Ca21 of 3 mM for ;30ms but does not fire untilC ' 10 mM. The mean time between firings is 41.6 ms with a large SD of 29.1 ms. The WTD (curve B,panel D) is also verybroad; its mean is 40.6 ms and SD is 30.2 ms. The parameters for wave C were chosen so that the total Ca21 released,ISR 3 Topen, was the same as inA. Although the parameters for A and C appear vastly different, the waves are more similar to each other than the wave in B. Linescans A and C are scaledbetween 0.1 and 350mM and are about equally bright because the total Ca21 released is identical; linescan B is scaled between 0.1 and 175mM and isconsiderably dimmer than A and C. C’s wave velocity (81mm/s) is about half of A’s (155mm/s) reflecting the slower rate of release (ISR), but the wavefront is quite sharp. The mean time between firing (from the time plotCb) is 24.6 ms with SD5 8.4 ms; the WTD has mean of 23.3 ms and SD of 4.6 ms.
112 Izu et al.
Biophysical Journal 80(1) 103–120

6 Ab). The mean time between firings is 14.1 ms with astandard deviation (SD) of 2.1 ms. In this and remainingtime plots, the Ca21 concentration rises rapidly in the firstfew milliseconds after the CRU fires, then more slowly asdiffusion balances influx. The sudden drop occurs when theCRU closes.
In contrast to this wave that propagates with almostdeterministic precision, the wave in Fig. 6Ba propagatesunpredictably. The unpredictable timing of firing of succes-sive CRUs is seen in the time plot (Fig. 6Bb) and gives thelinescan image a ragged edge. The stochastic nature of CRUfiring is clearly evident in the time plot. Note that the Ca21
concentration at which the CRU fires (circles) varies widelyfrom 1.3 to 15.3mM. The CRU atx 5 12 mm (4th curvefrom left) sees a Ca21 concentration of;2 mM for ;30 mswithout firing, although CRUs atx 5 6, 8, and 10mm hadfired at this concentration. In fact, the CRUs atx 5 12 and 16mm do not fire until the Ca21 concentration is raised by thefiring of neighboring CRUs (off of the linescan) to;10 mM.
The widely differing firing patterns of waves inAa andBa are reflected in their respective WTDs shown in Fig. 5and reproduced in Fig. 6D. The nearly fixed firing intervalsin A can be anticipated from the narrow WTD, which has aSD of 1.91 ms, close to the measured dispersion of firingintervals in the wave. The mean of this WTD (i.e., theMWT) is 10.9 ms, somewhat less than the mean firinginterval. As mentioned earlier, the MWT calculated usingmethodb overestimates the wave speed.
The WTD for (20, 5) (curve B) is very broad; its mean is40.6 ms with a SD of 30.2 ms. The large dispersion in theWTD is the reason for the large variability in firing intervalsfor the wave in PanelB. The MWT and SD for WTD (B) areclose to the mean firing interval measured from time plotBbof 41.6 ms with SD of 29.1 ms.
Total Ca21 released is a strong determinant ofwave properties
The waves in panelsA, B, andC of Fig. 6 were generatedwith (ISR, Topen) of (20, 8), (20, 5), and (5, 32), respectively.Although the parameters are similar forA andB, the wavesare quite different. In contrast, (20, 8) and (5, 32) are dis-similar yet the waves they engender are similar in terms oftheir regularity. What is common to both (20, 8) and (5, 32)parameter sets is the total amount of Ca21 released per CRU(ISR 3 Topen) is the same. The mean and SD for the(5, 32)-WTD, curveC, are 23.33 and 4.55; the mean firinginterval measured from the time plots in Fig. 6Cb is 24.56ms and the SD is 8.44 ms. We expect that the MWT for(5, 32) would be longer than that for (20, 8) simply becausethe rate of release is 4 times smaller. Surprisingly, however,the MWT is only about twice as long, not four times longer(24.6 versus 14.1). In contrast, the MWT for (20, 5) is aboutthreefold larger (41.6 versus 14.1) than the MWT for(20, 8).
These results show that there is no simple relationshipbetween the rate of releaseISR, the open time, and the wavevelocity. However, the total Ca21 released,ISR 3 Topen, isa fairly good predictor of the SD of the WTD, hence a fairlygood predictor of the sharpness of the wave front. Twowaves having equalISR 3 Topen but different ISR, wouldappear about equally sharp in linescan images but wouldhave different velocities. In actual linescan images, we donot knowISR 3 Topen, but, because it equals the total Ca21
released, cells with equalISR 3 Topen would be aboutequally bright (compare time plots in Fig. 6,Ab and Cb).“Equally bright” must be interpreted cautiously, however,when using a nonratiometric dye such as fluo-4.
Initiation of waves
The distinction between wave propagation and wave initi-ation is essential for understanding the stability of the Ca21
control system in muscle. For (ISR 5 20, Topen 5 5) theMWT before activating CRUs 2mm away is 696 35 mswhen the Ca21 distribution is set up using methoda (Fig.5 Ba, down triangles). Because of the large MWT and largeSD, we guessed that a wave would not be initiated withthese parameters and initial conditions. This guess was, infact, correct. We carried out a simulation using the sameinitial conditions as methoda, firing two columns of sevenCRUs that raised the Ca21 concentration locally to highlevels, but not enough Ca21 was released to trigger CRUrelease on adjacent sarcomeres. However, raising the Ca21
concentration to 30mM in a 4 3 4 mm region was enoughto trigger the wave shown in Fig. 6B.
These examples illustrate the inherent stability of dis-cretely spaced CRUs to even fairly large increases in Ca21
concentration that might arise from injury or the randomfiring of CRUs. Large enough perturbations can triggerwaves, however.
To assess whether a given perturbation, i.e., nonequilib-rium Ca21 distribution, can trigger a wave, we calculate theWTD and P(X $ 1, t ,t) for that perturbation. Fig. 6Dshows the WTD for CRU firing atx 5 6 mm for thestandard initial conditions used to start wave calculations,that is,C(x, y, 0) 5 30mM on 0, x , 4, 0, y , 4 (dashedline). Note, in this region, that the buffers are in equilibriumwith Ca21, so there is a large reservoir of Ca21. This WTDhas a mean of 18.026 5.43 ms. Given the short MWT andlow SD, we expect that this IC will initiate firing of CRUsat x 5 6. Initiation does occur and, in Fig. 6B, the CRU atx 5 6 (3rd spark from the left) fires on schedule att 5 16ms. The reason this perturbation (30mM on a 43 4 mm2
region) could initiate a wave but the perturbation of methoda (two columns of seven firing CRUs) could not is simplyrelated to the amount of Ca21 available to diffuse. In theformer case, the large Ca21 reservoir can raise the Ca21
concentration atx 5 6 mm rapidly and sustain the highconcentration; in the latter case, the Ca21 released is rapidly
Ca21 Sparks and Waves 113
Biophysical Journal 80(1) 103–120

taken up by buffers, so free Ca21 concentration atx 5 6 mmis low.
Initiating CRU firing on an adjacent sarcomere does notguarantee wave propagation, however. The Ca21 distribu-tion set up by methodb serves to assess whether a given setof parameters can support a wave. The WTD using methodb for (ISR 5 20, Topen5 5), which we have seen before, isshown again in Fig. 6D (B). The large MWT and SD(40.66 30.2 ms) for this WTD make it ambiguous whethera wave might be supported. This ambiguity is reflected inthe wave itself as we see in Fig. 6B, where there are timeswhen the wave “stalls” and might seem to cease propagating(e.g., atx 5 12 mm and 16mm).
In summary, even if a given set of parameters couldsupport wave propagation, not every disturbance initiates awave. To initiate a wave, the disturbance must raise theCa21 concentration sufficiently high over a sufficientlylarge region. The magnitude and spatial extent of the neededperturbation depends naturally on the parameters and can beestimated from the WTD.
Effect of CRU Ca21 sensitivity
Up to now, we have fixed the CRUs’ Ca21 sensitivityK to15mM and focused on the effects thatISRandTopenhave onwave behavior.K is affected by the Mg21 concentration(Rousseau and Meissner, 1989), drugs such as caffeine(Rousseau and Meissner, 1989) and tetracaine (Gyo¨rke etal., 1997), and SR Ca21 loading (Rousseau and Meissner,1989; Gyorke and Gyo¨rke, 1998). Figure 7 shows the pre-dicted (curves) and actual (open squares) velocity depen-dence ofnx on K for ISR 5 20 pA andTopen 5 7 ms. Thelower and upper curves were calculated from the WTD
generated using methodsa and b, respectively. The upperand lower boundaries decline almost linearly withK. Sim-ilar calculations usingISR 5 10, Topen5 10 andISR 5 20,Topen 5 8 show also the linear decline of the velocityboundaries, but the slopes differ for each pair of (ISR, Topen).
Increasing sensitivity and spontaneous waves
Halving K from 15 mM to 7.5 mM doubles the Ca21
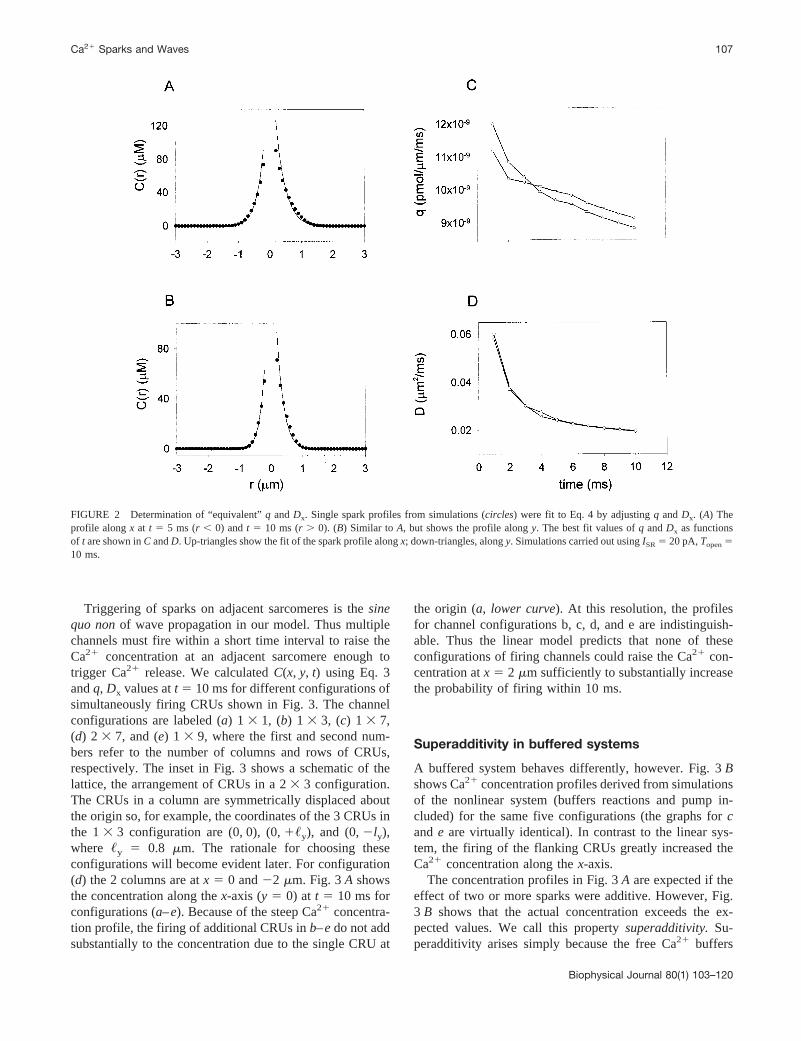
sensitivity of the CRU and triples the baseline spark rate,P.Figure 8 shows snapshots of the Ca21 distribution for thishigh-sensitivity condition. This simulation was started withall chemical species in equilibrium so all sparks arise spon-taneously. The first three panels (left to right) were taken att 5 21, 27, and 35 ms, and the arrows point to CRUs at(2, 4), (2, 3.2), and (2, 2.4), respectively. These three con-tiguous CRUs in the transverse direction fire sequentiallyand can be seen more clearly in the transverse linescanalongx 5 2 shown in the 12th panel. This sequential firingof sparks in the transverse direction is similar to thoseobserved by Parker et al. (1996) in ventricular cells. Notethat not all sparks trigger firing of contiguous CRUs. Forexample, in panel 2, the spark at (12, 9.6) (near the center)does not trigger any other spark.
Because of the high spontaneous spark rate, it is notsurprising to see a wave arise spontaneously. The birth of awave is seen in panels 4–7. Att 5 45 ms, the CRU at(16, 9.6) (panel 4, arrow) has fired and will sequentiallytrigger firing of contiguous CRUs onx 5 16. By t 5 61 ms(panel 5), CRUs at (16, 9.6) and (16, 8.8) have fired andturned off and the CRU at (16, 8) is firing. These sparks onx 5 16 have raised the Ca21 concentration at (14, 9.6)(arrow) only slightly above the baseline, so the firing of theCRU at (14, 9.6) is pure happenstance. If the CRUs onx 516 have not fired, the fate of CRUs onx 5 14 might besimilar to those we have seen: CRU (14, 9.6) might be anisolated spark or it might trigger one or two other sparks.
But the firing of CRUs onx 5 16 contribute Ca21 to siteson x 5 14 and also limit the diffusion of Ca21 away fromsite (14, 9.6). Thus the probability of firing of adjacentCRUs at (14, 9.66 0.8) is slightly higher than the CRU at(2, 3.2) following the CRU (2, 4) firing. Each additionalfiring of CRUs on x 5 16 leads to an ever increasinglikelihood of CRU firing onx 5 14 and vice versa, thusstabilizing the nascent wave. After a certain number ofCRUs have fired, the probability of the nascent wave dyingis virtually zero. This is the probabilistic equivalent of the“critical curvature” a wave must have before it can propa-gate (Wussling et al., 1997).
Effect of transverse lattice spacing
What effect would reducing the transverse CRU spacingfrom ,y 5 0.8 to 0.4mm, keeping,x fixed to 2mm, have on
FIGURE 7 Longitudinal velocity dependence onK. Curves give thelower and uppernx estimates using methodsa andb, respectively. Squaresgive the actual velocity from wave simulations. Inset shows velocitydependence asK approaches the baseline Ca21 concentration of 100 nM.Computation parameters:ISR 5 20 pA, Topen 5 7 ms.
114 Izu et al.
Biophysical Journal 80(1) 103–120
the ratio ofnx to ny? When,y 5 0.8 mm, nx/ny ' 1.3; forthe wave in Fig. 4,nx/ny 5 155 mm/s/124mm/s 5 1.25.When,y is reduced to 0.4mm, the distance to the adjacentCRU in they-direction is only1⁄5 of that to the CRU on thenext sarcomere. Thus the shorter distance should compen-sate for the 2:1 diffusion anisotropy, and we might expectnx/ny to be less than unity. This expectation is wrong.
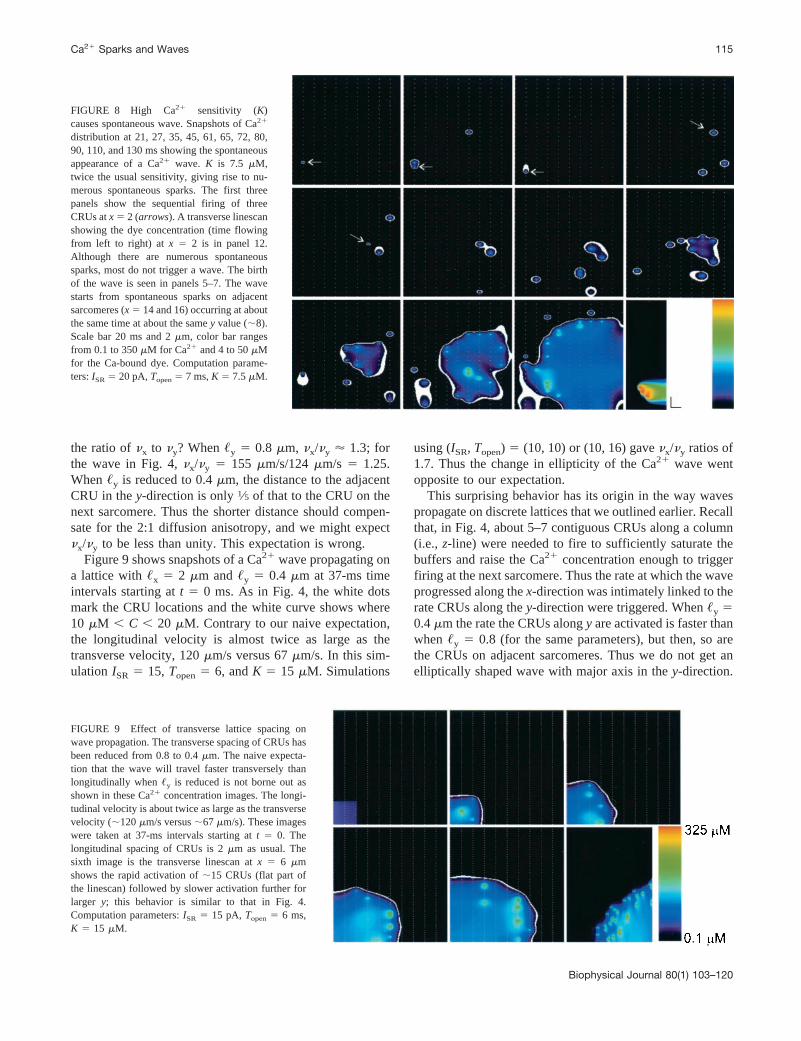
Figure 9 shows snapshots of a Ca21 wave propagating ona lattice with,x 5 2 mm and,y 5 0.4 mm at 37-ms timeintervals starting att 5 0 ms. As in Fig. 4, the white dotsmark the CRU locations and the white curve shows where10 mM , C , 20 mM. Contrary to our naive expectation,the longitudinal velocity is almost twice as large as thetransverse velocity, 120mm/s versus 67mm/s. In this sim-ulation ISR 5 15, Topen5 6, andK 5 15 mM. Simulations
using (ISR, Topen) 5 (10, 10) or (10, 16) gavenx/ny ratios of1.7. Thus the change in ellipticity of the Ca21 wave wentopposite to our expectation.
This surprising behavior has its origin in the way wavespropagate on discrete lattices that we outlined earlier. Recallthat, in Fig. 4, about 5–7 contiguous CRUs along a column(i.e., z-line) were needed to fire to sufficiently saturate thebuffers and raise the Ca21 concentration enough to triggerfiring at the next sarcomere. Thus the rate at which the waveprogressed along thex-direction was intimately linked to therate CRUs along they-direction were triggered. When,y 50.4mm the rate the CRUs alongy are activated is faster thanwhen,y 5 0.8 (for the same parameters), but then, so arethe CRUs on adjacent sarcomeres. Thus we do not get anelliptically shaped wave with major axis in they-direction.
FIGURE 8 High Ca21 sensitivity (K)causes spontaneous wave. Snapshots of Ca21
distribution at 21, 27, 35, 45, 61, 65, 72, 80,90, 110, and 130 ms showing the spontaneousappearance of a Ca21 wave. K is 7.5 mM,twice the usual sensitivity, giving rise to nu-merous spontaneous sparks. The first threepanels show the sequential firing of threeCRUs atx 5 2 (arrows). A transverse linescanshowing the dye concentration (time flowingfrom left to right) at x 5 2 is in panel 12.Although there are numerous spontaneoussparks, most do not trigger a wave. The birthof the wave is seen in panels 5–7. The wavestarts from spontaneous sparks on adjacentsarcomeres (x 5 14 and 16) occurring at aboutthe same time at about the samey value (;8).Scale bar 20 ms and 2mm, color bar rangesfrom 0.1 to 350mM for Ca21 and 4 to 50mMfor the Ca-bound dye. Computation parame-ters:ISR5 20 pA,Topen5 7 ms,K 5 7.5mM.
FIGURE 9 Effect of transverse lattice spacing onwave propagation. The transverse spacing of CRUs hasbeen reduced from 0.8 to 0.4mm. The naive expecta-tion that the wave will travel faster transversely thanlongitudinally when,y is reduced is not borne out asshown in these Ca21 concentration images. The longi-tudinal velocity is about twice as large as the transversevelocity (;120mm/s versus;67 mm/s). These imageswere taken at 37-ms intervals starting att 5 0. Thelongitudinal spacing of CRUs is 2mm as usual. Thesixth image is the transverse linescan atx 5 6 mmshows the rapid activation of;15 CRUs (flat part ofthe linescan) followed by slower activation further forlarger y; this behavior is similar to that in Fig. 4.Computation parameters:ISR 5 15 pA, Topen5 6 ms,K 5 15 mM.
Ca21 Sparks and Waves 115
Biophysical Journal 80(1) 103–120
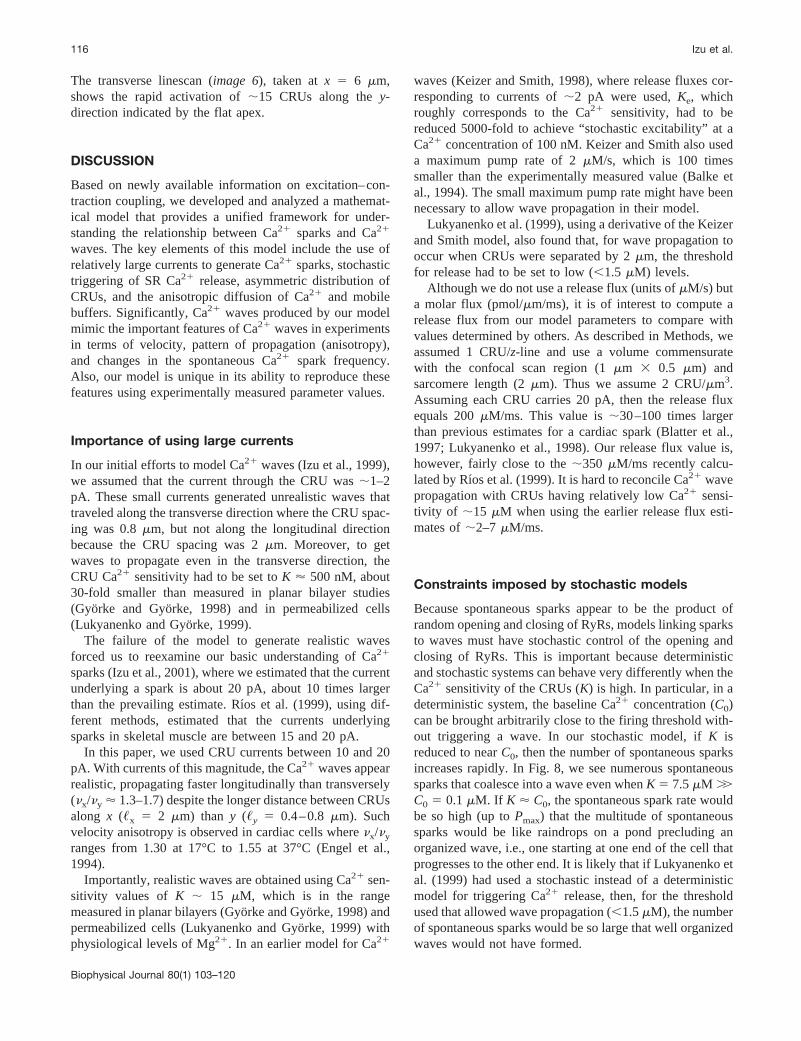
The transverse linescan (image 6), taken atx 5 6 mm,shows the rapid activation of;15 CRUs along they-direction indicated by the flat apex.
DISCUSSION
Based on newly available information on excitation–con-traction coupling, we developed and analyzed a mathemat-ical model that provides a unified framework for under-standing the relationship between Ca21 sparks and Ca21
waves. The key elements of this model include the use ofrelatively large currents to generate Ca21 sparks, stochastictriggering of SR Ca21 release, asymmetric distribution ofCRUs, and the anisotropic diffusion of Ca21 and mobilebuffers. Significantly, Ca21 waves produced by our modelmimic the important features of Ca21 waves in experimentsin terms of velocity, pattern of propagation (anisotropy),and changes in the spontaneous Ca21 spark frequency.Also, our model is unique in its ability to reproduce thesefeatures using experimentally measured parameter values.
Importance of using large currents
In our initial efforts to model Ca21 waves (Izu et al., 1999),we assumed that the current through the CRU was;1–2pA. These small currents generated unrealistic waves thattraveled along the transverse direction where the CRU spac-ing was 0.8mm, but not along the longitudinal directionbecause the CRU spacing was 2mm. Moreover, to getwaves to propagate even in the transverse direction, theCRU Ca21 sensitivity had to be set toK ' 500 nM, about30-fold smaller than measured in planar bilayer studies(Gyorke and Gyo¨rke, 1998) and in permeabilized cells(Lukyanenko and Gyo¨rke, 1999).
The failure of the model to generate realistic wavesforced us to reexamine our basic understanding of Ca21
sparks (Izu et al., 2001), where we estimated that the currentunderlying a spark is about 20 pA, about 10 times largerthan the prevailing estimate. Rı´os et al. (1999), using dif-ferent methods, estimated that the currents underlyingsparks in skeletal muscle are between 15 and 20 pA.
In this paper, we used CRU currents between 10 and 20pA. With currents of this magnitude, the Ca21 waves appearrealistic, propagating faster longitudinally than transversely(nx/ny ' 1.3–1.7) despite the longer distance between CRUsalong x (,x 5 2 mm) than y (,y 5 0.4–0.8mm). Suchvelocity anisotropy is observed in cardiac cells wherenx/ny
ranges from 1.30 at 17°C to 1.55 at 37°C (Engel et al.,1994).
Importantly, realistic waves are obtained using Ca21 sen-sitivity values of K ; 15 mM, which is in the rangemeasured in planar bilayers (Gyo¨rke and Gyo¨rke, 1998) andpermeabilized cells (Lukyanenko and Gyo¨rke, 1999) withphysiological levels of Mg21. In an earlier model for Ca21
waves (Keizer and Smith, 1998), where release fluxes cor-responding to currents of;2 pA were used,Ke, whichroughly corresponds to the Ca21 sensitivity, had to bereduced 5000-fold to achieve “stochastic excitability” at aCa21 concentration of 100 nM. Keizer and Smith also useda maximum pump rate of 2mM/s, which is 100 timessmaller than the experimentally measured value (Balke etal., 1994). The small maximum pump rate might have beennecessary to allow wave propagation in their model.
Lukyanenko et al. (1999), using a derivative of the Keizerand Smith model, also found that, for wave propagation tooccur when CRUs were separated by 2mm, the thresholdfor release had to be set to low (,1.5 mM) levels.
Although we do not use a release flux (units ofmM/s) buta molar flux (pmol/mm/ms), it is of interest to compute arelease flux from our model parameters to compare withvalues determined by others. As described in Methods, weassumed 1 CRU/z-line and use a volume commensuratewith the confocal scan region (1mm 3 0.5 mm) andsarcomere length (2mm). Thus we assume 2 CRU/mm3.Assuming each CRU carries 20 pA, then the release fluxequals 200mM/ms. This value is;30–100 times largerthan previous estimates for a cardiac spark (Blatter et al.,1997; Lukyanenko et al., 1998). Our release flux value is,however, fairly close to the;350 mM/ms recently calcu-lated by Rı´os et al. (1999). It is hard to reconcile Ca21 wavepropagation with CRUs having relatively low Ca21 sensi-tivity of ;15 mM when using the earlier release flux esti-mates of;2–7 mM/ms.
Constraints imposed by stochastic models
Because spontaneous sparks appear to be the product ofrandom opening and closing of RyRs, models linking sparksto waves must have stochastic control of the opening andclosing of RyRs. This is important because deterministicand stochastic systems can behave very differently when theCa21 sensitivity of the CRUs (K) is high. In particular, in adeterministic system, the baseline Ca21 concentration (C0)can be brought arbitrarily close to the firing threshold with-out triggering a wave. In our stochastic model, ifK isreduced to nearC0, then the number of spontaneous sparksincreases rapidly. In Fig. 8, we see numerous spontaneoussparks that coalesce into a wave even whenK 5 7.5mM ..C0 5 0.1 mM. If K ' C0, the spontaneous spark rate wouldbe so high (up toPmax) that the multitude of spontaneoussparks would be like raindrops on a pond precluding anorganized wave, i.e., one starting at one end of the cell thatprogresses to the other end. It is likely that if Lukyanenko etal. (1999) had used a stochastic instead of a deterministicmodel for triggering Ca21 release, then, for the thresholdused that allowed wave propagation (,1.5mM), the numberof spontaneous sparks would be so large that well organizedwaves would not have formed.
116 Izu et al.
Biophysical Journal 80(1) 103–120

Thus stochastic systems imposes the constraintK .. C0
for organized waves to occur. This constraint is importantwhen we consider factors that affect wave velocity.
Determinants of wave velocity
The wave velocity is affected by the rate of Ca21 release,ISR, the total amount of Ca21 released,ISR 3 Topen, and theCa21 sensitivity of the CRU,K. The Ca21 sensitivity ofRyRs is affected by the Mg21 concentration (Rousseau andMeissner, 1989; Gyo¨rke and Gyo¨rke, 1998), SR loading(Gyorke and Gyo¨rke, 1998), and drugs such as caffeine(Rousseau and Meissner, 1989) and tetracaine (Gyo¨rke etal., 1997). Figure 7 shows the estimated dependence of thelongitudinal wave velocitynx on K. As expected, increasingthe Ca21 sensitivity (decreasingK) increases the wavevelocity. In fact, such a velocity increase has been observedin the presence of low doses of caffeine (Lukyanenko et al.,1999).
The main graph of Fig. 7 shows the estimated bounds ofnx declining roughly linearly withK. However, the insetshows that, asK decreases to nearC0 (0.1 mM) the wavevelocity rises sharply; forK 5 0.3 mM, the estimatedvelocity ' 1600mm/s. ter Keurs and co-workers (Miura etal., 1999) have measured very high velocity (;1000–2000mm/s) Ca21 waves in intact trabeculae that increased (to;6000mm/s) in the presence of caffeine. They ascribe thechanges in velocity to changes in cellular loading and openprobability of CRUs. The sharp rise ofnx asK3 C0 wouldbe in accord with their explanation, but we find it a chal-lenge to explain such high wave velocities within the con-text of our stochastic model because the number of sponta-neous sparks would be so great that no well-organized wavewould emerge.
An unexpected finding of this study was that the “local”wave velocity was strongly affected by the total Ca21
released,ISR 3 Topen. The local or instantaneous wavevelocity is the distance between two CRUs (,x 5 2 mm)divided by the time interval between their firing. Largevariations in the local wave velocity are seen as a raggedwave front in linescan images (Fig. 6B) and were also notedby Cheng et al. (1996) in rat ventricular myocytes. Largevariations in the wave speed reflect the broad waiting-timedistribution that arises when total Ca21 released is low(ISR3 Topen5 20 pA3 5 ms5 100 fC) Fig. 6D, curve B).
Figure 6, A and C, show two waves having differentvelocities because the underlying currents are different (20pA and 5 pA) yet their wave fronts are about equally sharpbecauseTopen was adjusted to makeISR 3 Topen equal inboth cases (160 fC). The waiting time distribution curves(Fig. 6D, curves Aand C) are shifted because of thedifferent currents but roughly similar standard deviations.The two images are of about equal brightness because thetotal Ca21 released are the same. Acknowledging the perilsof comparing fluo-4 image brightness, we suggest, as a
rule-of-thumb, that wave images of comparable brightnesswill have wave fronts of comparable sharpness. In particu-lar, bright waves will have sharp wave fronts, and dimwaves will have ragged fronts.
Controlling instability
The paradox of stable cytosolic Ca21 levels in the face ofregenerative SR Ca21 release has been largely resolved byStern’s (1992) local control model of Ca21 release andconfirmed experimentally with the discovery of Ca21
sparks (Cheng et al., 1993). Anatomy (in part) confersstability: stability is achieved by the separation of CRUs byabout 2mm longitudinally and about 0.4–0.8mm in theplane of thez-line. Ca21 buffers severely restrict the spreadof Ca21 released from a single or few CRUs, where su-peradditivity effects are minimal, as seen in Fig. 2. Even forlarge currents (;20 pA), the maximum Ca21 concentration2 mm away from a CRU (in thex direction) is less than 300nM. However, CRUs are spaced more closely in the trans-verse direction and the Ca21 concentration at the CRUadjacent to the one that is firing 0.8mm away can be high.For example, for a CRU withISR 5 20 pA andTopen 5 7ms, the Ca21 concentration 0.8mm away is 2.9mM. How-ever, becauseK ; 15 mM, the probability that a neighbor-ing CRU will fire within 150 ms is 0.38. Note that, if theCRU spacing is assumed to be 0.4mm, the probability oftriggering a neighbor within 150 ms increases only to 0.42becauseP# is less. Stability is also enhanced slightly by theanisotropy favoring diffusion alongx over y. If diffusionwere isotropic then the probability of triggering a neighborwithin 150 ms rises to 0.52. Thus stability derives fromspatial separation of CRUs, low Ca21 sensitivity of theCRUs, Ca21 buffering, and, to a lesser extent, diffusionalanisotropy.
Loss of stability can manifest itself in Ca21 waves. Be-cause increased SR loading increases bothISR(measured bythe spark amplitude, Cheng et al., 1996; Satoh et al., 1997)and CRU Ca21 sensitivity (decreasesK), it is not surprisingthat increasing SR load is perhaps the most common way ofinducing spontaneous waves. As seen in Fig. 8, reducingKto 7.5 mM caused a spontaneous wave. However, we alsosee that not every spontaneous spark generates a wave.Precisely how many sparks in what configuration is neededto start a wave is difficult if not impossible to predict. Thesimulation in Fig. 8 suggests, however, that 2 sparks onadjacentz-lines within about 1 lattice step in they-direction,firing within a few milliseconds of each other is sufficient totrigger a wave. The reason why this configuration cantrigger a wave is due, in part, from the shallow concentra-tion gradient between the releasing sites alongx that forcesmore Ca21 to flow in they-direction and activate transverseneighbors. Each additional firing of CRUs on onez-lineleads to an ever increasing likelihood of CRU firing on theotherz-line and vice versa. Soon, transverse CRUs on the
Ca21 Sparks and Waves 117
Biophysical Journal 80(1) 103–120

neighboringz-lines begin to fire sequentially in lockstep,generating a stable nascent wave. After a certain number ofCRUs have fired, the probability of the nascent wave dyingspontaneously becomes virtually zero. The minimal sparkconfiguration that can initiate a stable wave is equivalent tothe critical curvature a wave must have before it can prop-agate (Wussling et al., 1997).
In ventricular cells, Ca21 waves are believed to be apathological manifestation of Ca21 overload. However, inother cell types such as avian ventricular cells or atrial cellsthat do not have t-tubules, Ca21 waves might assume thefunction of t-tubules in causing rapid, propagated Ca21
release throughout the cell. In these cells it would be im-portant for a state of “controlled instability” to be main-tained, wherein random Ca21 fluctuations would not triggera wave but a large enough Ca21 bolus, representing a usefulsignal, would start a wave.
Limitations of the model
One problem is the very slow decline of the Ca21 wave. Inour longest simulation of 300 ms, the Ca-bound dye con-centration ([Ca-Dye]) had not declined to the baseline level.We estimate from the maximum pump rate of 200mM/s andthe amount of Ca21 released that it would take;2000 msfor [Ca-Dye] to return to baseline. Lukyanenko et al. (1998)had used a maximum pump rate 10 times larger than ours,and, using this rate, we calculated that the wave woulddecline in about 200 ms.
The slow decline might be due, in part, to the absence ofdiffusion in thez-direction because of cylindrical symmetry.We partially compensated for this by reducing the molarflux (see Methods). This suggests that the too slow declineof the wave might be linked to another limitation of themodel—representing the cell as a 2D plane. At the moment,computational limitations preclude a full 3D simulation.However, a 2D simulation might not be as inaccurate as itmight first appear. Rapid 3D confocal imaging of Ca21
waves using a novel Nipkow confocal microscope (Ishida etal., 1999) shows that there is little variation of the wave inthe z-direction. This amounts to cylindrical symmetry as-sumed in our 2D model. Thus a 3D simulation wouldrequire CRUs to fire throughout they–z plane, so would notsolve the problem of the slowly declining wave.
Another limitation of the model is thatTopen is fixed forall CRUs in a particular simulation. We have seen that waveproperties are particularly sensitive toTopen. Even a 1-mschange can substantially affect the MWT and SD of thewaiting time distribution. In future work we will allowTopen
to be a random variable.As mentioned in Methods, we used the Smith buffer
model (Smith et al., 1998) instead of the more complexHarkins buffer model (Harkins et al., 1993) because thecomputational burden of using the latter was prohibitive. Toget a sense of how using the Harkins model would affect
wave propagation, we compared the Ca21 concentrationsfrom the two models at various distances away from a pointsource (assuming spherical symmetry, see Izu et al., 2001).In the Harkins model, protein-bound fluo-3 (PD) can bindCa21 and also act as a large reservoir for protein-free fluo-3(D), which has a higher Ca21 affinity than PD. Thus for thesame concentration of D in the Smith and Harkins buffermodels, there are more Ca21 binding sites in the Harkinsbuffer model resulting in a lower maximum Ca21 concen-tration for the same current. The magnitude of the differencedepends on the distance from the source,r, however. Forboth Smith and Harkins buffer modelsC at r 5 0.4 mm arealmost identical and the probability of triggering a CRU atthis distance is almost 1 within 15 ms. These calculationsusedISR5 40 pA,Topen5 5 ms,DCx 5 0.3mm2/ms,DDx 50.09 mm2/ms (for Harkins model) orDDx 5 0.02 mm2/ms(for Smith model). These currents are much larger than usedin the 2D simulations because spherical symmetry is as-sumed. See Izu et al. (2001) on the effect of symmetryassumptions. Atr 5 2 mm, C rises to;160 nM and;140nM in the Smith and Harkins models, respectively. Offset-ting the smaller maximum Ca21 concentration is the fasterrise time in the Harkins model, so, within;50 ms of firingof the source CRU, the probability of triggering a CRU atr 5 2 is about the same for both models.
Given these compensating effects in the Harkins model,we cannot make quantitative predictions of Ca21 waveproperties in the Harkins model without simulations. Wewould guess, however, that the wave velocity would beslower and it would be more difficult to initiate a wavebecause there is effectively more exogenous buffer than inthe Smith model.
Insufficient computational power imposes many of thelimits of the model. The most important are the limitation to2D simulations and the use of a simple Ca21 buffer model.We are currently writing simulation code to run on a super-computer (an SGI Origin 2000) that would remove theselimitations. Supercomputer calculations will also allowmuch longer simulation times (.. 150 ms) allowing us tostudy Ca21 oscillations. Currently, we prevent CRU refiring(hence oscillations) by setting the refractory period to vir-tual infinity to avoid complicating the analysis of propaga-tion of a single Ca21 wave.
The use of a stochastic function that depends algebra-ically on the local Ca21 concentration (i.e., changing in-stantly with C), instead of being a dynamical function, isboth a strength and a weakness. Its simplicity allowed us tocalculate probability functions that were extremely usefulfor guiding the simulations and provided insights into thefactors that control wave propagation. However, its uttersimplicity might be preventing us from seeing waves thatare self-aborting, as Keizer and Smith (1998) observed intheir simulations. (There are trivially self-aborting wavesthat exist for a short time because of high Ca21 concentra-
118 Izu et al.
Biophysical Journal 80(1) 103–120

tions that are put in as initial conditions.) In our model, aftera wave gets beyond a certain size, it never dies.
In summary, the model presented here provides a unifiedframework for studying both Ca21 sparks and Ca21 wavesin cardiac ventricular myocytes. The model generates spon-taneous Ca21 sparks at rates seen in experiments. Themodel also generates realistic Ca21 waves using relativelylow (;15 mM) Ca21 sensitivities for the SR Ca21 releaseunits.
APPENDIX A
It can be readily verified that the solution to the linear 2D anisotropicdiffusion problem,
C
t5 Dx
2C
x2 1 Dy
2C
y2 , (A1)
satisfying the boundary conditionu(x, y, t) 3 0 asx, y 3 ` and initialconditionC(x, y, 0) 5 Md(x, y) is
C~x, y, t! 5M
4pÎDxDytexpS2x2
4DxtD z expS2y2
4DytD
; MG~x, y, t!, (A2)
whereG is the Green’s function. We model the opening of the CRU witha sourcec(t) that has constant valueq between 0, t , T and is zerootherwise,
c~t! 5 qH~t! 2 qH~t 2 T!, (A3)
whereH is the Heaviside function. The Ca21 distribution in this case isfound by convolving the Green’s function withc. The convolution with thefirst term is
E0
t
qG~x, y, t 2 s!H~s! ds5q
4pÎDxDyE
g/(4t)
` e2z
zdz
5q
4pÎDxDy
E1Sg
4tD , (A4)
where g 5 (x2Dy 1 y2Dx)/(DxDy), z 5 g/[4(t 2 s)], and E1 is theexponential integral. The convolution of the second term ofc with G isobtained similarly, andC(x, y, t) becomes
C~x, y, t! 5q
4pÎDxDyFE1Sg
4tDH~t! 2 E1S g
4~t 2 T!DH~t 2 T!G;
q
4pÎDxDy
E1~x, y, t, T!, (A5)
where we call E˜ the “extended exponential integral.”
APPENDIX B
We derive the probability that a CRU at (x, y) will not fire in t , t, p(t ,t), and the waiting time distribution,w(t), when the probability of occur-rence per unit timeP(C(x, y, t), K, n) varies with time. WhenP is constantand,,1, then the waiting time distribution is the exponential distribution
(see any textbook on probability, e.g., Ross, 1976). We are unaware of aderivation forw whenP is variable.
The probability that we need to wait at least timet before the channel opensequals 12 (probability that no event occurred int , t). Divide t up intodttime segments,t 5 Ndt, then the probability that no event occurred is
p~t , t! 5 ~1 2 P~t1!dt~1 2 P~t2!dt! . . . ~1 2 P~tN!dt!,(B1)
where we use the abbreviated notationP(ti) 5 P(C(x, y, ti), K, n) and (i 21)dt # ti # i dt. Taking logs
ln~p~t , t!! 5 Oi
ln~1 2 P~i!dt! < 2Oi
P~i!dt. (B2)
The approximation holds providedP(i) ,, 1, which means thatC(x, y, t)should be much smaller thanK. Letting dt 3 0, gives the key result,
p~t , t! 5 expS2E0
t
P~s! dsD . (B3)
The probability that one has to wait at leastt for an event to occur isp(t . t) 5 1 2 p(t , t). The waiting time distributionw that generatesp(t . t) is defined by
p~t . t! 5 E2`
t
w~s! ds. (B4)
Differentiating with respect tot gives
w~x, y, t!
5 5 P(C~x, y, t!)expS2E0
t
P~C~x, y, s! ds!D t . 0
0, t # 0.
(B5)
The mean waiting timet# is
t# 5 E0
`
tw~x, y, t! dt. (B6)
Note that, ifP(C(x, y, t), K, n) 5 P# is constant, then the mean waiting timereduces to the well-known solutiont# 5 1/P# .
Waiting time distribution for N CRUs.
If pi(t , t) is the probability that theith CRU has not fired int , t, thenthe probability of having to wait at least timet before at least one of theN CRUs have fired is
P~X $ 1, t , t! 5 1 2 Pi51
N
pi
5 1 2 Pi51
N
expS2E0
t
P~C~xi , yi , s! ds!D . (B7)
Ca21 Sparks and Waves 119
Biophysical Journal 80(1) 103–120

Differentiating with respect tot gives
w~t! 5 5 SOi
P~C~xi , yi , t!!D z Pi
pi~t , t!, t . 0
0, t # 0.(B8)
We thank Ye Chen-Izu (University of Maryland) and Robert A. Spangler(State University of New York at Buffalo) for valuable discussions. L.T.I.was supported by National Institutes of Health/National Institute of Ar-thritis and Musculoskeletal and Skin Diseases Institutional Training GrantAR07592 to the Interdisciplinary Program in Muscle Biology, Universityof Maryland School of Medicine.
REFERENCES
Backx, P. H., P. P. De Tombe, J. H. K. Van Deen, B. J. M. Mulder, andH. E. D. J. ter Keurs. 1989. A model of propagating calcium-inducedcalcium release mediated by calcium diffusion.J. Gen. Physiol.93:963–977.
Balke, C. W., T. M. Egan, and W. G. Wier. 1994. Processes that removecalcium from the cytoplasm during excitation–contraction coupling inintact rat heart cells.J. Physiol.474:447–462.
Blatter, L. A., J. Huser, and E. Rı´os. 1997. Sarcoplasmic reticulum Ca21
release flux underlying Ca21 sparks in cardiac muscle.Proc. Natl. Acad.Sci. USA.94:4176–4181.
Bugrim, A. E., A. M. Zhabotinsky, and I. R. Epstein. 1997. Calcium wavesin a model with a random spatially discrete distribution of Ca21 releasesites.Biophys. J.73:2897–2906.
Carl, L. S., K. Felix, A. H. Caswell, N. R. Brandt, W. J. Ball, Jr., P. L.Vaghy, G. Meissner, and D. G. Ferguson. 1995. Immunolocalization ofsarcolemmal dihydropyridine receptor and sarcoplasmic reticular triadinand ryanodine receptor in rabbit ventricle and atrium.J. Cell Biol.129:673–682.
Cheng, H., M. R. Lederer, W. J. Lederer, and M. B. Cannell. 1996. Cal-cium sparks and [Ca21]i waves in cardiac myocytes.Am. J. Physiol. CellPhysiol.270:C148–C159.
Cheng, H., W. J. Lederer, and M. B. Cannell. 1993. Calcium sparks:elementary events underlying excitation–contraction coupling in heartmuscle.Science.262:740–744.
Cornell-Bell, A. H., and S. M. Finkbeiner. 1991. Ca21 waves in astrocytes.Cell Calcium.12:185–204.
Endo, M., M. Tanaka, and Y. Ogawa. 1970. Calcium induced release ofcalcium from the sarcoplasmic reticulum of skinned skeletal musclefibers.Nature.228:34–36.
Engel, J., M. Fechner, A. J. Sowerby, S. A. E. Finch, and A. Stier. 1994.Anisotropic propagation of Ca21 waves in isolated cardiomyocytes.Biophys. J.66:1756–1762.
Fabiato, A., and F. Fabiato. 1972. Excitation–contraction coupling ofisolated cardiac fibers with disrupted or closed sarcomeres. Calcium-dependent cyclic and tonic contractions.Circ. Res.31:293–307.
Ford, L. E., and R. J. Podolsky. 1970. Regenerative calcium release withinmuscle cells.Science.167:58–59.
Girard, S., A. Luckhoff, J. Lechleiter, J. Sneyd, and D. Clapham. 1992.Two-dimensional model of calcium waves reproduces the patterns ob-served inXenopusoocytes.Biophys. J.61:509–517.
Gyorke, S., and I. Gyo¨rke. 1998. Regulation of the cardiac ryanodinereceptor channel by luminal Ca21 involves luminal Ca21 sensing sites.Biophys. J.75:2801–2810.
Gyorke, S., V. Lukyanenko, and I. Gyo¨rke. 1997. Dual effects of tetracaineon spontaneous calcium release in rat ventricular myocytes.J. Physiol.500:297–309.
Harkins, A. B., N. Kurebayashi, and S. M. Baylor. 1993. Resting myo-plasmic free calcium in frog skeletal muscle fibers estimated with fluo-3.Biophys. J.65:865–881.
Huser, J., S. L. Lipsius, and L. A. Blatter. 1996. Calcium gradients duringexcitation–contraction coupling in cat atrial myocytes.J. Physiol.494:641–651.
Ishida, H., C. Genka, Y. Hirota, H. Nakazawa, and W. H. Barry. 1999.Formation of planar and spiral Ca21 waves in isolated cardiac myocytes.Biophys. J.77:2114–2122.
Izu, L. T., J. R. H. Mauban, C. W. Balke, and W. G. Wier. 2001. Largecurrents generate cardiac Ca21 sparks.Biophys. J.80:88–102.
Izu, L. T., W. G. Wier, and C. W. Balke. 1999. Evolution of Ca21 wavesfrom stochastic Ca21 sparks on rectangular lattices.Biophys. J.76:A397.
Jiang, Y.-H., M. G. Klein, and M. F. Schneider. 1999. Numerical simula-tion of Ca21 “sparks” in skeletal muscle.Biophys. J.77:2333–2357.
Kargacin, G., and F. S. Fay. 1991. Ca21 movement in smooth muscle cellsstudied with one- and two-dimensional diffusion models.Biophys. J.60:1088–1100.
Keizer, J. and G. D. Smith. 1998. Spark-to-wave transition: saltatory trans-mission of calcium waves in cardiac myocytes.Biophys. Chem.72:87–100.
Keizer, J., G. D. Smith, S. Ponce-Dawson, and J. E. Pearson. 1998. Salta-tory propagation of Ca21 waves by Ca21 sparks. Biophys. J.75:595–600.
Lakatta, E. G., and T. Guarnieri. 1993. Spontaneous myocardial calciumoscillations: are they linked to ventricular fibrillation?J. Cardiovasc.Electrophysiol.4:473–489.
Lukyanenko, V., and S. Gyo¨rke. 1999. Ca21 sparks and Ca21 waves insaponin-permeabilized rat ventricular myocytes.J. Physiol. 521:575–585.
Lukyanenko, V., S. Subramanian, I. Gyo¨rke, T. F. Wiesner, and S. Gyo¨rke.1999. The role of luminal Ca21 in the generation of Ca21 waves in ratventricular myocytes.J. Physiol.518:173–186.
Lukyanenko, V., T. F. Wiesner, and S. Gyo¨rke. 1998. Termination of Ca21
release during Ca21 sparks in rat ventricular myocytes.J. Physiol.507:667–677.
Miura, M., P. A. Boyden, and H. E. D. J. ter Keurs. 1999. Ca21 wavesduring triggered propagated contractions in intact trabeculae. Determi-nants of the velocity of propagation.Circ. Res.84:1459–1468.
Parker, I., W.-J. Zang, and W. G. Wier. 1996. Ca21 sparks involvingmultiple Ca21 release sites alongz-lines in rat heart cells.J. Physiol.497:31–38.
Ridgway, E. B., J. C. Gilkey, and L. F. Jaffe. 1977. Free calcium increasesexplosively in activating medaka eggs.Proc. Natl. Acad. Sci. USA.74:623–627.
Rıos, E., M. D. Stern, A. Gonza´lez, G. Pizzarro, and N. Shirokova. 1999.Calcium release flux underlying Ca21 sparks of frog skeletal muscle.J. Gen. Physiol.114:31–48.
Ross, S. 1976. A first course in probability. Macmillan, New York.Rousseau, E., and G. Meissner. 1989. Single cardiac sarcoplasmic reticu-
lum Ca21-release channel: activation by caffeine.Am. J. Physiol. HeartCirc. Physiol.256:H328–H333.
Satoh, H., L. A. Blatter, and D. M. Bers. 1997. Effects of [Ca21]i, SR Ca21
load, and rest on Ca21 spark frequency in ventricular myocytes.Am. J. Physiol. Heart Circ. Physiol.272:H657–H668.
Shacklock, P. S., W. G. Wier, and C. W. Balke. 1995. Local Ca21 tran-sients (Ca21 sparks) originate at transverse tubules in rat heart cells.J. Physiol.487:601–608.
Smith, G. D., J. E. Keizer, M. D. Stern, W. J. Lederer, and H. Cheng. 1998.A simple numerical model of calcium spark formation and detection incardiac myocytes.Biophys. J.75:15–32.
Stern, M. D. 1992. Theory of excitation–contraction coupling in cardiacmuscle.Biophys. J.63:497–517.
Wussling, M. H., K. Scheufler, S. Schmerling, and V. Drygalla. 1997.Velocity–curvature relationship of colliding spherical calcium waves inrat cardiac myocytes.Biophys. J.73:1232–1242.
120 Izu et al.
Biophysical Journal 80(1) 103–120