seismic vulnerability asssessment of reinforced concrete
274
SEISMIC VULNERABILITY ASSSESSMENT OF REINFORCED CONCRETE SCHOOL BUILDINGS IN TURKEY A THESIS SUBMITTED TO THE GRADUATE SCHOOL OF NATURAL AND APPLIED SCIENCES OF MIDDLE EAST TECHNICAL UNIVERSITY BY LEVENT MAZILIGÜNEY IN PARTIAL FULFILLMENT OF THE REQUIREMENTS FOR THE DEGREE OF DOCTOR OF PHILOSOPHY IN CIVIL ENGINEERING OCTOBER 2020
-
Upload
khangminh22 -
Category
Documents
-
view
0 -
download
0
Transcript of seismic vulnerability asssessment of reinforced concrete

SEISMIC VULNERABILITY ASSSESSMENT OF REINFORCED CONCRETE
SCHOOL BUILDINGS IN TURKEY
A THESIS SUBMITTED TO
THE GRADUATE SCHOOL OF NATURAL AND APPLIED SCIENCES
OF
MIDDLE EAST TECHNICAL UNIVERSITY
BY
LEVENT MAZILIGÜNEY
IN PARTIAL FULFILLMENT OF THE REQUIREMENTS
FOR
THE DEGREE OF DOCTOR OF PHILOSOPHY
IN
CIVIL ENGINEERING
OCTOBER 2020


Approval of the thesis:
SEISMIC VULNERABILITY ASSSESSMENT OF REINFORCED
CONCRETE SCHOOL BUILDINGS IN TURKEY
submitted by LEVENT MAZILIGÜNEY in partial fulfillment of the requirements
for the degree of Doctor of Philosophy in Civil Engineering, Middle East
Technical University by,
Prof. Dr. Halil Kalıpçılar
Dean, Graduate School of Natural and Applied Sciences
Prof. Dr. Ahmet Türer
Head of the Department, Civil Engineering
Prof. Dr. Ahmet Yakut
Supervisor, Civil Engineering Department, METU
Examining Committee Members:
Prof. Dr. Barış Binici
Civil Engineering Department, METU
Prof. Dr. Ahmet Yakut
Civil Engineering Department, METU
Prof. Dr. Kurtuluş Soyluk
Civil Engineering Department, Gazi University
Prof. Dr. Murat Altuğ Erberik
Civil Engineering Department, METU
Prof. Dr. Özgür AVŞAR
Civil Engineering Department, Eskişehir Technical University
Date: 21.10.2020

iv
I hereby declare that all information in this document has been obtained and
presented in accordance with academic rules and ethical conduct. I also declare
that, as required by these rules and conduct, I have fully cited and referenced
all material and results that are not original to this work.
Name, Last name : Levent Mazılıgüney
Signature :

v
ABSTRACT
SEISMIC VULNERABILITY ASSESSMENT OF REINFORCED
CONCRETE SCHOOL BUILDINGS IN TURKEY
Mazılıgüney, Levent
Doctor of Philosophy, Civil Engineering
Supervisor : Prof. Dr. Ahmet Yakut
October 2020, 250 pages
The walk-down and preliminary seismic vulnerability assessment procedures for
low-to-mid-rise RC school buildings are examined by detailed analysis. The
correlation of significant damage-inducing parameters and the performance is
studied by using results obtained from detailed analysis. The databases of the
Ministry of Environment and Urban Planning and the Governorship of İstanbul are
used for this study. 321 RC School buildings that were assessed using the 2007
Turkish Earthquake Code were employed. The parameters used for walk-down and
preliminary analysis methods are analyzed statistically for the databases used. A
representative database of buildings consisting of 36 buildings from different heights
was formed. All 36 RC school buildings are also analyzed by 2013 and 2019 versions
of Urban Renewal Law and 2007 and the new (2018) version of the Turkish EQ
Code. Fragility analysis for 3, 4, and 5-story RC school buildings are studied, and
Fragility Curves are formed using both bilinear and stiffness and strength
degradation (Modified Clough) material models. Obtained F.C.s are validated by the
observed performance data of RC school buildings after 2003 Bingöl EQ F.C.s are
formed for repeated EQs. Therefore, the study provides a wide and reliable database
for seismic vulnerability assessment of RC school buildings in Turkey.
Keywords: Earthquake, Performance, Vulnerability, Fragility, School

vi
ÖZ
TÜRKİYE’DEKİ BETONARME OKUL BİNALARININ DEPREM
PERFORMANLARININ BELİRLENMESİ
Mazılıgüney, Levent
Doktora, İnşaat Mühendisliği
Tez Yöneticisi: Prof. Dr. Ahmet Yakut
Ekim 2020, 250 sayfa
Tez çalışması kapsamında, alçak ve orta yükseklikteki betonarme okul binaları için
sokak taraması ve ikinci kademe deprem davranışı belirleme yöntemleri detaylı
analizler kullanılarak incelenmiştir. Hasara neden olan belirgin etkenlerle hasar
arasındaki ilişki detaylı analizlerden elde edilen sonuçlar kullanılarak araştırılmıştır.
Çalışma kapsamında, Çevre ve Şehircilik Bakanlığı ve İstanbul Valiliği’nin
verilerinden faydalanılmıştır. 2007 Türk Deprem Yönetmeliğine göre analiz edilen
321 betonarme okul binası kullanılmıştır. Sokak taraması ve ön değerlendirme
yöntemlerinde kullanılan parametreler, incelenen binalar için istatistiksel olarak
analiz edilmiştir. Farklı yüksekliklerde 36 binadan oluşan temsili bir bina seti
oluşturulmuştur. 36 okul binasının tamamı Riskli Yapı Tespit Esasları 2012 ve 2019
versiyonlarına göre ve 2007 ve (2018) Türkiye Bina Deprem Yönetmeliği’ne göre
analiz edilmiştir. 3, 4 ve 5 katlı betonarme okul binaları için hasar görebilirlik
analizleri çalışılmış ve kırılganlık eğrileri iki doğrulu ve dayanım ve rijitlik azaltımlı
(Modifiye Clough) malzeme modelleri kullanılarak oluşturulmuştur. Elde edilen
kırılganlık eğrileri 2003 Bingöl depremi sonrası betonarme okul binalarından elde
edilen performans verileri ile karşılaştırılmıştır. Tekrar eden depremler için
kırılganlık eğrileri oluşturulmuştur. Sonuç olarak, bu çalışma Türkiye’deki
betonarme okul binalarının deprem güvenliği açısından geniş ve güvenilir bir veri
tabanı sağlamaktadır.
Anahtar Kelimeler: Deprem, Performans, Hassasiyet, Kırılganlık, Okul

vii
To my daughters, Nazlı Hilâl, Azrâ, and Bernâ
They are the brightest lights of my sky, even in the darkest nights of life.

viii
ACKNOWLEDGMENTS
The author wishes to express his deepest gratitude to his supervisor Prof. Dr. Ahmet
Yakut, for his guidance, advice, criticism, encouragement, and insight throughout
the research.
The author would also like to thank Prof. Dr. Barış Binici, Prof.Dr. Murat Altuğ
Erberik, Prof. Dr. Kurtuluş Soyluk, Prof. Dr. Özgür Avşar and Asst. Prof. Dr.
Mehmet Gesoğlu for their suggestions and comments.
The technical assistance of so many colleagues who also supported this work is
gratefully acknowledged. The invaluable time and support provided by my
colleagues Vesile Hatun Akansel, Koray Kadaş, and İlker Kalem will always be
remembered by gratitude.
The author wishes to express his special thanks to Mr. Kazım Gökhan ELGİN, the
director of İstanbul Project Coordination Unit, for his grateful support and
encouragement. The efforts of all engineers and administrative staff of the İstanbul
Project Coordination Unit for a safer İstanbul and a safer Turkey are beyond any
appreciation.
Finally, I wish to dedicate this study to my family. Their enduring love,
unconditional support, and encouragement have been the real inspiration that I
always felt for this study, and every good thing I do throughout my life.

ix
TABLE OF CONTENTS
1.
ABSTRACT .......................................................................................................... v
ÖZ ........................................................................................................................ vi
ACKNOWLEDGMENTS .................................................................................. viii
TABLE OF CONTENTS ...................................................................................... ix
LIST OF TABLES .............................................................................................. xiii
LIST OF FIGURES ............................................................................................ xvi
LIST OF ABBREVIATIONS .............................................................................. xx
LIST OF SYMBOLS ......................................................................................... xxii
CHAPTERS
1 INTRODUCTION ......................................................................................... 1
1.1 Background and Research Significance ................................................... 1
1.2 Literature Survey ................................................................................... 10
1.3 Seismic Performance and Properties of RC Buildings in Turkey ............ 23
1.4 Object and Scope ................................................................................... 33
1.5 Organization of the Dissertation............................................................. 36
2 BUILDING DATABASE ............................................................................ 39
2.1 Description of the Buildings Database in the Study ................................ 39
2.2 Properties of Selected 36 RC School Buildings ...................................... 52
3 WALK-DOWN AND PRELIMINARY ASSESSMENT.............................. 55
3.1 Introduction to Walk-down and Preliminary Assessment ....................... 55

x
3.2 Assessment with Existing Methods ........................................................ 58
3.3 Proposed Preliminary Assessment Method ............................................. 71
4 DETAILED ASSESSMENT ........................................................................ 77
4.1 Introduction to Detailed Assessment Procedures .................................... 77
4.2 Modeling and Pushover Analysis of RC School Buildings ..................... 82
4.3 Bilinearization and Obtaining Equivalent SDOF Parameters .................. 89
4.4 The Structural Parameters of School Buildings ...................................... 93
4.5 Determination of Performance Limit States ........................................... 99
4.6 Assessment Using Target Displacements of Displacement Coefficient
Method .......................................................................................................... 104
4.7 Assessment by ASCE 41 Analysis ....................................................... 111
5 ASSESSMENT BY TURKISH BUILDING EARTHQUAKE CODE ........ 115
5.1 Introduction to TBEC-2018 for RC School Buildings .......................... 115
5.2 Assessment of Selected RC School Buildings by TBEC-2018.............. 122
5.3 Discussion of Results ........................................................................... 129
6 ASSESSMENT BY PROVISIONS UNDER URBAN RENEWAL LAW .. 133
6.1 Assessment by Provisions Published in 2013 ....................................... 133
6.2 Assessment by Provisions Published in 2019 ....................................... 136
6.3 Discussion of Results ........................................................................... 139
7 DEVELOPMENT OF FRAGILITY CURVES ........................................... 143
7.1 Introduction to Fragility Curves ........................................................... 143
7.2 Ground Motion Data ............................................................................ 150
7.3 Generation of Fragility Curves ............................................................. 155
7.3.1 F.C.s wrt. PGV Using Bilinear Material Model ............................. 158

xi
7.3.2 F.C.s wrt PSA Using Bilinear Material Model .............................. 161
7.3.3 F.C.s wrt. PGV using Modified Clough Material Model ............... 164
7.3.4 F.C.s wrt. PSA Using Modified Clough Material Model ............... 170
7.3.5 Discussion and Comparison of F.C.s............................................. 172
7.4 Comparison of F.C.s with Bingöl Database .......................................... 177
7.5 Fragility Curves under Repeated Earthquakes wrt. PGV ...................... 181
7.6 Discussion of Results ........................................................................... 189
8 CONCLUSIONS AND RECOMMENDATIONS ...................................... 191
8.1 Summary of the Work Done ................................................................ 191
8.2 Conclusions ......................................................................................... 192
8.3 Recommendations ............................................................................... 201
REFERENCES .................................................................................................. 203
APPENDICES
A. Determined Properties of the Database Consisting of 321 RC School
Buildings ....................................................................................................... 235
B. Properties of Selected 36 RC School Buildings .................................... 236
C. Structural Parameters of Selected Buildings ......................................... 237
D. Equivalent SDOF Parameters of Selected Buildings ............................ 243
E. Assessment Reports of Selected RC School Buildings Performed by
ProtaStructure Software under TBEC-2018 .................................................... 244
F. Assessment Reports of Selected RC School Buildings Performed by
ProtaStructure Software under URL Provisions Published in 2013 ................. 245
G. Assessment Reports of Selected RC School Buildings Performed by
ProtaStructure Software under URL Provisions Published in 2019 ................. 246
H. Ground Motion Data ............................................................................ 247

xii
CURRICULUM VITAE .................................................................................... 249

xiii
LIST OF TABLES
Table 1-1 The institutional distribution of damaged educational institutions after
1999 EQs (Özmen, 2000)....................................................................................... 2
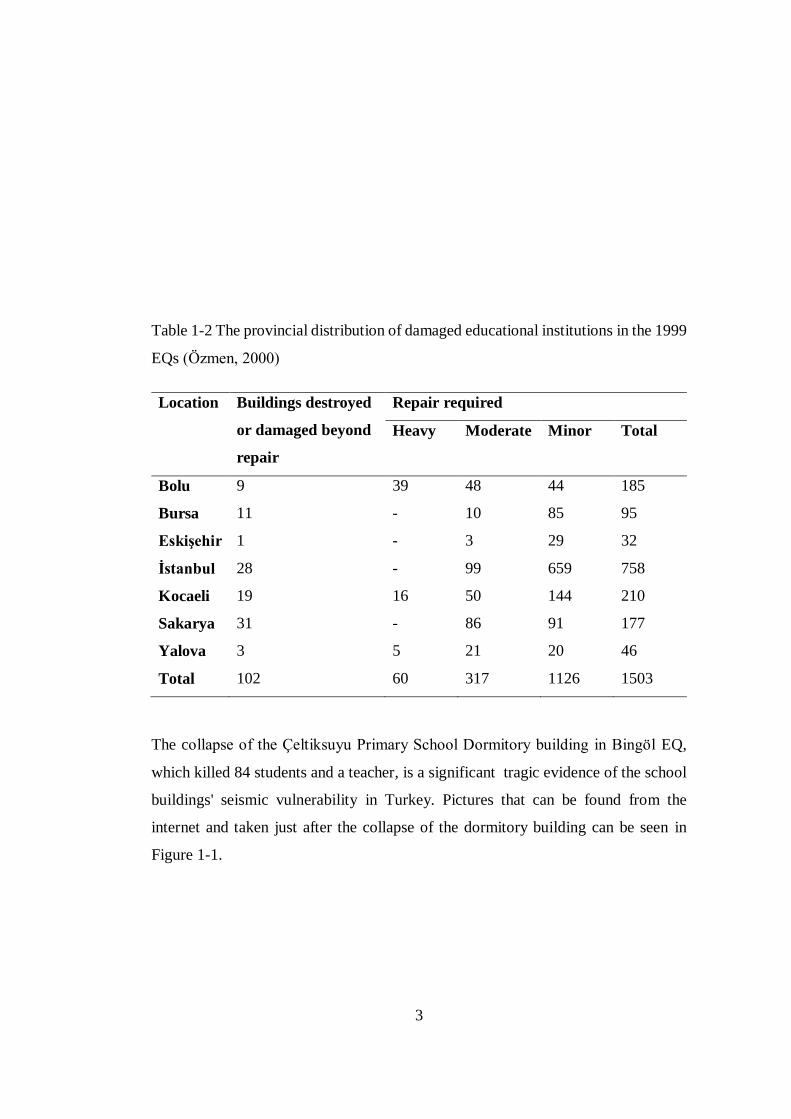
Table 1-2 The provincial distribution of damaged educational institutions in the
1999 EQs (Özmen, 2000)....................................................................................... 3
Table 1-3 EQs and damages to school facilities (Wisner, 2006) ............................. 5
Table 1-4 The statistical information on education in Turkey (2018-2019) (TUIK,
2019) ..................................................................................................................... 6
Table 1-5 Vulnerability creating characteristics for school buildings (Rodgers,
2012) ................................................................................................................... 15
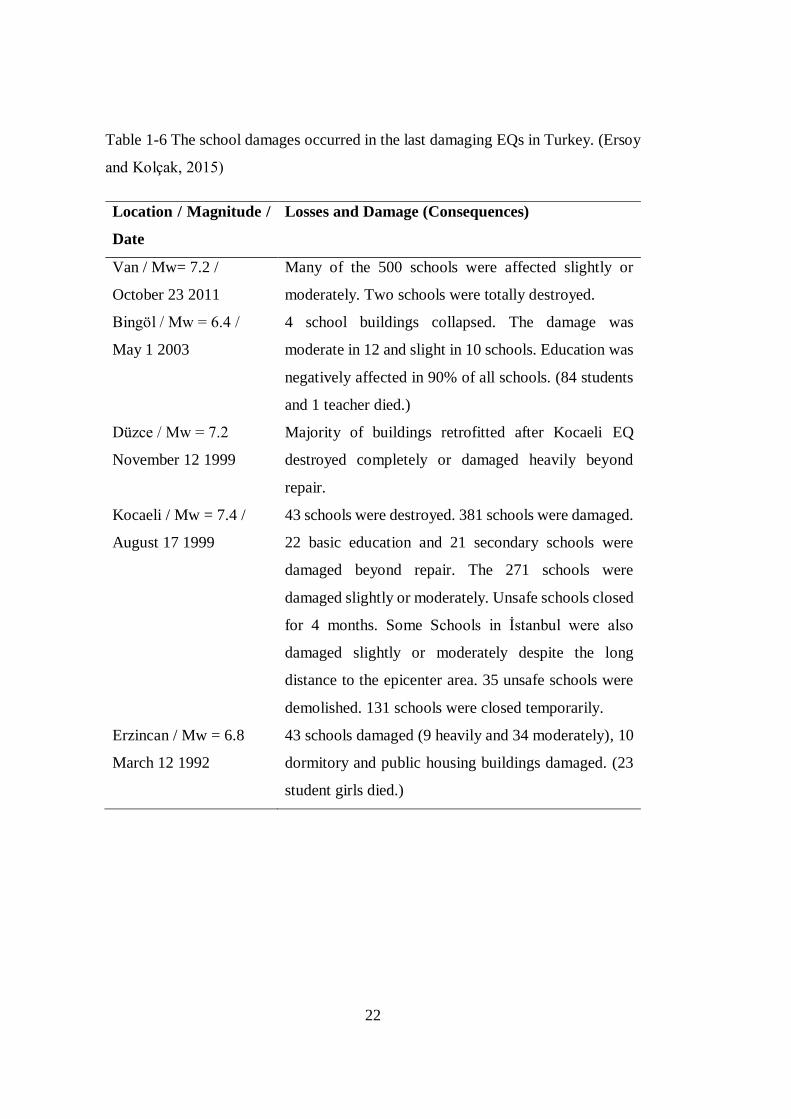
Table 1-6 The school damages occurred in the last damaging EQs in Turkey.
(Ersoy and Kolçak, 2015) .................................................................................... 22
Table 1-7 Conditions depending on ηci values (TEC 2007) ................................... 26
Table 1-8 Statistics of Capacity Curve Parameters (Yakut, 2008) ......................... 32
Table 2-1 General parameters of school buildings in the database. ....................... 41
Table 2-2 Average periods of buildings with respect to story numbers. ................ 43
Table 2-3 Number of stories of the school buildings in the database ..................... 44
Table 2-4 Number of school buildings having irregularities ................................. 47
Table 3-1 Evaluation of ATC-21 (FEMA, 1988) procedure with TEC-2007 for IO
10 % case ............................................................................................................ 61
Table 3-2 Evaluation of ATC-21(FEMA, 1988) procedure with TEC-2007 for LS 2
% case ................................................................................................................. 62
Table 3-3 Evaluation of Sucuoğluand Yazgan (2003) procedure with TEC-2007 for
IO 10 % case ....................................................................................................... 62
Table 3-4 Evaluation of Sucuoğlu and Yazgan (2003) procedure with TEC-2007
for LS 2 % case.................................................................................................... 63

xiv
Table 3-5 Evaluation of Sucuoğlu et al. (2007) procedure with TEC-2007 for IO 10
% case ................................................................................................................. 63
Table 3-6 Evaluation of Sucuoğlu et al. (2007) procedure with TEC-2007 for LS 2
% case ................................................................................................................. 64
Table 3-7 Evaluation of Hassan and Sözen procedure with TEC-2007 for IO 10 %
case...................................................................................................................... 64
Table 3-8 Evaluation of Hassan and Sözen procedure with TEC-2007 for LS 2 %
case...................................................................................................................... 65
Table 3-9 Evaluation of Özcebe et al. (2003) procedure with TEC-2007 for IO 10
% case ................................................................................................................. 66
Table 3-10 Evaluation of Özcebe et al. (2003) procedure with TEC-2007 for LS 2
% case ................................................................................................................. 67
Table 3-11 Evaluation of Yakut (2004) procedure (including walls) with TEC-2007
for IO 10 % case .................................................................................................. 67
Table 3-12 Evaluation of Yakut (2004) procedure (including walls) with TEC-2007
for LS 2 % case .................................................................................................... 68
Table 3-13 Evaluation of Yakut (2004) procedure (excluding walls) with TEC-
2007 for IO 10 % case ......................................................................................... 68
Table 3-14 Evaluation of Yakut (2004) procedure (excluding walls) with TEC-
2007 for LS 2 % case ........................................................................................... 69
Table 3-15 Comparison of assessment procedures with TEC-2007 for school
buildings .............................................................................................................. 70
Table 3-16 Penalties for structural irregularities ................................................... 74
Table 3-17 Evaluation of proposed procedure with TEC-2007 for LS 2 % case .... 75
Table 3-18 Evaluation of proposed procedure with TEC-2007 for IO 10 % case .. 75
Table 4-1 Requirements of performance states given in TEC-2007 ...................... 80
Table 4-2 Statistics of Capacity Curve Parameters for 3 Story RC Buildings ........ 95
Table 4-3 Statistics of Capacity Curve Parameters for 4 Story RC Buildings ........ 96
Table 4-4 Statistics of Capacity Curve Parameters for 5 Story RC Buildings ........ 97
Table 4-5 Performance state definitions (FEMA 356, 2000; Ay, 2006) .............. 101

xv
Table 4-6 The average performance limits for RC school buildings ................... 103
Table 4.7 The average drift ratio limits for RC school buildings ......................... 104
Table 4-8 Values for Coefficient C0 (FEMA 356, 2000)..................................... 105
Table 4-9 Values for Effective Mass Factor (Cm) (FEMA 356, 2000) ................. 106
Table 4-10 The comparison of DCM and TEC-2007 10% EQ ............................ 108
Table 4-11 The comparison of DCM and TEC-2007 for 2% EQ ........................ 109
Table 4-12 The comparison of ASCE-41 and TEC-2007 for 10% EQ ................ 113
Table 5-1 Performance targets and design procedures for new buildings (TBEC-
2018) ................................................................................................................. 120
Table 5-2 Performance targets and design procedures for existing buildings
(TBEC-2018) ..................................................................................................... 121
Table 5-3 Control of the linear analysis method as per TBEC-2018 (I: Invalid and
V: Valid) ........................................................................................................... 124
Table 5-4 Performances of the RC school buildings as per TBEC-2018 ............. 126
Table 5-5 Performances of the RC school buildings as per TBEC-2018 under
design EQ .......................................................................................................... 128
Table 5-6 Comparison of base shear force ratios ................................................ 130
Table 6-1 Risk assessment of the buildings as per URL-2013 ............................ 135
Table 6-2 Risk assessment of the buildings as per URL-2019 ............................ 138
Table 6-3 Comparing the risk assessments as per URL 2013 and 2019 .............. 141
Table 6.4 Comparison of assessment results for EQ level DD2 .......................... 142
Table 7-1 Features and Limitations of F.C.s (Kwon and Elnashai, 2006)............ 149
Table 7-2 Statistical Properties of Selected GM Set ........................................... 152
Table 7-3 Key points of force-deformation envelope of peak oriented models
(Altoontash, 2004) ............................................................................................. 167
Table 7-4 Parameters used in the OPENSEES software for Modified Clough peak
oriented material model ..................................................................................... 168
Table 7-5 Comparison of observed and derived fragility data ............................. 180

xvi
LIST OF FIGURES
Figure 1-1. Photographs taken from the dormitory building of Çeltiksuyu Basic
Education School collapsed during the 2003 Bingöl EQ ......................................... 4
Figure 1-2. Obstacles to good quality construction in Turkey (Gülkan, 2004) ...... 13
Figure 1-3. Typical Capacity Curve (HAZUS, 1997) ........................................... 30
Figure 1-4. Selected capacity curves for 2, 3, 4, and 5 story buildings in Turkey
(Akkar et al., 2005). ............................................................................................. 33
Figure 2-1. The distribution of date of construction of RC school buildings ......... 42
Figure 2-2. The distribution of concrete compressive strengths (MPa) ................. 43
Figure 2-3. The distribution of continuous frames in the long direction of RC
school buildings (Nx) ........................................................................................... 45
Figure 2-4. The distribution of continuous frames in the short direction of RC
school buildings (Ny) ........................................................................................... 46
Figure 2.5. Concrete compressive strengths of RC school buildings which do not
satisfy IO performance state for the design EQ (%10 in 50 years) ........................ 48
Figure 2.6. Concrete compressive strengths of RC school buildings which do not
satisfy IO performance state for the maximum expected EQ (%2 in 50 years) ...... 49
Figure 2.7. Concrete compressive strengths of RC school buildings which satisfy
IO performance state for the design EQ (%10 in 50 years) ................................... 49
Figure 2.8. Concrete compressive strengths of RC school buildings which satisfy
LS performance state for the maximum expected EQ (%2 in 50 years) ................ 50
Figure 2.9. Percentages of unsatisfactory buildings for design and maximum
expected EQs ....................................................................................................... 51
Figure 2.10. Deviance table (screenshot) of logistic regression analysis for design
EQ ....................................................................................................................... 52
Figure 2.11. Deviance table (screenshot) of logistic regression analysis for design
EQ ....................................................................................................................... 52
Figure 4-1. Schematic description of damage limit states (TEC-2007) ................. 79

xvii
Figure 4-2. Modeled default moment-rotation relationship (Yakut, 2008) ............ 86
Figure 4-3. Schematic description of pushover analysis (Ay, 2006)...................... 87
Figure 4-4. Obtained Pushover Curve of Structure (Kalem, 2010) ........................ 88
Figure 4-5. Idealized Bilinear Force-Displacement Curve (FEMA 356, 2000)...... 91
Figure 4-6. Assumed performance limits for performance states (Kalem, 2010) . 103
Figure 5-1. Design spectrum illustration in TBEC-2018 ..................................... 116
Figure 5-2. Design spectrum equations in TBEC-2018 ....................................... 117
Figure 5-3. Categorization regarding the building use, seismic design, and building
height in TBEC-2018 (Sucuoğlu, 2018) ............................................................. 119
Figure 7-1. Schematic representation of generating an F.C. (Avşar, 2009) ......... 145
Figure 7.2. Histogram of Ms of GM records ...................................................... 153
Figure 7.3. Histogram of CD of GM records ...................................................... 153
Figure 7-4. Original PGV distribution of the GM records ................................... 154
Figure 7-5. The methodology used for the generation of F.C.s ........................... 157
Figure 7-6. F.C. for 3 story RC school buildings using bilinear material model wrt.
PGV .................................................................................................................. 160
Figure 7-7. F.C. for 4 story RC school buildings using bilinear material model wrt.
PGV .................................................................................................................. 160
Figure 7-8. F.C. for 5 story RC school buildings using bilinear material model wrt.
PGV .................................................................................................................. 161
Figure 7-9. F.C. for 3 story RC school buildings using bilinear material model wrt.
PSA ................................................................................................................... 162
Figure 7-10. F.C. for 4 story RC school buildings using bilinear material model
wrt. PSA ............................................................................................................ 163
Figure 7-11. F.C. for 5 story RC school buildings using bilinear material model
wrt. PSA ............................................................................................................ 163
Figure 7-12. Loading envelope for peak oriented models (Ibarra, 2013) ............. 166
Figure 7-13. Modified Clough peak oriented material model (Altoontash, 2004) 166
Figure 7-14. F.C. for 3 story RC school buildings using Modified Clough peak
oriented material model wrt. PGV ...................................................................... 169
xviii
Figure 7-15. F.C. for 4 story RC school buildings using Modified Clough peak
oriented material model wrt. PGV ...................................................................... 169
Figure 7-16. F.C. for 5 story RC school buildings using Modified Clough peak
oriented material model wrt. PGV ...................................................................... 170
Figure 7-17. F.C. for 3 story RC school buildings using Modified Clough material
model wrt. PSA ................................................................................................. 171
Figure 7-18. F.C. for 4 story RC school buildings using Modified Clough material
model wrt. PSA ................................................................................................. 171
Figure 7-19. F.C. for 5 story RC school buildings using Modified Clough material
model wrt. PSA ................................................................................................. 172
Figure 7-20. Comparison of F.C.s generated by Bilinear and Modified Clough
Material Models wrt. PGV for 3 story RC school buildings ................................ 173
Figure 7-21. Comparison of F.C.s generated by Bilinear and Modified Clough
Material Models wrt. PGV for 4 story RC school buildings ................................ 173
Figure 7-22. Comparison of F.C.s generated by Bilinear and Modified Clough
Material Models wrt. PGV for 5 story RC school buildings ................................ 174
Figure 7-23. Comparison of F.C.s generated by Bilinear and Modified Clough
Material Models wrt. PSA for 3 story RC school buildings ................................ 175
Figure 7-24. Comparison of F.C.s generated by Bilinear and Modified Clough
Material Models wrt. PSA for 4 story RC school buildings ................................ 175
Figure 7-25. Comparison of F.C.s generated by Bilinear and Modified Clough
Material Models wrt. PSA for 5 story RC school buildings ................................ 176
Figure 7-26. Photo of the Çeltiksuyu Primary School after the May 1, 2003, Bingöl
EQ ..................................................................................................................... 178
Figure 7-27. Active faults of the Bingöl region and the centers of main and
aftershocks of May 1, 2003 EQ (Özcebe et al., 2003) ......................................... 179
Figure 7-28. Fragility surfaces for 3 story RC school buildings .......................... 183
Figure 7-29. Contour plots of the limit state IO (for 3 story RC school buildings)
.......................................................................................................................... 183
xix
Figure 7-30. Contour plots of the limit state LS (for 3 story RC school buildings)
.......................................................................................................................... 184
Figure 7-31. Contour plots of the limit state CP (for 3 story RC school buildings)
.......................................................................................................................... 184
Figure 7-32. Fragility surfaces for 4 story RC school buildings .......................... 185
Figure 7-33. Contour plots of the limit state IO (for 4 story RC school buildings)
.......................................................................................................................... 185
Figure 7-34. Contour plots of the limit state LS (for 4 story RC school buildings)
.......................................................................................................................... 186
Figure 7-35. Contour plots of the limit state CP (for 4 story RC school buildings)
.......................................................................................................................... 186
Figure 7-36. Fragility surfaces for 5 story RC school buildings .......................... 187
Figure 7-37. Contour plots of the limit state IO (for 5 story RC school buildings)
.......................................................................................................................... 187
Figure 7-38. Contour plots of the limit state LS (for 5 story RC school buildings)
.......................................................................................................................... 188
Figure 7-39. Contour plots of the limit state CP (for 5 story RC school buildings)
.......................................................................................................................... 188

xx
LIST OF ABBREVIATIONS
ABBREVIATIONS
ADRS Acceleration displacement response spectra
AFAD Disaster and Emergency Management Presidency of Turkey
ASCE American Society of Civil Engineers
ASCE/SEI Structural Engineering Institute of American Society of Civil
Engineers
ATC Applied Technology Council
BCPI Basic capacity index
BKS Building use category
BSS Basic structural score
BYS Building height category
C Collapse
CD Controlled Damage
CO Continued Operation
CP Collapse prevention
DCM Displacement Coefficient Method
DTS Seismic design category
EI Energy index
EPA Effective peak acceleration
EQ Earthquake
EQs Earthquakes
ESDOF Equivalent single degree of freedom
FBD Force based design
F.C. Fragility curve
F.C.s Fragility curves
FEMA Federal Emergency Management Agency
GM Ground motion

xxi
HAZUS Hazard United States
IM Intensity measure
IO Immediate occupancy
ISMEP İstanbul Seismic Risk Mitigation and Emergency Preparedness
Projects
IPCU İstanbul Project Coordination Unit
LD Limited Damage
LS Life Safety
MDOF Multi degree of freedom
METU Middle East Technical University
PBD Performance-Based assessment and re-Design
PGA Peak ground acceleration
PGV Peak ground velocity
PS Performance score
PSA Peak spectral acceleration
RC Reinforced concrete
S Satisfactory
SVA Seismic vulnerability assessment
SDOF Single degree of freedom
TBEC Turkish Building Earthquake Code
TEC Turkish Earthquake Code
TS Turkish Standards
TSS Total structural score
U Unsatisfactory
URL Urban Renewal Law

xxii
LIST OF SYMBOLS
SYMBOLS
Ac Total cross-section area of the concrete columns
Am Total cross-section area of the masonry walls
As Total cross-section area of the shear walls
C0 Coefficient that converts the SDOF spectral displacement to MDOF
(elastic) roof displacement
C1 Coefficient for modifying the elastic displacement to the
corresponding inelastic displacement
C2 Coefficient that incorporates the effects of pinched hysteretic shape,
stiffness degradation and strength deterioration
C3 Coefficient that reflects the increase in the displacements due to
dynamic P-Δ effects
cA A positive value used as the calibration exponent in the hysteretic
energy deterioration model, used for accelerated stiffness loss
deterioration
cD A positive value used as the calibration exponent in the hysteretic
energy deterioration model, used for capping deterioration
Cs Design strength coefficient (fraction of building weight)
cS A positive value used as the calibration exponent in the hysteretic
energy deterioration model, used for strength deterioration
cK A positive value used as the calibration exponent in the hysteretic
energy deterioration model, used for stiffness deterioration
Cm effective mass factor
D Damage (response)
DLSi Damage Limit State i

xxiii
Fy Yield force
Fy+ A positive value for the yield strength in positive direction
Fy− A negative value for the yield strength in negative direction
g Gravitational acceleration
IMj Ground motion level with an intensity measure of j
Ki Elastic initial stiffness
Ke Elastic effective stiffness
Ms Surface magnitude
K* Effective stiffness of Equivalent SDOF system
M* Effective mass of Equivalent SDOF system
PF Participation factor
PF1 Modal participation factor for the first fundamental mode
R Structural behavior factor
R Residual stress ratio as a fraction of yield strength (for OPENSEES
software)
S1 Spectral acceleration at 1.0 second
Sa Spectral acceleration
Say Yield spectral acceleration
Sau Ultimate spectral acceleration
Sd Spectral displacement
Sdy Yield spectral displacement
Sdu Ultimate spectral displacement
SS Spectral acceleration at 0.2 second
tag Integer identifier used to tag the material model
Te Effective building period
Ti Elastic initial period (period of the first mode)
V Base shear force
Vy Base shear force at yield
W Weight of the structure
α Modal weight factor

xxiv
α1 Modal mass coefficient for the first fundamental mode
αcap A negative value for the cap slope ratio as a fraction of stiffness
αh Isotropic hardening ratio as a fraction of elastic stiffness
d Demand displacement
Δroof Roof displacement
Δteff Effective duration of eartquake
γ Yield over-strength ratio
Ultimate over-strength ratio
λA A positive ratio for calculating the ultimate energy in the hysteretic
energy deterioration model, used for accelerates stiffness loss
deterioration
λD A positive ratio for calculating the ultimate energy in the hysteretic
energy deterioration model, used for capping deterioration
λK A positive ratio for calculating the ultimate energy in the hysteretic
energy deterioration model, used for stiffness deterioration
λS A positive ratio for calculating the ultimate energy in the hysteretic
energy deterioration model, used for strength deterioration
μ Ductility ratio
ϕroof,1 Amplitude of the first mode at the level of roof
δcap+ Positive value for the cap displacement on positive side
δcap− Negative value for the cap displacement on negative side
δi Average story drift for a given story
ηbi Torsional irregularity factor
ηci Ratio of the effective shear area of any story to the effective shear
area of the story immediately above
Γ1 First mode participation factor

1
CHAPTER 1
1 INTRODUCTION
1.1 Background and Research Significance
Turkey is an earthquake (EQ) prone country located in one of the world's most
seismically active regions. Recent EQs caused severe damage to buildings,
tremendous amounts of economic losses, so many injuries, and, unfortunately, tens
of thousands of human life losses. In EQ-prone countries like Turkey, the building
stock's seismic performance needs to be investigated for mitigation efforts and the
community's resilience.
Recent EQs in Turkey have shown that reinforced concrete (RC) buildings' structural
performance plays a crucial role in terms of EQ losses. The vulnerability of RC
construction to EQ ground motion was clearly apparent during the 1999 İzmit EQ
and its aftermath, where the property losses reached 20 billion US$ and human life
losses exceeded 18,000 (USGS, 2000). RC moment-resisting frame structures
represent approximately 75% of Turkey's building stock (Vona, 2014).
RC school buildings have been observed among the most vulnerable and severely
damaged buildings after August 17, 1999 Marmara (Mw=7,4), November 12, 1999
Düzce (Mw=7,2), May 1, 2003 Bingöl (Mw=6,4) and October 23, 2011 Van
(Mw=7,2) EQs.
Özmen (2000) and the Ministry of Education determined the institutional and
provincial distribution of school facilities damaged in the 1999 EQs, and it is
summarized in Table 1-1 and

2
Table 1-2 below.
Table 1-1 The institutional distribution of damaged educational institutions after
1999 EQs (Özmen, 2000)
Institution Buildings
destroyed or
damaged
beyond repair
Repair required
Heavy Moderate Minor Total
Primary schools 63 33 223 831 1087
Private education - - - 2 2
Secondary education 18 8 46 120 174
Female technical
education
10 7 25 78 110
Trade and tourism
education
1 3 6 25 34
Apprenticeship and
non-formal education
4 4 4 25 33
Teachers’ guesthouse 3 1 3 11 15
Public housing 1 - 2 5 7
Other 2 4 8 29 41
Total 102 60 317 1126 1503
3
Table 1-2 The provincial distribution of damaged educational institutions in the 1999
EQs (Özmen, 2000)
Location Buildings destroyed
or damaged beyond
repair
Repair required
Heavy Moderate Minor Total
Bolu 9 39 48 44 185
Bursa 11 - 10 85 95
Eskişehir 1 - 3 29 32
İstanbul 28 - 99 659 758
Kocaeli 19 16 50 144 210
Sakarya 31 - 86 91 177
Yalova 3 5 21 20 46
Total 102 60 317 1126 1503
The collapse of the Çeltiksuyu Primary School Dormitory building in Bingöl EQ,
which killed 84 students and a teacher, is a significant tragic evidence of the school
buildings' seismic vulnerability in Turkey. Pictures that can be found from the
internet and taken just after the collapse of the dormitory building can be seen in
Figure 1-1.Error! Reference source not found.

4
Figure 1-1. Photographs taken from the dormitory building of Çeltiksuyu Basic
Education School collapsed during the 2003 Bingöl EQ
The situation for school buildings' seismic vulnerability is not much different in
many countries globally, especially in developing countries. As noted in OECD
(2004), ''schools built worldwide routinely collapse in EQs due to avoidable errors
in design and construction, because existing technology is not applied, and existing
laws and regulations are not sufficiently enforced''. Some of the EQs that reveal
school buildings' seismic vulnerability is listed in Table 1-3 (Wisner, 2006).

5
Table 1-3 EQs and damages to school facilities (Wisner, 2006)
Year EQ-
Location
Damage
1999 Chi-Chi-
Taiwan
Destroyed 43 Taiwan schools in the Nantou and Taichung
area, and a total of 700 schools nationwide were
damaged.
2001 Gujarat-India Caused severe damage to 11,600 schools.
2005 Kashmir-
India
Resulted in the collapse of 8000 schools in the North-
West part of the country and 1300 schools in Pakistan-
administered Kashmir. UNICEF stated that in this EQ, at
least 17,000 school children died because children were
attending morning classes.
2008 Sichuan-
China
Caused the death of 19,000 students and the destruction
of about 7000 schools.
The characteristics that generate seismically vulnerable school buildings can be
better understood by the school collapses after EQs. But unfortunately, efforts to
collect and make available detailed data on EQ damage to school buildings have
fallen far short of what is needed (Rodgers, 2012). Focused attention on both pre-EQ
mitigation efforts and post-EQ reconnaissance reports for school buildings is a
necessity.
Approximately 1.2 billion students are enrolled in primary and secondary schools;
of these, 875 million school children live in high seismic risk zones worldwide
(Hancılar et al., 2014). In Turkey, about 30 % of the population are children of
school-age. During daytime hours, these children are mostly within the school
buildings, which are usually vulnerable to EQs.
Some of the statistical information of education in Turkey (schools, teachers, and
students) for the education year of 2018-2019 is given below in Table 1-4 (TUIK,

6
2019). There are also teachers and students (about 1.6 million) in the pre-school
classrooms, which are not listed in the table. Including the administrative staff, there
is approximately 20 million population within the school facilities during the
daytime. There are projections for the year 2023, and it is accepted that 21.2 % of
the population will be under 14 years old and 15.1 % of the population between the
ages of 15 and 24 by the year 2023 (TUIK, 2016), which means Turkey will have
more students and need more schools and teachers by the year 2023.
Table 1-4 The statistical information on education in Turkey (2018-2019) (TUIK,
2019)
2018-2019 Education
Year
Number of
schools
Number of
teachers
Number of
students
Primary School 24,749 300,732 5,267,378
Junior High School 18,395 354,198 5,627,075
Secondary School 12,506 371,234 5,649,594
Total 55,650 1,026,164 16,544,047
Schools play a vital role in the community's social life since they have an essential
role in the educational process. When the schools are closed, education is delayed,
and loss of social and cultural life comes after that (Ersoy and Kolçak, 2015). School
buildings are houses for children during the daytime and serve as emergency shelters
after any kind of disaster. EQ vulnerability assessment of school buildings is a prior
step to avoid losses and increase the emergency preparedness of society.
The calculated duration for an expected major EQ (Mw ≥ 7) in the Sea of Marmara
part of the North Anatolian Fault was probably a maximum of 30 years with the
probability of 20%-65% (Barka, 2000). Two third of the determined duration has
already been consumed, and time is passing rapidly. According to a prediction done
by the Japan International Cooperation Agency (JICA), an EQ of magnitude ranging

7
between 6.9 and 7.7 will occur around İstanbul in the near future (Griffiths et al.
2007).
Decision-makers should urgently exhibit a proactive approach for EQ preparedness
of school buildings. Since children are emotionally and physically delicate, they are
more vulnerable than adults in EQs or any kind of emergency events. Protecting and
defending children urgently during emergency events is the priority not only for
parents but also for governments and regulations. Building a safe and better future
for our children is a priority of the whole society. (Hancilar et al. 2014 & Ersoy and
Kolçak, 2015)
Retrofitting/strengthening of schools or designing them in accordance with the
requirements of the EQ-resistant design codes is considered as a primary objective
in EQ risk reduction strategies due to the high importance of those facilities for the
entire community (Hancılar et al., 2014). Nevertheless, due to economic constraints,
a tiny fraction of the existing school building stock has been upgraded in the frame
of pre-EQ strengthening programs worldwide (Chrysostomou et al., 2015).
Components for developing strategies against the EQ risk are EQ hazard estimation
and seismic vulnerability assessment (SVA). Determination of the vulnerability of
existing engineering structures requires the assessment of seismic performances of
the building stock when subjected to a variety of potential EQs (Özün, 2007). The
expected damage is generally considered as a measure of seismic vulnerability, and
the associated loss caused by EQs can be estimated in this way.
SVA of school buildings located within EQ prone regions and determination of their
performance levels under seismic actions play an essential role in the safety of
children, teachers, and the education system overall. Seismic performance
assessment procedures can be divided into three main categories in the literature.
These are walk-down (street survey), preliminary evaluation procedures, and
detailed assessment procedures.

8
Walk-down or street survey is the quickest and simplest method. Superficial data
(usually composed of deficiencies or irregularities) collected from a quick inspection
of the building is sufficient. Rapid evaluation techniques serve to identify or rank
highly vulnerable buildings by providing a crude index used to rank a group of
buildings to determine their priority for further evaluation. These highly vulnerable
buildings are investigated in detail thereafter, if necessary. (Yakut, 2004 & Kalem,
2010)
When a more reliable and detailed assessment than the walk-down survey is needed,
preliminary assessment techniques are employed. In addition to the data collected
for the walk-down assessment procedures, the size and orientation of the structural
components, material properties, and layout are needed to perform practical and
straightforward functions (Yakut, 2004 & Erduran, 2005).
There are various methods to evaluate the seismic performance of existing buildings
in the world. These methods are established so that they only have an application in
different types of RC buildings constructed in a country. Therefore, the direct
application of them in other countries is not possible (Mohsen, 2012).
Unfortunately, walk-down/street survey or preliminary assessment methods are
generally developed for residential buildings in Turkey. There is not enough data to
test these methods' accuracy for public buildings, including school facilities. In this
study, the accuracy of these methods will be tested based on TEC-2007 assessment
results.
The third category among assessment procedures that involve the in-depth evaluation
of the buildings is the detailed assessment procedures. Linear or nonlinear analyzes
are needed to determine the response quantities in these procedures. In order to
perform the analysis, the geometrical properties of the components, mechanical
properties of the materials, and detailing of the components are needed in addition
to the available data collected for preliminary assessment methods. (Yakut, 2004 &
Erduran, 2005)

9
Detailed analyzes are performed, and assessment results are compared by the results
of TEC-2007 within the study. Detailed analyzes are also performed by TBEC-2018,
and the results are compared by the results of TEC-2007.
Capacity curves are developed through parameters obtained with nonlinear analysis.
The reliability and accuracy of the capacity curves have a significant role in seismic
loss estimation studies. These curves directly affect building vulnerability and,
Consequently, the EQ losses. They are recommended to be used in loss estimation,
risk assessment, and quick evaluation studies for RC frame buildings. (Yakut, 2008)
Although comprehensive research is devoted to RC residential buildings' seismic
vulnerabilities in Turkey, a similar endeavor has not been given to RC school
buildings. Therefore, this study focuses on determining capacity curve parameters
and the validity of existing assessment procedures for Turkey's school buildings.
SVA of school buildings can be performed based on fragility curves (F.C.s) after
determining the seismic ground motion level that they can be exposed during their
lifetime. F.C.s supply useful information about the relation between the ground
motion intensity and the probability of exceeding a specific damage state.
Fragility based assessment is generally used to evaluate the seismic performance of
building stock. For a successful performance assessment, the country-specific
characteristics should necessarily be taken into account while generating the F.C.s
for the related building structures. Construction practices may differ broadly among
countries, and these differences directly influence the F.C.s of the buildings under
consideration (Özün, 2007).
Structures in seismically active regions can be subjected to repeated earthquakes
during their lifetimes before strengthening or by aftershocks. Damage accumulation
in their structural systems could be observed during these events. School buildings
encountering such occasions without being retrofitted after the first event might lead
to catastrophic cases, including increased fatality rates. (Mazılıgüney et al., 2017).

10
F.C.s for RC School Buildings due to repeated EQs are also derived, which are
thought to be useful for rapid decisions for using structures after EQs.
"Urban Renewal Law" of Turkey, which has been in action since May 2012 for risk
mitigation, focuses on reducing the expected seismic risk due to the vulnerability of
existing buildings. For this purpose, new provisions are set forth to investigate and
classify seismically vulnerable residential buildings as quickly as possible. (Binici et
al., 2015) Although the provisions are designated for residential buildings mainly,
36 RC school buildings were also analyzed accordingly, and the results are compared
by TEC-2007. Provisions for the seismic risk evaluation of existing RC buildings in
Turkey under the Urban Renewal Law was revised in February 2019. 36 RC school
buildings were also analyzed accordingly, and the results were compared by the
previous ones and TEC-2007 and TBEC-2018.
Turkish EQ Code was substantially revised in 2018, and the new code is in force
since January 2019. 36 RC school buildings were analyzed according to the new EQ
code, and the results were compared by the previous code and by the provisions of
Urban Renewal Law.
Time is running out rapidly for the expected EQ, which is threatening schools,
children, teachers, and the overall society. The future of our children shall not be
sacrificed to EQs.
1.2 Literature Survey
Fast urban growth after the 1970s, substantiating uncontrolled development of the
physical environment, is the primary source of existing EQ vulnerability risks. RC
buildings constitute the majority of the building stock, especially in developing
countries. Due to their poor performance under major EQs occurring in the last
decades, significant research has been initiated to assess the vulnerability of the
existing building stock and provide means of improving the vulnerable buildings'
expected seismic performance (Yakut and Erduran, 2005).

11
Vulnerability parameters and structural irregularities of RC buildings used by quick
performance assessment procedures can be listed as follows;
Number of stories,
Apparent building quality,
Soft-story,
Weak story,
Heavy overhangs,
Short columns,
Pounding between adjacent buildings,
Torsional irregularity,
Plan irregularity,
Vertical irregularity,
Redundancy,
Local soil conditions,
Topographic effects.
In the seismic performance of RC structures, one of the most critical parameters
determining the building's survival is its energy dissipation capacity (Erduran and
Yakut, 2004-2). Parameters used for quick performance assessment procedures also
deal with the building's energy dissipation capacity.
School buildings all over the world have an essential role in the educational process.
Damages to school buildings and losses of lives of teachers and children deeply
affect society. Additionally, school buildings may be used as emergency shelters
after EQs, contributing to the community's resilience. With these aspects, school

12
buildings' seismic vulnerability had taken attention among the EQ engineers, state
authorities, and non-profit organizations.
There have been only a few studies relating to the seismic vulnerability of school
buildings in Turkey, and unfortunately, they were all having limited content and
scope. Some of the considerable studies from Turkey and worldwide are summarized
below shortly.
OECD performed a comprehensive project under the Programme on Educational
Building (PEB) in order to keep schools around the world safe in EQs. OECD work
on school safety and security began in February 2002 with an experts' meeting in
Washington, D.C., USA, and plenty of valuable resources are published within the
project. The OECD PEB financed projects on the safety of school buildings within
the member states. The OECD published a comprehensive report in 2004, and a
chapter named "Obstacles to improving seismic safety of school buildings in Turkey"
was prepared by Prof. Dr. Polat GÜLKAN. Obstacles to good quality construction
in Turkey and observations from a site survey of school buildings after the EQ in
Bingöl are described briefly within the mentioned chapter of Gülkan (2004). Figure
showing the obstacles to good quality construction in Turkey (OECD, 2004) is
copied below because of its importance.

13
Figure 1-2. Obstacles to good quality construction in Turkey (Gülkan, 2004)
Gülkan and Utkutuğ (2003) discussed the Field Law of California and examined the
damage to school buildings in Bingöl after the 2003 EQ Gülkan and Utkutuğ (2003)

14
concluded that the shear walls in both orthogonal directions are the most critical
requirement for the EQ safety of RC school buildings. This requirement should be
obligatory through a code similar to Field Law.
Dilmaç et al. (2018) studied the parameters influencing the seismic performance of
existing RC buildings in Turkey and concluded the compressive strength of concrete
and the transverse reinforcement are the two crucial parameters for EQ safety.
Until recently, the most extensive efforts in implementing school strengthening
programs were made in Japan; some interesting examples of such applications are
given by the Japan Ministry of Education (2006) publication.
Moreover, recent efforts towards setting up large-scale strengthening (also referred
to as retrofit) programs of school buildings, such as that in British Columbia (Ventura
et al., 2012) are useful in that they introduce concepts like performance-based
assessment and compilation of web-based databases of results of advanced analysis
of such buildings, but, to the authors' best knowledge, have not culminated into the
actual implementation of strengthening schemes to even a limited number of schools.
Rodgers (2012) studied the physical characteristics of schools that cause
vulnerability to damage and collapse, using data from EQ damage reports and SVAs
of school buildings. Rodgers (2012) concluded that building configuration, type,
materials and location; construction and inspection practices; and maintenance and
modifications all contribute to building vulnerability. Scarce resources, inadequate
seismic codes, unskilled building professionals, and lack of awareness of EQ risk
and risk reduction measures are the underlying drivers for the vulnerability of
schools as well as other buildings, according to Rodgers (2012).
Rodgers (2012) tabulated the prevalence of characteristics that create vulnerability
by examining 32 EQs and 31 different vulnerability assessment reports worldwide,
including studies from Turkey. The mentioned characteristics are tabulated
concerning different categories below, as Table 1-5.

15
Rodgers (2012) also tabulated the underlying drivers of school vulnerability and
"no construction site inspections" and "engineer of record is paid by the developer,
no independent inspection, no liability" are two impressive underlying drivers from
Turkey which were previously mentioned by Gülkan (2004).
Table 1-5 Vulnerability creating characteristics for school buildings (Rodgers, 2012)
Category Vulnerability creating characteristics
Configuration Large rooms - no cross walls
Plan irregularity due to one-bay wide
Plan irregularity general
Captive (short) columns due to partial height infill walls
Torsion due to windows on one side
Torsion, general
Weakness due to windows - masonry
Soft or weak story
Vertical irregularity, general
Masonry gable walls
Heavy roofs
Structural system
type and
construction
materials
Vulnerable traditional construction
Vulnerable non-engineered non-ductile RC frame
Vulnerable non-engineered brick or block masonry
Vulnerable non-engineered poorly confined masonry
Vulnerable engineered non-ductile RC frame
Vulnerable engineered brick or block masonry
Safer traditional building types abandoned
Standard types/plans have major seismic deficiencies
Lack of seismic design understanding by engineers
Local materials generate weak or brittle buildings
Poor quality engineered materials general

16
Table 1-5 Continued
Category Vulnerability creating characteristics
Location Vulnerable sites / poor soil conditions
Liquefaction
Sloping site/landslides
Cultural practices for site selection
Construction
practices
Unskilled / low-skilled local labor
Builders not aware of EQ-resistant practices
Public contracting low bid rules
Reducing quality to save money or time
Poor construction quality, general
Construction
inspection
Lack of inspection
Corruption of inspection mechanisms
Maintenance Deferred / not done, general
No provision by builder or operator
Modifications SubsEQuent structural modifications
Ineffective retrofits
Falling hazards Facade and exterior
Interior / contents
Exit pathways Inadequate doors, windows, halls/corridors, or stairs

17
Tan and Abdul Rezak (2011) studied the assessment of risk to school buildings
resulting from distant EQs and concluded that the school buildings are safe to enter
after an EQ of magnitude up to a PGA of 0,2g. But concrete compressive strength
and yield strength of steel were accepted to be 25 MPA and 460 MPa, respectively,
so the conclusions cannot be realistic for Turkish school buildings and school
buildings of countries having similar construction practices with Turkey.
Sobaih and Nazif (2012) proposed a methodology for seismic risk evaluation of
existing RC school buildings in Egypt to determine the priority to take action for
mitigation. It is particularly mentioned that the school buildings need a rapid method
to evaluate their seismic risk level and provide a basis for the next steps of the
necessary mitigation process. The proposed methodology evaluates the school
buildings' seismic risk levels by inspecting them, concentrating on the irregularities
(soft-story, plan irregularity, short column, existence of adjacent building, i.e.,
pounding effect, etc.) especially to arrange a Priority List in ascending order of their
seismic risk levels. The proposed method is more or less similar to the walk-down,
and preliminary assessment methods discussed previously.
İnel et al. (2008) studied the seismic performance evaluation of school buildings in
Turkey constructed per pre-modern seismic code (TEC-1975) with the six selected
template designs to represent a significant percentage of school buildings in medium-
size cities located in high seismic regions of Turkey. In the related study, capacity
curves of investigated structures were determined by pushover analysis in two
principal directions, Equivalent SDOF systems represented the inelastic dynamic
characteristics of buildings, and their seismic displacement demands were calculated
under selected ground motions. 10, 13, and 16 MPa concrete compressive strengths
and two (15 and 25 cm) transverse reinforcement spacing were used to consider the
uncertainties of material properties. Member sizes and reinforcements in the
template design were used to model the selected buildings for nonlinear analysis.
Twenty ground motion records from 7 different EQs in Turkey based on PGA were
used for nonlinear time history analysis. Some of the remarkable conclusions of İnel
et al. (2008) are taken below because of their importance;

18
i. Shear walls dominate the building response in buildings with shear wall
area of at least 0,25 % of total building area,
ii. Concrete quality and detailing has a significant role in both displacement
and lateral strength capacity of buildings,
iii. Column shear failures are a common problem for poor concrete and low
amount of transverse reinforcement, resulting in brittle failure for existing
school buildings,
iv. Existing school buildings are far from satisfying the objectives of the
TEC 2007 during a possible EQ,
v. The primary deficiency of existing school buildings is high displacement
demands due to their low load capacities.
İnel et al. (2008) suggested the addition of shear walls as the most practical and
economical solution under the observed circumstances.
In his study, Kalem (2010) focused on determining capacity curve parameters and
the validity of existing assessment procedures for Turkey's school buildings. Kalem
(2010) documented valuable information about SVA of RC school buildings in
Turkey, so his study became a general reference for researchers of this subject.
Rodgers (2012) also referred to the study of Kalem (2010) for the vulnerability
characteristics of RC school buildings in Turkey.
Bilgin (2013) studied the fragility based assessment of public buildings
(administrative centers, health clinics, hospitals, schools, etc.) with representative
template designs in Turkey, indicating that although the used projects of public
buildings reveal minor differences from province to province, they are similar
architecturally. A set of template designs consisting of school and hospital buildings
were analyzed similarly with İnel et al. (2008). Some of the remarkable conclusions
of Bilgin (2013) are taken below because of their importance.

19
i. The probability of exceedance for LS and CP levels of all buildings are
close to each other.
ii. Examination of F.C.s reveals that the collapse probabilities of existing
buildings may change approximately from 30% to 60% between the PGV
values, which fall in the range of 40–70 cm/s.
iii. It can be said that the number of stories has a remarkable effect on the
probability of exceeding moderate and severe damage limit states.
Hancılar et al. (2014) studied the EQ vulnerability of school buildings by
probabilistic structural fragility analysis of four-story (typical project cited as 10403;
there are 55 schools with the same type design in İstanbul) standardized/template
designs. It is mentioned in the related study that methods to account for uncertainties
are desirable because it is very often that school buildings may differ from the
original blueprints. Uncertainties concerning material properties, geometrical
characteristics, etc. are taken into account in different analysis cases wherein the
parameter under consideration is randomly changing in each Monte Carlo
simulation. The accepted concrete compressive strength and steel yield strength were
14,8 Mpa and 220 MPa, respectively. Fragility functions are produced in terms of
PGA and PGV. Hancılar et al. (2014) mentioned that their study highlights the
importance of uncertainties in school buildings' seismic performance assessment.
The uncertainties cause a significant variation in the resulting fragility functions.
Turkey is an EQ-prone country, and especially İstanbul, Turkey's most crowded city,
has a high probability of a severe EQ in the coming years. With the finance of the
World Bank (at the first stages), the Governorship of İstanbul has started a project
named ISMEP to assess the public buildings (schools, hospitals, administrative
buildings, etc.) The Governorship of İstanbul has established an administrative unit
named IPCU to manage the project.

20
The project's primary goals are to improve preparedness for a potential EQ and
retrofit or reconstruction of priority public buildings in İstanbul. ISMEP project
consists of three components:
Component A: Enhancing Emergency Preparedness
Component B: Seismic Risk Mitigation for Priority Public Buildings
Component C: Enforcement of Building Codes (Elgin, 2007)
Within this aspect, a large number of school buildings have been selected for detailed
assessment based on the national EQ code (TEC-2007) to determine their seismic
performance (Yakut et al., 2008).
The project is financed by a World Bank (WB) loan at the beginning and is
implemented through the İstanbul Special Provincial Administration (ISPA). The
ISMEP project started on February 1 1, 2006, and was expected to be completed by
the end of 2010, but extended afterward. The İstanbul Project Coordination Unit
(IPCU), established under ISPA, is responsible for implementing the ISMEP. (IPCU,
2008)
ISMEP has reached a budget of 78 billion euros with the contribution of the
European Investment Bank (EIB), Council of Europe Development Bank (CEB), and
Islamic Development Bank (IDB). By January 2020, more than 900 school buildings
are assessed, 247 are re-built, and 627 are strengthened.
Inadequate structural component detailing, low concrete compressive strength, soft
or weak story created by a non-typical story height, and diaphragm deficiencies are
the generally mentioned common seismic deficiencies of school buildings within the
assessment reports (IPCU, 2008).
Ersoy and Koçak (2015) studied disasters and EQ preparedness of children and
schools in İstanbul in detail by noting the disaster risks in İstanbul, emphasizing the
losses from previous EQs, and summarizing, and evaluating the work done. The
students and the conditions of the schools were evaluated. In this evaluation,

21
population, building stocks, geological threats and risks, assessment of educational
buildings after 1999 Gölcük and Düzce EQs, and preparations against disasters for
children were covered. Ersoy and Koçak mentioned the losses of children and school
teachers and school damages in the last six EQs in Turkey, and damages to schools
are copied below in Table 1-6 because of its importance.
Ersoy and Koçak (2015) concluded that; seismic risk mitigations of school buildings
in İstanbul are not enough for İstanbul and far less than needed.
Ulutaş et al. (2019) concluded that school buildings could hardly satisfy the
performance requirements without at least 2 separate shear walls in both orthogonal
directions. Ulutaş et al. (2019-2) studied the shear wall ratio in school buildings and
concluded that 1.12 %, 1.51 %, 1.79 %, and 2 % of shear wall wrt. floor area is
needed for 2, 3, 4, and 5 story school buildings, respectively, for EQ safe school
buildings.
22
Table 1-6 The school damages occurred in the last damaging EQs in Turkey. (Ersoy
and Kolçak, 2015)
Location / Magnitude /
Date
Losses and Damage (Consequences)
Van / Mw= 7.2 /
October 23 2011
Many of the 500 schools were affected slightly or
moderately. Two schools were totally destroyed.
Bingöl / Mw = 6.4 /
May 1 2003
4 school buildings collapsed. The damage was
moderate in 12 and slight in 10 schools. Education was
negatively affected in 90% of all schools. (84 students
and 1 teacher died.)
Düzce / Mw = 7.2
November 12 1999
Majority of buildings retrofitted after Kocaeli EQ
destroyed completely or damaged heavily beyond
repair.
Kocaeli / Mw = 7.4 /
August 17 1999
43 schools were destroyed. 381 schools were damaged.
22 basic education and 21 secondary schools were
damaged beyond repair. The 271 schools were
damaged slightly or moderately. Unsafe schools closed
for 4 months. Some Schools in İstanbul were also
damaged slightly or moderately despite the long
distance to the epicenter area. 35 unsafe schools were
demolished. 131 schools were closed temporarily.
Erzincan / Mw = 6.8
March 12 1992
43 schools damaged (9 heavily and 34 moderately), 10
dormitory and public housing buildings damaged. (23
student girls died.)

23
1.3 Seismic Performance and Properties of RC Buildings in Turkey
Non-ductile reinforced-concrete moment frame buildings have been prevalent and
are the primary construction type used in Turkey since the early 1900s till 1975. In
1975, with the introduction of a seismic code in Turkey (TEC-1975), RC frame
structures were improved. Still, unfortunately, most of the practicing engineers were
unfamiliar with the requirements of the seismic provisions over the following
decades. The quality of construction was poor in most cases. Consequently, most of
the moment-resisting RC frame buildings constructed according to TEC-1975 are
also accepted as non-ductile, lacking the detailing necessary to prevent brittle failures
and collapse. These buildings still constitute large amounts of occupancy and are
vulnerable to future EQs. (IPCU, 2008)
Field surveys for determining the damage levels of buildings after EQs helped
determine the seismic performance and general properties of structures in Turkey.
After strong EQs, damage levels are determined, and buildings with none/light
damage were allowed to be in use, but retrofitting was required generally for
moderately damaged buildings. Severely damaged buildings are demolished after
EQs, except for the buildings having particular historical or strategic importance.
General properties and seismic vulnerability inducing parameters of Turkish RC
construction practice are described shortly in this section.
Mazılıgüney et al. (2008) analyzed concrete compressive strengths of 4,647 core
specimens taken from 693 buildings, mostly in İstanbul by grouping the buildings as
public, residential, and military. Concrete compressive strengths of existing
buildings in Turkey, which mostly need retrofit for EQ resistance, range from 5 to
16 MPa with an overall average of 10,64 MPa. Public buildings have an average
concrete compressive strength of 5.86 MPa, while residential and military structures
have average concrete compressive strengths of 8.96 MPa and 14.80 MPa.
The concrete compressive strengths of the buildings in Turkey are far less than the
requirements of TEC-2007, which allows at least 20 MPa of concrete compressive

24
strength. Mazılıgüney et al. (2008) also concluded that there is a small tendency to
increase the concrete compressive strength of structures by years until the 1970s.
Still, after the mid-1970s, the trend changes. The concrete compressive strength of
structures decreased by years until the time (ends of the 1990s) when ready mixed
concrete became obligatory and afterward a common construction practice.
Yakut and Erduran (2005) mentioned that the buildings with favorable material
properties would probably not suffer heavy damage or collapse, while the ones with
poor material properties are highly vulnerable to devastating EQs. Material
properties and particularly concrete compressive strengths of the buildings are strong
indications of the construction quality and the degree of conformance to EQ codes.
Sucuoğlu and Yazgan (2003) mentioned a close relationship between the apparent
quality and the experienced damage during Turkey's recent EQs. Buildings with poor
apparent quality can be expected to possess weak material strengths and inadequate
detailing so that they will be more vulnerable to EQs. There exists a strong
correlation between the apparent quality and the concrete compressive strengths of
buildings.
After the two EQs in 1999, Sucuoğlu and Yazgan (2003) analyzed the damage
distribution for 9685 buildings in Düzce concerning the number of stories. They
concluded that damage grades shift linearly with the number of stories. As the
number of stories increases, the ratio of undamaged and lightly damaged buildings
decreases steadily, whereas moderately and severely damaged buildings increase
almost linearly. Many researchers mentioned a strong correlation between the
number of stories and RC buildings' damage levels in Turkey. The number of stories
is perhaps the most dominant parameter in the seismic vulnerability of typical RC
buildings in Turkey (Sucuoğlu and Yazgan, 2003).
For buildings conforming to EQ codes are not accepted to have such a correlation
between the number of stories and the damage level. Turkey's unaccepted situation
is an indication of the conformance of the buildings to Turkey's EQ codes.

25
Consequently, the number of stories is a primary indicator for determining the sub-
classess of RC school buildings in Turkey for this study.
A soft-story (B2 type irregularity) occurs when the lateral rigidity of the horizontal
load resisting members at any level is such that the average lateral drift under the
design load at that level is at least 50% larger than the same quantity calculated for
the next story (TEC-2007). In TEC-2007, stiffness irregularity factor, ηki, is defined
as the ratio of the average story drift at any story to the average story drift at the story
immediately above. The same definition for the B2 type irregularity is included in
TBEC-2018.
𝜂𝑘𝑖 = 𝛿𝑖
𝛿𝑖+1 (1-1)
Stiffness irregularity or weak story (B1 type irregularity) exits when ηki exceeds 2.0.
Masonry non-structural elements are not typically modeled and can have an impact
on the soft-story determination.
For reinforced concrete buildings TEC-2007, bases the effective strength of a floor
is on its effective shear area. The effective shear area for each floor is computed
from:
Ae=As+Ac+0.15Am (1-2)
Where As, Ac, and Am are the total cross-section area of the shear walls, concrete
columns, and masonry walls, respectively, in the lateral direction under
consideration. This approach accounts for shear (area) contribution but not flexural
(moment of inertia) effect and appears inconsistent. The same definition for the B1
type irregularity is included in TBEC-2018.

26
In TEC-2007, the test for the presence of a weak story is the value of the coefficient,
ηci.
ηci = ΣAei
ΣAei+1 (1-3)
Depending on the value of ηci, several conditions exist, which are summarized in
Table 1-7.
Table 1-7 Conditions depending on ηci values (TEC 2007)
Case Action
0,8 ≤ ηci No weak story modification is needed.
0,6 ≤ ηci≤ 0,8 Increase the total base shear by the factor 1/1,25 ηci
ηci ≤ 0,6 Increase floor strength until ηci reaches 0,6 or above.
In Turkish construction practice, there is commonly a mixed form of occupation,
where small businesses (grocery shops, offices, etc.) are dispersed among the
residential spaces under the same roof (Yakut et al., 2005). The commercial areas at
the ground levels having level access from the streets are usually made as free of
obstructions (like columns or masonry walls), mostly left open between the frame
members with no masonry walls inside, for human circulation, and have taller story
heights (Sucuoğlu and Yazgan, 2003). These negative factors lead to weak or soft-
story at the ground level, where the demand for seismic resistance is the largest.
Many buildings with soft or weak stories were observed to collapse due to a
pancaked vulnerable story in the past strong EQs worldwide, and likewise in Turkey
(Sucuoğlu and Yazgan, 2003).
Another frequent application in Turkish construction practice is heavy balconies or
overhanging floors in multistory residential buildings. This construction type shifts

27
the mass center upwards, resulting in higher seismic lateral forces and overturning
moments affecting the structures during EQs. Heavy overhangs may also cause
discontinuity of frames. Buildings with heavy overhangs sustained more severe
damage with respect to regular buildings during recent strong EQs in Turkey (Ay,
2006; Sucuoğlu and Yazgan, 2003).
Torsional (A1 type) irregularity is another common vulnerability inducing
parameters in Turkish construction practice. In TEC-2007, torsional irregularity is
defined as when the average lateral displacement under the design forces at a given
story differs by more than 20% from the largest lateral situation in the same story. In
TEC-2007 torsional irregularity is defined as irregularity type A1 and described by
Torsional Irregularity Factor ηbi.
Torsional Irregularity Factor is defined for any of the two orthogonal EQ directions
as the ratio of the maximum relative story drift at any story to the average relative
story drift at the same story in the same direction. When the so-called factor is greater
than 1.2, the related building is accepted to have type A1 irregularity, according to
TEC-2007. The same definition for the A1 type irregularity is included in TBEC-
2018.
ηbi= (Δi)max/ (Δi)avr (1-4)
Landowners generally force architects to design the buildings utilizing the whole
area of the land permitted by the local authorities, and this may lead to torsional
irregularity usually at the extreme ends of the floor slabs (Yakut et al., 2005).
Plan irregularity is defined as irregularity type A3 and called "projections in the plan"
in TEC-2007. The buildings where dimensions of projections in both of the two
perpendicular directions in plan exceed the total plan dimensions of that story of the
building in the respective directions by more than 20% are accepted to have type A3
irregularity according to TEC2007. In addition to the increased likelihood of causing
28
torsional irregularity, this situation creates re-entrant corners where stresses become
concentrated and may cause unexpected distress (Yakut et al., 2005). In Turkey,
taller buildings seem more likely to have this type of irregularity. The same definition
for the A3 type irregularity is included in TBEC-2018.
Vertical (B3 type) irregularity is defined as irregularity type B3 and called
"discontinuity of vertical structural elements" in TEC-2007. The buildings where
vertical structural elements (columns or structural walls) are removed at some stories
and supported by beams or gusseted columns underneath, or the structural walls of
upper stories are supported by columns or beams underneath are accepted to have
type B3 irregularity according to TEC-2007. In Turkey, taller buildings seem more
likely to have vertical irregularity. The same definition for the B3 type irregularity
is included in TBEC-2018.
Continuous and/or band windows, semi-infilled walls, semi-buried basements, and
intermediate beams may result in the accumulation of shear forces in columns. Such
a column is called a short column (Ay, 2006). Short columns are usually formed
along the exterior side of the buildings so they can be identified from outside easily
(Sucuoğlu and Yazgan, 2003). Unfortunately, in Turkish construction practice, short
columns are frequent at the ground level, where seismic demand is the largest.
Especially in urban areas and along the main streets, buildings are constructed side
by side without sufficient clearance between each other. These types of buildings
pound each other during an EQ since they have different vibration periods. Different
story heights resulting in uneven floor levels worsen the effect of pounding, and such
buildings sustain heavier damages with respect to regular ones (Sucuoğlu and
Yazgan, 2003).
Building systems need continuous frames or sufficient number of bays in order to
distribute the lateral loads evenly to structural frame members. Buildings having
insufficient redundancy sustained localized heavy damages during recent strong EQs
in Turkey (Özcebe et al., 2003). Unfortunately, in Turkey, RC school buildings

29
generally have 3 or 4 continuous frames along the long direction or axes of the
structure, which means they do not have sufficient redundancy in the long direction.
Topographic conditions may affect the seismic performance of buildings in Turkey,
especially when the building is located on a slope steeper than 30° and have stepped
foundations (Ay, 2006; Sucuoğlu and Yazgan, 2003). There are many RC buildings
located on top of hills or steep slopes in Turkish construction practice.
Local site conditions and site amplification are other critical factors for RC buildings'
seismic vulnerability in Turkey. There were many RC buildings sustained damages
because of liquefaction during 1999 EQs.
Akkar et al. (2005) mentioned that low-and mid-rise ordinary RC buildings
constitute the most vulnerable construction type in Turkey like other EQ prone and
developing countries.
The capacity curves composed according to the design codes are used to determine
seismic vulnerability in the HAZUS (Hazard United States) (1997) methodology.
Still, these curves do not take into account local construction practices. Capacity
curves are represented in the ADRS format. The parameters (such as fundamental
period, yield over-strength ratio, post elastic stiffness, yield base shear coefficient,
yield and ultimate drift ratios) used to determine the seismic response of buildings
under a given hazard intensity can be determined from the idealized capacity curves.
(Yakut, 2008)
A typical capacity curve recommended by HAZUS (1997) is illustrated in Figure
1-3. In this curve, building response to EQ is represented in three segments, and
points A, B, and C show the code design point, actual elastic limit, and the ultimate
point beyond which the structure fails, respectively.

30
Figure 1-3. Typical Capacity Curve (HAZUS, 1997)
Where;
1
sy
CSa
(1-5)
2
24
y e
y
Sa T gSd
(1-6)
u ySa Sa (1-7)
u ySd Sd (1-8)

31
In construction practices of countries like Turkey, poor EQ code compliance is
widespread, and the existing or as-built properties of structures may differ from the
design drawings. To overcome this problem, as-built specific properties should be
used to analyze buildings' seismic vulnerability analysis whenever the structural
information is available. (Yakut, 2008)
In order to obtain the capacity-related properties of RC frame buildings in Turkey,
Yakut (2008) performed a comprehensive study in which 33 sample buildings were
selected to represent a typical subset of a comprehensive database consisting of
nearly 500 buildings. All buildings were located in either Zone 1 or Zone 2 EQ region
according to TEC-1997. The statistical properties of all capacity parameters needed
to describe the capacity curve are given in Table 1-8 for each number of stories
(Yakut, 2008).

32
Table 1-8 Statistics of Capacity Curve Parameters (Yakut, 2008)
Parameter Number of Stories
2 3 4 5
ySd(cm)
mean 0.75 1.06 1.67 1.52
st. dev. 0.25 0.29 0.71 0.35
ySa (g) mean 0.25 0.18 0.16 0.12
st. dev. 0.09 0.07 0.04 0.04
uSd(cm)
mean 7.30 10.65 12.84 14.06
st. dev. 1.50 2.65 3.61 5.40
uSa(g)
mean 0.28 0.21 0.18 0.14
st. dev. 0.10 0.08 0.05 0.04
Cs mean 0.10 0.10 0.10 0.10
st. dev. 0.00 0.00 0.00 0.00
Te mean 0.27 0.34 0.47 0.55
st. dev. 0.05 0.11 0.11 0.14
PF mean 1.17 1.24 1.28 1.29
st. dev. 0.02 0.04 0.02 0.01
mean 0.94 0.88 0.83 0.83
st. dev. 0.02 0.06 0.05 0.03
γ mean 2.31 1.58 1.30 1.02
st. dev. 0.85 0.52 0.39 0.32
mean 1.13 1.15 1.14 1.16
st. dev. 0.04 0.12 0.03 0.06
μ mean 9.23 9.26 7.67 7.86
st. dev. 3.03 3.12 3.01 2.22
The statistical properties of all capacity parameters needed to describe RC school
buildings' capacity curves in Turkey with respect to the number of stories will be
compared with this table in the following chapters.

33
Yakut (2004) mentioned that the evaluations made after recent strong EQs in Turkey
indicated that RC buildings having over-strength ratios of less than 1.65 would
perform poorly against a strong EQ Selected capacity curves for 2, 3, 4, and 5 story
RC buildings in Turkey are illustrated in Figure 1-4 (Akkar et al., 2005).
Figure 1-4. Selected capacity curves for 2, 3, 4, and 5 story buildings in Turkey
(Akkar et al., 2005).
1.4 Object and Scope
SVA of existing RC residential buildings has been focused by plenty of recent
studies in Turkey. However, SVA of facilities where essential public functions are
carried out, such as schools, has not been studied comprehensively. The public
buildings' vulnerability drew attention since they experienced considerable damage
compared to residential buildings after recent EQs in Turkey (Bilgin, 2013). The
seismic safety of the public buildings, especially school buildings, is essential for the
community's resilience after EQs. National attention has focused on the problem of
the high seismic vulnerability of schools for the sake of children's safety.

34
EQ hazard identification is out of the scope of this study. Identifying high
vulnerability buildings is of significant importance for both reliable loss estimation
and setting priority criteria for mitigation and strengthening of structures (Erduran
and Yakut, 2004). The study's primary concern and scope is the structural
vulnerability assessment of RC school buildings in Turkey.
The primary aims of this study are listed below:
To determine comprehensive statistical information for the RC school
buildings in Turkey,
To determine the capacity-related properties of school buildings located in
Turkey,
To investigate the applicability, on school buildings, of existing walk-down
and preliminary SVA procedures developed for residential buildings in
Turkey,
To analyze RC school buildings for assessing their performance using
different approximate methods and compare the results with TEC-2007,
To generate F.C.s for RC school buildings and validate with the observed
data,
To generate F.C.s for RC school buildings for repeated EQs,
To analyze RC school buildings according to the provisions of Urban
Renewal Law and discuss the applicability of provisions,
To analyze the RC school buildings according to the new EQ code (TBEC-
2018) and compare the results with the previous code.
The work done in order to achieve the aims of the study are shortly explained
below.
The database of 321 RC school buildings examined through site surveys and assessed
by TEC-2007 under the consultancy of professors of Middle East Technical

35
University (METU) is obtained from the IPCU, the administrative unit of ISMEP.
All buildings' as-built properties were determined by site surveys, in-situ, and
laboratory tests within the database. The material and structural properties, including
the as-built structural drawings of the buildings, soil properties, site observations,
and laboratory test results, were explained in detail with the comprehensive reports,
and professors of METU confirmed all studies. These buildings formed a
comprehensive statistical database reflecting importing properties of school
buildings in Turkey.
The walk-down and preliminary SVA procedures (ATC-21/FEMA154, Sucuoğlu et
al., Hassan and Sözen, Özcebe et al., and Yakut) are applied to RC school buildings
in the database. Assessment results are compared with the linear elastic assessment
results of TEC-2007. The parameters used for walk-down and preliminary
assessment methods are analyzed statistically for the database. An alternative
preliminary assessment method, a merging, and revision of ATC-21 and Yakut’s
procedures, is proposed for RC school buildings in Turkey consistent with the
Turkish EQ Code.
The majority (80 %) of the database are 3, 4, and 5 story RC school buildings, so
each story group is considered as a sub-class of the database. 12 RC school buildings
are selected for each sub-class. Thus a total of 36 RC school buildings are selected,
and 3-D structural models of all buildings are generated using SAP2000 software.
The capacity curves of the buildings in both orthogonal directions are obtained by
pushover analysis. Bilinear idealization (Acceleration Displacement Response
Spectra-ADRS) of the capacity or the pushover curves are obtained. Equivalent
single degree of freedom (ESDOF) models are generated for both orthogonal
directions of the selected buildings, which makes 72 Equivalent models in total.
The selected buildings are analyzed and assessed by the Displacement Coefficient
Method (DCM), ASCE-41 detailed assessment method, and the method proposed by
Urban Renewal Law of Turkey. All assessment results are compared with the linear
elastic assessment results of TEC-2007.

36
The selected buildings are also analyzed according to the new version of the
provisions under Urban Renewal Law and TBEC-2018. The results were compared
by the previous ones and linear elastic assessment results of TEC-2007
Fragility analysis for 3, 4, and 5-story RC school buildings are carried out using
Equivalent SDOF models, and F.C.s are developed using both bilinearand, stiffness
and strength degradation (Modified Clough) material models. The outcomes and the
limitations of the other studies explained in the literature survey on F.C. generation
are considered.
Obtained F.C.s are validated by the observed performance data of RC school
buildings after 2003 Bingöl EQ
F.C.s for RC School Buildings due to repeated EQs are also derived, which are
thought to be useful for rapid decisions for using structures after EQs.
1.5 Organization of the Dissertation
The thesis study is composed of 8 chapters. The first chapter is an introduction
section that gives a general overview of the background and research significance,
literature survey, and object and scope. The previous studies on school buildings'
seismic vulnerability are discussed in the first chapter's literature survey section.
The second chapter is devoted to describing the database composed of 321 RC school
buildings used in the study. Seismic performance and general properties of RC
buildings in Turkey are mentioned in the first section of the second chapter. The
selection procedure of the buildings for 3, 4, and 5 story sub-classes is also described
in this chapter.
The assessments of RC school buildings in the database by existing walk-down and
preliminary methods and the proposed preliminary assessment method are discussed
in the third chapter. The comparisons of assessment results with TEC-2007 are also

37
mentioned, and the results are discussed. The proposed (Modified ATC-21)
Preliminary Assessment Method is also described in the third chapter.
In the fourth chapter, the work done for 3-D modeling, pushover analysis, bilinear
idealization of capacity curves, ESDOF model formation, determining performance
limit states for each building, and assessment by target displacements of DCM,
ASCE-41, and the discussion of the assessment results are described. Detailed
assessment results are also compared with TEC-2007 results within the chapter.
In the fifth chapter, the new EQ code of Turkey, TBEC-2018, is examined for RC
school buildings, and all 36 RC school buildings are analyzed accordingly. The
assessment results are compared by the results of other methods and the results of
TEC-2007.
In the sixth chapter, the assessment of 36 RC school buildings under the provisions
of the Urban Renewal Law is carried out. Both 2013 and 2019 versions of the
provisions are used for assessment, and the results are compared for the two versions,
TEC-2007 and TBEC-2018.
The seventh chapter is devoted to the generation of the F.C.s for 3, 4, and 5 story RC
school buildings using both bilinear and stiffness and strength degradation (Modified
Clough) material models in Turkey, the validation of the F.C.s, and the assessment
of related buildings in the database are described.
Finally, the last chapter is devoted to a summary and conclusions of the study and
information obtained as well as recommendations for future studies.


39
CHAPTER 2
2 BUILDING DATABASE
2.1 Description of the Buildings Database in the Study
The majority of the school buildings worldwide are generally two classrooms wide,
with classrooms placed next to each other with a corridor between them (Rodgers,
2012). With this aspect, there are generally three of four continuous RC frames along
the long sides of the school buildings, which generates a low redundancy problem
for the long sides/directions.
There are generally exterior windows on the exterior side walls to sustain the need
for natural lighting and ventilation. Sometimes, these windows are constructed from
column to column, which may lead to short column irregularity on the exterior sides.
In order to provide unobstructed sight between the teacher and the students, there are
no columns or any kind of interior supports within the classrooms, and the bay widths
are generally larger than residential buildings. The school buildings' story heights
are usually more than residential buildings to provide enough ventilation for
children. Larger bay widths and taller story heights are the main differences and the
vulnerability deriving parameters of schools when compared with residential
buildings.
The above mentioned architectural configurations may support schools' functions
but, unfortunately, increase the seismic vulnerability. Rodgers (2012) noted that
other characteristics such as weak or soft stories and heavy roofs are not unique to
schools, but it is not totally valid for the Turkish construction practice.

40
Public buildings like schools and hospitals in Turkey are generally designed by
templates developed by the Ministry of Environment and Urban Planning (the
previous name was Ministry of Public Works and Settlement) (General Directorate
of Construction Affairs in general) according to the former EQ-codes for practical
reasons. Still, unfortunately, there are many deficiencies from templates during
construction (Bilgin, 2013). Although the used projects reveal minor differences
from province to province, they are similar architecturally. Unfortunately,
throughout the thesis study, it is observed that this is not the situation for most of the
school buildings in İstanbul as well as in the other provinces of Turkey.
There are many typical types of school buildings in İstanbul. IPCU defined 66
different types of school buildings in ISMEP (2008) guidelines, and the number
increased in the following years. Detailed information about typical school buildings
in İstanbul has been covered in the ISMEP (2008) guideline. It is also mentioned in
the guideline that many school buildings have characteristics incorporating several
of the listed types.
Using only template designs for determining the seismic vulnerabilities of school
buildings will lead to inconsistent results. Considering the uncertainties in material
properties and detailing would not be enough to reach adequate validity of
assessment analysis. In order to overcome the nonconformance problem, the as-built
properties of the RC school buildings are used in this study. Using the as-built
properties obtained by site surveys and laboratory tests results for materials reduces
the effects of uncertainties.
RC school buildings in Turkey usually consist of RC framing, only a few of them
having shear walls. They typically have masonry infill walls, and floor slabs are
generally of cast-in-place concrete. Lateral forces are usually resisted by cast-in-
place moment frames that develop stiffness through column-beam connections.
A database of 321 RC school buildings located in İstanbul that were assessed in detail
under the World Bank program ISMEP and with the consultancy of professors of
METU has been compiled for this study. The determined properties of 321 RC

41
school buildings considered in this study are given in Appendix-A. The general
properties of 321 RC school buildings and the sub-classes of 3, 4, and 5 story
buildings selected for further analyzes are described below. Each 3, 4, and 5 story
subclasses consists of 12 RC school buildings representing the database's general
properties, and templates are also taken into account in the selection process.
The general parameters of the school buildings in the database are listed in Table
2-1.
Table 2-1 General parameters of school buildings in the database.
Parameter Quantity
Construction Year 1951-2005
Average Plan Area 475 m2
Average Story Height 3.30 m
Average Distance to Fault 18.76 km
Average Concrete Compressive Strength 10.22 MPa
Average Steel Tensile Strength 253 MPa
Average Period (Tx/Ty) 0.66/0.62 sec
The distribution of the construction years of RC school buildings in the database is
shown below in Figure 2-1.

42
Figure 2-1. The distribution of date of construction of RC school buildings
Concrete compressive strengths of existing buildings in Turkey, which need retrofit
for EQ resistance, range from 5 to 16 MPa and public buildings have an average
concrete compressive strength of 5.86 MPa (Mazılıgüney et al., 2008). School
buildings have an average concrete compressive strength of 10.22 MPa, consistent
with Turkey's building stock but slightly better than other public buildings. The
minimum permitted concrete strength in the regions of high seismicity is specified
as 20 MPa in TEC-2007. The distribution of concrete compressive strengths of the
buildings in the database is shown in Figure 2-2 below.
0
5
10
15
20
25
Date of Construction

43
Figure 2-2. The distribution of concrete compressive strengths (MPa)
The periods of 3, 4, and 5 story RC school buildings are listed in Table 2-2. It is
observed that the periods in X and Y directions are close to each other. The X-
directions of RC school buildings are longer, but there are more shear walls in Y
directions, so the average periods in both directions are close to each other.
Table 2-2 Average periods of buildings with respect to story numbers.
Story Number Tx (s) Ty (s)
3 0.52 0.50
4 0.77 0.71
5 0.84 0.76
The average steel tensile strength of the steel used for the database is 253 MPa since
STIIIa is used only in 53 of the RC school buildings, and STI is used for the
remaining 268 buildings.
These RC school buildings' distance to the nearest fault (mostly the Marmara Sea
segment of North Anatolian Fault) was considered the primary seismic source and
ranges from 11 to 44 km. 111, 206, and 4 of the school buildings in the database are
0
10
20
30
40
50
60
70
LESS 5-7 7-9 9-11 11-13 13-15 15-17 17-19 MORE

44
located in the 1st, 2nd, and 3rd EQ zones according to the 2007 code. Only four
buildings were constructed after TEC-1997, so these four buildings are not included
in the subclasses.
The number of basement stories, the number of stories above ground, and
unrestrained stories are given in Table 2-3. There are 118 (36.8 %) RC school
buildings that have 1 basement story. None of the buildings in the database has 2 or
more basement stories. Stories above ground represent the story number of the
buildings except for the basement story. If the basement story is above the ground
for at least half of its height, it is accepted as a story above the ground. If the
basement story is surrounded by shear walls, it is accepted as restrained. The number
of unrestrained stories is taken into account for determining the subclasses.
Table 2-3 Number of stories of the school buildings in the database
Number of Stories Basement
Stories
Stories Above
Ground
Unrestrained
Stories
1 118 21 13
2 - 47 39
3 - 118 96
4 - 113 130
5 - 19 30
6 - 3 12
7 - - 1
3, 4, and 5 story buildings comprise (256/321=0,7975) nearly 80 % of the RC school
buildings stock. 1 and 2 story ones are less vulnerable, while structures having more
stories than 5 are more vulnerable with respect to 3, 4, and 5 story buildings
according to assessment results of TEC-2007 analysis that will be given in the next
section. It was also mentioned in the previous chapter that there is a strong
correlation between the number of stories and the damage level for RC buildings in

45
Turkey. Consequently, 3, 4, and 5 story building sub-classess are determined for
further analysis in this study.
The number of continuous frames in the long (X) and short (Y) directions of the RC
school buildings in the database is an important parameter. The distribution of the
number of continuous frames is given in Figure 2-3 and Figure 2-4 below for long
and short directions.
Figure 2-3. The distribution of continuous frames in the long direction of RC
school buildings (Nx)
0
20
40
60
80
100
120
140
160
0 1 2 3 4 5 6 7 8 9 10 11
Number of continuous frames in "X" (long) direction (Nx)

46
Figure 2-4. The distribution of continuous frames in the short direction of RC
school buildings (Ny)
Only 2 of the school buildings have an apparent building quality of “good”, while
114 of them have “average” and 205 of them have “poor” apparent building quality.
Factory brick was used in 319 of the school buildings, and local brick was used in
only 2 of them, which are not selected for subclasses. 27 of the buildings are located
on soil class Z1, while 261 are located on site Z2, and 33 are located on site Z3.
The irregularities observed on the school buildings are listed in Table 2-4. As can
be seen from Table 2-4 pounding effect, topographic effects, and the short column
are the most frequently observed features for school buildings.
0
5
10
15
20
25
30
35
40
45
50
0 1 2 3 4 5 6 7 8 9 10 11 12 13 14 15 16
Number of continuous frames in "Y" (short) direction (Ny)

47
Table 2-4 Number of school buildings having irregularities
Irregularity Definition Number of School Buildings
Observed
Topographic Effects 119
Soft-story 43
Weak Story 7
Vertical Irregularity 6
Plan Irregularity 9
Short Column 101
Heavy Overhangs 43
Torsion 7
Pounding Effect 186
43 of RC school buildings in the database have soft-story irregularities, and 7 have
a weak story. Soft-story and weak story irregularities in RC school buildings are due
to higher ground stories and large entrance halls.
The long sides and the short sides are always named as X and Y directions,
respectively, in this study. The density of shear walls in a given principal direction
is believed to have a prominent role in the buildings' seismic performance (Gülkan
and Sözen, 1999; Yakut, 2004), but 170 of the buildings in the database have no
shear walls in either direction.
Detailed assessment of these buildings according to TEC-2007 revealed that 258
(80.37 %) of the school buildings in the database do not satisfy the IO performance
state for an EQ having a probability of exceedance of 10 % in 50 years and 219
(68,22 %) of them do not satisfy LS for an EQ having a probability of occurrence of
2 % in 50 years.
It is examined if there is a correlation between concrete compressive strength and
EQ performance for the RC school buildings in the database. The concrete

48
compressive strength distribution of RC school buildings, which do not satisfy the
IO performance state for the (design) EQ having a probability of 10 % in 50 years,
is shown in Figure 2.5. Similarly, the concrete compressive strengths of RC school
buildings, which do not satisfy the LS performance state for the EQ having a
probability of exceedance of 2 % in 50 years, is shown in Figure 2.6. The concrete
compressive strength distribution of the satisfactory buildings are shown in Figure
2.7 and Figure 2.8. As can be seen from the corresponding figures, there is no
correlation between the concrete compressive strengths of RC school buildings and
the performance states of them.
Figure 2.5. Concrete compressive strengths of RC school buildings which do not
satisfy IO performance state for the design EQ (%10 in 50 years)

49
Figure 2.6. Concrete compressive strengths of RC school buildings which do not
satisfy IO performance state for the maximum expected EQ (%2 in 50 years)
Figure 2.7. Concrete compressive strengths of RC school buildings which satisfy
IO performance state for the design EQ (%10 in 50 years)

50
Figure 2.8. Concrete compressive strengths of RC school buildings which satisfy
LS performance state for the maximum expected EQ (%2 in 50 years)
RC school buildings in the database are examined for the correlation between the
number of stories and performance states. It is observed that all RC school buildings
in the database having more than 5 stories cannot satisfy the IO or LS performance
states for the design EQ and the maximum expected EQ, respectively. RC school
buildings having 1 or 2 stories are less vulnerable to EQs. The situation for 3, 4, and
5-story RC school buildings are close to each other. The percentage of unsatisfactory
RC school buildings having 3, 4, and 5 stories in the database are shown in Figure
2.9. The blue bars correspond to the percentages of RC school buildings that do not
satisfy the IO performance state for the design (%10 in 50 years) EQ, while the red
ones for the maximum expected (%2 in 50 years) EQ

51
Figure 2.9. Percentages of unsatisfactory buildings for design and maximum
expected EQs
It is well known that the number of stories is one of the primary governing factors
for the EQ vulnerability of RC building stock in Turkey. The percentages of
unsatisfactory RC school buildings of 3, 4, and 5 stories are close since there are
other contributing factors, especially structural irregularities.
None of the contributing factors governs the performance states of the RC school
buildings, but statistical analysis may give an insight into the weightiness of the
contributing factors. Logistic regression analyses are performed by using Minitab-
18 software, and the deviance table is constructed to determine the p-values of the
selected contributing factors, which are Fck, Nx, Ny, %Aswx, and %Aswy. There is no
statistically meaningful correlation, but the p-values give an insight since the p-
values get smaller when the contributing factors get more effective. The screenshots
of the deviance tables taken from Minitab-18 software is given in Error! Reference
ource not found. and Figure 2.11, which shows the most influential factor for EQ
safety of RC school buildings is the shear wall ratio in the short direction.

52
Figure 2.10. Deviance table (screenshot) of logistic regression analysis for design
EQ
Figure 2.11. Deviance table (screenshot) of logistic regression analysis for design
EQ
Appendix-A provides detailed information about the database and the selected
buildings.
2.2 Properties of Selected 36 RC School Buildings
The assessment reports of the 321 RC school buildings are taken from the IPCU and
determined as-built properties are provided in Appendix A.
All determined parameters of the selected RC school buildings are tabulated in
Appendix A. The selected RC school buildings are labeled with red ID numbers, and

53
all parameters are written with bold characters in Appendix A. Likewise, the selected
36 RC school buildings are extracted and tabulated separately in Appendix B.


55
CHAPTER 3
3 WALK-DOWN AND PRELIMINARY ASSESSMENT
3.1 Introduction to Walk-down and Preliminary Assessment
After severe EQs, extensive losses of human lives and economic property may be
faced in Turkey's urban areas or elsewhere, like in the past. For seismic risk reduction
in urban areas, it is a high priority to determine the addresses of seismically
vulnerable buildings within the existing building stock. Once the seismically
vulnerable structures are appropriately identified, the urban seismic risk may be
reduced either by retrofitting such buildings individually or applying urban renewal
procedures in areas where their density is high (Sucuoğlu and Yazgan, 2003).
As a significant example, the built environment of İstanbul alone consists of about a
million buildings. It is anticipated that some 50,000 to 70,000 buildings in İstanbul
are expected to experience severe damage or collapse if the probable scenario EQ
occurs (JICA, 2002). In order to perform effective seismic reduction for İstanbul,
determining the vulnerable buildings, and concentrating the efforts on them should
have a high priority.
An experienced professional's judgment is accepted to be the best instrument to
identify a vulnerable building, but determining all vulnerable structures by
experienced professionals is very expensive for cities like İstanbul and all other EQ
prone urban regions. The building inventory should be filtered initially, and the
buildings need further examination determined by objective criteria. These criteria
and the required calculation level need to be at a very low level of sophistication
(Hassan and Sözen, 1997).
As described in the first chapter, SVA procedures can be divided into three main
categories depending on their complexity in the literature. These are walk-down

56
(street survey), preliminary evaluation procedures, and detailed assessment
procedures.
Walk-down or street survey is the quickest and most straightforward (the easiest)
method. Superficial data (usually composed of deficiencies or irregularities)
collected from a quick inspection of the building is sufficient to use these assessment
methods. Rapid evaluation techniques serve to identify or rank highly vulnerable
buildings by providing a crude index used to rank a group of buildings to determine
their priority for further evaluation. No analysis is needed for the first level
assessment of building inventory. Walk-down assessment methods determine the
priority levels of buildings requiring more detailed studies. These vulnerable
buildings determined in the first level are investigated in detail thereafter, if
necessary. (Yakut, 2004, and 2004-2 & Kalem, 2010)
Sucuoğlu and Yazgan (2003) mentioned that a street survey procedure must be based
on simple structural and geotechnical parameters that can be observed quickly by a
sidewalk. The time required for an observer to collect one building's data by the
sidewalk is expected not to exceed 10 minutes (Hassan and Sözen, 1997).
The parameters examined by street survey methods are determined by expert
opinions or statistical data. After EQs, experts examine the performances of
buildings on-site and correlate the performances with structural parameters. Then the
importance of the parameters is determined through statistical analysis.
The typical (vulnerability) parameters used by walk-down assessment methods are
the number of stories, vertical and plan irregularities, location of the building
(including soil properties), age of the building, its structural system, apparent
building (including material and workmanship) quality, existence of soft and weak
story, overhangs, short columns, etc.
Generally, in walk-down assessment procedures, an initial score is first given to the
building examined depending on structural parameters, soil conditions, or seismic
risk zones. Then the structure is examined to determine the existence of vulnerability

57
parameters described above. Each parameter generally reflects a negative effect on
the buildings' seismic vulnerability, so the initial score is reduced by penalties
appropriately for each parameter observed. By this procedure, a performance score
is obtained for each building individually. A cut-off score is determined or
calculated, and the buildings with performance scores lower than the cut-off value
are accepted to be seismically vulnerable than others. The performance scores of
each building also reflect the building's priority for the next level of assessments. A
general equation for calculating the seismic PS is given below (Sucuoğlu and
Yazgan, 2003):
PS=(Initial Score)-(Vulnerability parameter)x(Penalty Score) (3-1)
FEMA-154 or ATC-21, and Sucuoğlu and Yazgan (2003), and Sucuoğlu et al. (2007)
are three examples of walk-down assessment procedures. ATC-21/FEMA-154
(1998) method has been developed to determine the vulnerable buildings that would
show collapse or collapse prevention performance states under the design EQ
Sucuoğlu and Yazgan (2003) and Sucuoğlu et al. (2007) walk-down assessment
procedures are based on the Düzce (1999) database consisting of 9685 RC residential
buildings. They aim to determine the buildings to be collapsed during the design EQ
ATC-21, Sucuoğlu and Yazgan (2003), and Sucuoğlu et al. (2007) methods are used
in this study and the assessment results are evaluated with respect to TEC-2007
(linear elastic) assessment results.
When a more reliable and detailed assessment than the walk-down survey is needed,
preliminary assessment techniques are employed. In addition to the data collected
for the walk-down assessment procedures, the size and orientation of the structural
components, material properties, and layout are needed to perform practical and
straightforward procedures. In this level, a simplified analysis of the buildings under
investigation can be performed; entry to the buildings and examining the drawings
may be necessary depending on the method used. The building's expected
performance state is usually predicted by comparing the index derived by
preliminary assessment methods against anticipated demand. The success of these
58
techniques depends on the availability and quality of data. (Yakut, 2004 and 2004-
2; Erduran, 2005)
Hassan and Sözen (1997), Özcebe et al. (2003), and Yakut’s (2004) methods are
three examples of preliminary assessment methods, and they are used in this study.
These methods generally depend on the dimensions of the lateral (EQ) load-
carrying/resisting structural elements.
Hassan and Sözen (1997) method is based on the Erzincan (1992) database
consisting of 46 institutional buildings. Özcebe et al. (2003) method is based on the
Düzce (1999) database composed of 484 RC residential buildings. Yakut’s (2004)
method depends on both the material properties and strength of the structures.
Yakut’s (2004) method aims to distinguish buildings that would have heavy damage
during the design EQ
It is possible to survey large building stocks by employing the walk-down and
preliminary assessment methods within a reasonable time and reasonable cost. The
primary point is that these practical methods may provide valuable information about
a building stock's seismic vulnerability. They are not tailored to estimate a single
building's expected seismic performance (Binici et al., 2015).
The in-depth evaluation of the buildings by detailed and sophisticated structural
analysis is the third level of SVA, which will be discussed in the next chapters. The
preliminary assessment is the most widely used one when a quick and reliable
evaluation is needed among three assessment levels.
3.2 Assessment with Existing Methods
The objective of walk-down and preliminary analysis is to perform a quick and
straightforward evaluation to decide about the expected seismic performance of the
buildings for which detailed evaluation procedures could not be applied due to lack
of data and enough time.

59
Turkish Earthquake Code (TEC-2007 and TBEC-2018 after January 2019) is
Turkey's legal technical seismic design code. TEC-1997 was updated, with a new
version issued in March 2007, to include a section in Chapter 7 on seismic
assessment and retrofit of existing buildings. TEC-2007 has been legally in effect
since March 2007 till 2019 when TBEC-2018 came to be in effect. It is used for the
design of new buildings and the assessment and retrofit of existing buildings.
Although comprehensive research devoted to reinforced concrete residential
buildings yielded capacity curve parameters and SVA procedures for residential
buildings in Turkey, a similar endeavor has not been given to school buildings.
Therefore, this section of the study focuses on determining the consistency of
existing assessment procedures with TEC-2007 for school buildings in Turkey.
Analytical and statistical analyzes are performed to investigate the applicability, on
school buildings, of existing SVA procedures developed for residential buildings in
Turkey.
The performance of the buildings is mainly grouped into three as IO, LS, and CP by
TEC-2007. In addition, the physical damage states of the buildings were also
identified based on the performance levels. There are mainly four damage levels that
are negligible, light, moderate, and heavy. The negligible and light damage states
correspond to the immediate occupancy performance level. The moderate damage
state corresponds to the life safety performance level, and the heavy damage level
corresponds to the collapse prevention.
For school buildings, TEC-2007 requires two different performance states for two
different earthquake load levels. School buildings should satisfy IO performance
state for an earthquake loading having a probability of exceedance of 10 % in 50
years lifetime and LS for an earthquake ground motion having a probability of
exceedance of 2 % in 50 years lifetime.
The walk-down and preliminary assessment procedures used in this study will not
be discussed in detail. For detailed information about the assessment procedures
used, researchers may examine the given references for each method.

60
Testing the predictive success of walk-down and preliminary analysis of structures
in Turkey can best be accomplished by observed damage after EQs in a collection of
buildings with dimensional and material properties on the basis of random choices
made during the design and construction stages. In this way, whether a rational
explanation of the empirical evidence is contained in theory can be answered with
better confidence (Yakut et al., 2005).
In this study, the predictive success of the walk-down and preliminary SVA methods
will be checked by comparing the assessment results of each technique with the
assessment results of TEC-2007. The proposed check in this study neither checks the
validity of the methods nor describes the one as better than others, but reflects the
consistency of the methods with TEC-2007.
As mentioned earlier, the buildings employed were assessed using the current
seismic design code in force in Turkey within the ISMEP project under the
consultancy of the academic staff of METU. In order to evaluate the efficiency and
consistency of existing walk-down and preliminary seismic performance assessment
procedures developed by ATC-21/FEMA-154 (FEMA, 1988), Sucuoğlu and Yazgan
(2003), Sucuoğlu et al. (2007), Yakut (2004), Hassan & Sözen (1997) and Özcebe et
al. (2003), these procedures were used to determine the expected seismic
performance of all 321 school buildings in the database. The assessments based on
TEC-2007 have been listed, and according to these results, the consistency
classification rates of walk-down and preliminary seismic assessment procedures
were determined.
A similar tabulation is used to evaluate each performance method, as can be seen in
the tables below. The assessment found by TEC-2007 analysis is given in the first
column, and the assessment based on the used procedure is provided in the next
column. The desired performance state for the related probability of occurrence of
EQ is also mentioned shortly. “IO 10 %” stands for the immediate occupancy
performance state for the EQ having a probability of occurrence of 10 % in 50 years,
and “LS 2 %” stands for life safety performance state for the EQ having a probability

61
of exceedance of 2 % in 50 years lifetime. Evaluations for the code-required EQ
intensities are shown by individual tables. The letter “U” shows unsatisfactory, “S”
corresponds to satisfactory, and “M” stands for moderate. The classification rates
and the correlations are given in percentages in the third column. Also, the relative
percentages are given for U and S individually in the last column. As an example,
the relative percentage of U-U stands for the percentage of correctly determined
unsatisfactory school buildings. Since one of the critical parameters for the
consistency of the related method with TEC-2007 is the relative ratio (%) of the U-
U case, it is written in bold characters. The consistency ratio (i.e., the sum of
consistency ratios of U-U and S-S) is another important parameter and is also written
in bold characters.
Evaluation of ATC-21/FEMA-154 (FEMA, 1988) procedure with TEC-2007 for the
IO performance state can be seen in Table 3-1. The unsatisfactory buildings were
assessed by a 78.68 % relative consistency ratio, and the method is evaluated to be
75.39 % consistent with TEC-2007.
Table 3-1 Evaluation of ATC-21 (FEMA, 1988) procedure with TEC-2007 for IO
10 % case
TEC IO 10 % ATC-21(FEMA154) Ratio (%) Relative Ratio (%)
U U 63.24 78.68
U S 17.13 21.32
S U 7.48 38.10
S S 12.15 61.90
Consistency (%) 75.39
Evaluation of ATC-21 (FEMA-154) procedure with TEC-2007 for the LS
performance state is summarized in Table 3-2. The unsatisfactory buildings may be
assessed by a 77.63 % relative consistency ratio, and the method is evaluated to be
66.98 % consistent with TEC-2007.

62
Table 3-2 Evaluation of ATC-21(FEMA, 1988) procedure with TEC-2007 for LS 2
% case
TEC IO 2 % ATC-21(FEMA154) Ratio (%) Relative Ratio (%)
U U 52.96 77.63
U S 15.26 22.37
S U 17.76 55.88
S S 14.02 44.12
Consistency (%) 66.98
Evaluation of Sucuoğlu and Yazgan (2003) procedure with TEC-2007 for the IO
performance state is given in Table 3-3. The unsatisfactory buildings may be
assessed by a 7.75 % relative consistency ratio, and the method is evaluated to be
24.3 % consistent with TEC-2007. The cut-off value is assumed as 50 for both cases.
Table 3-3 Evaluation of Sucuoğluand Yazgan (2003) procedure with TEC-2007 for
IO 10 % case
TEC IO 10 % Sucuoğlu et al. Ratio (%) Relative Ratio (%)
U U 6.23 7.75
U S 74.14 92.25
S U 1.56 7.94
S S 18.07 92.06
Consistency (%) 24.30
Evaluation of Sucuoğlu and Yazgan (2003) procedure with TEC-2007 for the LS
performance state can be seen in Table 3-4. The unsatisfactory buildings may be
assessed by a 7.31 % relative consistency ratio, and the method is evaluated to be
33.95 % consistent with TEC-2007.

63
Table 3-4 Evaluation of Sucuoğlu and Yazgan (2003) procedure with TEC-2007 for
LS 2 % case
TEC LS 2 % Sucuoğlu et all. Ratio (%) Relative Ratio (%)
U U 4.98 7.31
U S 63.24 92.69
S U 2.80 8.82
S S 28.97 91.18
Consistency (%) 33.95
All school buildings are assessed to be unsatisfactory with the Sucuoğlu et al. (2007)
method, i.e., none of the school buildings would behave satisfactorily according to
this method. Evaluation of Sucuoğlu et al. (2007) procedure with TEC-2007 for the
IO performance state can be seen in Table 3-5. The relative ratios seem to be high
for the unsatisfactory case, but it does not have a logical meaning since the method
evaluates all buildings as unsatisfactory. The process determines the unsatisfactory
buildings by 100 % consistency with TEC-2007 but also has a 100 % inconsistency
with TEC-2007 for the satisfactory buildings.
Table 3-5 Evaluation of Sucuoğlu et al. (2007) procedure with TEC-2007 for IO 10
% case
TEC IO 10 % Sucuoğlu et al. Ratio (%) Relative Ratio (%)
U U 80,37 100
U S 0 0
S U 19,63 100
S S 0 0
Evaluation of Sucuoğlu et al. (2007) procedure with TEC-2007 for the LS
performance state can be seen in Table 3-6. The relative ratios seem to be high for
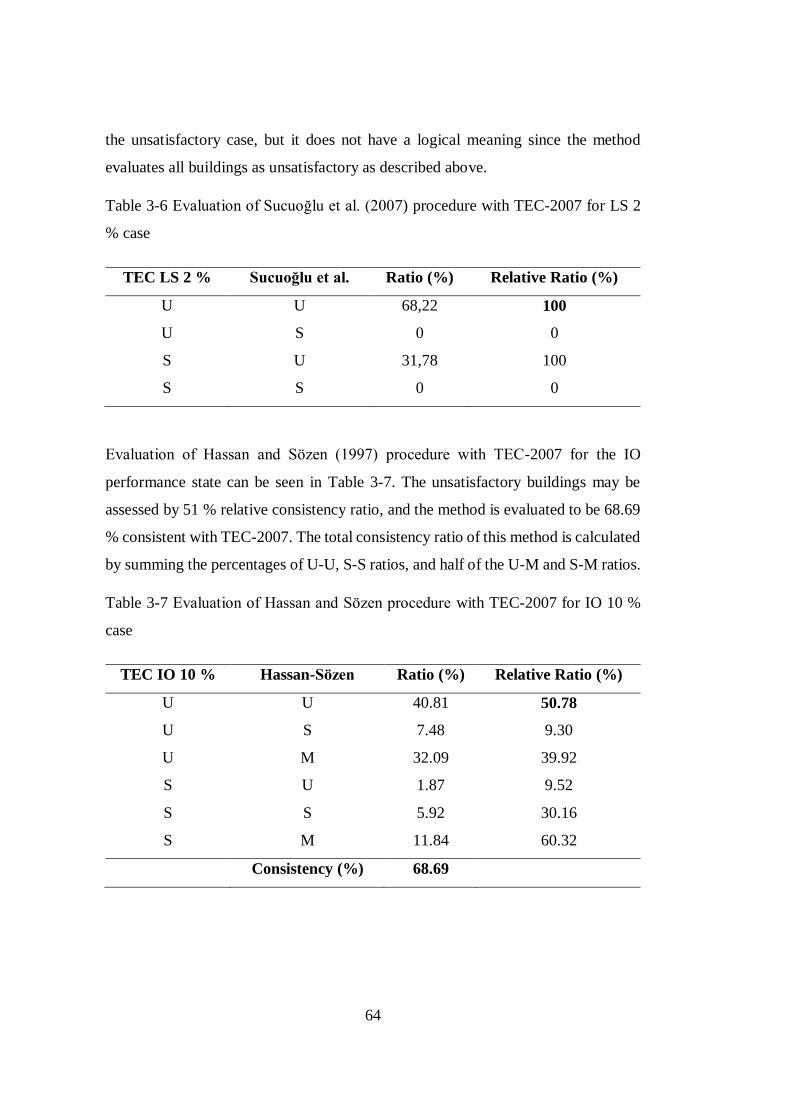
64
the unsatisfactory case, but it does not have a logical meaning since the method
evaluates all buildings as unsatisfactory as described above.
Table 3-6 Evaluation of Sucuoğlu et al. (2007) procedure with TEC-2007 for LS 2
% case
TEC LS 2 % Sucuoğlu et al. Ratio (%) Relative Ratio (%)
U U 68,22 100
U S 0 0
S U 31,78 100
S S 0 0
Evaluation of Hassan and Sözen (1997) procedure with TEC-2007 for the IO
performance state can be seen in Table 3-7. The unsatisfactory buildings may be
assessed by 51 % relative consistency ratio, and the method is evaluated to be 68.69
% consistent with TEC-2007. The total consistency ratio of this method is calculated
by summing the percentages of U-U, S-S ratios, and half of the U-M and S-M ratios.
Table 3-7 Evaluation of Hassan and Sözen procedure with TEC-2007 for IO 10 %
case
TEC IO 10 % Hassan-Sözen Ratio (%) Relative Ratio (%)
U U 40.81 50.78
U S 7.48 9.30
U M 32.09 39.92
S U 1.87 9.52
S S 5.92 30.16
S M 11.84 60.32
Consistency (%) 68.69

65
Evaluation of Hassan and Sözen procedure with TEC-2007 for the LS performance
state is given in Table 3-8. The unsatisfactory buildings may be assessed by a 52 %
relative consistency ratio, and the method is evaluated to be 64.65 % consistent with
TEC-2007. The total consistency ratio is calculated as described in the above
paragraph.
Table 3-8 Evaluation of Hassan and Sözen procedure with TEC-2007 for LS 2 %
case
TEC LS 2 % Hassan-Sözen Ratio (%) Relative Ratio (%)
U U 35.20 51.60
U S 6.85 10.05
U M 26.17 38.36
S U 7.48 23.53
S S 6.54 20.59
S M 17.76 55.88
Consistency (%) 64.65
Hassan and Sözen (1997) criticized their method themselves by the words below:
"Undoubtedly, the method leaves out more variables than it includes. It is insensitive
to changes in material quality, story height, girder properties, framing in upper
stories, and detail. It lacks proof by theory or experiment. It cannot make absolute
judgments about structural safety. Nevertheless, it offers a pragmatic method for
identifying the most vulnerable in a regional inventory of low-rise buildings with
monolithic RC framing. Granted that an engineer’s judgment is the most important
criterion for determining seismic vulnerability, the proposed method conserves the
most expensive ingredient: time of the experienced professional."
Gulkan and Sözen (1999) showed that the wall and column areas influence the drift
on the ground floor. Hassan and Sözen (1997) method is practical and

66
straightforward to use. Still, the major drawback of this method is the underlying
assumption that the quality of construction, quality of material, and as-built
properties of the buildings examined are uniform. The method itself is somehow a
force-based assessment procedure, but the effect of concrete strength is ignored
(Yakut, 2004).
Evaluation of Özcebe et al. (2003) procedure with TEC-2007 for the IO performance
state can be seen in Table 3-9. The unsatisfactory buildings may be assessed by a
3.57 % relative consistency ratio, and the method is evaluated to be 30.64 %
consistent with TEC-2007. The total consistency ratio is calculated as described in
the above paragraphs.
Table 3-9 Evaluation of Özcebe et al. (2003) procedure with TEC-2007 for IO 10 %
case
TEC IO 10 % Özcebe et al. 2003 Ratio (%) Relative Ratio (%)
U U 2.86 3.57
U S 60.32 75.40
U M 16.83 21.03
S U 0.00 0.00
S S 18.73 93.65
S M 1.27 6.35
Consistency (%) 30.64
Evaluation of Özcebe et al. (2003) procedure with TEC-2007 for the LS performance
state can be seen in Table 3-10. The unsatisfactory buildings may be assessed by a
3.76 % relative consistency ratio, and the method is evaluated to be 39.20 %
consistent with TEC-2007. The total consistency ratio is calculated as described in
the above paragraphs.

67
Table 3-10 Evaluation of Özcebe et al. (2003) procedure with TEC-2007 for LS 2 %
case
TEC LS 2 % Özcebe et al. 2003 Ratio (%) Relative Ratio (%)
U U 2.54 3.76
U S 51.43 76.06
U M 13.65 20.19
S U 0.32 0.98
S S 27.62 85.29
S M 4.44 13.73
Consistency (%) 39.20
Yakut's (2004) procedure has two different assessment versions. The only difference
between them is including or excluding the masonry filler walls in the assessment
procedure. Evaluation of Yakut (including walls) procedure with TEC-2007 for the
IO performance can be seen in Table 3-11. The unsatisfactory buildings may be
assessed by a 50.78 % relative consistency ratio, and the method is evaluated to be
46.39 % consistent with TEC-2007.
Table 3-11 Evaluation of Yakut (2004) procedure (including walls) with TEC-2007
for IO 10 % case
TEC IO 10 % Yakut (including walls) Ratio (%) Relative Ratio (%)
U U 40.75 50.78
U S 39.50 49.22
S U 14.11 71.43
S S 5.64 28.57
Consistency (%) 46.39
Evaluation of Yakut (2004) (including walls) procedure with TEC-2007 for the LS
performance state can be seen in Table 3-12. The unsatisfactory buildings may be

68
assessed by a 49.77 % relative consistency ratio, and the method is evaluated to be
44.83 % consistent with TEC-2007.
Table 3-12 Evaluation of Yakut (2004) procedure (including walls) with TEC-2007
for LS 2 % case
TEC LS 2 % Yakut (including walls) Ratio (%) Relative Ratio (%)
U U 33.86 49.77
U S 34.17 50.23
S U 21.00 65.69
S S 10.97 34.31
Consistency (%) 44.83
Evaluation of Yakut (2004) (excluding walls) procedure with TEC-2007 for the IO
performance state for the EQ having a probability of exceedance of 10 % in 50 years
lifetime can be seen in Table 3-13. The unsatisfactory buildings may be assessed by
a 50.00 % relative consistency ratio, and the method is evaluated to be 45.77 %
consistent with TEC-2007.
Table 3-13 Evaluation of Yakut (2004) procedure (excluding walls) with TEC-2007
for IO 10 % case
TEC IO 10 % Yakut (excluding walls) Ratio (%) Relative Ratio (%)
U U 40.13 50.00
U S 40.13 50.00
S U 14.11 71.43
S S 5.64 28.57
Consistency (%) 45.77
Evaluation of Yakut (2004) (excluding walls) procedure with TEC-2007 for the LS
performance state for the EQ having a probability of exceedance of 2 % in 50 years

69
lifetime can be seen in Table 3-14. The unsatisfactory buildings may be assessed by
a 48.85 % relative consistency ratio, and the method is evaluated to be 44.20 %
consistent with TEC-2007.
Table 3-14 Evaluation of Yakut (2004) procedure (excluding walls) with TEC-2007
for LS 2 % case
TEC LS 2 % Yakut (excluding walls) Ratio (%) Relative Ratio (%)
U U 33.23 48.85
U S 34.80 51.15
S U 21.00 65.69
S S 10.97 34.31
Consistency (%) 44.20
The primary objective for walk-down and preliminary SVA procedures is to assess
the unsatisfactory buildings correctly. In order to compare the assessment procedures
used in this study, the relative consistency percentages for unsatisfactory buildings
are tabulated, and this comparison can be seen in Table 3-15. Sucuoğlu et al. (2007)
method is not included in the table since all 321 school buildings are determined to
be unsatisfactory by this method.

70
Table 3-15 Comparison of assessment procedures with TEC-2007 for school
buildings
Assessment
Procedure
Ratios for Relative
Consistency of U-U case
Ratios of Total
Consistency
TEC IO 10 % TEC LS 2 % TEC IO
10 %
TEC LS
2 %
ATC-21/FEMA-154
(1998) 78.68 77.63 75.39 66.98
Sucuoğlu and Yazgan
(2003) 7.75 7.31 24.30 33.95
Hassan and Sözen
(1997) 50.78 51.60 68.69 64.65
Özcebe et al. (2003) 3.57 3.76 30.64 39.20
Yakut (2004)
(including walls) 50.78 49.77 46.39 44.83
Yakut (2004)
(excluding walls) 50.00 48.85 45.77 44.20
ATC-21/FEMA-154 (1998) SVA method is evaluated to be approximately 80
percent relatively and 75 % overall consistent with TEC-2007 for RC school
buildings in Turkey.
Hassan and Sözen (1997) and Yakut (2004) procedures are approximately 50 percent
relative consistent with TEC-2007 for RC school buildings in Turkey. Since there
are usually big openings on the masonry walls, including or excluding the masonry
walls of RC school buildings, do not cause a significant change in Yakut's (2004)
procedure.

71
Sucuoğlu and Yazgan (2003), Sucuoğlu et al. (2007), and Özcebe et al. (2003)
procedures that rely mostly on visual properties of buildings such as irregularities
are not consistent with TEC-2007 for RC school buildings in Turkey.
Muvafık and Özdemir (2018) studied the correlation of walk-down and preliminary
assessment methods with 50 buildings that are totally collapsed or severely damaged
in Van EQ, 23rd October 2011. Muvafık and Özdemir (2018) concluded that Yakut’s
preliminary assessment method is examined to be the most successful one, with 86%
accuracy.
The differences in assessment results are due to different parameters taken into
consideration in different assessment procedures. It should be noted that the
performances of the RC school buildings are determined by analysis software, and
the real performances may, of course, be different.
Although none of the procedures were found to adequately determine the
performance in conformance with TEC-2007, the ATC-21/FEMA-154 (1998)
method is the most suitable one to assess approximately the performance of existing
RC school buildings consistent with TEC-2007. Since the Turkish EQ Code is in
force and obligatory for all RC school buildings, the method which has the best
consistency with TEC-2007 is advised to be preferred for rapid assessment purposes,
which is ATC-21/FEMA-154 (1998).
3.3 Proposed Preliminary Assessment Method
As mentioned in the previous section, the ATC-21/FEMA-154 (1998) walk-down
SVA method is determined to be 75.39 % overall consistent with TEC-2007 for RC
school buildings in Turkey. As mentioned in Table 3-1, these ratios are for IO
performance level and an EQ with a probability of occurrence of 10 % in 50 years;
i.e., if the building satisfies IO performance, it is labeled as “Satisfactory” (S), and
if not it is labeled as “Unsatisfactory”(U). The ratios, i.e., the evaluation of ATC-21
(FEMA 154) method for the EQ having a probability of exceedance of 2 % in 50

72
years, is given in Table 3-2. Comparison of assessment procedures with TEC-2007
for school buildings is shown in Table 3-15.
Assessment of vulnerable buildings in EQ prone regions has always become a
challenging task for structural engineering. Since the ATC-21/FEMA-154 (1998)
method has been developed to determine the vulnerable buildings that would show
collapse or collapse prevention performance states under the design EQ, it is not
expected to match one to one with TEC-2007 assessment results. The basic
disadvantage for ATC-21 (FEM-154) (1998) procedure is the lack of contribution of
material properties for the assessment of the buildings.
Considering the large number (more than 55 thousand) of RC school buildings in
Turkey and inaduacy of inelastic analysis, it is clear that a simple and convenient
practical assessment method would be useful for structural engineers. In order to
develop a more convenient assessment method, material properties of structural
components as well as size and orientation of them should be taken into account.
Yakut's (2004) preliminary assessment procedure for existing RC buildings is
suitable for this purpose, and its overall consistency with TEC-2007 is 46 %. Only
the continuous infill walls without openings are taken into account by Yakut’s (2004)
method, likewise other structural analysis procedures. The infill walls of RC school
buildings generally have large openings. Because the number of continuous infill
walls without openings is low, the BCPI values calculated by including or excluding
the infill walls are quite close to each other. It can be seen in Table 3-11, Table 3-12,
Table 3-13, and Table 3-14 that the difference between TEC-2007 consistencies of
including or excluding infill walls are quite low. Since there is not much difference
between the BCPI values of RC school buildings by including or excluding the
masonry walls, BCPI values calculated without including masonry walls are
preferred.
In order to develop a preliminary assessment method that is more consistent with
TEC-2007, ATC-21 (FEMA-154) (1998) method is improved by modifying the
penalties for structural irregularities and determining the basic structural score by

73
taking into account BCPI of Yakut (2004) preliminary assessment method.
Combining the two approaches, size, orientation, and material properties of the
structural components are taken into account with structural irregularities. The
study's database consists of 321 RC school buildings used to find the best penalties
for structural irregularities. The proposed preliminary assessment method is
explained briefly below.
BCPI of RC school buildings is calculated as described in Yakut's (2004) preliminary
assessment method. Since the amount of continuous walls is negligible for most RC
school buildings, and there is not much difference between the TEC-2007
consistency results of Yakut's (2004) methods, BCPI is preferred to be calculated by
excluding walls.
BSS is determined concerning BCPI in both orthogonal directions. If BCPI is greater
than equal to 1.2, the BSS is 100, otherwise 90.
BCPI ≥ 1.2 => BSS = 100
BCPI < 1.2 => BSS = 90
The penalties determined for the structural irregularities are subtracted from the BSS
to find the Total Structural Score (TSS). The penalty scores of structural
irregularities determined by many trials for the best consistency with TEC-2007 are
listed below in Table 3-16.

74
Table 3-16 Penalties for structural irregularities
Structural Irregularity Penalty Score
Average Condition -10
Poor Condition -20
Vertical Irregularity -40
Torsion -40
Soft-story -40
Plan Irregularity -40
Pounding Effect -10
Short Column -20
Weak Story -40
Heavy Overhang -10
TSS > 80 => “S” (Satisfactory)
TSS < 80 => “U” (Unsatisfactory)
If TSS = 80 and Total Penalty Score ≥ -10 => “S”
If the shear wall ratio (with respect to surface area) for all stories for both of the
orthogonal directions is greater than 0.004 (0.4 %), the building is accepted to be
“S”.
Evaluation of the proposed procedure with TEC-2007 for the LS performance state
for the EQ having a probability of 2 % in 50 years lifetime can be seen in Table 3-17.
The unsatisfactory buildings may be assessed by a 91.09 % relative consistency ratio,
and the method is evaluated to be 81.00 % consistent with TEC-2007.

75
Table 3-17 Evaluation of proposed procedure with TEC-2007 for LS 2 % case
TEC IO 10 % Proposed Method Ratio (%) Relative Ratio (%)
U U 73.21 91.09
U S 7.17 9.91
S U 11.83 60.32
S S 7.79 39.68
Consistency (%) 81.00
Evaluation of the proposed procedure with TEC-2007 for the IO performance state
for the EQ having a probability of 10 % in 50 years lifetime can be seen in Table
3-18. The unsatisfactory buildings may be assessed by a 91.78 % relative consistency
ratio, and the method is evaluated to be 71.96 % consistent with TEC-2007.
Table 3-18 Evaluation of proposed procedure with TEC-2007 for IO 10 % case
TEC IO 10 % Proposed Method Ratio (%) Relative Ratio (%)
U U 62.62 91.78
U S 5.61 8.22
S U 22.43 70.59
S S 9.35 29.41
Consistency (%) 71.96
It is believed that the proposed preliminary assessment method would be useful for
structural engineers for the assessment of a group of RC school buildings with
respect to TEC-2007. Although TEC-2007 has been modified, and TBEC-2018 is in
effect since January 2019, the proposed method may give insight to structural
engineers about the seismic vulnerabilities of RC school buildings.
Since the consistency of the proposed method with TEC-2007 is more than 90 % for
unsatisfactory buildings, it is advised to be used for preliminary assessment of RC
school building groups.

76

77
CHAPTER 4
4 DETAILED ASSESSMENT
4.1 Introduction to Detailed Assessment Procedures
The third category among assessment procedures that involve the in-depth
evaluation of the buildings is the detailed assessment procedures. Detailed
assessment procedures employ linear or non-linear analysis of the related structures
and require dimensions of structural components and the reinforcement details of the
buildings. Displacement Coefficient Method (FEMA-440, 2005), TEC-2007,
TBEC-2018, FEMA-356 (2000), and Urban Renewal Law (URL) (MEU, 2013 and
2019) are examples of detailed assessment procedures which are used in this study.
Dimensions of structural components, the reinforcement details, and the mechanical
properties of materials of the related buildings may be obtained from structural
application drawings or as-built features of the structure determined by site surveys,
in-situ, and laboratory testing. There may be many deficiencies between structural
drawings and as-built properties of buildings in developing countries like Turkey. It
is strongly advised to use the as-built properties to overcome the inconsistent
assessment results for countries like Turkey.
After obtaining the buildings' required data, a representative structural model is
formed, and linear or non-linear analysis techniques are employed to determine the
response of the structure for an anticipated EQ. The obtained response quantities are
then compared with specific accepted values to arrive at a decision regarding the
building's expected performance (Yakut, 2004-2).
Methods for EQ vulnerability assessment of structures are legally introduced by
TEC-2007 (TBEC-2018 since January 2019) in Turkish practice. Chapter 7 of TEC-
2007, named “Evaluation and Strengthening of Existing Buildings,” declares the

78
rules of calculation to be used to assess the existing buildings in EQ zones and the
procedures to be followed for the decisions of strengthening them. Chapter 7 of TEC-
2007 requires member forces to be calculated with unreduced EQ demands, i.e., the
R-value is taken as “1” in the calculations for linear elastic procedures. The seismic
demand on each structural member is calculated and compared with the related
acceptance criteria for that member. The acceptance criteria depend on the state of
stress and the ductility of the corresponding structural member. Demand to capacity
ratios calculated, and the values defining the damage limit states are used for member
assessment. Tables 7.2, 7.3, and 7.4 of TEC-2007 present the demand/capacity ratios
(r) and the damage limit states for structural members of beams, columns, and shear
walls, respectively. Table 7.5 of TEC-2007 states the demand/capacity ratios for
strengthened filled walls, and relative story drifts with respect to defined damage
limit states.
During retrofitting and rehabilitation studies conducted under the scope of ISMEP,
it has been observed that TEC-2007 is likely more conservative in the assessment
and retrofit requirements of existing buildings compared with other code
applications. Therefore, engineering judgment and experience are key factors in
implementing TEC-2007 for seismic assessment and retrofit (IPCU, 2008). The
methods proposed in TEC-2007 are also criticized by Sucuoğlu (2006) in detail.
Yakut et al. (2008) also mentioned that the code recommendations were found to be
too conservative in the linear and nonlinear analysis.
TEC-2007 defines three limit states, i.e., four regions of performance states for
structural members (columns, beams, and shear walls). These limit states are
Minimum Damage Limit (MN), which also corresponds to IO, Safety Limit (GV),
which also corresponds to LS, and Collapsing Limit (GÇ) corresponds to CP. The
minimum damage limit defines the beginning of the behavior beyond elasticity. The
safety limit defines the limit of the behavior beyond elasticity that the section can
safely ensure the strength, and the collapsing limit defines the limit of the behavior
before collapsing (Kalem, 2010). This classification is for ductile elements and does

79
not apply to structural members damaged in a brittle behavior. The schematic
description of the damage limit states is shown in Figure 4-1 below.
Figure 4-1. Schematic description of damage limit states (TEC-2007)
Beams, columns, and shear walls are primary structural elements for RC buildings.
TEC-2007 requires all structural members to be ductile on their expected failure
mode. It allows a certain percentage of members that do not satisfy the code's
acceptable limits for each performance state. First, each member is checked by
damage limits to determine its expected damage state. After all members are checked
against damage limits, the global evaluation of the building is done. (Yakut et al.,
2008)
Procedures to determine the seismic performance of the buildings and the targeted
seismic performance of the buildings are also declared and described in TEC 2007.
IO (Ready for Use), LS, and CP performance states are defined according to the
corresponding damage states MN (IO), GV (LS), and GÇ (CP), respectively (Yakut
et al., 2008). Buildings having deformations beyond CP are in a Collapse

80
performance state. The requirements declared for performance states of buildings in
TEC-2007 are tabulated below in Table 4-1.
Table 4-1 Requirements of performance states given in TEC-2007
Performance State Requirements
IO 1. No columns or shear walls are allowed beyond the IO
level.
2. In any story, at most, 10 % of beams are allowed to be in
LS state.
3. No beams are allowed beyond LS level.
LS 1. No columns or shear walls are allowed beyond the CP
level.
2. In any story, at most, 30 % of beams are allowed to be in
CP state.
3. The total contribution of the columns in the CP state to
the shear force should not exceed 20 % in any story. It can
be 40 % for the roof story only.
4. The shear carried by columns or shear walls yielded at
both ends shall not exceed 30 % of the total story shear in
any story.
CP 1. No columns or shear walls are allowed beyond the CP
level,
2. In any story, at most, 20 % of beams are allowed to be in
a Collapse state.
3. The shear carried by columns or shear walls yielded at
both ends shall not exceed 30 % of the total story shear in
any story.
TEC-2007 determines the performance states according to the type of the building
and the probability of occurrence of the estimated EQ within 50 years. For school

81
buildings, two performance objectives, namely IO and LS, are required to be
satisfied. For an EQ having a probability of 10 % of exceedance in 50 years, school
buildings are required to satisfy the IO performance state. For an EQ having a
probability of 2 % of exceedance in 50 years, school buildings are required to satisfy
the LS performance state. For an EQ having a probability of occurrence of 2 % in 50
years, the spectrum corresponds to a probability of exceedance of 10 percent in 50
years is used by multiplying 1.5.
The database of RC school buildings used in this study consists of 321 buildings,
which are assessed according to TEC-2007 by the contractors of IPCU and under the
consultancy of METU professors. In the following sections, the RC school buildings
chosen for the subclasses will be modeled and assessed by other methods and
compared with the assessment results of TEC-2007.
An essential phenomenon about structural or EQ engineering that should be
mentioned while dealing with detailed analysis/assessment methods is the
“exactness.” Sometimes, researchers of structural engineering define somehow an
“exact” solution and compare the other so-called “approximate” solutions to that
“exact” solution (Freeman et al., 2004). Dr. Dykes defined structural engineering as:
“Structural Engineering is the Art of molding materials we do not wholly understand
into shapes we cannot precisely analyze, so as to withstand forces we cannot really
assess, in such a way that the community at large has no reason to suspect the extent
of our ignorance” (Schmidt, 2009).
Performance-based EQ engineering recently focused on the simplified procedures
that resulted in improved techniques for buildings with generally regular structural
and geometrical properties. Gülkan et al. (2005) mentioned that “the performance of
performance-based methods has not been tested by nature, so the goodness of a given
method is assessed against results calculated for another method or technique.”
Generally, a nonlinear dynamic time history is deemed to be the baseline “exact”
solution for structural engineering studies, but unfortunately, there is nothing to be
called as “really or naturally exact” for structural engineers.

82
4.2 Modeling and Pushover Analysis of RC School Buildings
Recent developments in performance-based procedures provide valuable
information for the SVA of existing structures (ATC-40, 1996; FEMA-356, 2000).
Unfortunately, there are important shortcomings in these procedures in general. The
first shortcoming is the requirement of nonlinear analysis capabilities that most
structural engineers do not have in common.
Nonlinear structural analysis procedures are not as standard as the linear elastic
analysis methods (Wight et al., 1999). Another significant disadvantage is the
number of buildings that should be evaluated for seismic performance before the
next EQ is extensive, and the procedures developed are time-consuming. Therefore,
engineers need more straightforward methods for SVA of buildings. (Sucuoğlu and
Günay, 2005)
Nonlinear Static Procedure based on pushover analysis has been introduced into EQ
engineering by ATC-40 (1996) and FEMA 273 and 274 (1997) within the context of
performance-based seismic evaluation and design (Aydınoğlu and Celep, 2005) and
in use for more than two decades. Pushover analysis has become popular for seismic
performance evaluation since it is relatively simple while considering the post-elastic
behavior of the whole structure (Kalem, 2010).
Pushover analysis is a static and nonlinear procedure. The structure is pushed by
increasing the magnitude of the lateral load step by step until the ultimate/failure
deformation is reached. The lateral load is applied according to a predefined manner.
The increments are small enough to determine plastification and the failure sequence
of the structural members of the whole structure. The overall capacity of the structure
is determined by considering the strength and deformation capacities of structural
members (columns and beams). In fact, the standard elastic and geometric stiffness
matrices for frame elements are progressively modified at each step of lateral load
increment under constant gravity loads. By this step-by-step procedure, pushover
analysis monitors the progressive stiffness degradation of a building while it is

83
loaded beyond the elastic behavior. (Hasan et al., 2002; Oğuz, 2005; Güneyisi, 2007;
Kalem, 2010)
The capacity curve of the building is drawn by using the corresponding lateral load
and deformation values obtained by pushover analysis. After that, the building's
expected performance under an estimated EQ can be evaluated by matching the
corresponding deformation demand for the related lateral load caused by that EQ
The major advantages of the pushover analysis method are its simplicity and its’
potential to expose weak links in the structure; its’ major disadvantage is the
questionable validity of a predefined/fixed lateral load pattern determined by only
one mode of vibration of the structure (Riddell et al., 2002). Therefore
assessment/design procedures based on pushover analysis can be reliably used only
for regular and low- to mid-rise buildings (Aydınoğlu and Celep, 2005). Considering
this major drawback, pushover analysis based assessment procedures are reliably
applicable for RC school buildings in Turkey.
A general sequence of steps is involved in performing the pushover analysis of the
selected 36 RC school buildings in this study. Below, the steps of performed
pushover analyzes are described shortly one by one. First of all, the 3-D models of
the selected buildings are formed, and the gravity loads composed of dead and live
loads are applied to the structural model.
Throughout the thesis study, it is observed that the as-built properties of school
buildings may have deficiencies from blueprints of application projects or template
designs. Using member sizes and amount of reinforcement somewhat different than
application projects or template designs is not uncommon in Turkish construction
practice. Using the blueprints of application or template designs for modeling and
analysis purposes would not give proper solutions in Turkish construction practice.
In order to overcome the inconsistencies between the blueprints and as-built
construction, as-built properties are used for modeling purposes for all of the selected
RC school buildings. SAP2000 v.14.1 software is used for modeling and analysis

84
purposes. 3-D (three dimensional) models of all selected 36 RC school buildings
were prepared using SAP2000 software.
All dimensions of the structural members are modeled according to site surveys.
Columns and beams are modeled as line elements (flexural members). RC shear
walls are modeled by using wide column analogy. Rigid diaphragms are employed
for modeling the story floors. The reinforcement details of the structural members
are also modeled according to the destructive and non-destructive in-situ test results.
Infill walls are not modeled since there are no continuous infill walls, i.e., there are
large windows or door openings on the walls, and the effect of the non-continuous
infill walls for seismic vulnerability is negligible for RC school buildings.
As-built material properties determined by field investigations and experimental
works were considered for 3-D modeling of the selected buildings. The concrete
compressive strength of each RC school building was determined using both
destructive (concrete core sampling and uniaxial compression laboratory testing) and
non-destructive (Schmidt hammer testing) methods.
Dead loads were calculated and applied to the model according to the load analysis.
Live loads were calculated and used according to TEC-2007, TS-498 (1987), and
TS-500 (2000). The buildings were then analyzed to calculate elastic forces and
displacements under gravity loads only at first. The pushover analysis phase starts
after the analysis under gravity loads. It is observed that all RC school buildings are
safe under gravity loads.
The masses of each story were applied/lumped to the mass centers of each floor, and
all seismic forces were applied to the mass centers. The weights of the stories are in
compliance with the story masses, and no eccentricity was applied. Viscous damping
values are taken as 5 % for all selected buildings.
Cracked section rigidities were used for defining the stiffness of beams and columns.
The cracked section stiffness of beams is defined as 40 % of uncracked section
stiffness, and cracked section stiffness of columns and shear walls are defined as 65

85
% of uncracked section stiffness. The rigidity of the cracked sections is modeled by
multiplying the moment of inertias by 0.40 for beams and by 0.65 for columns.
The material fibers furthest from the neutral axis starts initial yielding first. Under
the effect of the increasing moment, plasticity propagates through the neutral axis
and along the length of the member until a fully-developed plastic hinge is formed.
The spread of the plasticity causes post-elastic degradation of flexural stiffness of a
frame member, and the flexural stiffness of the member is exhausted when increasing
moment, continues as plasticity spreads through the section depth and along the
member length to form a fully-developed plastic hinge, at which point the flexural
stiffness of the member section is exhausted (Hasan et al., 2002).
SAP2000 provides default and user-defined hinge properties options to model the
nonlinear behavior of structural components. For beams, default M-M hinges, and
for columns default, P-M2-M3 hinges are defined at the member ends for all selected
36 buildings. Built-in default hinge properties of SAP2000 software are typically
based on ATC-40 (1996) and FEMA-356 (2000) criteria. Half of the cross-section
depth is suggested as the plastic hinge length by ATC-40 (1996). The modeled
default moment-rotation relationship can be seen below in Figure 4-2.

86
Figure 4-2. Modeled default moment-rotation relationship (Yakut, 2008)
Total equivalent seismic loads acting on the RC school buildings laterally (base shear
forces) were also calculated in compliance with TEC-2007 in the EQ direction
considered. The structural behavior factor, R, was taken as “1,” as described by TEC-
2007. The total base shear due to EQ was distributed to the stories as an inverted
triangle in compliance with TEC-2007.
The possibility of shear failure should be controlled before pushover analysis with
the full seismic loads applied. It is observed that there is no shear failure for the
selected buildings. It is followed and checked by screening the hinge propagation,
i.e., damage sequence of the analyzed RC school buildings using SAP-2000
software.
After that lateral seismic loads are extracted from the model, and the predefined
patterns for the pushover analysis were applied. A unit force of 1 N is applied to the
mass center of the first floor, and loads proportional to the triangular distribution
calculated are applied to the mass centers of upper floors. Lateral loads proportional
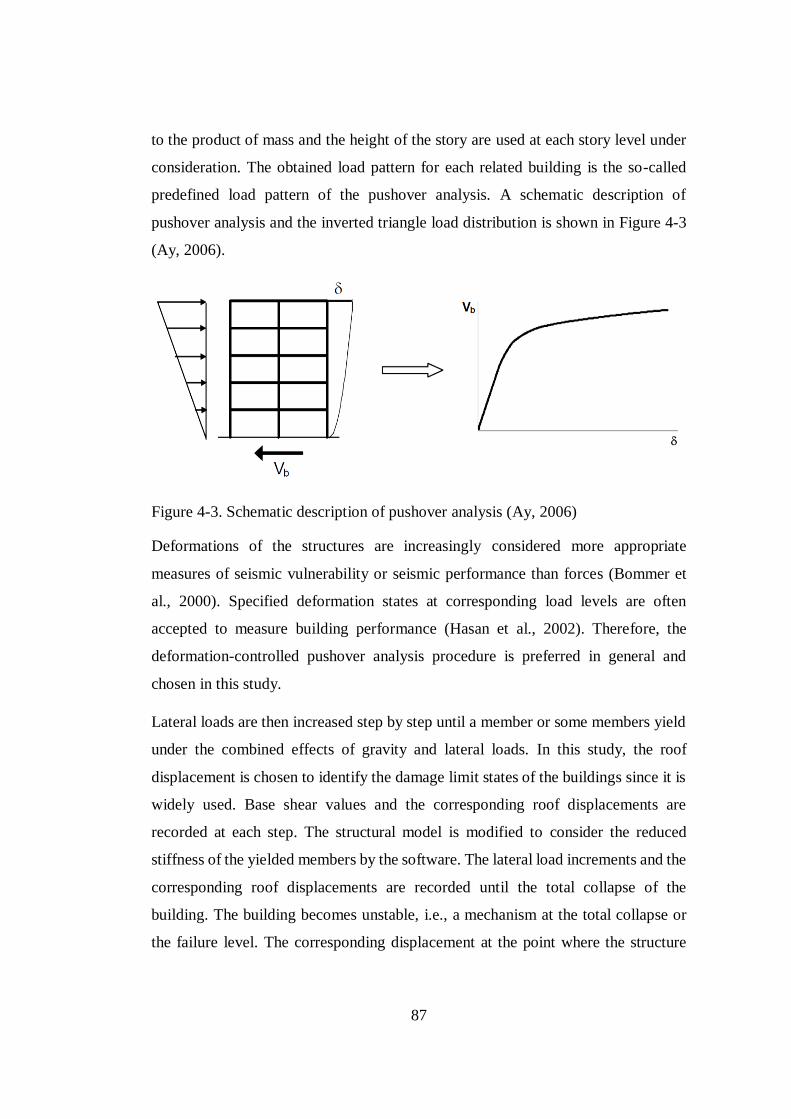
87
to the product of mass and the height of the story are used at each story level under
consideration. The obtained load pattern for each related building is the so-called
predefined load pattern of the pushover analysis. A schematic description of
pushover analysis and the inverted triangle load distribution is shown in Figure 4-3
(Ay, 2006).
Figure 4-3. Schematic description of pushover analysis (Ay, 2006)
Deformations of the structures are increasingly considered more appropriate
measures of seismic vulnerability or seismic performance than forces (Bommer et
al., 2000). Specified deformation states at corresponding load levels are often
accepted to measure building performance (Hasan et al., 2002). Therefore, the
deformation-controlled pushover analysis procedure is preferred in general and
chosen in this study.
Lateral loads are then increased step by step until a member or some members yield
under the combined effects of gravity and lateral loads. In this study, the roof
displacement is chosen to identify the damage limit states of the buildings since it is
widely used. Base shear values and the corresponding roof displacements are
recorded at each step. The structural model is modified to consider the reduced
stiffness of the yielded members by the software. The lateral load increments and the
corresponding roof displacements are recorded until the total collapse of the
building. The building becomes unstable, i.e., a mechanism at the total collapse or
the failure level. The corresponding displacement at the point where the structure

88
becomes a mechanism is called the ultimate displacement. The base shear force at
the ultimate displacement point is called the ultimate base shear force.
The base shear values and the corresponding roof displacements are plotted to obtain
the pushover curve of the entire structure. A representative obtained pushover curve
of the buildings is shown in Figure 4-4 (Kalem, 2010).
Figure 4-4. Obtained Pushover Curve of Structure (Kalem, 2010)
Push-over analysis and pushover curves provide valuable information for the SVA
and rehabilitation of existing RC buildings. The increasing roof displacement that
buildings experience is associated with EQs having increasing intensities of ground
motion, and the displacement is directly associated with the building's performance
level (Hasan et al., 2002). Pushover-based seismic evaluation methods might be
considered a breakthrough in EQ engineering since engineers can directly calculate
the nonlinear seismic demand and evaluate the response of the structure by using
pushover curves (Fajfar, 2002).

89
3-D models of each selected 36 buildings were developed in SAP2000 and then
subjected to pushover analysis together with the modal analysis in two
principal/orthogonal directions to obtain the base shear versus roof displacement
curves as described above. After that, these obtained capacity curves were
bilinearized to determine the yield base shear force (Vy), yield roof drift ratio (δy),
ultimate base shear force (Vu), and the ultimate drift ratio of (δu) of the selected
buildings for both directions. Then modal properties that conform to the initial linear
part of the bilinearized pushover curves were determined consistently.
4.3 Bilinearization and Obtaining Equivalent SDOF Parameters
Using 3-D models for seismic analysis is complicated and time-consuming. Seismic
behaviors of Multi-Degree-of-Freedom (MDOF) systems can be approximated with
certain accuracy by Equivalent Single Degree of Freedom (ESDOF) systems whose
properties are computed by conducting the push-over analysis (Kuramoto et al.,
2000, and Decanini et al., 2001). The primary requirement for certain accuracy of
conversion is the governance of the first mode for EQ response. Other requirements
for accuracy of determining EQ response using ESDOF conversion are; there should
not be torsion, push-over curves should be suitable for bilinear conversion, and
strength degradation should not be severe (Kuramoto et al., 2000, and Decanini et
al., 2001). The selected RC school buildings in this study satisfy the listed
requirements. RC school buildings are ideal for determining the EQ response by
using SDOF models.
It should be mentioned that there is no standard method for bilinearization of
pushover curves. In this study, pushover curves of each building approximated by a
bilinear curve using bilinearization of pushover curves are engineering judgment and
equal-area criterion as recommended in ATC-40 (1996) and FEMA 356 (FEMA,
2000). The procedure is also described by Ay (2006) in detail.

90
The areas under the actual pushover curve and the approximated bilinear curve
should be the same, and this phenomenon is stated as the equal-area rule in ATC-40
(1996) and FEMA 356 (FEMA, 2000). There is no specific point on the pushover
curve to describe the yielding of the building. The yield point on the pushover curves
was defined as the point where the building starts to soften definitely. Variations in
the initial stiffness of the bilinear curve would lead to considerable variations in Vy
and δy. Therefore, the first linear part of the bilinear curve should coincide with the
actual pushover curve at the 0.60 Vy point to overcome the variations.
Line segments of the idealized bilinear curves should be located using an iterative
procedure which approximately balances the areas above and below the curve. The
effective lateral stiffness, Ke, is taken as the secant stiffness calculated at a base shear
force equal to 60% of the structure's effective yield strength. The post-elastic
stiffness ratio, α, is determined by a line segment that starts from the Vy and δy points,
passes through the actual curve, and ends at the calculated target displacement.
(Özün, 2007)
Schematic descriptions of the bilinearization of pushover curves can be seen in
Figure 4-5 below.

91
Figure 4-5. Idealized Bilinear Force-Displacement Curve (FEMA 356, 2000)
After bilinearization of all pushover curves is completed, all curves are converted to
acceleration displacement response spectra (ADRS) format, i.e., the pushover curve
of the MDOF model is plotted in the Sa vs. Sd domain of the equivalent SDOF system
by using the corresponding modal properties of each RC school building. The
following equations were used to determine the spectral acceleration and spectral
displacement values.
𝑆𝑎 =𝑉
𝛼1𝑊 (4-1)
𝑆𝑑 =𝛥𝑟𝑜𝑜𝑓
𝑃𝐹1𝑥𝜙𝑟𝑜𝑜𝑓,1 (4-2)
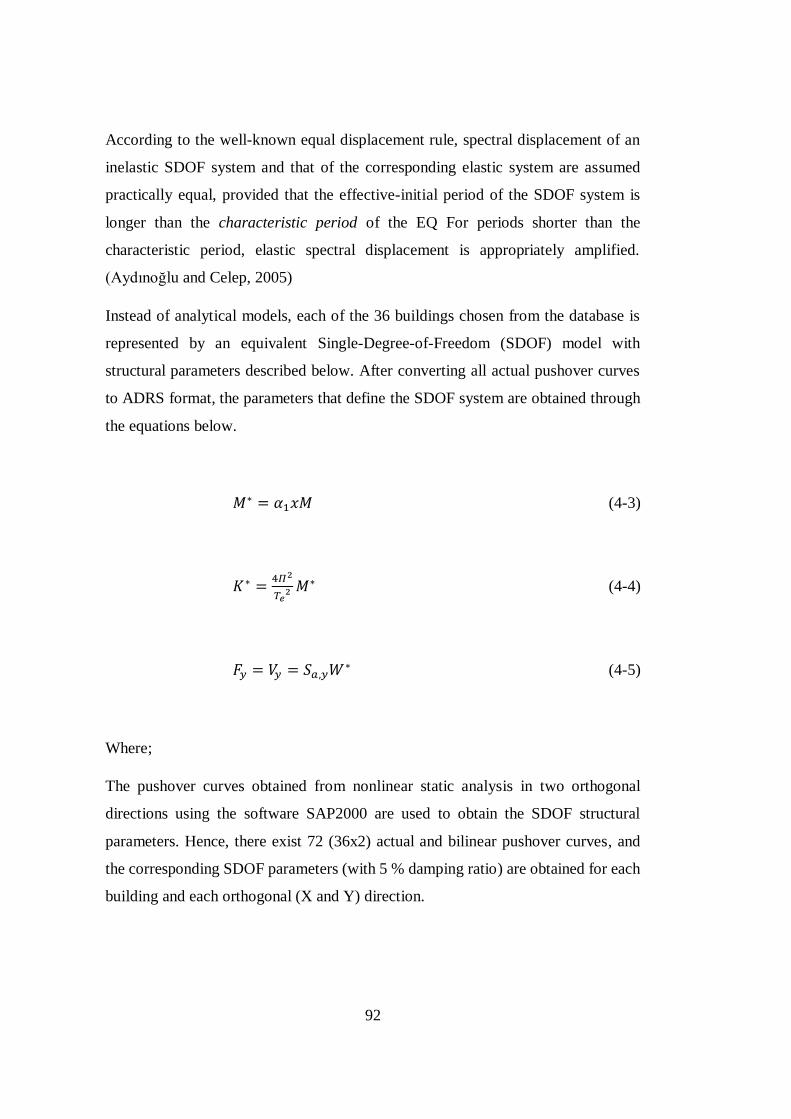
92
According to the well-known equal displacement rule, spectral displacement of an
inelastic SDOF system and that of the corresponding elastic system are assumed
practically equal, provided that the effective-initial period of the SDOF system is
longer than the characteristic period of the EQ For periods shorter than the
characteristic period, elastic spectral displacement is appropriately amplified.
(Aydınoğlu and Celep, 2005)
Instead of analytical models, each of the 36 buildings chosen from the database is
represented by an equivalent Single-Degree-of-Freedom (SDOF) model with
structural parameters described below. After converting all actual pushover curves
to ADRS format, the parameters that define the SDOF system are obtained through
the equations below.
𝑀∗ = 𝛼1𝑥𝑀 (4-3)
𝐾∗ =4𝛱2
𝑇𝑒2 𝑀∗ (4-4)
𝐹𝑦 = 𝑉𝑦 = 𝑆𝑎,𝑦𝑊∗ (4-5)
Where;
The pushover curves obtained from nonlinear static analysis in two orthogonal
directions using the software SAP2000 are used to obtain the SDOF structural
parameters. Hence, there exist 72 (36x2) actual and bilinear pushover curves, and
the corresponding SDOF parameters (with 5 % damping ratio) are obtained for each
building and each orthogonal (X and Y) direction.
93
Then, the capacity-related properties of RC school buildings are determined with
respect to story numbers and the EQ direction considered. As mentioned earlier, the
longer directions of the buildings were accepted to be the “X” direction, and the
orthogonal and shorter directions were taken to be the “Y” direction. EQ lateral loads
are applied to these two orthogonal directions.
All structural parameters for the selected 36 buildings with respect to orthogonal
directions are given in the tabular form in Appendix C. The equivalent SDOF system
parameters are also provided for all selected buildings in Appendix D.
4.4 The Structural Parameters of School Buildings
In order to obtain the capacity-related properties of RC frame buildings in Turkey,
Yakut (2008) performed a comprehensive study in which 33 sample buildings were
selected to represent a typical subset of a comprehensive database consisting of
nearly 500 buildings. The statistical properties of all capacity parameters needed to
describe the capacity curve were given in Table 1-8 for each number of stories
(Yakut, 2008). The capacity-related properties of RC school buildings determined in
this study are listed below (Table 4-2, Table 4-3, and Table 4-4) with parameters of
Yakut (2008) in the same tables with respect to the number of stories. The parameters
and the deriving formulas were described in Section 2.1, but the parameters are listed
below again. Remembering that in Yakut’s (2008) study, building databases were
mostly composed of residential buildings. By listing the capacity curve parameters
on the same table, we have the opportunity to compare the RC school buildings with
the RC residential buildings in Turkey.
1
sy
CSa
(4-6)

94
2
24
y e
y
Sa T gSd
(4-7)
u ySa Sa (4-8)
u ySd Sd (4-9)
The value of Cs is taken as 0.10 for all cases in order to compare with the results of
Yakut (2008). The value of Cs only affects the γ, and these values did not affect
previous studies.

95
Table 4-2 Statistics of Capacity Curve Parameters for 3 Story RC Buildings
Parameter 3 Story (X) 3 Story (Y) Yakut (2008)
Sdy (cm)
Mean 2,51 2,12 1,06
Std.Dev. 2,29 1,37 0,29
Say (g)
Mean 0,17 0,20 0,18
Std.Dev. 0,08 0,15 0,07
Sdu (cm)
Mean 3,36 5,56 10,65
Std.Dev. 2,79 5,22 2,65
Sau (g) Mean 0,23 0,29 0,21
Std.Dev. 0,12 0,25 0,08
Cs Mean 0,10 0,10 0,10
Std.Dev. 0,00 0,00 0,00
Te Mean 0,80 0,67 0,34
Std.Dev. 0,61 0,44 0,11
PF Mean 1,31 1,26 1,24
Std.Dev. 0,06 0,12 0,04
α Mean 0,83 0,77 0,88
Std.Dev. 0,07 0,08 0,06
γ Mean 1,26 1,47 1,58
Std.Dev. 0,63 1,23 0,52
λ Mean 1,33 1,45 1,15
Std.Dev. 0,14 0,32 0,12
μ Mean 2,84 3,39 9,26
Std.Dev. 0,66 1,06 3,12

96
Table 4-3 Statistics of Capacity Curve Parameters for 4 Story RC Buildings
Parameter 4 Story (X) 4 Story (Y) Yakut (2008)
Sdy (cm)
Mean 3,24 3,28 1,67
Std.Dev. 3,34 1,76 0,71
Say (g)
Mean 0,11 0,14 0,16
Std.Dev. 0,08 0,12 0,04
Sdu (cm)
Mean 7,55 9,06 12,84
Std.Dev. 4,09 4,23 3,61
Sau (g) Mean 0,13 0,17 0,18
Std.Dev. 0,10 0,16 0,05
Cs Mean 0,10 0,10 0,10
Std.Dev. 0,00 0,00 0,00
Te Mean 1,21 1,16 0,47
Std.Dev. 0,62 0,49 0,11
PF Mean 1,31 1,22 1,28
Std.Dev. 0,08 0,19 0,02
α Mean 0,80 0,72 0,83
Std.Dev. 0,07 0,10 0,05
γ Mean 0,84 0,96 1,30
Std.Dev. 0,59 0,93 0,39
λ Mean 1,25 1,27 1,14
Std.Dev. 0,19 0,11 0,03
μ Mean 3,58 3,42 7,67
Std.Dev. 1,81 1,79 3,01

97
Table 4-4 Statistics of Capacity Curve Parameters for 5 Story RC Buildings
Parameter 5 Story (X) 5 Story (Y) Yakut (2008)
Sdy (cm)
Mean 4,62 4,18 1,52
Std.Dev. 3,98 2,82 0,35
Say (g)
Mean 0,04 0,07 0,12
Std.Dev. 0,02 0,07 0,04
Sdu (cm)
Mean 14,01 12,65 14,06
Std.Dev. 11,41 6,54 5,40
Sau (g) Mean 0,04 0,09 0,14
Std.Dev. 0,03 0,09 0,04
Cs Mean 0,10 0,10 0,10
Std.Dev. 0,00 0,00 0,00
Te Mean 2,40 1,85 0,55
Std.Dev. 1,27 1,02 0,14
PF Mean 1,46 1,40 1,29
Std.Dev. 0,22 0,21 0,01
α Mean 0,76 0,72 0,83
Std.Dev. 0,06 0,08 0,03
γ Mean 0,28 0,50 1,02
Std.Dev. 0,20 0,43 0,32
λ Mean 1,19 1,23 1,16
Std.Dev. 0,16 0,11 0,06
μ Mean 3,79 3,83 7,86
Std.Dev. 1,67 2,43 2,22
For all 3, 4, and 5 story RC school buildings, yield spectral displacements for X and
Y directions are greater than the yield spectral displacements of RC residential
buildings calculated by Yakut (2008). But the situation is vice versa for ultimate
spectral displacements. It also means that, in Turkey, the ductilities of 3, 4, and 5

98
story RC school buildings are smaller than the ductilities of residential buildings in
general. The yield and ultimate spectral accelerations of 4 and 5 story RC school
buildings are smaller than the corresponding values of 4 and 5 story residential
buildings. The yield and ultimate spectral accelerations of 3 story RC school
buildings are smaller than the corresponding values of residential buildings for X-
direction but vice versa for the Y-direction.
The yield and ultimate spectral displacement values of RC school buildings increase
gradually with increasing number of stories, but the situation is vice versa for yield
and ultimate spectral accelerations. Ultimate spectral displacements for RC school
buildings are less than 1 percent of the total building heights for all cases. Effective
periods of RC school buildings also increase with increasing number of stories. The
ductility values also increase in small amounts with the increasing number of stories,
and the average value of ductility is 3.47 for RC school buildings.
The average yield spectral displacements for RC school buildings are found to be
0.23, 0.25, and 0.27 percent of the total height for 3, 4, and 5 story buildings,
respectively. The ultimate displacements are found to be 1.11, 2.06, and 2.34 percent
of the total height for 3, 4, and 5 story RC school buildings, respectively.
The effective periods of 3, 4, and 5 story RC school buildings are greater than the
effective periods of corresponding residential buildings. The reason for high
effective periods is using the cracked section rigidities of structural members for
analysis. The participation factor (PF) and modal mass factor (α) of the RC school
buildings do not show significant variation with the number of stories.
The yield over-strength ratios (γ) were found to decrease significantly with
increasing number of stories. The average yield over strength ratios for 5-story RC
school buildings is less than 1.0. In the study of Yakut (2004), it is declared that “RC
frame buildings that have yield over-strength ratio of less than 1.65 would perform
poorly against a devastating EQ in Turkey”. Unfortunately, the average yield over
strength ratios are less than 1.65 for 3, 4, and 5 story RC school buildings.

99
Since all analyses are done using as-built properties of RC school buildings, and the
variation of the structural properties are considerable, standard deviation values are
high for structural parameters, as is excepted.
The damage sequence of structural members can be observed by pushover analysis.
It is observed that for RC school buildings, the damage sequence of structural
members “generally” starts by yielding of the beam ends at the lower stories and then
yielding propagates to beams of upper stories. The total collapse of the buildings
occurs typically by the yielding of the column bases of the ground stories. The
damage sequence of RC school buildings is, in fact, the accepted sequence of ductile
beam mechanism. That is because RC school buildings are generally regular in plan
and do not have vertical irregularity. Unfortunately, the ductilities and the ultimate
displacement capacities are not sufficient. The main reason for the low ductilities is
the unconfined yielding regions, i.e., insufficient/small rotation capacities.
There are few buildings that the damage sequence starts with the yielding of column
bases or both column and beam ends. This is not a desirable sequence.
For all RC school buildings, yielding starts at the lowest story and then propagates
to the upper stories.
4.5 Determination of Performance Limit States
The point at which the system is no longer capable of satisfying a performance level
is defined as the limit state from the engineering perspective (Ay, 2006). The limit
states of the structures are, by definition, directly related to the damage levels of the
structure. There are generally four damage levels defined in the negligible, light,
moderate, and heavy literature. The immediate occupancy (IO) performance level
corresponds to negligible and light damage states. The life safety performance level
corresponds to the moderate damage state, and the collapse prevention performance
level corresponds to the heavy damage state.

100
One of the significant steps of F.C. generation is the determination of performance
levels, and this is directly related to the realistic and comprehensive limit state
determination. These indicators are the key factors and directly affect the resulting
F.C.s. (Erberik and Elnashai, 2004; Ay, 2006)
There are two main categories of response parameters, namely local and global. The
main response parameters will not be discussed within the scope of this study. The
limit states for the RC frame structures considered within the scope of this study are
defined in terms of roof drift. The damage limit states in fragility studies may be
defined as inter-story drift ratio (maximum lateral displacement between two
consecutive stories normalized by the story height), global drift ratio (maximum roof
drift normalized by the building height), roof drift, story shear force, etc. (Akkar et
al., 2005). In this study, roof drift is chosen for the definition of the damage limit
states. It is believed that global roof drift is the simplest and the most frequently used
(maybe most meaningful) response parameter for fragility analysis.
FEMA 356 (ASCE 2000) defined the three limit states qualitatively for structural
members as tabulated in Table 4-5 below.
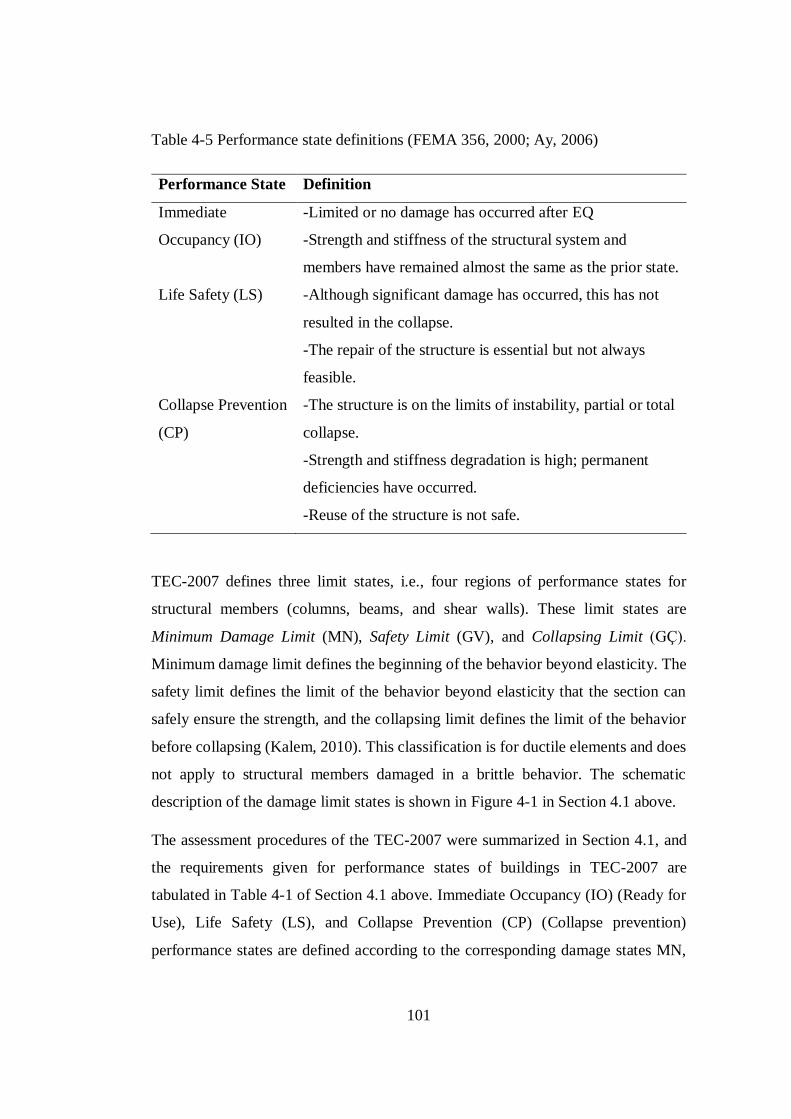
101
Table 4-5 Performance state definitions (FEMA 356, 2000; Ay, 2006)
Performance State Definition
Immediate
Occupancy (IO)
-Limited or no damage has occurred after EQ
-Strength and stiffness of the structural system and
members have remained almost the same as the prior state.
Life Safety (LS) -Although significant damage has occurred, this has not
resulted in the collapse.
-The repair of the structure is essential but not always
feasible.
Collapse Prevention
(CP)
-The structure is on the limits of instability, partial or total
collapse.
-Strength and stiffness degradation is high; permanent
deficiencies have occurred.
-Reuse of the structure is not safe.
TEC-2007 defines three limit states, i.e., four regions of performance states for
structural members (columns, beams, and shear walls). These limit states are
Minimum Damage Limit (MN), Safety Limit (GV), and Collapsing Limit (GÇ).
Minimum damage limit defines the beginning of the behavior beyond elasticity. The
safety limit defines the limit of the behavior beyond elasticity that the section can
safely ensure the strength, and the collapsing limit defines the limit of the behavior
before collapsing (Kalem, 2010). This classification is for ductile elements and does
not apply to structural members damaged in a brittle behavior. The schematic
description of the damage limit states is shown in Figure 4-1 in Section 4.1 above.
The assessment procedures of the TEC-2007 were summarized in Section 4.1, and
the requirements given for performance states of buildings in TEC-2007 are
tabulated in Table 4-1 of Section 4.1 above. Immediate Occupancy (IO) (Ready for
Use), Life Safety (LS), and Collapse Prevention (CP) (Collapse prevention)
performance states are defined according to the corresponding damage states MN,

102
GV, and GÇ, respectively (Yakut et al., 2008). Buildings having deformations
beyond CP are in a Collapse performance state.
For school buildings, TEC-2007 requires two different performance states for two
different earthquake load levels. School buildings should satisfy the IO performance
state for an earthquake loading having a probability of exceedance of 10 % in 50
years lifetime and LS for an earthquake ground motion having a probability of
exceedance of 2 % in 50 years lifetime.
As mentioned earlier, the database of RC school buildings used in this study consists
of 321 buildings, which are assessed according to TEC-2007 by the contractors of
IPCU and under the consultancy of professors of METU. But the 321 RC school
buildings were evaluated only for whether they satisfy the requirements of TEC-
2007 or not, i.e., the damage and the performance levels of buildings are not
determined individually.
In order to be consistent with TEC-2007, three limit states, which are immediate
occupancy, life safety, and collapse prevention, are considered for RC school
buildings in this study. The limit states of each RC school building are determined
individually for precise analysis and generation of precise F.C.s. The limit states are
determined by considering the yield (Δy) and the ultimate (Δu) spectral roof
displacements of related equivalent SDOF model of each RC school building. As
described by Akkar et al. (2005) and as it is accepted in many other studies, the yield
displacement point and the ultimate spectral roof displacement point are taken as the
limits for IO and CP performance states, respectively. The buildings with target
displacements below the IO limit state are in the IO performance state. The limits for
LS performance state are accepted as 75 % (three quarters) of the ultimate roof drift.
Performance limits for IO, LS, and CP are denoted as ΔIO, ΔLS, and ΔCP,
respectively. ΔCP values are also the ultimate displacements for each building.
Idealized pushover curves for equivalent SDOF systems of each building are used to
determine the limit state values. The limit state values in terms of spectral roof drifts
are given for each RC school building with respect to EQ direction in Appendix D.

103
The schematic description of the determination of performance limits for
performance states is shown in Figure 4-6 below. The ultimate roof drift is taken as
the drift value when the structure became a mechanism. A sudden drop in the load
capacity is observed after the system becomes a mechanism. There were no numeric
problems that caused the interruption of the analysis. The average values of
performance limits for 3, 4, and 5 story RC school buildings are given below in Table
4-6 and the limits are shown in terms of drift raions in Table 4.7.
Figure 4-6. Assumed performance limits for performance states (Kalem, 2010)
Table 4-6 The average performance limits for RC school buildings
Number of Stories ΔIO (cm) ΔLS (cm) ΔCP (cm)
X Y X Y X Y
3 2,82 2.09 6.34 5.96 8.45 7.95
4 3.70 3.61 8.93 9.02 11.90 12.02
5 6.35 5.65. 14.51 12.75 19.35 17.00
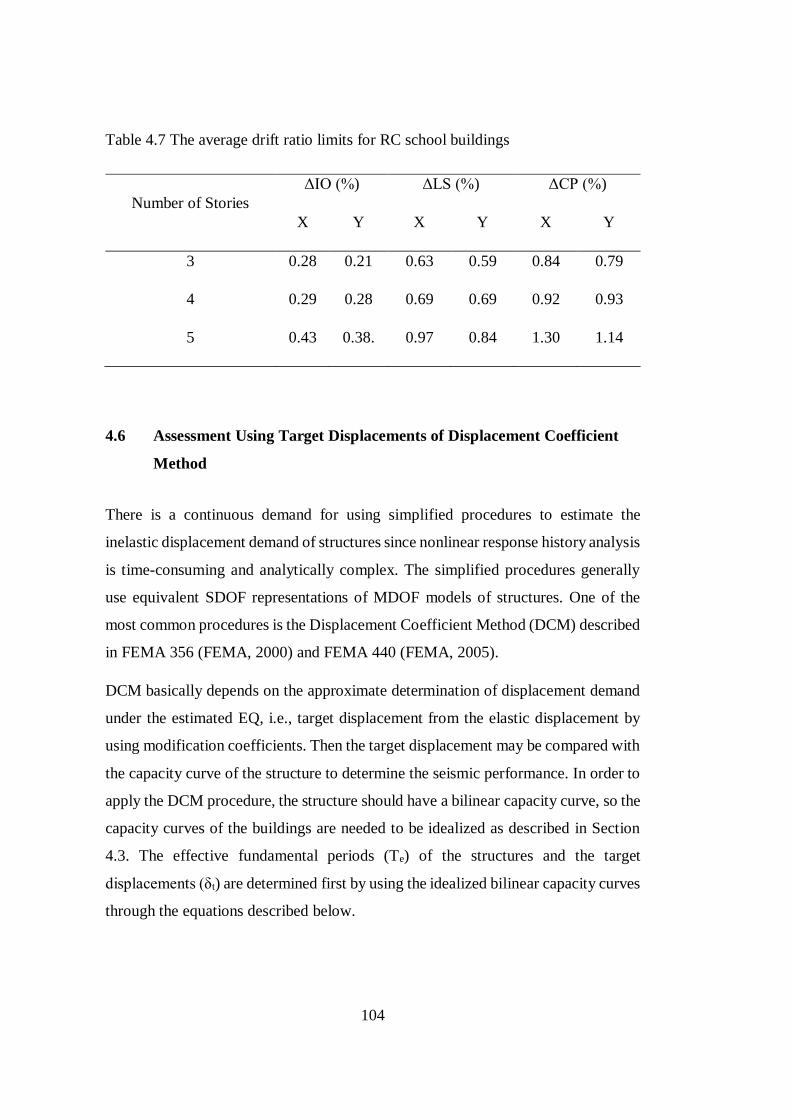
104
Table 4.7 The average drift ratio limits for RC school buildings
Number of Stories
ΔIO (%) ΔLS (%) ΔCP (%)
X Y X Y X Y
3 0.28 0.21 0.63 0.59 0.84 0.79
4 0.29 0.28 0.69 0.69 0.92 0.93
5 0.43 0.38. 0.97 0.84 1.30 1.14
4.6 Assessment Using Target Displacements of Displacement Coefficient
Method
There is a continuous demand for using simplified procedures to estimate the
inelastic displacement demand of structures since nonlinear response history analysis
is time-consuming and analytically complex. The simplified procedures generally
use equivalent SDOF representations of MDOF models of structures. One of the
most common procedures is the Displacement Coefficient Method (DCM) described
in FEMA 356 (FEMA, 2000) and FEMA 440 (FEMA, 2005).
DCM basically depends on the approximate determination of displacement demand
under the estimated EQ, i.e., target displacement from the elastic displacement by
using modification coefficients. Then the target displacement may be compared with
the capacity curve of the structure to determine the seismic performance. In order to
apply the DCM procedure, the structure should have a bilinear capacity curve, so the
capacity curves of the buildings are needed to be idealized as described in Section
4.3. The effective fundamental periods (Te) of the structures and the target
displacements (δt) are determined first by using the idealized bilinear capacity curves
through the equations described below.

105
𝑇𝑒 = √𝐾𝑖
𝐾𝑒𝑇𝑖 (4-10)
𝛿𝑡 = 𝐶0𝐶1𝐶2𝐶3𝑆𝑎𝑇𝑒
2
4𝜋2 𝑔 (4-11)
The coefficient (modification number) C0 relates the top roof displacement of the
structure to the displacement of an equivalent SDOF system, i.e., the coefficient that
converts the SDOF spectral displacement to MDOF (elastic) roof displacement.
The corresponding values of the coefficient C0 with respect to the number of stories
are represented in Table 4-8.
Table 4-8 Values for Coefficient C0 (FEMA 356, 2000)
Number of Stories C0
1 1.0
2 1.2
3 1.3
5 1.4
10+ 1.5
The coefficient C1 is used to modify the elastic displacement to the corresponding
inelastic displacement, i.e., the expected inelastic displacement divided by elastic
displacement.
𝐶1 = 1 +𝑅−1
𝑎𝑇𝑒2 (4-12)

106
𝐶1 = {𝐶1(𝑇 = 0.2𝑠), 𝑇 < 0.2𝑠
1.0, 𝑇 > 1.0𝑠 (4-13)
Where “a” in this equation is 130, 90, and 60 for soil sites B, C, and D, respectively.
𝑅 =𝑆𝑎
𝑉𝑦 𝑊⁄𝐶𝑚 (4-14)
Where Cm is the effective mass factor, and the values for Cm with respect to the
number of stories and the structural system are presented in Table 4-9.
Table 4-9 Values for Effective Mass Factor (Cm) (FEMA 356, 2000)
Number of Stories Concrete Frame Concrete Shear Wall
1-2 1.0 1.0
≥3 0.9 0.8
The coefficient C2 incorporates the effects of pinched hysteretic shape, stiffness
degradation, and strength deterioration, i.e., depends on the structural system and
varies with the hysteretic behavior.
𝐶2 = 1 +1
800(
𝑅−1
𝑇)2 (4-15)
𝐶2 = {𝐶2(𝑇 = 0.2𝑠), 𝑇 < 0.2𝑠
1.0, 𝑇 > 0.7𝑠 (4-16)

107
The coefficient C3 reflects the increase in the displacements due to dynamic P-Δ
effects.
𝐶3 = {1.0, 𝛼 ≥ 0
1 +𝛼(𝑅−1)3 2⁄
𝑇𝑒
(4-17)
The target (demand) roof displacement (d) of each RC school building in both
orthogonal directions under the estimated EQs of TEC-2007 were computed using
the DCM summarized above. Then the target displacements are compared with the
performance limit states derived in the previous section to determine the expected
seismic performance of each RC school building. The seismic performance levels of
each RC school building for both orthogonal directions and the assessments of TEC-
2007 are presented in Table 4-10 and Table 4-11 below.

108
Table 4-10 The comparison of DCM and TEC-2007 10% EQ
ID DCM Perf.-X DCM Perf.-Y TEC-2007 (10 %) Perf.
1 Collapse LS Collapse
2 Collapse Collapse IO
3 Collapse Collapse Collapse
4 Collapse Collapse IO
5 Collapse Collapse Collapse
6 Collapse LS Collapse
7 Collapse Collapse Collapse
8 Collapse LS Collapse
9 CP CP Collapse
10 LS LS Collapse
11 LS LS IO
12 LS LS Collapse
13 Collapse CP Collapse
14 CP Collapse Collapse
15 Collapse Collapse Collapse
16 Collapse CP Collapse
17 CP LS Collapse
18 Collapse Collapse Collapse
19 Collapse Collapse IO
20 Collapse Collapse IO
21 Collapse CP Collapse
22 Collapse Collapse IO
23 Collapse Collapse Collapse
24 Collapse Collapse Collapse
25 Collapse Collapse Collapse

109
Table 4-10 Continued
ID DCM Perf.-X DCM Perf.-Y TEC-2007 (10 %) Perf.
26 Collapse CP Collapse
27 CP CP Collapse
28 Collapse Collapse Collapse
29 Collapse Collapse IO
30 Collapse Collapse LS
31 Collapse Collapse IO
32 Collapse Collapse Collapse
33 Collapse Collapse IO
34 Collapse Collapse Collapse
35 Collapse IO LS
36 Collapse Collapse LS
Table 4-11 The comparison of DCM and TEC-2007 for 2% EQ
ID DCM Perf.-X DCM Perf.-Y TEC-2007 LS
(2%)
1 Collapse Collapse Collapse
2 Collapse Collapse LS
3 Collapse Collapse Collapse
4 Collapse Collapse LS
5 Collapse Collapse Collapse
6 Collapse Collapse Collapse
7 Collapse Collapse Collapse
8 Collapse LS Collapse
9 Collapse Collapse Collapse
10 CP LS Collapse
11 CP CP LS

110
Table 4-11 Continued
ID DCM Perf.-X DCM Perf.-Y TEC-2007 LS
(2%)
12 LS LS Collapse
13 Collapse Collapse Collapse
14 Collapse Collapse Collapse
15 Collapse Collapse Collapse
16 Collapse Collapse Collapse
17 Collapse LS Collapse
18 Collapse Collapse Collapse
19 Collapse Collapse LS
20 Collapse Collapse LS
21 Collapse Collapse Collapse
22 Collapse Collapse LS
23 Collapse Collapse Collapse
24 Collapse Collapse Collapse
25 Collapse Collapse Collapse
26 Collapse Collapse Collapse
27 Collapse Collapse Collapse
28 Collapse Collapse Collapse
29 Collapse Collapse LS
30 Collapse Collapse LS
31 Collapse Collapse LS
32 Collapse Collapse Collapse
33 Collapse Collapse LS
34 Collapse Collapse Collapse
35 Collapse LS LS
36 Collapse Collapse LS

111
According to DCM assessment results, the RC school buildings perform better in Y
(short) directions since the number of continuous frames in Y-directions is more than
in X-direction for RC school buildings. 11 (30,5 %) of the buildings are in collapse
performance state for both orthogonal directions according to DCM and also
according to TEC-2007 assessment results for an EQ of 10 % occurrence probability
in 50 years, and 20 (55,5 %) of them are in collapse performance state for an EQ of
2 % exceedance probability in 50 years. For other buildings, there is not a meaningful
correlation between the DCM and TEC-2007 assessment results.
4.7 Assessment by ASCE 41 Analysis
One of the well-known and most commonly used detailed assessment procedures is
FEMA 356 (FEMA, 2000) or ASCE 41 (ASCE, 2007). The ASCE/SEI 41-06 named
as Seismic Rehabilitation of Existing Buildings (ASCE, 2007), commonly known as
ASCE 41 standard, was developed from the FEMA 356 named as Prestandard and
Commentary for the Seismic Rehabilitation of Buildings (FEMA, 2000).
The procedures of ASCE 41 (ASCE, 2007) are not explained in detail since it is not
in the scope of this study. But it is worth to mention that the procedures used by
ASCE 41 (ASCE, 2007) and TEC-2007 are basically similar in concept. Unreduced
building demands are used, and individual members are assessed using member-
specific assessment criteria by ASCE-41 (ASCE, 2007) linear procedures. There is
an important difference between the two methods, which is the acceptance value “m”
of ASCE-41 (ASCE; 2007) is compared by the demand-to-capacity ratio of a
structural member, while the acceptance value “r” of TEC-2007 is derived for the
reserve capacity ratio. Both “m” and “r” values represent the demands to capacity
ratios of the structural members. The acceptance criteria of the structural members
depending on the acceptance value “m,” are listed in Chapter 6 of ASCE-41 (ASCE,
2007). IPCU prefers ASCE-41 (ASCE, 2007) since it is more intuitive than TEC2007
and not as dependent upon initial assumptions (IPCU, 2008).

112
The nonlinear static procedure of ASCE-41 (ASCE, 2007) uses the plastic rotation
values (in radians) of structural members in order to compare with the limit values
of performance levels and assess them, respectively. The outcome of comparisons of
demand values with the acceptance criteria or performance level criteria depends on
whether the structural member satisfies the requirements of the corresponding
performance level or not (Yakut and Erduran, 2005).
The major drawback for ASCE-41 is that although there are procedures to assess the
structural members individually, no guidelines are provided on how to evaluate the
performance level of the building as a whole; i.e., the final decision remains to the
judgment of the structural engineer (Yakut and Erduran, 2005).
The nonlinear static procedure of ASCE-41 is applied in both principal directions to
all 36 selected RC school buildings within the database. The plastic rotation values
of the structural members are determined and compared with the corresponding
values of performance level criteria. In order to assess the performance of the whole
building, the percentages of the structural members satisfying each performance
level are determined. After that, the assessments of the entire buildings are carried
on by using the same criteria of TEC-2007, which is described in Table 4-1 above.
The analyzes are performed for the EQ having a probability of occurrence of 10 %
in 50 years. The seismic performance levels of each RC school building for both
orthogonal directions and the assessments of TEC-2007 are presented in Table 4-12
below.

113
Table 4-12 The comparison of ASCE-41 and TEC-2007 for 10% EQ
ID ASCE-41 Perf.-X ASCE-41 Perf.-Y TEC-2007 (10 %) Perf.
1 Collapse Collapse Collapse
2 Collapse Collapse IO
3 IO Collapse Collapse
4 Collapse Collapse LS
5 Collapse Collapse Collapse
6 Collapse Collapse Collapse
7 IO IO Collapse
8 Collapse IO Collapse
9 Collapse Collapse Collapse
10 Collapse Collapse Collapse
11 Collapse Collapse IO
12 Collapse Collapse Collapse
13 Collapse IO Collapse
14 Collapse LS Collapse
15 Collapse CP Collapse
16 Collapse Collapse Collapse
17 IO IO Collapse
18 Collapse LS Collapse
19 Collapse Collapse IO
20 Collapse Collapse IO
21 Collapse LS Collapse
22 Collapse Collapse IO
23 Collapse IO Collapse
24 Collapse Collapse Collapse
25 Collapse IO Collapse

114
Table 4-12 Continued
ID ASCE-41 Perf.-X ASCE-41 Perf.-Y TEC-2007 (10 %) Perf.
26 Collapse LS Collapse
27 Collapse CP Collapse
28 Collapse Collapse Collapse
29 Collapse Collapse IO
30 Collapse Collapse LS
31 Collapse Collapse IO
32 IO IO Collapse
33 Collapse Collapse IO
34 Collapse CP Collapse
35 Collapse CP LS
36 Collapse Collapse LS
It is seen that the RC school buildings perform better in Y (short) directions,
according to ASCE-41 (ASCE, 2007) assessment results. 9 (25 %) of the buildings
are in collapse performance state in both directions according to ASCE-41 and
according to TEC-2007. 12 (33,3 %) of the buildings are in collapse performance
state according to TEC-2007 and in collapse performance state at least in one
direction, according to ASCE-41 (ASCE, 2007). For other buildings, there is not a
meaningful correlation between the ASCE-41 (ASCE; 2007) and TEC-2007
assessment results.

115
CHAPTER 5
5 ASSESSMENT BY TURKISH BUILDING EARTHQUAKE CODE
5.1 Introduction to TBEC-2018 for RC School Buildings
Turkey has updated the EQ code with the advances in EQ engineering as well as the
increase in social requirements since the first EQ code in 1940. Turkish EQ Code -
2007 (TEC-2007) is no more in use after the new code (TBEC-2018) is in force since
January 2019. TBEC-2018 has improved the TEC-2007 to provide a substantially
expanded scope.
The primary revision in the new code is in favor of the Turkish hazard map prepared
by AFAD (Disaster and Emergency Management Presidency of Turkey). The
previous map introduced in 1996 was based on a seismic zonation of the country into
five hazard zones. Each zone had a unique value of PGA on a stiff soil as wide as
100’s of km.s in some regions within a return period of 475 years. A single PGA
value was found to be insufficient to represent the degree of hazard. However, the
new seismic hazard map provided contour maps based on geographical coordinates
so that the seismic hazard is expressed via spectral acceleration rather than a PGA
value. For short periods of T=0.2 and 1.0 sec, site-specific spectral acceleration maps
are provided on stiff soils for a given return period of 2475, 475, 72, and 43 years,
respectively.
“A comparison of the 1996 Seismic Zones Map and the 2018 Seismic Hazard Map,
both 475-year PGA based, are presented in Figure 1. The mean PGA value in Zone
1 (red zone) of the 1996 map is 0.4g. The total area of the PGA > 0.4g regions is
seemingly less in the 2018 map, especially in the Aegean West and along the Eastern
Iranian border.” (Sucuoğlu, 2018)

116
Moreover, the four types of soil conditions (Z1 to Z4) in TEC-2007 are turned into
six types from ZA to ZF, in the order of the best to the worst.
Design spectrum and the spectrum parameters are described in a remarkably
different fashion in the new code. For a given stiff soil, the seismic hazard map
suggests the SS and S1, spectral accelerations at 0.2 and 1.0 sec, respectively, while
the site condition gives FS and F1 values which are used to modify the spectral
accelerations to attain the design values, namely, SDS and SD1, respectively. Finally,
the design spectrum is constructed in which the corner periods TA and TB are
obtained from the associated ratios of SDS and SD1. Design spectrum illustration and
equations in TBEC-2018 are shown in Figure 5-2 and Figure 5-2 below.
Figure 5-1. Design spectrum illustration in TBEC-2018

117
Figure 5-2. Design spectrum equations in TBEC-2018
For the buildings, the probability of exceedance of the design EQ within a period of
50 years is 10 % in TEC-2007. EQs with different probabilities of exceedance are
defined in Chapter 7 of TEC-2007 to be considered in evaluating and reinforcing the
existing buildings. However, TBEC-2018 proposes four different levels of EQ
ground motion, namely DD1, DD2, DD3, and DD4, in the design stage. “DD1” is
defined as the “maximum expected EQ ground motion level,” which accounts for a
2 % probability of exceedance in 50 years and a return period of 2475 years. “DD2”
is the “standard design EQ ground motion level,” which accounts for a 10 %
probability of exceedance in 50 years and a return period of 475 years. “DD3” is
defined as the “frequently expected EQ ground motion level,” which accounts for a
50 % probability of exceedance in 50 years and a return period of 72 years. “DD4”
is the “service level EQ ground motion,” which accounts for a 50 % probability of
exceedance in 30 years and a return period of 43 years.
Seismic performances of the buildings in TEC-2007 are only available in Chapter 7
(evaluation and reinforcement of the existing buildings) of TEC-2007 as defined as
IO, LS, CP, and collapse (C) levels. Each of them is determined based on force-based
damages of structural elements and relative story drifts. In TBEC-2018, on the other

118
hand, the performance levels are explicitly defined to specify not only the
performance of the existing building but also the design targets of the new building
as follows:
Continued Operation Performance (CO): Damage in structural members is
negligible.
Limited Damage Performance (LD): Limited damage in structural components
leading to minimal inelastic behavior.
Controlled Damage Performance (CD): Damage in structural components is
significant but possible to repair.
Collapse Prevention Performance (CP): Damage in structural components is severe;
however, a partial or total collapse of the building is prevented.
In the new EQ code, there are many classifications governing the seismic design of
the buildings, such as Building Use Category (BKS), Seismic Design Category
(DTS), and Building Height Category (BYS). Figure 5-3 shows those categories
associated with the corresponding ranks. Based on its critical facility assigned to the
building, school buildings have a BKS of 1, which leads to an importance factor of
1.5. It was 1.4 in the previous code. As a new category, in TBEC-2018, the seismic
design category (DTS) designates the seismic intensity at the design site under four
main categories of DTS1 to DTS4 (or DTS1a to DTS4a) in terms of BKS and SDS.
The subscript “a” stands for imposing additional requirements in the design of
critical buildings such as schools, hospitals, etc. BYS “building height category” in
Figure 5-3 is related to the building height above the foundation or the rigid
basement, and it is employed in selecting the design procedure.
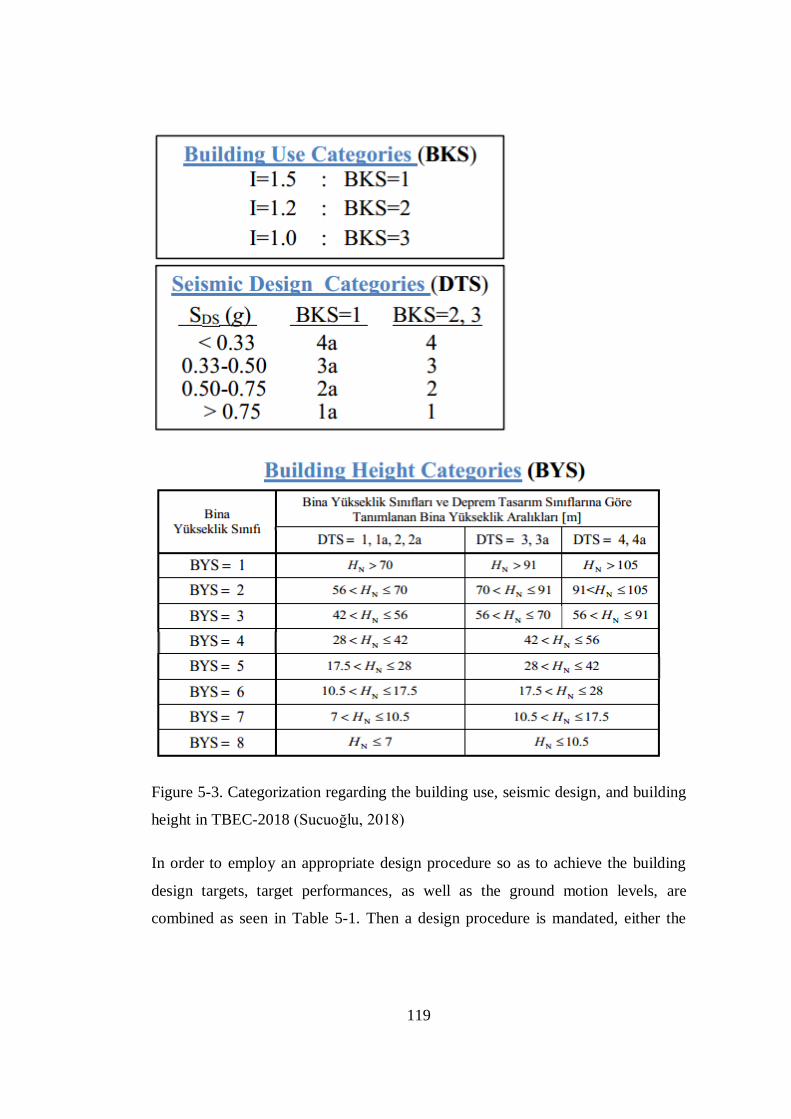
119
Figure 5-3. Categorization regarding the building use, seismic design, and building
height in TBEC-2018 (Sucuoğlu, 2018)
In order to employ an appropriate design procedure so as to achieve the building
design targets, target performances, as well as the ground motion levels, are
combined as seen in Table 5-1. Then a design procedure is mandated, either the

120
conventional Force-Based Design (FBD) or the Performance-Based Assessment and
re-Design (PBD).
Table 5-1 Performance targets and design procedures for new buildings (TBEC-
2018)
A “Controlled Damage” under DD-2, or the 475-year design ground motion
performance target, is set for all buildings, excluding the tall buildings. However, the
seismic design category (DTS) of 1a or 2a (critical buildings under high-intensity
ground motions) necessitates applying the advanced target performances, which are
the performance-based procedures under DD-1 and DD-3, force-based preliminary
design under the DD-2 design spectra. The advanced performance targets are
Limited Damage under the service earthquake DD-3, and Controlled Damage under
the maximum expected earthquake DD-1. The associated relations between the
ground motion level, target performance, and the must-use design procedure are
given in Table 5-1.
TBEC-2018 provides Table 5-2 for the performance of the existing buildings where
the ordinary performance target is controlled damage (CD) under the 475-year DD-
2 earthquake, and the assessment/design procedure is performance-based. The
school buildings with DTS of 1a or 2a require advanced performance targets
accompanied by limited damage and controlled damage under DD3 and DD1 design
spectra, respectively. A new displacement-based linear elastic procedure is
developed for existing buildings, whereas if the method being invalid, the nonlinear
analysis procedures have to be utilized.

121
Table 5-2 Performance targets and design procedures for existing buildings (TBEC-
2018)
EQ
GM
Level
DTS = 1, 2, 3, 3a, 4, 4a DTS = 1a, 2a
Ordinary
Performance
Target
Design/Assessment
Procedure
Advanced
Performance
Target
Design/Assessment
Procedure
DD3 __ __ LD PBD
DD2 CD PBD __ __
DD1 __ __ CD PBD
Forced-based analysis and design procedures implemented with the capacity design
principles are similar to the provisions of TEC-2007, with marked improvement,
however, in the definition of force reduction factors (R) and the over strength factors
(D). The former ranges from 4 to 8, and the latter ranges from 2 to 3. Both values are
assigned to be 1.0 for the assessment of the existing buildings.
TBEC-2018 describes the inter-story drift limits for new designs as follows:
If infill walls and frames are rigidly connected: λ 𝛿𝑖𝑚𝑎𝑥
ℎ𝑖 ≤ 0.008
If infill walls and frames have flexible connections: λ 𝛿𝑖𝑚𝑎𝑥
ℎ𝑖 ≤ 0.016
Where λ is the spectral acceleration ratio of DD-3 to DD-2 as in the range of 0.4 to
0.5 range and κ is 1.0 for concrete.
Sucuoğlu (2018) briefly summarized the new improvements in the new seismic code
TBES-2018. Sucuoğlu (2018) pointed to nonlinear analysis procedures gaining
wider acceptance as performance-based EQ engineering increases its popularity.
Dalyan and Şahin (2019) compared TEC-2007 and TBEC-2018 and told that
significant differences between the two codes are the description of the effective
cross-section stiffness and damage limits of RC sections. Dalyan and Şahin (2019)
122
concluded that effective periods of structures are calculated by TBEC-2018 are
longer than the ones calculated by TEC-2007.
Nemutlu and Sarı (2018) compared TEC-2007 and TBEC-2018 and concluded that
base shear force demands are calculated as 6 % greater by TBEC-2018. Nemutlu and
Sarı (2019) compared TBEC-2018 and IBC-2018 and concluded that base shear
force demands are calculated as 8 % greater by TBEC-2018.
5.2 Assessment of Selected RC School Buildings by TBEC-2018
A total of 36 RC school buildings presented in Appendix-B have been tested for the
performance criteria of existing buildings as per TBEC-2018. According to TBEC-
2018, all the buildings have a BKS of 1.0, leading to an importance factor of 1.5,
whereas it is reduced to unity in the analysis of existing buildings. Then, Ss and S1,
spectral accelerations at 0.2 and 1.0 sec, are acquired from the Turkish Seismic
Hazard Map by entering the geographical coordinates of each building for the return
periods of 2475, 475, and 72 years, respectively. Site classification of the buildings
as per the 2007 code is transformed to the corresponding category of the TBEC-2018
code. Out of 36 school buildings, therefore, ZA, ZC, and ZD soil classes are assigned
to 9, 25, and 2 of the buildings. Since the calculated design spectral accelerations
(SDS) range between 0.50 and 0.75, DTSs of all the buildings are found to be 2a. As
mentioned above, DTS of 2a indicates the necessity of employing a performance-
based assessment approach as well as advanced performance.
For a given DTS of 2a building height category (BYS) are found to be 7, 6, and 5 for
the school buildings with 3, 4, and 5 floors as seen in Figure 5-3. The new seismic
code suggests only two information levels, namely limited and comprehensive. The
comprehensive information level is utilized with a coefficient of 1.0 in the
assessment of the school buildings as the code does not allow the application of the
former to such buildings of critical facilities. In-situ material properties of the
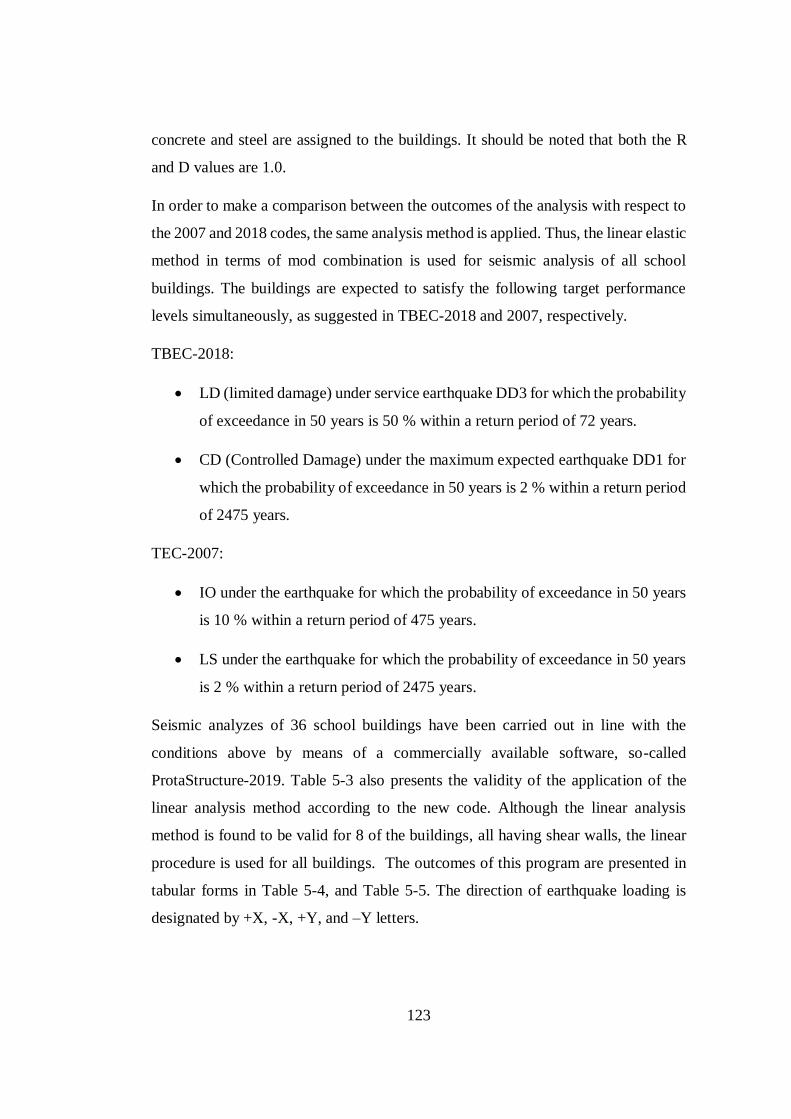
123
concrete and steel are assigned to the buildings. It should be noted that both the R
and D values are 1.0.
In order to make a comparison between the outcomes of the analysis with respect to
the 2007 and 2018 codes, the same analysis method is applied. Thus, the linear elastic
method in terms of mod combination is used for seismic analysis of all school
buildings. The buildings are expected to satisfy the following target performance
levels simultaneously, as suggested in TBEC-2018 and 2007, respectively.
TBEC-2018:
LD (limited damage) under service earthquake DD3 for which the probability
of exceedance in 50 years is 50 % within a return period of 72 years.
CD (Controlled Damage) under the maximum expected earthquake DD1 for
which the probability of exceedance in 50 years is 2 % within a return period
of 2475 years.
TEC-2007:
IO under the earthquake for which the probability of exceedance in 50 years
is 10 % within a return period of 475 years.
LS under the earthquake for which the probability of exceedance in 50 years
is 2 % within a return period of 2475 years.
Seismic analyzes of 36 school buildings have been carried out in line with the
conditions above by means of a commercially available software, so-called
ProtaStructure-2019. Table 5-3 also presents the validity of the application of the
linear analysis method according to the new code. Although the linear analysis
method is found to be valid for 8 of the buildings, all having shear walls, the linear
procedure is used for all buildings. The outcomes of this program are presented in
tabular forms in Table 5-4, and Table 5-5. The direction of earthquake loading is
designated by +X, -X, +Y, and –Y letters.

124
Table 5-3 Control of the linear analysis method as per TBEC-2018 (I: Invalid and V:
Valid)
Building
No
TURKISH EQ CODE 2018
EQ level: DD1 (2 %
in 50 years)
EQ level: DD2 (10 %
in 50 years)
EQ level: DD3 (50 %
in 50 years)
+X -X +Y -Y +X -X +Y -Y +X -X +Y -Y
1 I I I I I I I I V V V V
2 I I I I I I I I I I I I
3 I I I I I I I I I I I I
4 I I I I I I I I I I I I
5 V V V V V V V V V V V V
6 I I I I I I I I I I I I
7 V V V V V V V V V V V V
8 I I I I I I I I I I I I
9 I I I I I I I I I I I I
10 V V V V V V V V V V V V
11 V V V V V V V V V V V V
12 V V V V V V V V V V V V
13 V V V V V V V V V V V V
14 I I I I I I I I I I I I
15 I I I I I I I I I I I I
16 I I I I I I I I I I I I
17 I I I I I I I I V V V V
18 I I I I I I I I I I I I
19 I I I I I I I I V V V V
20 I I I I I I I I I I I I
21 V V V V V V V V V V V V
22 I I I I I I I I I I I I
23 I I I I I I I I I I I I
24 I I I I I I I I I I I I

125
Table 5-3 Continued
Building
No
TURKISH EQ CODE 2018
EQ level: DD1 (2 %
in 50 years)
EQ level: DD2 (10 %
in 50 years)
EQ level: DD3 (50 %
in 50 years)
+X -X +Y -Y +X -X +Y -Y +X -X +Y -Y
25 I I I I I I I I I I I I
26 I I I I I I I I I I I I
27 I I I I V V V V V V V V
28 I I I I I I I I I I I I
29 V V V V V V V V V V V V
30 I I I I I I I I I I I I
31 I I I I I I I I I I I I
32 I I I I I I I I I I I I
33 I I I I I I I I I I I I
34 I I I I I I I I V V V V
35 I I I I I I I I I I I I
36 I I I I I I I I I I I I
According to TBEC-2018, the linear analysis method is found to be valid for 8 of
the 36 buildings, all having shear walls. The linear analysis method is not valid
according to TBEC-2018 for RC school buildings having no shear walls. Buildings
are assessed by TBEC-2018 using linear analysis since they are all analyzed by linear
methods for TEC-2007. In order to compare them properly, the analysis methods
should be similar.
As it is well observed in Table 5-4, detailed seismic assessment of the buildings
according to TBEC-2018 revealed that none of the 36 RC school buildings do satisfy
the LD and CD performance levels. Indeed, in the case of DD1, the maximum
expected earthquake having a probability of occurrence of 2 % in 2475 years, all of
the school buildings appear to be within the collapse level (C). Similar findings were

126
seen under the DD3 - the service earthquake in that none of the buildings achieve the
expected limited damage stage, even entering the collapse zone. As seen in Table
5-4, few buildings seem to have controlled damage (CD) or collapse prevention (CP)
performance states only in Y directions. Therefore, usage of the buildings under
these circumstances poses substantial threats towards life safety, according to TBEC-
2018.
Table 5-4 Performances of the RC school buildings as per TBEC-2018
Bldng. TURKISH BUILDING EQ CODE 2018
No Target Performance level: CD Target Performance level: LD
EQ level: DD1 (2 % in 50 years) EQ level: DD3 (50 % in 50 years)
+X -X +Y -Y +X -X +Y -Y
1 C C C C C C C C
2 C C C C C C C C
3 C C C C C C C C
4 C C C C C C C C
5 C C C C C C CD CP
6 C C C C C C C C
7 C C C C C C C C
8 C C C C C C C C
9 C C C C C C C C
10 C C C C C C C C
11 C C C C C C C C
12 C C C C C C C C
13 C C C C C C C C
14 C C C C C C C C
15 C C C C C C C C
16 C C C C C C C C
17 C C C C C C C C
18 C C C C C C C C

127
Table 5-4 Continued
Bldng. TURKISH BUILDING EQ CODE 2018
No Target Performance level: CD Target Performance level: LD
EQ level: DD1 (2 % in 50 years) EQ level: DD3 (50 % in 50 years)
+X -X +Y -Y +X -X +Y -Y
19 C C C C C C C C
20 C C C C C C C C
21 C C C C C C CD CD
22 C C C C C C C C
23 C C C C C C C C
24 C C C C C C C C
25 C C C C C C C C
26 C C C C C C C C
27 C C C C C C C C
28 C C C C C C C C
29 C C C C C C C C
30 C C C C C C CP CP
31 C C C C C C C C
32 C C C C C C C C
33 C C C C C C C C
34 C C C C C C C C
35 C C C C C C C C
36 C C C C C C C C
The performances of 36 RC school buildings as per TEC-2007 were summarized in
Appendix B. The EQ spectra applied in the analysis differ in 2007 and 2018
provisions. The design EQ, which has the probability of occurrence of 10% in 50
years within a return period of 475 years, is not in the scope of TBEC-2018 for RC
school buildings. Although it is not mandatory, 36 selected RC school buildings are

128
also analyzed by the design EQ by using the same software so that a direct
comparison can be made between the assessment results of EQ codes for the design
EQ According to TEC-2007, RC school buildings are expected to satisfy immediate
occupancy performance level under the design EQ The performances of selected RC
school buildings with respect to TBEC-2018 under the design EQ is given in Table
5-5.
Table 5-5 Performances of the RC school buildings as per TBEC-2018 under design
EQ
Building No
TURKISH BUILDING EQ CODE 2018
Target Performance level: LD
EQ level: DD2 (10 % in 50 years)
+X -X +Y -Y
1 C C C C
2 C C C C
3 C C C C
4 C C C C
5 C C C C
6 C C C C
7 C C C C
8 C C C C
9 C C C C
10 C C C C
11 C C C C
12 C C C C
13 C C C C
14 C C C C
15 C C C C
16 C C C C
17 C C C C
18 C C C C
19 C C C C
20 C C C C
21 C C C C
22 C C C C
23 C C C C
24 C C C C
25 C C C C

129
Table 5-5 Continued
Building No
TURKISH BUILDING EQ CODE 2018
Target Performance level: LD
EQ level: DD2 (10 % in 50 years)
+X -X +Y -Y
26 C C C C
27 C C C C
28 C C C C
29 C C C C
30 C C C C
31 C C C C
32 C C C C
33 C C C C
34 C C C C
35 C C C C
36 C C C C
The assessment reports of all selected 36 RC school buildings performed by
ProtaStructure software are presented in Appendix E.
5.3 Discussion of Results
Linear calculation methods for determining the building performance in EQ have a
limited application on the buildings given in Section-15.5 of TBEC-2018. Otherwise,
a non-linear analysis method is employed. For this reason, the validity of the mod-
superposition method is checked in Table 5-3, in which “V” and “I” stand for “valid”
or “invalid” for linear analysis procedure. Irrespective of the EQ level of DD1, DD2,
and DD3, the linear analysis is found to be accurately applicable for 8 buildings out
of 36. Moreover, 4 buildings fulfilled those constraints in DD2 and DD3 ground
motions. It is evident that the linear analysis method seems to be invalid in the case
of buildings with no shear walls. However, the method is mostly applicable, provided

130
that the buildings have shear walls cross-section of higher than 0.5% by the land area
in both directions.
The density of shear walls in a given principal direction is believed to have a
prominent role in the seismic performance of the buildings (Gülkan and Sözen, 1999;
Yakut, 2004), but unfortunately, most of the buildings in this study have no sufficient
shear walls in either direction to fulfill the code requirements of TEC-2007 as well
as TBEC-2018. Also, the combined effects of low concrete quality and reinforcing
steel help the buildings exhibit these unexpectedly poor performances, irrespective
of the seismic code.
The performances of 36 selected RC school buildings are summarized as per TEC-
2007 in Appendix B and TBEC-2018 in the previous section. While 20 % of the
buildings satisfy the performance requirements of TEC-2007, it is not the same for
TBEC-2018. Excluding a few buildings that have shown satisfactory performance
levels in either X or Y directions for DD-3 EQ, there is no such building that has
fulfilled both DD-1 and DD-3 EQ performance requirements simultaneously for
TBEC-2018.
The base shear forces determined by TEC-2007 and TBEC-2018 are compared and
tabulated below in Table 5-6.
Table 5-6 Comparison of base shear force ratios
Number of Stories
TBEC-2018 / TEC-2007
X-direction Y-direction
3 1.075 1.064
4 1.070 1.070
5 1.078 1.097
Overall 1.074 1.077
Nemutlu and Sarı (2018) compared TEC-2007 and TBEC-2018 and concluded that
base shear force demands are calculated as 6 % greater by TBEC-2018. Nemutlu and

131
Sarı (2019) compared TBEC-2018 and IBC-2018 and concluded that base shear
force demands are calculated as 8 % greater by TBEC-2018.
Consistently, it is determined that the base shear forces of TBEC-2018 are 7.5%
larger than the base shear forces of TEC-2007.
The assessment results reveal that there is not much difference between the codes for
the buildings in this study owing to the deficiency of the shear walls in the buildings
to promote either Turkish Codes. It is evident that TBEC-2018 is more conservative
than TEC-2007.


133
CHAPTER 6
6 ASSESSMENT BY PROVISIONS UNDER URBAN RENEWAL LAW
6.1 Assessment by Provisions Published in 2013
Urban Renewal Law (URL) (no.6306) was accepted by the Turkish Parliament on
16 May 2012 (URL-2013) and in force since then. The primary focus of the law is
to reduce the expected seismic risk due to the vulnerability of existing RC and
masonry buildings having a total height of less than 25 meters and at most 8 stories,
which comprises the majority of the existing vulnerable buildings in Turkey (Binici
et al., 2015).
Detailed provisions (ordinance) for applying the law were accepted by the Turkish
Cabinet and published in the Official Newspaper on 15 December 2012. The 2nd
annex of the ordinance consists of the technical procedures to determine the
vulnerable existing buildings, i.e., critical or tagged buildings, as high risk. The 2nd
annex of the ordinance is generally known as the provisions/code for determining
the critical (or high risk) buildings.
According to the provisions, a building is tagged as highly critical if the building's
performance state under the estimated EQ is neat collapse or CP , i.e., the building
is expected to experience heavy damage or collapse. The estimated number of
buildings to be examined in the next decades is up to millions, which means
assessing these buildings with TEC-2007 or TBEC-2018 would need a tremendous
amount of time and budget (Binici et al., 2015). In order to overcome these
constraints, the new provisions suggest faster and cheaper procedures with
acceptable consistency with the EQ codes.
The provisions are not explained in detail since it is not in the scope of this study.
But it is worth to mention that the provisions are not to be used for seismic retrofit

134
purposes but to determine whether a single building has a risk for heavy damage or
collapse. The assessment is based on the critical floor, which is generally the ground
floor. The search for the irregularities of the building is decisive for whether there is
a need for a detailed survey of upper stories (Binici et al., 2015).
In this study, linear elastic analysis is employed for 36 selected RC school buildings
for two orthogonal directions, and bending moment demand capacity ratios (DCR)
at member ends and inter-story drift deformations are determined as stated by the
provisions. The design EQ described by TEC-2007 having a 10 % probability of
occurrence in 50 years is employed without using any response modification (i.e.,
R=1). The determined DCR values and inter-story drift deformations are then
compared with the performance limit values declared by the provisions. The columns
or structural walls that are not satisfying the limits are named as unacceptable. The
performance limits defined by the provisions are intermediate levels between the
commonly accepted life safety and collapse. Buildings are then classified as critical
or not critical depending on the number of unacceptable members. All analyses
within this study are conducted as declared by this provision and as explained by
Binici et al. (2015) using the “protastructure software” (2019). The performances of
the buildings are summarized in Table 6-1; “R” designating for “Risky” and “UR”
for “UnRisky.”

135
Table 6-1 Risk assessment of the buildings as per URL-2013
Building No.
Provisions of Urban Renewal Law (2013)
EQ level: DD2 (10 % in 50 years)
+X -X +Y -Y
1 R R R R
2 UR UR UR UR
3 UR UR R R
4 R R R R
5 UR UR UR UR
6 R R UR UR
7 UR UR UR UR
8 R R UR UR
9 R R R R
10 UR UR UR UR
11 UR UR UR UR
12 UR UR UR UR
13 UR UR UR UR
14 UR UR R R
15 R R R R
16 UR UR R R
17 R R R R
18 R R R R
19 UR UR R R
20 R R R R
21 R R R R
22 R R R R
23 R R R R
24 R R R R
25 R R R R
26 R R R R
27 R R R R
28 R R R R
29 UR UR UR UR
30 R R R R
31 R R R R
32 R R R R
33 R R R R
34 R R R R
35 R R R R
36 R R UR UR

136
Assessment reports of all selected 36 RC school buildings performed by
ProtaStructure software under URL provisions published in 2013 are provided in
Appendix F.
6.2 Assessment by Provisions Published in 2019
After TBEC-2018 has been officially enforced since January 1, 2019, Urban
Renewal Law (URL) (no.6306) is revised in accordance with the new code and
issued on February 16, 2019, and it is so-called URL-2019 hereafter in this study.
Like the URL-2013, URL-2019 aims to reduce the expected seismic risk of the
buildings but with expanded content. The former involves solely “the other
buildings, namely, houses, hotels, etc.,” as being identified in Section-7 of the TEC-
2007. The design spectrum given in TEC-2007 corresponding to the design
earthquake having a 10% probability of occurrence in 50 years is employed to
determine the elastic earthquake forces. The latter, however, provides to determine
the seismic risk of a much broader spectrum of the buildings, including “The
buildings that should be used after earthquakes,” “The buildings that people stay in
for a long time period,” “The buildings that people visit densely and stay in for a
short time period,” “The buildings containing hazardous materials,” as well as the
other buildings mentioned in TEC-2007. Conforming to the TBEC-2018, in URL-
2019 DD1 (2 % probability of being exceeded in 50 years) or DD2 (10 % probability
of being exceeded in 50 years), EQ ground motions are employed as the design
earthquake.
Moreover, the number of stories and the total height of the building are limited to 8
floors and 25 m, respectively. URL-2019 categorizes the buildings into low-rise,
mid-rise, and high-rise according to the height and number of stories so that it
enables to seismically analyze a wide range of RC and masonry buildings. Both
URL-2013 and URL-2019 provisions allow using Linear Calculation Methods for
seismic risk assessment.

137
In this part of the study, seismic assessments of 36 selected RC school buildings have
been conducted under the DD1 design earthquake having a 2% probability of being
exceeded in 50 years as per URL-2019 via “Protastructure-2019”. The program
outcomes designating the buildings as risky “R or Un-risky “UR” are tabulated
below in Table 6-2.
Assessment reports of all selected 36 RC school buildings performed by
ProtaStructure software under URL provisions published in 2019 are provided in
Appendix G.

138
Table 6-2 Risk assessment of the buildings as per URL-2019
Building No.
Urban Renewal Law (2019)
EQ level: DD1 (2 % in 50 years)
+X -X +Y -Y
1 R R R R
2 R UR R R
3 R R R R
4 R R R R
5 UR UR UR UR
6 R R R R
7 R R R R
8 R R UR UR
9 R R R R
10 R UR UR UR
11 R R R R
12 R UR UR UR
13 R R R R
14 R R R R
15 R R R R
16 R R R R
17 R R R R
18 R R R R
19 R R R R
20 R R R R
21 R UR R R
22 R R R R
23 R R R R
24 R R R R
25 R R R R
26 R R R R
27 R R R UR
28 R R R R
29 UR UR R UR
30 R R R R
31 R R R R
32 R R R R
33 R R R R
34 R R R R
35 R R R R
36 R R R UR

139
6.3 Discussion of Results
Table 6-1 presents the performance of the school buildings according to the URL-
2013. 8 buildings out of 36 satisfy the URL-2013 in all directions so that they are
found to be seismically having a low risk. However, this finding does not necessarily
mean that they also satisfy the target performance specified in TEC-2007. Most of
the buildings in this category have three stories. The lower number of stories
associated with the lower building height, the buildings become less vulnerable to
EQs. Almost all five and four-story buildings failed the risk assessment as per URL-
2013.
Binici et al. (2015), in their study, analyzed 10 RC buildings as a case study and
concluded that the new provisions seem to provide fast and easy-to-apply procedures
and to produce results that are as acceptable as the results of nonlinear procedures of
TEC-2007 with much less effort; however, linear elastic procedures of TEC-2007
may result in either way. Although the selected 36 RC school buildings in this study
are analyzed and assessed by linear elastic procedures of TEC-2007, there is
reasonable consistency between the provisions of URL and TEC-2007 assessment
results.
The status of the buildings appears to be much worse when URL-2019 is considered.
Indeed, all of the buildings except for only one are found to be risky, as seen in Table
6-2. Even the satisfactory buildings in the case of URL-2013 have failed the risk
assessment in this case. The main reason for this is based on the DD1 earthquake
level, which has as high as 1.5 times design spectral acceleration in the elastic
spectrum.
In order to compare URL-2013 and URL-2019, the buildings are tested for the same
design earthquake of a 10% probability of occurrence in 50 years. As seen in Table
6-3, among the 36 buildings, only four of them satisfy both provisions. Although the
selected 36 RC school buildings in this study are analyzed and assessed by linear

140
elastic procedures of either TEC-2007 or TEC-2018, there is reasonable consistency
between the assessment results of URL provisions and the seismic codes.
TEC-2007, TBEC-2018, URL-2013, URL-2019, DCM, and ASCE-41 assessment
results are all presented in the same table in order to compare them simultaneously.
The same EQ level DD’ is used for comparison. The assessment results for
orthogonal directions are not given, and the riskiest, i.e., the conservative result, is
mentioned for the whole building. The comparison table is provided in Table 6.4.
There is no RC school building, which is not risky for all assessment procedures.

141
Table 6-3 Comparing the risk assessments as per URL 2013 and 2019
Building
No.
Urban Renewal Law (2013) Urban Renewal Law (2019)
EQ level: DD2 (10 % in 50 years) EQ level: DD2 (10 % in 50 years)
+X -X +Y -Y +X -X +Y -Y
1 R R R R R R R R
2 UR UR UR UR R UR R R
3 UR UR R R R R R R
4 R R R R R R R R
5 UR UR UR UR UR UR UR UR
6 R R UR UR R R R R
7 UR UR UR UR R R R R
8 R R UR UR R R UR UR
9 R R R R R R R R
10 UR UR UR UR UR UR UR UR
11 UR UR UR UR R R R R
12 UR UR UR UR UR UR UR UR
13 UR UR UR UR R R R R
14 UR UR R R R R R R
15 R R R R R R R R
16 UR UR R R UR UR R R
17 R R R R R R R R
18 R R R R R R R R
19 UR UR R R R R R R
20 R R R R R R R R
21 R R R R R UR UR UR
22 R R R R R R R R
23 R R R R R R R R
24 R R R R R R R R
25 R R R R R R R R
26 R R R R R R R R
27 R R R R R R R UR
28 R R R R R R R R
29 UR UR UR UR UR UR UR UR
30 R R R R R R R R
31 R R R R R R R R
32 R R R R R R R R
33 R R R R R R R R
34 R R R R R R R R
35 R R R R R R R R
36 R R UR UR R R R UR

142
Table 6.4 Comparison of assessment results for EQ level DD2
Building No TEC-2007 TBEC-2018 URL-2013 URL-2019 DCM ASCE-41
1 C C R R C C
2 IO C UR R C C
3 C C R R C C
4 IO C R R C C
5 C C UR UR C C
6 C C R R C C
7 C C UR R C IO
8 C C R R C C
9 C C R R CP C
10 C C UR UR LS C
11 IO C UR R LS C
12 C C UR UR LS C
13 C C UR R C C
14 C C R R C C
15 C C R R C C
16 C C R R C C
17 C C R R CP IO
18 C C R R C C
19 IO C R R C C
20 IO C R R C C
21 C C R R C C
22 IO C R R C C
23 C C R R C C
24 C C R R C C
25 C C R R C C
26 C C R R C C
27 C C R R CP C
28 C C R R C C
29 IO C UR UR C C
30 LS C R R C C
31 IO C R R C C
32 C C R R C IO
33 IO C R R C C
34 C C R R C C
35 LS C R R C C
36 LS C R R C C

143
CHAPTER 7
7 DEVELOPMENT OF FRAGILITY CURVES
7.1 Introduction to Fragility Curves
When an EQ strikes a populated urban region, a large number of residential and
public buildings may suffer damages of various states, and some of these buildings
may collapse totally. This section of the study aims to determine the F.C.s for 3, 4,
and 5 story RC school buildings in Turkey. A realistic description of the fragilities
and generation of F.C.s for these buildings is essential since vulnerable school
buildings affect society more than other types of buildings after a severe EQ
The term fragility may be defined as “the quality of being easily broken or damaged”
in common, but in structural engineering, we define fragility as a typical expression
of damageability of an asset as a function of excitation (Porter, 2014). Fragility is
not vulnerability. Fragility measures probability, vulnerability measures loss. The
fragility of structures is a performance measure in most basic terms (Ay, 2006).
There may be two different analytical approaches for the assessment of the seismic
vulnerability of a specific building stock. The first one is to assess each building in
the stock individually, and the fragility information related to building stock is
obtained by combining the assessment results of each building. Although the results
are accurate in this approach, it is economically and practically not feasible. The
second and much more practical and economical approach is using the fragility
studies of equivalent and simplified analytical models. The obtained results are not
as accurate as in the first approach, but decision-makers need rapid estimates of
losses in order to execute their EQ mitigation plans (Özün, 2007).
F.C.s express conditional cumulative distribution functions that define the attainment
or exceedance probability of a damage state for a given ground motion intensity level

144
(PGV, PGA, SA, etc.). In most cases, the probability distribution function is the
standard lognormal distribution. (Shinozuka et al. 2000, Zentner et al., 2008, Kircher
et al. 1997).
F.C.s provide graphical information on structural damage distribution. Damage
distribution is shown by a damage/performance state curve, and every point on the
curve represents a probability of attaining or exceeding the related damage state for
the related ground motion intensity. It is a unique curve because every curve is
developed depending on related structural parameters and related ground motions.
The mathematical expression of the fragility function is given in Equation 7-1.
PFi,j = P(D ≥ DLSi |IMj) (7-1)
In EQ 7-1, D represents the damage (response) of the structure under the ground
motion level with an Intensity Measure of j (IMj). Hence, PFi,j expresses the
probability of attainment or exceedance of Damage Limit State i (DLSi) under the
ground motion level IMj.
F.C.s can be generated for one specific structural system or a component or a class
of structural systems and components. Fragility information should be integrated
with seismic hazard levels to estimate seismic risk at an acceptable level of accuracy
(Özün, 2007).
The reliability of the SVA by F.C.s is directly dependent on the reliability of the
F.C.s. The derived F.C.s are highly sensitive to the choices made for the structural
idealization, analysis method, seismic hazard, and performance/damage state
definitions (Avşar, 2009). One must keep in mind that F.C.s are inherently blind:
they reveal percentages of damage for building groups but not their addresses (Yakut
et al., 2005).

145
A schematic description of generating F.C.s are shown in Figure 7-1 (Avşar, 2009).
The x-axis represents the seismic intensity measure (in terms of PGV, PGA, SA,
etc.) of the EQ, and the y-axis represents the probability of attainment or exceedance
of related damage limit state. The resulting F.C. is the best fit for the probability
points.
The probability of attaining or exceeding a certain damage limit state is generally
modeled as a cumulative lognormal probability distribution in most of the recent
studies (HAZUS, 2003; Karim and Yamazaki, 2003; Elnashai et al., 2004; Nielson,
2005; Banerjee and Shinozuka, 2007). The lognormal probability distribution is also
used in this study.
Figure 7-1. Schematic representation of generating an F.C. (Avşar, 2009)
The probability of attaining or exceeding the limit states can also be expressed by
the Damage Probability Matrix (DPM), which is the tabular presentation of the
same information. DPM representation is out of the scope of this study.
F.C.s can be used in many ways, and most of them are somehow related to the
assessment of structures. Some of the uses of F.C.s are listed below:
i. As a screening tool to determine structure types and urban regions that are
more likely to be damaged in future EQs (Miranda, 2005),

146
ii. As a tool to perform parametric studies in order to identify structural or
ground motion parameters increasing seismic demands on structures
(Miranda, 2005),
iii. As a planning tool for emergency management authorities by using F.C.s in
order to generate possible damage scenarios (Miranda, 2005),
iv. As a tool for loss estimation of extensive inventories of structures,
v. As a useful tool for insurance or reinsurance companies to determine the
seismic risk, and the related optimum insurance costs,
vi. As a tool to provide early performance estimates just a few minutes after an
EQ,
vii. As a planning tool for hospitals and highways network (Mohsen, 2012),
viii. As a tool for analysis, evaluation, and improvement of seismic performance
of structures (Mohsen, 2012),
ix. As a tool for prioritizing of retrofit of structures (Güneyisi, 2007; Kirçil and
Polat, 2006),
x. As a tool for cost-benefit analysis of retrofit of structures (Güneyisi, 2007),
etc.
There are various ways to obtain F.C.s. Existing F.C.s are often classified into four
major groups called empirical, judgmental, analytical, and hybrid. Each type of F.C.
has some advantages and disadvantages.
Empirical F.C.s are obtained by using the damage data observed after real EQs.
Structural and non-structural damage to buildings is documented by reconnaissance
reports after different EQs recorded by accelerograms. F.C.s for different structure
types can be determined by using the observational damage data by statistical
analysis easily. It is the most realistic approach among all types of F.C.s, but the
reliability is questionable since there exists objectivity in the observed damage data.
Besides, the number of damaged structures of the same type with similar properties
affected by the EQs are usually inadequate. For example, the empirical F.C.s
developed for European countries are based on very few damage surveys carried out

147
for single locations or EQ events (Orsini, 1999). As a result, empirical F.C.s are
specific, and the application is minimal (Avşar, 2009).
To obtain more accurate empirical F.C.s, damage data from post-EQ surveys carried
out for large populations of buildings of similar construction over areas of uniform
soil conditions in close proximity to ground motion recording stations should be used
(Orsini, 1999).
Judgmental F.C.s are based on expert opinions on damage data of related structure
types. Experts are asked to estimate the performance states or damage distribution of
structure populations subjected to different intensities of EQs. Then F.C.s are
obtained by fitting probability functions to the expert opinions with respect to EQ
intensities and damage states. Delphi method and panels may be used for collecting
expert opinions. This way is one of the most straightforward methods of obtaining
F.C.s; however, the reliability of these curves is questionable due to their dependence
on the individual experience of the experts consulted (Güneyisi, 2007).
Applied Technology Council (ATC) conducted a study using the judgmental method
and obtained F.C.s of 40 different structural types in California (USA) are received
with the opinion of 58 experts, reporting the results in ATC-13 (1985) thereafter.
Several studies (Cardona and Yamin, 1997; King et al., 1997; HAZUS, 1999)
followed the judgmental method and used the F.C.s given in ATC–13 (Ay, 2006).
Using analytical models and structural simulations are the most common way of
obtaining F.C.s due to developments in analysis techniques that enable the
generation of damage data at very high speeds. The possibility of executing big
numbers of structural analysis is the primary advantage of this method. Lack of
inspection of real structural response is the primary disadvantage of the analytical
method. Performance limit state definitions have a direct influence on the analytical
F.C.s. Modeling assumptions, material models, ground motion parameters, analysis
techniques, and the response parameter are the necessary factors affecting the
accuracy of analytical F.C.s.

148
Elastic or inelastic time–history analysis has gained popularity due to efficiency and
reliable results. ESDOF system, which is the simplest model, enables the
computation of numerous analyses in a short period of time. As a result, many
researchers have used ESDOF models (Ibarra, 2003; Jeong and Elnashai, 2004;
Erberik and Elnashai, 2004). Akkar et al. (2005), Erberik and Çullu (2006), Baykal
and Kırçıl (2006), Kırçıl and Polat (2006) are some of the analytical fragility studies
conducted in Turkey.
Hybrid F.C.s are generated by combining data from different sources, generally
involving the modification of analytical or judgmental F.C.s with observational data.
The curves proposed in ATC-13 (1985) and ATC-40 (1996) are typically based on
expert opinion but also involve limited observational data from the San Fernando
EQ (1971) and Northridge EQ (1994), respectively (Güneyisi, 2007).
Hybrid vulnerability curves aim to compensate for the scarcity of observational data,
the subjectivity of judgmental data, and modeling deficiencies of analytical
procedures by combining data from different sources (Rossetto and Elnashai, 2003).
The primary disadvantage of hybrid F.C.s is the lack of proper supplementary data.
Experimental data can also be used for the generation of F.C.s, usually with other
sources of data. Although there is an interest to shift toward experimental studies, it
is not practically feasible because of both the time and economic limitations of big-
scale realistic experiments. Experimental studies are generally performed to define
the vulnerabilities of structural elements (columns, beams, etc.) rather than the
complete structures (Chong and Soong, 2000; Constantinou et al., 2000).
The type of method to choose for F.C. development depends not only on the
objective of the assessment but also on the availability of data and technology (Ay,
2006). Kwon and Elnashai (2006) summarized the basic features and limitations of
four methods of generating F.C.s, which are also given in Table 7-1. In this study,
analytical F.C.s are developed for RC school buildings in Turkey.

149
Table 7-1 Features and Limitations of F.C.s (Kwon and Elnashai, 2006)
Category Characteristics
Empirical
Features
Based on the post-EQ survey
Most realistic
Limitations
Highly specific to a particular seismo-tectonic,
the geotechnical and built environment
The observational data used tend to be scarce and
highly clustered in the low-damage, low-ground
motion severity range
Include errors in structural damage classification
Damage due to multiple EQs may be aggregated
Judgmental
Features
Based on expert opinion
The curves can be easily made to include all the factors
Limitations
The reliability of the curves depends on the individual
experience of the experts consulted
Consideration of local structural types, typical
configurations, detailing, and materials inherent in
the expert vulnerability predictions
Analytical
Features
Based on damage distributions simulated from the
analysis
Reduced bias and increased reliability of the
vulnerability estimate for different structures
Limitations
Substantial computational effort involved and
limitations in modeling capabilities
The choices of the analysis method, idealization,
seismic hazard, and damage models influence the
derived curves and have been seen to cause significant
discrepancies in seismic risk assessments
Hybrid
Features
Compensate for the scarcity of observational data, the
subjectivity of judgmental data, and modeling
deficiencies of analytical procedures
Modification of analytical or judgment based
relationships with observational data and experimental
results
Limitations
The consideration of multiple data sources is
necessary for the correct determination of
vulnerability curve reliability

150
7.2 Ground Motion Data
As expressed in Nielson and Pang (2011), a fragility curve, conditioned on an
intensity measure (IM), represents the probability of exceedance of a prescribed
damage state for a structure or a type of structure.
The IM, i.e., the ground motion (GM) intensity, expresses the ability of the EQ to
cause damage to structures. Therefore, selecting the proper GM is a challenging task
for EQ engineering. Particularly for fragility studies, the correlation between the
selected GM intensity and the structural deformation (response) demand requires
elaborate consideration (Ay, 2006). The selection of GM intensity and the GM
characteristics have a considerable effect on the resulting F.C.s.
The ground motion intensities in the F.C.s can be peak ground motion values,
spectral quantities, modified Mercalli scale, etc. (Akkar et al., 2005). Peak Ground
Velocity (PGV), Peak Ground Acceleration (PGA), Spectral Acceleration (Sa), and
Spectral Displacement (Sd) are among the most frequently used IMs for fragility
studies in the literature. PGV appears to be a suitable GM intensity parameter for
describing deformation demands in structures that deform beyond the elastic range,
and it is more indicative for defining the correlation between structural damage and
GM intensity (Akkar et al., 2005). PGV usually reflects the effect of soil conditions
very well during a large magnitude EQ (Wald et al., 1999). Akkar and Özen (2005)
mentioned that PGV correlates well with the SDOF deformation demands. Besides,
PGV primarily influences the seismic spectral response of medium period systems,
approximately in the period range 0.5<T<2.0 seconds (Sucuoğlu et al., 1999), which
corresponds the most of the RC school buildings in this study. Therefore, based on
the above discussion, PGV is chosen as the reference GM intensity parameter in this
study.
PGV fits well for the RC school buildings, but one of the major drawbacks is that
PGV does not consider the structural properties of the buildings. PGVconsiders the

151
EQ and site properties but not the structural properties of buildings. It is necessary
to include an IM considering structural properties.
PSA is an IM considering both EQ and structural properties. Dhakal et al. (2006)
mentioned that PSA is a more efficient intensity measure in comparison with PGA.
Using Sa as the GM intensity parameter would give more confidence in the result or
would require less number of records to generate results with the same level of
confidence (Avşar, 2009). Since it also plays a vital role in the traditional seismic
design approach (Akkar and Özen, 2005), PSA is chosen as the second GM intensity
parameter in this study.
In order to generate reliable F.C.s, a set of GM records from different EQs with
different magnitudes should be used. In this study, a group of 100 selected GMs
having different seismological characteristics from different parts of the world were
used in order to generate the F.C.s. The selected and used GM data consists of dense
to firm soil records with surface magnitudes (Ms), ranging from 5,1 to 7,8. Detailed
information about the GM data used in this study is given in Appendix H. The
information in Appendix H contains the name, the date, the location of the recording
station, component, the surface wave magnitude, distance to fault, scaling factor,
peak ground acceleration (PGA), peak ground velocity (PGV), V/A ratio, effective
peak acceleration (EPA), energy index (EI) and effective duration (Δteff) of the
corresponding EQs.
Besides strong shaking, the characteristics of near-fault ground motions
are linked to the fault geometry and the orientation of the
traveling seismic waves (Sommerville, 2000). The primary characteristics of near-
fault ground motions are the forward directivity and fling step
effects which have caused severe structural damage in recent
major EQs (Mavroeidis and Papageorgiou, 2003). As can be seen in Appendix H,
none of the ground motions have near-fault effects.
The statistical properties of the selected GM set are given in Table 7-2 below.
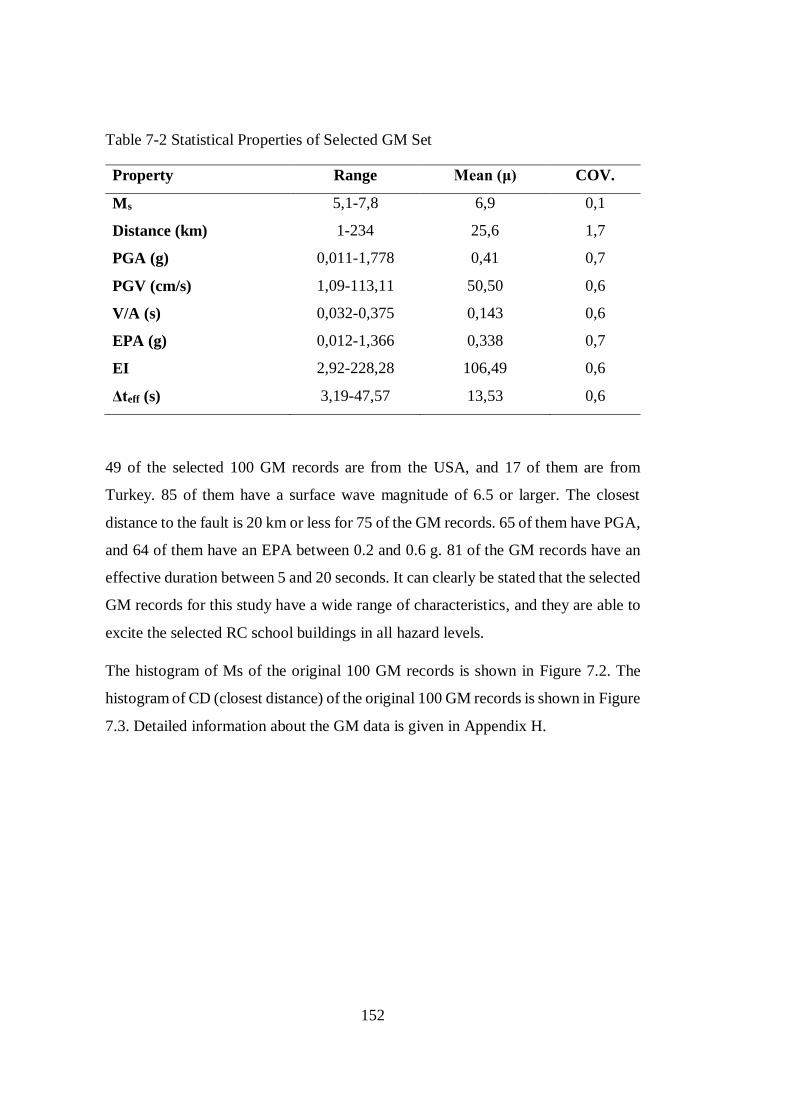
152
Table 7-2 Statistical Properties of Selected GM Set
Property Range Mean (μ) COV.
Ms 5,1-7,8 6,9 0,1
Distance (km) 1-234 25,6 1,7
PGA (g) 0,011-1,778 0,41 0,7
PGV (cm/s) 1,09-113,11 50,50 0,6
V/A (s) 0,032-0,375 0,143 0,6
EPA (g) 0,012-1,366 0,338 0,7
EI 2,92-228,28 106,49 0,6
Δteff (s) 3,19-47,57 13,53 0,6
49 of the selected 100 GM records are from the USA, and 17 of them are from
Turkey. 85 of them have a surface wave magnitude of 6.5 or larger. The closest
distance to the fault is 20 km or less for 75 of the GM records. 65 of them have PGA,
and 64 of them have an EPA between 0.2 and 0.6 g. 81 of the GM records have an
effective duration between 5 and 20 seconds. It can clearly be stated that the selected
GM records for this study have a wide range of characteristics, and they are able to
excite the selected RC school buildings in all hazard levels.
The histogram of Ms of the original 100 GM records is shown in Figure 7.2. The
histogram of CD (closest distance) of the original 100 GM records is shown in Figure
7.3. Detailed information about the GM data is given in Appendix H.

153
Figure 7.2. Histogram of Ms of GM records
Figure 7.3. Histogram of CD of GM records
7,67,26,86,46,05,65,2
30
25
20
15
10
5
0
Ms
Fre
qu
en
cy
Histogram of Ms
24020016012080400
40
30
20
10
0
CD (km)
Fre
qu
en
cy
Histogram of CD (km)

154
The dataset classification of selected 100 GM records is made by dividing the ground
motion data into 12 bins with PGV intervals of 10 cm/s. The original PGV
distribution of the data set can be seen in Figure 7-4 below.
Figure 7-4. Original PGV distribution of the GM records
The purpose of such a classification is to observe an even distribution of response,
so 20 new records are generated by scaling from the nearest bin in the time domain
in order to compose an even distribution between the bins. The scaling of the records
is formed from the nearest bin not to cause any distortion of the original
characteristics of the GM records. In this way, the GM set contains 120 records
totally covering a PGV range of 0-120 cm/s with PGV intervals of 10 cm/s. Then,
this set was applied to both orthogonal directions of the selected 36 RC school
buildings.
It is not possible to define a single PSA value for each GM record since PSA values
also depend on the periods of the RC school buildings. In order to define the PSA
values, 100 selected GM records are processed by Seismosignal software, and the
0
2
4
6
8
10
12
10 20 30 40 50 60 70 80 90 100 110 120
FrE
Qu
en
cy
PGV (cm/s)

155
corresponding PSA values are compiled for every 0.02-second interval between 0-
to-5 seconds period. Thereafter, with a simple code, the corresponding PSA values
are determined for each RC building consistent with the period of the structure for
each selected GM record. It is not possible to form even distributions of bins for
fragility analysis by PSA; therefore, 12 bins are formed by considering the number
of nonlinear time history analysis outcomes, as explained in the next chapter.
7.3 Generation of Fragility Curves
F.C.s and their types were described shortly in Section 7.1 above, and it was
mentioned that in this study, analytical F.C.s are developed for RC school buildings
in Turkey. The details of the generation of the F.C.s for RC school buildings are
described in this section.
In order to generate F.C.s, structural, ground motion, and response parameters should
be described and involved in the analysis. The construction practice may differ from
each other in different countries, and these differences may cause significant
deviations between the generated F.C.s. Therefore, obtaining the country-
specific/local characteristics of Turkey and generating F.C.s in accordance with these
local properties has substantial importance for the precise estimation of EQ damage
and loss in Turkey (Ay, 2006).
Another critical point is that obtaining the structural parameters directly from the
design parameters and layouts of related buildings for the generation of F.C.s may
lead to unexpected deviations from the real response characteristics. Like many other
countries, the construction practice in Turkey is far beyond complying with the
designed structural requirements.
The statistical properties of RC school buildings in Turkey have been obtained. The
structural and capacity curve parameters were calculated for 3-, 4- and 5-story
buildings throughout the above chapters of this study. It should be mentioned that all
structural input data included for the generation of F.C.s in this study are local and

156
as-built data. Structural variability for the generation of F.C.s is taken into account
by using as-built properties and by using a large number of RC school buildings
within the analysis process. So the building samples of each height category include
real buildings with varying properties providing uncertainity in typical building
properties such as span length, height, material property, member sizes, etc.
Generation of F.C.s generally compose two basic steps, which are pushover analysis
in order to determine the structural capacity and the performance state limits; then
nonlinear time history analysis in order to compute the responses of the related
structures. By following these two basic steps, it is possible to determine the
probability of exceedance of limit states for the related structural system.
The methodology used for the generation of F.C.s in this study is described step by
step in Figure 7-5 below. Steps 1-5 of the methodology were described throughout
the above chapters and sections.
Time history analysis (step 6) has been performed using both bilinear and Clough
material models for equivalent SDOF, which will be described shortly below. The
seismic load is given by ground motion time histories. F.C.s are derived separately
for different number of stories, i.e., 3-, 4- and 5- story RC school buildings. As
mentioned before, the number of stories is a prominent parameter influencing the
vulnerability of existing RC buildings.

157
Figure 7-5. The methodology used for the generation of F.C.s
1. Selection and classification of buildings (sub-classess with respect to number of stories)
2. 3-D modeling and pushover analysis
3. Bilinear idealization and obtaining Equivalent SDOF systems for each building
4. Determination of Performance Limit States
5. Selection and grouping of ground motion records
6. Time history analysis and response statistics
7. Determining probability of exceedance for limit states
under selected GM intensities
8. Construction of fragility curves for each building
subclass

158
7.3.1 F.C.s wrt. PGV Using Bilinear Material Model
First, F.C.s for 3, 4- and 5-story RC school buildings have been derived with respect
to PGV utilizing the above-described set of 120 GM records for nonlinear time
history analysis with bilinear models. To derive the fragility curves for 3 limit states
(IO, LS, and CP) for 3-, 4- and 5-story structures, an analytical approach
assuming log-normally distributed capacity and demand was followed utilizing the
probit method, which was codified by Baker (2015).
Utilizing derived parameters for models of selected RC school buildings, equivalent
SDOF systems (with 5% damping ratio) were modeled in OpenSees software and
nonlinear time history analyzes were performed employing the GM set. The GM
recordset was applied to both two orthogonal directions of the selected 36 buildings.
Accordingly, maximum displacement results were obtained from 8640 equivalent
SDOF-based nonlinear time history analysis, and these results have been processed
to determine the observed fractions of 3 performance states (IO, LS, and CP) in each
bin. Afterward, a MATLAB script (Baker, 2015) was utilized to derive the fragility
curves fitting to the observed fractions.
The inelastic dynamic characteristics of each building are represented by a bilinear
equivalent SDOF system. The seismic displacement demand is obtained, subjecting
such an SDOF system to time history analysis under the selected ground motions.
The ESDOF displacement demands are then converted into building displacement
demands by multiplying the first mode participation factor, Γ1. Following
displacement demand estimates, the seismic performance of each school building
was evaluated using its own performance state limits.
Extracting maximum roof/top drift demands from the analysis results, each structure
was marked to exhibit a particular damage state under each ground motion record.
While defining the damage level of the structure, following Akkar et al. (2005),
yield spectral displacement of each structure was taken as Immediate Occupancy
(IO) performance level, whereas ultimate spectral displacement value was taken as

159
Collapse Prevention (CP) limit state. Three-quarters of the ultimate spectral
displacement value was taken as Life Safety (LS) performance level as described in
Section 4.5 above (Mazılıgüney et al., 2013).
There are 12 RC school buildings, i.e.,24 ESDOF models in each subclass. There
exist 10 GM records in each bin, which makes a total of 240 response data for each
bin. There are 12 bins, so the F.C.s for each subclass of RC school buildings are
generated by using a total of 2880 response data.
The performance limit states of each ESDOF model of each building is determined
for each GM record (i.e., for each EQ intensity). Afterward, the number of buildings
reached or exceeded a specific performance state limit can be determined. The
percentage of the buildings reached or exceeded (probability of exceedance) a
specific performance state limit is determined by dividing the number determined
number of response data by the total number of response data in each bin. The mean
PGV values of each bin are plotted against the corresponding probability of
exceedance values. Finally, the log-normal cumulative distribution function by
employing the method of least squares is fitted to the scattered data in order to obtain
the final F.C. for the related performance limit state. The perfoemance limit states
were determined separately for each RC school building in Section 4.5 and are
presented in Appendix D.
Figure 7-6, Figure 7-7, and Figure 7-8 demonstrate the fragility curves wrt. PGV,
developed for the RC school buildings generated by using bilinear material models
for 3, 4, and 5 story subclasses, respectively. The three curves in each figure
represent the probability of exceeding the IO (red), LS (blue), and CP (green)
performance limit states. Any point on the F.C. of a particular RC school building
subclass indicates the probability of attaining or exceeding the corresponding
performance/damage limit state due to the corresponding EQ intensity (Avşar,
2009).
As it is seen from F.C.s, damage probability for each damage state increases with
increasing seismic demand.

160
Figure 7-6. F.C. for 3 story RC school buildings using bilinear material model wrt.
PGV
Figure 7-7. F.C. for 4 story RC school buildings using bilinear material model wrt.
PGV

161
Figure 7-8. F.C. for 5 story RC school buildings using bilinear material model wrt.
PGV
7.3.2 F.C.s wrt PSA Using Bilinear Material Model
As described in Section 7.2, it is not possible to define a single PSA value for each
GM record since PSA values also depend on the periods of the RC school buildings.
In order to define the PSA values, 100 selected GM records are processed by
Seismosignal software, and the corresponding PSA values are compiled for every
0.02-second interval between 0-to-5 second periods. Thereafter, with a simple code,
the corresponding PSA values are determined for each RC building consistent with
the period of the structure for each selected GM record. 2 models for each 36 selected
RC school buildings and 100 GM records form 7200 PSA values totally (i.e.,2400
for each subclass).
Since it is not possible to form even distributions of bins for fragility analysis by
PSA; therefore, 12 bins are formed by considering the number of nonlinear time
history analysis outcomes.

162
The same procedure described in section 7.3 above is applied to form F.C.s wrt. PSA
and Figure 7-9, Figure 7-10, and Figure 7-11 demonstrate the F.C.s developed for
the RC school buildings generated using bilinear material models for 3, 4, and 5 story
subclasses, respectively.
Figure 7-9. F.C. for 3 story RC school buildings using bilinear material model wrt.
PSA

163
Figure 7-10. F.C. for 4 story RC school buildings using bilinear material model wrt.
PSA
Figure 7-11. F.C. for 5 story RC school buildings using bilinear material model wrt.
PSA

164
7.3.3 F.C.s wrt. PGV using Modified Clough Material Model
In his dissertation, Ay (2006) emphasized that strength degradation determines the
stability of response and the rate of approaching failure. Strength degradation
depends on many parameters such as the dissipated energy per cycle, the number of
inelastic excursions (or low-cycle fatigue), and the plastic deformation range. The
elastic stiffness of the structures degrades due to the yielding of the members. The
cracking of concrete basically causes stiffness degradation in RC members under
repeated cyclic loading. Increasing ductility gives rise to the degrading of the elastic
stiffness (Ay, 2006).
The energy dissipation capacity of a building is computed as the area under its
pushover curve. Unfortunately, the capacity curves may overestimate the ultimate
ductility of the columns, since the pushover analysis cannot take the strength
degradation due to cyclic loading into account.
Strength and stiffness degradation are generally not considered by the F.C.s
developed in the existing studies, and their use for the low strength RC buildings
stock of developing countries is highly questionable. In most seismic demand studies
employing hysteresis models, the models generally have a non-degrading (ND)
backbone (bilinear model) curve and/or ignore stiffness deterioration (Ibarra et al.,
2005) due to the fact that the elapsed time, computational difficulty, and versatility
of the models increase with increasing complexity.
The FEMA-440 (2005) publication on nonlinear seismic analysis has given
significant importance to strength and stiffness degradation and emphasizes that the
current procedures for accounting degradations are not clear. Then, a FEMA-440
(2005) connected project, FEMA-P440A (2009), concentrated on the effects of
strength and stiffness degradation on seismic response. FEMA-P440A (2009)
summarized the previous works and examined the phenomena in detail by using
analytical studies. Researchers may refer to FEMA-P440A (2009) for further and
detailed information. Altoontash (2004), Kurtman (2007), Kale (2009), and Demirci

165
(2014) are some of the researchers who studied hysteresis and degrading behavior,
and their dissertations are valuable references for other researchers.
One of the well-known and commonly used material models including strength and
stiffness degrading behavior of RC is the Clough (Clough and Johnston, 1966;
Mahin and Bertero, 1976) Model, which is also mentioned by FEMA-P440A (2009).
The Clough (stiffness degrading, SD) material model and the modified (stiffness and
strength degrading, SSD) versions are used commonly for seismic response studies.
The Clough model uses a bilinear backbone curve that represents the stiffness
degradation during the reloading stage (Clough and Johnston, 1966). Mahin and
Bertero (1976) modified the Clough model by adding stiffness degradation in the
unloading stage (Kale, 2009).
In this study, the strength and stiffness degrading model is employed for the
generation of following F.C.s in order to take into account the inelastic behavior and
compare it with the bilinear F.C.s. Modified Clough Peak Oriented material model,
which is available in OPENSEES (coded by Arash Altoontash and Gregory
Deierlein) material model library, is used in order to define and employ the strength
and stiffness degradation of RC within the analysis. The model was studied by
Altoontash (2004) in his dissertation and then coded for OPENSEES in 2012. Since
it is not the scope of this study, the material model is not explained in detail.
Researchers may refer to the dissertation of Altoontash (2004) and online
OPENSESS publications. The loading envelope for peak oriented models are shown
in Figure 7-12 (Ibarra, 2003). The hysteresis curve of the material model can be seen
in Figure 7-13 (Altoontash, 2004) below.

166
Figure 7-12. Loading envelope for peak oriented models (Ibarra, 2013)
Figure 7-13. Modified Clough peak oriented material model (Altoontash, 2004)

167
The envelope key points which can be seen in Figure 7-12, are determined by user-
defined inputs, and the corresponding equations are listed in Table 7-3 (Altoontash,
2004) below.
Table 7-3 Key points of force-deformation envelope of peak oriented models
(Altoontash, 2004)
Point ID Deformation/Strain Force/stress Stiffness
1 0 0
2 𝛿𝑦+ =
𝐹𝑦+
𝐾𝑒
𝐹𝑦+ Ke
3 𝛿𝑐𝑎𝑝+ 𝐹𝑐𝑎𝑝
+ = 𝐹𝑦+ + 𝛼ℎ . 𝐾𝑒 . (𝛿𝑐𝑎𝑝
+ − 𝛿𝑦+) 𝛼ℎ ∙ 𝐾𝑒
4 𝛿𝑟𝑒𝑠+ = 𝛿𝑐𝑎𝑝
+ +(𝑅 ∙ 𝐹𝑦
+ − 𝐹𝑐𝑎𝑝+ )
𝛼𝑐𝑎𝑝 ∙ 𝐾𝑒
𝐹𝑟𝑒𝑠+ = 𝑅 ∙ 𝐹𝑦 𝛼𝑐𝑎𝑝 ∙ 𝐾𝑒
5 > 𝛿𝑟𝑒𝑠+ 𝐹𝑟𝑒𝑠
+ = 𝑅 ∙ 𝐹𝑦 0
The parameters used in the Modified Clough peak oriented material model within
the OPENSEES software are user-defined or depends on the ESDOF model. The
user-defined parameters are determined after several trials, and the most suitable
parameters contributing to meaningful hysteresis curves and consistent with previous
studies (Altoontash, 2004; Kurtman, 2007; Kale, 2009 and Demirci, 2014) are
selected for analysis. The parameters used in the OPENSEES software are described
in Table 7-4 below.

168
Table 7-4 Parameters used in the OPENSEES software for Modified Clough peak
oriented material model
Symbol Defined/Used
tag 1
Ke Model
𝐹𝑦+ Model
𝐹𝑦− Model
αh Model
R 0,12
αcap 0,012
𝛿𝑐𝑎𝑝+ Model
𝛿𝑐𝑎𝑝− Model
λS 0,04
λK 0,04
λA 0
λD 0
cS 1
cK 1
cA 0
cD 0
The same procedure described in section 7.3 above is applied to form F.C.s wrt. PGV
and Figure 7-14, Figure 7-15, and Figure 7-16 demonstrate the F.C.s developed for
the RC school buildings generated by using Modified Clough peak oriented material
model for 3, 4, and 5 story subclasses, respectively.

169
Figure 7-14. F.C. for 3 story RC school buildings using Modified Clough peak
oriented material model wrt. PGV
Figure 7-15. F.C. for 4 story RC school buildings using Modified Clough peak
oriented material model wrt. PGV

170
Figure 7-16. F.C. for 5 story RC school buildings using Modified Clough peak
oriented material model wrt. PGV
7.3.4 F.C.s wrt. PSA Using Modified Clough Material Model
The same procedure described in section 7.3 above is applied to form F.C.s wrt. PSA
and Figure 7-17, Figure 7-18, and Figure 7-19 demonstrate the F.C.s developed for
the RC school buildings generated by using Modified Clough peak oriented material
model for 3, 4, and 5 story subclasses, respectively.

171
Figure 7-17. F.C. for 3 story RC school buildings using Modified Clough material
model wrt. PSA
Figure 7-18. F.C. for 4 story RC school buildings using Modified Clough material
model wrt. PSA

172
Figure 7-19. F.C. for 5 story RC school buildings using Modified Clough material
model wrt. PSA
7.3.5 Discussion and Comparison of F.C.s
F.C.s are generated for 3, 4, and 5 story RC school buildings wrt. EQ intensity and
also wrt. Bilinear and Modified Clough material models. In order to compare the
F.C.s generated wrt. Bilinear and Modified Clough material models, both curves are
shown on the same graph wrt. number of stories. The dashed curves represent F.C.s
generated by the Modified Clough material model, while the continuous curves
represent the F.C.s generated by bilinear material models.
F.C.s generated by both Bilinear and Modified Clough material models wrt. PGV
are shown in Figure 7-20, Figure 7-21, and Figure 7-22 for 3, 4, and 5 story RC
school buildings, respectively.

173
Figure 7-20. Comparison of F.C.s generated by Bilinear and Modified Clough
Material Models wrt. PGV for 3 story RC school buildings
Figure 7-21. Comparison of F.C.s generated by Bilinear and Modified Clough
Material Models wrt. PGV for 4 story RC school buildings

174
Figure 7-22. Comparison of F.C.s generated by Bilinear and Modified Clough
Material Models wrt. PGV for 5 story RC school buildings
F.C.s generated by both bilinear and Modified Clough material models wrt. PSA
are shown in Figure 7-23, Figure 7-24, and Figure 7-25 for 3, 4, and 5 story RC
school buildings, respectively.

175
Figure 7-23. Comparison of F.C.s generated by Bilinear and Modified Clough
Material Models wrt. PSA for 3 story RC school buildings
Figure 7-24. Comparison of F.C.s generated by Bilinear and Modified Clough
Material Models wrt. PSA for 4 story RC school buildings

176
Figure 7-25. Comparison of F.C.s generated by Bilinear and Modified Clough
Material Models wrt. PSA for 5 story RC school buildings
The number of stories of RC school buildings was selected as the primary parameter
of the seismic performance, and the F.C.s were generated wrt. number of stories. The
generated F.C.s revealed that, number of stories affect the probability of exceedance
of all performance states for all cases. EQ vulnerability of RC school buildings
increases with increasing number of stories.
The probability of exceedance curves for IO performance state is generally distant
from the curves of LS and CP performance states, whereas the probability of
exceedance curves for LS and CP performance states are close to each other for RC
school buildings. That is why the performance limit definitions are likewise. IO and
LS performance limits are distant from each other, while LS and CP limits are close.
Bilinear and Modified Clough F.C.s have significant differences until the probability
of exceedance of 80 %, and Modified Clough-based curves indicate a larger
probability of exceedance values. Two curves nearly coincide at and after 80% of
probability of exceedance. It is evident that there are significant differences between

177
the Bilinear and Modified Clough material models based on probability of
exceedance curves. Hence, the degradation characteristics of the structural model
seem to have a significant influence on the final F.C.s.
It is important to note here that maximum values of the IMs considered and the
number of records utilized or available in each bin throughout GM set formation and
F.C. generation would undoubtedly affect the outcomes of the risk study, which
should be further investigated as it is stated by Mazılıgüney et al., 2013.
7.4 Comparison of F.C.s with Bingöl Database
On May 1, 2003, an EQ of moment magnitude 6.4 and with a depth of 6 km occurred
in Bingöl at 03:27 (A.M.) local time. The collapse of the Çeltiksuyu Primary School
Dormitory building in Bingöl EQ, which killed 84 students and a teacher, is an
obvious and tragic evidence of the seismic vulnerability of RC school buildings in
Turkey. A photograph of the Çeltiksuyu Primary School taken the following
morning and published by nearly all of the newspapers of Turkey can be seen in
Figure 7-26 below.
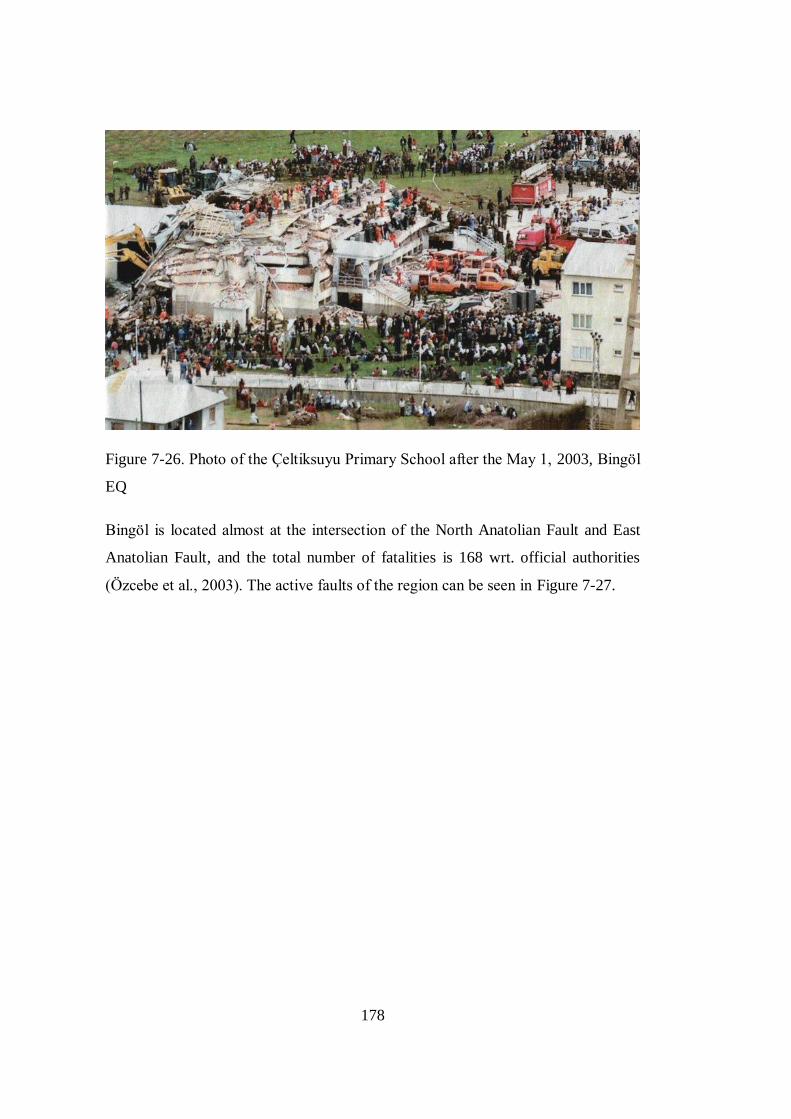
178
Figure 7-26. Photo of the Çeltiksuyu Primary School after the May 1, 2003, Bingöl
EQ
Bingöl is located almost at the intersection of the North Anatolian Fault and East
Anatolian Fault, and the total number of fatalities is 168 wrt. official authorities
(Özcebe et al., 2003). The active faults of the region can be seen in Figure 7-27.

179
Figure 7-27. Active faults of the Bingöl region and the centers of main and
aftershocks of May 1, 2003 EQ (Özcebe et al., 2003)
Immediately after the Bingöl EQ, technical reconnaissance teams composed of
academics, researchers, and practicing engineers arrived at the disaster site in order
to examine the impacts of the event. The teams were coordinated with each other
and studied different buildings, including RC school buildings. The METU team
studied 23 (13 of them 3 stories and 10 of them 4 stories) RC school buildings and
tabulated the related structural data and the observed damage for the buildings.
The flowchart of the work done for the building set in Bingöl is described below:
Consider the major Bingöl (1 May 2003, Mw=6.4) EQ that affected the
reinforced concrete school buildings under consideration.
Find the corresponding PGV and Sa values for each building by using
appropriate attenuation relationships (the distances of school buildings to the
related fault and the soil properties are considered within attenuation
relationships).

180
Obtain damage probability values for each RC school building by using the
generated F.C.s and related PGV and Sa values.
Compare the obtained results with the actual (observed) performance states
of the RC school buildings.
Since the observed damage data was not enough to make a comprehensive
comparison with obtained fragility curves, 3- and 4-story buildings were compared
together. Among 23 RC school buildings, 2 of them have negligible or light damage
corresponding to IO performance state, while 6 of them have moderate and 12 of
them heavy damage level corresponding to LS and CP performance states,
respectively. 3 of the buildings had been observed to be totally collapsed. The
geographical coordinates of the observed RC school buildings in Bingöl were
obtained, and corresponding site PGV values were calculated by using attenuation
relations of Akkar et al. (2014). The probability of exceedance values for each
building from each fragility curve were obtained, and then, the average values are
calculated. The comparison data can be seen in Table 7-5. (Mazılıgüney et al., 2013)
Table 7-5 Comparison of observed and derived fragility data
Performance State Probability Of Exceedance (%)
Observed Obtained from Fragility Curves
IO 91.3 83.5
LS 65.2 39.2
CP 13.0 22.9
The difference between the observed and the derived probability of exceedance
values are reasonable for IO and CP performance states, but the difference for LS
performance state is not tolerable and not on the safe side. The difference can be
attributed to the varying construction practices of different regions of Turkey.

181
The differences between predicted and observed fragilities are less than 10 percent
at both damage limit states in the 3 and 4 story buildings. Considering the
uncertainties inherent in the fragilities and randomness of ground intensities, these
results can be accepted as satisfactory, suggesting that the proposed procedure can
be implemented to large building stocks of RC school buildings in Turkey for loss
estimation.
7.5 Fragility Curves under Repeated Earthquakes wrt. PGV
The buildings damaged under an EQ may additionally be exposed to the aftershocks
or different earthquakes. In most of cases, these buildings are not retrofitted until the
second EQ occurrence. Damaged buildings need to be assessed separately because
they will soften, and the response under the next EQ will not be identical to the
undamaged ones. Like the main shock-aftershock, sequential EQs are observed in
the medium strongly active seismic regions such as; Turkey, Mexico, Italy, Japan,
and California. (Mazılıgüney et al., 2017)
Many researchers investigated these phenomena for different types of structures.
Moustafa and Takewaki (2010 and 2011) studied the critical ground motion
sequences for modeling the inelastic response of SDOF structures. Jalayer and
Ebrahimian (2017) studied cumulative damage due to aftershocks for existing
reinforced concrete moment-resisting frames. Ruiz-García and Negrete-Manriques
(2011) evaluated drift demand for mainshock and aftershock sequential EQs for
existing steel frames. Jeon (2013) studied the aftershock vulnerability assessment for
RC structures in California. Hatzigeorgiou and Beskos (2009), Zhai et al. (2014),
and Kimura et al. (2010) studied the inelastic response of SDOF structures subjected
to repeated EQs. Uma et al. (2011) compared mainshock and aftershock fragility
curves of New Zealand and US building stock. (Mazılıgüney et al., 2017)
Rehabilitation of the critical structures such as RC school buildings after an EQ is
usually not rapid. Most of these buildings are subjected to the second EQ without

182
any retrofitting and are collapsed under the next EQ Consequently, there is also a
need to derive the F.C.s for such damaged structures to determine the ones that need
an urgent retrofit. This section of the study concentrates on the derivation of F.C.s
for RC school buildings in Turkey due to repeated EQs. (Mazılıgüney et al., 2017)
To investigate the effect of repeated EQ on fragility curves, the ground motions were
sequentially applied to the SDOF models described above. After the first record, a
40-second noise (i.e., zero acceleration) was imposed on the damaged SDOF model
to force the vibration of the structure to get damped (i.e., the velocity of the structure
is approaching zero) and making the SDOF model ready for the second EQ effects.
This process has been repeated for 120x120 ground motion records yielding 14400
nonlinear time history analyses for each SDOF. The maximum top drift values were
extracted from these cumulative actions, and corresponding limit states have been
determined. After this step, PGV-based fragility surfaces obtained from the
interpolated values of probability of exceedance values determined by frEQuency
analysis have been generated. (Mazılıgüney et al., 2017)
The outcomes of this section are illustrated by the below figures, whereas fragility
surfaces display the variation of the probability of exceedance values with repeated
EQ action more clearly. The “x” and “y” axes of the following figures of this section
correspond to the intensity of the first and second earthquakes in terms of PGV,
respectively.
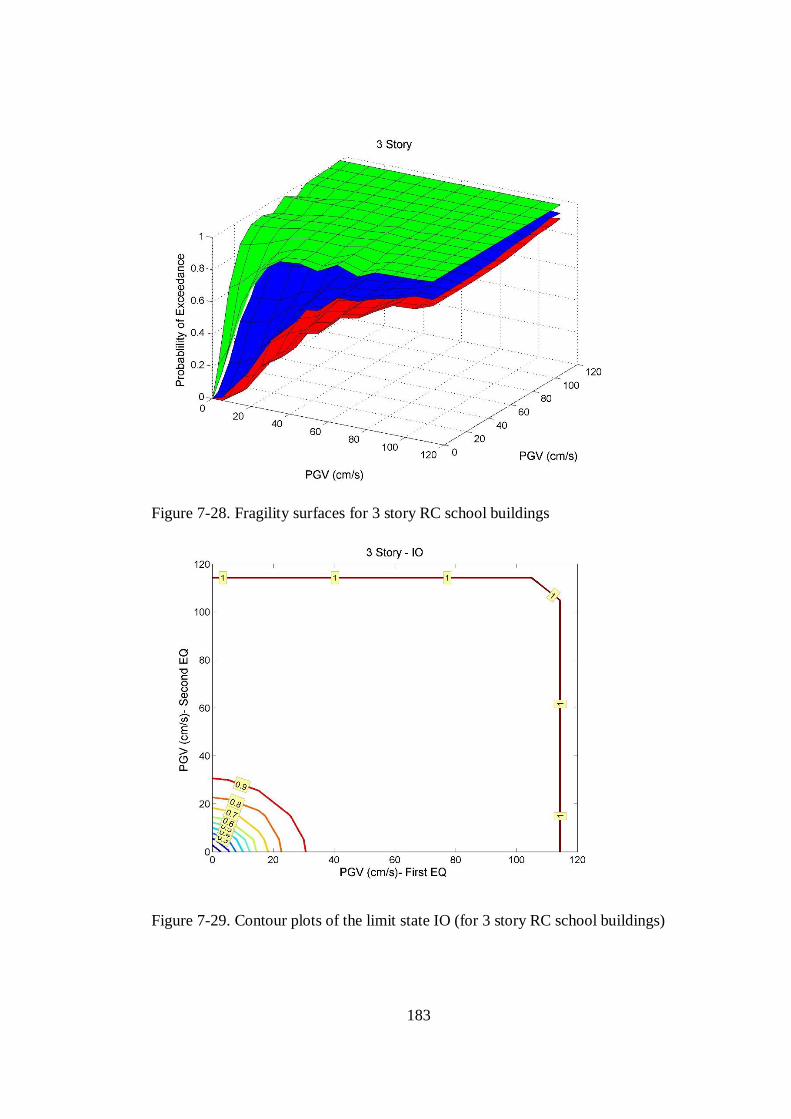
183
Figure 7-28. Fragility surfaces for 3 story RC school buildings
Figure 7-29. Contour plots of the limit state IO (for 3 story RC school buildings)

184
Figure 7-30. Contour plots of the limit state LS (for 3 story RC school buildings)
Figure 7-31. Contour plots of the limit state CP (for 3 story RC school buildings)
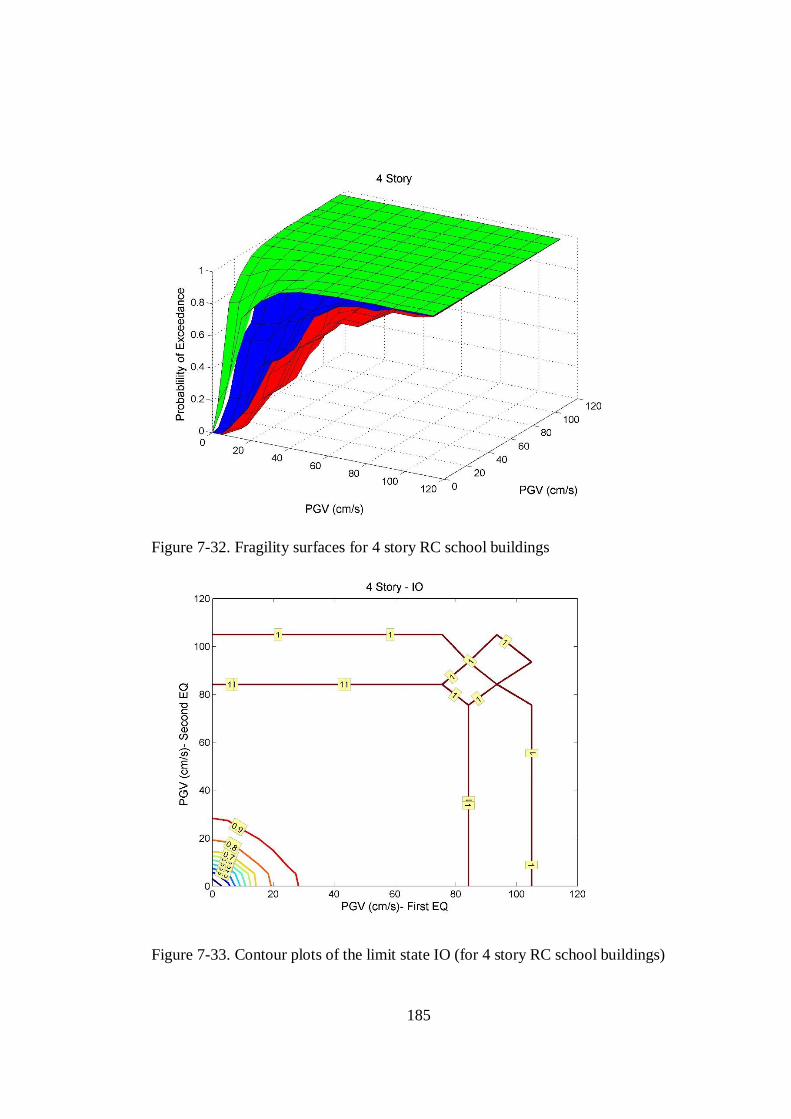
185
Figure 7-32. Fragility surfaces for 4 story RC school buildings
Figure 7-33. Contour plots of the limit state IO (for 4 story RC school buildings)

186
Figure 7-34. Contour plots of the limit state LS (for 4 story RC school buildings)
Figure 7-35. Contour plots of the limit state CP (for 4 story RC school buildings)

187
Figure 7-36. Fragility surfaces for 5 story RC school buildings
Figure 7-37. Contour plots of the limit state IO (for 5 story RC school buildings)

188
Figure 7-38. Contour plots of the limit state LS (for 5 story RC school buildings)
Figure 7-39. Contour plots of the limit state CP (for 5 story RC school buildings)

189
An example can be useful at this stage to understand F.C.s under repeated EQs.
Considering a 3-story school building experienced an EQ which has a PGV= 50 cm/s
and was not retrofitted after the EQ, and then, excited to a second EQ which has a
30 cm/s of PGV value. According to Figure 7-6, the building will have a probability
of exceedance of approximately 95% for IO, 65% for LS, and 50% for CP for the
first EQ, and a probability of exceedance of approximately 85% for IO, 45% for LS
and 30% for CP for the second EQ On the other hand, according to Figure 7-28 and
corresponding contour plots (Figure 7-29, Figure 7-30, and Figure 7-31), this 3-story
building will have a probability of exceedance of approximately 98% for IO, 70%
for LS, and 57% for CP after the second EQ considering the combined action. It is
clearly observed that combined action yielded more critical values in terms of
probability of exceedance, although the second EQ was less critical in terms of PGV.
(Mazılıgüney et al., 2017)
7.6 Discussion of Results
The probability of exceedance curves for LS and CP performance states are close to
each other for RC school buildings. Fragility curves obtained for selected RC school
buildings are roughly consistent with similar research studies (Bilgin, 2013)
concentrating on other public buildings. The number of stories seems to affect the
probability of exceedance of LS and CP performance states. The probability of
exceedance of CP performance state is sensitive in the range of 20-100 cm/s.
The second part of the chapter dealt with the derivation of the F.C.s (or surfaces) due
to repeated EQs where such critical structures might encounter without being
retrofitted. The fragility surfaces and corresponding contour plots display the
accumulation of damage on the structures analyzed and increasing probability of
exceedance for a specific limit state, as expected for such seismically vulnerable
structures encountering catastrophic seismic activities.

190
Due to the accumulation of structural damage and increasing risk of costly damage
or collapse, decision-makers for retrofitting such structures are advised to consider
the resulting fragility surfaces under repeated EQs.

191
CHAPTER 8
8 CONCLUSIONS AND RECOMMENDATIONS
8.1 Summary of the Work Done
The dissertation is composed of 8 chapters.
In the 1st chapter, a brief introduction gives a general overview of the background
and research significance, literature survey, object, and scope of the study. The
previous studies on the seismic vulnerability of RC school buildings are discussed in
the literature survey section of the 1st chapter.
The 2nd chapter is devoted to the description of the database composed of 321 RC
school buildings used in the study. Seismic performance and general properties of
RC buildings in Turkey are mentioned in the first section of the second chapter.
Detailed statistical and structural properties of RC school buildings in the database
are described by related figures and tables in this chapter. The selection procedure
of the buildings for 3, 4, and 5 story sub-classes is also described in this chapter.
In the 3rd chapter, the assessments of RC school buildings in the database by existing
walk-down and preliminary seismic assessment methods and the proposed
preliminary assessment method are discussed. The comparisons of assessment
results with the results of TEC-2007 are also mentioned and discussed in this chapter.
Proposed (Modified ATC-21) Preliminary Assessment Method is also described and
compared with the assessment results of TEC-2007 in the 3rd chapter.
In the 4th chapter, the work done for 3-D modeling of the selected 36 RC school
buildings, pushover analysis, bilinear idealization of capacity curves, ESDOF model
formation, determining of performance limit states for each building, assessment by

192
using DCM target displacements, by ASCE-41 and the discussion of the assessment
results are described. Detailed assessment results of selected 36 RC school buildings
are also compared with TEC-2007 results within the chapter.
In the 5th chapter, the new EQ code of Turkey, TBEC-2018, is examined for RC
school buildings, and selected 36 RC school buildings are analyzed accordingly. The
assessment results are compared by the results of other methods and the results of
TEC-2007.
The 6th chapter is devoted to the assessment of 36 RC school buildings under the
provisions of the Urban Renewal Law. Both the 2013 and 2019 versions of the
provisions are used for assessment, and the results between the versions are
compared as well as with the results of TEC-2007 and TBEC-2018.
The 7th chapter is devoted to the generation of the F.C.s for 3, 4, and 5 story RC
school buildings wrt. PGV and PSA using both bilinear and stiffness and strength
degradation (Modified Clough) material models, the validation of the F.C.s, and the
assessment of related buildings in the database. F.C.s generated are validated by site
observations of the Bingöl database for RC school buildings. F.C.s under repeated
EQs wrt. PGV were also developed and compared with the F.C.s under single EQs
in this chapter.
The 8th and the last chapter is devoted to conclusions and recommendations, and the
work done throughout the dissertation is described briefly.
8.2 Conclusions
Recent EQs in Turkey have shown that the structural performance of reinforced
concrete (RC) buildings play crucial role in terms of EQ losses. RC school buildings
have been observed among the most vulnerable and severely damaged buildings after

193
17 August 1999 Marmara (Mw=7,4), 12 November 1999 Düzce (Mw=7,2), 1 May
2003 Bingöl (Mw=6,4) and 23 October 2011 Van (Mw=7,2) EQs.
A database consisting of 321 RC school buildings are examined for their seismic
vulnerabilities throughout the thesis. A total of 36 RC school buildings, 12 of each
3, 4, and 5 story ones selected from the database were analyzed in detail.
First, the statistical and structural properties of RC school buildings are determined.
Although general parameters of RC school buildings are summarized in Table 2-1,
important parameters are mentioned again.
School buildings have an average concrete compressive strength of 10.22 MPa,
which is consistent with the building stock of Turkey but slightly better than other
public buildings. The average steel tensile strength of the steel used for the buildings
in the database is 253 MPa since STIIIa is used only in 16.5% of the RC school
buildings, and STI is used for the remaining 83.5% of buildings.
36.7% of the school buildings have basement stories. Factory brick was used in
99.4% of the school buildings, and local brick was used in only 0.6% of them, which
are not selected for subclasses.
Only 0.6% of the school buildings have an apparent building quality of “good”, while
35.5% of them have “average” and 63.9% of them have “poor” apparent building
quality. The two buildings having apparent building quality “good” responses both
cases of EQs satisfactorily according to TEC-2007.
The irregularities observed on the school buildings are listed in Table 2-4. As can be
seen from Table 2-4, 37.1% of the RC school buildings in the database have
topographic effects, 13.4% of them have soft-story, 2.2% have a weak story, 1.9%
have vertical irregularity, 2.8% have plan irregularity, 31.5% have short columns,
13.4% have heavy overhangs, 2.2 % have torsion, and 57.9% have pounding effect.

194
The database consisting of 321 RC school buildings are all analyzed by walk-down
and preliminary assessment methods, and the results are compared by TEC-2007.
Comparisons of assessment procedures with TEC-2007 for school buildings are
tabulated in Table 3-15. ATC-21/FEMA-154 (1998) SVA method is evaluated to be
approximately 80 percent relatively and 75 % overall consistent with TEC-2007 for
RC school buildings in Turkey.
Hassan and Sözen (1997), and Yakut (2004) procedures are found to be
approximately 50 percent relative consistent with TEC-2007 for RC school buildings
in Turkey. Since there are usually big openings on the masonry walls, including or
excluding the masonry walls of RC school buildings, do not cause a significant
change in the assessment results of Yakut (2004) procedure.
Sucuoğlu and Yazgan (2003), Sucuoğlu et al. (2007), and Özcebe et al. (2003)
procedures that rely mostly on visual properties of buildings such as irregularities
are not consistent with TEC-2007 for RC school buildings in Turkey.
The differences in assessment results are due to different parameters taken into
consideration in different assessment procedures.
Although none of the procedures were found to adequately determine the
performance in conformance with TEC-2007, the ATC-21/FEMA-154 (1998)
procedure is the most suitable one to assess approximately the performance of
existing RC school buildings consistent with TEC-2007.
Since the Turkish EQ Code is in force and obligatory for all RC school buildings,
the method which has the best consistency with TEC-2007 is advised to be preferred
for rapid assessment purposes, which is ATC-21/FEMA-154 (1998).
A new preliminary assessment method is proposed by merging Yakut’s Procedure
and ATC-21/FEMA-154. The basic capacity index of the Yakut’s Procedure is used,
and the penalty scores for ATC-21/FEMA-154 are modified. The proposed
preliminary assessment method is described in section 3.3 of the dissertation.

195
Evaluation of proposed procedure with TEC-2007 for the LS performance state for
the EQ having a probability of exceedance of 2 % in 50 years lifetime can be seen in
Table 3-17. The unsatisfactory buildings may be assessed by a 91.09 % relative
consistency ratio, and the method is evaluated to be 81.00 % consistent with TEC-
2007.
Evaluation of proposed procedure with TEC-2007 for the IO performance state for
the EQ having a probability of exceedance of 10 % in 50 years lifetime can be seen
in Table 3-18. The unsatisfactory buildings may be assessed by a 91.78 % relative
consistency ratio, and the method is evaluated to be 71.96 % consistent with TEC-
2007.
Although TEC-2007 has been modified, and TBEC-2018 is in effect since January
2019, the proposed method may give insight to structural engineers about the seismic
vulnerabilities of RC school buildings.
Since the consistency of the proposed method with TEC-2007 is more than 90 % for
unsatisfactory buildings, it is advised to be used for preliminary assessment of RC
school building groups. Since there are more than 55,000 RC school buildings in
Turkey, it is advised that the determination of a classification for prioritization of
vulnerable structures can be done by the proposed method, before applying TEC-
2007 or TBEC-2018, which will be time-consuming, uneconomical and impractical.
36 RC school buildings, 12 of each 3, 4, and 5 story ones are selected from the
database, and structural parameters are determined. Structural parameters of the
selected RC school buildings are tabulated in Appendix A. The equivalent SDOF
system parameters are also given for all selected buildings in Appendix D. Statistics
of capacity curve parameters are listed in Table 4-2, Table 4-3, and Table 4-4 for 3,
4, and 5 story RC school buildings, respectively.
The average value of ductility is 3.47 for RC school buildings. The average yield
spectral displacements for RC school buildings are found to be 0.23, 0.25, and 0.27

196
percent of the total height for 3, 4, and 5 story buildings, respectively. The ultimate
displacements are found to be 1.11, 2.06, and 2.34 percent of the total height for 3,
4, and 5 story RC school buildings, respectively.
The yield over-strength ratios (γ) were found to decrease significantly with
increasing number of stories. The average yield over strength ratios for 5 story RC
school buildings is less than 1.0. In the study of Yakut (2004), it is declared that “RC
frame buildings that have yield over-strength ratio of less than 1.65 would perform
poorly against a devastating EQ in Turkey”. The average yield over strength ratios
are less than 1.65 for 3, 4, and 5 story RC school buildings.
It is observed that for RC school buildings, the damage sequence of structural
members “generally” starts by yielding of the beam ends at the lower stories and then
yielding propagates to beams of upper stories. The total collapse of the buildings
occurs typically by the yielding of the column bases of the ground stories. The
damage sequence of RC school buildings is, in fact, the accepted sequence of ductile
beam mechanism. That is because RC school buildings are generally regular in plan
and do not have vertical irregularity. Unfortunately, the ductilities and the ultimate
displacement capacities are not sufficient. The main reason for the low ductilities is
the unconfined yielding regions, i.e., insufficient/small rotation capacities.
There are few buildings that the damage sequence starts with the yielding of column
bases or both column and beam ends. This is not a desirable sequence.
For all RC school buildings, yielding starts at the lowest story and then propagates
to the upper stories.
The average performance limits for RC school buildings are determined and listed
in Table 4-6.
36 selected RC school buildings are assessed by using DCM target displacements,
and the assessment results are tabulated and compared with TEC-2007 in Table 4-10
and Table 4-11. It is seen that the RC school buildings perform better in Y (short)

197
directions according to DCM assessment results. 11 (30,5 %) of the buildings are in
collapse performance state for both orthogonal directions according to DCM and also
according to TEC-2007 assessment results for an EQ of 10 % occurrence probability
in 50 years, and 20 (55,5 %) of them are in collapse performance state for an EQ of
2 % occurrence probability in 50 years. For other buildings, there is not a meaningful
correlation between the DCM and TEC-2007 assessment results.
36 selected RC school buildings are assessed by ASCE-41, and the assessment
results are tabulated and compared with TEC-2007 in Table 4-12. It is seen that the
RC school buildings perform better in Y (short) directions, according to ASCE-41
(ASCE, 2007) assessment results. 9 (25 %) of the buildings are in collapse
performance state in both directions according to ASCE-41 and according to TEC-
2007. 12 (33,3 %) of the buildings are in collapse performance state according to
TEC-2007 and in collapse performance state at least in one direction, according to
ASCE-41 (ASCE, 2007). For other buildings, there is not a meaningful correlation
between the ASCE-41 (ASCE; 2007) and TEC-2007 assessment results.
36 selected RC school buildings are assessed by TBEC-2018. First, the control of
the usability check of linear analyzes are performed for all selected 36 RC school
buildings. According to TBEC-2018, the linear analysis method is found to be valid
for 8 of the 36 buildings, all having shear walls. The linear analysis method is not
valid according to TBEC-2018 for RC school buildings having no shear walls.
However, the method is broadly applicable, provided that the buildings have shear
walls cross-section of higher than 0.5% by the land area in either direction.
As it is well observed in Table 5-4, detailed seismic assessment of the buildings
according to TBEC-2018 revealed that none of the 36 RC school buildings do satisfy
the LD and CD performance levels. Indeed, in the case of DD1, the maximum
expected earthquake having a probability of occurrence of 2 % in 2475 years, all of
the school buildings appear to be within the collapse level (C). Similar findings were
seen under the DD3 - the service earthquake in that none of the buildings achieve the

198
expected limited damage stage, even entering the collapse zone. As seen in Table
5-4, few buildings seem to have controlled damage (CD) or collapse prevention (CP)
performance states only in Y directions. Therefore, usage of the buildings under
these circumstances poses substantial threats to life safety, according to TBEC-2018.
While approximately 20 % of the buildings satisfy the performance requirements of
TEC-2007, it is not the same for TBEC-2018. Excluding a few buildings that have
shown satisfactory performance levels in either X or Y directions for DD-3 EQ, there
is no such building that has fulfilled both DD-1 and DD-3 EQ performance
requirements simultaneously for TBEC-2018.
The density of shear walls in a given principal direction is believed to have a
prominent role in the seismic performance of the buildings (Gülkan and Sözen, 1999;
Yakut, 2004), but unfortunately, most of the buildings in this study have no sufficient
shear walls in either direction to fulfill the code requirements of TEC-2007 as well
as TBEC-2018. Also, the combined effects of low concrete quality and reinforcing
steel help the buildings exhibit these unexpectedly poor performances, irrespective
of the seismic code.
It is determined that the base shear forces of TBEC-2018 are 7.5% larger than the
base shear forces of TEC-2007.
The assessment results reveal that there is not much difference between the codes for
the buildings in this study owing to the deficiency of the shear walls in the buildings
to promote either Turkish Codes. It is evident that TBEC-2018 is more conservative
than TEC-2007.
36 RC school buildings are assessed under the provisions of Urban Renewal Law.
Both 2013 and 2019 versions of the provisions are used for assessment, and the
results between the versions are compared as well as with the results of TEC-2007
and TBEC-2018.

199
Table 6-1 presents the performance of the school buildings according to the URL-
2013. 8 buildings out of 36 satisfy the URL-2013 in all directions so that they are
found to be seismically having a low risk. However, this finding does not necessarily
mean that they also satisfy the target performance specified in TEC-2007. Most of
the buildings in this category have three stories. The lower number of stories
associated with the lower building height, the buildings become less vulnerable to
EQs. Almost all five and four-story buildings failed the risk assessment as per URL-
2013.
The status of the buildings appears to be much worse when URL-2019 is considered.
Indeed, all of the buildings except for only one are found to be risky, as seen in Table
6-2. Even the satisfactory buildings in the case of URL-2013 have failed the risk
assessment in this case. The main reason for this is based on the DD1 earthquake
level, which has as high as 1.5 times design spectral acceleration in the elastic
spectrum.
In order to compare URL-2013 and URL-2019, the buildings are tested for the same
design earthquake of a 10% probability of occurrence in 50 years. As seen in Table
6-3, among the 36 buildings, only four of them satisfy both provisions. Although the
selected 36 RC school buildings in this study are analyzed and assessed by linear
elastic procedures of either TEC-2007 or TEC-2018, there is reasonable consistency
between the assessment results of URL provisions and the seismic codes.
F.C.s are generated for 3, 4, and 5 story RC school buildings wrt. PGV and PSA
using both bilinear and stiffness and strength degradation (Modified Clough)
material models. 100 ground motion records are used for F.C. generation. F.C.s
generated are validated by site observations of the Bingöl database for RC school
buildings.

200
The generated F.C.s revealed that the number of stories affects the probability of
exceedance of all performance states for all cases. EQ vulnerability of RC school
buildings increases with increasing number of stories.
The probability of exceedance curves for IO performance state is generally distant
from the curves of LS and CP performance states, whereas the probability of
exceedance curves for LS and CP performance states are close to each other for RC
school buildings. That is why the performance limit definitions are likewise. IO and
LS performance limits are distant from each other, while LS and CP limits are close.
The probability of exceedance of CP performance state is sensitive in the range of
20-100 cm/s.
Bilinear and Modified Clough F.C.s have significant differences until the probability
of exceedance of 80 %, and Modified Clough-based curves indicate a larger
probability of exceedance values. Two curves nearly coincide at and after 80% of
probability of exceedance. It is evident that there are significant differences between
the Bilinear and Modified Clough material models-based probability of exceedance
curves. Hence, the degradation characteristics of the structural model seem to have
a major influence on the final F.C.s.
It is important to note here that maximum values of the IMs considered and the
number of records utilized or available in each bin throughout GM set formation,
and F.C. generation would certainly affect the outcomes of the risk study, which
should be further investigated as it is stated by Mazılıgüney et al., 2013.
Comparison of observed from Bingöl database and derived fragility data are
tabulated in Table 7-5. The difference between the observed and the derived
probability of exceedance values are reasonable for IO and CP performance states,
but the difference for LS performance state is not tolerable and not on the safe side.
The difference can be attributed to the limited number of school buildings in the
Bingöl database and varying construction practices of different regions of Turkey.

201
The differences between predicted and observed fragilities are less than 10 percent
at both damage limit states in the 3 and 4 story buildings. Considering the
uncertainties inherent in the fragilities and randomness of ground intensities, these
results can be accepted as satisfactory, suggesting that the proposed F.C.s can be
implemented to large building stocks of RC school buildings in Turkey for loss
estimation studies.
F.C.s under repeated EQs wrt. PGV are also generated and compared with the F.C.s
under single EQs in section 7.5. It is clearly observed that combined action yielded
more critical values in terms of probability of exceedance, although the second EQ
was less critical in terms of PGV (Mazılıgüney et al., 2017). Due to the accumulation
of structural damage and increasing risk of costly damage or collapse, decision-
makers for retrofit of such structures are advised to consider the resulting fragility
surfaces under repeated EQs. It is believed that the F.C.s generated in the
dissertation can be used for school buildings in Turkey.
8.3 Recommendations
There are more than 55.000 RC school buildings in Turkey, and the seismic
vulnerability of them is a significant risk for the whole society. Determining seismic
vulnerabilities of RC school buildings, and retrofitting or reconstructing the risky
ones is an urgent task for Turkey.
The extension of the study to develop more precise preliminary assessment methods
and F.C.s will help to determine the seismic vulnerabilities of RC school buildings
in a shorter time. Undoubtedly, most of the effort should be devoted to determining
the vulnerabilities of RC school buildings and taking urgent precautions to reduce
the risks.

202

203
REFERENCES
Akkar S., Sucuoğlu H., Eeri M. and Yakut A., (2005), "Displacement-Based
Fragility Functions for Low-and Mid-rise Ordinary Concrete Buildings",
Earthquake Spectra, Vol. 21, 901-927.
Akkar, S., Bommer, JJ., (2007) “Empirical prediction equations for peak ground
velocity derived from strong-motion records from Europe and the Middle
East.”, Bulletin of the Seismological Society of America; 97:511–530.
Akkar, S., Sandıkkaya, A., Bommer, JJ., (2014), “Empirical ground-motion models
for point- and extended-source crustal earthquake scenarios in Europe and
the Middle East”, Bulletin of Earthquake Engineering, 12:359–387.
Altoontash, A., (2004), “Simulation and Damage Models for Performance
Assessment of Reindorced Concrete Beam-Column Joints”, Ph.D. Thesis,
Department of Civil and Environmental Studies, Standford University.
ASCE/SEI 41-06, (2007), “Seismic Rehabilitation of Existing Buildings”, Structural
Engineering Institute, American Society of Civil Engineers.
Atalay, M.B., and Penzien, J., (1975), “The seismic behavior of critical regions of
RC components as influenced by moment, shear and axial force”, Report No.
EERC75-19, University of California, Berkeley, California.
ATC-13, (1985), “Earthquake Damage Evaluation Data for California”, Palo Alto,
Applied Technology Council, Redwood City, California.
ATC-40, (1996), “Seismic Evaluation and Retrofit of Concrete Buildings”, Applied
Technology Council, California Seismic Safety Commission.

204
Avşar, Ö., (2009), "Fragility Based Seismic Vulnerability Assessment of Ordinary
Highway Bridges in Turkey", Ph.D. Thesis, The Graduate School of Natural
and Applied Sciences, Middle East Technical University, Ankara, Turkey.
Ay, B.Ö., (2006), "Fragility Based Assessment of Low-Rise and Mid-Rise RC Frame
Buildings in Turkey", M.S.Thesis, The Graduate School of Natural and
Applied Sciences, Middle East Technical University, Ankara, Turkey.
Aydınlıoğlu, M.,N., and Celep, U., (2005), "Improving a Pushover-Based Seismic
Design Procedure for Practice", Earthquake Engineering: Essentials and
Applications, Earthquake Engineering Research Center, July 18-20,Middle
East Technical University.
Baker, J. W., (2015), “Efficient analytical fragility function fitting using dynamic
structural analysis”, Earthquake Spectra, 31(1), pp. 579-599.
Bakhshi, A., and Asadi, P., (2013), “Probabilistic evaluation of seismic design
parameters of RC frames based on F.C.s”, Scientia Iranica A: Civil
Engineering, 20 (2), pp. 231–241.
Barka, A., (2000), "Seismic risk in Marmara", 2nd İstanbul and Earthquake
Symposium, Turkish Chambers of Civil Engineers, İstanbul, pp. 5-15.

205
Bertero V.V. and Bozorgnia Y., (2004), “The Early Years of Earthquake Engineering
and Its Modern Goal”, CRC Press LLC.
Bilgin, H., (2013), “Fragility-based assessment of public buildings in Turkey”,
Engineering Structures, 56, pp. 1283–1294.
Binder, R.W., (1952), “Engineering Aspects of the 1933 Long Beach Earthquake”,
Proceedings of Symposium on Earthquake and Blast Effects on Structures,
EERI and University of California, 187–221.
Binici, B., Yakut, A., Özcebe, G., and Erenler, A., (2015), “Provisions for the
Seismic Risk Evaluation of Existing Reinforced Concrete Buildings in
Turkey under the Urban Renewal Law”, Earthquake Spectra, Volume 31, No.
3, pp. 1353–1370.
Boğazici University, Department of Earthquake Engineering (2002) “Earthquake
Risk Assessment for İstanbul Metropolitan Area”, Final Report, Kandilli
Observatory and Earthquake Research Center.
Bolt, B.A., (2001), “The Nature of Earthquake Ground Motion”, Chapter 1, The
Seismic Design Handbook, Springer US.
Bolt, B.A., (2004), “Engineering Seismology”, CRC Press LLC.

206
Bommer, J.J., Elnashai, A. and Weir, A.G., (2000), “Compatıble Acceleratıon And
Dısplacement Spectra For Seısmıc Desıgn Codes”, 12WCEE2000 (12th
World Conference on Earthquake Engineering), 207.
Boore, D.M, Atkinson, GM., (2008), “Ground-motion prediction equations for the
average horizontal component of PGA, PGV, and 5%-damped PSA at
spectral periods between 0.01 s and 10.0 s.”, Earthquake Spectra; 24, pp. 99–
138.
Booth, E., Spence, R., and Bird, J., (2004), “Building Vulnerability Assessment
using Pushover Methods – A Turkish Case Study”, Proceedings of an
International Workshop on Performance–Based Seismic Design Concepts
and Implementation, Bled Slovenia, pp. 397–408.
Brunesi, E., Nascimbene, R., Parisi, F., Augenti, N., ,(2015), “Progressive collapse
fragility of RC framed structures through incremental dynamic analysis”,
Engineering Structures, 104, pp. 65–79
Calvi, G.M., Pinho, R. and Crowley, H., (2006) “State-of- the-Knowledge on the
Period Elongation of RC Buildings during Strong Ground Shaking”, First
European Conference on Earhquake Engineering and Seismology, Geneva.
Cardone, D., Perrone, G., (2015), “Damage and Loss Assessment of Pre-70 RC
Frame Buildings with FEMA P-58: A Case Study”, Improving the Seismic
Performance of Existing Buildings and Other Structures, ASCE and ATC

207
CEN, (2005), “Eurocode 8: Design provisions of structures for earthquake
resistance. Part 3: assessment and retrofitting of buildings (EN1998-3)”,
CEN, Brussels.
Çelik, O.C., and Ellingwood, B.R., (2008), “Modeling Beam-Column Joints in
Fragility Assessment of Gravity Load Designed RC Frames”, Journal of
Earthquake Engineering, 12, pp. 357–381.
Çelik, O.C., and Ellingwood, B.R., (2010), “Seismic Fragilities for Non-ductile RC
Frames – role of Aleatoric and Epistemic Uncertainties”, Structural Safety,
32, pp. 1–12.
Chopra A.K. and Chintanapakdee C., (2001), "Comparing response of SDF systems
to near-fault and far-fault earthquake motions in the context of spectral
regions", Earthquake Engineering and Structural Dynamics, Vol. 30, 1769-
1789.
Clough, R.W. and Johnston, S.B., (1966), “Effect of stiffness degradation on
earthquake ductility requirements”, Proceedings, 2nd Japan National
Conference on Earthquake Engineering, 227-232.
Crowley, H., Pinho, R. and Bommer, J., (2004), “A probabilistic displacement-based
vulnerability assessment procedure for earthquake loss estimation”, Bulletin
of Earthquake Engineering, 2(2), pp. 173–219.
208
Dalyan, İ., Şahin, B., (2019), “Evaluation of the structural system of an existing
reinforced concrete building under earthquake loads according to the 2007
and 2018 Turkish earthquake codes”, Turkish Journal of Earthquake
Research, 1 (2), December, pp. 134-147
Decanini, L., Mollaioli, F., Mura, A., (2001), “Equivalent SDOF systems for the
estimation of seismic response of multistory frame structures”, Transactions
on the Built Environment, Vo. 57, pp. 101-110
Del Gaudio, C., Ricci, P., Verderame, G.M., and Manfredi, G., (2015),
“Development and urban-scale application of a simplified method for seismic
fragility assessment of RC buildings”, Engineering Structures, Vol. 91,
pp.40-57.
Demirci, C., (2014), “An Approach for Seismic Damage Assessment of Residential
Buildings”, M.S. Thesis, The Graduate School of Natural and Applied
Sciences, Middle East Technical University, Ankara, Turkey.
Dilmaç, H., Ulutaş, H., Tekeli, H., Demir, F., (2018), “An evaluation on seismic
performance of existing reinforced concrete buildings in Turkey”, The
Journal of Graduate School of Natural and applied Sciences of Mehmet Akif
Ersoy University, 9 (Supplementary Issue 1), pp. 224-237
209
Dhakal, R.P., Mander, J.B., and Mashiko, N., (2006), “Identification of Critical
Ground Motions for Seismic Performance Assessment of Structures”,
Earthquake Engineering and Structural Dynamics, Volume 35, pp. 989-1008.
Dolce, M., Kappos, A.J., Masi, A., Penelis, G. and Vona, M., (2006), “Vulnerability
Assessment and Earthquake Scenarios of the Building Stock of Potenza
(Southern Italy) Using the Italian and Greek Methodologies”, Engineering
Structures, 28, pp. 357-371.
EERI Committee on Seismic Risk, (1984), Earthquake Spectra, 1, 33–40.
Elgin, K.G., (2007) “İstanbul Seismic Risk Mitigation and Emergency Preparedness
Project (ISMEP)”, Turkey, International Earthquake Symposium, Kocaeli.
Erberik, M.A., and Sucuoğlu, H., (2004), “Seismic energy dissipation in
deteriorating systems through lowcycle fatigue”, Earthquake Engineering
and Structural Dynamics 33, 49-67.
Erberik, M.A., (2008), “Fragility-based Assessment of Typical Mid-rise and Low-
rise RC Buildings in Turkey”, Engineering Structures, 30, pp. 1360–1374.
Erberik, M.A., and Elnashai, A.S., (2005), “Seismic Vulnerability of Flat Slab
Structures”, Technical Report, Mid America Earthquake Centre, University
of Illinois at Urbana-Champaign.

210
Erberik, M.A., and Kurtman, B., (2010), “A Detailed Evaluation On Degrading
Behavior Of Structural Systems”, Proceedings of the 9th U.S. National and
10th Canadian Conference on Earthquake Engineering, Toronto, Ontario,
Canada, Paper No. 369.
Erduran, E. (2005) “Component Based Seismic Vulnerability Assessment Procedure
for RC Buildings”, Turkey, Ph.D. Thesis, The Graduate School of Natural
and Applied Sciences, Middle East Technical University, Ankara, Turkey.
Erduran, E., and Yakut, A., (2004), “Drift Based Damage Functions for RC
Columns”, Computers and Structures, Vol. 82, 121-130.
Erduran E. and Yakut A., (2004-2), "Development of Component Importance
Factors for RC Buildings", Proceedings of the 6th International Congress on
Advances in Civil Engineering, October 6-8, 2004, İstanbul.
Ersoy, Ş., and Koçak, A., (2016), “Disasters and earthquake preparedness of children
and schools in İstanbul, Turkey”, Geomatics, Natural Hazards and Risk,
Vol.7, No.4, pp. 1307-1336.
European Committee for Standardization, (2004), “Eurocode 8: Design of structures
for earthquake resistance Part 3: Strengthening and repair of buildings”,
Eurocode 8, Brussels.

211
Fajfar, P., (2002), "Structural analysis in earthquake engineering – A breakthrough
of simplified non-linear methods", 12th European Conference on Earthquake
Engineering, London; Paper No.843.
Fardis, M.N., and Panagiotakos, T.B., (1996), “Hysteretic Damping of RC
Elements”, 11th World Conference on Earthquake Engineering, Paper No.
464, Acapulco, Mexico.
FEMA-154, (1988), “Rapid Visual Screening of Buildings for Potential Seismic
Hazards: A Handbook”, Federal Emergency Management Agency,
Washington (D.C.), USA.
FEMA 273 (Guidelines) and 274 (Commentary), (1997), “NEHRP guidelines for
the seismic rehabilitation of buildings” Federal Emergency Management
Agency, Washinton (D.C.), USA.
FEMA-356, (2000), “Prestandard and Commentary for the Seismic Rehabilitation of
Buildings”, Federal Emergency Management Agency, Washington (D.C.),
USA.
FEMA-440, (2005), “Improvement of Nonlinear Static Seismic Analysis
Procedures”, Applied Technology Council (ATC-55 Project), Federal
Emergency Management Agency, Redwood City, California, USA.

212
FEMA-NIBS, (2003), “Multi-hazard loss estimation methodology: earthquake
model”, HAZUS-MH Technical Manual, Federal Emergency Management
Agency, Washington DC, USA.
FEMA-P440A, (2009), “Effects of Strength and Stiffness Degradation on Seismic
Response”, Applied Technology Council (ATC-62 Project), Federal
Emergency Management Agency, Redwood City, California, USA.
Franchin, P., Lupoi, A., Pinto, P.E., and Schotanus, M.I.J., (2003), “Sesimic Fragility
of RC Structures Using a Response Surface Approach”, Journal of
Earthquake Engineering, 7(1) Special Issue, pp. 45-77.
Freeman, S., A., Nicoletti, J., P., and Tyrell, J., V., (1975) “Evaluations of Existing
Buildings for Seismic Risk: A case study of Puget Sound Naval Shipyard”,
Bremerton. Proceedings of First U.S. NCEE, EERI, Berkeley, Washington, ,
113-122.
Freeman, S. A., 1992, “On the Correlation of Code Forces to Earthquake Demands,”
Proceedings of 4th U.S./Japan Workshop on Improvement of Building
Structural Design and Construction Practices, ATC 15-3, Applied
Technology Council, Kailua-Kona, Hawaii.

213
Gardoni, P., Mosalam, K.M., and DerKiureghian, A., (2003), “Probabilistic Seismic
Demand Models and Fragility Estimates for RC Bridges”, Journal of
Earthquake Engineering, 7(1) Special Issue, pp. 79–106.
Freeman, S. A., Paret, T. F., Searer, G. R., and İrfanoglu, A., (2004), “Musings on
Recent Developments in Performance-Based Seismic Engineering,”
Structures Congress 2004, SEI, American Society of Civil Engineers,
Nashville.
Geschwind, C. H., (1996), “Earthquakes and their interpretation: The campaign for
seismic safety in California”, 1906–1933, Ph.D. Thesis, Johns Hopkins
University.
Govindan, P., Vivekanandan, D., “Effect ofopening in brick-infilled square panel”,
The Indian Concrete Journal, June 1990;298–303.
Griffiths, J.H.P., İrfanoğlu, A., Eeri, M., Santiago, P., (2007), "İstanbul at the
threshold: an evaluation of the seismic risk in İstanbul", Earthquake Spectra,
Vol. 23, pp. 63-75.
Gülkan, P, Sözen, M.,A., (1999), “Procedure for determining seismic vulnerability
of building structures”, ACI Structural Journal, 96(3):336–342.

214
Gülkan P., Bakır B.S., Yakut A. and Yılmaz M.T.,(2003), "Just How Prescient Are
Our Building Damage Predictions", NATO Science Series, Vol.29
Gülkan, P., Utkutuğ, D., (2003), “Minimum design requirements for earthquake
safety of school buildings”, Engineering News of Turkey, Vol. 425, 2003/3
Gülkan, P., (2004), “Obstacles to Improving Seismic Safety of School Buildings in
Turkey”, Chapter in Keeping schools safe in earthquakes, a publication of the
OECD Programme on Educational Building (PEB)
Gülkan, P., Kazaz, İ. and Yakut, A., (2005), “Caveats for Nonlinear Response
Assessment of Short-Period Structures”, Earthquake Engineering: Essentials
and Applications, Earthquake Engineering Research Center, Middle East
Technical University, July 18-20, 2005.
Güneyisi, E.M., (2007), "Development of F.C.s for Seismic Vulnerability
Assessment of High-Rise R/C Buildings with Added Viscous Dampers",
Ph.D.Thesis, The Institute for Graduate Studies in Science and Engineering,
Boğaziçi University, İstanbul, Turkey.
Hancılar, U., Çaktı, E., Erdik, M., Franco, G.E., and Deodatis, G., (2014),
“Earthquake vulnerability of school buildings: Probabilistic structural
fragility analysis”, Soil Dynamics and Earthquake Engineering, 67, pp. 169–
178.

215
Hasan, R., Xu, L., and Grierson, D.E., (2002), "Push-Over Analysis for
Performance-Based Seismic Design", Computers and Structures, Vol. 80,
2483-2493.
Hassan, A.F., and Sözen, M.A., (1997) “Seismic Vulnerability Assessment of Low-
Rise Buildings in Regions with Infrequent Earthquakes”, ACI Structural
Journal, Vol. 94, No. 1., 31-39
Hatzigeorgiou, G. D., and Beskos, D. E., (2009), Inelastic displacement ratios for
SDOF structures subjected to repeated earthquakes, Engineering Structures
31 (2009) 2744_2755.
HAZUS (1997) “Earthquake Loss Estimation Methodology”, Vol. I, National
Institute of Building Sciences.
Housner, G.W., (1984), “Historical view of earthquake engineering”, Proceedings of
the 8th World Conference on Earthquake Engineering, San Francisco, 1, 25–
39.
Hu, Y.X., Liu, S.C., and Dong, W., (1996), “Earthquake Engineering”, E & FN
Spon, London.
Hudson, D.E., (1992), “A History of Earthquake Engineering”, Proceedings, IDNDR
International Symposium on Earthquake Disaster Reduction Technology,
Japan, 3–13.

216
Ibarra, L.F., Medina, R.A., and Krawinkler, H., (2005), “Hysteretic models that
incorporate strength and stiffness deterioration”, Earthquake Engineering and
Structural Dynamics 34, 1489-1511.
İbrahim, Y., E., El-Shami, M., M., (2011) “Seismic F.C.s for Mid-Rise RC Frames
in Kingdom of Saudi Arabia”, The IES Journal Part A: Civil & Structural
Engineering, Vol. 4(no. 4), pp. 213-223.
İnel, M., Özmen, H.B., and Bilgin, H., (2008), “Seismic performance evaluation of
school buildings in Turkey”, Structural Engineering & Mechanics, Vol. 30, No. 5,
pp. 535-558.
İstanbul Project Coordination Unit (IPCU), (2008), “Guideline for Seismic Retrofit
of School and Hospital Facilities in İstanbul”, IPCU, İstanbul, Turkey.
Jalayer,F., and Ebrahimian, H.,(2017). Seismic risk assessment considering
cumulative damage due to aftershocks, Earthquake Engng Struct. Dyn.;
46:369–389.
Japan International Co-operation Agency and İstanbul Metropolitan Municipality
(2002) “The Study on a Disaster Prevention / Mitigation Basic Plan in
İstanbul Including Seismic Microzonation in the Republic of Turkey”, Final
Report, Tokyo-İstanbul.

217
Japan Ministry of Education, Culture, Sports, Science and Technology, (2006),
“Seismic retrofitting quick reference: school facilities that withstand EQs”,
Tokyo.
Javanpour, M., (2012), “Assessment of the Seismic Behaviour of the RC Structures
Based on the Probabilities: Implementing F.C.s”, Journal of Civil
Engineering and Science, Vol. 1, Issue 2, pp. 59-64.
Kale, Ö., (2009), “An Emprical Relationship Based on High-Pass Filtering to
Estimate Usable Period Range for Nonlinear SDOF Response”, M.S. Thesis,
The Graduate School of Natural and Applied Sciences, Middle East
Technical University, Ankara, Turkey.
Kalem, İ., (2010), "Capacity Related Properties and Assessment of School Buildings
in Turkey", M.S.Thesis, The Graduate School of Natural and Applied
Sciences, Middle East Technical University, Ankara, Turkey.
Kandilli Observatory and Earthquake Research Institute, “March 13, 1992 (Ms=6.8),
Erzincan Earthquake: A Preliminary Reconnaissance Report”, Department of
Civil Engineering, Bogazici University, May 1992, p. 119.
Kircher, C. A., Nassar, A. A., Kustu, O., and Holmes, W. T., (1997), “Development
of building damage functions for Earthquake loss estimation”, Earthquake
Spectra 12 -4, 663–682.

218
Kirçil, M.S., and Polat, Z., (2006), “Fragility analysis of mid-rise R/C frame
buildings”, Engineering Structures, 28, pp. 1335–1345.
Kunnath, S.K., Reinhorn, A.M., and Park, Y.J., (1990), “Analytical modeling of
inelastic seismic response of RC structures”, ASCE Journal of Structural
Engineering 116(4), 996-1017.
Kuramoto, H., Teshigawara, M., Okuzono, T., Koshika, N., Takayama, M., Hori, T.,
(2000), “Predicting the earthquake response of building systems using
equivalent single degree of freedom system”, 12th World Conference on
Earthquake Engineering, Auckland, New Zeland
Kurtman, B., (2007). “A detailed evaluation of the degradation characteristics of
simple structural systems”, M.S. Thesis, The Graduate School of Natural and
Applied Sciences, Middle East Technical University, Ankara, Turkey.
Kwon, O.S., and Elnashai, A.S., (2006), “The Effect of Material and Ground Motion
Uncertainty on the Seismic Vulnerability Curves of RC Structure”,
Engineering Structures, Volume 28, pp. 289–303.
Mahin, S.A., and Bertero, V.V., (1976). “Nonlinear seismic response of a coupled
wall system”, Journal of the Structural Division, ASCE, Vol. 102, No. 9, pp.
1759–1780.

219
Malhotra, P., K., (2006), “Smooth Spectra of Horizontal and Vertical Ground
Motions”, Bulletin of Seismological Society of America, Vol. 96, 506-518.
Mavroeidis, G.P., Papageorgiou, A.S., (2003), “A mathematical representation of
near-fault ground motions”, Bulletin of the Seismological Society of
America, 93 (3) (2003), pp. 1099-1131.
Mazılıgüney, L., Azılı, F., Yaman, İ.Ö. (2008), “In-Situ Concrete Compressive
Strengths of Residential, Public and Military Structures”, Eighth
International Congress on Advances in Civil Engineering, ACE2008,
September 15-17, Vol.3, Famagusta, Turkish Republic of Northern Cyprus,
pp. 273-280.
Mazılıgüney, L., Yakut, A., Kadaş, K., Kalem, İ., (2012), “Evaluation of Preliminary
Assessment Procedures for Reinforced Concrete School Buildings in
Turkey”, 10th International Congress on Advances in Civil Engineering,
ACE2012, October 17-19, Middle East Technical University, Ankara,
Turkey
Mazılıgüney, L., Yakut, A., Kadaş, K., Kalem, İ., (2013), “Fragility Analysis of
Reinforced Concrete School Buildings Using Alternative Intensity Measure-
Based Ground Motion Sets”, 2nd Turkish Conference on Earthquake
Engineering and Seismology – TDMSK -2013, Hatay, Turkey.
Mazılıgüney, L., Kadaş, K., Akansel, V. H., Yakut, A., (2017), “Fragility Curves for
Reinforced Concrete School Buildings due to Repeated Earthquakes”, 4th
International Conference on Earthquake Engineering and Seismology,
Eskişehir, Turkey, 468-471

220
Mazılıgüney, L., Akansel, V. H., Soysal, B. F., Kadaş, K., Yakut, A., (2019),
“Seismic R,sk Assessment of School Buildings on the Basis of Recent
Turkish Seismic Hazard Map”, VI. International Earthquake Symposium
Kocaeli 2019, IESKO 2019, September 25-27, Kocaeli, Turkey
McGuire, W., Gallagher, R.H., and Ziemian, R.D., (2000). "Matrix Structural
Analysis", Second edition, John Wiley & Sons, New York.
Ministry of Public Works and Settlement (MPWS), Turkish Earthquake Code (TEC-
1975), (1975), “Specifications for buildings to be built in seismic areas”,
Ministry of Public Works and Settlement, Ankara, Turkey.
Ministry of Public Works and Settlement (MPWS), Turkish Earthquake Code (TEC-
1998), (1998), “Specifications for structures to be built in disaster areas”,
Ministry of Public Works and Settlement, Ankara, Turkey.
Ministry of Public Works and Settlement (MPWS), Turkish Earthquake Code (TEC-
2007), (2007), “Specifications for the Buildings to be Constructed in Disaster
Areas”, Ministry of Public Works and Settlement, Ankara, Turkey.
Ministry of Environment and Urbanization (MEU), Urban Renewal Law, (2012),
“The Urban Renewal Law for Regions under Disaster Risk”, Law No: 6306,
Official Gazette: Date, 28(309), Volume 52, Turkey.

221
Miranda, E., (2005), "Seismic Evaluation of Existing RC Buildings", Earthquake
Engineering: Essentials and Applications, Earthquake Engineering Research
Center, Middle East Technical University, July 18-20, 2005.
Mosalam, K., Ayala, G., White, R. and Roth, C., (1997), “Seismic Fragility of RC
Frames with and without Masonry Infill Walls”, Journal of Earthquake
Engineering (JCES), 1, pp. 693–720.
Moustafa A., and Takewaki Izuru, (2010). “Modeling Critical Ground-Motion
Sequences for Inelastic Structures”. Advances in Structural Engineering Vol.
13 No. 4.
Moustafa A., and Takewaki Izuru, (2011). “Response of nonlinear single-degree-of-
freedom structures to random acceleration sequences”. Engineering
Structures 33 (2011) 1251–1258.
Muvafık, M., Özdemir, M., (2018), “Computer-aided quick determination of
earthquake performance of buildings by using street survey and preliminary
assessment methods”, 3rd International Symposium on Natural Hazards and
Disaster Management, 25-27 October, Van Yüzüncüyıl University, Turkey
Naqvi, T., Datta, T.K., and Ramana, G.V., (2010), “Fragility Analysis of Concrete
Building Structures”, International Journal of Earth Sciences and
Engineering, Vol. 03, No. 05, pp. 729-743.

222
Nemutlu, Ö., F., Sarı, A., (2018) “Comparison of Turkish earthquake code in 2007
with Turkish earthquake code in 2018”, International Engineering and
Natural Sciences Conference (IENSC 2018), November 2018, Diyarbakır,
Turkey
Nemutlu, Ö., F., Sarı, A., (2019) “Comparison of Turkish Building Earthquake Code
in 2018 with American International Building Code in 2018”, 5th
International Conference on Earthquake Engineering and Seismology,
5ICEES, October 8-11, Ankara, Turkey
Nielson, B. and Pang, W., (2011). “Effect of Ground Motion Suite Size on
Uncertainty Estimation in Seismic Bridge Fragility Modeling”, Structures
Congress 2011, pp. 23-34.
OECD, (2004), “Keeping schools safe in earthquake”, a publication of the OECD
Programme on Educational Building (PEB)
Oğuz, S., (2005), "Evaluation of Pushover Analysis Procedures for Frame
Structures", M.S.Thesis, The Graduate School of Natural and Applied
Sciences, Middle East Technical University, Ankara, Turkey.
OpenSees 2.3.2. Computer Software, University of California, Berkeley, CA.
Retrieved from http://opensees.berkeley.edu
223
OpenSees 2.4.5. Computer Software, University of California, Berkeley, CA.
Retrieved from http://opensees.berkeley.edu, Accessed 12 December 2014.
Özcebe, G., Yücemen, M.S., Yakut, A., and Aydogan, V., (2003) “Seismic
Vulnerability Assessment Procedure for Low- to Medium-Rise RC
Buildings”, Turkey, Structural Engineering Research Unit, Middle East
Technical University, Ankara.
Özcebe, G., Yücemen, M.S., Aydogan, V. and Yakut A., (2003), "Preliminary
Seismic Vulnerability Assessment of Existing RC Buildings in Turkey Part
I: Statistical Model Based on Structural Characteristics", Seismic Assessment
and Rehabilitation of Existing Buildings, NATO Science Series, Vol. 29, 29-
42.
Özcebe, G., Ramirez, J., Wasti, S. T., Yakut, A., (2003), “1 May 2003 Bingöl
Earthquake Engineering Report”, TÜBİTAK (Turkey), NSF (USA)
Özcebe, G., Sucuoglu, H., Yücemen, M., S., Yakut, A., and Kubin, J., (2006),
“Seismic Risk Assessment of Existing Building Stock in İstanbul A Pilot
Application in Zeytinburnu District”, 8NCEE", p.No.1737.
Özmen, B., (2000), "Damage Status of August 17th, 1999 Kocaeli Earthquake (with
numerical datas) (in Turkish)", TDV/DR 010-53, Turkey Earthquake
Foundation, p. 132.

224
Özün, A., (2007), "Fragility Based Assessment of Low-Rise and Mid-Rise RC Frame
Buildings in Turkey Using Düzce Damage Database", M.S.Thesis, The
Graduate School of Natural and Applied Sciences, Middle East Technical
University, Ankara, Turkey.
Pinho, R., Bommer, J.J., and Glaister, S., (2002), “A Simplified Approach to
Displacement-based Earthquake Loss Estimation Analysis”, Proceedings of
the 12th European Conference on Earthquake Engineering, London, U.K.,
Paper No. 738.
Porter, K., (2014), “A Beginner’s Guide to Fragility, Vulnerability, and Risk”,
Resource Document, University of Colorado Boulder and SPA Risk LLC,
Denver CO, USA.
Power, M., Chiou, B., Abrahamson, N., Bozorgnia, Y., Shantz, T., Roblee, C.,
(2008), “An Overview of The NGA Project”, Earthquake Spectra; 24:3–21.
Press, F., (1984), “The Role of Science and Engineering in Mitigating Natural
Hazards”, Proceedings of the 8th World Conference on Earthquake
Engineering, San Francisco.
Priestley, M. J. N., (1998), “Displacement-Based Approaches to Rational Limit
States Design of New Structures”, Proceedings of the 11th European
Conference on Earthquake Engineering, Rotterdam, AA Balkema.

225
Proag, V., (2014), “The concept of vulnerability and resilience”, 4th International
Conference on Building Resilience, 8-10 September, Salford Quays, United
Kingdom.
Reed, J.W., and Kennedy, R.P., (1994), “Methodology for Developing Seismic
Fragilities”, Final Report TR-103959, EPRI.
Reinhorn, A.M., (1997), "Inelastic Analysis Tecniques in Seismic Evaluations",
Proceedings of the International Workshop on Seismic Design
Methodologies for the Next Generation of Codes, pp.277-287, Slovenia.
Richter, C.F., (1935), “An instrumental Earthquake scale”, BSSA., 25, 1–32.
Riddell, R., GaRCia, J. E., and GaRCes, E., (2002), "Inelastic deformation response
of SDOF Systems Subjected to Earthquakes", Earthquake Engineering and
Structural Dynamics, Vol. 31, 515-538.
Rodgers, J.E., (2012), “Why Schools are Vulnerable to Earthquakes”, 15th World
Conference on Earthquake Engineering, Lisbon, Portugal.
Rosetto, T., and Elnashai, A. S., (2003), “Derivation of Vulnerability Functions for
European-Type RC Structures Based on Observational Data”, Engineering
Structures, Vol. 25, No.10, pp. 1241-1263.

226
Rossetto, T. and Elnashai, A.S., (2005), “A New Analytical Procedure for the
Derivation of Displacement-based Vulnerability Curves for Population of RC
Structures”, Engineering Structures, 27(3), pp. 397–409.
Roufaiel, M.S.L., and), Meyer, C., (1987), “Analytical modeling of hysteretic
behaviour of RC frames”, ASCE Journal of Structural Engineering, 113(3),
429-444.
Ruiz-Garcia J., and Negrete-Manriquez J. (2011). “Evaluation of drift demands in
existing steel frames under as-recorded far-field and near-fault mainshock–
aftershock seismic sequences”. Engineering Structures 33 (2011) 621–634.
Saiidi, M., and Sözen, M.A., (1979), “Simple and complex models for nonlinear
seismic response of RC Structures”, Structural Research Series, 465, Civil
Engineering Studies, University of Illinois, Urbana, IL.
Scawthorn, C., (2003), “Earthquakes: A historical perspective”, Chapter 1,
Earthquake Engineering Handbook, W.F.Chen and C.Scawthorn (editors),
CRC Press, Boca Raton, FL.
Schmidt, J.A., (2009), “The Definition of Structural Engineering”, Structure
Magazine, In Focus Column, p.9.

227
Shibata,A. and Sözen, M., (1974), "Substitute Structure Method for seismic design
in RC", Journal of Stryctural Division, ASCE, 102(12), pp. 3548-3566.
Shinozuka, M., Grigoriu, M., Ingraffea, A. R., Billington, S. L., Feenstra, P., Soong,
T. T., Reinhorn,A. M., and Maragakis, E., (1999), "Research Progress and
Accomplishment 1999–2000: Selected Papers", MCEER, SUNY at Buffalo,
NY.
Shinozuka, M., Feng, M.Q., Lee, J., and Naganuma, T., (2000a), “Statistical
Analysis of F.C.s”, ASCE Journal Of Engineering Mechanics, Volume 126,
No. 12, pp. 1224-1231.
Shinozuka, M., Feng, M.Q., Kim, H.K., and Kim, S.H., (2000b), “Nonlinear Static
Procedure for F.C. Development”, ASCE Journal of Engineering Mechanics,
Volume 126, No. 12, pp. 1287-1295.
Shinozuka, M., Feng, M.Q., Kim, H., Uzawa, T. and Ueda, T., (2003), “Statistical
Analysis of F.C.s”, Report No. MCEER-03-0002, MCEER.
Singhal, A., and Kiremidjian, A. S., (1997), “A Method For Earthquake Motion
Damage Relationships with Application To RC Frames”, Technical Report:
NCEER-97-0008, National Center for Earthquake Engineering Research,
Buffalo, NY.

228
Sobaih, M.E., and Nazif, M.A., (2012), “A proposed methodology for seismic risk
evaluation of existing reinforced school buildings”, Housing and Building
National Research Center, HBRC Journal, 8, pp. 204–211.
Sohaib, A., Nicolas, K., Kypros, P., Kyriacos, N., and Qaiser, Z., (2015), “Seismic
Fragility Assessment of Existing Sub-Standard Low Strength RC
Structures”, Earthquake Engineering and Engineering Vibration, Vol. 14,
pp.439-452.
Somerville, P., (2000), “Characterization of near field ground motions”, Proceedings
of the US–Japan workshop: effects of near-field earthquake shaking, San
Francisco, USA.
Sözen, M.A., (1981), “Review of Earthquake Response of RC Buildings with a View
to Drift Control”, State–of–the–Art in Earthquake Engineering, Kelaynak
Press, Ankara, Turkey.
Stojadinovic, B., and Thewalt, C.R., (1996), “Energy balanced hysteresis models”,
Proceedings, 11th World Conference on Earthquake Engineering, Mexico,
Paper No. 1734.
Sucuoğlu, H., and Yazgan, U., (2003), “Simple Survey Procedures for Seismic Risk
Assessment in Urban Building Stocks”, Seismic Assessment and
Rehabilitation of Existing Buildings, NATO Science Series, Vol. 29, 97-118.

229
Sucuoğlu, H., and Günay, M.,S., (2005), "Equivalent Linearization Method in
Displacement Based Performance Analysis", EQ Engineering: Essentials and
Applications, Earthquake Engineering Research center, Middle East
Technical University, July 18-20, 2005
Sucuoğlu, H., (2006), "2007 Deprem Yönetmeliği Performans Esaslı Hesap
Yöntemlerinin Karşılıklı Değerlendirilmesi", TMH-Türkiye Mühendislik
Haberleri, Vol. 444-445, pp. 24-36.
Sucuoğlu, H., Eeri, M., Yazgan, U. and Yakut A., (2007), “A Screening Procedure
for Seismic Risk Assessment in Urban Building Stocks”, Earthquake Spectra,
Vol. 23, pp. 441-458.
Sucuoğlu, H., (2018), “New improvements in the 2018 Turkish seismic code”,
International Workshop on Advanced Materials and Innovative Systems in
Structural Engineering: Seismic Practices, IWAMISSE2018, İstanbul,
Turkey
Sullivan, T. J., Calvi, G. M., and Priestley, M. J. N., (2004), “Initial stiffness versus
secant stiffness in displacement-based design”, 13th World Conference on
Earthquake Engineering, Vancouver, B. C., Canada, Paper No. 2888.
Takeda, T., Sözen, M.A., and Nielsen, N.N., (1970), “RC response to simulated
earthquakes”, ASCE Journal of Structural Engineering 96(12), 2557-2573.

230
Takemura, H., and Kawashima, K., (1997), “Effect of loading hysteresis on ductility
capacity of bridge piers”, Japan Journal of Structural Engineering, 43A, 849-
858.
Tan, K.T., Abdul Razak, H., (2011), “Assessment of Risk to School Buildings
Resulting from Distant Earthquakes”, Procedia Engineering, 14, pp. 2196–
2204.
Taylor, A.W., Kuo, C., Wellenius, K., and Chung, D.M., (1997), “A summary of
cyclic lateral load tests on rectangular RC columns”, Report No. NISTIR
5984, National Institute of Standards and Technology, Gaithersburg,
Maryland.
TUIK (Turkish Statistical Institute), (2016), Internet source, Cited 2016 Nov. 08,
Available from: www.tuik.gov.tr/PreIstatistikTablo.do?istab_id=1636
TUIK (Turkish Statistical Institute), (2019), Internet source, Cited 2020 Apr. 24,
Available from: http://www.tuik.gov.tr/PreTablo.do?alt_id=1018
Turkish Building Code (TBC-1984), (1984), “Requirements for design and
construction of RC structures”, Turkish Standards Institute (TSE), Ankara,
Turkey.

231
Turkish Building Code, TS-498, (1987), “Design Loads for Buildings”, Turkish
Standards Institute (TSE), Ankara, Turkey.
Turkish Building Code TS-500, (TBC-2000), (2000), “Requirements for design and
construction of RC structures”, Turkish Standards Institute (TSE), Ankara,
Turkey.
Ulutaş, H., Dilmaç, H., Tekeli, H., Demir, F., (2019), “An approach in order to
practically identify the seismic safety of existing school buildings: ATI”, The
Journal of Natural and Applied Sciences of Süleyman Demirel University,
Vol. 23, Issue 2, pp. 329-337
Ulutaş, H., Dilmaç, H., Tekeli, H., Demir, F., (2019), “A Study on the shear wall
ratio in school buildings”, The Journal of Graduate School of Natural and
Applied Sciences of Mehmet Akif Ersoy University, 10(1): 1-10
Uma, S.R., Ryu H., Luco N., Liel A.B., and Raghunandan M. (2011). “Comparison
of main-shock and aftershock fragility curves developed for New Zealand
and US buildings”. Proceedings of the Ninth Pacific Conference on
Earthquake Engineering Building an Earthquake-Resilient Society 14-16
April, Auckland, New Zealand.
USGS, (2000), “Implication for earthquake risk reduction in the United States from
the Kocaeli, Turkey, Earthquake of August 17, 1999”, U.S. Geological
Survey CiRCular, 1193, p. 64.

232
Vona, M., (2014), “F.C.s of Existing RC Buildings Based on Specific Structural
Performance Levels”, Open Journal of Civil Engineering, Vol. 4, pp. 120-
134
Wakefield, D., Ravindra, M., Merz, K., and Hardy, G., (2003), “Seismic
Probabilistic Risk Assessment Implementation Guide”, Final Report
1002989, EPRI.
Wald, D.J., Quitariano, V., Heaton, T.H., Kanamori, H., Scrivner C.W. and Worden,
C.B., (1999). "Trinet Shake Maps: rapid generation of peak ground motion
and intensity maps for Earthquakes in Southern California", Earthquake
Spectra, 15, 537-555.
Williams, M. S., and Sexsmith, R. G, (1995), “Seismic Damage Indices for Concrete
Structures: A State-of-the-Art Review”, Earthquake Spectra, 11(2): 319-349.
Wisner, B., (2006), "Let our children teach us! A review of the role of education and
knowledge in disaster risk reduction", Report On behalf of the ISDR system
Thematic Cluster/Platform on Knowledge and Education, p. 129.
Yakut, A., Aydogan, V., Özcebe, G. and Yücemen S., (2003), "Preliminary Seismic
Vulnerability Assessment of Existing RC Buildings in Turkey Part II:
Inclusion of Site Characterization", Seismic Assessment and Rehabilitation
of Existing Buildings, NATO Science Series, Vol. 29, 43-58.

233
Yakut, A., (2004). “Preliminary Seismic Performance Assessment Procedure for
Existing RC Buildings”, Engineering Structures, Vol. 26, No. 10, pp. 1447–
1462.
Yakut, A. (2004-2) “A Preliminary Seismic Assessment Procedure for RC Buildings
in Turkey”, 13th World Conference on Earthquake Engineering, Vancouver,
B.C., Canada, Paper No.897.
Yakut, A., and Erduran, E., (2005), “A Detailed Seismic Performance Assessment
Procedure for RC Frame Buildings”, Springer, Netherlands.
Yakut, A., Gülkan P., Bakır B.S. and Yılmaz M.T., (2005), “Re-examination of
Damage Distribution in Adapazarı: Structural Consideration”, Engineering
Structures, Vol. 27, 990-1001.
Yakut, A., Özcebe, G., and Yücemen, S., (2006), “Seismic Vulnerability Assessment
Using Regional Empirical Data”, Earthquake Engineering and Structural
Dynamics, Vol. 35.
Yakut, A., (2008). “Capacity Related Properties of RC Frame Buildings in Turkey”,
Journal of Earthquake Engineering, Vol. 12, pp. 1–8.

234
Yakut, A., Tonguç, Y. and Gülkan, P., (2008), “A Comparative Seismic Performance
Assessment and Rehabilitation of Existing School Buildings”, The 14th
World Conference on Earthquake Engineering, October 7-12, 2008, Beijing,
China.
Yakut, A., Sucuoğlu, H., Akkar, S., (2012) “Seismic Risk Prioritization of
Residential Buildings in İstanbul”, Earthquake Engineering and Structural
Dynamics, Published online in Wiley Online Library
(wileyonlinelibrary.com), DOI:10.1002/eqe.2215.
Zhai C.H., Wen W.P., Li S., Chen Z. Chang Z., and Xie L., (2014). “The damage
investigation of inelastic SDOF structure under the mainshock–aftershock
sequence-type ground motions” . Soil Dynamics and Earthquake
Engineering, 59, 30–41
Zentner, I., Nadjarian, A., Humbert, N., and Viallet, E., (2008), “Numerıcal
calculation of F.C.s for probabilistic seismic risk assessment”, The 14th
World Conference on Earthquake Engineering, Beijing, China.

235
APPENDICES
A. Determined Properties of the Database Consisting of 321 RC School
Buildings
The determined properties of the database consisting of 321 RC school buildings are
tabulated in both Microsoft Excel (.xls) and .pdf format file and presented in the CD,
supplemented by the dissertation.

236
B. Properties of Selected 36 RC School Buildings
All determined parameters of the selected RC school buildings are tabulated in
Appendix A. The selected RC school buildings are labeled with red ID numbers, and
all parameters are written with bold characters in Appendix A.
Likewise, the selected 36 RC school buildings are extracted and tabulated separately
in Appendix B. The determined properties of selected 36 RC school buildings are
tabulated in both Microsoft Excel (.xls) and .pdf format file and presented in the CD,
supplemented by the dissertation.

237
C. Structural Parameters of Selected Buildings

238

239

240

241

242

243
D. Equivalent SDOF Parameters of Selected Buildings
Equivalent SDOF parameters for all selected 36 RC school buildings are provided
by excel sheets for each building for both X and Y-directions separately. All excel
sheets are presented in the CD, supplemented by the dissertation.
244
E. Assessment Reports of Selected RC School Buildings Performed by
ProtaStructure Software under TBEC-2018
The assessment reports of the selected 36 RC school buildings performed by
ProtaStructure software under TBEC-2018 are provided in the CD, supplemented by
the dissertation. All assessment reports are in .pdf file format.

245
F. Assessment Reports of Selected RC School Buildings Performed by
ProtaStructure Software under URL Provisions Published in 2013
Assessment reports of all selected 36 RC school buildings performed by
ProtaStructure software under the URL provisions published in 2013 are provided in
the CD, supplemented by the dissertation. All assessment reports are in .pdf file
format.

246
G. Assessment Reports of Selected RC School Buildings Performed by
ProtaStructure Software under URL Provisions Published in 2019
Assessment reports of all selected 36 RC school buildings performed by
ProtaStructure software under the URL provisions published in 2019 are provided in
the CD, supplemented by the dissertation. All assessment reports are in .pdf file
format.

247
H. Ground Motion Data
Detailed information about the ground motion records set list used for the F.C.
generation is presented in .xls file format, and also the records and OPENSEES
formats are provided in the CD, supplemented by the dissertation.


249
CURRICULUM VITAE
PERSONAL INFORMATION
Surname, Name: Mazılıgüney, Levent
Nationality: Turkish (TC)
Date and Place of Birth: 1 August 1978, Kırıkkale
Marital Status: Married, 3 children
Phone: +90 542 261 71 17
email: [email protected]
EDUCATION
Degree Institution Year of
Graduation
MS Anadolu Unv. Civil Engineering
(Construction Management)
2008
MS METU Civil Engineering (Materials of
Construcyion)
2007
MS Gazi Unv. Civil Engineering
(Transportation)
2006
BE Anadolu Unv. Economics 2017
LLB Ankara Unv. Faculty of Law 2014
BS METU Civil Engineering 2000
High School Science High School, Kırıkkale 1996
WORK EXPERIENCE
Year Place Enrollment
2018
December-
Present
Mazılıgüney Consultancy Owner-Lawyer
2017 August-
2018 August
Ankara Bar Association Trainee Lawyer
2001-2017
April
Ministry of Defense Officer (Civil Engineer
and Internal Auditor)
2000 June-
2001
November
Private Engineering and Construction
Firms
Civil Engineer

250
FOREIGN LANGUAGES
Advanced English
PUBLICATIONS
1. Mazılıgüney, L., Yakut, A., Kadaş, K., Kalem, İ., (2012), “Evaluation of
Preliminary Assessment Procedures for Reinforced Concrete School Buildings in
Turkey”, 10th International Congress on Advances in Civil Engineering, ACE2012,
October 17-19, Middle East Technical University, Ankara, Turkey
2. Mazılıgüney, L., Yakut, A., Kadaş, K., Kalem, İ., (2013), “Fragility Analysis of
Reinforced Concrete School Buildings Using Alternative Intensity Measure-Based
Ground Motion Sets”, 2nd Turkish Conference on Earthquake Engineering and
Seismology – TDMSK -2013, Hatay, Turkey.
3. Mazılıgüney, L., Azılı, F., Yaman, İ.Ö. (2008), “In-Situ Concrete Compressive
Strengths of Residential, Public and Military Structures”, Eighth International
Congress on Advances in Civil Engineering, ACE2008, September 15-17, Vol.3,
Famagusta, Turkish Republic of Northern Cyprus, pp. 273-280.
4. Mazılıgüney, L., Kadaş, K., Akansel, V. H., Yakut, A., (2017), “Fragility Curves
for Reinforced Concrete School Buildings due to Repeated Earthquakes”, 4th
International Conference on Earthquake Engineering and Seismology, Eskişehir,
Turkey, 468-471
5. Mazılıgüney, L., Akansel, V. H., Soysal, B. F., Kadaş, K., Yakut, A., (2019),
“Seismic Risk Assessment of School Buildings on the Basis of Recent Turkish
Seismic Hazard Map”, VI. International Earthquake Symposium Kocaeli 2019,
IESKO 2019, September 25-27, Kocaeli, Turkey
Table Tennis, Swimming, Digital Forensics, Photographs, Movies, Literature