Repair of Reinforced Concrete Elements using Fiber Reinforced Polymers
56
1 Research about Repair of reinforced concrete elements using Fiber Reinforced Polymers Submitted to: Prof. Awad El-Hashemy
-
Upload
helwanuniversity -
Category
Documents
-
view
0 -
download
0
Transcript of Repair of Reinforced Concrete Elements using Fiber Reinforced Polymers

1
Research about Repair of reinforced concrete elements using
Fiber Reinforced Polymers
Submitted to: Prof. Awad El-Hashemy

2
Prepared by:
Moemen Negm eldine
Mohamed Salah Hamed
Abd El-Hameed Abd El-Fattah
3
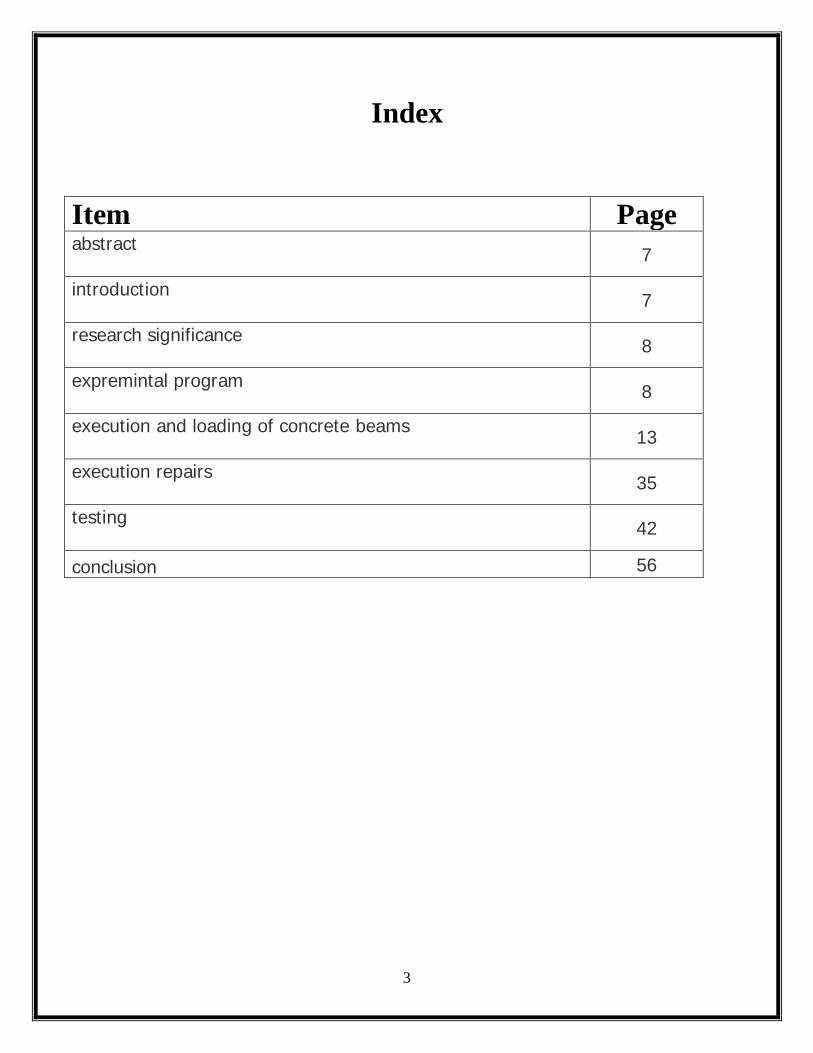
Index
Item Page abstract 7
introduction 7
research significance 8
expremintal program 8
execution and loading of concrete beams 13
execution repairs 35
testing 42
conclusion 56

4
List of figures
Fig no. Fig description page
1 shows reinforcement details of first group beams 10 2 shows reinforcement details of group two beams 12
3 shows execution of steel reinforcement of concrete beams 13
4 shows measuring actual diameter of steel specimen 15
5 shows adjusting steel specimen in the testing machine 15
6 shows steel specimen under loading 16 7 shows cup and cone failure of steel specimen 16 8 shows cutting and forming of steel reinforcement 18,19 9 shows preparing wooden pattern for stirrups forming 19 10 shows accurate dimensions produced 20 11 shows reinforcement linking 21 12 shows wooden forms before casting 21 13 shows beams after casting 22 14 shows concrete specimens 23 15 shows painting beams with lime solution 24 16 shows beam from group 2 ( shear failure ) after loading 24 17 shows beam from group 1 (moment failure) under loading 25 18 shows removing concrete cover from beams 37 19 shows cleaning beams using air blower 38 20 shows surface finishing of beams with epoxy mortar 39 21 shows the method of fiber painting 40 22 shows the multiple laminate repair 41 23 shows testing of repaired beams 43

5
List of Tables
Table
no. Table description page
1 result of tension test for steel reinforcement 14 2 deflection and loading values of beam 1 (group 1) 26 3 deflection and loading values of beam 2 (group 1) 27 4 deflection and loading values of beam 3 (group 1) 28 5 deflection and loading values of beam 1 (group 2) 29 6 deflection and loading values of beam 2 (group 2) 30 7 deflection and loading values of beam 3 (group 2) 31
8 values of crack widths and representation of crack propagation in beams after loading 33
9 the shape of repairs 35
10 loading and deflection values for beam 1 (group 1) after repair 44
11 loading and deflection values for beam 2 (group 1) after repair 46
12 loading and deflection values for beam 3 (group 1) after repair 48
13 loading and deflection values for beam 1 (group 2) after repair 50
14 loading and deflection values for beam 2 (group 2) after repair 52
15 loading and deflection values for beam 3 (group 2) after repair 54

6
List of graphs
Graph no.
Graph description page
1 stress strain curve for steel reinforcement 14 2 relation between load and deflection in beam 1 (group 1) 26 3 relation between load and deflection in beam 2 (group 1) 27 4 relation between load and deflection in beam 3 (group 1) 29 5 relation between load and deflection in beam 1 (group 2) 30 6 relation between load and deflection in beam 2 (group 2) 31 7 relation between load and deflection in beam 3 (group 2) 32
8 relation between load and deflection in beam 1 (group 1) after repair 46
9 relation between load and deflection in beam 2 (group 1) after repair 47
10 relation between load and deflection in beam 3 (group 1) after repair 49
11 relation between load and deflection in beam 1 (group 2) after repair 51
12 relation between load and deflection in beam 2 (group 2) after repair 53
13 relation between load and deflection in beam 3 (group 2) after repair 55

7
Abstract
Fiber reinforced polymer composites had been widely used in repairing and retrofitting of reinforced concrete elements due to its high strength, stiffness to weight ratio, high ability to form and shape, low price, and simplicity of execution. But till now there was no accurate identified procedures to do so. These papers give some recommendations for repair procedure of deteriorated concrete beams using hand lay up method with eboxy and glass fibers.
Introduction
Fiber reinforced polymers is a composite material made of a polymer matrix reinforced with relatively high strength fibers like steel, glass or carbon fibbers. Fibers are characterized by having very high strength to diameter ratio with a near crystal sized diameters. like any other composite materials, FRB have the desired properties of both fibers and plastics, where fibers are responsible for high strength, while matrix role is to bind dispersed fibers, protect them against environmental attacks, and damages due to handling.

8
Research significance
When concrete beams are deteriorated due to over loading or due to rusting of steel reinforcement, cracks take place. The shape of crack happens differ according to the reason of failure. In these cases, concrete beams should be repaired. Repair using FRP is one of the easy and cheap ways, but there is no accurate recommended ways for those repairs, even labor is not experienced to do so. Most of the cracks that appear in reinforced concrete beams are due to failure of section to resist moment (Normal) or shear stresses, but till now what is the optimum shape of repair for each failure mode. The research program is to answer those questions one by one.
Experimental program 1. The research is to test the result of repairing two groups of reinforced
concrete beams, each group consists of three beams which section is 20cm * 10cm, and its span is 50 cm.
2. The first group has relatively low bottom steel reinforcement in reinforcement in order to fail to resist normal stresses with sufficient number of stirrups to resist shear stresses. * bottom reinforcement: 4Ø4 mm, * top reinforcement: 2Ø4 mm/m' * stirrups: 10Ø2 mm * fy 518 kg/cm2
3. It was important to calculate the load capacity of the beams for cracking, as well as calculating the ultimate load the beam can withstand, in order for the applied load to be within the two values.

9
4. The following equations show these calculations for the first group of beams.
𝐹𝑦= 2400 𝑘𝑘 𝑐𝑐2⁄
𝐹𝑐𝑐= 250𝑘𝑘 𝑐𝑐2⁄ n = 𝐹𝑦𝐹𝑐𝑐
= 2400250
≈ 15 finding area under compression ∑ Moment @ neutral axis = 0 𝑏 𝑐2
2 = n 𝐴𝑠(𝑑 − 𝑐)
𝑛 = 15 , 𝐴𝑠= (0.4)2∗𝜋4
= 0.125 𝑐𝑐2, d = 19 cm , b = 10 cm C = 4.65 cm therefore a= 0.8 c = 3.72 cm
𝑀𝑐 = 0.67 𝐹𝑐𝑐𝛾𝑐
𝑏 𝑎 �𝑑 −𝑐2� = 0.624 𝑐. 𝑡.

10
𝑀𝑐 = 𝐴𝑠𝐹𝑦𝛾𝑠�𝑑 −
𝑎2� = 0.18 𝑐𝑡
Since loading is point load at mid span, therefore 𝑀𝑐 = 𝑃𝑃4
Maximum allowable load should be less than 5.5 ton
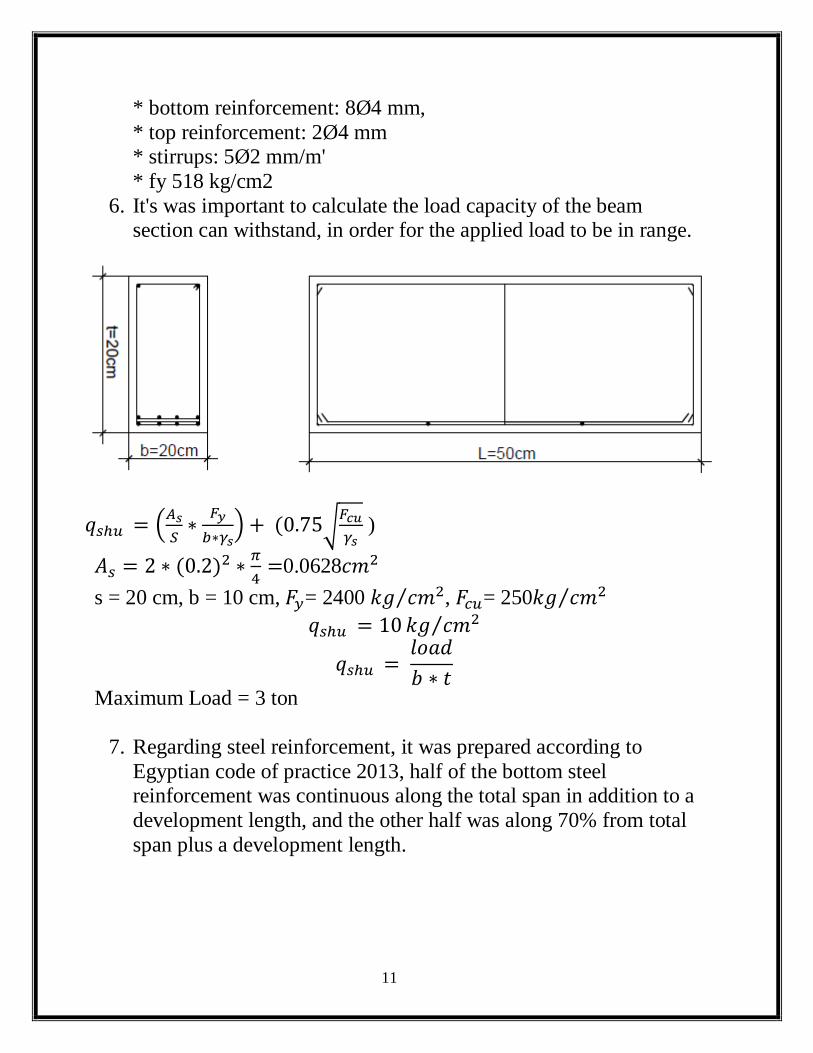
fig 1 shows reinforcement details of first group beams
5. The second group has relatively low number of stirrups in order to fail to resist shear stresses, with high bottom reinforcement to resist normal stresses
11
* bottom reinforcement: 8Ø4 mm, * top reinforcement: 2Ø4 mm * stirrups: 5Ø2 mm/m' * fy 518 kg/cm2
6. It's was important to calculate the load capacity of the beam section can withstand, in order for the applied load to be in range.
𝑞𝑠ℎ𝑐 = �𝐴𝑠𝑆∗ 𝐹𝑦𝑏∗𝛾𝑠
� + (0.75�𝐹𝑐𝑐𝛾𝑠
)
𝐴𝑠 = 2 ∗ (0.2)2 ∗ 𝜋4
=0.0628𝑐𝑐2 s = 20 cm, b = 10 cm, 𝐹𝑦= 2400 𝑘𝑘 𝑐𝑐2⁄ , 𝐹𝑐𝑐= 250𝑘𝑘 𝑐𝑐2⁄
𝑞𝑠ℎ𝑐 = 10𝑘𝑘 𝑐𝑐2⁄
𝑞𝑠ℎ𝑐 = 𝑙𝑙𝑎𝑑𝑏 ∗ 𝑡
Maximum Load = 3 ton
7. Regarding steel reinforcement, it was prepared according to Egyptian code of practice 2013, half of the bottom steel reinforcement was continuous along the total span in addition to a development length, and the other half was along 70% from total span plus a development length.

12
Fig 2 shows reinforcement details of group two beams

13
The research program is divided into three phases A) execution and loading of concrete beams B) Execution of the repairs C) Testing A) Execution and loading of concrete beams:
Fig 3 shows execution of steel reinforcement of concrete beams
1. The steel used in reinforcement was tested to fin allowable tensile strength, a long specimen of length 12 cm length was tested. after analyzing the results, it was found that the yield stress of the steel was 2400𝑘𝑘 𝑐𝑐2⁄ .

14
load (Kg) delta (cm) stress (Kg/cm2) strain
120 0.1 954.5454545 0.008333 250 0.1 1988.636364 0.008333 340 0.3 2704.545455 0.025 720 0.4 5727.272727 0.033333 850 0.5 6761.363636 0.041667 890 0.6 7079.545455 0.05 900 0.7 7159.090909 0.058333 910 0.8 7238.636364 0.066667 920 0.9 7318.181818 0.075 930 1 7397.727273 0.083333 930 1.1 7397.727273 0.091667 930 1.2 7397.727273 0.1 930 1.3 7397.727273 0.108333 930 1.4 7397.727273 0.116667 930 1.5 7397.727273 0.125 850 1.6 6761.363636 0.133333
Table 1 shows result of tension test for steel reinforcement
Graph 1 shows stress strain curve for steel reinforcement
010002000300040005000600070008000
0.00
8333
333
0.00
8333
333
0.02
5
0.03
3333
333
0.04
1666
667
0.05
0.05
8333
333
0.06
6666
667
0.07
5
0.08
3333
333
0.09
1666
667
0.1
0.10
8333
333
0.11
6666
667
0.12
5
0.13
3333
333
stress (Kg/cm2)
stress (Kg/cm2)
15
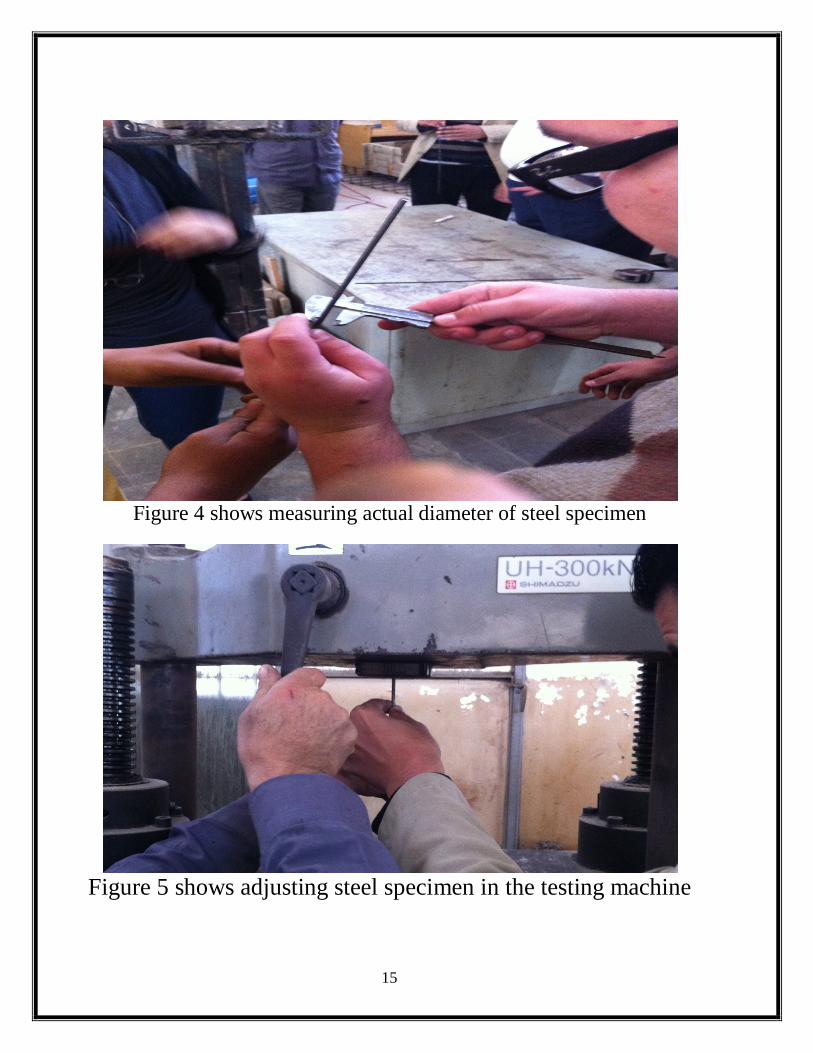
Figure 4 shows measuring actual diameter of steel specimen
Figure 5 shows adjusting steel specimen in the testing machine
16
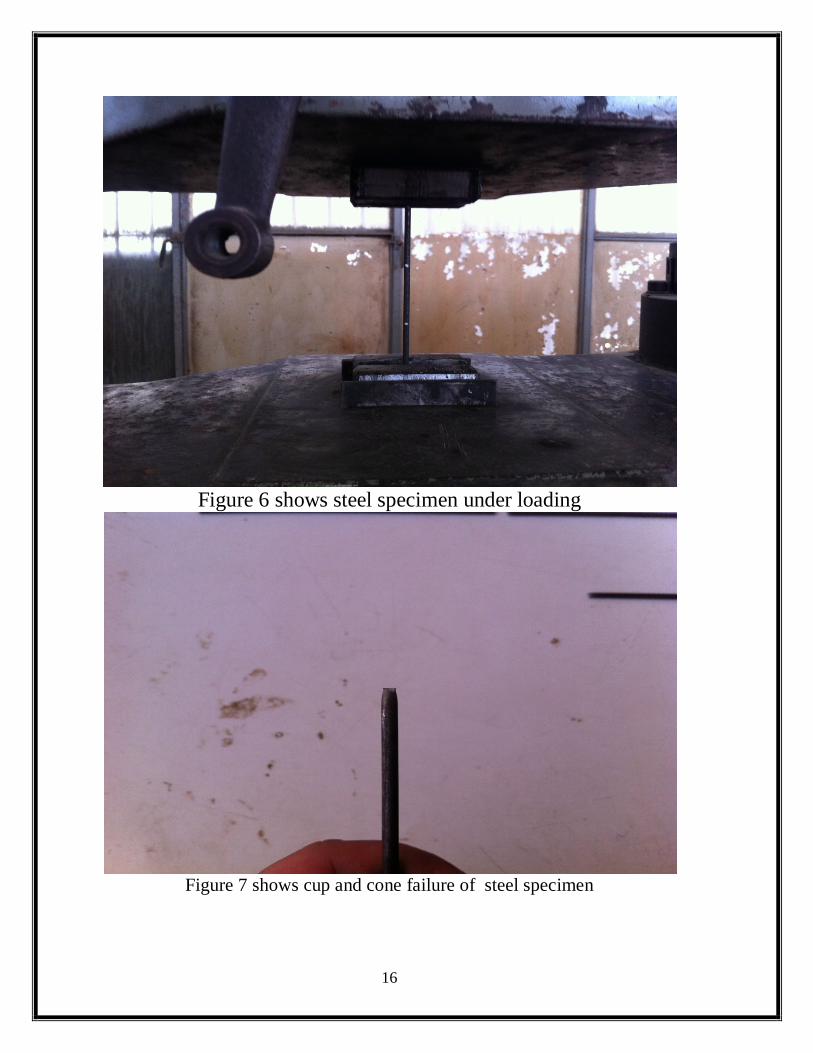
Figure 6 shows steel specimen under loading
Figure 7 shows cup and cone failure of steel specimen

17
2. Steel was cut and formed.

18
Figure 8 shows cutting and forming of steel reinforcement
19
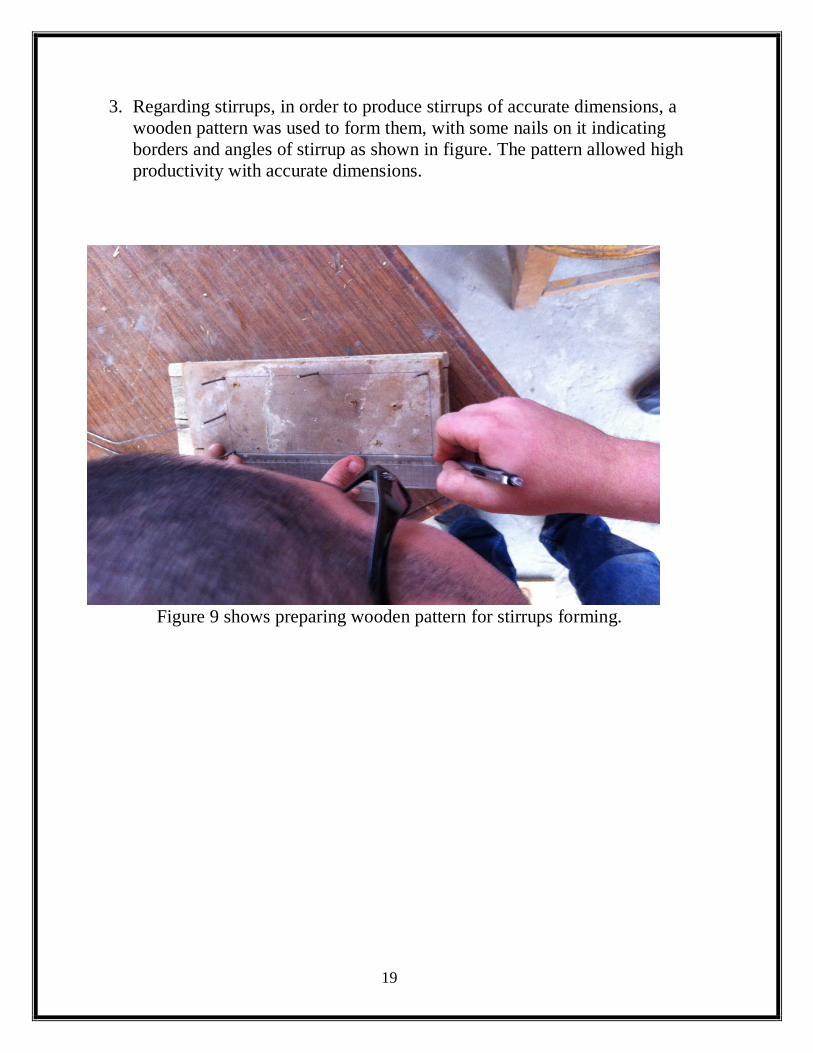
3. Regarding stirrups, in order to produce stirrups of accurate dimensions, a wooden pattern was used to form them, with some nails on it indicating borders and angles of stirrup as shown in figure. The pattern allowed high productivity with accurate dimensions.
Figure 9 shows preparing wooden pattern for stirrups forming.

20
Figure 10 shows accurate dimensions produced
21
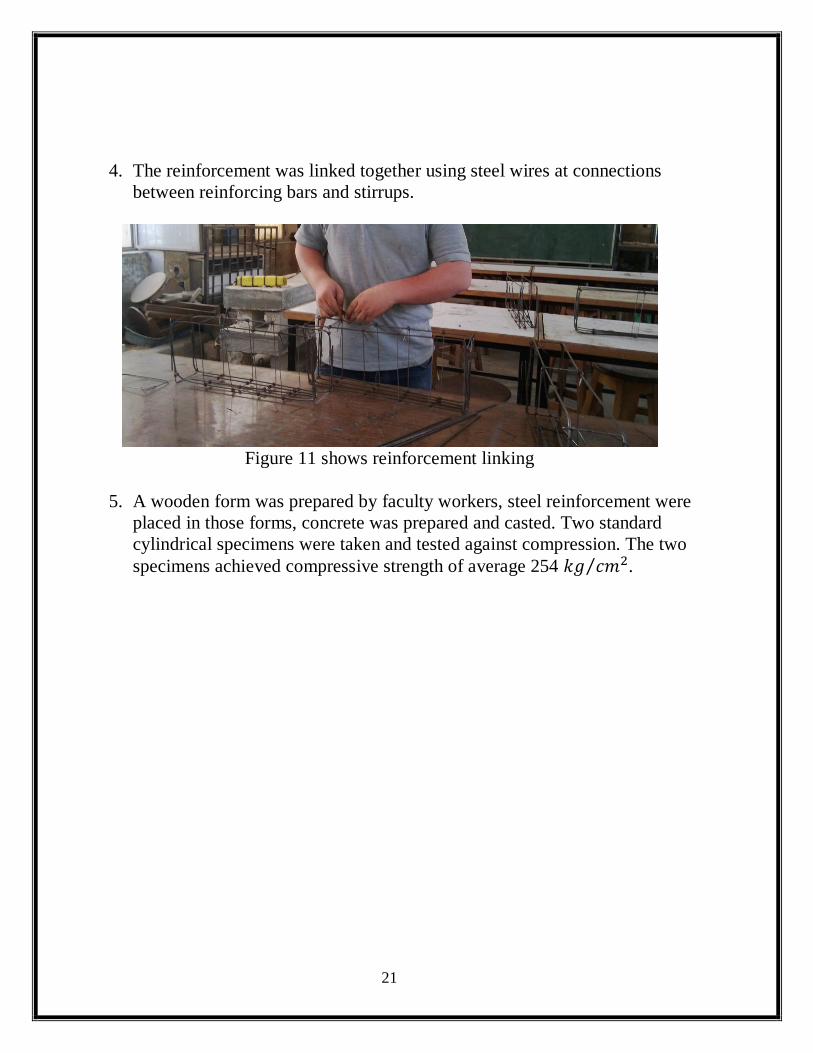
4. The reinforcement was linked together using steel wires at connections between reinforcing bars and stirrups.
Figure 11 shows reinforcement linking
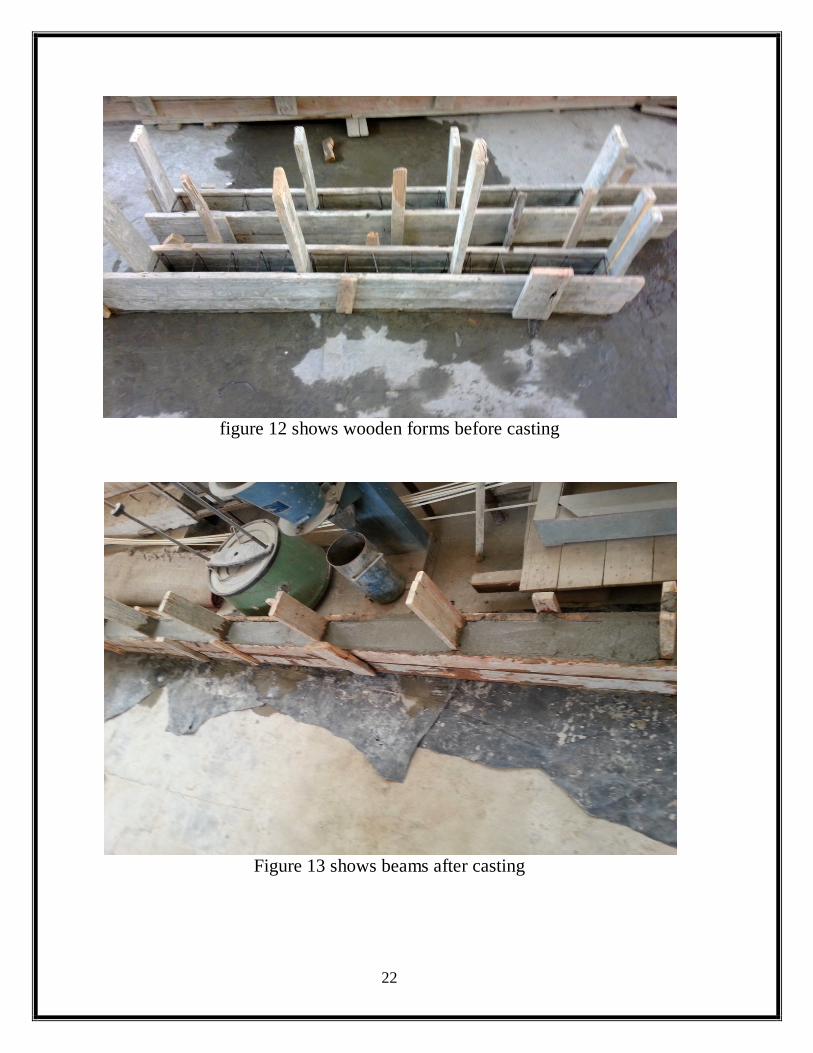
5. A wooden form was prepared by faculty workers, steel reinforcement were
placed in those forms, concrete was prepared and casted. Two standard cylindrical specimens were taken and tested against compression. The two specimens achieved compressive strength of average 254 𝑘𝑘 𝑐𝑐2⁄ .
22
figure 12 shows wooden forms before casting
Figure 13 shows beams after casting

23
Figure 14 shows concrete specimens
6. The beams were loaded then with concentrated loading at mid span with a
slow rate of loading. Before loading the beams were painted by lime solution in order to ease measuring crack widths.

24
Figure 15 shows painting beams with lime solution
Figure 16 shows beam from group 2 ( shear failure ) after loading

25
Figure 17 shows beam from group 1 (moment failure) under loading
7. The following tables show the relation between load applied and deflection of the two groups of beams.
8. A table below will show values of crack widths and representation of crack propagation in all beams.
26
A) Group 1 (moment failure)
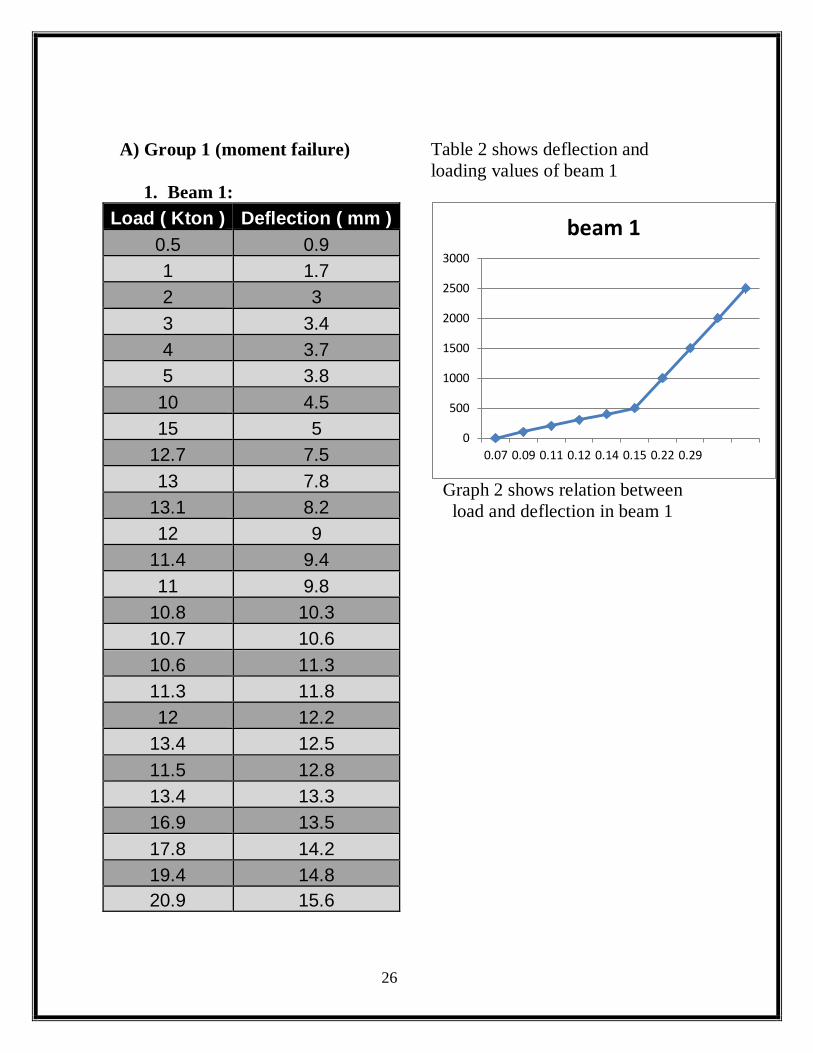
1. Beam 1: Load ( Kton ) Deflection ( mm )
0.5 0.9 1 1.7 2 3 3 3.4 4 3.7 5 3.8 10 4.5 15 5
12.7 7.5 13 7.8
13.1 8.2 12 9
11.4 9.4 11 9.8
10.8 10.3 10.7 10.6 10.6 11.3 11.3 11.8 12 12.2
13.4 12.5 11.5 12.8 13.4 13.3 16.9 13.5 17.8 14.2 19.4 14.8 20.9 15.6
Table 2 shows deflection and loading values of beam 1
Graph 2 shows relation between
load and deflection in beam 1
0
500
1000
1500
2000
2500
3000
0.07 0.09 0.11 0.12 0.14 0.15 0.22 0.29
beam 1

27
2- Beam 2:
Load ( Kg )
Deflection ( cm )
0 0.07 100 0.09 200 0.12 300 0.14 400 0.15 500 0.17
1000 0.23 1500 0.28 2000 0.54 2500 0
Table 3 shows deflection and loading values of beam 2
Graph 3 shows relation between loading and deflection in beam 2
0
500
1000
1500
2000
2500
3000
0.03 0.09 0.18 0.24 0.26 0.29 0.41 0.51 0.6 0.67
beam 2
Before Repair
28
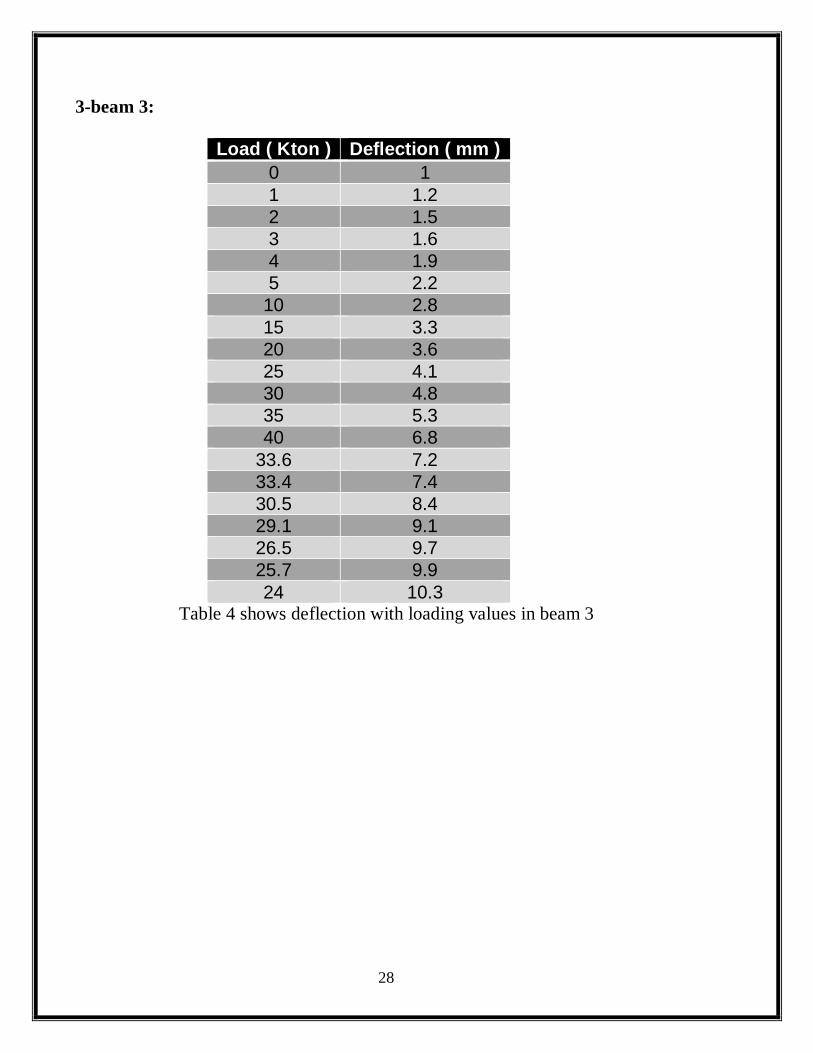
3-beam 3:
Load ( Kton ) Deflection ( mm ) 0 1 1 1.2 2 1.5 3 1.6 4 1.9 5 2.2
10 2.8 15 3.3 20 3.6 25 4.1 30 4.8 35 5.3 40 6.8
33.6 7.2 33.4 7.4 30.5 8.4 29.1 9.1 26.5 9.7 25.7 9.9 24 10.3
Table 4 shows deflection with loading values in beam 3

29
Graph 4 represents relation between loading and deflection values in beam 3
B) group two (shear failure): 1) beam 1:
Load ( Kg )
Deflection ( cm )
0 0.07 100 0.08 200 0.11 300 0.13 400 0.14 500 0.15
1000 0.2 1500 0.24 2000 0.28 2500 0.32
Table 5 shows deflection with loading values in beam 1
0
500
1000
1500
2000
2500
3000
0.06 0.07 0.08 0.09 0.09 0.1 0.13 0.17 0 0
beam 3
Before Repair

30
Graph 5 represents relation between loading and deflection values in beam 1
2-Beam 2:
Load ( Kg )
Deflection ( cm )
0 0.21 100 0.23 200 0.26 300 0.27 400 0.29 500 0.3
1000 0.33 1500 0.37 2000 0.39 2500 0.42
Table 6 shows deflection with loading values in beam 2
0
500
1000
1500
2000
2500
3000
0.07 0.08 0.11 0.13 0.14 0.15 0.2 0.24 0.28 0.32
beam 1
Before Repair

31
Graph 6 represents relation between loading and deflection values in beam 2
3-Beam 3:
Load ( Kg )
Deflection ( cm )
0 0.06 100 0.11 200 0.15 300 0.17 400 0.19 500 0.21
1000 0.23 1500 0.36 2000 0.41 2500 0.45
Table 7 shows deflection with loading values in beam 3
0
500
1000
1500
2000
2500
3000
0.21 0.23 0.26 0.27 0.29 0.3 0.33 0.37 0.39 0.42
beam 2
Before Repair

32
Graph 7 represents relation between loading and deflection values in beam 3
0
500
1000
1500
2000
2500
3000
0.06 0.11 0.15 0.17 0.19 0.21 0.23 0.36 0.41 0.45
Beam 3
Before Repair

33
Table 8 shows values of crack widths and representation of crack propagation
in beams after loading

34
B) Execution of repairs
1. The repair should be executed as follows: - regarding group one, the first beam will have a fiber laminate along its span over its breadth, the second would have fiber laminates around the crack and the third would have fiber laminates along its span over depth as shown in coming figures - regarding group two, the first beam will have fiber laminates over the crack in both sides, the second will have laminates along its span over the depth in both sides, and the third will have 5 cm laminates along its depth regularly distributed along its span as will be shown in the next figures

35
table 9 shows the shape of repairs

36
2. A small part of about 5 mm was removed from beam dimensions manually using hummer in order to increase surface area of which fibers will stick.

37
Figure 18 shows removing concrete cover from beams
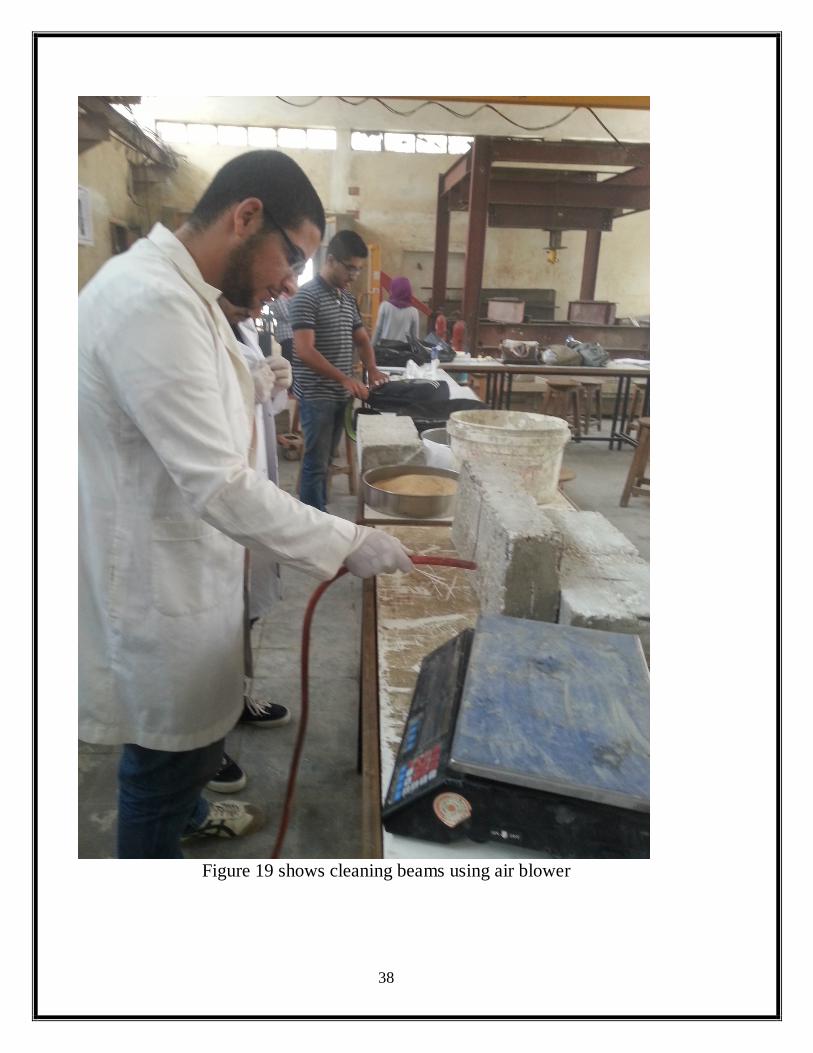
3. The areas of repair should be air plowed using a blower to remove any dust that may weak the bond with polymer. The areas of which fibers will stick is surface finished by Epoxy mortar. The Epoxy to sand ratio is 2:1, and peroxide hardener is added with ratio 6 𝑐𝑐3/𝑘𝑘 Epoxy.
38
Figure 19 shows cleaning beams using air blower

39
Figure 20 shows surface finishing of beams with epoxy mortar

40
4. Fibers were cut using according to dimensions of repair. 5. A polymer mixture of epoxy as a polymer and peroxide as a hardener with
content 6 𝑐𝑐3/𝑘𝑘 Epoxy is used to paint the beams, fiber laminates is laid over it, and another layer of polymer is painted.
6. A load is applied on the painted fibers using a roll brush. 7. Laminates should be of three layers, the first is perpendicular to crack, the
second is a 45º inclined to the crack and the third is also perpendicular to avoid interlaminar shear and differential strain of laminates.
Figure 21 shows the method of fiber painting

41
Figure 22 shows the multiple laminate repair
42
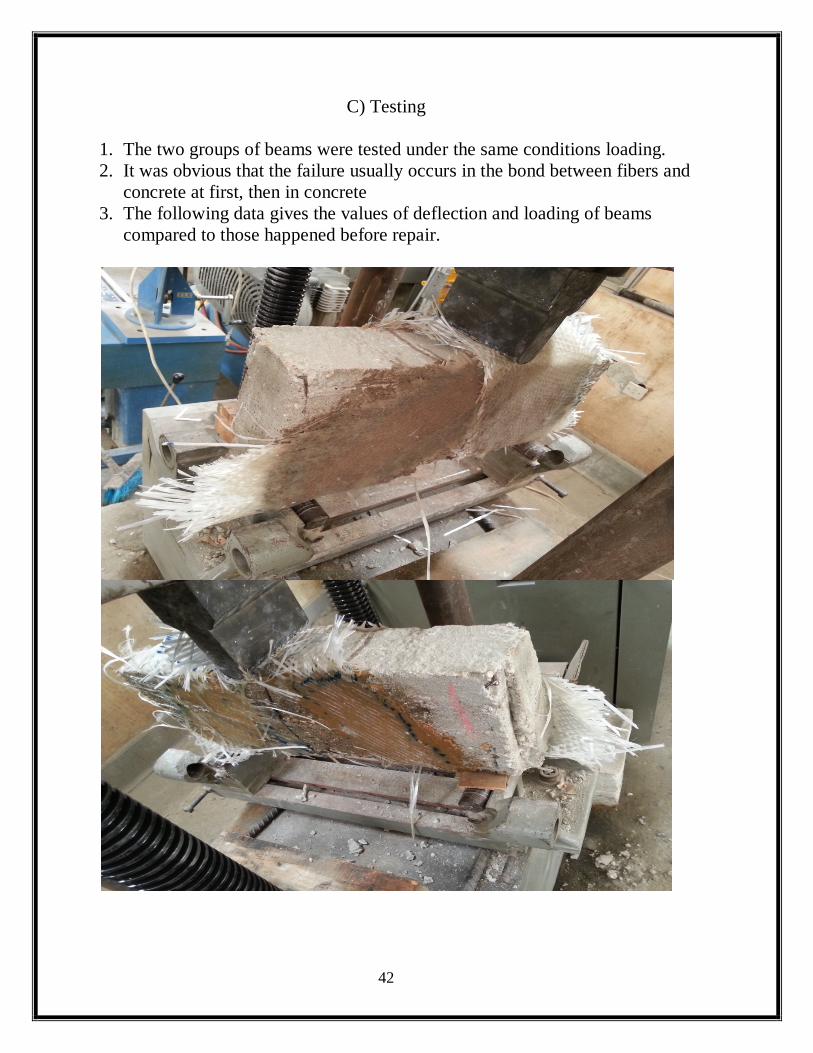
C) Testing
1. The two groups of beams were tested under the same conditions loading. 2. It was obvious that the failure usually occurs in the bond between fibers and
concrete at first, then in concrete 3. The following data gives the values of deflection and loading of beams
compared to those happened before repair.

43
Figure 23 shows testing of repaired beams

44
A) Group 1 1) Beam 1:
Load ( Kg ) Deflection ( cm ) 50 0.09 100 0.17 200 0.3 300 0.34 400 0.37 500 0.38 1000 0.45 1500 0.5 1270 0.75 1300 0.78 1310 0.82 1200 0.9 1140 0.94 1100 0.98 1080 1.03 1070 1.06 1060 1.13 1130 1.18 1200 1.22 1340 1.25 1150 1.28 1340 1.33 1690 1.35 1780 1.42 1940 1.48 2090 1.56
Table 10 shows loading and deflection values for beam 1

45
Graph 9 represents relation between loading and deflection for beam 1
0
500
1000
1500
2000
2500
3000
3500
4000
0.09 0.3 0.37 0.45 0.75 0.82 0.94 1.03 1.13 1.22 1.28 1.35 1.48
After Repair
before Repair

46
2) Beam 2:
Load ( Kg )
Deflection ( cm )
0 0.03 100 0.09 200 0.18 300 0.24 400 0.26 500 0.29 1000 0.41 1500 0.51 2000 0.6 2500 0.67 3000 0.75 3500 0.82 4000 0.89 4500 0.97 5000 1.05 3150 1.17 3200 1.18 3400 1.21 2280 1.27 2400 1.31 2580 1.32 2640 1.34 2840 1.38 3000 1.45 2900 1.51 2870 1.53 2690 1.6 2710 1.63
Table 11 shows loading and deflection values for beam 2

47
Graph 10 represents relation between loading and deflection for
beam 2
0
1000
2000
3000
4000
5000
6000
0.030.180.260.41 0.6 0.750.891.051.181.271.321.381.51 1.6
After Repair
Before Repair

48
2) Beam 3:
Load ( Kg )
Deflection ( cm )
0 0.1 100 0.12 200 0.15 300 0.16 400 0.19 500 0.22 1000 0.28 1500 0.33 2000 0.36 2500 0.41 3000 0.48 3500 0.53 4000 0.68 3360 0.72 3340 0.74 3050 0.84 2910 0.91 2650 0.97 2570 0.99 2400 1.03
Table 12 shows loading and deflection values for beam 3

49
Graph 11 represents relation between loading and deflection for
beam 3
0
1000
2000
3000
4000
5000
6000
0.1
0.12
0.15
0.16
0.19
0.22
0.28
0.33
0.36
0.41
0.48
0.53
0.68
0.72
0.74
0.84
0.91
0.97
0.99
1.03
After Repair
Before Repair

50
B) Group 2 1- Beam 1:
Load ( Kg ) Deflection ( cm ) 0 0.15
50 0.45 60 0.56 70 0.58 100 0.76 200 0.91 300 0.96 400 1.01 500 1.011 1000 1.18 1500 1.3 2000 1.36 2500 1.4 1740 1.42 1800 1.43 1580 1.45 1900 1.46 2000 1.52 2100 1.6 2110 1.61 2120 1.63 2130 1.64 2170 1.65 2240 1.66 2300 1.67 2400 1.69 2500 1.71 2600 1.73 2760 1.77 2700 1.82 2110 1.83 1600 1.85 1550 1.86
Table 13 shows deflection and loading values for beam 1

51
Graph 12 represents relation between loading and deflection in
beam 1
0
500
1000
1500
2000
2500
3000
3500
4000
After Repair
Before Repair

52
2-Beam 2:
Load ( Kg ) Deflection ( cm ) 0 0.11
100 0.14 200 0.17 300 0.2 400 0.22 500 0.24
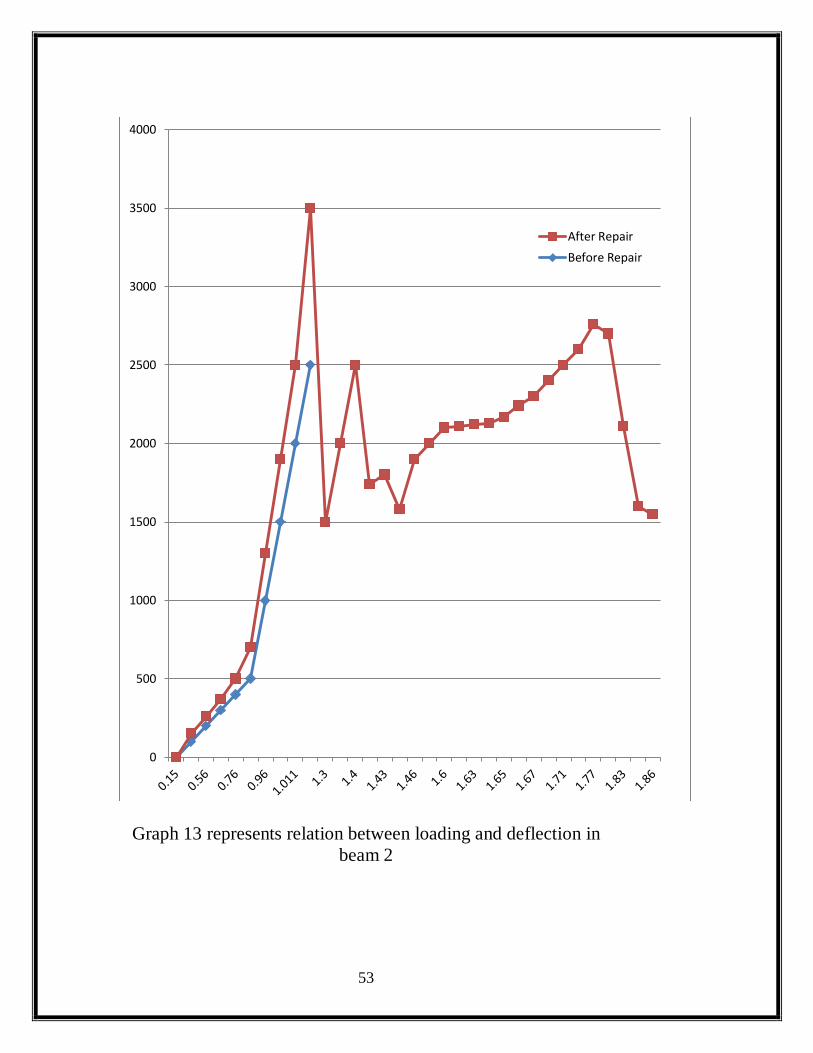
1000 0.34 1500 0.45 2000 0.65 2500 0.86 3000 0.98 3500 1.08 4000 1.24 2180 1.35 2240 1.39 2220 1.42 2290 1.46 2300 1.47 2420 1.57 2240 1.74 2170 1.87 1920 1.94 1900 1.97 1770 2.02 1740 2.05 1560 2.22 1490 2.36
Table 14 shows deflection and loading values of beam 2
53
Graph 13 represents relation between loading and deflection in beam 2
0
500
1000
1500
2000
2500
3000
3500
4000
After RepairBefore Repair

54
3-Beam 3:
Load ( Kg ) Deflection ( cm ) 0 0.19
100 0.23 200 0.24 300 0.26 400 0.27 500 0.27
1000 0.32 1500 0.37 2000 0.42 2500 0.46 3000 0.5 3350 0.54 3500 0.56 4000 0.61 4500 0.7 4700 0.79 2940 0.86 2800 0.95 2750 0.97 2740 1.03
Table 15 shows values of deflection and loading of beam 3

55
Graph 14 represents relation between loading and deflection in
beam 3
0
1000
2000
3000
4000
5000
6000
0.19 0.23 0.24 0.26 0.27 0.27 0.32 0.37 0.42 0.46 0.5 0.54 0.56 0.61 0.7 0.79 0.86 0.95 0.97 1.03
After RepairBefore Repair

56
Conclusion 1. load capacity of concrete elements increase by nearly 40% of
its original capacity after repair by FRP 2. After repair, failure occurred in each group due to the
opposite reason of original failure (failures in group 1 are shear failures, failures in group 2 are moment failures.
3. the early cracks appeared in bond between concrete and FRP, so best results came from beams with sufficient FRP development (bond) length