Dynamics of pelagic fish distribution and behaviour - Horizon ...

Progress in Oceanography 71 (2006) 59–87
Progress inOceanography
www.elsevier.com/locate/pocean
Seasonal food web structures and sympagic–pelagic couplingin the European Arctic revealed by stable isotopes and a
two-source food web model
Janne E. Søreide a,c,*, Haakon Hop b, Michael L. Carroll a,Stig Falk-Petersen b, Else Nøst Hegseth c
a Akvaplan-niva, N-9296 Tromsø, Norwayb Norwegian Polar Institute, N-9296 Tromsø, Norway
c Norwegian College of Fishery Science, University of Tromsø, N-9037 Tromsø, Norway
Received 3 February 2006; accepted 8 June 2006Available online 24 August 2006
Abstract
We simultaneously followed stable carbon (d13C) and nitrogen (d15N) isotopes in a two-source food web model to deter-mine trophic levels and the relative importance of open water- and ice-associated food sources (phytoplankton vs. icealgae) in the lower marine food web in the European Arctic during four seasons. The model is based upon extensive sea-sonal data from 1995 to 2001.
Phytoplankton, represented by samples of particulate organic matter from open water (Pelagic-POM) and ice algae,represented by samples from the underside of the ice (Ice-POM), were isotopically different. Ice-POM was generally dom-inated by the typical ice diatoms Nitzschia frigida and Melosira arctica and was more enriched than Pelagic-POM in 13C(d13C = �20& vs. �24&), but less enriched in 15N (d15N = 1.8& vs. 4.0&). However, when dominated by pelagic algae,Ice-POM was enriched in 13C and 15N similarly to Pelagic-POM.
The derived trophic enrichment factors for d15N (DN = 3.4&) and d13C (DC = 0.6&) were similar in both pelagic andsympagic (ice-associated) systems, although the DC for the sympagic system was variable.
Trophic level (TL) range for zooplankton (TL = 1.8–3.8) was similar to that of ice fauna (TL = 1.9–3.7), but ice amphi-pods were generally less enriched in d15N than zooplankton, reflecting lower d15N in Ice-POM compared to Pelagic-POM.For bulk zooplankton, TLs and carbon sources changed little seasonally, but the proportion of herbivores was higher dur-ing May–September than in October and March. Overall, we found that the primary carbon source for zooplankton wasPelagic-POM (mean 74%), but depending on species, season and TL, substantial carbon (up to 50%) was supplied from thesympagic system. For bulk ice fauna, no major changes were found in TLs or carbon sources from summer to autumn. Theprimary carbon source for ice fauna was Ice-POM (mean 67%), although ice fauna with TL > 3 (adult Onisimus nanseni
and juvenile polar cod) primarily utilized a pelagic food source.� 2006 Elsevier Ltd. All rights reserved.
Keywords: Trophic enrichment; Particulate organic matter; Zooplankton; Ice fauna; Marginal ice zone; Barents Sea
0079-6611/$ - see front matter � 2006 Elsevier Ltd. All rights reserved.
doi:10.1016/j.pocean.2006.06.001
* Corresponding author.E-mail address: [email protected] (J.E. Søreide).
60 J.E. Søreide et al. / Progress in Oceanography 71 (2006) 59–87
1. Introduction
Two potential carbon sources exist in the offshore Arctic marginal ice zone (MIZ); ice algae growing on theunderside and within the sea ice and phytoplankton in open waters (Syvertsen, 1991; Legendre et al., 1992;Hegseth, 1998; Falk-Petersen et al., 2000a; Sakshaug, 2003). Ice and open water environments generally sup-port different algal species (Syvertsen, 1991). Gran (1904) distinguished between obligate ice forms likeNitzschia frigida and Melosira hyperborea (now M. arctica) and planktonic forms such as Chaetoceros spp.and Thalassiosira spp. Ice algae start to grow in March, as light levels increase, and terminate growth whentheir sea ice substratum melts (Hegseth, 1998). In contrast, phytoplankton production in the MIZ starts afterthe onset of sea ice melting (Hegseth, 1998; Engelsen et al., 2002), giving a temporal discontinuity between sea-ice and open-water production.
Pelagic primary production is typified by short intense algal blooms trailing the ice edge as it melts andbreaks up, and subsequently spreading throughout the MIZ (Gran, 1931; Sakshaug and Skjoldal, 1989;Engelsen et al., 2002). The ice edge-bloom begins in April/May at the southernmost fringes of the first-yearice, and as late as the beginning of September near the multi-year ice pack in the far north (Zenkevitch, 1963;Sakshaug and Slagstad, 1992; Hegseth, 1997). Ice algal production may equal the pelagic production induration, although the production and biomass of phytoplankton usually exceeds that of ice algae (Hegseth,1998). The Arctic ice algal production is patchy and highly variable, averaging 5–10 g C m�2 yr�1, comparedto the Arctic pelagic production of 12–50 g C m�2 yr1 depending on the extent of ice-free waters and latitude(Legendre et al., 1992; Gosselin et al., 1997; Hegseth, 1998). However, in the multi-year ice pack of the cen-tral Arctic Ocean, ice algae contribute on average 57% of the total primary production (Gosselin et al.,1997).
Ice algae may be a crucial seasonal food source for first-order consumers, particularly in areas withextensive ice cover. Ice algae are known as an important food source for sympagic organisms (Werner,1997; Poltermann, 2001) and may supply and extend the restricted grazing season for Arctic zooplankton(e.g. Bradstreet and Cross, 1982; Conover et al., 1986; Runge and Ingram, 1991; Michel et al., 1996). Dur-ing the long and unproductive winter, Arctic zooplankton and ice fauna may switch to alternate preyand/or rely on physiological mechanisms such as reduced metabolism, body shrinkage or use of internallipid reserves stored the previous summer (Hagen and Auel, 2001; Werner and Auel, 2005; Lee et al.,2006). In the Antarctic, larval krill feed on the underside of the ice in winter, but too little algal foodis available to maintain growth (Ross et al., 2004). While multiple mechanisms for surviving the longpolar winter are possible, detailed information is limited (Sato et al., 2002; Ross et al., 2004; Wernerand Auel, 2005).
The stable isotope ratios of carbon (d13C) and nitrogen (d15N) provide a time-integrated measure of tro-phic position and have the potential to track energy or mass flows through food webs (Hobson and Welch,1992; Hobson et al., 1995; Post, 2002). A consumer is typically enriched in 15N by 3–4&, relative to its diet(DeNiro and Epstein, 1981; Minagawa and Wada, 1984; Peterson and Fry, 1987; Hobson and Welch, 1992),whereas 13C undergoes relatively little fractionation (<1&) with trophic level. The d13C values can thereforeprovide information on an organism’s major carbon sources, provided that the available carbon sourceshave distinct d13C signatures (Post, 2002). Ice algae and phytoplankton normally have distinctly differentd13C values, with ice algae being 2–10& more enriched in 13C than phytoplankton (Hobson and Welch,1992; Hobson et al., 1995; Hobson et al., 2002; Tamelander et al., 2006a). Despite the occurrence of bothice algae and phytoplankton in the Arctic MIZ, most Arctic stable isotope studies have used a one-sourcefood web model to estimate trophic levels (Hobson and Welch, 1992; Hobson et al., 1995; Hobson et al.,2002; Iken et al., 2005; Tamelander et al., 2006a). Such a model assumes that organisms utilize exclusivelyphytoplankton or ice algal source pathways. This is an overly simplistic assumption in the MIZ, with a morerealistic scenario being that both sympagic and pelagic production contribute to the overall autotrophic basisfor the food web. Exchange of energy among the pelagic, sympagic (i.e. ice-associated) and benthic commu-nities does occur in the Arctic (e.g. Hobson et al., 1995; Werner et al., 2004; Bauerfeind et al., 2005; Wernerand Auel, 2005; Tamelander et al., 2006a), but the extent of energy exchange (i.e. coupling) between thesecomponents varies spatially and is not well described. Sympagic–pelagic coupling has received particularlylittle attention.

J.E. Søreide et al. / Progress in Oceanography 71 (2006) 59–87 61
In the present study, we developed a stable isotope food web model for the European Arctic MIZ, basedon the two-source food web model from Post (2002), using phytoplankton and ice algae as food web base-lines, to determine trophic levels (TL) and seasonal carbon sources of key Arctic macrozooplankton and ice-fauna.
2. Materials and methods
We collected samples of particulate organic matter suspended in (Pelagic-POM) and settled from the watercolumn (Sedimented-POM), and from the underside of the sea ice (Ice-POM), in addition to zooplankton andice fauna, during several cruises from 1995 to 2001 to the Barents Sea MIZ and the MIZ north and west ofSvalbard, and east of Greenland (Table 1, Fig. 1).
2.1. Particulate organic matter (POM)
In May and October 1999, Pelagic-POM was collected with multiple vertical hauls (0–30 m) with a plank-ton net (20 lm mesh size). In September 2000 (Stn. 1003), Pelagic-POM was sampled by pumping large vol-umes of sea water from ca. 6 m depth through a plankton net (20 lm mesh size). Sedimented-POM wassampled by sediment traps moored to the sea ice. The sediment trap consisted of two gimballed Plexiglas cyl-inders (72 mm h, 450 mm high) with an aspect ratio of 6.25. The traps were placed at 25–30 m depth just belowthe pycnocline for 24 h. Ice-POM was collected by SCUBA divers using an electric suction pump equippedwith a net of 20 lm mesh size (Lønne, 1988).
In total, 10 Pelagic-POM, 27 Ice-POM, and 6 Sedimented-POM samples were analyzed. A sub-sample of100 ml from each suspended POM sample was preserved in 4% buffered formaldehyde for species determina-tion. Quantitative POM community samples were analyzed by counting 10-ml sub-samples under an invertedmicroscope (Utermohl, 1958). Qualitative POM community samples were analyzed under a microscope, andspecies identified were assigned relative abundance indices from present (x) to dominant (xxx). The POM com-munity composition was thereafter categorized into major taxonomic groups (see Table 2); with diatomsdivided into ice and pelagic diatoms, depending on their primary habitat (Hegseth, 1992; Hegseth, 1998;von Quillfeldt, 2000). Pelagic-, Ice- and Sedimented-POM were filtered onto pre-combusted (450 �C for 4 h)Whatman GF/C filters for stable isotope analysis. Zooplankton visible at 40· magnification were removedfrom the filter surface prior to freezing (�20 �C).
The stages of the algal bloom in May 1999 and March 2000 were obtained from Engelsen et al. (2002) andSøreide et al. (2003). The stages of the algal bloom at Stns. 882 and 890 were determined from the algal com-munity composition (Booth and Smith, 1997; Booth et al., 2002) and the recent (<3 months) sea ice conditions(obtained from satellite data; Goodman, 1992). At Stns. 978 and 1003, the algal bloom stages were determinedfrom the relative vertical distribution of chlorophyll-a recorded with a Sea Tech fluorometer attached to theCTD.
2.2. Zooplankton and ice fauna
Zooplankton was sampled in the upper 300 m by vertical hauls using plankton nets with various mesh sizes(180, 1000 and 1550 lm) and by oblique trawl hauls with a Tucker trawl (1 m2 mouth opening and 1 mmmesh). Ice amphipods and polar cod (Boreogadus saida) were collected by SCUBA divers using electric suctionpumps equipped with nets of 500 lm mesh and by hand held nets (5 mm mesh) on rods. Zooplankton and icefauna were kept in seawater at ambient temperatures and examined under a stereo-microscope within 1–4 hafter sampling. Organisms were identified to species, measured to nearest mm and sorted into different sizeclasses or copepodite stages. Calanus specimens were identified to species using the prosome lengths in Unstadand Tande (1991). If necessary, several individuals were pooled to obtain sufficient material for analysis. Deadanimals and specimens with visible stomach contents were not used for analysis. Whole zooplankton and iceamphipods, and dorsal muscle of polar cod were used for stable isotope analyses, and all samples were storedfrozen at �20 �C until analysis.

Table 1Sampling locations in the Barents Sea (BS), North (N), Northwest (NW) and Northeast (NE) of Svalbard and East (E) Greenland 1995–2001. Bottom (B.) depth, ice concentration (Iceconc.) in tenths, age of ice; First-year ice (FYI) and multi-year ice (MYI), and the algal bloom stage are given (nd, not determined)
Season Date Area Stations Latitude (N) Longitude B. depth (m) Ice conc. Ice type Algal stage
Spring 05–21.05.99 BS Al–A4, BI–B4, 68,76 75�520–77�22 0 27�00 0–34�25 0E 100–320 0–9/10 FYI Pre- to late-bloomSummer 17–21.06.99 BS ICE la, 2a 77�600–78�20 0 34�10 0–34�30 0E 100–320 7–9/10 FYI/MYI ndSummer 27.07–08.08.99 BS ICE lb–3b 78�320–8l�33 0 25�50 0–33�48 0E 100–320 3–6/10 FYI/MYI Late-bloomSummer 11.07.01 BS D 81�140 25�11 0E 200 9/10 FYI/MYI ndAutumn 25–28.09.99 NE Svalbard 882 82�270 33�l4 0E >2800 7–9/10 FYI/MYI Bloom to late-bloomAutumn 25–28.09.00 N-NW Svalbard 978, 1003 81�280–80�29 0 30�11 0–07�40 0E 342, 779 8/10 FYI/MYI Late-bloomAutumn 03–05.10.99 E Greenland 890 76�100 07�36 0W 330 7–9/10 FYI/MYI Late to post-bloomWinter 16–20.03.00 BS Cl–C4 76�300–78�21 0 3l�26 0–33�200E 150–300 0–5/10 FYI No bloom
62J
.E.
Sø
reide
eta
l./
Pro
gress
inO
cean
og
rap
hy
71
(2
00
6)
59
–8
7
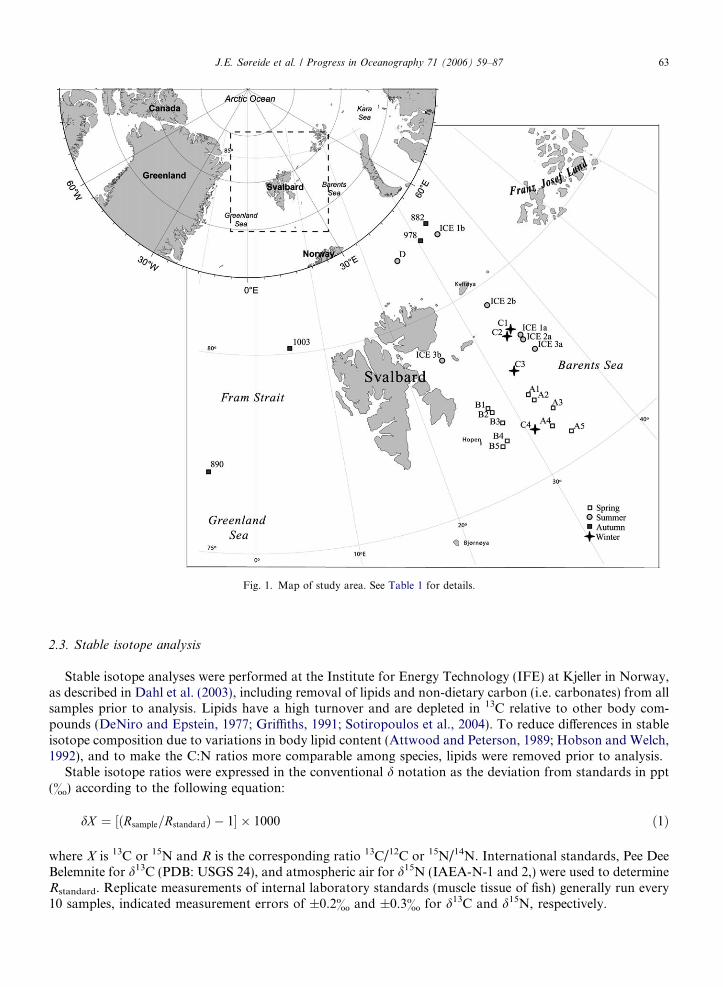
Fig. 1. Map of study area. See Table 1 for details.
J.E. Søreide et al. / Progress in Oceanography 71 (2006) 59–87 63
2.3. Stable isotope analysis
Stable isotope analyses were performed at the Institute for Energy Technology (IFE) at Kjeller in Norway,as described in Dahl et al. (2003), including removal of lipids and non-dietary carbon (i.e. carbonates) from allsamples prior to analysis. Lipids have a high turnover and are depleted in 13C relative to other body com-pounds (DeNiro and Epstein, 1977; Griffiths, 1991; Sotiropoulos et al., 2004). To reduce differences in stableisotope composition due to variations in body lipid content (Attwood and Peterson, 1989; Hobson and Welch,1992), and to make the C:N ratios more comparable among species, lipids were removed prior to analysis.
Stable isotope ratios were expressed in the conventional d notation as the deviation from standards in ppt(&) according to the following equation:
dX ¼ ½ðRsample=RstandardÞ � 1� � 1000 ð1Þ
where X is 13C or 15N and R is the corresponding ratio 13C/12C or 15N/14N. International standards, Pee DeeBelemnite for d13C (PDB: USGS 24), and atmospheric air for d15N (IAEA-N-1 and 2,) were used to determineRstandard. Replicate measurements of internal laboratory standards (muscle tissue of fish) generally run every10 samples, indicated measurement errors of ±0.2& and ±0.3& for d13C and d15N, respectively.

Table 2d13C and d15N values (mean ± SE) of particulate organic matter (POM) from open waters (Pelagic), underside of the sea ice (Ice) and sedimenting particles below the pycnocline (Sedim.), sampled from
different seasons, stations (Stn.), water depths (w. d.) and ice thicknesses (ice) in 1995–2001. Major POM taxonomic groups; ice and pelagic diatoms, Phaeocystis pouchetii (Phaeoc.), dinoflagellates (D. flg.),
Flagellates/ciliates (Flag./ciliat.) and detritus (Detr.) are given in percentages of total cell abundance and of carbon cell biomass (in brackets), or as present (x) to abundant (xxx), in addition to the dominating
algal species (nd = not determined)
POM Season Date Stn. w. d./ice (m) n Diatoms Phaeoc. D. flg. Flag./ciliat. Detr. Algae situation Dominating species d13C d15N
Ice Pelagic
Pelagic Spring 21.05.99 B4 0–30 3 1.5
(3.6)
43.4
(68.7)
52.5
(11.9)
1.1
(15.2)
1.4
(0.5)
nd bloom/late-bloom Phaeocystis pouchetii
(Thallassiosira spp.)
�23.6 ± 0.0 4.3 ± 0.2
Pelagic Spring 23.05.99 68, 76 0–50 2 xx xxx nd bloom/late-bloom Phacocystis pouchetii �24.5 ± 0.0 3.4 ± 0.5
Pelagic Autumn 27.09.99 882 0–40 1 48.5 51.5 nd bloom/late-bloom Attheya septentrionalis nd nd
Pelagic Autumn 03.10.99 890 0–40 2 0.8 98.9 0.0 0.2 0.0 nd late-/post-bloom Chaetoceros spp. �23.8 ± 0.0 5.7 ± 0.3
Pelagic Autumn 28.09.00 1003 5 3 xx xx xx late-bloom Diatom-mix �24.6 ± 0.2 3.9 ± 0.1
Ice (F) Spring 11.05.99 A2 �0.5 3 36.7 55.0 8.2 0.0 0.1 nd nd Fragilariopsis oceanica �24.3 ± 0.0 3.7 ± 0.2
Ice (O) Spring 18.05.99 B2 1.5 3 96.7 3.0 0.0 0.2 0.0 nd nd Nitzschia frigida �19.9 ± 0.1 2.4 ± 0.1
Ice (O) Summer 18.06.95 ICE Ia nd 2 xxx nd nd Melosira arctica �19.0 ± 0.1 0.9 ± 0.5
Ice (O) Summer 11.07.01 D 1 2 xxx nd healthy condition Melosira arctica �20.0 ± 0.8 1.6 ± 0.3
Ice (–) Summer 11.07.01 D 1 2 xxx nd moderate condition Melosira arctica �17.1 ± 0.9 4.3 ± 0.1
Ice (–) Summer 11.07.01 D 1 2 xxx nd poor condition Melosira arctica �12.2 ± 0.3 7.4 ± 0.4
Ice (O) Autumn 27.09.99 882 �1.5 3 86.8 9.7 0.0 0.7 2.8 nd nd Nitzschia spp. �21.0 ± 0.2 4.2 ± 0.1
Ice (F) Autumn 03.10.99 890 nd 6 9.2 89.3 0.0 0.8 0.7 nd nd Chaetoceros spp. �23.5 ± 0.3 5.7 ± 0.3
Sedim. Autumn 26.09.00 978 20 3 nd nd nd nd nd nd late summer-bloom nd �25.5 ± 0.3 3.5 ± 0.7
Sedim. Autumn 28.09.00 1003 35 3 nd nd nd nd nd nd late summer-bloom nd �25.8 ± 0.6 3.2 ± 1.0
(O) = obligate Ice-POM, (F) = facultative Ice-POM and (–) = Ice-POM excluded from the food web baseline estimates in summer.
64J
.E.
Sø
reide
eta
l./
Pro
gress
inO
cean
og
rap
hy
71
(2
00
6)
59
–8
7

J.E. Søreide et al. / Progress in Oceanography 71 (2006) 59–87 65
2.4. Two-source food web model
We assume that energy flows from primary producers through grazers and a chain of predators, generallyfrom small to large organisms (i.e. the basic idea of the classical bottom-up food web), and that zooplank-ton and ice fauna potentially utilize energy originating from both phytoplankton (Pelagic-POM) and icealgae (Ice-POM). To calculate trophic levels (TL) and proportions (a) contributed by these two availablecarbon sources, we used food web models from Post (2002). Trophic level (TL) of a consumer was calcu-lated from:
TLconsumer ¼ kþ ðd15Nconsumer � ½d15Npelagic � aþ d15Nice � ð1� aÞ�Þ=DN ð2Þ
where k is the TL of primary producers, i.e. TL = 1, d15Npelagic and d15Nice relate to Pelagic-POM and Ice-POM, respectively, DN is the estimated d15N enrichment value per TL, and a is the proportion of nitrogenin the consumer ultimately derived from Pelagic-POM. We assumed that carbon and nitrogen moved throughthe food web with a similar stoichiometry (Post, 2002), and used the two-member-mixing-model from Post(2002), with fractionation of 13C per TL (DC) included, which after reiterations gave:
a ¼ ðDNd13Cconsumer � DCd15Nconsumer þ DCd15Nice � DNd13CpelagicÞðDNd13Cpelagic � DNd13Cice � DCd15Npelagic þ DCd15NiceÞ
ð3Þ
The food web isotopic baselines and DC and DN were estimated from samples collected during spring and sum-mer, the peak productive season in the Arctic MIZ (Clarke and Peck, 1991; Dayton et al., 1994; Hegseth, 1998;Sakshaug, 2003). Mean d13C and d15N values of POM, consisting primarily of healthy pelagic algae (Pelagic-POM) and ice algae (Ice-POM) were used as food web baselines, and DC and DN were estimated from themean isotopic differences between consumers and diets for species with well-known feeding behaviour. Onlyconsumers with d13C values indicating dietary uptake from one carbon source, assessed from the generalassumption of DC = 0–1& and DN = 3–4& (DeNiro and Epstein, 1981; Minagawa and Wada, 1984; Petersonand Fry, 1987; Hobson and Welch, 1992), were used in the calculations. Any single trophic transfer is likely toexceed these generally assumed variability ranges for DC and DN, but DC = 0–1& and DN = 3–4& are robustand widely applicable assumptions when applied to food webs with multiple trophic pathways and many spe-cies (Post, 2002).
The robustness of the two-source food web model to changes in food web baseline values were tested byvarying baseline d13C and d15N values within the variability ranges found for Pelagic-POM and Ice-POMin this study. The robustness of the two-source food web model to changes in trophic enrichment factors weretested within the variability ranges generally found for DC and DN (i.e. 0–1& and 3–4&, respectively).
2.5. Data analysis
Species obtained from the same season (i.e. spring, summer, autumn or winter), but from different areas/stations and/or size groups were pooled if no significant differences in the d13C and d15N values were found.The predominant, seasonal feeding strategy for species/taxa was determined from their mean TLs (Eqs. (2)and (3)) using the feeding categories: herbivores (TL 6 2.3), omnivores (TL = 2.4–2.8), carnivores(TL = 2.9–3.3) and ‘‘top’’-carnivores (TL = 3.4–3.8).
Statistical tests were performed using STATISTICA ver. 6.1. T-tests were used when comparing two inde-pendent groups, and one-way ANOVA with the post-hoc Tukey HSD and Unequal N HSD tests when com-paring multiple groups with equal and unequal number of samples, respectively (Winer et al., 1991). If thevariance between independent groups was not homogenous (Levene’s test, p < 0.05), non-parametric statisticswere applied. The Mann–Whitney U test was used when comparing two independent groups, and a Kruskal–Wallis ANOVA, with a post-hoc multiple comparison test, was applied for comparing multiple independentgroups (Siegel and Castellan, 1988). The significance level for all tests was p 6 0.05; only the p-values are givenin the text.

66 J.E. Søreide et al. / Progress in Oceanography 71 (2006) 59–87
2.6. Food web model comparisons
We compared TLs from the two-source food web model (Eqs. (2) and (3), DN = 3.4&) with TLs from thecommonly used one-source food web model of Hobson and Welch (1992):
TL ¼ 1þ ðd15Nconsumer � d15NPPÞ=DN ð4Þ
where PP denotes primary producers (phytoplankton or ice algae, depending on the anticipated primary foodsource). We used the two-source food web model with and without fractionation of 13C (i.e. DC = 0.6 and 0&,respectively) and the one-source food-web model with this study’s estimated DN (i.e. 3.4&) and the DN (3.8&)commonly used in Arctic marine food web studies (Hobson and Welch, 1992; Hobson et al., 1995; Iken et al.,2005). In addition, the a values estimated from the two-source food web model with and without fractionationof 13C were compared.Chi-square (v2) tests (Snedecor and Cochran, 1989) were used to test for homogeneity of sample frequenciesin the selected feeding and carbon source categories for the different food web models.
3. Results
3.1. Particulate organic matter (POM)
Prymensiophytes (Phaeocystis pouchetti) and large pelagic diatoms (Thalassiosira spp.) dominated thespring bloom in May (Table 2). In September, near the multi-year ice pack, bloom to late-bloom situationsprevailed, dominated by oceanic summer diatoms (Nitzschia granii and Chaetoceros decipiens) and farthestnorth (Stn. 882) by small ice-associated diatoms (Attheya septentrionalis). In October, on the east Greenlandshelf (Stn. 890), a late- to post-bloom situation prevailed, dominated by small pelagic diatoms of the genusChaetoceros.
Ice-POM was generally dominated by the typical ice diatoms Nitzschia frigida or Melosira arctica (obligateIce-POM), but occasionally Ice-POM was dominated by pelagic-related algae such as Fragilariopsis oceanica
and Chaetoceros spp. (facultative Ice-POM) (Table 2). The algal cell condition of Ice-POM in July 2001, dom-inated by M. arctica, was determined and categorized into healthy, moderate and poor. Healthy M. arcticawere embedded in little ‘‘slime’’, i.e. polysaccharide mucus known as exopolymeric substances (EPS) (Krembset al., 2002); M. arctica in moderate cell condition contained relatively more EPS; whereas the M. arctica inpoor cell condition contained abundant EPS and had a lumpy consistency and brownish appearance.
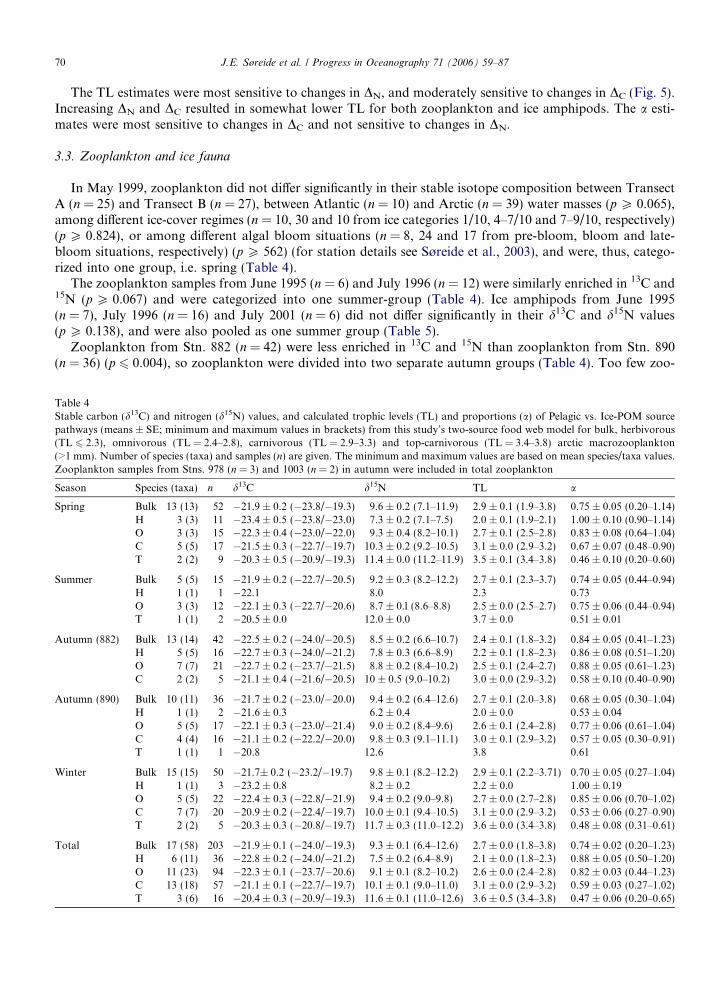
3.1.1. Stable isotope composition of POM
Overall, Pelagic-POM (n = 10) and facultative Ice-POM (n = 9) had similar d13C and d15N values(p P 0.517), but were less enriched in 13C and more enriched in 15N than obligate Ice-POM (n = 10; Ice-POMdominated by M. arctica in moderate and poor condition excluded) (p 6 0.004) (Table 2, Fig. 2). Sedimented-POM (n = 6) was less enriched in 13C (p 6 0.007), but had similar d15N values as Pelagic-POM, facultativeand obligate Ice-POM (p P 0.067).
Pelagic-POM from productive waters in spring (n = 5) and autumn (n = 9) had similar d13C values(p = 0.074), but Pelagic-POM from October was 1.4–2.3& more enriched in 15N than Pelagic-POM fromMay and September (p 6 0.049).
Obligate Ice-POM was �4–12& more enriched in 13C than Pelagic-POM (Table 2, Fig. 2). Ice-POM dom-inated by M. arctica in poor condition was particularly enriched in 13C, but the d15N values also graduallyincreased as the M. arctica-dominated Ice-POM samples degraded and became more embedded in EPS (Fig. 3).
Sedimented-POM from Stns. 978 and 1003 in autumn had similar d13C and d15N values (p P 0.625).
3.2. Two-source food web model
Mean stable isotope values of Pelagic-POM (n = 5), collected in the Barents Sea in spring, and obligate Ice-POM (n = 9), collected in the Barents Sea during spring and summer, were selected as isotopic baselines forphytoplankton and ice algae, respectively (Table 2 and Figs. 2, 4). Pelagic-POM and Ice-POM baselines were

δ
13C (‰)
15N
(‰
)
Pelagic-POM:May Sept.
Obligate Ice-POM:
Sedimented-POM:
Facultative Ice-POM:May Oct.
May June Sept.
Sept.
Oct.
July
0
1
2
3
4
5
6
7
-28 -27 -26 -25 -24 -23 -22 -21 -20 -19 -18
Fig. 2. Stable carbon (d13C) and nitrogen (d15N) values of individual particulate organic matter (POM) samples collected in open waterdominated by pelagic algae (Pelagic-POM) and from the underside of the sea ice, dominated by either ice diatoms (obligate Ice-POM) orpelagic algae (facultative Ice-POM). See Table 2 for details.
y=0.61x + 14.31
r2 = 0.89
M. arctica healthy/ little EPS
Moderate
M. arctica poor/ abundant EPS
p= 0.007
0
2
4
6
8
10
-22 -21 -20 -19 -18 -17 -16 -15 -14 -13 -12 -11 -10
δ
Fig. 3. Stable carbon (d13C) and nitrogen (d15N) composition of Ice-POM from summer (Stn. D), consisting primarily of Melosira arctica,differentiated into three major categories depending on the algal cell condition (healthy to poor), and the relative amount of polysaccharidemucus known as exopolymeric substances (EPS).
J.E. Søreide et al. / Progress in Oceanography 71 (2006) 59–87 67
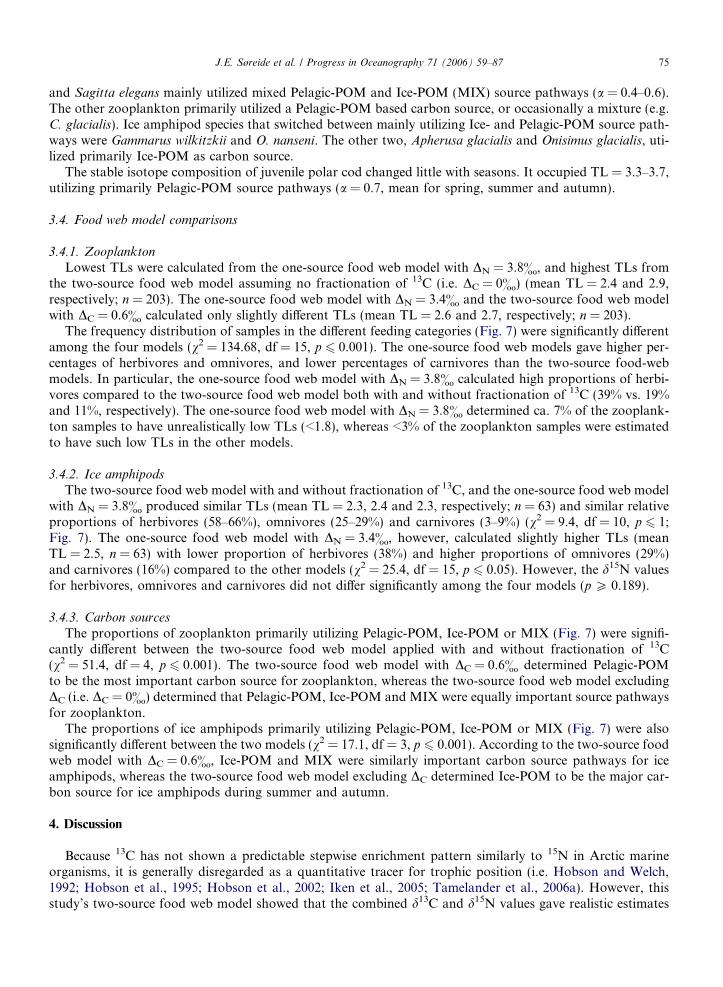
distinctly different in their d13C and d15N values (p 6 0.001), with Pelagic-POM baseline being 4& lessenriched in 13C and 2.2& more enriched in 15N than Ice-POM baseline (mean d13C = �24.0 ± 0.2 vs.�20.0 ± 0.3& and mean d15N = 4.0 ± 0.3 vs. 1.8 ± 0.2&, respectively).
The predominant herbivores and carnivores in the pelagic system during spring, those exclusively utilizingPelagic-POM source pathways, were the copepods Calanus glacialis (n = 4) and C. hyperboreus (n = 4) (meand13C = �23.3 ± 0.2&, and mean d15N = 7.3& ± 0.2&), and the amphipod Themisto libellula (n = 5) (mean

0
2
4
6
8
10
12
14
-26 -25 -24 -23 -22 -21 -20 -19 -18
0
2
4
6
8
10
12
14
-26 -25 -24 -23 -22 -21 -20 -19 -18
Pelagic-POM
Calanus spp.
T. libellula
T. inermis < 20 mm
T. inermis > 22 mm
S. elegans
Ice-POM
A. glacialis
G. wilkitzkii juv.G. wilkitzkii ad.
O. nanseni
B. saida
a
bPelagic-POMCarbon source:
MIXIce-POM
δ
Fig. 4. Stable carbon (d13C) and nitrogen (d15N) values (mean ± SE) of key components of the lower pelagic (a) and sympagic (b) foodwebs in the European Arctic during spring/summer. Organisms were categorized according to their major carbon source: phytoplankton(Pelagic-POM), ice algae (Ice-POM) or a mixture of the two (MIX). The organisms that primarily utilized Pelagic-POM or Ice-POMsource pathways were used to calculate the trophic enrichment factors of d13C and d15N for the pelagic and sympagic systems, respectively.
68 J.E. Søreide et al. / Progress in Oceanography 71 (2006) 59–87
d13C = �22.7 ± 0.3&, and d15N = 10.7 ± 0.2&) (Fig. 4), respectively. For the sympagic system, only the pre-dominantly herbivorous ice amphipod Apherusa glacialis (n = 4) (d13C = �19.9 ± 0.6&, and d15N =5.2 ± 0.3&) was found to mainly utilize Ice-POM source pathways (Fig. 4). The mean trophic enrichment fac-tor per TL for d15N (DN) was estimated to be 3.4& for both the pelagic (3.36 ± 17&) and sympagic(3.39 ± 0.34&) systems. The mean enrichment factor per TL for d13C (DC) was estimated to be 0.6& forthe pelagic system and 0.1& for the sympagic system. However, we determined DC to be similar for both pela-gic and sympagic systems, since the d13C values in A. glacialis used to calculate DC for the sympagic systemwere variable, and since the difference in d13C between individual samples of consumers and the estimatedfood web baselines in the pelagic (mean DC = 0.66 ± 0.14&, n = 13) and the sympagic (meanDC = 0.15 ± 0.56&, n = 4) systems were not significantly different (p = 0.184).
3.2.1. Robustness of the two-source food web model
The TL estimates for zooplankton and ice amphipods did not differ significantly when we changed the d13Cbaselines by ±1& (Table 3). However, the proportion of Pelagic-POM vs. Ice-POM utilized by zooplanktonincreased (i.e. higher a) when the Pelagic-POM baseline increased from d13C = �24.0& to �23.0&, anddecreased (i.e. lower a) when this baseline decreased from d13C = �24.0& to �25.0&. For ice amphipods,the proportion of Pelagic-POM food sources decreased when the Ice-POM baseline decreased fromd13C = �20& to �21&.
The a estimates for zooplankton and ice amphipods did not differ significantly when we changed the d15Nbaselines by ±2&, except for an increase in the estimated proportion of Ice-POM utilized by ice amphipods

Table 3Comparison of trophic levels (TL) and proportions (a) of Pelagic- vs. Ice-POM source pathways (means ± SE) for zooplankton (zoopl.)and ice amphipods (Ice amph.), calculated from this study’s two-source food web model (in bold) and from the two-source food webmodel when using other Pelagic- and/or Ice-POM food web baseline values (p-values given). Phytoplankton and ice algae, represented bysamples of particulate organic matter from open water (Pelagic-POM) and the underside of the sea ice (Ice-POM), were used as food webbaselines
Pelagie-POM Ice-POM Mean TL p-value Mean a p-value
d13C d15N d13C d15N Zoopl. Ice amph. Zoopl. Ice amph. Zoopl. Ice amph. Zoopl. Ice amph.
�24.0 4.0 �20.0 1.8 2.7 ± 0.5 2.3 ± 0.0 0.74 ± 0.02 0.33 ± 0.03
�24.0 4.0 �19.0 1.8 2.7 ± 0.5 2.2 ± 0.0 1.000 0.959 0.79 ± 0.02 0.45 ± 0.02 1.000 0.070�24.0 4.0 �21.0 1.8 2.8 ± 0.5 2.4 ± 0.0 1.000 0.625 0.66 ± 0.03 0.13 ± 0.04 0.601 <0.001�23.0 4.0 �20.0 1.8 2.6 ± 0.5 2.2 ± 0.0 0.171 0.992 0.96 ± 0.03 0.42 ± 0.04 <0.001 0.721�25.0 4.0 �20.0 1.8 2.8 ± 0.5 2.3 ± 0.0 1.000 1.000 0.60 ± 0.02 0.27 ± 0.02 <0.001 0.977�24.0 4.0 �20.0 1.0 3.1 ± 0.5 2.6 ± 0.1 <0.001 <0.001 0.41 ± 0.02 0.10 ± 0.03 1.000 <0.00l�24.0 4.0 �20.0 2.4 2.7 ± 0.5 2.1 ± 0.0 1.000 0.790 0.73 ± 0.02 0.31 ± 0.03 1.000 1.000�24.0 4.0 �20.0 4.0 2.6 ± 0.4 1.8 ± 0.1 0.021 <0.001 0.71 ± 0.02 0.26 ± 0.03 1.000 1.000�24.0 6.0 �20.0 4.0 2.2 ± 0.5 1.7 ± 0.0 <0.001 <0.001 0.66 ± 0.02 0.24 ± 0.03 0.313 1.000
J.E. Søreide et al. / Progress in Oceanography 71 (2006) 59–87 69
when the Ice-POM baseline decreased from d15N = 1.8& to 1.0& (Table 3). In contrast to the a values, the TLestimates were sensitive to changes in the d15N baseline. When the Ice-POM baseline was reduced fromd15N = 1.8& to 1.0&, the mean TL for both zooplankton and ice amphipods increased. When Pelagic-POM and Ice-POM had the same d15N (i.e. 4&), no significant differences in TL for zooplankton were found,although significantly lower TLs were estimated for ice amphipods. By increasing the d15N baseline value byapproximately 2& for both Pelagic-POM and Ice-POM (i.e. an autumn situation with d15N = 6& and 4&,respectively), the estimated TL for both zooplankton and ice amphipods became significantly lower.
y = -0.07x + 0.97
y = -0.05x + 0.49
3.0 3.1 3.2 3.3 3.4 3.5 3.6 3.7 3.8 3.9 4.0
y = -0.26x + 2.88
y = -0.19x + 2.37
2.0
2.1
2.2
2.3
2.4
2.5
2.6
2.7
2.8
2.9
3.0
0 0.1 0.2 0.3 0.4 0.5 0.6 0.7 0.8 0.9 1.0
y = 0.41x + 0.49
y = 0.29x + 0.15
0
0.1
0.2
0.3
0.4
0.5
0.6
0.7
0.8
0.9
1.0
0.0 0.1 0.2 0.3 0.4 0.5 0.6 0.7 0.8 0.9 1.0
y = -0.44x + 4.24
y = -0.32x + 3.35
2.0
2.1
2.2
2.3
2.4
2.5
2.6
2.7
2.8
2.9
3.0
3.0 3.1 3.2 3.3 3.4 3.5 3.6 3.7 3.8 3.9 4.0
13C fractionation value ( C)15
N fractionation value ( N)
Tro
phic
leve
l (T
L)
Prop
ortio
n (
)
Ice amphipods
Zooplankton
0
0.1
0.2
0.3
0.4
0.5
0.6
0.7
0.8
0.9
1.0
δδ
α
Fig. 5. Mean trophic levels (top panels), and mean proportion of Pelagic-POM vs. Ice-POM source pathways (bottom panels) for bulkzooplankton and ice amphipods, calculated from the two-source food web model when changing the trophic fractionation estimates of 13C(DC) and 15N (DN) respectively from 0 to 1& and 3 to 4&. The TL and a labelled (*) were significantly different from the TL and acalculated from the two-source food web model when using this study’s estimated DC (0.6&) and DN (3.4&).
70 J.E. Søreide et al. / Progress in Oceanography 71 (2006) 59–87
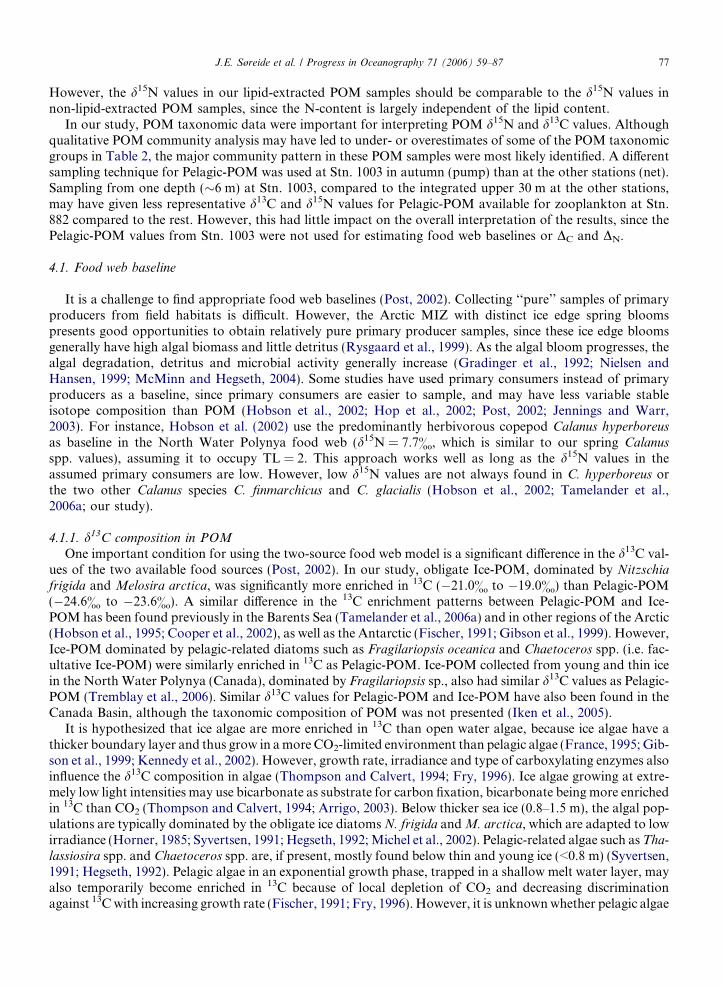
The TL estimates were most sensitive to changes in DN, and moderately sensitive to changes in DC (Fig. 5).Increasing DN and DC resulted in somewhat lower TL for both zooplankton and ice amphipods. The a esti-mates were most sensitive to changes in DC and not sensitive to changes in DN.
3.3. Zooplankton and ice fauna
In May 1999, zooplankton did not differ significantly in their stable isotope composition between TransectA (n = 25) and Transect B (n = 27), between Atlantic (n = 10) and Arctic (n = 39) water masses (p P 0.065),among different ice-cover regimes (n = 10, 30 and 10 from ice categories 1/10, 4–7/10 and 7–9/10, respectively)(p P 0.824), or among different algal bloom situations (n = 8, 24 and 17 from pre-bloom, bloom and late-bloom situations, respectively) (p P 562) (for station details see Søreide et al., 2003), and were, thus, catego-rized into one group, i.e. spring (Table 4).
The zooplankton samples from June 1995 (n = 6) and July 1996 (n = 12) were similarly enriched in 13C and15N (p P 0.067) and were categorized into one summer-group (Table 4). Ice amphipods from June 1995(n = 7), July 1996 (n = 16) and July 2001 (n = 6) did not differ significantly in their d13C and d15N values(p P 0.138), and were also pooled as one summer group (Table 5).
Zooplankton from Stn. 882 (n = 42) were less enriched in 13C and 15N than zooplankton from Stn. 890(n = 36) (p 6 0.004), so zooplankton were divided into two separate autumn groups (Table 4). Too few zoo-
Table 4Stable carbon (d13C) and nitrogen (d15N) values, and calculated trophic levels (TL) and proportions (a) of Pelagic vs. Ice-POM sourcepathways (means ± SE; minimum and maximum values in brackets) from this study’s two-source food web model for bulk, herbivorous(TL 6 2.3), omnivorous (TL = 2.4–2.8), carnivorous (TL = 2.9–3.3) and top-carnivorous (TL = 3.4–3.8) arctic macrozooplankton(>1 mm). Number of species (taxa) and samples (n) are given. The minimum and maximum values are based on mean species/taxa values.Zooplankton samples from Stns. 978 (n = 3) and 1003 (n = 2) in autumn were included in total zooplankton
Season Species (taxa) n d13C d15N TL a
Spring Bulk 13 (13) 52 �21.9 ± 0.2 (�23.8/�19.3) 9.6 ± 0.2 (7.1–11.9) 2.9 ± 0.1 (1.9–3.8) 0.75 ± 0.05 (0.20–1.14)H 3 (3) 11 �23.4 ± 0.5 (�23.8/�23.0) 7.3 ± 0.2 (7.1–7.5) 2.0 ± 0.1 (1.9–2.1) 1.00 ± 0.10 (0.90–1.14)O 3 (3) 15 �22.3 ± 0.4 (�23.0/�22.0) 9.3 ± 0.4 (8.2–10.1) 2.7 ± 0.1 (2.5–2.8) 0.83 ± 0.08 (0.64–1.04)C 5 (5) 17 �21.5 ± 0.3 (�22.7/�19.7) 10.3 ± 0.2 (9.2–10.5) 3.1 ± 0.0 (2.9–3.2) 0.67 ± 0.07 (0.48–0.90)T 2 (2) 9 �20.3 ± 0.5 (�20.9/�19.3) 11.4 ± 0.0 (11.2–11.9) 3.5 ± 0.1 (3.4–3.8) 0.46 ± 0.10 (0.20–0.60)
Summer Bulk 5 (5) 15 �21.9 ± 0.2 (�22.7/�20.5) 9.2 ± 0.3 (8.2–12.2) 2.7 ± 0.1 (2.3–3.7) 0.74 ± 0.05 (0.44–0.94)H 1 (1) 1 �22.1 8.0 2.3 0.73O 3 (3) 12 �22.1 ± 0.3 (�22.7/�20.6) 8.7 ± 0.l (8.6–8.8) 2.5 ± 0.0 (2.5–2.7) 0.75 ± 0.06 (0.44–0.94)T 1 (1) 2 �20.5 ± 0.0 12.0 ± 0.0 3.7 ± 0.0 0.51 ± 0.01
Autumn (882) Bulk 13 (14) 42 �22.5 ± 0.2 (�24.0/�20.5) 8.5 ± 0.2 (6.6–10.7) 2.4 ± 0.1 (1.8–3.2) 0.84 ± 0.05 (0.41–1.23)H 5 (5) 16 �22.7 ± 0.3 (�24.0/�21.2) 7.8 ± 0.3 (6.6–8.9) 2.2 ± 0.1 (1.8–2.3) 0.86 ± 0.08 (0.51–1.20)O 7 (7) 21 �22.7 ± 0.2 (�23.7/�21.5) 8.8 ± 0.2 (8.4–10.2) 2.5 ± 0.1 (2.4–2.7) 0.88 ± 0.05 (0.61–1.23)C 2 (2) 5 �21.1 ± 0.4 (�21.6/�20.5) 10 ± 0.5 (9.0–10.2) 3.0 ± 0.0 (2.9–3.2) 0.58 ± 0.10 (0.40–0.90)
Autumn (890) Bulk 10 (11) 36 �21.7 ± 0.2 (�23.0/�20.0) 9.4 ± 0.2 (6.4–12.6) 2.7 ± 0.1 (2.0–3.8) 0.68 ± 0.05 (0.30–1.04)H 1 (1) 2 �21.6 ± 0.3 6.2 ± 0.4 2.0 ± 0.0 0.53 ± 0.04O 5 (5) 17 �22.1 ± 0.3 (�23.0/�21.4) 9.0 ± 0.2 (8.4–9.6) 2.6 ± 0.1 (2.4–2.8) 0.77 ± 0.06 (0.61–1.04)C 4 (4) 16 �21.1 ± 0.2 (�22.2/�20.0) 9.8 ± 0.3 (9.1–11.1) 3.0 ± 0.1 (2.9–3.2) 0.57 ± 0.05 (0.30–0.91)T 1 (1) 1 �20.8 12.6 3.8 0.61
Winter Bulk 15 (15) 50 �21.7± 0.2 (�23.2/�19.7) 9.8 ± 0.1 (8.2–12.2) 2.9 ± 0.1 (2.2–3.71) 0.70 ± 0.05 (0.27–1.04)H 1 (1) 3 �23.2 ± 0.8 8.2 ± 0.2 2.2 ± 0.0 1.00 ± 0.19O 5 (5) 22 �22.4 ± 0.3 (�22.8/�21.9) 9.4 ± 0.2 (9.0–9.8) 2.7 ± 0.0 (2.7–2.8) 0.85 ± 0.06 (0.70–1.02)C 7 (7) 20 �20.9 ± 0.2 (�22.4/�19.7) 10.0 ± 0.1 (9.4–10.5) 3.1 ± 0.0 (2.9–3.2) 0.53 ± 0.06 (0.27–0.90)T 2 (2) 5 �20.3 ± 0.3 (�20.8/�19.7) 11.7 ± 0.3 (11.0–12.2) 3.6 ± 0.0 (3.4–3.8) 0.48 ± 0.08 (0.31–0.61)
Total Bulk 17 (58) 203 �21.9 ± 0.1 (�24.0/�19.3) 9.3 ± 0.1 (6.4–12.6) 2.7 ± 0.0 (1.8–3.8) 0.74 ± 0.02 (0.20–1.23)H 6 (11) 36 �22.8 ± 0.2 (�24.0/�21.2) 7.5 ± 0.2 (6.4–8.9) 2.1 ± 0.0 (1.8–2.3) 0.88 ± 0.05 (0.50–1.20)O 11 (23) 94 �22.3 ± 0.1 (�23.7/�20.6) 9.1 ± 0.1 (8.2–10.2) 2.6 ± 0.0 (2.4–2.8) 0.82 ± 0.03 (0.44–1.23)C 13 (18) 57 �21.1 ± 0.1 (�22.7/�19.7) 10.1 ± 0.1 (9.0–11.0) 3.1 ± 0.0 (2.9–3.2) 0.59 ± 0.03 (0.27–1.02)T 3 (6) 16 �20.4 ± 0.3 (�20.9/�19.3) 11.6 ± 0.1 (11.0–12.6) 3.6 ± 0.5 (3.4–3.8) 0.47 ± 0.06 (0.20–0.65)
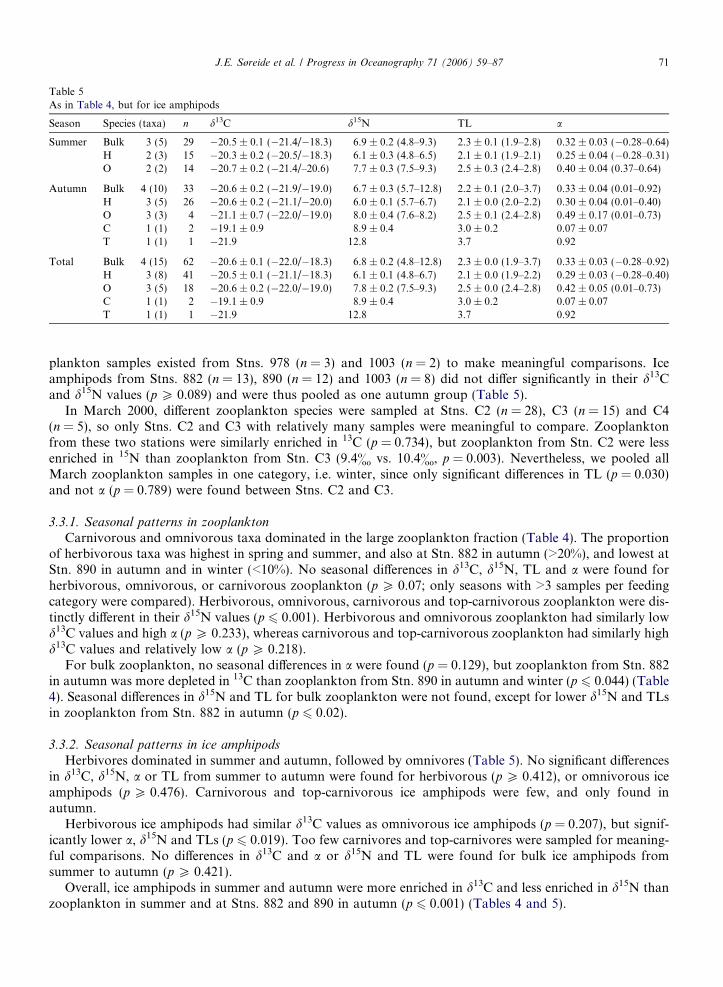
Table 5As in Table 4, but for ice amphipods
Season Species (taxa) n d13C d15N TL a
Summer Bulk 3 (5) 29 �20.5 ± 0.1 (�21.4/�18.3) 6.9 ± 0.2 (4.8–9.3) 2.3 ± 0.1 (1.9–2.8) 0.32 ± 0.03 (�0.28–0.64)H 2 (3) 15 �20.3 ± 0.2 (�20.5/�18.3) 6.1 ± 0.3 (4.8–6.5) 2.1 ± 0.1 (1.9–2.1) 0.25 ± 0.04 (�0.28–0.31)O 2 (2) 14 �20.7 ± 0.2 (�21.4/–20.6) 7.7 ± 0.3 (7.5–9.3) 2.5 ± 0.3 (2.4–2.8) 0.40 ± 0.04 (0.37–0.64)
Autumn Bulk 4 (10) 33 �20.6 ± 0.2 (�21.9/�19.0) 6.7 ± 0.3 (5.7–12.8) 2.2 ± 0.1 (2.0–3.7) 0.33 ± 0.04 (0.01–0.92)H 3 (5) 26 �20.6 ± 0.2 (�21.1/�20.0) 6.0 ± 0.1 (5.7–6.7) 2.1 ± 0.0 (2.0–2.2) 0.30 ± 0.04 (0.01–0.40)O 3 (3) 4 �21.1 ± 0.7 (�22.0/�19.0) 8.0 ± 0.4 (7.6–8.2) 2.5 ± 0.1 (2.4–2.8) 0.49 ± 0.17 (0.01–0.73)C 1 (1) 2 �19.1 ± 0.9 8.9 ± 0.4 3.0 ± 0.2 0.07 ± 0.07T 1 (1) 1 �21.9 12.8 3.7 0.92
Total Bulk 4 (15) 62 �20.6 ± 0.1 (�22.0/�18.3) 6.8 ± 0.2 (4.8–12.8) 2.3 ± 0.0 (1.9–3.7) 0.33 ± 0.03 (�0.28–0.92)H 3 (8) 41 �20.5 ± 0.1 (�21.1/�18.3) 6.1 ± 0.1 (4.8–6.7) 2.1 ± 0.0 (1.9–2.2) 0.29 ± 0.03 (�0.28–0.40)O 3 (5) 18 �20.6 ± 0.2 (�22.0/�19.0) 7.8 ± 0.2 (7.5–9.3) 2.5 ± 0.0 (2.4–2.8) 0.42 ± 0.05 (0.01–0.73)C 1 (1) 2 �19.1 ± 0.9 8.9 ± 0.4 3.0 ± 0.2 0.07 ± 0.07T 1 (1) 1 �21.9 12.8 3.7 0.92
J.E. Søreide et al. / Progress in Oceanography 71 (2006) 59–87 71
plankton samples existed from Stns. 978 (n = 3) and 1003 (n = 2) to make meaningful comparisons. Iceamphipods from Stns. 882 (n = 13), 890 (n = 12) and 1003 (n = 8) did not differ significantly in their d13Cand d15N values (p P 0.089) and were thus pooled as one autumn group (Table 5).
In March 2000, different zooplankton species were sampled at Stns. C2 (n = 28), C3 (n = 15) and C4(n = 5), so only Stns. C2 and C3 with relatively many samples were meaningful to compare. Zooplanktonfrom these two stations were similarly enriched in 13C (p = 0.734), but zooplankton from Stn. C2 were lessenriched in 15N than zooplankton from Stn. C3 (9.4& vs. 10.4&, p = 0.003). Nevertheless, we pooled allMarch zooplankton samples in one category, i.e. winter, since only significant differences in TL (p = 0.030)and not a (p = 0.789) were found between Stns. C2 and C3.
3.3.1. Seasonal patterns in zooplankton
Carnivorous and omnivorous taxa dominated in the large zooplankton fraction (Table 4). The proportionof herbivorous taxa was highest in spring and summer, and also at Stn. 882 in autumn (>20%), and lowest atStn. 890 in autumn and in winter (<10%). No seasonal differences in d13C, d15N, TL and a were found forherbivorous, omnivorous, or carnivorous zooplankton (p P 0.07; only seasons with >3 samples per feedingcategory were compared). Herbivorous, omnivorous, carnivorous and top-carnivorous zooplankton were dis-tinctly different in their d15N values (p 6 0.001). Herbivorous and omnivorous zooplankton had similarly lowd13C values and high a (p P 0.233), whereas carnivorous and top-carnivorous zooplankton had similarly highd13C values and relatively low a (p P 0.218).
For bulk zooplankton, no seasonal differences in a were found (p = 0.129), but zooplankton from Stn. 882in autumn was more depleted in 13C than zooplankton from Stn. 890 in autumn and winter (p 6 0.044) (Table4). Seasonal differences in d15N and TL for bulk zooplankton were not found, except for lower d15N and TLsin zooplankton from Stn. 882 in autumn (p 6 0.02).
3.3.2. Seasonal patterns in ice amphipods
Herbivores dominated in summer and autumn, followed by omnivores (Table 5). No significant differencesin d13C, d15N, a or TL from summer to autumn were found for herbivorous (p P 0.412), or omnivorous iceamphipods (p P 0.476). Carnivorous and top-carnivorous ice amphipods were few, and only found inautumn.
Herbivorous ice amphipods had similar d13C values as omnivorous ice amphipods (p = 0.207), but signif-icantly lower a, d15N and TLs (p 6 0.019). Too few carnivores and top-carnivores were sampled for meaning-ful comparisons. No differences in d13C and a or d15N and TL were found for bulk ice amphipods fromsummer to autumn (p P 0.421).
Overall, ice amphipods in summer and autumn were more enriched in d13C and less enriched in d15N thanzooplankton in summer and at Stns. 882 and 890 in autumn (p 6 0.001) (Tables 4 and 5).

Table 6Stable carbon (d13C) and nitrogen (d15N) isotope values of dominating Arctic macrozooplankton species (>1 mm), their trophic level (TL)and proportion (a) of Pelagic- vs. Ice-POM source pathways calculated from this study’s two-source food web model. Species obtainedfrom the same season (i.e. spring, summer, autumn or winter), but from different areas/stations and/or size groups were pooled as long asno significant differences were found in their d13C or d13N values
Species Size/stage Season Stn./area n d13C d15N TL a
Calanus finmarchicus (cf) CVIF Spring BS 99 3 �23.8 ± 1.9 7.4 ± 0.4 2.0 ± 0.4 1.14 ± 0.43CVIF Autumn 890, 1003 5 �21.6 ± 0.1 6.4 ± 0.2 2.0 ± 0.1 0.50 ± 0.02CVIF Winter BS 00 2 �20.1 ± 0.4 9.7 ± 0.3 3.1 ± 0.0 0.35 ± 0.12
Calanus glacialis (cg) CVIF Spring BS 99 4 �23.6 ± 0.2 7.1 ± 0.3 1.9 ± 0.1 1.00 ± 0.04CV, CVIF Autumn 882 6 �21.2 ± 0.3 7.4 ± 0.3 2.3 ± 0.1 0.51 ± 0.07CVIF Autumn 890, 978 6 �21.4 ± 0.3 9.1 ± 0.1 2.8 ± 0.0 0.63 ± 0.08CV Autumn 890 3 �21.1 ± 0.2 10.2 ± 0.3 3.1 ± 0.1 0.61 ± 0.05CVIF Winter BS 00 3 �21.7 ± 0.7 9.7 ± 0.2 2.9 ± 0.1 0.73 ± 0.18
Calanus hyperboreus (ch) CVIF Spring BS 99 4 �23.0 ± 0.2 7.5 ± 0.4 2.1 ± 0.1 0.90 ± 0.03CVIF Summer BS 96 �22.1 8.0 2.3 0.76CV, CVIF Autumn 882 6 �24.0 ± 0.1 8.9 ± 0.2 2.3 ± 0.1 1.20 ± 0.02CV, CVIF Autumn 890 6 �21.2 ± 0.2 9.4 ± 0.4 2.9 ± 0.1 0.60 ± 0.05CVIF Winter BS 00 3 �21.9 ± 0.8 9.3 ± 0.2 2.7 ± 0.1 0.70 ± 0.21
Paraeuchaeta norvegica (pn) CVIF Spring BS 99 1 �20.6 9.8 3.1 0.48CVIF Autumn 882 3 �21.6 ± 0.4 10.7 ± 0.6 3.2 ± 0.2 0.70 ± 0.10CVIF Winter BS 00 3 �20.7 ± 0.7 10.5 ± 0.3 3.2 ± 0.1 0.54 ± 0.10
Paraeuchaeta glacialis (pg) CVIF Autumn 882 3 �23.7 ± 0.1 10.2 ± 0.2 2.7 ± 0.1 1.23 ± 0.02CVIF Autumn 890 3 �22.2 ± 0.4 11.1 ± 0.3 3.2 ± 0.1 0.91 ± 0.08
Thysanoessa inermis (ti) 10–19 mm Spring BS 99 6 �21.6 ± 0.3 8.2 ± 0.6 2.5 ± 0.1 0.64 ± 0.09>22 mm Spring BS 99 3 �21.0 ± 0.4 10.5 ± 0.5 3.2 ± 0.2 0.61 ± 0.08n.m. Summer BS 95,96 3 �20.6 ± 0.1 8.6 ± 0.1 2.7 ± 0.0 0.44 ± 0.02l6–19 mm Autumn 882 3 �23.1 ± 0.8 6.9 ± 0.8 1.9 ± 0.3 0.97 ± 0.17>22 mm Autumn 890 3 �20.0 ± 0.3 9.1 ± 0.1 3.0 ± 0.0 0.30 ± 0.0817–19 mm Winter BS 00 3 �21.9 ± 0.2 9.4 ± 0.1 2.8 ± 0.0 0.70 ± 0.06
Thysanoessa longicaudata (tl) 9–13 mm Spring BS 99 2 �20.8 ± 0.5 9.2 ± 0.1 2.9 ± 0.1 0.50 ± 0.1212–17 mm Autumn 882, 890 7 �22.5 ± 0.4 8.4 ± 0.4 2.4 ± 0.2 0.80 ± 0.0912–13 mm Winter BS 00 3 �22.1 ± 0.3 9.2 ± 0.2 2.7 ± 0.1 0.81 ± 0.07
Themisto abyssorum (ta) 6–9 mm Autumn 882, 978 2 �23.1 ± 0.1 6.6 ± 0.1 1.8 ± 0.0 0.90 ± 0.039–15 mm Autumn 882, 890 4 �22.9 ± 0.3 8.6 ± 0.2 2.4 ± 0.0 0.93 ± 0.0812–15 mm Winter BS 00 3 �19.7 ± 0.0 11.0 ± 0.1 3.5 ± 0.0 0.31 ± 0.00
Themisto libellula (tli) 26–27 mm Spring BS 99 5 �22.7 ± 0.3 10.7 ± 0.2 3.0 ± 0.1 1.02 ± 0.07n.m. Summer BS 96 6 �22.7 ± 0.1 8.7 ± 0.2 2.5 ± 0.0 0.94 ± 0.0311–17 mm Autumn 882 3 �21.5 ± 0.1 8.5 ± 0.6 2.6 ± 0.2 0.63 ± 0.0113–26 mm Autumn 890 6 �23.0 ± 0.5 9.6 ± 0.4 2.7 ± 0.1 1.04 ± 0.1315–26 mm Winter BS 00 3 �22.8 ± 0.7 9.8 ± 0.5 2.7 ± 0.2 1.02 ± 0.10
Hyperia galba (hg) <10 mm Spring BS 99 2 �21.2 ± 0.4 9.9 ± 0.5 3.0 ± 0.1 0.62 ± 0.10<10 mm Winter BS 00 3 �22.4 ± 0.2 10.5 ± 0.2 3.0 ± 0.1 0.90 ± 0.05
Aglantha digitale (ad) 13–21 mm Spring BS 99 6 �21.0 ± 0.4 10.4 ± 0.1 3.2 ± 0.1 0.60 ± 0.11l4–16 mm Winter BS 00 3 �19.7 ± 0.6 9.6 ± 0.4 3.1 ± 0.1 0.27 ± 0.17
Beroe cucumis (bc) 15–45 mm Spring BS 99 6 �20.9 ± 0.5 11.2 ± 0.2 3.4 ± 0.1 0.60 ± 0.1170–80 mm Autumn 882 2 �20.5 ± 0.6 9.0 ± 0.1 2.9 ± 0.1 0.41 ± 0.1670–80 mm Winter BS 00 3 �20.8 ± 0.3 10.3 ± 0.3 3.2 ± 0.1 0.54 ± 0.07
Mertensia ovum (mo) n.m. Spring BS 99 2 �23.0 ± 0.6 9.7 ± 0.4 2.7 ± 0.2 1.04 ± 0.1415–45 mm Autumn 882 2 �22.5 ± 0.6 8.1 ± 0.4 2.3 ± 0.0 0.80 ± 0.1735–40 mm Winter BS 00 3 �23.2 ± 0.8 8.2 ± 0.2 2.2 ± 0.2 1.04 ± 0.18
Clione limacina (cl) 10–40 mm Spring BS 99 7 �22.8 ± 0.6 10.1 ± 0.3 2.8 ± 0.1 1.02 ± 0.14n.m. Summer BS 95, 96 3 �22.3 ± 0.3 8.8 ± 0.4 2.5 ± 0.1 0.80 ± 0.0835 mm Autumn 882 2 �22.8 ± 0.1 8.6 ± 0.3 2.4 ± 0.1 0.90 ± 0.0420–40 mm Winter BS 00 6 �22.5 ± 0.6 9.4 ± 0.2 2.7 ± 0.1 0.91 ± 0.10
72 J.E. Søreide et al. / Progress in Oceanography 71 (2006) 59–87

Table 6 (continued)
Species Size/stage Season Stn./area n d13C d15N TL a
Limacina helicina (lh) 10 mm* Autumn 882 3 �22.6 ± 0.2 8.7 ± 0.2 2.5 ± 0.1 0.91 ± 0.04
Eukrohnia hamata (eh) 15–30 mm Autumn 882, 890 5 �21.5 ± 0.2 8.6 ± 0.2 2.6 ± 0.1 0.61 ± 0.0615–30 mm Winter BS 00 2 �20.3 ± 0.2 9.4 ± 0.0 3.0 ± 0.0 0.36 ± 0.04
Sagitta elegans (se) 30–40 mm Spring BS 99 3 �19.3 ± 0.8 11.9 ± 0.2 3.8 ± 0.1 0.20 ± 0.19n.m. Summer BS 95 2 �20.5 ± 0.0 12.0 ± 0.0 3.7 ± 0.0 0.54 ± 0.0126–30 mm Autumn 890 1 �20.8 12.6 3.8 0.6530–40 mm Winter BS 00 3 �20.8 ± 0.3 12.2 ± 0.1 3.7 ± 0.0 0.62 ± 0.07
n.m., not measured.BS, Barents Sea.
* Shell diameter.
J.E. Søreide et al. / Progress in Oceanography 71 (2006) 59–87 73
3.3.3. Seasonal patterns at species level
The zooplankton species Calanus finmarchicus, C. glacialis, C. hyperboreus changed one or more TLbetween seasons, while the krill Thysanoessa inermis, and the amphipod Themisto abyssorum varied by oneor more TL between size groups (Table 6, Fig. 6). Among ice fauna, only Onisimus nanseni changed markedlyin TL, with a 2· TL difference between small and large specimens in autumn (Table 7, Fig. 6). The other spe-cies changed by TL 6 0.5 among seasons or size groups.
0
2
4
6
8
10
12
14
-26 -25 -24 -23 -22 -21 -20 -19 -18
0
2
4
6
8
10
12
14
-26 -25 -24 -23 -22 -21 -20 -19 -18
0
2
4
6
8
10
12
14
-26 -25 -24 -23 -22 -21 -20 -19 -18
0
2
4
6
8
10
12
14
-26 -25 -24 -23 -22 -21 -20 -19 -18
δ
13C (‰)
15N
(‰
)
S4
S3
S2
S1
P3
P2
P1
Spring Summer
Autumn Winter
S4
S3
S2
S1
P3
P2
P1
S4
S3
S2
S1
P3
P2
P1
S4
S3
S2
S1
P3
P2
P1
cgcf ch
cltli
bs
hg pnad
bcse
moti
tlti
tlicl
ch
on
gw
gw
tl
bs se
ag
gw
on
gw
on
onagog
ogcg
cg
cg
cf
chch
ti
titli
tlieh
bs
seon
pgpg
pn
bccl
ta
lhtlmo gw
mo
tlicl
tl
hgbc
pn ta
adcfch
se
ta
ZooplanktonIce amphipodsPolar cod
Taxa: Carbon source:Pelagic-POM (black) Ice-POM (white) MIX (grey)
Pelagic-POM
Facultative Ice-POMObligate Ice-POM
Sedimented-POM
Particulate organic matter:
ticg
Fig. 6. Seasonal overview of the stable carbon (d13C) and nitrogen (d15N) values (means) of species/taxa (see Tables 6 and 7 forabbreviations and details). Species with a P 0.7, a = 0.4–0.6 and a 6 0.3 were assumed to primarily utilize Pelagic-POM, mixed Pelagic-and Ice-POM (MIX) and Ice-POM source pathways, respectively. Trophic levels for the pelagic (P) and sympagic (S) systems are markedon the opposite y-axis.

Table 7As in Table 6, but for dominating Arctic ice fauna (>1 mm)
Species Size stadium Season Stn./area n d13C d15N TL a
Apherusa glacialis (ag) Juv.–Ad. Summer BS 96 3 �19.9 ± 0.6 5.2 ± 0.3 1.9 ± 0.0 0.10 ± 0.055–13 mm Autumn 882, 890, 1003 7 �20.6 ± 0.3 5.7 ± 0.2 2.0 ± 0.1 0.32 ± 0.07
Gammarus wilkitzkii (gw) Juv. Summer BS 95, 96 11 �20.5 ± 0.2 6.5 ± 0.3 2.1 ± 0.1 0.31 ± 0.04Ad. up to 40 mm Summer BS 95, 96, 01 12 �20.6 ± 0.1 7.5 ± 0.2 2.4 ± 0.1 0.37 ± 0.0310–41 mm Autumn 882, 1003 15 �20.7 ± 0.2 6.2 ± 0.1 2.1 ± 0.0 0.30 ± 0.0635–62 mm Autumn 890 2 �22.0 ± 0.3 8.0 ± 0.8 2.4 ± 0.2 0.73 ± 0.09
Onisimus glacialis (og) 7–8 mm Autumn 890 2 �20.0 ± 0.8 6.2 ± 0.4 2.2 ± 0.0 0.04 ± 0.2010–11 mm Autumn 890 1 �21.1 6.7 2.2 0.4012 mm Autumn 890 1 �19.0 7.6 2.7 0.01
Onisimus nanseni (on) Juv–ad Summer BS 95, 96 2 �21.4 ± 0.8 9.3 ± 0.0 2.8 ± 0.1 0.64 ± 0.206–8 mm Autumn 890 1 �20.0 5.7 2.0 0.1616 mm Autumn 890 1 �21.3 8.2 2.5 0.5818 mm Autumn 890 1 �21.9 12.8 3.7 0.9220–21 mm Autumn 882 2 �19.1 ± 0.9 8.9 ± 0.4 3.0 ± 0.2 0.07 ± 0.19
Boreogadus saida (bs) n.m. Spring B5 99 13 �21.2 ± 0.1 11.8 ± 0.1 3.5 ± 0.0 0.72 ± 0.02n.m. Summer BS 95 4 �20.8 ± 0.2 12.2 ± 0.4 3.7 ± 0.1 0.64 ± 0.0499–112 mm Autumn 882 3 �21.5 ± 0.3 11.3 ± 0.2 3.3 ± 0.0 0.70 ± 0.07
n.m., not measured; BS, Barents Sea; Juv., juvenile; Ad., adult.
H O C T TL > 3.8
0
20
40
60
80
100
0
20
40
60
80
100
α <-0.2 Ice-POM MIX Pelagic-POM α >1.2
Two-source ΔC= 0.6
Two-source ΔC= 0
One-source ΔN= 3.4
One-source ΔN= 3.8
Two-source ΔC= 0.6
Two-source ΔC= 0
TL<1.8
6.5 6.3
6.46.2
7.6
7.0
7.7
8.4 9.1
8.7
9.3
9.9
10.1
9.7
10.9
11.7 11.510.9
12.211.9
12.1
4.94.4
6.26.0
5.6
6.0
7.8
6.9
7.87.3
9.2
8.6
8.7
9.2 12.8 12.84.1 -18.3
-18.7
-19.9
-20.5
-21.1
-21.8
-22.1
-18.5
-19.5
-20.9 -20.9 -22.0
-22.7
-23.4
-25.2 -25.7
Carbon sources Feeding strategies
0
20
40
60
80
100
0
20
40
60
80
100
Ice
amph
ipod
s (%
)Z
oopl
ankt
on (
%)
9.2
Fig. 7. Distributions of zooplankton (n = 203) and ice amphipod samples (n = 62) with regard to feeding strategies (left panels):herbivores (TL = 1.8–2.3), omnivores (TL = 2.4–2.8), carnivores (TL = 2.9–3.3) and top-carnivores (TL = 3.4–3.8), and primary carbonsources (right panels): Pelagic-POM (a = 0.7–1.2), Ice-POM (a = �0.2–0.3), and a mixture (MIX) of them (a = 0.4–0.6). Values werecalculated from this study’s two-source food web model with (DC = 0.6&) and without trophic fractionation of d13C (DC = 0&), and fromthe one-source food web model (Hobson and Welch, 1992) with this study’s d15N trophic fractionation value (DN = 3.4&) and the DN
(3.8&) used in Hobson and Welch (1992). Mean d15N values for each feeding strategy, and mean d13C for each carbon source, are shownabove the bars.
74 J.E. Søreide et al. / Progress in Oceanography 71 (2006) 59–87
Zooplankton that switched between mainly utilizing Pelagic-POM (a P 0.7) and Ice-POM (a 6 0.3) sourcepathways were C. finmarchicus, T. inermis and T. abyssorum. No zooplankton species were found to exclu-sively utilize Ice-POM, but Paraeuchaeta norvegica, Aglantha digitale, Beroe cucumis, Eukrohnia hamata
J.E. Søreide et al. / Progress in Oceanography 71 (2006) 59–87 75
and Sagitta elegans mainly utilized mixed Pelagic-POM and Ice-POM (MIX) source pathways (a = 0.4–0.6).The other zooplankton primarily utilized a Pelagic-POM based carbon source, or occasionally a mixture (e.g.C. glacialis). Ice amphipod species that switched between mainly utilizing Ice- and Pelagic-POM source path-ways were Gammarus wilkitzkii and O. nanseni. The other two, Apherusa glacialis and Onisimus glacialis, uti-lized primarily Ice-POM as carbon source.
The stable isotope composition of juvenile polar cod changed little with seasons. It occupied TL = 3.3–3.7,utilizing primarily Pelagic-POM source pathways (a = 0.7, mean for spring, summer and autumn).
3.4. Food web model comparisons
3.4.1. Zooplankton
Lowest TLs were calculated from the one-source food web model with DN = 3.8&, and highest TLs fromthe two-source food web model assuming no fractionation of 13C (i.e. DC = 0&) (mean TL = 2.4 and 2.9,respectively; n = 203). The one-source food web model with DN = 3.4& and the two-source food web modelwith DC = 0.6& calculated only slightly different TLs (mean TL = 2.6 and 2.7, respectively; n = 203).
The frequency distribution of samples in the different feeding categories (Fig. 7) were significantly differentamong the four models (v2 = 134.68, df = 15, p 6 0.001). The one-source food web models gave higher per-centages of herbivores and omnivores, and lower percentages of carnivores than the two-source food-webmodels. In particular, the one-source food web model with DN = 3.8& calculated high proportions of herbi-vores compared to the two-source food web model both with and without fractionation of 13C (39% vs. 19%and 11%, respectively). The one-source food web model with DN = 3.8& determined ca. 7% of the zooplank-ton samples to have unrealistically low TLs (<1.8), whereas <3% of the zooplankton samples were estimatedto have such low TLs in the other models.
3.4.2. Ice amphipods
The two-source food web model with and without fractionation of 13C, and the one-source food web modelwith DN = 3.8& produced similar TLs (mean TL = 2.3, 2.4 and 2.3, respectively; n = 63) and similar relativeproportions of herbivores (58–66%), omnivores (25–29%) and carnivores (3–9%) (v2 = 9.4, df = 10, p 6 1;Fig. 7). The one-source food web model with DN = 3.4&, however, calculated slightly higher TLs (meanTL = 2.5, n = 63) with lower proportion of herbivores (38%) and higher proportions of omnivores (29%)and carnivores (16%) compared to the other models (v2 = 25.4, df = 15, p 6 0.05). However, the d15N valuesfor herbivores, omnivores and carnivores did not differ significantly among the four models (p P 0.189).
3.4.3. Carbon sources
The proportions of zooplankton primarily utilizing Pelagic-POM, Ice-POM or MIX (Fig. 7) were signifi-cantly different between the two-source food web model applied with and without fractionation of 13C(v2 = 51.4, df = 4, p 6 0.001). The two-source food web model with DC = 0.6& determined Pelagic-POMto be the most important carbon source for zooplankton, whereas the two-source food web model excludingDC (i.e. DC = 0&) determined that Pelagic-POM, Ice-POM and MIX were equally important source pathwaysfor zooplankton.
The proportions of ice amphipods primarily utilizing Pelagic-POM, Ice-POM or MIX (Fig. 7) were alsosignificantly different between the two models (v2 = 17.1, df = 3, p 6 0.001). According to the two-source foodweb model with DC = 0.6&, Ice-POM and MIX were similarly important carbon source pathways for iceamphipods, whereas the two-source food web model excluding DC determined Ice-POM to be the major car-bon source for ice amphipods during summer and autumn.
4. Discussion
Because 13C has not shown a predictable stepwise enrichment pattern similarly to 15N in Arctic marineorganisms, it is generally disregarded as a quantitative tracer for trophic position (i.e. Hobson and Welch,1992; Hobson et al., 1995; Hobson et al., 2002; Iken et al., 2005; Tamelander et al., 2006a). However, thisstudy’s two-source food web model showed that the combined d13C and d15N values gave realistic estimates

76 J.E. Søreide et al. / Progress in Oceanography 71 (2006) 59–87
of trophic levels for zooplankton (TL = 1.8–3.8), comparable to those reported for zooplankton in the abovestudies, in addition to realistic estimates of major carbon sources for zooplankton and ice fauna withouta priori assumptions. For ice amphipods, our two-source food web model calculated generally higher andmore realistic TLs (1.9–3.7) than those previously reported from the Barents Sea (TL = 0.9–2.1) (Hopet al., 2002; Tamelander et al., 2006a).
The importance of ice algae as a carbon source for zooplankton is not well described. The proportion ofPelagic-POM and Ice-POM utilized by zooplankton and ice amphipods in our study did, however, supportthe general understanding that Pelagic-POM is the primary carbon source for zooplankton and Ice-POMfor ice amphipods. However, a significant proportion of Ice-POM source pathways was found in several zoo-plankton species, particularly in carnivorous zooplankton. Conversely, Pelagic-POM was shown to be animportant additional carbon source for ice amphipods, particularly for those with TL > 2.4. Juvenile polarcod (ages 1 and 2) use the sea ice as a feeding site and as a refuge to avoid predators. Their diet, however,consists primarily of pelagic copepods and hyperiid amphipods (Lønne and Gulliksen, 1989; Scott et al.,1999), which was supported in our study by a relatively high a (0.6–0.7) and high TL (3.3–3.7). Their dietmay also include ice amphipods, particularly in multi-year ice (Lønne and Gulliksen, 1989).
One important assumption for the two-source food web model is that carbon and nitrogen move throughthe food web with similar stoichiometry, an assumption which is only acceptable when working with organ-isms with similar C:N (Post, 2002). However, high latitude organisms may experience relatively large differ-ences in C:N among species, developmental stages and seasons due to differences in body lipid content(Lee, 1974; Hagen, 1999; Walve and Larsson, 1999; Matthews and Mazumder, 2005). Lipids have a high turn-over (Attwood and Peterson, 1989; Graeve et al., 1994; Graeve et al., 2004) and are strongly depleted in 13Crelative to other body components (Sato et al., 2002; van Dongen et al., 2002; Sotiropoulos et al., 2004). Inparticular, herbivorous zooplankton accumulate large lipid stores during spring and summer, whereas carni-vores generally store less lipids because they experience less seasonal resource limitation (Falk-Petersen et al.,1990; Clarke and Peck, 1991; Lee et al., 2006). The nitrogen content, however, is more or less independent ofthe lipid content and is relatively stable, constituting 5–10% of dry weight (Omori and Ikeda, 1984; Walve andLarsson, 1999; Postel et al., 2000). The significantly lower d13C values in herbivorous and omnivorous zoo-plankton compared to carnivorous zooplankton in our study may suggest that removal of lipids was not suf-ficient in order to obtain comparable C:N between herbivores and carnivores. However, a similar variabilityand range in the d13C values was found in lipid-rich (e.g. Calanus spp. and Thysanoessa spp.) and relativelylipid-poor zooplankton (e.g. Clione limacina, Eukrohnia hamata, Mertensia ovum). Dietary quality may alsoinfluence the stable isotope fractionation (Adams and Sterner, 2000; Scott et al., 2003; Robbins et al.,2005). Vander Zanden and Rasmussen (2001) found lower DC, and DN, in herbivores than in carnivores,although Post (2002) did not. However, Post (2002) did find larger variability in DC for herbivore-detritivoresthan for carnivores.
The ranges in d13C and d15N values of zooplankton and ice amphipods in our study were within the rangesfound for zooplankton and ice amphipods in the Canadian Arctic (Hobson and Welch, 1992), northern BaffinBay (Hobson et al., 2002), the Northeast Water Polynya of Greenland (Hobson et al., 1995) and in the BarentsSea (Tamelander et al., 2006a). Zooplankton and ice amphipods from Canada Basin had similar d15N values,but much lower d13C values (Iken et al., 2005), which most likely can be explained by lack of lipid removalprior to stable isotope analyses in their study in contrast to the others. The few stable isotope data existingfor zooplankton in winter, from Fram Strait and West-Spitsbergen waters in January (Sasaki et al., 2001; Satoet al., 2002), were comparable to our copepod stable isotope data from the Barents Sea in March.
We removed lipids not only from the animal tissue samples, but also from the POM samples, which makesit difficult to compare our POM d13C values with those of other studies, except for the study by Tamelanderet al. (2006a) from the Barents Sea in July, who also analyzed lipid-extracted POM samples. Algae may con-tain 5–20% lipids, depending on the algal growth stage (Siegenthaler and Murata, 1998). POM may also con-tain a significant proportion of animal remains and/or micro-heterotrophs, which additionally influence thetotal POM lipid content. For instance Hobson et al. (1995) found a relatively large gap between the d13C val-ues of non-lipid-extracted POM samples (< � 27.7&) and lipid-extracted zooplankton samples (> � 24.2&)from the Northeast Water Polynya of Greenland, which may indicate presence of 13C-depleted terrestrialorganic matter in the POM samples (Goni et al., 2000) or d13C-depleted POM due to presence of lipids.
J.E. Søreide et al. / Progress in Oceanography 71 (2006) 59–87 77
However, the d15N values in our lipid-extracted POM samples should be comparable to the d15N values innon-lipid-extracted POM samples, since the N-content is largely independent of the lipid content.
In our study, POM taxonomic data were important for interpreting POM d15N and d13C values. Althoughqualitative POM community analysis may have led to under- or overestimates of some of the POM taxonomicgroups in Table 2, the major community pattern in these POM samples were most likely identified. A differentsampling technique for Pelagic-POM was used at Stn. 1003 in autumn (pump) than at the other stations (net).Sampling from one depth (�6 m) at Stn. 1003, compared to the integrated upper 30 m at the other stations,may have given less representative d13C and d15N values for Pelagic-POM available for zooplankton at Stn.882 compared to the rest. However, this had little impact on the overall interpretation of the results, since thePelagic-POM values from Stn. 1003 were not used for estimating food web baselines or DC and DN.
4.1. Food web baseline
It is a challenge to find appropriate food web baselines (Post, 2002). Collecting ‘‘pure’’ samples of primaryproducers from field habitats is difficult. However, the Arctic MIZ with distinct ice edge spring bloomspresents good opportunities to obtain relatively pure primary producer samples, since these ice edge bloomsgenerally have high algal biomass and little detritus (Rysgaard et al., 1999). As the algal bloom progresses, thealgal degradation, detritus and microbial activity generally increase (Gradinger et al., 1992; Nielsen andHansen, 1999; McMinn and Hegseth, 2004). Some studies have used primary consumers instead of primaryproducers as a baseline, since primary consumers are easier to sample, and may have less variable stableisotope composition than POM (Hobson et al., 2002; Hop et al., 2002; Post, 2002; Jennings and Warr,2003). For instance, Hobson et al. (2002) use the predominantly herbivorous copepod Calanus hyperboreus
as baseline in the North Water Polynya food web (d15N = 7.7&, which is similar to our spring Calanus
spp. values), assuming it to occupy TL = 2. This approach works well as long as the d15N values in theassumed primary consumers are low. However, low d15N values are not always found in C. hyperboreus orthe two other Calanus species C. finmarchicus and C. glacialis (Hobson et al., 2002; Tamelander et al.,2006a; our study).
4.1.1. d13C composition in POM
One important condition for using the two-source food web model is a significant difference in the d13C val-ues of the two available food sources (Post, 2002). In our study, obligate Ice-POM, dominated by Nitzschia
frigida and Melosira arctica, was significantly more enriched in 13C (�21.0& to �19.0&) than Pelagic-POM(�24.6& to �23.6&). A similar difference in the 13C enrichment patterns between Pelagic-POM and Ice-POM has been found previously in the Barents Sea (Tamelander et al., 2006a) and in other regions of the Arctic(Hobson et al., 1995; Cooper et al., 2002), as well as the Antarctic (Fischer, 1991; Gibson et al., 1999). However,Ice-POM dominated by pelagic-related diatoms such as Fragilariopsis oceanica and Chaetoceros spp. (i.e. fac-ultative Ice-POM) were similarly enriched in 13C as Pelagic-POM. Ice-POM collected from young and thin icein the North Water Polynya (Canada), dominated by Fragilariopsis sp., also had similar d13C values as Pelagic-POM (Tremblay et al., 2006). Similar d13C values for Pelagic-POM and Ice-POM have also been found in theCanada Basin, although the taxonomic composition of POM was not presented (Iken et al., 2005).
It is hypothesized that ice algae are more enriched in 13C than open water algae, because ice algae have athicker boundary layer and thus grow in a more CO2-limited environment than pelagic algae (France, 1995; Gib-son et al., 1999; Kennedy et al., 2002). However, growth rate, irradiance and type of carboxylating enzymes alsoinfluence the d13C composition in algae (Thompson and Calvert, 1994; Fry, 1996). Ice algae growing at extre-mely low light intensities may use bicarbonate as substrate for carbon fixation, bicarbonate being more enrichedin 13C than CO2 (Thompson and Calvert, 1994; Arrigo, 2003). Below thicker sea ice (0.8–1.5 m), the algal pop-ulations are typically dominated by the obligate ice diatoms N. frigida and M. arctica, which are adapted to lowirradiance (Horner, 1985; Syvertsen, 1991; Hegseth, 1992; Michel et al., 2002). Pelagic-related algae such as Tha-
lassiosira spp. and Chaetoceros spp. are, if present, mostly found below thin and young ice (<0.8 m) (Syvertsen,1991; Hegseth, 1992). Pelagic algae in an exponential growth phase, trapped in a shallow melt water layer, mayalso temporarily become enriched in 13C because of local depletion of CO2 and decreasing discriminationagainst 13C with increasing growth rate (Fischer, 1991; Fry, 1996). However, it is unknown whether pelagic algae

78 J.E. Søreide et al. / Progress in Oceanography 71 (2006) 59–87
can be as enriched in 13C as ice algae, since few comprehensive stable isotope studies of phytoplankton and icealgae exist from the Arctic (Schubert and Calvert, 2001; Tremblay et al., 2006).
It is difficult to assess whether the d13C baseline values determined for Pelagic-POM and Ice-POM in ourstudy are representative food web baselines in a pan-Arctic perspective, since only Tamelander et al. (2006a)and our study have analyzed the d13C composition of lipid-extracted POM. However, the d13C baseline valuedetermined for Pelagic-POM seems appropriate for the geographical area and time period that both we andTamelander et al. (2006a) studied, since Pelagic-POM from the Barents Sea, NW Spitsbergen and East Green-land, near the Greenland Sea, were similarly enriched in 13C.
Tamelander et al. (2006a) found similarly large variability in Ice-POM d13C values in the Barents Sea inJuly as we did. They did not analyze the POM community composition, but the heavily enriched d13C valuesin Ice-POM (�12.6& to �17.3&) correspond to the enrichment we found in Ice-POM dominated by M. arc-
tica in moderate to poor condition embedded in high quantities of mucilage-bound EPS, and the relativelydepleted Ice-POM d13C values (�20.4& to �21.7&) correspond to the d13C values of Ice-POM we foundin autumn (Stn. 882), when there was greater representation of facultative species. Tremblay et al. (2006) alsofound similarly large variability in d13C values of Ice-POM from the North Water Polynya, Canada, but theyexplained the increased enrichment in 13C by increased ice thickness. In our study, enriched (�20.0&), mod-erately enriched (�17.1&) and highly enriched (�12.2&) d13C values of M. arctica assemblages were foundbelow ice of similar thickness (�1 m). A qualitative microscopic investigation of the M. arctica-dominated Ice-POM samples from July 2001 did not reveal microfauna in notable concentrations, although we cannot ruleout high numbers of bacteria and nanoflagellates. The major difference was that the highly 13C-enriched sam-ples had a more ‘‘lumpy’’ consistency and brownish appearance, and consisted of algal cells in generallypoorer condition than the moderate and less 13C- enriched samples. Several diatom species can secrete highquantities of mucilaginous EPS, which may play a crucial role in the formation of a thin algal sheet andthe attachment of the sheet to the under-ice surface (McConville and Wetherbee, 1983; McConville, 1985).Diatoms have also been shown to release large amounts of polysaccharides when degrading (Cigleneckiet al., 2003), and ice algal assemblages in older and thicker ice generally have higher amounts of EPS (Syvert-sen, 1991). The stable carbon isotope compositions of individual monosaccharides are generally enriched in13C by 0–9& compared to the total algal cell material (van Dongen et al., 2002), which may explain the muchheavier d13C in the EPS-rich M. arctica assemblages. In our study, the d13C values of zooplankton and ice-fauna indicated that these EPS-rich M. arctica communities were of minor importance as food source. Theanimals may feed on these EPS-rich algal assemblages, but McConville et al. (1986) found that under-ice her-bivores were unable to digest the complex polysaccharides/proteglycans (i.e. EPS) that ice diatoms secrete.
Sedimented-POM (20–35 m depth) was significantly depleted in 13C compared to Pelagic-POM and Ice-POM in autumn. In July in the Barents Sea, Tamelander et al. (2006a) found that Sedimented-POM was0.9–5.6& more enriched in 13C than Pelagic-POM, but they also collected 13C-enriched Ice-POM (�21.7&
to �12.6&) at these stations. In our study, no ice algae were visible by direct observation under the ice wherethe sediment traps were placed. Sedimented-POM tends to consist of faecal pellets, sedimented algal cells, anddetritus (e.g. Andreassen et al., 1996; Olli et al., 2002). A high proportion of faecal pellets in the Sedimented-POM samples could have resulted in depleted d13C values compared to Pelagic-POM, since copepod faecal pel-lets are depleted in 13C relative to the algal food ingested (Klein Breteler et al., 2002; Tamelander et al., 2006b).Zooplankton (e.g. C. hyperboreus and C. finmarchicus), which occasionally had a > 1.0, may have fed on faecalpellets since the retention potential may be 50–70% of the produced faecal pellets in the Barents Sea (WexelsRiser et al., 2002). Detritus may be enriched or depleted in 13C, which potentially makes the d13C values in detri-tus-feeding organisms highly variable (Post, 2002). In the Arctic, a significant input of terrestrial POM, depletedin 13C, can be incorporated in sea ice and transported offshore (Schubert and Calvert, 2001; Bauerfeind et al.,2005). Carbon sources other than phytoplankton and ice algae may therefore exist offshore in the Arctic MIZ.However, the phytoplanktonic and ice algae carbon sources explained quite well the variability in organismald13C composition in our study, suggesting that other potential carbon sources were of minor importance.
4.1.2. d15N composition in POM
Pelagic-POM d15N baseline values used in other Arctic marine food web studies are generally 4–5.4&
(Hobson and Welch, 1992; Hobson et al., 1995; Iken et al., 2005; Tamelander et al., 2006a), which is similar
J.E. Søreide et al. / Progress in Oceanography 71 (2006) 59–87 79
to the range found in our study. This suggests a relatively uniform d15N value for Pelagic-POM in the Arctic.Hobson et al. (2002) and Tamelander et al. (2006a) found relatively high Pelagic-POM d15N values in theNorth Water Polynya and the Barents Sea (6.8& and 8.3&, respectively), but excluded these values frombaseline estimates for their one-source food web models. Hobson et al. (2002) chose to use the slightly moreenriched C. hyperboreus (d15N = 7.7&, TL = 2.0) as food web baseline, whereas Tamelander et al. (2006a)chose to treat the high d15N values as outliers. In our study, Pelagic-POM from the East Greenland shelfin October was more enriched in 15N than Pelagic-POM from the Barents Sea in May and from waters northof Svalbard in September. Different water masses in East Greenland vs. Barents Sea/Svalbard area may causedifferences in the Pelagic-POM 15N values, but it is more likely that differences in seasons, ice cover and thealgal bloom stages led to the enriched Pelagic-POM values on the East Greenland shelf. The station on theEast Greenland shelf in October had only been partly covered by sea ice since July, and subsurface chloro-phyll-a maxima were recorded by Richardson et al. (2005) in June and August the same year relatively closeto our Stn. 890. In comparison, the stations in the Barents Sea in May and north of Svalbard in September hadbeen covered by very close drift ice (7–9/10) until 1–3 weeks before sampling, which also explains the findingsof ice diatoms at these stations. In the North Water Polynya, Canada, Tremblay et al. (2006) found that Pela-gic-POM was most depleted in 15N (4–5&) at the onset of the bloom, and Bauerfeind et al. (2005) found thatd15N values of sedimented matter on the East Greenland Shelf gradually increased from summer (3.4&) towinter (7.2&). Pelagic-POM from detritus-rich waters west of Spitsbergen in January was enriched in 15N(6.7 ± 1.6&) similarly to sedimented matter from the East Greenland shelf in winter (Sasaki et al., 2001). Bac-terial degradation of algae and increased microbial activity can increase both the d13C and d15N values inPOM (Owens, 1985; Rolff, 2000). Nitzschia-dominated Ice-POM was more 15N-enriched in autumn than inspring, which can be explained by less viable cells late in the season, as well as by less dominance of ice diatomsin obligate Ice-POM in autumn than in spring (87% vs. 97%). Ice-POM consisting of M. arctica in moderate topoor condition was significantly more enriched in 15N compared to healthy M. arctica communities.
During spring and summer, obligate Ice-POM had surprisingly low d15N values (0.9–2.4&). Such low d15Nvalues have not previously been recorded to our knowledge in Arctic Ice-POM, except that Iken et al. (2005)reported d15N values as low as 2.3& in one Ice-POM sample from the Canada Basin. In the Antarctic, how-ever, similarly low d15N values in Ice-POM (1.7–2.1&) have been found during the Austral winter by Frazer(1996), who explained the depleted d15N values by low light intensities, referring to Wada and Hattori (1991).They found depleted d15N values in diatoms cultured under low-light intensities compared to those grownunder high light intensities.
The d15N composition of marine algae depends mainly on the source of nitrogen used, i.e. the isotopicallyheavy nitrate ðNO�3 Þ or the isotopically lighter ammonium ðNHþ4 Þ (Checkley and Miller, 1989; Waser et al.,1999). POM with low d15N values has been found in oligotrophic waters rich in zooplankton-excreted ammo-nium (Checkley and Miller, 1989). High concentrations of ammonium are frequently measured in sea ice, par-ticularly when covered by dense, actively growing algae (Demers et al., 1989; Mock and Gradinger, 1999;Thomas and Papadimitriou, 2003). Simultaneous uptake of NO�3 and NHþ4 in ice algae has been reported(Demers et al., 1989), although high levels of ammonium can inhibit nitrate assimilation by algae (Thompsonet al., 1989; Flynn, 1991). Sea ice may be one of the few environments where ammonium-dominated nitrogenmetabolism prevails (Thomas and Papadimitriou, 2003). In the Arctic, Ice-POM is generally found to be sim-ilarly or more enriched in 15N than Pelagic-POM (Hobson and Welch, 1992; Hobson et al., 1995; Hobsonet al., 2002; Tamelander et al., 2006a; Tremblay et al., 2006). The low d15N values of Ice-POM in our study,however, were supported by lower d15N values in ice amphipods than in zooplankton. Others have also foundsimilarly low d15N values in Arctic ice amphipods (Iken et al., 2005; Tamelander et al., 2006a), and as a resultthey estimated unrealistically low trophic levels for ice amphipods (e.g. TL = 0.9–2.0; Tamelander et al.,2006a) compared to our study (TL = 1.9–3.7).
4.2. Trophic enrichment in 13C and 15N
Our DC (0.6&) and DN (3.4&) estimates are comparable to previously published DC and DN estimates (DeN-iro and Epstein, 1981; Minagawa and Wada, 1984; Peterson and Fry, 1987; Vander Zanden and Rasmussen,2001; Post, 2002). However, more knowledge about tissue turnover times and the underlying physiological and

80 J.E. Søreide et al. / Progress in Oceanography 71 (2006) 59–87
biochemical mechanisms that account for trophic increases in stable isotope values of zooplankton and iceamphipods are needed for validation of these fractionation estimates. Nevertheless, the DN showed low vari-ability and was consistent across comparisons in spring (Fig. 4). The trophic enrichment factor of 3.4& is con-sidered to be a robust and valid approximation for trophic fractionation of 15N (Post, 2002). However, it isimportant to keep in mind that occasionally any single trophic transfer may range between DN = �2–5& (Post,2002). We determined DC to be similar for the pelagic and sympagic systems, despite a possibly lower DC in thesympagic system. Fractionations of 13C and 15N are relatively similar in a wide range of animals (Ponsard andAverbuch, 1999; Post, 2002). The small ice amphipod used for estimating DN and DC for the sympagic system,A. glacialis, was sampled relatively late in the productive season for ice algae (i.e. summer), which may explainthe relatively large variability in d13C values of this species. In autumn, A. glacialis was more depleted in 13Cthan in summer, suggesting that Pelagic-POM source pathways increased in importance toward the end ofthe productive season. Had we used DC = 0.1& for the sympagic system, a similar TL would have been esti-mated as when using DC = 0.6&, although a slightly higher proportion of Ice-POM source pathway wouldhave been calculated for the ice fauna (a = 0.2 vs. 0.3).
Small DC (<0–1&) generally has little effect on calculations of TL, so long as the differences in d15N valuesare small and the differences in d13C values are large between the two available food sources (Post, 2002).However, in our study the difference in d15N was relatively large (i.e. 2.2&) and the difference in d13C small(i.e. 4&) between Pelagic-POM and Ice-POM compared to the isotopic differences found for the two foodsources in the study of Post (2002) (<1.5& and >6&, respectively). It was therefore important in our studyto include trophic fractionation of 13C in our two-source food web model, particularly for calculating realistica. The high d13C values in carnivorous compared to herbivorous and omnivorous zooplankton lead to a sig-nificantly lower proportion of Pelagic-POM source pathway in carnivorous compared to herbivorous andomnivorous zooplankton. This may indicate that our DC was underestimated, which would suggest a lowerd13C baseline value for Pelagic-POM, or as previously mentioned that differences in dietary quality or C:N,as well as physiological status, may influence DC.
4.3. Seasonal patterns in trophic structures and sympagic–pelagic coupling
4.3.1. Zooplankton
Few of the macrozooplankton (>1 mm) species we studied are considered to be predominantly herbivorous,except for the copepods Calanus spp. (Kattner and Hagen, 1995; Scott et al., 2002) and the krill Thysanoessa
inermis (Falk-Petersen et al., 2000b). The other macrozooplankton species are considered to be omnivorous orpredominantly carnivorous. We expected to find the largest shift in feeding strategies between the vegetativeand non-vegetative seasons (Hopkins and Torres, 1989; Sasaki et al., 2001; Werner and Auel, 2005), but nopronounced seasonality in TL and carbon sources was found for bulk zooplankton in our study. However,the majority of the zooplankton species were omnivorous-carnivorous, and they generally experience less sea-sonal food limitation than herbivores (Clarke and Peck, 1991).
In our study, early season sampling was performed in winter (March) with very low phytoplankton and icealgal biomass, although we cannot rule out that ice algae were present further inside the MIZ (e.g. Hegseth,1998). In May, the phytoplankton biomass was high, but relatively little ice algae was present since the ice meltwas advanced (Engelsen et al., 2002; Søreide et al., 2003). Periods with high ice algal biomass and very lowphytoplankton biomass were not investigated in our study. No herbivorous zooplankter was found by usto graze extensively on Ice-POM in March or mid-May, but March may have been too early and mid-Maytoo late to detect possible grazing on Ice-POM. At the time of sampling in May the phytoplankton bloomwas advanced, suggesting that a relatively high phytoplankton biomass had been available for 2–3 weeks(Engelsen et al., 2002). Intensive feeding and growth in spring may have led to rapid tissue turnover and fullincorporation of the phytoplankton stable isotope signature in Calanus spp. at the time of sampling (e.g. KleinBreteler et al., 2002). Carnivorous zooplankton, however, will incorporate the POM signatures later than her-bivores due to time lags (Falk-Petersen et al., 1990). The chaetognath, Sagitta elegans, which is strictly carniv-orous (TL = 3.7–3.8), had particularly enriched d13C values (�19.3&) and low a (0.2) in May. It is known tofeed extensively on nauplii, and small copepods such as early stages of Calanus, Pseudocalanus and Oithona,in addition to appendicularians in the Barents Sea (Falkenhaug, 1991). In early spring, particularly

J.E. Søreide et al. / Progress in Oceanography 71 (2006) 59–87 81
Pseudocalanus can graze extensively on ice diatoms (Runge and Ingram, 1988; Runge and Ingram, 1991),which may explain the dominant Ice-POM source pathway in S. elegans in spring compared to the other sea-sons. Few stable isotope studies exist for Pseudocalanus in the Arctic, but Iken et al. (2005) categorized Pseud-
ocalanus from the Canada Basin as herbivorous sympagic fauna due to its stable isotope signature. Othercarnivores, such as Paraeuchaeta norvegica, Thysanoessa longicaudata and Hyperia galba, were also markedlymore enriched in 13C and had correspondingly lower a (0.5–0.6) in spring than in autumn and winter.
In spring and summer, the stable isotope signatures in zooplankton generally suggested feeding strategies asexpected, except for the carnivorous diet of large specimens (>22 mm) of T. inermis. In autumn, latitudinaldifferences in feeding strategies were found between bloom to late-bloom waters near the multi-year ice packto the north (82�N) and late- to post-bloom waters farther south (76�N). In the north (Stn. 882), zooplanktonwere mainly herbivorous-omnivorous (mean TL = 2.4), whereas in the south (Stn. 890) they were mainlyomnivorous-carnivorous (mean TL = 2.7). In winter, only carnivorous-omnivorous zooplankton (meanTL = 2.9) were found, except for the surprisingly low TL (2.3) of the ctenophore Mertensia ovum. As previ-ously mentioned, ice algae could have been growing farther inside the MIZ in March, out of the reach of theswells, but the a calculated for M. ovum suggests an exclusively Pelagic-POM source pathway. However, thephytoplankton biomass in March was very low (Søreide et al., 2003), and M. ovum is known to be a carnivoremainly feeding on Calanus spp. (Swanberg and Bamstedt, 1991; Falk-Petersen et al., 2002). In spring, M. ovum
occupied a higher TL (2.7), but in autumn it had the same depleted stable isotope values as in winter. Since M.
ovum can metabolize its own tissue and actually shrink during times of food shortage (Hoeger, 1983), it is notunlikely that the isotopic signal of the autumn diet was reflected in M. ovum in winter. In the North WaterPolynya, during spring-summer, similarly low TL (2.3) was estimated for M. ovum, although it had slightlyhigher d15N (8.9&) and much higher d13C (�19.0&) values (Hobson et al., 2002).
Zooplankton may reduce or cease feeding in autumn and go into a hibernating stage utilizing stored bodyenergy to survive the dark and long unproductive winter (Hagen, 1999; Hagen and Auel, 2001; Lee et al.,2006). Polar zooplankton commonly utilize stored lipid reserves for overwintering and spawning the next spring,although some euphausiids and gelatinous zooplankton may also rely on reducing their body mass and volume(Falk-Petersen, 1985; Clarke and Peck, 1991). Fasting animals may show a progressive increase in d13C andd15N value, since mainly the lighter isotopes are used in catabolism, and during starvation these are not replaced(Hobson et al., 1993; Gannes et al., 1997; Adams and Sterner, 2000). However, insignificant changes in the d13Cand d15N values of starved calanoid copepods (Tamelander et al., 2006b), mysids (Gorokhova and Hansson,1999) and krill (Frazer et al., 1997), suggest that the isotopic composition of some invertebrates is unaffectedby the metabolic processes during prolonged periods of starvation. The TLs and a estimated for organisms col-lected during the unproductive season, particularly in winter, should therefore be interpreted with caution.
Parts of the Calanus population may not descend to depth in autumn to hibernate, but remain in the surfacewaters during winter (Sato et al., 2002). These surface-dwelling copepods may not have accumulated largeenough lipid stores for successful overwintering in diapause, and thus continue to feed (Pasternak et al.,2001). Sasaki et al. (2001) conclude from stable isotope studies of Calanus spp. and Pelagic-POM from theupper 300 m, West of Svalbard in January, that C. glacialis occasionally feeds on POM (e.g. detritus) in win-ter, whereas C. finmarchicus utilizes lipid reserves. In March (0–300 m), we found elevated d15N values in allthree Calanus species, similarly high as those Sato et al. (2002) measured in C. glacialis in January, suggestingTL = 2.7–3.1. Omnivory in Calanus spp. is found to be inversely related to the availability of diatoms (Stevenset al., 2004). In response to phytoplankton shortages, copepods may switch to alternate prey including nauplii(Landry, 1981), ciliates (Atkinson, 1996) and heterotrophic dinoflagellates (Levinsen et al., 2000). In autumn,C. glacialis and C. hyperboreus were predominantly herbivorous in bloom/late-blooming waters and omniv-orous in late- to post-blooming waters. Calanus finmarchicus, however, was predominantly herbivorousregardless of the algal bloom situation, which may indicate that it had stopped feeding and started to descendat the time of sampling in autumn. Even though similarly high d15N values were found in the three Calanus
species in March, C. finmarchicus had significantly lower d13C values (a = 0.35) than C. glacialis andC. hyperboreus (a = 0.73 and 0.70, respectively), which may suggest species-specific differences in carbonsources and/or metabolic processes. Of the three Calanus species, only C. finmarchicus has been found inthe ice-water interface (0–5 m) in the Barents Sea in March (Werner, 2005). High concentrations of particulateorganic matter (POC, PON) were found in this 0–5 m layer below sea ice in March, POM most likely

82 J.E. Søreide et al. / Progress in Oceanography 71 (2006) 59–87
dominated by detritus given its high C:N ratios and very low concentrations of algal pigments (Werner, 2005).If POM released from the sea ice in late winter is similarly enriched in 13C as is obligate Ice-POM, this couldexplain the enriched d13C values and low a of C. finmarchicus and other zooplankton in March.
Runge and Ingram (1988, 1991) concluded from gut analyses that ice algae were a regular and principal foodsource for C. glacialis in Hudson Bay, Canada. In our study, substantial grazing on Ice-POM was only indicatedfor C. glacialis sampled in autumn, far to the north (82�N) in the multi-year ice pack (i.e. TL = 2.3, a = 0.5). Atthis location (Stn. 882), ice diatoms were commonly found on the underside of the ice, and a substantial propor-tion of the suspended algal cells were ice-associated diatoms, with the small Attheya septentrionalis being par-ticularly abundant. However, C. hyperboreus sampled at Stn. 882 did not seem to graze on ice diatoms(TL = 2.3, a = 1.2). It most likely grazed on pelagic algae or had stopped feeding.
Differences in body size will naturally lead to differences in feeding strategies, even in the same species(Omori and Ikeda, 1984). Since some of the macrozooplankton species can grow to a relatively large size, theirfeeding strategies can change markedly from juvenile to adult. In our study, medium-sized specimens (10–19 mm) of T. inermis were predominantly herbivorous or omnivorous–herbivorous during spring and autumn,whereas larger T. inermis (>22 mm) sampled at the same time were carnivorous (TL = 3–3.2). The hyperiidamphipod Themisto abyssorum also showed large differences in feeding strategies with size. Small specimensof Themisto libellula were not analyzed in our study, but Tamelander et al. (2006a) found significantly lowerd15N values in small than in large T. libellula, indicating a shift from herbivory to omnivory–carnivory withincreasing body size.
The ctenophore Beroe cucumis may prey on M. ovum (Falk-Petersen et al., 2002), but our stable isotopedata indicated that M. ovum was not an important prey. Beroe cucumis was >2& more enriched in 13Cand only 0.9–2.1& more enriched in 15N than M. ovum. The pteropod Clione limacina is known to feed exclu-sively on Limacina helicina (Conover and Lalli, 1974; Lalli and Gilmer, 1989). However, from the one location(Stn. 882) where we sampled both C. limacina and L. helicina, similarly enriched d13C and d15N values werefound for these two species. Fatty acid analyses have also not revealed a clear predator–prey relationshipbetween these two species (Falk-Petersen et al., 2001; Boer et al., 2005).
4.3.2. Ice amphipodsGut content analyses (Poltermann, 2001), feeding experiments (Werner, 1997) and fatty acid analyses (Scott
et al., 1999; Scott et al., 2001; Werner and Auel, 2005) support the feeding strategies we determined forApherusa glacialis, Onisimus nanseni, Onisimus glacialis and Gammarus wilkitzkii in this study. In general,herbivorous ice amphipods had lower a than omnivores and particularly carnivores, suggesting increasedimportance of Pelagic-POM source pathways with increasing TL, although exceptions were found. Wedetected no significant switch in feeding strategy for A. glacialis from summer to autumn, although a slightincrease in a from summer to autumn indicated increased grazing on Pelagic-POM later in the season. Lipidand fatty acid analyses confirm that A. glacialis is strictly herbivorous, and that it overwinters on internal lipidreserves stored during the productive season (Werner and Auel, 2005). Small specimens of O. glacialis
(<9 mm) also primarily grazed on Ice-POM, but its TL increased with increasing body size. Of the four iceamphipod species, O. nanseni seemed to be the most opportunistic feeder, which has been confirmed by others(Werner and Auel, 2005). It switched from grazing on Ice-POM to carnivory in the sympagic system, and evento ‘‘top’’ predator status in the pelagic system. Besides O. nanseni, G. wilkitzkii could assimilate substantialenergy from the pelagic system (a = 0.7). Small specimens of G. wilkitzkii generally had lower TLs than thelarger ones (2.1 vs. 2.4, respectively), but even relatively large G. wilkitzkii could be predominantly herbivo-rous (TL = 2.1), which resulted in low overall TL for G. wilkitzkii and relatively low a (0.3–0.4). Fatty acidanalyses confirm that Ice-POM is a major diet component in G. wilkitzkii in summer and autumn (Scottet al., 2001; Werner and Auel, 2005), but winter studies show that G. wilkitzkii switches to feed mainly onavailable ice fauna and planktonic copepods when ice algae are scarce (Werner and Auel, 2005).
5. Conclusions
Zooplankton and ice fauna had a similar TL range, but macrozooplankton were mainly omnivorous–car-nivorous, whereas ice fauna were herbivorous–omnivorous. During all seasons, zooplankton primarily utilized

J.E. Søreide et al. / Progress in Oceanography 71 (2006) 59–87 83
open water food sources, whereas ice amphipods mainly utilized ice-source pathways, although ice fauna withTL > 3 primarily fed on pelagic organisms.
The two-source food web model of this study gave realistic TL and a estimates for larger zooplankton andice fauna species in the European Arctic MIZ, demonstrating the advantage of combining d13C and d15N val-ues in Arctic marine food web models. However, large stable isotope variability in Pelagic-POM and, partic-ularly, Ice-POM was found, which showed that to determine representative baselines for primary producers itis essential to know the POM community composition as well as the algal cell condition and the stage of thealgal bloom. The period of the spring bloom, characterized by high algal biomass and little detritus, was foundto be the most appropriate time for determining food web baselines and trophic enrichment factors for theArctic MIZ. The tissue turnover times and the underlying physiological and biochemical mechanisms thataccount for trophic increases in d13C and d15N values of zooplankton and ice amphipods are poorly known.A better understanding of these processes is important in order to fully exploit stable isotope techniques fordetermining food web structures.
Acknowledgements
We warmly acknowledge J. Wiktor for algal community data, K. Olsson for additional POM samples, T.Robertsen for sea ice satellite data, and the captains and crews of RV Lance, RV Jan Mayen and icebreakerOden for ship logistics and assistance in the field. We also thank P.E. Renaud for comments on an earlier ver-sion of the manuscript and K. Borga for the map. This study was supported by the partners of the Barents SeaProduction Licenses 182, 225, 228, and by the Norwegian Research Council Norklima Programme (ProjectNo. 150356-S30 to M.L.C.).
References
Adams, T.S., Sterner, R.W., 2000. The effect of dietary nitrogen content on trophic level 15N enrichment. Limnol. Oceanogr. 45,601–607.
Andreassen, I., Nothig, E.-M., Wassmann, P., 1996. Vertical particle flux on the shelf of northern Spitsbergen, Norway. Mar. Ecol. Prog.Ser. 137, 215–228.
Arrigo, K.R., 2003. Primary production in sea ice. In: Thomas, D.N., Dieckmann, G.S. (Eds.), Sea Ice – An Introduction to its Physics,Chemistry, Biology and Geology. Blackwells Publishing, Oxford, pp. 143–183.
Atkinson, A., 1996. Subantarctic copepods in an oceanic, low chlorophyll environment: ciliate predation, food selectivity and impact onprey populations. Mar. Ecol. Prog. Ser. 130, 85–96.
Attwood, C.G., Peterson, W.T., 1989. Reduction in fecundity and lipids of the copepod Calanus australis (Brodskii) by strongly pulsedupwelling. J. Exp. Mar. Biol. Ecol. 129, 121–131.
Bauerfeind, E., Leipe, T., Ramseier, R.O., 2005. Sedimentation at the permanently ice-covered Greenland continental shelf (74�57.70N/12�58.70W): significance of biogenic and lithogenic particles in particulate matter flux. J. Mar. Syst. 56, 151–166.
Boer, M., Gannefors, C., Kattner, G., Graeve, M., Hop, H., Falk-Petersen, S., 2005. The Arctic pteropod Clione limacina: seasonal lipiddynamics and life-strategy. Mar. Biol. 147, 707–717.
Booth, B.C., Smith, W.O., 1997. Autotrophic flagellates and diatoms in the Northeast Water Polynya, Greenland: summer 1993. J. Mar.Syst. 10, 241–261.
Booth, B.C., Larouche, P., Belanger, S., Klein, B., Amiel, D., Mei, Z.-P., 2002. Dynamics of Chaetoceros socialis blooms in the NorthWater. Deep-Sea Res. II. 49, 5003–5025.
Bradstreet, M.S.W., Cross, W.E., 1982. Trophic relationships at high Arctic ice edges. Arctic 35, 1–12.Checkley, D.M., Miller, C.A., 1989. Nitrogen isotope fractionation by oceanic zooplankton. Deep-Sea Res. 36, 1449–1456.Ciglenecki, I., Plavsic, V., Vojvodic, V., Cosovic, B., Pepi, M., Baldi, F., 2003. Mucopolysaccharide transformation by sulphide in diatom
cultures and natural mucilage. Mar. Ecol. Prog. Ser. 263, 17–27.Clarke, A., Peck, L.S., 1991. The physiology of polar marine zooplankton. Polar Res. 10, 355–369.Conover, R.J., Lalli, C.M., 1974. Feeding and growth in Clione limacina (Pripps), a pteropod mollusc. II. Assimilation, metabolism and
growth efficiency. J. Exp. Mar. Biol. Ecol. 16, 131–154.Conover, R.J., Herman, A.W., Prinsenberg, S.J., Harris, L.R., 1986. Distribution and feeding by the copepod Pseudocalanus under fast ice
during the Arctic spring. Science 232, 1245–1247.Cooper, L.W., Grebmeier, J.M., Larsen, I.N., Egorov, V.G., Theodorakis, C., Kelly, H.P., Lovvorn, J.R., 2002. Seasonal variation in
sedimentation of organic materials in the St. Lawrence Island Polynya region, Bering Sea. Mar. Ecol. Prog. Ser. 226, 13–26.Dahl, T.M., Falk-Petersen, S., Gabrielsen, G.W., Sargent, J.R., Hop, H., Millar, R.-M., 2003. Lipids and stable isotopes in common eider,
black-legged kittiwake and northern fulmar: a trophic study from an Arctic fjord. Mar. Ecol. Prog. Ser. 256, 257–269.Dayton, P.K., Mordida, B.J., Bacon, F., 1994. Polar marine communities. Am. Zool. 34, 90–99.

84 J.E. Søreide et al. / Progress in Oceanography 71 (2006) 59–87
Demers, S., Legendre, L., Maestrini, S.Y., Rochet, M., Ingram, R.G., 1989. Nitrogenous nutrition of sea-ice microalgae. Polar Biol. 9,377–383.
DeNiro, M.J., Epstein, S., 1977. A mechanism of carbon isotope fractionation associated with lipid synthesis. Science 197, 261–263.DeNiro, M.J., Epstein, S., 1981. Influence of diet on the distribution of nitrogen in animals. Geochim. Cosmochim. Acta 45, 341–351.Engelsen, O., Hegseth, E.N., Hop, H., Hansen, E., Falk-Petersen, S., 2002. Spatial variability of chlorophyll-a in the marginal ice zone of
the Barents Sea, with relation to sea ice and oceanographic conditions. J. Mar. Syst. 35, 79–97.Falkenhaug, T., 1991. Prey composition and feeding rate of Sagitta elegans var arctica (chaetognatha) in the Barents Sea in early summer.
Polar Res. 10, 487–506.Falk-Petersen, S., 1985. Growth of the euphausiids Thysanoessa inermis, Thysanoessa raschii and Meganyctiphanes norvegica in a subarctic
fjord, North Norway. Can. J. Fish. Aquat. Sci. 42, 14–22.Falk-Petersen, S., Hopkins, C.C.E., Sargent, J.R., 1990. Trophic relationships in the pelagic, arctic food web. In: Barnes, M., Gibson,
R.N. (Eds.), Trophic Relationships in the Marine Environment. Aberdeen University Press, Aberdeen, pp. 315–333.Falk-Petersen, S., Hop, H., Budgell, W.P., Hegseth, E.N., Korsnes, R., Løyning, T.B., Ørbæk, J.B., Kawamura, T., Shirasawa, K., 2000a.
Physical and ecological processes in the marginal ice zone of the northern Barents Sea during the summer melt period. J. Mar. Syst. 27,131–159.
Falk-Petersen, S., Hagen, W., Kattner, G., Clarke, A., Sargent, J., 2000b. Lipids, trophic relationships, and biodiversity in Arctic andAntarctic krill. Can. J. Fish. Aquat. Sci. 57, 178–191.
Falk-Petersen, F., Sargent, J.R., Kwasniewski, S., Gulliksen, B., Millar, R.-M., 2001. Lipids and fatty acids in Clione limacina andLimacina helicina in Svalbard waters and the Arctic Ocean: trophic interactions. Polar Biol. 24, 163–170.
Falk-Petersen, S., Dahl, T.M., Scott, C.L., Sargent, J.R., Gulliksen, B., Kwasniewski, S., Hop, H., Millar, R.-M., 2002. Lipid biomarkersand trophic linkages between the Arctic ctenophores and calanoid copepods in Svalbard waters. Mar. Ecol. Prog. Ser. 227, 187–194.
Fischer, G., 1991. Stable carbon isotope ratios of plankton carbon and sinking organic matter from the Atlantic sector of the SouthernOcean. Mar. Chem. 35, 581–596.
Flynn, K.J., 1991. Algal carbon–nitrogen metabolism: a biochemical basis for modelling the interactions between nitrate and ammoniumuptake. J. Plankton Res. 13, 373–382.
France, R.L., 1995. Carbon-13 enrichment in benthic compared to planktonic algae: food web implications. Mar. Ecol. Prog. Ser. 124,307–312.
Frazer, T.K., 1996. Stable isotope composition (d13C and d15N) of larval krill, Euphausia superba, and two of its potential food sources inwinter. J. Plankton Res. 18, 1413–1426.
Frazer, T.K., Ross, R.M., Quetin, L.B., Montoya, J.P., 1997. Turnover of carbon and nitrogen during growth of larval krill, Euphausia
superba Dana: a stable isotope approach. J. Exp. Mar. Biol. Ecol. 212, 259–275.Fry, B., 1996. 13C/12C fractionation by marine diatoms. Mar. Ecol. Prog. Ser. 134, 283–294.Gannes, L.Z., O’Brien, D.M., Mart�ınez del Rio, C., 1997. Stable isotopes in animal ecology: assumptions, caveats and a call for more
laboratory experiments. Ecology 78, 1271–1276.Gibson, J.A.E., Trull, T., Nichols, P.D., Summons, R.E., McMinn, A., 1999. Sedimentation of 13C-rich organic matter from Antarctic
sea-ice algae: a potential indicator of past sea ice extent. Geology 27, 331–334.Goodman, M., 1992. DMSP-F8 SSM/I Pathfinder Global Level 2 Sea Ice Concentrations. National Snow and Ice Data Center, Boulder,
CO, USA, Digital media.Goni, M.A., Yunker, M.B., Macdonald, R.W., Eglinton, T.I., 2000. Distribution and sources of organic biomarkers in arctic sediments
from the Mackenzie River and Beaufort Shelf. Mar. Chem. 71, 23–51.Gorokhova, E., Hansson, S., 1999. An experimental study on variations in stable carbon and nitrogen isotope fractionation during growth
of Mysis mixta and Neomysis integer. Can. J. Fish. Aquat. Sci. 56, 2203–2210.Gosselin, M., Levasseur, M., Wheeler, P.A., Horner, R.A., Booth, B.C., 1997. New measurements of phytoplankton and ice algal
production in the Arctic Ocean. Deep-Sea Res. II. 44, 1623–1644.Gradinger, R., Spindler, M., Weissenberger, J., 1992. On the structure and development of Arctic pack ice communities in Fram Strait: a
multivariate approach. Polar Biol. 12, 727–733.Graeve, M., Hagen, W., Kattner, G., 1994. Diet-induced changes in the fatty acid composition of Arctic herbivorous copepods:
experimental evidence of trophic markers. J. Exp. Mar. Biol. Ecol. 182, 97–110.Graeve, M., Albers, C., Kattner, G., 2004. Assimilation and biosynthesis of lipids in Arctic Calanus species based on feeding experiments
with a 13C labelled diatom. J. Exp. Mar. Biol. Ecol. 317, 109–125.Gran, H.H., 1904. Diatomaceae from ice floes and plankton of the Arctic Ocean. Sci. Res. Norw. N. Polar Exped. 4, 3–74.Gran, H.H., 1931. Quantitative plankton investigations carried out during the expedition with ‘‘Michael Sars’’ July–September, 1924.
Rapp. Cons. Permanent Explor. Mer. 56, 1–50.Griffiths, H., 1991. Applications of stable isotope technology in physiological ecology. Funct. Ecol. 5, 254–269.Hagen, W., 1999. Reproductive strategies and energetic adaptations of polar zooplankton. Invertebr. Reprod. Dev. 36, 25–34.Hagen, W., Auel, H., 2001. Seasonal adaptations and the role of lipids in oceanic zooplankton. Zool-Anal. Complex Syst. 104, 313–326.Hegseth, E.N., 1992. Sub-ice assemblages of the Barents Sea: species composition, chemical composition, and growth rates. Polar Biol. 12,
485–496.Hegseth, E.N., 1997. Phytoplankton of the Barents Sea – the end of the growth season. Polar Biol. 17, 235–241.Hegseth, E.N., 1998. Primary production of the northern Barents Sea. Polar Res. 17, 113–123.Hobson, K.A., Welch, H.E., 1992. Determination of trophic relationships within a high Arctic marine food web using d13C and d15N
analysis. Mar. Ecol. Prog. Ser. 84, 9–18.

J.E. Søreide et al. / Progress in Oceanography 71 (2006) 59–87 85
Hobson, K.A., Alisauskas, R.T., Clark, R.G., 1993. Stable-nitrogen isotope enrichment in avian tissues due to fasting and nutritionalstress: implications for isotopic analyses of diet. Condor 95, 388–394.
Hobson, K.A., Ambrose Jr., W.G., Renaud, P.E., 1995. Sources of primary production, benthic-pelagic coupling, and trophicrelationships within the Northeast Water Polynya: insights from d13C and d15N analysis. Mar. Ecol. Prog. Ser. 128, 1–10.
Hobson, K.A., Fisk, A., Karnovsky, N., Holst, M., Gagnon, J.-M., Fortier, M., 2002. A stable isotope (d13C, d15N) model for the NorthWater food web: implications for evaluating trophodynamics and the flow of energy and contaminants. Deep-Sea Res. II. 49, 5131–5150.
Hoeger, U., 1983. Biochemical composition of ctenophores. J. Exp. Mar. Biol. Ecol. 72, 251–261.Hop, H., Borga, K., Gabrielsen, G.W., Kleivane, L., Skaare, J.U., 2002. Food web magnification of persistent organic pollutants in
poikilotherms and homeotherms from the Barents Sea. Environ. Sci. Technol. 36, 2589–2597.Hopkins, T.L., Torres, J.J., 1989. Midwater food web in the vicinity of a marginal ice zone in the western Weddell Sea. Deep-Sea Res. 36,
543–560.Horner, R.A., 1985. Arctic Sea Ice Biota. CRC Press, Boca Raton, FL.Iken, K., Bluhm, B.A., Gradinger, R., 2005. Food web structure in the high Arctic Canada Basin: evidence from d13C and d15N analysis.
Polar Biol. 28, 238–249.Jennings, S., Warr, K.W., 2003. Environmental correlates of large-scale spatial variation in the d15N in marine animals. Mar. Biol. 142,
1131–1140.Kattner, G., Hagen, W., 1995. Polar herbivorous copepods – different pathways in lipid biosynthesis. ICES J. Mar. Sci. 52, 329–335.Kennedy, H., Thomas, D.N., Kattner, G., Haas, C., Dieckmann, G.S., 2002. Particulate organic matter in Antarctic summer sea ice:
concentration and stable isotopic composition. Mar. Ecol. Prog. Ser. 238, 1–13.Klein Breteler, W., Grice, K., Schouten, S., Kloosterhuis, H., Sinninghe Damste, J., 2002. Stable carbon isotope fractionation in the
marine copepod Temora longicornis: unexpectedly low d13C value of faecal pellets. Mar. Ecol. Prog. Ser. 240, 195–204.Krembs, C., Eicken, H., Junge, K., Deming, J.W., 2002. High concentrations of exopolymeric substances in Arctic winter sea ice:
implications for the polar ocean carbon cycle and cryoprotection of diatoms. Deep-Sea Res. I. 49, 2163–2181.Lalli, C.M., Gilmer, R.W., 1989. Pelagic Snails: the Biology of Holoplanktonic Gastropod Molluscs. Stanford University Press, Stanford.Landry, M.R., 1981. Switching between herbivory and carnivory by the planktonic marine copepod Calanus pacificus. Mar. Biol. 65, 77–
82.Lee, R.F., 1974. Lipid composition of the copepod Calanus hyperboreus from the Arctic Ocean. Changes with depth and season. Mar.
Biol. 26, 313–318.Lee, R.F., Hagen, W., Kattner, G., 2006. Lipid storage in marine zooplankton. Mar. Ecol. Prog. Ser. 307, 273–306.Legendre, L., Ackley, S.F., Dieckmann, G.S., Gulliksen, B., Horner, R., Hoshiai, T., Melnikov, I.A., Reeburgh, W.S., Spindler, M.,
Sullivan, C.W., 1992. Ecology of sea ice biota 2. Global significance. Polar Biol. 12, 429–444.Levinsen, H., Turner, J.T., Nielsen, T.G., Hansen, B.W., 2000. On the trophic coupling between protists and copepods in arctic marine
ecosystems. Mar. Ecol. Prog. Ser. 204, 65–77.Lønne, O.J., 1988. A diver-operated electric suction sampler for sympagic (=under-ice) invertebrates. Polar Res. 6, 135–136.Lønne, O.J., Gulliksen, B., 1989. Size, age and diet of polar cod, Boreogadus saida (Lepechin 1773), in ice covered waters. Polar Biol. 9,
187–191.Matthews, B., Mazumder, A., 2005. Temporal variation in body composition (C:N) helps explain seasonal patterns of zooplankton d13C.
Freshwater Biol. 50, 502–515.McConville, M.J., 1985. Chemical composition and biochemistry of sea ice algae. In: Horner, R.H. (Ed.), The Ice Biota. CRC Press, Boca
Raton, FL.McConville, M.J., Wetherbee, R., 1983. The bottom-ice microalgal community from annual ice in the inshore waters of East Antarctica. J.
Phycol. 19, 431–439.McConville, M.J., Bacic, A., Clarke, A.E., Ikeda, T., 1986. The nature of digestive carbohydrases, particularly (1-3)-b-D-glucan
hydrolases, from the hepatopancreas of Antarctic krill, Euphausia superba and E. crystallorophasis. Mar. Biol. 90, 371–378.McMinn, A., Hegseth, E.N., 2004. Quantum yield and photosynthetic parameters of marine microalgae from the southern Arctic Ocean,
Svalbard. J. Mar. Biol. Ass. U.K. 84, 865–871.Michel, C., Legendre, L., Ingram, R.G., Gosselin, M., Levasseur, M., 1996. Carbon budget of sea-ice algae in spring: evidence of a
significant transfer to zooplankton grazers. J. Geophys. Res. 101, 18345–18360.Michel, C., Nielsen, T.G., Nozais, C., Gosselin, M., 2002. Significance of sedimentation and grazing by ice micro- and meiofauna for
carbon cycling in annual sea ice (northern Baffin Bay). Aquat. Microb. Ecol. 30, 57–68.Minagawa, M., Wada, T., 1984. Stepwise enrichment of 15N along food chains: further evidence and the relation between d15N and animal
age. Geochim. Cosmochim. Acta 48, 1135–1140.Mock, T., Gradinger, R., 1999. Determination of Arctic ice algal production with a new in situ incubation technique. Mar. Ecol. Prog. Ser.
177, 15–26.Nielsen, T.G., Hansen, B.W., 1999. Plankton community structure and carbon cycling on the western coast of Greenland during the
stratified summer situation: 1. Hydrography, phytoplankton and bacterioplankton. Aquat. Microb. Ecol. 16, 205–216.Olli, K., Wexels Riser, C., Wassmann, P., Ratkova, T., Arashkevich, E., Pasternak, A., 2002. Seasonal variation in vertical flux of biogenic
matter in the marginal ice zone and the central Barents Sea. J. Mar. Syst. 38, 189–204.Omori, N., Ikeda, T., 1984. Methods in Marine Zooplankton Ecology. Wiley, New York.Owens, N.J.P., 1985. Variations in the natural abundance of 15N in estuarine suspended particulate matter: a specific indicator of
biological processing. Estuar. Coast. Shelf Sci. 20, 505–510.

86 J.E. Søreide et al. / Progress in Oceanography 71 (2006) 59–87
Pasternak, A., Arashkevich, E., Tande, K., Falkenhaug, T., 2001. Seasonal changes in feeding, gonad development and lipid stores inCalanus finmarchicus and C. hyperboreus from Malangen, Northern Norway. Mar. Biol. 138, 1141–1152.
Peterson, B.J., Fry, B., 1987. Stable isotopes in ecosystem studies. Annu. Rev. Ecol Syst. 18, 293–320.Poltermann, M., 2001. Arctic sea ice as feeding ground for amphipods – food sources and strategies. Polar Biol. 24, 89–96.Ponsard, S., Averbuch, P., 1999. Should growing and adult animals fed on the same diet show different d15N values? Rapid Comm. Mass
Spectrom. 13, 1305–1310.Post, D.M., 2002. Using stable isotopes to estimate trophic positions: models, methods, and assumptions. Ecology 83, 703–718.Postel, L., Fock, H., Hagen, W., 2000. Biomass and abundance. In: Harris, R., Wiebe, P., Lenz, J., Skjoldal, H.R., Huntley, M. (Eds.),
Zooplankton Methodology Manual. Elsevier Academic Press, London.Richardson, K., Markager, S., Buch, E., Lassen, M.F., Kristensen, A.S., 2005. Seasonal distribution of primary production,
phytoplankton biomass and size distribution in the Greenland Sea. Deep-Sea Res. I 52, 979–999.Robbins, C.T., Felicetti, L.A., Sponheimer, M., 2005. The effects of dietary protein quality on nitrogen isotope discrimination in mammals
and birds. Oecologia 144, 534–540.Rolff, C., 2000. Seasonal variations in d13C and d15N of size-fractionated plankton at a coastal station in the northern Baltic proper. Mar.
Ecol. Prog. Ser. 203, 47–65.Ross, R.M., Quetin, L.B., Newberger, T., Oakes, S.A., 2004. Growth and behaviour of larval krill (Euphausia superba) under the ice in late
winter 2001 west of the Antarctic Peninsula. Deep-Sea Res. II 51, 17–19.Runge, J.A., Ingram, R.G., 1988. Underice grazing by planktonic, calanoid copepods in relation to a bloom of ice microalgae in
Southeastern Hudson Bay. Limnol. Oceanogr. 33, 280–286.Runge, J.A., Ingram, R.G., 1991. Under-ice feeding and diel migration by the planktonic copepods Calanus glacialis and
Pseudocalanus minutus in relation to the ice algal production cycle in southeastern Hudson Bay, Canada. Mar. Biol. 108, 217–225.
Rysgaard, S., Nielsen, T.G., Hansen, B.W., 1999. Seasonal variation in nutrients, pelagic primary production and grazing in a high Arcticcoastal marine ecosystem. Mar. Ecol. Prog. Ser. 179, 13–25.
Sakshaug, E., 2003. Primary production in Arctic and subarctic waters. In: Stein, R., McDonald, R.W. (Eds.), The Organic Carbon Cyclein the Arctic Ocean. Springer-Verlag, Berlin.
Sakshaug, E., Skjoldal, H.E., 1989. Life at the ice edge. Ambio 18, 60–67.Sakshaug, E., Slagstad, D., 1992. Sea ice and wind: effects on primary productivity in the Barents Sea. Atmos. Ocean 30, 579–591.Sasaki, H., Kawai, D., Sato, M., 2001. Stable isotopes of arctic copepods in the Greenland Sea in winter. Mem. Nat. Inst. Polar Res. Spec.
Issue 54, 423–428.Sato, M., Sasaki, H., Fukuchi, M., 2002. Stable isotopic compositions of overwintering copepods in the arctic and subarctic waters and
implications to the feeding history. J. Mar. Syst. 38, 165–174.Schubert, C.J., Calvert, S.E., 2001. Nitrogen and carbon isotopic composition of marine and terrestrial organic matter in Arctic Ocean
sediments: implications for nutrient utilization and organic matter composition. Deep-Sea Res. I. 48, 789–810.Scott, C.L., Falk-Petersen, S., Sargent, J.R., Hop, H., Lønne, O.J., Poltermann, M., 1999. Lipids and trophic interactions of ice fauna and
pelagic zooplankton in the Marginal Ice Zone of the Barents Sea. Polar Biol. 21, 65–70.Scott, C.L., Falk-Petersen, S., Gulliksen, B., Lønne, O.J., Sargent, J.R., 2001. Lipid indicators of the diet of the sympagic amphipod
Gammarus wilkitzkii in the Marginal Ice Zone and in open waters of Svalbard (Arctic). Polar Biol. 24, 572–576.Scott, C.L., Kwasniewski, S., Falk-Petersen, S., Sargent, J.R., 2002. Species differences, origins and functions of fatty alcohols and fatty
acids in the wax esters and phospholipids of Calanus hyperboreus, C. glacialis and C. finmarchicus from Arctic waters. Mar. Ecol. Prog.Ser. 235, 127–134.
Scott, F.P., Levey, D.J., Greenberg, C.H., Martınez del Rio, C.M., 2003. Effects of elemental composition on the incorporation of dietarynitrogen and carbon isotopic signatures in an omnivorous songbird. Oecologia 135, 516–523.
Siegel, S., Castellan, N.J., 1988. Nonparametric Statistics for the Behavioral Sciences, second ed. McGraw-Hill, New York.Siegenthaler, P.A., Murata, N., 1998. Lipids in Photosynthesis: Structure, Function and Genetics. Kluwer Academic Publishers,
Dordrecht.Snedecor, G.W., Cochran, W.G., 1989. Statistical Methods, eighth ed. Iowa State University Press, USA.Søreide, J.E., Hop, H., Falk-Petersen, S., Gulliksen, B., Hansen, E., 2003. Macrozooplankton communities and environmental variables in
the Barents Sea marginal ice zone. Mar. Ecol. Prog. Ser. 263, 43–64.Sotiropoulos, M.A., Tonn, W.M., Wassenaar, L.I., 2004. Effects of lipid extraction on stable carbon and nitrogen isotope analyses of fish
tissues: potential consequences for food web studies. Ecol. Freshw. Fish 13, 155–160.Stevens, C.J., Deibel, D., Parrish, C.C., 2004. Copepod omnivory in the North Water Polynya (Baffin Bay) during autumn: spatial
patterns in lipid composition. Deep-Sea Res. I. 51, 1637–1658.Swanberg, N., Bamstedt, U., 1991. Ctenophora in the Arctic – the abundance, distribution and predatory impact of the cydippid
ctenophore Mertensia ovum (Fabricius) in the Barents Sea. Polar Res. 10, 507–524.Syvertsen, E.E., 1991. Ice algae in the Barents Sea: types of assemblages, origin, fate and role in the ice-edge phytoplankton bloom. Polar
Res. 10, 277–287.Tamelander, T., Renaud, P.E., Hop, H., Carroll, M.L., Ambrose Jr., W.G., Hobson, K.A., 2006a. Trophic relationships and pelagic-
benthic coupling during summer in the Barents Sea Marginal Ice Zone revealed by stable carbon and nitrogen isotope measurements.Mar. Ecol. Prog. Ser. 310, 33–46.
Tamelander, T., Søreide, J.E., Hop, H., Carroll, M.L., 2006b. Fractionation of stable isotopes in the Arctic marine copepod Calanus
glacialis: Effects on the isotopic composition of marine biogenic matter. J. Exp. Mar. Biol. Ecol. 333, 231–240.

J.E. Søreide et al. / Progress in Oceanography 71 (2006) 59–87 87
Thomas, D.N., Papadimitriou, S., 2003. Biogeochemistry of sea ice. In: Thomas, D.N., Dieckmann, G.S. (Eds.), Sea Ice – An Introductionto its Physics, Chemistry, Biology and Geology. Blackwell Publishing, Oxford, pp. 267–302.
Thompson, P.A., Calvert, S.E., 1994. Carbon-isotope fractionation by a marine diatom: the influence of irradiance, daylength, pH, andnitrogen source. Limnol. Oceanogr. 39, 1835–1844.
Thompson, P.A., Levasseur, M.E., Harrison, P.J., 1989. Light-limited growth on ammonium vs. nitrate: what is the advantage for marinephytoplankton. Limnol. Oceanogr. 34, 1014–1024.
Tremblay, J.-E., Hobson, K.A., Michel, C., Gratton, Y., Price, N.M., 2006. Bloom dynamics in early-opening waters of the Arctic Ocean.Limnol. Oceanogr. 51, 900–912.
Unstad, K.H., Tande, K.S., 1991. Depth distribution of Calanus finmarchicus and C. glacialis in relation to environmental conditions inthe Barents Sea. Polar Res. 10, 409–420.
Utermohl, H., 1958. Zur Vervollkommung der quantitativen Phytoplankton-Methodik. Mitt. Int. Ver. Theor. Angew. Limnol. 9, 1–38.Vander Zanden, M.J., Rasmussen, J.B., 2001. Variation in d15N and d13C trophic fractionation: Implications for aquatic food web studies.
Limnol. Oceanogr. 46, 2061–2066.van Dongen, B.E., Schouten, S., Damste, J.S.S., 2002. Carbon isotope variability in monosaccharides and lipids of aquatic algae and
terrestrial plants. Mar. Ecol. Prog. Ser. 232, 83–92.von Quillfeldt, C.H., 2000. Common diatom species in Arctic spring blooms: their distribution and abundance. Bot. Mar. 43, 499–516.Wada, E., Hattori, A., 1991. Nitrogen in the Sea: Forms, Abundances, and Rate Processes. CRC Press, Boca Raton, FL.Walve, J., Larsson, U., 1999. Carbon, nitrogen and phosphorus stoichiometry of crustacean zooplankton in the Baltic Sea: implications
for nutrient recycling. J. Plankton Res. 21, 2309–2321.Waser, N.A., Yu, Z., Yin, K., Nielsen, B., Harrison, P.J., Turpin, D.H., Calvert, S.E., 1999. Nitrogen isotopic fractionation during a
simulated diatom spring bloom: importance of N-starvation in controlling fractionation. Mar. Ecol. Prog. Ser. 179, 291–296.Werner, I., 1997. Grazing of Arctic under-ice amphipods on sea-ice algae. Mar. Ecol. Prog. Ser. 138, 93–99.Werner, I., 2005. Living conditions, abundance, and biomass of under-ice fauna in the Storfjord area (western Barents Sea, Arctic) in late
winter (March 2003). Polar Biol. 28, 311–318.Werner, I., Auel, H., 2005. Seasonal variability in abundance, respiration and lipid composition of Arctic under-ice amphipods. Mar. Ecol.
Prog. Ser. 292, 251–262.Wexels Riser, C., Wassmann, P., Olli, K., Pasternak, A., Arashkevich, E., 2002. Seasonal variation in production, retention and export of
zooplankton faecal pellets in the marginal ice zone and central Barents Sea. J. Mar. Syst. 38, 175–188.Werner, I., Auel, H., Kiko, R., 2004. Occurrence of Anonyx sarsi (Amphipoda: Lysianassoidea) below Arctic pack ice: an example for
cryo-benthic coupling? Polar Biol. 27, 474–481.Winer, B.J., Brown, D.R., Michels, K.E., 1991. Statistical Principals in Experimental Design, third ed. McGraw-Hill, New York.Zenkevitch, L., 1963. Biology of the Seas of the USSR. George Allen & Unwin LTD, London.
Copyright © 2022 FDOKUMEN