trophic relationships in an arctic marine food web and ... - CORE
310
TROPHIC RELATIONSHIPS IN AN ARCTIC MARINE FOOD WEB AND IMPLICATIONS FOR TRACE ELEMENT DYNAMICS Recommended: Approved: By Larissa-A. Dehn Advisory Committee Co-Chair '\'U * ‘fi )1 & Assistant Chair, Department o fBiology asd Wildlife >ean, College of Natural Dean, College of Natural Science and Mathematics Dean of the Graduate School Date #
-
Upload
khangminh22 -
Category
Documents
-
view
2 -
download
0
Transcript of trophic relationships in an arctic marine food web and ... - CORE
TROPHIC RELATIONSHIPS IN AN ARCTIC MARINE FOOD WEB AND
IMPLICATIONS FOR TRACE ELEMENT DYNAMICS
Recommended:
Approved:
By
Larissa-A. Dehn
Advisory Committee Co-Chair
' \ ' U * ‘f i ) 1&Assistant Chair, Department o f Biology asd Wildlife
>ean, College of NaturalDean, College of Natural Science and Mathematics
Dean of the Graduate School
Date #
A
THESIS
Presented to the Faculty
of the University of Alaska Fairbanks
in Partial Fulfillment of the Requirements
for the Degree of
DOCTOR OF PHILOSOPHY
By
Larissa-A. Dehn, B.S., M.S.
Fairbanks, Alaska
August 2005
TROPHIC RELATIONSHIPS IN AN ARCTIC MARINE FOOD WEB AND
IMPLICATIONS FOR TRACE ELEMENT DYNAMICS
/ V / ' U&
BIOSCIENCES LIBRARY-UAF
ABSTRACT
Tissues of subsistence-harvested Arctic marine and terrestrial mammals and
potential prey species were analyzed for isotopes of carbon and nitrogen and selected
trace elements describing contaminant pathways in the food web. Feeding habits of ice
seals were characterized using stable isotopes and gastric contents analysis. Bearded seals
(.Erignathus barbatus) relied on the benthic food chain. Zooplankton and fishes were
significant prey for ringed seals (Phoca hispida), while fishes were the principal prey in
spotted seals (Phoca largha). Gastric prey composition and isotope ratios varied with age
and sex. Effects of age, trophic level, and prey prevalence on trace element
concentrations in seal tissues were investigated. Most trace elements differed
significantly in phocid tissues. Bearded seals had the highest cadmium (Cd)
concentrations and spotted seals the lowest. This indicates a connection of Cd with
invertebrate prey, while mercury (Hg), in particular the proportion of organic to total Hg
(THg), accumulated in the piscivorous food web. Silver (Ag) showed possible association
to benthic feeding habits. Altered trace element accumulation patterns were observed in
compromised seals. Stable isotopes illustrated belugas (Delphinapterus leucas) occupied
a higher trophic level than bowheads (Balaena mysticetus) and gray whales (Eschrichtius
robustus). Trace element concentrations also differed significantly among these
cetaceans. Observed relationships with age or length in species analyzed were complex
and nonlinear rather than previously reported continuous bioaccumulation with age. Cd
was similar in belugas and bowheads but lowest in gray whales. THg was highest in
belugas and near detection limit in mysticetes, supporting the connection of Hg with fish
and Cd with invertebrates. The hepatic selenium (Se):THg ratio exceeded the frequently
described equimolarity in all species. Se:THg molar ratios and tissue concentrations of
zinc (Zn) may show promise as indicators of immune status and animal health. Polar
bears (Ursus maritimus) feed on the highest trophic level, though Cd concentrations were
either similar to, or significantly lower than those in belugas or ice seals. Conversely,
THg increased significantly from seal to bear. Generally, trace elements in Alaska-
harvested animals were lower than for other Arctic regions, and trace metal magnification
in the Arctic food web was not significant.
V
Signature P ag e ..................................................................................................................... i
Title Page ..............................................................................................................................ii
A bstract................................................................................................................................ iii
Table of C ontents................................................................................................................v
List of Figures.................................................... .................................................................. xi
List o f Tables........................................................................................................................xii
List of Abbreviations.......................................................................................................... xiv
Dedication............................................................................................................................. xvi
Acknowledgements..............................................................................................................xvii
General Introduction ...........................................................................................................1
References.............................................................................................................................5
CHAPTER 1
Feeding ecology of phocid seals in the Alaskan and Canadian A rctic .................14
1.1 Abstract .......................................................................................................................... 14
1.2 Introduction...................................................................................................................16
1.3 Materials and M ethods................................................................................................ 20
1.31 Sampling ...................................................................................................................... 20
1.32 Stomach Contents Analysis ............................................................ ..........................21
1.33 Stable Isotopes ............................................................................................................ 22
TABLE OF CONTENTS
1.34 A ging ..............................................................................................................................24
1.35 Statistical A nalysis...................................................................................................... 25
1.4 R esults..............................................................................................................................26
1.41 Stomach Contents A nalyses....................................................................................... 26
1.42 Stable Isotopes .............................................................................................................28
1.5 D iscussion................................... 30
1.51 Stomach Contents A nalyses....................................................................................... 30
1.511 Ringed S ea ls ............................................................................................................... 30
1.512 Bearded S e a ls .............................................................................................................32
1.513 Spotted S e a ls .............................................................................................................. 34
1.52 Stable Isotopes ............................................................................................................. 36
1.521 Ringed S ea ls ............................................................................................................... 36
1.522 Bearded Seals and W alrus........................................................................................ 38
1.523 Spotted S ea ls ..............................................................................................................40
1.6 Acknowledgments..........................................................................................................42
1.7 References.......................................................................................................................43
v i
CHAPTER 2
Trace elements in tissues of phocid seals harvested in the Alaskan and Canadian
Arctic - Influence of age and feeding ecology ..............................................................66
2.1 A bstract........................................................................................................................... 66
2.2 Introduction.....................................................................................................................68
2.3 Materials and M ethods..................................................................................................72
2.31 Sampling ......................................................................................................................72
2.32 A ging......................................... .................................................................................. 73
2.33 Stable Isotope Analyses .............................................................................................73
2.34 Trace Element A nalyses..............................................................................................74
2.35 Total Mercury A nalysis...............................................................................................75
2.36 Methyl Mercury A nalysis........................................................................................... 75
2.37 Quality Control ............................................................................................................76
2.38 Metal Ratios ................................................................................................................. 76
2.39 Statistical A nalysis...................................................................................................... 77
2.4 R esults..............................................................................................................................78
2.41 Trace Element Concentrations and Tissue Distribution ........................................ 78
2.42 Influence o f Location .................................................................................................. 78
2.43 Influence o f Sex ...........................................................................................................79
2.44 Species Com parison.................................................................................................... 79
2.45 Correlation Between Variables ..................................................................................80
2.46 Trace Element Concentrations in Potential Prey Species ...................................... 81
2.5 D iscussion....................................................................................................................... 81
2.51 C adm ium ..................................................................................................................... 81
2.511 Species Com parison.................................................................................................. 81
2.512 Cd and Sex ................................................................................................................. 85
2.513 Cd and Age ................................................................................................................ 86
v ii
2.52 M ercury......................................................................................................................... 88
2.521 Species Com parison.................................................................................................. 88
2.522 Hg and Age ................................................................................................................ 90
2.53 Selenium .............................................. 92
2.54 S ilv e r............................................................................................................................. 93
2.55 Copper and Z in c ...........................................................................................................96
2.6 Summary and Conclusion .............................................................................................97
2.7 Acknowledgments..........................................................................................................98
2.8 References.......................................................................................................................99
CHAPTER 3
Stable isotope and trace element status of subsistence hunted bowhead (Balaena
mysticetus) and beluga whales (Delphinapterus leucas) in Alaska and gray whales
(Eschrichtius robustus) in Chukotka ..............................................................................135
3.1 A bstract............................................................................................................................135
3.2 Introduction..................................................................................................................... 137
3.3 Materials and M ethods.................................................................................................. 141
3.31 Sample C ollection........................................................................................................141
3.32 Stable Isotope Analyses .............................................................................................. 142
3.33 Trace Element A nalyses.............................................................................................. 143
3.34 Total Mercury .............................................................................................................. 144
3.35 Methyl Mercury ........................................................................................................... 145
3.36 Quality Control ............................................................................................................ 145
3.37 Trace Element R a tio s .................................................................................................. 146
3.38 Statistical A nalysis.......................................................................................................146
3.4 R esults ..............................................................................................................................147
3.41 Stable Isotopes ............................................................................................................. 147
3.42 Trace Element Concentrations and Tissue Distribution .........................................148
3.43 Species Com parison.....................................................................................................149
3.44 Correlation Between Variables .................................................................................. 149
3.5 D iscussion....................................................................................................................... 150
3.51 Stable Isotopes ............................................................................................................. 150
3.52 Trace E lem ents............................................................................................................. 153
3.521 Mercury and Selenium............................................................................................... 153
3.522 C adm ium ..................................................................................................................... 158
3.523 S ilv e r............................................................................................................................161
3.524 Copper and Z in c .........................................................................................................163
3.6 Summary and C onclusion.............................................................................................164
3.7 Acknowledgments.......................................................................................................... 165
3.8 References....................................................................................................................... 166
ix
CHAPTER 4
Trophic ecology of Arctic marine biota and implications for trace metal dynamics
.................................................................................................................................................. 207
X
4.1 A bstract........................................................................................................................... 207
4.2 Introduction.....................................................................................................................209
4.3 Materials and M ethods..................................................................................................212
4.31 Field Sampling and Tissue Processing.......................................................................212
4.32 Stable Isotope Analyses ............................................................................................. 214
4.33 Trace Metal A nalyses..................................................................................................215
4.34 Statistical Analysis and Trophic Transfer Calculations...................................... .....216
4.4 R esu lts ............................................................................................................................. 218
4.41 Stable Isotopes and Trace M etals.............................................................................. 218
4.42 Food Web Magnification and Biomagnification Factors........................................ 220
4.5 D iscussion.......................................................................................................................221
4.51 Stable Isotopes .............................................................................................................221
4.52 Trace M eta ls ................................................................................................................. 224
4.53 Food Web Magnification ................................................ 227
4.54 Biomagnification..........................................................................................................230
4.6 Summary and Conclusion ............................................................................................ 232
4.7 Acknowledgements....................................................................................................... 233
4.8 References.......................................................................................................................234
General Conclusions ............................................................................................................282
References 286
x i
Figure 1.1 Alaskan and Canadian communities...............................................................58
Figure 1.2. 513C versus 815N in ringed seals harvested in Alaska and Canada............ 59
Figure 1.3. 813C in muscle versus age based on cementum analysis o f teeth ............. 60
Figure 1.4. 515N in muscle versus age based on cementum analysis o f te e th ............. 61
Figure 2.1. Alaskan and Canadian villages and communities ...................................... 121
Figure 2.2. Age based on cementum analysis of teeth versus renal Cd .......................122
Figure 2.3. Age based on cementum analysis o f teeth versus %MeHg .......................123
Figure 2.4. Age based on cementum analysis of teeth versus the hepatic....................124
Figure 3.1. Alaskan and Russian villages and com m unities..........................................191
Figure 3.2. 515N versus 5I3C ..............................................................................................192
Figure 3.3. Hepatic THg [(amole/g] versus hepatic Se [|amole/g].................................193
Figure 3.4. Hepatic Se:THg molar ratio versus length [cm] ......................................... 194
Figure 3.5. Renal Cd [jag/g ww] versus length [cm ]...................................................... 195
Figure 3.6. Hepatic Ag [jxg/g ww] versus length [cm] .................................................. 196
Figure 3.7. Hepatic Cu [p.g/g ww] versus length [cm] ............................................... 197
Figure 4.1. Alaskan, Russian and Canadian villages and com m unities.......................267
Figure 4.2. Trophic structure of an Arctic marine food web .........................................268
Figure 4.3. Principal component (PC) 2 versus 1 from standardized d a ta .................. 269
Figure 4.4. Trophic structure (based on 515N) versus THg (a) and Ag (b) in liver and renal
Cd (c ) ............................................................... ..................................................................... 270
LIST OF FIGURES
LIST OF TABLES
Table 1.1. Pinniped samples collected in Alaskan and Canadian villages ................. 62
Table 1.2. Frequency o f occurrence (FO,) o f prey species..............................................63
Table 1.3. Stable carbon and nitrogen ratios in Arctic phocids .................................... 64
Table 2.1. Seal samples collected in Alaskan and Canadian v illages........................... 125
Table 2.2. Results for trace element analysis of reference materials ............................ 126
Table 2.3. Mean trace element concentration ± standard deviation...............................127
Table 2.4 Tukey grouping and p-values of all variables ................................................. 129
Table 2.5 Correlation matrix of all variables ....................................................................130
Table 2.6 Mean trace element concentration ± standard deviation................................134
Table 3.1. Whale samples collected in Alaskan and Russian v illages.......................... 198
Table 3.2. Results for trace element analysis of reference materials ............................ 199
Table 3.3. Average trace element concentration ± standard deviation .........................200
Table 3.4. Tukey grouping and p-values of variables ..................................................... 203
Table 3.5. Correlation matrix o f all variables .................................................................. 204
Table 4.1. Results o f multiple ANOVAs as follow-up test to M ANOVA................... 273
Table 4.2. Stable carbon and nitrogen ratios in selected Arctic marine and terrestrial
mammals ................................................................................................................................274
Table 4.3. Concentrations o f Cd and THg in liver and kidney and hepatic Ag o f selected
Arctic marine and terrestrial m am m als............................................................................. 276
Table 4.4. Food Web Magnification Factors (FWMF) and Biomagnification Factors
(BMF) of selected heavy metals in an Arctic marine food web...................................... 281
LIST OF ABBREVIATIONS
AAS - Atomic Absorption Spectrometry
Ag - Silver
BMF - Biomagnification Factor
BrCl - Bromine Chloride
Cd - Cadmium
CO2 - Carbon Dioxide
Cu - Copper
CVAFS - Cold Vapor Atomic Fluorescence Spectrometer
dw - Dry Weight
EPA - Environmental Protection Agency
FOi - Frequency of Occurrence
FWMF - Food Web Magnification Factor
GC - Gas Chromatography
HC1 - Hydrochloric Acid
He - Helium
Hg - Mercury
Hgll - Divalent Mercury
FINO3 - Nitric Acid
H2 O2 - Hydrogen Peroxide
H 2SO4 - Sulfuric Acid
XV
ICP-MS - Inductively Coupled Plasma Mass Spectrometer
IRMS - Isotope Ratio Mass Spectrometer
MDL - Minimum Detection Limit
MeHg - Methyl Mercury
N 2 - Atmospheric Nitrogen
NaB(C2H 5 ) 4 - Sodium Tetraethyl Borate
NIST - National Institute for Standards and Technology
NRC - National Research Council
PC - Principal Component
PCA - Principal Components Analysis
SD - Standard Deviation
Se - Selenium
SnCb - Stannous Chloride
THg - Total Mercury
TL - Trophic Level
ww - Wet Weight
YOY - Young-of-the-Year
Zn - Zinc
%MeHg - Proportion of MeHg to THg
813C - Stable Isotope Ratio o f Carbon
615N - Stable Isotope Ratio of Nitrogen
To my father W olf who gave me his curiosity, my mother Christina who gave me her
strength and my husband Jon who always believed in me.
x v i
In the sea, once upon a time,O my best beloved,There was a whale,And he ate fishes.He ate the starfish and the garfish, And the crab and the dab,And the plaice and the dace,And the skate and his mate,And the mackereel and the pickereel, And the really truly twirly-whirly eel.
How the whale got his throat Rudyard Kipling
ACKNOWLEDGEMENTS
Many, many wonderful people were involved in this memorable stage o f my life.
This study was made possible by the generosity, trust and hospitality of the many
subsistence hunters in Alaska, Russia and Canada who invited me to their homes to share
hunting success, stories and “pilaking” (butchering) techniques. And of course, they
shared a substantial portion of their food to find its way in my sample bags for analysis.
In particular, I thank Charlie Brower, Harry Brower, Tommy Olemaun, Benny
Akootchook, Taqulik Hepa, Lolly Hopson and Rebecca Brower, who went out of their
way to support my sampling effort.
My sincere appreciation and thanks go to my committee. Erich Follmann has been
a wonderful advisor and mentor to me. He shared my joy when things were going good
and picked me up with much encouragement and his unwavering optimism when I was
falling apart. Erich has always been there and I feel honored that he believed in me all
those years ago and took me on as a student of life and science. Dana Thomas showed me
that statistics can be fun. I knew I was in trouble when he got thrilled about my unruly
data set. But he was there for me every step of the way and I admire his unending
patience. Larry Duffy introduced me to the secrets o f the mercury detector and still
trusted me in his lab after the infamous vial with blubber digest garnished the ceiling.
Todd O ’Hara navigated with me around my first bowhead whale and pointed out that the
Cadillac-sized organ in there is actually the liver.
Very special thanks go to Cheryl Rosa. She is one of the few people
understanding the excitement of finding a lesion. She is also one of the very few people
x v i i
that can follow my confused ideas and consequently keep me on track. And I should not
forget the hours and days (or even months) we spent in the freezer or sub-sampling
tissues that would have been dreary without her. Thank you for being such a great friend.
Gay Sheffield is the true sampling queen of the North Slope and the Bering Strait.
Sample sizes and more importantly sampling fun would have been a lot less impressive
without her. I very much appreciate the help of Torsten Bentzen. He was a real trooper
helping me wash through seal guts, and I think he almost enjoyed it in the end. Craig
George is one of the most amazing storytellers and listening, I learned so much about the
Arctic, the people and the whales.
I am indebted to Gerald Bratton, Robert Taylor, Norma Haubenstock and Tim
Howe for their collaboration with the many samples in the labs and their patience in
explaining the equipment. I especially thank Victoria Woshner for her contagious
fascination and joy with necropsies in the freezing cold. I gratefully acknowledge the
assistance o f the many sampling wizards in the field, Genna Zelensky, Solissa Visalli,
Deborah Burnett, Geoff York, Tania Zenteno-Savin, Bob Eisner, Robert Suydam, Paul
Hoekstra, Tami Mau, Leslie Pierce, Lois Harwood and many more. I also thank Ray
Highsmith and Bodil Bluhm for collecting amphipods in the Bering Strait and Paul
Becker and Steven Christopher who organized interlaboratory comparison exercises and
provided marine mammal reference material as part o f the QA/QC program. Douglas
DeMaster, John Bengtson and many others at NMML coached me on processing and
aging o f seal teeth and stomach contents analysis.
Last, but most certainly not least, I thank my family for their loving support and
especially my parents who were close even when 10,000 miles separated us. I am
particularly grateful to my father who was always enthusiastic and never got tired of
explaining hyperbolas and decay functions.
My love Jon, you have been the unbiased voice o f reason, the magician who fixed
the computer; you’ve read through drafts and listened to talks and defenses, put up with
bloody stories, pictures and sometimes very bad olfactory inputs. You cooked when I was
writing, massaged my shoulders, watched over my sleep and most importantly, you made
me laugh. I love you!
Finally, Fenris and Loki. They don’t care much for written thank-you’s, but they
deserve a big bone for not understanding bad days (nor caring) and washing dark clouds
away with the wag of a tail.
Financial support for this study was primarily provided by the Cooperative
Institute for Arctic Research (CIFAR). Additional funding was provided by the
Experimental Program for Stimulation of Competitive Research (EPSCoR); the IdeA
Network for Biomedical Research Excellence (INBRE); the North Slope Borough
Department o f Wildlife Management; the Institute o f Arctic Biology and the Department
of Biology and Wildlife, UAF; the US Geological Survey and the Barrow Arctic Science
Consortium (BASC).
x ix
1
Exposure to contaminants is widespread among marine mammals, and continuous
bioaccumulation and biomagnification, the increase in concentration of pollutants with
age and trophic level, respectively, o f various trace metals and organic compounds (e.g.,
organochlorines (OC’s)) have been repeatedly reported in their tissues (Smith and
Armstrong, 1978; Honda et al., 1983, Hansen et al., 1990, Dietz et al., 2000, Woshner et
al., 2001a; Watanabe et al., 2002; Bustamante et al., 2004). The Arctic has a
comparatively low human population density, is relatively unaffected by industrial
activity and is generally considered a pristine environment (Barrie et al., 1992; Bard,
1999). However, the Arctic Ocean has been proposed as the sink for many contaminants
(Ponce et al., 1997, Bard, 1999), and, recently, mercury (Hg) was shown to accumulate in
polar regions due to surface deposition of reactive Hgll during polar sunrise (Ebinghaus
et al., 2002; Lindberg et al., 2002).
Commercial whalers and sealers exploited and greatly depleted many marine
mammal populations during the 18th and 19th century (Fay, 1982; Lowry et al., 1982;
Clapham et al., 1999). Thus, Arctic marine mammals are particularly vulnerable to
harmful effects o f contaminants, e.g., impaired reproduction, neoplasia, and immune
suppression (Gauthier et al., 1998; Beckmen et al., 2003; Brousseau et al., 2003;
Derocher et al., 2003; Gauthier et al., 2003; Lie et al., 2004). Marine mammals feed
generally at the top o f food chains, and some o f their unique adaptations (e.g., blubber
layer) make them a target for fat-soluble contaminants. Some species are remarkably
long-lived, for example bowhead whales (Balaena mysticetus) can live in excess of 100
GENERAL INTRODUCTION

years (George et al., 1999). In addition, marine mammals are a significant cultural and
nutritional resource for the Native coastal population of Alaska and other Arctic areas.
Subsistence users are concerned about exposure to biomagnifying contaminants in the
food web. In fact, concentrations of some contaminants (e.g., cadmium (Cd)) are at levels
of concern to marine mammal health and subsistence consumers, compared to tissue
concentrations established for domestic animals (Puls, 1994; Bratton et al., 1997).
However, the highest tissue concentrations of Cd are noted for bowhead whales and
ringed seals (Phoca hispida) that feed low in the food chain (Lowry et al., 1980; Lowry
and Sheffield, 2002) and those levels are an order o f magnitude higher than in top-level
Arctic predators, e.g., Arctic fox (Alopex lagopus) and polar bear (Ursus maritimus)
(Prestrud et al., 1994; Woshner et al., 2001a; Woshner et al., 2001b). This illustrates that
not all trace elements accumulate with trophic level and that the generally accepted
concept o f biomagnification may be flawed, warranting further study.
Recent investigations reported elevated cadmium (Cd) concentrations in tissues of
ringed seals that do not coincide with lesions associated with metal toxicosis (Woshner
2000; Sonne-Hansen et al. 2002). It was suggested that ringed seals may have adapted to
these metal concentrations and, perhaps that these levels can be considered normal
background for this species (Woshner 2000; Sonne-Hansen et al. 2002). This is supported
by trace metal evidence from ancient human and animal hair from archeological sites in
Greenland showing unchanged Cd concentrations in 15th century Inuit mummies
compared to modem samples (Hansen et al., 1989). Hg, on the other hand, was slightly
2

lower in hair sampled from mummies in Greenland, and Alaska compared to present-day
Inuit populations (Toribara and Muhs, 1984; Hansen et al., 1989; Egeland et al., 1999).
Marine mammal studies usually rely on small sample sizes, and, due to legal
limitations (Marine Mammal Protection Act), tissues are commonly collected from
stranded or otherwise compromised animals (e.g., during epizootics) and thus may not
present the norm of a healthy population. This indicates the need to establish normal
reference ranges for marine mammals. Many studies have recognized the importance of
adequate baseline data to compare and evaluate effects of contaminants, nutrients and
disease factors on animal health, immune status and reproduction, but also temporal and
geographic trends and variations in marine and terrestrial animals (Warburton and
Seagars 1993; Becker et al. 1997; Krahn et al. 1997; Dunbar et al. 1999a; Dunbar et al.
1999b; Aguirre et al. 2000; Ylitalo et al. 2001; Anan et al. 2002; Aguilar et al. 2002;
Kucklick et al. 2002; Lander et al. 2003; Jepson et al. 2005). Baseline data enhance the
understanding o f anthropogenic and climate effects, are invaluable for effective
management strategies and restoration of wildlife habitats, and improve knowledge on
natural variability within the ecosystem.
This study aims to provide baseline data o f selected essential and potentially toxic
trace elements (silver (Ag), cadmium (Cd), copper (Cu), mercury (Hg), selenium (Se) and
zinc (Zn)) in tissues o f apparently healthy marine and some terrestrial mammals in the
Alaskan, Canadian and Russian Arctic sampled during Native subsistence harvests.
Reference ranges were also established for stable isotope ratios o f carbon and nitrogen
(§13C and 515N) in muscle of marine and terrestrial mammals and total body homogenates
3
of potential prey. Stable isotopes are commonly used as indicators for trophic
relationships and feeding sources. Isotope ratios were supplemented and interpreted using
analysis of stomach contents in ice-associated pinnipeds. Further, the effects of animal
age, sex, trophic ecology (via stable isotopes) and prey preference on trace element
pathways were examined. This will aid in the understanding o f basic biology,
conservation, and management of these important subsistence species.
Chapter 1 compares feeding ecology of three Arctic phocids, ringed, bearded
(Erignathus barbatus), and spotted seals {Phoca largha), harvested in Alaska and Canada
using stomach contents and stable isotope analysis. Results are also interpreted with
regard to sex and seal age.
Chapter 2 provides baseline concentrations o f selected trace elements in
apparently healthy ice seals (ringed, bearded and spotted seal) taken during subsistence
harvests in Alaska and Canada. Effects of age, sex, trophic level, and prey selection on
trace element pathways are evaluated.
Chapter 3 gives baseline concentrations of selected trace elements and stable
carbon and nitrogen isotopes in tissues of Arctic cetaceans. Bowhead and beluga whales
(Delphinapterus leucas) and gray whales (Eschrichtius robustus) were sampled during
Native subsistence harvests in Alaska and Russia, and tissues were analyzed to compare
and evaluate the effects o f age, sex, and trophic position on trace metal concentration.
Chapter 4 identifies trophic relationships in the entire Arctic marine food web and
presents food web magnification factors in liver and kidney for Hg, Cd and Ag in this
ecosystem. Tissue-specific biomagnification factors are established for selected predator-
prey scenarios. Concentration ranges of trace elements and stable isotopes for mammals
analyzed in this study are compared to mammals from other Arctic regions.
REFERENCES
Aguilar A, Borrell A, Reijnders PJH. Geographical and temporal variation in levels of
organochlorine contaminants in marine mammals. Mar Environ Res 2002; 53:
425-452.
Aguirre AA, Angerbjom A, Tannerfeldt M, Momer T. Health evaluation of Arctic fox
(Alopex lagopus) cubs in Sweden. J Zoo Wildl Med 2000; 31: 36-40.
Anan Y, Kunito T, Ikemoto T, Kubota R, Watanabe I, Tanabe S, Miyazaki N, Petrov EA.
Elevated concentrations of trace elements in Caspian seals (Phoca caspica) found
stranded during the mass mortality events in 2000. Arch Environ Contam Toxicol
2002; 42: 354-362.
Bard, HM. Global transport of anthropogenic contaminants and the consequences for the
Arctic marine ecosystem. Mar Pollut Bull 1999; 38: 356-379.
Barrie LA, Gregor D, Hargrave B, Lake R, Muir D, Shearer R, Tracey B, Bidleman T.
Arctic contaminants: sources, occurrence and pathways. Sci Total Environ 1992;
122: 1-74.
5
Becker PR, Wise SA, Thorsteinson L, Koster BJ, Rowles T. Specimen banking of marine
organisms in the United States: current status and long-term prospective.
Chemosphere 1997; 34: 1889-1906.
Beckmen KB, Blake JE, Ylitalo GM, Stott JL, O ’Hara TM. Organochlorine contaminant
exposure and associations with hematological and humoral immune functional
assays with dam age as factor in free-ranging northern fur seal pups (Callorhinus
ursinus). Mar Pollut Bull 2003; 46: 594-606.
Bratton GR, Flory W, Spainhour CB, Haubold EM. Assessment o f selected heavy metals
in liver, kidney, muscle, blubber, and visceral fat o f Eskimo harvested bowhead
whales Balaena mysticetus from Alaska's North Coast. 1997. Barrow, Alaska,
Department o f Wildlife Management, North Slope Borough, 233 pp.
Brousseau P, De Guise S, Voccia I, Ruby S, Fournier M. Immune status of St. Lawrence
estuary beluga whales. 2003. In Vos, J. G., Bossart, G. D., Fournier, M., O’Shea,
T. J. Toxicology o f Marine Mammals. Taylor & Francis, London.
Bustamante P, Morales CF, Mikkelsen B, Dam M, Caurant F. Trace element
bioaccumulation in grey seals Halichoerus grypus from Faroe Islands. Mar Ecol
Prog Ser 2004; 267:291-301.
6
Clapham PJ, Young SB, Brownell RL. Baleen whales: conservation issues and the status
of the most endangered populations. Mamm Rev 1999; 29: 35-60.
Derocher AE, Wolkers H, Colbom T, Schlabach M, Larsen TS, Wiig 0 . Contaminants in
Svalbard polar bear samples archived since 1967 and possible population level
effects. Sci Total Environ 2003; 301: 163-174.
Dietz R, Riget F, Cleemann M, Aarkrog A, Johansen P, Hansen, JC. Comparison of
contaminants from different trophic levels and ecosystems. Sci Total Environ
2000; 245:221-231.
Dunbar MR, Cunningham MW, Linda SB. Vitamin A concentrations in serum and liver
from Florida panthers. J Wildl Dis 1999; 35: 171-177.
Dunbar MR, Velarde R, Gregg MA, Bray M. Health evaluation o f a pronghorn antelope
population in Oregon. J Wildl Dis 1999; 35: 510.
Ebinghaus R, Kock HH, Temme C, Einax JW, Lowe AG, Richter A, Burrows JP,
Schroeder WH. Antarctic springtime depletion of atmospheric mercury. Environ
Sci Techno1 2002; 36: 1238-1244.

Egeland GM, Ponce R, Knecht R, Bloom NS, Fair J, Middaugh JP. Trace metals in
ancient hair from the Karluk archeological site, Kodiak, Alaska. Int J Circumpolar
Health 1999; 58: 52-56.
Fay FH. Ecology and biology of the Pacific Walrus, Odobenus rosmarus divergens
Illiger. 1982. United States Department of the Interior, Fish and Wildlife Service,
North American Fauna 74, Washington, D. C., 279 pp.
Gauthier JM, Dubeau H., Rassart E. Mercury-induced micronuclei in skin fibroblasts of
beluga whales. Environ Toxicol Chem 1998; 17: 2487-2493.
Gauthier JM, Dubeau H, Rassart E. Evaluation of genotoxic effects of environmental
contaminants in cells of marine mammals, with particular emphasis on beluga
whales. 2003. In Vos, J. G., Bossart, G. D., Fournier, M., O ’Shea, T. J.
Toxicology o f Marine Mammals. Taylor & Francis, London.
George JC, Bada J, Zeh J, Scott L, Brown SE, O'Hara T, Suydam R. Age and growth
estimates o f bowhead whales (Balaena mysticetus) via aspartic acid racemization.
Can JZ ool 1999; 77: 571-580.
8
9
Hansen JC, Toribara TY, Muhs AG. Trace metals in human and animal hair from the
15th century graves at Qilakitsoq compared with recent samples. Meddelelser im
Gronland, Man & Society 1989; 12: 161-167.
Hansen CT, Nielsen CO, Dietz R, Hansen MM. Zinc, cadmium, mercury and selenium in
minke whales, belugas and narwhals from West Greenland. Polar Biol 1990; 10:
529-539.
Honda K, Tatsukawa R, Itano K, Miyazaki N, Fujiyama T. Heavy metal concentrations in
muscle, liver and kidney tissue of striped dolphin, Stenella coeruleoalba, and their
variations with body length, weight, age and sex. Agricult Biol Chem 1983; 47:
1219-1228.
Jepsen PD, Bennett PM, Deaville R, Allchin CR, Baker JR, Law RJ. Relationships
between polychlorinated biphenyls and health status in harbor porpoises
(Phocoena phocoena) stranded in the United Kingdom. Environ Toxicol Chem
2005; 24: 238-248.
Krahn MM, Becker PR, Tilbury KL, Stein JE. Organochlorine contaminants in blubber of
four seal species: integrating biomonitoring and specimen banking. Chemosphere
1997; 34: 2109-2121.
Kucklick JR, Struntz WDJ, Becker PR, York GW, O'Hara TM, Bohonowych JE.
Persistent organochlorine pollutants in ringed seals and polar bears collected from
northern Alaska. Sci Total Environ 2002; 287: 45-59.
Lander ME, Harvey JT, Gulland FMD. Hematology and serum chemistry comparisons
between free-ranging and rehabilitated harbor seal (Phoca vitulina richardsi)
pups. J Wildl Dis 2003; 39: 600-609.
Lie E, Larsen HJS, Larsen S, Johansen GM, Derocher AE, Lunn NJ, Norstrom RJ, Wiig
O, Skaare JU. Does high organochlorine (OC) exposure impair the resistance to
infection in polar bears (Ursus maritimus)? Part I: Effect o f OCs on the humoral
immunity. J Toxicol Environ Health A 2004; 67: 555-582.
Lindberg SE, Brooks S, Lin C-J, Scott KJ, Landis MS, Stevens RK, Goodsite M, Richter
A. Dynamic oxidation of gaseous mercury in the Arctic troposphere at polar
sunrise. Environ Sci Technol 2002; 36: 1245-1256.
Lowry LF, Frost KJ, Bums JJ. Variability in the diet o f ringed seals, Phoca hispida, in
Alaska. Can J Fish Aquat Sci 1980; 37: 2254-2261.
10
Lowry LF, Frost KJ, Calkins DG, Swartzman GL, Hills S. Feeding habits, food
requirements, and status of Bering Sea marine mammals. 1982. Anchorage, North
Pacific Fishery Management Council, 233 pp.
Lowry, LF, Sheffield G. Stomach contents of bowhead whales harvested in the Alaskan
Beaufort Sea. In Richardson, W. J. and Thompson, D. H. Bowhead whale feeding
in the Eastern Alaskan Beaufort Sea: Update o f scientific and traditional
information. 2002. Vol. 1. OCS Study MMS 2002-012. LDL Report TA2196-7.
LGL Ltd. King City, Ontario, Canada.
Ponce RA, Egeland GM, Middaugh JP, Becker PR. Twenty years o f trace metal analyses
o f marine mammals: Evaluation and Summation o f data from Alaska and other
Arctic regions. State of Alaska Epidemiology Bulletin 1997; 1: 1-15.
Prestrud P, Norheim G, Sivertsen T, Daae HL. Levels of toxic and essential elements in
arctic fox in Svalbard. Polar Biol 1994; 14: 155-159.
Puls, R. Mineral levels in animal health. Diagnostic data. 1994. Sherpa International,
Clearbrook, British Columbia, Canada. 356 pp.
Smith TG, Armstrong FAJ. Mercury and selenium in ringed and bearded seal tissues
from Arctic Canada. Arctic 1978; 31: 75-84.
11
Sonne-Hansen C, Dietz R, Leifsson PS, Hyldstrup L, Riget FF. Cadmium toxicity to
ringed seals (Phoca hispida): an epidemiological study of possible cadmium-
induced nephropathy and osteodystrophy in ringed seals (Phoca hispida) from
Qaanaaq in Northwest Greenland. Sci Total Environ 2002; 295: 167-181.
Toribara TY, Muhs AG. Hair: a keeper of history. Arctic Anthropol 1984; 21: 99-108.
Warburton J, Seagars DJ Heavy metal concentrations in liver and kidney tissues of
pacific walrus. Continuation of a baseline study. 1993. Anchorage, Alaska, US
Fish and Wildlife Service, 27 pp.
Watanabe I, Kunito T, Tanabe S, Amano M, Koyama Y, Miyazaki N, Petrov EA,
Tatsukawa R. Accumulation of heavy metals in Caspian seals (Phoca caspica).
Arch Environ Contam Toxicol 2002; 43: 109-120.
Woshner VM. Concentrations and interactions of selected elements in tissues of four
marine mammal species harvested by Inuit hunters in Arctic Alaska, with an
intensive histologic assessment, emphasizing the beluga whale. 2000. Ph.D.
thesis, College o f Veterinary Medicine, University o f Illinois, Urbana-
Champaign, IL.
r
12
Woshner VM, O'Hara TM, Bratton GR, Beasley VR. Concentrations and interactions of
selected essential and non-essential elements in ringed seals and polar bears of
Arctic Alaska. J Wildl Dis 2001a; 37: 711-721.
Woshner VM, O'Hara TM, Bratton GR, Suydam RS, Beasley VR. Concentrations and
interactions of selected essential and non-essential elements in bowhead and
beluga whales of Arctic Alaska. J Wildl Dis 2001b; 37: 693-710.
Ylitalo GM, Matkin CO, Buzitis J, Krahn MM, Jones LL, Rowles T, Stein JE. Influence
o f life-history parameters on organochlorine concentrations in free-ranging killer
whales (Orcinus orca) from Prince William Sound, AK. Sci Total Environ 2001;
281: 183-203.
r
13
CHAPTER 1
FEEDING ECOLOGY OF PHOCID SEALS IN THE ALASKAN AND
CANADIAN ARCTIC1
1.1 ABSTRACT
Feeding habits o f ringed, bearded, and spotted seals were studied using stomach
contents and stable isotopes of nitrogen and carbon. Bearded seals relied heavily on the
benthic food chain, with crustaceans and mollusks making up the majority of the prey
(Frequency of Occurrence (FO,) = 97.2% and 83.3%, respectively), but fish were
common as well (FO, = 80.6%)). Both zooplankton and fish were significant prey for
ringed seals (FO, = 64.1 %> and 61.5%, respectively), while fish was the principal prey of
spotted seals. In ringed seals, age and sex had a large impact on gastric prey composition.
Stomachs o f male ringed seals caught in Barrow, Alaska were more likely to contain
zooplankton while those o f females were more likely to contain fish. Stable nitrogen
isotope ratios o f ringed seal muscle were significantly higher for females than for males
(16.7 ± 0.6%o and 17.1 ± 0.6%o, respectively), indicating that females occupied a higher
trophic level. Stomachs o f older ringed seals were more likely to contain gadids, while
the presence of zooplankton was age-independent. §15N was positively correlated to age
in spotted seal muscle, suggesting dependence on higher trophic level prey with
increasing age. This was not indicated in the analysis o f stomach contents possibly due to
1 Dehn, L.-A., Sheffield, G. G., Follmann, E. H., Duffy, L. K., Thomas, D. L., O ’Hara, T. M. Feeding
ecology ofphocid seals in the Alaskan and Canadian Arctic. Prepared for submission to Polar Biology.
15
abundance o f spawning herring during summer. 813C was positively correlated to age in
ringed seals, possibly indicating carbon transfer from maternal tissues to pups during
gestation and lactation. 815N was significantly highest in spotted seals (17.6 ± 0.9%o) and
is in agreement with their fish-dominated diet. 815N was not different between ringed and
bearded seals harvested in Alaska (16.9 ± 0.6%o and 16.8 ± 1.0%o, respectively)
suggesting both species occupy a similar trophic level during summer, while 815N was
lowest in walrus (13.6 ± 1.0%o). Carbon-13 was most enriched in bearded seals and
walrus (-17.1 ± 0.6%o and -17.3 ± 0.9%o) reflecting greater use o f the benthic ecosystem.
Ringed seals from the Canadian Arctic were highly depleted in 13C (-20.4 ± 0.4%o)
compared to Alaskan pinnipeds, likely because o f influence from the Beaufort Sea versus
Chukchi and Bering seas. 813C was not statistically different between Alaskan ringed and
spotted seals, but variability in spotted seals was high, suggesting importance of both
coastal and offshore feeding habitats.
Keywords: Ringed seal, bearded seal, spotted seal, walrus, stable isotopes, feeding
ecology, stomach contents analysis, Arctic
16
1.2 INTRODUCTION
Distribution, movement, and feeding ecology of ringed (Phoca hispida), bearded
(Erignathus barbatus) and spotted (Phoca largha) seals are strongly associated with
Arctic sea ice (Braham et al. 1984). They are commonly referred to as ice or pagophilic
seals, but are adapted to different niches within the sea ice environment, and only some
overlap occurs among species (Bums 1970; Simpkins et al. 2003). These seals are an
important prey to higher trophic level organisms, including Arctic fox (Alopex lagopus),
polar bear ( Ursus maritimus), humans and some walrus (Odobenus rosmarus) (Smith
1976; Lowry and Fay 1984; Hammill and Smith 1991; Derocher et al. 2002). Ice seals
have significant nutritional and cultural importance to the Native coastal populations of
Alaska and other Arctic areas.
Ringed seals are the most abundant and smallest seal in circumpolar Arctic
waters. They prefer fast ice, dense pack ice or pressure ridges (Braham et al. 1984).
Feeding habits o f these seals have been described in the Canadian High Arctic, Svalbard,
Greenland and the Bering and Chukchi seas (Lowry et al. 1980a; Bradstreet and Finley
1983; Smith 1987; Siegstad et al. 1998). Major prey includes Arctic cod (Boreogadus
saida), amphipods, and krill (euphausids and mysids). Seasonal shifts in ringed seal
feeding show presence o f krill in summer and Arctic cod in winter and spring (Lowry et
al. 1980a). Age-related prey prevalence and a decline in the importance o f crustaceans
with age also have been suggested for ringed seals (Lowry et al. 1980a; Bradstreet and
Finley 1983; Smith 1987; Siegstad et al. 1998).
17
Bearded seals have a circumpolar distribution, prefer pack ice, polynyas, and are
rarely found in shorefast ice conditions (Bums 1970). Studies conducted in the Canadian
High Arctic, Central Bering and Chukchi seas describe a variety o f different benthic and
epibenthic prey in bearded seal stomachs (Lowry et al. 1980b; Finley and Evans 1983;
Antonelis et al. 1994), but importance o f prey types vary by location and age groups.
Competition for habitat and foods of bearded seals with benthic feeding Pacific walrus
has been suggested (Lowry et al. 1980b; Cleator 1996; Simpkins et al. 2003).
Little information on feeding ecology is available for spotted seals, and only in
the past 20 years has this species been differentiated from its close relative, the harbor
seal (Phoca vitulina) (Bums et al. 1984). In the Alaskan Arctic, spotted seals occupy the
Bering Sea ice front during winter and spring and travel to coastal habitats in the Bering,
Chukchi and Beaufort seas during the open-water season (Braham et al. 1984; Lowry et
al. 1998). Schooling fish, such as Pacific herring (Clupea pallasii), capelin (Mallotus
villosus), smelt (Osmerus spp.) and Arctic cod dominate their diet in these areas, while
invertebrates, such as shrimp, are found less frequently in their stomachs (Bukhtiyarov et
al. 1984). However, there is some indication that prey consumed varies with age with
younger seals preying predominately on small crustaceans, while the frequency o f fish is
higher in adults (Kato 1982; Bukhtiyarov et al. 1984).
Analysis o f stomach contents has been used extensively in these earlier studies to
determine feeding ecology of pagophilic seals. Recently, it has been repeatedly suggested
that analysis o f stomach contents or scat o f marine mammals is strongly biased and
overestimates prey with chitinous structures (e.g., crustaceans, cephalopod beaks) and
F
fish otoliths that resist digestion or are retained in the stomach, and underestimates soft
prey such as snails and mussels that are digested within hours (Murie and Lavigne 1986;
Gales and Cheal 1992; Bowen 2000; Sheffield et al. 2001). Secondary ingestion of prey,
such as digestive tract contents of ingested fish, could also lead to biased prey
assessments (Santos et al. 2001). Thus, it is difficult to accurately assess the importance
of prey species, prey preference or dietary shifts as the stomach contents only represent a
“snapshot” in time. The use of other methods has been suggested by Sheffield et al.
(2001) to identify diet, and a combination of classic methods with chemical feeding
ecology has proven powerful in dietary reconstructions (Hobson et al. 1997; Bums et al.
1998).
Stable isotopes of carbon and nitrogen have become increasingly more important
in studies of trophic ecology. Stable nitrogen isotopes become more enriched in
consumer tissues as trophic level increases due to selective incorporation of the heavier
isotope in tissues (DeNiro and Epstein 1981). Thus, nitrogen isotope analysis is helpful in
establishing trophic level and predator-prey relationships (Kelly 2000). However, tissue-
specific turnover rates and enrichment factors are poorly understood and make evaluation
of nitrogen isotope ratios difficult. Without prior knowledge o f typically ingested prey,
the results o f stable isotope analysis are difficult to interpret (Gannes et al. 1997). Age
and body condition can have substantial impact on nitrogen isotope ratios and their
interpretation. Hobson et al. (1997) reported enrichment of nitrogen isotopes in muscle of
northern fur seal (Callorhinus ursinus) pups compared to their mothers and suggested
that pups are feeding on a higher trophic level while being nourished by their mothers.
18
Similarly, body condition can impact nitrogen isotope ratios as water stress and body
protein catabolism during starvation will lead to trophic enrichment (Hobson et al. 1993).
Stable carbon isotopes may enrich in consumer tissues to a minor degree and are
therefore less useful in the determination of trophic position or predator-prey
relationships (Tieszen et al. 1983; France 1995a). However, species differences in 513C
can provide insights on feeding location or habitat (Burton and Koch 1999). Schell et al.
(1998) showed more depleted carbon isotope values of zooplankton from the Beaufort
Sea than in the Bering and Chukchi seas, and a similar pattern can be detected in baleen
and muscle of bowhead whales (Balaena mysticetus) that migrate between these two
regions (Schell et al. 1989; Hoekstra et al. 2002). Carbon isotope signatures have also
been used to distinguish between fresh- and saltwater feeding habitats o f harbor seals
(Smith et al. 1996) and have application in identifying animals that rely on either benthic
or pelagic food chains (France 1995b).
Feeding ecology of pagophilic seals in the Alaskan Arctic was last described in
the 1980’s, and changes in prey distribution may have occurred. Feeding ecology
information for these seals has been determined almost solely via stomach contents
analysis, and little information is available on stable isotopes in ice seals. Published data
on stable isotopes in ringed seals vary greatly. Muir et al. (1995) reports stable nitrogen
values of 13.9 ± 1.4%o for ringed seals harvested in the Canadian Arctic, while ringed
seals harvested in Barrow and the Barrow Strait-Lancaster Sound seem to occupy higher
trophic levels at 16.9 ± 0.2%o and 17.3 ± l.l%o, respectively, for 8 I5N (Hobson and
Welch 1992; Hoekstra et al. 2002).
The purpose of this study is to a) evaluate and compare feeding ecology of arctic
phocids harvested in Alaska and Canada using stomach contents and stable isotope
analysis, b) provide baseline data for stable isotopes in muscle o f apparently healthy seals
and typically ingested prey, and c) discuss isotopes in muscle and prey composition in
stomachs with regard to age.
1.3 MATERIALS AND METHODS
1.31 Sampling
All marine mammal samples were obtained during Native subsistence harvests.
Basic morphometries, e.g., body length, blubber thickness and sex were recorded. Seals
were grossly examined for lesions and parasites. Lumbar muscle samples and stomachs
were collected o f ringed and bearded seals in Barrow, Alaska mainly during the summer
period from 1996-2001. Ringed seal samples also were collected in Holman, NWT,
Canada during summer, 2001, Tissues o f spotted seals were collected at Little Diomede
and Shishmaref, Alaska in summer 2000 and 2001. Walrus muscle was obtained in
Barrow and Little Diomede on an opportunistic basis mainly during summer 1998 and
2003 and serves as a comparison to that of bearded seals. Figure 1.1 shows villages and
communities where samples were collected, and Table 1.1 summarizes sample sizes.
Muscle tissue was sub-sampled under clean conditions with titanium or ceramic blades
on a Teflon covered surface, following the sampling protocol for contaminants by Becker
et al. (1999) and stored at -20°C in acid-washed vials or whirlpacks™ until analysis.
Several potential prey species were collected or donated by subsistence hunters in
20
Barrow, Alaska and the Alaskan Bering Strait. Marine mammal samples were collected
and analyzed under the authority of Permit Nos. 782-1399 and 358-1585 issued to the
Alaska Department for Fish and Game (ADFG) and 932-1489-03 issued to T. Rowles of
the Marine Mammal Health and Stranding Response Program.
1.32 Stomach Contents Analysis
Stomachs o f ringed and bearded seals were collected by tying off cardiac and
pyloric sphincters to avoid spillage, placed into a bag and frozen at -20°C until analysis
in Fairbanks. All stomachs of ringed seals harvested in Holman were empty. Stomachs
obtained from spotted seals from Little Diomede and Shishmaref were archived and
analyzed by the ADFG in Fairbanks.
Stomach contents were weighed to the nearest gram for ringed seals and with a
chatillon scale (0.1 pound increments) for bearded seals and sequentially washed through
three sieves with mesh sizes 3.96 mm, 1.4 mm and 0.5 mm. Spotted seal stomach
contents were sequentially washed through sieves with mesh sizes 1.0 mm and 0.5 mm.
Standard reference keys (Rathbun 1929; Akimushkin 1965; Keen and Coan 1974; Butler
1980; Frost and Lowry 1980; Frost 1981; Harkonen 1986; Kathman et al. 1986; Foster
1991; Jensen 1995; Harvey et al. 2000) were used for the identification of fish otoliths
and invertebrate prey to the lowest possible taxonomic level. Identifiable prey were
sorted, counted and weighed to the nearest milligram. Due to digestive biases on
diagnostic tissues o f varying endurance (e.g., overestimation of chitinous prey versus
under-representation o f soft prey, such as echiurid worms and polychaetes) a ranking of
21
r
prey by weight or numerical frequency of prey in the stomach was not determined and
only the frequency of occurrence of prey species i (FO, method) was noted for all
animals. FO, is defined as the percentage of stomachs that contained one or more
individuals o f the prey species i:
FO, = (p,7 p,) * 100
where p, is the number of stomachs with the prey species i and p, is the number of
stomachs with digesta (Hjelset et al. 1999). Nematodes in the stomach and cestodes
migrating from the duodenum to the stomach after death were found in all seals, in
particular bearded seals on a regular basis and were considered normal (Dunbar 1941;
Lauckner 1985). They were not analyzed as a food item and hence not included in pt.
1.33 Stable Isotopes
Lumbar muscle tissue of ringed, bearded, and spotted seals, as well as total body
homogenates o f prey were freeze-dried and ground into a fine powder with mortar and
pestle. For each sample, 0.2 to 0.4 mg of tissue was weighed into a 4.75 x 4 mm tin
capsule, which was then folded into a cube. Samples were analyzed for both stable
carbon and nitrogen ratios at the University of Alaska Fairbanks (UAF) using a Finnigan
MAT DeltaplusXL Isotope Ratio Mass Spectrometer (IRMS) directly coupled to a Costech
Elemental Analyzer (ESC 4010). Samples were flash combusted at 1020°C, followed by
on-line chromatographic separation of sample N2 and CO2 with He as carrier gas.
22
Samples analyzed for 15N /14N and 13C/12C were standardized against atmospheric N 2 and
PeeDee Belemnite limestone, respectively. Enrichment o f a particular isotope was
reported using the following notation and equation:
8R%o = (( sample/- standard) “ 1) X 1000
where the differential notation (5R) represents the relative difference between isotopic
ratios of the sample and standard gases (i.e., 13C/12C, 15N /14N). A laboratory-working
standard (Peptone No. P-7750) was analyzed every 10 samples during analysis, and tin
capsule blanks were run every 20 samples. Calibrations were made with the use of stable
isotope reference materials provided by the National Institute of Standards and
Technology (NIST). External instrument reproducibility for both carbon and nitrogen
isotope analysis was +/- 0 .2%o.
Trophic level (TL) was calculated using the equation provided by Hobson and Welch
(1992):
TLcons = TLcop + (§,5Ncons - 815NCOp) / 3.8
where TLcons and §15Ncons are trophic level and nitrogen isotope concentration,
respectively, o f the consumer, and TLcop (by convention copepods are set at TL 2) and
S15Ncop are trophic level and nitrogen isotope composition, respectively, of copepods. A
stepwise trophic level enrichment of 3.8%o was assumed after Hobson and Welch (1992).
r
23
Calculated trophic level was compared to trophic level estimates from stomach contents
reported by Pauly et al. (1998) for marine mammals.
1.34 Aging
Jaws and claws were collected from seals after 1997 and stored at -20°C until
analysis. Ringed seals harvested in 1996 and 1997 were aged using the keratin layers of
claws, which represent a minimum age estimate for the animals (Benjaminsen 1973).
Two canines or canine and postcanine (if only one canine was available) were extracted
from the upper or lower jaw (depending on availability), submerged in a hot water bath
for 30 minutes to avoid damage to the structure of the cementum, and stored in paper
envelopes (Matson 1981). All teeth were shipped to Matson's Laboratory, Milltown,
Montana for slide preparation. Teeth were prepared in 14 p.m sections, placed on glass
slides and stained with Giemsa histological stain suitable for cementum analysis. Age
was estimated by counting annual growth layers in the cementum of teeth by two
independent readers at UAF. Preparation and evaluation o f teeth were done doubly blind
by randomly assigning an identification number to each tooth with two teeth analyzed per
animal. The animal identification and matching teeth were revealed only after all ages
were estimated in duplicate. One growth layer per year o f age was assumed for all seals
(Benjaminsen 1973; Stewart et al. 1996). Maximum variation in age estimates was +/- 1
year for seals younger than 15 years and +/- 5 years in animals older than 15.
1.35 Statistical Analysis
The variables in the data set (age, § !5N and §13C) were ranked prior to analysis to
to reduce the risk o f violations of normality and homogeneity o f variance assumptions.
Variables were analyzed for sex and location differences using a t-test within a seal
species. If no significant differences were detected for each variable, sexes and localities
were pooled. A residual analysis was conducted to determine any possible violations of
assumptions. Spearman rank correlation was calculated within a species to determine
correlations between age and stable isotope ratios. LOESS non-parametric smoothing
was utilized on non-ranked raw data to estimate suitable functions between two variables
and compare regression surfaces between groups. The Kruskal-Wallis test followed by
Tukey’s multiple comparison test was used to compare variable means between seal
species. For statistical analysis of stomach contents, two categories were established for
each seal species based on presence and absence of prey items (0 = absent, 1 = present).
These categories were analyzed using logistic regression with interaction term (forward
selection) with age and sex (indicator variable) as independent variables for each species.
All statistical analyses were performed using SAS (Version 8) with a = 0.05. Sigma-Plot
(Version 7.0) was used for graphic presentation o f data. Results are reported as mean +/-
standard deviation (SD) unless otherwise noted.
25
r
1.4 Results
1.41 Stomach Contents Analyses
Table 1.2 presents frequency of occurrence (FO,) o f prey in stomachs of bearded,
ringed, and spotted seals harvested in Alaska. FO, of prey was calculated for all stomachs
containing digesta. For ringed seals, 50 stomachs were analyzed and 11 were empty or
contained only bile, blood or parasites. O f 37 bearded seal stomachs, one was empty and
contained only parasites. For spotted seals 43 stomachs were analyzed and 5 contained no
food. All 25 stomachs of ringed seals harvested in Holman, Canada were empty.
The frequency of fish was 61.5% in stomachs of ringed seals containing prey
(Table 1.2). O f all fish identified, gadids like Arctic cod and saffron cod (Eleginus
gracilis) were identified most often, followed by Pacific sand lance (Ammodytes
hexapterus). Zooplankton in stomachs of ringed seals occurred at a frequency of 64.1%>.
Both euphausids and mysids were consumed in similar proportions (53.8% and 46.2%,
respectively), as were amphipods and pandalid shrimp (38.5% and 30.8%, respectively).
All other prey were present in less than 10% of stomachs with contents.
Prey diversity in bearded seal stomachs was higher than in ringed and spotted
seals with more than 20 different species consumed representing more than 10 animal
phyla (Table 1.2). Prey was ingested intact in most cases though only feet o f ingested
clams and snails were present and only abdomens of predominately gravid female spider
crabs (Hyas coarctatus) was identified from stomach contents. Crustaceans were found in
97.2%) of stomachs. O f the prey species consumed, sculptured shrimp (Sclerocrangon
boreas) was present most often and occurred in 83.3% of the stomachs. The frequency of
26
27
fish in bearded seal stomachs was 80.6%, with eelpout (Lycodes spp.) making up the
majority of teleost prey (58.3%). Other prey identified in more than 50% of the stomachs
consisted o f northern shrimp (Pandalus spp.), amphipods, spider crabs, octopus,
Greenland cockle (Serripes groenlandicus) and echiurid worms.
Fishes were identified in all spotted seal stomachs containing prey (Table 1.2).
Most frequently found was Pacific herring (52.6%), followed by gadid fish (47.4%>) and
rainbow smelt (23.7%>). Capelin, sand lance, and flatfish were found in more than 10% of
the stomachs, while other teleosts (e.g., sculpin) were present in less than 10%.
Invertebrate prey was mainly comprised of crustaceans (44.7%>) with amphipods making
up the largest proportion (26.3%). Mollusks occurred in less than 10% of the stomachs.
Generally, there was no statistical difference in the frequency of prey types
consumed by male and female bearded and spotted seals. However, bearded seal males
were 6 times more likely to contain smelt (odds-ratio (OR) = 6.06, p = 0.04) and 7.5
times more likely to contain sea cucumber than females (OR = 7.52, p = 0.01). In ringed
seals, male stomachs were about 16 times more likely to contain zooplankton than
females (OR = 15.87, p = 0.0004). This relationship was also significant when mysids
and euphausids were analyzed separately (p = 0.007 and 0.002 for euphausids and
mysids, respectively). Similarly, stomachs of female ringed seals were 5.4 times more
likely to contain fish than those o f males (OR = 5.42, p = 0.04). Sex was not significant
when teleost species were analyzed separately.
Older bearded seals were less likely to consume welkes (Buccinum spp.) (OR =
0.87, p = 0.049). No other age effects were noted in bearded seal diets. In spotted seals,
E
28
presence o f capelin and flatfish increased with increasing age (p = 0.003, OR = 1.90 and
p = 0.005, OR = 1.41, for capelin and flatfish, respectively). In ringed seals only the
consumption o f cod was related to age (p = 0.01) and presence o f cod is 1.2 times more
likely with increasing age (OR = 1.22), while zooplankton ingestion was age
independent.
1.42 Stable Isotopes
Age and isotope composition of spotted seals harvested near Shishmaref and
Little Diomede were not statistically different (p = 0.65, 0.83 and 0.12 for age, 8I5N and
813C, respectively). Therefore these data were pooled to increase sample size and power.
Ringed seals harvested in Holman were significantly more depleted in 13C than ringed
seals from Barrow (p = <0.0001). Stable nitrogen isotope ratios and age were higher in
Canadian ringed seals (p = 0.006 for both 815N and age) than in animals sampled in
Barrow and therefore seals from Alaska and Canada were analyzed as different groups.
Generally, there were no sex differences within species in age composition, stable carbon
or stable nitrogen isotope ratios. However, female ringed seals harvested in Barrow had
significantly higher stable nitrogen isotope ratios than males harvested in Barrow (p =
0.01) and they were analyzed separately for this variable. Male and female ringed seals
from Holman as well as bearded and spotted seal sexes were pooled.
Spearman rank test showed no significant correlation between variables in
bearded seals and Holman ringed seals. Age was positively correlated to stable nitrogen
F
isotopes (p = 0.009) in spotted seals, and positively correlated to 513C in Barrow ringed
seals (p = 0.0007).
Mean ratios of stable carbon and nitrogen isotopes in seals, walrus and some prey
species (analyzed in this study and compiled from literature) are given in Table 1.3. 815N
in prey is quite variable, ranging from 16.7%o in large squid to 7.9 ± 0.8%o in amphipods,
reflecting different trophic levesl o f these pinniped prey items. Stable nitrogen isotope
signatures o f ringed, bearded and spotted seal muscle ranged widely. Mean 815N in
ringed seals was 16.9 ± 0.6%o (range 15.6%o to 18.0%o) in Barrow, and 17.2 ± 0.7%o in
Holman (range 14.6%0 to 18.0%o). For bearded seal muscle, mean 815N was 16.7 ± 0.9%o
and varied between 15.2%o and 18.8%o. Mean stable nitrogen isotope ratio in muscle of
spotted seals was 17.6 ± 0.9%o (range 15.9%o to 19.4%o). Values o f 813C in ringed seals
showed a wide range as well, from -21.3%o to -18.2%0 in Barrow and -20.9% o to -19.2%o
in Holman. Mean values in bearded seals were -17.1 ± 0.6%o (range -18.7%o to -15.8%o)
and ranged from -2 0 .0 %o to - 1 5.9%o in spotted seals.
Kruskal-Wallis test showed significant differences in variables between seal
species (p = <0.0001 for 815N and S13C). Tukey’s post-hoc test established that stable
nitrogen isotope ratios were significantly higher in spotted seals and Holman ringed seals
than bearded seals and male Alaskan ringed seals. 815N was not statistically different in
Holman ringed seals, spotted seals and Barrow ringed seal females. 815N was lower in
walrus than in the seals. Stable carbon isotopes were significantly more enriched in
bearded seals and walrus than any other species, while Canadian ringed seals were most
29
depleted in !3C. No difference in 513C was detected between ringed seals from Barrow
and spotted seals. Figure 1.2 illustrates §I5N versus 513C in all pinnipeds analyzed.
1.5 DISCUSSION
1.51 Stomach Contents Analyses
1.511 Ringed Seals
Analysis o f ringed seal stomachs showed Arctic cod prevalence increased with
age and could possibly be related to hunting experience or habitat when foraging. This
finding agrees with observations by Lowry et al. (1980a) that ringed seal pups consume
less cod than adults, and Bradstreet and Finley (1983) noted a decline in the presence of
crustaceans in stomachs with age in ringed seals. However, age was not a significant
variable for consumption of zooplankton, crustaceans or invertebrate prey in general in
this study. This could be related to the use of the FO, method, as it tends to overestimate
the importance of less commonly or unintentionally ingested prey (Hjelset et al. 1999). It
is possible that seals preying on schooling fish, such as Arctic cod, will also ingest krill
and amphipods as fish schools feed on zooplankton patches (Lowry and Frost 1981; Hop
et al. 1997). Hence a decline in the importance o f crustaceans with age cannot be ruled
out, as the relationship of numerical frequency o f krill with age was not determined. It is
possible that ingestion of zooplankton is necessary nutritionally for these seals. Very little
is known about nutritional quality o f most marine forage or nutritional requirements of
seals. Geraci (1975) reported high levels of thiaminase, an enzyme that breaks down
thiamine (Vitamin Bi), in herring, smelt and capelin. As a result, captive and wild seal
30
populations sustained exclusively on these fish can suffer from thiamine deficiency.
Hence, inclusion o f krill in the diet, even in adult animals, could serve to fulfill a dietary
requirement.
Analysis of stomach contents in this study showed significant differences in prey
composition between male and female ringed seals harvested in the Barrow area. This
difference in prey composition between sexes was also detected by means of stable
isotope analysis. 815N was significantly higher in females than males and stomach
contents analysis showed that females were more likely to eat fish, while males
consumed more zooplankton. Lowry et al. (1980a) reported that female ringed seals from
the Bering Sea ate more fish and less shrimp than did males, but differences were
minimal and similar differences in prey selection could not be found in other Arctic
regions. Possible explanations for the differences in foods ingested by male and female
ringed seals could include sexual segregation and associated differential use of resources.
Fedoseev (2000) described segregation of ice-associated seals by age and sex outside the
breeding period. Differences in foraging strategy and prey selection between sexes have
been indicated for northern elephant seals (Mirounga angustirostris) (Le Boeuf et al.
2000) and have been suggested for northern fur seals (Hobson et al. 1997).
Several circumpolar studies have noted that ringed seals prey only on a few key
taxa, and Arctic cod and a variety of crustaceans were found as important food items
(Fedoseev 1965; Lowry et al. 1980a; Bradstreet and Finley 1983; Smith 1987). Results of
this study also show that krill and fishes (in particular Gadidae) make up the majority of
ringed seal diet and are consumed in similar frequencies. Lowry et al. (1978) noted that
31
amphipods had a high frequency (69%) in ringed seal stomachs taken near Barrow, but
comprised only 4.6% of the total combined volume. Similarly, frequency of amphipods
in this study was 39%, but biomass consumed was likely negligible. Amphipods have
been reported as a major food item for ringed seals from Svalbard and the Canadian
Arctic (Dunbar 1941; Bradstreet and Finley 1983; Smith 1987; Weslawski et al. 1994).
However, based on stable nitrogen isotope ratios in ringed seals from Barrow and
Holman, and assuming an enrichment factor of 2.4%o for 515N in seal muscle (Hobson et
al. 1996), it is highly improbable that amphipods (515N = 7.9 ± 0.8%o) make up a large
proportion of the diet in either region. However, large variation in prey availability by
region may confound a large scale geographical comparison.
1.512 Bearded Seals
Stomachs of bearded seals examined in this study contained a wide variety of
benthic and epibenthic prey and these seals can be characterized as opportunistic
generalists. Some aspects of bearded seal diet were similar to those previously reported,
but others were markedly different. Antonelis et al. (1994) reported high frequencies of
fish in bearded seals sampled in the Bering Sea in spring; the most common teleost
species consumed was capelin. Finley and Evans (1983) also found large occurrences of
fish in bearded seal stomachs from the Canadian Arctic with gadids being most common.
In contrast, Lowry et al. (1980b) did not consider fish important prey for bearded seals
based on volumetric measurements, even though frequency o f fish ranged from 78%) -
82%). However, volume of fish would be severely underestimated when only otoliths or
bones are present. Frequency of fish found in stomachs of seals from the Barrow area was
similar (80.6%) to occurrences reported by Lowry et al. (1980b), but the most common
species consumed was eelpout followed by gadids.
Large regional differences in consumption of clams are seen in bearded seal diets.
While frequencies o f Greenland cockle in this study are high (50%) and are in agreement
with prevalence o f cockle reported by Lowry et al. (1980b) in the Bering Sea (63%)
others only documented infrequent occurrences ranging from 7-8% in the Canadian
Arctic and Svalbard (Antonelis et al. 1994; Hjelset et al. 1999) to absence in diet in the
Okhotsk Sea (Pikharev 1941).
Frequency of octopus and echiurid worms in stomachs also varied among
locations. Finley and Evans (1983) noted a high frequency o f occurrence o f octopus in
bearded seal stomachs from the Canadian Arctic, but amounts consumed were minimal,
while echiurid worms were not found. They concluded that neither octopus nor marine
worms were important prey. Antonelis et al. (1994) and Hjelset et al. (1999) came to the
same conclusion for bearded seals harvested in the Bering Sea and Svalbard, respectively.
Lowry et al. (1980b) found no cephalopods, and echiurids were of minor importance. In
contrast, this study showed high frequencies of octopus and echiurids in the diet of
bearded seals harvested near Barrow and is in accordance with studies in the Sea of
Okhotsk (Pikharev 1941).
The high frequency o f occurrence of crustacean prey is in agreement with
previous studies, though some regional differences are notable in species composition
(Pikharev 1941; Lowry et al. 1980b; Finley and Evans 1983; Antonelis et al. 1994;
33
Hjelset et al. 1999) Sea cucumber was reported as a minor food item in bearded seal
stomachs analyzed from the Canadian Arctic and Okhotsk Sea (Pikharev 1941; Finley
and Evans 1983), but was fairly common in seals in this study. These variations in
bearded seal diet are likely area specific and reflect the local distribution of available prey
in the Arctic. However, there were evident variations in prey composition reported from
the Bering and Chukchi seas (Lowry et al. 1980b; Antonelis et al. 1994). Differences in
frequencies of occurrence in stomachs of seals collected in this study from the Chukchi
Sea could reflect changes in prey distribution or abundance over the past 20 years.
Results of this study show that males are more likely than females to consume sea
cucumber and smelt. This could be due to sex-related differential use o f feeding habitats
and associated small changes in benthic fauna. Tarasevich (1976) suggested that females
use habitats closer to shore and avoid feeding at greater depth.
Lowry et al. (1980b) found increased importance o f mollusk prey with age and
suggested acquired behavior as a possible explanation. Segregation by age and associated
differences in diet composition were not evident in this study, though some age-related
variations in prey consumption was found for whelk (Buccinum spp.), and its prevalence
decreased with increasing age.
1.513 Spotted Seals
The high frequency o f fish in spotted seal diet is in accordance with studies
conducted in the Alaskan and Russian Arctic and the Sea of Okhotsk (Bukhtiyarov et al.
1984; Sobolevskii 1996). The most common species present in spotted seal stomachs
34
35
analyzed in this study was herring followed by gadids. Bukhtiyarov et al. (1984) noted
that herring and smelt are minor foods for spotted seals in spring, but increase in
prevalence during summer and fall. In late spring and early summer, spotted seals in the
Sea of Okhotsk consumed mostly walleye pollock (Theragra chalcogramma), followed
by herring (Kato 1982). Pacific herring are abundant in coastal waters during spawning in
summer and migrate offshore to their wintering grounds after spawning (Lassuy 1989).
Hence spotted seals likely are responding to seasonal availability of forage fish.
However, salmon has been described as an important component o f the diet in summer
during spawning (Sobolevskii 1996; Lowry et al. 2000) but was not identified from
stomachs o f spotted seals in this study.
Gol’tsev (1971), Kato (1982), and Bukhtiyarov et al. (1984) reported high
frequencies o f crustacean prey in younger spotted seals while fish and cephalopods made
up the majority of the adult diet. However, no age-related differences were found in the
consumption of invertebrate prey in this study. This could be associated with the
abundance o f spawning herring that would make this species seasonally accessible and
easy prey for spotted seal pups. However, age was a significant factor in the prevalence
of flatfish and capelin in older seals. Bukhtiyarov et al. (1984) reported that older seals
are more likely to feed on benthic organisms. Benthic prey may only be available to
adults due to restrictions in diving performance of juveniles, as has been suggested for
harbor seal pups (Jorgensen et al. 2001). This could explain the presence of flatfish or
other benthic prey in adult spotted seals and relative absence in pups.
1.52 Stable Isotopes
1.521 Ringed Seals
Stable nitrogen isotopes varied over the range o f one trophic level in ringed seals
from both Barrow (15.6%o to 18.0%o) and Holman (14.6%o to 18.0%o). This possibly
reflects the consumption of either krill or Arctic cod. Hobson et al. (1996) suggested an
enrichment factor o f 2.4%o for 515N in seal muscle. Assuming a seal feeding exclusively
on zooplankton, a muscle 815N value of approximately 13%o could be expected while that
of a seal preying on cod would approximate 18%o. These extremes reflect the upper, but
not lower ranges of 5 I5N found in ringed seals, suggesting minor significance of a
zooplankton-exclusive diet. Also, average concentrations of §15N (16.9%0) indicate a krill
and cod mix for these seals, and are in agreement with stomach contents findings.
While the gastric prevalence of Arctic cod was positively correlated to age, 815N
showed no age dependence. Several young animals (<1 year) and one fetus displayed
elevated 15N values. Hobson et al. (1997) and Das et al. (2003) observed similar nitrogen
enrichment in northern fur seal pups and suckling harbor porpoises (Phocoena
phocoena), respectively, and suggested that milk has isotope signatures comparable to
other maternal tissues. Kurle (2002) proposed preferential transfer o f 15N to milk. Thus,
trophic enrichment could occur in nursing pups or in fetuses during gestation compared
to their mothers. Roth and Hobson (2000) theorized that high rate o f protein synthesis
and catabolism in tissues o f juveniles causes excretion o f predominantly light nitrogen
while the heavier isotope is incorporated and magnified in tissues.
36
6i5N was significantly different between male and female ringed seals harvested in
Barrow, with females occupying a higher trophic level. Das et al. (2003) made a similar
observation with female harbor porpoise being enriched in 15N over males and suggested
higher consumption or feeding on larger prey by pregnant or lactating animals. Stomach
content analysis o f ringed seals confirmed that females are more likely to eat cod and less
krill than males, thus explaining the higher trophic status observed from stable nitrogen
isotope ratios.
A positive correlation of carbon isotope ratios with age was shown for ringed
seals from Barrow, but not for ringed seals from the Canadian Arctic (Figure 1.3). In both
locations a similar relationship was noticeable after a LOESS non-parametric smoothing.
Thus, the positive relationship observed in Barrow seals was most likely driven by some
young-of-the-year (YOY) and one fetus (highlighted as open triangles in Figure 1.3) that
are highly depleted in 13C compared to the majority of seals. Body fat is usually depleted
in l3C due to selective fractionation (DeNiro and Epstein 1977) and the low values for the
fetus and YOY suggest the mobilization and transfer of carbon from body fat of the
mother to fetal development and milk production. Wilson et al. (1988) found that 54% of
the carbon in milk is derived from body fat in Holstein cows during early lactation. Seal
pups receive high-fat milk and are weaned after about 2 months, during nursing they
more than double their weight (Kelly 1988).
Carbon isotope signatures in Canadian ringed seals were significantly depleted
compared to all other seals. Schell et al. (1998) reported more depleted carbon-13 values
in the Beaufort Sea versus continental shelf waters of the Bering and Chukchi seas.
37
Figure 1.3 illustrates that 513C in ringed seals from the Canadian Arctic can clearly be
distinguished from ringed seals harvested in Barrow. Since many phocid seals migrate
(Lowry et al. 1998) and ringed seals of the Canadian Arctic are known to move towards
the Chukchi and Bering seas (Smith 1987; Harwood and Smith 2003), it is possible that
some of the ringed seals harvested in the Barrow area have migrated or dispersed from
the Beaufort Sea and hence show the characteristic low carbon-13 signature.
Geographically, Point Barrow is the separation point for Beaufort and Chukchi seas
(Figure 1.1) and seals from either area and with either carbon signature are common and
taken by subsistence hunters.
1.522 Bearded Seals and Walrus
Stable isotope analyses of bearded seal muscle show a wide range for 5I5N. This
variation covers one trophic level (TL), likely reflecting the diverse feeding habits of
these seals. The low nitrogen isotope ratios in walrus muscle indicate the reliance of this
species on lower trophic level prey. The significance o f clams to walrus diet has been
emphasized by a variety o f reports (Lowry et al. 1980b; Fay 1982; Fay et al. 1984) and is
further supported by the 815N findings of this study. Fish are generally not present in
walrus stomachs and frequency of octopus is negligible (Krylov 1971; Fay et al. 1984).
A comparison o f TL, calculated from nitrogen isotope ratios and TL estimates
from stomach contents by Pauly et al. (1998), shows that results deviate for bearded seals
and walrus while they are in good agreement for ringed and spotted seals (Table 1.2). The
estimate by Pauly et al. (1998) for bearded seals is much lower than the isotope
calculation. This study showed that fish was of great importance to bearded seals and also
suggested a possible shift in prey distribution compared to previous reports from the
Bering and Chukchi seas (Lowry et al. 1980b; Antonelis et al. 1994). These changes and
an under representation o f fish as prey for bearded seals could lead to underestimation of
TL based on previous accounts of stomach contents. In contrast, isotope calculations
were lower for walrus than reported by Pauly et al. (1998). However, the estimate by
Pauly et al. (1998) contained animals that had preyed on other pinnipeds and can thus be
considered to occupy a higher TL. While seal-eating walrus are known to exist, they do
not represent the norm of the population (Fay 1960; Lowry and Fay 1984). Based on
nitrogen isotope ratios obtained it is likely that none of the walrus included in this study
had consumed other pinnipeds in the recent past.
Values o f §13C in bearded seals and walrus show a large distribution, while carbon
isotope ratios of walrus have a smaller range (-18.7%o to -15.8%o and -17.3%o to -16.8%o
in bearded seals and walrus, respectively). The more enriched carbon isotope signatures
found in bearded seals and walrus compared to ringed and spotted seals (Figure 1.2) are
likely due to benthic feeding habits, as confirmed by analyses of stomach contents.
Aquatic environments with low turbulence and stagnant boundary layers, such as the
benthic ecosystem, are more enriched in 13C (France 1995b). The larger 513C range in
bearded seals could be related to migration patterns between Beaufort and Chukchi Seas
as discussed for ringed seals, but also could be associated with opportunistic feeding on
both benthos and plankton. In contrast, the walrus is a specialist and relies almost
exclusively on benthic prey. However, sample size for walrus muscle was small and
could explain the smaller variation in walrus isotope ratios. Based on these results it is
unlikely that walrus and bearded seal have a large overlap in prey utilization, but it is
possible that competition between these two pinnipeds is the driving force for a dietary
change in bearded seals as suggested by Lowry et al. (1980b).
1.523 Spotted Seals
Nitrogen isotope ratios of spotted seals show that they feed on a higher trophic
level than other pinnipeds in this study. This is in accordance with stomach contents
analysis as fish occurs at a high frequency in the spotted seal diet. 815N is positively
correlated with age, suggesting that trophic level increases with increasing age of spotted
seals (Figure 1.4). However, mostly young animals were sampled and a 24-year old
female (Dio-7-01 is highlighted in Figure 1.4) was excluded from regression analysis to
avoid the impact of an influential observation and interpolation over the range of 15
years. A change from low to high trophic level prey is in accordance with studies by Kato
(1982) and Bukhtiyarov et al. (1984) who suggested that spotted seal pups feed mainly on
crustaceans and that the importance of fish increases with age. However, stomach
contents analysis in this study did not show any age effects for invertebrate prey.
Considering that stable isotopes in muscle tissue show a signature that reflects feeding
habits o f these animals over at least a month (Tieszen et al. 1983; Hobson 1993) it is
possible that younger seals were feeding on a lower trophic level earlier in the year and
switched their diet to take advantage o f the abundant spawning herring in early summer.
40

Hence the importance of invertebrates to immature seals was not detectable by means of
stomach contents analysis.
Carbon isotope ratios o f spotted seal muscle were not statistically different from
ringed seal muscle 513C. This suggests that both species rely on the planktonic food web
rather than the benthic ecosystem as seen for bearded seals and walrus. However, stable
carbon isotope ratios were not correlated with age in spotted seals as described for
Alaskan ringed seals. Lowry et al. (1998) showed long-distance migration of spotted
seals equipped with satellite transmitters in the Chukchi Sea during the open-water
season. Seals migrating between the Beaufort and Chukchi seas could therefore have
13different 5 C patterns. This possible movement and cyclical foraging o f spotted seals in
offshore areas and coastal haul-out sites as demonstrated by Lowry et al. (1998) could
also result in variable carbon signatures. Smith et al. (1996) showed more depleted
carbon isotope ratios in harbor seal populations feeding in freshwater versus saltwater
habitats. A similar trend was observed by Hobson et al. (1997) when comparing coastal
harbor seals with exclusively marine Steller sea lions (Eumetopias jubatus).
In conclusion, dietary habits of three phocids analyzed in this study are markedly
different. Bearded seals relied heavily on the benthic food chain, and ringed and spotted
seals foraged mainly in the water column. However, prevalence of schooling fish in
stomachs was much higher in spotted than in ringed seals. Stable nitrogen and carbon
isotope analysis fit well with most dietary compositions based on stomach contents. Most
notable was the occupation of a higher trophic level by Alaskan ringed seal females
compared to males and an overall prevalence of a krill-fish mix diet in ringed seals.
41
Nitrogen isotope ratios also demonstrated increasing trophic level in spotted seals with
age; however, examination of stomach contents did not indicate different feeding
patterns. Nevertheless, the importance of herring to spotted seals o f all ages during
summer would not have been noticeable with stable isotope analyses alone. This study
also documented that age is an important factor when reconstructing pinniped diets and
accounts for much of the variability found in stable carbon and nitrogen isotope ratios.
We recommend the use o f traditional methods, e.g., stomach contents or scat analysis, in
combination with chemical feeding ecology to assess dietary habits most accurately when
direct observation o f feeding behavior is not possible.
1.6 ACKNOWLEDGMENTS
This study would not have been possible without the samples provided by
Alaskan and Canadian subsistence hunters in the communities o f Barrow, Holman, Little
Diomede and Shishmaref, and we thank them all for their support. We greatly appreciate
the assistance o f C. D. N. Brower, H. Brower, Jr., T. Olemaun, B. Akootchook, T. Hepa,
L. Hopson, V. Woshner, R. Eisner, T. Zenteno-Savin, S. Visalli, D. Burnett, G. York and
many others in the field and T. Bentzen, T. Howe, N. Haubenstock and P. Hoekstra for
support with analysis. We also thank L. Harwood for providing tissues and jaws of ringed
seals harvested in Holman, Canada, R. Highsmith and B. Bluhm for collection of
amphipod samples from the Bering Strait, and J. Bengtson and D. DeMaster for training
in cementum aging and stomach contents analysis. The Frozen Tissue Collection of the
University o f Alaska Museum provided some of the spotted seal muscle samples.
42
43
This study was primarily funded by the Cooperative Institute for Arctic Research
(CIFAR). Additional support was provided by the Experimental Program for Stimulation
of Competitive Research (EPSCoR); the Biomedical Research Infrastructure Network
(BRIN); the North Slope Borough Department of Wildlife Management; the Institute of
Arctic Biology and the Department o f Biology and Wildlife, UAF; the US Geological
Survey; the Barrow Arctic Science Consortium (BASC); and the National Science
Foundation (NSF) OPP Grant 9910319.
1.7 REFERENCES
Akimushkin II (1965) Cephalopods of the seas o f the U.S.S.R. Israel Program for
Scientific Translations. Jerusalem.
Antonelis GA, Melin SR, Bukhtiyarov YA (1994) Early spring feeding habits of bearded
seals (Erignathus barbatus) in the Central Bering Sea, 1981. Arctic 47: 74-79.
Becker PR, Porter BJ, Mackey EA, Schantz MM, Demiralp R, Wise SA (1999) National
Marine Mammal Tissue Bank and Quality Assurance Program: protocols,
inventory, and analytical results. Gaithersburg, U.S. Department o f Commerce.
Benjaminsen T (1973) Age determination and the growth and age distribution from
cementum growth layers o f bearded seals at Svalbard. Fiskeridirektoratets
skrifter. Serie havundersokelser 16: 159-170.
44
Bowen WD (2000) Reconstruction of pinniped diets: accounting for complete digestion
of otoliths and cephalopod beaks. Can J Fish Aquat Sci 57: 898-905.
Bradstreet MSW, Finley KJ (1983) Diet of ringed seals (Phoca hispida) in the Canadian
High Arctic. Toronto, Ontario, LGL Limited.
Braham HW, Bums JJ, Fedoseev GA, Krogman BD (1984) Habitat partitioning by ice-
associated pinnipeds: distribution and density o f seals and walruses in the Bering
Sea, April, 1976 In Soviet-American Cooperative. Research on Marine Mammals.
Volume 1 - Pinnipeds. U.S. Department of Commerce, NOAA, NMFS.
Bukhtiyarov YA, Frost KJ, Lowry LF (1984) New information on foods o f the spotted
seal, Phoca largha, in the Bering Sea in spring. In Soviet-American Cooperative.
Research on Marine Mammals. Volume 1 - Pinnipeds. U.S. Department of
Commerce, NOAA, NMFS.
Bums JJ (1970) Remarks on the distribution and natural history o f pagophilic pinnipeds
in the Bering and Chukchi Seas. J Mamm 51: 445-454.
Bums JJ, Francis HF, Fedoseev GA (1984) Craniological analysis o f harbor and spotted
seals o f the North Pacific Region. In Soviet-American Cooperative. Research on
45
Marine Mammals. Volume 1 - Pinnipeds. U. S. Department o f Commerce,
NOAA, NMFS.
Bums JM, Trumble SJ, Castellini MA, Testa JW (1998) The diet o f Weddell seals in
McMurdo Sound, Antarctica as determined from scat collections and stable
isotope analysis. Polar Biol 19: 272-282.
Burton RK, Koch PL (1999) Isotopic tracking of foraging and long-distance migration in
northeastern Pacific pinnipeds. Oecologia 119: 578-585.
Butler TH (1980) Shrimps of the Pacific coast of Canada. Can Bull Fish Aquat Sci 202:
280p.
Cleator HJ (1996) The status of the bearded seal, Erignathus barbatus, in Canada. Can
Field-Nat 110: 501-510.
Das K, Lepoint G, Leroy Y, Bouquegneau JM (2003) Marine mammals from the
southern North Sea: feeding ecology data from S13C and 515N measurements. Mar
Ecol Prog Ser 263: 287-298.
DeNiro MJ, Epstein S (1977) Mechanisms of carbon isotope fractionation associated with
lipid synthesis. Science 197: 261-263.
46
DeNiro MJ, Epstein S (1981) Influence o f diet on the distribution o f nitrogen isotopes in
animals. Geochim Cosmochim Acta 45: 341-351.
Derocher AE, Wiig O, Andersen M (2002) Diet composition o f polar bears in Svalbard
and the western Barents Sea. Polar Biol 25: 448-452.
Dunbar MJ (1941) On the food of seals in the Canadian Eastern Arctic. Can J Res 19:
150-155.
Fay FH (1960) Carnivorous walrus and some Arctic zoonoses. Arctic 13:111-122.
Fay FH (1982) Ecology and biology of the Pacific Walrus, Odobenus rosmarus divergens
Illiger. United States Department of the Interior, Washington, D. C.
Fay FH, Bukhtiyarov YA, Stoker SW, Shults LM (1984) Foods of the Pacific walrus in
winter and spring in the Bering Sea. In Soviet-American Cooperative. Research
on Marine Mammals. Volume 1 - Pinnipeds. U. S. Department o f Commerce,
NOAA, NMFS.
Fedoseev GA (1965) Food of the ringed seal. Izvestiia TINRO 59: 216-223.
Fedoseev GA (2000) Population biology of ice-associated forms o f seals and their role in
the northern Pacific ecosystems. Center for Russian Environmental Policy,
Moscow.
Finley KJ, Evans CR (1983) Summer diet of the bearded seal (Erignathus barbatus) in
the Canadian high Arctic. Arctic 36: 82-89.
Foster N R (1991) Intertidal bivalves - a guide to the common marine bivalves of Alaska.
University o f Alaska Press.
France RL (1995a) Carbon isotopic variability in the composite pelagic foodweb of four
oligotrophic lakes: feeding diversity or metabolic fractionations? J Plankton Res
17: 1993-1997.
France RL (1995b) Carbon-13 enrichment in benthic compared to planktonic algae:
foodweb implications. Mar Ecol Prog Ser 124: 307-312.
Frost KJ (1981) Descriptive key to the otoliths o f gadid fishes o f the Bering, Chukchi,
and Beaufort Seas. Arctic 34: 55-59.
Frost KJ, Lowry LF (1980) Feeding o f ribbon seals (Phoca fasciata) in the Bering Sea in
spring. Can J Zool 58: 1601-1607.
I -
47
Gales NJ, Cheal AJ (1992) Estimating diet composition of the Australian sea-lion
(Neophoca cinerea) from scat analysis: an unreliable technique. Wildl Res 19:
447-456.
Gannes LZ, O ’Brien DM, Martinez Del Rio C (1997) Stable isotopes in animal ecology:
assumptions, caveats, and a call for more laboratory experiments. Ecology 78:
1271-1276.
Geraci JR (1975) Pinniped nutrition. Rapp. P.-v. Reun. Cons. int. Explor. Mer. 169: 312-
323.
Gol'tsev VN (1971) Feeding of the largha seal. Ekologiia 2: 62-70.
Harkonen T (1986) Guide to otoliths of the bony fishes of the Northeast Atlantic. Danbiv
ApS, Hellerup, Denmark.
Harvey JT, Loughlin TR, Perez MA, Oxman DS (2000) Relationship between fish size
and otolith length for 63 species of fishes from the Eastern North Pacific Ocean.
NOAA Technical Report NMFS 150. U.S. Department o f Commerce. Seattle,
Washington.
48
49
Hammill MO, Smith TG (1991) The role of predation in the ecology o f the ringed seal in
Barrow Strait, Northwest Territories, Canada. Mar Mamm Sci 7: 123-135.
Harwood LA, Smith TG (2003) Movements and diving of ringed seals in the Beaufort
and Chukchi seas, 1999-2003. 15th Biennial Conference on the Biology of Marine
Mammals, Greensboro, North Carolina.
Hjelset AM, Andersen M, Gjertz I, Lydersen C, Gulliksen B. (1999) Feeding habits of
bearded seals (Erignathus barbatus) from the Svalbard area, Norway. Polar Biol
21: 186-193.
Hobson, K.A. 1993. Trophic relationships among high Arctic seabirds: insights from
tissue-dependent stable-isotope models. Mar Ecol Prog Ser 95: 7-18.
Hobson KA, Alisauskas RT, Clark RG (1993) Stable-nitrogen isotope enrichment in
avian tissues due to fasting and nutritional stress: implications for isotopic
analyses o f diet. Condor 95: 388-394.
Hobson KA, Schell DM, Renouf D, Noseworthy, E (1996) Stable carbon and nitrogen
isotopic fractionation between diet and tissues of captive seals: implications for
dietary reconstructions involving marine mammals. Can J Fish Aquat Sci 53: 528-
533.
50
Hobson KA, Sease JL, Merrick RL, Piatt JF (1997) Investigating trophic relationships of
pinnipeds in Alaska and Washington using stable isotope ratios of nitrogen and
carbon. M arM amm Sci 13: 114-132.
Hobson KA, Welch HE (1992) Determination of trophic relationships within a High
Arctic marine food web using dl3C and dl5N analysis. Mar Ecol Prog Ser 84: 9-
18.
Hoekstra PF, Dehn L-A, George JC, Solomon KR, Muir DCG, O'Hara TM (2002)
Trophic ecology o f bowhead whales (Balaena mysticetus) compared with that of
other arctic marine biota as interpreted from carbon-, nitrogen-, and sulfur-isotope
signatures. Can J Zool 80: 223-231.
Hop H, Welch HE, Crawford RE (1997) Population structure and feeding ecology of
Arctic cod schools in the Canadian high Arctic. Am Fish Soc Symp 19: 68-80.
Jensen GC (1995) Pacific coast crabs and shrimps. Sea Challengers.
Jorgensen C, Lydersen C, Brix O, Kovacs KM (2001) Diving development in nursing
harbour seal pups. J Exp Biol 204: 3993-4004.
Kathman RD, Austin WC, Saltman JC, Fulton JD (1986) Identification manual to the
mysidacea and euphausiacea of the Northeast Pacific. Can Spec Pub Fish Aquat
Sci 93: 41 lp.
Kato H (1982) Food habits o f largha seal pups in the pack ice area. Sci. Rep. Whales Res.
Inst 43: 123-136.
Keen AM, Coan E (1974) Marine molluscan genera o f Western North America. An
illustrated key. Stanford University Press, Stanford, California.
Kelly BP (1988) Ringed seal. In Selected marine mammals o f Alaska: Species accounts
with research and management recommendations. Marine Mammal Commission,
Washington.
Kelly JF (2000) Stable isotopes of carbon and nitrogen in the study of avian and
mammalian trophic ecology. Can J Zool 78: 1-27.
Krylov VI (1971) On the food of the pacific walrus (Odobenus rosmarus divergens 111.).
Investigations on marine mammals. Trudy AtlantNIRO 39: 110-116.
51
Kurle CM (2002) Stable-isotope ratios of blood components from captive northern fur
seals (Callorhinus ursinus) and their diet: applications for studying the foraging
ecology o f wild otariids. Can J Zool 80: 902-909.
Lassuy DR (1989) Species profiles: Life histories and environmental requirements of
coastal fishes and invertebrates (Pacific Northwest). Pacific herring. US Fish and
Wildlife Service Biological Report 82: 1-18.
Lauckner G (1985) Diseases of mammalia: pinnipedia. In Diseases of marine mammals.
Westholsteinische Verlagsdruckerei Boyens & Co., Heide, Germany.
Lawson JW, Hobson KA (2000) Diet of harp seals (Pagophilus groenlandicus) in
13nearshore northeast Newfoundland: inferences from stable-carbon ( 8 C) and
nitrogen (515N) isotope analyses. Mar Mamm Sci 16: 578-591.
Le Boeuf BJ, Crocker DE, Costa DP, Blackwell SB, Webb PM, Houser DS (2000)
Foraging ecology of northern elephant seals. Ecol Monographs 70: 353-382.
Lowry LF, Fay FH (1984) Seal eating by walruses in the Bering and Chukchi Seas. Polar
Biol 3: 11-18.
52
Lowry LF, Frost KJ (1981) Distribution, growth, and foods o f Arctic cod (Boreogadus
saida) in the Bering, Chukchi, and Beaufort seas. Can Field-Nat 95: 186-191.
Lowry LF, Frost KJ, Bums JJ (1978) Food of ringed seals and bowhead whales near
Point Barrow, Alaska. Can Field-Nat 92: 67-70.
Lowry LF, Frost KJ, Bums JJ (1980a) Variability in the diet o f ringed seals, Phoca
hispida, in Alaska. Can J Fish Aquat Sci 37: 2254-2261.
Lowry LF, Frost KJ, Bums JJ (1980b) Feeding o f bearded seals in the Bering and
Chukchi Seas and trophic interaction with Pacific walrus. Arctic 33: 330-342.
Lowry LF, Frost KJ, Douglas RD, DeMaster DP, Suydam RS (1998) Movements and
behavior of satellite-tagged spotted seals (Phoca largha) in the Bering and
Chukchi Seas. Polar Biol 19: 221-230.
Lowry LF, Burkanov VN, Frost KJ, Simpkins MA, Davis R, DeMaster DP, Suydam R,
Springer A (2000) Habitat use and habitat selection by spotted seals (Phoca
largha) in the Bering Sea. Can J Zool 78: 1959-1971.
Matson GM (1981) Workbook for cementum analysis. Matson's Laboratory, Milltown,
Montana. 30pp.
53

54
Muir DCG, Segstro MD, Hobson KA, Ford CA, Stewart REA, Olpinski S (1995) Can
seal eating explain elevated levels o f PCBs and organochlorine pesticides in
walrus blubber from Eastern Hudson Bay (Canada)? Environ Pollut 90: 335-348.
Murie DJ, Lavigne DM (1986) Interpretation of otoliths in stomach content analyses of
phocid seals: quantifying fish consumption. Can J Zool 64: 1152-1157.
Ostrom PH, Lien J, Macko SA (1993) Evaluation of the diet o f Sowerby's beaked whale,
Mesoplodon bidens, based on isotopic comparisons among northwestern Atlantic
cetaceans. Can J Zool 71: 858-861.
Pauly D, Trites AW, Capuli E, Christensen V (1998) Diet composition and trophic levels
of marine mammals. ICES J Mar Sci 55: 467-481.
Pikharev GA (1941) Some data on the feeding of the far eastern bearded seal. Izvestiia
TINRO 20: 101-120.
Rathbun MJ (1929) Canadian Atlantic Fauna. Arthropoda - Decapoda. The Biological
Board o f Canada. The Atlantic Biological Station. St. Andrews, N. B., Canada.
Roth JD, Hobson KA (2000) Stable carbon and nitrogen isotopic fractionation between
diet and tissue o f captive red fox: implications for dietary reconstructions. Can J
Zool 78: 848-852.
Santos MB, Clarke MR, Pierce GJ (2001) Assessing the importance o f cephalopods in
the diets o f marine mammals and other top predators: problems and solutions.
Fish Res 52: 121-139.
Schell DM, Barnett BA, Vinette KA (1998) Carbon and nitrogen isotope ratios in
zooplankton of the Bering, Chukchi and Beaufort seas. Mar Ecol Prog Ser 162:
11-23.
Schell DM, Saupe SM, Haubenstock N (1989) Natural isotope abundance in bowhead
whale (Balaena mysticetus) baleen: markers of aging and habitat usage. In Stable
isotopes in ecological research. Springer-Verlag, Berlin.
Sheffield G, Fay FH, Feder H, Kelly BP (2001) Laboratory digestion of prey and
interpretation o f walrus stomach contents. Mar Mamm Sci 17: 310-330.
Siegstad H, Neve PB, Heide-Jorgensen MP, Harkonen T (1998) Diet o f ringed seal
(Phoca hispida) in Greenland. In Ringed seals in the North Atlantic. NAMMCO
Scientific Publications, Troms0 . pp. 229-241.
55
56
Simpkins MA, Hiruki-Raring LM, Sheffield G, Grebmeier JM, Bengtson JL (2003)
Habitat selection by ice-associated pinnipeds near St. Lawrence Island, Alaska in
March 2001. Polar Biol 26: 577-586.
Smith RJ, Hobson KA, Koopman HN, Lavigne DM (1996) Distinguishing between
populations of fresh-and saltwater harbour seals (Phoca vitulina) using stable-
isotope ratios and fatty acid profiles. Can J Fish Aquat Sci 53: 272-279.
Smith TG (1976) Predation o f ringed seal pups (Phoca hispida) by the arctic fox (Alopex
lagopus). Can J Zool 54: 1610-1616.
Smith, T.G. (1987) The ringed seal, Phoca hispida, o f the Canadian Western Arctic. Can
Bull Fish Aquat Sci 216: 1-81.
Sobolevskii El (1996) The distribution and seasonal dynamics o f feeding of the spotted
seal Phoca largha in the Bering Sea. Rus J Mar Biol 22: 199-204.
Stewart REA, Stewart BE, Stirling I, Street E 1996 Counts o f growth layer groups in
cementum and dentine in ringed seals (Phoca hispida). Mar Mamm Sci 12: 383-
401.
57
Tarasevich MN (1976) Biology of the bearded seal (Erignathus barbatus). Tr. Akad.
Nauk SSSR., Institut Okeanologii 71: 223-225. Fisheries and Marine Service
Translation Series No. 3774.
Tieszen LL, Boutton TW, Tesdahl KG, Slade NA (1983) Fractionation and turnover of
stable carbon isotopes in animal tissues: Implications for S13C analysis of diet.
Oecologia 57: 32-37.
Weslawski JM, Ryg M, Smith TG, Oritsland NA (1994) Diet o f ringed seals (Phoca
hispida) in a fjord o f West Svalbard. Arctic 47: 109-114.
Wilson GF, Mackenzie DDS, Brookes IM, Lyon GL (1988) Importance of body tissue as
• * 1 3 •sources o f nutrients for milk synthesis in the cow, using C as a marker. Brit J
Nutr 60: 605-617.
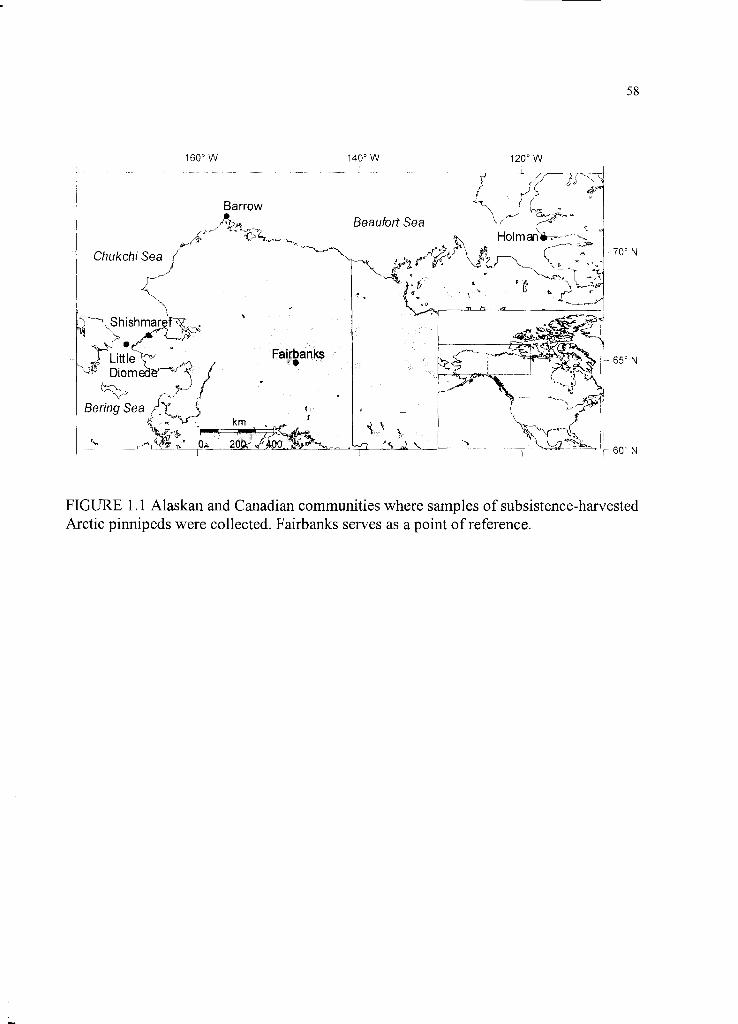
58
160° W 140° W 120° W
FIGURE 1.1 Alaskan and Canadian communities where samples of subsistence-harvested Arctic pinnipeds were collected. Fairbanks serves as a point o f reference.
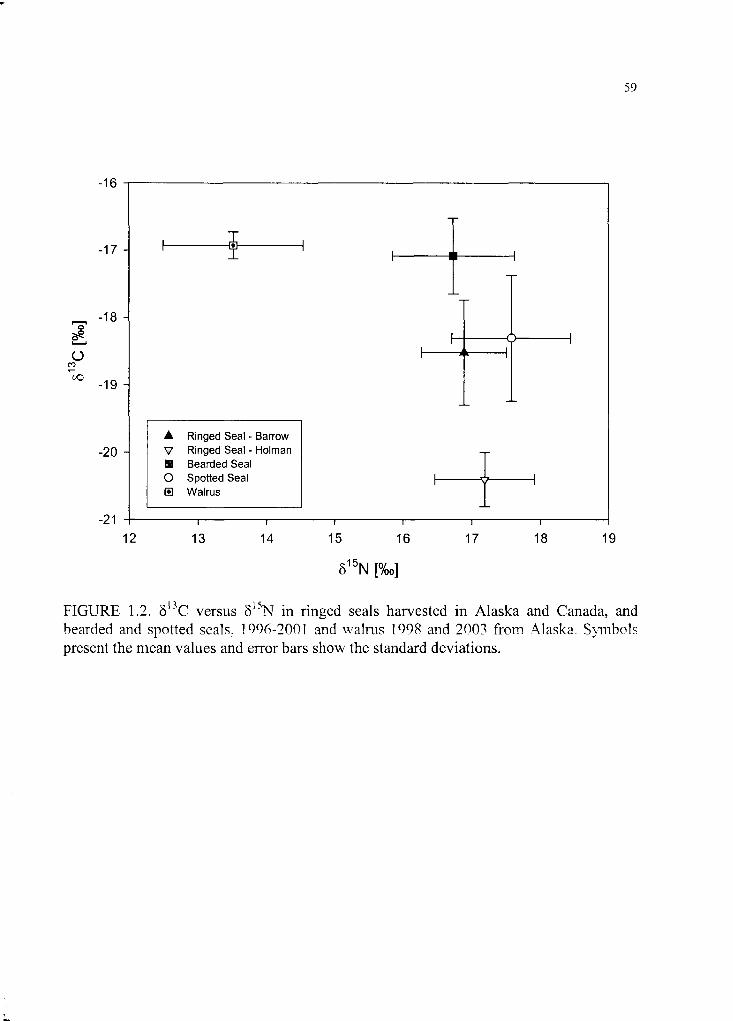
59
-16
-17
^ -18 OpN>>io
CO
-20
-2112 13 14 15 16 17 18 19
515N [% o]
FIGURE 1.2. 5n C versus 8 15N in ringed seals harvested in Alaska and Canada, and bearded and spotted seals, 1996-2001 and walrus 1998 and 200? from Alaska. Symbols present the mean values and error bars show the standard deviations.
▲ Ringed Seal - BarrowV Ringed Seal - HolmanBIB Bearded Sealo Spotted Seals Walrus
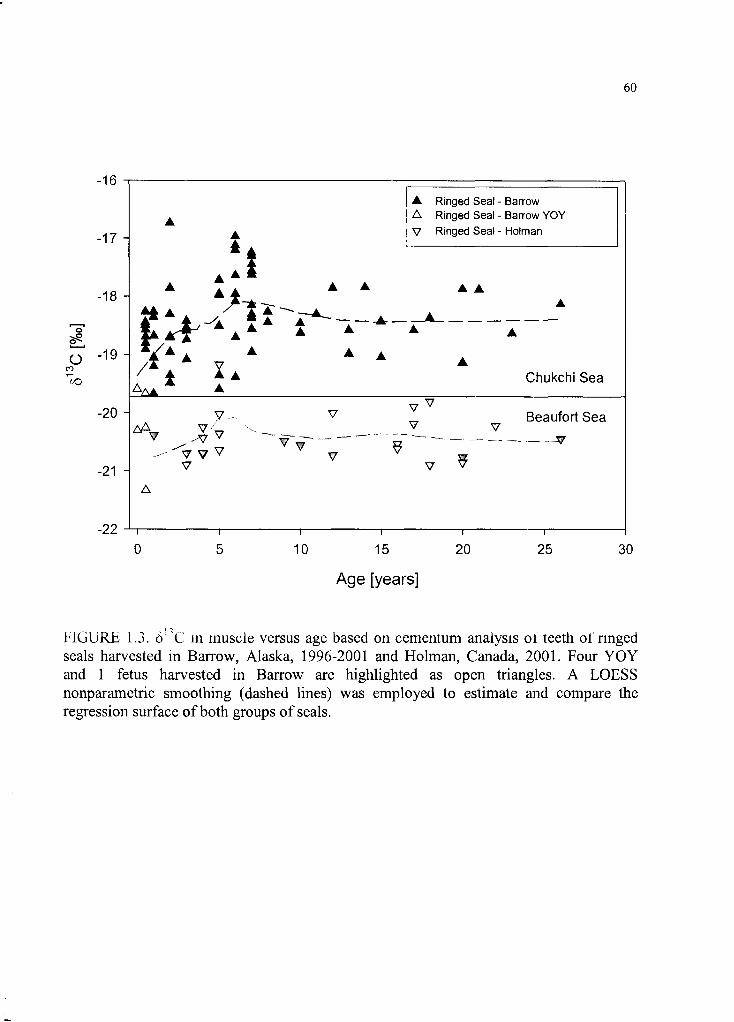
60
oCO
-16
-17
-18
-19 -
A Ringed Seal - BarrowA Ringed Seal - Barrow YOYV Ringed Seal - Holman
▲ ▲
V A a a 1 1 ▲
▲
▲ ▲
/ Chukchi Sea
-20 -
zA,
-21
v V. . - v v
v v ^V
Beaufort Sea 5 7
-2210 15
Age [years]
20T25 30
FIGURE 1.3. 6 1 C in muscle versus age based on cementum analysis of teeth of ringed seals harvested in Barrow, Alaska, 1996-2001 and Holman, Canada, 2001. Four YOY and 1 fetus harvested in Barrow are highlighted as open triangles. A LOESS nonparametric smoothing (dashed lines) was employed to estimate and compare the regression surface o f both groups o f seals.
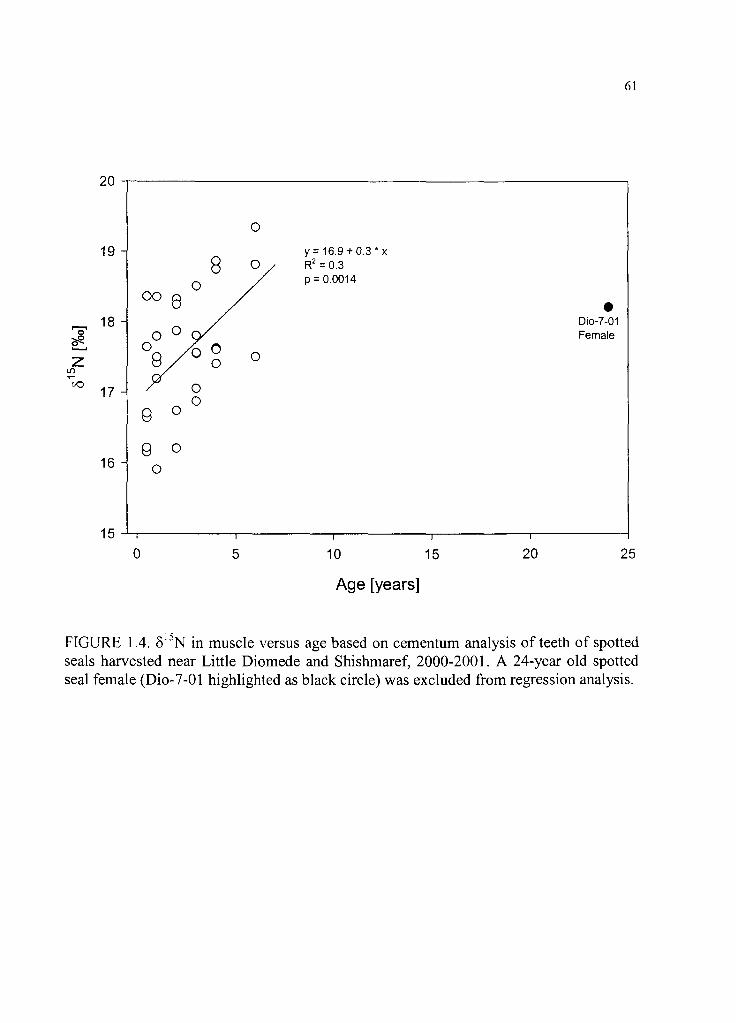
61
Age [years]
FIGURE 1.4. Sl3N in muscle versus age based on cementum analysis of teeth of spotted seals harvested near Little Diomede and Shishmaref, 2000-2001. A 24-year old spotted seal female (Dio-7-01 highlighted as black circle) was excluded from regression analysis.
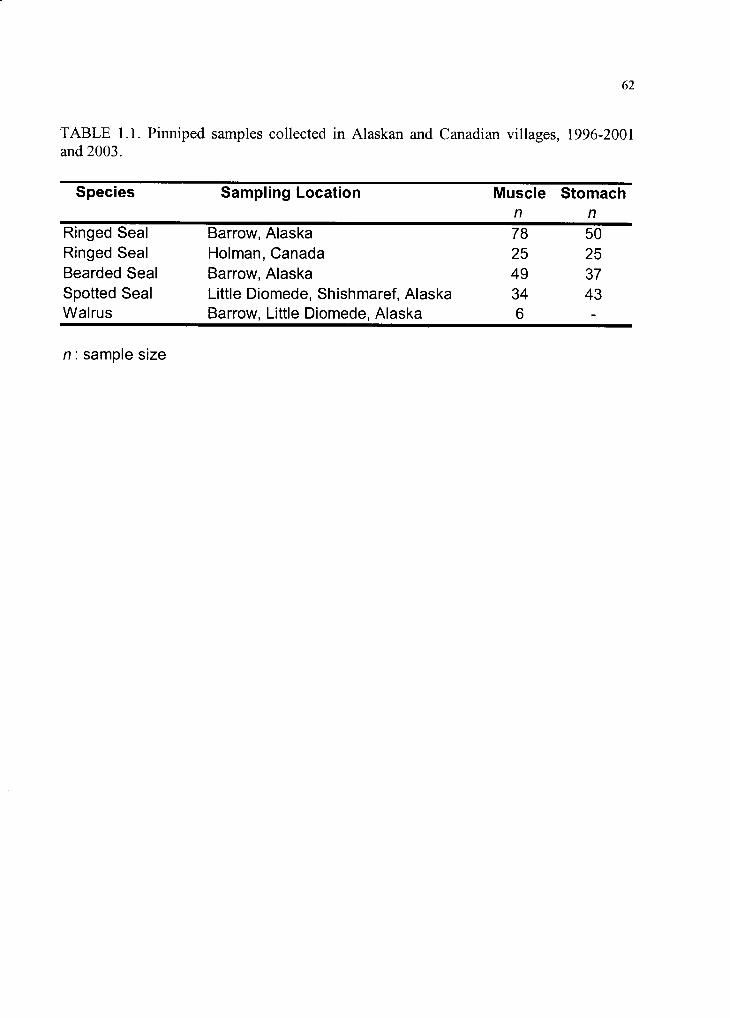
62
TABLE 1.1. Pinniped samples collected in Alaskan and Canadian villages, 1996-2001 and 2003.
Species Sampling Location Musclen
Stomachn
Ringed Seal Barrow, Alaska 78 50Ringed Seal Holman, Canada 25 25Bearded Seal Barrow, Alaska 49 37Spotted Seal Little Diomede, Shishmaref, Alaska 34 43Walrus Barrow, Little Diomede, Alaska 6 -
n : sample size
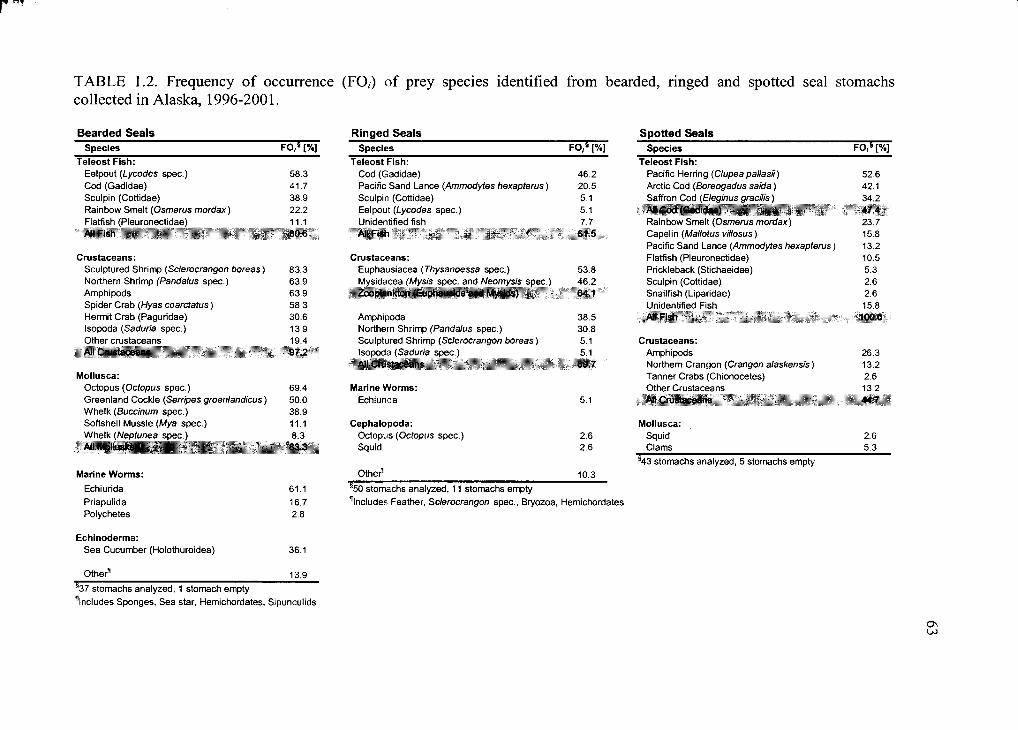
TABLE 1.2. Frequency o f occurrence (FO,) o f prey species identified from bearded, ringed and spotted seal stomachs collected in Alaska, 1996-2001.
Bearded SealsSpecies FO,5 [%]
Teleost Fish:Eelpout (Lycodes spec.) 58.3Cod (Gadidae) 41.7Sculpin (Cottidae) 38.9Rainbow Smelt (Osmerus mordax) 22.2Flatfish (Pleuronectidae) 11.1All Fish 80.6
Crustaceans:Sculptured Shrimp (Sderocrangon boreas) 83.3Northern Shrimp (Pandalus spec.) 63.9Amphipods 63.9Spider Crab (Hyas coarctatus) 58.3Hermit Crab (Paguridae) 30.6Isopoda (Saduria spec.) 13.9Other crustaceans 19.4All Crustaceans 07.2
Mollusca:Octopus (Octopus spec.) 69.4Greenland Cockle (Serripes groenlandicus) 50.0Whelk (Buccinum spec.) 38.9Softshell Mussle (Mya spec.) 11.1Whelk (Neptunea spec.) 8.3All Msllusks 83.3
Marine Worms:Echiurida 61.1Priapulida 16.7Polychetes 2.8
Ringed SealsSpecies FO,S [%]
Teleost Fish:Cod (Gadidae) 46.2Pacific Sand Lance (Ammodytes hexapterus) 20.5Sculpin (Cottidae) 5.1Eelpout (Lycodes spec.) 5.1Unidentified fish 7.7All Fish 61.5
Crustaceans:Euphausiacea (Thysanoessa spec.) 53.8Mybidd'.Pd (Mysis spec anil Neomysis spec ) 46.2Zoop-ankton (Euphausids and Mysids) 64.1
Amphipoda 38.5Northern Shrimp (Pandalus spec.) 30.8Sculptured Shrimp (Sderocrangon boreas) 5.1Isopoda (Saduria spec.) 5.1All Crustaceans 89.7
Marine Worms:Echiurida 5.1
Cephalopoda:Octopus (Octopus spec.) 2.6Squid 2.6
Other11 10.3550 stomachs analyzed, 11 stomachs empty’ includes Feather, Sderocrangon spec., Bryozoa, Hemichordates
Spotted SealsSpecies FO,s [%]
Teleost Fish:Pacific Herring (Clupea pallasii) 52.6Arctic Cod (Boreogadus saida) 42.1Saffron Cod (Eleginus gracilis) 34.2All Cod (Gadidae) 47.4Rainbow Smelt (Osmerus mordax) 23.7Capelin (Mallotus villosus) 15.8Pacific Sand Lance (Ammodytes hexapterus) 13.2Flatfish (Pleuronectidae) 10.5Prickleback (Stichaeidae) 5.3Sculpin (Cottidae) 2.6Snailfish (Liparidae) 2.6Unidentified Fish 15.8All Fish 100.0
Crustaceans:Amphipods 26.3Northern Crangon (Crangon alaskensis) 13.2Tanner Crabs (Chionocetes) 2.6Other Crustaceans 13.2All Crustaceans 44.7
Mollusca:Squid 2.6Clams 5.3
s43 stomachs analyzed, 5 stomachs empty
Echinoderma:Sea Cucumber (Holothuroidea) 36.1
Other’ 13.98 1s37 stomachs analyzed, 1 stomach emptyinc ludes Sponges, Sea star, Hemichordates, Sipunculids
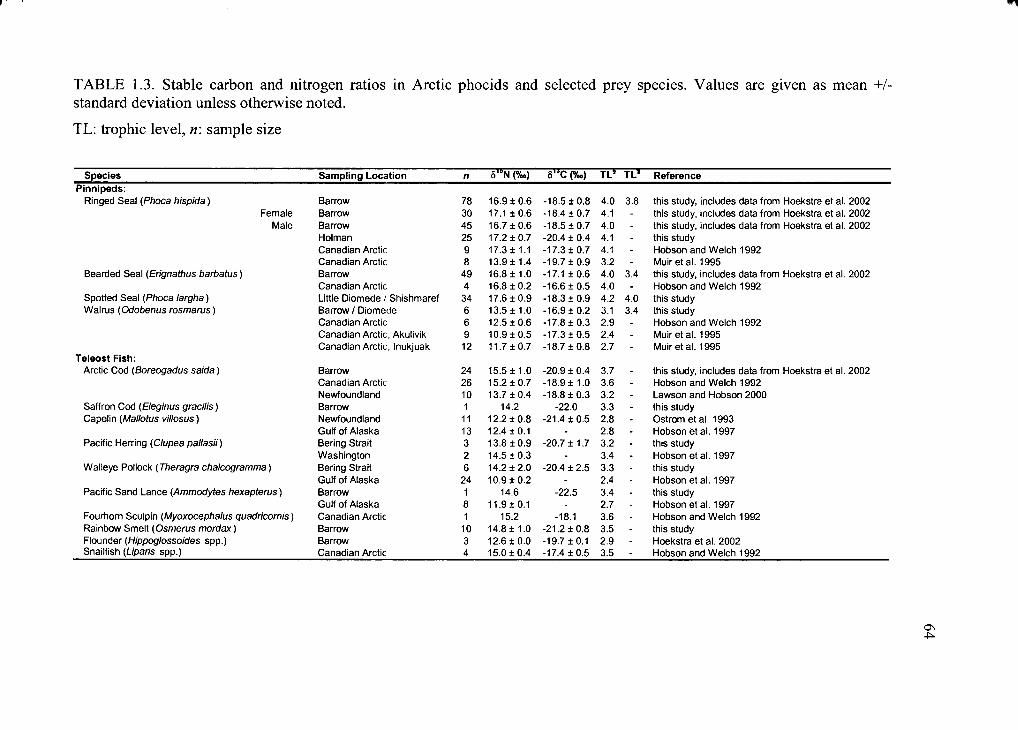
TABLE 1.3. Stable carbon and nitrogen ratios in Arctic phocids and selected prey species. Values are given as mean +/- standard deviation unless otherwise noted.
TL: trophic level, n: sample size
Species Sampling Location n 5 ,i’N(% .) 8 ' * C (%o) TLS TL ' ReferencePinnipeds:
Ringed Sea! (Phoca h isp ida ) Barrow 78 16.9 + 0.6 -1 8 .5 ± 0 .8 4.0 3.8 this study, includes data from Hoekstra et al. 2002Female Barrow 30 17.1 ± 0 .6 -18.4 ± 0 .7 4.1 - this study, includes data from Hoekstra et al. 2002
Male Barrow 45 16.7 ± 0 .6 -18.5 ± 0 .7 4.0 - this study, includes data from Hoekstra et al. 2002Holman 25 17.2 ±0 .7 -20.4 ± 0.4 4.1 - this studyCanadian Arctic 9 17.3 ± 1.1 -17.3 ±0 .7 4.1 - Hobson and W elch 1992Canadian Arctic 8 13.9 ± 1.4 -19.7 ± 0 .9 3.2 - Muir et al. 1995
Bearded Seal (Erignathus barbatus ) Barrow 49 16.8 ±1 .0 -17.1 ± 0 .6 4.0 3.4 this study, includes data from Hoekstra et al. 2002Canadian Arctic 4 16.8 ±0 .2 -16.6 ± 0 .5 4.0 - Hobson and W elch 1992
Spotted Seal (Phoca la rgha ) Little Diomede / Shishmaref 34 17.6 ± 0 .9 -18.3 ± 0 .9 4.2 4.0 this studyW alrus (Odobenus rosm arus) Barrow / Diomede 6 13.5 ±1 .0 -16.9 ±0 .2 3.1 3.4 this study
Canadian Arctic 6 12.5 ± 0 .6 -17.8 ± 0 .3 2.9 - Hobson and W elch 1992Canadian Arctic, Akulivik 9 10.9 ± 0 .5 -17.3 ±0 .5 2.4 - Muir et al. 1995Canadian Arctic. Inukjuak 12 11.7 ± 0 .7 -18.7 ± 0 .8 2.7 - Muir et al. 1995
Teleost Fish:Arctic Cod (Boreogadus sa ida ) Barrow 24 15.5 ± 1.0 -20.9 ± 0.4 3.7 - this study, includes data from Hoekstra et al. 2002
Canadian Arctic 26 15.2 ±0 .7 -18.9 ± 1.0 3.6 - Hobson and W elch 1992Newfoundland 10 13.7 ±0 .4 -18.8 ± 0 .3 3.2 - Lawson and Hobson 2000
Saffron Cod (Eleginus g rac ilis ) Barrow 1 14.2 -22.0 3.3 - this studyCapelin (Mallotus villosus) Newfoundland 11 12.2 ± 0 .8 -21.4 ±0 .5 2.8 - Ostrom et al. 1993
Gulf o f Alaska 13 12.4 ±0.1 - 2.8 - Hobson et al. 1997Pacific Herring (Clupea pa llasii) Bering Strait 3 13.8 ± 0 .9 -20.7 ± 1.7 3.2 - this study
Washington 2 14.5 ± 0 .3 - 3.4 - Hobson et al. 1997Walleye Pollock (Theragra chalcogramma) Bering Strait 6 14.2 ± 2 .0 -20.4 ± 2.5 3.3 - this study
Gulf of Alaska 24 10.9 ± 0 .2 - 2.4 - Hobson et al. 1997Pacific Sand Lance (Ammodytes hexapterus) Barrow 1 14.6 -22.5 3.4 - this study
Gulf of Alaska 8 11.9 ± 0.1 - 2.7 - Hobson et al. 1997Fourtiom Sculpin (Myoxocephalus quadricornis) Canadian Arctic 1 15.2 -18.1 3.6 - Hobson and W elch 1992Rainbow Smelt (Osmerus m ordax) Barrow 10 14.8 ± 1.0 -21.2 ±0 .8 3.5 - this studyFlounder (Hippoglossoides spp.) Barrow 3 12.6 ±0 .0 -19.7 ±0.1 2.9 - Hoekstra et al. 2002Snailfish (Liparis spp.) Canadian Arctic 4 15.0 ±0 .4 -17.4 ±0 .5 3.5 - Hobson and Welch 1992
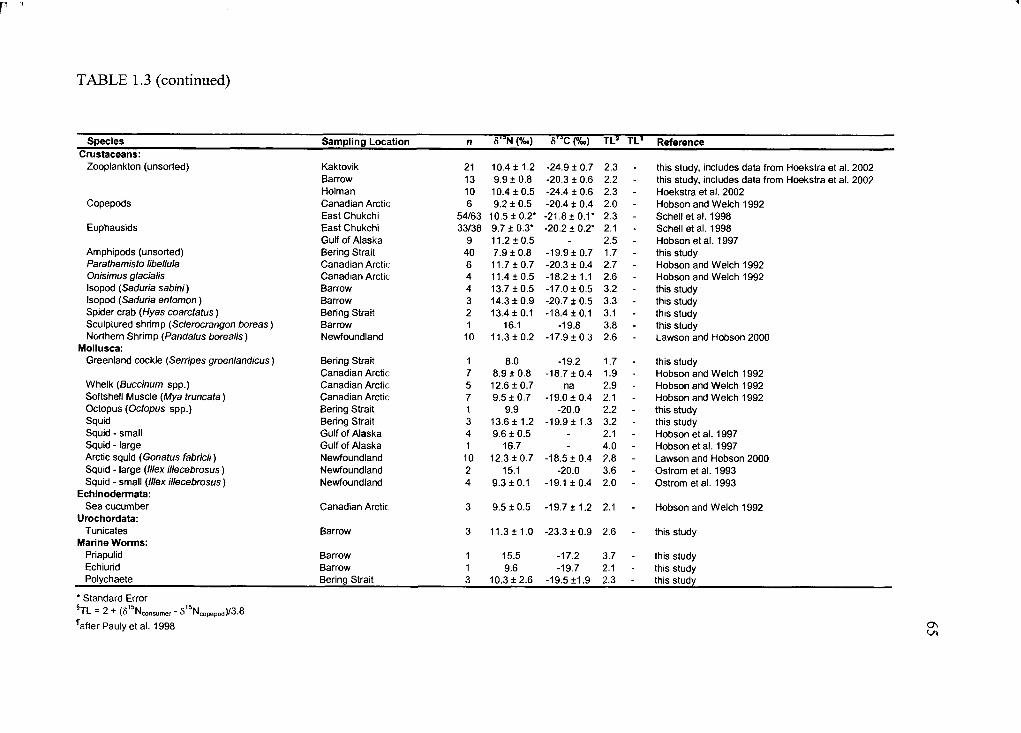
TABLE 1.3 (continued)
Species Sampling Location n 8 laN (%.) S'-’C(% .) TL5 TL1 ReferenceCmstaceans:
Zooplankton (unsorted) Kaktovik 21 10.4 ± 1.2 -24.9 ± 0.7 2.3 - this study, includes data from Hoekstra et al. 2002Barrow 13 9.9 ± 0.8 -20.3 ± 0.6 2.2 - this study, includes data from Hoekstra et al. 2002Holman 10 10.4 ± 0 .5 -24.4 ± 0.6 2.3 - Hoekstra et al. 2002
Copepods Canadian Arctic 6 9.2 ± 0 .5 -20.4 ± 0.4 2.0 - Hobson and W elch 1992East Chukchi 54/63 10.5 ±0 .2 * -21.8 ±0 .1* 2.3 - Schell et al. 1998
Euphausids East Chukchi 33/38 9.7 ± 0.3* -20.2 ± 0.2* 2.1 - Schell et al. 1998Gulf of Alaska 9 11.2 ± 0.5 - 2.5 - Hobson e ta l. 1997
Amphipods (unsorted) Bering Strait 40 7.9 ±0 .8 -19.9 ±0 .7 1.7 - this studyParathemisto libellula Canadian Arctic 6 11.7 ± 0 .7 -20.3 ± 0.4 2.7 - Hobson and W elch 1992Onisimus glacialis Canadian Arctic 4 11.4 ± 0 .5 -18.2 ±1.1 2.6 - Hobson and W elch 1992Isopod (Saduria sabin i) Barrow 4 13.7 ±0 .5 -17.0 ±0 .5 3.2 - this studyIsopod (Saduria entom on) Barrow 3 14.3 ± 0 .9 -20.7 ± 0.5 3.3 - this studySpider crab (Hyas coarctatus) Bering Strait 2 13.4 ±0.1 -18.4 ±0.1 3.1 - this studySculptured shrimp (Sderocrangon boreas) Barrow 1 16.1 -19.8 3.8 - this studyNorthern Shrimp (Pandalus borea lis) Newfoundland 10 11.3 ± 0 .2 -17.9 ±0 .3 2.6 - Lawson and Hobson 2000
Mollusca:Greenland cockle (Serripes groenlandicus) Bering Strait 1 8.0 -19.2 1.7 - this study
Canadian Arctic 7 8.9 ± 0 .8 -18.7 ±0 .4 1.9 - Hobson and Welch 1992W helk (Buccinum spp.) Canadian Arctic 5 12.6 ± 0 .7 na 2.9 - Hobson and W elch 1992Softshell Muscle (Mya truncata) Canadian Arctic 7 9.5 ± 0.7 -19.0 ± 0 .4 2.1 - Hobson and W elch 1992Octopus (Octopus spp.) Bering Strait 1 9.9 -20.0 2.2 - this studySquid Bering Strait 3 13.6 ± 1.2 -19.9 ± 1.3 3.2 - this studySquid - small Gulf o f Alaska 4 9.6 ± 0.5 - 2.1 - Hobson et al. 1997Squid - large Gulf o f Alaska 1 16.7 - 4.0 - Hobson et al. 1997Arctic squid (Gonatus fabricii) Newfoundland 10 12.3 ± 0 .7 -18.5 ±0 .4 2.8 - Lawson and Hobson 2000Squid - large (///ex illecebrosus) Newfoundland 2 15.1 -20.0 3.6 - Ostrom et al. 1993Squid - small (///ex illecebrosus) Newfoundland 4 9.3 ±0 .1 -19.1 ±0 .4 2.0 - Ostrom et al. 1993
Echinodermata:Sea cucumber Canadian Arctic 3 9.5 ± 0.5 -19.7 ± 1.2 2.1 - Hobson and W elch 1992
Urochordata:Tunicates Barrow 3 11.3 ± 1.0 -23.3 ± 0.9 2.6 - this study
Marine Worms:Priapulid Barrow 1 15.5 -17.2 3.7 - this studyEchiurid Barrow 1 9.6 -19.7 2.1 - this studyPolychaete Bering Strait 3 10.3 ±2 .6 -19.5 ±1.9 2.3 - this study
* Standard Error§TL = 2 + (S15Nc„nsume, - 515Ncopepod)/3.8
'’after Pauly et al. 1998 os
TRACE ELEMENTS IN TISSUES OF PHOCID SEALS HARVESTED IN THE
ALASKAN AND CANADIAN ARCTIC - INFLUENCE OF AGE AND FEEDING
ECOLOGY2
2.1 ABSTRACT
Concentrations of selected trace elements (Ag, Cu, Cd, Se, Zn, THg, and MeHg)
were measured in tissues of subsistence-harvested ringed (Phoca hispida Schreber,
1775), bearded (Erignathus barbatus Erxleben, 1777) and spotted seals (Phoca largha
Pallas, 1811) from Alaska and ringed seals from Canada. Most variables differed
significantly in tissues o f phocids analyzed. Renal Cd concentrations were highest in
ringed seals from Canada and Alaskan bearded seals, while spotted seals had the lowest
concentrations. Cd concentrations increased with age to a maximum in ringed and
bearded seals, followed by a slow decline with increasing age. Spotted seals had the
highest ratio of organic Hg to THg (%MeHg) in liver and bearded seals the lowest ratio.
THg in seal tissues followed the opposite trend. %MeHg in ringed and bearded seals
followed a hyperbolic decay function with age, but was highly variable in spotted seals.
Seals with lesions had a higher relative occurrence of organic mercury in liver. The molar
ratio of Se:THg in liver exceeded 1:1 in most seals and was negatively correlated to age
CHAPTER 2
2 Dehn, L.-A., Sheffield, G. G., Follmann, E. H., Duffy, L. K., Thomas, D. L., Bratton, G. R., Taylor, R. J.,
O ’Hara, T. M. (2 0 0 5 ). Trace elements in tissues of phocid seals harvested in the Alaskan and Canadian
Arctic - Influence of age and feeding ecology. Canadian Journal o f Zoology 83: 726-746.

in ringed and spotted seals. Hepatic Ag was higher in bearded seals compared to ringed
and spotted seals. A correlation of Ag with age was not documented.
Keywords: Ringed seal, bearded seal, spotted seal, trace elements, age, feeding ecology,
Arctic
67
Bioaccumulation of heavy metals has been o f growing concern to consumers of
subsistence foods in Alaska and other Arctic areas (Ponce et al. 1997; Egeland et al.
1998; Deutch and Hansen 2003). Ice seals such as ringed (Phoca hispida Schreber,
1775), bearded (Erignathus barbatus Erxleben, 1777) and spotted seals (Phoca largha
Pallas, 1811) have significant nutritional and cultural importance to the Native coastal
population o f the Arctic. Marine mammals, including seals, have been reported to
accumulate contaminants (e.g., mercury) in their tissues with increasing age and trophic
level (Smith and Armstrong 1978; Dietz et al. 2000; Woshner et al. 2001a; Watanabe et
al. 2002; Bustamante et al. 2004a). However, accumulation of metals in marine mammal
tissues appears to be not solely dependent on trophic position. Bowhead whales (Balaena
mysticetus Linnaeus, 1758) feed low in the Arctic food chain on pelagic krill (Lowry and
Frost 1984). Nevertheless, cadmium (Cd) concentrations in the kidney of bowheads are
higher than in top-level consumers of a simple Arctic food chain, e.g., polar bear (Ursus
maritimus Phipps, 1774) and Arctic fox (Alopex lagopus Linnaeus, 1758) (Bratton et al.
1997; Woshner et al. 2001a; Woshner et al. 2001b; Ballard et al. 2003). Hence, it is
possible that dietary selection may influence trace element pathways. On the other hand,
accumulation o f trace elements with age could lead to a higher rate o f metal deposition in
bowheads since these mysticetes are known to live in excess o f 100 years (George et al.
1999), while the life span o f Arctic fox usually does not exceed 10 years (Smirnov 1968).
Even though the continuous accumulation o f metals with age is often assumed, the
relationship o f trace elements in tissues of marine mammals with age is less well
68
2.2 INTRODUCTION
investigated. Egeland et al. (1998) noted the importance o f animal age to interpret and
identify possible new sources of contamination and to provide recommendations for the
consumption of subsistence foods.
Wagemann et al. (1988) suggested that mercury (Hg) is transferred via the
placenta from mother to pup in harp seals (Phoca groenlandica Erxleben, 1777), while
Cd does not cross the placenta. Essential elements like copper (Cu), zinc (Zn) and
selenium (Se) are transferred and accumulate in the fetus (Wagemann et al. 1988;
Enomoto and Hirunuma 2001; Rombach et al. 2003). Bustamante et al. (2004a) reported
a logarithmic relationship o f Cd with age in kidney of male grey seals (Halichoerus
grypus Fabricius, 1791), suggesting equilibrium of Cd intake and elimination with
increasing age. Watanabe et al. (2002) found an increase o f Cd with age in liver and
kidney of Caspian seals (Phoca caspica Gmelin, 1788) followed by decline in older seals.
This relationship was also described for ringed seals in Greenland (Dietz et al. 1996;
Dietz et al. 1998; Sonne-Hansen et al. 2002).
Recent investigations report elevated Cd concentrations in renal and hepatic tissue
of ringed seals that do not coincide with lesions associated with metal toxicosis (Woshner
2000; Sonne-Hansen et al. 2002). It was suggested that ringed seals may have adapted to
these metal concentrations and perhaps that these levels can in fact be considered normal
background for this species (Woshner 2000; Sonne-Hansen et al. 2002). It is likely
therefore that ringed seals are exposed to elevated Cd in their diet. Ringed seals
experience seasonal dietary shifts, feeding on pelagic zooplankton in summer and Arctic
cod (Boreogadus saida Lepechin, 1774) in winter and spring (Lowry et al. 1980a). In the
69
Canadian Arctic, Cd concentrations of typical ringed seal prey such as copepods and
amphipods are 5-8 times higher than concentrations in Arctic cod (Bohn and McElroy
1976). Euphausids and mysids have lower concentrations, ranging from 0.25 fig/g dry
weight (dw) in mysids to 0.44 (j.g/g dw in euphausids (Muir et al.1992; Ritterhoff and
Zauke 1997).
While metals and trace elements in active metabolic tissues (e.g., liver and
kidney) of ringed seals have been well investigated in the circumpolar Arctic there is
little information available for trace element concentrations in bearded and spotted seals.
Bearded seals rely heavily on benthic food, with crustaceans making up a majority of
their prey (Lowry et al. 1980b, Dehn in prep.). Feeding habits o f bearded seals are similar
to those o f Pacific walrus (Odobenus rosmarus Linnaeus, 1758). However, Cd
concentrations in liver of walrus from Alaska were about 5 times higher (Taylor et al.
1989) than for three bearded seals analyzed by Mackey et al. (1996), while total mercury
(THg) in walrus liver was an order of magnitude lower than reported for Canadian
bearded seals (Smith and Armstrong 1978).
Recently it has been shown that not only organic compounds may act as
endocrine disruptors, but heavy metals like Hg (both organic and inorganic), Cd, cobalt
(Co) and lead (Pb) can also have estrogenic effects in humans and rodents (Johnson et al.
2003; Martin et al. 2003). Hence, contaminants have been suggested as a cause for the
ongoing decline o f harbor seals (Phoca vitulina Linnaeus, 1758) in Alaskan waters, a
close relative to the spotted seal (Papa and Becker 1998). Both harbor seals and spotted
seals are piscivorous, and seasonally abundant schooling fish, e.g., herring (Clupea
pallasii Valenciennes, 1847), capelin (Mallotus villosus Muller, 1776) and smelt
(Osmerus spp. Linnaeus, 1758) dominate their diet (Bukhtiyarov et al. 1984; Hoover
1988; Dehn in prep.). Cd concentrations in kidneys of Alaskan harbor seals range from
0.3-44 ng/g wet weight (ww) and THg in liver ranges from 0.4-72 (j,g/g ww (Miles et al.
1992). Hepatic tissue concentrations of Cd and THg for one female spotted seal analyzed
by Becker et al. (1995a) fell within the lower range reported for harbor seals.
Concentrations of trace elements in most Arctic pinnipeds and accumulation
factors and pathways are not well understood, and reference ranges o f contaminant levels
in healthy seals are needed. The distribution and movement o f ringed, bearded and
spotted seals are strongly dependent on movements of sea ice, and seals migrate in
conjunction with their preferred ice habitat (Bums 1970). Since ice seals occupy a similar
habitat but deviate in their feeding ecology, the hypothesis that metal concentrations in
tissues could be discriminators for prey in the Arctic marine food web can be tested.
These animals also offer the opportunity to study and compare dietary effects of trace
elements likely without significant interspecies differences in physiological detoxification
mechanisms.
The objectives of this study are to provide baseline concentrations o f selected
trace elements o f apparently healthy seals taken during subsistence harvests in Alaska
and Canada, and evaluate the effects of age, trophic level and prey prevalence on trace
element pathways and biomagnification in phocid seals.
71
2.3 MATERIALS AND METHODS
2.31 Sampling
All seal samples were obtained during Native subsistence harvests. Sex and basic
morphometries, e.g., body length and blubber thickness were recorded. Most seals were
grossly examined for lesions and parasites. Lumbar muscle, kidney and liver of ringed
and bearded seals were collected in Barrow, Alaska mainly during the summer period
from 1998-2001. To increase sample size and statistical power, data from ringed seals
harvested in Barrow in 1996 and 1997 (Woshner et al. 2001a) were included in the
analyses.
Ringed seal samples also were obtained in Holman, NWT, Canada during
summer, 2001. Tissues of spotted seals were collected in Little Diomede (n = 18) and
Shishmaref (n = 16), Alaska in summer 2000 and 2001. Figure 2.1 shows villages and
communities where samples were collected and Table 2.1 summarizes sample sizes. All
tissues were sub-sampled under clean conditions with titanium or ceramic blades on a
Teflon covered surface, following the sampling protocol for contaminants by Becker et
al. (1999) and stored at -20°C in acid-washed scintillation vials or Whirlpacks™ until
analysis. Several potential prey species were collected or donated by subsistence hunters
in Barrow and the Bering Strait. Marine mammal samples were collected and analyzed
under the authority o f Permit Nos. 782-1399 and 358-1585 issued to the Alaska
Department of Fish and Game and 932-1489-03 issued to Dr. T. Rowles o f the Marine
Mammal Health and Stranding Response Program.
2.32 Aging
Jaws and claws were collected from seals after 1997 and stored at -20°C until
analysis. Ringed seals harvested in 1996 and 1997 were aged using the keratin layers of
claws, which provide a minimum age estimate for the animals (Benjaminsen 1973). Two
canines or canine and postcanine (if no other canines were available) were extracted from
the upper or lower jaw (depending on availability), submerged in a hot water bath for 30
minutes to avoid damage to the structure of the cementum, and stored in paper envelopes
(Matson 1981). All teeth were shipped to Matson's Laboratory, Milltown, Montana for
slide preparation. Teeth were prepared in 14 |im sections, placed on glass slides and
stained with Giemsa histological stain suitable for cementum analysis. Age was estimated
by counting annual growth layers in the cementum of teeth by two independent readers at
the University o f Alaska Fairbanks (UAF). Preparation and evaluation o f teeth were done
doubly blind by randomly assigning an identification number to each tooth with two teeth
analyzed per animal. The animal identification and matching teeth were only revealed
after all ages were estimated in duplicate. One growth layer per year o f age was assumed
for all seals (Benjaminsen 1973; Stewart et al. 1996). Maximum variation in age
estimates for seals younger than 15 years was +/- 1 year and in animals older than 15 +/-
5 years.
2.33 Stable Isotope Analyses
Lumbar muscle o f ringed, bearded, and spotted seals was freeze-dried and ground
into a powder with mortar and pestle. Samples were analyzed for both stable carbon and
73
nitrogen ratios (515N and 5 1 3C) at UAF using a Finnigan MAT Deltap'usXL Isotope Ratio
Mass Spectrometer (IRMS) directly coupled to a Costech Elemental Analyzer (ESC
4010). External instrument reproducibility for both carbon and nitrogen isotope analysis
was +/- 0.2%o. Detailed methods are described in Dehn (in prep.).
2.34 Trace Element Analyses
Silver (Ag), Cd, Cu, Se and Zn were analyzed at Texas A&M University (TAMU)
following US Environmental Protection Agency (EPA) procedures (200.3, 200.7, 200.8
and 200.9) with slight modifications (EPA 1992). Briefly, sub-sampled tissues were
freeze-dried to a constant weight and homogenized by ball-milling. Powdered tissue
(approximately 0.2 - 0.25 g) was digested in a microwave wet ash procedure using 3:2:1
HNO3 , H2 O2 and HC1, respectively. A second preparation followed for determination of
Se in tissues using excess HC1 to completely reduce Se (VI) to Se (IV) in a CPI
ModBlock digester. For Alaskan pinnipeds, all metals (except Cu and Zn) were analyzed
using Graphite Furnace Atomic Absorption Spectrometry (Perkin-Elmer Model SIMAA
6000 equipped with an AS-72 autosampler and Zeeman background correction). Cu and
Zn were determined by Flame Atomic Absorption Spectrometry (Perkin-Elmer Aanalyst
100). Se in all seal tissues was analyzed using Atomic Fluorescence Spectrometry (PSA
Millennium Excalibur with CETAC autosampler) and metals (Ag, Cd, Cu and Zn) in
seals from the Canadian Arctic were analyzed by ICP-MS (Perkin-Elmer Elan Model
6100 DRC-II). The detection limit was 0.01 |ig/g for elements analyzed with Graphite
Furnace AAS, Flame AAS and Atomic Fluorescence Spectrometry. The detection limits
74

were 0.01 (j.g/g for Cd, 0.05 (ig/g for Zn and Cu and 0.005 (j.g/g for Ag using ICP-MS.
All element concentrations were expressed as /ag/g wet weight (ww) unless otherwise
noted.
2.35 Total Mercury Analysis
Total mercury (THg) was analyzed at UAF following the procedure established
by Bloom and Crecelius (1983). Briefly, sub-sampled tissues were homogenized and
approximately 1 g was digested in 7:3 HNO3/H2 SO4 and oxidized with 10% BrCl in 12N
HCL. The sample was reduced to Hg° with SnC^ and purged with N 2 onto gold-coated
quartz sand traps followed by dual thermal desorption to a Cold Vapor Atomic
Fluorescence Spectrometer (Tekran Model-2500 CVAFS Mercury Detector) with argon
as the carrier gas. The detection limit was 0.001 |ig/g. Concentrations were expressed as
(ig/g ww unless otherwise noted.
2.36 Methyl Mercury Analysis
Methyl mercury (MeHg) was analyzed at UAF following the procedure
established by Bloom (1989). About 1 g o f tissue was homogenized and digested in 20%
KOH in methanol. Aqueous phase ethylation was initiated with NaB(C2H 5 ) 4 resulting in
volatile methylethylmercury which was purged with N 2 from solution onto a carbotrap™.
MeHg was thermally desorbed from the trap and volatile ethyl-analogs separated by
isothermal (100°C) gas chromatography (GC) followed by CVAFS (Tekran Model-2500)
75
with argon as the carrier gas. The detection limit was 0.001 (J-g/g. Concentrations were
expressed as (ig/g ww unless otherwise noted.
2.37 Quality Control
All trace element analyses have been run with respect to a thorough quality
control program (Table 2.2). Reference materials (DOLT-2 and DORM-2) were obtained
from the National Research Council, Canada (NRC) and SRM 1946 and BLS 1577b from
the National Institute of Standards and Technology (NIST). Marine mammal reference
material (liver o f pilot and beluga whale) and SRM 1947 were provided by NIST as part
of annual interlaboratory comparison exercises for the determination o f trace elements in
marine mammals (Wise et al. 1993, Christopher 2002, Christopher 2004). Spikes and
duplicates of samples as well as method and instrument blanks were run routinely (with
each group of 2 0 samples) during analysis.
2.38 Metal Ratios
The ratio or relative occurrence of organic Hg (MeHg) to total Hg (THg) is
referred to as %MeHg in the text and was calculated as:
%MeHg = (MeHg |ag/g ww / THg |_ig/g ww) * 100
76
The molar ratio o f Se to THg was calculated as:
77
Se/THg molar ratio = (Se (j,g/g ww / THg jj.g/g ww) * (200.59 g/mole / 78.96 g/mole)
where 200.59 g/mole and 78.96 g/mole are the atomic weight o f Hg and Se, respectively.
2.39 Statistical Analysis
The variables in the data set (age, S15N, 51 3C, Ag, Cd, Cu, Se, Zn, THg, MeHg,
%MeHg and Se/THg molar ratio) were ranked prior to analysis to adjust for violations of
normality and homogeneity of variance assumptions. Variables were analyzed for
location differences using t-tests within a seal species. If no significant differences were
detected for each variable localities were pooled to increase sample size. Two-way
ANOVA (with interaction term) followed by Tukey’s multiple comparison test was
applied to compare variable means among seal species, location and sex. Spearman rank
correlation was calculated within a species to determine correlations between the
variables. A residual analysis was implemented to determine any possible violations of
assumptions. Nonlinear regression analysis and LOESS non-parametric smoothing were
utilized on non-ranked raw data to estimate suitable functions between two variables and
compare regression surfaces between seal species. Graphing and nonlinear regression
analysis were conducted using Sigma-Plot (Version 7.0). All other statistical analyses
were performed using SAS (Version 8 ) with a = 0.05. In order to include element
concentrations below the minimum detection limit (MDL) into summary statistics and
statistical tests, they were expressed as one-half the MDL (Gilbert 1987). Results are
reported as mean +/- standard deviation (SD) unless otherwise noted.
2.4 RESULTS
2.41 Trace Element Concentrations and Tissue Distribution
Table 2.3 summarizes mean concentrations o f trace elements (Cu, Zn, Cd, Ag, Se,
THg and MeHg) and element ratios (%MeHg and Se/THg molar ratio) in tissues of
ringed, bearded and spotted seals from Alaska and Canada. For Ag in kidney and muscle,
more than 50% o f the samples were below the MDL in ringed, bearded, and spotted seals
from Alaska.
Generally, concentrations of trace elements were highest in liver, followed by
kidney, and lowest in muscle. However, renal concentrations o f Cd exceeded levels in
liver in all three species of seals in both Alaska and Canada. Zn in bearded seal muscle
was higher than in kidney, and renal Se in spotted seals was greater than in liver. Zn in
kidney o f Holman ringed seals exceeded concentrations in liver and the molar ratio of Se
to THg was lower in liver o f Alaskan and Canadian ringed, bearded and spotted seals
than other tissues.
2.42 Influence of Location
Trace element concentrations of spotted seals harvested near Shishmaref and
Little Diomede were not statistically different. Hence, these data were pooled to increase
sample size and power. Ringed seals harvested in Holman had significantly higher renal
and hepatic concentrations of THg (p = <0.0001 for both kidney and liver), Ag (p =
<0.0001 for both kidney and liver), Cd (p = <0.0001 and p = 0.0004 for kidney and liver,
respectively), Se (p = 0.003 and p = <0.0001 for kidney and liver, respectively), and
MeHg (p = <0.0001 and p = 0.01 for kidney and liver, respectively) than ringed seals
78
from Barrow. Zn in kidney o f Canadian ringed seals was higher than in Alaskan seals (p
= 0.0005), while hepatic Zn and Cu in liver and kidney were not different (p = 0.17 for
Zn in liver, p = 0.07 and p = 0.18 for Cu in kidney and liver, respectively). The ratio
%MeHg in kidney was higher in Canadian seals than in seals from Barrow (p = 0.01),
while the latter had higher %MeHg in liver (p = 0.0003). Seals from these two regions
were therefore analyzed separately.
2.43 Influence of Sex
There were few sex differences within a species for the variables. Holman ringed
seal males had higher renal concentrations o f MeHg than females (p = 0.04), while
females had higher concentrations o f Se and Cd in liver (p = 0.04 and 0.005 for Se and
Cd, respectively). Ringed seal females harvested in Barrow had higher hepatic Cd and Ag
than did males (p = 0.04 and 0.03 for Cd and Ag, respectively). Similarly, renal Cd and
Ag in liver o f bearded seals were higher in females than males (p = 0.03 and 0.04 for Cd
and Ag, respectively). Using two-way ANOVA, sex had a significant effect on renal Cd
(p = 0.01), hepatic Cd (p = 0.006), hepatic Se (p = 0.03) and Ag in liver (p = 0.02) with
females having higher concentrations than males in all cases. There were no significant
interaction among seal species, location and sex.
2.44 Species Comparison
All variables in all tissues differed significantly among species analyzed and
ringed seals from both locations (p = <0 . 0 0 0 1 for most comparisons) with the exception
of Cd in muscle. Results of the ANOVA and Tukey’s multiple comparison test for all
variables and tissues are compiled in Table 2.4. The relative proportion of organic Hg to
79
THg (%MeHg) in muscle was similar in ringed and bearded seals and accounted for
about 100% of the THg concentration present in this tissue. Hepatic Zn, Cu, Cd and Ag
were significantly higher in bearded seals than Alaskan ringed and spotted seals as well
as Cd and Se and in the kidney. Ringed seals from Canada had the highest concentrations
o f Se in liver; Ag and Cd in liver and renal Cd were similar to concentrations in bearded
seals. Average concentrations of Cu and THg in muscle were higher in ringed than in
bearded seals. Spotted seals had the lowest concentrations o f THg in tissues analyzed, but
had the highest molar ratio o f Se to THg in kidney and liver and highest renal and hepatic
%MeHg. Mean THg and MeHg in liver and kidney were highest in ringed seals from
Canada and the molar ratio o f Se to THg in these tissues was lowest. Sample size for
spotted seal muscle did not allow for an ANOVA comparison with ringed and bearded
seals.
2.45 Correlation Between Variables
Spearman rank test showed significant correlations in a variety o f variables within
and among tissues and are given in Table 2.5 for ringed, bearded and spotted seals from
Alaska and Canada. Positive correlations of Cd with age in kidney and Se in liver were
noted in ringed, bearded and spotted seals from both Alaska and Canada. Correlations
between Se and THg in liver and hepatic Cd to renal Cd were also found in all seals from
both locations. Trophic level as determined by §15N was negatively correlated to Cd in
liver and kidney of Alaskan ringed seals and was positively correlated to renal and/or
hepatic MeHg or THg in bearded seals, spotted seals and ringed seals from Canada. Other
significant correlations that were consistent among Alaskan species are Ag and Zn with
Cu in liver. Correlations that were noted in all species from both locations are highlighted
in Table 2.5 as bold script, and correlations consistent between seal species harvested in
Alaska are underlined.
2.46 Trace Element Concentrations in Potential Prey Species
Total body homogenates o f potential prey species analyzed for Cu, Zn, Ag, Cd,
Se and THg are compiled in Table 2.6. THg in body homogenates was generally low,
ranging from 1 ng/g in zooplankton to 70 ng/g in pollock (Theragra chalcogramma
Pallas, 1814). Cd was highest in invertebrates such as mollusks, sea cucumbers and
crustaceans, while Cu was an order of magnitude higher in squid, mussel and benthic
crustaceans compared to zooplankton and herring. Concentrations o f Ag were higher in
benthic and epibenthic species than pelagic zooplankton and the Se to THg molar ratio
was highest in isopods and zooplankton (2150:1 and 380:1, respectively) and lowest in
salmon (40:1).
2.5 DISCUSSION
2.51 Cadmium
2.511 Species Comparison
There is evidence that invertebrate prey species, in particular cephalopods, have
higher levels o f Cd than do fish (Bustamante et al. 1998; Bustamante et al. 2003).
Canadian ringed seals and bearded seals from Alaska had the highest Cd levels in liver
and kidney compared to Barrow ringed seals, and spotted seals had the lowest
concentrations. Concentrations of Cd in bearded seal liver were comparable to hepatic Cd
81
in Pacific walrus in Alaska, while concentrations in walrus kidney were higher (9.47 ±
8.26 (j.g/g and 50.77 ± 21.29 jag/g ww in walrus liver and kidney, respectively) (Taylor et
al. 1989). The diet o f bearded seals is dominated by benthic and epibenthic species, with
fish, crustaceans and mollusks (including cephalopods) making up the majority of
ingested prey in the Alaskan Arctic (Lowry et al. 1980b; Dehn in prep.). Walrus dietary
habits are similar to those of bearded seals, but clams are their prominent prey, fish are
generally not present, and frequency of octopus in walrus stomachs is negligible (Krylov
1971; Fay et al. 1984). However, concentration of Cd was low in the foot of Greenland
cockle (Serripes groenlandicus Mohr, 1786) and the siphon o f soft-shell clam (Mya
truncata Linnaeus, 1758) from the Canadian Arctic (0.03 ± 0.03 |j.g/g and 0.21 ± 0.13
|j.g/g ww, respectively) (Wagemann and Stewart 1994), while Cd in cockle total body
homogenates determined for this study was an order of magnitude higher (Table 2.6). Cd
content was highest in the digestive gland of clams analyzed from Antarctica (Bargagli et
al. 1996). Sheffield et al. (2001) argued that walrus likely excavated the whole clam and
did not selectively consume the foot; this is conceivable for bearded seals as well.
However, clam organs will digest more rapidly and thus may not be identified from most
walrus or seal stomachs (Sheffield et al. 2001). Generally, Cd concentrations were higher
in invertebrate prey than fish and higher in benthic than pelagic species (Table 2.6).
Marine organisms analyzed from Antarctica showed a similar trend with Cd in benthic
invertebrates being as high as 80 (ig/g dw (Bargagli et al. 1996). High levels o f Cd were
reported for hyperiid amphipods (Parathemisto libellula Lichtenstein, 1822) and
82
copepods from the Canadian Arctic, averaging 6.31 |ig/g and 5.0 |ig/g dw, respectively
(Bohn and McElroy 1976; Hamanaka and Ogi 1984; Macdonald and Sprague 1988;
Ritterhoff and Zauke 1997). Concentrations of Cd in mysids and whole Arctic cod were
an order o f magnitude lower with 0.17 p.g/g and 0.62 |j.g/g dw, respectively (Bohn and
McElroy 1976; Macdonald and Sprague 1988), and Cd in euphausids analyzed from
Greenland waters were below detection limit (Dietz et al. 1996; Ritterhoff and Zauke
1997). Cd in Atlantic pilot whales (Globicephala melas Traill, 1809) is among the
highest reported for marine mammals and can exceed 1 0 0 (ig/g ww in whole kidneys
(Caurant and Amiard-Triquet 1995). Squid has been implicated as being the Cd source
for these whales, and concentrations in cephalopods in the Atlantic Ocean can range from
0.1 (ig/g to 9.06 |ag/g ww (Bustamante et al. 1998). Thus, benthic invertebrate prey
consumed by bearded seals and high prevalence of cephalopods in their diet (Dehn in
prep.) likely accounted for high concentrations of hepatic and renal Cd.
Ringed seals from the Canadian Arctic have been reported to consume mostly
hyperiid amphipods (Bradstreet and Finley 1983; Smith 1987), and this may explain the
elevated Cd concentrations found in this study with those o f ringed seals from Alaska.
However, nitrogen isotope ratios for Canadian ringed seals indicate dependence on higher
trophic level prey (Dehn in prep.). Polar bears analyzed by Norstrom et al. (1986) and
Braune et al. (1991), as well as ringed seals and beluga whales (Delphinapterus leucas
Pallas, 1776) examined by Wagemann et al. (1996), followed a similar trend, with Cd
83
being higher in the Eastern than the Western Arctic. Thus, it is likely that ringed seals
from Canada are exposed to higher background concentrations o f Cd than Alaskan seals.
Renal and hepatic Cd of ringed seals harvested in Holman, Canada fall
intermediate to values reported by Wagemann et al. (1996) for ringed seals from Western
and Eastern Canada (21.1 ± 14.2 and 47.7 ± 23.3 (ig/g ww for seal kidney in western and
eastern Canada, respectively). Amphipods are also an important prey species for seals
from Greenland (Siegstad et al. 1998), and Cd in the renal cortex is similar to that
reported from Eastern Canada (44.5 ± 40.8 |ig/g ww) (Sonne-Hansen et al. 2002).
However, cortex concentrations o f Cd are approximately 25% higher than in whole
renicules (Sonne-Hansen et al. 2002). Thus, concentrations o f renal Cd in Greenland
seals are similar to Canadian ringed seals in this study.
Cd concentrations in liver and kidney are within the range previously reported for
ringed seals from Alaska (Becker et al. 1995a; Woshner et al. 2001a). Alaskan ringed
seals switch their diet seasonally from zooplankton in summer to Arctic cod in winter and
spring (Lowry et al. 1980a). An increased prevalence of Arctic cod with age was noted in
ringed seals along with a reduction in the amount o f crustaceans consumed (Lowry et al.
1980a, Dehn in prep.). Trophic level (515N) in this study was negatively correlated to Cd
in Alaskan ringed seals, suggesting association of Cd with low trophic level prey. Hence,
the relatively high Cd concentrations in ringed seal tissues are in agreement with the
seasonal importance o f dietary zooplankton (Lowry et al. 1980a, Dehn in prep.), in
contrast to the often assumed insignificance of invertebrate prey to this species.
Spotted seals have been described as piscivorous, but some evidence suggests that
taxa of prey consumed vary with age. Younger seals prey mostly on small crustaceans,
while the frequency o f fish increases in adults (Kato 1982; Bukhtiyarov et al. 1984, Dehn
in prep.). The low Cd concentrations found in spotted seal liver and kidney and a diet
dominated by fish both support an invertebrate connection to Cd. Similarly, Caspian seals
had low Cd concentrations in liver and kidney and seemed to prefer a fish-based diet,
while Baikal seals (Phoca sibirica Gmelin, 1788) accumulated Cd and fed mostly on
invertebrates (Watanabe et al. 2002). Mean concentrations of Cd in kidney of harbor
seals are higher than concentrations for closely related spotted seals (6 . 6 fj.g/g ww in
harbor seal kidney) (Miles et al. 1992). This difference could be due to the age bias
toward juvenile spotted seals in this study or could reflect the higher occurrence of
cephalopod prey in harbor seals (Lowry et al. 1982; Hoover 1988).
2.512 Cd and Sex
Cd concentrations in liver but not kidney were higher in female ringed seals than
in males from both Alaska and Canada. Dehn (in prep.) noted a difference in feeding
ecology between sexes o f Alaskan ringed seals. However, females occupied a higher
trophic level than did males and had higher prevalence o f fish in their diet, while males
consumed more zooplankton (Dehn in prep.). Thus, the difference in hepatic Cd
concentrations between male and female is unlikely related to diet. Bustamante et al.
(2004a) suggested the influence o f hormonal cycles to Cd metabolism. Adult female seals
exhibit higher feeding rates and greater energy content than males as a result of
reproductive requirements (Beck et al. 2003). Female rats have been shown to have an
increased induction of metallothionein and hence an increased capacity to store essential
elements, such as Cu and Zn in preparation for gestation (Suzuki et al. 1990; Chan et al.
1993; Solaiman et al. 2001). However, metallothionein is known to also bind non-
essential elements (e.g., Cd) with equal or higher affinity (Das et al. 2000), which could
account for the higher concentrations of Cd in liver o f ringed seal females. The low
amounts of Cd present in prey consumed by spotted seals and a bias in age distribution
towards immature seals may explain why a significant difference in Cd between sexes
was not documented. Based on element concentrations in typical bearded seal prey
(Table 2.6) there is likely a high intake of Cd, Zn and Cu with the diet so that subtle sex
differences could not be noted. However, results of the two-way ANOVA, in general,
showed that concentrations of Cd in liver and kidney were influenced by sex.
2.513 Cd and Age
Cd in renal tissue ringed and bearded seals from Alaska increase with age to a
peak, followed by a slow decline in older animals (Figure 2.2). This relationship was not
noted in spotted seals. However, only young animals were available and an age bias
could explain why a peak distribution similar to ringed and bearded seals from Alaska
was not documented for spotted seals. Ringed seals from Canada showed a continuous,
but gradual increase o f Cd after a critical age (around age 10). Although Cu and Zn can
cross the placental barrier readily, Cd is not transferred from maternal tissues to the fetus
during gestation (Wagemann et al. 1988; Itoh et al. 1996). Several studies report
induction o f metallothionein in the placenta which may serve as a selective filter against
toxic effects for the fetus (Itoh et al. 1996; Nordberg and Nordberg 2000; Enomoto and
86
Hirunuma 2001). Thus, accumulation of Cd begins after birth with dietary uptake.
However, some studies report a continuous accumulation of Cd with increasing age or
increase o f Cd to a maximum, the latter suggesting that dietary input and excretion are
balanced (Watanabe et al. 1998; Bustamante et al. 2004a).
A decrease o f Cd in kidneys with age as seen in ringed and bearded seals from
Alaska was also noted in humans (Marquart and Schaefer 1997), Greenland ringed seals
(Dietz et al. 1998; Sonne-Hansen et al. 2002), and Caspian seals (Watanabe et al. 2002).
In Caspian seals, this relationship was attributed to a preferential change in diet with age
from invertebrates to fish (Watanabe et al. 2002). This explanation is also likely for
ringed seals in this study, as they exhibited a similar dietary change with age (Lowry et
al. 1980a; Dehn in prep.). A dietary shift from relatively high Cd-containing crustaceans
(Bohn and McElroy 1976; MacDonald and Sprague 1988) to lower concentrations in fish
(Bustamante et al. 2003) could explain the observed decrease with age. However, in
bearded seals, there is no indication of a change in dietary preference with age that would
account for a decreased Cd input.
Physiologically, a metallothionein-cadmium complex is filtered through the renal
glomerulus and reabsorbed by the proximal tubule cells. Elimination o f Cd occurs
predominantly with shedding of tubule cells into the urine (Gerhardsson and Skerfving
1996). This process is extremely slow and is in part, responsible for the long biological
half-life o f about 20-40 years in humans (WHO 2000). The aging process is associated
with a variety o f changes in renal tissue. The ability to reabsorb Cd (and other essential
elements, e.g., Zn) in the proximal tubule cells decreases with age owing to impaired
87
peritubular blood flow and hypoxia caused by glomerulosclerosis (Khan et al. 1999;
Sonne-Hansen et al. 2002). The increase in renal connective tissue with age
(glomerulosclerosis) is well known (Thomas et al. 1998) and could also account for
decreasing Cd concentrations in these seals. In addition, apoptosis (programmed cell
death) o f renal tubule cells with increasing age, as described by Cardani and Zavanella
(2000), may lead to an increased excretion of Cd with shed cells after a critical age.
Lastly, involvement of hormones may also explain changes in Cd metabolism. Muraoka
(2 0 0 1 ) suggested that androgens like testosterone increase renal tubule apoptosis and
could thus lead to an increased excretion of Cd with shed tubular cells in males. This is
supported by this study, as females had significantly higher renal Cd concentrations than
males.
2.52 Mercury
2.521 Species Comparison
O f phocids harvested in Alaska, bearded seals showed the highest concentrations
of THg, while spotted seals had the lowest. This finding was unexpected as several
studies linked Hg to trophic level and fish consumption (Dietz et al. 1996; Wagemann et
al. 1997; Egeland et al. 1998). Fish was identified from all spotted seal stomachs and
trophic level (S15N) was significantly higher in spotted seals than ringed or bearded seals
from Alaska. Bearded seals had a high proportion o f fish in their diet (Dehn in prep.),
which could account for elevated concentrations o f THg in their tissues. However, MeHg
in bearded seal tissues was low; it is usually associated with fish and readily bioavailable
*kL
88
(Wagemann et al. 1997; Wagemann et al. 2000). If organic Hg (MeHg) is expressed as
percentage o f THg (%MeHg), piscivorous spotted seals had the highest ratio and bearded
seals the lowest ratio in both hepatic and renal tissues. Ringed seals from Alaska
consume a mix o f fish and crustaceans and showed values intermediate to spotted and
bearded seals. This suggests that the ratio of MeHg to THg may be a better indicator for
piscivory than THg alone.
Overall, concentrations of THg in liver and kidney were highest for ringed seals
from Canada. A geographic increase o f Hg from eastern to western Canada has been
reported for ringed seal tissues and was attributed to a gradient in natural geological
background concentrations (Wagemann et al. 1996). Thus, higher Hg concentrations in
ringed seals from Canada than in seals from Alaska are feasible if geologic THg gradients
are only localized in the Canadian Arctic. Hepatic THg in bearded seals from Holman
was 143 ± 1 7 0 fig/g ww (Smith and Armstrong 1978), while concentrations in bearded
seals harvested in Barrow were about two orders of magnitude lower. THg and MeHg in
liver of ringed seals from Canada in this study were very similar to levels reported by
Smith and Armstrong (1978) for Holman seals. In the Greenland Arctic, concentrations
of 21.4 ± 52.0 fag/g ww and 13.4 ± 12.2 (ig/g ww were found for ringed and bearded seal
liver, respectively (Dietz et al. 1990), which are comparable to those from Canada. THg
in Alaskan ringed seal tissues are within ranges reported by Becker et al. (1995a) and
Woshner et al. (2001a). Hepatic THg of spotted seals in this study was an order of
magnitude lower than for 23 harbor seals from Alaska analyzed by Miles et al. (1992).
89
Several studies reported differences in concentrations o f Hg between sexes and
suggested that females may be able to excrete Hg, in particular MeHg, through maternal
transfer across the placenta, which would leave males with a higher body burden
(Wagemann et al. 1988; Becker et al. 1995a, Watanabe et al. 1998; Watanabe et al.
2002). Thomas et al. (1986) showed that female rats fed MeHg cleared Hg faster from
body tissues than did males. However, only Holman ringed seal males had higher renal,
but not hepatic concentrations o f MeHg than females.
2.522 Hg and Age
Several studies describe a positive correlation between THg or MeHg and age in
seal liver and kidney (Dietz et al. 1996; Yeats et al. 1999; Wagemann et al. 2000;
Woshner et al. 2001a; Watanabe et al. 2002; Bustamante et al. 2004a). This suggests the
continuous uptake o f Hg / MeHg via diet, slow elimination or storage and thus a
relatively long half-life of THg of about 10 years as discussed by Wagemann et al.
(2000).
The relative occurrence of MeHg expressed as percentage of THg (%MeHg) in
liver versus age in ringed, bearded, and spotted seals from Alaska and Canada is shown
in Figure 2.3. A LOESS nonparametric curve fitting (dashed gray line) was used to assess
the accuracy of the nonlinear regression. A hyperbolic decay function was fitted to each
data set, and is in good agreement with the LOESS fit for bearded seals and ringed seals
from both Canada and Alaska. Fetuses are exposed to MeHg, likely through placental
transfer from the mother. Transport of Hg across the placental barrier was also described
for harp seals, Caspian seals, and humans (Wagemann et al. 1988; Ask et al. 2002;
90
Watanabe et al. 2002). The percentage o f MeHg in liver decreases to a minimum at
around 5 years and remains relatively constant with increasing age. This indicates that the
dietary uptake o f MeHg in these seals remains in equilibrium with physiological
detoxification processes. For spotted seals the variability o f %MeHg with age is high and
the hyperbolic decay function is not a good fit. It is possible that the amount o f MeHg in
tissues is strongly dependent on the consumption o f fish, and the physiological
detoxification processes may be outweighed by an increased dietary input of MeHg. In
rodent studies, biotransformation o f MeHg in the liver was inversely correlated to
administered MeHg dose, suggesting saturation of enzyme systems involved in
demethylation o f Hg (Iverson and Hierlihy 1974; Yamamoto et al. 1986). However, age
of spotted seals in this study is biased toward young animals and could also account for
the high variability in these animals.
Seals highlighted as open symbols in Figure 2.3 (I and II) were found with hepatic
lesions and show a higher relative occurrence of organic mercury in liver (seals were
excluded from regression analysis to avoid the impact o f influential observations).
Lesions were determined during either necropsy and/or histologic assessment by
Woshner (2000). Elevated %MeHg could suggest that these seals are compromised in
their ability to demethylate MeHg or that the underlying physiological detoxification
mechanisms are altered. Thus, caution should be taken when determining element status
of stranded or compromised animals, as they may not present the norm of a healthy
population. Altered accumulation patterns of some heavy metals in seal tissues during
91

epizootics have also been reported by Frank et al. (1992), Olsson et al. (1994) and Anan
et al. (2 0 0 2 ).
2.53 Selenium
Se is an essential element and incorporated into antioxidant enzyme systems, most
importantly glutathione peroxidase (Bondy 1996). Numerous studies have discussed the
protective effect of Se on Hg toxicosis and a molar ratio o f 1:1 for Se:THg has been
reported in many studies involving marine mammals (Koeman et al. 1973; Smith and
Armstrong 1978; Caurant et al. 1994; Dietz et al. 1998; Dietz et al. 2000; Endo et al.
2002; Bustamante et al. 2004a; Decataldo et al. 2004). Other investigators have found
ratios deviating from unity to varying degrees (Wagemann and Stewart 1994; Woshner et
al. 2001a; Woshner et al. 2001b; Anan et al. 2002). Becker et al. (1995b) found Se:THg
molar ratios o f 3:1 in belugas harvested in Alaska, while pilot whales from the North
Atlantic had a 1:1 ratio. Results of this study showed that the Se:THg molar ratio in liver
had a strong negative correlation with age in ringed (r = -0.48 and r = -0.56 for Alaskan
and Canadian ringed seals, respectively) and spotted seals (r = -0.80) (Figure 2.4).
Wagemann et al. (1988) made a similar observation in harp seal mothers having a 1:1
molar ratio (Se:THg), while their pups had a 6.5:1 Se:THg molar ratio. Se is transported
over the placental barrier from mother to fetus (Wagemann et al. 1988; Enomoto and
Hirunuma 2001; Yang et al. 2004) and is essential for the maturing antioxidant system,
and endocrine, reproductive, and neuronal development (Bedwal and Bahuguna 1994;
Watanabe et al. 1999; Bates et al. 2000; Hirunuma et al. 2001).
92
In general, spotted seals in this study had the highest hepatic Se:THg molar ratio,
followed by ringed seals from Alaska (13:1 and 11.7:1 for spotted and ringed seals,
respectively). The typical 1:1 molar ratio could only be documented for some older
ringed seals from the Canadian Arctic. This is in accordance with Wagemann et al.
(2000) and Dietz et al. (2000) who suggested that the classic unity o f Se and THg is only
found in seals with high concentrations of Hg. However, a molar ratio o f 1:1 (Se:THg)
would indicate that almost all available Se is bound to Hg. Se is involved in oxy radical
scavenging as part o f the glutathione peroxidase system and this capability is needed in
diving marine mammals to cope with oxidative stress (Zenteno-Savin et al. 2002). Thus,
tissue ratios close to 1:1 (Se:THg) could be a possible indicator for compromised health
as suggested by Dietz et al. (2000). In spotted seals, renal Se and the Se:THg molar ratio
was higher than in liver. The sampling bias was toward young animals and, as described,
the correlation between Se:THg molar ratio and age is negative and nonlinear. However,
Se in the kidney may be protective against renal damage (Santos et al. 2005). The molar
ratio of Se exceeds those o f Hg by more than 100 in most prey homogenates and is in
agreement with concentrations reported by Dietz et al. (2000).
2.54 Silver
Ag occurs naturally in the earth's crust and as mining deposits (Purcell and Peters
1998). It can erode from natural accumulations or reach the aquatic environment via
hydrothermal activity, e.g., black smokers of the Aleutian volcanic arc. Anthropogenic
sources o f Ag include mining, photographic industry, electronic applications as well as
93
industrial and sewage discharges (Purcell and Peters 1998). None of the anthropogenic
sources seem to have significant impact in the Arctic waters o f Alaska. Becker et al.
(2001) demonstrated lower concentrations of Ag in liver o f Cook Inlet beluga whales
(close to human activities) than in the more remote Beaufort or Chukchi sea beluga
stocks.
Ag has a high affinity to sulfate ions and halogens in water and forms insoluble
complexes that precipitate (Bell and Kramer 1999). Thus, Ag has the potential to
accumulate in the benthic food chain. Zhang et al. (2001) showed an increase of
dissolved Ag with depth, ranging from 4.4 pmol/kg in North Pacific surface waters to
41.5 pmol/kg at over 5 km deep. Sea-floor sediments sampled in the East Siberian Sea
and Laptev Sea o f the Russian Arctic had concentrations o f 0.082 |ig/g (Presley 1997)
and Ag in the vicinity o f hydrothermal vents had concentrations as high as 8 6 jag/g (Hein
et al. 1999). Marine mammals feeding in the benthic ecosystem could therefore have a
higher exposure to Ag than animals that feed pelagically. This is supported by the
findings of this study as benthic-feeding bearded seals had the highest concentrations of
hepatic Ag whereas pelagic ringed and spotted seals had low concentrations. The high
levels of Ag in liver of ringed seals from Canada are not likely to be explained by dietary
selection. Although benthic or epibenthic prey is consumed by these seals, they are
preying mostly in the water column (Bradstreet and Finley 1983; Smith 1987). Thus, it is
possible that Ag is higher in the Canadian Arctic becaue o f either natural geologic
sources or anthropogenic impact as has been discussed for the St. Lawrence estuary
(Gobeil 1999).
94
Benthic invertebrates that seem to accumulate Ag (and Cu) at considerable levels
are cephalopods, bivalves, and crustaceans, while flatfish retained less than 2 0 % of an
administered Ag dose (Martin and Flegal 1975; Berthet et al. 1992; Rouleau et al. 2000;
Bustamante et al. 2004b). The blood of mollusks and crustaceans contains hemocyanin, a
Cu-based respiratory pigment. Ag is chemically similar to Cu and has a high affinity to
sulfur ligands. Thus, an incidental uptake of Ag instead o f Cu or binding-site competition
seems possible. Saeki et al. (2001) indicated that Ag interferes with Cu metabolism and
Cu transport. Martin and Flegal (1975) described a strong positive correlation of Ag and
Cu in cephalopods. These elements are also correlated in liver o f Alaskan seals in this
study and in polar bears, ringed seals, and bowhead and beluga whales (Woshner et al.
2001a; Woshner et al. 2001b).
The higher concentrations of hepatic Ag in bearded seals and the high occurrence
of octopus and large crustaceans in stomachs of these seals (Dehn in prep.) support a
linkage of benthic invertebrates to Ag. Similarly, concentrations of Ag in liver of
Northern fur seals (Callorhinus ursinus Linnaeus, 1758) are comparable to levels found
in bearded seals from Alaska and are in agreement with the cephalopod-dominated diet of
fur seals (Mori et al. 2001; Saeki et al. 2001). Very high concentrations of Ag have been
reported in beluga whales from Alaska and this appears to be unique for this species
(Becker et al. 1995b; Mackey et al. 1996; Becker et al. 2001; Woshner et al. 2001b). In
contrast to pinnipeds analyzed by Saeki et al. (2001), Ag was not correlated to age in
seals of this study. Reasons for higher concentrations o f hepatic Ag in females than in
95
males in this study are likely the same as discussed for Cd, e.g., increased induction of
metallothionein in reproductive females and increased rate o f feeding.
2.55 Copper and Zinc
Cu and Zn are essential elements and thus are regulated within tight biological
margins. However, Cu and Zn seem to mirror the concentration patterns described for Ag
and Cd, with benthic- and invertebrate-feeding bearded seals showing higher
concentrations than piscivorous and pelagic ringed and spotted seals from Alaska and
Canada. Wagemann and Stewart (1994) reported concentrations o f hepatic Cu and Zn of
walrus from Canada that were within the range of ringed seals, but were lower than for
bearded seals analyzed in this study (9.7 ± 7.7 and 45.2 ± 10.3 p.g/g ww for walrus Cu
and Zn, respectively).
Zn, Cu, Cd and Ag are commonly intercorrelated (Das et al. 2000; Woshner et al.
2001a; Bustamante et al. 2004a), suggesting induction o f metallothionein and possible
competition or paralleling increase in metal-binding sites. Braune et al. (1991) and
Woshner et al. (2001a) also described correlations of Hg with Cu and Zn in liver of polar
bears. However, Hg does not seem to be correlated to Cu and Zn in pinnipeds and
cetaceans, indicating that Hg induces metallothionein in terrestrial, but not in marine
animals as has been discussed by Das et al. (2000) and Decataldo et al. (2004).
Several studies report higher concentrations o f Cu and Zn in juvenile and subadult
animals (Wagemann et al. 1988; Wagemann 1989; Watanabe et al. 1998), and both
elements readily cross the placental barrier. Metallothionein in the fetus is higher than in
96
juveniles and adults, likely to accommodate the increased demand for Cu and Zn in
developing and growing tissues (Bremner and Beattie 1990; Teigen et al. 1999). In Arctic
ruminants, the fetus stores large amounts of Cu for tissue development and growth during
late gestation, as dietary Cu and maternal reserves may be marginal (Rombach et al.
2003). On the other hand, Bremner and Beattie (1990) postulated that the accumulation
of Cu in fetal tissues may be due to limited efficiency o f bilary excretion mechanisms.
For seals analyzed in this study, Cu or Zn and age were only inversely correlated in
ringed seals from Canada.
2.6 SUMMARY AND CONCLUSION
In conclusion, age and diet can substantially affect trace element concentrations in
tissues o f phocid seals. Cd concentrations appear to be connected to invertebrates, and
bearded seals that are dependent on this type o f prey exhibit the highest renal and hepatic
concentrations, while spotted seals have the lowest. Renal Cd increases with age to a
peak, followed by a gradual decline with increasing age. This suggests physiological
changes associated with aging in the kidney, such as increased apoptosis and shedding of
proximal tubule cells. THg in liver and kidney was unexpectedly lower in piscivorous
spotted seals than bearded seals. Hepatic %MeHg on the other hand was highest in
spotted seals and lowest in bearded seals, indicating that this metal ratio may be a good
indicator o f piscivory. Seals with hepatic lesions had higher %MeHg in liver than healthy
seals, implying that these animals may be compromised in their ability to demethylate
MeHg. Se is strongly correlated to THg in liver and kidney and the Se:THg molar ratio is
97
inversely correlated to age in ringed and spotted seals. A 1:1 (Se:THg) molar ratio in liver
was only documented in older ringed seals from Canada. Ag showed a possible
connection to the benthic food chain and was positively correlated to Cu in seals from
Alaska. Concentrations o f Cu and Zn are more difficult to interpret as they are essential
elements and regulated within tight biological margins. However, Cu and Zn mirror
tissue distribution patterns described for Ag and Cd and these metals are often
intercorrelated, suggesting induction of metallothionein and binding site competition.
2.7 ACKNOWLEDGMENTS
This study would not have been possible without the samples provided by
Alaskan and Canadian subsistence hunters in the communities o f Barrow, Holman, Little
Diomede and Shishmaref, and we thank them all for their support. We greatly appreciate
the assistance o f C. D. N. Brower, H. Brower, Jr., T. Olemaun, B. Akootchook, T. Hepa,
L. Hopson, V. Woshner, B. Eisner, T. Zenteno-Savin, S. Visalli, D. Burnett, G. York, and
many others in the field and T. Bentzen for support with analysis. We also thank L.
Harwood for providing tissues and jaws of ringed seals harvested in Holman, Canada,
and P. Hoekstra for shipment of these samples. J. Bengtson and D. DeMaster arranged for
training in cementum aging techniques and P. Becker and S. Christopher provided marine
mammal reference material and coordinated interlaboratory comparison exercises for the
determination o f trace elements in marine mammals. The comments o f two anonymous
reviewers improved the manuscript. This study was primarily funded by the Cooperative
Institute for Arctic Research (CIFAR). Additional support was provided by the
98
Experimental Program for Stimulation of Competitive Research (EPSCoR); the
Biomedical Research Infrastructure Network (BRIN); the North Slope Borough
Department o f Wildlife Management; the Institute of Arctic Biology and the Department
of Biology and Wildlife, UAF; the US Geological Survey; the Barrow Arctic Science
Consortium (BASC); and the National Science Foundation (NSF) OPP Grant 9910319.
2.8 REFERENCES
Anan, Y., Kunito, T., Ikemoto, T., Kubota, R., Watanabe, I., Tanabe, S., Miyazaki, N.,
and Petrov, E.A. 2002. Elevated concentrations of trace elements in Caspian seals
(Phoca caspica) found stranded during the mass mortality events in 2000. Arch.
Environ. Contam. Toxicol. 42: 354-362.
Ask, K., Akesson, A.B.M., and Vahter, M. 2002. Inorganic mercury and methylmercury
in placentas of Swedish women. Environmental Health Perspectives, 110: 523-
526.
Ballard, W.B., Cronin, M.A., Robards, M.D., and Stubblefield, W.A. 2003. Heavy metal
concentrations in Arctic foxes, Alopex lagopus, in the Prudhoe Bay oil field,
Alaska. Can. Field-Nat. 117: 119-121.
99
Bargagli, R., Nelli, L., Ancora, S., and Focardi, S. 1996. Elevated cadmium accumulation
in marine organisms from Terra Nova Bay (Antarctica). Polar Biol. 16: 513-520.
Bates, J.M., Spate, V.L., Morris, J.S., Germain, D.L.S., and Galton, V.A. 2000. Effects of
selenium deficiency on tissue selenium content, deiodinase activity, and thyroid
hormone economy in the rat during development. Endocrinology, 141: 2490-
2500.
Beck, C.A., Bowen, W.D., and Iverson, S.J. 2003. Sex differences in the seasonal
patterns o f energy storage and expenditure in a phocid seal. J. Anim. Ecol. 72:
280-291.
Becker, P.R., Mackey, E.A., Schantz, M.M., Demiralp, R., Greenberg, R.R., Koster, B.J.,
Wise, S. A., and Muir, D.C.G. 1995a. Concentrations o f chlorinated hydrocarbons,
heavy metals and other elements in tissues banked by the Alaska Marine Mammal
Tissue Archival Project. NISTIR 5620, U. S. Department of Commerce,
Gaithersburg, MD.
Becker, P.R., Mackey, E.A., Demiralp, R., Suydam, R., Early, G., Koster, B.J., and Wise,
S.A. 1995b. Relationship of silver with selenium and mercury in the liver of two
species o f toothed whales (Odontocetes). Mar. Pollut. Bull. 30: 262-271.
Becker, P.R., Porter, B.J., Mackey, E.A., Schantz, M.M., Demiralp, R., and Wise, S.A.
1999. National Marine Mammal Tissue Bank and Quality Assurance Program:
100
protocols, inventory, and analytical results. NISTIR 6279, U. S. Department of
Commerce, Gaithersburg, MD.
Becker, P.R., Pugh, R.S., Schantz, M.M., Mackey, E.A., Demiralp, R., Epstein, M.S.,
Donais, M.K., Porter, B.J., Wise, S.A., and Mahoney, B.A. 2001. Persistent
chlorinated compounds and elements in tissues o f Cook Inlet beluga whales,
Delphinapterus leucas, banked by the Alaska Marine Mammal Tissue Archival
Project. NISTIR 6702, National Institute of Standards and Technology,
Gaithersburg, MD.
Bedwal, R.S., and Bahuguna, A. 1994. Zinc, copper and selenium in reproduction.
Experientia (Basel), 50: 626-640.
Bell, R.A., and Kramer, J.R. 1999. Structural chemistry and geochemistry of silver-sulfur
compounds: Critical review. Environ. Toxicol. Chem. 18: 9-22.
Benjaminsen, T. 1973. Age determination and the growth and age distribution from
cementum growth layers of bearded seals at Svalbard. Fiskeridirektoratets
skrifter. Serie havundersokelser, 16: 159-170.
Berthet, B., Amiard, J.C., Amiard-Triquet, C., Martoja, R., and Jeantet, A.Y. 1992.
Bioaccumulation, toxicity and physico-chemical speciation of silver in bivalve
101
102
molluscs: ecotoxicological and health consequences. Sci. Total Environ. 125: 97-
122.
Bloom, N. 1989. Determination o f picogram levels o f methylmercury by aqueous phase
ethylation, followed by cryogenic gas chromatography with cold vapor atomic
fluorescence detection. Can. J. Fish. Aquat. Sci. 46: 1131-1140.
Bloom, N.S., and Crecelius, E.A. 1983. Determination of mercury in seawater at sub
nanogram per liter levels. Mar. Chem. 14: 49-59.
Bohn, A., and McElroy, R.O. 1976. Trace metals (As, Cd, Cu, Fe and Zn) in Arctic cod,
Boreogadus saida, and selected zooplankton from Strathcona Sound, northern
Baffin Island. J. Fish. Res. Board Can. 33: 2836-2840.
Bondy, S.C. 1996. Oxygen generation as a basis for neurotoxicity by metals. In
Toxicology of Metals. Edited by L. W. Chang. CRC Lewis Publishers, Boca
Raton, FL. pp. 699-706.
Bradstreet, M.S.W., and Finley, K.J. 1983. Diet of ringed seals (Phoca hispida) in the
Canadian High Arctic. LGL Limited. Toronto, Ontario.
Bratton, G.R., Flory, W., Spainhour, C.B., and Haubold, E.M. 1997. Assessment of
selected heavy metals in liver, kidney, muscle, blubber, and visceral fat o f Eskimo
harvested bowhead whales Balaena mysticetus from Alaska:s North Coast.
Department o f Wildlife Management, North Slope Borough, Barrow, AK.
Braune, B.M., Norstrom, R.J., Wong, M.P., Collins, B.T., and Lee, J. 1991. Geographical
distribution o f metals in livers of polar bears from the Northwest Territories,
Canada. Sci. Total Environ. 100: 283-299.
Bremner, I., and Beattie, J.H. 1990. Metallothionein and the trace minerals. Annu. Rev.
Nutr. 10: 63-83.
Bukhtiyarov, Y.A., Frost, K.J., and Lowry, L.F. 1984. New information on foods of the
spotted seal, Phoca largha, in the Bering Sea in spring. U. S. Department of
Commerce, NOAA, NOAA Technical Report, NMFS N o.12 : 55- 59.
Bums, J.J. 1970. Remarks on the distribution and natural history of pagophilic pinnipeds
in the Bering and Chukchi Seas. J. Mammal. 51: 445-454.
Bustamante, P., Caurant, F., Fowler, S.W., and Miramand, P. 1998. Cephalopods as a
vector for the transfer of cadmium to top marine predators in the north-east
Atlantic Ocean. Sci. Total Environ. 220: 71-80.
103

Bustamante, P., Bocher, P., Cherel, Y., Miramand, P., and Caurant, F. 2003. Distribution
o f trace elements in the tissues o f benthic and pelagic fish from the Kerguelen
Islands. Sci. Total Environ. 313: 25-39.
Bustamante, P., Morales, C.F., Mikkelsen, B., Dam, M., and Caurant, F. 2004a. Trace
element bioaccumulation in grey seals Halichoerus grypus from Faroe Islands.
Mar. Ecol. Prog. Ser. 267: 291-301.
Bustamante, P., Teyssie, J.-L., Danis, B., Fowler, S.W., Miramand, P., Cotret, O., and
Wamau, M. 2004b. Uptake, transfer and distribution o f silver and cobalt in tissues
o f common cuttlefish Sepia officinalis at different stages o f its life cycle. Mar.
Ecol. Prog. Ser. 269: 185-195.
Cardani, R., and Zavanella, T. 2000. Age-related cell proliferation and apoptosis in the
kidney of male Fischer 344 rats with observations on a spontaneous tubular cell
adenoma. Toxicologic Pathology, 28: 802-806.
Caurant, F., Amiard, J.C., Amiard-Triquet, C., and Sauriau, P.G. 1994. Ecological and
biological factors controlling the concentrations o f trace elements (As, Cd, Cu,
Hg, Se, Zn) in delphinids Globicephala melas from the North Atlantic Ocean.
Mar. Ecol. Prog. Ser. 103: 207-219.
104

Caurant, F., and Amiard-Triquet, C. 1995. Cadmium contamination in pilot whales
Globicephala melas: Source and potential hazard to the species. Mar. Pollut. Bull.
30: 207-210.
Chan, H.M., Tamura, Y., Cherian, M.G., and Goyer, R. 1993. Pregnancy-associated
changes in plasma metallothionein concentration and renal cadmium
accumulation in rats. Proc. Soc. Exp. Biol. Med. 202: 420-427.
Christopher, S.J. 2002. NIST / NOAA National marine analytical quality assurance
program. Description and results of the 2001 interlaboratory comparison exercise
for the determination of trace elements in marine mammals. National Institute of
Standards and Technology, Charleston, SC.
Christopher, S.J. 2004. NIST / NOAA National marine analytical quality assurance
program. Description and results of the 2003 interlaboratory comparison exercise
for the determination of trace elements in marine mammals. National Institute of
Standards and Technology, Charleston, SC.
Das, K., Debacker, V., and Bouquegneau, J.M. 2000. Metallothioneins in marine
mammals. Cell. Mol. Biol. 46: 283-294.

Decataldo, A., Di Leo, A., Giandomenico, S., and Cardellicchio, N. 2004. Association of
metals (Mercury, cadmium and zinc) with metallothionein-like proteins in storage
organs of stranded dolphins from the Mediterranean sea (Southern Italy). J.
Environ. Monit. 6: 361-367.
Dehn, L.-A. In preparation. Trophic relationships in an Arctic marine foodweb and
implications for trace element dynamics. Ph.D. thesis, Department of Biology and
Wildlife, University o f Alaska Fairbanks, Fairbanks, AK.
Deutch, B., and Hansen, J.C. 2003. AMAP Greenland and the Faroe Islands 1997-2001.
Dancea. Danish Cooperation for Environment in the Arctic. Danish
Environmental Protection Agency. 234 pp.
Dietz, R., Nielsen, C.O., Hansen, M.M., and Hansen, C.T. 1990. Organic mercury in
Greenland birds and mammals. Sci. Total Environ. 95: 41-51.
Dietz, R., Riget, F., and Johansen, P. 1996. Lead, cadmium, mercury and selenium in
Greenland marine animals. Sci. Total Environ. 186: 67-93.
Dietz, R., Paludan-Mtiller, P., Agger, C.T., and Nielsen, C.O. 1998. Cadmium, mercury,
zinc and selenium in ringed seals (Phoca hispida) from Greenland and Svalbard.
NAMMCO Scientific Publications, Tromso. pp. 242-273.
Dietz, R., Riget, F., Cleemann, M., Aarkrog, A., Johansen, P., and Hansen, J.C. 2000.
Comparison of contaminants from different trophic levels and ecosystems. Sci.
Total Environ. 245:221-231.
Egeland, G.M., Feyk, L.A., and Middaugh, J.P. 1998. The use o f traditional foods in a
healthy diet in Alaska: risks in perspective. State o f Alaska Epidemiology
Bulletin, 2: 1-140.
Endo, T., Haraguchi, K., and Sakata, M. 2002. Mercury and selenium concentrations in
the internal organs of toothed whales and dolphins marketed for human
consumption in Japan. Sci. Total Environ. 300: 15-22.
Enomoto, S., and Hirunuma, R. 2001. Fetoplacental transport of various trace elements in
pregnant rat using the multitracer technique. RIKEN Review, 35: 31-34.
Fay, F.H., Bukhtiyarov, Y.A., Stoker, S.W., and Shults, L.M. 1984. Foods of the Pacific
walrus in winter and spring in the Bering Sea. NOAA Technical Report, NMFS
N o.12 : 81- 88.
Frank, A., Galgan, V., Roos, A., Olsson, M., Petersson, L.R., and Bignert, A. 1992. Metal
concentrations in seals from Swedish waters. Ambio, 21: 529-538.
107
George, J.C., Bada, J., Zeh, J., Scott, L., Brown, S.E., O'Hara, T., and Suydam, R. 1999.
Age and growth estimates of bowhead whales (Balaena mysticetus) via aspartic
acid racemization. Can. J. Zool. 77: 571-580.
Gerhardsson, L., and Skerfving, S. 1996. Concepts on biological markers and
biomonitoring for metal toxicity. In Toxicology of Metals. Edited by L. W.
Chang. CRC Lewis Publishers, Boca Raton, FL. pp 81-107.
Gilbert, R. O. 1987. Statistical methods for environmental pollution monitoring. John
Wiley and Sons, Inc., New York.
Gobeil, C. 1999. Silver in sediments from St. Lawrence River and estuary and the
Saguenay Fjord. Environ. Sci. Technol. 33: 2953-2957.
Hamanaka, T., and Ogi, H. 1984. Cadmium and zinc concentrations in the hyperiid
amphipod, Parathemisto libellula from the Bering Sea. Bull. Fac. Fish. Hokkaido
Univ. 35: 171-178.
Hein, J.R., Koski, R.A., Embley, R.W., Reid, J., and Chang, S.-W. 1999. Diffuse-flow
hydrothermal field in an oceanic fracture zone setting, Northeast Pacific: Deposit
composition. Exploration and Mining Geology, 8 : 299-322.
108
Hirunuma, R., Ozaki. T., Endo, K., Yasui, H., Sakurai, H., and Enomoto, S. 2001. Uptake
of various elements in selenium-deficient rats: Application o f the multitracer
technique. RIKEN Review, 35: 40-44.
Hoover, A.A. 1988. Harbor seal. In Selected marine mammals o f Alaska: Species
accounts with research and management recommendations. Edited by J. W.
Lentfer. Marine Mammal Commission, Washington, D.C. pp. 125-157.
Itoh, N., Fujita, Y., Nakanishi, H., Kawai, Y., Mayumi, T., Hawang, G.S., Min, K.,
Onosake, S., Muto, N., and Tanaka, K. 1996. Binding of Cd to metallothionein in
the placenta o f Cd-treated mouse. J. Toxicol. Sci. 21: 19-27.
Iverson, F., and Hierlihy, S.L. 1974. Biotransformation of methyl mercury in the guinea
pig. Bull. Environ. Contam. Toxicol. 11: 85-91.
Johnson, M.D., Kenny, N., Stoica, A., Hilakivi-Clarke, L., Singh, B., Chepko, G., Clarke,
R., Sholler, P.F., Lirio, A.A., Foss, C., Reiter, R., Trock, B., Paik, S., and Martin,
M.B. 2003. Cadmium mimics the in vivo effects o f estrogen in the uterus and
mammary gland. Nature Medicine, 9: 1081-1084.
Kato, H. 1982. Food habits of largha seal pups in the pack ice area. Sci. Rep. Whales Res.
Inst. (Tokyo), 43: 123-136.
109
Khan, S., Cleveland, R.P., Koch, C.J., and Schelling, J.R. 1999. Hypoxia induces renal
tubular epithelial cell apoptosis in chronic renal disease. Lab. Investig. 79: 1089-
1099.
Koeman, J.H., Peeters, W.H.M., Koudstaal-Hol, C.H.M., Tijoe, P.S., and de Goeij, J.J.M.
1973. Mercury-selenium correlations in marine mammals. Nature (Lond.), 245:
385-386.
Krylov, V.I. 1971. On the food of the pacific walrus (Odobenus rosmarus divergens 111.).
Investigations on marine mammals. Trudy AtlantNIRO, 39: 110-116.
Lowry, L.F., Frost, K.J., and Bums, J.J. 1980a. Variability in the diet of ringed seals,
Phoca hispida, in Alaska. Can. J. Fish. Aquat. Sci. 37: 2254-2261.
Lowry, L.F., Frost, K.J., and Bums, J.J. 1980b. Feeding of bearded seals in the Bering
and Chukchi Seas and trophic interaction with Pacific walrus. Arctic, 33: 330-
342.
110
Lowry, L.F., Frost, K.J., Calkins, D.G., Swartzman, G.L., and Hills, S. 1982. Feeding
habits, food requirements, and status of Bering Sea marine mammals. North
Pacific Fishery Management Council, Anchorage, AK.
Lowry, L.L., and Frost, K.J. 1984. Foods and feeding of bowhead whales in western and
northern Alaska. Sci. Rep. Whales Res. Inst. (Tokyo), 35: 1-16.
Macdonald, C.R., and Sprague, J.B. 1988. Cadmium in the marine invertebrate and arctic
cod in the Canadian Arctic. Distribution and ecological implications. Mar. Ecol.
Prog. Ser. 47: 17-30.
Mackey, E.A., Becker, P.R., Demiralp, R., Greenberg, R.R., Koster, B.J., and Wise , S.A.
1996. Bioaccumulation o f vanadium and other trace metals in livers o f Alaskan
cetaceans and pinnipeds. Arch. Environ. Contam. Toxicol. 30: 503-512.
Marquart, H., and Schaefer, S.G. 1997. Lehrbuch der Toxikolgie. Spektrum
Akademischer Verlag, Heidelberg.
Martin, J.H., and Flegal, A.R. 1975. High copper concentrations in squid livers in
association with elevated levels o f silver, cadmium, and zinc. Mar. Biol. 30: 51-
55.
Martin, M.B., Reiter, R., Pham, T., Avellanet, Y.R., Camara, J., Lahm, M., Pentecost, E.,
Pratap, K., Gilmore, B.A., Divekar, S., Dagata, R.S., Bull, J.L., and Stoica, A.
2003. Estrogen-like activity of metals in Mcf-7 breast cancer cells.
Endocrinology, 144: 2425-2436.
Ill
112
Matson, G.M. 1981. Workbook for cementum analysis. Matson's Laboratory, Milltown,
MT.
Miles, A.K., Calkins, D.G., and Coon, N.C. 1992. Toxic elements and organochlorines in
harbor seals (Phoca vitulina richardsi), Kodiak, Alaska, USA. Bull. Environ.
Contam. Toxicol. 48: 727-732.
Mori, J., Kubodera, T., and Baba, N. 2001. Squid in the diet of northern fur seals,
Callorhinus ursinus, caught in the western and central North Pacific Ocean. Fish.
Res. 52: 91-97.
Muir, D.C.G., Wagemann, R., Hargrave, B.T., Thomas, D.J., Peakall, D.B., and
Norstrom, R.J. 1992. Arctic ecosystem contamination. Sci. Total Environ. 122:
75-134.
Muraoka, K. 2001. Effects of testosterone replacement on renal function and apoptosis on
mesangial renal tubule cells in rats. Yonago Acta medica, 41: 37-44.
Nordberg, M., and Nordberg, G.F. 2000. Toxicological aspects o f metallothionein. Cell.
Mol. Biol. 46: 451-463.
Norstrom, R.J., Schweinsburg, R.E., and Collins, B.T. 1986. Heavy metals and essential
elements in liver of the polar bear (Ursus maritimus) in the Canadian Arctic. Sci.
Total Environ. 48: 195-212.
Olsson, M., Karlsson, B., and Ahnland, E. 1994. Diseases and environmental
contaminants in seals from the Baltic and Swedish west coast. Sci. Total Environ.
154:217-227.
Papa, R.S., and Becker, P.R. 1998. Alaska harbor seal (Phoca vitulina) contaminants.
NISTIR 6211, U. S. Department of Commerce, Gaithersburg, MD.
Ponce, R.A., Egeland, G.M., Middaugh, J.P., and Becker, P.R. 1997. Twenty years of
trace metal analyses of marine mammals: Evaluation and Summation of data from
Alaska and other Arctic regions. State of Alaska Epidemiology Bulletin, 1: 1-15.
Presley, B.J. 1997. A review of Arctic trace metal data with implications for biological
effects. Mar. Pollut. Bull. 35: 226-234.
Purcell, T.W., and Peters, J.J. 1998. Historical impacts o f environmental regulation of
silver. Environ. Toxicol. Chem. 18: 3-8.
113

Ritterhoff, J., and Zauke, G.-P. 1997. Trace metals in field samples o f zooplankton from
Farm Strait and the Greenland Sea. Sci. Total Environ. 199: 255-270.
Rombach, E.P., Barboza, P.S., and Blake, J.E. 2003. Cost of gestation in an Arctic
ruminant: copper reserves in muskoxen. Comp. Biochem. Physiol. C 134: 157-
168.
Rouleau, C., Gobeil, C., and Tjalve, H. 2000. Accumulation o f silver from the diet in two
marine benthic predators: the snow crab (Chionoecetes opilio) and American
plaice (Hippoglossoidesplatessoides). Environ. Toxicol. Chem. 9: 631-637.
Saeki, K., Nakajima, M., Loughlin, T.R., Calkins, D.C., Baba, N., Kiyota, M., and
Tatsukawa, R. 2001. Accumulation of silver in the liver of three species of
pinnipeds. Environ. Pollut. 112: 19-25.
Santos, F.W., Zeni, G., Rocha, J.B., Weis, S.N., Fachinetto, J.M., Favero, A.M., and
Nogueira, C.W. 2005. Diphenyl diselenide reverses cadmium-induced oxidative
damage on mice tissues. Chem. Biol. Interact. 151: 159-165.
Sheffield, G., Fay, F.H., Feder, H., and Kelly, B.P. 2001. Laboratory digestion of prey
and interpretation o f walrus stomach contents. Mar. Mamm. Sci. 17: 310-330.
114
Siegstad, H., Neve, P.B., Heide-J0 rgensen, M.P., and Harkonen, T. 1998. Diet of ringed
seal (Phoca hispida) in Greenland. In Ringed seals in the North Atlantic.
NAMMCO Scientific Publications, Tromso. pp. 229-241.
Smirnov, V.S. 1968. Analysis o f Arctic fox population dynamics and methods of
increasing the Arctic fox harvest. Problems of the North, 11: 81-101.
Smith, T.G., and Armstrong, F.A.J. 1978. Mercury and selenium in ringed and bearded
seal tissues from Arctic Canada. Arctic, 31: 75-84.
Smith, T.G. 1987. The ringed seal, Phoca hispida, of the Canadian Western Arctic. Can.
Bull. Fish. Aquat. Sci. 216: 1-81.
Solaiman, D., Jonah, M.M., Miyazaki, W., Ho, G., and Bhattacharyya, M.H. 2001.
Increased metallothionein in mouse liver, kidneys, and duodenum during
lactation. Toxicological Sciences, 60: 184-192.
Sonne-Hansen, C., Dietz, R., Leifsson, P.S., Hyldstrup, L., and Riget, F.F. 2002.
Cadmium toxicity to ringed seals (Phoca hispida): an epidemiological study of
possible cadmium-induced nephropathy and osteodystrophy in ringed seals
(Phoca hispida) from Qaanaaq in Northwest Greenland. Sci. Total Environ. 295:
167-181.
115
Stewart, R.E.A., Stewart, B.E., Stirling, I., and Street, E. 1996. Counts o f growth layer
groups in cementum and dentine in ringed seals (Phoca hispida). Mar. Mamm.
Sci. 12: 383-401.
Suzuki, K.T., Tamagawa, H., Takahashi, K., and Shimojo. 1990. Pregnancy-induced
mobilization o f copper and zinc bound to renal metallothionein in cadmium-
loaded rats. Toxicology, 60: 199-210.
Taylor, D.L., Schliebe, S., and Metske, H. 1989. Contaminants in Blubber, Liver and
Kidney Tissue o f Pacific Walruses. Mar. Pollut. Bull. 20: 465-468.
Teigen, S.W., Andersen, R.A., Daae, H.L., and Skaare, J.U. 1999. Heavy metal content in
liver and kidneys of grey seals (Halichoerus grypus) in various life stages
correlated with metallothionein levels: some metal-binding characteristics of this
protein. Environ. Toxicol. Chem. 18: 2364-2369.
Thomas, D.J., Fisher, H.L., Sumler, M.R., Marcus, A.H., Mushak, P., and Hall, L.L.
1986. Sexual differences in the distribution and retention o f organic and inorganic
mercury in methyl mercury-treated rats. Environ. Res. 41: 219-234.
Thomas, S.E., Anderson, S., Gordon, K.L., Oyama, T.T., Shankland, S.J., and Johnson,
R.J. 1998. Tubulointerstitial disease in aging: Evidence for underlying peritubular
116
117
capillary damage, a potential role for renal ischemia. J. Am. Soc. Nephrol. 9: 231-
242.
US Environmental Protection Agency. 1992. Methods for the determination of metals in
environmental samples. CRC Press, Boca Raton, FL.
Wagemann, R., Stewart, R.E.A., Lockhart, W.L., Stewart, B.E., and Povoledo, M. 1988.
Trace metals and methyl mercury: associations and transfer in harp seal {Phoca
groenlandica) mothers and their pups. Mar. Mamm. Sci. 4: 339-355.
Wagemann, R. 1989. Comparison of heavy metals in two groups o f ringed seals {Phoca
hispida) from the Canadian Arctic. Can. J. Fish. Aquat. Sci. 46: 1558-1563.
Wagemann, R., and Stewart, R.E.A. 1994. Concentrations o f heavy metals and selenium
in tissues and some foods of walrus {Odobenus rosmarus rosmarus) from eastern
Canadian Arctic and sub-Arctic, and associations between metals, age, and
gender. Can. J. Fish. Aquat. Sci. 51: 426-436.
Wagemann, R., Innes, S., and Richard, P. 1996. Overview and regional and temporal
differences of heavy metals in Arctic and ringed seals in the Canadian Arctic. Sci.
Total Environ. 186: 41-66.
Wagemann, R., Trebacz, E., Hunt, R., and Boila, G. 1997. Percent methylmercury and
organic mercury in tissues of marine mammals and fish using different
experimental and calculation methods. Environ. Toxicol. Chem. 16: 1859-1866.
Wagemann, R., Trebacz, E., Boila, G., and Lockhart, W.L. 2000. Mercury species in the
liver of ringed seals. Sci. Total Environ. 261: 21-32.
Watanabe, C., Yoshida, K, Kasanuma, Y., Kun, Y., and Satoh, H. 1999. In utero
methylmercury exposure differentially affects the activities o f selenoenzymes in
the fetal mouse brain. Environ. Res. 80: 208-214.
Watanabe, I., Tanabe, S., Amano, M., Miyazaki, N., Petrov, E.A., and Tatsukawa, R.
1998. Age-dependent accumulation of heavy metals in Baikal seal (Phoca
sibirica) from the Lake Baikal. Arch. Environ. Contam. Toxicol. 35: 518-526.
Watanabe, I., Kunito, T., Tanabe, S., Amano, M., Koyama, Y., Miyazaki, N., Petrov,
E.A., and Tatsukawa, R. 2002. Accumulation o f heavy metals in Caspian seals
(Phoca caspica). Arch. Environ. Contam. Toxicol. 43: 109-120.
WHO 2000. Cadmium. World Health Organization Regional Publications, Copenhagen,
Denmark.
118
Wise, S.A., Schantz, M.M., Koster, B.J., Demiralp, R., Mackey, E.A., Greenberg, R.R.,
Burow, M., Ostapczuk, P., and Lillestolen, T.I. 1993. Development of frozen
whale blubber and liver reference materials for the measurement of organic and
inorganic contaminants. Fresenius J. Anal. Chem. 345: 270-277.
Woshner, V.M. 2000. Concentrations and interactions of selected elements in tissues of
four marine mammal species harvested by Inuit hunters in Arctic Alaska, with an
intensive histologic assessment, emphasizing the beluga whale. Ph.D. thesis,
College o f Veterinary Medicine, University o f Illinois, Urbana-Champaign, IL.
Woshner, V.M., O'Hara, T.M., Bratton, G.R., and Beasley, V.R. 2001a. Concentrations
and interactions o f selected essential and non-essential elements in ringed seals
and polar bears of Arctic Alaska. J. Wildl. Dis. 37: 711-721.
Woshner, V.M., O'Hara, T.M., Bratton, G.R., Suydam, R.S., and Beasley, V.R. 2001b.
Concentrations and interactions of selected essential and non-essential elements in
bowhead and beluga whales o f Arctic Alaska. J. Wildl. Dis. 37: 693-710.
Yamamoto, R., Suzuki, T., Satoh, H., and Kawai, K. 1986. Generation and dose as
modifying factors of inorganic mercury accumulation in brain, liver, and kidneys
o f rats fed methylmercury. Environ. Res. 41: 309-318.
119
Yang, J., Kunito, T., Anan, Y., Tanabe, S., and Miyazaki, N. 2004. Total and subcellular
distribution of trace elements in the liver of a mother-fetus pair of Dali’s
porpoises (Phocoenoides dalli). Mar. Pollut. Bull. 48:1122-1129.
Yeats, P., Stenson, G., and Hellou, J. 1999. Essential elements and priority contaminants
in liver, kidney, muscle and blubber of harp seal beaters. Sci. Total Environ.
243/244: 157-167.
Zenteno-Savin, T., Clayton-Hemandez, E., and Eisner, R. 2002. Diving seal: are they a
model for coping with oxidative stress? Comp. Biochem. Physiol. C 133: 527-
536.
Zhang, Y., Amakawa, H., and Nozaki, Y. 2001. Oceanic profiles of dissolved silver:
precise measurements in the basins of western North Pacific, Sea of Okhotsk, and
the Japan Sea. Mar. Chem. 75: 151-163.
120
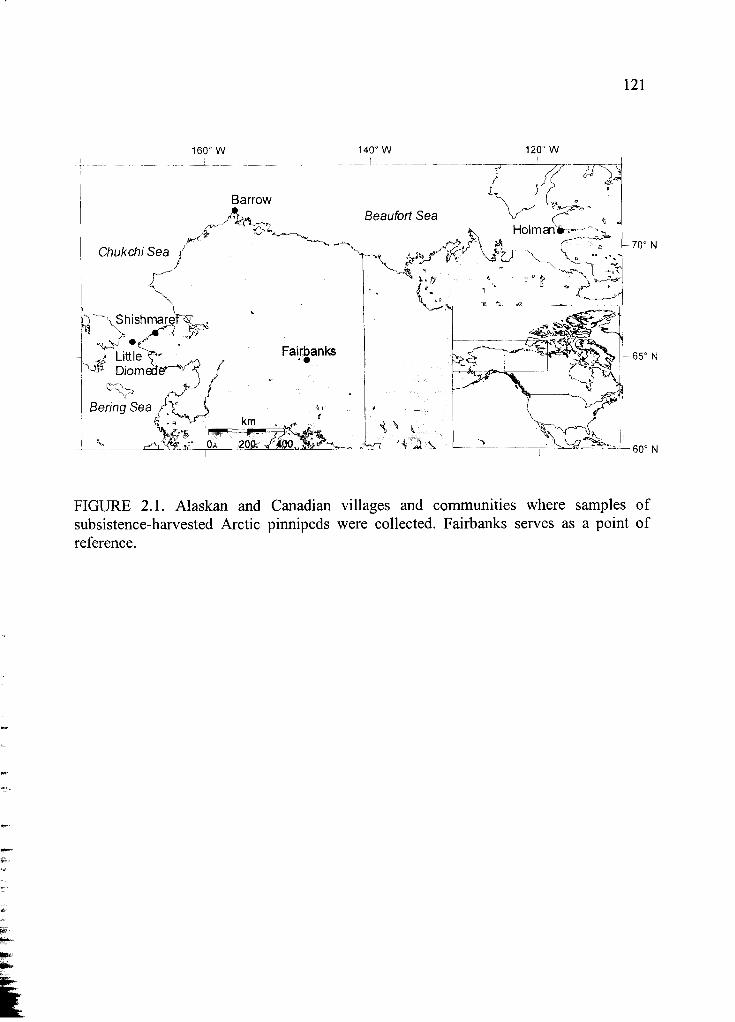
121
160° W 140° W 120° W
FIGURE 2.1. Alaskan and Canadian villages and communities where samples of subsistence-harvested Arctic pinnipeds were collected. Fairbanks serves as a point of reference.
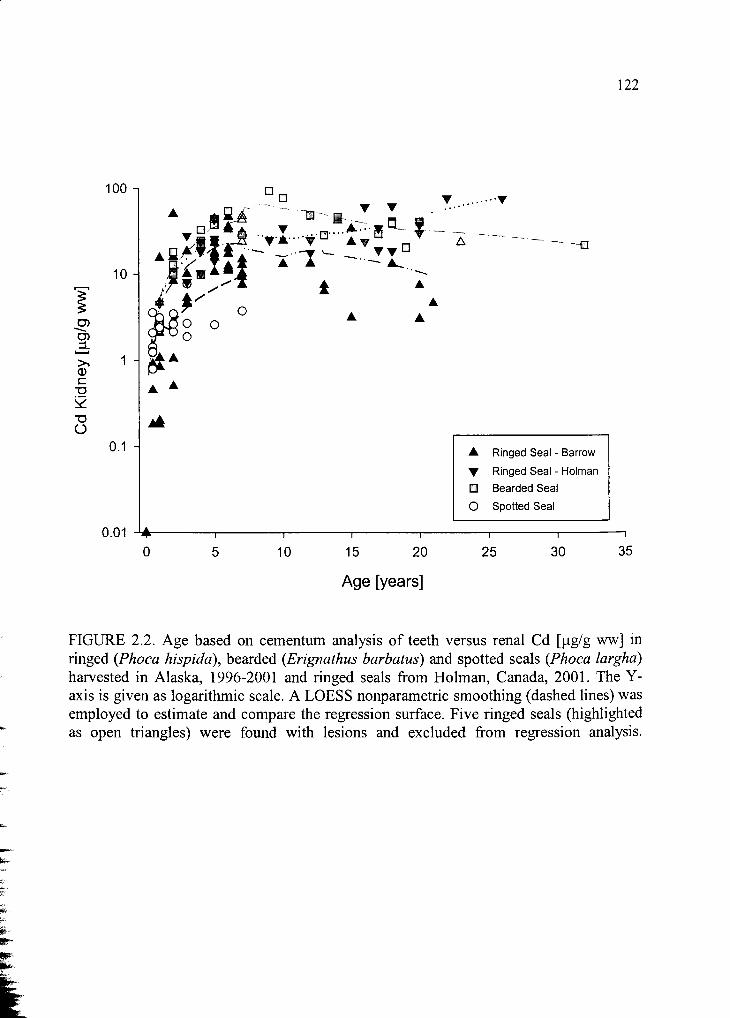
122
Age [years]
FIGURE 2.2. Age based on cementum analysis o f teeth versus renal Cd [fig/g ww] in ringed (Phoca hispida), bearded (Erignathus barbatus) and spotted seals (Phoca largha) harvested in Alaska, 1996-2001 and ringed seals from Holman, Canada, 2001. The Y- axis is given as logarithmic scale. A LOESS nonparametric smoothing (dashed lines) was employed to estimate and compare the regression surface. Five ringed seals (highlighted as open triangles) were found with lesions and excluded from regression analysis.
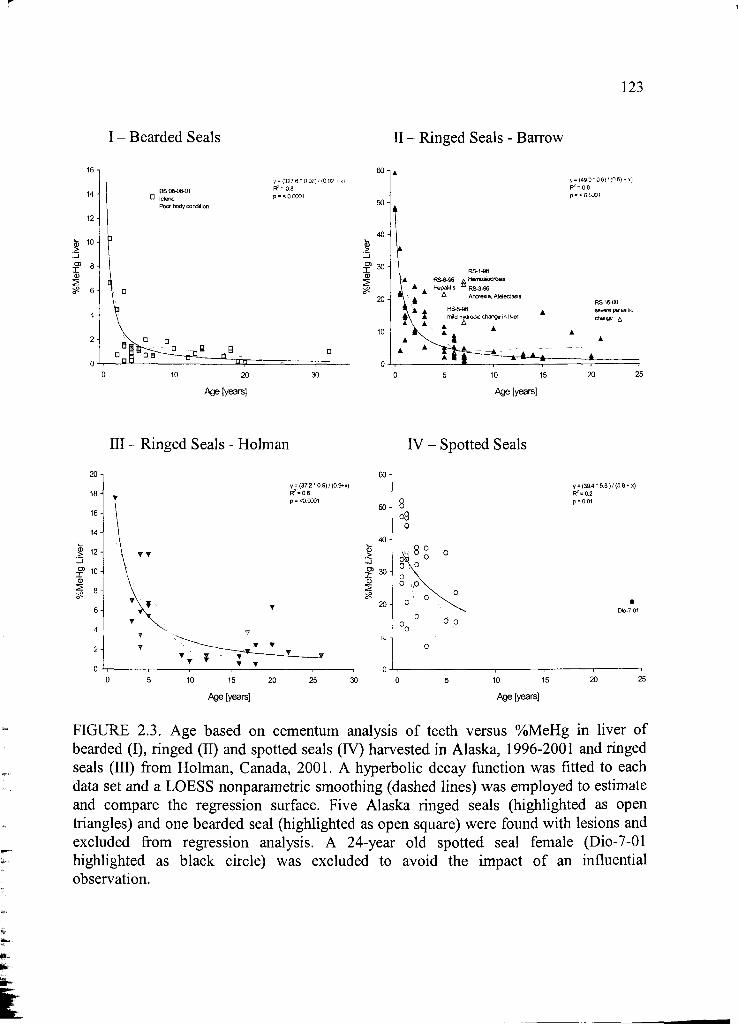
123
I - Bearded Seals II - Ringed Seals - Barrow
Age [years] Age [years]
III - Ringed Seals - Holman IV - Spotted Seals
Age [years] Age [years]
FIGURE 2.3. Age based on cementum analysis of teeth versus %MeHg in liver of bearded (I), ringed (II) and spotted seals (IV) harvested in Alaska, 1996-2001 and ringed seals (III) from Holman, Canada, 2001. A hyperbolic decay function was fitted to each data set and a LOESS nonparametric smoothing (dashed lines) was employed to estimate and compare the regression surface. Five Alaska ringed seals (highlighted as open triangles) and one bearded seal (highlighted as open square) were found with lesions and excluded from regression analysis. A 24-year old spotted seal female (Dio-7-01 highlighted as black circle) was excluded to avoid the impact o f an influential observation.

124
I - Bearded Seals25 i
Xon
g 0 □
•a g-n[Q□ n p a s-qO
0 10 20
Pge [years]
y = 4.9 + (1 .1 /x) R2 = 0.005p = O.60
30
II - Ringed Seals - Barrow
Age [years]
III - Ringed Seals - Holman IV - Spotted Seals
cuCU_ro0 51_iOJX
<u(f)
10 15 20
Age [years]
•2 15 or
10-
x
CO 5
2 4
Age [years]
y = 7.4 + (4.4 / x) R?«0.7
FIGURE 2.4. Age based on cementum analysis of teeth versus the hepatic Se/THg molar ratio of bearded (I), ringed (II) and spotted seals (IV) harvested in Alaska, 1996-2001 and ringed seals (III) from Holman, Canada, 2001. A hyperbolic decay function was fitted to the data of Alaska harvested ringed seals and an inverse polynomial was fitted to the other data sets. A LOESS nonparametric smoothing (dashed lines) was employed to estimate the regression surface. Five ringed seals (highlighted as open triangles) were found with lesions and excluded from regression analysis.
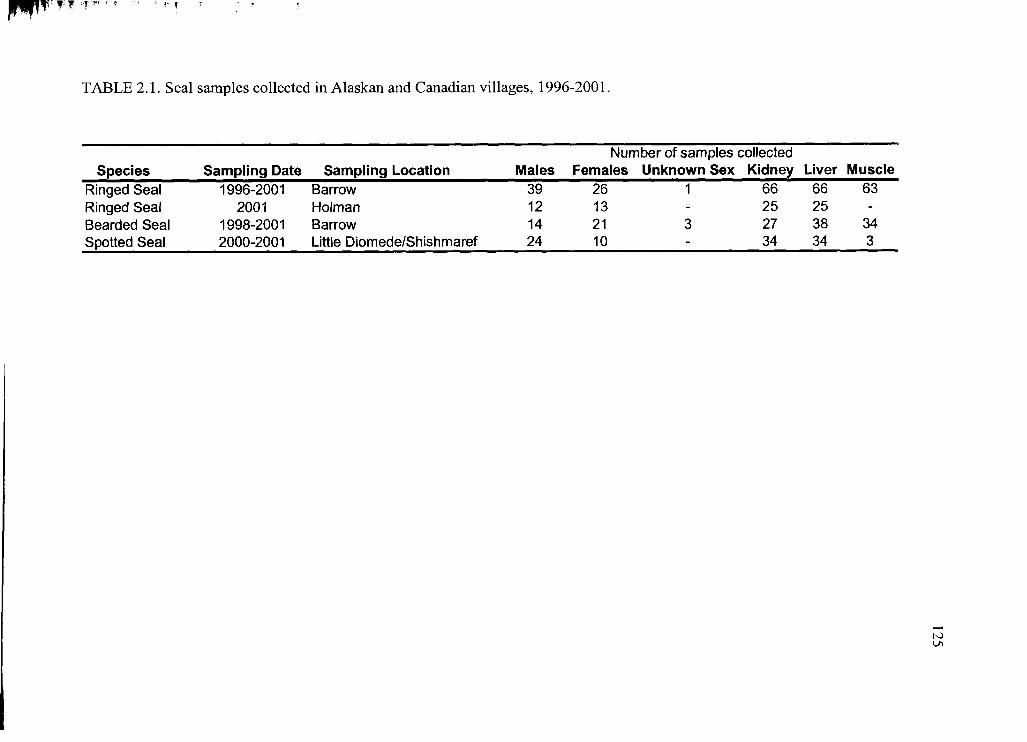
TABLE 2.1. Seal samples collected in Alaskan and Canadian villages, 1996-2001.
Species Sampling Date Sampling Location MalesNumber of samples collected
Females Unknown Sex Kidney Liver MuscleRinged Seal 1996-2001 Barrow 39 26 1 66 66 63Ringed Seal 2001 Holman 12 13 - 25 25 -Bearded Seal 1998-2001 Barrow 14 21 3 27 38 34Spotted Seal 2000-2001 Little Diomede/Shishmaref 24 10 - 34 34 3
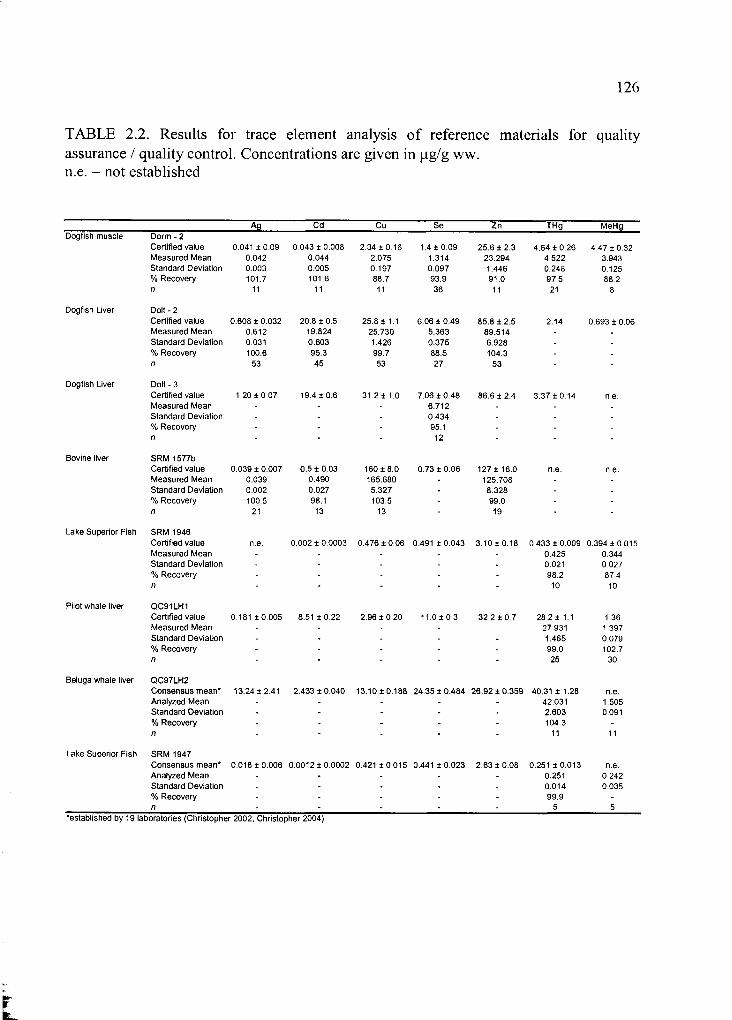
126
TABLE 2.2. Results for trace element analysis o f reference materials for quality assurance / quality control. Concentrations are given in p.g/g ww. n.e. = not established
Ag Cd Cu Se Zn THg MeHgDogfish muscle Dorm - 2
Certified value 0.041 ±0 .09 0.043 ± 0.008 2.34 ± 0.16 1.4 ± 0 .0 9 25.6 ± 2 .3 4.64 ± 0.26 4.47 ±0 .32Measured Mean 0.042 0.044 2.075 1.314 23.294 4.522 3.943Standard Deviation 0.003 0.005 0.197 0.097 1.446 0.248 0.125% Recovery 101.7 101.6 88.7 93.9 91.0 97.5 88.2n 11 11 11 36 11 21 8
Dogfish Liver Dolt - 2Certified value 0.608 ± 0.032 20.8 ± 0 .5 25.8 ± 1.1 6.06 ± 0.49 85.8 ± 2 .5 2.14 0.693 ± 0.06Measured Mean 0.612 19.824 25.730 5.363 89.514 - .Standard Deviation 0.031 0.803 1.426 0.375 6.928 - .% Recovery 100.6 95.3 99.7 88.5 104.3 - -n 53 45 53 27 53 - -
Dogfish Liver Dolt - 3 Certified value 1.20 ±0 .0 7 19.4 ± 0.6 31.2 ± 1.0 7.06 ± 0 .4 8 86.6 ± 2.4 3.37 ±0 .14 n.e.Measured Mean - - - 6.712 . - .Standard Deviation - - 0.434 . .% Recovery - - - 95.1 - -n - - - 12 - - -
Bovine liver SRM 1577b Certified value 0.039 ± 0.007 0.5 ± 0 .0 3 160 ± 8 .0 0.73 ± 0.06 127 ± 16.0 n.e. n.e.M easured Mean 0.039 0.490 165.680 - 125.708 . .Standard Deviation 0.002 0.027 5.327 - 8.328 . .% Recovery 100.5 98.1 103.5 - 99.0 - -n 21 13 13 - 19 - -
Lake Superior Fish SRM 1946 Certified value n.e. 0.002 ± 0.0003 0.476 ±0 .06 0.491 ± 0 .043 3.10 ± 0.18 0.433 ±0 .009 0.394 ± 0.015Measured Mean - • - - . 0.425 0.344Standard Deviation - - - - 0.021 0.027% Recovery - - 98.2 87.4n - * - - - 10 10
Pilot whale liver QC91LH1 Certified value 0.181 ±0 .005 8.51 ±0 .22 2.96 ± 0.20 11.0 ± 0.3 32.2 ± 0 .7 28.2 ± 1.1 1.36Measured Mean Standard Deviation
27 931 1.465
1 397 0.079
% Recovery - - - - - 99.0 102.7n - - - - - 25 30
Beluga whale liver QC97LH2 Consensus mean* 13.24 ±2.41 2.433 ± 0.040 13.10 ± 0.188 24.35 ± 0.484 26.92 ± 0.359 40.31 ± 1.28 n.e.Analyzed Mean - - - - - 42.031 1.505Standard Deviation - - - - - 2.603 0.091% Recovery - - - - - 104.3 -n - - - - - 11 11
Lake Superior Fish SRM 1947 Consensus mean* 0.018 ± 0.006 0.0012 ±0 .0002 0.421 ±0 .015 0.441 ± 0 .023 2 .6 3 1 0 .0 8 0.251 ±0 .013 n.e.Analyzed Mean . - - - - 0.251 0.242Standard Deviation - - - - - 0.014 0.035% Recovery - - - . - 99.9 -n - - * - - 5 5
‘ established by 19 laboratories (Christopher 2002, Christopher 2004)
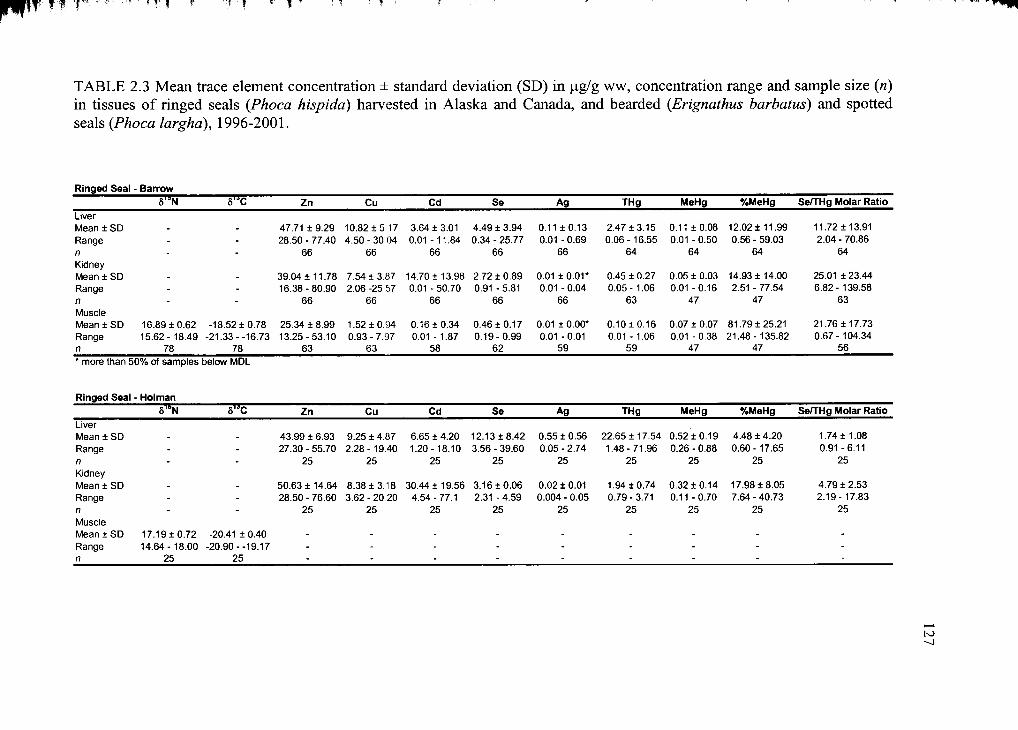
I f - f ■*' * ' * r -f t " i
TABLE 2.3 Mean trace element concentration ± standard deviation (SD) in |j.g/g ww, concentration range and sample size (n) in tissues o f ringed seals (Phoca hispida) harvested in Alaska and Canada, and bearded (Erignathus barbatus) and spotted seals (Phoca largha), 1996-2001.
Ringed Seal - B arrow8 ISN S'^C Zn Cu Cd Se Ag THg MeHg %MeHg Se/THg Molar Ratio
LiverMean ± SD 47.71 ± 9.29 10.82 ± 5 17 3.64 ± 3.01 4.49 ± 3.94 0.11 ±0 .13 2.47 ±3 .15 0.11 ±0 .08 12.02 ± 11.99 11.72 ±13.91Range - - 28.50 - 77.40 4.50 - 30 04 0.01 - 11.84 0.34 - 25.77 0.01 - 0.69 0 .06 -1 6 .55 0.01 -0 .50 0.56 - 59.03 2.04 - 70.86n - - 66 66 66 66 66 64 64 64 64Kidney Mean ± SD 39.04 ± 11.78 7.54 ± 3.87 14.70 ±13.98 2.72 ± 0.89 0.01 ±0 .01* 0.45 ± 0.27 0.05 ± 0.03 14.93 ± 14.00 25.01 ± 23.44Range - - 16 .38-80.90 2.06 -25 57 0.01 - 50.70 0.91 -5.81 0.01 - 0.04 0 .0 5 -1 .0 6 0.01 -0 .16 2.51 - 77.54 6 .8 2 - 139.58n - - 66 66 66 66 66 63 47 47 63Muscle Mean ± SD 16.89 ±0 .62 -18.52 ±0 .78 25.34 ± 8.99 1.52 ±0 .94 0.16 ±0 .34 0.46 ±0 .17 0.01 ± 0.00* 0.10 ± 0.16 0.07 ± 0.07 81.79 ±25.21 21.76 ±17.73Range 15 .62-18 .49 -21 .33 --16 .73 13.25-53 .10 0.93 - 7.97 0.01 -1 .87 0 .1 9 -0 .9 9 0.01 -0.01 0.01 - 1.06 0.01 - 0.38 21.48- 135.82 0 .6 7 - 104.34n 78 78 63 63 58 62 59 59 47 47 56* more than 50% of samples below MDL
Ringed Seal - Holman8 loN S '*C Zn Cu Cd Se Ag THg MeHg %MeHg Se/THg M olar Ratio
LiverMean ± SD - 43.99 ± 6.93 9.25 ± 4.87 6.65 ± 4.20 12.13 ±8 .42 0.55 ± 0.56 22.65 ± 17.54 0.52 ±0 .19 4.48 ± 4.20 1.74 ± 1.08Range - 27.30 - 55.70 2 .2 8 -1 9 40 1.20-18.10 3.56 - 39.60 0.05 - 2.74 1.48 - 71.96 0.26 - 0.88 0 .60 -17 .65 0.91 -6.11n - 25 25 25 25 25 25 25 25 25KidneyMean ± SD - 50.63 ± 14.64 8.38 ± 3.18 30.44 ± 19.56 3.16 ±0 .06 0.02 ± 0.01 1.94 ±0 .74 0.32 ±0 .14 17.98 ±8 .05 4.79 ± 2.53Range - 28.50 - 76.60 3.62 - 20 20 4.54-77 .1 2.31 - 4.59 0.004 - 0.05 0 .79-3 .71 0.11 -0 .70 7.64 - 40.73 2 .19 -1 7 .83n - 25 25 25 25 25 25 25 25 25MuscleMean ± SD 17.19 ±0 .7 2 -20.41 ±0 .40 - - - - - - - - -Range 14 .64 -18 .0 0 -20 .90 --19 .17 - - - - - - - - -n 25 25 - - - - - - - - -
K>-J
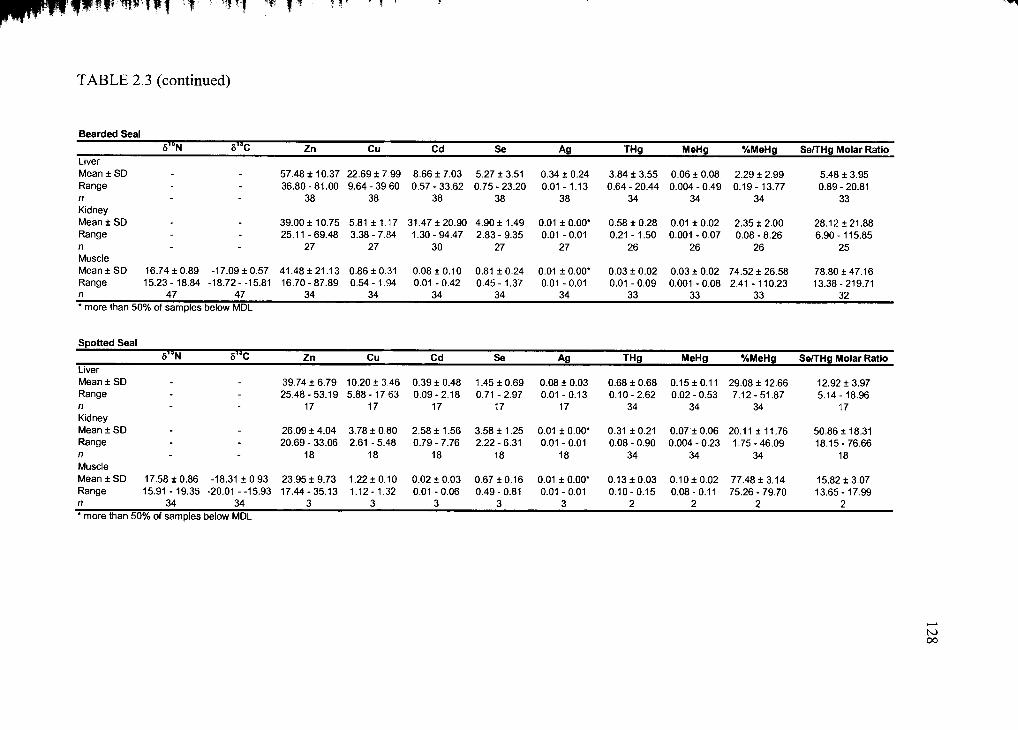
TABLE 2.3 (continued)
Bearded Seal6 ,;,N s '^ c Zn Cu Cd Se Ag THg MeHg %MeHg Se/THg M olar Ratio
LiverMean ± SD _ . 57.48 ± 10.37 22.69 ± 7 99 8.66 ± 7.03 5.27 ± 3.51 0.34 ± 0.24 3.84 ± 3.55 0.06 ± 0.08 2.29 ± 2.99 5.48 ± 3.95Range - - 36 .80-81.00 9.64 - 39 60 0.57 - 33.62 0.75 - 23.20 0.01 - 1.13 0.64 - 20.44 0.004 - 0.49 0 .19 -1 3 .77 0.89 - 20.81n - - 38 38 38 38 38 34 34 34 33Kidney Mean ± SD 39.00 ± 10.75 5.81 ± 1 1 7 31.47 ±20.90 4.90 ± 1.49 0.01 ± 0.00* 0.58 ± 0.28 0.01 ± 0.02 2.35 ± 2.00 28.12 ±21.88Range - - 25.11 -69.48 3.38 - 7.84 1 .30-94 .47 2.83 - 9.35 0.01 - 0.01 0.21 - 1.50 0.001 - 0.07 0.08 - 8.26 6 .90-115.85n - - 27 27 30 27 27 26 26 26 25Muscle Mean ± SD 16.74 ±0 .89 -17.09 ±0 .57 41.48 ±21.13 0.86 ± 0 31 0.08 ±0 .10 0.81 ± 0.24 0.01 ± 0.00* 0.03 ± 0.02 0.03 ± 0.02 74.52 ± 26.58 78.80 ±47.16Range 15.23-18 .84 -18.72--15.81 16 .70-87 .89 0 .5 4 -1 .94 0.01 - 0.42 0 .4 5 -1 .3 7 0.01 -0.01 0.01 - 0.09 0.001 - 0.08 2.41 -110.23 13.38-219.71n 47 47 34 34 34 34 34 33 33 33 32* more than 50% of samples below MDL
S potted Seal5 ,S,N 8 ,JC Zn Cu Cd Se Ag THg MeHg %MeHg Se/THg M olar Ratio
LiverMean ± SD - 39.74 ± 6.79 10.20 ±3 ,46 0.39 ± 0.48 1.45 ±0 .69 0.08 ± 0.03 0.68 ± 0.68 0.15 ±0.11 29.08 ± 12.66 12.92 ±3 .97Range - 25 .48 -53 .19 5 .8 8 -1 7 63 0 .0 9 -2 .1 8 0.71 - 2.97 0.01 -0 .13 0 .1 0 -2 .6 2 0.02 - 0.53 7 .12 -51 .87 5.14- 18.96n - 17 17 17 17 17 34 34 34 17KidneyMean ± SD - 26.09 ± 4.04 3.78 ± 0 80 2.58 ± 1.56 3.58 ± 1.25 0.01 ± 0.00* 0.31 ± 0.21 0.07 ± 0.06 20.11 ±11.76 50.86 ± 18.31Range - 20.69 - 33.06 2.61 - 5.48 0.79 - 7.76 2.22 - 6.31 0.01 - 0.01 0.08 - 0.90 0.004 - 0.23 1 .75-46 .09 18.15-76.66n - 18 18 18 18 18 34 34 34 18MuscleMean ± SD 17.58 ±0 .86 -18.31 ±0 .93 23.95 ± 9.73 1.22 ±0 .10 0.02 ± 0.03 0.67 ±0 .16 0.01 ± 0.00* 0.13 ±0 .03 0.10 ±0 .02 77.48 ±3 .14 15.82 ±3 .07Range 15.91 - 19.35 -20.01 --15.93 17.44-35 .13 1 .12 -1 .32 0.01 - 0.06 0.49 - 0.81 0.01 - 0.01 0 .1 0 -0 .1 5 0.08-0 .11 75.26 - 79.70 13.65-17.99n 34 34 3 3 3 3 3 2 2 2 2* more than 50% of samples below MDL
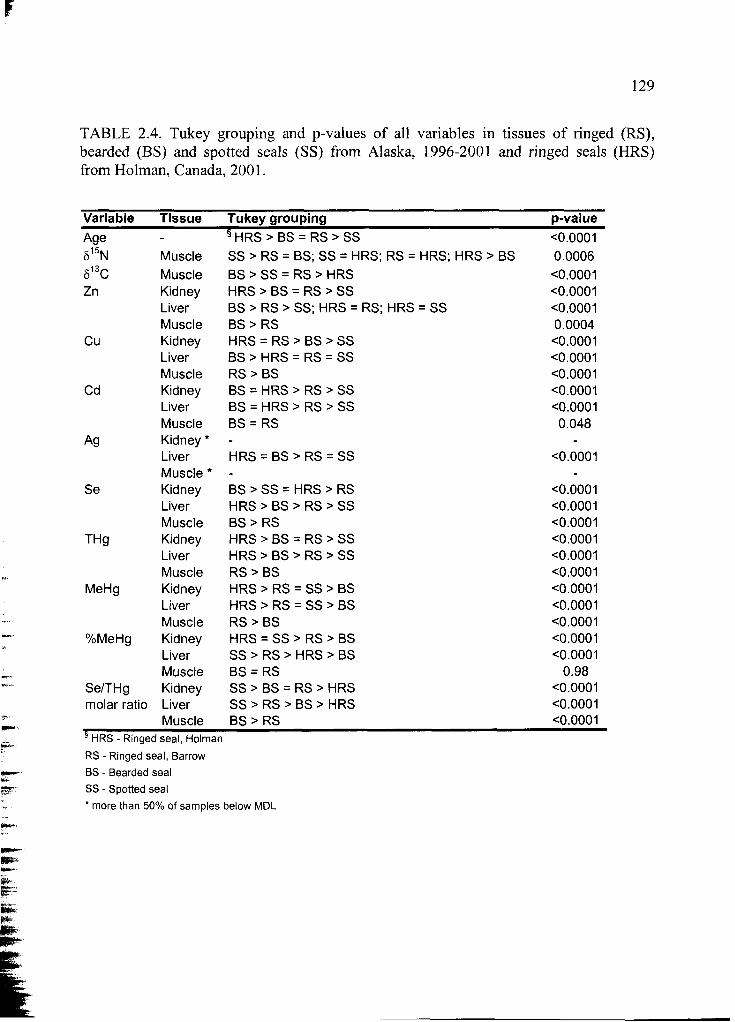
129
TABLE 2.4. Tukey grouping and p-values of all variables in tissues of ringed (RS), bearded (BS) and spotted seals (SS) from Alaska, 1996-2001 and ringed seals (HRS) from Holman, Canada, 2001.
Variable Tissue Tukey grouping p-valueAge - s HRS > BS = RS > SS <0.0001515N Muscle SS > RS = BS; SS = HRS; RS = HRS; HRS > BS 0.0006813C Muscle BS > SS = RS > HRS <0.0001Zn Kidney HRS > BS = RS > SS <0.0001
Liver BS > RS > SS; HRS = RS; HRS = SS <0.0001Muscle BS > RS 0.0004
Cu Kidney HRS = RS > BS > SS <0.0001Liver BS > HRS = RS = SS <0.0001Muscle RS > BS <0.0001
Cd Kidney BS = HRS > RS > SS <0.0001Liver BS = HRS > RS > SS <0.0001Muscle BS = RS 0.048
Ag Kidney * - -
Liver HRS = BS > RS = SS <0.0001Muscle * - -
Se Kidney BS > SS = HRS > RS <0.0001Liver HRS > BS > RS > SS <0.0001Muscle BS> RS <0.0001
THg Kidney HRS > BS = RS > SS <0.0001Liver HRS > BS > RS > SS <0.0001Muscle RS > BS <0.0001
MeHg Kidney HRS > RS = SS > BS <0.0001Liver HRS > RS = SS > BS <0.0001Muscle RS > BS <0.0001
%MeHg Kidney HRS = SS > RS > BS <0.0001Liver SS > RS > HRS > BS <0.0001Muscle BS = RS 0.98
Se/THg Kidney SS > BS = RS > HRS <0.0001molar ratio Liver SS > RS > BS > HRS <0.0001
Muscle BS > RS <0.0001s HRS - R inged sea l, H olm an
RS - R inged sea l, Barrow
BS - Bearded seal
SS - S potted seal
* m ore than 50% o f sam p les be low MDL
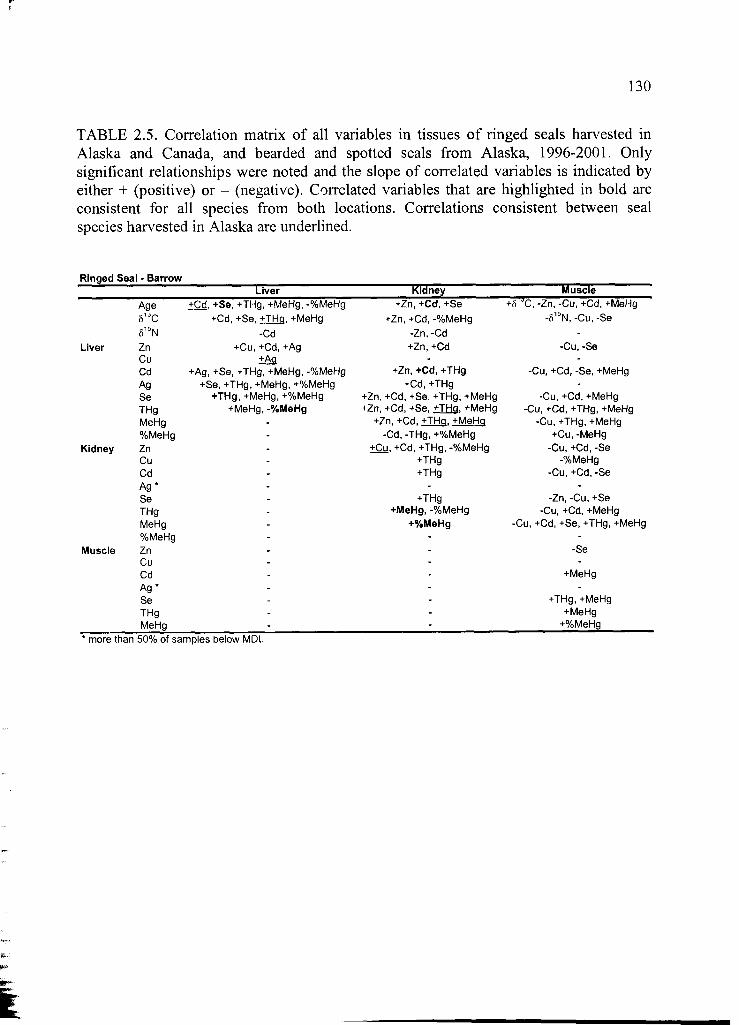
130
TABLE 2.5. Correlation matrix of all variables in tissues o f ringed seals harvested in Alaska and Canada, and bearded and spotted seals from Alaska, 1996-2001. Only significant relationships were noted and the slope of correlated variables is indicated by either + (positive) or - (negative). Correlated variables that are highlighted in bold are consistent for all species from both locations. Correlations consistent between seal species harvested in Alaska are underlined.
Ringed Seal - BarrowLiver Kidney Muscle
Age +Cd. +Se, +THg, +MeHg, -% MeHg +Zn, +Cd, +Se +5 '°C ,-Z n , -Cu, +Cd, +MeHg
81JC +Cd. +Se. +THa. +MeHa +Zn, +Cd, -% MeHg -813N, -Cu, -Se
8i:,N -Cd -Zn, -Cd -
Liver Zn +Cu, +Cd, +Ag +Zn, +Cd -Cu, -SeCu +Ag - -Cd +Ag, +Se, +THg, +MeHg, -%MeHg +Zn, +Cd, +THg -Cu, +Cd, -Se, +MeHg
Ag +Se, +THg, +MeHg, +%MeHg +Cd, +THg -Se +THg, +MeHg, +%MeHg +Zn, +Cd, +Se, +THg, +MeHg -Cu, +Cd, +MeHgTHg +MeHg, -% MeHg +Zn. +Cd. +Se. +THa. +MeHa -Cu, +Cd, +THg, +MeHgMeHg - +Zn. +Cd. +THa. +MeHa -Cu, +THg, +MeHg% MeHg - -Cd, -THg, +% MeHg +Cu, -MeHg
Kidney Zn - +Cu, +Cd, +THg, -% M eHg -Cu, +Cd, -SeCu - +THg -%MeHgCd - +THg -Cu, +Cd, -SeA g * - - *Se - +THg -Zn, -Cu, +SeTHg - +MeHg, -% MeHg -Cu, +Cd, +MeHgMeHg - +% MeHg -Cu, +Cd, +Se, +THg, +MeHg%MeHg - - -
Muscle Zn - - -SeCu - - -Cd - - +MeHgA g * - - -Se - - +THg, +MeHgTHg - - +MeHgMeHg - - +%MeHg
* more than 50% of samples below MDL
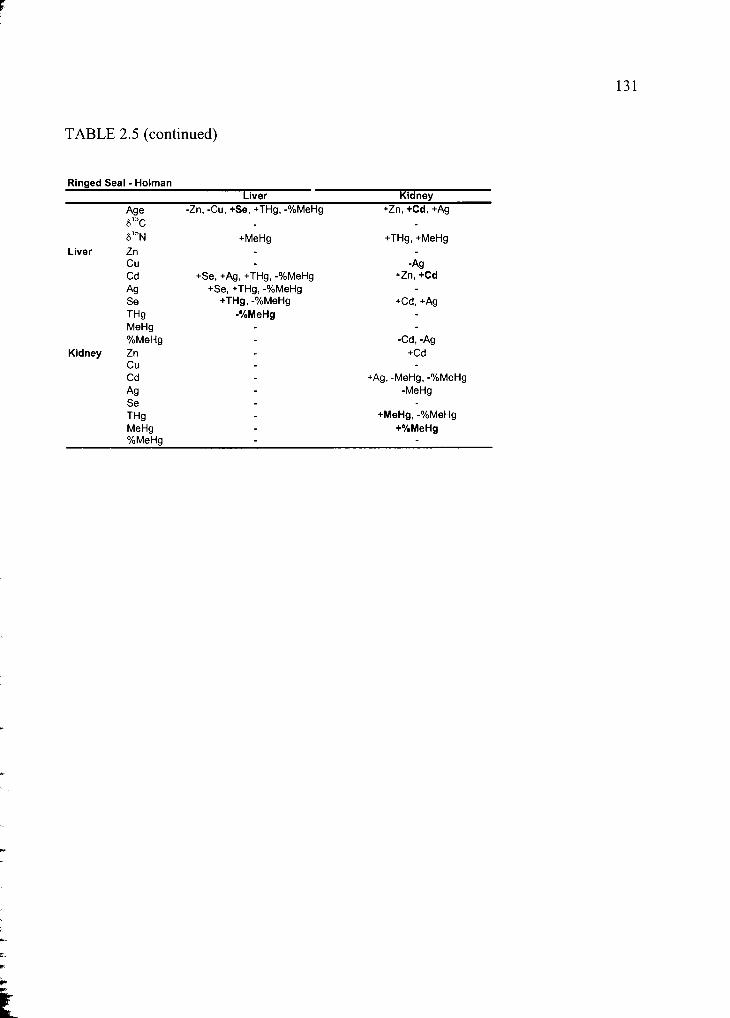
TABLE 2.5 (continued)
Ringed Seal - HolmanLiver Kidney
Age -Zn, -Cu, +Se, +THg, -%MeHg +Zn, +Cd, +Ag81JC - -
81:>N +MeHg +THg, +MeHgLiver Zn - -
Cu - -AgCd +Se, +Ag, +THg, -%MeHg +Zn, +CdAg +Se, +THg, -%MeHg -Se +THg, -%MeHg +Cd, +AgTHg -%MeHg -MeHg - -% MeHg -Cd, -Ag
Kidney Zn +CdCu -Cd +Ag, -MeHg, -% MeHgAg -MeHgSe - -
THg - +MeHg, -% MeHgMeHg - +% MeHg%MeHg - -
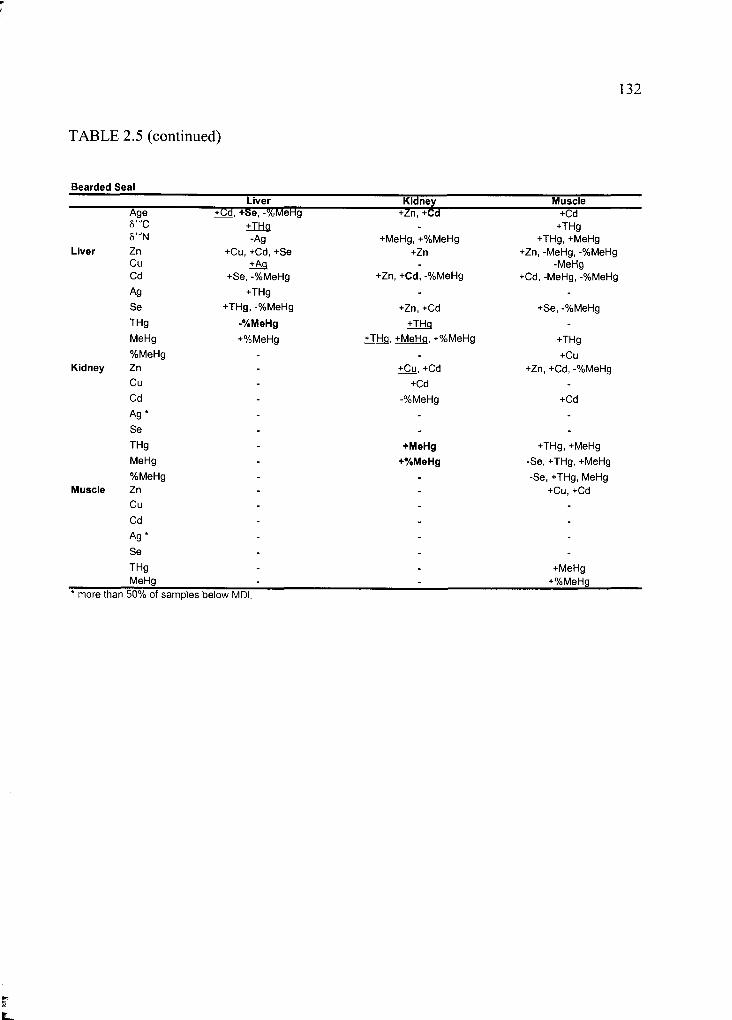
132
TABLE 2.5 (continued)
Bearded SealLiver Kidney Muscle
Age ±Cd, +Se, -% MeHg +Zn, +Cd +CdS 'JC +THq - +THgS'-'N -Ag +MeHg, +%MeHg +THg, +MeHg
Liver Zn +Cu, +Cd, +Se +Zn +Zn, -MeHg, -%MeHgCu +Aq - -MeHgCd +Se, -%MeHg +Zn, +Cd, -%MeHg +Cd, -MeHg, -%MeHg
Ag +THg - -
Se +THg, -%MeHg +Zn, +Cd +Se, -%MeHgTHg -%MeHg +THq -MeHg +%MeHg +THa. +MeHa. +%MeHa +THg% MeHg - - +Cu
Kidney Zn - +Cu, +Cd +Zn, +Cd, -%MeHgCu - +Cd -Cd - -%MeHg +Cd
A g * - - -Se - - -
THg - +MeHg +THg, +MeHgMeHg - +%MeHg -Se, +THg, +MeHg
% MeHg - - -Se, +THg, MeHgMuscle Zn - - +Cu, +Cd
Cu - - -
Cd - - -
A g * - - -
Se - - -
THg - - +MeHgMeHg - - +%MeHg
* more than 50% of sam ples below MDL
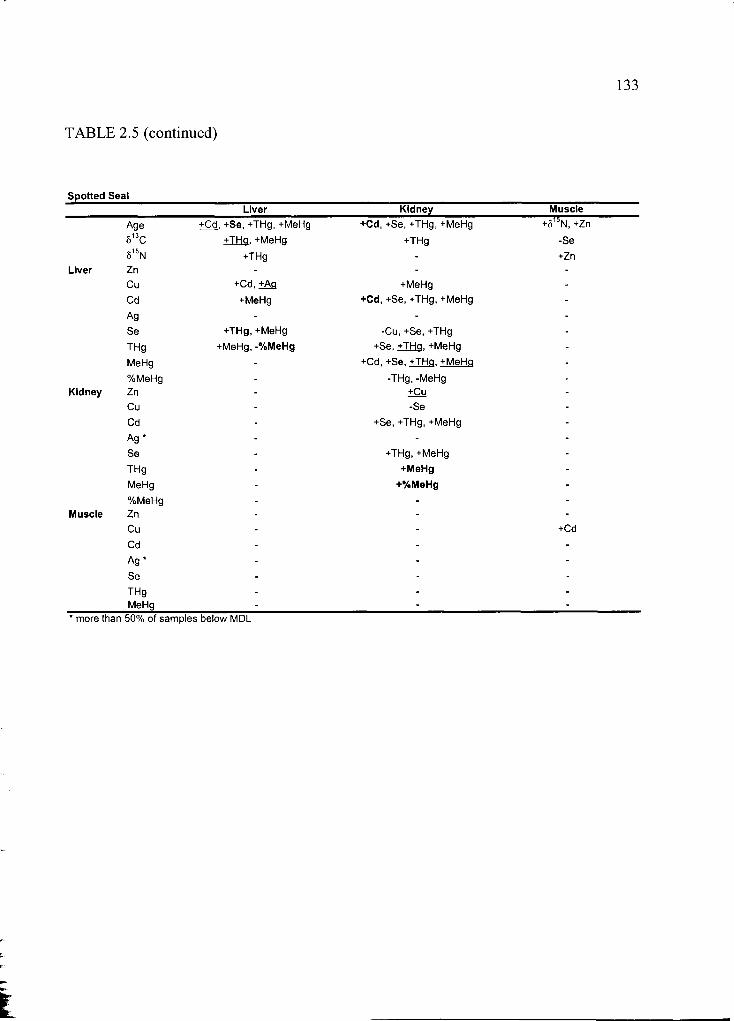
133
TABLE 2.5 (continued)
Spotted SealLiver Kidney Muscle
Age +Cd. +Se, +THg, +MeHg +Cd, +Se, +THg, +MeHg +5lbN, +Zn
§13C +THq, +MeHg +THg -Se
815N +THg - +ZnLiver Zn - - -
Cu +Cd, +Aa +MeHg -
Cd +MeHg +Cd, +Se, +THg, +MeHg -
Ag - - -
Se +THg, +MeHg -Cu, +Se, +THg -
THg +MeHg, -% MeHg +Se. +THa. +MeHa -
MeHg - +Cd. +Se. +THa. +MeHa -
%MeHg - -THg, -MeHg -Kidney Zn - +Cu -
Cu - -Se -
Cd - +Se, +THg, +MeHg -
A g * - - -
Se - +THg, +MeHg -
THg ■ +MeHg -
MeHg - +% MeHg -
% MeHg - - -Muscle Zn - - -
Cu - - +Cd
Cd - - -
A g * - - -
Se - - -
THg - - -MeHg - - -
* more than 50% of samples below MDL

134
TABLE 2.6 Mean trace element concentration ± standard deviation (SD) in |j,g/g ww, concentration range and sample size (n) in total body homogenates o f selected prey species, n. d. = not determined
Species Cd Cu Zn Ag Se THg Se/THg Molar RatioTeleost FishMean ± SD Arctic cod 0.19 ±0.07 5.49 ± 1.03 80.82 ± 10.35 0.06 ±0.03 2.99 ± 0.23 n.d. n.d.Range (Boreogadus saida) 0 .10-0.26 4.11 -6.71 63.00 • 92.00 0.04-0.11 2.74-3.31 .
n 6 6 6 6 6 . .
Mean ± SD Walleye Pollock 0.10 ±0.05 1.24 ±0.49 25.21 ±6.09 0.25 ±0.13 0.40 ±0.11 0.02 ±0.03 121.16 ± 86.15Range {Theragra chaicogramma) 0.03-0 .15 0.75-1 .98 17.92-32.76 0.16-0 .47 0 .24-0 .54 0.004-0.07 15.56-245.81n 5 5 5 5 5 5 5Mean ± SD Pacific Herring 0.17 ±0.07 0.94 ± 0.39 22.50 ± 3.20 0.18 ± 0.12 0.50 ± 0.25 0.02 ± 0.02 108.73 ±60.92Range (Clupea pallasii) 0.11 -0.24 0.49- 1.21 19.23-25.62 0.07-0.31 0.22 * 0.66 0.004 - 0.04 38.87- 150.81n 3 3 3 3 3 3 3Mean ± SD King Salmon 0.13 1.22 52.37 0.17 0.31 0.02 41.47RangenMean ± SDRangenMollusksMean ± SDRangenMean ± SDRangenMean ± SDRangenCrustaceansMean ± SDRangenMean ± SDRangenMean ± SDRangenMean ± SDRangenMean ± SDRangenEchinodermataMean ± SDRangenUrochordataMean ± SD Range
{Oncorhynchus tshawytscha)
Chum Salmon (Oncorhynchus ke ta )
Squid
Octopus (Octopus spp.)
Greenland cockle (Serripes groenlandicus)
Zooplankton(unsorted)
AmphipodsGammaridae
Isopods (Saduria spp.)
Sculptured Shrimp (Sderocrangon boreas)
Hermit crab Paguridae
Sea Cucumber
Tunicate
10.14
1
11.72
1
0.25 ±0.24 0 .09-0.52
3 0.14
11.76
8.53 ±3.06 6.11 - 11.97
3 2.23
111.40
1
0.22 ± 0.10 0.04 - 0.44
21 0.87
1
0.89 ±0.48 0.13- 1.60
10 9.15
11.23
1
1.65 ±0.89 1 .03-2.28
2
0.28
1
1
0.76 ±0.64 0.11 -2.93
21 39.50
173.58 ± 24.58 41.10- 107.00
10 36.20
119 80
3.21 ±3.38 0 .82-5.60
2
7.50
1
125.66
1
22.55 ±5.27 17.49-28.00
364.17
145.40
1
28.67 ± 8.22 13.36-47.51
21 89.50
165.72 ±10.29 51.20-87.90
10 50.60
152 30
1
52.34 ±13.23 42.99-61.70
2
53.8
1
10.15
1
0.16 ±0.07 0 ,12-0.25
3 0.05
10.16
1
0.04 ± 0.03 0.01 -0.09
21 1.66
10.42
1
0.27 ±0.05 0.21 -0.32
3 0.24
14.14
1
0.3B ± 0.14 0.15-0 .67
21 1.96
11.44 ± 0.68 0.64-2 .93
10 0.79
10 14
1
0.04 ±0.04 0.01 -0.07
2
0.12
1
12.64 ± 1.01 1 .94-5.44
10 1.24
10 80
1
3.56
1
1.55
1
10.02
0.01 ±0.004 0.01 - 0.01
3 0.01
1n.d
0.01 ± 0.002 0.001 - 0.01
6n.d.
0.004 ± 0.00 0.004-0.01
2n.d.
0 01
1
n.d.
155.49
1
93.47 ±49.94 42.03- 141.76
3100.23
1n.d
382.98 ± 300.76 170.92-976.52
2156.01 ±1170.95 1328.03 ±2984.00
2n.d.
292 7R
1
n.d.
STABLE ISOTOPE AND TRACE ELEMENT STATUS OF SUBSISTENCE
HUNTED BOWHEAD (BALAENA MYSTICETUS) AND BELUGA WHALES
(DELPH IN A PIERUS LEUCAS) IN ALASKA AND GRAY WHALES
{ESCHRICHTIUS ROBUSTUS) IN CHUKOTKA3
3.1 ABSTRACT
Tissues o f bowhead, beluga, and gray whales were analyzed for Ag, Cd, Cu, Se,
Zn, THg and MeHg (belugas only). §I5N and 513C in muscle were used to estimate
trophic position and feeding habitat, respectively. Trace element concentrations in tissues
were significantly different among whale species. Hepatic Ag was higher in belugas than
bowheads and gray whales. Gray whales had lower Cd concentrations in liver and kidney
than bowhead and belugas and a sigmoid correlation of Cd with length was noted for all
whales. Renal and hepatic Se and THg were higher in belugas than in baleen whales. The
hepatic molar ratio of Se:THg exceeded 1:1 in all species and was negatively correlated
to body length. Hepatic and renal Zn in subsistence-harvested gray whales was lower
than concentrations for stranded whales. Se:THg molar ratios and tissue concentrations of
Zn may show promise as potential indicators of immune status and animal health.
135
CHAPTER 3
3 Dehn, L.-A., Follmann, E. H., Rosa, C., Duffy, L. K., Thomas, D. L., Bratton, G. R., Taylor, R. J., O ’Hara, T. M. Stable isotope and trace element status of subsistence hunted bowhead (Balaena mysticetus) and beluga whales (Delphinapterus leucas) in Alaska and gray whales (Eschrichtius robustus) in Chukotka.
Submitted to Marine Pollution Bulletin.
Keywords: Bowhead whale, beluga whale, gray whale, trace elements, stable isotopes,
feeding ecology, Arctic
136
Bowhead (.Balaena mysticetus), beluga (Delphinapterus leucas) and gray whales
(Eschrichtius robustus) have been of subsistence and cultural importance to the Inuit of
Alaska and other Arctic areas for centuries. Accumulation o f toxic elements is o f growing
concern to the consumers of subsistence foods in Alaska and Russia, and the cold water
o f the Arctic has been proposed as a sink for many contaminants (Ponce et al., 1997,
Egeland et al., 1998, Bard, 1999). Continuous bioaccumulation and biomagnification of
trace elements have been repeatedly reported in marine mammal tissues (Honda et al.,
1983, Hansen et al., 1990, Dietz et al., 2000, Woshner et al., 2001a). In addition, the
effect of longevity in cetaceans, in particular the bowhead whale (George et al., 1999),
may lead to high levels of trace element accumulation.
The bowhead whale is the largest mysticete in Arctic waters. The Bering-
Chukchi-Beaufort seas stock (BCBS or western Arctic stock) o f bowheads migrates
annually from the Bering Sea in winter to the Beaufort Sea in summer (Moore and
Reeves, 1993). Commercial whalers decimated the bowhead population in the 19th
century, but the BCBS stock is recovering at an estimated rate o f 3.4% a year and
sustains a controlled subsistence harvest (George et al., 2004). However, effects of
offshore and coastal industrial development and thus health status and contaminant
burden are o f great importance for conservation and management o f this culturally
important species. Generally, trace elements in tissues of bowhead whales are low
compared to other cetaceans, e.g., beluga, narwhal (Monodon monoceros), minke whale
(Balaenoptera acutorostrata) and harbor porpoise (Phocoena phocoena) (Honda et al.,
137
3.2 INTRODUCTION
1987, Hansen et al., 1990, Mackey et al., 1995, Wagemann et al., 1996, Woshner et al.,
2001a). Several studies have linked the lower trace element concentrations found in
mysticetes to their low position in the food chain (Honda et al., 1987, Hansen et al., 1990,
Bratton et al. 1997, Woshner et al., 2001a). However, compared to domestic animals,
cadmium (Cd) concentrations in kidneys of bowheads are at levels o f concern to whale
health and subsistence consumers (Puls, 1994, Bratton et al., 1997). The levels are an
order of magnitude higher than in top-level Arctic predators, e.g., Arctic fox (Alopex
lagopus) and polar bear (Ursus maritimus) (Woshner et al., 2001a, 2001b, Ballard et al.,
2003). Thus, it is evident that some trace elements do not accumulate with trophic level,
but rather are prey-specific (Watanabe et a l, 2002, Dehn et al., 2005). Bowheads feed
low in the Arctic food chain on pelagic krill, primarily euphausids and copepods (Lowry,
1993, Lowry and Sheffield, 2002). Other prey is comprised o f amphipods, Arctic cod
(Boreogadus saida), and epibenthic species, but the presence o f these species is likely
due to incidental ingestion or age-related feeding differences (Lowry, 1993, Hazard and
Lowry, 1994).
Gray whales are primitive mysticetes and unique in their reliance on benthic
invertebrates (Rice and Wolman, 1971). Benthic gammaridean amphipods (e.g.,
Ampelisca spp.) are found most commonly in their stomachs (Rice and Wolman, 1971,
Bogoslovskaya et al., 1981). The eastern Pacific stock o f gray whales migrates annually
from their feeding grounds in the Bering and Chukchi seas in summer to its calving
grounds in Baja California and the Gulf o f California in winter (Rice and Wolman, 1971).
In 1999 the number o f gray whales involved in fatal strandings increased from an average
of about 50 animals per year to 274 animals (Le Boeuf et al., 2000). Contaminants, in
particular sediment-associated compounds, have been proposed as possible causes for the
die-offs (Varanasi et al., 1994, Le Boeuf et al., 2000, De Luna and Rosales-Hoz, 2004).
However, very little baseline information is available on trace elements in healthy gray
whales, making inference on the cause of strandings difficult. Tilbury et al. (2002) have
reported trace element concentrations in juvenile gray whales harvested in Russia for
subsistence use. Other information on trace elements consists o f data o f stranded animals
(mostly juveniles) o f varying specimen condition (Varanasi et al., 1994, Mendez et al.,
2002, Ruelas-Inzunza and Paez-Osuna, 2002, De Luna and Rosales-Hoz, 2004).
The beluga is a medium sized odontocete and is widely distributed throughout the
Arctic. Five stocks of beluga whales are currently recognized in Alaskan waters,
including the small isolated Cook Inlet stock (O’Corry-Crowe et al., 1997). Little
information is available on beluga feeding ecology. Various species of fishes have been
identified from stomach contents (Seaman et al., 1982). However, belugas routinely carry
out deep benthic dives for foraging (Martin et al., 1998, Martin and Smith, 1999), and
benthic and epibenthic prey (e.g., octopus, shrimp, polychaetes) seem to be o f importance
(Seaman et al., 1982). A close relative of belugas, the narwhal, shows a high prevalence
of deep benthic prey, e.g., halibut (Reinhardtius hippoglossoides), cephalopods, and
crustaceans (Finley and Gibb, 1982). Beluga and narwhal habitats often overlap in the
Canadian High Arctic, and it has been suggested that both utilize similar prey (Finley and
Gibb, 1982, Richard et al., 1994). Some beluga stocks are declining in Alaska and
Canada, and contaminants have been proposed as significant factors in this decline
139
(Wagemann et al., 1990, Gauthier et al., 1998, Becker et al., 2000). Belugas in the
isolated St. Lawrence estuary are exposed to elevated contaminants and show signs of
disease (e.g., neoplasia) and immune suppression associated with contaminant burden
(Gauthier et al., 1998, Martineau et al., 2003, Brousseau et al., 2003, Gauthier et al.,
2003).
Bowheads, beluga, and gray whales utilize very different trophic niches in the
Arctic marine food web, and a comparison between tissues o f these cetaceans may help
to discriminate trace element pathways. Thus, it is of importance to identify trophic level
and predator-prey relationships for these species. Studies o f feeding ecology that rely on
fecal or stomach contents analysis are strongly biased toward prey with identifiable hard
parts and often underestimate soft prey (Sheffield et al., 2001). In addition, the frequency
of empty stomachs is high in marine mammals, especially during migration, and empty
stomachs will not yield any prey-based information (Rice and Wolman, 1971, Oliver et
al., 1983, Kasuya, 1995).
Stable isotopes have been increasingly important in feeding ecology studies. They
occur naturally, and nitrogen isotope ratios of prey are reflected in tissues of the
consumer with slight enrichment occurring at each trophic step (Kelly, 2000). Carbon
isotope ratios are not reliable indicators of trophic position, but are powerful in
distinguishing between benthic and pelagic foodwebs, inshore vs. offshore environments
and fresh- and saltwater habitats (Tieszen et al., 1983, France, 1995, Smith et al., 1996,
Burton and Koch, 1999). Schell et al. (1998) showed distinct regional differences in
carbon isotope signatures of zooplankton from the Beaufort Sea versus the Bering and
140
Chukchi seas. These differences have also been detected in muscle and baleen of
migrating bowhead whales (Schell et al., 1989, Hoekstra et al., 2002) and are apparent in
muscle o f ringed seals (Phoca hispida) originating from either the Canadian or Alaskan
Arctic (Dehn, in prep.). However, little or no comparative information is available on
stable carbon and nitrogen isotope ratios in tissues of bowheads, belugas, and gray
whales.
The objectives of this study are to provide reference concentrations of selected
trace elements and stable isotopes of apparently healthy whales taken during subsistence
harvests in Alaska and Russia to evaluate the effects o f age (length) and trophic level
(§15n ) on trace element pathways and biomagnification in Arctic cetaceans. This may
aid in the conservation and management o f these important subsistence species.
3.3 MATERIALS AND METHODS
3.31 Sample Collection
All whale samples were obtained during Native subsistence harvests. Basic
morphometries, e.g., body length, blubber thickness, and sex were recorded. Standard
body length (rostrum to fluke notch) was used as a proxy for age (Sergeant and Brodie,
1969, Rice and Wolman, 1971, George et al., 1999). Most whales were grossly examined
for lesions. Bowhead epidermis, lumbar muscle, kidney, and liver were predominantly
collected in Barrow, Alaska during either spring or fall harvest 1998-2001. Data from
bowheads harvested during 1995-1997 (Woshner et al., 2001a) and harvested from 1983
to 1990 (Bratton et al., 1997) were included in the data set. Samples of belugas harvested
141
in Point Lay and Wainwright, Alaska in 1998-1999 were combined with data obtained
during 1996-1997 (Woshner et al., 2001a) and 1992-1995 (Tarpley et al., 1995) that
displayed the appropriate biological variables to increase sample size and statistical
power. Tissues o f gray whales were sampled in Lorino and Lavrentiya, Russia in 2001.
Amphipods and zooplankton were obtained in the Bering Strait and near Kaktovik,
Alaska, respectively.
Figure 3.1 shows villages and communities where samples were collected and
Table 3.1 summarizes sample sizes. All tissues were sub-sampled under clean conditions
with titanium or ceramic blades on a Teflon covered surface, following the sampling
protocol for contaminants by Becker et al. (1999) and stored at -20°C in acid-washed
scintillation vials or Whirlpacks™ until analysis. Marine mammal samples were collected
and analyzed under the authority of Permit No. 932-1489-03 issued to Dr. T. Rowles of
the Marine Mammal Health and Stranding Response Program.
3.32 Stable Isotope Analyses
Muscle o f bowhead, beluga, and gray whales and total body homogenates of prey
(unsorted zooplankton and amphipods) were freeze-dried and ground into a fine powder
with mortar and pestle. For each sample, 0.2 to 0.4 mg of tissue was weighed into a 4.75
x 4 mm tin capsule, which were folded into a cube. Samples were analyzed for both
stable isotope ratios o f carbon and nitrogen at the University o f Alaska Fairbanks (UAF)
using a Finnigan MAT DeltaplusXL Isotope Ratio Mass Spectrometer (IRMS) directly
coupled to a Costech Elemental Analyzer (ESC 4010). Samples were flash-combusted at
142

1020°C, followed by on-line chromatographic separation o f sample N 2 and CO2 with He
as carrier gas. Samples analyzed for 15N/14N and 1 3C/12C were standardized against
atmospheric N2 and PeeDee Belemnite limestone, respectively. Enrichment of a
particular isotope was reported using the following notation and equation:
§R% 0 = (( sample/ standard) - 1) X 1000
where the differential notation (5R) represents the relative difference between isotopic
ratios o f the sample and standard gases (i.e., 13C/1 2C, 15N /14N). A laboratory-working
standard (Peptone No. P-7750) was analyzed every 10 samples during analysis and tin
capsule blanks were run every 20 samples. Calibrations were made with the use of stable
isotope reference materials provided by the National Institute of Standards and
Technology (NIST). External instrument reproducibility for both carbon and nitrogen
isotope analysis was +/- 0.2%o.
3.33 Trace Element Analyses
Silver (Ag), cadmium (Cd), copper (Cu), selenium (Se), and zinc (Zn) were
analyzed at Texas A&M University (TAMU) following US Environmental Protection
Agency (EPA) procedures (200.3, 200.7, 200.8 and 200.9) with slight modifications
(EPA, 1992). Briefly, sub-sampled tissues were homogenized, and approximately 0.8 -
1.0 g of sample was digested in a microwave wet ash procedure using HNO3 , H2O2 and
HC1. A second preparation followed for determination o f Se in tissues using excess HC1
143
to completely reduce Se (VI) to Se (IV) in a CPI ModBlock digester. For bowhead and
beluga whales, Cd and Ag were analyzed using Graphite Furnace Atomic Absorption
Spectrometry (Perkin-Elmer Model SEMAA 6000 equipped with an AS-72 autosampler
and Zeeman background correction). Cu and Zn were determined by Flame Atomic
Absorption Spectrometry (Perkin-Elmer Aanalyst 100). Se in all whale tissues was
analyzed using Atomic Fluorescence Spectrometry (PSA Millennium Excalibur with
CETAC autosampler) and metals (Ag, Cd, Cu and Zn) in gray whales were analyzed by
ICP-MS (Perkin-Elmer Elan Model 6100 DRC-II). The detection limit was 0.01 |ig/g for
elements analyzed with Graphite Furnace AAS, Flame AAS and Atomic Fluorescence
Spectrometry. The detection limits were 0.01 (j,g/g for Cd, 0.05 ng/g for Zn and Cu and
0.005 |^g/g for Ag using ICP-MS. All element concentrations are expressed as (ig/g wet
weight (ww) unless otherwise noted.
3.34 Total Mercury
Total mercury (THg) was analyzed at UAF following the procedure established
by Bloom and Crecelius (1983). Briefly, sub-sampled tissues were homogenized, and
approximately 1 g of tissue was digested in 7:3 HNO3/H 2 SO4 and oxidized with 10%
BrCl in 12N HCL. The sample was reduced to Hg° with SnCh and purged with N2 onto
gold-coated quartz sand traps followed by dual thermal desorption to a Cold Vapor
Atomic Fluorescence Spectrometer (Tekran Model-2500 CVAFS Mercury Detector) with
144
argon as carrier gas. The detection limit was 0.001 fag/g. Concentrations are expressed as
|ug/g wet weight (ww) unless otherwise noted.
3.35 Methyl Mercury
Methyl mercury (MeHg) was analyzed in beluga tissues at UAF following the
procedure established by Bloom (1989). About 1 g o f tissue was homogenized and
digested in 20% KOH in methanol. Aqueous phase ethylation was initiated with
NaB(C2H5)4 resulting in volatile methylethylmercury which was purged with N 2 from
solution onto a carbotrap™. MeHg was thermally desorbed from the trap and volatile
ethyl-analogs were separated by isothermal (100°C) gas chromatography (GC) followed
by CVAFS (Tekran Model-2500) with argon as carrier gas. The detection limit was 0.001
(j,g/g. Concentrations are expressed as (ig/'g wet weight (ww) unless otherwise noted.
3.36 Quality Control
All trace element analyses were performed under a thorough quality control
program (Table 3.2). Reference materials (DOLT-2, DOLT-3 and DORM-2) were
obtained from the National Research Council, Canada (NRC) and BLS 1577b from
National Institute for Standards and Technology (NIST). Marine mammal reference
material (liver of pilot and beluga whale) was provided by NIST as part of annual
interlaboratory comparison exercises for the determination o f trace elements in marine
mammals (Wise et al., 1993, Christopher, 2002, Christopher, 2004). Spikes and duplicate
145
samples as well as method and instrument blanks were run routinely (with each group of
20 samples) during analysis.
3.37 Trace Element Ratios
The ratio or relative occurrence of organic Hg (MeHg) to total Hg (THg) is
referred to as %MeHg in the text and was calculated (for belugas only) as:
%MeHg = (MeHg jag/g ww / THg jag/g ww) * 100
The molar ratio of Se to THg was calculated for all three species as:
Se:THg molar ratio = (Se |ig/g ww / THg fj,g/g ww) * (200.59 g/mole / 78.96 g/mole)
where 200.59 g/mole and 78.96 g/mole are the atomic weights of Hg and Se,
respectively.
3.38 Statistical Analysis
The variables in the data set (body length, 515N, §13C, Ag, Cd, Cu, Se, Zn, THg,
MeHg, %MeHg, and Se:THg molar ratio) were ranked prior to analysis to reduce the risk
of violations o f normality and homogeneity of variance assumptions. Two-way ANOVA
(with interaction term - species * sex) followed by Tukey’s multiple comparison test was
applied to compare variable means between cetacean species and sex. Sample sizes did
146
not allow for a comparison between localities. A residual analysis was implemented to
determine possible violations of assumptions. Spearman rank correlation was calculated
within a species to determine correlations between the variables. LOESS smoothing
followed by nonlinear regression analysis was utilized on non-ranked raw data to
estimate suitable functions between two variables and compare regression surfaces
between whale species. Graphing and nonlinear regression analyses were conducted
using Sigma-Plot (Version 7.0). All other statistical analyses were performed using SAS
(Version 8) with a = 0.05. In order to include element concentrations below the
minimum detection limit (MDL) in summary statistics and statistical tests, they were
expressed as one-half the MDL (Gilbert, 1987). If more than 50% of samples had element
concentrations below the MDL they were highlighted in summary statistics and excluded
from further statistical tests. Results are reported as mean +/- standard deviation (SD)
unless otherwise noted. In addition, the sample median is reported as it is robust to
outliers and is appropriate for censored data sets.
3.4 RESULTS
3.41 Stable Isotopes
Stable carbon and nitrogen isotope ratios were significantly different for the three
cetacean species analyzed (p = <0.0001 for both 813C and 515N). 615N was highest in
belugas (16.8 ± 0.6%o), followed by bowheads (13.3 ± 0.6%o) then gray whales (12.0 ±
0.9%o). Carbon isotope values were more enriched in gray whales (-17.3 ± 1.0%o) than in
bowheads (-20.7 ± 0.8%o) and belugas were intermediate (-18.4 ± 0.6%o). Averages,
standard deviations, medians and ranges of stable carbon and nitrogen isotope ratios in
whales are given in Table 3.3. No sex difference and no significant interaction term
(species * sex) were noted for 513C and 515N in the three whale species.
Nitrogen and carbon isotope ratios in the mysticete prey examined were
significantly different (p = <0.0001 for both 813C and 515N). Total body homogenates of
unsorted zooplankton (including copepods and euphausids) had higher 815N than
homogenates o f benthic gammaridean amphipods (10.4 ± 1.2%o and 7.9 ± 0.8%o for
zooplankton and amphipods, respectively). In contrast, amphipods showed more enriched
l3C values than zooplankton (-24.9 ± 0.7%o and -19 .9 ± 0.7%o for zooplankton and
amphipods, respectively). Figure 3.2 illustrates 513C versus 8l5N in all cetacean groups
analyzed and in bowhead and gray whale prey (pelagic zooplankton and benthic
amphipods, respectively).
3.42 Trace Element Concentrations and Tissue Distribution
Table 3.3 summarizes mean, standard deviation, median, and concentration range
of trace elements (Cu, Zn, Cd, Ag, Se, THg and MeHg) and element ratios (%MeHg and
Se:THg molar ratio) in epidermis, muscle, liver and kidney o f bowheads, belugas and
gray whales. For Ag in epidermis and muscle and Cd in epidermis, more than 50% of the
samples were below the MDL in the three whale species analyzed. Ag in kidney was
below MDL in more than 50% of bowheads and gray whales only.
Generally, concentrations of trace elements were highest in liver, followed by
kidney and lowest in muscle and epidermis. However, renal concentrations of Cd
148
exceeded levels in liver in all three species. Epidermal Se was higher in gray whales and
belugas than concentrations in muscle and kidney, while Se in bowhead kidney showed
the highest concentrations and muscle the lowest. The Se:THg molar ratio was highest in
epidermis for all species analyzed. Zn was higher in bowhead muscle than in any other
tissue, while belugas had the highest Zn concentration in the epidermis. MeHg was only
analyzed in beluga tissues and accounted for approximately 100% of the THg measured
in muscle and epidermis, while kidney and liver had less than 15% MeHg.
3.43 Species Comparison
All variables in all tissues differed significantly among species analyzed, except
for Zn in liver (Table 3.4). Zn in kidney and epidermis and hepatic Ag were higher in
belugas than in bowheads and gray whales. Se and THg were also highest in beluga
tissues compared to bowhead and gray whale tissues, while the Se:THg ratio was lowest
in belugas. Cd concentrations were higher in bowheads and belugas than in gray whales,
and Cu was highest in gray whale and beluga tissues and was lowest in bowheads.
Results o f the ANOVA and Tukey’s multiple comparison tests for all variables and
tissues are compiled in Table 3.4. No sex differences were detected for variables
analyzed in this study, and no significant interaction between whale species and sex was
noted.
3.44 Correlation Between Variables
Significant Spearman rank correlations were found between many variables
within and among tissues (Table 3.5) for all whale species. Positive correlations of renal
and hepatic Cd with length, hepatic THg with length, and Se and THg in kidney were
149
r
noted in all species. Hepatic Cd was positively correlated to Se and THg in liver in
bowheads, belugas, and gray whales. THg in liver and renal Se were negatively
correlated with trophic level (based on 815N) in mysticetes only. Other significant
correlations consistent for bowheads and gray whales included Cu with Ag in liver and
hepatic Ag with THg. Hepatic Se was correlated to hepatic THg in belugas and
bowheads, but not in gray whales. Similarly, Cu in liver was negatively correlated with
length in bowheads and belugas, but was not correlated in gray whales. Hepatic %MeHg
was negatively correlated to length in belugas, while THg and MeHg were positively
correlated to length in all beluga tissues. Significant correlations that were noted in all
species are underlined in Table 3.5, and correlations consistent among mysticetes were
highlighted in bold script.
3.5 DISCUSSION
3.51 Stable Isotopes
Beluga whales occupy a higher trophic level (based on 815N) than both mysticete
species analyzed. Seaman et al. (1982) suggested competition for prey between belugas
and piscivorous spotted seals (Phoca largha). However, nitrogen isotope ratios were
lower in belugas than reported for spotted seals, indicating that this odontocete does not
eat fish exclusively (Dehn, in prep.). Though a variety o f fish species are clearly
important to the beluga diet, cephalopods and shrimp are commonly eaten and 90-100%
of stomachs analyzed by Seaman et al. (1982) contained invertebrates. 815N in beluga
muscle analyzed in this study was similar to values reported for narwhal in Greenland
150
(16.3 ± 1.0%o) and belugas from the St. Lawrence estuary (15.1 %o to 16.3%o range),
suggesting similar prey utilization by these whales (Lesage et al., 2001, Dietz et al.,
2004). Narwhals rely on deep benthic prey, with squid, octopus, and fish making up the
majority o f the diet, while crustaceans were present in about 60% of stomachs (Finley
and Gibb, 1982).
Stable nitrogen isotope ratios suggest that bowheads are foraging on a higher
trophic level than gray whales, thus pointing to differences in prey consumed. Typical
bowhead prey (e.g., euphausids and copepods) had higher 815N than benthic
gammaridean amphipods that make up the majority o f the gray whale diet (Figure 3.2).
This indicates a stepwise trophic enrichment of 3.0%o for 515N in whale muscle,
corresponding to enrichment factors reported by Hobson et al. (1996). Stable nitrogen
isotope ratios o f unsorted amphipods and zooplankton in this study are in agreement with
values reported for gray whale prey (7.0 ± 0.4%o and 8.3 ± 0.3%o for Ampelisca eschrichti
and Ampelisca macrocephala, respectively) and bowhead dietary items (9.6 ± 1,6%o and
10.1 ± 0.7%o for euphausids and copepods, respectively) (Highsmith and Coyle, 1991).
Minke whale nitrogen isotope ratios in baleen are generally similar to those found in
bowhead muscle (12%o - 14%o and 12%o - 15%0 for minke and bowhead whales,
respectively) with baleen and muscle tissue showing comparable isotope ratios (Hobson
and Schell, 1998, Bom et al., 2003, Hobson et al., 2004). However, in contrast to
bowheads, minke whales are known to consume capelin (Mallotus villosus) and herring
(Clupea harengus) and may switch to krill only if fish is not available (Siguijonsson et
al., 2000, Haug et al., 2002).
151
Carbon-13 is significantly enriched in gray whales as compared to bowhead and
beluga whales (Figure 3.2). Stagnant boundary layers and low turbulence, as found in
benthic ecosystems, will lead to enrichment of 13C (France, 1995), thus explaining the
enriched carbon isotope values in benthic-feeding gray whales. In contrast, bowheads
feed mostly in the water column on euphausids and copepods (Lowry, 1993), displaying
the more depleted carbon isotope signatures of the pelagic foodweb. Two bowhead whale
fetuses exhibited highly depleted carbon isotope signatures (highlighted in Figure 3.2).
Selective fractionation o f carbon isotopes leads to depleted 13C in body fat compared to
other tissues (DeNiro and Epstein, 1977), and the low concentrations in fetuses suggest
mobilization and transfer of maternal carbon to fetal development.
Gray whales are enriched in 13C relative to their prey by 2.6 %o, while bowheads
show a shift of 4.2%o. However, carbon isotope signatures are significantly different
between Arctic regions, and bowhead whales migrating from the Beaufort Sea in fall are
more depleted in 13C than whales migrating from the Bering Sea in spring (Schell et al.,
1989, Hoekstra et al., 2002). Bowheads analyzed in this study were taken during both
spring and fall harvests; therefore, the sample includes animals with both carbon
signatures. Zooplankton was obtained from the Beaufort Sea and can be expected to have
more depleted carbon isotope values compared to invertebrates from continental shelf
waters o f the Bering and Chukchi seas (Schell et al., 1998). Thus, a shift of 513C from
zooplankton to bowheads of about 3%o is more plausible and coincides with enrichment
factors noticed for gray whales.
152
Belugas have intermediate 5 C values between bowhead and gray whales,
suggesting that both pelagic and benthic foods are important components of their diet. As
discussed, narwhals rely heavily on epibenthic prey, but Arctic cod is also o f importance
(Finley and Gibb, 1982). Similarly, saffron cod (Eleginus gracilis), shrimp, and octopus
dominate the beluga diet (Seaman et al., 1982). The majority o f beluga stomachs
analyzed by Seaman et al. (1982) contained sediment and pebbles, and about 27% of
narwhal stomachs contained sand (Finley and Gibb, 1982). Carbon isotope signatures of
belugas in this study and narwhal (Dietz et al., 2004) were almost indistinguishable (-
18.5 ± 0.4%o and -18 .4 ± 0.6%o for narwhal and beluga, respectively), further supporting
similar prey utilization by these two odontocetes.
3.52 Trace Elements
3.521 Mercury and Selenium
The beluga occupies a higher trophic level compared to the mysticetes analyzed in
this study, and, as expected, concentrations of Hg in all beluga tissues are up to two
orders o f magnitude higher. Hepatic Hg in this work falls within the range reported for
Alaska belugas by Becker et al. (1995) and Woshner et al. (2001a), but is higher than for
belugas analyzed from the Cook Inlet stock (Becker et al., 2000). Hepatic Hg
concentrations o f belugas harvested in Alaska are intermediate to values reported by
Wagemann et al. (1996) for whales from Western and Eastern Canada (11.3 ± 7.1 jag/g
ww and 19.2 ± 32.7 )ig/g ww, respectively, in liver), while belugas from the St. Lawrence
Estuary were an order of magnitude higher (Wagemann et al., 1990). Thus,
1
concentrations of Hg in tissues ranges widely in these whales and may be interpreted as
differences in feeding habits and feeding grounds due to geographically separate stocks
or populations (Becker et al., 1995, Kunito et al., 2002, Bom et al., 2003). THg and
MeHg in this study were positively correlated to length (as a proxy for age), and
heterogeneity in age structure of the sampled beluga stocks may also explain the large
variations in Hg concentrations reported for this species. However, concentrations of
THg in belugas in this study are low compared to other odontocetes, e.g., rough-toothed
dolphins (Steno bredanensis), pilot whales (Globicephala melas), and striped dolphins
(Stenella coeruleoalba) (Honda et al., 1983, Becker et al., 1995, Caurant et al., 1996,
Mackey et al., 2003).
THg in tissues o f bowhead and gray whales is very low in comparison to other
mysticetes, e.g., minke whales (Hansen et al., 1990, Bom et al., 2003). The overall higher
concentrations of Hg in minke whale tissues in contrast to bowhead and gray whales are
likely due to the higher prevalence of fish in the minke whale diet (Haug et al., 2002).
Fish consumption has been correlated to elevated Hg levels in a variety o f studies (Dietz
et al., 1996, Wagemann et al., 1997, Egeland et al., 1998), and the low concentrations of
THg in bowhead and gray whales are in agreement with the invertebrate-dominated diet
of these mysticetes. THg in tissues of bowheads is comparable to levels reported by
Bratton et al. (1997) and Woshner et al. (2001a). Hg concentrations in gray whales
analyzed in this study are among the lowest reported for marine mammals and MeHg
analyzed in four stranded gray whales accounted for 22%, 18% and 75% of the THg
burden in liver, kidney and muscle, respectively (Ruelas-Inzunza et al., 2003). Tissue
levels o f THg in whales stranded along the Pacific West coast o f North America were
lower (0.06 ± 0.01 (j.g/g ww for gray whale liver) (Varanasi et al., 1994) than for juvenile
gray whales sampled during subsistence harvests in Russia (0.16 ± 0.06 fj.g/g ww for
liver) (Tilbury et al., 2002) and whales examined in this study.
THg is positively correlated to length (as a proxy for age) in liver of all three
species analyzed in this study (r = 0.43, 0.57 and 0.55 for bowhead, beluga and gray
whale, respectively). In addition, MeHg was positively correlated to length in all beluga
tissues (r = 0.45, 0.38, 0.60 and 0.53 for liver, kidney, muscle and epidermis,
respectively). This likely results from the continuous uptake o f Hg / MeHg via diet, slow
elimination, or storage (e.g., tiemannite), and thus a relatively long half-life of THg of
about 10 years as discussed by Wagemann et al. (2000). However, studies on captive
bottlenose dolphins (Tursiops truncatus) inferred that only about 50% of ingested Hg
(administered as dietary fish) is retained and the remainder is eliminated via bilary
excretion in the feces, while pulmonary elimination is negligible (Nigro et al., 2002). A
half-life o f less than 1000 days for Hg in whale tissues was postulated (Nigro et al.,
2002). Wagemann et al. (1996) suggested that the epidermis o f cetaceans might be a
significant route o f elimination o f Hg compounds. For belugas in this study, about 100%
of THg in epidermis was present as organic Hg. The highest Hg concentration is found in
the outer epidermal layer, and during skin molt approximately 14% of epidermal MeHg
can be eliminated (Wagemann et al., 1996). The fraction of MeHg (%MeHg) in beluga
liver was inversely correlated to length (r = -0.46). A similar decay function of hepatic
%MeHg with age was also described for other marine mammals (Becker et al., 1995,
2000, Dehn et al., 2005).
Storage o f Hg as biologically inert tiemannite (Hg-Se granules) requires Se and
thus leads to the often discussed protective effect of Se on Hg toxicosis. This is supported
by a strong correlation between THg and Se in liver o f beluga and bowhead whales (r =
0.72 and 0.58 for beluga and bowhead, respectively). This relationship is commonly
observed in marine mammal tissues (Koeman et al, 1973, Mackey et al., 1996, 2003, Das
et al., 2004a), although it was not noted for gray whales in this study (r = 0.31, p = 0.11).
Several authors report that both elements occur in a 1:1 ratio when expressed as molar
concentrations (Koeman et al., 1973, Caurant et al., 1994, Becker et al., 1995, Dietz et al.,
2000, Endo et al., 2002). Unity between Se and Hg on a molar basis was only observed in
one adult beluga whale, and other cetaceans in this study had ratios in liver of
approximately 10:1 in belugas or 100:1 (Se:THg) for mysticetes (Figure 3.3). Se is an
essential element and is incorporated into selenoproteins involved in hormone
homeostasis, reproduction, and anti-oxidant enzyme systems, e.g., glutathione peroxidase
(Bedwal and Bahuguna, 1994, Bates et al., 2000, Whanger, 2001). A molar ratio of 1:1
would indicate that all available Se is bound to Hg, leaving animals, in particular diving
marine mammals, vulnerable to oxidative stress. Becker et al. (1995) and Ikemoto et al.
(2004) argued that not only Hg binds Se, but also Ag may compete for binding sites on
Se in belugas and other marine mammals, thus making the assumed unity of Hg:Se even
more improbable. In addition, Figure 3.4 shows that the Se:THg molar ratio is negatively
correlated to body length in all three species, and a similar decay function o f Se:THg with
156
age was also noted for ice seals (Dehn et al., 2005). This illustrates the importance of Se
for maturation of the antioxidant system and endocrine, reproductive, and neuronal
development (Bedwal and Bahuguna, 1994, Hagmar et al., 1998, Whanger, 2001). Thus,
tissue ratios of Se:THg close to 1:1 could suggest compromised health of the animals
(Dietz et al., 2000, Dehn et al., 2005). Wagemann et al. (2000) postulated that only
marine mammals with exceedingly high concentrations o f Hg show a Se:THg ratio
approaching unity. Se in liver o f stranded gray whales was higher than for subsistence-
harvested gray whales examined here (Varanasi et al., 1994). Hepatic Se concentrations
have been reported to be elevated in stranded and emaciated animals (Bennet et al., 2001,
Das et al., 2004a). Ketone body metabolism requires Se, and it is possible that during
starvation Se is elevated to increase turnover of lipids and ketone bodies (Olsson, 1985).
Epidermal Se in this study was highest in belugas and lowest in bowhead whales.
Elevated concentrations of Se were also reported in epidermis o f harbor porpoise from
Greenland and belugas and narwhals from the Canadian Arctic (Dietz et al., 1990,
Paludan-Miiller et al., 1993, Wagemann et al., 1996). Se in epidermis does not seem to be
associated with Hg as tiemannite, as most of the Hg in epidermis is present in the organic
form. Paludan-Miiller et al. (1993) considered a possible storage mechanism or excretion
of Se via skin molt as described for Hg. Leccia et al. (1993) and Burke et al. (2003)
suggested that Se in the form of glutathione peroxidase protects against ultraviolet (UV)
induced skin damage and carcinogenesis caused by generation of reactive oxygen
species. As belugas lose their skin pigmentation with adulthood at approximately 6 years
of age (Sergeant, 1973), it is feasible that this species will need more UV protection than
157
the dark pigmented bowhead whale. Se in epidermis of belugas analyzed in this study
was higher than reported by Wagemann et al. (1996) for belugas and narwhals from the
Canadian Arctic. However, epidermal Se concentrations in harbor porpoise exceeded
levels established for belugas by an order of magnitude (Dietz et al., 1990, Paludan-
Miiller et al., 1993).
3.522 Cadmium
Although bowheads feed low in the food chain, renal and hepatic Cd
concentrations of bowheads were similar to or even higher than those o f belugas that
occupy a higher trophic level. Renal and hepatic Cd in gray whales was considerably
lower than in both bowheads and belugas. Most invertebrates have higher Cd levels than
fish (Bohn and McElroy, 1976, Bustamante et al., 2003), and cephalopods, in particular,
display elevated Cd concentrations (Martin and Flegal, 1975, Bustamante et al., 1998a,
1998b). High variability in Cd levels has been described for different species of
crustaceans that make up typical mysticete prey. Elevated levels o f Cd were reported for
pelagic amphipods (Parathemisto libellula) and copepods, ranging from 3 ng/g dry
weight (dw) in copepods to 11 p,g/g dw in amphipods (Bohn and McElroy, 1976,
Hamanaka and Ogi, 1984, Macdonald and Sprague, 1988). However, benthic amphipods
have very low concentrations ranging from 0.2 to 1.3 (u,g/g ww in the Alaskan Beaufort
Sea (Presley, 1997). Similarly, concentrations of Cd in mysids and euphausids are up to
an order o f magnitude lower than in Parathemisto and copepods (Hamanaka and Ogi,
1984, Macdonald and Sprague, 1988), and Cd concentrations in euphausids from
Greenland are below the limit of detection (Dietz et al, 1996). However, the overall lower
concentrations of Cd in gray whale prey would not account for the 1 to 2 orders of
magnitude difference in renal Cd levels o f the two mysticetes. According to daily
consumption estimates based on body mass and metabolic rate, adult bowheads consume
between 1083 and 1453 kg of prey, while adult gray whales take in approximately 268 to
538 kg of amphipods (Tamura and Ohsumi, 2000, Thompson, 2002). In addition, gray
whales feed mainly for about 5 months in their summering grounds, while there is still
disagreement about seasonality of bowhead feeding (Rice and Wolman, 1971, Schell et
al., 1989, Lowry, 1993, Hoekstra et al., 2002). Thus, differences in prey Cd
concentrations and daily and seasonal intake of prey may account for the overall higher
exposure to Cd in bowhead whales compared to gray whales. Renal Cd concentration in
minke whales is intermediate to bowheads and gray whales, and the seasonal importance
of fish to this species may explain much of this difference (Hansen et al., 1990, Haug et
al., 2002).
The relatively high concentrations of Cd in kidneys o f belugas indicate the
importance of invertebrates and/or cephalopods to this species. Bustamante et al. (1998a)
suggested that cephalopods, in particular benthic rather than neritic species, are a main
vector for Cd in the food chain. Cd levels in narwhal tissues are higher than established
for belugas in this study, ranging from 0.76 to 168 jag/g ww (Wagemann et al., 1996).
This may indicate higher prevalence of invertebrates and cephalopods in narwhals or
regional differences in Cd concentrations as described by Wagemann et al. (1996).
Belugas from the St. Lawrence estuary are considered highly polluted, though Cd levels
159
I
in these whales are among the lowest compared to belugas from other Arctic regions
(Wagemann et al., 1990). Similarly, renal Cd of the declining Cook Inlet beluga stock is
markedly lower than for other Alaska belugas (Becker et al., 2000). Feeding habits of
Cook Inlet belugas are strongly correlated with salmon runs and other seasonally
abundant fish, while invertebrates seem uncommon in their diet (Huntington, 2000).
Thus, limited abundance of invertebrate prey or dietary preference for fish may explain
the low Cd concentrations in these isolated beluga stocks.
Renal Cd was positively correlated to length in all three species (r = 0.83, 0.40
and 0.84 for bowhead, beluga and gray whale, respectively). The correlation is sigmoid
rather than linear, showing plateaus of Cd levels during the fetal and neonate stage and
later in adult life (Figure 3.5). Cd concentrations are below detection limit in two
bowhead fetuses (Figure 3.5), suggesting that Cd is not transferred from mother to fetus
in this species. Some studies report that the placenta may serve as a selective Cd filter
(Itoh et al., 1996, Enomoto and Hirunuma, 2001). Almost linear accumulation of Cd
begins at birth via oral exposure (e.g., milk, prey). With increasing length (as a proxy for
age) Cd increases to a maximum in midlife and plateaus such that Cd intake and
excretion are balanced. Renal Cd concentrations at the point o f curve saturation are 29.4,
10.6 and 4.7 (ig/g ww in bowhead, beluga and gray whales, respectively (Figure 3.5).
Metallothionein is involved in intracellular binding of divalent elements (e.g., Cd,
Cu, Zn) at the renal glomerulus, though Cd is reabsorbed at the proximal tubules along
with the biologically similar essential elements. The biological half-life for Cd in humans
is estimated at 20-40 years as Cd is continuously accumulated until tubule cells and
160
associated Cd are shed in the urine (Gerhardsson and Skerfving, 1996). Changes in renal
physiology associated with the aging process (e.g., apoptosis, glomerulosclerosis) may
lead to an increased excretion o f Cd with shed cells or decreased absorption efficiency
due to impaired peritubular blood flow after a critical age (Khan et al., 1999, Cardani and
Zavanella, 2000). Thus, increase of Cd levels to a maximum or even decreases in renal
Cd concentrations after a critical age are plausible and have been described for other
marine mammals (Dietz et al., 1998, Watanabe et al., 2002, Dehn et al., 2005).
3.523 Silver
The high concentrations o f Ag in beluga liver have long been a mystery and
several authors have discussed possible causes for Ag accumulation (Becker et al. 1995,
2000, Woshner et al. 2001a). Cephalopods have been associated with elevated
concentrations o f Ag (Martin and Flegal, 1975). Benthic snow crabs (Chionoecetes
opilio) retained 90% of an administered Ag dose and the biological half-life was above
1000 days, while flatfish retained only 16% and rate o f Ag elimination was 10 to 100
times faster (Rouleau et al., 2000). Thus, much higher concentrations o f Ag can be
reached in benthic invertebrates. As discussed above, belugas rely heavily on
cephalopods; however, hepatic Ag concentrations were an order of magnitude higher in
belugas than in some pinnipeds (e.g., northern fur seal (Callorhinus ursinus), bearded
seal (Erignathus barbatus)) and cetaceans (e.g., pilot whale) that also rely heavily on
octopus and squid (Mackey et al., 1996, Becker et al., 2000, Saeki et al., 2001, Dehn et
al., 2005). Thus, the concentrations of Ag found in belugas could reflect a unique dietary
source, as has been suggested by Becker et al. (1995), or feeding location, e.g., vicinity to
volcanic or hydrothermal activity (Hein et al., 1999). It is also conceivable that belugas
have a predilection for Ag accumulation or this trace metal serves an unknown nutritional
need. Currently, there is no data available on Ag concentrations in tissues of narwhals to
determine if Ag accumulation is a peculiarity in the Family Monodontidae.
Hepatic Ag concentrations of pelagic bowheads and benthic-feeding gray whales
were 2-3 orders o f magnitude lower than concentrations in beluga whales, suggesting that
mysticete prey, e.g., zooplankton and benthic amphipods, are not retaining Ag to the
extent that large crustaceans and cephalopods do. Copepods have low accumulation
potential (-17% of Ag is retained), and zooplankton molt their chitinous carapace so that
Ag adsorbed to the exoskeleton is shed, hence not bioaccumulated (Ratte, 1999).
Ag in liver was not correlated to body length in gray whales or belugas (r = -0.08
and -0.29 for gray whales and beluga, respectively), but was negatively correlated in
bowheads (r = -0.37). Juvenile and subadult bowhead whales have higher hepatic Ag
levels than adults (Figure 3.6). Hazard and Lowry (1984) reported benthic prey in a
juvenile bowhead and considered that the baleen plates of young bowhead whales are not
long enough to filter plankton efficiently from the water column. Hence, differences in
feeding ecology could explain higher concentrations o f hepatic Ag in juvenile bowheads.
However, Ag is also elevated in juvenile gray whales and belugas (Figure 3.6). Ag and
Cu are commonly intercorrelated, and Saeki et al. (2001) indicated that Ag interferes with
Cu metabolism and transport. Bremner and Beattie (1990) postulated that Cu accumulates
in fetal tissues due to limited efficiency of bilary excretion mechanisms. Thus, co
162
accumulation of Cu and Ag in liver o f juvenile whales or limited bilary excretion may
account for elevated concentrations of Ag.
3.524 Copper and Zinc
Homeostasis o f the essential trace metals Cu and Zn is tightly regulated. Both
metals are excreted from the liver with bile or pancreatic secretions. Excretion via
kidneys is limited, though Zn may be removed in urine following muscle catabolism
mediated by interleukin-1 (Cousins, 1985). Cu and Zn are required for bone formation
and are part of the antioxidant enzyme system superoxide dismutase. In addition, Zn
contributes to tissue growth, wound-healing, and immune function and protects against
UV-radiation in the epidermis (Rostan et al., 2002). Thus, Zn is found in its highest
concentration in the epidermis of beluga whales, and is lower in bowhead and gray
whales.
Concentrations o f renal and hepatic Zn of stranded gray whales (Varanasi et al.,
1994) were higher than levels of subsistence-harvested animals analyzed in this study. Zn
is an inhibitor o f gluconeogenesis, its absorption increases during malnutrition, and it
competes with Cu for receptor binding sites (Cousins, 1985, Das et al., 2004b). In
addition, high dietary Zn decreases Cu absorption (Cousins, 1985). Cu secretion from the
liver is increased and its absorption is negatively influenced by stress (e. g.,
glucocorticoids), while elevated Zn concentrations and altered Zn kinetics are a response
to stressors, poor body condition, and infection (Cousins, 1985, 1986, Frank et al., 1992,
163
Bennet et al., 2001, Das et al., 2004b, Ilback et al., 2004). Thus, tissue concentrations of
Zn could provide a possible indication of immune status and health in cetaceans.
Cu in liver is inversely correlated to length in bowheads and beluga, but not gray
whales, such that fetal and juvenile tissues have the highest hepatic concentrations
(Figure 3.7). The negative correlation of Cu with age has been noticed by a variety of
studies (Honda et al., 1983, Wagemann et al. 1988, 1990, Caurant et al., 1994, Woshner
et al., 2001a). Liver metallothionein is increased during fetal growth, and concentrations
of Cu in a Dali’s porpoise (Phocoenoides dalli) fetus exceeded levels found in maternal
tissues by 6 times (Yang et al., 2004). Thus, tissue growth, development, and DNA
synthesis may require increased concentrations of Cu and Zn. However, limited
efficiency o f bilary excretion mechanisms in fetus and subadult animals, as discussed
above, may lead to accumulation of Cu in juveniles (Bremner and Beattie, 1990).
3.6 SUMMARY AND CONCLUSION
Stable nitrogen isotope ratios indicate that belugas occupied the highest trophic
level. 515N values also established that bowheads forage on a higher trophic level than
gray whales, thus pointing to differences in prey species consumed. Typical bowhead
prey had higher nitrogen isotope ratios than benthic amphipods that make up the majority
of the gray whale diet. Carbon isotope values were enriched in gray whales and are likely
due to their benthic feeding habits. Bowheads feed mostly in the water column,
displaying depleted 13C values of the pelagic foodweb. Belugas take an intermediate
position, suggesting that both pelagic and benthic prey are important components. Cd
164
concentrations in whale tissues seem to be associated with invertebrate prey and are
indicative o f Cd levels in prey species consumed and ingested biomass. The relationship
between Cd and length was sigmoid in all three species. The molar ratio o f Se to THg
was inversely correlated to length. The observed ratios exceeded the classic 1:1 ratio by
one or two orders o f magnitude, and Se:THg ratios close to unity may indicate
compromised health. High concentrations of Ag in liver of belugas were noticed in this
study; mysticetes had much lower Ag concentrations. Juvenile and subadult whales of all
species possessed higher hepatic Ag than adults, mirroring accumulation patterns
observed for hepatic Cu. Se and Zn occurred in high concentrations in cetacean
epidermis. Both elements are likely involved in protection against reactive oxygen
species and UV radiation. Subsistence-harvested gray whales had strikingly lower
concentrations o f Zn in liver and kidney than stranded gray whales. Thus, Zn status may
be useful in the evaluation o f body condition, immune status, and animal health.
3.7 ACKNOWLEDGMENTS
This study would not have been possible without the samples provided by
Alaskan and Russian subsistence hunters and whaling captains in the communities of
Barrow, Kaktovik, Wainwright, Point Lay, Point Hope, Savoonga, Lorino and
Lavrentiya, and we thank them all for their support. We greatly appreciate the assistance
of H. Brower, Jr., C. D. N. Brower, B. Akootchook, T. Hepa, C. George, R. Suydam, G.
Zelensky, G. Sheffield, V. Woshner, G. York and many others in the field and N.
Haubenstock, T. Howe, T. Bentzen and P. Hoekstra for support with analysis. We also
r
165
thank P. Krahn and G. Ylitalo for making additional gray whale samples available and R.
Highsmith and B. Bluhm for collection of amphipod samples from the Bering Strait. P.
Becker and S. Christopher provided marine mammal reference material and coordinated
interlaboratory comparison exercises for the determination of trace elements in marine
mammals. This study was primarily funded by the Cooperative Institute for Arctic
Research (CIFAR). Additional support was provided by the Experimental Program for
Stimulation o f Competitive Research (EPSCoR); the Biomedical Research Infrastructure
Network (BRIN); the North Slope Borough Department o f Wildlife Management; the
Institute o f Arctic Biology and the Department of Biology and Wildlife, UAF.
3.8 REFERENCES
Ballard, W. B., Cronin, M. A., Robards, M. D. & Stubblefield, W. A. 2003. Heavy metal
concentrations in Arctic foxes, Alopex lagopus, in the Prudhoe Bay oil field,
Alaska. Canadian Field-Naturalist 117, 119-121.
Bard, H. M. 1999. Global transport of anthropogenic contaminants and the consequences
for the Arctic marine ecosystem. Marine Pollution Bulletin 38, 356-379.
Bates, J. M., Spate, V. L., Morris, J. S., Germain, D. L. S. & Galton, V. A. 2000. Effects
o f selenium deficiency on tissue selenium content, deiodinase activity, and
thyroid hormone economy in the rat during development. Endocrinology 141,
2490-2500.
166
Becker, P. R., Mackey, E. A., Demiralp, R., Suydam, R., Early, G., Koster, B. J. & Wise,
S. A. 1995. Relationship o f silver with selenium and mercury in the liver of two
species of toothed whales (Odontocetes). Marine Pollution Bulletin 30, 262-271.
Becker, P. R., Porter, B. J., Mackey, E. A., Schantz, M. M., Demiralp, R., & Wise, S. A.
1999. National Marine Mammal Tissue Bank and Quality Assurance Program:
protocols, inventory, and analytical results. U. S. Department of Commerce,
Gaithersburg.
Becker, P. R., Krahn, M. M., Mackey, E. A., Demiralp, R., Schantz, M. M., Epstein, M.
S., Donais, M. K., Porter, B. J., Muir, D. C. G. & Wise, S. A. 2000.
Concentrations and polychlorinated biphenyls (PCB's), chlorinated pesticides, and
heavy metals and other elements in tissues of belugas, Delphinapterus leucas,
from Cook Inlet, Alaska. Marine Fisheries Review 62, 81-98.
Bedwal, R. S. and Bahuguna, A. 1994. Zinc, copper and selenium in reproduction.
Experientia 50, 626-640.
Bennet, P. M., Jepson, P. D., Law, R. J., Jones, B. R., Kuiken, Y., Baker, J. R., Rogan, E.
& Kirkwood, J. K. 2001. Exposure to heavy metals and infectious disease
mortality in harbour porpoises from England and Wales. Environmental Pollution
112, 33-40.
167
&E.
Bloom, N. S. and Crecelius, E. A. 1983. Determination o f mercury in seawater at sub
nanogram per liter levels. Marine Chemistry 14, 49-59.
Bloom, N. 1989. Determination of picogram levels o f methylmercury by aqueous phase
ethylation, followed by cryogenic gas chromatography with cold vapor atomic
fluorescence detection. Canadian Journal of Fisheries and Aquatic Science 46,
1131-1140.
Bogoslovskaya, L. S., Vorogov, L. M. & Semenova, T. N. 1981. Feeding habits of the
gray whale off Chukotka. Report to the Scientific Committee o f the International
Whaling Commission 31, 507-510.
Bohn, A. and McElroy, R. O. 1976. Trace metals (As, Cd, Cu, Fe and Zn) in Arctic cod,
Boreogadus saida, and selected zooplankton from Strathcona Sound, northern
Baffin Island. Journal of the Fisheries Research Board o f Canada 33, 2836-2840.
Bom, E. W., Outridge, P., Riget, F. F., Hobson, K. A., Dietz, R., 0ien, N. & Haug, T.
2003. Population substructure of North Atlantic minke whales (Balaenoptera
acutorostrata) inferred from regional variation of elemental and stable isotopic
signatures in tissues. Journal of Marine Systems 43, 1-17.
168
F
Bratton, G. R., Flory, W., Spainhour, C. B. & Haubold, E. M. 1997. Assessment of
selected heavy metals in liver, kidney, muscle, blubber, and visceral fat of Eskimo
harvested bowhead whales Balaena mysticetus from Alaska's North Coast.
Department o f Wildlife Management, North Slope Borough, Barrow, Alaska.
Bremner, I. and Beattie, J. H. 1990. Metallothionein and the trace minerals. Annual
Review of Nutrition 10, 63-83.
Brousseau, P., De Guise, S., Voccia, I., Ruby, S. & Fournier, M. 2003. Immune status of
St. Lawrence estuary beluga whales. In Vos, J. G., Bossart, G. D., Fournier, M.,
O ’Shea, T. J. Toxicology of Marine Mammals. Taylor & Francis, London.
Burke, K. E., Clive, J., Combs, G. F. & Nakamura, R. M. 2003. Effects of topical L-
selenomethionine with topical and oral vitamin E on pigmentation and skin cancer
induced by ultraviolet irradiation in Skh:2 hairless mice. Journal of the American
Academy o f Dermatology 49, 458-472.
Burton, R. K. and Koch, P. L. 1999. Isotopic tracking o f foraging and long-distance
migration in northeastern Pacific pinnipeds. Oecologia 119, 578-585.
169
Bustamante, P., Caurant, F., Fowler, S. W. & Miramand, P. 1998a. Cephalopods as a
vector for the transfer of cadmium to top marine predators in the north-east
Atlantic Ocean. The Science of the Total Environment 220, 71-80.
Bustamante, P., Cherel, Y., Caurant, F. & Miramand, P. 1998b. Cadmium, copper and
zinc in octopuses from Kerguelen Islands, Southern Indian Ocean. Polar Biology
19, 264-271.
Bustamante, P., Bocher, P., Cherel, Y., Miramand, P. & Caurant, F. 2003. Distribution of
trace elements in the tissues of benthic and pelagic fish from the Kerguelen
Islands. The Science of the Total Environment 313, 25-39.
Cardani, R. and Zavanella, T. 2000. Age-related cell proliferation and apoptosis in the
kidney of male Fischer 344 rats with observations on a spontaneous tubular cell
adenoma. Toxicologic Pathology 28, 802-806.
Caurant, F., Amiard, J. C., Amiard-Triquet, C. & Sauriau, P. G. 1994. Ecological and
biological factors controlling the concentrations o f trace elements (As, Cd, Cu,
Hg, Se, Zn) in delphinids Globicephala melas from the North Atlantic Ocean.
Marine Ecology Progress Series 103, 207-219.
170
Caurant, F., Navarro, M. & Amiard, J.-C. 1996. Mercury in pilot whales: possible limits
to the detoxification process. The Science of the Total Environment 186, 95-104.
Cousins, R. J. 1985. Absorption, transport, and hepatic metabolism of copper and zinc:
special reference to metallothionein and ceruloplasmin. Physiological Reviews
65, 238-309.
Cousins, R. J. 1986. Toward a molecular understanding o f zinc metabolism. Clinical
Physiology and Biochemistry 4, 20-30.
Christopher, S. J. 2002. NIST / NOAA National marine analytical quality assurance
program. Description and results of the 2001 interlaboratory comparison exercise
for the determination of trace elements in marine mammals. NIST.
Christopher, S. J. 2004. NIST / NOAA National marine analytical quality assurance
program. Description and results of the 2003 interlaboratory comparison exercise
for the determination of trace elements in marine mammals. NIST.
Das, K., Holsbeek, L., Browning, J., Siebert, U., Birkun, A. & Bouquegneau, J.-M.
• 1 ^ 1 S2004a. Trace metal and stable isotope measurements ( 6 C and 8 N) in the
harbour porpoise Phocoena phocoena relicta from the Black Sea. Environmental
Pollution 131, 197-204.
171
Das, K., Siebert, U., Fontaine, M., Jauniaux, T., Holsbeek, L. & Bouquegneau, J.-M.
2004b. Ecological and pathological factors related to trace metal concentrations in
harbour porpoises Phocoena phocoena from the North Sea and adjacent areas.
Marine Ecology Progress Series 281, 283-295.
Dehn, L.-A., Sheffield, G. G., Follmann, E. H., Duffy, L. K., Thomas, D. L., Bratton, G.
R., Taylor, R. J. & O'Hara, T. M. (2005). Trace elements in tissues o f phocid seals
harvested in the Alaskan and Canadian Arctic - Influence o f age and feeding
ecology. Canadian Journal o f Zoology 83, 726-746.
Dehn, L.-A. In preparation. Trophic relationships in an Arctic marine foodweb and
implications for trace element dynamics. Ph.D. thesis, Department o f Biology and
Wildlife, University of Alaska Fairbanks, Fairbanks, AK.
De Luna, C. J. and Rosales-Hoz, L. 2004. Heavy metals in tissues of gray whales
Eschrichtius robustus, and in sediments of Ojo de Liebre Lagoon in Mexico.
Bulletin o f Environmental Contamination and Toxicology 72, 460-466.
DeNiro, M. J. and Epstein, S. 1977. Mechanisms of carbon isotope fractionation
associated with lipid synthesis. Science 197, 261-263.
172
Dietz, R., Nielsen, C. O., Hansen, M. M. & Hansen, C. T. 1990. Organic mercury in
Greenland birds and mammals. The Science of the Total Environment 95, 41-51.
Dietz, R., Norgaard, J. & Hansen, J. C. 1998. Have arctic marine mammals adapted to
high cadmium levels? Marine Pollution Bulletin 36, 490-492.
Dietz, R., Riget, F., Cleemann, M., Aarkrog, A., Johansen, P. & Hansen, J. C. 2000.
Comparison of contaminants from different trophic levels and ecosystems. The
Science of the Total Environment 245, 221-231.
Dietz, R., Riget, F., Hobson, K. A., Heide-Jorgensen, M. P., Moller, P., Cleemann, M., de
Boer, J. & Glasius, M. 2004. Regional and inter annual patterns of heavy metals,
organochlorines and stable isotopes in narwhals (Monodon monoceros) from
West Greenland. The Science of the Total Environment 331, 83-105.
Egeland, G. M., Feyk, L. A. & Middaugh, J. P. 1998. The use o f traditional foods in a
healthy diet in Alaska: risks in perspective. State o f Alaska Epidemiology Bulletin
2, 1-140.
Endo, T., Haraguchi, K. & Sakata, M. 2002. Mercury and selenium concentrations in the
internal organs o f toothed whales and dolphins marketed for human consumption
in Japan. The Science of the Total Environment 300, 15-22.
173
Enomoto, S. and Hirunuma, R. 2001. Fetoplacental transport o f various trace elements in
pregnant rat using the multitracer technique. RIKEN Review 35, 31-34.
Finley, K. J. and Gibb, E. J. 1982. Summer diet of the narwhal (Monodon monoceros) in
Pond Inlet, northern Baffin Island. Canadian Journal o f Zoology 60, 3353-3363.
France, R. L. 1995. Carbon-13 enrichment in benthic compared to planktonic algae:
foodweb implications. Marine Ecology Progress Series 124, 307-312.
Frank, A., Galgan, V., Roos, A., Olsson, M., Petersson, L. R. & Bignert, A. 1992. Metal
concentrations in seals from Swedish waters. Ambio 21, 529-538.
Gauthier, J. M., Dubeau, H. & Rassart, E. 1998. Mercury-induced micronuclei in skin
fibroblasts o f beluga whales. Environmental Toxicology and Chemistry 17, 2487-
2493.
Gauthier, J. M., Dubeau, H. & Rassart, E. 2003. Evaluation of genotoxic effects of
environmental contaminants in cells of marine mammals, with particular
emphasis on beluga whales. In Vos, J. G., Bossart, G. D., Fournier, M., O’Shea,
T. J. Toxicology of Marine Mammals. Taylor & Francis, London.
174
George, J. C., Bada, J., Zeh, J., Scott, L., Brown, S. E., O'Hara, T. & Suydam, R. 1999.
Age and growth estimates of bowhead whales (Balaena mysticetus) via aspartic
acid racemization. Canadian Journal of Zoology 77, 571-580.
George, J. C., Zeh, J., Suydam, R. & Clark, C. 2004. Abundance and population trend
(1978-2001) of western Arctic bowhead whales surveyed near Barrow, Alaska.
Marine Mammal Science 20, 755-773.
Gerhardsson, L. and Skerfving, S. 1996. Concepts on biological markers and
biomonitoring for metal toxicity. In Chang, L. W. Toxicology of Metals. CRC
Lewis Publishers, Boca Raton.
Gilbert, R. O. 1987. Statistical methods for environmental pollution monitoring. John
Wiley and Sons, Inc., New York.
Hagmar, L., Persson-Moschos, M., Akesson, B. & Schiitz, A. 1998. Plasma levels of
selenium, selenoprotein P and glutathione peroxidase and their correlations to fish
intake and serum levels o f thyrotropin and thyroid hormones: A study on Latvian
fish consumers. European Journal of Clinical Nutrition 52, 796-800.
175
Hansen, C. T., Nielsen, C. O., Dietz, R. & Hansen, M. M. 1990. Zinc, cadmium, mercury
and selenium in minke whales, belugas and narwhals from West Greenland. Polar
Biology 10, 529-539.
176
Haug, T., Lindstram, U. & Nilssen, K. T. 2002. Variations in minke whale (Balaenoptera
acutorostrata) diet and body condition in response to ecosystem changes in the
Barents Sea. Sarsia 87, 409-422.
Hazard, K. W. and Lowry, L. F. 1984. Benthic prey in a bowhead whale from the
Northern Bering Sea. Arctic 37, 166-168.
Hein, J. R., Koski, R. A., Embley, R. W., Reid, J. & Chang, S.-W. 1999. Diffuse-flow
hydrothermal field in an oceanic fracture zone setting, Northeast Pacific: Deposit
composition. Exploration and Mining Geology 8 , 299-322.
Highsmith, R. C. and Coyle, K. O. 1991. Amphipod life histories: community structure,
impact o f temperature on decoupled growth and maturation rates, productivity,
and P:B ratios. American Zoologist 31, 861-873.
Hobson, K. A., Schell, D. M., Renouf, D. & Noseworthy, E. 1996. Stable carbon and
nitrogen isotopic fractionation between diet and tissues o f captive seals:
implications for dietary reconstructions involving marine mammals. Canadian
Journal of Fisheries and Aquatic Science 53, 528-533.
Hobson, K. A. and Schell, D. M. 1998. Stable carbon and nitrogen isotope patterns in
baleen from eastern Arctic bowhead whales (Balaena mysticetus). Canadian
Journal of Fisheries and Aquatic Science 55, 2601-2607.
Hobson, K. A., Riget, F. F., Outridge, P. M., Dietz, R. & Bom, E. 2004. Baleen as
biomonitor o f mercury content and dietary history o f North Atlantic minke whales
(Balaenoptera acutorostrata): combining elemental and stable isotope
approaches. The Science of the Total Environment 331, 69-82.
Hoekstra, P. F., Dehn, L.-A., George, J. C., Solomon, K. R., Muir, D. C. G. & O'Hara, T.
M. 2002. Trophic ecology of bowhead whales (Balaena mysticetus) compared
with that of other arctic marine biota as interpreted from carbon-, nitrogen-, and
sulfur-isotope signatures. Canadian Journal o f Zoology 80, 223-231.
Honda, K., Tatsukawa, R., Itano, K., Miyazaki, N. & Fujiyama, T. 1983. Heavy metal
concentrations in muscle, liver and kidney tissue o f striped dolphin, Stenella
coeruleoalba, and their variations with body length, weight, age and sex.
Agricultural and Biological Chemistry 47, 1219-1228.
Il l
Honda, K., Yamamoto, Y., Kata, H. & Tatsukawa, R. 1987. Heavy metal accumulations
and their recent changes in Southern minke whales Balaenoptera acutorostrata.
Archives o f Environmental Contamination and Toxicology 16, 209-216.
Huntington, H. P. 2000. Traditional knowledge of the ecology o f belugas, Delphinapterus
leucas, in Cook Inlet, Alaska. Marine Fisheries Review 62, 134-140.
Ikemoto, T., Kunito, T., Tanaka, H., Baba, N., Miyazaki, N. & Tanabe, S. 2004.
Detoxification mechanism of heavy metals in marine mammals and seabirds:
interaction o f selenium with mercury, silver, copper, zinc, and cadmium in liver.
Archives o f Environmental Contamination and Toxicology 47, 402-413.
Ilback, N.-G., Glynn, A. W., Wikberg, L., Netzel, E. & Lindh, U. 2004. Metallothionein
is induced and trace element balance changed in target organs of a common viral
infection. Toxicology 199, 241-250.
Itoh, N., Fujita, Y., Nakanishi, H., Kawai, Y., Mayumi, T., Hawang, G.S., Min, K.,
Onosake, S., Muto, N. & Tanaka, K. 1996. Binding o f Cd to metallothionein in
the placenta o f Cd-treated mouse. Journal of Toxicological Sciences 21, 19-27.
Kasuya, T. 1995. Overview of cetacean life histories: an essay in their evolution. In
Whales, seals, fish and man. Elsevier Science B. V., New York.
178
Kelly, J. F. 2000. Stable isotopes of carbon and nitrogen in the study of avian and
mammalian trophic ecology. Canadian Journal of Zoology 78, 1-27.
179
Khan, S., Cleveland, R. P., Koch, C. J. & Schelling, J. R. 1999. Hypoxia induces renal
tubular epithelial cell apoptosis in chronic renal disease. Laboratory Investigation
79, 1089-1099.
Koeman, J. H., Peeters, W. H. M. & Koudstaal-Hol, C. H. M. 1973. Mercury-selenium
correlations in marine mammals. Nature 245, 385-386.
Kunito T., Watanabe I., Yasunaga G., Fujise Y. & Tanabe S. 2002. Using trace elements
in skin to discriminate the populations of minke whales in southern hemisphere.
Marine Environmental Research 53, 175-197.
Le Boeuf, B. J., Perez-Cortes, M. H., Urban-Ramirez, J., Mate, B. & Ollervides, F. 2000.
High gray whale mortality and low recruitment in 1999: potential causes and
implications. Journal o f Cetacean Research and Management 2, 85-99.
Leccia, M. T., Richard, M. J., Beani, J. C., Faure, H., Monjo, A. M., Cadet, J., Amblard
& P., Favier, A. 1993. Protective effect of selenium and zinc on UV-A damage in
human skin fibroblasts. Photochemistry and Photobiology 58, 548-553.
Lesage, V., Hammill, M. O. & Kovacs, K. M. 2001. Marine mammals and the
community structure o f the Estuary and Gulf o f St. Lawrence, Canada: evidence
from stable isotope analysis. Marine Ecology Progress Series 210, 203-221.
Lowry, L. F. 1993. Foods and Feeding Ecology. In Bums, J. J., Montague, J. J., Cowles,
C. J. The bowhead whale. The Society for Marine Mammalogy. Special
Publication Number 2.
Lowry, L. F. and Sheffield, G. 2002. Stomach contents o f bowhead whales harvested in
the Alaskan Beaufort Sea. In Richardson, W. J. and Thompson, D. H. Bowhead
whale feeding in the Eastern Alaskan Beaufort Sea: Update of scientific and
traditional information. Vol. 1. OCS Study MMS 2002-012. LDL Report
TA2196-7. LGL Ltd. King City, Ontario, Canada.
Macdonald, C. R. and Sprague, J. B. 1988. Cadmium in the marine invertebrate and
arctic cod in the Canadian Arctic. Distribution and ecological implications.
Marine Ecology Progress Series 47, 17-30.
Mackey, E. A., Becker, P. R., Demiralp, R., Greenberg, R. R., Koster, B. J. & Wise , S.
A. 1996. Bioaccumulation of vanadium and other trace metals in livers of Alaskan
cetaceans and pinnipeds. The Archives o f Environmental Contamination and
Toxicology 30, 503-512.
180
Mackey, E. A., Demiralp, R., Becker, P. R., Greenberg, R. R., Koster, B. J. & Wise, S. A.
1995. Trace element concentrations in cetacean liver tissues archived in the
National Marine Mammal Tissue Bank. The Science o f the Total Environment
175,25-41.
Mackey, E. A., Oflaz, R. D., Epstein, M. S., Buehler, B., Porter, B. J., Rowles, T., Wise,
S. A. & Becker, P. R. 2003. Elemental composition o f liver and kidney tissues of
rough-toothed dolphins (Steno bredanensis). Archives of Environmental
Contamination and Toxicology 44, 523-532.
Martin, J. H. and Flegal, A. R. 1975. High copper concentrations in squid livers in
association with elevated levels of silver, cadmium, and zinc. Marine Biology 30,
51-55.
Martin, A. R., Smith, T. G. & Cox, O. P. 1998. Dive form and function in belugas
(Delphinapterus leucas) o f the Canadian high arctic. Polar Biology 20, 218-228.
Martin, A. R. and Smith, T. G. 1999. Strategy and capability o f wild belugas,
Delphinapterus leucas, during deep, benthic diving. Canadian Journal of Zoology
77, 1783-1793.
181
Martineau, D., Mikaelian, I., Lapointe, J.-M., Labelle, P. & Higgins, R. 2003. Pathology
of cetaceans. A case study: Beluga from the St. Lawrence estuary. In Vos, J. G.,
Bossart, G. D., Fournier, M., O ’Shea, T. J. Toxicology o f Marine Mammals.
Taylor & Francis, London.
Mendez, L., Alvarez-Castaneda, S. T., Acosta, B. & Sierra-Beltran, A. P. 2002. Trace
metals in tissues of gray whale (Eschrichtius robustus) carcasses from the
Northern Pacific Mexican Coast. Marine Pollution Bulletin 44, 217-221.
Moore, S. E. and Reeves, R. R. 1993. Distribution and Movement. In Bums, J. J.,
Montague, J. J., Cowles, C. J. The bowhead whale. The Society for Marine
Mammalogy. Special Publication Number 2.
Nigro, M., Campana, A., Lanzillotta, E. & Ferrara, R. 2002. Mercury exposure and
elimination rates in captive bottlenose dolphins. Marine Pollution Bulletin 44,
1071-1075.
O'Corry-Crowe, G. M., Suydam, R. S., Rosenberg, A., Frost, K. J. & Dizon, A. E. 1997.
Phylogeography, population structure and dispersal patterns of the beluga whale
Delphinapterus leucas in the western Nearctic revealed by mitochondrial DNA.
Molecular Ecology 6 , 955-970.
182
Oliver, J. S., Slattery, P. N., Silberstein, M. A. & O'Connor, E. F. 1983. A comparison of
gray whale, Eschrichtius robustus, feeding in the Bering Sea and Baja California.
Fishery Bulletin 81, 513-522.
Olsson, U. 1985. Impaired ketone body metabolism in the selenium deficient rat. Possible
implications. Metabolism 34, 933-938.
Paludan-Miiller, P., Agger, C. T., Dietz, R. & Kinze, C. C. 1993. Mercury, cadmium,
zinc, copper and selenium in harbour porpoise (Phocoena phocoena) from West
Greenland. Polar Biology 13, 311-320.
Ponce, R. A., Egeland, G. M., Middaugh, J. P. & Becker, P. R. 1997. Twenty years of
trace metal analyses o f marine mammals: Evaluation and Summation o f data from
Alaska and other Arctic regions. State of Alaska Epidemiology Bulletin 1, 1-15.
Presley, B. J. 1997. A review of Arctic trace metal data with implications for biological
effects. Marine Pollution Bulletin 35, 226-234.
Puls, R. 1994. Mineral levels in animal health. Diagnostic data. Sherpa International,
Clearbrook, British Columbia, Canada. 356 pp.
183
Ratte, H. T. 1999. Bioaccumulation and toxicity of silver compounds: A review.
Environmental Toxicology and Chemistry 18, 89-108.
Rice, D. W. and Wolman, A. A. 1971. The life history and ecology of the gray whale
(Eschrichtius robustus). The American Society o f Mammalogists Special
Publication No. 3.
Richard, P., Weaver, P., Dueck, L. & Barber, D. 1994. Distribution and numbers of
Canadian High Arctic narwhals (Monodon monoceros) in August 1984.
Meddelelser om Gronland, Bioscience 39, 41-50.
Rostan, E. F., DeBuys, H. V., Madey, D. L. & Pinnell, S. R. 2002. Evidence supporting
zinc as an important antioxidant for skin. International Journal o f Dermatology
41,606-611.
Rouleau, C., Gobeil, C. & Tjalve, H. 2000. Accumulation o f silver from the diet in two
marine benthic predators: the snow crab (Chionoecetes opilio) and American
plaice (Hippoglossoides platessoides). Environmental Toxicology and Chemistry
9, 631-637.
184
Ruelas-Inzunza, J. and Paez-Osuna, F. 2002. Distribution of Cd, Cu, Fe, Mn, Pb and Zn
in selected tissues of juvenile whales stranded in the SE Gulf o f California
(Mexico). Environment International 28, 325-329.
Ruelas-Inzunza, J. R., Horvat, M., Perez-Cortes, H. & Paez-Osuna, F. 2003.
Methylmercury and total mercury in tissues o f gray whales (Eschrichtius
robustus) and spinner dolphins (Stenella longirostris) stranded along the lower
Gulf o f California, Mexico. Ciencias Marinas 29, 1-8.
Saeki, K., Nakajima, M., Loughlin, T. R., Calkins, D. C., Baba, N., Kiyota, M. &
Tatsukawa, R. 2001. Accumulation of silver in the liver o f three species of
pinnipeds. Environmental Pollution 112, 19-25.
Schell, D. M., Saupe, S. M. & Haubenstock, N. 1989. Bowhead whale (Balaena
mysticetus) growth and feeding as estimated by dl3C techniques. Marine Biology
103, 433-443.
Schell, D. M., Barnett, B. A. & Vinette, K. A. 1998. Carbon and nitrogen isotope ratios in
zooplankton o f the Bering, Chukchi and Beaufort seas. Marine Ecology Progress
Series 162, 11-23.
185
Seaman, G. A., Lowry, L. F. & Frost, K. J. 1982. Foods o f belukha whales
(Delphinapterus leucas) in Western Alaska. Cetology 44, 1-19.
Sergeant, D. E. and Brodie, P. F. 1969. Body size in white whales, Delphinapterus
leucas. Journal o f the Fisheries Research Board o f Canada 26, 2561-2580.
Sergeant, D. E. 1973. Biology o f white whales (Delphinapterus leucas) in Western
Hudson Bay. Journal of the Fisheries Research Board of Canada 30, 1065-1090.
Sheffield, G., Fay, F. H., Feder, H. & Kelly, B. P. 2001. Laboratory digestion of prey and
interpretation of walrus stomach contents. Marine Mammal Science 17, 310-330.
Sigurjonsson, J., Galan, A. & Vikingsson, G. A. 2000. A note on stomach contents of
minke whales (Balaenoptera acutorostrata) in Icelandic waters. In Vikingsson, G.
A., Kapel, F. O. Minke whales, harp and hooded seals: major predators in the
North Atlantic ecosystem. NAMMCO Scientific Publications 2, Tromso.
Smith, R. J., Hobson, K. A., Koopman, H. N. & Lavigne, D. M. 1996. Distinguishing
between populations of fresh-and saltwater harbour seals (Phoca vitulina) using
stable-isotope ratios and fatty acid profiles. Canadian Journal o f Fisheries and
Aquatic Science 53, 272-279.
r
186
t
Tamura, T. and Ohsumi, S. 2000. Regional assessments o f prey consumption by marine
cetaceans in the world. Report to the Scientific Committee of the International
Whaling Commission. SC/52/E6. Adelaide, Australia.
Tarpley, R. J., Wade, T. L. & Haubold, E. M. 1995. Toxicological studies in tissues of
the beluga whale Delphinapterus leucas along northern Alaska with an emphasis
on public health implications o f subsistence utilization. Final report to the Alaska
Beluga Whale Committee. North Slope Borough, Department of Wildlife
Management. Barrow, Alaska.
Thompson, D. H. 2002. Energetics of bowhead whales. In Richardson, W. J. and
Thompson, D. H. Bowhead whale feeding in the Eastern Alaskan Beaufort Sea:
Update of scientific and traditional information. Vol. 1. OCS Study MMS 2002-
012. LDL Report TA2196-7. LGL Ltd. King City, Ontario, Canada.
Tieszen, L. L., Boutton, T. W., Tesdahl, K. G. & Slade, N. A. 1983. Fractionation and
turnover o f stable carbon isotopes in animal tissues: Implications for 513C analysis
o f diet. Oecologia 57, 32-37.
Tilbury, K. L., Stein, J. E., Krone, C. A., Brownell, R. L., Blokhin, S. A., Bolton, J. L. &
Ernest, D. W. 2002. Chemical contaminants in juvenile gray whales
187
(Eschrichtius robustus) from subsistence harvest in Arctic feeding grounds.
Chemosphere 47, 555-564.
US Environmental Protection Agency. 1992. Methods for the determination of metals in
environmental samples. CRC Press, Boca Raton.
Varanasi, U., Stein, J. E., Tilbury, K. L., Meador, J. P., Sloan, C. A., Clark, R. C. &
Chan, S.-L. 1994. Chemical contaminants in gray whales (Eschrichtius robustus)
stranded along the west coast of North America. The Science o f the Total
Environment 145, 29-53.
Wagemann, R., Stewart, R. E. A., Lockhart, W. L., Stewart, B. E. & Povoledo, M. 1988.
Trace metals and methyl mercury: associations and transfer in harp seal (Phoca
groenlandica) mothers and their pups. Marine Mammal Science 4, 339-355.
Wagemann, R., Stewart, R. E. A., Beland, P. & Desjardins, C. 1990. Heavy metals and
selenium in tissues of beluga whales, Delphinapterus leucas, from the Canadian
Arctic and the St. Lawrence estuary. Canadian Bulletin o f Fisheries and Aquatic
Science 224, 191-206.

Wagemann, R., Innes, S. & Richard, P. 1996. Overview and regional and temporal
differences of heavy metals in Arctic whales and ringed seals in the Canadian
Arctic. The Science of the Total Environment 186, 41-66.
Wagemann, R., Trebacz, E., Hunt, R. & Boila, G. 1997. Percent methylmercury and
organic mercury in tissues of marine mammals and fish using different
experimental and calculation methods. Environmental Toxicology and Chemistry
16, 1859-1866.
Wagemann, R, Trebacz, E, Boila, G & Lockhart, WL. 2000. Mercury species in the liver
o f ringed seals. Sci Total Environ; 261: 21-32.
Watanabe, I., Kunito, T., Tanabe, S., Amano, M., Koyama, Y., Miyazaki, N., Petrov, E.
A. & Tatsukawa, R. 2002. Accumulation of heavy metals in Caspian seals (Phoca
caspica). Archives o f Environmental Contamination and Toxicology 43, 109-120.
Whanger, P.D. 2001. Selenium and the brain. Nutritional Neuroscience 4, 81-97.
Wise, S. A., Schantz, M. M., Koster, B. J., Demiralp, R., Mackey, E. A., Greenberg, R.
R., Burow, M., Ostapczuk, P. & Lillestolen, T. I. 1993. Development of frozen
189
whale blubber and liver reference materials for the measurement o f organic and
inorganic contaminants. Fresenius Journal of Analytical Chemistry 345, 270-277.
Woshner, V. M., O'Hara, T. M., Bratton, G. R., Suydam, R. S. & Beasley, V. R. 2001a.
Concentrations and interactions o f selected essential and non-essential elements in
bowhead and beluga whales of Arctic Alaska. Journal o f Wildlife Diseases 37,
693-710.
Woshner, V. M., O'Hara, T. M., Bratton, G. R. & Beasley, V. R. 2001b. Concentrations
and interactions of selected essential and non-essential elements in ringed seals
and polar bears o f Arctic Alaska. Journal of Wildlife Diseases 37, 711-721.
Yang, J., Hunito, T., Anan, Y., Tanabe, S. & Miyazaki, N. 2004. Total and subcellular
distribution o f trace elements in the liver of a mother-fetus pair of Dali's porpoises
(Phocoenoides dalli). Marine Pollution Bulletin 48, 1122-1129.
190
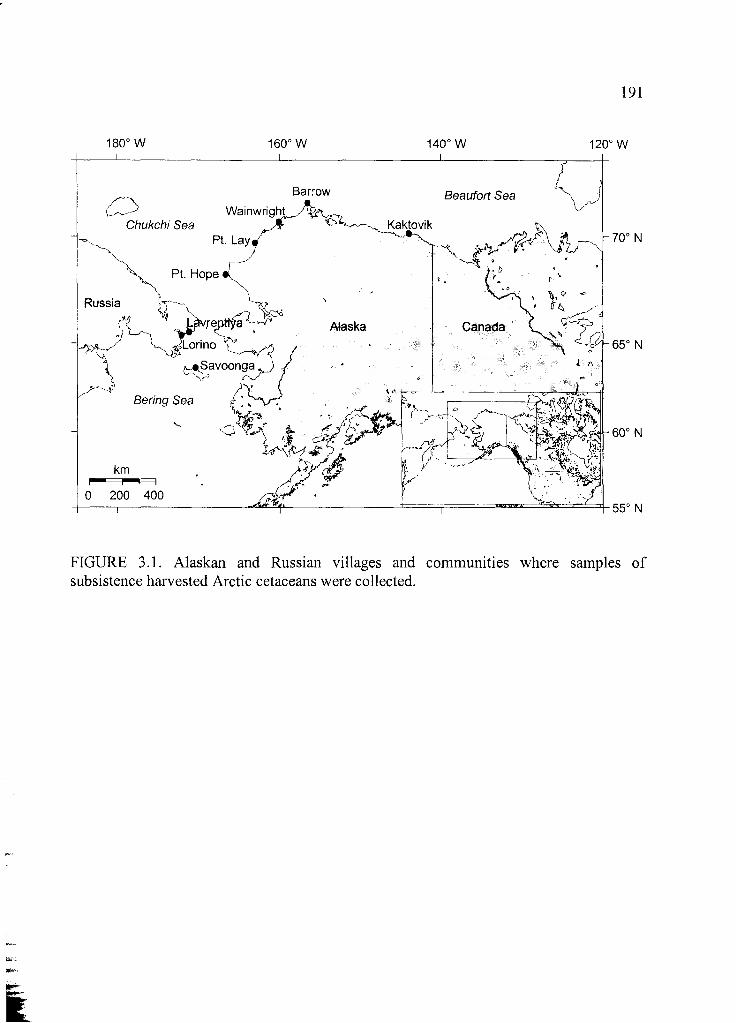
191
180° W 160° W 120° W
-70° N
-65° N
-60° N
55° N
FIGURE 3.1. Alaskan and Russian villages and communities where samples of subsistence harvested Arctic cetaceans were collected.
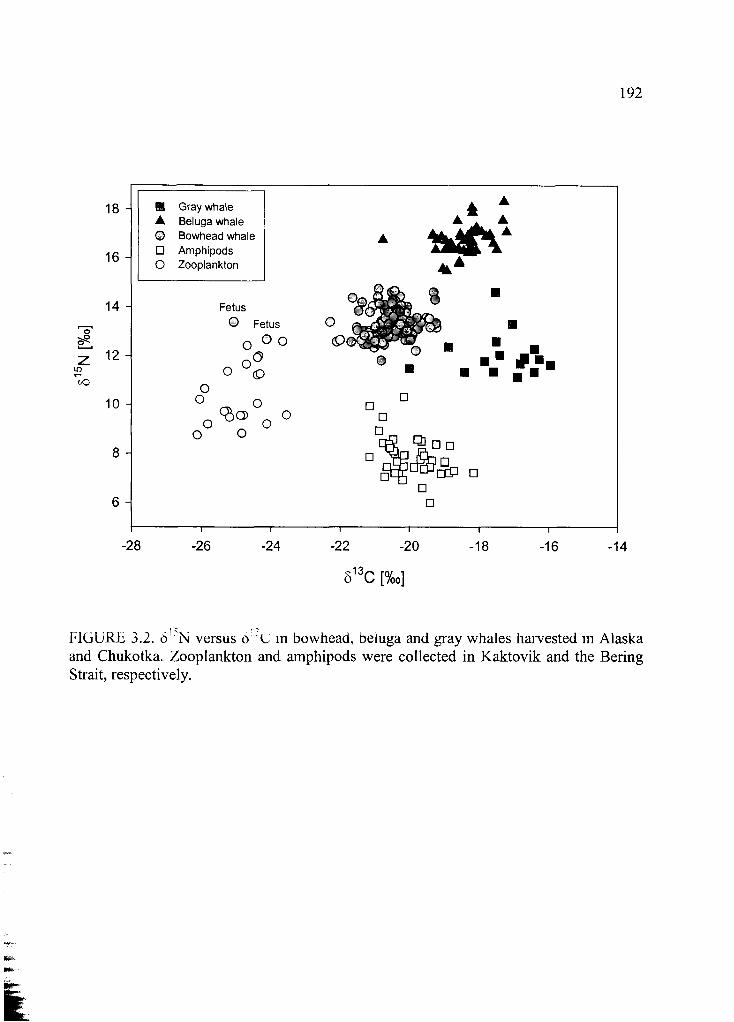
192
18
16
14
O’' - P
z 12in
10
8
6
-28 -26 -24 -22 -20 -18 -16 -14
813C [%o]
FIGURE 3.2. 6 'N versus o X in bowhead, beluga and gray whales harvested in Alaska and Chukotka. Zooplankton and amphipods were collected in Kaktovik and the Bering Strait, respectively.
■ Gray whale A Beluga whale O Bowhead whale □ Amphipods O Zooplankton
Fetus © Fetus
O ° °
C ° Sooo ^ ° o 0 o o
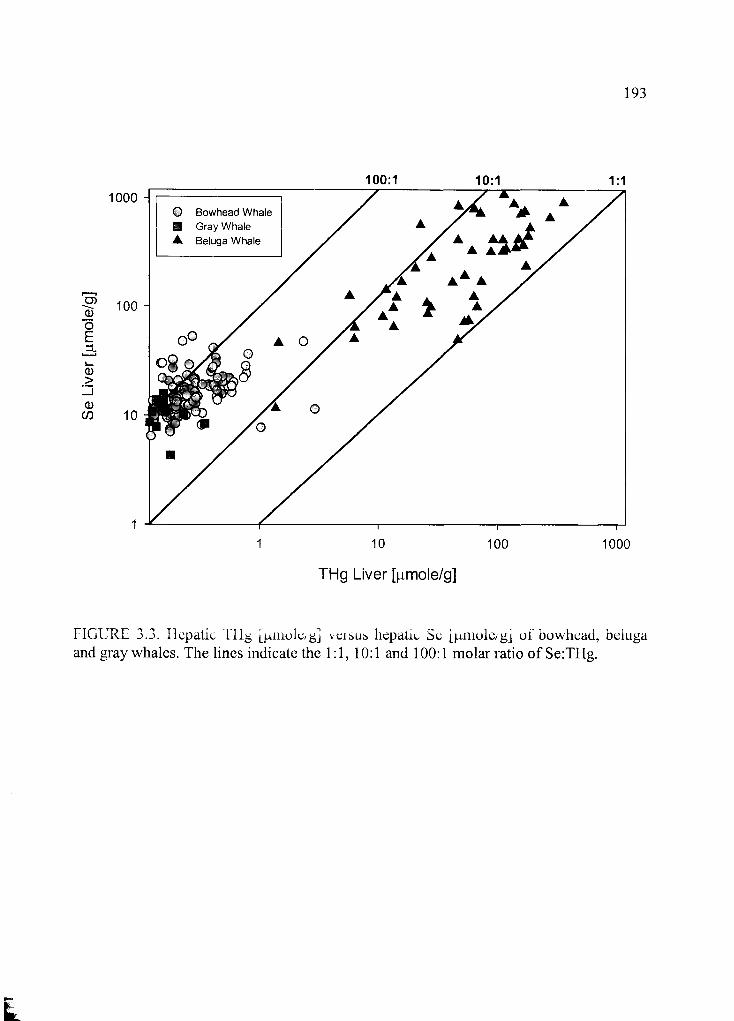
Se
Live
r [^
imol
e/g]
100:1 10:1 1:1
THg Liver [(imole/g]
FIGURE 3.3. Hepatic TIIg vei&us hepatic Se [p.mole/g] of bowhead, belugaand gray whales. The lines indicate the 1:1, 10:1 and 100:1 molar ratio ofSe:THg.
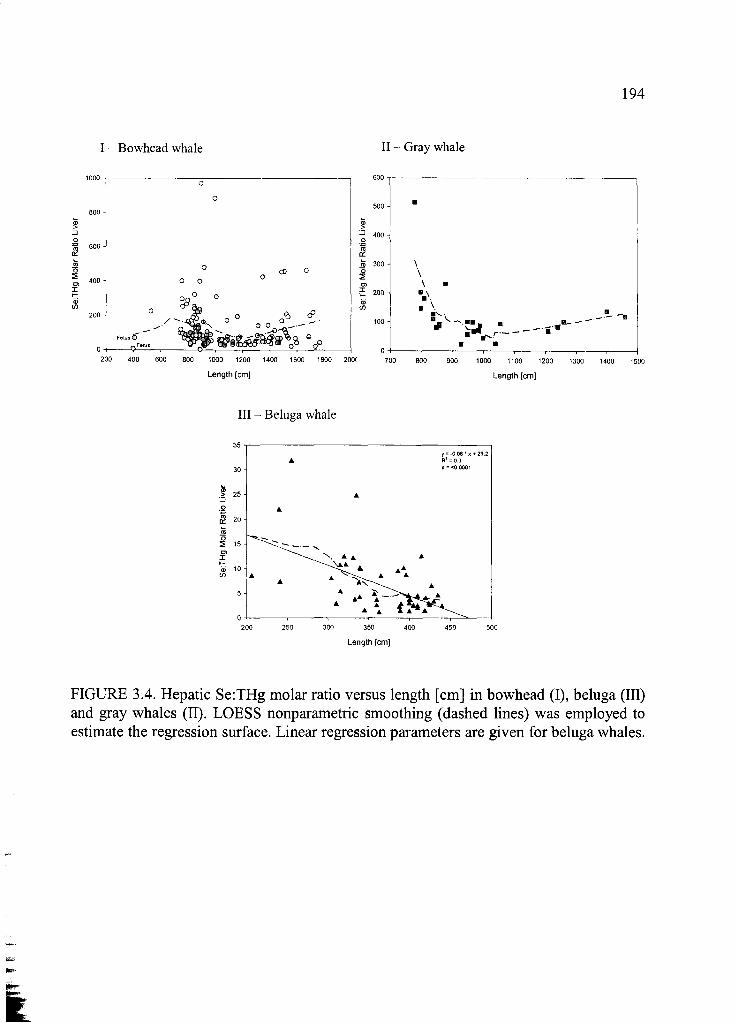
I - Bowhead whale II - Gray whale
Length [cm] Length [cm]
III - Beluga whale
Length [cm]
FIGURE 3.4. Hepatic Se:THg molar ratio versus length [cm] in bowhead (I), beluga (III) and gray whales (II). LOESS nonparametric smoothing (dashed lines) was employed to estimate the regression surface. Linear regression parameters are given for beluga whales.
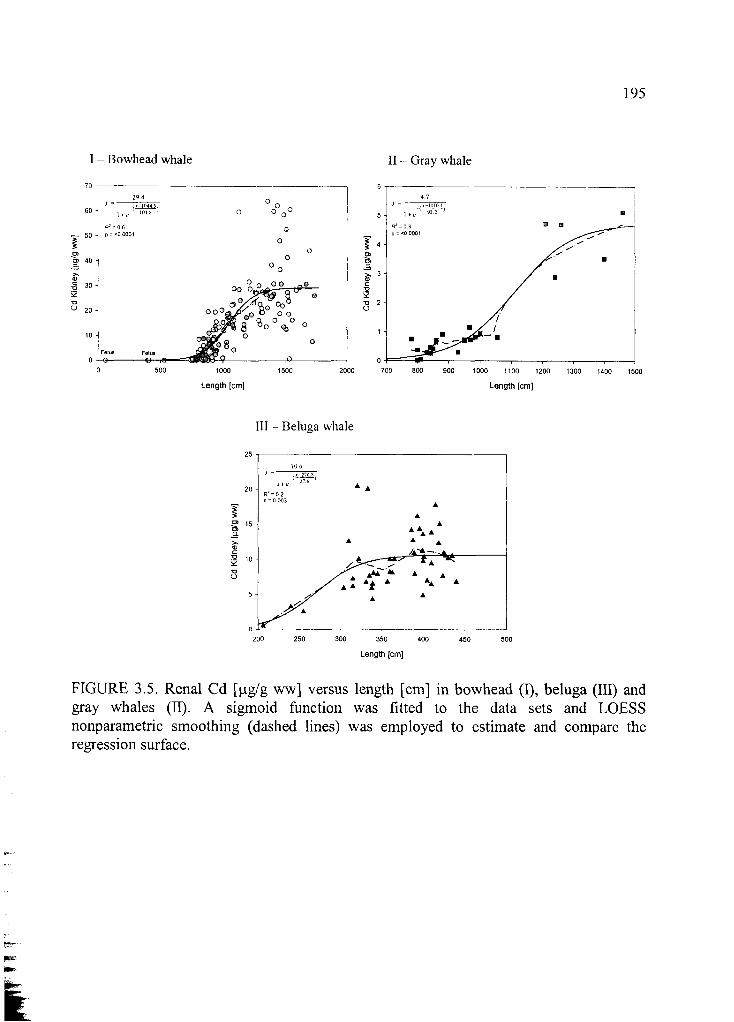
195
I - Bowhead whale II - Gray whale
Length [cm] Length [cm]
III - Beluga whale
Length [cm]
FIGURE 3.5. Renal Cd [)_ig/g ww] versus length [cm] in bowhead (I), beluga (III) and gray whales (II). A sigmoid function was fitted to the data sets and LOESS nonparametric smoothing (dashed lines) was employed to estimate and compare the regression surface.
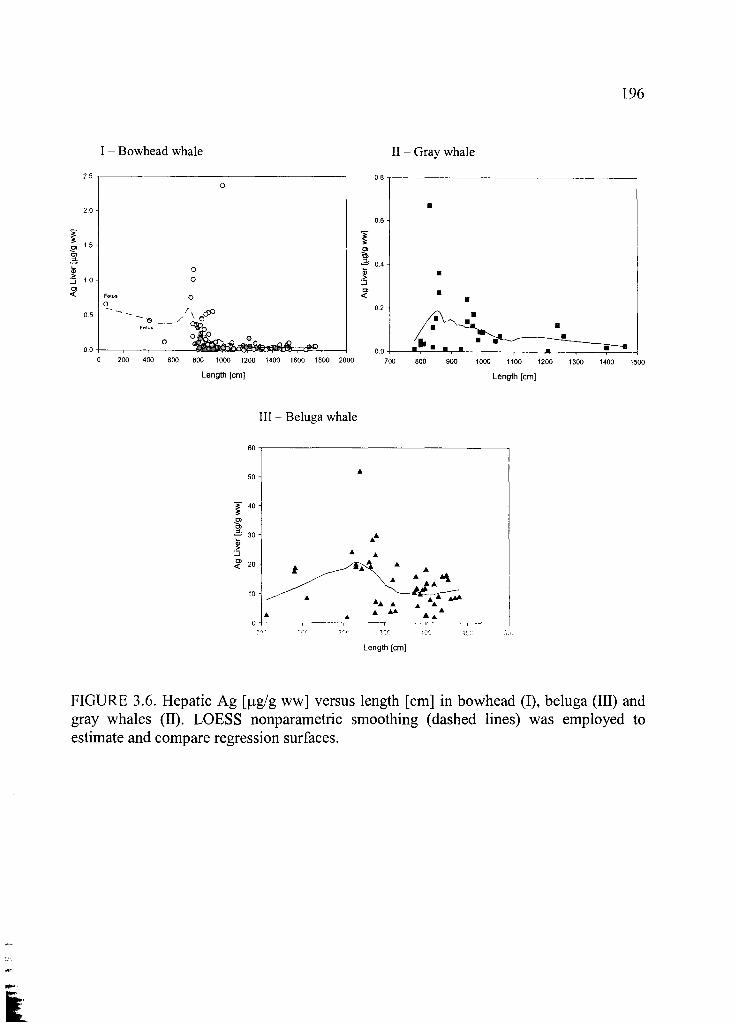
I - Bowhead whale II - Gray whale
Length [cm] Length [cm]
III - Beluga whale
Length [cm]
FIGURE 3.6. Hepatic Ag [jag/g ww] versus length [cm] in bowhead (I), beluga (III) and gray whales (II). LOESS nonparametric smoothing (dashed lines) was employed to estimate and compare regression surfaces.
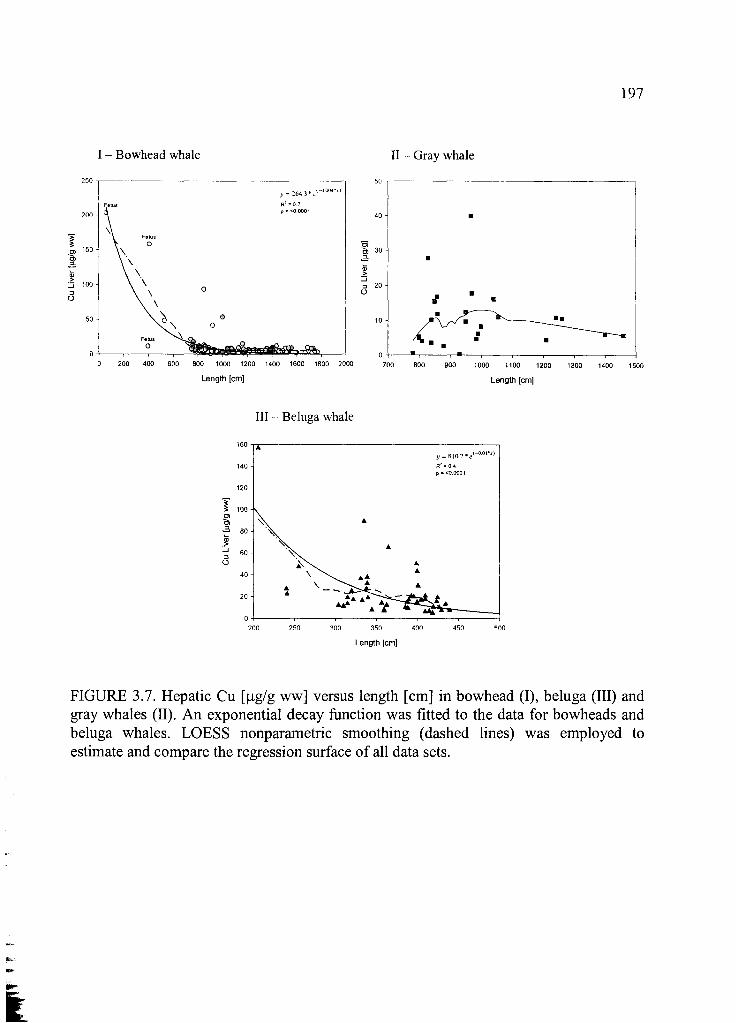
I - Bowhead whale II - Gray whale
Length [cm] Length [cm]
III - Beluga whale
Length [cm]
FIGURE 3.7. Hepatic Cu [|Lxg/g ww] versus length [cm] in bowhead (I), beluga (III) and gray whales (II). An exponential decay function was fitted to the data for bowheads and beluga whales. LOESS nonparametric smoothing (dashed lines) was employed to estimate and compare the regression surface of all data sets.
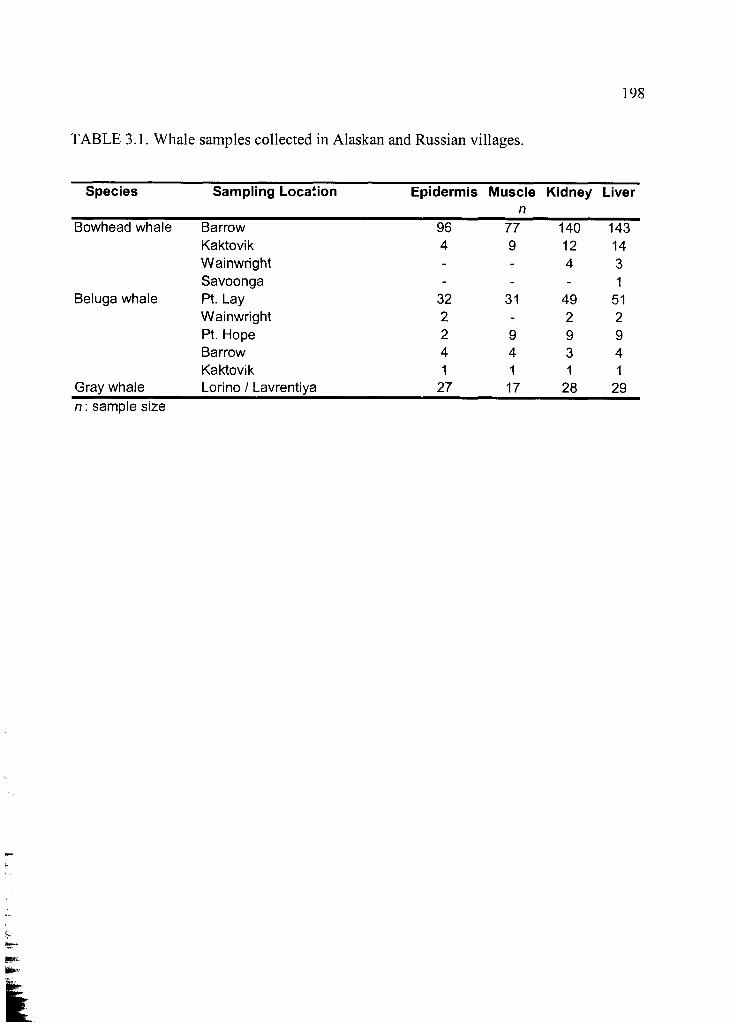
198
TABLE 3.1. Whale samples collected in Alaskan and Russian villages.
Species Sampling Location Epidermis Musclen
Kidney Liver
Bowhead whale Barrow 96 77 140 143Kaktovik 4 9 12 14Wainwright - - 4 3Savoonga - - - 1
Beluga whale Pt. Lay 32 31 49 51Wainwright 2 - 2 2Pt. Hope 2 9 9 9Barrow 4 4 3 4Kaktovik 1 1 1 1
Gray whale Lorino / Lavrentiya 27 17 28 29n: sample size
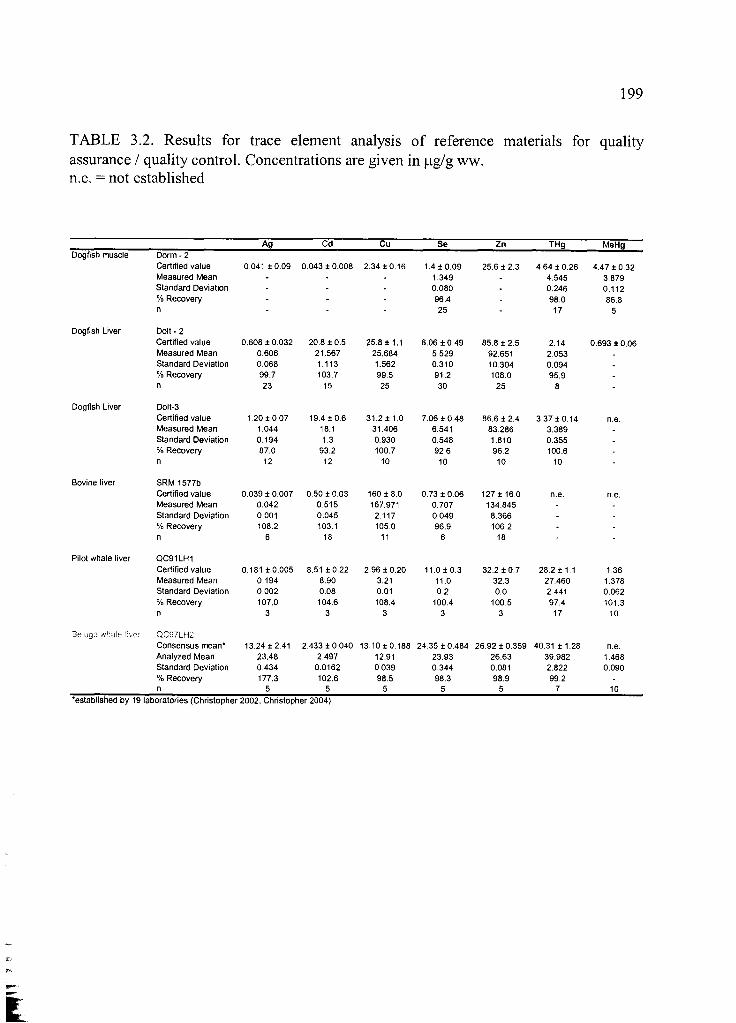
TABLE 3.2. Results for trace element analysis of reference materials for quality assurance / quality control. Concentrations are given in |ag/g ww. n.e. = not established
Ag Cd Cu Se Zn THg MeHgDogfish muscle Dorm - 2
Certified value 0.041 ±0 .09 0.043 ± 0.008 2.34 ± 0.16 1.4 ± 0 .0 9 25.6 ± 2 .3 4.64 ±0 .26 4.47 ±0 .32Measured Mean - - - 1.349 . 4.545 3.879Standard Deviation - - - 0.080 - 0.246 0,112% Recovery - - - 96.4 - 98.0 86.8n - - - 25 - 17 5
Dogfish Liver Dolt - 2Certified value 0,608 ±0 .032 20.8 ± 0 .5 25.8 ±1.1 6,06 ± 0 .4 9 85.8 ± 2.5 2.14 0.693 ±0 .06Measured Mean 0.606 21.567 25.684 5.529 92.651 2.053 .
Standard Deviation 0.068 1.113 1.562 0.310 10.304 0.094 .
% Recovery 99.7 103.7 99.5 91.2 108.0 95.9 .n 23 15 25 30 25 8 -
Dogfish Liver Dolt-3Certified value 1.20 ±0 .07 19.4 ±0 .6 3 1 .2 ± 1.0 7.06 ±0 .48 86.6 ± 2 .4 3.37 ±0 .14 n.e.M easured Mean 1.044 18.1 31.406 6.541 83.286 3.389 .
Standard Deviation 0.194 1.3 0.930 0.548 1.810 0.355 .
% Recovery 87.0 93.2 100.7 92.6 96.2 100.6 -n 12 12 10 10 10 10 -
Bovine liver SRM 1577b Certified value 0.039 ± 0.007 0.50 ±0 .03 160 ± 8 .0 0.73 ± 0 .0 6 127 ± 16.0 n.e. n.e.M easured Mean 0.042 0.515 167.971 0.707 134.845 - .
Standard Deviation 0.001 0.045 2.117 0.049 8.366 - .
% Recovery 108.2 103.1 105.0 96.9 106.2 - -n 6 18 11 6 18
Pilot whale liver QC91LH1 Certified value 0.181 ±0 .005 8.51 ±0 .22 2.96 ±0 .20 11.0 ± 0.3 32.2 ± 0 .7 28.2 ± 1.1 1.36Measured Mean 0.194 8.90 3.21 11.0 32.3 27.460 1.378Standard Deviation 0.002 0.08 0.01 0.2 0.0 2.441 0.062% Recovery 107.0 104.6 108.4 100.4 100.5 97.4 101.3n 3 3 3 3 3 17 10
B e l u g a w h a l e , e : QC97LH2 Consensus mean* 13.24 ±2.41 2.433 ±0 .040 13.10 ± 0.188 24.35 ±0 .484 26.92 ± 0.359 40.31 ± 1.28 n.e.Analyzed Mean 23,48 2.497 12.91 23.93 26.63 39.982 1.468Standard Deviation 0.434 0.0162 0.039 0.344 0.081 2.822 0.090% Recovery 177.3 102.6 98.5 98.3 98.9 99.2 -
n 5 5 5 5 5 7 10•established by 19 laboratories (Christopher 2002, Christopher 2004)
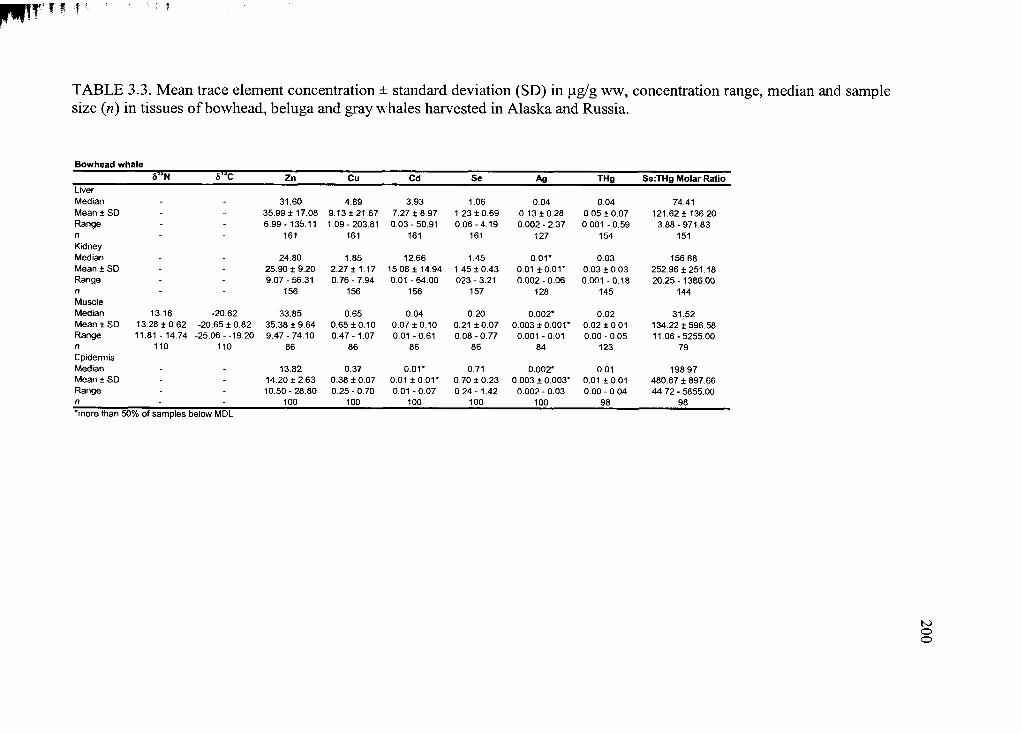
TABLE 3.3. Mean trace element concentration ± standard deviation (SD) in j_ig/g ww, concentration range, median and sample size (n) in tissues o f bowhead, beluga and gray whales harvested in Alaska and Russia.
Bowhead whale5 'aN 5 “ C Z n Cu Cd Se A g TH g S e :T H g M o la r R a tio
L ive rM edian . . 31.60 4.89 3.93 1.06 0.04 0.04 74.41M ean ± SD - - 35.99 ± 17.08 9.13 ± 2 1 .6 7 7.27 ± 8 .9 7 1.23 ± 0 .6 9 0.13 ± 0 .2 8 0.05 ± 0 .0 7 121.62 ± 1 3 6 .2 0R ange - - 6 .9 9 - 135.11 1 .0 9 -2 0 3 .8 1 0 .0 3 -5 0 .9 1 0 .0 6 -4 .1 9 0 .0 0 2 -2 .3 7 0.001 -0 .5 9 3 .8 8 -9 7 1 .8 3n - - 161 161 161 161 127 154 151K idneyM edian . . 24.80 1.85 12.66 1.45 o .o r 0.03 156.68M ean ± SD - - 25.90 ± 9.20 2 .27 ± 1.17 15.08 ± 14.94 1.45 ± 0 .4 3 0.01 ± 0 .0 1 * 0.03 ± 0 .0 3 252 .96 ± 2 5 1 .1 8R ange - - 9 .0 7 -5 6 .3 1 0.76 - 7.94 0.01 - 64.00 023 - 3.21 0.Q02 - 0 .06 0 .0 0 1 -0 .1 8 2 0 .2 5 -1 3 8 6 .0 0n - - 156 156 156 157 128 145 144M uscleM edian 13.16 -20.62 33.85 0.65 0.04 0.20 0.002* 0.02 31.52M ean ± SD 13.28 ± 0.62 -20 .65 ± 0.82 35.38 ± 9.64 0.65 ± 0 .1 0 0.07 ± 0 .1 0 0.21 ± 0 .0 7 0.003 ± 0 .0 0 1 * 0.02 ± 0 .0 1 134.22 ± 5 9 6 .5 8R ange 11.81 - 14.74 -25.06 --1 9 .2 0 9.47 - 74.10 0 .4 7 -1 .0 7 0.01 -0 .6 1 0 .0 8 -0 .7 7 0.001 -0 .0 1 0.00 - 0 .05 1 1 .0 6 -5 2 5 5 .0 0n 110 110 86 86 86 86 84 123 79Ep iderm isM edian . . 13.82 0.37 o .o r 0.71 0.002* 0.01 198.97M ean ± SD - - 14.20 ± 2 .6 3 0.38 ± 0.07 0.01 ± 0 .0 1 * 0.70 ± 0 .2 3 0.003 ± 0.003* 0.01 ± 0 .0 1 480 .87 ± 897.66Range - - 1 0 .5 0 -2 8 .8 0 0 .25 - 0.70 0.01 -0 .0 7 0.24 - 1.42 0 .0 0 2 -0 .0 3 0.00 - 0.04 44.72 - 5855.00n - - 100 100 100 100 100 98 98*more than 50% of samples below MDL
200
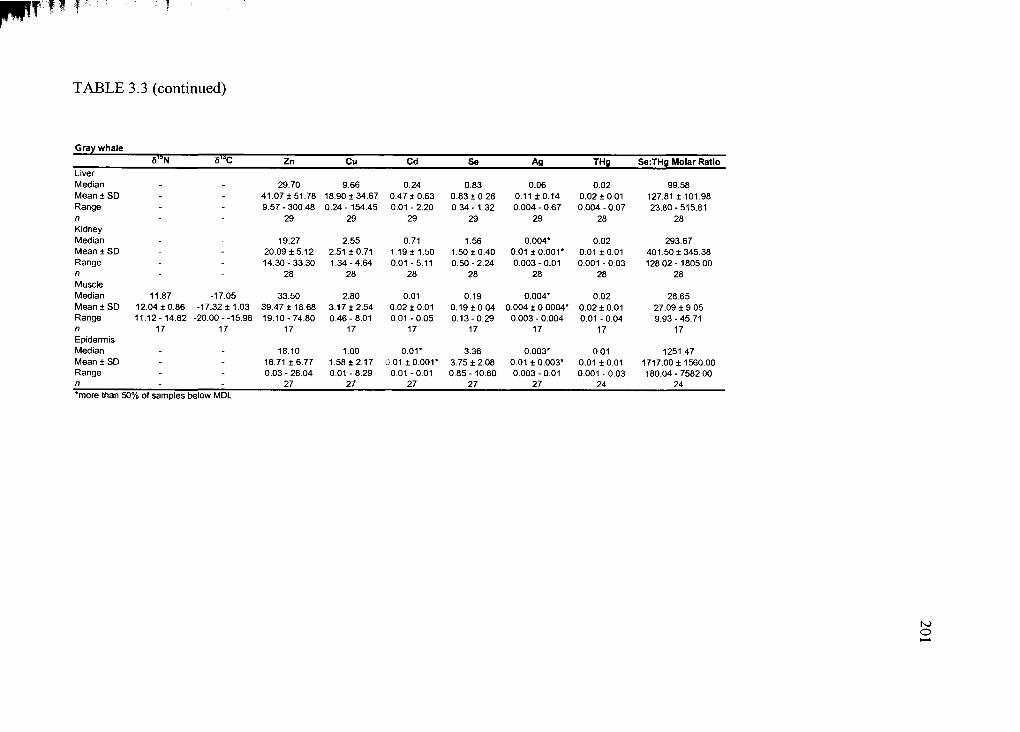
TABLE 3.3 (continued)
Gray whale5iaN 5 1-* C Zn Cu Cd Se Ag THg Se:THg Molar Ratio
LiverMedian 29.70 9.66 0.24 0.83 0.06 0.02 99.58Mean ± SD - - 41.07 ±51.78 18.90 ±34.67 0.47 ±0.63 0.83 ±0.26 0.11 ±0.14 0.02 ±0.01 127.81 ± 101.98Range - - 9.57-300.48 0.24 - 154.45 0.01 - 2.20 0.34-1.32 0.004 - 0.67 0.004 - 0.07 23.80-515.81n - - 29 29 29 29 29 28 28KidneyMedian 19.27 2.55 0.71 1.56 0.004* 0.02 293.67Mean ± SD - - 20.09 ±5.12 2.51 ±0.71 1.19 ± 1.50 1.50 ±0.40 0.01 ±0.001* 0.01 ± 0.01 401.50 1 345.38Range - - 14.30 - 33.30 1.34-4.64 0.01 - 5.11 0.50-2.24 0.003-0.01 0.001 -0.03 128.02-1805.00n - - 28 28 28 28 28 28 28MuscleMedian 11.87 -17.05 33.50 2.80 0.01 0.19 0.004* 0.02 28.65Mean ± SD 12.04 ±0.86 -17.32 ±1.03 39.47 ±18.68 3.17 ±2.54 0.02 ±0.01 0.19 ±0.04 0.004 ± 0.0004* 0.02 ±0.01 27.0919.05Range 11.12-14.62 -20.00--15.96 19.10-74.80 0.46 - 8.01 0.01 - 0.05 0.13-0.29 0.003 - 0.004 0.01 - 0.04 9.93-45.71n 17 17 17 17 17 17 17 17 17EpidermisMedian . 18.10 1.00 0.01* 3.36 0.003* 0.01 1251.47Mean ± SD - - 16.71 ±6.77 1.58 ±2.17 0.01 ±0.001* 3.75 ± 2.08 0.01 ±0.003* 0.01 ±0.01 1717.00 ± 1560.00Range - - 0.03-26.04 0.01 - 8.29 0.01 - 0.01 0.85-10.60 0.003-0.01 0.001 - 0.03 180.04-7582.00n - - 27 27 27 27 27 24 24*more than 50% of samples below MDL
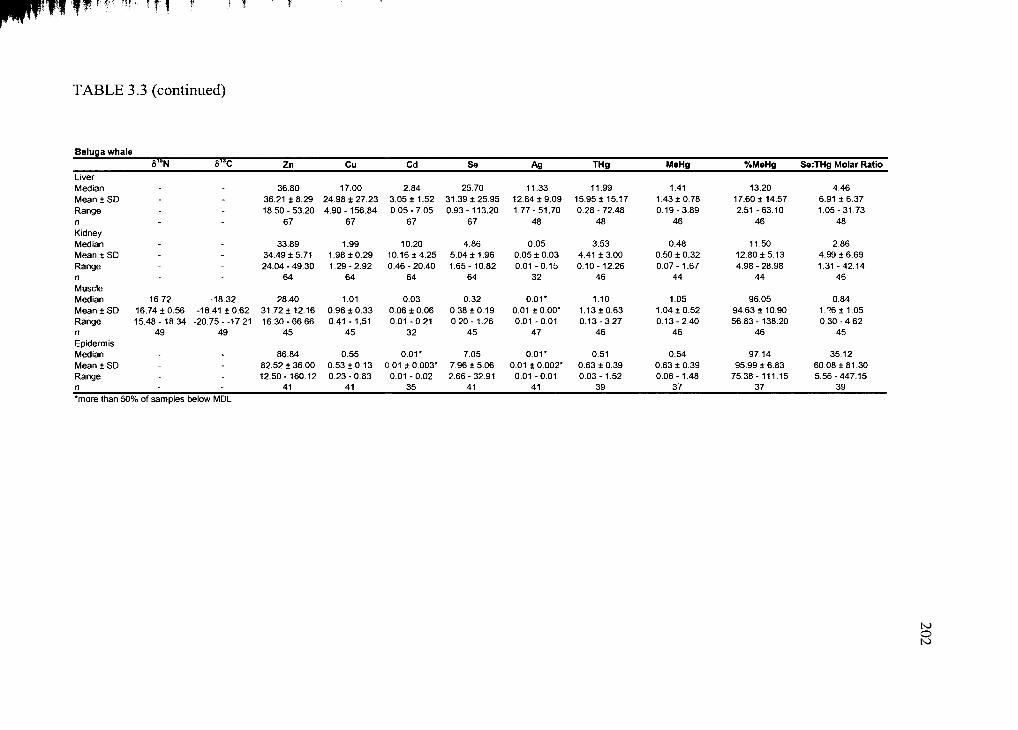
TABLE 3.3 (continued)
Beluga whaleS^N 51JC Zn Cu Cd Se Ag THg MeHg •/.MeHg Se:THg Molar Ratio
LiverMedian 36.80 17.00 2.84 25.70 11.33 11.99 1.41 13.20 4.46Mean ± SD - - 36.21 ± 8.29 24.98 ± 27.23 3.05 ± 1.52 31.39 ±25.95 12.84 ±9.09 15.95 ± 15.17 1.43 ±0.78 17.60 ± 14.57 6.91 ±6.37Range - - 18.50-53.20 4.90-156.84 0.05-7.05 0.93 -113.20 1.77-51.70 0.28 - 72.48 0.19-3.89 2.51 -63.10 1.05-31.73n - - 67 67 67 67 48 48 46 46 48KidneyMedian 33.89 1.99 10.20 4.86 0.05 3.53 0.48 11.50 2.86Mean ± SD - - 34.49 ±5.71 1.98 ±0.29 10.16 ±4.25 5.04 ± 1.96 0.05 ± 0.03 4.41 ± 3.00 0.50 ± 0.32 12.80 ±5.13 4.99 ± 6.69Range - - 24.04 - 49.30 1.29-2.92 0.46 - 20.40 1.65-10.82 0.01 -0.15 0.10-12.26 0.07-1.67 4.98 - 28.98 1.31 -42.14n - - 64 64 64 64 32 46 44 44 46MuscleMedian 16.72 -18.32 28.40 1.01 0.03 0.32 0.01* 1.10 1.05 96.05 0.84Mean ± SD 16.74 ±0.56 -18.41 ±0.62 31.72 ±12.16 0.96 ± 0.33 0.06 ± 0.06 0.38 ±0.19 0.01 ±0.00* 1.13 ± 0.63 1.04 ±0.52 94.63 ± 10.90 1.?6 ± 1.05Range 15.48-18.34 -20.75--17.21 16.30-66.66 0.41 -1.51 0.01 -0.21 0.20-1.26 0.01 -0.01 0.13-3.27 0.13-2.40 56.83 -138.20 0.30-4.62n 49 49 45 45 32 45 47 46 46 46 45EpidermisMedian 86.84 0.55 0.01* 7.05 0.01* 0.51 0.54 97.14 35.12Mean ± SD - - 82.52 ± 36.00 0.53 ±0.13 0.01 ± 0.003* 7.96 ± 5.06 0.01 + 0.002* 0.63 ±0.39 0.63 ± 0.39 95.99 ± 6.83 60.08 ±81.30Range - - 12.50 -160.12 0.23-0.83 0.01 -0.02 2.66 - 32.91 0.01 -0.01 0.03-1.52 0.06-1.48 75.38- 111.15 5.56-447.15n - - 41 41 35 41 41 39 37 37 39*more than 50% of samples below MDL
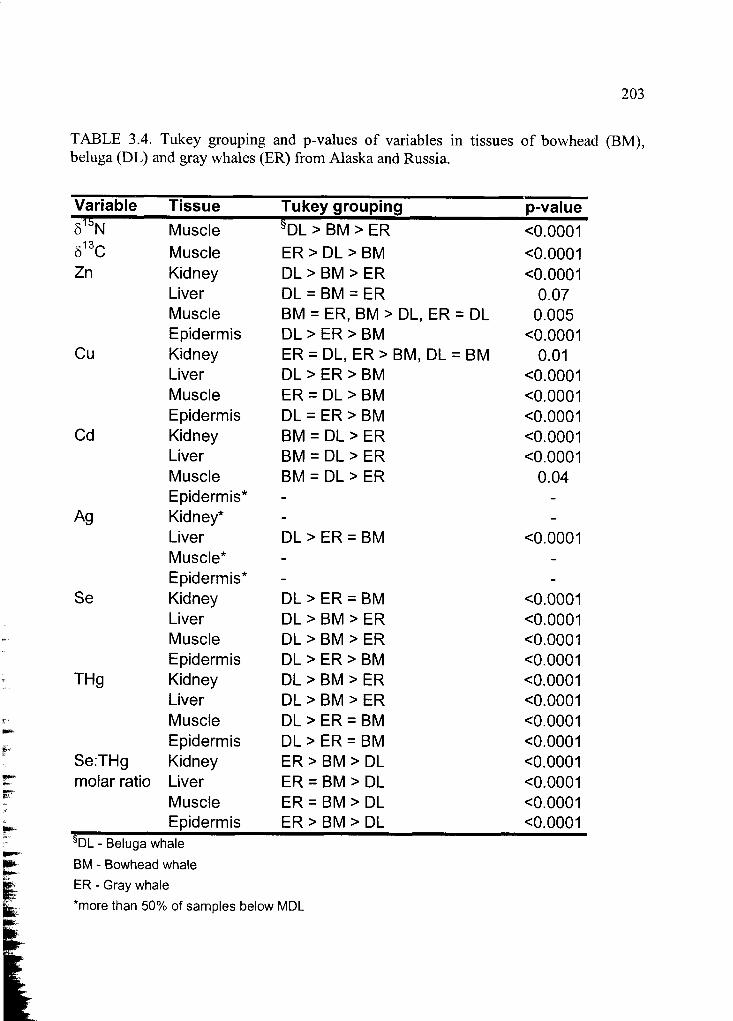
203
TABLE 3.4. Tukey grouping and p-values of variables in tissues o f bowhead (BM), beluga (DL) and gray whales (ER) from Alaska and Russia.
Variable Tissue Tukey grouping p-value51tN Muscle SDL > BM > ER <0.0001513C Muscle ER > D L> BM <0.0001Zn Kidney DL > BM > ER <0.0001
Liver DL = BM = ER 0.07Muscle BM = ER, BM > DL, ER = DL 0.005Epidermis DL > ER > BM <0.0001
Cu Kidney ER = DL, ER > BM, DL = BM 0.01Liver DL > ER > BM <0.0001Muscle ER = DL > BM <0.0001Epidermis DL = ER > BM <0.0001
Cd Kidney BM = DL > ER <0.0001Liver BM = DL > ER <0.0001Muscle BM = DL > ER 0.04Epidermis* - -
Ag Kidney* - -
Liver DL > ER = BM <0.0001Muscle* - -
Epidermis* - -Se Kidney DL > ER = BM <0.0001
Liver DL > BM > ER <0.0001Muscle DL > BM > ER <0.0001Epidermis DL > ER > BM <0.0001
THg Kidney DL > BM > ER <0.0001Liver D L> BM > ER <0.0001Muscle DL > ER = BM <0.0001Epidermis DL > ER = BM <0.0001
Se:THg Kidney ER > BM > DL <0.0001molar ratio Liver ER = BM > DL <0.0001
Muscle ER = BM > DL <0.0001Epidermis ER > BM > DL <0.0001
§DL - Beluga whale
BM - Bowhead whale ER - Gray whale‘more than 50% of samples below MDL
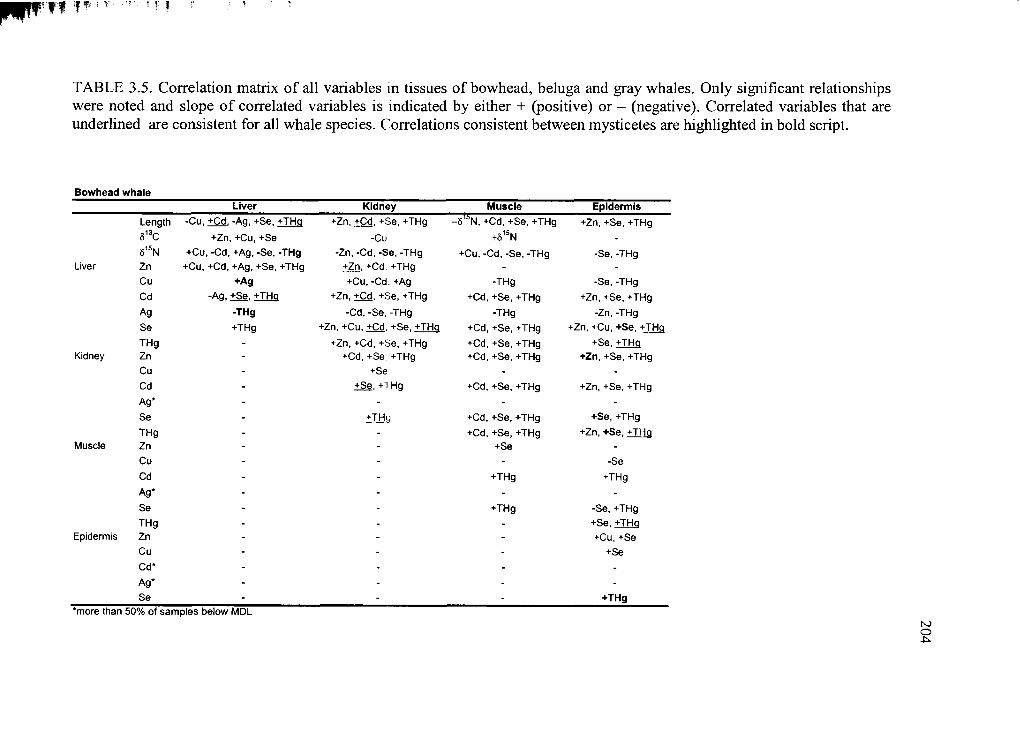
TABLE 3.5. Correlation matrix o f all variables in tissues o f bowhead, beluga and gray whales. Only significant relationships were noted and slope o f correlated variables is indicated by either + (positive) or - (negative). Correlated variables that are underlined are consistent for all whale species. Correlations consistent between mysticetes are highlighted in bold script.
B ow head w h a leLiver Kidney Muscle Epidermis
Length -Cu. +Cd. -Aa. +Se. +THa +Zn, +Cd, +Se, +THg - 8 isN, +Cd, +Se, +THg +Zn, +Se, +THg813C +Zn, +Cu, +Se -Cu +815N -
815N +Cu, -Cd, +Ag, -Se, -THg -Zn, -Cd, -Se, -THg +Cu, -Cd, -Se, -THg -Se, -THgLiver Zn +Cu, +Cd, +Ag, +Se, +THg +Zn. +Cd. +THg - -
Cu +Ag +Cu, -Cd. +Ag -THg -Se, -THg
Cd -Aa. +Se. +THa +Zn, +Cd. +Se, +THg +Cd, +Se, +THg +Zn, +Se, +THg
Ag -THg -Cd, -Se, -THg -THg -Zn, -THg
Se +THg +Zn, +Cu. +Cd. +Se. +THa +Cd, +Se, +THg +Zn. +Cu. +Se. +THa
THg - +Zn, +Cd, +Se, +THg +Cd, +Se, +THg +Se, +THqKidney Zn - +Cd, +Se +THg +Cd, +Se, +THg +Zn, +Se, +THg
Cu - +Se - -
Cd - ±Se. +THg +Cd, +Se, +THg +Zn, +Se, +THg
Ag* - - - -
Se - +THq +Cd, +Se, +THg +Se, +THg
THg - - +Cd, +Se, +THg +Zn. +Se. +THaMuscle Zn - - +Se -
Cu - - - -Se
Cd - - +THg +THg
Ag* - - - -
Se - - +THg -Se, +THg
THg - - - +Se, +THqEpidermis Zn - - - +Cu, +Se
Cu - - - +Se
Cd* - - - -
Ag* - - - -
Se - - - +THg*more than 50% of samples below MDL 204
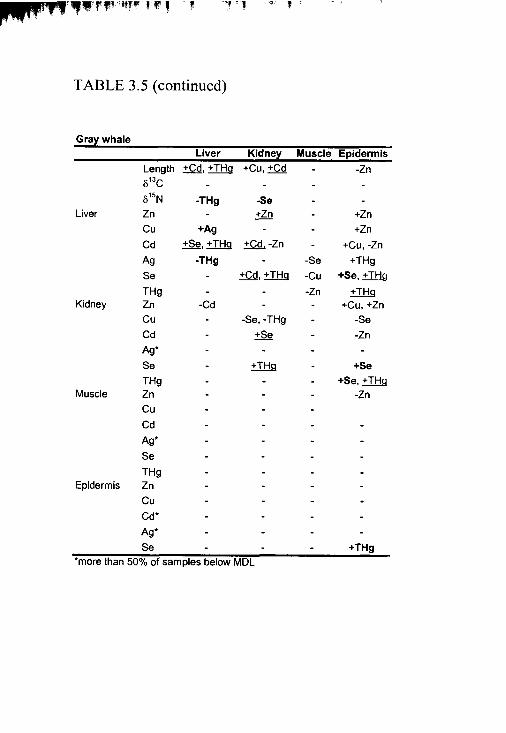
TABLE 3.5 (continued)
Gray whaleLiver Kidney Muscle Epidermis
Length +Cd, +THq +Cu, +Cd - -ZnS13C - - - -6,5N -THg -Se - -
Liver Zn - +Zn - +ZnCu +Ag - - +ZnCd +Se, +THq +Cd. -Zn - +Cu, -ZnAg -THg - -Se +THgSe - +Cd, +THq -Cu +Se, +THqTHg - - -Zn +THq
Kidney Zn -Cd - - +Cu, +ZnCu - -Se, -THg - -SeCd - +Se - -ZnAg* - - - -Se - +THq - +SeTHg - - - +Se. +THq
Muscle Zn - - - -ZnCu - - -Cd - - - -
Ag* - - - -Se - - - -
THg - - - -Epidermis Zn - - - -
Cu - - - -Cd* - - - -Ag* - - - -Se - - - +THg
'm o re than 50% o f sam ples below MDL

b->o
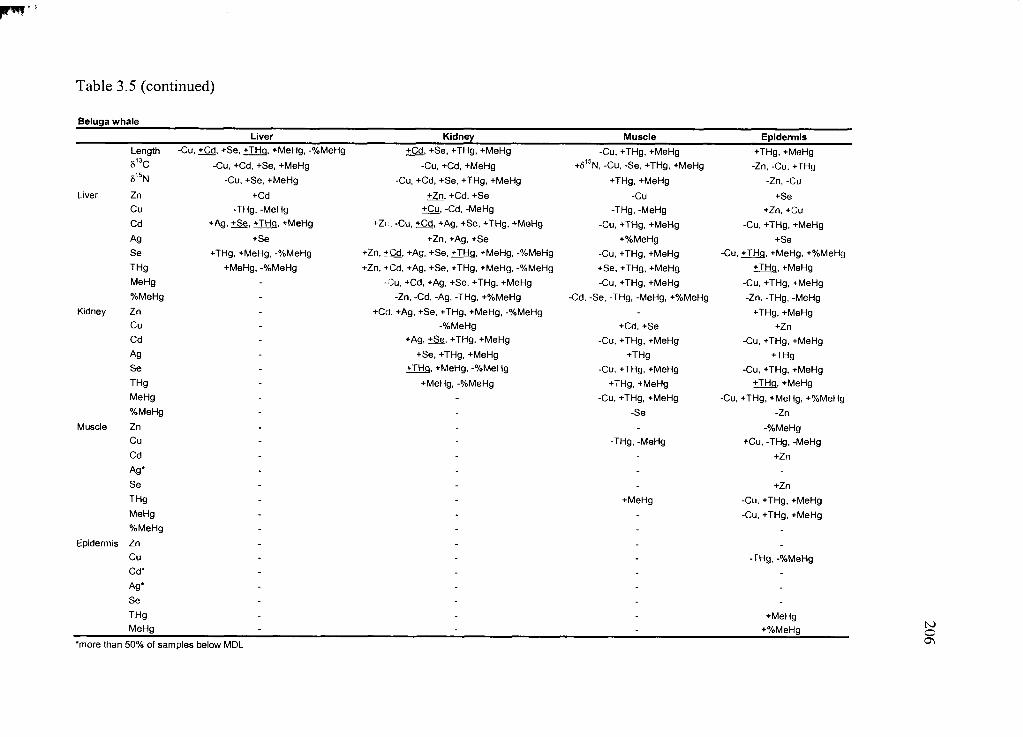
p r « r !
Table 3.5 (continued)
Beluga whale
L iver Kidney Muscle Epiderm isLength -Cu, +Cd, +Se, +THg. +MeHg, -%MeHg +Cd. +Se, +THg, +MeHg -Cu, +THg, +MeHg +THg, +MeHg513C -Cu, +Cd, +Se, +MeHg -Cu, +Cd, +MeHg +815N, -Cu, -Se, +THg, +MeHg -Zn, -Cu, +THg8,5N -Cu, +Se, +MeHg -Cu, +Cd, +Se, +THg, +MeHg +THg, +MeHg -Zn, -Cu
Liver Zn +Cd +Zn. +Cd, +Se -Cu +SeCu -THg, -MeHg +Cu, -Cd, -MeHg -THg, -MeHg +Zn, +CuCd +Ag, +Se, +THs, +MeHg +Zr,, -Cu, -t-Cd. +Ag, +Se, +THg, +MeHg -Cu, +THg, +MeHg -Cu, +THg, +MeHgAg +Se +Zn, +Ag, +Se +%MeHg +SeSe +THg, +MeHg, -%MeHg +Zn. +Cd. +Aa. +Se. +THa. +MeHa. -%MeHa -Cu, +THg, +MeHg -Cu, +THa. +MeHg, +%MeHgTHg +MeHg, -%MeHg +Zn, +Cd, +Ag, +Se, +THg, +MeHg, -%MeHg +Se, +THg, +MeHg +THa. +MeHg
MeHg - -Cu, +Cd, +Ag, +Se, +THg, +MeHg -Cu, +THg, +MeHg -Cu, +THg, +MeHg%MeHg - -Zn, -Cd, -Ag, -THg, +%MeHg -Cd, -Se, -THg, -MeHg, +%MeHg -Zn, -THg, -MeHg
Kidney Zn - +Cd, +Ag, +Se, +THg, +MeHg, -%MeHg - +THg, +MeHgCu - -%MeHg +Cd, +Se +ZnCd - +Ag, +Se, +THg, +MeHg -Cu, +THg, +MeHg -Cu, +THg, +MeHgAg - +Se, +THg, +MeHg +THg +THgSe - -t-THa. +MeHg, -%MeHg -Cu, +THg, +MeHg -Cu, +THg, +MeHgTHg - +MeHg, -%MeHg +THg, +MeHg +THa. +MeHaMeHg - - -Cu, +THg, +MeHg -Cu, +THg, +MeHg, +%MeHg%MeHg - - -Se -Zn
Muscle Zn - - - -%MeHgCu - - -THg, -MeHg +Cu, -THg, -MeHgCd - - - +Zn
Ag* - - - -Se - - - +ZnTHg - - +MeHg -Cu, +THg, +MeHgMeHg - - - -Cu, +THg, +MeHg%MeHg - - - -
Epidermis Zn - - - -Cu - - - -THg, -%MeHgCd* - - - -
Ag* - - - -Se - - - -THg - - - +MeHgMeHg - - - +%MeHg
*more than 50% of samples below MDL
206
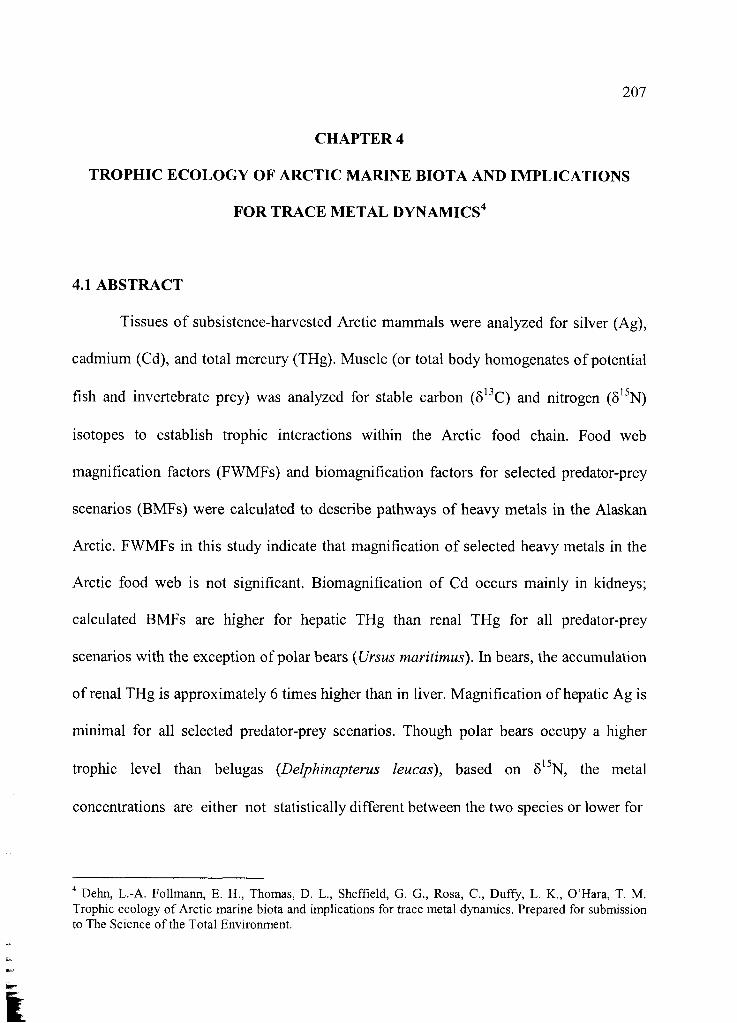
4.1 ABSTRACT
Tissues of subsistence-harvested Arctic mammals were analyzed for silver (Ag),
cadmium (Cd), and total mercury (THg). Muscle (or total body homogenates of potential
fish and invertebrate prey) was analyzed for stable carbon (8 1 3C) and nitrogen (S15N)
isotopes to establish trophic interactions within the Arctic food chain. Food web
magnification factors (FWMFs) and biomagnification factors for selected predator-prey
scenarios (BMFs) were calculated to describe pathways o f heavy metals in the Alaskan
Arctic. FWMFs in this study indicate that magnification o f selected heavy metals in the
Arctic food web is not significant. Biomagnification of Cd occurs mainly in kidneys;
calculated BMFs are higher for hepatic THg than renal THg for all predator-prey
scenarios with the exception of polar bears (Ursus maritimus). In bears, the accumulation
of renal THg is approximately 6 times higher than in liver. Magnification of hepatic Ag is
minimal for all selected predator-prey scenarios. Though polar bears occupy a higher
trophic level than belugas (Delphinapterus leucas), based on 6 15N, the metal
concentrations are either not statistically different between the two species or lower for
207
CHAPTER 4
TROPHIC ECOLOGY OF ARCTIC MARINE BIOTA AND IMPLICATIONS
FOR TRACE METAL DYNAMICS4
4 Dehn, L.-A. Follmann, E. H., Thomas, D. L., Sheffield, G. G., Rosa, C., Duffy, L. K„ O ’Hara, T. M.
Trophic ecology o f Arctic marine biota and implications for trace metal dynamics. Prepared for submission
to The Science o f the Total Environment.
bears. Similarly, concentrations o f renal and hepatic Cd are significantly lower or not
statistically different in polar bears compared to ringed (Phoca hispida) and bearded seals
(Erignathus barbatus), their primary prey. THg, on the other hand, increased
significantly from seal to polar bear tissues. Mean 515N was lowest in muscle of Arctic
fox (Alopex lagopus) and foxes also show the lowest levels o f Hg, Cd and Ag in liver and
kidney compared to the other species analyzed. These values are in good agreement with
a diet dominated by terrestrial prey. Metal deposition in animal tissues is strongly
dependent on biological factors such as diet, age, sex, body condition and health, and
caution should be taken when interpreting biomagnification o f dynamic and actively
regulated trace metals.
Keywords: Arctic, food web, biomagnification, trace metals, stable isotopes, arctic fox,
polar bear, bowhead whale, beluga whale, gray whale, ringed seal, bearded seal, spotted
seal, ribbon seal
208
Trace metals are widely distributed and have multiple natural (e.g., degassing of
the earth's crust) and anthropogenic inputs (e.g., fossil fuel burning, mining) into the
environment (Presley, 1997; Pyle and Mather, 2003; Trefry, et al. 2003; AMAP, 2004).
The Arctic is generally considered a pristine environment as it is sparsely populated by
humans and relatively unaffected by industrial activity (Barrie et al., 1992; Bard, 1999).
However, concentrations o f some contaminants in Arctic marine mammals are at levels
of concern to subsistence users and animal health (Gauthier et al., 1998; Deutch and
Hansen, 2000; Belles-Isles et al., 2002; Lalancette et al., 2003). O f particular importance
in marine mammals are bioaccumulation and biomagnification, the increase in
concentration of contaminants in tissues with age and trophic level, respectively. Several
Arctic marine mammal populations were decimated by commercial whalers and sealers
in the 18th and 19th centuries and are therefore especially vulnerable to harmful effects of
pollutants, e.g., effects on reproduction, body condition, and immune status (Fay, 1982;
Lowry et al., 1982; Clapham et al., 1999). Additionally, marine mammals are long-lived,
e.g., bowhead whales (Balaena mysticetus) are reported to live in excess of 100 years
(George et al., 1999); many species are top-level predators, and the Inuit coastal
population o f the Arctic has been nutritionally and culturally dependent on marine
resources for centuries.
Mercury (Hg) may accumulate in polar regions due to surface deposition of
reactive, divalent Hg (Hgll) during polar sunrise (Ebinghaus et al., 2002; Lindberg et al.,
2002). It is released during snow melt and thus made available to the marine food chain
209
4.2 INTRODUCTION
where it is subjected to microbial methylation (Boening, 2000; Ebinghaus et al., 2002;
Lindberg et al., 2002). Transfer efficiency from phytoplankton to copepods is four times
greater for organic Hg (MeHg) than Hgll (Morel et al., 1998). Furthermore, fish muscle
contains approximately 100% bioavailable MeHg, therefore leading to high potential of
Hg magnification in the piscivorous food chain (Bryan and Langston, 1992; Wagemann
et al., 1997; Baeyens et al., 2003). On the other hand, cadmium (Cd) is found in higher
concentrations in kidney and liver of marine mammals that feed low in the Arctic food
chain, e.g., bowhead whales and walrus (Odobenus rosmarus), than in top-level Arctic
predators such as polar bear (Ursus maritimus) and Arctic fox (Alopex lagopus)
(Warburton and Seagars, 1993; Prestrude et al., 1994; Wagemann and Stewart, 1994;
Bratton et al., 1997; Woshner et al., 2001a; Woshner et al., 2001b). Marine invertebrates
and cephalopods in particular have been suggested to be main vectors of Cd in the food
chain, while fish generally have lower concentrations (Bustamante et al., 1998;
Bustamante et al., 2003).
Silver (Ag) is associated with sewage wastes, but also occurs naturally in the
earth’s crust and in mining deposits (Purcell and Peters, 1998). Elevated concentrations
(>50 ppm) of Ag also have been reported in the vicinity of hydrothermal vents (Hein et
al., 1999). Ag has a high affinity to sulfur ligands and halogens in water and sediments
(Bell and Kramer, 1999) and may thus have the potential to accumulate in the benthic
food web. Cephalopods, bivalves, and crustaceans can accumulate Ag at high
concentrations, usually in conjunction with copper (Cu), required by some of these taxa
210
as the central atom in their blood pigment, hemocyanin (Martin and Flegal, 1975; Berthet
et al., 1992; Rouleau et al., 2000; Bustamante et a!., 2004a).
In order to address trophic relationships and biomagnification o f contaminants in
the Arctic, stable nitrogen isotopes have been commonly used (Fisk et al., 2001; Hobson
et al., 2002; Hop et al., 2002; Hoekstra et al., 2003). Nitrogen isotope ratios of prey are
reflected in tissues o f the consumer, with slight enrichment occurring at each trophic step
(Kelly, 2000). Stable isotopes of carbon are generally used to provide information on
spatial habitat use and carbon sources rather than trophic relationships as they enrich in
consumer tissues only to a minor degree (Schell et al., 1989; France, 1995; Burton and
Koch, 1999; Dehn, in prep.). However, there are difficulties and limitations with the
interpretation o f stable isotopes. Nitrogen isotope ratios can be influenced by age, body
condition, water stress, body protein catabolism associated with starvation and urea
recycling during hibernation (Hobson et al., 1993; Barboza et al., 1997; Hobson et al.,
1997; Femandez-Mosquera et al., 2001; Dehn, in prep.). In addition, turnover rates and
tissue and species-specific isotopic fractionation factors are poorly understood.
Substantial variations in trophic shift have been reported for animals consuming either
high versus low protein food or invertebrate versus plant diets (McCutchan et al., 2003;
Sponheimer et al., 2003). Furthermore, differences in metabolic rate could result in
different species-specific fractionation rates (Bearhop et al., 2002). For the marine
ecosystem, trophic enrichment of 15N can range from 2.4 %o for pinniped and bird muscle
(Hobson and Clark, 1992; Hobson et al., 1996) to 3.0 %o for whale muscle (Dehn et al.,
submitted), and a general fractionation of 3.8 %o has been reported for muscle or total
211
body homogenates o f other food web components (Hobson and Welch, 1992; Hobson et
al., 2002). Thus, caution should be taken when nitrogen isotopes are used to calculate
trophic level based on general enrichment factors. Nevertheless, stable isotope signatures
are powerful tools in establishing basic trophic interactions.
The purpose of this study is to identify trophic relationships (via 5 15N) of selected
heavy metals in the Arctic marine food chain, and compare trace element concentrations
within this ecosystem. Foodweb magnification factors (FWMF) and biomagnification
factors (BMF) are calculated to describe and quantify biomagnification of heavy metals
in the Alaskan Arctic.
4.3 MATERIAL AND METHODS
4.31 Field Sampling and Tissue Processing
All marine mammal samples were obtained during native subsistence harvests.
Ringed (Phoca hispida) and bearded seal (Erignathus barbatus) lumbar muscle, kidney
and liver were collected in Barrow, Alaska, mainly during summer from 1998-2001. To
increase sample size and statistical power, data from ringed seals harvested in Barrow
during summer 1996 and 1997 (Woshner et al., 2001a) were included in the analyses.
Ringed seal samples were also obtained in Holman, Canada, during summer, 2001.
Tissues o f spotted seals (Phoca largha) were collected in Little Diomede and Shishmaref,
Alaska, in summer 2000 and 2001. Ribbon seal (Phoca fasciata) samples were acquired
in Little Diomede and Hooper Bay, Alaska, during summer 2003. Walrus muscle was
212
obtained in Barrow and Little Diomede on an opportunistic basis mainly during summer
1998 and 2003.
Epidermis, lumbar muscle, kidney and liver of bowheads were predominantly
collected in Barrow either during spring or fall harvest 1998-2001. Data from bowheads
harvested during 1995-1997 (Woshner et al., 2001b) and 1983 to 1990 (Bratton et al.,
1997) were included in the data set. Samples of beluga whales (Delphinapterus leucas)
harvested in Point Lay and Wainwright, Alaska, in 1998-1999 were combined with data
obtained during 1996-1997 (Woshner et al., 2001b) and 1992-1995 (Tarpley et al., 1995)
that displayed the appropriate biological variables to increase sample size and statistical
power. Tissues o f gray whales (.Eschrichtius robustus) were sampled in Lorino and
Lavrentiya, Russia, in 2001.
Polar bear samples were obtained opportunistically from subsistence hunters
during winter 1999 and 2000 near Barrow. Bears sampled during 1996 and 1997 were
analyzed for renal mercury (THg) and stable isotopes. Additional data for these bears
(Woshner et al., 2001a) were included in the analyses. Personnel o f the North Slope
Borough Public Health Office Veterinary Clinic collected Arctic fox tissues in winter
1999 and spring 2000 in Barrow as part of the Animal Damage Control Program. Inuit
hunters in Holman collected additional samples o f Arctic fox in November 1999. Several
potential prey species were collected or donated by subsistence hunters in Barrow and the
Alaskan Bering Strait. Figure 4.1 shows Arctic villages and communities where samples
were collected.
213
All tissues were sub-sampled under clean conditions with titanium or ceramic
blades on a Teflon covered surface, following the sampling protocol for contaminants by
Becker et al. (1999), and stored at -20°C in acid-washed scintillation vials or
Whirlpacks™ until analysis. Marine mammal samples were collected and analyzed under
the authority o f Permit Nos. 782-1399 and 358-1585 issued to the Alaska Department of
Fish and Game and 932-1489-03 issued to T. Rowles o f the Marine Mammal Health and
Stranding Response Program.
4.32 Stable Isotope Analyses
Muscle o f marine and terrestrial mammals and total body homogenates of
potential prey were freeze-dried and ground into a fine powder with mortar and pestle.
For each sample, 0.2 to 0.4 mg of tissue was weighed into a 4.75 x 4 mm tin capsule,
which was folded into a cube. Samples were analyzed for both stable carbon and nitrogen
ratios at the University of Alaska Fairbanks (UAF) using a Finnigan MAT DeltaplusXL
Isotope Ratio Mass Spectrometer (IRMS) directly coupled to a Costech Elemental
Analyzer (ESC 4010). Samples were flash combusted at 1020°C, followed by on-line
chromatographic separation o f sample N 2 and CO2 with He as carrier gas. Samples
analyzed for 15N /14N and 13C/12C were standardized against atmospheric N2 and PeeDee
Belemnite limestone, respectively. Enrichment o f a particular isotope was reported using
the equation:
214
5R%o = (( sample//?standard) - 1) X 1000
215
where the differential notation (5R) represents the relative difference between isotopic
ratios of the sample and standard gases (i.e., 13C/I2 C, 15N /14N). A laboratory-working
standard (Peptone No. P-7750) was analyzed every 10 samples during analysis, and tin
capsule blanks were run every 20 samples. Calibrations were made with the use of stable
isotope reference materials provided by the National Institute of Standards and
Technology (NIST). External instrument reproducibility for both carbon and nitrogen
isotope analysis was ± 0 . 2 %o.
4.33 Trace Metal Analyses
Silver (Ag) and cadmium (Cd) were analyzed at Texas A&M University (TAMU)
following US Environmental Protection Agency (EPA) procedures (200.3, 200.7, 200.8
and 200.9) with slight modifications (EPA, 1992). Briefly, sub-sampled tissues were
freeze-dried to a constant weight and homogenized by ball-milling Powdered tissue
(approximately 0.2 - 0.25 g) was digested in a microwave wet ash procedure using
HNO3 , H2 O2 and HC1. Whale tissues were homogenized and about 0.8-1.0 g of sample
was subjected to a wet tissue digestion in the microwave wet ash procedure. Cd and Ag
were analyzed using either Graphite Furnace Atomic Absorption Spectrometry (Perkin-
Elmer Model SIMAA 6000 equipped with an AS-72 autosampler and Zeeman
background correction) or by ICP-MS (Perkin-Elmer Elan Model 6100 DRC-II). The
detection limit was 0.01 jj.g/g for elements analyzed with Graphite Furnace AAS and 0.01
jug/g for Cd and 0.005 jig/g for Ag using ICP-MS.
Total mercury (THg) was analyzed at UAF following the procedure established
by Bloom and Crecelius (1983). Briefly, sub-sampled tissues were homogenized and
approximately 1 g o f tissue was digested in 7:3 HNO3/H 2 SO4 and oxidized with 10 %
BrCl in 12N HCL. The sample was reduced to Hg° with SnCl2 and purged with N2 onto
gold-coated quartz sand traps followed by dual thermal desorption to a Cold Vapor
Atomic Fluorescence Spectrometer (Tekran Model-2500 CVAFS Mercury Detector) with
argon as carrier gas. The detection limit was 0.001 fig/g. All trace element concentrations
are expressed as |L4,g/g wet weight (ww) unless otherwise noted.
4.34 Statistical Analysis and Trophic Transfer Calculations
MANOVA was used to simultaneously compare means of 8 t5N, 8 !3 C, Ag in liver,
Cd in liver and kidney, and THg in liver and kidney between 9 marine and terrestrial
mammal groups sampled (polar bear, Arctic fox from Barrow, ringed seal from both
Holman and Barrow, bearded seal, spotted seal, bowhead whale, beluga whale and gray
whale). The variables in the data set were ranked prior to analysis to reduce the risk of
violations o f normality and homogeneity of variance assumptions (Conover, 1999).
Multiple one-way ANOVAs were implemented (controlled for Type I error using the
Bonferroni approach with a = 0.001) as follow-up tests to determine pairs of groups that
are different in specific dependent variables.
Principal components analysis (PCA) was used on standardized data (Z scores /
correlation matrix) to identify patterns and highlight similarities and differences between
216
marine and terrestrial mammals. PCA on the correlation matrix is appropriate when
adjustment for large variance differences between variables is necessary or when
variables are not measured in comparable units (Johnson, 1998).
Simple linear regression analysis was used on all animals in the data set to
determine food web magnification factors (FWMF) based on the relationship between
515N (as indicator for trophic position) and each metal concentration. The slope of the
linear regression gives the mean rate o f increase (FWMF) for selected trace metals (Cd
and THg in liver and kidney and hepatic Ag) in this Arctic food web (Fisk et al., 2001).
Biomagnification factors (BMF) were calculated for selected predator-prey
scenarios as:
BMF = (Metal p reda to r / Metal prey ) / ( 5 15N p redato r / S 15N p re y )
where Metal predator and Metal prev are the concentrations o f selected metals in ug/g ww of
the predator and prey, respectively (adapted from Hoekstra et al., 2003). BMF was
corrected for differences in trophic position (based on 515N) between predator and prey.
BMF was calculated for liver and kidney in marine mammals. For invertebrates and fish,
trace element concentrations o f total body homogenates were used for calculations.
Statistical analyses were performed using SAS (Version 8) with 5 % significance
level unless otherwise noted. Sigma-Plot (Version 7.0) was used for graphic presentation
of data and linear regression. In order to include element concentrations below the
I l l
minimum detection limit (MDL) into summary statistics and statistical tests, they were
expressed as one-half the MDL (Gilbert, 1987). However, none of the tissues analyzed
for trace metals showed more than 50 % of samples below MDL. Results are reported as
mean ± standard deviation (SD) unless otherwise noted.
4.4 RESULTS
4.41 Stable Isotopes and Trace Metals
Significant differences (p = <0.0001) in the multivariate mean vectors of ranked
values o f 815N, 813C, Ag in liver, Cd and THg in liver and kidney among the different
Arctic mammal groups were found using MANOVA. Table 4.1 summarizes the results of
the follow-up pair-wise comparisons using multiple one-way ANOVAs. Though polar
bears occupy a higher trophic level than belugas (based on S15N), the metal
concentrations between the two species were either not statistically different or were
significantly lower for polar bears. Similarly, concentrations o f renal and hepatic Cd were
either significantly lower or not statistically different in polar bears compared to ringed
and bearded seals, their primary prey. Mean S15N was lowest in muscle of Arctic fox, and
foxes also show the lowest levels o f Hg, Cd and Ag in liver and kidney compared to the
other groups.
Mean values o f stable carbon and nitrogen isotopes in Arctic marine and
terrestrial mammals (analyzed in this study and compiled from literature) are given in
Table 4.2. Stable carbon and nitrogen isotope signatures in muscle range widely. Mean
815N in muscle of belugas and ice seals (ringed, bearded and spotted seals) are not
218
statistically different, though values are higher than for mysticetes. Stable nitrogen
isotope ratios are significantly higher in bowheads than gray whales and 815N in typical
prey of baleen whale (zooplankton and amphipods) is also isotopically distinct (Figure
4.2). Carbon-13 is enriched in bearded seal, walrus, and gray whale compared to other
species and most depleted in Arctic fox. Figure 4.2 illustrates 815N versus 813C in marine
and terrestrial vertebrates and some potential prey species.
The first two principal components (PCI and PC2) explained 60 % of the
variability in marine and terrestrial animals harvested in Alaska and Canada (Figure 4.3).
Variables with the most weight in PCI were S15N and THg in kidney and liver. The
separation in PC2 was largely driven by a positive loading o f renal and hepatic Cd
(Figure 4.3). The nine groups are distinct, though ringed and bearded seal are similar and
some overlap occurs between polar bear and beluga whale and also between bowhead
and gray whale. Arctic fox can clearly be differentiated from the other species. The
spread in PCI closely resembles the trophic structure o f the groups with the exception of
spotted seals (see Figure 4.2) and is in agreement with the high loading of 515N on PCI.
Spotted seals had comparatively low concentrations o f THg in tissues based on their
trophic standing. Table 4.3 gives means, standard deviations and ranges of concentrations
for selected metals o f mammals analyzed in this study and data compiled from literature
for mammals from other Arctic regions.
219
4.42 Food Web Magnification and Biomagnification Factors
Magnification o f renal Cd and THg and Ag in liver versus § '5N in Arctic marine
biota is illustrated in Figure 4.4. FWMFs ranged from 0.22 for Ag in liver to 1.86 for
renal Cd (Table 4.4). The linear regression relationship was only significant for hepatic
and renal THg (p - 0.02 and p = 0.01 for liver and kidney, respectively). A slope greater
than 1 indicates accumulation in the food web (for FWMFs) or accumulation from
predator to prey (for BMFs), while values less than 1 suggest active elimination of the
element or interrupted trophic transfer. A two-tailed t-test was used to determine if the
slope of the linear regression is statistically different from unity. Hepatic Ag and Cd had
slopes significantly smaller than 1, while the slope of all other variables was not
statistically different from unity (Table 4.4).
In this study, biomagnification of Cd occurred mainly in the kidney, while
calculated BMFs were higher for hepatic THg than renal THg with the exception of polar
bears. In bears the accumulation o f renal THg was approximately 6 times higher than in
liver (Table 4.4). Similarly, concentrations o f THg in Arctic fox were higher in kidneys
than in liver (Table 4.3). Accumulation of hepatic Ag was minimal for all selected
predator-prey scenarios. The highest BMFs (above 350) were calculated for THg from
zooplankton and shrimp to liver o f ringed and bearded seals, respectively. Cd
magnification from zooplankton to Arctic cod (Boreogadus saida) was not observed, but
concentrations o f THg (corrected for 815N) increased 3-fold. Similarly, Cd was not
transferred from ringed seal to polar bear in either kidney or liver, while THg increased
significantly.
220
4.5 DISCUSSION
4.51 Stable Isotopes
The low trophic standing (based on 815N) determined for Arctic fox in this study
indicates that these animals are not feeding or scavenging on remains o f pinnipeds or
other large vertebrates as suggested by Chesemore (1968) and Smith (1976). Arvicoline
rodents are the primary terrestrial food source of Arctic fox (Fay and Stephenson, 1989;
Anthony et al., 2000). Mean nitrogen isotope ratios established for tundra voles (Microtus
oeconomus) are approximately 7.0 %0 (Schmutz and Hobson, 1998) and range from
means o f 9.3 %o to 11.3 %o in muscle o f Arctic foxes from Holman and Barrow,
respectively. These values are in good agreement with a diet dominated by microtine
rodents, assuming a trophic enrichment of 3.5 %o for fox muscle (Roth and Hobson,
2000). However, based on mean nitrogen isotope ratios, caribou or reindeer (Rangifer
tarandus) cannot be excluded as a food source for Arctic fox and have been described as
fox prey in Svalbard (Prestrud, 1992; Szepanski et al., 1999; Frafjord, 2002). The
depleted 13C values for Arctic fox in this study from both Alaska and Canada also
indicate that the animals rely on a terrestrial rather than marine diet (Angerbjom et al.,
1994; Kelly, 2000). Roth (2003) suggested that foxes feed on marine resources only
when lemming populations are depleted. The capture years o f foxes in this study (1999
and 2000) fell within high lemming (Lemmus spp. and Dicrostonyx spp.) and vole
(Microtus spp. and Clethrionomys spp.) population cycles in the Alaskan and Canadian
Arctic though geographical variation can be substantial (Krebs et al., 2002).
221

Polar bears occupy the highest trophic level (based on 515N). In the Alaskan
Arctic they prey mostly on ringed and bearded seals (Smith, 1980; Hammill and Smith,
1991). A number o f reports show that bears in the circumpolar Arctic opportunistically
hunt belugas and narwhals (Monodon monoceros), feed on carrion (e.g., bowhead and
gray whale carcasses) and may prey on terrestrial ungulates (e.g., caribou) (Lowry et al.,
1987; Smith and Sjare, 1990; Derocher et al., 2000; Miller et al., 2004). Mean nitrogen
isotope ratios in muscle o f ringed seals and polar bears suggest a 15N trophic enrichment
of 3.7 %o, assuming a bear feeding exclusively on ringed seal. However, the close range
of mean nitrogen isotope ratios in ringed, bearded and spotted seals and belugas and
narwhals (Table 4.2) made it difficult to discern the proportions of these potential prey
species to the polar bear diet. Based on mean 515N ratios in bear muscle in this study it is
improbable that bowhead or gray whale carrion made up a considerable fraction of their
annual diet. Enriched 13C values in polar bears suggest reliance on the marine rather than
terrestrial food chain. This is in accordance with Ramsay and Hobson (1991), who
concluded that terrestrial food sources are negligible in the polar bear diet.
The diet o f pagophilic seals is highly variable, and this is reflected by the large,
but overlapping ranges o f 515N (Figure 4.2). However, spotted seal 815N is slightly higher
than that o f other seals and is in agreement with a higher frequency of fish in spotted seal
diet (Bukhtiyarov et al., 1984; Dehn, in prep.). Invertebrates make up the majority of the
bearded seal prey; they are seasonally important to ringed seals, and invertebrate
consumption is dependent on age in ringed seals (Lowry et al., 1980a; Lowry et al.,
1980b; Dehn, in prep.). Little is known about ribbon seal feeding due to their remote
222
distribution in the pack ice. Available reports suggest that nektobenthos, e.g., walleye
pollock (Theragra chalcogramma) and cephalopods are o f importance to adult ribbon
seals, while pups and juveniles utilize small crustaceans (Shustov, 1965; Frost and
Lowry, 1980; Fedoseev, 2000). Stable nitrogen isotopes in assumed prey of adult ribbon
seals range from 13.6 ± 1.2 %0 in cephalopods to 14.2 ± 2.0 % o in pollock (Figure 4.2).
Mean 515N values o f ribbon seals (16.0 ± 1.2 %0) are in good agreement with the
proposed prey, assuming a nitrogen fractionation rate o f 2.4 % o from prey to seal muscle
(Hobson et al., 1996). Nitrogen isotope ratios are low in walrus muscle compared to that
o f other pinnipeds (Table 4.2), and the significance o f clams in their diet has been
emphasized (Lowry et al., 1980b; Fay, 1982; Fay et al., 1984). Mean 815N values in
Greenland cockle (Serripes groenlandicus) homogenates (commonly found in walrus
stomachs) range from 8.0 % o to 8.9 % o (Hobson and Welch, 1992; Dehn, in prep.).
Bearded seals and walrus are significantly enriched in carbon-13 compared to the other
seals. Both feed benthically, and the enriched carbon-13 values reflect the use of this
habitat (France, 1995). In contrast, ringed, spotted and ribbon seals are pelagic feeders
most o f the year (Bums, 1970; Fedoseev, 2000).
Beluga whales feed on a higher trophic level (based on 815N) than either bowhead
and gray whales. This finding is in accordance with a diet dominated by fish described
for belugas, though cephalopods and other invertebrates are commonly eaten (Seaman et
al., 1982; Huntington, 2000). Nitrogen isotope ratios are not different for ringed, bearded
and spotted seals (Table 4.1), and, as described above, ice seals also feed
opportunistically on a wide variety of prey so that competition for prey between ice seals
223
and belugas is probable (Seaman et al., 1982). In contrast, bowhead and gray whales are
fairly specialized filter-feeding predators. Bowheads consume primarily pelagic
euphausids and copepods (Lowry, 1993; Lowry and Sheffield, 2002), while gray whales
are unique in their reliance on benthic gammaridean amphipods (Rice and Wolman,
1971; Bogoslovskaya et al., 1981). Both prey types (zooplankton and amphipods) are
isotopically distinct, thus leading to discemable isotope ratios in muscle of bowhead and
gray whale (Figure 4.2). Bowheads feed mostly in the water column, and their depleted
carbon-13 value in muscle is indicative for the pelagic foodweb. Gray whales display the
enriched 13C signature of the benthic food chain and their ratios are not different from
other benthic feeders, e.g., bearded seal (Figure 4.2). Belugas had intermediate 513C
values between bowhead and gray whales, suggesting that both pelagic and benthic foods
are important components o f their diet.
4.52 Trace Metals
A comparison with existing data from other Arctic regions (Table 4.3) shows
generally lower concentrations of Cd and Hg in liver and kidney of subsistence-harvested
marine and terrestrial mammals in Alaska. Hepatic Ag is rarely reported for Arctic
mammals. Ag was highest in liver of belugas compared to other species by 1 to 2 orders
of magnitude. These high concentrations have long been a mystery and possible causes
for Ag accumulation have been discussed (Becker et al.; 1995, Becker et al.; 2000;
Woshner et al., 2001a; Dehn et al., submitted). Ag shows a possible connection to the
benthic food chain or cephalopod and crustacean prey (Martin and Flegal, 1975; Rouleau
224
et al., 2000), as bearded seals and walrus (aside from belugas) have higher hepatic Ag
concentrations than pelagic feeding bowhead whales, spotted seals, and harp seals (Phoca
groenlandica).
Table 4.3 shows that the highest Cd concentrations in the circumpolar Arctic have
been measured in tissues of hooded seals (Cystophora cristata) from Greenland
(Julshamn and Grahl-Nielsen, 2000). Hepatic THg levels were also highest for hooded
seals, which are deep divers and feed on a variety of fish and squid (Hauksson and
Bogason, 1997; Folkow and Blix, 1999). Bustamante et al. (1998) indicated that
cephalopods are a main vector in the trophic flux of Cd, while fish accumulate and
transfer Hg (Baeyens et al., 2003). Hg accumulation from sediments has also been
suggested as a dominant pathway for Hg uptake (Bryan and Langston, 1992) and could
explain elevated concentrations of Hg in deep-diving hooded seals. Interestingly,
piscivorous spotted seals had the lowest THg concentrations in their tissues compared to
other Arctic pinnipeds (Table 4.3). However, Dehn et al. (2005) reported that the ratio of
organic to inorganic Hg was highest in tissues of spotted seals and they suggested that
this ratio might be a better indicator for piscivory than THg alone.
The lowest concentrations o f metals selected in this study were found in Arctic
fox. This is in agreement with the low trophic position established for this species.
Concentrations o f THg and Cd measured in liver of red-backed vole (Clethrionomys
rutilus) sampled from Inuvik, Northwest Territories, Canada were 0.08 jag/g and 0.12
fig/g ww for THg and Cd, respectively (after Lodenius et al., 2002, a conversion factor of
0.27 was used for liver to transform Cd concentrations from dry weight to wet weight)
225
(Poole et al., 1998). On the other hand, concentrations of THg and Cd in liver of caribou
and reindeer from Svalbard and Greenland exceed levels established for rodents by orders
of magnitude (Borch-Iohnsen et al., 1996; Aastrup et al., 2000). Cd concentrations were
higher in Arctic foxes from Svalbard than in foxes from Alaska and Canada analyzed in
this study, while THg levels were comparable at a similar mean age (Prestud et al., 1994).
Arvicoline rodents are absent from Svalbard with the exception of some small and
isolated vole populations (Fuglei and Oritsland, 1999). Thus, Arctic fox in Svalbard rely
either on the marine ecosystem for food or utilize reindeer carrion, explaining the higher
levels o f Cd found in their tissues (Prestrud, 1992; Pond et al., 1995, Frafjord, 2002).
In comparison, THg concentrations in tissues of polar bears from Alaska and
Greenland were higher than in bears from Svalbard. Cd concentrations were similar in
bears sampled in Alaska and Svalbard, while Cd in tissues of Greenland bears was higher
(Table 4.3). This is in agreement with a geographic increase o f Hg from eastern to
western Arctic Canada reported for a variety o f marine mammal tissues, which was
attributed to a gradient in natural geological concentrations (Wagemann et al., 1996). In
contrast, Cd concentrations were higher in the Eastern than the Western Arctic in polar
bears, ringed seals and beluga whales (Norstrom et al., 1986; Braune et al., 1991;
Wagemann et al., 1996).
Belugas, narwhals and harbor porpoise (.Phocoena phocoena) have a higher
trophic standing (Table 4.2) than mysticetes, and concentrations of THg in odontocete
tissues are up to two orders o f magnitude higher (Table 4.3). Renal and hepatic
concentrations o f Cd, on the other hand, are similar or even higher in filter-feeding
226
bowheads than in belugas. Renal and hepatic Cd in gray whales was considerably lower
than in other cetaceans from polar waters (Table 4.3).
4.53 Food Web Magnification
The calculation of FWMFs in this study indicates that magnification o f selected
heavy metals in the Arctic foodweb is not significant or FWMFs are significantly smaller
than unity, suggesting active elimination of some metals rather than magnification (Table
4.4). In addition, low Revalues of the regressions illustrate that the underlying
relationships lack linearity (Figure 4.4). The calculation o f these transfer factors makes a
variety o f assumptions that may not be representative for the biomagnification of heavy
metals. It is assumed that the contaminant burden originates from the prey and that the
tissue under evaluation is a good proxy for total body burden (Fisk et al., 2001; McGeer
et al., 2003). However, metal uptake and adsorption over the gills and other body surfaces
may be an important route of exposure for invertebrates and fish (Rainbow, 1996;
Laporte et al., 2002; Rainbow and Black, 2004; Wood et al., 2004) and uptake via
ingested seawater or lungs cannot be excluded in marine mammals (Law, 1996).
In contrast to organochlorines (OC’s) that are mainly concentrated in lipid-rich
tissues (e.g., blubber), trace metal storage and detoxification may be more organ specific
and metal dependent, e.g., Cd accumulation in kidney, lead (Pb) in bone and arsenic (As)
in blubber and liver (Hu et al., 1998; Gallien et al., 2001; Kubota et al., 2001; Ebisuda et
al., 2003). It should be considered that most trace metals are dynamic, actively regulated,
dependent on transport molecules, and subjected to binding site competition (McGeer et
227
al., 2003). Tracing pathways o f Hg can be particularly challenging, depending on its
chemical form and presence of demethylation processes. Hg can accumulate in the brain
via exposure to MeHg and Hg vapor that can cross the blood-brain-barrier, and is there
converted to inert Hgll (Sichak et al., 1986; Aschner and Aschner, 1990). MeHg is also
known to accumulate in muscle, epidermis, hair, and other keratinized structures and is
transferred to the fetus via the placenta (Wagemann et al., 1988; Shi et al., 1990;
Wagemann et al., 1990; Dehn et al., 2005; Dehn et al., submitted). Hg is commonly
associated with selenium (Se) in liver as biologically inert Se-Hg granules (tiemannite),
and this has led to the often-discussed protective effect o f Se on Hg toxicosis (Koeman et
al., 1973; Danscher and M0 ller-Madsen, 1985; Caurant et al., 1996; Nigro et al., 2002;
Arai et al., 2004; Decataldo et al., 2004). Renal metallothionein may be involved in the
detoxification and accumulation o f Hg in terrestrial, but not marine mammals (Caurant et
al., 1996; Satoh et al., 1997; Das et al., 2000; Decataldo et al., 2004). Active elimination
and demethylation o f Hg can also occur with bilary excretion and the reticuloendothelial
system, respectively (Suda and Takahashi, 1990; Nigro et al., 2002; Bemtssen et al.,
2004). Wagemann et al. (1996) suggested that approximately 14 % of epidermal MeHg
could be actively eliminated via skin molt in cetaceans. Similarly, Cd can be bound to
metallothionein or deposited in storage granules (Gallien et al., 2001; Das et al., 2002;
Decataldo et al., 2004) and is thus not bioavailable to predators and disconnected from
trophic transfer (Groten et al., 1990; Groten et al., 1991; Lind et al., 2001). Non-essential
Cd is chemically similar to zinc (Zn), an essential element regulated within tight
homeostatic margins. Among others, this leads to interactions o f Cd and Zn, binding site
228
competition on metallothionein, re-absorption of both essential and toxic elements in
renal tubule cells and increased uptake of Cd when dietary Zn is marginal (Cousins,
1986; Reeves and Chaney, 2004; Barbier et al., 2005). Correspondingly, Ag is chemically
comparable to essential copper (Cu) and can interfere with Cu metabolism and transport
(Saeki et al., 2001). Trophic transfer o f Ag can be interrupted by adsorption of Ag to the
carapace of crustaceans and shedding of this exoskeleton and associated Ag (Ratte,
1999). It is also possible that trophic transfer of Ag only occurs in the benthic food chain
as described above. Molting is considered a primary pathway o f Ag excretion in
pinnipeds (Saeki et al., 2001).
Furthermore, metal deposition in animal tissues is strongly dependent on
numerous physical and biological factors, e.g., geography, sex, age, health status and
body condition (Honda et al., 1983; Wagemann et al., 1996; Watanabe et al., 2002; Dehn
et al., 2005; Dehn et al., submitted). The induction of metallothionein and thus binding
potential o f some trace metals is itself influenced by a variety of factors. Liver
metallothionein is increased in fetus and in pregnant or lactating females to store essential
elements, thus giving the opportunity for other non-essential elements (e.g., Cd) to
compete for binding sites (Bremner and Beattie, 1990; Teigen et al., 1999; Solaiman et
al., 2001). This may lead to differences in metal accumulation patterns between males
and females and juvenile and adult animals. Altered accumulation mechanisms of heavy
metals have been described for compromised, stranded or starving animals and during
epizootics. For example, elevated Zn concentrations and altered Zn kinetics are a
response to stressors, poor body condition, and infection (Frank et al., 1992; Olsson et al.,
229
1994; Bennet et al., 2001; Anan et al., 2002; Das et al., 2004a; Ilback et al., 2004; Dehn
et al., submitted).
4.54 Biomagnification
BMF calculations are based on trace metal comparisons o f predator and assumed
prey (corrected for 615N ratio differences) and are summarized in Table 4.4. It is assumed
that the selected comparisons are representative o f simple predator-prey relationships;
however, that may not be true. For example, bearded seals in particular have a diverse
diet (Lowry et al., 1980b; Dehn, in prep), ringed seals are known to shift their diet with
age and season, have prey selection differences based on sex (Lowry et al., 1980a; Dehn,
in prep.), and diets o f some species, such as ribbon seals and belugas, are largely
unknown (Frost and Lowry, 1980; Seaman et al., 1982). The extent to which polar bears
may be scavenging on remains o f subsistence-harvested or stranded marine mammal
carcasses or terrestrial food sources, as discussed above, is not well understood (Derocher
et al., 2000; Miller et al., 2004). The calculation o f BMF’s also assumes that predators
completely consume the prey. However, studies have suggested that some polar bears
will selectively feed on seal blubber (Stirling and McEwan, 1975, Smith, 1980), and thus
are exposed to very low concentrations o f THg, Cd and Ag (Woshner et al, 2001a). On
the other hand, THg and other trace elements like Se and Zn are higher in muscle and
also in the epidermis o f cetaceans, and Hg occurs mainly as bioavailable MeHg in these
tissues (Paludan-Miiller et al., 1993; Wagemann et al., 1996; Dehn et al., submitted). This
could explain why Cd does not biomagnify from prey to polar bear, whereas THg does.
23 0
Overall, calculation o f BMFs between predator and potential prey warrants
similar concerns as discussed above, e.g., internal metal dynamics, essentiality and
binding site competition. This becomes evident when comparing BMFs o f THg in kidney
and liver between marine and terrestrial mammals. Accumulation o f THg is higher in
kidneys o f terrestrial mammals than marine species (Table 4.3 and Table 4.4). This is
most likely due to differences in accumulation mechanisms and, as discussed above, renal
metallothionein is involved in binding and bioconcentration of Hg in terrestrial but not
marine mammals (Caurant et al., 1996; Satoh et al., 1997; Das et al., 2000; Decataldo et
al., 2004).
The very high BMFs calculated for THg from zooplankton and shrimp to ringed
and bearded seals, respectively, indicate that the seals do not exclusively depend on these
dietary items. In addition, fish, not invertebrates, may be the main route by which seals
are exposed to Hg as discussed above. The opposite may be true for Cd, as several studies
have observed higher concentrations of Cd in marine mammals that rely on invertebrates
rather than fish (Watanabe et al., 2002; Bustamante et al., 2004b; Dehn et al., 2005; Dehn
et al., submitted). Exceptionally high concentrations o f Cd have been reported for
invertebrates from polar waters (Bohn and McElroy, 1976; Hamanaka and Ogi, 1984;
Macdonald and Sprague, 1988; Ritterhoff and Zauke, 1997), while fish generally have
lower concentrations (Bohn and McElroy, 1976; Bustamante et al., 2003). It is notable
that Ag in this study has a very low accumulation potential in marine mammal tissues
with the exception of beluga tissues. This indicates that Ag is either actively eliminated in
the species analyzed except for belugas or that belugas have a predilection for Ag for
231
reasons yet unknown. Overall, more data from polar regions is needed, particularly at the
base of the food chain, to accurately assess biomagnification o f heavy metals in the
Arctic.
4.6 SUMMARY AND CONCLUSION
In conclusion, concentrations of trace elements in tissues o f marine and some
terrestrial mammals harvested in Alaska are generally lower than reported for other
Arctic regions. Magnification of the selected heavy metals (THg, Cd and Ag) was not
significant for the components of the Arctic food web analyzed in this study. Calculation
of BMFs suggested organ-specific accumulation of Cd in the kidney. Concentrations of
THg and BMFs were higher in liver than kidney for all selected predator-prey scenarios
with the exception of polar bear and Arctic fox, reflecting the involvement of renal
metallothionein in binding and accumulation of THg in terrestrial but not marine
mammals. Hepatic Ag has low magnification potential in the food web and in
mammalian tissues with the exception of beluga tissues. Polar bears occupied the highest
trophic level, though concentrations of trace metals were not statistically different or
significantly lower in bears than in belugas. Correspondingly, Cd did not biomagnify
from ice seal to polar bear tissues, while THg increased significantly. The calculations of
BMFs from predator to prey usually assume the complete ingestion of prey though polar
bears may selectively feed on seal or whale blubber, muscle and epidermis. Mean 515N in
muscle of belugas and ice seals were not statistically different and the close range of
mean nitrogen isotope ratios made it difficult to discern the proportions of these potential
232
prey species to the polar bear diet. The low trophic standing (based on 5!5N) and equally
low concentrations o f trace metals determined for Arctic fox sampled in this study is in
agreement with a diet dominated by arvicoline rodents or other low trophic level
terrestrial prey. A variety o f assumptions are made when calculating trophic transfer
factors that may not be suitable for trace metals. Some o f these elements are actively
regulated or deposited as inert storage molecules, and thus made unavailable for trophic
transfer. In addition, trace metals are affected by basic, biological factors such as sex,
reproductive status, age and body condition. Therefore careful deliberation should be
given to the interpretation of biomagnification and transfer o f trace elements.
4.7 ACKNOWLEDGEMENTS
We thank the subsistence hunters and whaling captains in the communities of
Barrow, Holman, Little Diomede, Shishmaref, Kaktovik, Wainwright, Point Lay, Point
Hope, Savoonga, Hooper Bay, Lorino and Lavrentiya for their cooperation and support in
providing samples for this study. We greatly appreciate the assistance of the North Slope
Borough (NSB) Public Health Office Veterinary Clinic and the Department of Wildlife
Management for arranging Arctic fox samples and R. Highsmith and B. Bluhm for
collection o f amphipod samples from the Bering Strait. This study would not have been
possible without the guidance and helping hands o f C. D. N. Brower, H. Brower, Jr., B.
Akootchook, T. Olemaun, T. Hepa, L. Hopson, C. George, R. Suydam, G. Zelensky, V.
Woshner, R. Eisner, T. Zenteno-Savin, S. Visalli, D. Burnett, G. York and many others in
the field and G. Bratton, R. Taylor, N. Haubenstock, T. Howe, T. Bentzen and P.
233
Hoekstra for support with analysis. We also thank L. Harwood for providing tissues and
jaws of ringed seals harvested in Holman, Canada. P. Becker and S. Christopher provided
marine mammal reference material and coordinated interlaboratory comparison exercises
for the determination o f trace elements in marine mammals. This study was primarily
funded by the Cooperative Institute for Arctic Research (CIFAR). Additional support was
provided by the Experimental Program for Stimulation of Competitive Research
(EPSCoR); the IdeA Network for Biomedical Research Excellence (INBRE); the North
Slope Borough Department of Wildlife Management; the Institute of Arctic Biology and
the Department o f Biology and Wildlife, UAF.
4.8 REFERENCES
Aastrup P, Riget F, Dietz R, Asmund G. Lead, zinc, cadmium, mercury, selenium and
copper in Greenland caribou and reindeer (Rangifer tarandus). Sci Total Environ
2000; 245: 149-159.
AMAP. Persistent toxic substances, food security and indigenous peoples of the Russian
North. Final Report. Oslo, Norway, 2004, 192 pp.
Anan Y, Kunito T, Ikemoto T, Kubota R, Watanabe I, Tanabe S, Miyazaki N, Petrov EA.
Elevated concentrations of trace elements in Caspian seals (Phoca caspica) found
stranded during the mass mortality events in 2000. Arch Environ Contam Toxicol
2002; 42: 354-362.
234
Angerbjom A, Hersteinsson P, Liden K, Nelson E. Dietary variation in arctic foxes
(Alopex lagopus) - an analysis of stable carbon isotopes. Oecologia 1994; 99:
226-232.
Anthony RM, Barten NL, Seiser PE. Foods o f Arctic foxes (Alopex lagopus) during
winter and spring in western Alaska. J Mamm 2000; 81: 820-828.
Arai T, Ikemoto T, Hokura A, Terada Y, Kunito T, Tanabe S, Nakai I. Chemical forms of
mercury and cadmium accumulated in marine mammals and seabirds as
determined by XAFS analysis. Environ Sci Technol 2004; 38: 6468-6474.
Aschner M, Aschner JL. Mercury neurotoxicity: mechanism of blood-brain barrier
transport. Neurosci BiobehavRev 1990; 14: 169-176.
Baeyens W, Leermakers M, Papina T, Saprykin A, Brion N, Noyen J, De Gieter M,
Elskens M, Goeyens L. Bioconcentration and biomagnification o f mercury and
methylmercury in North Sea and Schelt Estuary fish. Arch Environ Contam
Toxicol 2003; 45: 498-508.
Barbier O, Dauby A, Jacquillet G, Tauc M, Poujeol P, Cougnon M. Zinc and cadmium
interactions in a renal cell line derived from rabbit proximal tubule. Nephron
Physiol 2005; 99: 74-84.
235
Barboza PS, Farley SD, Robbins CT. Whole-body urea cycling and protein turnover
during hyperphagia and dormancy in growing bears (Ursus americanus and U.
arctos). Can J Zool 1997; 75: 2129-2136.
236
Bard HM. Global transport o f anthropogenic contaminants and the consequences for the
Arctic marine ecosystem. Mar Pollut Bull 1999; 38: 356-379.
Barrie LA, Gregor D, Hargrave B, Lake R, Muir D, Shearer R, Tracey B, Bidleman T.
Arctic contaminants: sources, occurrence and pathways. Sci Total Environ 1992;
122:1-74.
Bearhop S, Waldron S, Votier SC, Furness RW. Factors that influence assimilation rates
and fractionation of nitrogen and carbon stable isotopes in avian blood and
feathers. Physiol Biochem Zool 2002; 75: 451-458.
Becker PR, Mackey EA, Demiralp R, Suydam R, Early G, Koster BJ, Wise SA.
Relationship o f silver with selenium and mercury in the liver o f two species of
toothed whales (Odontocetes). Mar Pollut Bull 1995; 30: 262-271.
Becker PR, Porter BJ, Macke EA, Schantz MM, Demiralp R, Wise SA. National Marine
Mammal Tissue Bank and Quality Assurance Program: protocols, inventory, and
analytical results. 1999. Gaithersburg, U. S. Department o f Commerce. NISTIR
6279, 183 pp.
Becker PR, Krahn MM, Mackey EA, Demiralp R, Schantz MM, Spstein MS, Donais
MK, Porter BJ, Muir DCG, Wise SA. Concentrations and polychlorinated
biphenyls (PCB's), chlorinated pesticides, and heavy metals and other elements in
tissues o f belugas, Delphinapterus leucas, from Cook Inlet, Alaska. Mar Fish Rev
2000; 62: 81-98.
Bell RA, Kramer JR. Structural chemistry and geochemistry o f silver-sulfur compounds:
Critical review. Environ Toxicol Chem 1999; 18: 9-22.
Belles-Isles M, Ayotte P, Dewailly E, Weber J-P, Roy R. Cord blood lymphocyte
functions in newborns from a remote maritime population exposed to
organochlorines and methylmercury. J Toxicol Environ Health A 2002; 65: 165-
182.
Bennett PM, Jepson PD, Law RJ, Jones BR, Kuiken T, Baker JR, Rogan E, Kirkwood
JK. Exposure to heavy metals in infectious disease mortality in harbour porpoises
from England and Wales. Environ Pollut 2001; 112: 33-40.
237
Bemtssen MH, Hylland K, Lundebye AK, Julshamn K. Higher faecal excretion and
lower tissue accumulation of mercury in Wistar rats from contaminated fish than
from methylmercury chloride added to fish. Food Chem Toxicol 2004; 40: 1359-
1366.
Berthet B, Amiard JC, Amiard-Triquet C, Martoja M, Jeantet AY. Bioaccumulation,
toxicity and physico-chemical speciation o f silver in bivalve molluscs:
ecotoxicological and health consequences. Sci Total Environ 1992; 125: 97-122.
Bloom NS, Crecelius EA. Determination of mercury in seawater at sub-nanogram per
liter levels. Mar Chem 1983; 14: 49-59.
Boening DW. Ecological effects, transport, and fate of mercury: a general review.
Chemosphere 2000; 40: 1335-1351.
Bogoslovskaya LS, Vorogov LM, Semenova TN. Feeding habits o f the gray whale off
Chukotka. Rep Int Whal Commn 1981; 31: 507-510.
Bohn A, McElroy RO. Trace metals (As, Cd, Cu, Fe and Zn) in Arctic cod, Boreogadus
saida, and selected zooplankton from Strathcona Sound, northern Baffin Island. J
Fish Res Bd Can 1976; 33: 2836-2840.
238
Borch-Iohnsen B, Nilssen KJ, Norheim G. Influence o f season and diet on liver and
kidney content of essential elements and heavy metals in Svalbard reindeer. Biol
Trace Elem Res 1996; 56: 235-247.
Bom EW, Outridge P, Riget FF, Hobson KA, Dietz R, 0 ien N, Haug T. Population
substructure of North Atlantic minke whales (Balaenoptera acutorostrata)
inferred from regional variation of elemental and stable isotopic signatures in
tissues. J Mar Sys 2003; 43: 1-17.
Bratton GR, Flory W, Spainhour CB, Haubold EM. Assessment o f selected heavy metals
in liver, kidney, muscle, blubber, and visceral fat o f Eskimo harvested bowhead
whales Balaena mysticetus from Alaska's North Coast. 1997. Barrow, Alaska,
Department o f Wildlife Management, North Slope Borough, 233 pp.
Braune BM, Norstrom RJ, Wong MP, Collins BT, Lee J. Geographical distribution of
metals in livers of polar bears from the Northwest Territories, Canada. Sci Total
Environ 1991; 100: 283-299.
Bremner I, Beattie JH. Metallothionein and the trace minerals. Annu Rev Nutr 1990; 10:
239
63-83.
Bryan GW, Langston WJ. Bioavailability, accumulation and effects o f heavy metals in
sediments with special reference to United Kingdom estuaries: a review. Environ
Pollut 1992; 76: 89-131.
240
Bukhtiyarov YA, Frost KJ, Lowry LF. New information on foods of the spotted seal,
Phoca largha, in the Bering Sea in spring. U.S. Department of Commerce,
NOAA Technical Report 1984; 12: 55- 59.
Bums JJ. Remarks on the distribution and natural history o f pagophilic pinnipeds in the
Bering and Chukchi Seas. J Mamm 1970; 51: 445-454.
Burton RK, Koch PL. Isotopic tracking of foraging and long-distance migration in
northeastern Pacific pinnipeds. Oecologia 1999; 119: 578-585.
Bustamante P, Caurant F, Fowler SW, Miramand P. Cephalopods as a vector for the
transfer o f cadmium to top marine predators in the north-east Atlantic Ocean. Sci
Total Environ 1998; 220: 71-80.
Bustamante P, Bocher P, Cherel Y, Miramand P, Caurant F. Distribution of trace
elements in the tissues of benthic and pelagic fish from the Kerguelen Islands. Sci
Total Environ 2003; 313: 25-39.
Bustamante P, Teyssie J-L, Danis B, Fowler SW, Miramand P, Cotret O, Wamau M.
Uptake, transfer and distribution of silver and cobalt in tissues o f common
cuttlefish Sepia officinalis at different stages o f its life cycle. Mar Ecol Prog Ser
2004a; 269: 185-195.
Bustamante P, Morales CF, Mikkelsen B, Dam M, Caurant F. Trace element
bioaccumulation in grey seals Halichoerus grypus from Faroe Islands. Mar Ecol
Prog Ser 2004b; 267: 291-301.
Caurant F, Navarro M, Amiard J-C. Mercury in pilot whales: possible limits to the
detoxification process. Sci Total Environ 1996; 186: 95-104.
Chesemore DL. Notes on the food habits of Arctic foxes in northern Alaska. Can J Zool
1968; 46: 1127-1130.
Clapham PJ, Young SB, Brownell RL. Baleen whales: conservation issues and the status
of the most endangered populations. Mamm Rev 1999; 29: 35-60.
Conover WJ. Practical nonparametric statistics. John Wiley and Sons, Inc., New York,
1999,584 pp.
241
Cousins RJ. Toward a molecular understanding o f zinc metabolism. Clin Physiol
Biochem 1986; 4: 20-30.
Danscher G, Mo Her-Madsen B. Silver amplification of mercury sulfide and selenide: a
histochemical method for light and electron microscopic localization of mercury
in tissue. J Histochem Cytochem 1985; 33: 219-228.
Das K, Debacker V, Bouquegneau JM. Metallothioneins in marine mammals. Cell Mol
Biol 2000; 46: 283-294.
Das K, Jacob V, Bouquegneau JM. White-sided dolphin metallothioneins: purification,
characterization and potential role. Comp Biochem Physiol C 2002; 131: 245-251.
Das K, Lepoint G, Leroy Y, Bouquegneau JM. Marine mammals from the southern North
Sea: feeding ecology data from 813C and §15N measurements. Mar Ecol Prog Ser
2003; 263:287-298.
Das K, Siebert U, Fontaine M, Jauniaux T, Holsbeek L, Bouquegneau J-M. Ecological
and pathological factors related to trace metal concentrations in harbour porpoises
Phocoena phocoena from the North Sea and adjacent areas. Mar Ecol Prog Ser
2004a; 281:283-295.
242
E
Das K, Holsbeek L, Browning J, Siebert U, Birkun A , Bouquegneau J-M. Trace metal
and stable isotope measurements (813C and 815N) in the harbour porpoise
Phocoena phocoena relicta from the Black Sea. Environ Pollut 2004b; 131: 197-
204.
Decataldo A, Di Leo A, Giandomenico S, Cardellicchio N. Association of metals
(Mercury, cadmium and zinc) with metallothionein-like proteins in storage organs
of stranded dolphins from the Mediterranean sea (Southern Italy). J Environ
Monit 2004; 6: 361-367.
Dehn, L-A. Trophic relationships in an Arctic marine foodweb and implications for trace
element dynamics. Ph.D. thesis, Department of Biology and Wildlife, University
o f Alaska Fairbanks, Fairbanks, Alaska, in preparation.
Dehn L-A, Follmann EH, Rosa C, Duffy LK, Thomas DL, Bratton GR, Taylor RJ,
O’Hara TM. Stable isotope and trace element status o f subsistence hunted
bowhead (Balaena mysticetus) and beluga whales (Delphinapterus leucas) in
Alaska and gray whales (Eschrichtius robustus) in Chukotka. Mar Pollut Bull
submitted.
Dehn L-A, Sheffield GG, Follmann EH, Duffy LK, Thomas DL, Bratton GR, Taylor RJ,
O'Hara TM. Trace elements in tissues of phocid seals harvested in the Alaskan
243
244
and Canadian Arctic - Influence o f age and feeding ecology. Can J Zool; 2005;
83: 726-746.
Derocher AE, Wiig 0 , Bangjord G. Predation of Svalbard reindeer by polar bears. Polar
Biol 2000; 23: 675-678.
Deutch B, Hansen JC. High human plasma levels of organochlorine compounds in
Greenland. Dan Med Bull 2000; 47: 132-137.
Dietz R, Riget F, Johansen P. Lead, cadmium, mercury and selenium in Greenland
marine animals. Sci Total Environ 1996; 186: 67-93.
Dietz R, Paludan-Miiller P, Agger CT, Nielsen CO. Cadmium, mercury, zinc and
selenium in ringed seals (Phoca hispida) from Greenland and Svalbard.
NAMMCO Scientific Publications, Tromso, 1998, pp. 242-273.
Ebinghaus R, Kock HH, Temme C, Einax JW, Lowe AG, Richter A, Burrows JP,
Schroeder WH. Antarctic springtime depletion of atmospheric mercury. Environ
Sci Techno1 2002; 36: 1238-1244.
Ebisuda K, Kunito T, Fujihara J, Kubota R, Shibata Y, Tanabe S. Lipid-soluble and
water-soluble arsenic compounds in blubber o f ringed seal (Pusa hispida).
Talanta 2003; 61: 779-787.
Fay FH. Ecology and biology o f the Pacific Walrus, Odobenus rosmarus divergens
Illiger. United States Department of the Interior, Fish and Wildlife Service, North
American Fauna 74, Washington, D. C., 1982, 279 pp.
Fay FH, Bukhtiyarov YA, Stoker SW, Shults LM. Foods o f the Pacific walrus in winter
and spring in the Bering Sea. NOAA Technical Report, NMFS 1984; 12: 81- 88.
Fay FH, Stephenson RO. Annual, seasonal and habitat-related variation in feeding habits
of the arctic fox (Alopex lagopus) on St. Lawrence Island, Bering Sea. Can J Zool
1989; 67: 1986-1994.
Fedoseev GA. Population biology of ice-associated forms of seals and their role in the
northern Pacific ecosystems. Center for Russian Environmental Policy, Moscow,
2000, 271 pp.
Femandez-Mosquera D, Vila-Taboada M, Grandal-dAnglade A. Stable isotopes data
(513C, §15N) from the cave bear (Ursus spelaeus): a new approach to its
245
246
palaeoenvironment and dormancy. Proc R Soc London, Ser B 2001; 268: 1159-
1164.
Fisk AT, Hobson KA, Norstrom RJ. Influence of chemical and biological factors on
trophic transfer of persistent organic pollutants in the northwater polynya marine
food web. Environ Sci Technol 2001; 35: 732-738.
Folkow LP, Blix AS. Diving behaviour of hooded seals (Cystophora cristata) in the
Greenland and Norwegian seas. Polar Biol 1999; 22: 61-74.
Fraljord K. Predation on an introduced vole Microtus rossiaemeridionalis by Arctic fox
Alopex lagopus on Svalbard. Wildlife Biol 2002; 8: 41-47.
France RL. Carbon-13 enrichment in benthic compared to planktonic algae: foodweb
implications. Mar Ecol Prog Ser 1995; 124: 307-312.
Frank A, Galgan V, Roos A, Olsson M, Petersson LR, Bignert A. Metal concentrations in
seals from Swedish waters. Ambio 1992; 21: 529-538.
Frost KJ, Lowry LF. Feeding of ribbon seals (Phoca fasciata) in the Bering Sea in spring.
Can J Zool 1980; 58: 1601-1607.
Fuglei E, 0ritsland NA. Seasonal trends in body mass, food intake and resting metabolic
rate, and induction of metabolic depression in arctic foxes (Alopex lagopus) at
Svalbard. J Comp Physiol B 1999; 169: 361-369.
Gallien I, Caurant F, Bordes M, Bustamante P, Miramand P, Fernandez B, Quellard N,
Babin P. Cadmium-containing granules in kidney tissue of the Atlantic white
sided dolphin (Lagenorhyncus acutus) off the Faroe Islands. Comp Biochem
Physiol C 2001; 130: 389-395.
Gauthier JM, Dubeau H, Rassart E. Mercury-induced micronuclei in skin fibroblasts of
beluga whales. Environ Toxicol Chem 1998; 17: 2487-2493.
George JC, Bada J, Zeh J, Scott L, Brown SE, O'Hara T, Suydam R. Age and growth
estimates o f bowhead whales (Balaena mysticetus) via aspartic acid racemization.
Can J Zool 1999; 77: 571-580.
Gilbert RO. Statistical methods for environmental pollution monitoring. John Wiley and
Sons, Inc., New York, 1987, 320 pp.
Groten JP, Sinkeldam EJ, Luten JB, van Bladeren PJ. Comparison of the toxicity of
inorganic and liver-incorporated cadmium: a 4-wk feeding study in rats. Food
Chem Toxicol 1990; 28: 435-441.
247
Groten JP, Sinkeldam EJ, Luten JB, van Bladeren PJ. Cadmium accumulation and
metallothionein concentrations after 4-week dietary exposure to cadmium
chloride or cadmium-metallothionein in rats. Toxicol Appl Pharmacol 1991; 111:
504-513.
Hamanaka T, Ogi H. Cadmium and zinc concentrations in the hyperiid amphipod,
Parathemisto libellula from the Bering Sea. Bull Fac Fish Hokkaido Univ 1984;
35: 171-178.
Hammill MO, Smith TG. The role of predation in the ecology o f the ringed seal in
Barrow Strait, Northwest Territories, Canada. Mar Mamm Sci 1991; 7: 123-135.
Hansen CT, Nielsen CO, Dietz R, Hansen MM. Zinc, cadmium, mercury and selenium in
minke whales, belugas and narwhals from West Greenland. Polar Biol 1990; 10:
529-539.
Hauksson E, Bogason V. Comparative feeding of grey (Halichoerus grypus) and
common seals (Phoca vitulina) in coastal waters of Iceland, with a note on the
diet o f hooded (Cystophora cristata) and harp seals (Phoca groenlandica). J
Northw Atl Fish Sci 1997; 22:125-135.
248
Hein JR, Koski RA, Embley RW, Reid J, Chang S-W. Diffuse-flow hydrothermal field in
an oceanic fracture zone setting, Northeast Pacific: Deposit composition. Explor
M inGeol 1999; 8: 299-322.
Hobson KA, Clark RG. Assessing avian diets using stable isotopes II: Factors influencing
diet-tissue fractionation. Condor 1992; 94: 189-197.
Hobson KA, Welch HE. Determination of trophic relationships within a high Arctic
marine food web using dl3C and dl5N analysis. Mar Ecol Prog Ser 1992; 84: 9-
18.
Hobson KA, Alisauskas RT, Clark RG. Stable-nitrogen isotope enrichment in avian
tissues due to fasting and nutritional stress: implications for isotopic analyses of
diet. Condor 1993; 95: 388-394.
Hobson KA, Schell DM, Renouf D, Noseworthy E. Stable carbon and nitrogen isotopic
fractionation between diet and tissues of captive seals: implications for dietary
reconstructions involving marine mammals. Can J Fish Aquat Sci 1996; 53: 528-
533.
249
L
Hobson KA, Sease JL, Merrick RL, Piatt JF. Investigating trophic relationships of
pinnipeds in Alaska and Washington using stable isotope ratios o f nitrogen and
carbon. Mar Mamm Sci 1997; 13: 114-132.
Hobson KA, Fisk AT, Kamovsky N, Holst M, Gagnon J-M, Fortier M. A stable isotope
(513C, 515N) model for the North Water foodweb: implications for evaluating
trophodynamics and the flow of energy and contaminants. Deep-Sea Res II 2002;
49: 5131-5150.
Hoekstra PF, Dehn L-A, George JC, Solomon KR, Muir DCG, O'Hara TM. Trophic
ecology of bowhead whales (Balaena mysticetus) compared with that of other
arctic marine biota as interpreted from carbon-, nitrogen-, and sulfur-isotope
signatures. Can J Zool 2002; 80: 223-231.
Hoekstra PF, O'Hara TM, Fisk AT, Borga K, Solomon KR , Muir DCG. Trophic transfer
of persistent organochlorine contaminants (OCs) within an Arctic marine food
web from the southern Beaufort-Chukchi Seas. Environ Pollut 2003; 124: 509-
522.
Honda K, Tatsukawa R, Itano K, Miyazaki N, Fujiyama T. Heavy metal concentrations in
muscle, liver and kidney tissue of striped dolphin, Stenella coeruleoalba, and their
250
variations with body length, weight, age and sex. Agric Biol Chem 1983; 47:
1219-1228.
251
Hop H, Borga K, Gabrielsen GW, Kleivane L, Skaare JU. Food web magnification of
persistent organic pollutants in poikilotherms and homeotherms from the Barents
Sea. Environ Sci Technol 2002; 36: 2589-2597.
Hu H, Rabinowitz M, Smith D. Bone lead as a biological marker in epidemiologic studies
of chronic toxicity: conceptual paradigms. Environ Health Perspect 1998; 106: 1-
8 .
Huntington HP. Traditional knowledge of the ecology of belugas, Delphinapterus leucas,
in Cook Inlet, Alaska. Mar Fish Rev 2000; 62: 134-140.
Ilback N-G, Glynn AW, Wikberg L, Netzel E, Lindh U. Metallothionein is induced and
trace element balance changed in target organs o f a common viral infection.
Toxicology 2004; 199: 241-250.
Johnson DE. Applied multivariate methods for data analysis. Duxbury Press, Pacific
Grove, California. 1998, 567 pp.
Julshamn K, Grahl-Nielsen O. Trace element levels in harp seal (Pagophilus
groenlandicus) and hooded seal (Cystophora cristata) from the Greenland Sea. A
multivariate approach. Sci Total Environ 200; 250: 123-133.
Kelly JF. Stable isotopes of carbon and nitrogen in the study o f avian and mammalian
trophic ecology. Can J Zool 2000; 78: 1-27.
Koeman JH, Peeters WHM, Koudstaal-Hol CHM. Mercury-selenium correlations in
marine mammals. Nature 1973; 245: 385-386.
Koeman JH, van de Ven WS, de Goeij JJ, Tjioe PS, van Haaften JL. Mercury and
selenium in marine mammals and birds. Sci Total Environ 1975; 3: 279-287.
Krebs CJ, Kenney AJ, Gilbert S, Danel K, Angerbjom A, Erlinge S, Bromley RG, Shank
C, Carriere S. Synchrony in lemming and vole populations in the Canadian
Arctic. Can J Zool 2002; 80: 1323-1333.
Kubota R, Kunito T, Tanabe S. Arsenic accumulation in the liver tissue of marine
mammals. Environ Pollut 2001; 115: 303-312.
252
Lalancette A, Morin Y, Measures LFM. Contrasting changes o f sensitivity by
lymphocytes and neutrophils to mercury in developing grey seals. Develop Comp
Immunol 2003; 27: 735-747.
253
Laporte JM, Andres S, Mason RP. Effect of ligands and other metals on the uptake of
mercury and methylmercury across the gills and the intestine of the blue crab
('Callinectes sapidus). Comp Biochem Physiol C 2002; 131: 185-196.
Law RJ. Metals in marine mammals. In: Beyer WN, Heinz GH, Redmon-Norwood AW,
editors. Environmental contaminants in wildlife: interpreting tissue
concentrations. CRC Press, Inc., Boca Raton, Florida, 1996, pp. 357-376.
Lesage V, Hammill MO, Kovacs KM. Marine mammals and the community structure of
the Estuary and Gulf o f St. Lawrence, Canada: evidence from stable isotope
analysis . Mar Ecol Prog Ser 2001; 210: 203-221.
Lind Y, Engman J, Jorhem L, Glynn AW. Cadmium absorption in mice: effects of
broiling on bioavailability of cadmium in foods o f animal origin. J Toxicol
Environ Health A 2001; 62: 269-280.
Lindberg SE, Brooks S, Lin C-J, Scott KJ, Landis MS, Stevens RK, Goodsite M, Richter
A. Dynamic oxidation of gaseous mercury in the Arctic troposphere at polar
sunrise. Environ Sci Technol 2002; 36: 1245-1256.
Lodenius M, Soltanpour-Gargari A, Tulisalo E, Henttonen H. Effects of ash application
on cadmium concentration in small mammals. J Environ Qual 2002; 31: 188-192.
Lowry LF, Frost KJ, Bums JJ. Variability in the diet of ringed seals, Phoca hispida, in
Alaska. Can J Fish Aquat Sci 1980a; 37: 2254-2261.
Lowry LF, Frost KJ, Bums JJ. Feeding of bearded seals in the Bering and Chukchi Seas
and trophic interaction with Pacific walrus. Arctic 1980b; 33: 330-342.
Lowry LF, Frost KJ, Calkins DG, Swartzman GL, Hills S. Feeding habits, food
requirements, and status o f Bering Sea marine mammals. 1982. Anchorage, North
Pacific Fishery Management Council, 233 pp.
Lowry LF, Bums JJ, Nelson RR. Polar bear, Ursus maritimus, predation on belugas,
Delphinapterus leucas, in the Bering and Chukchi Seas. Can Field-Nat 1987; 101:
141-146.
254
Lowry LF. Foods and feeding ecology. In: Bums JJ, Montague JJ, Cowles CJ, editors.
The bowhead whale. The Society for Marine Mammalogy, Special Publication 2,
1993, pp. 201-238.
Lowry LF, Sheffield G. Stomach contents of bowhead whales harvested in the Alaskan
Beaufort Sea. In: Richardson WJ, Thompson DH, editors. Bowhead whale
feeding in the Eastern Alaskan Beaufort Sea: Update o f scientific and traditional
information. Vol. 1. 2002. OCS Study MMS 2002-012. LDL Report TA2196-7.
LGL Ltd. King City, Ontario, Canada, pp. 1810-1828.
Macdonald CR, Sprague JB. Cadmium in the marine invertebrate and arctic cod in the
Canadian Arctic. Distribution and ecological implications. Mar Ecol Prog Ser
1988; 47: 17-30.
Martin JH, Flegal AR. High copper concentrations in squid livers in association with
elevated levels of silver, cadmium, and zinc. Mar Biol 1975; 30: 51-55.
McCutchan JH, Lewis WM, Kendall C, McGrath CC. Variation in trophic shift for stable
isotope ratios o f carbon, nitrogen, and sulfur. OIKOS 2003; 102: 378-390.
McGeer JC, Brix KV, Skeaff JM, DeForest DK, Brigham SI, Adams WJ, Green A.
Inverse relationship between bioconcentration factor and exposure concentration
255
for metals: implications for hazard assessment o f metals in the aquatic
environment. Environ Toxicol Chem 2003; 22: 1017-1037.
Medvedev N, Panichev N, Hyvarinen. Levels of heavy metals in seals of Lake Ladoga
and the White Sea. Sci Total Environ 1997; 206: 95-105.
Miles AK, Calkins DG, Coon NC. Toxic elements and organochlorines in harbor seals
(Phoca vitulina richardsi), Kodiak, Alaska, USA. Bull Environ Contam Toxicol
1992; 48: 727-732.
Miller S, Proffitt K, Schliebe S. Demography and behavior o f polar bears feeding on
marine mammal carcasses. Second Interim Report. 2004. U.S. Department of the
Interior. Mineral Management Service. Alaska Outer Continental Shelf Region,
22 pp.
Morel FMM, Kraepiel AML, Amyot M. The chemical cycle and bioaccumulation of
mercury. Annu Rev Ecol Sys 1998; 29: 543-566.
Muir DCG, Segstro MD, Hobson KA, Ford CA, Stewart REA, Olpinski S. Can Seal
Eating Explain Elevated Levels of PCBs and Organochlorine Pesticides in Walrus
Blubber from Eastern Hudson Bay (Canada)? Environ Pollut 1995; 90: 335-348.
Nigro M, Campana A, Lanzillotta E, Ferrara R. Mercury exposure and elimination rates
in captive bottlenose dolphins. Mar Pollut Bull2002; 44: 1071-1075.
Norheim G, Skaare JU, Wiig 0 . Some heavy metals, essential elements, and chlorinated
hydrocarbons in polar bear (Ursus maritimus) at Svalbard. Environ Pollut 1992;
77: 51-57.
Norstrom RJ, Schweinsburg RE, Collins BT. Heavy metals and essential elements in
liver o f the polar bear (Ursus maritimus) in the Canadian Arctic. Sci Total
Environ 1986; 48: 195-212.
Olsson M, Karlsson B, Ahnland E. Diseases and environmental contaminants in seals
from the Baltic and Swedish west coast. Sci Total Environ 1994; 154: 217-227.
Paludan-Miiller P, Agger CT, Dietz R, Kinze CC. Mercury, cadmium, zinc, copper and
selenium in harbour porpoise (Phocoena phocoena) from West Greenland. Polar
Biol 1993; 13:311-320.
Polischuk SC, Hobson KA, Ramsay MA. Use of stable-carbon and -nitrogen isotopes to
assess weaning and fasting in female polar bears and their cubs. Can J Zool 2001;
79: 499-511.
257
L
Pond CM, Mattacks CA, Gilmour I, Johnston MA, Pillinger CT, Prestrud P. Chemical
and carbon isotopic composition of fatty acids in adipose tissue as indicators of
dietary history in wild arctic foxes (Alopex lagopus) on Svalbard. J Zool, Lond
1995;236:611-623.
Poole KG, Elkin BT, Bethke RW. Organochlorine and heavy metal contaminants in wild
mink in western Northwest Territories, Canada. Arch Environ Contam Toxicol
1998; 34: 406-413.
Presley BJ. A review of arctic trace metal data with implications for biological effects.
Mar Pollut Bull 1997; 35: 226-234.
Prestrud P. Food habits and observations of the hunting behaviour of Arctic foxes, Alopex
lagopus, in Svalbard. Can Field-Nat 1992; 106: 225-236.
Prestrud P, Norheim G, Sivertsen T, Daae HL. Levels o f toxic and essential elements in
arctic fox in Svalbard. Polar Biol 1994; 14: 155-159.
Purcell TW, Peters JJ. Sources of silver in the environment. Environ Toxicol Chem 1998;
17: 539-546.
258
Pyle DM, Mather TA. The importance of volcanic emissions for the global atmospheric
mercury cycle. Atmos Environ 2003; 37: 5115-5124.
Rainbow PS. Heavy metals in Aquatic Invertebrates. In: Beyer WN, Heinz GH, Redmon-
Norwood AW, editors. Environmental contaminants in wildlife: interpreting tissue
concentrations. CRC Press, Inc., Boca Raton, Florida, 1996, pp. 405-425.
Rainbow PS, Black WH. Cadmium, zinc and the uptake o f calcium by two crabs,
Carcinus maenas and Eriocheir sinensis. Aquat Toxicol 2005; 72: 45-65.
Ramsay MA, Hobson KA. Polar bears make little use o f terrestrial food webs: evidence
from stable-carbon isotope analysis. Oecologia 1991; 86: 598-600.
Ratte HT. Bioaccumulation and toxicity of silver compounds: A review. Environ Toxicol
Chem 1999; 18: 89-108.
Reeves PG, Chaney RL. Marginal nutritional status of zinc, iron, and calcium increases
cadmium retention in the duodenum and other organs o f rats fed rice-based diets.
Environ Res 2004; 96: 311-322.
Rice DW, Wolman AA. The life history and ecology of the gray whale (Eschrichtius
robustus). The American Society of Mammalogists 1971; Special publication 3.
Ritterhoff J, Zauke G-P. Trace metals in field samples o f zooplankton from the Farm
Strait and the Greenland Sea. Sci Total Environ 1997; 199: 255-270.
260
Roth JD, Hobson KA. Stable carbon and nitrogen isotopic fractionation between diet and
tissue of captive red fox: implications for dietary reconstructions. Can J Zool
2000; 78: 848-852.
Roth JD. Variability in marine resources affects arctic fox population dynamics. J Anim
Ecol 2003; 72: 668-676.
Rouleau C, Gobeil C, Tjalve H. Accumulation o f silver from the diet in two marine
benthic predators: the snow crab (Chionoecetes opilio) and American plaice
(Hippoglossoid.es platessoides). Environ Toxicol Chem 2000; 9: 631-637.
Saeki K, Nakajima M, Loughlin TR, Calkins DC, Baba N, Kiyota M, Tatsukawa R.
Accumulation o f silver in the liver of three species o f pinnipeds. Environ Pollut
2001; 112: 19-25.
Satoh M, Nishimura N, Kanayama Y, Naganuma A, Suzuki T, Tohyama C. Enhanced
renal toxicity by inorganic mercury in metallothionein-null mice. J Pharmacol
Exp Ther 1997; 283: 1529-1533.
►%■L.
Schell DM, Saupe SM, Haubenstock N. Natural isotope abundance in bowhead whale
(Balaena mysticetus) baleen: markers of aging and habitat usage. In: Rundel PW,
Ehleringer JR, Nagy KA, editors. Stable isotopes in ecological research. Springer-
Verlag, Berlin, 1989, pp. 261-269.
Schmutz JA, Hobson KA. Geographic, temporal, and age-specific variation in diets of
glaucous gulls in Western Alaska. Condor 1998; 100: 119-130.
Seaman GA, Lowry LF, Frost KJ. Foods of belukha whales (Delphinapterus leucas) in
Western Alaska. Cetology 1982; 44: 1-19.
Shi CY, Lane AT, Clarkson TW. Uptake o f mercury by the hair o f methylmercury-
treated newborn mice. Environ Res 1990; 51: 170-181.
Shustov AP. The food o f ribbon seals in the Bering Sea. Izvestiia TINRO 1965; 59: 178-
183.
Sichak SP, Mavis RD, Finkelstein JN, Clarkson TW. An examination o f the oxidation of
mercury vapor by rat brain homogenate. J Biochem Toxicol 1986; 1: 53-68.
Smith TG, Armstrong FAJ. Mercury in seals, terrestrial carnivores, and principal food
items o f the Inuit, from Holman, N. W. T. J Fish Res Bd Can 1975; 32: 795-801.
261
Smith TG. Predation o f ringed seal pups (Phoca hispida) by the arctic fox (Alopex
lagopus). Can J Zool 1976; 54: 1610-1616.
Smith TG, Armstrong FAJ. Mercury and selenium in ringed and bearded seal tissues
from Arctic Canada. Arctic 1978; 31: 75-84.
Smith TG. Polar bear predation o f ringed and bearded seals in the land-fast sea ice
habitat. Can J Zool 1980; 58: 2201-2209.
Smith TG, Sjare B. Predation of belugas and narwhals by polar bears in nearshore areas
o f the Canadian High Arctic. Arctic 1990; 43: 99-102.
Solaiman D, Jonah MM, Miyazaki W, Ho G, Bhattacharyya MH. Increased
metallothionein in mouse liver, kidneys, and duodenum during lactation. Toxicol
Sci 2001; 60: 184-192.
Sponheimer M, Robinson T, Ayliffe L, Roeder B, Hammer J, Passey B, West A, Cerling
T, Dearing D, Ehleringer J. Nitrogen isotopes in mammalian herbivores: hair 515N
values from a controlled feeding study. Int J Osteoarch 2003; 13: 80-87.
262
Stirling I, McEwan E. The caloric value o f whole ringed seals (Phoca hispida) in relation
to polar bear (Ursus maritimus) ecology and hunting behavior. Can J Zool 1975;
53: 1021-1027.
Suda I, Takahashi H. Effect o f reticuloendothelial system blockade on the
biotransformation of methyl mercury in the rat. Bull Environ Contam Toxicol
1990; 44: 609-615.
Szepanski MM, Ben-David M, Van Ballenberghe V. Assessment of anadromous salmon
resources in the diet of Alexander Archipelago wolf using stable isotope analysis.
Oecologia 1999; 120: 327-335.
Tarpley RJ, Wade TL, Haubold EM. Toxicological studies in tissues of the beluga whale
Delphinapterus leucas along northern Alaska with an emphasis on public health
implications o f subsistence utilization. Final report to the Alaska Beluga Whale
Committee. 1995. North Slope Borough, Department o f Wildlife Management.
Barrow, Alaska.
Taylor DL, Schliebe S, Metske H. Contaminants in Blubber, Liver and Kidney Tissue of
Pacific Walruses. Mar Pollut Bull 1989; 20: 465-468.
263
Teigen SW, Andersen RA, Daae HL, Skaare JU. Heavy metal content in liver and
kidneys o f grey seals (Halichoerus grypus) in various life stages correlated with
metallothionein levels: some metal-binding characteristics o f this protein. Environ
Toxicol Chem 1999; 18: 2364-2369.
Tilbury KL, Stein JE, Krone CA, Brownell RL, Blokhin SA, Bolton JL, Ernest DW.
Chemical contaminants in juvenile gray whales (Eschrichtius robustus) from
subsistence harvest in Arctic feeding grounds. Chemosphere 2002; 47: 555-564.
Trefry JH, Rember RD, Trocine RP, Brown JS. Trace metals in sediments near offshore
oil exploration and production sites in the Alaskan Arctic. Environ Geol 2003; 6:
1- 12 .
US Environmental Protection Agency. Methods for the determination of metals in
environmental samples. CRC Press, Boca Raton, 1992, 352 pp.
Wagemann R, Stewart REA, Lockhart WL, Stewart BE, Povoledo M. Trace metals and
methyl mercury: associations and transfer in harp seal (Phoca groenlandica)
mothers and their pups. Mar Mamm Sci 1988; 4: 339-355.
Wagemann R. Comparison o f heavy metals in two groups o f ringed seals (Phoca hispida)
from the Canadian Arctic. Can J Fish Aquat Sci 1989; 46: 1558-1563.
264
Wagemann R, Stewart REA, Beland P, Desjardins C. Heavy metals and selenium in
tissues o f beluga whales, Delphinapterus leucas, from the Canadian Arctic and
the St. Lawrence estuary. Can Bull Fish Aquat Sci 1990; 224: 191-206.
Wagemann R, Stewart REA. Concentrations of heavy metals and selenium in tissues and
some foods of walrus (Odobenus rosmarus rosmarus) from eastern Canadian
Arctic and sub-Arctic, and associations between metals, age, and gender. Can J
Fish Aquat Sci 1994; 51: 426-436.
Wagemann R, Innes S, Richard P. Overview and regional and temporal differences of
heavy metals in Arctic whales and ringed seals in the Canadian Arctic. Sci Total
Environ 1996; 186: 41-66.
Wagemann R, Trebacz E, Hunt R, Boila G. Percent methylmercury and organic mercury
in tissues o f marine mammals and fish using different experimental and
calculation methods. Environ Toxicol Chem 1997; 16: 1859-1866.
Warburton J, Seagars DJ Heavy metal concentrations in liver and kidney tissues of
pacific walrus. Continuation of a baseline study. 1993. Anchorage, Alaska, US
Fish and Wildlife Service, 27 pp.
Watanabe I, Kunito T, Tanabe S, Amano M, Koyama Y, Miyazaki N, Petrov EA,
Tatsukawa R. Accumulation of heavy metals in Caspian seals (Phoca caspica).
Arch Environ Contam Toxicol 2002; 43: 109-120.
Wood CM, McDonald MD, Walker P, Grosell M, Barimo JF, Playle RC, Walsh PJ.
Bioavailability o f silver and its relationship to ionregulation and silver speciation
across a range o f salinities in the gulf toadfish (Opsanus beta). Aquat Toxicol
2004; 70: 137-157.
Woshner VM, O'Hara TM, Bratton GR, Beasley VR. Concentrations and interactions of
selected essential and non-essential elements in ringed seals and polar bears of
Arctic Alaska. J Wildl Dis 2001a; 37: 711-721.
Woshner VM, O'Hara TM, Bratton GR, Suydam RS, Beasley VR. Concentrations and
interactions of selected essential and non-essential elements in bowhead and
beluga whales o f Arctic Alaska. J Wildl Dis 2001b; 37: 693-710.
Yeats P, Stenson G, Hellou J. Essential elements and priority contaminants in liver,
kidney, muscle and blubber of harp seal beaters. Sci Total Environ 1999; 243/244:
157-167.
266
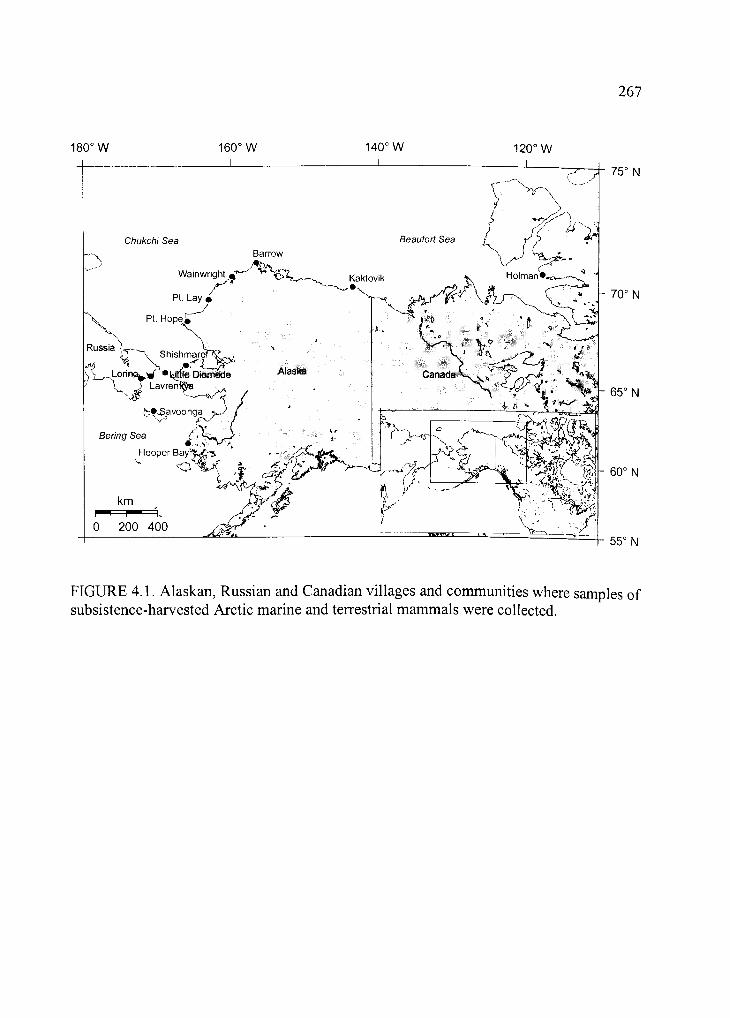
267
180° W 160° W 140° W 120° W
FIGURE 4.1. Alaskan, Russian and Canadian villages and communities where samples of subsistence-harvested Arctic marine and terrestrial mammals were collected.
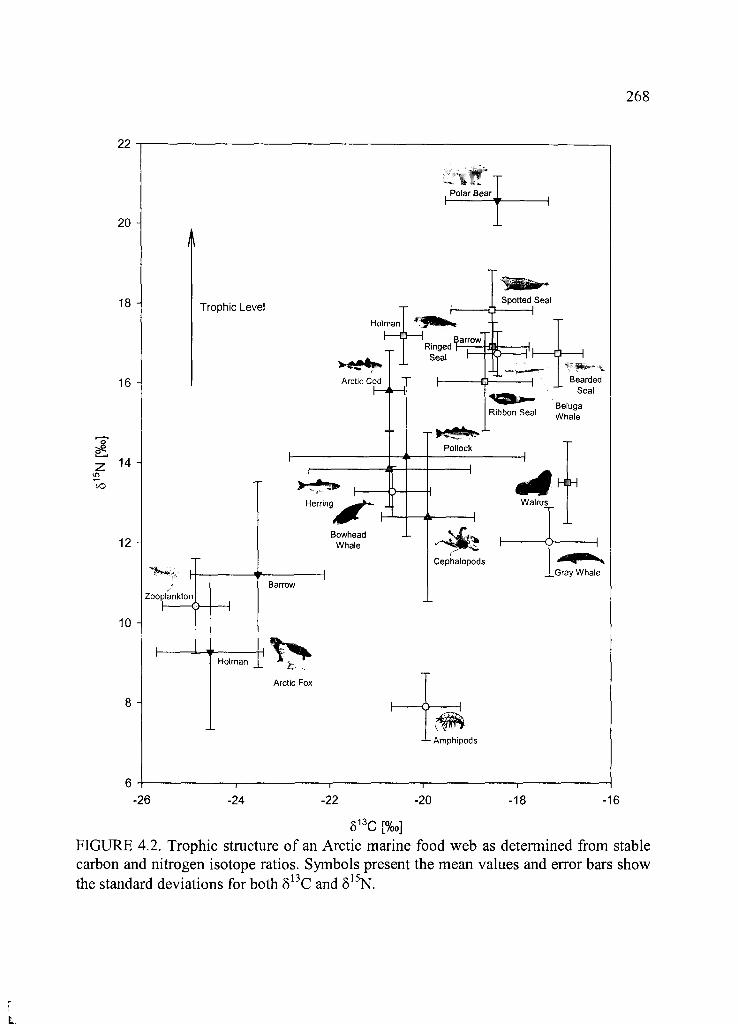
268
813C [ % o]
FIGURE 4.2. Trophic structure of an Arctic marine food web as determined from stable carbon and nitrogen isotope ratios. Symbols present the mean values and error bars show
1-1 1C
the standard deviations for both 5 C and S N.
L
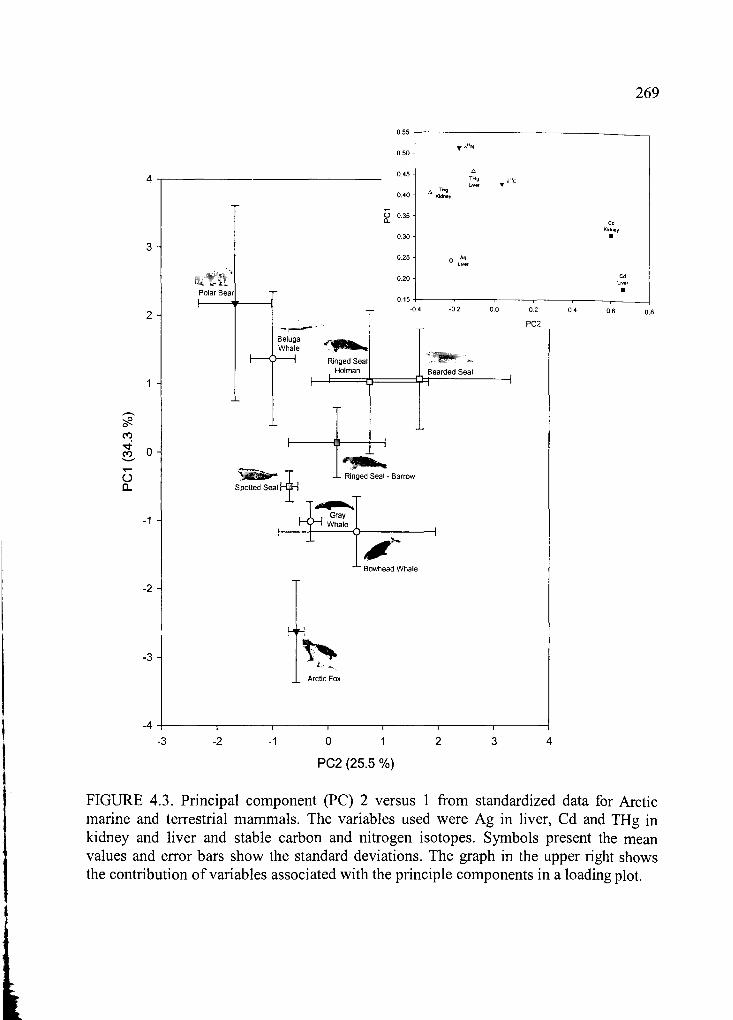
269
- 3 - 2 - 1 0 1 2 3 4PC2 (25.5 %)
FIGURE 4.3. Principal component (PC) 2 versus 1 from standardized data for Arctic marine and terrestrial mammals. The variables used were Ag in liver, Cd and THg in kidney and liver and stable carbon and nitrogen isotopes. Symbols present the mean values and error bars show the standard deviations. The graph in the upper right shows the contribution o f variables associated with the principle components in a loading plot.
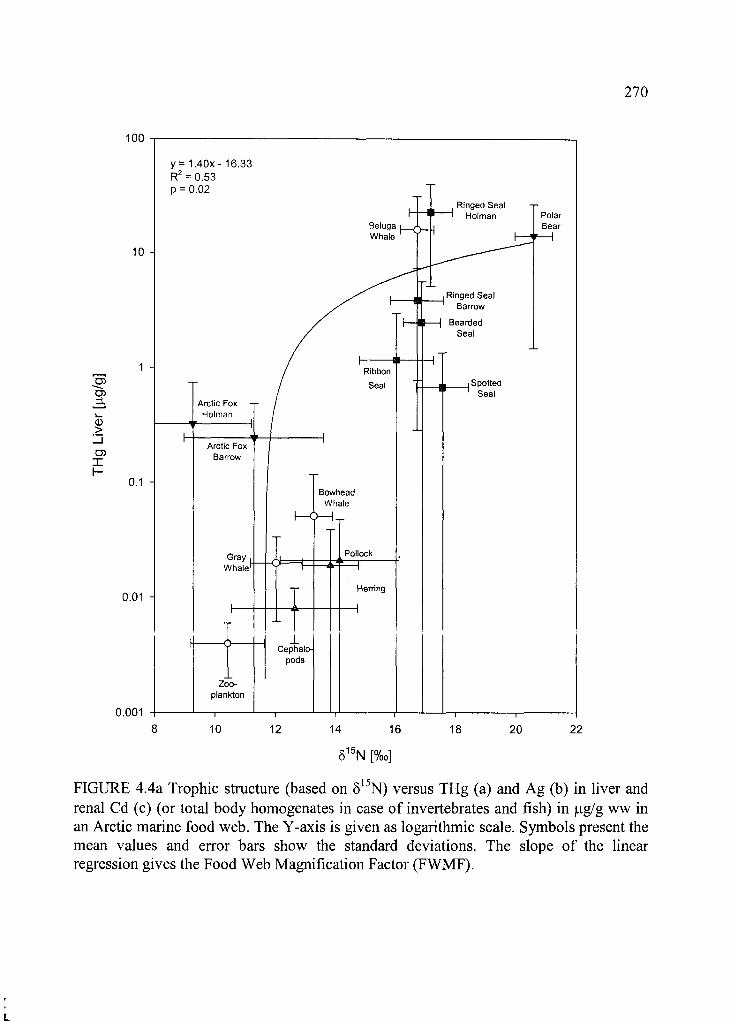
270
515N [%o]
FIGURE 4.4a Trophic structure (based on 615N) versus THg (a) and Ag (b) in liver and renal Cd (c) (or total body homogenates in case of invertebrates and fish) in (ig/g ww in an Arctic marine food web. The Y-axis is given as logarithmic scale. Symbols present the mean values and error bars show the standard deviations. The slope o f the linear regression gives the Food Web Magnification Factor (FWMF).
L
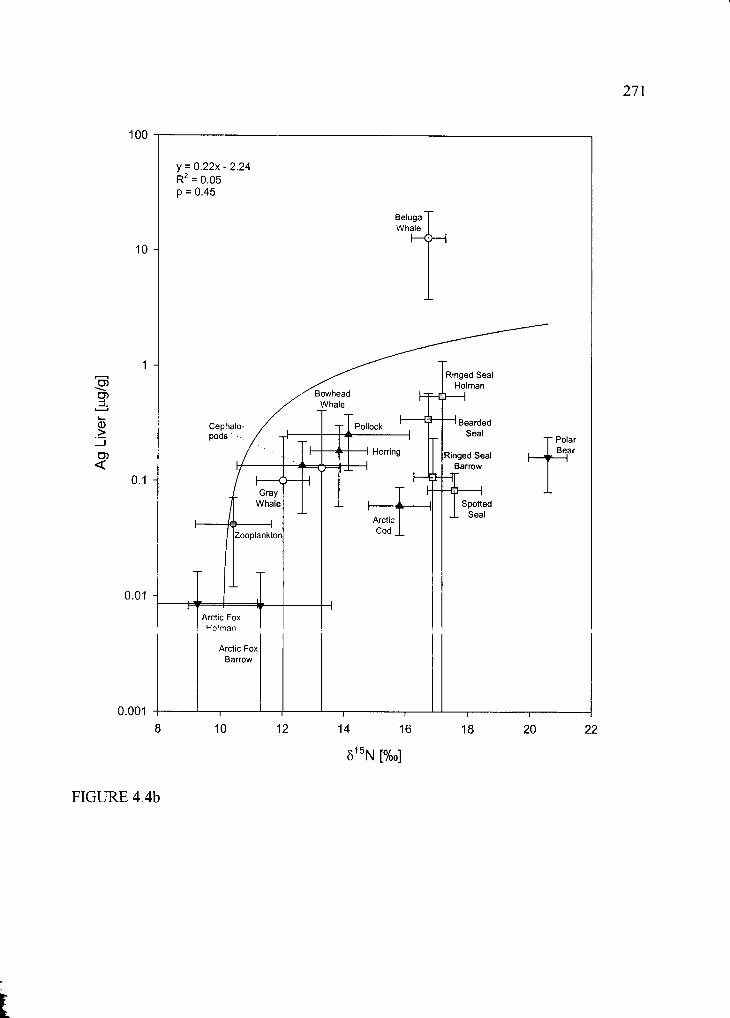
Ag
Live
r [n
g/g]
815N [ % o]
FIGURE 4.4b
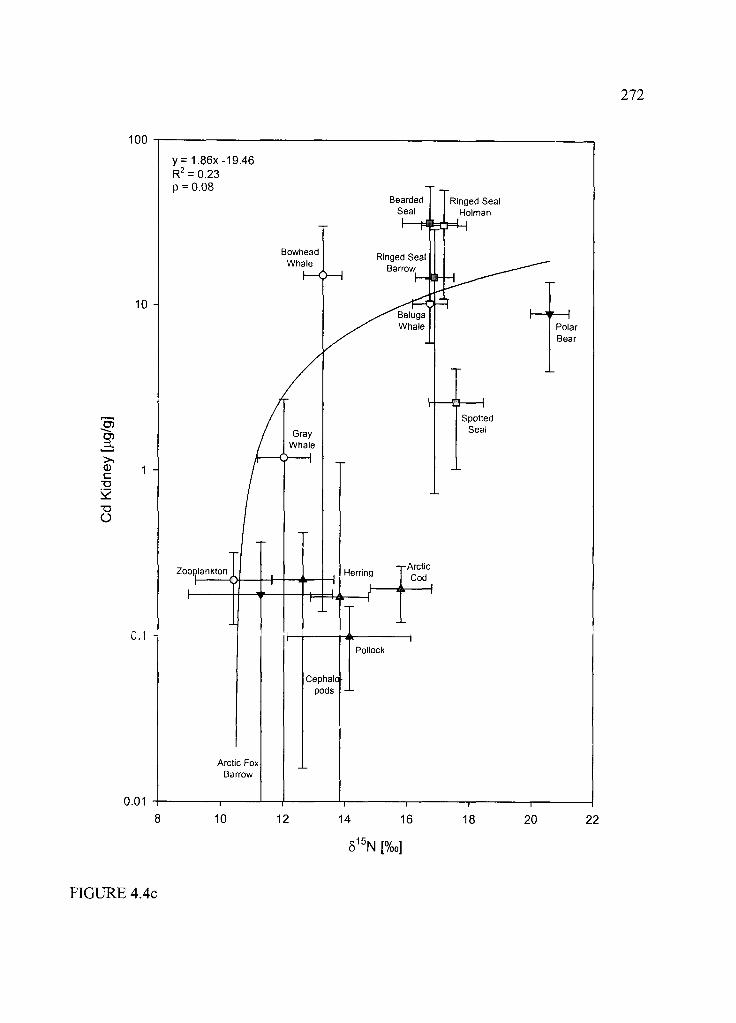
Cd
Kidn
ey
[|ag/
g]272
515N [ % o]
FIGURE 4.4c
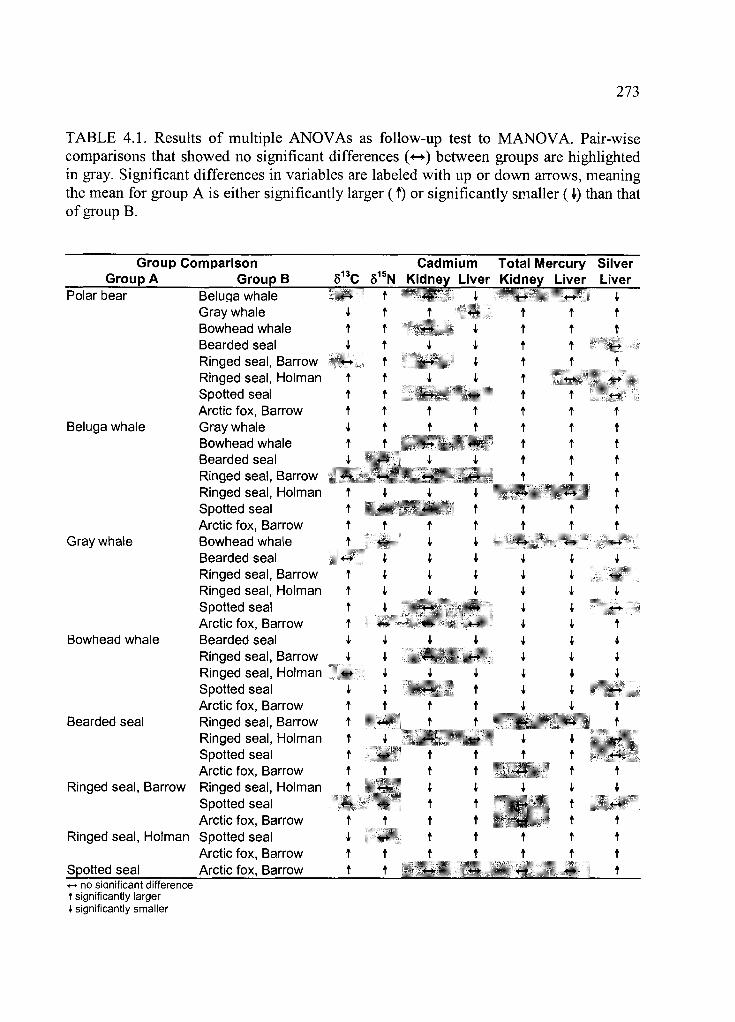
273
TABLE 4.1. Results o f multiple ANOVAs as follow-up test to MANOVA. Pair-wise comparisons that showed no significant differences (<-*) between groups are highlighted in gray. Significant differences in variables are labeled with up or down arrows, meaning the mean for group A is either significantly larger ( t) or significantly smaller (1) than that of group B.
Group Comparison Cadmium Total Mercury SilverGroup A___________Group B_____ S13C 815N Kidney Liver Kidney Liver Liver
Polar bear Beluga whale <-+ t 4 4Gray whale 4 t t t t tBowhead whale T t 4 t t tBearded seal 4 t 4 4 t t * - *
Ringed seal, Barrow _ * - * t «-» 4 t f tRinged seal, Holman t t 4 4 t 4-* «—►Spotted seal t t +-+ 4—* t T «—*Arctic fox, Barrow t t t t t t t
Beluga whale Gray whale 4 t t t t T TBowhead whale t t t tBearded seal 4 4- 4 t t tRinged seal, Barrow 4—►SiitwafMra!; 4- *-* t t tRinged seal, Holman t 4 4 4 4-> tSpotted seal t t t t tArctic fox, Barrow t t t t t t t
Gray whale Bowhead whale t 4 1 4—* 4-*Bearded seal 4—► 4 4 4 4 4 4Ringed seal, Barrow t 4 4 4 4 4Ringed seal, Holman t 4 4 4 4 4 4Spotted seal t 4 «-► 4—» 4 4 «-»■Arctic fox, Barrow t 4 4 t
Bowhead whale Bearded seal 4 4 4 4 4 4 4Ringed seal, Barrow 4 4 4 4 4Ringed seal, Holman 4—► 4 4 4 4 4 4Spotted seal 4 4 «—*■ t 4 4 4-*Arctic fox, Barrow t t t t 4 4 t
Bearded seal Ringed seal, Barrow t t t +-+ tRinged seal, Holman T 4 4—* +-» 4 4 4-*Spotted seal t «—► t t t t 4-+Arctic fox, Barrow T t t t t t
Ringed seal, Barrow Ringed seal, Holman t 4—► 4 4 4 4 ♦Spotted seal «—* 4—► t t <-» tArctic fox, Barrow t t t t •* - < t t t
Ringed seal, Holman Spotted seal 4 * - + t t t t tArctic fox, Barrow t t t t t t t
Spotted seal Arctic fox, Barrow t t *-► 4—► «—► t<-► no s ian ifican t d iffe rence t s ign ifican tly la rger * s ign ifican tly sm a lle r
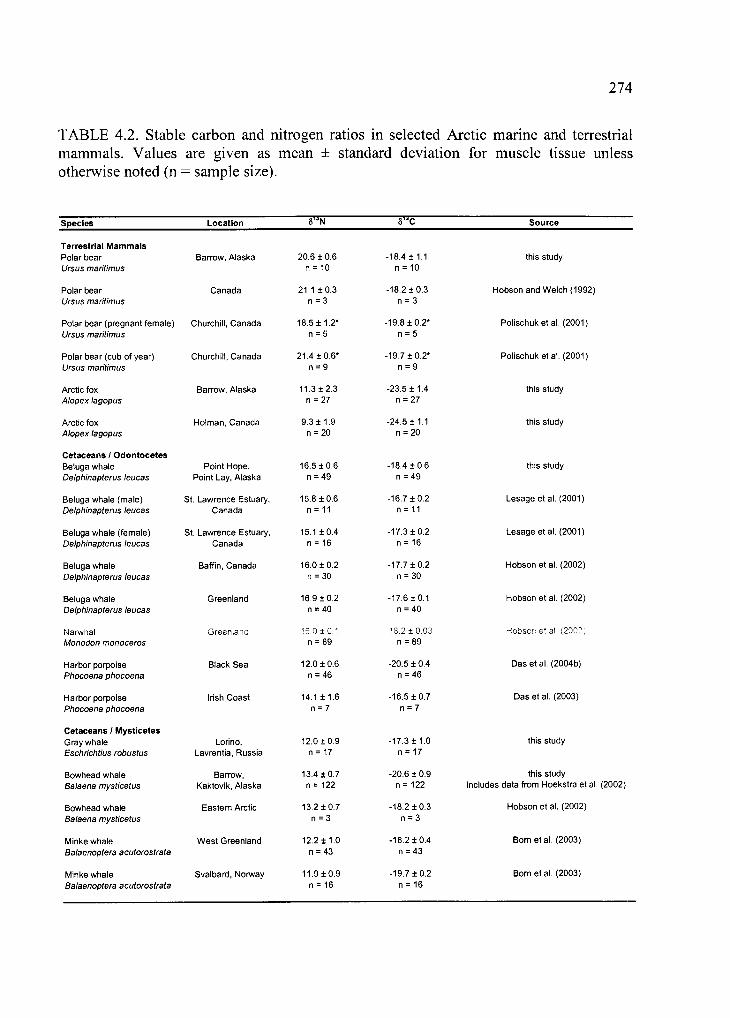
274
TABLE 4.2. Stable carbon and nitrogen ratios in selected Arctic marine and terrestrial mammals. Values are given as mean ± standard deviation for muscle tissue unless otherwise noted (n = sample size).
Species Location SloN 81JC Source
Terrestria l M am m alsPolar bear Ursus m aritim us
Barrow, Alaska 20.6 ± 0 .6 n = 10
-18.4 ±1 .1 n = 10
this study
Polar bearUrsus m aritim us
C anada 21.1 ± 0 .3 n = 3
-18.2 ± 0 .3 n = 3
Hobson and W elch (1992)
Po lar bear (pregnant fem a le) Ursus m aritim us
Church ill, C anada 18.5 ± 1 .2 * n = 5
-19.8 ± 0 .2 * n = 5
Po lischuk et al. (2001 )
Polar bear {cub o f year) Ursus m aritim us
Church ill, Canada 21.4 ± 0 .6 * n = 9
-19.7 ± 0 .2 * n = 9
Po lischuk et al. (2001)
Arctic fox Aiopex lagopus
Barrow, A laska 11.3 ± 2.3 n = 27
-23.5 ± 1 .4 n = 27
this study
Arctic fox Aiopex lagopus
Holm an, Canada 9.3 ± 1.9 n = 20
-24.5 ±1 .1 n = 20
th is study
Cetaceans / O dontocetesBeluga whale D elphinapterus leucas
Po int Hope, Po int Lay, A laska
16.5 ± 0 .6 n = 49
-18.4 ± 0 .6 n = 49
th is study
Beluga whale (m ale) Delphinapterus leucas
St. Law rence Estuary, Canada
15.8 ± 0 .6 n = 11
-16.7 ± 0.2 n = 11
Lesage et al. (2001)
Beluga whale (fem ale) Delphinapterus leucas
St. Law rence Estuary, Canada
15.1 ± 0 .4 n = 16
-17.3 ± 0 .2 n = 16
Lesage et al. (2001)
Beluga whale Delphinapterus leucas
Baffin, Canada 16.0 ± 0 .2 n = 30
-17.7 ± 0 .2 n = 30
Hobson e t al. (2002)
Beluga whale D elphinapterus leucas
Greenland 16.9 ± 0 .2 n = 40
-17.6 ± 0.1 n = 40
Hobson e t al. (2002)
NarwhalM onodon m onoceros
G reenlanc ■ 5.0 ± o.-: n = 89
13.2 ± 0.03 n = 89
Hobson et al (2002;
Harbor porpoise Phocoena phocoena
Black Sea 12.0 ± 0 .6 n = 46
-20.5 ± 0.4 n = 46
Das e t al. (2004b)
Harbor porpoise Phocoena phocoena
Irish Coast 14.1 ± 1 .6 n = 7
-16.5 ± 0 .7 n = 7
Das et al. (2003)
Cetaceans / M ysticetesG ray whale Eschrichtius robustus
Lorino, Lavrentia , Russia
12.0 ± 0 .9 n = 17
-17.3 ± 1.0 n = 17
th is study
Bowhead whale Balaena m ysticetus
Barrow, Kaktovik, A laska
13.4 ± 0 .7 n = 122
-20.6 ± 0.9 n = 122
th is studyincludes data from Hoekstra et al (2002)
Bowhead whale Balaena m ysticetus
Eastern Arctic 13.2 ± 0 .7 n = 3
-18.2 ± 0 .3 n = 3
Hobson et al. (2002)
M inke whaleBalaenoptera acutorostrata
W est Greenland 12.2 ± 1 .0 n = 43
-18.2 ± 0 .4 n = 43
Born e t al. (2003)
M inke whateBalaenoptera acutorostrata
Svalbard, Norway 11.9 ± 0 .9 n = 16
-19.7 ± 0 .2 n = 16
Born e t al. (2003)
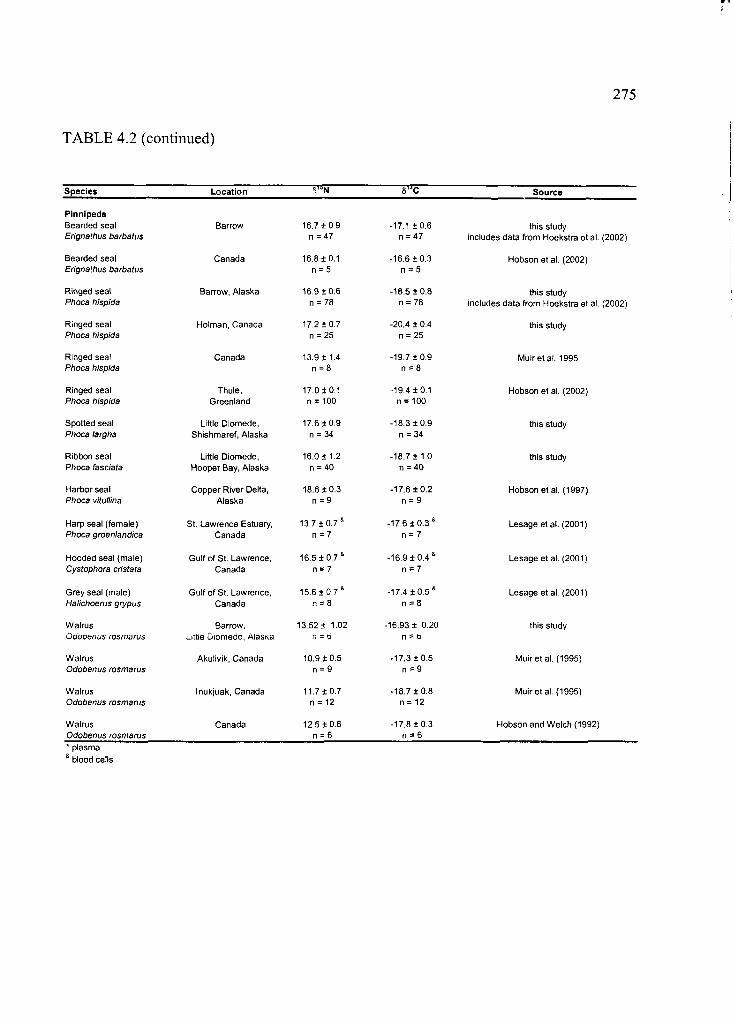
275
TABLE 4.2 (continued)
Species Location V °N 81JC Source
PinnipedsBearded seal Erignathus barbatus
Barrow 16.7 + 0 9 n = 47
-17.1 ± 0 .6 n = 47
th is studyincludes data from Hoekstra et al. (2002)
Bearded seal E rignathus barbatus
C anada 16.8 ±0 .1 n = 5
-16.6 ± 0 .3 n = 5
Hobson et a!. (2002)
R inged seal Phoca hispida
Barrow, A laska 16.9 ± 0 .6 n = 78
-18.5 ± 0 .8 n = 78
th is studyincludes data from Hoekstra et al. (2002)
Ringed seal Phoca hispida
Holm an, Canada 17.2 + 0.7 n = 25
-20.4 ± 0.4 n = 25
th is study
Ringed seal Phoca hispida
Canada 13.9 + 1.4 n = 8
-19.7 ± 0 .9 n = 8
M uir e t at. 1995
Ringed seal Phoca hispida
Thule,Greenland
17.0 + 0.1 n = 100
-19.4 ± 0 .1 n = 100
Hobson et al. (2002)
Spotted seal Phoca largha
Little D iom ede, Sh ishm aref, Alaska
17.6 + 0.9 n = 34
-18.3 ± 0 .9 n = 34
th is study
Ribbon seal Phoca fasciata
Little D iom ede, H ooper Bay, A laska
16.0 ± 1.2 n = 40
-18.7 ± 1.0 n = 40
this study
H arbor seal Phoca vitullina
C opper R iver Delta, A laska
18.6 ± 0 .3 n = 9
-17.6 ± 0 .2 n = 9
Hobson et al. (1997)
Harp seal (fem ale) Phoca groenlandica
St. Law rence Estuary, C anada
13.7 ± 0.7 s n = 7
-17.6 ± 0 .3 8 n = 7
Lesage et al. (2001)
H ooded seal (m ale) Cystophora cristata
G ulf o f St. Lawrence, C anada
16.5 ± 0.7 * n = 7
-16.9 ± 0 .4 * n = 7
Lesage e t al. (2001)
G rey seal (m ale) Halichoerus grypus
G ulf o f St. Lawrence, C anada
15.6 ± 0 .7 * n = 8
-17.4 ± 0 .5 * n = 8
Lesage e t al. (2001)
W alrusOdobenus rosm arus
Barrow,L ittle Diom ede, AlasKa
13.52 ± 1.02 n = o
-16.93 ± 0.20 n = o
this study
W alrusO dobenus rosm arus
Aku iiv ik , Canada 10.9 ± 0 .5 n = 9
-17.3 ± 0 .5 n = 9
M u ire t al. (1995)
W alrusO dobenus rosm arus
Inukjuak, Canada 11.7 ± 0.7 n = 12
-18.7 ± 0 .8 n = 12
M u ire t al. (1995)
W alrusO dobenus rosm arus
Canada 12.5 + 0.6 n = 6
-17.8 ± 0 .3 n = 6
Hobson and W e lch (1992)
* plasma
* blood cells
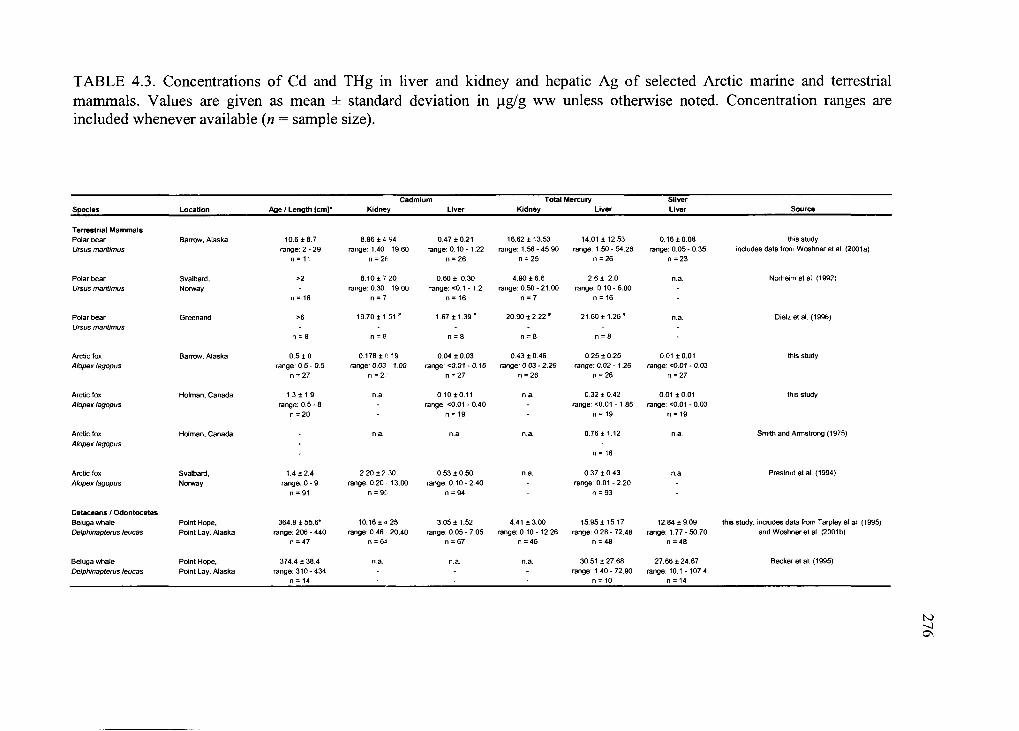
TABLE 4.3. Concentrations o f Cd and THg in liver and kidney and hepatic Ag o f selected Arctic marine and terrestrial mammals. Values are given as mean ± standard deviation in ju.g/g ww unless otherwise noted. Concentration ranges are included whenever available (n = sample size).
Species Location Age / Length {cm]*Cadmium
Kidney LiverTotal Mercury
Kidney LiverSilverLiver Source
Terrestrial MammalsPolar bear Ursus maritimus
Barrow, Alaska 10.6 ±8.7 range: 2 - 29
n = 11
8.96 ± 4 94 range: 1.40 19.60
n = 2(
0.47 ±0.21 range: 0 .10-1.22
n = 26
16.62 ± 13.53 range: 1.56 - 45.90
n = 25
14.01 ± 12.53 range: 1.50 - 54.26
n = 26
0.16 ±0.08 range: 0.05- 0.35
n =23
this studyincludes data from Woshner et al. (2001a)
Polar bear Ursus maritimus
Svalbard,Norway
>2
n = 16
8.10 ± 7 20 range: 0.30 19.00
n = 7
0.60 ± 0.30 range: <0.1 - 1.2
n = 16
4.90 ±6.6 range: 0.50 - 21.00
n = 7
2.6 ± 2.0 range: 0.10 - 6.00
n = 16
n.a. Norheim et al. (1992)
Polar bear Ursus maritimus
Greenand
00
19.70 ± 1 51 ’
n = 8
1.67 ± 1 .3 9 *
n = 8
20.90 ± 2 .2 2 *
n = 8
21.60 ± 1 .2 6 '
n = 8
n.a. Dietz et al. (199£>j
Arctic fox Alopex lagopus
Barrow, Alaska 0.5 ± 0 range: 0.5 - 0.5
n = 27
0.178 ± o 19 range: 0.03 1.00
n = 27
0.04 ±0.03 range: <0.01 - 0.15
n = 27
0.43 ±0.46 range: 0.03 - 2.29
n = 26
0.25 ±0.25 range: 0.02 - 1.26
n = 26
0.01 ±0.01 range: <0.01 - 0.03
n =27
this study
Arctic fox Alopex lagopus
Holman, Canada 1.3 ± 1.9 range: 0.5 - 8
n =20
n.a. 0.10±0.11 range: <0.01 - 0.40
n = 19
n.a. 0.32 ± 0.42 range: <0.01 -1 .85
n = 19
0.01 ±0.01 range: <0.01 - 0.03
n = 19
this study
Arctic fox Alopex lagopus
Holman, Canada n.a. n.a. n.a. 0.76 ± 1.12
n = 16
n.a. Smith and Armstrong (1975)
Arctic fox Alopex lagopus
Svalbard.Norway
1.4 ±2.4 range: 0 - 9
n = 91
2.20 ± 2 30 range: 0.20 13.00
n = 9f>
0.53 ±0.50 range: 0.10 - 2.40
n = 94
n.a. 0.37 ±0.43 range: 0.01 - 2.20
n = 93
n.a. Prestrud et al. (1994)
Cetaceans / OdontocetesBeluga whale Delphinapterus leucas
Point Hope,Point Lay, Alaska
364.8 ± 55.6* range: 206*440
n = 47
10.16 ± 4 25 range: 0.46 20.40
n = 6^
3.05 ± 1.52 range: 0.05 - 7 05
n = 67
4.41 ±3.00 range: 0.10 -12.26
n = 46
15.95 ± 15.17 range: 0.28 - 72.48
n = 48
12.84 ±9.09 range: 1.77 - 50.70
n =48
this study, includes data from Tarpley et ai. (1995) and Woshner et al (2001b)
Beluga whale Delphinapterus leucas
Point Hope.Point Lay, Alaska
374.4 ±38.4 range: 310-434
n = 14
n.a. n.a. n.a. 30.51 ±27.68 range: 1.40 - 72,90
n = 10
27.66 ± 24.67 range: 10.1 -107.4
n = 14
Becker et al. (1995)
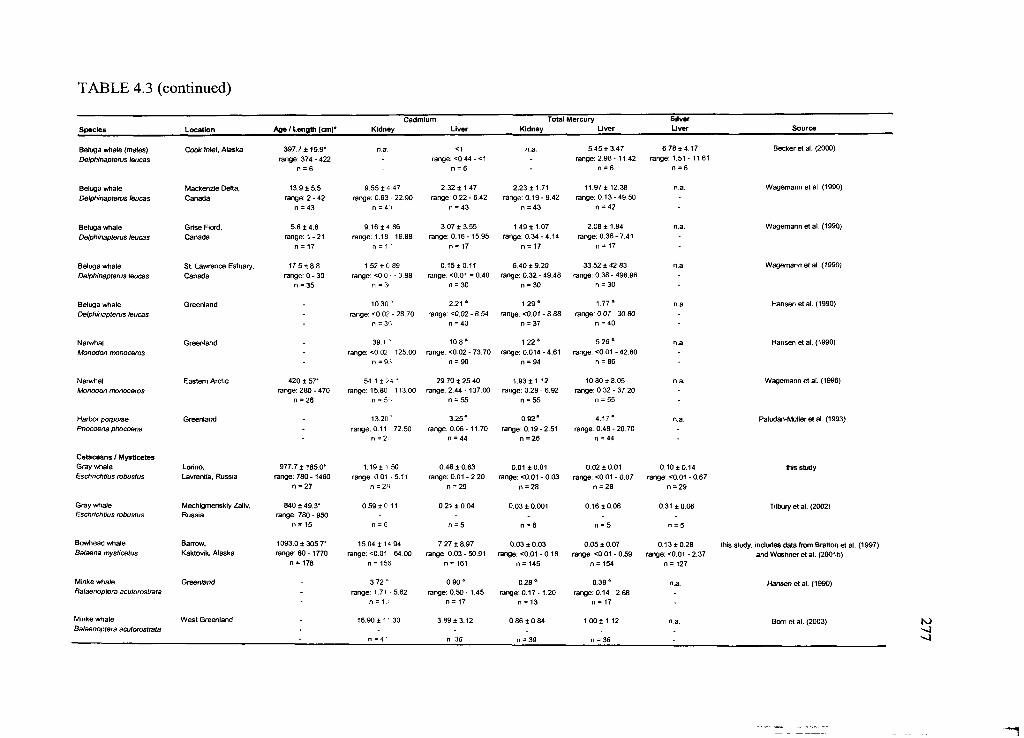
TABLE 4.3 (continued)
Species Location Age / Length [cm]*Cadmium
Kidney LiverTotal Mercury
Kidney LiverSilverLiver Source
Beluga whale (males) Delphinapterus leucas
Cook Inlet, Alaska 397.7 ±19.9* range: 374 - 422
n = 6
n.a. <1range: <0.44 - <1
n = 6
n.a. 5.45 ±3.47 range: 2 .98-11 42
n = 6
6 78 ± 4.17 range: 1.51 -11.61
n =6
Becker et al. (2000)
Beluga whale Delphinapterus leucas
Mackenzie Delta, Canada
13.9 ±5.5 range: 2 - 42
n =43
9.55 ± 4 47 range: 0.63 22.90
n = 4^
2.32 ± 1.47 range: 0.22 - 6.42
n = 43
2.23 ±1.71 range: 0 .19-9.42
n =43
11.97 ± 12.38 range: 0.13 - 49.50
n =42
n.a. Wagemann et al. (1990)
Beluga whale Delphinapterus leucas
Grise Fiord, Canada
5.6 ±4.8 range: 1 -21
n = 17
9.16 ± 4 86 range: 1.18 19 88
n = 1 '
3.07 ±3.55 range: 0.16 - 15.95
n = 17
1.49 ±1.07 range: 0.34 - 4.14
n = 17
2.08 ± 1.94 range: 0.36-7.41
n = 17
n.a. Wagemann et al. (1990)
Beluga whale Delphinapterus leucas
St. Lawrence Estuary, Canada
17.5 ±8.8 range: 0 - 30
n = 35
1.52 ± 0 89 range: <0.0 • 3.88
n =3 i'
0 .15*0.11 range: <0.01 = 0.40
n = 30
6.40 ±9.20 range: 0.32 - 49.48
n = 30
33.52 ± 42 83 range: 0.38 - 498.96
n = 30
n.a. Wagemann et al. (1990)
Beluga whale Delphinapterus leucas
Greenland
-
10.30 ' range: <0.02 - 28.70
n = 3t>
2.21 4 range: <0.02 * 6.54
n = 40
1.29* range: <0.01 - 8.88
n = 37
1.77 * range: 0.07 - 30.80
n = 40
n.a. Hansen et al. (1990)
NarwhalMonodon monoceros
Greenland * 39.1 % range: <0 02 125.00
n = 9 <
10.8* range: <0.02 - 73.70
n = 90
1.22 * range: 0.014-4.61
n = 94
5.26 4 range: <0.01 -42.80
n = 86
n.a. Hansen et al. (1990)
NarwhalMonodon monoceros
Eastern Arctic 420 ± 57* range: 280 - 470
n =26
54.1 ± 2-4.1 range: 15.80 113.00
n = 5'>
29 70 ±25.40 range: 2 .44- 137.00
n = 55
1.93 ±1.12 range: 0.29 - 6.92
n = 55
10.80 ±8.05 range: 0.32 - 37.20
n = 55
n.a. Wagemann et ai. (1996)
Harbor porpoise Phocoena phocoena
Greenland
*
13.20" range: 0.11 72.50
n = 2t:
3 .25 ' range: 0 .06-11.70
n = 44
0 .92 ' range: 0.19-2.51
n =26
4 .17s range: 0 .48- 20.70
n = 44
n.a. Paludan-Miiller et al. (1993)
Cetaceans / MysticetesGray whale (Eschrichtius robustus
Lorino,Lavrentia. Russia
977.7 ± 185.0* range: 780 -1460
n = 27
1.19 ± i 50 range: 0.01 - 5.11
n =28
0.46 ± 0.63 range: 0.01 - 2.20
n = 29
0.01 ±0.01 range: <0.01 - 0.03
n =28
0.02 ± 0.01 range: <0.01 - 0.07
n = 28
0.10 ± 0.14 range: <0.01 - 0.67
n = 29
this study
Gray whale Eschrichtius robustus
Mechigmenskiy Zaliv. Russia
840 ±49.3* range: 780 * 950
n j* 15
0.59 ± C 11
n = 6
0 21 ±0.04
n = 5
0.03 ± 0.001
n = 6
0.16 ±0.06
n = 5
0.31 ±0.06
n = 5
Tilbury et al. (2002)
Bowhead whale Balaena mysticetus
Barrow,Kaktovik, Alaska
1093.0 ± 305.7* range: 60-1770
n = 178
15.04 ±14 94 range: <0.01 • 64.00
n = 156
7.27 ± 8.97 range: 0.03 - 50.91
n = 161
0.03 ± 0.03 range: <0.01 - 0.18
n = 145
0.05 ± 0.07 range: <0.01 - 0.59
n = 154
0.13 ±0.28 range: <0.01 - 2.37
n = 127
this study, includes data from Bratton et al. (1997) and Woshner et al. (2001b)
Minke whaleBalaenoptera acutorostrata
Greenland
:3 72
range: 1.71 5.62 n = 1. ■
0.90 4 range: 0 .50-1 .45
n = 17
0.28 * range: 0 .17-1.20
n = 13
0.39 * range: 0.14-2.68
n = 17
n.a. Hansen e ta i. (1990)
Minke whaleBalaenoptera acutorostrata
West Greenland 16.90 ± 1 ' 30
n = 4 '
3.89 ±3.12
n 36
0.86 ± 0.84
n =39
1.00 ± 1.12
n = 36
n.a. Bom et al. (2003)
LLZ
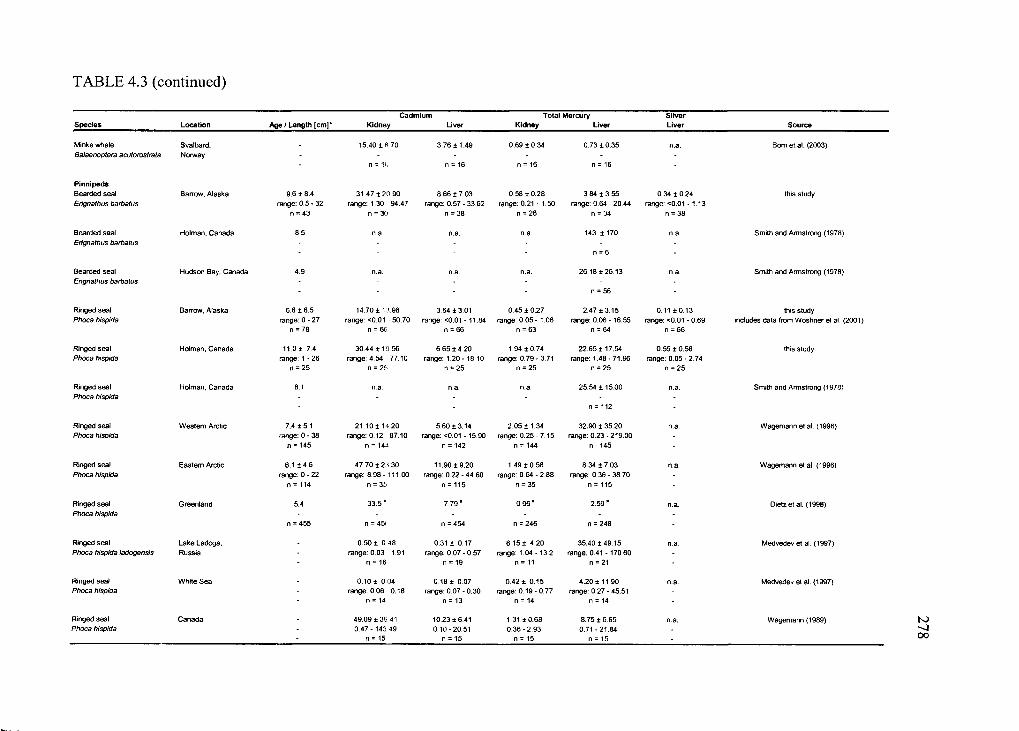
TABLE 4.3 (continued)
Species Location Age 1 Length [cm]*Cadmium
Kidney LiverTotal Mercury
Kidney LiverSilverLiver Source
Minke whale Svalbard. . 15.40 ± 8 70 3.76 ±1.49 0.69 ±0.34 0.73 ±0.35 n.a. Bom et al. (2003)Balaenoptera acutorostrata Norway • - -
n = V> n = 16 n = 16 n = 16
PinnipedsBearded seal Barrow. Alaska 9.6 ± 8.4 31.47 ± 2 0 90 8.66 ±7.03 0.58 ±0.28 3.84 ±3.55 0.34 ±0.24 this studyErignathus barbatus range: 0 .5 -3 2 range: 1.30 94.47 range: 0.57 - 33.62 range: 0.21 -1 .50 range: 0.64 - 20.44 range: <0.01 -1 .13
n = 43 n = 30 n =38 n = 26 n = 34 n = 38
Bearded seal Holman, Canada 8.5 n.a. n.a. n.a. 143 ± 170 n.a. Smith and Armstrong (1978)Erignathus barbatus
;*
; n = 6
Bearded seal Hudson Bay. Canada 4.9 n.a. n.a. n.a. 26.18 ± 26 13 n.a. Smith and Armstrong (1978)Erignathus barbatus - - -
- - n = 56
Ringed seal Barrow, Alaska 6.6 ±6.5 14.70 ± 1 } 98 3.64 ±3.01 0.45 ±0.27 2.47 ±3.15 0.11 ±0.13 this studyPhoca hispida range: 0 - 27 range: <0.01 50.70 range: <0.01 -11.84 range: 0.05 -1 .06 range: 0.06 - 16 55 range: <0.01 - 0.69 includes data from Woshner et al (2001)
n = 79 n = 66 n = 66 n =63 n = 64 n = 66
Ringed seal Holman. Canada 11.0± 7.4 30.44 ± 19 56 6.65 ± 4 20 1.94 ±0.74 22.65 ± 17.54 0.55 ±0.56 this studyPhoca hispida range: 1 - 26 range: 4.54 77.10 range: 1.20-18.10 range: 0.79 - 3.71 range: 1.48 - 71.96 range: 0.05 - 2.74
n =25 n = 2b it fO Ol n = 25 n = 25 n = 25
Ringed seal Holman, Canada 8.1 n.a. n.a. n.a. 25.54 ±15.00 n.a. Smith and Armstrong (1978)Phoca hispida - - -
- - n = 112 *
Ringed seal Western Arctic 7.4 ± 5.1 21.10 ± 14 20 5.60 ±3.14 2.05 ± 1.34 32.90 ± 35.20 n.a. Wagemann et al. (1996)Phoca hispida range: 0 -3 8 range: 0.12 87.10 range: <0.01 -15.90 range: 0.25 - 7.15 range: 0.23 * 219.00
n = 145 n = 144 n = 142 n = 144 n -145 -
Ringed seal Eastern Arctic 6.1 ±4.6 47.70 ± 23 30 11.90 ±9.20 1.49 ±0.58 8.34 ± 7.03 n.a. Wagemann et al. (1996)Phoca hispida range: 0 - 22 range: 8.98- 111.00 range: 0.22 -4 4 60 range: 0.64 - 2.88 range: 0.36 - 38.70
n = 114 n = 35 n = 115 n = 35 n = 115
Ringed seal Greenland 5.4 33 .5 ’ 7 .7 9 ' 0 .96’ 2 .59 ’ n.a. Dietz et al. (1998)Phoca hispida - - - -
n = 455 nc
n =454 n = 246 n = 248 -
Ringed seal Lake Ladoga, 0.50 ± 0 48 0.31 ± 0.17 6.15 ± 4.20 35.40 ±49.15 n.a. Medvedev et al. (1997)Phoca hispida ladogensis Russia - range: 0.03 1.91 range: 0.07 - 0.57 range: 1.04 -13.2 range: 0.41 - 170 60 -
* n = 16 n = 19 n = 11 n = 21 *
Ringed seal White Sea . 0.10 ± 0 04 0 .18 ± 0 .07 0.42 ± 0.15 4.20 ±11.90 n.a. Medvedev et al. (1997)Phoca hispida range: 0.06 0.18 range: 0.07 - 0.30 range: 0.19 - 0.77 range: 0.27 -45.51 -
- n = 14 n = 13 n = 14 n = 14
Ringed seal Canada . 49.09 ±3S 41 10.23 ±6.41 1.31 ±0.68 8.75 ± 6.65 n.a. Wagemann (1989)Phoca hispida - 0 .47- 143 49 0.10-20.51 0 .36-2.93 0.71 -21.84 -
- n = 15 n = 15 n = 15 n = 15
278
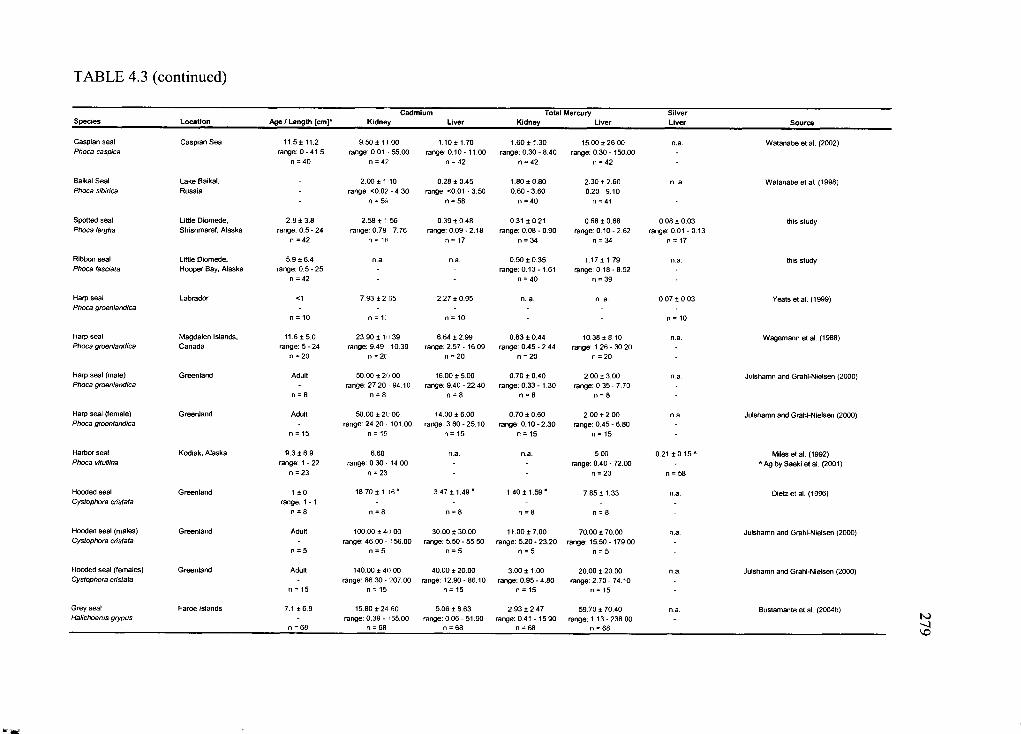
TABLE 4.3 (continued)
Species Location Ao© / Length [cm]*Cadmium
K idney LiverTotal Mercury
Kidney LiverSilverLiver Source
Caspian seal Caspian Sea 1 1.5 * 11.2 9.50 ±11.00 1 .1 0 * 1.70 1.60 ± 1.30 15.00*26.00 n.a. Watanabe et al. (2002)Phoca caspica range: 0 - 41.5 range: 0.01 55.00 range: 0 .10-11.00 range: 0.30 - 8.40 range: 0.30 - 150.00
n s 40 n = 42 n = 42 n = 42 n = 42 *
Baikal Seal Lake Baikal, 2 .00 ± 1 10 0 28 ± 0.45 1.80 ±0.80 2 3 0 *2 .6 0 n. a. Watanabe et al. (1998)Phoca sibirica Russia - range: <0.02 - 4.30 range: <0.01 - 3.50 0 .60 -3 .60 0 .20-9.10
n = 59 n = 58 n = 40 n = 41
Spotted seal Little Diomede, 2.8 ±3.8 2.58 ± 1 56 0 .3 9 *0 .4 8 0.31 ±0.21 0-68 * 0.68 0.08 ± 0.03 this studyPhoca largha Shishmaref, Alaska range: 0.5 - 24 range: 0.79 7.76 range: 0.09 - 2.18 range: 0.08 - 0.90 range: 0.10 - 2 62 range: 0.01 - 0.13
n =42 n = 18 n = 17 n = 34 n = 34 n = 17
Ribbon seal Little Diomede, 5.9 ±6.4 n.a. n.a. 0.50 ± 0.35 1 .17*1.79 n.a. this studyPhoca fasciata Hooper Bay, Alaska range: 0.5 * 25 - range: 0.13 -1.61 range: 0 18 - 8.52
n =42 • n = 40 n = 39
Harp seal Labrador <1 7.93 ± 2 65 2 .2 7 *0 .9 5 n. a. n. a. 0 .0 7 *0 .0 3 Yeats et al. (1999)Phoca groenlandica - -
n = 10 n = 1C n = 10 n = 10
Harp seal Magdalen Islands, 11 .6 *5 .0 23.90 ±10 39 6 .6 4 *2 .9 9 0.83 * 0.44 1 0 .3 8 *8 10 n.a. Wagemann et al. (1988)Phoca groenlandica Canada range: 5 - 24 range: 9.49 10.39 range: 2.57-16.09 range: 0.45 - 2.44 range: 1.26 - 30 20
n =20 n = 2C
oC oCMc oCMIIC
Harp seal (male) Greenland Adult 50.00 ±20 00 16.00 ±5.00 0 .7 0 *0 .4 0 2 .0 0 *3 .0 0 n.a. Julshamn and Grahl-Nielsen (2000)Phoca groenlandica - range: 27.20 94.10 range: 9.40 - 22.40 range: 0.33 -1 .30 range: 0.35 - 7.70
n = 8 n - 8 n = 8 n = 8 n = 8
Harp seal (female) Greenland Adult 50.00 ± 20 00 14.00*6.00 0.70 * 0.60 2.00 *2 .0 0 n.a. Julshamn and Grahl-Nielsen (2000)Phoca groenlandica - range: 24.20 101.00 range: 3.60 - 25.10 range: 0 .10-2 .30 range: 0.45 - 6.80 -
n = 15 n = 15 n = 15 n = 15 n = 15 '
Harbor sea! Kodiak. Alaska 9.3 ±6.9 6.60 n.a. n.a. 5.00 0.21 ± 0 .1 5 A Miles e ta l. (1992)Phoca vitullina range: 1 - 22 range: 0.30 - 44.00 - - range: 0.40 - 72.00 A Ag by Saeki et al. (2001)
n =23 n =23 - * n = 23 n = 58
Hooded seal Greenland 1 ± 0 18.70 ±1 16* 3 .4 7 * 1.49" 1.40 ± 1 .5 9 ’ 7 .85*1 .33 n.a. Dietz et al. (1996)Cystophora cristata range: 1 -1 - - -
n * 8 n = 8 n = 8 n = 8 n = 8
Hooded seal (males) Greenland Adult 100 .00*40 00 30.00 ± 30.00 11.00 ±7.00 70.00 * 70.00 n.a. Julshamn and Grahl-Nielsen (2000)Cystophora cristata range: 46.00 - 156.00 range: 5.50 - 55.50 range: 5 .20- 23.20 range: 15.50- 179.00
n = 5 n = 5 n = 5 n = 5 n = 5 -
Hooded seal (females) Greenland Adult 140.00 ± 4 0 00 40.00 * 20.00 3.00 ±1.00 20.00 * 20.00 n.a. Julshamn and Grahl-Nielsen (2000)Cystophora cristata range: 86.30 * 207.00 range: 12.90 - 86.10 range: 0.95 - 4.80 range: 2.70 - 74.10
n = 15 n = 15 n = 15 n = 15 n = 15
Grey seal Faroe islands 7.1 ±6.9 15.80 ±24 60 5.06 * 8.63 2.93 ±2.47 59.70 ± 70.40 n.a. Bustamante et al. (2004b)Halichoerus grypus - range: 0.39 - ? 55.00 range: 0.06 - 51.90 range: 0.41 -15.90 range: 1.13 - 238.00 -
n =68 n = 68 n =68 n = 68 n = 68
279
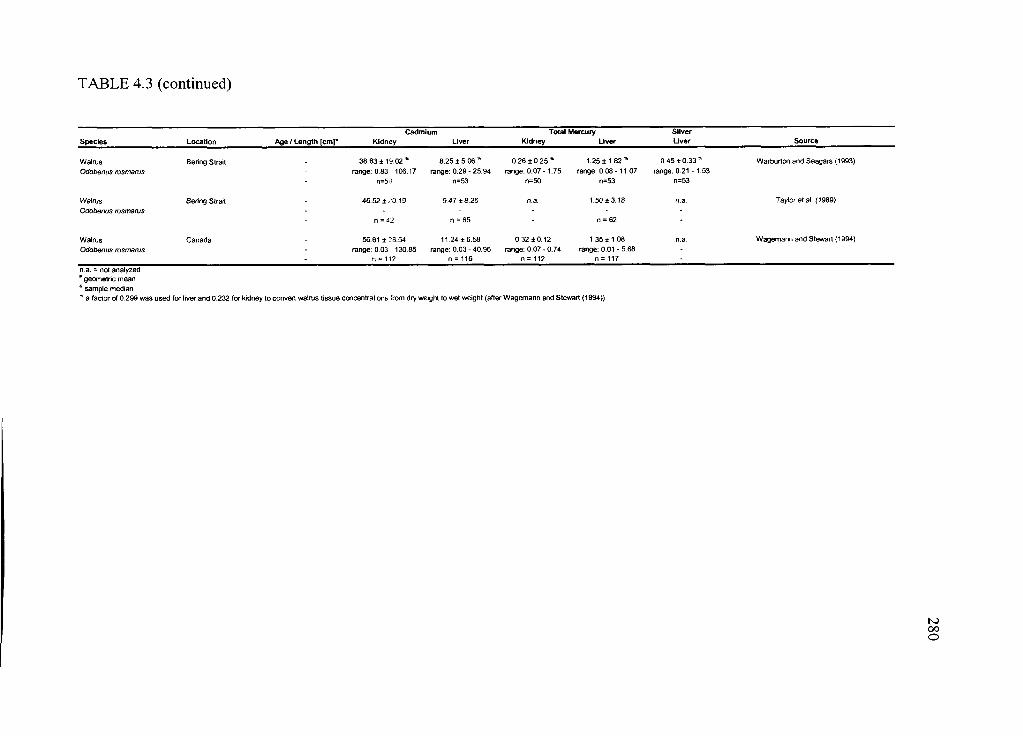
TABLE 4.3 (continued)
Species Location Age / Length [cm]*Cadmium
Kidney LiverTotal Mercury
Kidney LiverSilverLiver Source
Walrus Bering Strait 38.63 ± 1 9 .0 2 * 8.25 ± 5.06 * 0.26 ± 0.25 * 1.25 ± 1 .8 2 * 0.45 ± 0.33 * Warburton and Seagars (1993)Odobenus rosmarus - range: 0.83 106.17 range: 0.29 - 25.94 range: 0.07 -1 .75 range: 0.08 -11 07 range: 0.21 -1.53
* n=50 n=53 n=50 n=53 n=53
Walrus Bering Straft . 46.52 ±.-’0.19 9.47 ±8.26 n.a. 1.50 ± 3.18 n.a. Taylor e ta l. (1989)Odobenus rosmarus
n = 42 n =65 - n = 62 *
Walrus Canada . 56.61 ±28.54 11.24 ±6.58 0.32 ±0.12 1.35 ±1.08 n.a. Wagemann and Stewart (1994)Odobenus rosmarus - range: 0.03 130.85 range: 0.03 - 40.96 range: 0.07 - 0.74 range: 0.01 - 5.68
- n = 112 n = 116 n = 112 n = 117 -n a. = not analyzed* geometric mean* sample median* a factor of 0.299 was used for liver and 0.232 for kidney to convert walnjs tissue concentrations from dry weight to wet weight (after Wagemann and Stewart (1994))
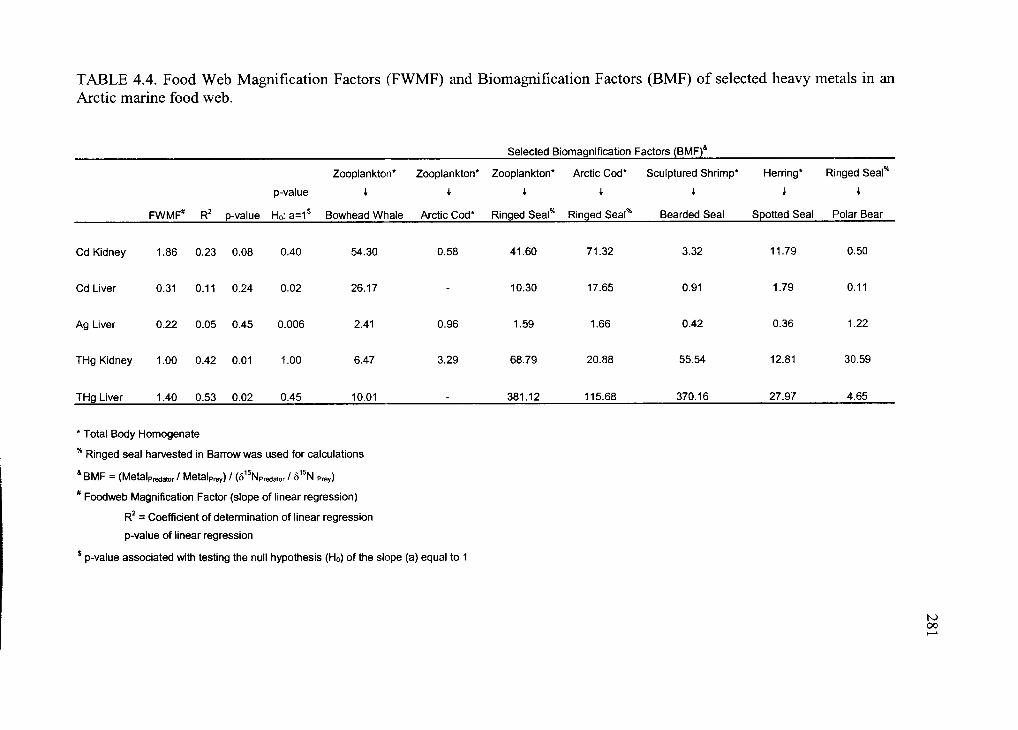
TABLE 4.4. Food Web Magnification Factors (FWMF) and Biomagnification Factors (BMF) o f selected heavy metals in an Arctic marine food web.
Selected Biomagnification Factors (BMF)4
FWMF* R2 p-value
p-value
H0: a=1$
Zooplankton*
*
Bowhead Whale
Zooplankton*
i
Arctic Cod*
Zooplankton*
i
Ringed Seal%
Arctic Cod*
I
Ringed Seal%
Sculptured Shrimp*
*
Bearded Seal
Herring*
i
Spotted Seal
Ringed Seal*
i
Polar Bear
Cd Kidney 1.86 0.23 0.08 0.40 54.30 0.58 41.60 71.32 3.32 11.79 0.50
Cd Liver 0.31 0.11 0.24 0.02 26.17 - 10.30 17.65 0.91 1.79 0.11
Ag Liver 0.22 0.05 0.45 0.006 2.41 0.96 1.59 1.66 0.42 0.36 1.22
THg Kidney 1.00 0.42 0.01 1.00 6.47 3.29 68.79 20.88 55.54 12.81 30.59
THg Liver 1.40 0.53 0.02 0.45 10.01 381.12 115.68 370.16 27.97 4.65
* Total Body Homogenate
% Ringed seal harvested in Barrow was used for calculations
& BMF = (MetalPredator / MetalPrey) / (5 Npredator / 6 N prey)
* Foodweb Magnification Factor (slope of linear regression)
R2 = Coefficient of determination of linear regression
p-value of linear regression
* p-value associated with testing the null hypothesis (H0) of the slope (a) equal to 1
This study showed complex interactions among different Arctic species, their
trophic position, specific feeding habits and biological factors, such as sex, season,
reproductive status and age. Stable isotopes of carbon and nitrogen have been established
as powerful tools in animal ecology. However, it is often underestimated that stable
isotopes are highly dynamic and are influenced by age, body condition, gestation or
lactation, water stress, body protein catabolism, and urea recycling, among others
(Hobson et al., 1993; Barboza et al., 1997; Hobson et al., 1997; Femandez-Mosquera et
al., 2001). Their interpretation is further complicated by unpredictable or poorly
understood turnover rates and tissue- and species-specific isotopic fractionation factors
(Gannes et al., 1997; Bearhop et al., 2002). On the other hand, analysis of stomach
contents or scat may be biased and overestimate prey that resist digestion and have
identifiable hard parts (e.g., fish otoliths, cephalopod beaks), and underestimate soft prey
(Murie and Lavigne, 1986; Gales and Cheal, 1992; Bowen, 2000; Sheffield et al., 2001).
It is often difficult to assess seasonal importance of prey as stomach contents only present
a single point in time. In addition, occurrences of individuals with empty stomachs are
common in marine mammals, and thus no prey-based information can be obtained. The
use of traditional methods, such as fecal or stomach contents analysis in combination
with chemical feeding ecology, e.g., stable isotope analysis, describe dietary habits most
accurately if direct observation of feeding behavior is not possible.
This research also demonstrated that concentrations o f trace elements in marine
mammals were substantially influenced by a variety o f factors, including age and diet.
2 8 2
GENERAL CONCLUSIONS
Age was identified as one o f the most important factors in explaining variability o f trace
elements, stable isotopes, and prey prevalence in biological systems. Animal age is of
significance in the interpretation and identification o f possible new sources of
contaminants and in providing recommendations for the consumption of subsistence
foods (Egeland et al., 1998). However, estimates of animal age can be challenging. Aging
based on growth layers in keratin o f claws and dentine or cementum of teeth and other
calcified structures is widely used (Benjaminsen, 1973; Matson, 1981; Stewart et al.,
1996; Childerhouse et al., 2004). This method assumes that the deposition of growth
layers is predictable, although studies on known-age beluga whales (Delphinapterus
leucas) have shown that between one and two growth layers can be deposited annually
(Goren et al., 1987). Teeth of female black bears (Ursus americanus), and potentially
other species, have the capability to re-absorb or reduce production of calcified material
during cub rearing, thus making age assessments difficult (Harshyne et al., 1998). In the
absence of easily accessible age-defining structures, as is the case for baleen whales,
other methods have been developed, such as ear plug counts, aspartic acid racemization,
and stable carbon isotope oscillations in baleen (Rice and Wolman, 1971, Schell et al.,
1989, George et al., 1999). Linear accumulation of metals with age is often assumed
although this study demonstrated more complex nonlinear relationships affected by
physiological processes, for example, changes in renal physiology associated with
advanced age. Juveniles, fetuses and gestating or lactating females have a higher demand
for essential elements like zinc (Zn) and copper (Cu). However, chemical similarity of
these elements with cadmium (Cd), silver (Ag) and other heavy metals leads to
283
interactions and binding site competition on transport and storage molecules. Similarly,
selenium (Se) is involved in oxy radical scavenging, needed to cope with oxidative stress,
particularity in diving species. In addition, Se is required in juveniles for maturation of
antioxidant defenses and neuronal development. Many studies have observed a protective
effect o f Se on mercury (Hg) toxicosis due to an inert and non-toxic Hg-Se storage
complex. It was argued that both elements occur in a 1:1 molar ratio (Koeman et al.,
1973; Smith and Armstrong, 1978; Caurant et al., 1994; Dietz et al., 2000; Bustamante et
al., 2004). However, results o f this study showed few animals approaching Se:Hg unity
and it is likely that the often reported 1:1 molar ratio may in fact be an indicator for
compromised health. Other evidence also suggests that metal accumulation patterns are
altered in emaciated or diseased animals. Seals with hepatic lesions had a higher
proportion o f methyl Hg (MeHg) to total Hg (THg) in liver than healthy seals, suggesting
they may have been challenged in their ability to demethylate MeHg. Similarly, tissue
concentrations o f Zn and Zn status may be useful in the evaluation of body condition,
immune status, and animal health. This further illustrates the importance of high quality
baseline data to evaluate and interpret effects o f contaminants.
This work established that trace element concentrations can be discriminators for
characteristic prey species and ecological relationships in the Arctic. Cd concentrations
appear to be associated with a diet comprised mostly o f invertebrate prey, while Hg is
linked to the fish-based food chain. However, the ratio of MeHg to THg may be a better
indicator for piscivory than THg alone. Ag has potential to accumulate in the benthic
food web and seems particularly linked to cephalopods and large crustaceans. However,
284
biomagnification o f Hg, Cd and Ag could not be documented when calculating food web
magnification factors using data on the entire Arctic food chain. Further, accumulation of
trace metals is organ-specific, and this study established that Cd accumulates
predominantly in the kidney, whereas Hg accumulates mainly in the liver of marine
mammals, but in the kidney o f terrestrial mammals. When calculating trophic transfer
factors, assumptions are made that may not be suitable for trace metals. It is often
assumed that the tissue under investigation is a good proxy for total body burden of the
contaminant and it is further assumed that metals are static. It is important to recognize
that metals are tissue-specific, accumulate differently in marine and terrestrial species,
and thus are affected by adaptive capabilities and detoxification mechanisms of the
animal. Metal accumulation is dependent on age, gender, season, and diet, and
accumulation patterns may be altered with disease or other stressors. Additionally, metals
are dynamic, actively regulated and eliminated, dependent on transport molecules and
subject to binding site competition, and this can lead to unpredictable or disrupted trophic
transfer. In general, concentrations of trace metals in tissues o f marine and terrestrial
mammals harvested in Alaska are low compared to other Arctic regions. Future efforts
should include determination o f Cd bound to metallothionein and continued monitoring
of MeHg in the Arctic food chain to assess bioavailability o f these high priority
contaminants and possible risks to the subsistence consumer.
285
REFERENCES
Barboza PS, Farley SD, Robbins CT. Whole-body urea cycling and protein turnover
during hyperphagia and dormancy in growing bears (Ursus americanus and U.
arctos). Can J Zool 1997; 75: 2129-2136.
Bearhop S, Waldron S, Votier SC, Furness RW. Factors that influence assimilation rates
and fractionation of nitrogen and carbon stable isotopes in avian blood and
feathers. Physiol Biochem Zool 2002; 75: 451-458.
Benjaminsen T. Age determination and the growth and age distribution from cementum
growth layers o f bearded seals at Svalbard. Fiskeridirektoratets skrifter. Serie
havundersekelser 1973; 16: 159-170.
Bowen WD. Reconstruction of pinniped diets: accounting for complete digestion of
otoliths and cephalopod beaks. Can J Fish Aquatic Sci 2000; 57: 898-905.
Bustamante P, Morales CF, Mikkelsen B, Dam M, Caurant F. Trace element
bioaccumulation in grey seals Halichoerus grypus from Faroe Islands. Mar Ecol
Prog Ser 2004; 267:291-301.
Caurant F, Amiard JC, Amiard-Triquet C, Sauriau PG. Ecological and biological factors
controlling the concentrations of trace elements (As, Cd, Cu, Hg, Se, Zn) in
286
delphinids Globicephala melas from the North Atlantic Ocean. Mar Ecol Prog Ser
1994; 103: 207-219.
Childerhouse S, Dickie G, Hessel G. Ageing live New Zealand sea lions (Phocarctos
hookeri) using the first post-canine tooth. Wildl Res 2004; 31: 177-181.
Dietz R, Ridget F, Bom EW. An assessment of selenium to mercury in Greenland marine
animals. Sci Total Environ 2000; 245: 15-24.
Egeland GM, Feyk LA, Middaugh JP. The use of traditional foods in a healthy diet in
Alaska: risks in perspective. State of Alaska Epidemiology Bulletin 1998; 2: 1-
140.
Femandez-Mosquera D, Vila-Taboada M, Grandal-d'Anglade A. Stable isotopes data
(813C, 515N) from the cave bear (Ursus spelaeus): a new approach to its
palaeoenvironment and dormancy. Proc R Soc London, Ser B 2001; 268: 1159-
1164.
Gales NJ, Cheal AJ. Estimating diet composition o f the Australian sea-lion (Neophoca
cinerea) from scat analysis: an unreliable technique. Wildl Res 1992; 19: 447-
456.
287
Gannes LZ, O'Brien DM, Rio CMD. Stable isotopes in animal ecology: Assumptions,
caveats, and call for more laboratory experiments. Ecology 1997; 78: 1271-1276.
George JC, Bada J, Zeh J, Scott L, Brown SE, O'Hara T, Suydam R. Age and growth
estimates o f bowhead whales (Balaena mysticetus) via aspartic acid racemization.
Can J Zool 1999; 77: 571-580.
Goren AD, Brodie PF, Spotte S, Ray GC, Kaufman HW, Gwinnett AJ, Sciubba JJ, Buck
JD. Growth layer groups (GLGs) in the teeth of an adult belukha whale
(Delphinapterus leucas) o f known age: evidence for two annual layers. Mar Mam
Sci 1987; 3: 14-21.
Harshyne WA, Deifenach DR, Alt GA, Matson GM. Analysis of error from cementum-
annuli age estimates of known-age Pennsylvania black bears. J Wildl Manage
1998; 62:1281-1291.
Hobson KA, Alisauskas RT, Clark RG. Stable-nitrogen isotope enrichment in avian
tissues due to fasting and nutritional stress: implications for isotopic analyses of
diet. Condor 1993; 95: 388-394.
288
Hobson KA, Sease JL, Merrick RL, Piatt JF. Investigating trophic relationships of
pinnipeds in Alaska and Washington using stable isotope ratios of nitrogen and
carbon. Mar Mamm Sci 1997; 13: 114-132.
Koeman JH, Peeters WHM, Koudstaal-Hol CHM. Mercury-selenium correlations in
marine mammals. Nature 1973; 245: 385-386.
Matson GM. Workbook for cementum analysis. Milltown, Montana, Matson's
Laboratory, 1981, 31 pp.
Murie DJ, Lavigne DM. Interpretation of otoliths in stomach content analyses of phocid
seals: quantifying fish consumption. Can J Zool 1986; 64: 1152-1157.
Rice DW, Wolman AA. The life history and ecology o f the gray whale (Eschrichtius
robustus). The American Society o f Mammalogists 1971; Special publication 3.
Schell DM, Saupe SM, Haubenstock N. Natural isotope abundance in bowhead whale
(.Balaena mysticetus) baleen: markers of aging and habitat usage. In: Rundel PW,
Ehleringer JR, Nagy KA, editors. Stable isotopes in ecological research. Springer-
Verlag, Berlin, 1989, pp. 261-269.
289
Sheffield G, Fay FH, Feder H, Kelly BP. Laboratory digestion o f prey and interpretation
of walrus stomach contents. Mar Mam Sci 2001; 17: 310-330.
290
Smith TG, Armstrong FAJ. Mercury and selenium in ringed and bearded seal tissues
from Arctic Canada. Arctic 1978; 31: 75-84.
Stewart REA, Stewart BE, Stirling I, Street E. Counts o f growth layer groups in
cementum and dentine in ringed seals (Phoca hispida). Marine Mammal Science
1996; 12:383-401.