Refuting phylogenetic relationships
19
BioMed Central Page 1 of 19 (page number not for citation purposes) Biology Direct Open Access Research Refuting phylogenetic relationships James Bucknam 1 , Yan Boucher 2 and Eric Bapteste* 1 Address: 1 Canadian Institute for Advanced Research and Genome Atlantic, Department of Biochemistry and Molecular Biology, Dalhousie University, Halifax, Nova Scotia, B3H 4H7, Canada and 2 Department of Chemistry and Molecular Biosciences, Macquarie University, North Ryde, NSW 2109, Australia Email: James Bucknam - [email protected]; Yan Boucher - [email protected]; Eric Bapteste* - [email protected] * Corresponding author Abstract Background: Phylogenetic methods are philosophically grounded, and so can be philosophically biased in ways that limit explanatory power. This constitutes an important methodologic dimension not often taken into account. Here we address this dimension in the context of concatenation approaches to phylogeny. Results: We discuss some of the limits of a methodology restricted to verificationism, the philosophy on which gene concatenation practices generally rely. As an alternative, we describe a software which identifies and focuses on impossible or refuted relationships, through a simple analysis of bootstrap bipartitions, followed by multivariate statistical analyses. We show how refuting phylogenetic relationships could in principle facilitate systematics. We also apply our method to the study of two complex phylogenies: the phylogeny of the archaea and the phylogeny of the core of genes shared by all life forms. While many groups are rejected, our results left open a possible proximity of N. equitans and the Methanopyrales, of the Archaea and the Cyanobacteria, and as well the possible grouping of the Methanobacteriales/Methanoccocales and Thermosplasmatales, of the Spirochaetes and the Actinobacteria and of the Proteobacteria and firmicutes. Conclusion: It is sometimes easier (and preferable) to decide which species do not group together than which ones do. When possible topologies are limited, identifying local relationships that are rejected may be a useful alternative to classical concatenation approaches aiming to find a globally resolved tree on the basis of weak phylogenetic markers. Reviewers: This article was reviewed by Mark Ragan, Eugene V Koonin and J Peter Gogarten. Open peer review Reviewed by Mark Ragan, Eugene V Koonin and J Peter Gogarten. For the full reviews, please go to the Reviewers' comments section. Background Since the 1960's, molecular phylogeneticists have sought to reconstruct organismal relationships based on gene and protein trees [1]. Generally, successes in this enter- prise have been evaluated as a function of the capacity to build unambiguous monophyletic groups, thus reducing the paraphyly of former classifications [2]. Despite such Published: 06 September 2006 Biology Direct 2006, 1:26 doi:10.1186/1745-6150-1-26 Received: 25 August 2006 Accepted: 06 September 2006 This article is available from: http://www.biology-direct.com/content/1/1/26 © 2006 Bucknam et al; licensee BioMed Central Ltd. This is an Open Access article distributed under the terms of the Creative Commons Attribution License (http://creativecommons.org/licenses/by/2.0 ), which permits unrestricted use, distribution, and reproduction in any medium, provided the original work is properly cited.
Transcript of Refuting phylogenetic relationships

BioMed CentralBiology Direct
ss
Open AcceResearchRefuting phylogenetic relationshipsJames Bucknam1, Yan Boucher2 and Eric Bapteste*1Address: 1Canadian Institute for Advanced Research and Genome Atlantic, Department of Biochemistry and Molecular Biology, Dalhousie University, Halifax, Nova Scotia, B3H 4H7, Canada and 2Department of Chemistry and Molecular Biosciences, Macquarie University, North Ryde, NSW 2109, Australia
Email: James Bucknam - [email protected]; Yan Boucher - [email protected]; Eric Bapteste* - [email protected]
* Corresponding author
AbstractBackground: Phylogenetic methods are philosophically grounded, and so can be philosophicallybiased in ways that limit explanatory power. This constitutes an important methodologic dimensionnot often taken into account. Here we address this dimension in the context of concatenationapproaches to phylogeny.
Results: We discuss some of the limits of a methodology restricted to verificationism, thephilosophy on which gene concatenation practices generally rely. As an alternative, we describe asoftware which identifies and focuses on impossible or refuted relationships, through a simpleanalysis of bootstrap bipartitions, followed by multivariate statistical analyses. We show howrefuting phylogenetic relationships could in principle facilitate systematics. We also apply ourmethod to the study of two complex phylogenies: the phylogeny of the archaea and the phylogenyof the core of genes shared by all life forms. While many groups are rejected, our results left opena possible proximity of N. equitans and the Methanopyrales, of the Archaea and the Cyanobacteria,and as well the possible grouping of the Methanobacteriales/Methanoccocales andThermosplasmatales, of the Spirochaetes and the Actinobacteria and of the Proteobacteria andfirmicutes.
Conclusion: It is sometimes easier (and preferable) to decide which species do not grouptogether than which ones do. When possible topologies are limited, identifying local relationshipsthat are rejected may be a useful alternative to classical concatenation approaches aiming to find aglobally resolved tree on the basis of weak phylogenetic markers.
Reviewers: This article was reviewed by Mark Ragan, Eugene V Koonin and J Peter Gogarten.
Open peer reviewReviewed by Mark Ragan, Eugene V Koonin and J PeterGogarten. For the full reviews, please go to the Reviewers'comments section.
BackgroundSince the 1960's, molecular phylogeneticists have soughtto reconstruct organismal relationships based on geneand protein trees [1]. Generally, successes in this enter-prise have been evaluated as a function of the capacity tobuild unambiguous monophyletic groups, thus reducingthe paraphyly of former classifications [2]. Despite such
Published: 06 September 2006
Biology Direct 2006, 1:26 doi:10.1186/1745-6150-1-26
Received: 25 August 2006Accepted: 06 September 2006
This article is available from: http://www.biology-direct.com/content/1/1/26
© 2006 Bucknam et al; licensee BioMed Central Ltd.This is an Open Access article distributed under the terms of the Creative Commons Attribution License (http://creativecommons.org/licenses/by/2.0), which permits unrestricted use, distribution, and reproduction in any medium, provided the original work is properly cited.
Page 1 of 19(page number not for citation purposes)

Biology Direct 2006, 1:26 http://www.biology-direct.com/content/1/1/26
precise goals, tree reconstruction remains notoriously dif-ficult, both for practical and conceptual reasons. Regard-ing some of the problems of classical phylogenetics, manypublications have presented what we feel to be valid argu-ments [3]. At a large scale, the most pervasive issue isprobably the occurrence of lateral gene transfers (LGT)[4]. This paper will, however, focus on a different topic,tackling instead a peculiar practical issue: the relativeweakness and the ambiguity of the phylogenetic signal ina context of a tree-like pattern of evolution.
Dealing with phylogenetic information recorded inmolecular markers is indeed often a major challenge. Eachindividual gene is of limited size, generally too short tofully resolve a given phylogenetic question [5]. In addi-tion, the phylogenetic signal is generally eroded by muta-tional saturation and suffers from other sources ofhomoplasy such as convergence or parallelism that led tounevenly resolved trees. This unequal support is reflectedby the bootstrap values (BVs) associated with the differentnodes of the gene tree. BVs are the most common way toassess the robustness of clades. They are produced by arandom resampling of positions with replacement todetermine sampling error or the confidence interval forthe groups as displayed in the hypothesized best tree [6].Low BVs reflect that the marker employed contained toofew synapomorphies to be conclusive. High BVs indicatethat the data consistently support a given grouping. How-ever to conclude that a highly supported grouping identi-fies a true set of descendants from a common ancestorrequires that the BV statistics are not artefactually biased.Such artifactual biases often arise, since very fast-evolvingspecies of an alignment will systematically tend to grouptogether, independently of their real phylogenetic rela-tionships [3]. If present, this long branch attraction prob-lem is generally aggravated as the sequences under studyget longer [7]. Such artifically increased BVs are alsoobserved in self-concatenation (i.e. concatenation of asingle marker with itself). While no new independent dataare added, the simple repetition of the same charactersleads to questionnable higher supports (data not shown).
In spite of this, when phylogeneticists face problems ofweak resolution using a few markers, they traditionally tryto increase the support for the clades under study by pro-viding more phylogenetic signal (i.e. increasing thesequence length) [8]. That is, they study simultaneouslyseveral genes or proteins in an attempt to raise the globalquantity of synapomorphies available to support eachmonophyletic group, following a principle of total evi-dence. As one often reads in papers proposing concatena-tion analyses, total evidence rests on the assumption thatif multiple markers share a common history then theiroverall analysis will produce a concatenation tree that is
better resolved, through summation of their individuallyweak phylogenetic signals.
As debates around the works of the famous philosopherR. Carnap have shown, total evidence methods have adefined epistemological background: they belong to theverificationist toolkit. In other words, aware of it or not,classical phylogeny and its attempt to establish robustclades by concatenation are a verificationist procedure.Importantly, verificationism is not the only possibleapproach to acquiring scientific knowledge, as decades ofepistemological studies have underlined. For instance, itis well known that falsificationism directly opposes verifi-cationism. Falsificationism supposes that "natural laws ...can never do more than exclude certain possibilities"[9]. Tomake the constrast more clear in a phylogenetic context:instead of aiming to confirm clades via a progressiveincrease in their bootstrap support when more data isadded, a falsificationist would more likely be interestedfirst by the rejection of impossible groupings, underliningwhat can not be a natural group. These divergent goalsintroduce some asymetry in our way of looking at phylo-genetic results. We will argue that it can sometimes be eas-ier (and preferable) to decide which species do not grouptogether than which ones do. Our reason to encourage thedevelopment of an alternative perspective to verification-ism is not a commitment to falsificationist sensu stricto.Simply, it follows a third epistemological current: the oneof P. Feyerabend, who stated that: «proliferation of theoriesis beneficial for science, while uniformity impairs its criticalpower» [10].
In this case, we feel that more falsificationist perspectivesshould be explored as a counterbalance to the current ver-ificationist foundation of molecular phylogenetics. Weillustrate this by describing a very simple tool whoseobjectives are to refute impossible phylogenetic relation-ships, highlighting disagreements and inconsistenciesabout a priori possible clades, not exclusively their consist-ency. In this way, instead of reaching a weak conclusion –we cannot know for sure if a given clade A exists – we canmake the strong claim that another group B is certainlynot an appropriate unit in any natural classification. Typ-ically, our «falsificationist-lite»-software could be usefulfor those who study a new genome and want to test rap-idly and without taxonomic a priori assumptions, whichrelationships are rejected by their multiples alignments,that is, to which taxa the genome could never belong. Oursoftware also provides the details of the pattern of rejec-tion for each gene, so that markers supporting atypicalimpossible groupings can be easily identified, suggestingspecific instances of phylogenetic artefact, lateral genetransfer or hidden paralogy for these markers. Finally,through its identification of impossible associations, ourmethod delineates restricted sets of possible relationships
Page 2 of 19(page number not for citation purposes)

Biology Direct 2006, 1:26 http://www.biology-direct.com/content/1/1/26
that could help traditional (verificationist) classifiersexplore a refined selection of realistic taxonomic connec-tions.
Material and methodsConstitution of the datasetsThe archaeal dataset is the one presented in [11]. In brief,it comprises 23 aligned ribosomal markers: rpl2p, rpl15p,rpl18p, rpl22p, rpl23p, rpl30p, rpl37ae, rpl3p, rpl44e,rpl4p, rps10p, rps13, rps15p, rps17e, rps19e, rps19p,rps2p, rps3p, rps4p, rps5p, rps6e, rps7p and rps8e. Eachmarker presented 23 species: 4 crenarchaeotes (Pyrobacu-lum aerophilum, Aeropyrum pernix, Sulfolobus solfataricus,Sulfolobus tokodaii), 3 Thermococcales (Pyrococcus furiosus,Pyrococcus abyssi, Pyrococcus horikoshii), 3 Thermoplasmat-ales (Ferroplasma acidarmanus, Thermoplasma volcanium,Thermoplasma acidophilum), 2 Halobacteriales (Halobacte-rium sp, Haloarcula marismortui), 4 Methanosarcinales(Methanosarcina barkeri, Methanosarcina mazei, Methanosa-rcina acetivorans, Methanoccoides burtonii), 1 Methanobac-teriales, (Methanothermobacter thermoautotrophicus), 2Methanococcales (Methanocaldococcus jannaschii, Methano-coccus maripaludis) Archaeoglobus fulgidus, diverse metha-nogens (Methanogenium frigidum Methanopyrus kandleri)and Nanoarchaeum equitans.
The sequences of 34 genes identified as core genes in [12]were retrieved using the program "retrieve sequences" inall analyses of the Neurogadgets website [38] (option"Reciprocal best match in other genomes" using a GInumber). The 34 genes were: argS, infB, pheS, rplN, secY,dnaG, ksgA, proS, rpsB, serS, dnaX, leuS, rplA, rpsC, thrS,fusA, lysS, rplC, rpsD, trpS, gcp, metG, rplE, rpsG, valS, gltX,nusA, rplF, rpsH, ychF, hisS, nusG, rplK, rpsM. For all thesemarkers, we produced a careful alignment and prelimi-nary phylogenetic analyses (NJ) to check the sequenceorthology. We subsequently excluded from the files all theinstances of species harboring multiple copies of eachgene and obtained a set of 34 files with 135 shared spe-cies. Maximum Likelihood analyses, using Phyml [13],were conducted on these data to ensure that the mono-phyly of the main groups under study was supported. Asit appeared that the homology of archaeal and bacterialsequences in lysS was doubtful, and that pheS and proSpresented either hidden paralogy problems or more likelyancient LGTs between the two prokaryotic domains, these3 markers were removed for the rest of our study. We useda selection of 43 common species representative of 8major prokaryotic groups in the 31 remaining markers,for further in-depth phylogenetic analyses to be presentedhere and elsewhere. The groups tested here were: theArchaea (Halobacterium sp., Pyrococcus abyssi, Archaeoglobusfulgidus, Methanosarcina acetivorans, Thermoplasma volca-nium, Pyrobaculum aerophilum, Aeropyrum pernix, Sulfolobussolfataricus), the Spirochaetes (Borrelia burgdorferi,
Treponema denticola, Treponema pallidum), the Chlamy-diales (Parachlamydia sp., Chlamydia muridarum, Chlamydiatrachomatis, Chlamydophila pneumoniae, Chlamydophila cav-iae), the actinobacteria (Propionibacterium acnes, Bifidobac-terium longum, Mycobacterium avium subsp paratuberculosis,Corynebacterium diphtheriae gravis), the Proteobacteria(Campylobacter jejuni, Wolinella succinogenes, Desulfovibriovulgaris, Geobacter sulfurreducens, Xanthomonas axonopodis,Nitrosomonas sp., Caulobacter crescentus, Mesorhizobiumloti), the Cyanobacteria (Gloeobacter violaceus, Synechocystissp., Prochlorococcus marinus, Thermosynechococcus elongatus,Nostoc sp., Synechocystis sp.), the Aquificales/Thermoto-gales (Thermotoga maritima, Aquifex aeolicus) and the firmi-cutes (Clostridium acetobutylicum, Thermoanaerobactertengcongensis, Ureaplasma parvum, Mesoplasma florum,Lactobacillus johnsonii, Bacillus subtilis, Staphylococcusaureus).
Impossible analysesBootstrap calculations were calculated using PHYML [13](settings, 4 categories, Γ law, JTT model of evolution) andCONSENSE [14] for each of the 31 markers. These bipar-titions were inputed to our new software: Impossible,which accepts as input any bipartition files produced byCONSENSE [14], containing identical or overlapping setof species. Missing taxa are not a problem, as an optionallows us to filter the outputs to focus on the commonspecies, if desired. Typically, these infiles, one per marker,contain the list of the species investigated and the list ofbipartitions with their BVs. Bipartitions appear as a stringof "*" and ".", which splits the species investigated intotwo disjoint subsets. Species sharing a "*" or species shar-ing a "." are more closely related than species with a dif-ferent symbol. In classical phylogeny, each bipartition,thus defining a split, allows us to draw a dichotomy on atree, and the bootstrap support indicates the robustness ofthis relationship. Impossible examines all of the biparti-tions that have support above a user-defined cutoff todetermine two different types of impossible relationships:the basic impossibility and the combined impossibility(see Additional file 1).
Basic impossibilities occur between the two subsets of asingle bipartition (i.e. AB|CDE or **...): grouping mem-bers of the left subset with members of the right subset isimpossible, and vice versa. By default, basic impossibili-ties are given a score of one. The higher the score betweentwo species or two groups of species, the more their asso-ciation is rejected by the data. Combined impossibilitiesare quite different from basic impossibilities as theyexplore the hierarchical structure of the phylogenetic tree,and involve more than one bipartition. Each combined-impossibility consists of two subsets of species whichcome from n different bipartitions and have disjoint taxo-nomical sampling. To identify them, for each marker, all
Page 3 of 19(page number not for citation purposes)

Biology Direct 2006, 1:26 http://www.biology-direct.com/content/1/1/26
pairs of bipartitions are examined to determine if a com-bined impossibility exists between them. For instance, forthe bipartitions ABC|DEF and AB|CDEF, there are fourpairs of cross-subsets: ABC-AB, ABC-CDEF, AB-DEF, andCDEF-DEF. However, in our definition, only AB-DEF is acombined-impossibility since all the other pairs, sharingspecies between their subsets, are partly overlapping. Eachcombined impossibility is given a score of one plus theirdegree value. Conceptually, this degree value representsthe number of strongly supported nodes which occur onthe path between the two subsets of the cross impossibil-ity and thus oppose to their direct grouping. To calculatethis degree value, we defined a 'related set' as any set thatincludes one member of the combined-impossibility as asubset. We then listed the related sets present in all thebipartitions of a marker for each subset of the combined-impossibility of interest. Our second step is to evaluate thenumber of related sets that do not share any species incommon. Indeed, the list of related sets does not corre-spond exactly to the number of dichotomies between twocombined-impossible subsets of species as some of therelated sets partially overlap and encompass commonspecies. In order to detect and remove the overlapsbetween 'related sets' (not to obtain artefactually highdegree values of impossibilities) and to define the numberof nodes separating two groups, we sort them by decreas-ing order of size, based on the number of species that theyencompass.
Briefly, 'related sets' with the most species are more likelyto be involved in an overlap. The related sets that are bothinvolved in the most numerous overlaps and higher inour list are then removed. In case of ties, one of the relatedsets involved in the largest number of overlaps is ran-domly selected for removal. The procedure is repeateduntil no overlap is left. By default, the degree of this com-bined-impossibility is then evaluated as the number ofremaining related sets plus one (see Additional file 2).Researchers are however able to change these weightingsin order to give cross impossibilities more or less empha-sis. If the user specifies «linear» weighting, the weightingbecomes the number of related sets + 1 + a user-suppliedvalue, if he specifies «multiplicative» weighting, theweighting becomes the number of related sets + 1 multi-plied by a user-supplied value, if he specifies «exponen-tial» weighting, the weighting becomes the number ofrelated sets + 2 exponential a user-supplied value.
Finally, these scores of impossibilities are used to compilethe tables and diagrams outputted by Impossible (seeAdditional file 1). The tools propose 4 different summa-ries: (1) an impossibility diagram, (2) a group-group dia-gram, (3) a species-group diagram, and (4) a pairwiseimpossibility diagram. Each of these diagrams, whilebased on the same data, displays a different facet of the
results. The first set of diagrams displays all of the impos-sibilities that the program has identified. This set containsthree different sections: (a) basic impossibilities, (b) com-bined impossibilities, and (c) a summation of basic andcross impossibilities. On (1), the impossibilities are dis-played as coloured squares sets on a grid. Each columncorresponds to a different markers, whereas each row cor-responds to an individual impossible association of spe-cies, supported by one marker under investigation.Therefore, a square in column X in the row correspondingto impossibility w-y indicates that the association of wwith y is impossible for the marker X. One can thus assesswhich markers present similar pattern of refutation andwhich do not, and which relationships are stronglyrejected, or only rejected by a few markers. To ease thisidentification further, the rows are ordered to locate theimpossibility that occurs in the largest number of markersat the bottom of the diagram, while the rarest impossiblerelationships is placed at the top of the diagram. In both(1a) and (1b), basic impossibility squares are coloured inwhite, and combined-impossibilities are indicated withvarious shades of blue, with darker shades correspondingto a higher overall degree value. The numerical valuesindicating the strength of the rejection of a relationshipare also displayed in an array, for further statistics (outfile.pharm). Finally, in the combined diagram (1c), an extra-row and an extra-column display the overall impossibilityscore for that whole row or whole column. Markers pro-posing the most impossibilities (refuting genes), andstrongest impossibilities (refuted groups) receive thehighest overall score, and are easily identified.
The second diagram, which is known as the group-groupimpossibility diagram, transforms the data included inthe first diagram in a bar graph. The length of each bar rep-resents the total score for a particular impossible group-ing. For instance, the entry AB would show the sum of thevalues for all of the impossibilities that have AB as a sub-set. Diagram (2) thus allows a researcher to find whichgroups of species tend to be the most unrelated to otherspecies, and thus would deserve further investigations tobe classified. This diagram presents another interestingproperty: the groups with the highest impossibility scoresrelative to other groups are also the most probable associ-ations of species.
The third kind of diagram breaks down the informationfound in the group-group diagram, as it provides the userswith the possibility to highlight the impossible relation-ships for a species of interest (i.e. their favorite bug ornewly sequenced organisms). Any selected species can begiven its own diagram of type (3)-the species-group dia-gram – that summarizes its non-relation with othergroups. The species-group diagram can be used to deter-mine in which groups the selected species cannot be
Page 4 of 19(page number not for citation purposes)

Biology Direct 2006, 1:26 http://www.biology-direct.com/content/1/1/26
placed. Counter-instances in a given marker presentingthe grouping of the species with its usually refuted part-ners, would thus help to unravel interesting exceptionsand original gene histories (i.e. LGT).
The final diagram produced by Impossible is the pairwiseimpossibility diagram (4). It shows impossibilitiesbetween pairs of individual species. By only showing pairrelationships, this diagram avoids any possible group sizebias, which tend otherwise to award large groups highimpossibility scores. This is because large groups containmore elements which can be involved in impossibilityrelations. By using only single species, there is always onlya one-to-one relationship. This diagram is also convertedinto numbers that can be used in statistical analyses toidentify species with similar/different patterns of refuta-tions of relationships.
Finally, Impossible contains a rough feature to test theinconsistency of a priori user-defined original groupings,switch -g. Although a researcher can manually lookthrough the complete diagrams to determine whichgroups are refuted and which ones are not, a more user-friendly method might be to input predefined groups ofinterest into Impossible (i.e. the cabozoa) and haveImpossible return their information. As the user-definedgroup to be tested will appear in the pairwise impossibil-ity diagram under the appelation chosen by the user, anentry showing the internal impossibilities between themembers of the predefined group will also be indicated inthe pairwise diagram. In order for a group to be consid-ered potentially solid, a rough estimate is that the sum ofits external impossibilities (the number of associationsrejected by a group) must be greater than the sum of itsinternal impossibilities. Otherwise, the members of the apriori groups will reject their grouping more than theyreject their association to any other taxa.
For the archaeal dataset, we ran Impossible with the fol-lowing command-line:
Java Impossible F1 0.9 -a -g F2 -o F3, with F1 correspond-ing to the list of files of bipartitions, F2 being the descrip-tion of groups to be tested by the rough estimate ofinconsistency and to be listed in the pairwise diagram andF3, the name of the outfile at the pdf format. As test-groups for F2, we retained the Methanococcales/Meth-anobacteriales, the Methanosarcinales, the Crenarchae-otes, the Halobacteriales, the Thermococcales, theThermoplasmatales as described above. F2 exact format isbuilt as the name of the group followed by the names ofthe species of the group, separated by a coma (i.e.groupName1 species1, species2, species3 and, on the nextline, groupName2 species2, species3, species4.) 0.9 indi-cates that all the bipartitions with more than 10 % of sup-
port were considered. For the prokaryotic core dataset, wefirst ran Impossible with the following command-line:Java Impossible F1 0.1 -a -o F3, respecting the samenomenclature than above in the text. 0.1 means thatbiparitions with a support higher than 1-0.1, which is90%, were considered.
The principal component analyses were run using R and ascript presented in [15]. The coordinates of the species ofthe principal component analyses were extracted and usedto test the normality of the data as well as the two-sampleT-test and the Wilcoxson rank-sum with NCSS Junior 6.0.This program, which is a freely-distributed and can bedownloaded from the NCSS website [39], runs on any ver-sion of Windows. The data are inputted into the programin the form of a tab-delimited table (although space-delimited and comma-delimited tables are also accepta-ble). This table can be prepared using our script Make-Group, with the command line MakeGroup grouppgroup, where group is a text file containing the group tobe tested, as described above for Impossible and pgroup issimply the output of the Principal Component Analysis,presented on two columns. Each column represents a listof values to test different species grouping (i.e. the X axisor Y axis coordinates on the principal component analy-sis). To run the analysis (options Run > Run Analysis), thecolumns of data of interest have to be selected in theResponse variables section of the options Analysis > T-tests > Two-sample t test. The output from the programwill be displayed on the screen. In addition to the primarystatistical tests mentioned above, NCSS also runs severalother tests to determine the validity of the data such astests of the normality and variance equality. If the normal-ity test fail for a certain pair of groups, as its variance testsdetermine that the sample groups have unequal variances,it is still possible to use the Aspin-Welch Unequal-Vari-ance test instead of the two-sample T-test to assess if twogroups of species are statistically different or not. It wasnot needed here.
Results and discussionToward an attempt to facilitate classical molecular systematicsClassical molecular systematics embraces a tree-likemodel: its ultimate goal is the elaboration of a uniqueinclusive hierarchy [16]. Whenever a new species is dis-covered and its genes or genomes sequenced, the affilia-tion of this species to known groups is the object of thesystematicist's speculations. To achieve this, significantreorganizations of former classifications may be requiredand some past hypotheses challenged. In such cases, mul-tiple taxonomical levels have to be redefined or eveninvented. Thus the state of classification becomes thentemporarily open. As with any new problem, one of the
Page 5 of 19(page number not for citation purposes)

Biology Direct 2006, 1:26 http://www.biology-direct.com/content/1/1/26
simplest positions is to assume that everything is possible,that many groups might potentially host the new species.
T. Cavalier-Smith's writings about the «cabozoan hypoth-esis», (the claim that there is a common origin for eugle-noid and chlorarachnean chloroplasts), illustrate thislogic of a priori maximal possibility well. As this authorunderlined in a paper from 1999 [17], "a relationshipbetween euglenoid and chlorarachnean chloroplasts has notbeen previously suspected apart from one brief mention of thepossibility [...] Though at first sight a strikingly differentarrangement, it does not actually preclude a direct phylogeneticsister relationship between them, as postulated here". T. Cava-lier-Smith used the absence of evidence as a starting pointfor his revised systematics. For example, he argued that for"cabozoan", "the phylogeny of both groups is imperfectlyknown. [...] But this is no serious objection to the cabozoan the-ory", for discicristates, that "there is no particular reason tothink that archezoa/discicristates are sisters to all eukaryotesexcept Reclinomonas. So I suggest that they may instead be sis-ter only of the Cercozoa", for the phylogenetic proximitybetween the sporozoan and the dinoflagellates plastids,he recalled that "the published [tufA] trees do not rule out adirect relationship instead with dinoflagellates, for which notufA sequences are yet available" [17]. Open exploration ofthe taxonomically possible is definitely an important partof the traditional classification task.
Yet, discussing the possibility of new groupings is only thefirst step in such an analysis. Once a group and its subse-quent sister-groups are proposed, these hypotheses mustbe tested. In pursuing the cabozoan case, Cavalier-Smithmade it clear that "one way of testing the cabozoan theory isto establish which of the clades postulated here are correct andwhich are false". The test may not be easy, due to the weak-ness of phylogenetic markers [18], which is often the firstproblem with testing taxonomic hypotheses. Along thisline of thought, Cavalier-Smith recognized that "our ina-bility to infer the correct branching order of the seven taxa[including sporozoan, dinoflagellates, euglenoids andchlorarachnean] merely from rRNA trees cannot be seriouslyquestioned. Therefore such trees cannot be used to confirm orrefute my postulates of plant, chromist, and chromalveolatemonophyly" [17]. Better resolution (at least locally) is thusoften needed to refute some groupings. Yet obtaining bet-ter apparent resolution is not sufficient. Some visiblyrobust results on phylogenetic trees should be interpretedwith caution due to potential artefacts that would unitesome unrelated species in an erroneously supported sin-gle group. Another of T. Cavalier-Smith's proposed clades,the myosozoans, illustrated this issue and how the sys-tematist should not take a phylogeny at face value withouta critical look. Some results may simply be «too nice» tobe considered true, i.e. "the extreme divergence of the dino-flagellate sequences might be expected to cause them to group
with the sporozoan sequences even if they were not directlyrelated" [17]. In this case, the comparison with other genephylogenies, especially those including species withslower evolving genes [19], might help to pinpoint gene-specific artefactual groupings. The contrast of multipleindependent gene phylogenies is thus another key in test-ing taxonomic hypotheses.
Consequently, these few examples stress the value in sys-tematics of developing phylogenetic approaches aimed attesting multiple relationships, possible and impossiblealike: accounting both for the limited as well as for theconflictual resolutions between multiple gene trees.
Epistemological principles of our tests of phylogenetic hypothesesWith this goal in mind, we developed phylogenetic anal-yses testing hypothetical groupings but trying to be lessverificationist and more falsificationist in spirit. To makethis last principle explicit, we will discuss in more detailthe interests and scopes of these two different epistemog-ical approaches.
The notion that cladism and total evidence are verifica-tionist is indeed often argued in the literature [20]. Forinstance, «introducing the concept of 'total evidence' in system-atics, Kluge (1989) cited the relevant theoretical background,namely the work on inductive inference and its relevance forepistemology by the philosophers Rudolf Carnap and CarlHempel. Consulting the references provided by Kluge (1989) ofCarnap (1950) and Hempel (1965) shows that for theseauthors, the principle of 'total evidence' was tied to inductiveinference» [21]. More precisely, «the empiricist philosopherRudolf Carnap used 'total evidence' as a tool of decision-mak-ing, where the decision is to accept or reject a certain theory/hypothesis on inductive grounds. 'Total evidence' supports thisprocess of decision-making by determining, in part, the value ofa 'c-function,' which is the 'degree of confirmation'» [22]. «If[evidence] e expresses the total knowledge of X at time t, that isto say, his total knowledge of the results of his observations, thenX is justified at this time to believe [hypothesis] h to the degreer [where r is the result of applying inductive logic to e and h],and hence to bet on h with a betting quotient not higher thanr.]" [23]. Put in more concrete phylogenetic terms, totalevidence suggests to analysing as many data as possible todecide how much support a given relationship has. Inconcatenation analyses, this is achieved by joining all thegenes together in the largest alignment possible, thusmaximising the number of synapomorphies.
The logic of verificationism developed here has conse-quently one limit: such an «inductive support works symmet-rically, confirming or disconfirming theories or hypotheses to agreater or lesser degree. An empirically confirmed hypothesis Adisconfirms a rival hypothesis B to the degree to which B is
Page 6 of 19(page number not for citation purposes)
Biology Direct 2006, 1:26 http://www.biology-direct.com/content/1/1/26
inconsistent with A. So if x confirms hypothesis A, y confirmshypothesis B, and if x carries a greater evidentiary weight thany, then A is confirmed and B is symmetrically disconfirmed»[24]. Total evidence is thus fundamentally a confirmatoryapproach, going for the majority rule as the answer,instead of carefully testing if some individual gene in theconcatenation rejects some groupings, and identifyingwhich ones. This is problematic as it makes the untestedassumption that there is a unique phylogenetic answer,which relevantly summarizes the phylogenetic informa-tions of the different markers. Inevitably, in a verification-ist approach (for instance after the concatenation ofmultiple markers) the most-parsimonious tree or themost-likely one is always «well-"corroborated"» [20]. Yet,as falsificationists would point out, it does not mean thatthis concatenation tree has been proven to represent thetrue evolutionary history for all the genes. Falsificationistswould claim that the «y» characters in favor of hypothesisB have been unfairly dismissed.
This is a real problem, as more sequences would increasethe global bootstrap support even when conflicting inphylogeny [15]. This may be true even when disagree-ments between markers remain, due to lateral gene trans-fer, hidden paralogy or artefacts [5]. So, when providedwith a long concatenation and a verificationist tree, «sys-tematists typically talk about 'congruent' characters, but whatthey really mean by that is the coherence of sets and subsets ofcharacter statements relative to an inclusive hierarchy» [22];the common tree whose existence was taken a priori forgranted. Importantly, such a «test of congruence under totalevidence [...] is shown to be related to the coherence theory oftruth in metaphysics and thus to coherentism in epistemology»[22]. What this does mean is that such a method is notemployed independently of an ontological conception ofspecies, which is not necessarily explicitly stated and,should it be, would not necessarily be approved by all thecommunity. As demonstrated by Ruse, "as soon as onestarts breaking organisms into parts, one must bring in theory... Take two bears, one white and one brown. Do they differ inone feature, or does one take each hair separately ... The pointis whether someone who explicitly eschews the theory has theright to combine all the hairs into one feature" [22]. What thesystematists who work from a verificationist/coherentistpoint of view classically do, is to force a unique modelupon all markers, as if they were not as many gene histo-ries as there are genes: they assume that, like bear hairs,genes can be combined in one feature.
Yet, if the hairs of a bear all quite likely share a same ori-gin, in a context of lateral gene transfers (hidden paralogyand artefacts), the a priori hypothesis that there is a com-mon phylogenetic history for the genes might be veryrisky to embrace, as the resulting truth might well be veryartefactual. After all, even random markers concatenated
together can strongly support a tree. On the one hand, "asFarris himself pointed out: "... the decision [the choice amongstcompeting hypotheses of relationships] is made by accepting thestronger body of evidence over the weaker, and ad hoc hypoth-eses of homoplasy are required to the extent that evidence mustbe dismissed in order to defend the conclusion"» [22]. On theother hand, despite what it seems "congruence does not sup-port a phylogenetic hypothesis, for the congruent charactersneed not be homologous, they could also be homoplastic» [22].Philosophically speaking, the least we can say is that thegreatest care should accompany the positive interpreta-tion of any global well-corroborated topology. There isindeed a high type I error to accept a wrong tree with thisapproach.
Some systematists, such as Kluge, came progressively torealize some of the weaknesses of verificationism, andtried to shelter phylogeny under the apparently more pro-tective aura of falsificationism. They reworded the logic ofthe test of congruence and insisted on the fact that «in phy-logenetic analysis, an hypothesis of relationships can be said tobe falsified if a perceived synapomorphy is inconsistent or inconflict with the hypothesis», a claim that indeed sounds fal-sificationist [20]. However, there are numerous reasonsfor which this semantic trick falls short, as discussed inlength and convincingly by Rieppel.
To clarify what was still not falsificationist in phylogeny,let us summarise very briefly how strong falsificationismfunctions. This popperian approach to scientific knowl-edge rests on what is called an "hypothetico-deductive"logic, which requires that a testable prediction is deduci-ble from a theory/hypothesis and its auxiliaries. Thefamous example given by the philosopher is that of thestatement «all ravens are black", which can be logically trans-formed to «there is no one thing that is not black and is araven," and that statement in turn can be logically transformedto «no white raven is here now". Hence, if one accepts the obser-vation of a white raven here and now, then that negation of thenegated observation statement contradicts the universal propo-sition in logical space, and falsification occurs" [24]. Yet, thereis more to falsificationism, since it is also an «asymmetricalall-or-nothing affair» [24]. The non-refuted, non-rejectedhypotheses remain in fact unproven. Even with a reformu-lation, classical phylogenetic approaches fail to acknowl-edge this assymetry as the same fact classicallysymmetrically confirms a statement (if it exists), or dis-confirms a statement (if it does not exist). The promotionof a concatenated tree as the true tree is still, thus, opposedto the "asymmetry of falsification." For a falsificationist, atree resulting from a concatenation is never proven.Namely, "if a prediction deduced from theory is met by experi-ence, it does not confirm the theory, it only corroborates it. Ifthe prediction is not met, or rather, if it is accepted that the pre-diction is not met, falsification of the theory occurs" [24]. As
Page 7 of 19(page number not for citation purposes)

Biology Direct 2006, 1:26 http://www.biology-direct.com/content/1/1/26
expounded by Rieppel, 'it is evident that no such asymmetryof falsification obtains in the 'test of congruence' based on totalevidence. Congruent characters (coherent character state-ments) confirm a hypothesis of relationships to the degree thatincongruent characters disconfirm it symmetrically. This is therelationship expressed in the ensemble consistency index (ortree length)» [22], or in a higher likelihood for the concate-nation ML tree. Indeed, since most phylogenetic programswork by identifying the most likely relationships betweenspecies while eliminating the most unlikely, a best tree issimply the one having a slightly higher acceptability thanthe rest in the output given to the user, which usually con-tains a large number of very different trees. Yet, even ifsuch a tree is still unproven, some relationships, by defi-nition not reported on this drawing, might well have beenrejected in the process of its reconstruction.
One of our guiding principle was to look for these locallyrejected grouping and to try to promote a way to thinkmore assymetrically about phylogeny without taking theverificationist shortcut, as the only answer of a phyloge-netic analysis. Instead of letting our main concern beabout the 'best supported' hypothesis of relationships, wedecided to focus on the most falsified hypotheses of rela-tionships. To do so, we first looked not only at the domi-nant relationships – the ones found on the best tree-butalso at all the challenged associations and the multiplephylogenetic falsifications they allowed us to infer. Inter-estingly, we do not need a fully resolved tree to producesuch results: the list of the bipartitions, not necessarilyconsistent between and within a marker suffices. Second,we analysed the refuted relationships for multiple markersof interest independently, to avoid masking any minorphylogenetic histories that would be overwhelmed by theconsensus in a verificationist concatenation. We feel thatthis perspective might more efficiently gain taxonomicknowledge than the traditional attempt to increase thesupport for a given possible phylogenetic group. Indeed,from an epistemological point of view, it would allowsome firm conclusions to be drawn about which groupsare not true for a given dataset, while the classicalapproach would establish only a limited number of rela-tionships that have not been falsified yet.
Our approach to refute impossible groupsWe wrote a program in java, named Impossible, whichlooks first of all for the relationships that are the moststrongly falsified by the genomic data, using bootstrapbipartitions as infiles (see Material and methods fordetails). In brief, Impossible estimates a degree of impos-sibility for any pair of species or groups of species by com-paring and ranking all the bipartitions, for each marker aswell as for all the markers, if they are above a user-definedthreshold.
An Impossible analysis can then be followed by statisticaltests, which can help decide which groupings are likelystatistically rejected. We suggest using principal compo-nents analysis [25] on the data reflecting the degree ofimpossibility for any pair of species to group together.This multivariate analysis takes the data points, which cor-respond to all the pairwise impossibility relationships,and transforms them onto a n-dimensional plan, wherethe dispersal between species is maximised. That way, inthe principal component analysis, the higher the pairwiseimpossibility score between two species, the further awayfrom each other they will be placed on the graph. Con-versely, species for which groupings are possible will tendto cluster more closely on the graph. Observing the spreadof species can thus, provide a first clue about which group-ings are refuted.
Once the data have been organised (for instance along thetwo main axes of the principal component analysis), thetwo-sample T-test and the Wilcoxson rank-sum test can beapplied to compare the values of the coordinates of a pri-ori user-defined groups of species [26]. These statisticaltests allow determination of whether two groups of data,A and B, are not significantly different and can be consid-ered as a subset of an overall common group or not. If thedata have a normal distribution, and if the means andoverall standard deviations of groups A and B are not sta-tistically different, the grouping is statistically possible.Conversely, if their means and their standard deviationsdiffer significantly, the two groups can be determined asindependent. The grouping of A and B is then statisticallyrejected. Clearly, the size of the data sets under investiga-tion will affect the overall accuracy of the statistical analy-sis, and larger data sets of roughly equal size providebetter estimates than smaller sets.
Application to several prokaryotic genesTo illustrate a possible use of our software, we consideredtwo prokaryotic datasets. First, Impossible was used tostudy the mysterious phylogenetic position of Nanoar-chaeum equitans, the sole cultured representative of thephylum Nanoarchaea, for an archaeal dataset of 23 ribos-omal proteins, including 23 species, belonging to morethan 10 phyla (see Material and Methods). Impossiblerough estimates indicated that it was more likely that N.equitans should not be grouped with the Methanosarci-nales/Methanomicrobiales (2723 degrees of impossibil-ity), then not with the Halobacteriales (1461 degrees ofimpossibility), the crenarchaeotes (1348 degrees ofimpossibility), the Methanobacteriales/Methanococcales(1335 degrees of impossibility), the Thermoplasmatales(1280 degrees of impossibility) and the Thermococcales(1208 degrees of impossibility), respectively. The PCAreflects these numbers. In Figure 1, the Methanosarcinalesand the Methanomicrobiales Methanogenium frigidum
Page 8 of 19(page number not for citation purposes)

Biology Direct 2006, 1:26 http://www.biology-direct.com/content/1/1/26
(identified as members of the Class II of methanogens in[11]), as well as the Halobacteriales, fall far to the left ofN. equitans, suggesting that these species are not closelyrelated. We had however no direct way to test which of thegroupings of N. equitans with species falling close to it inthe PCA, such as the Methanobacteriales/Methanococca-les (identified as members of the Class I of methanogensin [11]), the Thermoplasmatales, the Thermococcales orthe crenarchaeotes, were rejected or possible. We thusused these 4 different a priori groups, each containingmore than three species, to operate a "triangulation" anddefine which could not be closely related to the Nanoar-chaea. Based on the coordinates of each species on eachaxis of the PCA independently, we used the two-sample T-test and the Wilcoxson rank-sum test at the level of 5% totest if some associations amongst all the possible pairs ofthese 4 groups of species were significantly rejected. Inter-
estingly, the two tests convergently concluded that thecoordinates of the crenarchaeotes and the Thermococcalesalong the first axis were significantly larger than the coor-dinates of both the Thermoplasmatales and the Methano-coccales/Methanobacteriales. We symbolized this resulton Figure 2, by a vertical frontier between these twogroups of species, as the tests indicated that the species oneach side of the frontier (i.e. the crenarchaeotes and theThermococcales on one hand, and the Thermoplasmat-ales and the Methanococcales/Methanobacteriales on theother hand) were statistically different. When we repeatedthe same tests for the y axis, we observed a second frontier,horizontal, separating the "lower" crenarchaeotes fromthe "higher" Thermococcales/Methanobacteriales/Meth-anococcales/Thermoplasmatales. The conjunction ofthese two frontiers remarkably isolated N. equitans fromthe 4 groups, but left it in the vicinity of M. kandleri. This
Principal Component Analysis of the archaeal datasetFigure 1Principal Component Analysis of the archaeal dataset. Degrees of impossibility of the pairwise diagram were used to infer this principal component analysis. The variance explained by each axis is reported along the lines. Each point on the dia-gram corresponds to a species, and received the colours of the archaeal order to which it belongs, as indicated on the left of the graph.
500
1000
1500
2000
2500
3000
3500
4000
4500
-15000 -10000 -5000 0 5000 10000 15000
15.1%
78.5%
M. thermoautotrophicus
M. burtonii
M.kandleri
S. solfataricus
P. aerophilum
A. pernix
N. equitans
Crenarchaeota
Thermococcales
Methanosarcinales
ThermoplasmatalesMethanococcales
Halobacteriales
Crenarchaeota
Methanomicrobiales
Archaeoglobales
Nanoarchaea
Methanopyrales
M. frigidum
M. acetivorans
M. jannaschii
P. horikoshii
A. fulgidus
H. marismortui
T. acidophilum
F. acidarmanus
Methanobacteriales
Page 9 of 19(page number not for citation purposes)

Biology Direct 2006, 1:26 http://www.biology-direct.com/content/1/1/26
analysis thus indicates that, contrary to previous sugges-tions, N. equitans might not represent a third archaealkingdom [27,28], nor a Thermoccocales [29], but clusterswithin the euryarchaeotes, possibly as a relative of theMethanopyrales. This proposition now deserves carefulconsideration to ensure that it does not result from a longbranch artefact, since both Nanoarchaeum and Methano-pyrus display high evolutionary rates for the componentsof their transcription apparatuses [30]. The proximity
between Methanobacteriales/Methanococcales and Ther-mosplasmatales in the upper left corner of the diagram,delineates another possible group. It is also consistantwith phylogenetic analysis of concatenated ribosomalproteins that weakly groups Methanococcales and Meth-anobacteriales together, and the lack of any support in thebackbone branches separating them from Thermoplas-matales, which suggest that a specific sister-groupingbetween them is indeed possible. However, so far no spe-
Statistics applied to PCA resultsFigure 2Statistics applied to PCA results. This figure is the same principal component analysis as figure 1, on which the boundaries deduced from the convergent results of the two-sample T-test and the Wilcoxson rank-sum test have been mapped. A thick red line corresponds to the rejection of the null hypothesis that members on opposite side could come from a same group. Identically shaded areas represent regions where the difference of coordinates would not be considered as significant.
500
1000
1500
2000
2500
3000
3500
4000
4500
0 5000 10000 15000
Y-axis
X-axis
M. kandleri
MethanococcalesThermoplasmatales
Thermococcales
S. solfataricus
P. aerophilum
A. pernix
N. equitans
Crenarchaeota
Methanobacteriales
Page 10 of 19(page number not for citation purposes)

Biology Direct 2006, 1:26 http://www.biology-direct.com/content/1/1/26
cific synapomorphies appear obvious. Other groupings,such as the two distinct classes of methanogens identifiedin a previous study [11], are similarly not rejected byImpossible. Methanococcales, Methanobacteriales andMethanopyrales fall on the righthand side of the x axis inthe PCA (class I methanogens) as Methanosarcinales andMethanomicrobiales fall on the lefthand side (class IImethanogens) (Figure 1).
Another prokaryotic dataset of 31 ubiquitous markersconstituted our second case study, as the classification ofprokaryotes remains a major challenge for phylogeny[31]. These genes, present in no less than 180 completeprokaryotic genomes [12], are a potentially important setof molecular candidates to analyse what might be the ver-tical backbone at the "Tree of Life" level. In order to reducethe potential impact of lateral gene transfer or other arte-facts that would contribute an important non-vertical sig-
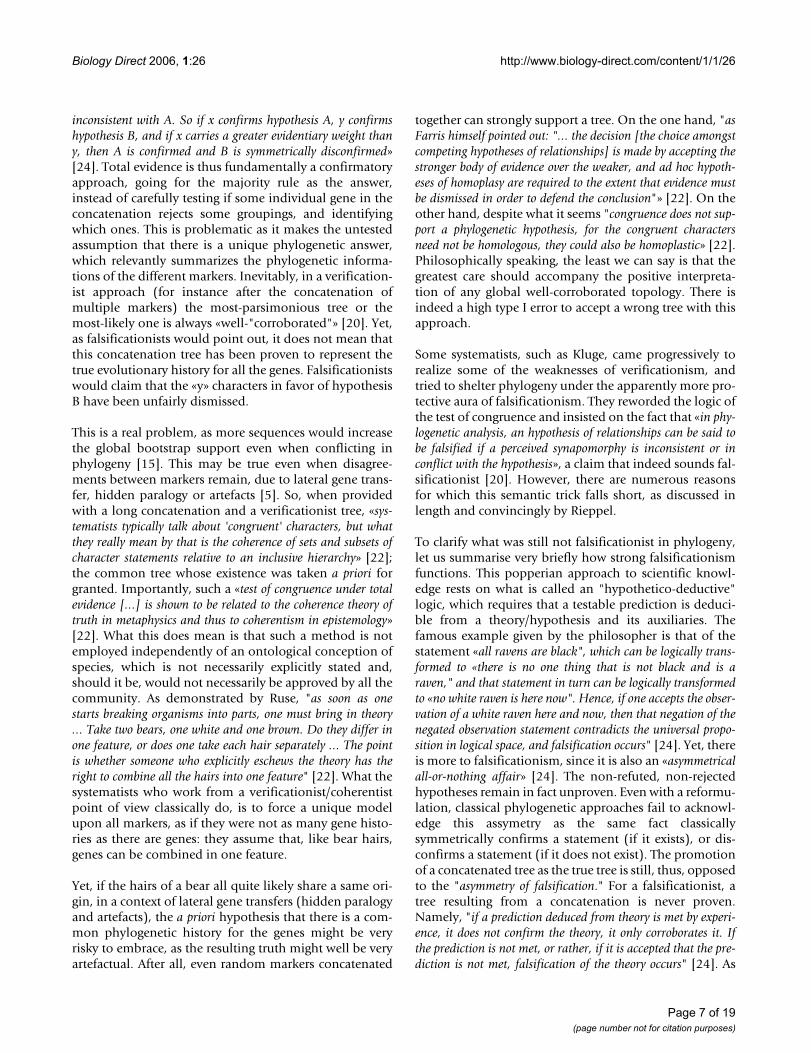
nal, we carried out a first Impossible analysis focusing onthe congruence between these 31 markers. We performeda principal component analysis, based on the degrees ofimpossibility for the 58 most commonly rejected biparti-tions presented by the Impossibility diagram. Figure 3shows that all these markers belong to a cloud with thepossible exception of argS, valS and metG. We subse-quently removed these 3 genes from our analysis andreran Impossible with the same parameters on the 28 coregenes for which no incongruence was suspected a priori.The second principal component analysis based on thedegrees of impossibility of the 28 markers and for 43 spe-cies is reported in Figure 4. In this diagram, the speciesknown a priori to belong to a monophyletic group tend togroup closer (i.e the Proteobacteria are very close on thediagram), but the distance between the different mono-phyletic groups varies (i.e. the Proteobacteria are closer tothe Actinobacteria than to the Chlamydiales). Some phy-
Principal component analysis of the 31 prokaryoticcore genesFigure 3Principal component analysis of the 31 prokaryoticcore genes. This PCA of core genes is based on their degrees of impossibility for the 58 most commonly rejected bipartitions, as reported in the .pharm. In grey, we have drawn the cloud of markers without obviously different phylogenetic signal. The variance explained by each axis is reported along the graph.
-12
-10
-8
-6
-4
-2
0
2
4
6
8
5 10 15 20argS
metG
valS
30.8%
17%
Page 11 of 19(page number not for citation purposes)

Biology Direct 2006, 1:26 http://www.biology-direct.com/content/1/1/26
logenetic information might thus be gained from thisprincipal component analysis. The tables in Figure 4report when this dispersion in the principal componentanalysis was considered statistically significant andexcluded that two groups belong to a common clade.Interestingly, the two axes provided highly congruentanswers concerning which groups were rejected or possi-ble (23 agreements and only 5 disagreements). Unfortu-nately, the position of the Chlamydiales remainsundecided. Their isolation from the other bacterial taxaunder study is made obvious on the PCA (Figure 4). Con-sequently, the Chlamydiales are involved in a very highnumber of rejections of potential relationships in the
group-group diagram (data not shown but see tables inFigure 4). This could be because all known representativesof this group are obligate intracellular pathogens, a life-style that can result in drastic changes in evolutionaryrates and codon uasge biases. Additional slowly evolvingrepresentatives of the Chlamydiales appear to be neededto understand the origin of this group and no concate-nated trees involving these taxa, wherever they branch,should be taken for granted. It is interesting to note how-ever, that despite their fast evolutionary rates, they do notartefactually group with distantly related species (i.e.Archaea), as would be the case due to typical LBA artefactin a molecular phylogeny.
Principal component analysis of the degrees of impossibility of 43 species, for 28 core genesFigure 4Principal component analysis of the degrees of impossibility of 43 species, for 28 core genes. Each point on the diagram corresponds to a species, and received the colours of its group, as indicated on the left of the graph. The two tables contain the results of the two statistical tests applied to the coordinates on axis 1 and on axis 2, to decide if a priori groups of points on the principal component analysis are overlapping or not. Eight groups were tested (see. Mat. and Meth.). When two groups were non-overlapping, we reported IMPO for impossible grouping on the table, and when we could not reject the null hypothesis that they overlap, we reported POSS. We indicated by an impo*, when one test only rejected a grouping.
-100
0
100
200
300
400
500
600
700
800
-400 -200 200400
600
58.7%
23.3%
Chlamydiales
Aquifex/Thermotoga
Firmicutes
Spirochaetes
Cyanobacteria
Proteobacteria
Actinobacteria
Archaea
AXIS I Archaea Spiro. Chlamyd. Actino Proteob. Cyanob. Aquif/Th.
Archaea XXX XXX XXX XXX XXX XXX XXX
Spiro. POSS XXX XXX XXX XXX XXX XXX
Chlamyd. IMPO IMPO XXX XXX XXX XXX XXX
Actino IMPO POSS IMPO XXX XXX XXX XXX
Proteob. IMPO POSS IMPO IMPO XXX XXX XXX
Cyanob. POSS POSS IMPO POSS IMPO XXX XXX
Aquif/Th. IMPO IMPO IMPO IMPO IMPO IMPO XXX
Firmicutes IMPO impo* IMPO IMPO POSS IMPO IMPO
AXIS 2 Archaea Spiro. Chlamyd. Actino Proteob. Cyanob. Aquif/Th.
Archaea XXX XXX XXX XXX XXX XXX XXX
Spiro. IMPO XXX XXX XXX XXX XXX XXX
Chlamyd. IMPO IMPO XXX XXX XXX XXX XXX
Actino IMPO POSS IMPO XXX XXX XXX XXX
Proteob. IMPO POSS IMPO IMPO XXX XXX XXX
Cyanob. POSS IMPO IMPO IMPO IMPO XXX XXX
Aquif/Th. IMPO IMPO IMPO impo* IMPO IMPO XXX
Firmicutes IMPO POSS IMPO POSS POSS IMPO IMPO
Page 12 of 19(page number not for citation purposes)

Biology Direct 2006, 1:26 http://www.biology-direct.com/content/1/1/26
The non-conflictual information about the rejectedgroups and the convergent information about the possi-ble ones allowed us to suggest three possible groupings:(i) the proximity of the Archaea and the Cyanobacteria,(ii) the proximity of the Spirochaetes and the Actinobac-teria and (iii) the proximity of the Proteobacteria and theFirmicutes, while other configurations are rejected. Thepossibility of an even larger clade comprising this last twocould also be put forward, consistent with the dispersionalong the principal component analysis. These results areof interest as they suggest an early emergence of bothCyanobacteria and Archaea, should the root of this tree beplaced in between the two prokaryotic domains. Shouldthe tree-like reasoning apply to these markers, thishypothesis would be consistent with the proposition thatthere might have been methanogenic Archaea and Cyano-bacteria living contemporarily 2.8 billions years ago[32,33]. Such an ancestry of Archaea is however impor-tantly contested by T. Cavalier-Smith [34], for whom theold fossil evidence is too indirect to be conclusive. Pres-ently, Cyanobacteria live closely associated with halo-philic Archaea in microbial mats found in salineenvironments, and it has been suggested that the fact thatboth Cyanobacteria and Archaea display gas vesicle struc-tures (which help them keep afloat in their natural envi-ronments) could be the result of lateral gene transfer. Yet,on the other hand, if the relationship between these taxais one of common descent, this feature could be insteadan ancestral characteristics of this group. Further in-depthphylogenetic studies will be needed to decide if this con-nection is genuine or should be rejected. A priori, thisgrouping is unlikely to result from an artefact due to pref-erentially shared lateral gene transfer, as prokaryoticgroups known to have undergone frequent interdomaingene transfers (such as Thermotogales or Methanosarci-nales) are not artificially attracted to representatives of thedonor domain in our PCA (Figure 4). Furthermore, earliergene phylogenies dealing with partially overlapping setsof markers never identified such a problem [35]. Yet, itmight reflect another problem if one considers the prox-imity of Thermotogales and Aquificales (Figure 4), whichare both hyperthermophilic specialist bacteria with smallgenomes, as artefactual. Perhaps similar lifestyles couldimpose similar evolutionary biases on their genomes [35].Finally, the possible proximity between the Spirochaetesand the Actinobacteria, as well as between the Proteobac-teria and the Firmicutes also deserve to be studied in evo-lutionary scenarios, as it might help to refine ourunderstanding of the bacterial evolution.
ConclusionSurprisingly, the application of our simple software basedon a slightly modified perspective allowed us to extractsome original information about complex phylogeneticproblems. We easily rejected a large number of a priori
possible combinations, which is our primary results. Thatsome groups are left possible for these markers is thenmentionned, as a complementary result. None of thesepossible group (the proximity of N. equitans and of theMethanopyrales, of the Archaea and the Cyanobacteria,the possible groupings of Methanobacteriales/Methanoc-cocales and Thermosplasmatales, of Spirochaetes and theActinobacteria and of the Proteobacteria and the firmi-cutes) should be taken as proven by this approach. Insteadall of them should be tested further under the advice ofbiologists working with the organisms, with other mark-ers or characters, and eventually be falsified. In any case,we hope that our present work encourages the attempts tomultiply the perspectives in phylogeny. In this respect, alot remains to be done to investigate more exhaustively,and with more powerful tools than ours, the "impossibleinformations" carried by phylogenetic markers, and theirconflicting signal, which is too rarely discussed (but see[36] and [37] for interesting exceptions).
Competing interestsThe author(s) declare that they have no competing inter-ests.
Authors' contributionsJB wrote Impossible. YB provided the biological expertiserequired to interpret the phylogenetic results and helpedwith the redaction of the manuscript. EB conceived theproject, supervised it, created the datasets and wrote themanuscript.
Reviewers' commentsWe would like to thank the referees for their comments thatgreatly help to improve this manucript.
Reviewer's report 1Mark Ragan, The University of Queensland, Brisbane, Aus-tralia
This is an interesting paper that challenges us to considercurrent practice in molecular phylogenetics (specifically,the testing of phylogenetic relationships) in the context ofcompeting theories of epistemic philosophy. The authorsignore Bayesian approaches, in which the empirical rela-tive frequency of a topology (determined by samplingfrom the equilibrium posterior probability distribution)converges to its corresponding marginal posterior proba-bility given the prior probability distribution, model anddata. Instead, relationships are viewed completelythrough the lens of the likelihood approach and its limit-ing case, parsimony (hence the authors' concern withsynapomorphies at Background, paragraph 2). Theseapproaches do not yield estimates of the probability ofbipartitions; rather, the robustness of a clade is typicallyassessed by use of the bootstrap.
Page 13 of 19(page number not for citation purposes)

Biology Direct 2006, 1:26 http://www.biology-direct.com/content/1/1/26
Philosophical theorising on classification is as old asPlato, and will continue for centuries. In the absence oflogical error, the authors' programme cannot be proveneither right or wrong, although it might be examined(subjectively) for aesthetic qualities such as elegance. ThusI offer these comments to help explore not the truth of fal-sity of their claims, but rather their generality, explanatorypower, and utility in application to real problems.
(1) Does concatenation practice rest on verificationism?The authors assert that when bootstrap values are low,phylogeneticists "try to increase the support of the cladesunder study by providing always more phylogenetic sig-nal (i.e. increasing the sequence length)". No doubt somedo, but alternatively we might view sequence regions assamples of the genome. A small sample (i.e. a single shortsequence) might represent a region of the genome thathappens to be anomalous in some way – as the result ofmutational saturation, selection, GC bias or whatever –and it would simply be good scientific practice to obtainfurther samples from different genomic regions, in hopesof integrating over as much local misinformation as pos-sible. The motivation would be not purely to pull signalout from stochastic noise, but equally to avoid interpret-ing a local anomaly as the true genome-wide phylogeneticsignal. This seems beneficial regardless of philosophicalprogramme. Indeed it's not always clear that the verifica-tionist and falsificationist programmes can be cleanly sep-arated. Consider the following (admittedly not verygeneral) case:
To test the hypothesis "there are exactly 10 thousand liliesin this 1-ha field", would I rather have data from a singlerandom 1-m2 sample grid, or from 1000? Unless the fieldwere fully tiled with grids and I can count the lilies inevery one, I cannot guarantee that I can definitively testthe hypothesis. But under either programme I'm better-offwith 1000 grids than with one: if the count exceeds 10thousand (which, given the size of lilies, is more likely tohappen in 1000 grids than in one) then the hypothesis isstrongly falsified; and if not, I can use the number of liliesthe 1000 grids do contain to assign a more-accurate prob-ability to the truth of the hypothesis. Either way, it's in myinterest to have access to more grids.
Author response: I want to thank the reviewer for his veryinteresting comments. It seems to me that the sample perspec-tive is interesting. I will embrace this analogy in my answer,and I would argue (i) that falsificationism and verificationismapproach can still be distinguished, and (ii) that the a priorihypothesis that there is a unique field to sample is coherentistand is not a free assumption, as it biases the meaning of theresults of the multiple sample practices.
It is indeed very important to have a better estimate of what thefield of 1ha contains (of what the tree of life is), if there is suchthing as a 1ha field (such a thing as a tree of life). If there isno such thing, but several overlapping patches of grass, multiplefields in this 1 ha area, then our estimate based on multiplesample will certainly be accurate, but it will not be a relevantdescription of the distribution of lilies. In fact, the number of lil-ies in each patch could differ for the simple and good reasonthat there is no such thing as a unique homogenous 1ha field,and then why would be willing to go on and comment abouthow rich this field is? So if the background hypothesis is correct,we are better off with more estimates, but we should make surethat we test that the hypothesis is safe first. We can not only beverficationist.
However, in phylogenetic concatenations, if someone assumesthat there is a tree, he is not prone to consider that different esti-mates could genuinely be different and that these differencesshould be tested to validate the concatenation approach itself.
Where the falsificationist and verificationist approaches coulddiffer then is that while the verificationist would assign itselfthe goal to describe the field as well as he can, the falsification-ist would eventually be happy enough to reject 1. that there is afield, 2. that there is this number of lilies in this patch. The firstone is coherentist (one field to count them all), the second onedoes not have to be so (as many differences as we can reportcould undermine the claim that there is one field to be discov-ered out there).
(2) In relationship-testing, would a falsificationist be"more likely [to] be interested by the rejection of impossi-ble groupings, underlining what can not be a naturalgroup"? For Popper, the possibility of falsification demar-cated science from pseudo-science (see Conjectures andRefutations). One exposes a hypothesis (here, a proposedclade) to a risk (a test in which the proposed clade can beshown to be false); if the hypothesis survives, its scientificstatus is enhanced (if it fails, it might be rescued by ad hocmeasures, but would come out with diminished scientificstatus). Falsification in this sense seems quite differentfrom what the authors propose, which seems more a mat-ter of chipping away at the space of possible hypotheses.Do the authors imply that by refuting some dozens (orhundreds, or thousands) of clades, all remaining un-refuted ones (or the refutable ones among them) areincreased in status?
Author response: No, we do not mean that. We stick to thedeepest spirit of refutation, which is not about proving any-thing, but disproving some things.
For large datasets, astronomical numbers of possibleclades will remain, most of them untouched by humanimagination, but each now with an infinitesimally
Page 14 of 19(page number not for citation purposes)

Biology Direct 2006, 1:26 http://www.biology-direct.com/content/1/1/26
increased status. Or (as in the Nanoarchaeum equitansexample) must we happen to care about the individualclades that happen to be refuted?
Author response: No increase in status for us. What was notrejected remains unproven for us. We simply suggest that weshould keep in mind what was rejected and make it visible.Then, if someones wishes to test the coherentist hypothesis thatNanoarchaeon is a X, we could at least tell him what are themany evidence that actually opposed to this claim.
(3) What does "falsificationist-lite" mean? In their"Impossible" analysis, have the authors not fallen intowhat Rieppel called the "semantic trick" of superficial fal-sificationism, where clades with little or no observedbootstrap support are considered refuted? Is this really fal-sification, in either a strong or weak sense? Do the authorsrecommend rejecting one pre-identified clade each time,or are they carrying out multiple tests?
Author response: Falsificationist-lite means falsificationist inspirit, more eager to disprove than to confirm, to stress the irre-ducibility of conflict than to hide it. We advocate this approachnot because falsificationism sensu stricto would be a betterapproach than verificationism for phylogenetics (both could notactually be applied in their strong sense), but because this per-spective can complement the verificationism of phylogeneticmethods too prone to look at what the majority signal is, andnot to look at what the plurality signal is, and would reject.Here, in this modest approach, we intend to provide a tool foranyone who, once done with his individual phylogenies, wantsto look at the data in a way that he could conclude easilyenough about the falseness of some (could be multiple) pre-identified hypotheses of relationships. So, in our approach thereis everything that is in the classical approach (a simple use ofbootstrap support to reject some groupings, but a refusal to useit to affirm that a grouping is proved) and a little bit more (acomplex use of multiple bipartitions together to deduce thedegrees of impossibility of a given relationship). It means thatthis approach is not falsificationist in the strong sense and thatthere is room for improvement in this respect to make it evenmore complementary to traditional approaches. It would be val-uable for instance to evaluate what was never ever seen in anytrees, for any gene, not even ever suggested to be a grouping,without resting on bipartitions, but maybe directly looking atthe pattern not inferred for each site in an alignment.
(4) Is lateral genetic transfer really the "most pervasiveproblem" in large-scale phylogenetics? There is little evi-dence that LGT is a problem at all for many taxa thatresearchers care about (e.g. animals, green plants, fungi).A stronger case might be made for the problematic perva-siveness of model mis-specification, methodologicalinconsistency, lineage-specific biases, long-branch attrac-
tion, paralogy, or (for systematics) the grade-vs-cladeissue.
Author response: Certainly, those are problem as well. Hencemy claim deserves to be tested, but can not be tested with toolsthat suppose that there is a unique tree a priori, and hidding theconflicting signal instead of highlighting it. One reason forwhich few transfers are observed by phylogeneticists using clas-sical phylogenetic approaches is simply that they can not detectthe vast majority of these lateral events. The recent works ofBrochier et al. is an example of that: these authors (hello Celineand coworkers) simply check if concatenated trees agree witheach other and from that compatibility conclude that there is noLGT in their whole dataset. However, by doing so they simplyacknowledge that they manage to obtain a dominant signal,which has not to be identical in any of the genes they used forconcatenation. All these genes could support phylogenies thatdiffer locally in topology, for instance because of LGT. The rea-son why the reviewer mention some presumably safest groups(plants, fungi, etc.) could then be partly psychological. Becausesome people believe that there are mechanisms causing LGTthat could be important in prokaryotes, they sometimes proceedto some further phylogenetic analyses, which generally suggestthat phylogenetic markers are too weak to tell about the extentof LGT, or even show some conflicting signal. Yet, for eukaryo-tes, few people have such an a priori belief, so few test it. Hence,they can not see LGT, and not see it as a problem, and theywould keep thinking that artefacts are a potentially larger issuein their dataset. But, should some of them start thinking thatprotists acquire genes laterally, as suggested by Andersson, thenwe might start seeing more reports of LGT in those safest groupstoo. I feel this is a limit of many of Philippe's et al. publicationsincluding protists in the analyses (hello Herve and coworkers).Because they use long concatenation, they get nicely resolvedtrees but those trees do not tell us anything direct about the truephylogenetic history of individual markers, and if some LGTwere dismissed to got the emerging picture. So honestly, I wouldsay it is an open question at large evolutionary scales (whenprotists and prokaryotes are involved), and to make our mindabout it more correctly, we will need to keep our eyes open to thediscoveries of microbiology and molecular mechanisms of LGT.Also, I meant more pervasive because LGT undermines the veryexistence of a tree of life, while artefact just make it harder tobe discovered.
(5) Is the posing of Cavalier-Smith's cabozoan hypothesisreally an illustration of testing multiple possible clades?Cavalier-Smith is a powerful exponent of the position thatboth clades and grades are important in systematics. Thisposition was once almost axiomatic, then fell into eclipsewith the rise of the strong cladistic programme. One sus-pects that Cavalier-Smith had more in mind than alterna-tive topologies when posing the cabozoan hypothesis; the"contrast of phylogenies" may be a key test among alter-
Page 15 of 19(page number not for citation purposes)

Biology Direct 2006, 1:26 http://www.biology-direct.com/content/1/1/26
natives, but for him, there can be other key tests that arenot topological in nature.
Author response: You are certainly right. Tom Cavalier Smithproposes indeed grades and clades (and I personally approve ofthis way of looking at things for classification purposes). Also Iwould assume that in many cases he actually means clade byclade (even if his own favorite topology (classification frame-work) can change), hence these claims (and singularly thisone) could sometimes be tested topologically (among otherapproaches).
(6) In what sense is comparison with other gene phyloge-nies different from total evidence, i.e. verificationism? Inthe third paragraph under Results & Discussion, theauthors comment that weakness of phylogenetic markers(i.e. their lack of resolving power, illustrated here by rRNAsequence data) can hinder tests (including attempted fal-sification) of theories. If even robust results may be erro-neous, what is to be done? The authors recommendcomparison with other gene phylogenies. This may not betotal evidence, but it does involve recourse to additionalinformation; in what way does this move beyond verifica-tionism?
Author response: The approach is different and so could be theresults. Genes are analysed individually as well as collectively:so individual dissent can be identified, local congruences can bedetected, so that the phylogenetic signal does not have to becoherent at the end of the analysis. It may well be the case thatno common possible "groups within groups" struture emerges atthe end of such an analysis, and that we end up observing mul-tiples patterns of rejection: coherent between some genes onlyand incoherent with any other gene, while this is impossible toreport in a verificationist approach. So this differs from totalevidence in the sense that the goal is not to maximise the degreeof confirmation of a single syncretic hypothesis.
(7) Do concatenation trees represent the true genomic his-tory? The principle embodied in the quotation leading offthe third paragraph of the section on Epistemologicalprinciples ("inductive support works symmetrically...")should, I believe, be credited to Kolmogorov. That aside,one does not have to be a falsificationist to ask when, andindeed if, datasets should be concatenated (the total evi-dence approach in sensu Kluge); this debate permeates thesupertree literature. More fundamentally, Ford Doolittlehas asked whether genomes necessarily have phylogenies(his analogy with city telephone directories). Reducing allof this to a battle between Carnap and Popper does injus-tice to the underlying complexities, both biological andalgorithmic.
Author response: Indeed, yet I feel it gives a solid rationale topreach in favor of the diversification of methodologies and
scopes in phylogenetics, a fields that tend to be too much con-cerned by the question "what is the tree of life?" and not by theother most fundamental essential questions: "is there a tree oflife?" and "what if there is no such Tree?"
(8) Are species relevant? In the section on Epistemologicalprinciples, paragraph 4, why do the authors relate tests of'congruence' to an ontological conception of species, asopposed to an ontological conception of genome? We aretalking about nucleotide (or protein) characters, not bearhairs. In what relevant ways might the two conceptionsdiffer?
Author response: It is related I believe in many people's mindas the use of a single phylogeny to find the single true phyloge-netic position of a species is a coherentist approach. This meansthat some assume that they will somehow end up equating thegenome histories with a single place and time along the tree oflife structure (the species origin). This conception of a species isindeed not relevant to me, as I am more inclined to conceivespecies as emergent cohesive arrangements of micro-compo-nents with their own histories, which can themselves trace backto different "ancestral" systems at different times and differentplaces in the past. I am thus more interested in trying to testhow many genes can be proved to coevolve (to have a cohesivepattern of inheritance). If it happens that we have no evidenceagainst the cohesion of all the markers under study (i.e. no dif-ferent impossible groupings derived based on these markers),then we could start wondering what their common tree is. Oth-erwise, we should prove that there is a common phylogeny forspecies to be inferred. In this respect, Impossible analyses is agood first step to test without a priori if a series of markersshould be combined and which ones.
(9) What body of observation or theory might inform theuser's choice among linear, multiplicative and exponen-tial weighting (particularly given the non-independenceof nodes within a given tree)? Of bipartition supportthreshold?
Author response: Because the issue of significativity is not spe-cific to our software (who can tell what is the bootstrap valueabove which a group is significantly supported?), I can onlythink about being empirical. Here, we offer the user differentoptional settings so that he tests their possible influence, to usea metaphor to try to zoom in and zoom out the distancesbetween taxa and figure if the dispersal on the PCA for instanceis dramatically modified with some parameters choices, orremain stable. Then, the user should report that such and suchgroups where impossible given such and such tresholds.
Reviewer's report 2Eugene V Koonin, National Center for Biotechnology Informa-tion, NIH, Bethesda, Maryland, USA
Page 16 of 19(page number not for citation purposes)

Biology Direct 2006, 1:26 http://www.biology-direct.com/content/1/1/26
This paper offers a fresh and interesting view of the episte-mology of phylogenetic analysis. The authors start byexplaining that traditional phylogenetic analysis is verifi-cationist in its epistemological foundations (inevitably,this brings to mind Moliere's Monsieur Jourdain who dis-covered, to his great delight, that all his life he spokeprose... but nevertheless, this is an important clarificationon the nature of the methodology that is applied non-crit-ically all too often) and develop the alternative, falsifica-tionist (Popperian) paradigm. They then describe crude(by self-admission) software they developed to falsify(prove impossible) phylogenetic affinities and presentsome examples of phylogenetic inferences made withinthis new framework.
The gist of the paper is, obviously, philosophical, and Iwill make some comments in the same spirit, i.e., withoutgetting into details of the actual method and examples.
It seems to me that the authors under-appreciate (or atleast do not present explicitly enough) the complementa-rity/conceptual equivalence of the verificationist and falsi-ficationist approaches.
Author response: We have modified the text to make this com-plementarity explicit.
Indeed, when a phylogeneticist embraces the falsification-ist credo, she can (at least, in principle) refute all possibletree topologies, except for one, and thus, effectively, verifythe only remaining topology. This is becoming obvious inthe case of 4-species tree: to verify one topology, all ittakes is to falsify the remaining two topologies. Of course,in practice testing all topologies very quickly becomesprohibitively expensive with the growth of the number ofnodes. However, refuting all positions of a given branchexcept one is still possible. In this respect, I think it isdesirable to discuss some existing phylogenetic tests, suchas Adachi-Hasegawa and Shimodaira-Hasegawa: what istheir epistemological status?
Author response: Even if in principle it is absolutely possiblethat refuting 2 out of 3 hypotheses could allow to establish thatthe one that's left is the true one, I must stress on the fact thatthere is no need that such a coherent pattern is to be observed.It is also possible that all the three topologies could be rejectedby different markers (in this case there is no common best tree).In absence of a common best tree, the issue becomes then toidentify which sets of markers were cotransmitted, i.e. becausethey share common patterns of rejection and thus allow com-mon possible groupings to be defined.
The status of the tests based on the comparisons of multiple testtopologies (i.e. Adachi-Hasegawa and Shimodaira-Hasegawa)is interesting. We published elsewhere (Susko et al., 2006) that
these tests have a high type I error (a tendency not to reject awrong tree). But, to put it in a more "philosophical" phrasing,these tests evoke the Sherlock Holmes logic of inquiry: ""Elimi-nate the impossible, and whatever remains, however improba-ble, must be the truth." The potential problem here is thus tomake sure that a proper set of hypotheses is being tested: if wefall short when considering our test topologies for these tests, wewill end up picking the best of a bad lot.
The author seems be getting into a bit of a philosophicalmuddle by tacitly equating verificationism and the princi-ple of complete evidence. To the best of my understand-ing, these are connected but not inseparable. The morepractical side of the same issue is the emphasis that isbeing made in the manuscript on the sequence concatena-tion methods in connection with verificationism. Per-haps, concatenation is, indeed, relevant when it comes tocomplete evidence. Verificationism, however, seems to bea much more general principle that permeates all modernphylogenetics (although see above) and, as far as I under-stand, fully applies to single-gene phylogenies. I think itwould be useful to be a little clearer on this point.
Author response: The referee is right. The reconstruction of sin-gle-gene phylogenies is verificationist.
The above points are philosophical quibbles whose aim,in part, is to show that the reviewer understands the epis-temological issues addressed in this paper (I do not knowhow well it works). Here, however, I come to the onlyproblem that, to me, to some extent undercuts the valueof this otherwise very interesting and promising paper.While the entire work is about falsificationism and itsmerits, the authors make a very strange, almost paradoxi-cal somersault when it comes to conclusions and present,mostly, claims on putative new phylogenetic affinitiesthat look suspiciously verificationist. It does not help that,when one looks into specifics, each of these connectionslooks dubious (granted, the authors are careful in point-ing out that these are very preliminary indications). In myopinion, it would be much more appropriate to makeconclusions on the falsification of some affinities thathave been previously considered valid on the basis of ver-ificationist phylogenetics or other evidence. Only then, asan addendum, some potentially interesting affinities thatcould not be falsified might be mentioned.
Author response: The referee is entirely right. Our primaryresults were the refutations of groups: that some groups are leftpossible for these markers is mentionned, as a complementaryresult. Yet, none of these possible group should be taken asproven by these approach, instead all of them should be testedfurther, with other markers or characters, and eventually be fal-sified. How dubious these connections are, based on thosegenes, is however really difficult to evaluate, and that it is why
Page 17 of 19(page number not for citation purposes)

Biology Direct 2006, 1:26 http://www.biology-direct.com/content/1/1/26
we report them for further test. If we compare the impossiblegroups with some former propositions (for instance by pruningthe tree of life recently published by Cicarelli et al. from thegroups we were missing), we observed that the group of Spiro-chaetes and actinobacteria (supported by less than 40 % of BV)is not rejected, while the group of cyanobacteria/aquifex-ther-motoga (supported by 40 to 80 % of BV) is rejected.
Reviewer's report 3J Peter Gogarten, University of Connecticut, Storrs, CT, USA
This reviewer suggested we quote the important followingpublications: Hendy, M., and M. Penny. 1993. Spectralanalysis of phylogenetic data., J. Classif. 10:5–24.; Lento,G. M., R. E. Hickson, G. K. Chambers, and D. Penny.1995. Use of spectral analysis to test hypotheses on theorigin of pinnipeds. Mol Biol Evol 12:28–52.; Zhaxy-bayeva, O., J. P. Gogarten, R. L. Charlebois, W. F. Doolit-tle, and R. T. Papke. 2006. Phylogenetic analyses ofcyanobacterial genomes: Quantification of horizontalgene transfer events. Genome Res.; and Zhaxybayeva, O.,P. Lapierre, and J. P. Gogarten. 2004. Genome mosaicismand organismal lineages. Trends Genet 20:254–260. Healso suggested we comment on the possibility thatnanoarchaea would be sister group to all the euryarchaea.Our results reject this possibility and suggest that nanoar-chaea are within the euryarchaea.
Additional material
AcknowledgementsThis paper is a respectful tribute to Tom Cavalier-Smith's powerful imagi-nation.
We acknowledge W. Ford Doolittle, D. Walsh, C. Lane and M. Spencer for critical reading of our manuscript, and E. Susko for statistical discussions. EB was supported by a Canadian Institutes of Health Research grant MOP4467 to W. F. Doolittle.
References1. Zuckerkandl E, Pauling L: Molecules as documents of evolution-
ary history. J Theor Biol 1965, 8:357-66.2. Cracraft J, Donoghue MJ: Assembling the Tree of Life: Where
We Stand at the Beginning of the 21st Century. Assembling theTree of Life 2004:553-561.
3. Gribaldo S, Philippe H: Ancient phylogenetic relationships.Theor Popul Biol 2002, 61:391-408.
4. Doolittle WF: Phylogenetic classification and the universaltree. Science 1999, 284:2124-9.
5. Bapteste E, Susko E, Leigh J, MacLeod D, Charlebois RL, DoolittleWF: Do orthologous gene phylogenies really support tree-thinking? BMC Evol Biol 2005, 5:33.
6. Felsenstein J: Confidence limits on phylogenies: An approachusing the bootstrap. Evolution 1985, 40:783-791.
7. Page RDM, Holmes EC: Molecular Evolution: A phylogeneticapproach. Blackwell Scientific, Oxford; 1998.
8. Baldauf SL, Roger AJ, Wenk-Siefert I, Doolittle WF: A kingdom-level phylogeny of eukaryotes based on combined proteindata. Science 2000, 290:972-7.
9. Popper K: The rationality of scientific revolutions. In ScientificRevolutions Edited by: Hacking I. Oxford University Press;1981:80-106.
10. Feyerabend P: Against Method. Verso, London; 1975. 11. Bapteste E, Brochier C, Boucher Y: Higher-level classification of
the Archaea: evolution of methanogenesis and methano-gens. Archaea 2005, 1:353-63.
12. Charlebois RL, Doolittle WF: Computing prokaryotic gene ubiq-uity: rescuing the core from extinction. Genome Res 2004,14:2469-77.
13. Guindon S, Gascuel O: A simple, fast, and accurate algorithmto estimate large phylogenies by maximum likelihood. SystBiol 2003, 52:696-704.
14. Felsenstein J: PHYLIP – Phylogeny Inference Package (Version3.2). Cladistics 1989, 5:164-166.
15. Susko E, Leigh J, Doolittle WF, Bapteste E: Visualizing and Assess-ing Phylogenetic Congruence of Core Gene Sets: a CaseStudy of the {gamma}-Proteobacteria. Mol Biol Evol 2006,23(5):1019-30.
16. O'Hara RJ: Population thinking and tree thinking in systemat-ics. Zoologica Scripta 1997, 26:323-329.
17. Cavalier-Smith T: Principles of protein and lipid targeting insecondary symbiogenesis: euglenoid, dinoflagellate, and spo-rozoan plastid origins and the eukaryote familly tree. JEukaryot Microbiol 1999, 46:347-366.
18. Bhattacharya D, Yoon HS, Hackett JD: Photosynthetic eukaryo-tes unite: endosymbiosis connects the dots. Bioessays 2004,26:50-60.
19. Ruiz-Trillo I, Riutort M, Littlewood DT, Herniou EA, Baguna J: Acoelflatworms: earliest extant bilaterian Metazoans, not mem-bers of Platyhelminthes. Science 1999, 283:1919-23.
20. Faith DP, Trueman JW: Towards an inclusive philosophy forphylogenetic inference. Syst Biol 2001, 50:331-50.
21. Rieppel O: A skeptical look at justification. Cladistics 2005,21:203-207.
22. Rieppel O: The philosophy of total evidence and its relevancefor phylogenetic inference. Papéis Avulsos Zoologia 2005, 45:1-31.
23. Lang C: A Problem with Probability:Decision-justification andCarnap's Principle of Total Evidence Philosophy of Logic,Math & Physics. University of Western Ontario; 2001.
24. Rieppel O: Popper and systematics. Syst Biol 2003, 52:259-71.25. Mardia KV, Kent JT, Bibby JM: Multivariate Analysis. Academic
Press., London; 1979. 26. Lehmann EL: Nonparametrics: statistical methods based on
ranks. Holden-Day, San Fransisco; 1975:5-32. 27. Ciccarelli FD, Doerks T, von Mering C, Creevey CJ, Snel B, Bork P:
Toward automatic reconstruction of a highly resolved treeof life. Science 2006, 311:1283-7.
28. Waters E, Hohn MJ, Ahel I, Graham DE, Adams MD, Barnstead M,Beeson KY, Bibbs L, Bolanos R, Keller M, Kretz K, Lin X, Mathur E,Ni J, Podar M, Richardson T, Sutton GG, Simon M, Soll D, Stetter KO,Short JM, Noordewier M: The genome of Nanoarchaeum equi-tans: insights into early archaeal evolution and derived para-sitism. Proc Natl Acad Sci USA 2003, 100:12984-8.
29. Brochier C, Gribaldo S, Zivanovic Y, Confalonieri F, Forterre P:Nanoarchaea: representatives of a novel archaeal phylum or
Additional File 1A pdf document with a representation of what basic and combined impos-sibilities mean, some outfiles generated by the program (the impossibility diagram, the group-group diagram, the species group diagram, and the pairwise impossibility diagram).Click here for file[http://www.biomedcentral.com/content/supplementary/1745-6150-1-26-S1.pdf]
Additional File 2A text presenting an example of the calculation of the weight of a com-bined-impossibility.Click here for file[http://www.biomedcentral.com/content/supplementary/1745-6150-1-26-S2.doc]
Page 18 of 19(page number not for citation purposes)
http://www.ncbi.nlm.nih.gov/entrez/query.fcgi?cmd=Retrieve&db=PubMed&dopt=Abstract&list_uids=5876245

Biology Direct 2006, 1:26 http://www.biology-direct.com/content/1/1/26
Publish with BioMed Central and every scientist can read your work free of charge
"BioMed Central will be the most significant development for disseminating the results of biomedical research in our lifetime."
Sir Paul Nurse, Cancer Research UK
Your research papers will be:
available free of charge to the entire biomedical community
peer reviewed and published immediately upon acceptance
cited in PubMed and archived on PubMed Central
yours — you keep the copyright
Submit your manuscript here:http://www.biomedcentral.com/info/publishing_adv.asp
BioMedcentral
a fast-evolving euryarchaeal lineage related to Thermococ-cales? Genome Biol 2005, 6:R42.
30. Brochier C, Forterre P, Gribaldo S: Archaeal phylogeny based onproteins of the transcription and translation machineries:tackling the Methanopyrus kandleri paradox. Genome Biol2004, 5:R17.
31. Creevey CJ, Fitzpatrick DA, Philip GK, Kinsella RJ, O'Connell MJ, Pen-tony MM, Travers SA, Wilkinson M, McInerney JO: Does a tree-likephylogeny only exist at the tips in the prokaryotes? Proc R SocLond B Biol Sci 2004, 271:2551-8.
32. Brocks JJ, Buick R, Summons RE, Logan GA: A reconstruction ofArchaean biological diversity based on molecular fossilsfrom the 2.78 to 2.45 billion-year-old Mount Bruce Super-group, Hamersley Basin, Western Australia. Geochimica andCosmochimica Acta 2003, 67:4321-4335.
33. Brocks JJ, Logan GA, Buick R, Summons RE: Archean molecularfossils and the early rise of eukaryotes. Science 1999,285:1033-6.
34. Cavalier-Smith T: The neomuran origin of archaebacteria, thenegibacterial root of the universal tree and bacterial mega-classification. Int J Syst Evol Microbiol 2002, 52:7-76.
35. Brochier C, Bapteste E, Moreira D, Philippe H: Eubacterial phylog-eny based on translational apparatus proteins. Trends Genet2002, 18:1-5.
36. Lento GM, Hickson RE, Chambers GK, Penny D: Use of spectralanalysis to test hypotheses on the origin of pinnipeds. Mol BiolEvol 1995, 12:28-52.
37. Zhaxybayeva O, Gogarten JP, Charlebois RL, Doolittle WF, Papke RT:Phylogenetic analyses of cyanobacterial genomes: Quantifi-cation of horizontal gene transfer events. Genome Res 2006,16(9):1099-1108. Epub 2006 Aug 9
38. Neurogadgets [http://emu.imb.uq.edu.au/recentnews.php]39. NCSS [http://www.ncss.com/download.html]
Page 19 of 19(page number not for citation purposes)
http://www.ncbi.nlm.nih.gov/entrez/query.fcgi?cmd=Retrieve&db=PubMed&dopt=Abstract&list_uids=7877495