Phylogenetic relationships and rates of allozyme evolution among the lineages of sceloporine sand...
31
Biological Journal of the Linnean Society (1992), 45: 333-362. With 5 figures Phylogenetic relationships and rates of allozyme evolution among the lineages of sceloporine sand lizards KEVIN DE QUEIROZ* Department of Zoology and Museum of Vertebrate Zoology, University of California, Berkeley, CA 94720, U.S.A. Received 7 August 1990, revised and accepted for publication 26 October 1990 Parsimony analysis of characters derived from an electrophoretic survey of allozyme variation in the sceloporine sand lizards indicates that Uma is outside of a clade formed by the rest of the sand Uzards and that Cophosaurus and Holbrookia share a more recent common ancestor with one another than either does with Callisaurus. Previous electrophoretic studies used phenetic clustering based on genetic distance data to assess relationships among these taxa. The resulting dendrograms were used to argue that Holbrookia is the sister group of all other sand lizards and that Callisaurus and Cophosaurus are sister taxa. When reanalysed using parsimony methods, the data from these previous studies are found to support the conclusions of the present study, namely, that Uma rather than Holbrookia is the sister group of all other sand lizards and that Cophosaurus is the sister taxon of Holbrookia rather than of Callisaurus. Relative rate tests indicate that the incongruencies between branching diagrams derived from phenetic clustering of genetic distances versus those derived from parsimony analysis of electrophoretic characters are attributable to increased rates of protem evolution in the Holbrookia lineage. KEY WORDS:•AUozymes ~ Callisaurus draconoides - Cophosaurus texanus - electrophoresis - evolutionary rates - Holbrookia lacérala - Holbrookia macúlala - Holbookia propinqua - Wagner parsimony - phenetic clustering - phylogeny - relative rate test - Uma exsul - Uma notata - Uma paraphygas • Uma scoparia. CONTENTS Introduction Materials and methods ^^^ Sampling ^^ Specimen preparation and electrophoresis 334 Phylogenetic analysis ^^•' Results 336 349 Discussion ^ ^ Phylogenetic relationships ^^^ Comparisons with previous studies ^^° Rates of protein evolution •'Oi Acknowledgements ^•'•^ References 356 Appendices •Present address; Division of Amphibians and Reptiles, U.S. National Museum of Natural History, Smithsonian Institution, Washington, DC 20560, U.S.A. 333 0024-4066/92/040333 + 30 103.00/0 © 1992 The Linnean Society of London
Transcript of Phylogenetic relationships and rates of allozyme evolution among the lineages of sceloporine sand...
Biological Journal of the Linnean Society (1992), 45: 333-362. With 5 figures
Phylogenetic relationships and rates of allozyme evolution among the lineages of sceloporine sand lizards
KEVIN DE QUEIROZ*
Department of Zoology and Museum of Vertebrate Zoology, University of California, Berkeley, CA 94720, U.S.A.
Received 7 August 1990, revised and accepted for publication 26 October 1990
Parsimony analysis of characters derived from an electrophoretic survey of allozyme variation in the sceloporine sand lizards indicates that Uma is outside of a clade formed by the rest of the sand Uzards and that Cophosaurus and Holbrookia share a more recent common ancestor with one another than either does with Callisaurus. Previous electrophoretic studies used phenetic clustering based on genetic distance data to assess relationships among these taxa. The resulting dendrograms were used to argue that Holbrookia is the sister group of all other sand lizards and that Callisaurus and Cophosaurus are sister taxa. When reanalysed using parsimony methods, the data from these previous studies are found to support the conclusions of the present study, namely, that Uma rather than Holbrookia is the sister group of all other sand lizards and that Cophosaurus is the sister taxon of Holbrookia rather than of Callisaurus. Relative rate tests indicate that the incongruencies between branching diagrams derived from phenetic clustering of genetic distances versus those derived from parsimony analysis of electrophoretic characters are attributable to increased rates of protem
evolution in the Holbrookia lineage.
KEY WORDS:•AUozymes ~ Callisaurus draconoides - Cophosaurus texanus - electrophoresis - evolutionary rates - Holbrookia lacérala - Holbrookia macúlala - Holbookia propinqua - Wagner parsimony - phenetic clustering - phylogeny - relative rate test - Uma exsul - Uma notata - Uma
paraphygas • Uma scoparia.
CONTENTS
Introduction Materials and methods ^^^
Sampling ^^ Specimen preparation and electrophoresis 334 Phylogenetic analysis ^^•'
Results 336 349 Discussion ^ ^
Phylogenetic relationships ^^^ Comparisons with previous studies ^^° Rates of protein evolution •'Oi
Acknowledgements ^•'•^ References 356 Appendices
•Present address; Division of Amphibians and Reptiles, U.S. National Museum of Natural History, Smithsonian Institution, Washington, DC 20560, U.S.A.
333 0024-4066/92/040333 + 30 103.00/0 © 1992 The Linnean Society of London

334 K. DE QUEIROZ
INTRODUCTION
The sceloporine sand lizards (Iguania) form a clade of c. ten extant species inhabiting arid and semi-arid habitats in western North American (Smith, 1946; Etheridge & de Queiroz, 1988; de Queiroz, 1989). Although monophyly of this informal taxon is well supported (Etheridge, 1964; Presch, 1969; Etheridge & de Queiroz, 1988; de Queiroz, 1989), and although it has been studied extensively in terms of both systematics and numerous other aspects of biology, the relationships among the various species and supraspecific taxa of sand lizards are disputed. In particular, disagreements exist concerning the primary dichotomy among the extant taxa and whether the greater earless lizard, Cophosaurus texanus, is the sister group of the other earless lizards, Holbrookia, or of the zebratail lizard, Callisaurus draconoides (e.g. Mittleman, 1942; Smith, 1946; Axtell, 1958; Norris, 1958; Savage, 1958; Earle, 1961, 1962; Clarke, 1965; Cox & Tanner, 1977; Adest, 1978; Blackburn, 1978). As part of a synthetic systematic analysis involving both morphological and biochemical data (de Queiroz, 1989), I undertook an electrophoretic survey of sand hzard allozymes in order to investigate phylogenetic relationships and rates of biochemical evolution within the sand lizard clade.
MATERIALS AND METHODS
Sampling
In order to obtain an adequate representation of variation both within and among conspecific populations, I employed a geographic samphng strategy (Buth, 1984). Sample sizes were hmited to a maximum of 20 organisms per species because of constraints imposed by time and expense. I then attempted to obtain ten organisms from a single population and up to ten other organisms from one to ten additional populations from widely separated localities. For those species within which subspecies are recognized, an attempt was made to include representatives of as many of these subspecies as possible. Failure to achieve samples conforming to the above description for some species resulted from practical limitations. For example, I was able to secure only a single specimen of Holbrookia ¡acerata, and Uma inornata was not sampled because of its endangered status. Species, sample sizes, locahties and specimen numbers for the sand lizards used in this study are given in Appendix 1. ^
Representatives of three successive outgroups were included in the electrophoretic comparisons for the purpose of determining ancestral character states. The three successive outgroups, according to the relationships proposed by Etheridge & de Queiroz (1988), are Phrynosoma, the Sceloporus group {Sceloporus, Urosaurus, and Uta) and Petrosaurus. I sampled these outgroups in such a way as to maximize the number of species, and thus presumably also the number of electromorphs, while constraining myself to ten, ten and five specimens from the three successive outgroups. Outgroup taxa, sample sizes, localities and specimen numbers are hsted in Appendix 1.
Specimen preparation and electrophoresis
Tissues were dissected from freshly killed specimens and maintained at • 76°C. Tissue extracts from combined liver and either skeletal or smooth

SAND LIZARD PHYLOGENY AND EVOLUTIONARY RATES 335
TABLE I. Proteins, presumptive genetic loci, and electrophoretic conditions used to study protein variation in the sceloporine sand lizards. Abbreviations for electrophoretic conditions are as follows: 1 =LiOH, pH 8.2 (gel), pH 8.1 (tray), 3 h at 300 V; 2 = PGI phosphate, pH 6.7, 4 h at 130 V- 3 = phosphate-citrate, pH 7.0, 4 h at 100 V; 4 = Poulik with EDTA, pH 8.7 (gel), borate, pH 8 2 (tray), 3 h at 250 V; 5 = tris-citrate II with NADP, pH 8.0, 4 h at 130 V; 6 = tris-citrate
III, pH 7.0, 3 h at 180 V
Enzyme Electrophoretic
Protein commission number Locus conditions
Aconitate hydratase Albumin
4.2.1.3 Aeon Alb
1 1, 5
Alcohol dehydrogenase 1.1.1.1 Adh-1 1 1.1.1.1 Adh-2 1
Aspartate aminotransferase 2.6.1.1 Aat 4
Creatine kinase 2.7.3.2 Ck 5
Esterase 3.1.1.1 Est 1
Esterase D 3.1.1.1 Est-D 1
General protein • GP-1 1, 5 3 1, 5
Glucose phosphate isomerase 5.3.1.9 Gpi Glycerol-3-phosphate dehydrogenase 1.1.1.8 a-Gpd
Isocitrate dehydrogenase 1.1.1.42 1.1.1.42
Icdh-1 Icdh-2
5 5
L-Iditol dehydrogenase 1.1.1.14 Iddh 5
Lactate dehydrogenase 1.1.1.27 Ldh-1 4 1.1.1.27 Ldh-2 4
Malaie dehydrogenase 1.1.1.37 Mdh-1 6 1.1.1.37 Mdh-2 6
Mannose-6-phosphate isomerase 5.3.1.8 Mpi 3
Tripeptide aminopeptidase 3.4.13 Pep-B
Peptidase C 3.4.13 Pep-C
Proline dipeptidase 3.4.13.9 Pep-D
Peptidase E 3.4.13 Pep-E
Peptidase S 3.4.13 Pep-S
Phosphoglucomutase 2.7.5.1 Pgm 6
6-phosphogluconate dehydrogenase 1.1.1.44 6-Pgd 5
Purine nucleoside phosphorylase 2.4.2.1 Np 4
Superoxide dismutase 1.15.1.1 Sod 1, 2
muscle (stomach and intestine), or both, were subjected to horizontal starch gel electrophoresis using standard techniques (Selander et al, 1971; Harris & Hopkinson, 1976; Richardson, Baverstock & Adams, 1986). Twenty-eight loci were scored using the electrophoretic conditions Hsted in Table 1.
Phylogenetic analysis
Presumptive loci were treated as characters and different combinations or suites of alíeles (allozymes) as character states (Buth, 1984; Mickevich & Mitter, 1981, 1982). I used only a single population as the OTU (terminal taxon) representing each species, specifically the population with a large sample (nine or ten specimens). Consequendy, the combinations of alíeles treated as character states represent true polymorphisms, rather than variation among populations. Information from other populations was used to determine whether it was appropriate to generaUze these character states to the species as a whole. All multistate characters were treated as unordered.
Phylogenetic relationships were analysed according to the principle that shared, derived characters but not shared, ancestral ones are evidence of exlusive

336 K. DE QUEIROZ
common ancestry, that is, of monophyly (e.g. Hennig, 1966). Primitive and derived character states were determined using the method of outgroup comparison (Watrous & Wheeler, 1981; Farris, 1982; Maddison, Donoghue & Maddison, 1984). The ancestral state was determined by reconstructing the condition of the most recent common ancestor of the nearest outgroup and the ingroup according to the relationships proposed by Etheridge & de Queiroz (1988) using the method of Maddison et al. (1984).
The best estimate of phylogenetic relationships among the various sand lizards was considered to be the arrangement that maximized Wagner parsimony, that is, the arrangement that minimized the number of instances in which homoplasy had to be postulated in order to account for shared character states. I used Swofford's Phylogenetic Analysis Using Parsimony (PAUP, version 3.0) and Maddison and Maddison's MacClade (version 2.97.50) programs to find the tree(s) that satisfied this criterion. Exhaustive searches and searches using the branch and bound algorithm were conducted using PAUP, insuring that the shortest tree or trees were found.
RESULTS
The various presumptive alíeles and their distributions and frequencies among taxa are summarized in Table 2; data for the large populations only are presented in Table 3. These data formed the basis of the following characters and (unordered) character states. (For cases in which the ancestral condition could be determined, that condition is assigned state 0.)
1 2 3 4 5 6 7 8 9 0 1 2 3 4 5 6 7 8 9
20 21 22 23 24 25
Aeon: State 0 = alíele a, 1 = b, 2 = c, 3 = be, 4 = cd. Alb: 0 = a, 1 = b, 2 = d, 3 = e, 4 = f Adh-1: 0 = a, 1 = ae. Adh-2: 0 = d, 1 = bd. Aat: 0 = c, 1 = e. Ck: 0 = a. Est: 0 = c, 1 = e, 2 = ce. Est-D: 0 = e, 1 = f Gp-1: 0 = a, 1 = b, 2 = ac. Gpi: 0 = c, 1 = b, 2 = d, 3 = f, 4 = ef. a-Gpd: 0 = a, 1 = b, 2 = d. Icdh-1: 0 = c, 1 = ac, 2 = bc. Icdh-2: 0 = a, 1 = c, 2 = be. Iddh: 0 = e, 1 = c, 2 = de. Ldh-1: 0 = c. Ldh-2: 0 = b, 1 = ab. Mdh-1: 0 = d, 1 = b, 2 = c, 3 = e. Mdh-2: 0 = b, 1 = a. Mpi: 0 = b, 1 = a. Pep-B: 0 = a, 1 = c, 2 = d, 3 = ce, 4 = ceh, 5 = bdei, 6 = gilm, 7 = gklm. Pep-C: 0 = c. Pep-D: 0 = f, 1 = ab, 2 = be, 3 = cd, 4 = cf, 5 = fg, 6 = cdfgh. Pep-E: 0 = a. Pep-S: 0 = a, 1 = c, 2 = d, 3 = bed. Pgm: 0 = b, 1 = c.

SAND LIZARD PHYLOGENY AND EVOLUTIONARY RATES 337
tí .¡H u
-o ,tí
o ° -^ o T3 § o Ö s §• o ^ g u s;
•5 H >-
o .^
3 O
I ,« < O
•9, o "S s C/3 * .0 ÍÍ
S."", il g ë|^
3.S
o U"
•3
•a • -S -s^
" a ^ " iS a
n¡ t. « g ;3 N ^ Ü
§ a 3 B- o u •S
u CL (^ m O tr e
tí ° bßS tí -r;
§ ^ !«
SU
B tí I S
<u (W
O ^
« G s 3 -S "S
u tí
CO <M
•U
CM ::3 tí ^ QQ rfí
^1
O. 3 O fe
O
ü
en o d Ö
T3 ^
CO '-<
(71 O Ö Ö
Ö Ö Ö Ö Ö Ö T3 bO rt OJ T3 t4-i
CM CO en CO en p o p Ö ¿,¿¿ g_ XI xJ bo .n
CO CM CJ) o d d
lo in CO CM tX> CO <7l p
d XI u cj
I -^ I rv. u
X 5
J3 ^ ^ O w
o. Ü
o. ü

338 K. DE QUEIROZ
n <: H
B
2-2-
r^ CO CO cs oi o ai o öd öd o o o o
S
2-2-
(MOOO C^CVtO COr^íO -^to
u ^ 13 (u XI rt
2-2-2- U t+H ÖD XI
¡J
lO m Oí o d Ö 2-2- 2-2-2-2-^ 2-
X30 .-H.^tlOÜKT3
ü
CO CM CTÍ O Ö Ö 2-2-
O X!
00 •'
XÏ rt 2-2-2-2-2- 'O oj .^ XÎ .•1
u .J2 'ü XI rt o..
I I ^11 ^ I
•a a, O
• CM
i-l
XI ID
J3 X! .- -a o. M

SAND LIZARD PHYLOGENY AND EVOLUTIONARY RATES 339
T3 O
U ^ -O
a^ p o Ö
CO es Cl -^ CO iT) m to CO m CM ••t o p o Ö Ö ¿¿¿2-
X t« XJ XI .^
lO CS í>í O) o o ö ö ö
T3 rt
o_o^o_o, J3 PÍ u T3
I I
J3
ó, V
Q ó.
CU O, z

340 K. DE QUEIROZ
S <d (í
f^ i o -t-" o
bo - 4-) ^ Ö <S ^ O N a
XI
,T3X<.S
-a
M ^
V
2 ^
(ü
s cl
^*- *> . ^ O > tr SI "o r^ " t! S U « o s;
ío «n g o
s 3 p "rt 3 J5 •ao ^ C s- ••^
g T3 (3 U ^-o « _3
ti) « ä " ^ I
.2-s g
HS O
Ë a;
a" Xi .« fi g a
J V.
^ C bo
^ 4J il
m ^ « 1-H
bD u >•I c ra ^ 2 <^ ^' S u e
'G -S o "
^t > S •a o
3 u V T3 ^
CO 2 •- CM fi a
°l S S ^ ¿P
cao ^ O w
S'a« ¡u o
ri £.3 S S S
H t/0 <
.5 H " .^ eu ti
_ to TO
g (U to
P -^ Ü 1•r t*-i -^
^^ Sa • n to (H
a fi (^
•" tí
o o o, 'g Ö
ip o «.s
• S c i^ t4_(
'à % '*= S, c >•
o 1)
-^ 'S » TO P CI
Ü
u C3 tj
(j rt flj i) ri
(j ri u lU ri
V T3
ri U ri
u ri tj
CO ^
Ö o_ ¿¿ ¿¿ ¿¿ ¿è u^'ObOritJ'TJ.n aj ri o*fl(H-i
O O ai •
iULt_x cjri u^^ V
XI (J ri u
o o en •
d Ö Ö d
nj .£ u es u OJ C*H
J2
r-i CM
J3 J3
I ri I u
< a « Q ^ w (¿ •Q.
u Ü Ü
^^ CM
» HH k-4

SAND LIZARD PHYLOGENY AND EVOLUTIONARY RATES 341
CO CM 00 •'
c3 X!
Ö Ö Ö Ö Ö ^S- JD(iiajXJl!0<UJ3 U (JT3
o o 2^ O o_
t CO 1^ ID CO ^ O
CO i-~ CO ID ^gí:§S
o. 2-S.2- O ¿ O O O O o^
^ B • be U Ä (-,-1 (J bß T3 .J3
Ö O O O o o o_2-2- UX1T34Í -Û JÜt+^TJ^H-U
lO O O lO (£) CM -^ O Ö O O Ö
o o o o i£> C^ ^ ^ CO tN
lO lO o lO CO ^^
o_o_o_o_ S-S- ¿éé 13 OJ ._ J3 u a ;• 60 íl
oi o O O O CO •' ^
o o o^o_ o o o
X¡ (4 TJ rt X rt u
I
u w pí pf 13 X T3 -^
I I I ^ I - II « I II
-a

342 K. DE QUEIROZ
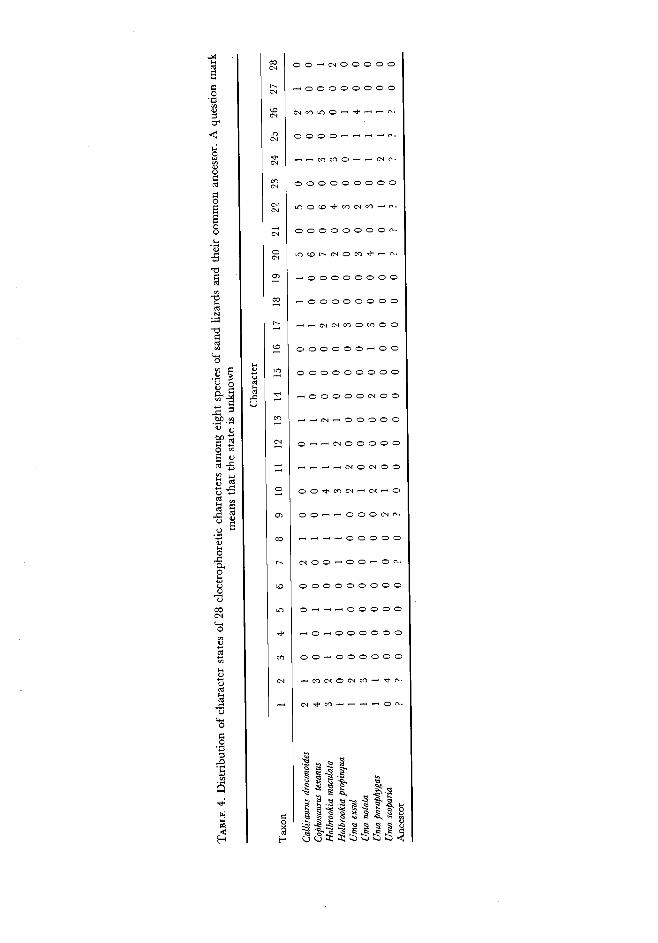
(26) 6-Pgd: 0 = f, 1 = j, 2 = ad, 3 = ce, 4 = gj, 5 = bdfh. (27) Np: 0 = d, 1 = b. (28) Sod: 0 = b, 1 = d, 2 = be. These 28 characters imply a minimum of 59 phylogenetic transformations. The distributions of these characters and character states among taxa are given in Table 4.
Wagner parsimony analysis of the data in Table 4 resulted in the identification of five trees of equal and minimum length [length = 63, consistency index (Kluge & Farris, 1969) = 0.937, 0.875 excluding uninformative characters] (Fig. 1). These trees differ in whether Uma is monophyletic (Fig. IB, D, E) or paraphyletic (Fig. lA, C). The trees in which Uma is monophyletic differ in the relationships of Uma scoparia and Uma notata to one another and to the presumptive Uma paraphygas-Uma exsul clade. Those in which Uma is paraphyletic differ in whether a clade composed of Uma notata and Uma scoparia or one composed of Uma exsul and Uma paraphygas is the sister group of the remaining sand Hzards. The strict consensus tree of these five trees (Fig. 2) has a basal polytomy among the Uma paraphygas-Uma exsul clade, Uma scoparia, Uma notata, and a clade composed of the remaining sand hzards. The characters supporting the various presumptive and possible clades are listed in Appendix 2. That no unambiguous synapomorphies were identified for the sand lizard clade as a whole reflects the level of analysis (i.e. that the goal of this study was to identify clades within the group). It should not be interpreted as indicating that sand lizard monophyly is in doubt.
DISCUSSION
Phylogenetic relationships
Every grouping appearing on one or more of the minimum length trees is supported by at least one character. Nevertheless, the support for some of these groupings as clades is ambiguous because of equally parsimonious alternative interpretations of character transformation. This kind of ambiguity applies to afl of those groupings seen on some but not all of the minimum length trees.
Although Uma is paraphyletic on some of the minimum length trees, monophyly of this taxon should not be considered in doubt. Monophyly of Uma is supported unambiguously by at least eight morphological characters (de Queiroz, 1989). Furthermore, the results of the present electrophoretic study do not call the monophyly of Uma into question because they are interpretable as an artifact of the ambiguous nature of unordered multistate characters.
AH of the characters that are interpretable as potential synapomorphies of part of Uma (either exsul 3.nd paraphygas or notata and scoparia) and the clade composed oí Callisaurus, Cophosaurus and Holbrookia, are ambiguous. Two of these characters (20 and 22) imply virtually nothing about relationships among the various sand lizards because they are unpolarized and exhibit different states in all or almost all of the terminal taxa. Any state of these characters that exists in any of the terminal taxa of a possible group on a tree is interpretable as originating in the stem lineage of that group.
A third character (2) has three states (1,2 and 3) that each occur in a single terminal taxon within Uma and in a single terminal taxon within the clade
3 er
tí ü¡
a o 6 e o
T3 B
tí Pi «3
(+H O « g
> o
X 3 bß «1
'v (U
C 3 O E Ci
u .tí tí ^
CJ
o
o
CO CM
J3
u
00-^<N00000
•íOOOOOOOO
ooooooooo
OOOOOOOOf^'
-^oooooooo
•-HOOOOOOOO
•<-^<MCMCOOCOOO
OOOOOO'-'OO
ooooooooo
-^OOOOOCMOO
••'^^CN'•'OOOOO
o-•'^^C^íOOOOO
^^,_,^^_^CMOCMOO
OO-^COCM^^CS-•'O
,^Q,_^HOOOCMO-.
^^M^^OOOOO
CMOO-•'OO-•'Of^'
OOOOOOOOO
o^^^ooooo
•'O•'OOOOOO
OO•'OOOOOO
C^t^CO'•'••'^^-HO<^>
•S 3
so > H a ¡3 -^ -S 'S, Q
I to o <S ^ K -«- <^ (fí o ^. >». ai
•§•3 3 E J ^ J e

344 K. DE QUEIROZ
•5 ••=
o c C *: S> -5
<o Í: -t
t
& Vj Ï: a; lo to a: a:
bOJV c c •-Û o
S a
r^ u
J3
-tí hn >
R 6 3 e a
J5 H CO
o II
bß-n fe •S

SAND LIZARD PHYLOGENY AND EVOLUTIONARY RATES 345
composed of Callisaurus, Cophosaurus and Holbrookia. The unpolarized and unordered condition of this character enables the length of the tree to be minimized by interpreting any state shared by two or more taxa on different sides of the primary dichotomy within a presumptive clade as the ancestral state for that clade. Because of the structure of the stable part of the tree based on other characters, and because none of the electrophoretic characters supports the monophyly of Uma unambiguously, placing a subclade of Uma in which one member possesses one of the shared states of this character as the sister group of the clade composed of Callisaurus, Cophosaurus and Holbrookia and having this shared state arise in the common ancestor of the clade thus formed is one possible arrangement that minimizes tree length. Support for such a grouping, however, is highly tenuous. First, only two out of six taxa in the supposed clade actually possess the character state. Second, although this kind of interpretation is possible for each of three different shared states, the different states imply two contradictory ways in which Uma might be paraphyletic (Fig. lA, C). Third, this is only one of several possible optimizations that minimize the number of character state transformations, and alternative optimizations are compatible with monophyly of Uma. This character (Alb) apparently exhibits a high degree of homoplasy within the sand lizards (Appendix 2).
Two remaining characters (11 and 17) can be interpreted as supporting (ambiguously) paraphyly of Uma, but they can be interpreted parsimoniously as favouring only one of the two trees in which Uma is paraphyletic (Fig. IC). In both of these characters, Uma notata and Uma scoparia retain the primitive state, and both Uma exsul and Uma paraphygas have a derived state that differs from the derived state (character 11) or states (17) found in the other sand lizards. Because the order among the derived states is unknown, it is possible that all of the derived states are part of a single transformation series, in which case Uma exsul and Uma paraphygas would be the sister group of the clade composed of Callisaurus, Cophosaurus and Holbrookia. It is also possible, however, that the derived states in Uma exsul and Uma paraphygas represent transformations from the plesiomorphic condition independent of those in Callisaurus, Cophosaurus and Holbrookia, in which case these characters do not support the conclusion that Uma is paraphyletic.
A similar situation exists in the case of trees indicating paraphyly of the presumptive clade known informally as the ocellated sand Hzards (de Queiroz, 1989). Monophyly of this group, composed of the taxa Uma notata, Uma scoparia and Uma inornata (the last not sampled in this study), is supported unambiguously by ten morphological characters (de Queiroz, 1989). Although the electrophoretic characters by themselves allow the possibility that this taxon is paraphyletic, this conclusion is not actually supported by any of them.
Only two characters (20 and 22) have states that are potentially interpretable as evidence of a close relationship between Uma exsul, Uma paraphygas and Uma notata, and these same characters are two of the four with states that are potentially interpretable as evidence of a close relationship between Uma exsul, Uma paraphygas and Uma scoparia. Both of these characters, and one of the other two that is potentially interpretable as evidence of the latter grouping (character 2), are highly ambiguous in that Uma notata and Uma scoparia possess different states and these states also differ from the state (character 22) or states (characters 2 and 20) found in Uma exsul and Uma paraphygas. The absence of

346 K. DE QUEIROZ
unambiguous electrophoretic evidence supporting monophyly of the clade composed of Uma notata and Uma scoparia, and the unordered nature of these states, allows every state present in a presumptive clade composed of Uma exsul, Uma paraphygas and either Uma notata or Uma scoparia to be interpreted as potentially originadng in the stem hneage of that group. Other interpretations are possible, however, including support for the monophyly of the presumptive Uma notata-Uma scoparia clade. Indeed, examination of the allehc composidon of these states reveals that in one of the characters (22) Uma notata and Uma scoparia share what appears to be a derived alíele (b) not seen in Uma exsul and Uma paraphygas.
The only other character bearing on potential paraphyly of the Uma notata- Uma scoparia group (character 26) has one state in Uma exsul, Uma paraphygas and Uma scoparia and another in Uma notata. The character is unpolarized and unordered, but if the state present in the first three taxa is derived relative to that present in the fourth, then the former would be potenrial evidence of a close relaüonship among Uma exsul, Uma paraphygas and Uma scoparia. Nevertheless, because the states are unordered, either state could be derived relative to the other. If the state in Uma notata is derived from that seen in Uma exsul, Uma paraphygas and Uma scoparia, then this character does not imply that the Uma notata-Uma scoparia group is paraphyletic. In fact, examination of the allelic composition of the states suggests that it is more reasonable to interpret the state seen in Uma notata as the derived state. This state consists of two alíeles, g and j, the former of which is found in no other sand lizard or any of the outgroups examined and for that reason appears to be autapomorphic for Uma notata. In contrast, the state found in the other three taxa consists of a single alíele, j, which is also found in Uma notata. If this alíele is derived, then the simplest explanation for its distribution is that it arose in the common ancestor of all Uma.
Neither paraphyly of Uma nor paraphyly of the ocellated sand lizards occurs on all minimum length trees. Even considering individually the trees on which these arrangements occur, the potentially supporting characters have alternative minimum step interpretations. Only two of the groups not common to all five minimum length trees have unambiguous interpretations of character transformation in their stem lineages on any of the trees. A monophyletic Uma has an unambiguous transformation in its stem, state 1 of character 10 (Gpi, alíele b), on the trees in which one or the other of Uma notata or Uma scoparia is the sister group of Uma exsul and Uma paraphygas (Fig. ID, E). This interpretation, however, requires that the state in Uma exsul and Uma paraphygas is derived relative to that in Uma notata and Uma scoparia. Alternatively, the state in Uma notata and Uma scoparia may be derived relative to that in Uma exsul and Uma paraphygas, or both states may be independent transformations from the primitive state. In the latter case, monophyly of Uma is not supported.
The possible Uma notata-Uma scoparia clade has an unambiguous trans- formation in its stem hneage involving the same character and state (Gpi, alíele b) on both trees in which Uma is paraphyletic (Fig. lA, C). Both the state in Uma notata and Uma scoparia and that in Uma exsul and Uma paraphygas are derived relative to the ancestral sand lizard, but their order of derivation relative to one another is unknown. If the possible Uma notata-Uma scoparia clade is not the sister group of the presumptive Uma exsul-Uma paraphygas clade, then independent derivation of the two states from the ancestral condition and hence a

SAND LIZARD PHYLOGENY AND EVOLUTIONARY RATES
^_^_^___^_^_^^_^-^•^-^ Uma exsul
347
Uma paraphygas
Uma notata
Uma scoparia
Callisaurus draconoides
Cophosaurus texanus
Holbrookia maculata
• Holbrookia propincua
Figure 2. Strict consensus tree derived from the five minimum length trees in Fig. 1.
transformation in the stem lineage of the Uma notata-Uma scoparia clade minimizes the number of character state transformations. However, if the Uma notata-Uma scoparia clade is the sister group of the Uma exsuhUma paraphygas clade (Fig. IB), then the transformation to state 1 in the common ancestor of Uma notata and Uma scoparia is ambiguous because it may be the intermediate stage in a transformation series between the ancestral sand lizard condition and the state in Uma exsul and Uma paraphygas. If so, then an equally parsimonious interpretation is that it originated in the stem of the clade of all Uma rather than that of the possible Uma notata-Uma scoparia clade.
In summary, the alternative arrangements on the five minimum length trees result not from character incongruence but from ambiguities stemming from alternative interpretations of transformation among states of unordered characters. Although certain relationships are not ruled out, neither are they supported by the characters. Many of the electrophoretic characters suffer to some degree from this kind of ambiguity.
Even those clades common to all the minimum length trees are not necessarily supported unambiguously in terms of characters, as in the case of the presumptive clade of Uma exsul and Uma paraphygas. Although every one of the five minimum length trees has at least one character supporting this presumptive clade unambiguously, there is no single character that can be interpreted as an unambiguous synapomorphy on all of the minimum length trees.
Despite these difficulties, every dichotomous node common to all five trees (Fig. 2) has at least one character that unambiguously transforms in its stem on each of the minimum length trees. Furthermore, for each of those dichotomous nodes with no branches terminating in a species of Uma, every one of the two or more characters that unambiguously transforms in its stem hneage does so on each of the five trees. The unambiguously supported relationships are (1) that Callisaurus, Cophosaurus and Holbrookia share a common ancestor not shared with Uma, (2) that Cophosaurus and Holbrookia share a common ancestor not shared with Callisaurus or Uma and (3) that Holbrookia maculata and H. propinqua share a common ancestor not shared with other sand lizards, in other words, that Holbrookia is monophyletic.
Monophyly of various of the terminal taxa is also supported by unambiguous

348 K. DE QUEIROZ
characters; however, this evidence should be viewed with caution. Some species are represented by only a single population, the character states of which cannot necessarily be generalized to the entire species. It is significant, however, that widely separated populations of the polytypic species Callisaurus draconoides share derived characters supporting monophyly of this taxon, for example, Iddh (alíele c), Mdh-2 (a), Mpi (a) and Np (b).
The results of the present study contradict a widely held view (e.g. Axtell, 1958; Norris, 1958; Earle, 1961, 1962; Clarke, 1965; Adest, 1978) that the greater earless lizard, Cophosaurus texanus, shares a more recent common ancestor with the zebratail lizard, Callisaurus draconoides, than with the other earless lizards, Holbrookia. Consequently, these results also contradict a related hypothesis in which the derived 'earless' condition in Cophosaurus and Holbrookia is viewed as the result of homoplasy in the form of evolutionary parallelism. Given that Cophosaurus and Holbrookia are sister taxa, there is no reason to postulate parallelism to account for the shared, derived earless condition. Instead, the simplest explanation is that the earless condition originated in the common ancestral lineage shared exclusively by these two taxa.
Comparisons with previous studies
Several electrophoretic studies of sceloporine sand lizards have been done previously (Guttman, 1970; Adest, 1977, 1978, 1987). In an early study, Guttman (1970) found that species representing all four genera of sand lizards possessed the same mobilities in three different fractions (bands) of haemoglobin. He contrasted this situation with results obtained for 40 other species of lizards, in which he found only two cases of electrophoretically identical haemoglobins involving "two closely related pairs oí Sceloporus and two xantusiids" (Guttman, 1970: 572). Guttman (1970) offered five possible explanations for the high degree of similarity among sand lizard haemoglobins but considered the most likely to be that the sand lizards are more closely related than their taxonomy indicates. In that the haemoglobin electromorphs studied by Guttman were invariant among the sand lizards, his results neither support nor contradict those of the present study.
Adest (1977, 1978, 1987) performed extensive studies on electrophoretic variation in the sceloporine sand lizards, both within and among currently recognized genera and species. Of particular significance to the present study are his analyses of relationships among the species of Uma (Adest, 1977) and his analysis of intergeneric relationships (Adest, 1978).
In his study of relationships among the species of Uma, Adest (1977) proposed that Urna exsul is the sister group of all other species of Uma. Although this proposal is contradicted by the results of the present study, in which Uma exsul appears to be the sister group of Uma paraphygas, the data upon which Adest's conclusions were based are ambiguous. Adest's proposed phylogeny diners from the relationships among the species of Uma on all minimum length trees found in the present study only in the position of the root. Because no outgroup taxa were included in his study, the position of the root implied by his data is unknown. (Phenograms, such as that presented by Adest, are rooted only in the sense that the branch at the last clustering level specifies the 'bottom' of the dendrogram; they are not rooted on the basis of information about ancestral states.)
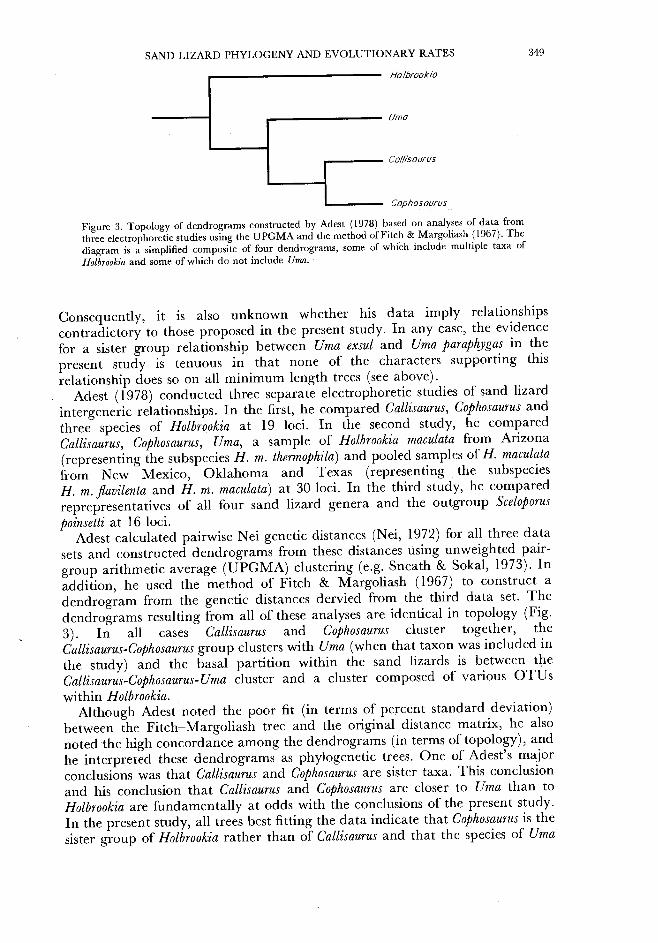
SAND LIZARD PHYLOGENY AND EVOLUTIONARY RATES 349
Uma
Callisaurus
Cophosaurus
Figure 3. Topology of dendrograms constructed by Adest (1978) based on analyses of data from three electrophoretic studies using the UPGMA and the method of Fitch & Margoliash (1967). The diagram is a simplified composite of four dendrograms, some of which include multiple taxa of Holbrookia and some of which do not include Uma.
Consequently, it is also unknown whether his data imply relationships contradictory to those proposed in the present study. In any case, the evidence for a sister group relationship between Uma exsul and Uma paraphygas in the present study is tenuous in that none of the characters supporting this relationship does so on all minimum length trees (see above).
Adest (1978) conducted three separate electrophoretic studies of sand hzard intergeneric relationships. In the first, he compared Callisaurus, Cophosaurus and three species of Holbrookia at 19 loci. In the second study, he compared Callisaurus, Cophosaurus, Uma, a sample of Holbrookia macúlala from Arizona (representing the subspecies H. m. thermophila) and pooled samples oíH. macúlala from New Mexico, Oklahoma and Texas (representing the subspecies H. m.flavilenta and H. m. macúlala) at 30 loci. In the third study, he compared reprepresentatives of all four sand lizard genera and the outgroup Sceloporus
poinsetli at 16 loci. Adest calculated pairwise Nei genetic distances (Nei, 1972) for all three data
sets and constructed dendrograms from these distances using unweighted pair- group arithmetic average (UPGMA) clustering (e.g. Sneath & Sokal, 1973). In addition, he used the method of Fitch & Margohash (1967) to construct a dendrogram from the genetic distances dervied from the third data set. The dendrograms resulting from all of these analyses are identical in topology (Fig. 3). In all cases Callisaurus and Cophosaurus cluster together, the Callisaurus-Cophosaurus group clusters with Uma (when that taxon was included in the study) and the basal partition within the sand lizards is between the Callisaurus-Cophosaurus-Uma cluster and a cluster composed of various OTUs within Holbrookia.
Although Adest noted the poor fit (in terms of percent standard deviation) between the Fitch-MargoHash tree and the original distance matrix, he also noted the high concordance among the dendrograms (in terms of topology), and he interpreted these dendrograms as phylogenetic trees. One of Adest's major conclusions was that Callisaurus and Cophosaurus are sister taxa. This conclusion and his conclusion that Callisaurus and Cophosaurus are closer to Uma than to Holbrookia are fundamentally at odds with the conclusions of the present study. In the present study, all trees best fitting the data indicate that Cophosaurus is the sister group of Holbrookia rather than of Callisaurus and that the species of Uma

350 K. DE QUEIROZ
Cophosaurus Holbrookia macúlala
Callisaurus • _ Holbrookia propinqua
Holbrookia lacérala
Callisaurus Holbrookia macúlala (Arizona)
Uma Holbrookia
' macúlala (pooled)
B Cophosaurus
Figure 4. Minimum length unrooted trees resulting from Wagner parsimony analysis of: A, 19 electrophoretic loci from Adest's (1978) first study of sand lizard intergeneric relationships (total length = 24; consistency index =1.000, 1.000 excluding uninformative characters); B, 30 electrophoretic loci from Adest's (1978) second study of sand lizard intergeneric relationships (total length = 46; consistency index = 0.978, 0.889 excluding uninformative characters). For A, dots indicate alternative placements of the root that will give rooted trees corresponding with the tree derived from Wagner parsimony analysis of my electrophoretic data (1) and Adest's phenogram (2). For B, the dot indicates the placement of the root that will give a rooted tree corresponding with the tree derived from Wagner parsimony analysis of my electrophoretic data. No root placement will give the same tree as Adest's dendrogram. Branch lengths in both diagrams bear no relationship to the number of changes occurring along them.
are outside of the clade stemming from the most recent common ancestor of Callisaurus, Cophosaurus and Holbrookia (Figs 1, 2).
Because of the discrepancies between Adest's conclusions and mine, his analysis deserves critical examination. I argue that these discrepancies result not from incongruencies between Adest's data and my own but from differences in their interpretation resulting from the use of different analytical methods. As it turns out, parsimony analysis of Adest's data gives results that contradict his conclusions and instead support the conclusions of the present study. Furthermore, this outcome is understandable as a consequence of pecuharities of the data that render the analytical methods used by Adest inappropriate as methods for reconstructing phylogenetic relationships.
Adest's first electrophoretic study of intergeneric relationships included only Callisaurus, Cophosaurus and three species of Holbrookia. I coded these data as characters treadng the loci as characters and the allelic arrays as unordered character states. An exhaustive search using PAUP yielded a single tree of minimum length (Fig. 4A). This tree is unrooted because no outgroup was included in the study. The unrooted tree is equivalent both with Adest's phenogram (Fig. 3) and with the phylogenedc tree of the present study (Fig. 2). This equivalence exists because for this subset of sand lizards Adest's dendrogram and mine do not differ in terms of connecdons but only in the position of the root. Although roodng at the midpoint of the branches connecting the most divergent taxa is sometimes used as an alternative to

SAND LIZARD PHYLOGENY AND EVOLUTIONARY RATES 351
outgroup rooting, this method assumes homogeneity of evolutionary rates (Farris, 1972). This assumption is inappropriate in the present context, because unequal rates of evolution may be responsible for the differences between dendrograms resulting from phenetic clustering and those resulting from parsimony analysis (see below).
As with the previous analysis, I coded the data from Adest's second study as characters treating the loci as characters and the allelic arrays as unordered character states. Again, an exhaustive search using PAUP yielded a single minimum length tree (Fig. 4B). Adest's second study also did not include an outgroup, and therefore the tree is unrooted.
With the inclusion of Uma, the unrooted tree corresponding with the rooted tree based on parsimony analysis of my electrophoretic data differs from the unrooted tree corresponding with Adest's dendrograms. Consequently, the reanalysis of Adest's second data set bears on a choice between the alternative hypotheses. The unrooted tree resulting from parsimony analysis of Adest's second data set is incompatible with Adest's dendrograms. The only root placement that will result in a clade formed by Callisaurus, Cophosaurus and Uma will have Callisaurus the sister group of Uma rather than of Cophosaurus, and no root placement will result in Callisaurus and Cophosaurus being sister groups. In contrast, the unrooted tree resulting from Wagner parsimony analysis of Adest's second data set is topologically identical with the unrooted tree corresponding with the rooted tree based on parsimony analysis of my electrophoretic data. Rooting the unrooted tree resulting from reanalysis of the data from Adest's second study along the branch connecting Uma to the rest of the tree gives the topology of the tree resulting from parsimony analysis of my electrophoretic
data. Although based on the smallest samples of loci (16) and of organisms for each
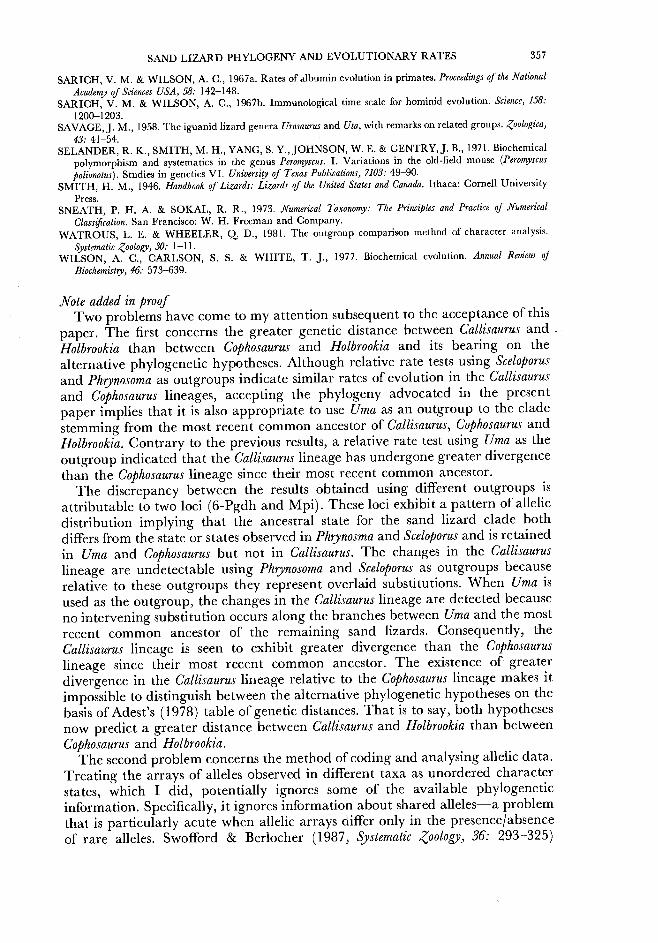
taxon (one or two), Adest's third study of intergeneric relationships of the sand lizards included outgroup taxa with which trees can be rooted. This is significant because, in contrast with unrooted trees, rooted trees are interpretable as phylogenies, and furthermore, being more restricted statements (a single unrooted tree corresponds with several different rooted trees), they allow greater discrimination between alternative phylogenetic hypotheses.
Using Sceloporus poinsetti and Phrynosoma platyrhinos as outgroups, I reconstructed the condition of the outgroup node (Maddison et al, 1984) and used this hypothetical ancestor to root the tree(s) in my reanalysis of Adest's third data set. (G. Adest kindly supplied me with his data on P. platyrhinos, which were not included in his dissertation.) An exhaustive search of trees using PAUP revealed a single rooted tree of minimum length (Fig. 5; length = 19, CI = 0.895 for all characters, 0.778 for informative characters only). This tree differs from Adest's dendrograms based on the same electrophoretic data in two ways, first, in having Uma outside of a clade made up of the remaining sand lizards rather than being the sister group of a presumptive Callisaurus-Cophosaurus clade and second, in having Cophosaurus as the sister group of Holbrookia rather than of Callisaurus. In other words, when considering the taxa common to both studies, the tree resulting from parsimony analysis of characters based on the data from Adest's third study is identical to the tree resulting from a similar analysis of my electrophoretic data.
Adest also presented a dendrogram based on the Nei genetic distances derived

352 K. DE QUEIROZ
Urna
Callisaurus
Cophosaurus
Holbrookia maculata (Arizona)
Holbrookia maculata (pooled)
Figure 5. Minimum length rooted tree resulting from Wagner parsimony analysis of 16 electrophoretic loci from Adest's (1978) third study of sand lizard intergeneric relationships (total length = 19; consistency index = 0.895, 0.778 excluding uninformative characters).
from his third study using the method of Fitch & Margohash (1967). This dendrogram has the same branching structure as his phenogram for the same data. Although the Fitch-Margohash method does not assume constant evolutionary rates, the dendrogram presented by Adest is not the best estimate of sand hzard phylogeny judged by percent standard deviation, the criterion employed in that method. Reanalyses of the data upon which Adest's dendrogram is based (Adest, 1978: table 14) using the FITCH algorithm in Felsenstein's PHYLIP package (version 3.2) revealed that this dendrogram has an average percent standard deviation (APSD) of 12.37. I found two dendrograms with lower APSDs: one in which the relationships are those favoured by character analysis of my electrophoretic data (Fig. 2) and similar reanalysis of Adest's data (Fig. 5) and a second differing only in that the positions oí Callisaurus and Uma are reversed. The APSDs for those dendrograms are 11.47 and 10.82, respectively.
The hypothesis that Callisaurus and Cophosaurus are closest relatives has been advocated by various authors (Axtell, 1958; Norris, 1958; Earle, 1961, 1962; Clarke, 1965; Adest, 1978). Not only is this hypothesis contradicted by the electrophoretic data as a whole, it is not supported by any individual electrophoretic characters. In my study, Callisaurus and Cophosaurus share a derived state for each of four characterers (Est-D, a-Gpd, Icdh-2, and Mdh-1). In three of these, the derived state shared by Callisaurus and Cophosaurus is also found in one (Icdh-2) or both (Est-D, a-Gpd) species of Holbrookia. The fourth (Mdh-1, alíele b) is unique to Callisaurus and Cophosaurus, but Holbrookia possess an alternative derived state. Because the relative order of these two states is unknown, it is possible that the alíele shared by Callisaurus and Cophosaurus is ancestral relative to that seen in Holbrookia. Therefore, even if interpreted as evidence for a sister group relationship between Callisaurus and Cophosaurus, the evidence is ambiguous. In Adest's third study, the only one in which character polarities can be determined, Callisaurus and Cophosaurus share derived alíeles in only two characters. In one of these (a-Gpd) the derived alíele is also shared with Holbrookia, and in the other (Gp-4), the derived alíele is also shared with Uma.

SAND LIZARD PHYLOGENY AND EVOLUTIONARY RATES 353
There are no known electrophoretic characters unambiguously supporting a sister group relationships between Callisaurus and Cophosaurus.
Rates of protein evolution
The discrepancies between the results of my analyses of Adest's data and those of his own analyses are attributable to the use of analytical methods on his part that are inappropriate for reconstructing phylogenetic relationships under conditions that apparently exist within the sand Hzard clade. In order for phenetic clustering methods, including the UPGMA employed by Adest (1978), to give accurate estimates of phylogenetic relationships, the data must have been generated by equal rates of evolutionary divergence among Hneages (CoUess, 1970; Farris, 1971; Felsenstein, 1988). Although such clocklike evolution is sometimes hypothesized for molecular characters, rate variarions among lineages have been demonstrated, and such variations are acknowledged even by proponents of the so-called molecular clock hypothesis (e.g. Wilson, Carlson & White, 1977).
The existence of variation in evolutionary rates among the hneages withm a study group can be tested prior to analysis of their phylogenetic inter- relationships by making comparisons with an outside reference taxon, a procedure known as the relative rate test (Sarich & Wilson, 1967a, b). Relative rate tests can be employed to assess the appropriateness of interpreting dendrograms produced by phenetic clustering as phylogenetic trees. Subjecting Adest's data to such tests reveals not only the existence of rate variations but also that the particular variations explain the discrepancies between phenograms and minimum length trees derived from the same data. The particular patterns of rate variation thus revealed are consistent with the phylogeny based on parsimony analysis of both my and Adest's electrophoretic data; they are incompatible with the interpretation of Adest's phenograms as phylogenetic
trees. Relative rate tests reveal that the Nei genetic distances used by Adest to
construct phenograms of sand Hzard relationships have been generated by unequal evolutionary rates. Only the last of Adest's three data sets includes taxa outside the sand lizard clade, Sceloporus and Phrynosoma, which are necessary for relative rate tests. If rates of evolution have been equal among the various hneages of sand hzards, then the genetic distances between either one of these outgroups and each of the sand lizard taxa should be roughly equal. This is not the case. Using Sceloporus as the outside reference taxon, the largest Nei genetic distance (to Holbrookia maculata thermophila) is 56% greater (1.91/1.22) than the smallest distance (to either Callisaurus or Cophosaurus; Uma and pooled populations of Holbrookia maculata exhibit intermediate distances to Sceloporus) (Adest, 1978: table 14). The Nei genetic distances between Sceloporus and all sand lizards' are high (minimum 1.22), however, and the Nei genetic distance coefficient is less accurate at high distances (Nei, 1972).
Phrynosoma is more closely related to the sand lizards than is Sceloporus (Presch, 1969; Etheridge & de Queiroz, 1988); the former taxon also exhibits smaller genetic distances to the various sand Hzards. Using Phrynosoma rather than Sceloporus as the outside reference taxon in a relative rate test, apparent rate variations are even greater. The distances between Phrynosoma and Holbrookia

354 K. DE QUEIROZ
(1.01 and 1.03 to H. m. thermophila and the pooled sample of H. maculata, respectively) are at least 80% greater than the distances between Phrynosoma and Callisaurus, Cophosaurus and Uma (d = 0.56 for each comparison). Holbrookia appears to have experienced greater rates of protein evolution than the other Hneages of sand lizards since their most recent common ancestor.
In fact, Adest (1978) postulated variation in rates of protein evolution in the sand lizards. His assessment, however, was based on interpreting his data in the context of his hypothesized phylogeny, which was based on phenetic clustering of genetic distance data. Acceptance of this hypothesized phylogeny led Adest to postulate relatively lesser rather than greater rates of evolution in the Holbrookia lineage. Adest's conclusions about both relationships and rates of evolution are undermined by his interpretation of a phenogram as a phylogenetic tree when the data do not satisfy the condition of constant evolutionary rates required for such an interpretation. Furthermore, his conclusion about rates of evolution is contradicted by the results of relative rate tests, which indicate that Holbrookia has undergone greater rather than lesser amounts of change compared with other lineages of sand lizards.
The particular rate variations that exist among sand lizard lineages explain the discrepancies between the results of Adest's phenetic analyses and my phylogenetic conclusions based on parsimony analyses of the same data. As demonstrated by relative rate tests, the lineage leading to Holbrookia apparendy has undergone greater rates of protein evolution than those leading to the other extant sand lizards. If the discrepancy in evolutionary rates is sufficiently great, then Holbrookia should be more distant phenetically (i.e. in terms of genetic distance) from all other sand lizards than these other taxa are from one another, and this situation should hold even though some of these other taxa, in particular Cophosaurus, share a more recent common ancestor with Holbrookia than with one another. In other words, a sufficiently greater rate of protein evolution in Holbrookia would explain, for example, why Cophosaurus clusters phenetically with Callisaurus rather than Holbrookia, even though Cophosaurus shares a more recent common ancestor with Holbrookia than with Callisaurus.
Although not useful for relative rate tests because they do not include outgroups, Adest's first two studies, in addidon to his third study, bear on the hypothesis that Cophosaurus and Holbrookia are sister taxa but are dissimilar because of increased rates of divergence in the latter taxon. This hypothesis implies that although phenetic distances between Callisaurus and Cophosaurus may be smaller than those between either taxon and Holbrookia, provided that rates of evolution in the Callisaurus and Cophosaurus lineages have been similar (which they have, see below), the genetic distances between Cophosaurus and Holbrookia should be smaller than those between Callisaurus and Holbrookia. This prediction is upheld. For all three of Adest's electrophoretic studies, the Nei genetic distances between Cophosaurus and various OTUs representing Holbrookia are consistentiy smaller than those between Callisaurus and these same OTUs representing Holbrookia (Table 5).
These patterns of electrophoretic similarity can be accounted for in the context of a phylogeny in which Callisaurus and Cophosaurus are sister taxa by postulating, as Adest did, greater rates of evolution in Callisaurus relative to Cophosaurus. This interpretation, however, is contradicted by relative rate tests. The Nei genetic distance for the comparison between Callisaurus and Sceloporous is

SAND LIZARD PHYLOGENY AND EVOLUTIONARY RATES 355
TABLE 5. Comparison of Nei genetic distances from various OTUs representing Holbrookia to Cophosaurus on the one hand and to Callisaurus on the other. The data are divided into three blocks corresponding with three separate studies conducted by Adest (1978) and presented in his tables 15, 16, and 17,
respectively
Genetic distance to:
OTU representing Holbrookia Cophosaurus Callisaurus
H. maculaia H. propincua H. lacérala
0.43 0.44 0.84
0.85 0.74 1.10
H. macúlala (Arizona) H. macúlala (pooled)
0.44 0.45
0.69 0.71
H. macúlala (Arizona) H. macúlala (pooled)
0.47 0.40
0.98 0.73
identical to that between Cophosaurus and Sceloporus (d = 1.22 for both comparisons), indicating similar rates of evolution in these two hneages for the loci sampled by Adest (1978: table 17). The same is true for the genetic distances between each of these two sand lizard taxa and Phrynosoma, which again have identical values (d = 0.56). Two other things should be remembered. First, the existence of rate variations invalidate an assumption imphcit in the interpretation of a phenogram as a phylogenetic tree, thus undermining the phylogenetic hypothesis upon which this Adest's interpretation was based. Second, the evidence of shared, derived characters contradicts this hypothesis of relationships. Rate variations among the Hneages of sceloporine sand lizards apparently have been sufficiently great to cause phenetic clustering to yield an incorrect phylogenetic tree.
ACKNOWLEDGEMENTS
This paper is a modified chapter from a dissertation partially fulfilHng the requirements of a Ph.D. degree in Zoology at the University of California at Berkeley. I thank my advisor, D. Wake, and other committee members, M. Wake and V. Sarich, for their comments on the dissertation chapter and A. Graybeal for comments on a later version of the paper. A. Bauer, D. Brown, D. Good, J. Losos, M. Donoghue, R. Sieb and S. Walker collected or assisted with collecting specimens, and G. Adest, R. MacCuUoch, D. Morafka and R. Murphy provided frozen tissue samples. M. Frelow taught me how to do electrophoresis and helped me through minor crises in the lab. I would Hke to give special thanks to G. Adest for supplying me with his dissertation and unpublished data on Phrynosoma platyrhinos and for introducing me to the fascinating sand hzards. I hope that my extensive criticisms of his work are seen not as disrespectful but as the result of refinements in phylogenetic reasoning. Field work was supported by two grants from the Louise Kellog Fund of the Museum of Vertebrate Zoology (University of CaHfornia at Berkeley); lab work

356 K. DE QUEIROZ
was supported by grants from the Theodore Roosevelt Fund of the American Museum of National History, Sigma Xi, the Scientific Research Society, and the National Science Foundation (grant BSR 8619630 to D. Wake).
REFERENCES
ADEST, G. A., 1977. Genetic relationships within the genus Uma (Iguanidae). Copeia, 1977: Al-bï. ADEST, G. A., 1978. The relations of the sand lizards Uma, Callisaurus and Holbrookia (Sauria: Iguanidae): An
electrophoretic study. Unpublished Ph.D. dissertation, University of California, Los Angeles. ADEST, G. A., 1987. Genetic differentiation among populations of the zebratail lizard, Callisaurus draconoides
(Sauria: Iguanidae). Copeia, 1987: 854-859. AXTELL, R. W., 1958. A monographic revision of the iguanid genus Holbrookia. Unpublished Ph.D. dissertation,
University of Texas, Austin. BLACKBURN, D. G., 1978. The comparative, functional, and evolutionary myology of burrowing sceloporine lizards.
Unpublished M. S. Thesis, Cornell University. BUTH, D. G., 1984. The application of electrophoretic data in systematic studies. Annual Review of Ecology and
Systematics, 15: 501•522. CLARKE, R. F., 1965. An ethological study of the iguanid lizard genera Callisaurus, Cophosaurus, and
Holbrookia. Emporia Slate Research Studies, 13: 1-66. COLLESS, D. H., 1970. The phenogram as an estímate of phylogeny. Systematic ^oology, 19: 352-362. COX, D. C. & TANNER, W. W., 1977. Osteology and myology of the head and neck regions o[ Callisaurus,
Cophosaurus, Holbrookia, and Uma (Reptilia: Iguanidae). Great Basin Naturalist, 37: 35-56. DE QUEIROZ, K., 1989. Morphological and biochemical evolution in the sand lizards. Unpublished Ph.D.
dissertation, University of California, Berkeley. EARLE, A. M., 1961. The middle ear oi Holbrookia and Callisaurus. Copeia, 1961: 405-410. EARLE, A. M., 1962. The middle ear of the genus Uma compared to those of the other sand lizards. Copeia,
1962: 185-188. ETHERIDGE, R., 1964. The skeletal morphology and systematic relationships of sceloporine lizards. Copeia,
1964: 610-631. ETHERIDGE, R. & DE QUEIROZ, K., 1988. A phylogeny of Iguanidae. In R. Estes & G. Pregill (Eds),
Phylogenetic Relationships of the Lizard Families: 283-367. Stanford: Stanford University Press. FARRIS, J. S., 1971. The hypothesis of nonspecificity and taxonomic congruence. Annual Review of Ecology and
Systematics, 2: 2n-'i02. FARRIS, J. S., 1972. Estimating phylogenetic trees from distance matrices. American naturalist, 106: 645-668. FARRIS, J. S., 1982. Outgroups and parsimony. Systematic Zoology, 31: 328-334. FELSENSTEIN, J., 1988. Phylogenies from molecular sequences: Inferences and reliability. Annual Review of
Genetics, 22: 521-565. FITCH, W. M. & MARGOLIASH, E., 1967. Constructíon of phylogeneric trees. Science, 155: 279-284. GUTTMAN, S. I., 1970. An electrophoretic study of the hemoglobins of the sand lizards Callisaurus,
Cophosaurus, Holbrookia and Uma. Comparative Biochemistry and Physiology, 34: 569-574. HARRIS, H. & HOPKINSON, D. A., 1976. Handbook of Enzyme Electrophoresis in Human Genetics. New York:
Oxford American Publishing Company, Incorporated. HENNIG, W., 1966. Phylogenetic Systematics. Urbana: University of Illinois Press. KLUGE, A. G. & FARRIS, J. S., 1969. Quantitative phyletics and the evolution of anurans. Systematic ^.oology,
18: 1-32. MADDISON, W. P., DONOGHUE, M. J. & MADDISON, D. R., 1984. Outgroup analysis and parsimony.
Systematic Zoology, 33: 83-103. MICKEVICH, M. F. & MITTER, C, 1981. Treaüng polymorphic characters in systematics: A phylogenetic
treatment of electrophoretic data. In V. A. Funk & D. R. Brooks (Eds), Advances in Cladistics: Proceedings of the First Meeting of the Willi Hennig Society: 45•60. Bronx: New York Botanical Garden.
MICKEVICH, M. F. & MITTER, C, 1982. Evolutionary patterns in allozyme data: a systematic approach. In N. I. Platnick & V. A. Funk (Eds), Advances in Cladistics, Volume 2. Proceedings of the Second Meeting of the Willi Hennig Society: 169-176. New York: Columbia University Press.
MITTLEMAN, M. B., 1942. A summary of the iguanid genus Urosaurus. Bulletin of the Museum of Comparative Zoology, 91: 106-181 + 16 plates.
NEI, M., 1972. Genetic distance between populations. American Naturalist, 106: 283-292. NORRIS, K. S., 1958. The evolution and systematics of the iguanid genus Uma and its relation to the
evolution of other North American desert reptiles. Bulletin of the American Museum of Natural History, 114: 251-326.
PRESCH, W., 1969. Evolutionary osteology and relationships of the horned lizard genus Phrynosoma (Family Iguanidae). Copeia, 1969: 250-275.
RICHARDSON, B. J., BAVERSTOCK, P. R. & ADAMS, M., 1986. Allozyme Electrophoresis: A Handbook for Systematics and Population Studies. Sydney: Academic Press.
SAND LIZARD PHYLOGENY AND EVOLUTIONARY RATES 357
SARICH, V. M. & WILSON, A. C, 1967a. Rates of albumin evolution in primates. Proceedings of the National Academy of Sciences USA, 58: 142-148.
SARICH, V. M, & WILSON, A. C, 1967b. Immunological time scale for hominid evolution. Science, 158: 1200-1203.
SAVAGE, J. M., 1958. The iguanid lizard genera Urosaurus and Uta, with remarks on related groups. Zoológica, 43: 41-54.
SELANDER, R. K., SMITH, M. H., YANG, S. Y., JOHNSON, W. E. & GENTRY, J. B., 1971. Biochemical polymorphism and systematics in the genus Peromyscus. I. Variations in the old-field mouse [Peromyscus polionotus). Studies in genetics VI. University of Texas Publications, 7103: 49-90.
SMITH, H. M., 1946. Handbook of Lizards: Lizards of the United States and Canada. Ithaca: Cornell University Press.
SNEATH, P. H. A. & SOKAL, R. R., 1973. Numerical Taxonomy: The Principles and Practice of Numerical Classification. San Francisco: W. H. Freeman and Company.
WATROUS, L. E. & WHEELER, Q,. D., 1981. The outgroup comparison method of character analysis. Systematic Zoology, 30: 1-11.
WILSON, A. C, CARLSON, S. S. & WHITE, T. J., 1977. Biochemical evolution. Annual Review of Biochemistry, 46: 573-639.
Note added in proof Two problems have come to my attention subsequent to the acceptance of this
paper. The first concerns the greater genetic distance between Callisaurus and ^ Holbrookia than between Cophosaurus and Holbrookia and its bearing on the alternative phylogenetic hypotheses. Although relative rate tests using Scelopoms and Phrynosoma as outgroups indicate similar rates of evolution in the Callisaurus and Cophosaurus lineages, accepting the phylogeny advocated in the present paper imphes that it is also appropriate to use Uma as an outgroup to the clade stemming from the most recent common ancestor of Callisaurus, Cophosaurus and Holbrookia. Contrary to the previous results, a relative rate test using Uma as the outgroup indicated that the Callisaurus lineage has undergone greater divergence than the Cophosaurus lineage since their most recent common ancestor.
The discrepancy between the results obtained using different outgroups is attributable to two loci (6-Pgdh and Mpi). These loci exhibit a pattern of allehc distribution implying that the ancestral state for the sand hzard clade both differs from the state or states observed in Phrynosma and Sceloporus and is retained in Uma and Cophosaurus but not in Callisaurus. The changes in the Callisaurus hneage are undetectable using Phrynosoma and Sceloporus as outgroups because relative to these outgroups they represent overlaid substitutions. When Uma is used as the outgroup, the changes in the Callisaurus hneage are detected because no intervening substitution occurs along the branches between Uma and the most recent common ancestor of the remaining sand lizards. Consequently, the Callisaurus lineage is seen to exhibit greater divergence than the Cophosaurus hneage since their most recent common ancestor. The existence of greater divergence in the Callisaurus lineage relative to the Cophosaurus lineage makes it impossible to distinguish between the alternative phylogenetic hypotheses on the basis of Adest's (1978) table of genetic distances. That is to say, both hypotheses now predict a greater distance between Callisaurus and Holbrookia than between Cophosaurus and Holbrookia.
The second problem concerns the method of coding and analysing allelic data. Treating the arrays of alíeles observed in different taxa as unordered character states, which I did, potentially ignores some of the available phylogenetic information. Specifically, it ignores information about shared alíeles•a problem that is particularly acute when allehc arrays differ only in the presence/absence of rare alíeles. Swofford & Berlocher (1987, Systematic Zoology, 36: 293-325)

358 K. DE QUEIROZ
developed a parsimony method that avoids this problem by incorporating information on alíele frequencies. I analysed the data in Table 3 for eight sand lizard species with this method using D. L. Swofford's FREQPARS program (version 1.0). Because the program's heuristic algorithm is not guaranteed to find the most parsimonious solution (s) even for small numbers of taxa, I simply compared the (unrooted) tree favoured in my previous analysis with the tree favoured by Adest (1978) and the tree produced by the heuristic algorithm. The tree favoured in this comparison was the same one favoured in the previous analysis.

SAND LIZARD PHYLOGENY AND EVOLUTIONARY RATES 359
APPENDIX 1
Species, sample sizes, localities, and specimen numbers for specimens used in the electrophoretic study of allozyme variation. Abbreviations: KdQ, field series of the author: MVZ, Museum of Vertebrate Zoology, University of California at Berkeley; ROM, Royal Ontario Museum, Toronto; USC, University of Southern
California Field Series.
Sand lizards: Callisaurus draconoides rhodostictus (10): U.S.A., California, Imperial Co., 0.5 mi N S-2 on Shell Canyon Rd.,
vie. Ocotillo (ROM 13776-13779, 13828-13831, 13833, 13841). C. d. veniralis (1): U.S.A., Arizona, Pima Co., Santa Catalina Mts., mouth Pima Canyon, vie. Tucson (MVZ 214732). C. d. rhodostictus (1): U.S.A., California, Inyo Co., Argus Mts., Darwin Wash (MVZ 214740). C. d. myurus (1): U.S.A., Nevada, Mineral Co., SW shore Walker Lake (KdQ.207). C. d. rhodostictus (1): México, Baja California, 6.8 mi N Cataviña on Hwy 1 (ROM 14066). C. d. crinitis (1): México, Baja California, dunes N Guerrero Negro (MVZ 199440). C. d. carmenensis (1): México, Baja California Sur, Santa Águeda (ROM 14452). C. d. draconoides (1): México, Baja California Sur, El Coro (MVZ 214731). C. d. bogerti (1): México, Sinaloa, Playas N Mazatlan (ROM 14992). C. d. brevipes, bogerti, or imsitatus (Specimens from this area have been referred to all three subspecies.) (1): México, Sonora, Bahía Kino, 1.0 mi on dirt rd. to Punta Chueca from Bahía Kino (ROM 15024). C. d. brevipes (1): México, Sonora, Alamos, Río Cuchujaqui (ROM 14929).
Cophosaurus texanus scitulus (10): México, Durango, Bolsón de Mapimí, Laboratorio del Desierto, 40 km NE Ceballos, 26°41'N, 103°45'E (ROM 15103-15109, 15157-15159). C. t. texanus (2): México, Nuevo Leon, Cadereyta, 17.3 mi NE and 2.5 mi N Cadereyta rd. to Santa Isadora (ROM 15379-15380). C. t. scitulus (2): U S A., Arizona, Cochise Co., 1.9 mi W New Mexico border on MO (MVZ 214724-214725). C. t. scitulus (2): U.S.A., Arizona, Yavapai Co., 3 mi N Hillside (MVZ 200010-200011). C. t. scitulus (2): U.S.A., Texas, Hudspeth Co., scenic lookout N side I-IO, 4 mi W Van Horn (MVZ 214709-214710). C. t. ¡exams (2): U.S.A., Texas, Travis Co., South San Gabriel River at Hwy 183 (MVZ 214727, 214729).
Holbrookia lacérala lacérala (1): U.S.A., Texas, no further data (MVZ 214876). Holbrookia macúlala approximans (9): México, Durango, Bolsón de Mapimí, Laboratorio del Desierto, 40 km NE Ceballos, 26°4rN, 103°45'E (ROM 15129-15133, 15189-15190, 15192-15193). H. m. thermophila (2): Mexico, Sonora, Alamos, 5 mi E Navojoa (ROM 14934-14935). H. m. approximans (2): México, Zacatecas, 11 mi NE Conception Del Oro turnoff on Hwy 54 (USC 5611; ROM 15341). H. m. flavilenla or thermophila (The specimen has been skeletonized and can no longer be identified to subspecies.) (1): U.S.A., Arizona, Cochise Co., vicinity of Nicksville (MVZ 200016). H. m.flavilenta (1): U.S.A., Arizona, Cochise Co., 3.5 mi SE junction rd. to Ft. Bowie Nati. Hist. Site on Hwy 186 (MVZ 214872). H. m.flavilenta (2): U.S.A., Arizona, Cochise Co., junction I-IO and Hwy 666 N (MVZ 214808-214809). H. m. macúlala (2): New Mexico, Chaves Co., 0.9 mi S Hwy 380, 37 0 mi E Rosewell (junction Hwy 285) MVZ 214803-214804). Holbrookia propinqua propincua (10): U.S.A., Texas, Nueces Co., dunes N Access Rd. 3, Mustang Island (MVZ 214818-214823, 214857, 214860-214861
214933). Uma exsul (10): México, Durango, Hwy 47, rd. to Nazas and Rodeo (ROM 15304-15313). U. exsul (1)
México, Coahuila, Bilbao dunes, vie. Viesca (ROM 15323). Uma nótala rufopunctata (10): México, Sonora 42 km SW Sonoita on Hwy 8 (to Puerto Peñasco), turn off to microondas San Pedro (ROM 13860-13863, 13865-13870). U. n. rufopunctata (7): México, Sonora, 17 km NE Puerto Peñasco on Hwy 8 (ROM 13916-13920, 13923-13924). U. n. nótala (3): U.S.A., California, Imperial Co., E edge Algodones Dunes, 0 9 mi W junction I-10 and S-34 (MVZ 214798-214800). Uma paraphygas (10): México, Durango, Bolsón de Mapimí, Laboratorio del Desierto, 40 km NE Ceballos, 26°41'N, 103°45'E (ROM 15080-15089). Uma scoparia (10): U.S.A., California, San Bernardino Co., vie. Pisgah Lava Flow, 10 mi W Newberry Springs on National Trails Hwy (ROM 14625, 14627-14634; MVZ 214787). U. scoparia (10): U.S.A., California, San Bernardino Co., SE edge Kelso Dunes (MVZ 214788-214797).
Outgroups: First outgroup (6 species out of 13). Phrynosoma cornutum (1): U.S.A., Texas, Pecos Co., 12.8 mi E jet Hwy 285
on I-IO (MVZ 214669). Phrynosoma coronatum (3): México, Baja California Sur, 37.6 mi N La Paz on Hwy 1 (KdQ,58); México, Baja California, 11.4 rd mi W Bahía de Los Angeles (KdQ.59); México, Baja California, 42.5 mi S El Rosario on Hwy 1 (KdQ.60). Phrynosoma douglassi (1): U.S.A., Arizona, Pima Co., Santa Catalina Mts., jet. Mt. Lemon Hwy and Oracle-Mt. Lemon rd. (KdQ,56). Phrynosoma modestum (1): U.S.A., Texas, Pecos Co., rest area N side MO at jet. Hwy 385 (MVZ 214668). Phrynosoma platyrhinos (3): U.S.A., Nevada, Washoe Co., 8.0 mi S jet. Hwy 446 (Nixon) on Hwy 447 (MVZ 214671); U.S.A., California, Kern Co., 12.1 mi NE California City on rd. to Red Mountain (MVZ 214828); U.S.A., California, Kern Co., 8.5 mi NE California City on rd. to Red Mountain (MVZ 214670). Phrynosoma solare (1): U.S.A., Arizona, Pima Co., Santa Catalina Mts., mouth Pima Canyon, vie. Tucson (MVZ 214667).
Second outgroup (10 species out of 81). Sceloporus clarki (1): U.S.A., Arizona, Pima Co., Santa Catalina Mts., mouth Pima Canyon (MVZ 214875). Sceloporus graciosus (1): U.S.A., New Mexico, Chaves Co., 0.9 mi S Hwy 380, 37.0 mi E Rosewell (junction Hwy 285) (MVZ 214698). Sceloporus jarrovi (1): U.S.A., Arizona, Cochise Co.,' Huachuca Mts., vie. Clark Spring (MVZ 214694). Sceloporus olivaceus (1): U.S.A., Texas, Travis Co., South San Gabriel R. at jet. Hwy 183 (MVZ 214677). Sceloporus magister (1): U.S.A., Nevada, Washoe Co.,

360 K. DE QUEIROZ
6.7 mi NW jet. Hwy 447 (Nixon) on Hwy 446 (MVZ 214826). Sceloporus undulatus (1): U.S.A., Arizona, Cocliise Co., 3.1 mi SE jct. rd. to Ft. Bowie Nati. Hist. Site on Hwy 186 (MVZ 214874). Sceloporus virgatus (1); U.S.A., Arizona, Cochise Co., Chiricahua Mts., 5.8 mi E jct. Hwy 181 on Pinery Canyon Rd. (MVZ 214871). Urosaumsgraciosus (1): U.S.A., California, San Bernardino Co., N edge Pisgah Lava Flow (KdQ,28). Urosaurus ornatus (1): U.S.A., Arizona, Cochise Co., Chiricahua Mts., vic. Cave Creek Canyon (KdQ,44). Uta stansburiana (1); U.S.A., Nevada, Washoe Co., 8.0 mi S jct. Hwy 446 (Nixon) on Hwy 447 (MVZ 214826).
Third outgroup (1 species out of 2). Petrosaurus thalassinus (5): México, Baja California Sur, El Coro (MVZ 190074-190078).

SAND LIZARD PHYLOGENY AND EVOLUTIONARY RATES 361
APPENDIX 2
Electrophoretic characters supporting various presumptive and possible clades of sand lizards. Unambiguous characters are those originating (under minimum step optimization) in the common ancestor of the taxa under which they are listed on all minimum length trees. Ambiguous characters are those interpreted as originating in the common ancestor of the taxa under which they are listed under some but not all minimum step optimizations or on some but not all minimum length trees. Homoplastic characters are marked with an 'H'.
Presumptive clades (common to all minimum length trees);
Sand lizards (entire): Unambiguous (0):
None identified. Ambiguous (10):
1 (1); Aeon: b. 2 (1, 2 or 3); Alb: b, d or e. 7 (0); Est: c. 9 (0); Gp-1: a. 20 (0, 1, 2, 3, 4, 5, 6, or 7); Pep-B: a, c, d, ce, ceh, bdei, gilm, or gklm.
21 (0); Pep-C: c. 22 (0, 1, 2, 3, 4, 5, or 6); Pep-D: f, ab, cb, cd, cf, fg, or cdfgh. 24 (1); Pep-S: c. 25 (0 or 1); Pgm: b or c. 26 (0, 1, 2, 3, 4, or 5); 6-Pgd: f, j, ad, ce, gj, bdfh.
Uma exsul and Uma paraphygas: Unambiguous (0):
None identified. Ambiguous (6):
2 (IH or 2H); Alb: b or d. 10 (2); Gpi: d. 11 (2); a-Gpd: d. 17 (3); Mdh-1: e. 20 (0 or 4); Pep-B: a or ceh. 22 (3); Pep-D: cd.
Callisaurus, Cophosaurus, and Holbrookia: Unambiguous (2):
8(1); Est-D: Í 13(1); Icdh-2: c.
Ambiguous (6): 11 (1); a-Gpd: b. 17 (1); Mdh-1: b. 20 (2, 5, 6, or 7); Pep-B: d, bdei, gilm, or gklm. 22 (0, 4, 5, or 6); Pep-D: f, cf, fg, or cdfgh. 25 (0); Pgm: b. 26 (0, 2, 3, or 5); 6-Pgd: f, ad, ce, bdfh.
Cophosaurus and Holbrookia: Unambiguous (2):
5 (1); Aat: e. 12 (1); Icdh-1: ac.
Ambiguous (4): 2 (0, 2H, or 3H); Alb: a, d, or e. 20 (2, 6, or 7); Pep-B: d, gilm, or gklm. 22 (0, 4, or 6); Pep-D: f, cf, cdfgh. 26 (0, 3, or 5); 6-Pgd: f, ce, or bdfh.
Holbrookia macúlala and Holbrookia propinqua: Unambiguous (3):
9 (1); Gp-1: b. 17 (2); Mdh-1: c. 24 (3); Pep-S: bed.
Ambiguous (6): 2 (0 or 2H); Alb: a or d. 10 (3 or 4); Gpi: for ef 20 (2 or 7); Pep-B: d or gklm. 22 (4 or 6); Pep-D: cf or cdfgh. 26 (0 or 5); 6-Pgd: for bdlh. 28 (1 or 2); Sod: d or be.

362 K. DE QUEIROZ
Urna exsul: Unambiguous (1):
24 (0); Pep-S; a. Ambiguous (2):
2 (2H); Alb: d. 20 (0); Pep-B: a.
Uma paraphygas: Unambiguous (3):
7 (IH); Est: e. 14 (2); Iddh: de. 16 (1); Ldh-2: ab.
Ambiguous (2): 2 (IH); Alb: b. 20 (4); Pep-B: ceh.
Uma notata: Unambiguous (0):
None identified. Ambiguous (4):
2 (3H); Alb: e. 20 (3); Pep-B: ce. 22 (2); Pep-D: be. 26 (4); 6-Pgd: gj.
Uma scoparia: Unambiguous (3):
1 (0); Aeon: a. 9 (2); Gp-1: ae. 24 (2); Pep-S: d.
Ambiguous (3): 2 (4); Alb: f. 20 (1); Pep-B: c. 22 (1); Pep-D; ab.
Callisaurus draconoides : Unambiguous (7);
1 (2); Aeon: c. 4 (IH); Adh-2: bd. 7 (2); Est: ce. 14 (1); Iddh: c. 18 (1); Mdh-2: a. 19 (1); Mpi: a. 27 (1); Np: b.
Ambiguous (4): 2 (IH); Alb: b. 20 (5); Pep-B: bdei. 22 (5); Pep-D: fg. 26 (2); 6-Pgd: ad.
Cophosaurus texanus: Unambiguous (1):
1 (4); Aeon: cd. Ambiguous (4):
2 (3H); Alb: e. 20 (6); Pep-B: gilm. 22 (0); Pep-D: f. 26 (3); 6-Pgd: ce.
Holbrookia macúlala: Unambiguous (4):
1 (3); Aeon: be. 3 (1); Adh-1: ae. 4 (IH); Adh-2: bd. 13 (2); Icdh-2: be.
Ambiguous (6): 2 (2H); Alb: d. 10 (4); Gpi: ef. 20 (7); Pep-B: gklm. 22 (6); Pep-D: cdfgh. 26 (5); 6-Pgd: bdfh. 28 (1); Sod: d.
Holbrookia propinqua: Unambiguous (2):
7 (IH); Est: e. 12 (2); Icdh-1: be.
Ambiguous (6): 2 (0); Alb: a. 10 (3); Gpi: f. 20 (2); Pep-B: d. 22 (4); Pep-D: cf. 26 (0); 6-Pgd: f. 28 (2); Sod: be.
Possible clades (present on only some minimum length trees): Uma
Unambiguous (0): None identified.
Ambiguous (5): 10 (1 or 2); Gpi: b or d. 20 (0, 1, 3, or 4); Pep-B: a, c, ce, or ceh. 22 (1. 2, or 3); Pep-D: ab, be, or cd. 25 (1); Pgm: c. 26 (1 or 4); 6-Pgd: j or gj.
Uma exsul, Uma paraphygas, Callisaurus, Cophosaurus, and Holbookia Unambiguous (0):
None identified. Ambiguous (5):
2 (I or 2); Alb: b or d. 11 (1 or 2); a-Gpd: b or d. 17 (1 or 3); Mdh-1: bore. 20 (0, 2, 4, 5, 6, or 7); Pep-B: a, d, ceh, bdei, gilm, or gklm. 22 (0, 3, 4, 5, or 6); Pep-D: f, cd, ef, fg, or cdfgh.
Uma notata, Uma scoparia, Callisaurus, Cophosaurus, and Holbrookia Unambiguous (0):
None identified. Ambiguous (3):
2 (3); Alb: e. 20 (1, 2, 3, 5, 6, or 7); Pep-B: c, d, ce, bdei, gilm, or gklm. 22 (0, 1, 2, 4, 5, or 6); Pep-D: f, ab, be, cf, fg, or cdfgh.
Uma exsul, Uma paraphygas, and Uma notata Unambiguous (0):
None identified. Ambiguous (2);
20 (0, 3, or 4): Pep-B: a, ce, or eeh. 22 (2 or 3): Pep-D: be or cd.
Uma exsul, Uma paraphygas, and Uma scoparia Unambiguous (0):
None identified. Ambiguous (4):
2 (IH, 2H or 4); Alb: b, d, or f 20 (0, 1, or 4); Pep-B: a, c, or eeh. 22 (1 or 3); Pep-D: ab or cd. 26(1); 6-Pgd: j.
Uma notata and Uma scoparia Unambiguous (0):
None identified. Ambiguous (4):
2 (3H or 4); Alb: e or f 10 (1); Gpi: b. 20 (1 or 3); Pep-B: c or ce. 22 (1 or 2); Pep-D: ab or be.

Note added after publication The problem I pointed out in the note added in proof concerning the amounts
of divergence in the Callisaurus and Cophosaurus lineages was raised in the context of the data from the third of Adest's three studies. It is worthwhile to consider this problem further for two reasons. First, because the genetic distance values depend on the particular set of loci sampled, the problem may not apply to the other two studies. Second, it has occurred to me that there is a way to correct for the unequal amounts of divergence in the Callisaurus and Cophosaurus lineages so that the data from the third study can be used to test the alternative phylogenetic hypotheses.
Because Adest's first study did not include Uma, it is unknown whether the problem applies in this case. Consequently, the genetic distances obtained in this study cannot be used to test the alternative phylogenetic hypotheses. In the second study, the genetic distance between Uma and Cophosaurus is slightly larger than that between Uma and Callisaurus. In other words, the problem does not apply, and the original conclusion is unchanged. The smaller genetic distances between Cophosaurus and Holbrookia relative to those between Callisaurus and Holbrookia are consistent with the results of the parsimony analyses but contradict the results of the UPGMA analysis. The problem arises only in the third study. Because the Callisaurus lineage has experienced a greater amount of divergence than the Cophosaurus lineage in this set of loci, the fact that the genetic distances between Cophosaurus and Holbrookia are smaller than those between Callisaurus and Holbrookia cannot be taken at face value as evidence supporting the parsimony tree and contradicting the UPGMA tree. Nevertheless, the distances can be corrected so that the data can still be used to test the alternative hypotheses. The genetic distance between Uma and Callisaurus (0.58) is 0.21 greater than the distance between Uma and Cophosaurus (0.37). Therefore, one can correct for the unequal divergences in the Callisaurus and Cophosaurus lineages by subtracting 0.21 from the comparisons between Callisaurus and Holbrookia, and then comparing the corrected values with those for the comparisons between Cophosaurus and Holbrookia. When this is done, the distances between Callisaurus and Holbrookia maculata (Arizona) (0.77) and Holbrookia maculata (pooled) (0.52) are still greater than the distances for the comparisons involving Cophosaurus and the same two OTUs representing Holbrookia (0.47 and 0.40, respectively). This finding is consistent with the results of the parsimony analysis but contradicts those of the UPGMA analysis.