Why tropical forest lizards are vulnerable to climate warming
33
doi: 10.1098/rspb.2008.1957 , 1939-1948 first published online 4 March 2009 276 2009 Proc. R. Soc. B Álvarez Pérez and Theodore Garland, Jr Raymond B. Huey, Curtis A. Deutsch, Joshua J. Tewksbury, Laurie J. Vitt, Paul E. Hertz, Héctor J Why tropical forest lizards are vulnerable to climate warming Supplementary data tml http://rspb.royalsocietypublishing.org/content/suppl/2009/02/27/rspb.2008.1957.D "Data Supplement" References rls http://rspb.royalsocietypublishing.org/content/276/1664/1939.full.html#relat Article cited in: http://rspb.royalsocietypublishing.org/content/276/1664/1939.full.html#ref-list-1 This article cites 81 articles, 12 of which can be accessed free Subject collections (119 articles) environmental science (519 articles) ecology (441 articles) behaviour Articles on similar topics can be found in the following collections Email alerting service here right-hand corner of the article or click Receive free email alerts when new articles cite this article - sign up in the box at the top http://rspb.royalsocietypublishing.org/subscriptions go to: Proc. R. Soc. B To subscribe to This journal is © 2009 The Royal Society
-
Upload
independent -
Category
Documents
-
view
0 -
download
0
Transcript of Why tropical forest lizards are vulnerable to climate warming

doi: 10.1098/rspb.2008.1957, 1939-1948 first published online 4 March 2009276 2009 Proc. R. Soc. B
Álvarez Pérez and Theodore Garland, JrRaymond B. Huey, Curtis A. Deutsch, Joshua J. Tewksbury, Laurie J. Vitt, Paul E. Hertz, Héctor J. Why tropical forest lizards are vulnerable to climate warming
Supplementary data
tmlhttp://rspb.royalsocietypublishing.org/content/suppl/2009/02/27/rspb.2008.1957.DC1.h
"Data Supplement"
References
rlshttp://rspb.royalsocietypublishing.org/content/276/1664/1939.full.html#related-uArticle cited in: http://rspb.royalsocietypublishing.org/content/276/1664/1939.full.html#ref-list-1
This article cites 81 articles, 12 of which can be accessed free
Subject collections
(119 articles)environmental science � (519 articles)ecology �
(441 articles)behaviour � Articles on similar topics can be found in the following collections
Email alerting service hereright-hand corner of the article or click
Receive free email alerts when new articles cite this article - sign up in the box at the top
http://rspb.royalsocietypublishing.org/subscriptions go to: Proc. R. Soc. BTo subscribe to
This journal is © 2009 The Royal Society
on 23 April 2009rspb.royalsocietypublishing.orgDownloaded from

Proc. R. Soc. B (2009) 276, 1939–1948
doi:10.1098/rspb.2008.1957
on 23 April 2009rspb.royalsocietypublishing.orgDownloaded from
Why tropical forest lizards are vulnerable toclimate warming
Raymond B. Huey1,*, Curtis A. Deutsch2, Joshua J. Tewksbury1, Laurie J. Vitt3,
Paul E. Hertz4, Hector J. Alvarez Perez5 and Theodore Garland Jr6
1Department of Biology, University of Washington, PO Box 351800, Seattle, WA 98195, USA2Department of Atmospheric and Oceanic Science, University of California, Los Angeles, CA 90095, USA
3Sam Noble Oklahoma Museum of Natural History and Department of Zoology,
University of Oklahoma, Norman, OK 73072, USA4Department of Biology, Barnard College, New York, NY 10027, USA
5Faculty of Education, University of Puerto Rico, Rio Piedras, PR 00931, USA6Department of Biology, University of California, Riverside, CA 92521, USA
Published online 4 March 2009
Electron1098/rsp
*Autho
ReceivedAccepted
Biological impacts of climate warming are predicted to increase with latitude, paralleling increases in
warming. However, the magnitude of impacts depends not only on the degree of warming but also on the
number of species at risk, their physiological sensitivity to warming and their options for behavioural and
physiological compensation. Lizards are useful for evaluating risks of warming because their thermal
biology is well studied. We conducted macrophysiological analyses of diurnal lizards from diverse latitudes
plus focal species analyses of Puerto Rican Anolis and Sphaerodactyus. Although tropical lowland lizards live
in environments that are warm all year, macrophysiological analyses indicate that some tropical lineages
(thermoconformers that live in forests) are active at low body temperature and are intolerant of warm
temperatures. Focal species analyses show that some tropical forest lizards were already experiencing
stressful body temperatures in summer when studied several decades ago. Simulations suggest that
warming will not only further depress their physiological performance in summer, but will also enable
warm-adapted, open-habitat competitors and predators to invade forests. Forest lizards are key
components of tropical ecosystems, but appear vulnerable to the cascading physiological and ecological
effects of climate warming, even though rates of tropical warming may be relatively low.
Keywords: climate warming; heat stress; body temperature; operative temperature
1. INTRODUCTION
Climate warming has profoundly affected terrestrial
organisms (Walther et al. 2002; Parmesan 2006), and
the magnitude of future effects is expected to increase with
latitude (Root et al. 2003), paralleling the latitudinal
increase in rate of warming (IPPC 2007). However, biotic
impacts depend not only on the rate of warming but also
on the number of species at risk, the behavioural and
physiological abilities of organisms to buffer climate
warming (Huey et al. 2003; Helmuth et al. 2005) and on
physiological sensitivity to warming (Huey & Slatkin
1976; Deutsch et al. 2008; Tewksbury et al. 2008). The
biodiversity of terrestrial ectotherms (e.g. insects, amphi-
bians, reptiles) is of course vastly greater at lower latitudes.
Moreover, many tropical ectotherms are surprisingly
intolerant of high temperatures (Ruibal 1961; Parsons
1989) or are relatively sensitive to temperature change
(Janzen 1967; van Berkum 1988; Deutsch et al. 2008).
Nevertheless, biologists have given limited attention to
whether tropical ectotherms are vulnerable to warming
(Parsons 1989; Pounds et al. 1999; Root et al. 2003;
Parmesan 2007; Colwell et al. 2008; Deutsch et al. 2008;
ic supplementary material is available at http://dx.doi.org/10.b.2008.1957 or via http://rspb.royalsocietypublishing.org.
r for correspondence ( [email protected]).
17 January 20096 February 2009 1939
Raxworthy et al. 2008; Tewksbury et al. 2008; Williams
et al. 2008; Chen et al. 2009; Kearney et al. 2009).
Reliable projections of the biological impacts of climate
change require information on environmental biophysics
as well as the body temperature, thermal physiology,
behaviour and ecology of species (Huey & Slatkin 1976;
Tracy & Christian 1983; Dunham 1993; Buckley 2008;
Angilletta 2009; Kearney et al. 2009). Air temperatures
recorded by weather stations are often used as a proxy for
body temperature (Tb), but actual Tbs are far superior
(Chown & Terblanche 2007). Unfortunately, Tb data are
lacking for most ectotherms. However, such data (as well
as habitats, thermoregulatory behaviours and activity
patterns) are available for diverse species of lizards from
many latitudes. Moreover, these data are often accom-
panied by laboratory data on thermal preferences (Tp),
which are often co-adapted with optimal performance
temperatures (To; Huey & Bennett 1987; Martin & Huey
2008), by critical thermal temperatures (CTmin, CTmax)
and sometimes by measures of the temperature sensitivity
of physiological performance (Bennett 1980; Hertz et al.
1983; Angilletta et al. 2002). Our knowledge of lizard
thermal performance comes largely from studies of sprint
speed: accordingly, we compiled data on the thermal
dependence of this ecologically relevant trait (Bennett
1980) for more than 70 species of lizards (see table 1 in the
electronic supplementary material). The completeness and
This journal is q 2009 The Royal Society
1940 R. B. Huey et al. Tropical forest lizards can’t take the heat
on 23 April 2009rspb.royalsocietypublishing.orgDownloaded from
richness of behavioural and physiological data, as well as
information on phylogenetic relationships, are unsurpassed
for ectotherms and permit the first physiologically and
phylogenetically based assessment of latitudinal patterns in
the performance consequences of global warming.
We first conducted a comparative, macrophysiological
analysis (Chown et al. 2004) of thermoregulatory
behaviour and thermal sensitivity of lizards as a function
of latitude. Then we focused on several Puerto Rican
lizards. Using field Tb data collected several decades ago as
a temporal baseline, as well as data on the thermal
sensitivity of sprinting, we simulated how warming should
affect both lizard Tb and relative performance during
summer (Huey 1983). These complementary analyses use
different approaches but lead to the same conclusion:
some tropical forest lizards ‘can’t take the heat’. Moreover,
theoretical models yield this same conclusion (Deutsch
et al. 2008; Kearney et al. 2009). Given the huge diversity
of ectotherms in the tropics, the implications of these
consistent patterns are daunting.
2. MATERIAL AND METHODS(a) Macrophysiological analyses
Data on mean values of CTmin, CTmax, To, Tb (of active
lizards), habitat associations, basking behaviour and absolute
latitude were compiled from the literature (see tables 1 and 2
in the electronic supplementary material). To minimize
methodological noise (Chown et al. 2003; Ives et al. 2007),
we analysed only species for which the thermal dependence of
sprint speed had been quantified. Most studies (63 out of 70)
were done by us, our students or our close colleagues; thus,
protocols were uniform by comparative standards.
We include independent field data on habitat association
(forest and open), thermoregulatory behaviour (basking and
non-basking), Tb and Ta for lizards from 12 neotropical sites
(available as table 2b in the electronic supplementary material).
Most sites were approximately 1.5!1.5 km. These field data
were collected by a single team of investigators (Vitt et al.
2008), and thus methods were consistent.
To evaluate an association of absolute latitude, taxonomic
affinity and basking behaviour with the physiological traits,
we computed (multiple) regressions involving the three
independent variables and their interactions. Phylogenetic
relationships were considered, and the tree (and sources) is
available in table 3 in the electronic supplementary material.
We computed regressions in three ways (reviews in
Garland et al. 2005; Lavin et al. 2008): conventional (non-
phylogenetic) ordinary least squares (OLS); phylogenetic
generalized least squares (PGLS); and regression in which
residuals were modelled as having evolved via an Ornstein–
Uhlenbeck process (RegOU), thus mimicking stabilizing
selection. These three models form a continuum between
assuming a star phylogeny with no hierarchical structure
(OLS), a phylogeny as specified by the user (PGLS) and
something that can take on values intermediate between the
star and the specified hierarchical phylogeny (RegOU)
(Garland et al. 2005). Candidate-independent variables
included absolute latitude, a 0–1 dummy variable to code
for non-basking versus basking and a series of dummy
variables to code for ‘family’ membership (Lavin et al.
2008). Details of analysis and model comparisons are
described in the electronic supplementary material.
Proc. R. Soc. B (2009)
(b) Focal species analyses of Puerto Rican lizards
Extensive field and laboratory data for several Puerto
Rican lizards enable us to describe the thermal biology of
these lizards several decades ago, and then to predict how
warming will affect their Tb and relative sprint performance.
Details of methods are given in the electronic supplementary
material. Field data on Tb and Ta, laboratory thermal
preference (Tp), CTmax and CTmin for Anolis cristatellus from
Punta Salinas were collected in July 1973 (Huey 1974; Huey &
Webster 1976). Thermal sensitivities of sprint speed were for
lizards from this population collected in 1981 (Huey 1983).
The preferred temperature range is arbitrarily delimited by the
central 50 per cent of all Tp records (Hertz et al. 1993).
Field data for Tbs and operative temperatures (Te) were
obtained for A. cristatellus at San German in August 1983
(Hertz 1992). Tes were obtained using a randomly placed
array of 60 hollow electroformed copper models (calibrated
against live lizards) that match the size and reflectivity of
adults. Thermal preference shows no significant geographical
variation (Huey & Webster 1976), and so we used Tps from
Punta Salinas.
Field data for Tb and Ta of Anolis gundlachi from El Verde
were obtained in July 1972, and Tp were obtained in 1973
(Huey & Webster 1976). Long-term weather records are
available for this site (http://luq.lternet.edu/data/lterdb16/
data/evtemp.htm), enabling us to estimate the actual shift in
mean July maximum temperature from 1975 to 2008. The
predicted shift in Ta was 2.18C (see figure 1 in the electronic
supplementary material).
Field data for lowland populations of diurnal geckos
(Sphaerodactylus spp.) were obtained in 1988–1991 (Alvarez
1992; table 2h in the electronic supplementary material).
Basic techniques for obtaining Tbs and Tes followed Hertz
(1992), except that small polyvinyl chloride cylinders (nZ27)
were used to estimate Tes.
3. RESULTS AND DISCUSSION(a) Natural history, phylogeny and latitude
Basic natural history and phylogenetic issues lay a critical
foundation for understanding latitudinal patterns of lizard
thermal biology. Over four decades ago, Ruibal (1961)
noted that temperate and tropical lizards (diurnal) differ in
habitat use, thermoregulatory behaviour and Tb. Almost
all temperate-zone lizards are restricted to open habitats
where operative temperatures (Tes) are high and suffi-
ciently heterogeneous to enable thermoregulation (Porter
et al. 1973; Bakken 1989): most species bask, thermo-
regulate relatively carefully and maintain high Tb that are
often well above associated Ta (Porter et al. 1973; Huey
1982; van Berkum 1988). (The few exceptions are
cryptozoic species that infrequently emerge from cover
(see below).)
Some tropical and subtropical lizards also live in open
habitats and generally share behavioural and physiological
characteristics (e.g. basking behaviour, elevated Tb) with
high-latitude species living in open habitats (Ruibal 1961;
Porter & James 1979; van Berkum 1988; Vitt et al. 1998).
However, many other tropical and subtropical lizards live
below the canopy inside deeply shaded forests (Inger
1959; Ruibal 1961; Huey 1982), where Tes are relatively
low and homogeneous (Hertz 1992), making thermo-
regulation difficult or expensive (Huey 1974). In fact,
these tropical forest lizards rarely bask and are active at

Tropical forest lizards can’t take the heat R. B. Huey et al. 1941
on 23 April 2009rspb.royalsocietypublishing.orgDownloaded from
relatively low Tbs that are necessarily close to air
temperatures (Inger 1959; Ruibal 1961; Huey 1982),
because convection dominates heat exchange in such
habitats (Bakken 1992).
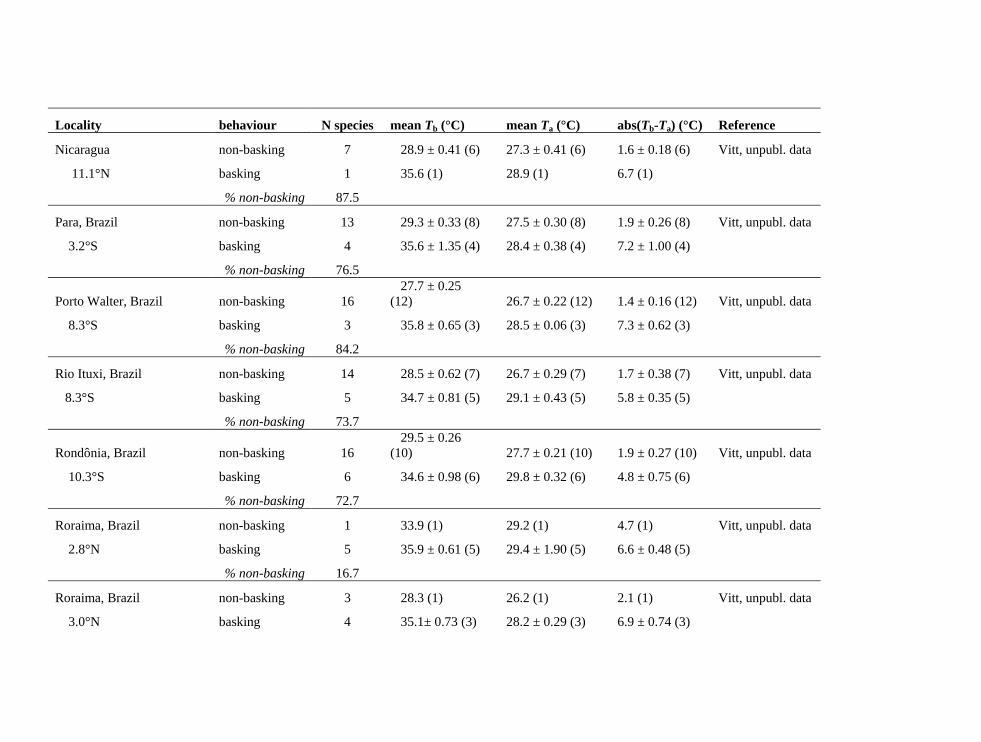
In the neotropics, non-basking (forest) species often
outnumber basking (open-habitat) species at lowland sites
with mixed forest and open habitats (see table 2b in the
electronic supplementary material). Thus, non-basking
species constitute a major component of the diversity of
neotropical lizards. In fact, these species constitute an
average of 62 per cent of 63 species at 12 sites from
Nicaragua to Brazil (see table 2b in the electronic
supplementary material).
Close associations among habitat, basking behaviour
and Tb are evident for neotropical species (see table 2b in
the electronic supplementary material). Of the species
found in forests, only 1 out of 40 was basking. Of the
species in open or edge habitats, 21 out of 24 were
basking. Importantly, activity Tbs of tropical forest lizards
averaged 68C lower than that of tropical open-habitat
lizards (t-test, p/0.001, 28.9G0.318C (nZ38) and
34.9G0.518C (nZ20)).
These linkages appear to have phylogenetic and latitu-
dinal components. Different neotropical lineages tend
to comprise either predominately forest-dwelling, non-
basking and low Tb species or open-edge dwelling, basking
and high Tb species (see table 2a in the electronic
supplementary material). (Note: these families show
significant heterogeneity in percentages of basking and
forest-dwelling species (non-phylogenetic c2-tests, both
p!0.01).) Moreover, lineages in the tropics that include
predominately forest-dwelling and low Tb species (e.g.
diurnal Gekkonidae, Gymnophthalmidae, Polychrotidae)
are largely restricted to tropical and subtropical regions,
whereas lineages with a preponderance of open-habitat
species and higher Tb species (e.g. Teiidae) often extend
into the temperate zone.
Overall, most temperate-zone lizards are baskers,
whereas tropical species can be either baskers on non-
baskers. Moreover, these different ‘thermal syndromes’
tend to run in families. Exceptions do exist. A few
temperate lineages are cryptozoic and have low Tb
(e.g. Anguidae: Kingsbury 1994; Xantusiidae: Mautz
et al. 1992; some Scincidae: Bennett & John-Alder 1986;
Shine 1999). Also, some tropical families and species
(e.g. A. cristatellus) include both types. However, we
are confident that these trends are general, at least for
New World lizards.
(b) Field body temperatures
Early workers, who apparently expected that tropical
lizards would have relatively high Tb simply because
lowland tropical sites are always warm, were surprised
to find that some tropical species were in fact active at
Tbs well below those of most temperate-zone species
(Brattstrom 1965). We evaluated field Tbs for species from
diverse latitudes (figure 1c). In an ordinary least-squares
analysis, which assumes a star phylogeny (Garland et al.
1992), Tb increased with latitude (two-tailed pZ0.0145;
see table 2c in the electronic supplementary material).
However, field Tb showed a strong phylogenetic signal
(Blomberg et al. 2003; pZ0.007), and the best-fit
regression model (RegOU) for Tb excluded latitude but
included basking and family membership. Thus, the
Proc. R. Soc. B (2009)
non-phylogenetic trend probably stems from the many
non-basking, low Tb species in the tropics.
(c) Lizard thermal sensitivity
In the OLS regression, CTmin decreased with absolute
latitude (p/0.001; figure 1d; see table 2d in the
electronic supplementary material). Phylogenetic signal
for CTmin was significant ( p!0.001), and absolute
latitude was the only variable in the best-fit model
(RegOU). As in the non-phylogenetic analysis, CTmin
declined with latitude.
Optimal sprint temperature (To; figure 1b) and heat
tolerance (CTmax; figure 1d ) shared similar patterns.
In OLS, both variables increased with latitude (both
p/0.001; see table 2e, f in the electronic supplementary
material). Both traits showed strong phylogenetic signal
( p/0.001), and the best-fit models (OLS) showed that
To and CTmax are elevated for basking species versus non-
baskers and differ among taxa. As with Tb, the
non-phylogenetic trend with latitude may be a conse-
quence of the tropical concentration of non-basking taxa.
Note that Tb, To and CTmax appear independent of
latitude but are associated with basking behaviour and
with taxon, whereas CTmin is independent of basking
and taxon and depends only on latitude. These contrasting
associations might reflect differential effectiveness of
behaviour in buffering climate-associated selection on
these thermal traits (van Berkum 1988). When active,
a thermoregulating lizard in an open habitat at any latitude
can usually achieve some control over its Tb and can
simultaneously avoid stressfully high temperatures.
Consequently, mean Tb (herein) and also maximal Tb
(van Berkum 1988, p. 335) are generally independent of
latitude (but see, Clark & Kroll 1974), but do tend to
show strong phylogenetic conservatism (Huey 1982;
Hertz et al. 1983) and a strong association with habitat
and basking behaviour (herein, Ruibal 1961; Clark &
Kroll 1974). Because Tb, To and CTmax are likely to be
co-adapted traits (Huey & Bennett 1987; Huey &
Kingsolver 1993; Angilletta et al. 2006; Martin & Huey
2008; Angilletta 2009), we are not surprised that these
thermal traits were closely associated with phylogenetic
affinities and basking behaviour.
By contrast, a lizard hibernating at high latitude in a
winter refuge has relatively few options for behavioural
thermoregulation. Consequently, temperatures of high-
latitude lizards in winter (and CTmin) should decline
with latitude (van Berkum 1988; Kearney et al. 2009).
Thus, thermoregulatory behaviour may buffer selection
(Bogert 1949; van Berkum 1988; Huey et al. 2003) on
some thermal traits (e.g.Tb, CTmax), but not on all (CTmin).
(d) Some tropical lizards have narrow thermal
safety margins
Whether climate warming is detrimental depends not only
on the heat tolerance of species (i.e. on To and CTmax) but
also on whether current Tes (Roughgarden et al. 1981;
Bakken 1992) are already high relative to an ectotherm’s
To (Tracy & Christian 1983; Huey 1991; Deutsch et al.
2008). If Tes in shaded microenvironments are below an
ectotherm’s To and if shade is readily accessible,
ectotherms confronting climate warming can find thermal
refugia and thus remain active (Kearney et al. 2009).
However, if Tes in shade are currently equal to or greater

10 20 30 40 50
0
5
–5
10
15
20
25
latitude (°N or °S)
ther
mal
saf
ety
mar
gin
(°C
)
Figure 2. Thermal safety margin (ToKTa,max) for diurnallizards increases with latitude. Open circles, basking species;filled circles, non-basking species. In a phylogeneticanalysis, thermal safety margin increases with latitude. Thetropical species with a large safety margin (Sceloporusmagister) is montane.
tem
pera
ture
(°C
)(a)
(b)
(c)
(d)
30
40
50
30
40
0
10
20
30
40
10 20 30 40 50
latitude (°N or °S)
Figure 1. Thermal sensitivity of diurnal lizards versuslatitude. (a) Heat tolerance (CTmax), (b) optimal sprinttemperature (To), (c) mean-field body temperature (Tb) and(d ) cold tolerance (CTmin) versus latitude. In phylogeneticanalyses, CTmax, To and Tb are independent of the latitudebut are relatively low for certain taxa and for non-baskingspecies, especially tropical ones (black circles; see text); bycontrast, CTmin decreases with latitude. The four pointsfor non-baskers and mid-latitude are cryptozoic species(see text). Points for non-baskers are offset and shifted by0.58 latitude to increase spread (see data in table 1 in theelectronic supplementary material).
1942 R. B. Huey et al. Tropical forest lizards can’t take the heat
on 23 April 2009rspb.royalsocietypublishing.orgDownloaded from
than an ectotherm’s To, climate warming will force
ectotherms to retreat below ground or tolerate activity at
a high Tb (Dunham 1993), which will probably induce
stress and reduce performance (Huey 1983). If time
restrictions and performance declines are substantive, the
population might go extinct (Dunham 1993; Kearney
et al. 2009).
We quantified potential access to an above-ground
thermal refuge by computing a ‘thermal safety margin’,
which is the difference between a lizard’s To for sprinting
and the maximal Te in shade (Deutsch et al. 2008). Ideally,
shade Te should be calculated for lizards on a global scale
(Kearney et al. 2009), but here we substituted mean
maximal daytime air temperature (Ta,max) during the
warmest three months of the year (New et al. 2002).
Ta,max will closely approximate the maximal average Te for
Proc. R. Soc. B (2009)
small ectotherms in shade (Rogowitz 1996), because
convection dominates heat exchange in shade (Bakken
1992). Of course, Ta,max underestimates the maximal Te in
open microhabitats. Nevertheless, the issue here is whether
lizards facing climate warming can access thermal refuges
(Kearney et al. 2009), and thus Ta,max is a relevant index.
Thermal safety margins showed only a weak phylo-
genetic signal ( pZ0.09). OLS regression was the best-fit
model (see table 2g in the electronic supplementary
material), and safety margin increased with latitude and
basking (figure 2). Thermal safety margins are thus
small—and sometimes even slightly negative—for most
tropical forest lizards. Because these forest species live in
already warm environments, but have low Tb, To and
CTmax, even a small increase in Te may force them to
reduce activity time (Kearney et al. 2009) or to suffer
reduced performance in summer. Thus, tropical forest
lizards may not be able to ‘take the heat’.
By contrast, many higher latitude or high-altitude
species will not need to retreat if Te in shade increases
with climate warming; rather, these species may even
benefit (Kearney & Porter 2004; Chamaille-Jammes et al.
2007; Buckley 2008; Kearney et al. 2009) because
warming will improve the thermal quality of their habitat
(Tracy & Christian 1983; Huey 1991; Hertz et al. 1993).
Of course, some diurnal species (Dunham 1993) living in
mid-latitude deserts (and cryptozoic species) also have
small safety margins (figure 2), and these may also suffer
from warming.
(e) Lizards in lowland Puerto Rico are already
at risk
The latitudinal pattern of thermal safety margins (figure 2)
suggests that lizards in tropical forests might be relatively
vulnerable to climate warming in summer. However, such
a macrophysiological approach ignores heterogeneity of
microclimates and thermoregulatory behaviour. To add
a biophysically and physiologically grounded approach,
we analyse data for several lizards from Puerto Rico.
Anolis cristatellus is an abundant and widespread
species, and its thermal biology is well known (e.g. Rand
1964; Huey & Webster 1976; Gorman & Hillman 1977;
Hertz 1992). In shaded lowland habitats, this species lives

rela
tive
perf
orm
ance
0.3
0.4
0.5
0.6
0.7
0.8
0.9
1.0(b)
25
30
35bo
dy te
mpe
ratu
re (
°C)
(a)
rela
tive
perf
orm
ance
06.00 10.00 14.00 18.00
0.3
0.4
0.5
0.6
0.7
0.8
0.9
1.0
time of day (h)
(d )
25
30
35
time of day (h)
body
tem
pera
ture
(°C
)
06.00 10.00 14.00 18.00
(c)
Figure 3. Impact of climate warming on Tb and performance of a tropical lizard. (a) Body temperature and (b) predictedrelative sprint performance of A. cristatellus in a shaded forest at Punta Salinas, Puerto Rico before (grey boxes, 1973) and after(red boxes) predicted climate warming (air temperature increase of 38C). (c) Body temperature and (d ) predicted relativesprint performance of A. cristatellus in a forest at San German, Puerto Rico, before (1983–1984) and after predicted warming(TaZC38C). In (a, c), the shaded grey rectangle delimits the preferred temperature range of this species, and the red dashed lineindicates the CTmax (Huey & Webster 1976). Box plots depict the median, interquartile range and range.
time of day (h)06.00 09.00 12.00 15.00
22
24
26
28
30
body
tem
pera
ture
(°C
)
18.00
Tb measured in 1972
Tb predicted in 2008
Tp A. gundlachi
Tp A. cristatellus
Figure 4. Predicted impact of recent climate warming on atropical forest lizard. Observed climate warming between 1972and 2008 (see figure 1 in the electronic supplementary material)is likely to make forest habitats (El Verde, Puerto Rico) lesssuitable in summer for resident forest species but more suitablefor an open-habitat species. Tbs of the forest species(A. gundlachi ) in July 1972 are shown in grey boxes, and mostTbs were close to theTp range of this species (lower shaded greyrectangle). By 2008, observed warming of 2.18C at El Verdeshould have elevated predicted Tb of lizards in the forest(red boxes). These predicted Tb are much higher thanthose preferred by A. gundlachi, but should now be close tothe preferred temperatures (upper shaded red rectangle) ofA. cristatellus, which was restricted to open habitats in 1972.If warming continues,A. cristatellus could displaceA. gundlachi.
Tropical forest lizards can’t take the heat R. B. Huey et al. 1943
on 23 April 2009rspb.royalsocietypublishing.orgDownloaded from
on tree trunks, does not bask and is a thermoconformer,
such that Tb closely matches Ta, and thus Te (Huey 1974;
Hertz 1992; see details of methods in the electronic
supplementary material). It will bask in open lowland
habitats, but only very early and late in the day (Huey
1974; Hertz 1992). Similar to other anoles (van Berkum
1988), it is relatively intolerant of high Tb (see table 1 in
the electronic supplementary material).
Body and air temperatures and behaviour of
A. cristatellus were monitored in summer approximately
35 years ago (1972 and 1973) at Punta Salinas on the
northern coast (Huey 1974; Huey & Webster 1976), and
we use the 1973 data as a temporal baseline. In a dense
forest, these lizards were classic thermoconformers
(figure 3): they were active from sunrise to sunset; had
no opportunity to bask; and had Tbs that averaged only
0.6G0.058C above Ta (Huey 1974; Huey & Webster
1976). This habitat was thermally suitable for this
species: even without thermoregulating, lizards had Tbs
that usually fell within the Tp range (figure 3a) and that
enabled them to sprint at greater than 90 per cent of their
maximal speed from sunrise to sunset (figure 3b).
To estimate the impact of climate warming on
A. cristatellus over the next 100 years, we conservatively
assume that Ta will increase by 38C above levels measured
in the early 1970s (Malhi & Wright 2004; IPPC 2007).
Proc. R. Soc. B (2009)

1944 R. B. Huey et al. Tropical forest lizards can’t take the heat
on 23 April 2009rspb.royalsocietypublishing.orgDownloaded from
Because convection dominates heat exchange in forests,
Tb will also increase by approximately 38C. As a result,
lizards will have elevated Tb (red boxes in figure 3a) that
exceed Tp for most of the day, and their predicted
sprint performance should be lower for most of the
day (figure 3b).
Additional data (figure 3c) were collected for this
species approximately 25 years ago (1983) at San
German, a lowland forested site (90 m) on the warmer,
southwestern side of Puerto Rico (Hertz 1992). Here,
A. cristatellus were again active from sunrise to sunset and
were thermoconformers. Their Tbs averaged only
0.6G0.098C above the mean Te of their habitat. During
most of the day, Tb and Te were within the lizard’s
preferred temperature range, and only 20.8 per cent of Tb
(and 7.8% of Te) exceeded that range. If Te increases by
38C, 68.6 per cent of all predicted Tb records (and 70.6%
of all Te) should exceed the lizard’s preferred range
(figure 3c). In fact, 92.1 per cent of all Te should exceed
the preferred range during midday (10.00–14.00 hours).
Moreover, relative sprint performance at midday should
decline precipitously (figure 3d ).
Thermal data are also available for several species of
the diurnal ground gecko, Sphaerodactylus, studied in
1988–1991 (Alvarez 1992). These geckos typically inhabit
leaf litter. In cool seasons or at high altitude, these geckos
sometimes bask; but in lowland forests, they rarely do so
(Alvarez 1992). Similar to Anolis, these lizards are
relatively intolerant of high temperatures: most have a
CTmax below 408C and a Tp only approximately 308C
(see table 2h in the electronic supplementary material).
In 1991, lowland populations of four species were already
living in environments that were stressfully warm in
summer; in fact, mean Te exceeded mean Tp and mean
To by 3.2G1.06 and 5.1G0.708C, respectively. As a
consequence, mean Tb during the day in summer (across
species) exceeded mean Tp by 2.1G0.438C on average and
exceeded To for sprinting by 3.9G1.168C on average
(see table 2h in the electronic supplementary material).
If Te increases by 38C because of climate warming, these
lizards will probably experience severe heat stress because
mean Te over the day in summer will be only 3.5G0.908C
below the CTmax of these lizards.
Although climate warming may well stress Puerto
Rican lizards in summer, it should benefit them in winter,
as the slightly lower temperatures then depress reproduc-
tion (Gorman & Licht 1974; Lister 1981). Therefore,
a full demographic model will be necessary to evaluate the
overall effects of warming. However, because thermal
fitness curves are asymmetric (Gilchrist 1995; Huey &
Berrigan 2001), being ‘too hot’ is likely to be much worse
physiologically than being ‘too cold’.
(f ) Cascading effects of warming on ecological
interactions
Climate warming will not only induce thermal stress in
tropical forest lizards, but also probably force them to
suffer increased competition and predation from warm-
adapted, open-habitat lizards. Some open-habitat high-Tb
lizards, such as Ameiva festiva (Costa Rica), make periodic
forays into shaded forest habitats to search for food.
However, they must soon return to the open to bask
(van Berkum et al. 1986). As climate warming elevates Te
inside forests, A. festiva will cool more slowly, forage
Proc. R. Soc. B (2009)
longer and thus put increased competitive and predatory
pressures on forest lizards (Vitt et al. 1998).
Climate warming may even enable open-habitat species
to displace tropical forest species. In the early 1970s at El
Verde, Puerto Rico (approx. 350 m), A. gundlachi
was a forest-dwelling, non-basking species, whereas
A. cristatellus was restricted to open and edge habitats.
Relative to A. cristatellus, A. gundlachi had a significantly
lower field Tb (figure 4), Tp and CTmax (Huey & Webster
1976; Hertz 1992; Rogowitz 1996).
In July 1972, the thermal environment inside the forest
at El Verde was highly suitable for A. gundlachi (Huey &
Webster 1976); indeed, 74.7 per cent of all Tbs during the
entire day (figure 4) were within 18C of the Tp range for
this species, and only 4.5 per cent of Tbs were 18C or more
above its Tp range. By contrast, forest Tes would have been
too cool for A. cristatellus (Gorman & Hillman 1977);
95.5 per cent of all predicted Tbs in summer would have
been at least 18C below its Tp range (figure 4).
The observed 2.18C climate warming in summer since
1975 (see figure 1 in the electronic supplementary
material) should have made the forest less suitable
thermally for A. gundlachi in that season. Only
39.6 per cent of its predicted Tbs should now be within
18C of its Tp range, and 60.3 per cent should be at
least 18C warmer than its Tp range, suggesting likely heat
stress. By contrast, 60.4 per cent of predicted Tb of
A. cristatellus should now be within 18C of its Tp range
(figure 4). Therefore, if warming continues, A. cristatellus
might soon move into the forest, at least during summer,
and potentially even displace A. gundlachi.
4. CONCLUDING REMARKSBoth macrophysiological (figures 1 and 2) and focal
species (figures 3 and 4) approaches suggest that lowland
lizards living in neotropical forests are at risk from climate
warming; in fact, some species are probably already
experiencing body temperatures at or above their physio-
logical optima, at least in summer (figures 3 and 4; see
table 2h in the electronic supplementary material). The
cascading effects of increased competition and predation
from open-habitat species will only compound problems
for forest species and may have major effects on tropical
forest food webs. Moreover, performance of some
species may have already been harmed by recent climate
warming (figure 4).
Other studies have raised concern for the vulnerability
of tropical ectotherms (e.g. Parsons 1989; Pounds et al.
1999; Root et al. 2003; Parmesan 2007; Colwell et al.
2008; Deutsch et al. 2008; Raxworthy et al. 2008;
Williams et al. 2008; Kearney et al. 2009). Moreover,
population declines of lowland forest lizards in Costa Rica
have already been noted (Whitfield et al. 2007). Because
lowland tropical forests are centres of biodiversity, these
predictions and trends are disturbing.
A reviewer of a draft of this paper felt that we have taken
a ‘pessimistic stance’. We disagree. To be sure, physio-
logical acclimation could potentially buffer the impact of
climate warming (Chown & Terblanche 2007). However,
the few available data suggest that tropical forest
ectotherms—including Puerto Rican Anolis (Rogowitz
1996)—show limited acclimation responses (Brattstrom
1968; Feder 1982; Tsuji 1988; Ghalambor et al. 2006).

Tropical forest lizards can’t take the heat R. B. Huey et al. 1945
on 23 April 2009rspb.royalsocietypublishing.orgDownloaded from
Similarly, genetic adaptation could potentially buffer the
impact (Hoffmann & Blows 1993; Travis & Futuyma
1993; Angilletta 2009), and rapid response to temperature
in selection experiments is common in invertebrates
(Santos et al. 2005). Nevertheless, artificial selection on
heat tolerance of a fish was unsuccessful (Baer & Travis
2000). Unfortunately, the heritability of thermal traits in
lizards is essentially unstudied (Sinervo 1990; Angilletta
2009). In any case, conservatism seems to be the rule in
lizard thermal evolution (Hertz et al. 1983; Huey & Bennett
1987). Thus, adaptive rescue is feasible but unlikely.
For some species, thermoregulatory behaviour will
effectively buffer the impact of climate warming (Huey
et al. 2003; Angilletta 2009; Kearney et al. 2009). For
example, many desert lizards readily evade heat stress by
retreating underground during warm periods (Porter et al.
1973; Stevenson 1985). By contrast, tropical forest
lizards, such as Anolis and Sphaerodactylus, have relatively
few thermoregulatory options because forest Tes are
relatively homogeneous in space and time (Hertz 1992);
the ‘thermal mosaic’ for such forest species is relatively
monochromatic. Populations with access to a mountain
could potentially migrate uphill (Colwell et al. 2008;
Raxworthy et al. 2008; Chen et al. 2009), but the largest
remaining tropical rainforest (Amazon basin) has moun-
tains only on one edge.
The biotic pressure of open-habitat species on forest
ectotherms will be exacerbated if climate change also
opens tropical forest canopies (Clark et al. 2003; Feeley
et al. 2007; Whitfield et al. 2007); more solar radiation will
penetrate the forest, thus increasing Te. Canopy opening
will also reduce humidity and increase wind speed,
harming ectotherms sensitive to desiccation (Parsons
1989; Pounds et al. 1999). More importantly, deforesta-
tion and fragmentation will directly accelerate extinction
rates (Brook et al. 2003; Ferraz et al. 2003) as well as
increase hot edge environments (Vitt et al. 1998).
Of course, climate warming would not be physiologically
detrimental to all tropical forest lizards. Some species living
in cool montane forests should benefit (Huey & Webster
1976; Hertz 1992; Hertz et al. 1993). Also, even lowland
species may benefit during cool seasons, when Tes and Tbs
are slightly lower (Lister 1981; Hertz 1992) and reproduc-
tion is reduced (Gorman & Licht 1974; Lister 1981).
Similarly, some high-latitude species may benefit because
warmer temperatures will increase potential activity
times and growth rates (Kearney & Porter 2004;
Chamaille-Jammes et al. 2007; Buckley 2008; Deutsch
et al. 2008; Kearney et al. 2009).
Our prediction that neotropical forest lizards are
vulnerable to climate warming can be evaluated in future
studies. One predictive approach develops biophysical,
physiological and demographic models that transduce
predicted climate change onto changes in vital demo-
graphic rates (Dunham 1993; Helmuth et al. 2005;
Crozier & Dwyer 2006; Buckley 2008). Kearney et al.
(2009) have recently made a major step in this direction.
Our conclusions are remarkably consistent with theirs: the
primary challenge for temperate-zone ectotherms is
gaining heat, but that for tropical ectotherms is avoiding it.
A complementary approach involves field studies: if
lowland forest populations are indeed currently heat
stressed in summer (figures 3 and 4), those populations
should now show reduced rates of growth and
Proc. R. Soc. B (2009)
reproduction in summer, relative to cooler seasons (or
preferably to earlier decades). Ultimately, time-series
monitoring of population ecology (Chamaille-Jammes
et al. 2007; Whitfield et al. 2007), food resources (Buckley
2008), distributions (Colwell et al. 2008; Raxworthy et al.
2008), Tb, habitat usage and microclimates may be
necessary to evaluate whether lowland tropical forest
lizards are indeed on—and perhaps already even over—the
thermal edge. Field data from earlier decades (e.g. figures
3 and 4; Chen et al. 2009) provide a critical baseline for
monitoring climate-induced changes in temperatures and
performance of tropical lizards.
We dedicate this paper to Rodolfo Ruibal, whose 1961 paperpioneered empirical studies of the thermobiology of tropicalectotherms and whose insights into tropical and temperateectotherms laid the conceptual foundation for this paper.We thank M. Angilletta and M. Kearney for their comments.This study was supported by National Science Foundationgrants to P.E.H., R.B.H., J.J.T., L.J.V. and T.G., and by aProgram on Climate Change Fellowship to C.A.D. El Verdetemperature data were provided courtesy of the LuquilloExperimental Forest (LTER).
REFERENCESAlvarez, H. J. 1992 Thermal characteristics of Sphaerodactylus
species in Puerto Rico and their implications for thedistribution of species in Puerto Rico. San Juan, PR:University of Puerto Rico.
Angilletta, M. J. 2009 Thermal adaptation: a theoretical andempirical synthesis. Oxford, UK: Oxford University Press.
Angilletta Jr, M. J., Niewiarowski, P. H. & Navas, C. A. 2002The evolution of thermal physiology in ectotherms.J. Therm. Biol. 27, 249–268. (doi:10.1016/S0306-4565(01)00094-8)
Angilletta Jr, M. J., Bennett, A. F., Guderley, H., Navas,C. A., Seebacher, F. & Wilson, R. S. 2006 Coadapation:a unifying principle in evolutionary thermal biology.Physiol. Biochem. Zool. 79, 282–294. (doi:10.1086/499990)
Baer, C. F. & Travis, J. 2000 Direct and correlated responsesto artificial selection on acute thermal stress tolerance in alivebearing fish. Evolution 54, 238–244. (doi:10.1111/j.0014-3820.2000.tb00024.x)
Bakken, G. S. 1989 Arboreal perch properties and theoperative temperature experienced by small animals.Ecology 70, 922–930. (doi:10.2307/1941359)
Bakken, G. S. 1992 Measurement and application ofoperative and standard operative temperatures in ecology.Am. Zool. 32, 194–216. (doi:10.1093/icb/32.2.194)
Bennett, A. F. 1980 The thermal dependence of lizardbehaviour. Anim. Behav. 28, 752–762. (doi:10.1016/S0003-3472(80)80135-7)
Bennett, A. F. & John-Alder, H. B. 1986 Thermal relations ofsome Australian skinks (Sauria: Scincidae). Copeia 1986,57–64. (doi:10.2307/1444888)
Blomberg, S. P., Garland Jr, T. & Ives, A. R. 2003 Testing forphylogenetic signal in comparative data: behavioral traitsare more labile. Evolution 57, 717–745. (doi:10.1111/j.0014-3820.2003.tb00285.x)
Bogert, C. M. 1949 Thermoregulation in reptiles, a factorin evolution. Evolution 3, 195–211. (doi:10.2307/2405558)
Brattstrom, B. H. 1965 Body temperatures of reptiles. Am.Midl. Nat. 73, 376–422. (doi:10.2307/2423461)
Brattstrom, B. H. 1968 Thermal acclimation in anuranamphibians as a function of latitude and altitude. Comp.Biochem. Physiol. 24, 93–111. (doi:10.1016/0010-406X(68)90961-4)

1946 R. B. Huey et al. Tropical forest lizards can’t take the heat
on 23 April 2009rspb.royalsocietypublishing.orgDownloaded from
Brook, B. W., Sodhi, N. S. & Ng, P. K. L. 2003 Catastrophic
extinctions follow deforestation. Nature 424, 420–423.
(doi:10.1038/nature01795)
Buckley, L. B. 2008 Linking traits to energetics and
population dynamics to predict lizard ranges in changing
environments. Am. Nat. 171, E1–E8. (doi:10.1086/
523949)
Chamaille-Jammes, S., Massot, M., Aragon, P. & Clobert, J.
2007 Global warming and positive fitness response in
mountain populations of common lizards Lacerta vivipara.
Glob. Change Biol. 12, 392–402. (doi:10.1111/j.1365-
2486.2005.01088.x)
Chen, I.-C., Shiu, H.-J., Benedick, S., Holloway, J. D.,
Chey, V. K., Barlow, H. S., Hill, J. K. & Thomas, C. D.
2009 Elevation increases in moth assemblages over 42
years on a tropical mountain. Proc. Natl Acad. Sci. USA
106, 1479–1483. (doi:10.1073/pnas.0809320106)
Chown, S. L. & Terblanche, J. S. 2007 Physiological diversity
in insects: ecological and evolutionary contexts. Adv.
Insect Physiol. 33, 50–152. (doi:10.1016/S0065-2806
(06)33002-0)
Chown, S. L., Addo-Bediako, A. & Gaston, K. J. 2003
Physiological diversity: listening to the large-scale signal.
Funct. Ecol. 17, 562–572. (doi:10.1046/j.1365-2435.
2003.07622.x)
Chown, S. L., Gaston, K. J. & Robinson, D. 2004
Macrophysiology: large-scale patterns in physiological
traits and their ecological implications. Funct. Ecol. 18,
159–167. (doi:10.1111/j.0269-8463.2004.00825.x)
Clark Jr, D. R. & Kroll, J. C. 1974 Thermal ecology of anoline
lizards: temperate versus tropical strategies. Southwest.
Nat. 19, 9–19. (doi:10.2307/3669786)
Clark, D. A., Piper, S. C., Keeling, C. D. & Clark, D. B. 2003
Tropical rain forest tree growth and atmospheric
carbon dynamics linked to interannual variation during
1984–2000. Proc. Natl Acad. Sci. USA 100, 5852–5857.
(doi:10.1073/pnas.0935903100)
Colwell, R. K., Brehm, G., Cardelus, C. L., Gilman, A. C. &
Longino, J. T. 2008 Global warming, elevational range
shifts, and lowland biotic attrition in the wet tropics.
Science 322, 258–261. (doi:10.1126/science.1162547)
Crozier, L. & Dwyer, G. 2006 Combining population-
dynamic and ecophysiological models to predict climate-
induced insect range shifts. Am. Nat. 167, 853–866.
(doi:10.1086/504848)
Deutsch, C. A., Tewksbury, J. J., Huey, R. B., Sheldon, K. S.,
Ghalambor, C. K., Haak, D. C. & Martin, P. R. 2008
Impacts of climate warming on terrestrial ectotherms
across latitude. Proc. Natl Acad. Sci. USA 105,
6668–6672. (doi:10.1073/pnas.0709472105)
Dunham, A. E. 1993 Population responses to environmental
change: physiologically structured models, operative
environments, and population dynamics. In Biotic
interactions and global change (eds P. M. Kareiva, J. G.
Kingsolver & R. B. Huey), pp. 95–119. Sunderland, MA:
Sinauer Associates.
Feder, M. E. 1982 Environmental variability and thermal
acclimation of metabolism in tropical anurans.
J. Therm. Biol. 7, 23–28. (doi:10.1016/0306-4565(82)
90015-8)
Feeley, K. J., Wright, S. J., Supardi, M. N. N., Kassim,
A. R. & Davies, S. J. 2007 Decelerating growth in tropical
forest trees. Ecol. Lett. 10, 461–469. (doi:10.1111/j.1461-
0248.2007.01033.x)
Ferraz, G., Russell, G. J., Stouffer, P. C., Bierregaard Jr, R. O.
& Pimm, S. L. 2003 Rapid species loss from Amazonian
forest fragments. Proc. Natl Acad. Sci. USA 100,
14 069–14 073. (doi:10.1073/pnas.2336195100)
Proc. R. Soc. B (2009)
Garland Jr, T., Harvey, P. H. & Ives, A. R. 1992 Procedures
for the analysis of comparative data using phylogenetically
independent contrasts. Syst. Biol. 41, 18–32. (doi:10.
2307/2992503)
Garland Jr, T., Bennett, A. F. & Rezende, E. L. 2005
Phylogenetic approaches in comparative physiology.
J. Exp. Biol. 208, 3015–3035. (doi:10.1242/jeb.01745)
Ghalambor, C. K., Huey, R. B., Martin, P. R., Tewksbury,
J. J. & Wang, G. 2006 Are mountain passes higher in the
tropics? Janzen’s hypothesis revisited. Integr. Comp. Biol.
46, 5–17. (doi:10.1093/icb/icj003)
Gilchrist, G. W. 1995 Specialists and generalists in changing
environments. I. Fitness landscapes of thermal sensitivity.
Am. Nat. 146, 252–270. (doi:10.1086/285797)
Gorman, G. C. & Hillman, S. 1977 Physiological basis for
climatic niche partitioning in two species of Puerto Rican
Anolis (Reptilia, Lacertilia, Iguanidae). J. Herpetol. 11,
337–340. (doi:10.2307/1563246)
Gorman, G. C. & Licht, P. 1974 Seasonality in ovarian cycles
among tropical Anolis lizards. Ecology 55, 360–369.
(doi:10.2307/1935223)
Helmuth, B., Kingsolver, J. G. & Carrington, E. 2005
Biophysics, physiological ecology, and climate change:
does mechanism matter? Annu. Rev. Physiol. 67, 177–201.
(doi:10.1146/annurev.physiol.67.040403.105027)
Hertz, P. E. 1992 Temperature regulation in Puerto Rican
Anolis lizards: a field test using null hypotheses. Ecology 73,
1405–1417. (doi:10.2307/1940686)
Hertz, P. E., Huey, R. B. & Nevo, E. 1983 Homage to Santa
Anita: thermal sensitivity of sprint speed in agamid lizards.
Evolution 37, 1075–1084. (doi:10.2307/2408420)
Hertz, P. E., Huey, R. B. & Stevenson, R. D. 1993 Evaluating
temperature regulation by field-active ectotherms: the
fallacy of the inappropriate question. Am. Nat. 142,
796–818. (doi:10.1086/285573)
Hoffmann, A. A. & Blows, M. W. 1993 Evolutionary genetics
and climate change: will animals adapt to global warming?
In Biotic interactions and global change (eds P. M. Kareiva,
J. G. Kingsolver & R. B. Huey), pp. 165–178. Sunderland,
MA: Sinauer Associates.
Huey, R. B. 1974 Behavioral thermoregulation in lizards:
importance of associated costs. Science 184, 1001–1003.
(doi:10.1126/science.184.4140.1001)
Huey, R. B. 1982 Temperature, physiology, and the ecology
of reptiles. In Biology of the Reptilia, vol. 12 (eds C. Gans &
F. H. Pough), Physiology (C), pp. 25–91. London, UK:
Academic Press.
Huey, R. B. 1983 Natural variation in body temperature
and physiological performance in a lizard. In Advances in
herpetology and evolutionary biology: essays in honor of
Ernest E. Williams (eds A. G. J. Rhodin & K. Miyata),
pp. 484–490. Cambridge, MA: Museum of Comparative
Zoology.
Huey, R. B. 1991 Physiological consequences of habitat
selection. Am. Nat. 137, S91–S115. (doi:10.1086/285141)
Huey, R. B. & Bennett, A. F. 1987 Phylogenetic studies of
coadaptation: preferred temperatures versus optimal
performance temperatures of lizards. Evolution 41,
1098–1115. (doi:10.2307/2409194)
Huey, R. B. & Berrigan, D. 2001 Temperature, demography,
and ectotherm fitness. Am. Nat. 158, 204–210. (doi:10.
1086/321314)
Huey, R. B. & Kingsolver, J. G. 1993 Evolution of resistance
to high temperature in ectotherms. Am. Nat. 142,
S21–S46. (doi:10.1086/285521)
Huey, R. B. & Slatkin, M. 1976 Costs and benefits of lizard
thermoregulation. Q. Rev. Biol. 51, 363–384. (doi:10.
1086/409470)

Tropical forest lizards can’t take the heat R. B. Huey et al. 1947
on 23 April 2009rspb.royalsocietypublishing.orgDownloaded from
Huey, R. B. & Webster, T. P. 1976 Thermal biology of
Anolis lizards in a complex fauna: the cristatellus
group on Puerto Rico. Ecology 57, 985–994. (doi:10.2307/
1941063)
Huey, R. B., Hertz, P. E. & Sinervo, B. 2003 Behavioral drive
versus behavioral inertia: a null model approach. Am. Nat.
161, 357–366. (doi:10.1086/346135)
IPPC 2007 Climate change 2007: the physical science basis.
Cambridge, UK: Cambridge University Press.
Inger, R. F. 1959 Temperature responses and ecological
relations of two Bornean lizards. Ecology 40, 127–136.
(doi:10.2307/1929930)
Ives, A. R., Midford, P. E. & Garland Jr, T. 2007 Within-
species variation and measurement error in phylogenetic
comparative methods. Syst. Biol. 56, 252–270. (doi:10.
1080/10635150701313830)
Janzen, D. H. 1967 Why mountain passes are higher in the
tropics. Am. Nat. 101, 233–249. (doi:10.1086/282487)
Kearney, M. & Porter, W. P. 2004 Mapping the fundamental
niche: physiology, climate, and the distribution of a
nocturnal lizard. Ecology 85, 3119–3131. (doi:10.1890/
03-0820)
Kearney, M., Shine, R. & Porter, W. P. 2009 The potential for
behavioral thermoregulation to buffer ‘cold-blooded’
animals against climate warming. Proc. Natl Acad. Sci.
USA. (doi:10.1073/pnas.0808913106)
Kingsbury, B. A. 1994 Thermal constraints and eurythermy
in the lizard Elgaria multicarinata. Herpetologica 50,
266–273.
Lavin, S. R., Karasov, W. H., Ives, A. R., Middleton, K. M. &
Garland Jr, T. 2008 Morphometrics of the avian
small intestine, compared with that nonflying mammals:
a phylogenetic approach. Physiol. Biochem. Zool. 81,
536–550. (doi:10.1086/590395)
Lister, B. C. 1981 Seasonal niche relationships of rain forest
anoles. Ecology 62, 1548–1560. (doi:10.2307/1941511)
Malhi, Y. & Wright, J. 2004 Spatial patterns and recent
trends in the climate of tropical rainforest regions. Phil.
Trans. R. Soc. B 359, 311–329. (doi:10.1098/rstb.2003.1433)
Martin, T. L. & Huey, R. B. 2008 Why suboptimal is
optimal: Jensen’s inequality and ectotherm thermal
preferences. Am. Nat. 171, E102–E118. (doi:10.1086/
527502)
Mautz, W. J., Daniels, C. B. & Bennett, A. F. 1992 Thermal
dependence of locomotion and aggression in a xantusiid
lizard. Herpetologica 48, 271–279.
New, M., Lister, D., Hulme, M. & Makin, I. 2002 A high-
resolution data set of surface climate over global land
areas. Clim. Res. 21, 1–25. (doi:10.3354/cr021001)
Parmesan, C. 2006 Ecological and evolutionary responses to
recent climate change. Annu. Rev. Ecol. Syst. 37, 637–669.
(doi:10.1146/annurev.ecolsys.37.091305.110100)
Parmesan, C. 2007 Influence of species, latitudes and
methodologies on estimate of phenological response to
global warming. Glob. Change Biol. 13, 1860–1872.
(doi:10.1111/j.1365-2486.2007.01404.x)
Parsons, P. A. 1989 Conservation and global warming:
a problem in biological adaptation to stress. Ambio 18,
322–325.
Porter, W. P. & James, F. C. 1979 Behavioral implications
of mechanistic ecology II: the African rainbow lizard,
Agama agama. Copeia 1979, 594–619. (doi:10.2307/
1443867)
Porter, W. P., Mitchell, J. W., Beckman, W. A. & DeWitt, C. B.
1973 Behavioral implications of mechanistic ecology.
Thermal and behavioral modeling of desert ectotherms
and their microenvironment. Oecologia 13, 1–54. (doi:10.
1007/BF00379617)
Proc. R. Soc. B (2009)
Pounds, J. A., Fogden, M. P. L. & Campbell, J. H.1999 Biological response to climate change on atropical mountain. Nature 398, 611–615. (doi:10.1038/19297)
Rand, A. S. 1964 Ecological distribution in anoline lizardsof Puerto Rico. Ecology 45, 745–752. (doi:10.2307/1934922)
Raxworthy, C. J., Pearson, R. G., Rabibisoa, N.,Rakotondrazafy, A. M., Ramanamanjato, J.-B.,Raselimanana, A. P., Wu, S., Nussbaum, R. A. & Stone,D. A. 2008 Extinction vulnerability of tropical montaneendemism from warming and upslope displacement:a preliminary appraisal for the highest massif in Mada-gascar. Glob. Change Biol. 14, 1703–1720. (doi:10.1111/j.1365-2486.2008.01596.x)
Rogowitz, G. L. 1996 Evaluation of thermal acclimation andaltitudinal variation of metabolism in the Neotropicallizard, Anolis gundlachi. Copeia 1996, 535–542. (doi:10.2307/1447517)
Root, T. L., Price, J. T., Hall, K. R., Schneider, S. H.,Rosenzweig, C. & Pounds, J. L. 2003 Fingerprints ofglobal warming on wild animals and plants. Nature 421,37–42. (doi:10.1038/nature01333)
Roughgarden, J., Porter, W. P. & Heckel, D. 1981 Resourcepartitioning of space and its relationship to bodytemperatures in Anolis lizard populations. Oecologia 50,256–264. (doi:10.1007/BF00348048)
Ruibal, R. 1961 Thermal relations of five species oftropical lizards. Evolution 15, 98–111. (doi:10.2307/2405846)
Santos, M., Cespedes, W., Balanya, J., Trotta, V., Calboli,F. C. F., Fontdevila, A. & Serra, L. 2005 Temperature-related genetic changes in laboratory populations ofDrosophila subobscura: evidence against simple climatic-based explanations for latitudinal clines. Am. Nat. 165,258–273. (doi:10.1086/427093)
Shine, R. 1999 Egg-laying reptiles in cold climates:determinants and consequences of nest temperatures inmontane lizards. J. Evol. Biol. 12, 918–926. (doi:10.1046/j.1420-9101.1999.00093.x)
Sinervo, B. 1990 Evolution of thermal physiology and growthrate between populations of the western fence lizard(Sceloporus occidentalis). Oecologia 83, 228–237. (doi:10.1007/BF00317757)
Stevenson, R. D. 1985 The relative importance of behavioraland physiological adjustments controlling body tempera-ture in terrestrial ectotherms. Am. Nat. 126, 362–386.(doi:10.1086/284423)
Tewksbury, J. J., Huey, R. B. & Deutsch, C. A. 2008 Puttingthe heat on tropical animals. Science 320, 1296–1297.(doi:10.1126/science.1159328)
Tracy, C. R. & Christian, K. A. 1983 Ecological relationsamong space, time and thermal niche axes. Ecology 67,609–615. (doi:10.2307/1937684)
Travis, J. & Futuyma, D. J. 1993 Global change: lessons fromand for evolutionary biology. In Biotic interactionsand global change (eds P. M. Kareiva, J. G. Kingsolver &R. B. Huey), pp. 251–263. Sunderland, MA: SinauerAssociates.
Tsuji, J. S. 1988 Thermal acclimation of metabolism inSceloporus lizards from different latitudes. Physiol. Zool. 61,241–253.
van Berkum, F. H. 1988 Latitudinal patterns of the thermalsensitivity of sprint speed in lizards. Am. Nat. 132,327–343. (doi:10.1086/284856)
van Berkum, F. H., Huey, R. B. & Adams, B. 1986Physiological consequences of thermoregulation in atropical lizard (Ameiva festiva). Physiol. Zool. 59, 464–472.
Vitt, L. J., Avila-Pires, T. C. S., Caldwell, J. P. & Oliveira,V. R. L. 1998 The impact of individual tree harvesting on

1948 R. B. Huey et al. Tropical forest lizards can’t take the heat
on 23 April 2009rspb.royalsocietypublishing.orgDownloaded from
thermal environments of lizards in Amazonian rain forest.Conserv. Biol. 12, 654–664. (doi:10.1046/j.1523-1739.1998.96407.x)
Vitt, L. J., Shepard, D. B., Vieira, G. H. C., Caldwell, J. P.,Colli, G. R. & Mesquita, D. O. 2008 Ecology of Anolisnitens brasiliensis in cerrado woodlands of Cantao. Copeia2008, 142–151. (doi:10.1643/CP-06-251)
Walther, G.-R., Post, E., Convey, P., Menzel, A., Parmesan,C., Beebee, T. J. C., Fromentin, J.-M., Hoegh-Guldberg,O. & Bairlein, F. 2002 Ecological responses to recentclimate change. Nature 416, 389–395. (doi:10.1038/416389a)
Proc. R. Soc. B (2009)
Whitfield, S. M., Bell, K. E., Philippi, T., Sasa, M., Bolanos,
F., Chaves, G., Savage II, J. M. & Donnelly, M. A. 2007
Amphibian and reptile declines over 35 years at La Selva,
Costa Rica. Proc. Natl Acad. Sci. USA 104, 8352–8356.
(doi:10.1073/pnas.0611256104)
Williams, S. E., Isaac, J. L. & Shoo, L. P. 2008
The impact of climate change on the biodiversity
and ecosystem functions of the wet tropics. In Living
in a dynamic tropical forest landscape (eds N. E. Stork &
S. M. Turton), pp. 282–294. Malden, MA: Blackwell
Publishing.

Supplementary Tables 2 Table 2a. Summary thermal statistics (mean x± SE) for lineages of lizards studied in the macrophysiological analysis. Region refers to the geographic association of species in our sample, not necessarily for the family as a whole. Predominantly tropical lineages are in boldface. Taxon Region Ntotal Nbask Tb CTmax To CTmin Safety zone Agamidae temperate 3 3 35.5±1.22 45.6±0.79 36.9±0.36 12.2±0.22 10.5±5.48 Anguidae temperate 1 1 21.4 43.6 34.6 12.4 8.3 Cordylidae temperate 1 1 28.8 44.8 33.0 8.9 1.9 Gekkonidae tropical 6 0 29.0±1.34 39.3±0.76 30.3±0.61 11.7±0.33 0.8±0.87 Iguania widespread 13 13 34.8±0.73 43.5±0.50 36.0±0.66 9.5±1.05 4.9±1.50 Lacertidae widespread 16 16 32.4±0.38 43.7±0.47 36.8±0.49 6.2±0.57 9.8±1.01 Polychrotidae tropical 11 4 26.7±0.90 37.2±0.67 29.4±0.61 10.4±0.90 -1.3±0.60 Scincidae widespread 13 11 30.4±1.53 42.1±0.64 34.1±0.59 6.0±0.91 8.1±1.25 Teiidae widespread 3 3 38.2±1.30 44.7±0.48 38.1±0.35 13.0±2.04 10.4±3.35 Xantusiidae widespread 3 0 29.1±3.84 39.6±1.05 31.2±1.15 8.3±1.52 1.3±3.79 Total 70

Table 2b. Field thermal and behavioural data on lizards from specific Neotropical sites. Non-basking species, which occur inside forests, generally outnumber basking species at these sites (8 of 12). Non-basking species always (11 of 11 sites) have lower mean body temperatures (Tb), and always have Tb only slightly elevated above air temperatures Ta (thus small average absolute(Tb – Ta), 11 of 11 sites), as would be expected in shaded forest habitats, where convection dominates heat exchange. Data are mean ± s.e. (N). For details of field methods used by Vitt and colleagues, see Copeia 2008:142-151.
Locality behaviour N species mean Tb (°C) mean Ta (°C) abs(Tb-Ta) (°C) Reference
Amazonas, Brazil non-basking 11 28.4± 0.39 (6) 27.5 ± 0.23 (6) 1.1 ± 0.17 (6) Vitt, unpubl. data
3.3°S basking 5 35.2 ± 1.02 (3) 29.7 ± 0.32 (3) 5.6 ± 0.75 (3)
% non-basking 68.6
Barro Colorado Is., Panama non-basking 19 --- --- --- Rand & Myers 1990
9.1°N basking 6 --- --- ---
% non-basking 76.0 --- --- ---
Belém, Brazil non-basking 10 28.3 ± 0.23 (4) 27.9 ± 0.38 (4) 0.4 ± 0.17 (4)
Crump 1971; Rand & Humphrey 1968
1.5°S basking 11 36.1 ± 1.03 (6) 29.6 ± 0.67 (6) 6.5 ± 0.46
% non-basking 47.6
Caatinga non-basking 2 32.9 ± 0.59 (2) 31.3 ± 1.70 (2) 2.1 ± 0.64 (2) Vitt, unpubl. data
7.5°S basking 8 36.3 ± 0.78 (8) 32.0 ± 0.21 (8) 4.4 ± 1.30 (2)
% non-basking 20.0
Cuyabeno, Ecuador non-basking 14 27.5 ± 0.30 (9) 26.2 ± 0.19 (9) 1.5 ± 0.13 (9) Vitt, unpubl. data
0.0° basking 4 32.7 ± 1.47 (2) 27.9 ± 0.24 (2) 4.8 ± 1.30 (2)
% non-basking 77.8
Locality behaviour N species mean Tb (°C) mean Ta (°C) abs(Tb-Ta) (°C) Reference
Nicaragua non-basking 7 28.9 ± 0.41 (6) 27.3 ± 0.41 (6) 1.6 ± 0.18 (6) Vitt, unpubl. data
11.1°N basking 1 35.6 (1) 28.9 (1) 6.7 (1)
% non-basking 87.5
Para, Brazil non-basking 13 29.3 ± 0.33 (8) 27.5 ± 0.30 (8) 1.9 ± 0.26 (8) Vitt, unpubl. data
3.2°S basking 4 35.6 ± 1.35 (4) 28.4 ± 0.38 (4) 7.2 ± 1.00 (4)
% non-basking 76.5
Porto Walter, Brazil non-basking 16 27.7 ± 0.25
(12) 26.7 ± 0.22 (12) 1.4 ± 0.16 (12) Vitt, unpubl. data
8.3°S basking 3 35.8 ± 0.65 (3) 28.5 ± 0.06 (3) 7.3 ± 0.62 (3)
% non-basking 84.2
Rio Ituxi, Brazil non-basking 14 28.5 ± 0.62 (7) 26.7 ± 0.29 (7) 1.7 ± 0.38 (7) Vitt, unpubl. data
8.3°S basking 5 34.7 ± 0.81 (5) 29.1 ± 0.43 (5) 5.8 ± 0.35 (5)
% non-basking 73.7
Rondônia, Brazil non-basking 16 29.5 ± 0.26
(10) 27.7 ± 0.21 (10) 1.9 ± 0.27 (10) Vitt, unpubl. data
10.3°S basking 6 34.6 ± 0.98 (6) 29.8 ± 0.32 (6) 4.8 ± 0.75 (6)
% non-basking 72.7
Roraima, Brazil non-basking 1 33.9 (1) 29.2 (1) 4.7 (1) Vitt, unpubl. data
2.8°N basking 5 35.9 ± 0.61 (5) 29.4 ± 1.90 (5) 6.6 ± 0.48 (5)
% non-basking 16.7
Roraima, Brazil non-basking 3 28.3 (1) 26.2 (1) 2.1 (1) Vitt, unpubl. data
3.0°N basking 4 35.1± 0.73 (3) 28.2 ± 0.29 (3) 6.9 ± 0.74 (3)

% non-basking 42.9 References: Crump, M. L. 1971 Quantitative analysis of the ecological distribution of a tropical herpetofauna. Occ. Pap. Mus. Nat. Hist. Univ.
Kansas, Lawrence, KS 3, 1-62 Rand, A. S. & Humphrey, S. S. 1968 Interspecific competition in the tropical rain forest: ecological distribution among lizards at
Belém, Para. Proc. U.S. Nat. Mus. 125, 1-17 Rand, A. S. & Myers, C. W. 1990 The herpetofauna of Barro Colorado Island, Panama: an ecological survey. In Four Neotropical
Rainforests (ed. A. H. Gentry), pp. 386-409. New Haven: Yale University Press.

5
Table 2c. Mean field Tb, N = 61 species. Independent Variables
Model d from REML
ln ML Likeli-hood
AIC AICc
AbsLat OLS -176.684 359.367 359.788 PGLS -168.312 342.625 343.046 RegOU 0.7105837 -162.869 333.738 334.452 Bask OLS -165.324 336.647 337.068 PGLS -165.091 336.181 336.602 RegOU 0.6095391 -157.722 323.444 324.158 FamCode1 OLS -153.702 329.404 334.792 PGLS -167.232 356.464 361.852 RegOU 0.3706275 -148.646 321.293 327.793 Bask, AbsLat OLS -165.32 338.640 339.354 PGLS -164.535 337.071 337.785 RegOU 0.6245386 -157.533 325.067 326.157 FamCode1, AbsLat
OLS -153.565 331.129 337.629
PGLS -166.765 357.531 364.031 RegOU 0.88654 -148.638 323.275 331.020 FamCode1, Bask
OLS -143.930 311.860 318.360
PGLS -162.897 349.795 356.295 RegOU 0.2569374 -141.299 308.597 316.342 FamCode1, Bask, AbsLat
OLS -143.898 313.796 321.54
PGLS -162.199 350.398 358.143 RegOU 0.2724039 -141.240 310.479 319.610

6
Table 2d. CTmin, N = 59 species Independent Variables
Model d from REML
ln ML Likeli-hood
AIC AICc
AbsLat OLS -150.362 306.725 307.161 PGLS -158.583 323.165 323.602 RegOU 0.2986203 -144.272 296.544 297.284 Bask OLS -155.614 317.229 317.665 PGLS -162.603 331.205 331.642 RegOU 0.3283983 -148.282 304.565 305.305 FamCode1 OLS -142.658 307.316 312.933 PGLS -162.280 346.560 352.177 RegOU 0.2092041 -139.387 302.775 309.557 Bask, AbsLat OLS -150.266 308.532 309.273 PGLS -158.566 325.133 325.874 RegOU 0.3101080 -144.257 298.515 299.647 FamCode1, AbsLat
OLS -138.257 300.515 307.297
PGLS -158.181 340.362 347.144 RegOU 0.2163928 -135.622 297.243 305.332 FamCode1, Bask
OLS -140.372 304.744 311.526
PGLS -162.200 348.400 355.183 RegOU 0.1496319 -137.634 301.267 309.356 FamCode1, Bask, AbsLat
OLS -136.629 299.258 307.346
PGLS -158.135 342.270 350.359 RegOU 0.1748034 -134.384 296.767 306.313

7
Table 2e. Optimum Tb, To, N = 70. Independent Variables
Model d from REML
ln ML Likeli-hood
AIC AICc
AbsLat OLS -174.043 354.086 354.450 PGLS -168.322 342.644 343.007 RegOU 0.6881707 -161.098 330.197 330.812 Bask OLS -163.029 332.058 332.422 PGLS -167.916 341.832 342.196 RegOU 0.4849774 -156.145 320.290 320.906 FamCode1 OLS -142.579 307.158 311.710 PGLS -168.066 358.133 362.685 RegOU 0.09642502 -141.706 307.412 312.885 Bask, AbsLat OLS -160.579 329.158 329.773 PGLS -167.131 342.263 342.878 RegOU 0.4859982 -156.119 322.238 323.176 FamCode1, AbsLat
OLS -142.579 309.158 314.631
PGLS -167.268 358.535 364.009 RegOU 0.1074314 -141.701 309.402 315.902 FamCode1, Bask
OLS -140.587 305.174 310.647
PGLS -167.321 358.642 364.115 RegOU 0.09033477 -139.898 305.797 312.297 FamCode1, Bask, AbsLat
OLS -140.531 307.062 313.562
PGLS -166.439 358.879 365.379 RegOU 0.1045310 -139.829 307.657 315.294

8
Table 2f. CTmax, N = 70 species Independent Variables
Model d from REML
ln ML Likeli-hood
AIC AICc
AbsLat OLS -165.274 336.547 336.911 PGLS -166.201 338.402 338.765 RegOU 0.5506289 -156.089 320.178 320.793 Bask OLS -153.749 313.498 313.862 PGLS -163.098 332.196 332.560 RegOU 0.3625394 -147.849 303.698 304.313 FamCode1 OLS -141.618 305.237 309.789 PGLS -165.166 352.332 356.884 RegOU 0.1318155 -140.092 304.185 309.659 Bask, AbsLat OLS -149.951 307.903 308.518 PGLS -162.290 332.580 333.196 RegOU 0.2825182 -145.521 301.042 301.980 FamCode1, AbsLat
OLS -140.258 304.515 309.989
PGLS -164.330 352.661 358.134 RegOU 0.1237131 -138.613 303.225 309.725 FamCode1, Bask
OLS -133.872 291.743 297.217
PGLS -162.520 349.041 354.515 RegOU 0.05370689 -132.899 291.798 298.298 FamCode1, Bask, AbsLat
OLS -133.140 292.281 298.781
PGLS -161.738 349.477 355.977 RegOU 0.06321541 -132.075 292.149 299.786

9
Table 2g. Safety margin, N = 70 species Independent Variables
Model d from REML
ln ML Likeli-hood
AIC AICc
AbsLat OLS -217.532 441.065 441.428 PGLS -256.192 518.384 518.747 RegOU e-010 -217.450 442.900 443.515 Bask OLS -216.567 439.133 439.497 PGLS -256.055 518.111 518.475 RegOU e-008 -216.356 440.712 441.327 FamCode1 OLS -207.576 437.152 441.703 PGLS -256.145 534.291 538.842 RegOU e-011 -207.553 439.105 444.579 Bask, AbsLat OLS -212.888 433.776 434.392 PGLS -255.991 519.982 520.598 RegOU e-009 -212.744 435.488 436.426 FamCode1, AbsLat
OLS -207.004 438.007 443.481
PGLS -256.081 536.163 541.636 RegOU e-012 -207.008 440.015 446.515 FamCode1, Bask
OLS -206.527 437.054 442.528
PGLS -255.954 535.908 541.382 RegOU e-011 -206.503 439.007 445.507 FamCode1, Bask, AbsLat
OLS -206.148 438.295 444.795
PGLS -255.898 537.796 544.296 RegOU e-011 -206.148 440.295 447.932

10
Table 2h. Thermal data for species of Sphaerodactylus in Puerto Rico (Álvarez 1992). Tb = mean body temperature (range), Te = mean operative temperature, Tp = preferred body temperature, To = optimal temperature for sprinting, CTmax = critical thermal maximum. Also reported are deviations between various temperatures (e.g., Te – Tp). Mean Tb and Te are usually several degrees above Tp or To, suggesting that these geckos were experiencing above optimal and probably stressful temperatures during the day in summer.
Trait S. roosevelti (Guanica) S. townsendi (Fajardo) S. nicholsi (Guanica)
S. microlepis (Isabela)
Tb 32.8 (28.2-37.5) 31.0 (27.6-35.3) 32.8 (28.2-36.9) 30.3 (28.9-31.8) Te 33.1 36.3 33.1 35.1 Tp 30.2 ± 1.2 30.2 ± 1.5 30.2 ± 1.2 28.1 ± 1.6 To 29.2 ± 1.3 29.6 ± 1.4 29.2 ± 1.4 29.3 ± 1.6
CTmax 39.5 ± 0.8 42.1 ± 0.5 39.5 ± 0.5 39.5 ± 0.5 Deviation Mean
deviation Tb - Tp 2.6 0.8 2.6 2.2 2.1
Tb - To 3.6 1.4 3.6 7 3.9
Te - Tp 2.9 6.1 2.9 1 3.2
Te - To 3.9 6.7 3.9 5.8 5.1

Phylogenetic information General phylogenetic relations follow the supertree for squamate reptiles in Wiens et al. (2006), with additions. Anolis relationships follow Nicholson et al. (2005). Sceloporus follow Leaché (2008). Lacertids follow Fu(2000) and (Oliverio et al. 2000). Skink relationships are uncertain (T. Reeder, 2008 personal communication): we follow Rabosky (2007), but note that other relationships have been proposed for some Australian genera (Reeder 2003; Skinner 2007). Eulamprus relationships follow O’Connor and Moritz (2003). Sphaerodactylus relationships are from Haas (1996) modified by unpublished data (C. Hass, 2008 personal communication). Acknowledgements. We thanks C. Haas, A. Leaché, J. Losos, and T. Reeder for helpful advise on phylogenetic relationships. References: Fu, J. 2000 Toward the phylogeny of the family Lacertidae--Why 4708 base pairs of mtDNA
sequences cannot draw the picture. Biol. J. Linn. Soc 71, 203-217. Haas, C. A. 1996 Relationships among West Indian geckos of the genus Sphaerodactylus: a
preliminary analyssis of mitochondrial 16s ribosomal RNA sequences. In Contributions to West Indian Herpetology: A Tribute to Albert Schwartz (ed. R. Powell & R. W. Henderson), pp. 175-194. Ithaca, N.Y.: Society for the Study of Amphibians and Reptiles.
Leaché, A. D. 2008 Speciation in North American spiny lizards (genus Sceloporus): insights from phylogeny, phylogeography, and hybrid zones. In Integrative Biology. Berkeley: University of California.
Nicholson, K. E., Glor, R. E., Kolbe, J. J., Larson, A., Hedges, S. B. & Losos, J. B. 2005 Mainland colonization by island lizards. J. Biogeogr. 32, 929-938.
O'Connor, D. & Moritz, C. 2003 A molecular phylogeny of the Australian skink genera Eulamprus, Gnypetoscincus and Nangura. Aust. J. Zool. 51, 317-330.
Oliverio, M., Bologna, M. A. & Mariottini, P. 2000 Molecular biogeography of hte Mediterranean lizards Podarcis Wagler, 1830 and Teira Gray, 1838 (Reptilia, Lacertidae). J. Biogeogr. 27, 1403-1420.
Rabosky, D. L., Donnellan, S. C., Talaba, A. L. & Lovette, I. J. 2007 Exceptional among-lineage variation in diversification rates during the radiatin of Australia's most diverse vertebrate clade. Proceedings of the Royal Society B 274, 2915-2923.
Reeder, T. W. 2003 A phylogeny of the Australian Sphenomorphus group (Scincidae: Squamata) and the phylogenetic placement of the crocodile skinks (Tribolonotus): Bayesian approaches to assessing congruence and obtaining confidence in maximum likelihood inferred relationships. Mol. Phylogen. Evol. 27, 384-397.
Skinner, A. 2007 Phylogenetic relationships and rate of early diversification of Australian Sphenomorphus group scincids (Scincoidea, Squamata). Biol. J. Linn. Soc. 92, 347-366.
Wiens, J. J., Brandley, M. C. & Reeder, T. W. 2006 Why does a trait evolve multiple times within a clade? Repeated evolution of snakelike body form in squamate reptiles. Evolution 60, 123-141.

Phylogenetic tree used for analyses. The file below (ALL70.PDI) was produced by the DOS PDTREE.EXE program (Garland et al., 1993, 1999), available on request from Theodore Garland, Jr. (http://www.biology.ucr.edu/people/faculty/Garland/PDAP.html). The program PDDIST.EXE was then used to produce the phylogenetic matrix (ALL70.DSC) used in the Matlab programs PHYSIG_LL.m and REGRESSIONv2.m (Blomberg et al., 2003; Lavin et al., 2008) (http://www.biology.ucr.edu/people/faculty/Garland/PHYSIG.html). 70 A2 $$ 0.0000000000E+00 A3 A2 5.0000000000E+00 A4 A3 9.0000000000E+01 El A4 1.4300000000E+02 A6 A4 5.0000000000E+00 A7 A6 1.3300000000E+02 A8 A7 4.0000000000E+00 LB A8 1.0000000000E+00 Lk A8 1.0000000000E+00 Ts A7 5.0000000000E+00 AC A6 1.5000000000E+01 AD AC 8.3000000000E+01 a1 AD 4.0000000000E+01 AF AD 5.0000000000E+00 AG AF 1.0000000000E+01 tr AG 2.5000000000E+01 AI AG 5.0000000000E+00 Ai AI 2.0000000000E+01 AK AI 5.0000000000E+00 AL AK 1.0000000000E+01 Ah AL 5.0000000000E+00 cu AL 5.0000000000E+00 AO AK 5.0000000000E+00 mu AO 1.0000000000E+01 AQ AO 5.0000000000E+00 li AQ 5.0000000000E+00 Al AQ 5.0000000000E+00 AT AF 2.0000000000E+01 Ag AT 1.5000000000E+01 AV AT 1.0000000000E+01 Ac AV 5.0000000000E+00 ck AV 5.0000000000E+00 AY AC 8.8000000000E+01 AZ AY 5.0000000000E+00 Gw AZ 3.0000000000E+01 Dd AZ 3.0000000000E+01 B2 AY 5.0000000000E+00 Um B2 3.0000000000E+01 B4 B2 2.5000000000E+00 Us B4 2.7500000000E+01 B6 B4 2.5000000000E+00 B7 B6 5.0000000000E+00 B8 B7 5.0000000000E+00 B9 B8 5.0000000000E+00 BA B9 5.0000000000E+00

BB BA 4.0000000000E+00 Su BB 1.0000000000E+00 Sc BB 1.0000000000E+00 BE BA 4.0000000000E+00 So BE 1.0000000000E+00 oc BE 1.0000000000E+00 ch B9 1.0000000000E+01 Sg B8 1.5000000000E+01 BJ B7 1.9000000000E+01 bo BJ 1.0000000000E+00 SM BJ 1.0000000000E+00 Sv B6 2.5000000000E+01 BN A3 5.5000000000E+01 BO BN 6.0000000000E+01 BP BO 1.0300000000E+02 Af BP 1.5000000000E+01 BR BP 5.0000000000E+00 Cm BR 1.0000000000E+01 At BR 1.0000000000E+01 BU BO 3.0000000000E+01 BV BU 4.0000000000E+01 BW BV 3.8000000000E+01 BX BW 5.0000000000E+00 Pa BX 5.0000000000E+00 Ph BX 5.0000000000E+00 C0 BW 5.0000000000E+00 Gy C0 5.0000000000E+00 Gs C0 5.0000000000E+00 C3 BV 4.3000000000E+01 Tp C3 5.0000000000E+00 Tx C3 5.0000000000E+00 C6 BU 4.0000000000E+01 Ae C6 4.8000000000E+01 C8 C6 5.0000000000E+00 C9 C8 1.8000000000E+01 CA C9 5.0000000000E+00 CB CA 1.0000000000E+01 CC CB 5.0000000000E+00 hh CC 5.0000000000E+00 bc CC 5.0000000000E+00 oa CB 1.0000000000E+01 ou CA 2.0000000000E+01 if C9 2.5000000000E+01 CI C8 2.8000000000E+01 Lm CI 1.5000000000E+01 CK CI 5.0000000000E+00 CL CK 5.0000000000E+00 La CL 5.0000000000E+00 Rt CL 5.0000000000E+00 Zv CK 1.0000000000E+01 CP BN 1.6000000000E+01 CQ CP 1.3700000000E+02 CR CQ 1.0000000000E+01 CS CR 1.0000000000E+01 Pb CS 5.0000000000E+00 Pe CS 5.0000000000E+00 CV CR 5.0000000000E+00

Ew CV 1.0000000000E+01 CX CV 5.0000000000E+00 N1 CX 5.0000000000E+00 N2 CX 5.0000000000E+00 D0 CQ 5.0000000000E+00 D1 D0 1.5000000000E+01 Hd D1 5.0000000000E+00 Hp D1 5.0000000000E+00 D4 D0 5.0000000000E+00 D5 D4 5.0000000000E+00 Et D5 1.0000000000E+01 D7 D5 5.0000000000E+00 Ek D7 5.0000000000E+00 Eq D7 5.0000000000E+00 DA D4 5.0000000000E+00 Cr DA 1.0000000000E+01 DC DA 5.0000000000E+00 ta DC 5.0000000000E+00 Cu DC 5.0000000000E+00 DF CP 1.3700000000E+02 Pi DF 2.5000000000E+01 DH DF 1.5000000000E+01 Lf DH 1.0000000000E+01 DJ DH 5.0000000000E+00 Xr DJ 5.0000000000E+00 Xv DJ 5.0000000000E+00 DM A2 2.1800000000E+02 DN DM 5.0000000000E+00 DO DN 5.0000000000E+00 DP DO 5.0000000000E+00 St DP 5.0000000000E+00 Sn DP 5.0000000000E+00 Sk DO 1.0000000000E+01 ga DN 1.5000000000E+01 DU DM 1.5000000000E+01 ml DU 5.0000000000E+00 Sr DU 5.0000000000E+00 El 0E+01 0E+01 LB 0E+01 0E+01 Lk 0E+01 0E+01 Ts 0E+01 0E+01 a1 0E+01 0E+01 tr 0E+01 0E+01 Ai 0E+01 0E+01 Ah 0E+01 0E+01 cu 0E+01 0E+01 mu 0E+01 0E+01 li 0E+01 0E+01 Al 0E+01 0E+01 Ag 0E+01 0E+01 Ac 0E+01 0E+01 ck 0E+01 0E+01 Gw 0E+01 0E+01 Dd 0E+01 0E+01 Um 0E+01 0E+01 Us 0E+01 0E+01

Su 0E+01 0E+01 Sc 0E+01 0E+01 So 0E+01 0E+01 oc 0E+01 0E+01 ch 0E+01 0E+01 Sg 0E+01 0E+01 bo 0E+01 0E+01 SM 0E+01 0E+01 Sv 0E+01 0E+01 Af 0E+01 0E+01 Cm 0E+01 0E+01 At 0E+01 0E+01 Pa 0E+01 0E+01 Ph 0E+01 0E+01 Gy 0E+01 0E+01 Gs 0E+01 0E+01 Tp 0E+01 0E+01 Tx 0E+01 0E+01 Ae 0E+01 0E+01 hh 0E+01 0E+01 bc 0E+01 0E+01 oa 0E+01 0E+01 ou 0E+01 0E+01 if 0E+01 0E+01 Lm 0E+01 0E+01 La 0E+01 0E+01 Rt 0E+01 0E+01 Zv 0E+01 0E+01 Pb 0E+01 0E+01 Pe 0E+01 0E+01 Ew 0E+01 0E+01 N1 0E+01 0E+01 N2 0E+01 0E+01 Hd 0E+01 0E+01 Hp 0E+01 0E+01 Et 0E+01 0E+01 Ek 0E+01 0E+01 Eq 0E+01 0E+01 Cr 0E+01 0E+01 ta 0E+01 0E+01 Cu 0E+01 0E+01 Pi 0E+01 0E+01 Lf 0E+01 0E+01 Xr 0E+01 0E+01 Xv 0E+01 0E+01 St 0E+01 0E+01 Sn 0E+01 0E+01 Sk 0E+01 0E+01 ga 0E+01 0E+01 ml 0E+01 0E+01 Sr 0E+01 0E+01

DETAILS OF METHODS Macrophysiological analyses To quantify the thermal dependence of sprinting, we fit curves (Deutsch et al.
2008) to mean speeds at each Tb interval to curves and estimated the optimal
temperature (To) for sprinting. Most studies used similar protocols. For example,
all estimates of CTmax and CTmin used loss of the righting response as the
endpoint, and most used heating or cooling rates of 0.5°C to 1°C/min. Inevitably,
methodological variation remains (Lutterschmidt & Hutchison 1997; Chown et al.
2008), especially with regard to length and temperatures of acclimation. Such
residual variation should only add noise rather introduce systematic error (van
Berkum 1988; Chown et al. 2003; Ives et al. 2007).
We did not partition data within species by sex because sexes of lizards
rarely differ in field Tb and related measures (Huey & Pianka 2007). Furthermore,
only one study reported sex-specific results for locomotion (Lailvaux et al. 2003).
[For this species we used an un-weighted average of sexes.] Multiple populations
(Garland & Adolph 1991) were sampled for a few species (e.g., Sceloporus
undulatus). For these we included only the two most geographically divergent
populations.
As mentioned in the text, we used three models to look at relationships
involving thermal traits, latitude, basking, and lineage: least squares (OLS),
phylogenetic generalized last squares (PGLS); and regression in which residuals

were modelled as having evolved via an Ornstein-Uhlenbeck process (RegOU).
The RegOU models contains an additional parameter, d, which estimates the
transformation of the phylogenetic branch lengths (Blomberg et al. 2003; Lavin et
al. 2008), and hence its fit can be compared with the OLS or GLS models by a ln
maximum likelihood ratio test, where twice the difference in the ln maximum
likelihood is assumed to be distributed asymptotically as a c2 with 1 d.f., for
which the critical value at a = 0.05 is 3.841. Similar tests were used to compare
the fit of models within the OLS, PGLS or RegOU classes when they contained
nested subsets of independent variables. As a heuristic indicator of model support,
we report the Akaike Information Criterion (AIC), where AIC = (-2 * ln
maximum likelihood) + (2 * # of parameters). Because sample sizes were
relatively small, we also computed the AICc (Burnham & Anderson 2002), which
in all cases gave results consistent with AIC.
When determining the best-fit model from a set of models, nested or not,
we follow Burnham and Anderson (2002) and select the one with the lowest AIC
and do not report specific P values of component variables. [Note: readers
wishing P values can calculate them from the likelihoods (ln likelihood ratio tests)
of the models. In any case, all variables included in the best-fitting models were
statistically significant (P < 0.05) via partial-F tests.] As a rule of thumb, models
whose AIC was within 2 units of the best model were considered to have
substantial support (Burnham & Anderson 2002). Note that maximum likelihoods

were used for computing AIC and likelihood ratio tests, whereas REML was used
for estimating coefficients in the model. REML estimates of the OU
transformation parameter, d, are also reported. All of the regression models
(results in electronic supplemental materials, tables 2c-g) were computed using
the Matlab Regressionv2.m program of Lavin et al. (2008), available on request
from T.G.
Focal-species analyses of Puerto Rican lizards
Details on field and laboratory methods for A. cristatellus at Punta Salinas
are found in Huey (1974) and Huey and Webster (1976). Field data for 1973 are
from one day in July. However, mean Tb in 1973 differed by less than 0.1°C from
that of a full-day sample in July 1972 (Huey & Webster 1976).
Field Tbs of Sphaerodactylus were measured between 0930 and 1430 h,
and Tes were measured between 0900 and 1600 h. The thermal dependence of
sprint speed was measured in a 2-m racetrack. CTmax, and CTmin, Tb, and Tp were
measured using standard procedures (Huey & Webster 1976).
Predicting Tb and relative performance after climate warming
Predicting the change in Tb of a basking lizard (following warming of Ta)
requires a biophysical model (Kearney et al. 2009), as radiation often dominates

overall heat exchange. For the Anolis lizards studied here, predicting the change
in Tb does not require biophysics because these lizards are thermoconformers
(Huey 1974). This is evident both from field observations of the infrequency of
basking behaviour in these lizards (Huey 1974; Huey & Webster 1976; Hertz
1992), as well as from the 1:1 regressions of Tb on Ta.
Population Intercept ± S.E. Slope ± S.E. R2
A. cristatellus Pta. Salinas -1.50 ± 0.817 1.08 ± 0.03 0.936
A. cristatellus San German 1.85 ± 1.670 1.00 ± 0.062 0.681
A. gundlachi El Verde 0.22 ± 0.589 1.00 ± 0.024 0.944
Therefore, we could used field data from 1973 and the above regression to
predict Tbs following a hypothetical 3°C increase in Tas. Relative sprint
performance versus Tb was estimated by fitting a normal X exponential curve
(Deutsch et al. 2008). Using this curve, we predicted relative sprint speed at
different times of day (Huey 1983) before and after warming.
For A. cristatellus at San German, We computed a regression of hourly
mean Tb on hourly mean Te (Tb = - 0.01 + 1.02*Te, R2 = 0.924), and then
predicted Tb and relative performance before and after warming. Thermal
preference shows no significant geographic variation (Huey & Webster 1976),
and so we used Tps from Pta. Salinas.
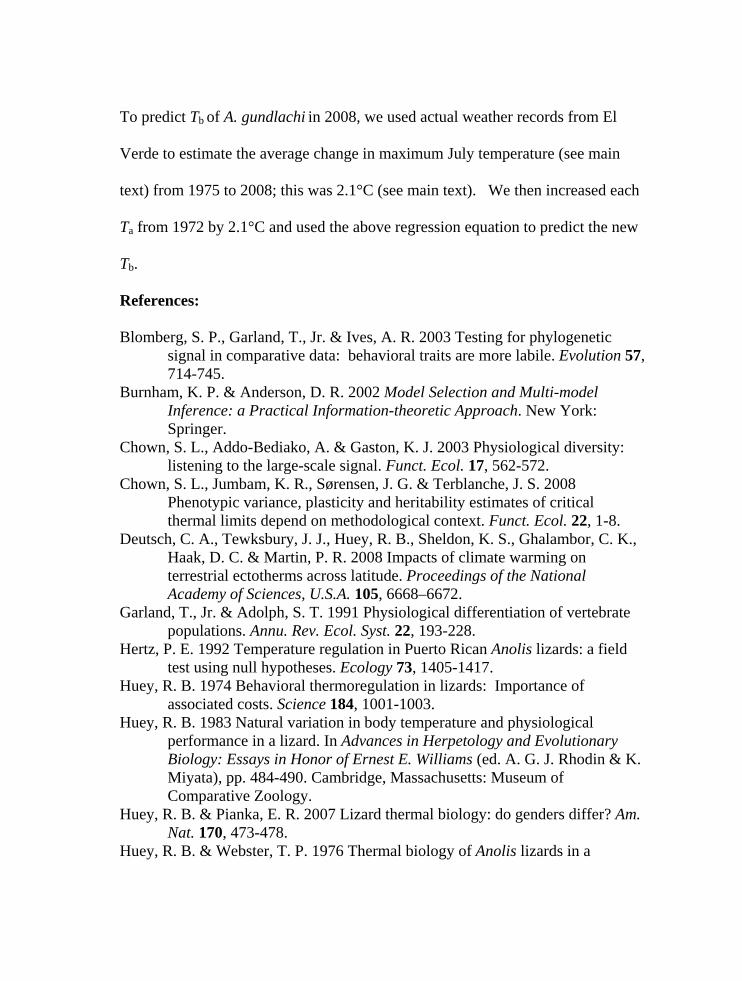
To predict Tb of A. gundlachi in 2008, we used actual weather records from El
Verde to estimate the average change in maximum July temperature (see main
text) from 1975 to 2008; this was 2.1°C (see main text). We then increased each
Ta from 1972 by 2.1°C and used the above regression equation to predict the new
Tb.
References: Blomberg, S. P., Garland, T., Jr. & Ives, A. R. 2003 Testing for phylogenetic
signal in comparative data: behavioral traits are more labile. Evolution 57, 714-745.
Burnham, K. P. & Anderson, D. R. 2002 Model Selection and Multi-model Inference: a Practical Information-theoretic Approach. New York: Springer.
Chown, S. L., Addo-Bediako, A. & Gaston, K. J. 2003 Physiological diversity: listening to the large-scale signal. Funct. Ecol. 17, 562-572.
Chown, S. L., Jumbam, K. R., Sørensen, J. G. & Terblanche, J. S. 2008 Phenotypic variance, plasticity and heritability estimates of critical thermal limits depend on methodological context. Funct. Ecol. 22, 1-8.
Deutsch, C. A., Tewksbury, J. J., Huey, R. B., Sheldon, K. S., Ghalambor, C. K., Haak, D. C. & Martin, P. R. 2008 Impacts of climate warming on terrestrial ectotherms across latitude. Proceedings of the National Academy of Sciences, U.S.A. 105, 6668–6672.
Garland, T., Jr. & Adolph, S. T. 1991 Physiological differentiation of vertebrate populations. Annu. Rev. Ecol. Syst. 22, 193-228.
Hertz, P. E. 1992 Temperature regulation in Puerto Rican Anolis lizards: a field test using null hypotheses. Ecology 73, 1405-1417.
Huey, R. B. 1974 Behavioral thermoregulation in lizards: Importance of associated costs. Science 184, 1001-1003.
Huey, R. B. 1983 Natural variation in body temperature and physiological performance in a lizard. In Advances in Herpetology and Evolutionary Biology: Essays in Honor of Ernest E. Williams (ed. A. G. J. Rhodin & K. Miyata), pp. 484-490. Cambridge, Massachusetts: Museum of Comparative Zoology.
Huey, R. B. & Pianka, E. R. 2007 Lizard thermal biology: do genders differ? Am. Nat. 170, 473-478.
Huey, R. B. & Webster, T. P. 1976 Thermal biology of Anolis lizards in a

complex fauna: the cristatellus group on Puerto Rico. Ecology 57, 985-994.
Ives, A. R., Midford, P. E. & Garland, T., Jr. 2007 Within-species variation and measurement error in phylogenetic comparative methods. Syst. Biol. 56, 252-270.
Kearney, M., Shine, R. & Porter, W. P. 2009 The potential for behavioral thermoregulation to buffer 'cold-blooded' animals against climate warming. Proc. Natl. Acad. Sci. USA in press.
Lailvaux, S. P., Alexander, G. J. & Whiting, M. J. 2003 Sex-based differences and similarities in locomotor performance, thermal preferences, and escape behaviour in the lizard Platysaurus intermedius wilhelmi. Physiol. Biochem. Zool. 76, 511-521.
Lavin, S. R., Karasov, W. H., Ives, A. R., Middleton, K. M. & Garland, T. J. 2008 Morphometrics of avian intestine, compared with non-flying mammals: a phylogenetic approach. Physiol. Biochem. Zool. 81, 536-550.
Lutterschmidt, W. I. & Hutchison, V. H. 1997 The critical thermal maximum: history and critique. Canadian Journal of Zoology 75, 1561-1574.
van Berkum, F. H. 1988 Latitudinal patterns of the thermal sensitivity of sprint speed in lizards. Am. Nat. 132, 327-343.

Fig. 1. Observed climate warming at El Verde, Puerto Rico Mean maximum temperature in July (summer) has increased significantly (-104.3 + 0.066*year, P << 0.001) between 1975 and 2007. Mean minimum temperature in July (not show) has also increased significantly (-39.95 + 0.031*year, P = 0.001). [Note: the URL indicates that data are substituted for several years. If these records are excluded, the pattern is very similar (maximum: -110.1 + 0.069*year, P = 0.003; minimum: -27.9 + 0.025*year).] Data from http://luq.lternet.edu/data/lterdb17/metadata/lterdb17.htm.