Engaging citizens living in vulnerable circumstances in research
Upload
khangminh22Category
view
1download
0
Detection of vulnerable atherosclerotic plaque
Thesis for the degree philosophiae doctor
Trondheim, January 2007
Norwegian University of Science and TechnologyFaculty of Information Technology, Mathematics and Electrical Engineering Department of Electronics and Telecommunications
Magnus Borstad Lilledahl
I n n o v a t i o n a n d C r e a t i v i t y

NTNUNorwegian University of Science and Technology
Thesis for the degree philosophiae doctor
Faculty of Information Technology, Mathematics and Electrical Engineering Department of Electronics and Telecommunications
© Magnus Borstad Lilledahl
ISBN 978-82-471-0489-7 (printed version)ISBN 978-82-471-0492-7 (electronic version)ISSN 1503-8181
Doctoral theses at NTNU, 2007:23
Printed by NTNU-trykk

Preface
Perhaps the most valuable result of all education is the ability tomake yourself do the thing you have to do, when it ought to bedone, whether you like it or not; it is the first lesson that oughtto be learned; and however early a man’s training begins, it isprobably the last lesson that he learns thoroughly.Thomas H. Huxley, English biologist (1825 - 1895)
The work which comprise this thesis was done at the Norwegian Univer-sity of Science and Technology in Trondheim, Norway, from January 2003to November 2006 under the supervision of professor Lars Othar Svaasand.
As I climbed the steep hill toward the Gløshaugen campus early onemorning in November 2002, I was imbued by a spirit of academia. The towersof the main building reminded me of famous classical institutions like Yale,Oxford and Johns Hopkins University: Brilliant professors in tweed jackets,libraries filled with dusty books, profound discussion in dimly lit halls andsecret high-tech laboratories. Unfortunately, the feeling of grand academicarchitecture was vaporized as I rounded the corner of the main buildingand witnessed the architectural wasteland that lay behind. However, duringmy interview with professor, and later advisor, Lars Othar Svaasand theassociations to classic academia returned. As he scratched his beard andlectured on nonlinear optical phenomena with sparkling eyes, I thought thatNTNU could be a good place to study. Through countless discussions in thelibrary (ehh...maybe coffee room is more exact) he has given me physicalinsights in a wide array of physical phenomena that made me realize that Iknew close to nothing, but also moved me infinitely further away from theignorance that was mine when I began the pursuit of a PhD degree.
Several people have made these four years a gratifying experience. LiseLyngsnes Randeberg provided invaluable support on many occasions, espe-cially during my first fumbling year when I had no signs to point me in theright direction.
The cross-disciplinary nature of this work has been very rewarding. Iwould like to thank all the people at St. Olav’s Hospital and especially OlavAnton Haugen for providing medical insight, tissue samples and huntingadvice.
i

ii
Also, a great thanks to Eivind Larsen and Bertil Nistad who, throughuncountable coffee breaks, have inspired a great interest in the the field ofextracurricular applied physics. Andreas Winnem and the people in SMIDAmust be mentioned for providing a social life where little existed before.
I have very much enjoyed working with professors Odd Gutteberg, TrondYtterdal, Morten Olavsbraten and Helge Engan in my mandatory teachinghours, making it less of a hassle than it could be.
Thanks to all my students that have slaved for me and shown that stu-dents are still hard working and enthusiastic, just like they were in my time.
To my girlfriend Kari, family, and friends in Oslo: I could not haveaccomplished this without you....or yes, actually I could, but the processwould probably have been all the less pleasurable.
And to everybody else I have worked with, it has been a great time, butunfortunately you did not quite make it to be mentioned in the preface :-P

Abstract
Heart attacks are the cause for the majority of deaths in the industrializedworld. The underlying cause of most of these deaths is the rupture of vul-nerable plaque. As of this day, no widely accepted clinical tool exists fordetecting plaques that are prone to rupture, although several techniques arebeing investigated. This thesis gives an overview of detection modalitiesthat have been proposed for detecting vulnerable plaque with special em-phasis on three methods, diffuse reflection spectroscopy, thermography andmultiphoton microscopy.
iii

iv

Outline of thesis
Introduction
This chapter gives an outline of the thesis and a list of the included papers.The author’s contributions to the various published works are specified anda brief description of the papers is given. The papers are listed chrono-logically. All the papers are related to the detection and characterizationof vulnerable plaques. The work has centered around several topics withinthis field, namely diffuse reflection spectroscopy, thermography, multipho-ton spectroscopy and fluorescence spectroscopy. In addition, a list of otherpublications completed during the PhD period, but not related to vulnerableplaque, is included.
Outline
Chapter 2 reviews the basic physiology of atherosclerosis and the featuresthat are relevant for vulnerable plaque detection. Then a review of technolo-gies that are in use for characterization of cardiovascular disease is presented.Not only those modalities that measure individual plaques, but also tech-niques for measuring their effects, i.e. indirect measures of atherosclerosisare included. The modalities are grouped according to the level of phys-iological detail they measure: Systemic parameters, heart function, vesselanatomy and vessel wall anatomy. More details are included in those fieldswere active research has been conducted.
List of papers
• Characterization of atherosclerotic plaque by reflection spec-troscopy and thermography: A comparisonMagnus B. Lilledahl, Olav A. Haugen, Lise L. Randeberg and Lars O.Svaasand.Proceedings of SPIE, vol. 5686, 415-425 (2005)
Absorption spectra of pure substances likely to dominate near infraredabsorption spectra in arteries were measured. These basis spectra
v

vi
were used in a diffusion type model to determine the expected shapeof measured spectra. Samples of human aorta were examined spec-troscopically and a measure of the lipid content based on the spectrais presented. No correlation between the size of the plaques and thespectra was found.
Simple models of heat distribution in a plaque were developed to de-termine temperature increases in plaques due to higher metabolism.The expected temperature at the surface was found to be less than0.05. This value was in agreement with thermographic, in-vivo mea-surements performed in rabbit aortas.
Contributions: Conducting spectroscopic measurements and analy-sis of data with existing models. Development of lipid-index. Mathe-matical analysis of thermal distributions in plaque.
• The effect of a thin bloodlayer on fluorescence spectroscopyMagnus B. Lilledahl, Marianne Barkost, Mari W. Gran, Olav A. Hau-gen and Lars O. SvaasandProceedings of SPIE, vol. 6078, 60782J-1 (2006)
Fluorescence from samples of human aorta were excited using a lightemitting diode and the fluorescence was collected with a fiber opticprobe. The level of fluorescence could detect calcifications but thedifferentiation between fibrous and lipid rich plaque was poor. Fluo-rescent tissue phantoms of fluorescein and agar with a surface layer ofblood was investigated to determine the effect of the interfering blood.When a random layer of blood was added to the spectra from the aortasamples the different tissue states could no longer be determined ac-curately.
Contributions: Spectral measurements of aorta. Analysis of spectraldata and the effect of the added blood layer.
• Reflection spectroscopy of atherosclerotic plaqueMagnus B. Lilledahl, Olav A. Haugen, Marianne Barkost and Lars O.Svaasand.Journal of Biomedical Optics 11(2), 0210051-0210057 (2006)
A series of reflectance spectra were collected from human aorta withvarying degrees of atherosclerosis. The spectra were collected bothwith an optical fiber probe and an integrating sphere. The reflectedspectra were compared to histology and it was found that near infraredspectroscopy could be used to detect lipids in plaques with good sen-sitivity and specificity.
Contributions: Experimental work and development of method ofanalysis.

vii
• An analytic and numerical study of intravascular thermogra-phy of vulnerable plaqueMagnus B. Lilledahl, Eivind L. P. Larsen and Lars O. SvaasandPhysics in medicine and biology.52 (2007), 961-979
An estimate of the upper limit of heat generation that could be ex-pected in a plaque was developed from physiological considerations.This value was used in numerical and analytic models of the heat dis-tribution in a plaque to calculate a limit on the temperature increasethat could be expected in a plaque due to inflammation. It was foundthat the an upper limit on the temperature due to a plaque was 0.1C.Possible explanations for higher values reported in the literature is pre-sented.
Contributions: Numerical analysis and analytic model developmentin cooperation with Lars O. Svaasand.
• Characterization of vulnerable plaques by multiphoton mi-croscopyMagnus B. Lilledahl, Olav A. Haugen, Catharina Davies and Lars O.SvaasandJournal of Biomedical Optics Conditionally accepted.
Multiphoton microscopy could be used to image the connective fibersthat constitute the fibrous plaque, which again could be used to deter-mine its mechanical strength. Samples of human aorta were imagedin a microscope coupled to a Ti:Sapphire laser to excite second har-monic generation and two-photon excited fluorescence. It was foundthat individual collagen fibers and elastic fibers could be seen down toa depth of about 100 µm.
Contributions: Collection of microscopy images and analysis.
Other publications
This section includes publications which do not fall under the subject of thisthesis and is thus not included, but was completed during the Ph.D period.
• Subcutaneous transport of extravascular bloodLise L. Randeberg, Eivind L. P. Larsen, Magnus B Lilledahl, RuneHaaverstad, Olav A. Haugen, Bjorn Skallerud and Lars O. Svaasand.Proceedings of SPIE, vol. 6078 (2006), 607808-9
Models of fluid transport in tissue was developed based on measure-ments of fluorescein transport in a porcine model.
Contributions: Assisted in the experimental work.

viii
• Skin changes following minor traumaLise L. Randeberg, Andreas M. Winnem, Neil E. Langlois, Eivind L.P. Larsen, Magnus B. Lilledahl, Rune Haaverstad, Bjørn Skallerud,Olav A. Haugen and Lars O. Svaasand.Spectroscopic and histological investigation of blunt trauma in a porcinemodel was investigated. It was found that reflection spectroscopycould be used to characterize age and type of trauma.
Contributions: Assisted in the experimental work.

Contents
Preface i
Abstract iii
Outline of thesis viii
Table of contents x
1 Introduction 11.1 Motivation . . . . . . . . . . . . . . . . . . . . . . . . . . . . 1
2 Atherosclerosis 32.1 Introduction . . . . . . . . . . . . . . . . . . . . . . . . . . . . 32.2 Normal vessel anatomy . . . . . . . . . . . . . . . . . . . . . . 32.3 Physiology of atherosclerotic lesions . . . . . . . . . . . . . . 4
2.3.1 Histological classification . . . . . . . . . . . . . . . . 42.3.2 Lesion initiation and development . . . . . . . . . . . 7
2.4 Vulnerable plaque . . . . . . . . . . . . . . . . . . . . . . . . . 82.5 Vulnerable patient . . . . . . . . . . . . . . . . . . . . . . . . 82.6 Detection features . . . . . . . . . . . . . . . . . . . . . . . . 92.7 Treatment . . . . . . . . . . . . . . . . . . . . . . . . . . . . . 10
3 Detection modalities 113.1 Introduction . . . . . . . . . . . . . . . . . . . . . . . . . . . . 113.2 Systemic parameters . . . . . . . . . . . . . . . . . . . . . . . 12
3.2.1 Traditional risk factors . . . . . . . . . . . . . . . . . . 123.2.2 Biomarkers . . . . . . . . . . . . . . . . . . . . . . . . 12
3.3 Heart function . . . . . . . . . . . . . . . . . . . . . . . . . . 133.3.1 Electrocardiography . . . . . . . . . . . . . . . . . . . 133.3.2 Echocardiography . . . . . . . . . . . . . . . . . . . . 143.3.3 Nuclear imaging . . . . . . . . . . . . . . . . . . . . . 15
3.4 Vessel anatomy . . . . . . . . . . . . . . . . . . . . . . . . . . 183.4.1 Coronary Angiography . . . . . . . . . . . . . . . . . . 183.4.2 Magnetic Resonance Imaging . . . . . . . . . . . . . . 19
ix

x CONTENTS
3.4.3 Computed tomography . . . . . . . . . . . . . . . . . 213.4.4 Ultrasonography . . . . . . . . . . . . . . . . . . . . . 233.4.5 Ankle-Brachial pressure index . . . . . . . . . . . . . . 23
3.5 Vessel wall anatomy, composition andfunction . . . . . . . . . . . . . . . . . . . . . . . . . . . . . . 233.5.1 Intravascular ultrasound . . . . . . . . . . . . . . . . . 233.5.2 Thermography . . . . . . . . . . . . . . . . . . . . . . 263.5.3 Optical coherence tomography . . . . . . . . . . . . . 293.5.4 Multiphoton microscopy . . . . . . . . . . . . . . . . . 313.5.5 Optical spectroscopy . . . . . . . . . . . . . . . . . . . 343.5.6 Angioscopy . . . . . . . . . . . . . . . . . . . . . . . . 43
4 Conclusions 454.1 Conclusions . . . . . . . . . . . . . . . . . . . . . . . . . . . . 45
5 Future work 475.1 Future Work . . . . . . . . . . . . . . . . . . . . . . . . . . . 47

Chapter 1
Introduction
1.1 Motivation
Only two things are infinite, the universe and human stupidity,and I’m not sure about the former.Albert Einstein, US (German-born) physicist (1879 -1955)
Cardiovascular disease places an enormous medical and economic burdenon society, being the cause of the majority of deaths in the western world.Most of these deaths are caused by the rupture of atherosclerotic plaques inthe coronary arteries. A lot is known about lifestyle habits that acceleratethe development of atherosclerotic plaque, yet it seems as if the general pop-ulation is unwilling to heed the advice and change their detrimental habits.Hence, the medical personnel are left with the option of treating patientsafter the development of the disease. It is established that the majorityof acute coronary events are caused by the rupture or erosion of so-calledvulnerable plaque (defined as plaques prone to causing atherothrombosis).Two thirds of all coronary deaths are caused by plaque rupture with the re-maining being due to plaque erosion[60]. However, equipment for detectingthese types of plaques are still in the research laboratories. This leaves us inthe worrisome situation where we both know the risk factors of atheroscle-rotic development, and when the plaques begin to put the patient at risk,yet neither of the problems can be addressed. The first due to the lack ofknowledge and will-power in the population and the second due to the lackof technology for the clinical personnel. The goal of this thesis is to providea contribution for solving the second issue.
There are two important aspects that motivates this work. One is todevelop a sensor that can detect a vulnerable plaque and indicate for theclinician the appropriate treatment. However, the treatment for vulnerableplaque is not fully developed. The other goal is to design a sensor thatcan characterize plaques and can be used to monitor their development to
1

2 CHAPTER 1. INTRODUCTION
better understand the disease process and monitor the effect of medication.Even though clinical tools in the end must rely on proven clinical effects, abetter understanding of the physiological process can aid the developmentof appropriate treatments.

Chapter 2
Atherosclerosis
Now there are more overweight people in America than average-weight people. So overweight people are now average. Whichmeans you’ve met your New Year’s resolution.Jay Leno, US talk-show host
2.1 Introduction
Atherosclerosis (from the greek athere -porridge, gruel and sklerosis - hard-ening) is believed to be the underlying cause for the majority of cardio-vascular disease (CVD)[72]. The early stages of atherosclerosis (describedbelow) can be seen in virtually everybody from the first decade of life. Theseearly stages are reversible, but can, due to certain conditions, develop into alife-threatening condition. In the early stages the changes in the vessel walloccur at localized areas called plaques, as they are often elevated from thesurrounding vessel wall. In advanced stages of the disease the whole vesselcan be affected, and no normal areas can be found. The exact developmentof atherosclerotic plaques is still an area of active research, but numerous riskfactors have been determined, e.g. high cholesterol levels, smoking, familyhistory of CVD, high blood pressure, obesity, sedentary lifestyle, stress andmany more. In the following a brief description of the disease and propertiesthat are relevant for new detection modalities are presented.
2.2 Normal vessel anatomy
In all arteries in the body, three distinct regions can be defined. These arecalled the tunica intima, tunica media and tunica adventitia (see figure 2.1).The tunica intima consists of a continuous endothelium facing the lumen,resting on a basement membrane. The endothelium is a continous layer ofendothelial cells which serves as the signaling pathway between the vessel
3

4 CHAPTER 2. ATHEROSCLEROSIS
Figure 2.1: The figure shows schemtically the structure of a muscular arterywhere the major structural features are illustrated. (Courtesy of Stijn A.I.Ghesquiere[118]).
and cytokines circulating in the blood. Under the endothelium is the suben-dothelium which consists of fibroelastic tissue and a few scattered musclecells. Between the tunica intima and the tunica media is the internal elasticlamina, which is a thick layer of elastic fibers. The tunica media differsslightly in elastic arteries (the aorta and its major branches) and muscu-lar arteries (all other arteries). In elastic arteries the tunica media consistsprimarily of elastic membranes separated by ground substance, while inmuscular arteries the media consists of layers of muscle cells with connec-tive tissue in between. The elastic arteries are responsible for maintainingblood pressure during diastole while muscular arteries can contract or di-late according to the oxygen demand of the tissue distal to the vessel. Theoutermost layer, the tunica adventitia consists of loose connective tissue, fatcells and blood vessels. The blood vessels in the adventitia are called thevasa vasorum, literally meaning the vasculature of the vessel. An externalelastic lamina can sometimes be seen between the media and adventitia.
2.3 Physiology of atherosclerotic lesions
2.3.1 Histological classification
The following classification of atherosclerotic plaques is based on a seriesof consensus documents issued by the American Heart Association (AHA)[87, 89, 88]. The motivation for this classification was based on histological

2.3. PHYSIOLOGY OF ATHEROSCLEROTIC LESIONS 5
studies that indicate that each type of plaque is temporarily or permanentlystable. Refer to figure 2.2.
Type I-III lesions are often called early lesions. These lesions show nodisruption of intimal structure and there is no effect on the media or adven-titia. They are considered to be reversible changes.
• Type I: Initial lesion
– Increase in number of macrophages.
– Appearance of macrophages filled with lipid droplets.
• Type II: Fatty streak
– Grossly visible.
– Layers of macrophage foam cells, increased number of macrophages.
– Lipid droplets within intimal smooth muscle cells.
– Minimal extracellular lipids.
• Type III: Intermediate lesion
– All of type II characteristics.
– Pools of extracellular lipids.
Type IV-VI lesions are often called advanced lesions. These lesions showintimal disorganization and are often symptomatic. They predispose tosudden lesion progression and are not reversible.
• Type IV: Atheroma
– Lipid core of extracellular lipid.
– Intimal disorganization.
– No fibrous (collagenous) cap.
• Type V: Fibrous
– Thick layers of fibrous tissue.
– Type Va if presence of lipid core (fibroatheroma).
– Type Vb if calcified.
– Type Vc if no lipid accumulation.
• Type VI: Complicated lesions.
– Type IV or V with additional fissure (VIa), hematoma (VIb) orthrombus (VIc).

6 CHAPTER 2. ATHEROSCLEROSIS
Figure 2.2: Illustration of the development of atherosclerosis withinthe artery. (Reprinted by permission from Macmillan Publishers Ltd:Nature[54], copyright 2002.)

2.3. PHYSIOLOGY OF ATHEROSCLEROTIC LESIONS 7
Virmani et al. have published a paper suggesting some changes to thisclassification based on what they view as certain shortcomings[112]. First,the classification is based on postmortem histological studies, and thus thechronological progression suggested by the roman numbering is uncertainand should be avoided. Furthermore, later studies have shown that not onlyplaque rupture is associated with thrombosis but also plaque erosion, and,less frequently, calcified nodules. Since thromboses, erosions, rupture etc.occure over various plaque morphologies, they should not be classified asseparate plaque types but rater to be used as adjectives to describe differentstates of the same plaque type. The plaque types proposed by this Virmaniet al. was,
• Intimal thickening
• Intimal xanthoma (fatty streak)
• Pathological intimal thickening
• Fibrous cap atheroma
• Thin cap fibroatheroma
• Calcified nodule
• Fibrocalcific plaque
The first two plaque types are considered normal and reversible and arethus not atherosclerotic.
2.3.2 Lesion initiation and development
The exact process that initiates atherosclerotic plaques and cause them todevelop into advanced lesions is not known in detail. The problem is thatpractically all information about plaques is from retrospective pahtologicalstudies.
It is believed that plaque development is initiated by lipoproteins beingabsorbed in the intima due to high concentrations circulating in the plasma.Plaques often appear at branches and bifurcations of the artery indicatingthat hemodynamics play a role. Perhaps increased turbulence and reducedsheer stress increase the likelihood of molecules adsorbing to the endothe-lium. A small damage to the endothelium has also been proposed as thestarting point for atherosclerotic plaques. The absorped lipids are oxidizedin the plaque which triggers an immune response that recruits monocytes.Atherosclerosis is therefore characterized as an inflammatory disease. Themonocytes digest the lipids and turn into macrophages. The process whichthen makes the plaque develop into an advanced lesion instead of regress-ing is not known, but it is believed to be a complicated process with manymediators being involved[65].

8 CHAPTER 2. ATHEROSCLEROSIS
2.4 Vulnerable plaque
The definition of vulnerable plaque is a functional one and not based onanatomic appearance. This is due to the fact that many types of plaquescan cause obstructive thrombosis in the coronary arteries, and as of yet thereexists very few prospective studies that have determined which plaques aremost likely to develop thrombosis. Therefore the title of this thesis couldperhaps have been determining the vulnerable plaque rather than detect-ing. The first task of new detection modalities that are being developed(described in chapter 3) is to prospectively determine what actually charac-terizes a vulnerable plaque. Only when this information has been confirmedcan the development of the ideal detection technique begin.
A vulnerable plaque is therefore defined as a plaque at increased risk ofthrombosis and lesion progression[113]. Retrospective studies have shownthat ruptured plaques seem to be the cause of most thrombi, though alsointimal erosions also cause thrombosis[34]. These studies have indicated thatmost ruptured plaques are so called thin-cap fibroatheromas with macrophageinfiltration. These types of plaques would be classified as a type IV or Vin the AHA classification. Other types of plaques that have been associ-ated with thrombosis is proteoglycan rich plaques and plaques with calcifiednodules[72]. Mauriallo et al. found that inflammation is increased four-fold(by counting inflammatory cells in histological sections) in patients hav-ing suffered a myocardial infaraction, compared to controls[63], and thatinflammation was also present in stable plaques and non-culprit coronarysegments. Vulnerable plaques were found to only have a 30% increased ininflammatory cells compared to stable plaques. This study thus indicatesthat the role of inflammation in atherosclerosis is primarily systemic.
One prospective study with angioscopy has shown that glistening yellowplaques have an increased risk of developing thrombosis[75]. This yellowcolor could be due to lipophilic carotenoids being absorbed in lipid richplaques[8]. The plaques were hypothesized to be thin-cap fibroatheromas.
A reason for the lack of prospective studies has been limitations in avail-able imaging techniques for individual plaques. With the advent of themodalities described herein, this obstacle will now be cleared. The informa-tion that is most relevant clinically has yet to be determined and must alsobe seen in light of cost, time, and available treatment.
2.5 Vulnerable patient
Vulnerable patient is a term coined for patients that are at increased risk ofexperiencing an acute coronary event[72]. Vulnerable patients are definednot only by the presence of vulnerable plaques, but also blood that is proneto thrombosis (vulnerable blood) and a myocardium that is prone to fatal

2.6. DETECTION FEATURES 9
arrhythmias (vulnerable myocardium). Diabetes is one condition that canlead to vulnerable blood, and many other serum markers have also beenassociated with a thrombosis prone blood[72]. A vulnerable myocardiumcan be caused by ventricular hypertrophy and electrical instabilities in theheart.
2.6 Detection features
It has been shown that the majority of plaques that cause acute coronaryevents are not hemodynamically significant and are not visible during an-giography. This does not, however, mean that the plaques are small butrather that they exhibit positive remodeling (i.e. not stenotic)[38]. Thishas been shown both by histological and intravascular studies[36]. Stenoticplaques also cause acute events but are often symptomatic (angina) beforethe occurence of a myocardial infarction. Some also included plaques withgreater than 90% stenosis as vulnerable[72], the present work will howeveruse the definition of a plaque prone to thrombosis by plaque rupture orerosion. The important features that is believed to characterize vulnerableplaques are: A large lipid core, a thin fibrous cap covering the lipid core,and the presence of macrophages. One study reported that 95% of rupturedplaques had a cap thickness less than 64 µm (mean 23 µm) and thereforeput 65 µm as a limit of vulnerability[16]. Further prospective studies areneeded to confirm these findings and this is now possible with the new imagemodalities described herein.
Another important feature of atherosclerosis is that it is a diffuse diseasethat affects the entire arterial tree. Burke et al. reported 1.22 ± 1.44 addi-tional vulnerable plaques in men who died suddenly of coronary disease[16].This raises the important issue of whether it is helpful to find individualatherosclerotic plaques since there are several of them. Treating all of themindividually might not be a cost effective solution. It might be better to as-sess the global burden of the disease and then use systemic medication. Theglobal extent of atherosclerosis can be determined noninvasively by imaginglarger and more accessible arteries than the coronary arteries.
As opposed some forms of cancer (cervical and breast), there exists nocurrent screening for cardiovascular disease, even though the latter is thecause of more deaths. The SHAPE report calls for screening for atheroscle-rosis beyond traditional risk factor assessment like the Framingham risk (seesection 3.2.2)[71]. They propose that the traditional assessments are ex-panded for selected moderate risk patients, with noninvasive assessments ofcoronary calcium score by computed tomography (section 3.4.3) or measure-ment of carotid intima-media thickness by ultrasonography (section 3.4.4).

10 CHAPTER 2. ATHEROSCLEROSIS
2.7 Treatment
The treatments that are proposed for vulnerable plaques are mainly lifestylechanges and pharmacological medication e.g. statins, lipid-lowering drugs,anti-thrombotic medication, beta-blockers, nitrates and hypertensive-drugs.Treatment will depend on risk assessment and age. At increasing age longterm side effects are not so important, but the body might respond poorlyto strong medication. Since medications are mostly systemic, the questionagain arises of whether characterization of individual plaques in coronaryarteries is valuable. Perhaps a general plaque burden can be assessed frommore easily accessible vessels?
With high throughput genomic and proteomic studies with micro arraysthe actual expressions of mRNA and proteins in plaques can be determined.This might lead to drugs that more directly interfere with the processes thatcause plaques to develop.
Stenting has been proposed as focal treatment of plaques. However,it has been shown that if there is one vulnerable plaque there are usuallymore. Drug-eluting stens have been very successful in avoiding restenosisproblems. Whether stenting of several non-stenotic plaques due to risk ofplaque rupture is clinically favorable is uncertain and must be investigated.It is also uncertain to what degree the stenting will make the plaques lessprone to thrombosis. It might reduce the risk of rupture, but as alreadymentioned endothelial erosion can also cause thrombosis and it is not clearwhat effect stenting would have on this process.

Chapter 3
Detection modalities
3.1 Introduction
This chapter organizes detection modalities of atherosclerosis according tothe level of spatial physiological detail they deliver. The parameter mea-sured can be systemic, that is, a property of the whole body. By zoomingin, usually including imaging, the modality can look at the function of themyocardium, trying to determine whether it is affected by atherosclerosisor if a myocardial infarction has already occurred. By including even moredetail the function of the arteries themselves can be assessed, which usu-ally amounts to determining the anatomy of the lumen. This is usuallydone with an imaging modality but indirect methods also exist (e.g. ankle-brachial pressure index). Finally, with even better resolution, one can resolvestructures within the vessel wall, i.e. try to characterize the plaque itselfand the structures that renders it vulnerable to rupture or erosion.
A discussion of existing technological diagnostic tools that are used inthe monitoring of cardiovascular disease are included in addition to emergingtechnologies. The chapter aims for completeness in the types of detectionmodalities included, even though only outlines and important results foreach technique are given. The rationale behind including existing technologyis that new detection modalities that characterize individual plaques mustbe able to show improved clinical information or cost- or time-effectivenesscompared to existing methods. If thickness of the fibrous cap of a plaque isnot a better predictor of clinical outcome than family history of cardiovascu-lar disease, the former is not likely to be a cost-effective diagnostic modality.More details are included in those sections where active research has beendone (i.e. diffuse reflection spectroscopy, thermography and multiphotonmicroscopy).
Important parameters when evaluating modalities are time, cost, radi-ation dose, side effects, invasiveness and of course the clinical informationthat can be collected. Clinically, the value of a detection modality is given
11

12 CHAPTER 3. DETECTION MODALITIES
by its ability to determine the appropriate treatment in a time and costefficient way. The treatment is prescribed from the risk of something badhappening, determined by the diagnostic modality, compared to the costand side-effects of the treatment. If a pill that cures atherosclerosis is freeand without side-effects there is no need for diagnosis. Just take your pill.Also, if the most aggressive treatment is already applied based on one riskassessment method, there is no need to further stratify the risk. There isnothing more you can do. If the most aggressive lipid lowering drug andstatin therapy is prescribed, based on a Framingham risk score, there is noneed for complicated invasive catheter-based assessment of coronary plaques.
However, for research purposes the technological tools play a differentrole. Many of the detection modalities described herein can have great valuein gaining a better understanding of atherosclerosis and how risk factors arerelated, even though they will not make it into a clinical tool.
3.2 Systemic parameters
3.2.1 Traditional risk factors
There are certain risk factors that are easily and quickly measured andprovide a risk value for the chance of developing cardiovascular disease.These are primarily obesity, high blood pressure, family history of CVD,smoking and diabetes. Based on these results, patients can be signed up formore detailed assessment that can either lower or increase the assumed riskof a cardiovascular event.
3.2.2 Biomarkers
Constituents of the serum can provide additional risk assessment over thetraditional methods. Most notably are low and high density lipoprotein(LDL and HDL), and total cholesterol level. But there are other markersthat have also been associated with CVD, the best known being C-reactiveprotein (CRP). The concentration of CRP in the blood is a marker of theoverall state of inflammation in the body. It is well known that inflamma-tion plays an important role in the progress of atherosclerosis and elevatedCRP levels have been associated with increased risk of myocardial infarc-tion. However, whether CRP is the cause or an effect of plaque ruptureis unknown[65]. There is a vast array of proteins, both pro-inflammatoryand anti-inflammatory that have been associated with atherosclerosis[65, 6].With high throughput micro-array techniques, both for genomic and pro-teomic analysis, detailed knowledge about which proteins or genes have in-creased expression in atherosclerosis and vulnerable plaques is increasing. Ifthese markers have corresponding concentrations in the blood, the risk of aruptured plaque could perhaps be well assessed by a blood sample[42, 62].

3.3. HEART FUNCTION 13
The Framingham risk score combines traditional risk factors and biomark-ers (cholesterol levels, blood pressure, diabetes, smoking and age) into avalue estimating the 10 year risk of developing cardiovascular disease[117],and is used to prescribe an appropriate lipid lowering therapy. However,the risk estimates based on the Framingham study have been shown notto be accurate for all populations[102]. Another problem with the Fram-ingham risk score is that the risk factors are present in almost everybodyin some populations so that it is unable to really yield any additional riskstratification of the population. Also, this risk assessment programs provideno information about the short term risk for developing an acute coronaryevent[73].
3.3 Heart function
3.3.1 Electrocardiography
As the autorythmic muscle fibers depolarize throughout the heart they setup electric potentials. By attaching electrodes to the chest (usually six)and the limbs, these potentials can be measured. Different combinations ofthese electrodes give information about the potential in different directionsacross the heart. From these signals it is possible to determine enlargedmyocardium, conduction problems, arrhythmias, damaged regions and cur-rent heart attacks. For atherosclerosis the relevance of electrocardiography(EKG) is to detect stenosis (which cause reduced blood flow to the my-ocardium) and detection of past and current heart attacks. Within theframework of the vulnerable patient, it is an important tool for characteriz-ing a vulnerable myocardium.
The electrocardiogram is usually described by a P-wave, a T-wave and aQRS complex. By different changes in the shape of these waves, a diagnosisof the heart can be given. For example, a flatter T-wave indicates insufficientoxygen supply that might be due to stenosis of an atherosclerotic plaque.Even though the electrocardiogram is normal at rest, a stress test can findthat the heart is not receiving enough oxygen under exercise and might havea small stenosis. Since it says something about the state of the vessel, thismodality might also belong to the section on modalities characterizing vesselanatomy (section 3.4). A branch of EKG is high resolution EKG. This isbasically a method to improve the signal to noise ratio by averaging severalsignals thereby making very low signals called late potentials visible. Thelate potentials have been shown to be indicative of the prognosis after aheart attack[11].

14 CHAPTER 3. DETECTION MODALITIES
3.3.2 Echocardiography
Echocardiography (ECG)1 uses ultrasound to produce images of the heart.Ultrasound images are produced by sending mechanical waves into the tissue.When these waves encounter a change in acoustic impedance, the wave willbe partially reflected. By measuring the time from the emitted wave tothe reflected signal (about 10-100µs) the position of the object causing thereflectance can be determined. The radial resolution (parallel to the beam),∆xr, is thus dependent on the width of the pulse, τ , which again is dependenton the bandwidth B
∆xr =cτ
2=
c
2B, (3.1)
where c is the speed of sound in the medium (about 1540 m/s for mostsoft tissue). The lateral resolution of the image, ∆xl, is dependent on thefocusing of the beam and is described by
∆xl = λF
D, (3.2)
where λ is the wavelength and F and D are the focal length and aperture,respectively. Frequencies used in biomedical imaging range from 2-30 MHz.This gives a theoretical maximum resolution in the radial direction of 20−400 µm. Increasing frequency improves resolution but decreases penetrationdepth (rule of thumb is 0.5 dB per cm per MHz at center frequency). Theresolution can also be improved by using the nonlinear part of the generatedsignal (usually the second harmonic).
The transducer for ECG consists of a piezoelectric ceramic with an elec-trode on each side. Piezoelectric materials contract or expand as a functionof the applied electric field and also generate an electric field as a functionof externally applied pressure. The same piezoelectric material is thus usedas both detector and transducer. Focusing is achieved either by a curvatureof the ceramic or an array of transducers where a phase change between thetransducers cause the beam to be focused. This focusing, by adding a phaseto the signals, can be used both for transmitting and detection.
Another type of ultrasound transducer is the capacitive micromachinedultrasound transducer (CMUT). This transducer consists of micromachinedmembrane with an electrode on top. By applying a time varying voltagebetween the electrode and the substrated the membrane can be made tooscillate and thereby generate the ultrasound signal. The small size of themembranes allow for higher frequencies than what is acheivable by ceramictransducers, thereby improving the resolution. These capacitors are usuallyfabricated in arrays and their small size make them ideal for intravascularultrasound (IVUS, see section 3.5.1).
1Note that ECG is echocardiography and EKG is electrocardiography (from the germanelektrokardiogram).

3.3. HEART FUNCTION 15
ECG is used to image the myocardium and heart valves. When used asan image modality for the heart, it can quantify heart function parameterslike ejection fraction (fraction of blood emptied from ventricle during systole)and cardiac output (volume of blood emptied into the aorta per minute).Abnormalities in the contraction of the myocardium can be seen in ECGimages. Such abnormalities seen at rest indicate a diseased myocardium,possibly due to a myocardial infarction. If the movement is normal duringrest but abnormal during a stress test (induced either by exercise or drugadministration), insufficient blood supply, possibly due to stenotic arteries,is indicated. Imaging of the heart is performed either through the chest(transthoracic) or through the esophagus (transesophageal, requires lightsedation and is considered an invasive technique).
With doppler ultrasound, blood flow direction and velocity in the cham-bers of the heart can be determined. This is especially useful to investigateblood flow across heart valves and to determine septal defects.
Contrast enhancement techniques with gas-filled microbubbles exist. Thesemicrobubbles are 1-4 µm in diameter and can thus easily pass through thecapillaries. The shell is made of varying materials (albumin, galactose, lipidpolymers) and the gas core can consist of varying gases like air, perfluor-carbon and nitrogen. These gas bubbles have a very strong echogenicety,due to the large difference in acoustic impedance between blood and gas,and can better outline the myocardium for a more accurate determination ofheart wall movement and ejection fractions. Clinical research has also beendone of myocardial perfusion measurement (myocardial contrast echocardio-graphy). The microbubbles are then destroyed by the ultrasound beam, andthe speed of replenishment of the bubbles in the ultrasound beam is quan-tified, and used as a measure of perfusion in the myocardium[52]. Targetedcontrast agents consist of various receptors in the body that are attached tothe shell of the microbubble. Molecules can be attached to the microbubblesto make targeted contrast agents but the high velocity of the blood giveslow absorption rates.
3.3.3 Nuclear imaging
Nuclear imaging methods are not used for imaging of anatomical structureson the size of vessels due to their low resolution, but rather provide in-formation about the function of the organ in question. It is therefore notpart of the arsenal of vulnerable detection techniques. A description ofthe technique is included here for completeness and because it is an im-portant tool in the management of cardiovascular disease. In addition, theresults of positron emission tomography (PET) on myocardial perfusion andmetabolism are relevant for the thermography technique described in section3.5.2.
Nuclear imaging is based on the emission of gamma-rays from radioac-
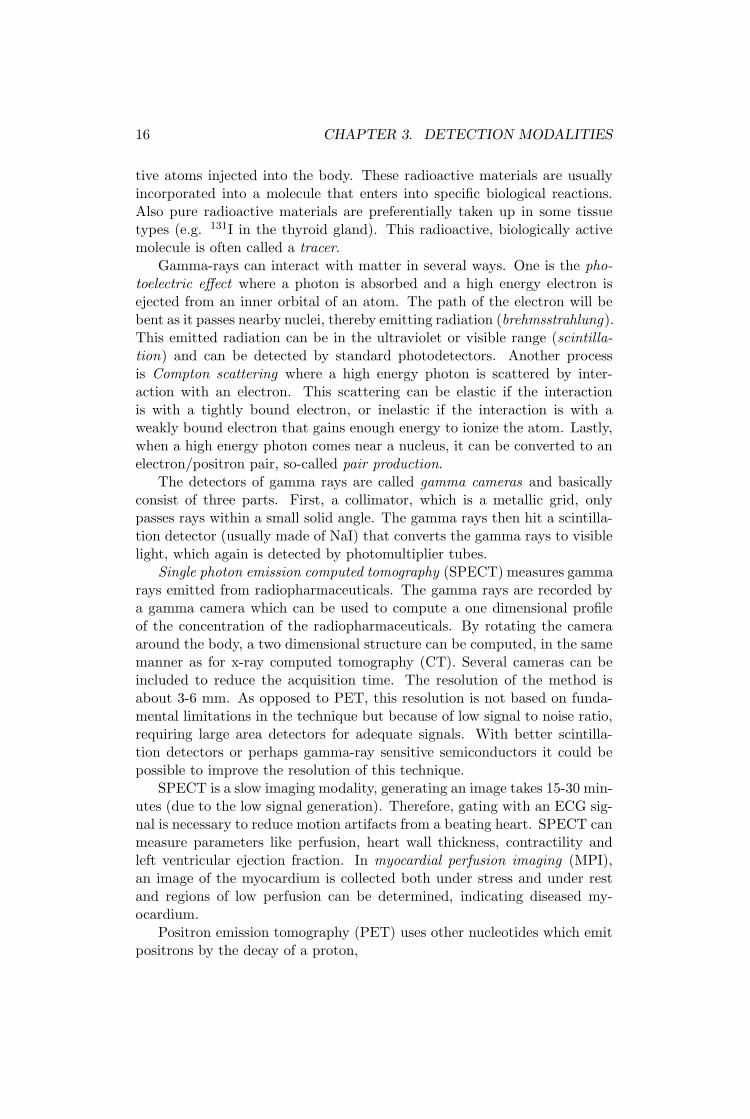
16 CHAPTER 3. DETECTION MODALITIES
tive atoms injected into the body. These radioactive materials are usuallyincorporated into a molecule that enters into specific biological reactions.Also pure radioactive materials are preferentially taken up in some tissuetypes (e.g. 131I in the thyroid gland). This radioactive, biologically activemolecule is often called a tracer.
Gamma-rays can interact with matter in several ways. One is the pho-toelectric effect where a photon is absorbed and a high energy electron isejected from an inner orbital of an atom. The path of the electron will bebent as it passes nearby nuclei, thereby emitting radiation (brehmsstrahlung).This emitted radiation can be in the ultraviolet or visible range (scintilla-tion) and can be detected by standard photodetectors. Another processis Compton scattering where a high energy photon is scattered by inter-action with an electron. This scattering can be elastic if the interactionis with a tightly bound electron, or inelastic if the interaction is with aweakly bound electron that gains enough energy to ionize the atom. Lastly,when a high energy photon comes near a nucleus, it can be converted to anelectron/positron pair, so-called pair production.
The detectors of gamma rays are called gamma cameras and basicallyconsist of three parts. First, a collimator, which is a metallic grid, onlypasses rays within a small solid angle. The gamma rays then hit a scintilla-tion detector (usually made of NaI) that converts the gamma rays to visiblelight, which again is detected by photomultiplier tubes.
Single photon emission computed tomography (SPECT) measures gammarays emitted from radiopharmaceuticals. The gamma rays are recorded bya gamma camera which can be used to compute a one dimensional profileof the concentration of the radiopharmaceuticals. By rotating the cameraaround the body, a two dimensional structure can be computed, in the samemanner as for x-ray computed tomography (CT). Several cameras can beincluded to reduce the acquisition time. The resolution of the method isabout 3-6 mm. As opposed to PET, this resolution is not based on funda-mental limitations in the technique but because of low signal to noise ratio,requiring large area detectors for adequate signals. With better scintilla-tion detectors or perhaps gamma-ray sensitive semiconductors it could bepossible to improve the resolution of this technique.
SPECT is a slow imaging modality, generating an image takes 15-30 min-utes (due to the low signal generation). Therefore, gating with an ECG sig-nal is necessary to reduce motion artifacts from a beating heart. SPECT canmeasure parameters like perfusion, heart wall thickness, contractility andleft ventricular ejection fraction. In myocardial perfusion imaging (MPI),an image of the myocardium is collected both under stress and under restand regions of low perfusion can be determined, indicating diseased my-ocardium.
Positron emission tomography (PET) uses other nucleotides which emitpositrons by the decay of a proton,

3.3. HEART FUNCTION 17
p+ → n + e+. (3.3)
The nucleotides used in PET (e.g. 11C, 13N, 15O) are substituted fortheir non-radioactive counterparts in biological molecules without changingtheir chemical properties (generally not the case for radiopharmacueticalsused in SPECT). These radioactive nucletoids are made by in-house cy-clotrons that bombard specific materials with protons. Various biologicalsubstances are then synthesized using these radioactive nucleotides. A prob-lem overcome by in-house production is that some of the nucleotides havevery short half-lives (on the order of minutes).
The positrons that are emitted are slowed down through interaction withthe material. When they interact with the electrons they are almost at rest,and since the electrons are bound to an atom the kinetic energy is very lowand linear momentum is close to zero[7]. The electron and positron can alsocombine into an atomic structure called positronium, such that the kineticenergy and linear momentum is zero. When the positron and electron andannihilates, two photons of 0.511 MeV are produced which is equal to therest mass of the electron (and positron). Since the linear momentum iszero before the annihilation, the photons must move in exactly oppositedirections. If the electron and positron annihilate at higher kinetic energies,the emitted photons will not travel along a straight line and will be rejectedby the conicidence circuit of the PET detector. This effect is used in themeasurement of electron momenta in solids[32].
The PET detector system consists of a ring of detectors positionedaround the body (usually a row of ring-detectors to expand the field ofview). These detectors are connected to a coincidence circuit that de-termines whether the detected gamma rays were generated by the samepositron, by measuring the time difference between two detected photons(which is very small, it takes a photon about 1 ns to cross the PET scannertube). From this, the system can determine whether there is a radioactivemolecule along the line of sight between the two detectors. The line canbe drawn between any detectors that are within each other’s line of sight(such that each detector has a fan shaped field of view). By recording thesignal along many lines a 2D plane of the concentrations of these nucleotidescan be determined by data processing similar to the one used in CT. PETcurrently gives better resolution than SPECT, but is more expensive and itscost-effectiveness in cardiology has not been proven[6]. However, the resolu-tion of PET is fundamentally limited by the length that the positron travelsbefore it annihilates. This length varies from 2 mm (18F) to 16 mm (82Rb)and the resolution can not be improved beyond this.
In cardiology, PET is used to measure perfusion and metabolism inthe myocardium. The perfusion measurements are usually performed with13NH3 or 82Rb. Because these have fairly short half-lives, rest- and stress-
18 CHAPTER 3. DETECTION MODALITIES
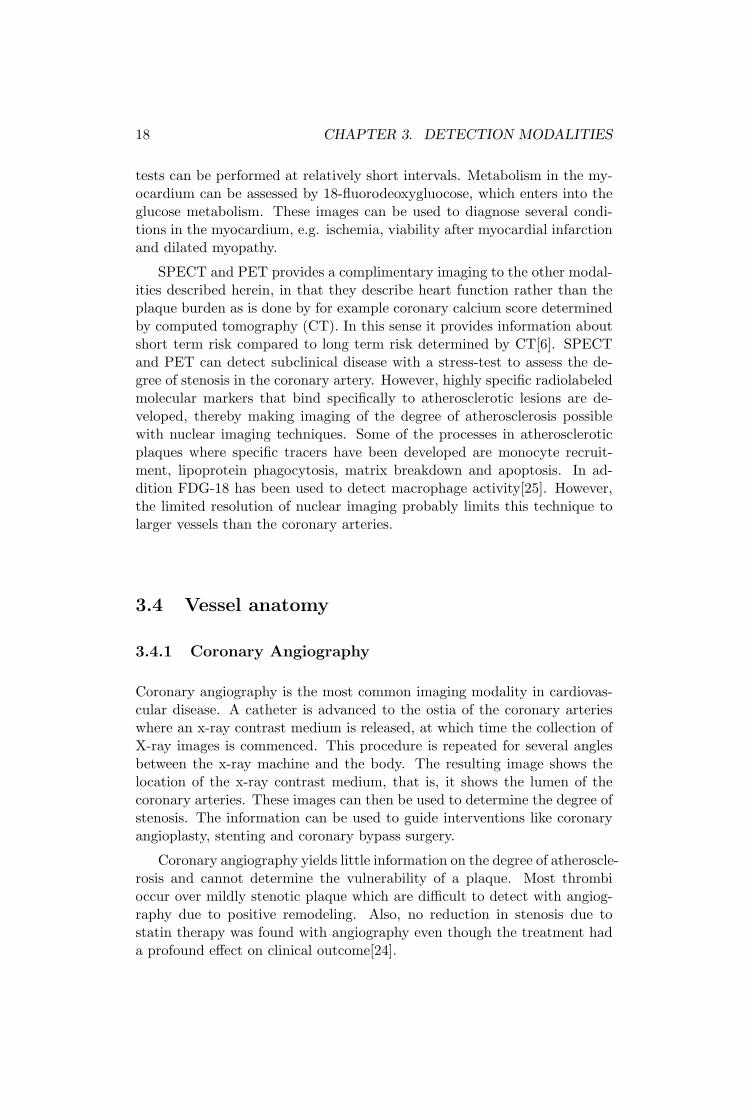
tests can be performed at relatively short intervals. Metabolism in the my-ocardium can be assessed by 18-fluorodeoxygluocose, which enters into theglucose metabolism. These images can be used to diagnose several condi-tions in the myocardium, e.g. ischemia, viability after myocardial infarctionand dilated myopathy.
SPECT and PET provides a complimentary imaging to the other modal-ities described herein, in that they describe heart function rather than theplaque burden as is done by for example coronary calcium score determinedby computed tomography (CT). In this sense it provides information aboutshort term risk compared to long term risk determined by CT[6]. SPECTand PET can detect subclinical disease with a stress-test to assess the de-gree of stenosis in the coronary artery. However, highly specific radiolabeledmolecular markers that bind specifically to atherosclerotic lesions are de-veloped, thereby making imaging of the degree of atherosclerosis possiblewith nuclear imaging techniques. Some of the processes in atheroscleroticplaques where specific tracers have been developed are monocyte recruit-ment, lipoprotein phagocytosis, matrix breakdown and apoptosis. In ad-dition FDG-18 has been used to detect macrophage activity[25]. However,the limited resolution of nuclear imaging probably limits this technique tolarger vessels than the coronary arteries.
3.4 Vessel anatomy
3.4.1 Coronary Angiography
Coronary angiography is the most common imaging modality in cardiovas-cular disease. A catheter is advanced to the ostia of the coronary arterieswhere an x-ray contrast medium is released, at which time the collection ofX-ray images is commenced. This procedure is repeated for several anglesbetween the x-ray machine and the body. The resulting image shows thelocation of the x-ray contrast medium, that is, it shows the lumen of thecoronary arteries. These images can then be used to determine the degree ofstenosis. The information can be used to guide interventions like coronaryangioplasty, stenting and coronary bypass surgery.
Coronary angiography yields little information on the degree of atheroscle-rosis and cannot determine the vulnerability of a plaque. Most thrombioccur over mildly stenotic plaque which are difficult to detect with angiog-raphy due to positive remodeling. Also, no reduction in stenosis due tostatin therapy was found with angiography even though the treatment hada profound effect on clinical outcome[24].
3.4. VESSEL ANATOMY 19
3.4.2 Magnetic Resonance Imaging
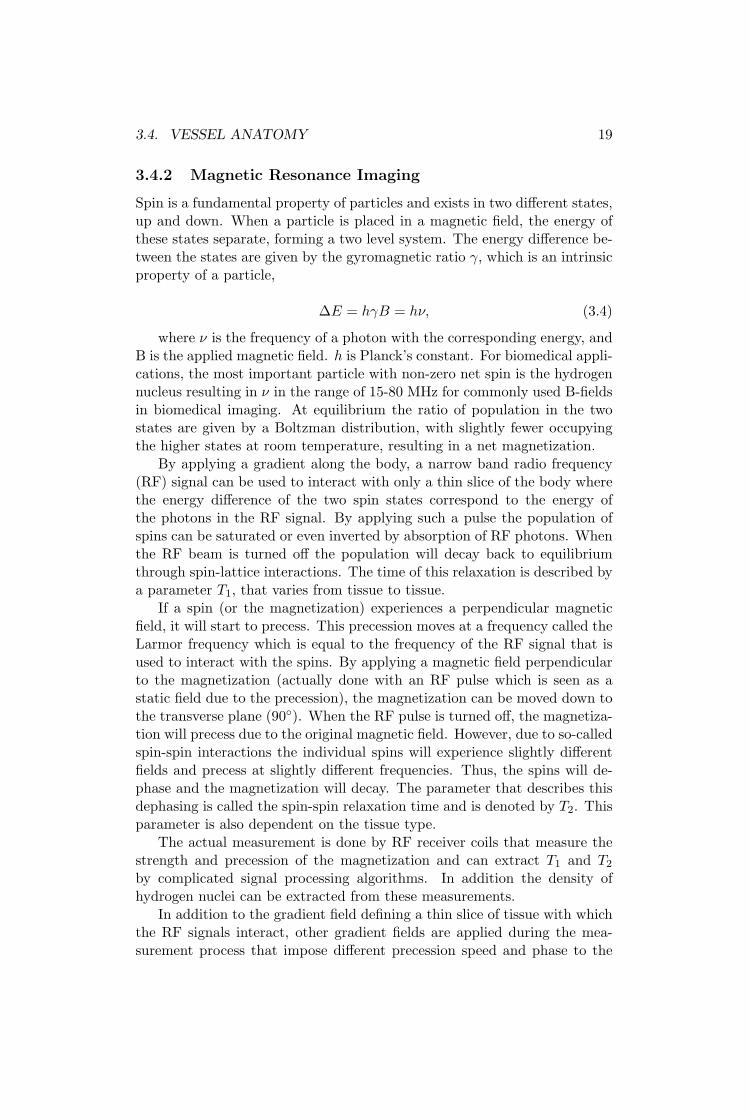
Spin is a fundamental property of particles and exists in two different states,up and down. When a particle is placed in a magnetic field, the energy ofthese states separate, forming a two level system. The energy difference be-tween the states are given by the gyromagnetic ratio γ, which is an intrinsicproperty of a particle,
∆E = hγB = hν, (3.4)
where ν is the frequency of a photon with the corresponding energy, andB is the applied magnetic field. h is Planck’s constant. For biomedical appli-cations, the most important particle with non-zero net spin is the hydrogennucleus resulting in ν in the range of 15-80 MHz for commonly used B-fieldsin biomedical imaging. At equilibrium the ratio of population in the twostates are given by a Boltzman distribution, with slightly fewer occupyingthe higher states at room temperature, resulting in a net magnetization.
By applying a gradient along the body, a narrow band radio frequency(RF) signal can be used to interact with only a thin slice of the body wherethe energy difference of the two spin states correspond to the energy ofthe photons in the RF signal. By applying such a pulse the population ofspins can be saturated or even inverted by absorption of RF photons. Whenthe RF beam is turned off the population will decay back to equilibriumthrough spin-lattice interactions. The time of this relaxation is described bya parameter T1, that varies from tissue to tissue.
If a spin (or the magnetization) experiences a perpendicular magneticfield, it will start to precess. This precession moves at a frequency called theLarmor frequency which is equal to the frequency of the RF signal that isused to interact with the spins. By applying a magnetic field perpendicularto the magnetization (actually done with an RF pulse which is seen as astatic field due to the precession), the magnetization can be moved down tothe transverse plane (90). When the RF pulse is turned off, the magnetiza-tion will precess due to the original magnetic field. However, due to so-calledspin-spin interactions the individual spins will experience slightly differentfields and precess at slightly different frequencies. Thus, the spins will de-phase and the magnetization will decay. The parameter that describes thisdephasing is called the spin-spin relaxation time and is denoted by T2. Thisparameter is also dependent on the tissue type.
The actual measurement is done by RF receiver coils that measure thestrength and precession of the magnetization and can extract T1 and T2
by complicated signal processing algorithms. In addition the density ofhydrogen nuclei can be extracted from these measurements.
In addition to the gradient field defining a thin slice of tissue with whichthe RF signals interact, other gradient fields are applied during the mea-surement process that impose different precession speed and phase to the
20 CHAPTER 3. DETECTION MODALITIES
magnetization at different positions within the slice. By the appropriatefiltering, the signal from a single voxel (volume element) can be found, andcan be used to generate a three dimensional image of the tissue.
Within the field of cardiology, MRI has two applications, one is to char-acterize the vessel wall by standard imaging procedures and the other isto measure blood flow. One common pulse sequence used in MRI is thespin-echo sequence. Here, the magnetization is rotated 90 and allowed todephase slightly before a 180 rotation is applied. This in effect causes thosespins that precess faster to be moved behind those that precess slower. Thespins will therefore rephase causing a so called spin-echo. Since the blood ismoving the spins will have moved during the pulse sequence and no echo isgenerated. This makes the blood vessels appear black in images and can bevisualized with good contrast (so called black-blood imaging). By applyingthe two pulses at different slices one can determine where the echo reap-pears and how far the blood has moved, thereby determining the blood flow(time of flight imaging). Similar effect can be achieved with phase contrastimaging where gradients with opposite signs are applied. If the object is sta-tionary the signals will cancel, but if the object has moved, a non-zero signalwill be generated. MRI is hampered by relatively long acquisition times(45minutes[24]) to achieve sufficient quality images, especially problematic formoving organs like the heart[6].
The resolution of current MRI scanners (at 1.5 T) is about 300 µmwithin a slice and 2-5 mm between slices[121]. This is too large to image,with detail, the walls of the coronary arteries, but it has been used to imagethe walls of the carotid arteries and the aorta. By combining several contrastmechanisms in MRI (e.g. T1, T2 and proton density) it has been shown thatplaque components like fibrous cap, lipid core, calcification, hemorrhage andvessel area can be determined. This was done by comparing MRI images ofthe carotid arteries, to histological sections acquired from endarterectomysamples[82, 20]. Resolution can be improved by stronger magnetic fields.One study with 3 T fields found improved signal-to-noise and contrast-to-noise in the images[48]. In the coronary arteries MRI found thicker vesselwalls in patients with cardiovascular disease compared to healthy patients,indicating that plaques with positive remodeling can be found by MRI[47].However, for details in the vessel wall structure, the resolution is not yetgood enough for the coronary arteries[67].
Clinically MRI has shown the ability to prospectively assess risk of cere-brovascular events[95]. This could perhaps also be used as a global assess-ment of the degree of vulnerability of the plaques and prospectively assessthe risk of cardiovascular events. MRI has also been used to show the effectof treatment by statins by imaging plaques in larger arteries[22, 23].
3.4. VESSEL ANATOMY 21
Contrast agents
Paramagnetic contrast agents have been used to enhance imaging of bloodsince it reduces the T1 parameter compared to the surrounding tissue. Astudy with gadolinium found that vessel wall volume changed by almost30% compared to the same vessel with noncontrast imaging, possibly dueto improvement in resolution[77].
Gadolinium has also been shown to have preferential uptake in extra-cellular matrix and could be used as a molecular marker for fibrous capdetection[116]. Gadolinium can also be labeled with LDL, HDL, fibrin andtissue factor to be preferentially absorbed in various tissues.
Ultrasmall paramagnetic iron oxide (USPIO) have been shown to bepreferentially absorbed in macrophages[106]. Since inflammation is an im-portant factor for plaque vulnerability, USPIO could perhaps be used as amolecular marker that can improve the detection and imaging of vulnerableplaques.
3.4.3 Computed tomography
Computed tomography (CT) images the x-ray attenuation in small volumeswithin the body. This is achieved by measuring the attenuation at var-ious different angles. By a mathematical reconstruction technique calledbackscatter projection, or more properly by the Radon transform, the x-rayattenuation in a single volume element (voxel) can be calculated and threedimensional images of the x-ray absorption can be generated.
The source of x-rays in CT-scanners is a cathode ray tube. Electrons thatare released from a hot filament are accelerated across an electrical field in avacuum tube. The electrons hit a metal disc where they excite tightly boundelectrons. As an electron decays back, it emits an x-ray photon. X-rays arealso produced as bremsstrahlung when electrona are accelerated (bent) bynuclei. One of the challenges for x-ray sources is to produce very steadyx-ray fluxes so that small contrast changes in the image is not obscured.Furthermore the resolution depends on the aperture of source, but thereis a trade off between signal strength and resolution that is limited by theheating of the x-ray source material.
Several classes of CT scanners exist, for example electron beam tomogra-phy (EBT), helical computed tomography (HCT) and multislice computedtomography (MSCT). Usually the source moves in a ring around the patientemitting a fan of electrons that is detected by a row of detectors that moveswith the source. If the patient is moved through the tube at the same time,the source will describe a helix around the patient (HCT). Several slicescan be detected at the same time to reduce imaging time by adding rowsof detectors, and possibly also more sources (MSCT). For cardiac imagingvery short image times are necessary due to the beating heart. EBT was
22 CHAPTER 3. DETECTION MODALITIES
designed especially for this. The source is then stationary and the scan-ning is achieved by electrically deflecting the electron beam across the x-raymaterial.
At the present, the resolution of CT (about 0.4 mm) is not good enoughto image individual plaque components in the coronary arteries. The res-olution of CT is fundamentally limited only by Compton scattering, butpresently by source and detector sizes. Synchrotron radiation (producedby electrons accelerated in a particle accelerator) has been used to imagepaleontolgical samples with micrometer resolution[30]. Contrast is also aproblem to overcome for imaging plaques since the x-ray absorption doesnot vary much between the different components. With advances in biolog-ical markers labeled with x-ray absorbers, this obstacle could be overcome.
Clinically, CT is presently used in cardiovascular management to mea-sure the amount of calcifications in the coronary vessels. Coronary calciumscore (CCS, or coronary artery calcium score, CACS) gives an indication ofthe global atherosclerotic burden and have strong predictive power for longterm outcome of coronary artery disease[6]. de Weert et al. have shownthat CT can be used to differentiate between lipids and fibrous tissue in thecarotid artery[28]. By correlating CT measurements with histology fromendarterectomy samples, they found that the x-ray absorption in Hounds-field units (HU)2 of calcifications, lipids and fibrous tissue was 657±416 HU,88±18 HU and 25±19 HU, respectively.
CT angiography with contrast agents as a noninvasive alternative tocoronary angiography has also been tested. Since regular angiography hasbeen so successful in guiding treatment, a noninvasive procedure with thesame clinical information could be very useful. CT angiography can be com-bined with CCS in one measurement to reduce radiation dose (even thoughthis somewhat reduces the quality of both assessments). The presence of ex-tensive calcification and stents makes CT for angiography difficult since theyscatter the x-rays strongly, masking nearby objects. One study comparedCT angiography with intravascular ultrasound (IVUS) for determining ves-sel wall composition and found good agreement[24]. The radiation dose inCT is higher than for conventional angiography but avoiding an invasiveprocedure could still be clinically advantageous.
As an example of how modalities without the necessary resolution to im-age coronary arteries can be valuable, it was shown that noninvasive (non-contrast) CT misses stenoses that can be seen functionally by SPECT [6].
The combination of CT and PET could provide a powerful combinationwith CT providing high resolution anatomical information, and PET givingmetabolic information.
2Houndsfiel units (HU) are a measure of x-ray absorption and are defined by settingwater to HU = 0 and air to HU = −1000.

3.5. VESSEL WALL ANATOMY, COMPOSITION AND FUNCTION 23
3.4.4 Ultrasonography
Ultrasonography uses equipment similar to echocardiography (section 3.3.2)to produce images of the walls of larger vessels. It can be used to imageplaques in larger arteries like the carotid and femoral arteries and the aorta.
In plaque imaging, ultrasonography has shown the ability to measure thethickness of the vessel between the intima and media. The external elasticmembrane and the lumen can in general be easily seen in ultrasound imagesand thus defines the thickness of the intima and media, which can be used asa measure of plaque thickness. This thickness in the carotid arteries (calledCIMT, carotid intima-media thickness) has been proposed as a screeningvariable that describes the systemic burden of atherosclerosis[71]. Withcontrast agents, ultrasonography has been used to image the vasa vasorum incarotid arteries, thereby giving information on the neovascularization duringatherosclerosis[35]. With the advent of targeted contrast agents that canattach to sites of inflammation, it could be possible to say something aboutthe physiological state of the plaque. A problem with targeted microbubblesis that for flows with large sheer stress values, as they are in the aorta andcarotid arteries, the fractional binding of microbubbles to the vessel wallwill be very low.
3.4.5 Ankle-Brachial pressure index
If there are stenotic parts in the lower limbs, this will cause the pressureto drop along the vessel. This can be assessed by measuring the bloodpressure at the ankle and the arm with a standard cuff. The differencein pressure at these two sites is called the Ankle-brachial pressure index(ABPI or ABI) If pressure difference is large, atherosclerosis in the lowerextremities is indicated. This techniques is used to quickly and cheaplyassess the systemic burden of atherosclerosis.
3.5 Vessel wall anatomy, composition andfunction
3.5.1 Intravascular ultrasound
Intravascular ultrasound (IVUS) uses a catheter based imaging techniquewhere an ultrasound transducer is located at the tip of the catheter. Thetransducer is advanced through the coronary arteries, guided by x-ray imag-ing (fluoroscopy). Motorized pullback of the catheter is then performed atconstant speed, usually acquiring images every 1 mm[24]. Imaging ratesup to 30 frames per second are achieved. Angular scanning of a vessel canbe achieved by mechanical rotation of the transducer by an electrical rotoroutside the body which is connected to the transducer with a torque wire.

24 CHAPTER 3. DETECTION MODALITIES
Another method, that allows for quicker image collection is to have an arrayof transducer elements located circumferentially around the catheter tip sothat the angular scanning is achieved electronically.
An advantage of IVUS is the proximity to the object in question sothat high frequency ultrasound, allowing for higher resolution, can be usedin spite of the strong attenuation. The excitation signal used in IVUS isgenerally around 30MHz, yielding an axial resolution around 100 µm, eventhough the theoretical limit is lower. The lateral resolution is slightly higher,usually around 300 µm[113]. The resolution is therefore not good enough todetermine the thickness of a thin fibrous cap.
The disadvantages of IVUS are the radiation dose (from the fluoroscopy)and the invasive nature of the procedure. In addition, IVUS is currentlyquite expensive.
The American college of cardiology (ACC) has published a guidelinedocument for interpreting and reporting IVUS images[66]. The primaryfeatures detectable with IVUS are the geometry of the lumen, calcifications,lipid-rich regions and the external elastic lamina. The lumen geometry givesan indication of the degree of stenosis. The lumen surface together with theexternal elastic lamina can be used to calculate the total vessel wall cross-sectional area[66]. This is usually called the intima-media thickness, andgives a measure of the size of a plaque. It thus offers an advantage comparedto angiography as it is also able to detect plaques with positive modeling.Calcifications are seen very clearly due to their strong echogenecity but withthe drawback that they shadow for the underlying layers. Calcifications aredetected with a sensitivity of 86-97%[113]. Plaques with calcified noduleshave been proposed as a type of vulnerable plaque and IVUS could play asignificant role in detecting these. Lipid rich areas are characterized by lowechogenecity compared to fibrous tissue, but the contrast is low as indicatedby the low sensitivities (around 40%) reported in attempts to differentiatebetween between fibrous and lipid rich tissue[113].
IVUS has also been used to better assess the effects of angioplasty andstenting than what is possible with angiography. It has also been used as anendpoint in clinical trials of medication treatments[24] where it was foundthat statins increased the echogenecity of plaques, hypothesized to be dueto increased fibrous or decreased lipid content in the plaques. In one studyIVUS was used to determine that ruptured plaques do not occur at minimalplaques but rather at large plaques with minimal stenosis due to positiveremodeling[36].
Radiofrequency analysis
Conventional IVUS measures the intensity of the backscatterd signal and therecorded signal has gone through several signal processing steps like enve-lope filtering and gain compensation before it is recorded. Radiofrequency

3.5. VESSEL WALL ANATOMY, COMPOSITION AND FUNCTION 25
(RF) ultrasound records the raw signal that is collected by the detector.Since a problem with conventional IVUS is that it differentiates poorly be-tween fibrous and lipid-rich plaques, it was proposed that perhaps the fre-quency spectrum of the raw RF signal contained information to improvethis differentiation. Several methods for analyzing the frequency signal hasbeen proposed, e.g integrated backscatter[46] and frequency spectral anal-ysis (Virtual Histology)[74]. Murashige et al. used wavelet analysis on theRF signals and found that lipid-rich plaques could be detected in-vivo witha sensitivity of 81% and a specificity of 85%[70]. A challenge has been to de-velop analog-to-digital converters operating at sufficient frequencies (a fewtimes the ultrasound frequency) and sufficient bit depth, but commercialequipment is now available.
Elastography
Elastography (also called palpography) is a method for extracting the me-chanical properties of the vessel wall. The tissue is imaged using IVUS attwo different pressures. By correlation analysis of the two images the move-ment or strain of the vessel during systole is determined. Several techniquesfor analyzing the signal to derive the strain are used[113]. By comparing thestrain to the stress induced by the blood pressure, the mechanical propertiesof the tissue can be extracted. The technique gives the ability to improve thecontrast between soft and hard tissue that is a problem with standard IVUS,since the echogenecity difference between soft and hard tissue is small. Theexcitation of stress in the vessel can either be achieved using the normalvariation in blood pressure or using an inflatable balloon[50].
Shear stress imaging
By combining IVUS with biplane angiography (collecting x-ray images intwo orthogonal planes), the actual three dimensional geometry of the lumencan be determined. This data can be used to create a finite element model ofthe lumen which can be used to accurately determine the flow pattern in thevessel. From this pattern the shear stress at the surface can be determined.The shear stress is important both as a factor for plaque rupture and thatit has strong effect on the endothelium and its production of cytokines andregulation of vascular tone.
Endothelial vasodilator dysfunction
The endothelium plays a key role in the development of atherosclerosis.Improper function of this organ has been associated with increased risk ofcardiovascular events. The function of the endothelium can be assessedby various different methods. The vessels can be exposed to various typesof stimuli, either pharmacologically or by exercise, which would cause a

26 CHAPTER 3. DETECTION MODALITIES
reaction in the vessel wall. By measuring this response, e.g. by IVUS, theactual functioning of the vessel wall can be assessed.
3.5.2 Thermography
Temperature is a tightly regulated parameter in the human body. Justa few degrees of change during a fever quickly reduces the ability to dowork. A few degrees more can be fatal (44-46C). Too low temperaturescan lead to cardiac arrythmias while too high temperatures leads to proteindenaturation.
Temperature is regulated by a thermostat in the preoptic area in the hy-pothalamus. This center receives impulses from thermal sensors in the skinand in the hypothalamus. When the temperature falls below the desiredlevel the preoptic center triggers several heat promoting effects: contractionof blood vessels, release of hormones that increase metabolism (thyroid,epenephrine), and shivering. The opposite process is triggered if the tem-perature is too high. Fever occurs when the thermostat in the hypothalamusis reset to regulate at a higher temperature. This process can for examplebe initiated by phagocytes eating bacteria that release interleukin-1 whichagain initiates the production of prostaglandines which reset the hypotha-lamus thermostat[103].
Increased heat generation has been linked to inflammation by two macro-scopically apparent phenomena. One is that if the body is infected, we geta fever. This is, as explained above, related to a regulatory mechanism andnot increased metabolism. The other is that a local inflammation causes theskin to appear red and feel hot. However, this heat is not due to increasedmetabolism only (if at all), but also that the vessels are dilated (the in-creased optical absorption of hemoglobin causing the redness), so that moreblood from the central body reaches the skin circulation. Normally, the corebody temperature is higher than the skin temperature by a few degrees.
To make a mathematical model of the temperature distribution in thebody, the physical mechanisms of heat transport must be determined. Onthe surface of the body the transport mechanisms are radiation into thesurroundings (60%), convection due to heated air at the skin surface (15%),evaporation of water on the skin and in the lungs (22%) and convectioninto the surroundings (2%). The percentages are given for a person atrest in normal room temperature with normal humidity, and can changesignificantly in other conditions. E.g. at 100% humidity, evaporation cannot transport temperature away from the body.
Within the human body, the primary heat transport is by convection ofthe flowing blood. Radiation is not a significant source of thermal conductionwithin the body[57]. Thermal transport by conduction requires a thermalgradient, and is not a major factor within the body since the temperature isquite similar throughout the body. The temperature in the body is regulated

3.5. VESSEL WALL ANATOMY, COMPOSITION AND FUNCTION 27
by the blood moving the heat generated in the tissue to the skin and lungswhere it is dissipated (by conduction, radiation or vaporization). Thereforethe arterial blood must necessarily be colder than the internal organs, butwarmer than the skin.
If every capillary in a given tissue volume to be modeled was to beincluded, the resulting geometry would be unwieldly, even for numericalmethods. Therefore an assumption (and simplification) is made that forcapillaries and small vessels, that the flow is so slow that the blood reachesthermal equilibrium with the surrounding tissue during its passage. Thus,the cooling by the blood is assumed to be proportional to the perfusion ofthe tissue, and the temperature difference between the arterial and venousblood. This model is not valid when the flow velocity increases to the pointwhere the blood does not reach equilibrium on its pass through the tissue.The vessel must then be modeled as a separate geometry.
Based on these physical assumptions the so-called bioheat equation canbe derived[76].
κ∇2T − ρtct∂T
∂t= −q + ρbcbω(T − T0) + ρbcb~vb · ∇T. (3.5)
The two last terms on the right side represent perfusion and the con-vection, respectively. Usually, the convection term (the last term) is notincluded in the bioheat equation.
From autopsy studies it has been shown that macrophages are presentin great numbers in ruptured plaques[26]. This prompted the hypothesisthat matrix digesting enzymes released by the macrophages degrade the fi-brous cap, increasing the vulnerability of the plaque. Since macrophagesrepresent an inflammatory process, it was postulated that an increase intemperature of the plaque would accompany the macrophage infiltration.However, a recent autopsy study has shown that in patients with acute my-ocardial infaraction, the number of inflammatory cells was four-fold higherthan in a control group but that the increased inflammation was present instable plaque as well as non-culprit segments. The difference in inflamma-tion was only 30% between stable and vulnerable plaques within the samegroup. This study indicates that inflammation is primarily systemic and notlocated in individual plaques.
The first investigation of thermography was performed by Casscells et al.whom examined the temperature variations in carotid plaques, excised dur-ing endarterectomy, and measured the temperature using a thermistor[21].This was compared to the density of macrophages, determined from histol-ogy. They found good correlation between macrophages and temperatureand found temperature variations up to 1 K.
Many in-vivo studies have been performed both on humans and ani-mals. The first in-vivo study was performed by Stefanadis et al. who mea-sured the thermal heterogeneity in coronary vessels in patients with differ-

28 CHAPTER 3. DETECTION MODALITIES
ent diagnoses[93]. They found that the thermal heterogeneity was greaterin patients having suffered a myocardial infarction compared to patientssuffering from unstable angina. Patients with stable angina had the lowestthermal heterogeneity. The interpretation was that patients who had suf-fered a myocardial infarction had a higher probability of having an inflamedvulnerable plaque which caused the increased thermal heterogeneity. Thisgroup has in several subsequent clinical studies shown the effect of ther-mography. It has been shown to be a predictor of clinical outcome afterpercutaneous coronary intervention[91], statin treatment has been shownto reduce thermal heterogeneity[90] in patients, and thermal heterogenietyhas shown good correlation with concentration of acute phase proteins[92].Results of intracoronary thermography is quite varied, so it is interesting tonote that already papers are published where thermography is considered tobe a standard measuring technique from which secondary information canbe derived, e.g. the effect of medication on plaques[94]. It has been previ-ously mentioned that there is a dispute about whether vulnerable plaquesshould be considered as a diffuse or focal diseases. A study from Stefanadisgroup used thermography to investigate whether temperature heterogene-ity varies between culprit and non-culprit lesions[105]. Several companies(Volcano therapeutics, Thermocoil guidewire and Imetrix) have developedcommercial equipment, indicating their belief in the method.
Recent studies have found much lower values than the initial studiesby Stefanadis[85, 81, 104] and did not find thermal heterogeneity over 0.1K in more than 40% of the patients[81]. Interestingly, one study foundthat the measured temperature heterogeneity that has been reported in thelitterature have decreased over the years[99]. Perhaps the laws of physicsare not as constant as Einstein assumed[31].
However, only a few studies have tried to analyze the physics of thetemperature generation and measurement process. These were finite el-ement studies that investigated the effect of plaque geometry[98], probegeometry[97] and heat source location on temperature measurements[40].Since no direct experimental values for the heat generation in plaques exist,these studies used heat generation which were derived by requiring that theyfit experimental values (i.e. 1 K temperature increase).
There are two important facts that are almost never considered in thepublished thermography studies. One is that arterial blood must be slightlycolder than the tissue. The arterial blood must be colder than the tissue(except at the skin and lungs) so that it can absorb the heat generated inthe organs and transport it to the skin and lungs where it is dissipated.The other is that temperatures between organs vary. The lungs will forexample be cooler than the heart since it is in contact with the colder air. Inother organs the temperature difference will not be large due to the efficientperfusion. These factors are important to consider in the measurementprocess.

3.5. VESSEL WALL ANATOMY, COMPOSITION AND FUNCTION 29
Since the arterial blood is cooler than the tissue, the thermal contactwith the vessel wall will have a significant effect on the measurements. If theprobe moves but a tiny bit from the vessel wall, the measured temperaturewill fall rapidly. Also the vessel wall temperature will depend on surroundingorgans. This is especially true for the aorta which pass by diverse organs aslungs, heart, liver and intestines[111].
A study included in this thesis took another approach (Paper IV). Basedon physiological consideration we found an upper limit on heat generationthat could be expected in a plaque and found that a temperature increasein the center of the plaque was less than 0.1 K[57].
3.5.3 Optical coherence tomography
Optical coherence tomography (OCT) quantifies the amount of optical scat-tering within a small volume of tissue. The tissue is irradiated and thereflected light due to scattering is measured. By measuring the time it takesthe light to go from the source via the tissue and to the detector, the pointwithin the tissue where the reflected light originated can be determined.In this respect it is equivalent to intravascular ultrasound except that itmeasures the reflection of light waves instead of sound waves.
The time difference at the detector between two signals generated atlocations separated by 10 µm is on the order of 10−13 s, and only interfer-ometric methods can be used to measure such small time differences. Thelight from the source passes a beam splitter where one beam is directed tothe tissue and the other to a reference mirror. If a broad band light source isused there will be maximal constructive interference at the detector betweenthe two beams only when their optical path lengths are identical.
Light sources that are used in OCT are usually super luminescent diodes(SLD) or Ti:Sapphire lasers with bandwidths 70 nm and 120 nm, respec-tively. Their center wavelengths are usually 1300 nm and 800 nm respec-tively. The resolution in the direction parallel to the beam is dependent onthe bandwidth and the center wavelength. The theoretical limit lc is givenby[14],
lc =2 ln(2)λ2
0
π∆λ, (3.6)
where λ0 is the center wavelength and ∆λ is the bandwidth. For a SLDsystem the resolution is about 13 µm and about 4 µm for a Ti:Sapphiresystem.
The penetration depth depends on the scattering and absorption in thetissue. The absorption loss can be somewhat compensated for by increasingthe incident power. Due to the scattering there will be some photons thathave travelled the same optical length as the volume in question even thoughthey originate somewhere else. At a certain depth there will be more of these

30 CHAPTER 3. DETECTION MODALITIES
scattered photons than those originating from the volume in question andthe signal cannot be improved by increasing incident power. The penetrationdepth in coronary tissue have been investigated for the various layers andpathological states[64]. It was found that the attenuation coefficient at 800nm (Ti:Sapphire laser) ranged from 3 − 10 mm−1 and from 2.3 − 7 mm−1
at 1300 nm (SLD). We see that the penetration depth is higher at 1300 nmthan at 800 nm even though the absorption is probably highest at 1300 nm,indicating that scattering is the primary limiting factor.
The resolution in the direction perpendicular to the direction of lightpropagation is achieved by a lens and the resolution depends on the waistof the focused beam at the volume in question. Two different systems havebeen used for intravascular applications. One system (LightLab Inc.) usesa miniaturized microscope consisting of two lenses, one converging and onediverging. The other uses a gradient index lens (Massachusetts GeneralHospital). In both systems the light is guided through the catheter by anoptical fiber and directed towards the vessel wall by a prism. Scanning inthe transverse directions are achieved by rotation and pullback of the probe.The systems achieve frame rates of 30 and 8 frames/s, respectively.
OCT is equally invasive to IVUS and in-vivo studies have shown thatcomplications (ECG changes indicating ischemia and chest pain) are equallyfrequent in these two modalities with no serious events reported. Due to thehigh scattering of blood, saline flushing is necessary during measurementand puts an additional burden on the myocardium. The scattering of bloodis due to the index mismatch between the erythrocytes and the plasma.Some work on index-matching by adding dextran and ioxaglate (a contrastagent) to the plasma has been shown to increase the reflected signal fromthe tissue by 70% and 40%, respectively[13]. The incident power used was inthe range of 5-8 mW and is considered safe. However, this depends entirelyon the irradiation time and the focus of the beam but is usually safe in thisapplication due to the high scanning rate (see paper V).
Since the resolution of OCT is an order of magnitude higher than theresolution of IVUS, it seems likely that new physiological information canbe gained.
A study of 357 artery segments from the aorta, carotid and coronaryarteries found OCT image criteria for physiological classification[119]. Theycorrelated strong reflection with fibrous cap, calcifications with echolucentregions with sharp borders and lipid rich regions with echolucent regionswith diffuse borders. A subset of the measurements were used as a trainingset for two investigators to classify plaques based on OCT images. Theyshowed good specificity and sensitivity in the remaining samples for detect-ing fibrous cap, lipid rich regions and calcifications, compared to histologicalclassification.
An in-vivo study found that OCT could detect all physiological char-acteristics that were detectable with IVUS, but in addition also detected
3.5. VESSEL WALL ANATOMY, COMPOSITION AND FUNCTION 31
features related to intimal hyperplasia and lipid-rich regions, indicating thatOCT provides additional information compared to IVUS[44].
The high resolution of OCT makes it ideal for measuring cap thickness.Two studies have shown that there is good correlation between cap thicknessmeasured by OCT compared to histology[64, 43]. Oddly enough one of thestudies reported the linear coefficient between OCT and histology less thanone and the other greater than one.
Macrophage infiltration is an important parameter in plaque vulnera-bility because it is believed that the enzymes released by the macrophagesdegrade the fibrous cap. Since the index of refraction is different in the lipidrich macrophages compared to the surrounding tissue it was proposed thatthis would lead to a greater variance in the OCT signal. This was tested in-vitro and good correlation between OCT variance and macrophage densitywas found[96]. An in-vivo study found that the OCT variance was greater inpatients with unstable angina compared to stable angina, speculating thathigher incidence of vulnerable plaques with large macrophage densities canbe found in unstable patients[59].
Another area where OCT could have an impact is stenting. Due to itshigh resolution it can better monitor neointimal growth and dissections afterstent placement, thereby providing information that can be used to improvethe procedure.
Since apparently vulnerable plaques have been found in several vesselsduring autopsy studies, it has been proposed that further information mustbe found to delineate which plaques are vulnerable. One such feature couldbe the collagen content of the fibrous cap. Since collagen is birefringent,a measure of the degree of birefringence in the cap could be a measure ofthe collagen content in the cap. One study using polarization sensitive OCTfound that the degree of birefringence in the cap could be correlated with thecollagen content, determined from histological stains with picrosirious[37].
OCT could also be combined with spectroscopy for even better charac-terization of tissue, but this has of yet not been investigated.
3.5.4 Multiphoton microscopy
Nonlinear optics
The polarization of a medium due to an electrical field can be described bythe susceptibility,
P = ε0(χ(1)E + χ(2)E2 + ...) (3.7)
Here we have used scalars but in reality P and E are vectors and χ(1)
is a second rank tensor, χ(2) is third rank tensor and so on[10]. This is fora bulk medium. For a single molecule a similar equation can be used by

32 CHAPTER 3. DETECTION MODALITIES
exchanging the polarization with the dipole moment and the susceptibilitywith the polarizability.
If monochromatic light is used the polarization due to the second term inthe above equation results in polarization oscillating at the double frequency,hence light of half the wavelength of the incident light is generated, this iscalled second harmonic generation (SHG). In addition, the molecules canalso absorb two photons at the same time. Thus, fluorescent states in amolecule can be excited by two photons with half the energy of the excitedstate. This is called two-photon excited fluorescence (TPEF). SHG andTPEF are the most common nonlinear optical processes used in imaging ofbiological tissue even though other processes like third harmonic generationand coherent anti-stokes Raman scattering (CARS) are used.
The second order susceptibility is very small so that very strong electricfields must be used to generate detectable signals. To avoid high averagepower from the laser that could cause photothermal damage to the tissue,pulsed lasers with very short pulses (resulting in high peak intensities) areused. The most popular laser system is the Ti:Sapphire laser that deliverspulses of about 100 fs, with a repetition rate of about 100 MHz, and averagepower of about 1 W. To achieve short pulses relatively large bandwidths areneeded (about 10 nm) so the generated signal is not only second harmonicgeneration but also sum frequency generation.
Multiphoton microscopy
Using nonlinear properties of tissues have several advantages in microscopy.Red light penetrates deeper than the blue light traditionally used for excitingfluorophores and can therefore provide imaging deeper into the tissue. Alsothe excited signal depends quadratically on the intensity so that if a highnumerical aperture objective is used, a signal is only generated near thefocus. The signal will in the geometrical approximation decay as d−4, whered is the distance from the focus. This approximation is not valid near thefocus where the geometrical optics approximation is not valid. This meansthat a confocal effect is achieved without a confocal pinhole and the excitedlight can be collected more efficiently. Also, photobleaching is reduced sincethe long wavelength light is very weakly absorbed outside the focus.
Exogenous dyes can be added to a sample to improve TPEF imagingof specific structures, but also endogenous fluorophores generate TPEF andsome molecules also generate SHG. Collagen I and III are the only biologicalmolecules known to produce SHG. TPEF, on the other hand, is generatedby several different proteins.
Multiphoton microscopy (MPM), the combination of microscopy andnonlinear excitation, has been used for imaging many biological tissues,both at the cellular and tissue level of organization. This include brain[41,100, 53, 45], tumors[15], cartilage[120] and skin[49].

3.5. VESSEL WALL ANATOMY, COMPOSITION AND FUNCTION 33
Figure 3.1: MPM image of a normal artery, near the surface. TPEF isshown in green and SHG in red. A dense layer of elastic fibers exhibitingTPEF can be seen over a layer of thin, scattered collagen fibers that giveSHG. The image is 230 x 230 µm.

34 CHAPTER 3. DETECTION MODALITIES
MPM has also been used to image cardiovascular structures. One studyof atherosclerotic mice found that different structures of the plaques couldbe seen both in intact tissue and in stained thin sections[110]. A few studieshave also confirmed that elastin and collagen can be differentiated in humanvessel walls[122, 84]. As an example of a clinical application, one groupinvestigated the vessel of rats where the parents had been exposed to lindane(a pesticide), and found changes in the vessel structure of the offspring[9]
It has thus been shown that MPM can efficiently image connective fiberswithin tissue, both elastin and collagen. In atherosclerosis, advanced plaquesare characterized by a collagenous cap that covers the lipid-rich necrotic core.For vulnerable plaque the danger is that this cap ruptures exposing the lipidcore. It is thus the mechanical strength of the cap that ultimately determinesthe vulnerability of the plaque to rupture (even though thrombotic blood andhealth of myocardium are important factors for the outcome). By imagingthe individual collagen fibers within the cap, a better understanding of itsmechanical properties can be gained[58]. (See figures 3.1 and 3.2.)
Developing an intravascular probe for multiphoton microscopy seemschallenging but not impossible. There are two main obstacles. One is todevelop a miniaturized microscope objective with focus control. This couldperhaps be achieved by microoptical devices. The other challenge is to guidethe necessary high intensity pulse through a fiber. The problem is that thebroad wavelength will lead to both linear and nonlinear dispersion. However,this problem can also be overcome by prechirping techniques[107].
3.5.5 Optical spectroscopy
This section will present optical methods where light is collected in thebackscatter mode, but without imaging. The reflected light gives informa-tion on the bulk optical properties of the sample which can be used to par-tially derive its chemical composition. Techniques that have been used forcharacterization of plaque are diffuse reflection spectroscopy (using visibleor near-infrared (NIR) light), fluorescence spectroscopy and Raman spec-troscopy.
Diffuse reflection spectroscopy
Tissue is a very turbid medium and the refractive index varies betweeninterstitial fluid, membranes, connective fibers, lipids and cell nuclei. Thisvariation in the refractive index causes the light to be scattered, i.e. theelectromagnetic field changes its direction of propagation. When the lightis scattered enough times it can be reemitted from the surface, appearingas reflected light. In the field of tissue characterization this is commonly
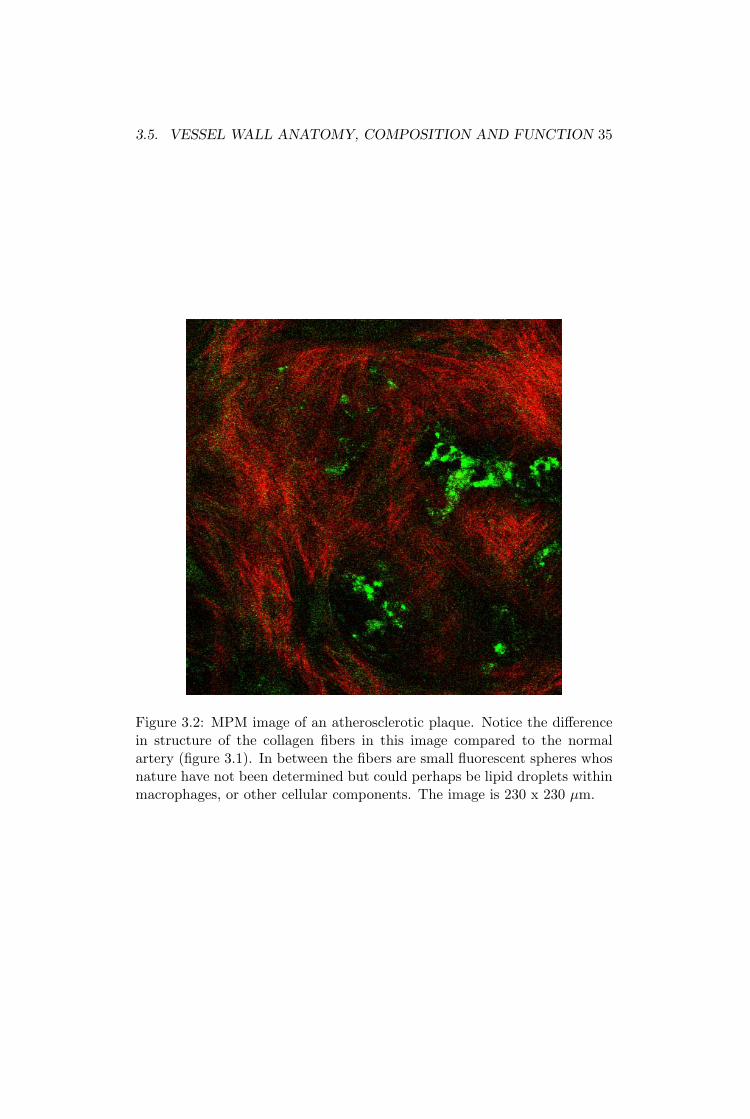
3.5. VESSEL WALL ANATOMY, COMPOSITION AND FUNCTION 35
Figure 3.2: MPM image of an atherosclerotic plaque. Notice the differencein structure of the collagen fibers in this image compared to the normalartery (figure 3.1). In between the fibers are small fluorescent spheres whosnature have not been determined but could perhaps be lipid droplets withinmacrophages, or other cellular components. The image is 230 x 230 µm.
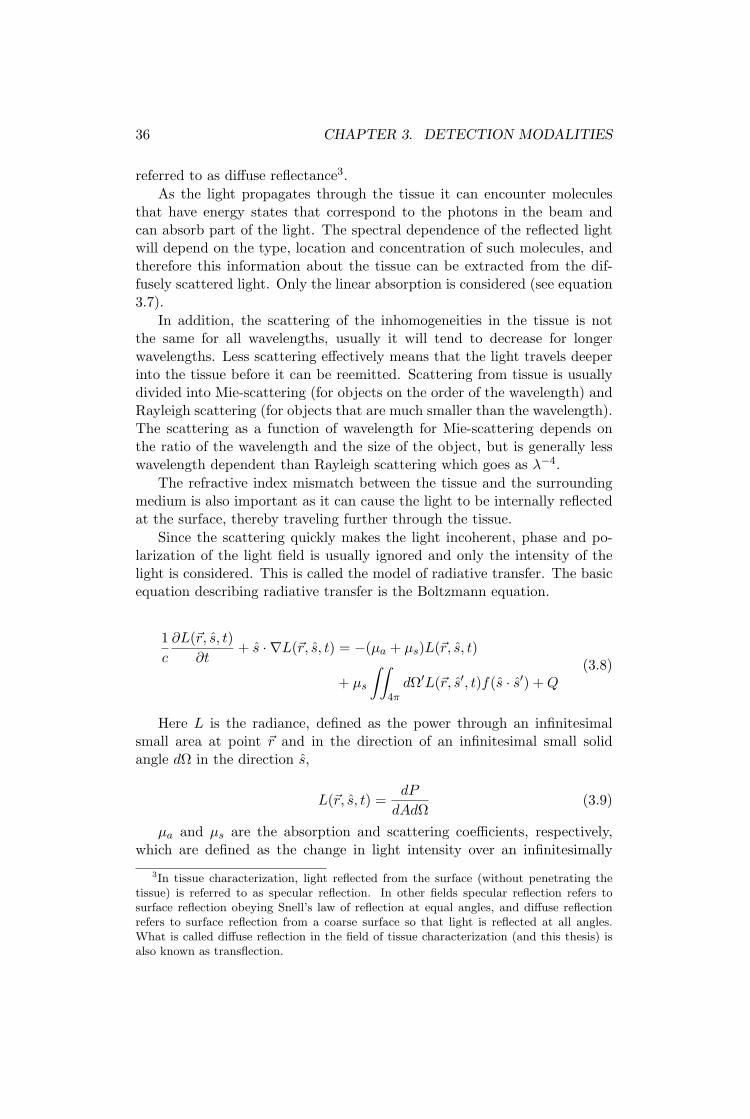
36 CHAPTER 3. DETECTION MODALITIES
referred to as diffuse reflectance3.As the light propagates through the tissue it can encounter molecules
that have energy states that correspond to the photons in the beam andcan absorb part of the light. The spectral dependence of the reflected lightwill depend on the type, location and concentration of such molecules, andtherefore this information about the tissue can be extracted from the dif-fusely scattered light. Only the linear absorption is considered (see equation3.7).
In addition, the scattering of the inhomogeneities in the tissue is notthe same for all wavelengths, usually it will tend to decrease for longerwavelengths. Less scattering effectively means that the light travels deeperinto the tissue before it can be reemitted. Scattering from tissue is usuallydivided into Mie-scattering (for objects on the order of the wavelength) andRayleigh scattering (for objects that are much smaller than the wavelength).The scattering as a function of wavelength for Mie-scattering depends onthe ratio of the wavelength and the size of the object, but is generally lesswavelength dependent than Rayleigh scattering which goes as λ−4.
The refractive index mismatch between the tissue and the surroundingmedium is also important as it can cause the light to be internally reflectedat the surface, thereby traveling further through the tissue.
Since the scattering quickly makes the light incoherent, phase and po-larization of the light field is usually ignored and only the intensity of thelight is considered. This is called the model of radiative transfer. The basicequation describing radiative transfer is the Boltzmann equation.
1c
∂L(~r, s, t)∂t
+ s · ∇L(~r, s, t) = −(µa + µs)L(~r, s, t)
+ µs
∫∫4π
dΩ′L(~r, s′, t)f(s · s′) + Q(3.8)
Here L is the radiance, defined as the power through an infinitesimalsmall area at point ~r and in the direction of an infinitesimal small solidangle dΩ in the direction s,
L(~r, s, t) =dP
dAdΩ(3.9)
µa and µs are the absorption and scattering coefficients, respectively,which are defined as the change in light intensity over an infinitesimally
3In tissue characterization, light reflected from the surface (without penetrating thetissue) is referred to as specular reflection. In other fields specular reflection refers tosurface reflection obeying Snell’s law of reflection at equal angles, and diffuse reflectionrefers to surface reflection from a coarse surface so that light is reflected at all angles.What is called diffuse reflection in the field of tissue characterization (and this thesis) isalso known as transflection.

3.5. VESSEL WALL ANATOMY, COMPOSITION AND FUNCTION 37
900 1000 1100 1200 1300 1400 1500 1600 1700
Ref
lect
ance
(A
.U.)
Wavelength (nm)
0.1mm0.3mm0.5mm0.7mm0.9mm
Figure 3.3: Monte carlo simulation of a layer of fat of various thickness 0.1mm below the surface, giving the diffuse reflection as a function of wave-length. The absorption of pure porcine fat was used for the lipid layer. Theonly absorber in the rest of the tissue was water at a 70% concentration.The absorption peak of fat at 1210 nm can be seen.
small length dx, dI = µiIdx, where i can be substituted by either a or s.The term f(s · s′) is the probability that a photon travelling in the directions will be scattered in the direction s′. This factor is also called the phasefunction. Q is a source term and c the speed of light. The source term canfor example represent fluorescent light generated in the tissue, or collimatedlight that is diffused when the diffusion approximation is used (see below).
The Boltzmann equation cannot be solved analytically. Simplificationsmust be made or one must resolve to numerical methods. One common sim-plification for samples where the scattering dominates over the absorptionis the diffusion approximation. The basis of this model is that since themedium is highly scattering, the radiance will be nearly isotropic and canbe described by an isotropic fluence rate together with a small directionalflux
L =φ
4π+
34π
~j · s (3.10)
Substituting this expression in the Boltzmann equation and integratingover the appropriate variables yields a diffusion type equation that can besolved analytically[39].
Monte Carlo simulation is a popular numerical tool. This techniquesimulates packages of photons that are launched into the tissue and theirpath is traced using probabilities based on µa, µs and f . By repeating thismany times a statistical distribution of the light in the tissue can be found.Figure 3.3 shows Monte Carlo simulations of a one dimensional model of
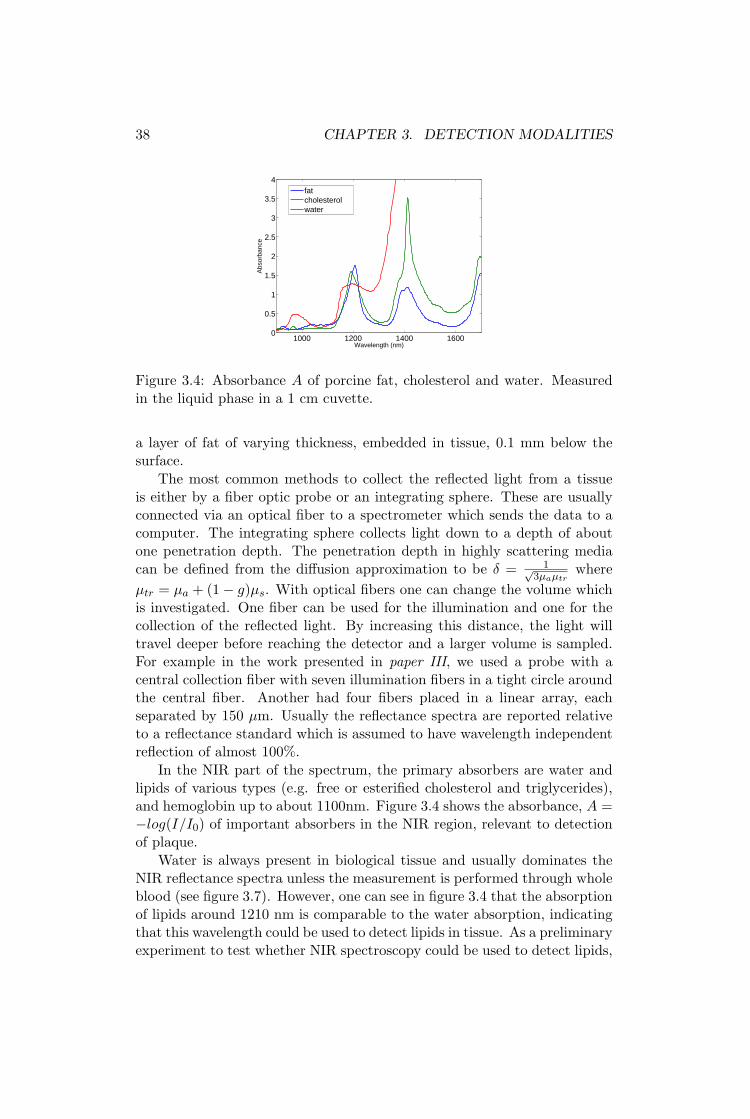
38 CHAPTER 3. DETECTION MODALITIES
1000 1200 1400 16000
0.5
1
1.5
2
2.5
3
3.5
4
Wavelength (nm)
Abs
orba
nce
fatcholesterolwater
Figure 3.4: Absorbance A of porcine fat, cholesterol and water. Measuredin the liquid phase in a 1 cm cuvette.
a layer of fat of varying thickness, embedded in tissue, 0.1 mm below thesurface.
The most common methods to collect the reflected light from a tissueis either by a fiber optic probe or an integrating sphere. These are usuallyconnected via an optical fiber to a spectrometer which sends the data to acomputer. The integrating sphere collects light down to a depth of aboutone penetration depth. The penetration depth in highly scattering mediacan be defined from the diffusion approximation to be δ = 1√
3µaµtrwhere
µtr = µa + (1− g)µs. With optical fibers one can change the volume whichis investigated. One fiber can be used for the illumination and one for thecollection of the reflected light. By increasing this distance, the light willtravel deeper before reaching the detector and a larger volume is sampled.For example in the work presented in paper III, we used a probe with acentral collection fiber with seven illumination fibers in a tight circle aroundthe central fiber. Another had four fibers placed in a linear array, eachseparated by 150 µm. Usually the reflectance spectra are reported relativeto a reflectance standard which is assumed to have wavelength independentreflection of almost 100%.
In the NIR part of the spectrum, the primary absorbers are water andlipids of various types (e.g. free or esterified cholesterol and triglycerides),and hemoglobin up to about 1100nm. Figure 3.4 shows the absorbance, A =−log(I/I0) of important absorbers in the NIR region, relevant to detectionof plaque.
Water is always present in biological tissue and usually dominates theNIR reflectance spectra unless the measurement is performed through wholeblood (see figure 3.7). However, one can see in figure 3.4 that the absorptionof lipids around 1210 nm is comparable to the water absorption, indicatingthat this wavelength could be used to detect lipids in tissue. As a preliminaryexperiment to test whether NIR spectroscopy could be used to detect lipids,

3.5. VESSEL WALL ANATOMY, COMPOSITION AND FUNCTION 39
900 1000 1100 1200 1300 1400 1500 1600 17000
10
20
30
40
50
60
Ref
lect
ance
(%
)
Wavelength (nm)
Thick fatThin fatMuscle
Figure 3.5: Reflection spectra taken at various sites on the outside of abovine heart, both muscular areas and of thick adipose tissue. The spectra ofmuscular tissue shows the water absorption at 980 nm, 1190nm and around1450nm. The spectra of thick adipose tissue shows lipid absorption peaks at930 nm, 1080 nm and 1210 nm. In addition the large water absorption peakat 1450 nm dominates the spectra at higher wavelengths. The area withthin adipose tissue had some dried blood over it which can be seen by thebroad absorption from 900 nm to about 1100 nm due to oxy-hemoglobin.
we measured the diffuse reflectance at various sites on the surface of a bovineheart. Figure 3.5 shows the reflectance from muscle and adipose tissue. Theabsorption peaks from figure 3.4 are clearly visible. Water at 980 nm, 1190nm and 1450 nm and lipids at 930 nm, 1050 nm and 1210 nm.
A few studies have been published in this field. The first study usedFourier transform infrared (FTIR) spectroscopy and found that they couldspatially differentiate between lipids and connective tissue in sections ofaortic tissue[61]. They collected spectra from 3-12 µm. This has since beendeveloped to include imaging and it has been found that elastic lamellaand foam cells could be imaged[19]. Spectra were collected in the range2.6-10 µm However IR light is not very useful for in-vivo applications sincethe penetration depth is only about 10 µm. Using NIR light gives goodpenetration depth, especially in the so-called optical window from 800-1200nm. One study using light from 1100-2200 nm for reflection spectroscopyusing partial least squares analysis found that they could detect lipids, thincap and inflammatory cells with good sensitivity and specificity (90% and93%, 77% and 93%, 84% and 89%, respectively)[68]. A similar study usingcluster analysis found that lipid/protein ratio extracted from the spectracorrelated with histological classification according to the American HeartAssociation[114]. A company called Infraredx is trying to commercialize thistechnique and claims to be on the brink of clinical trials.
In the visible range important absorbers are blood and carotenoids. Clin-
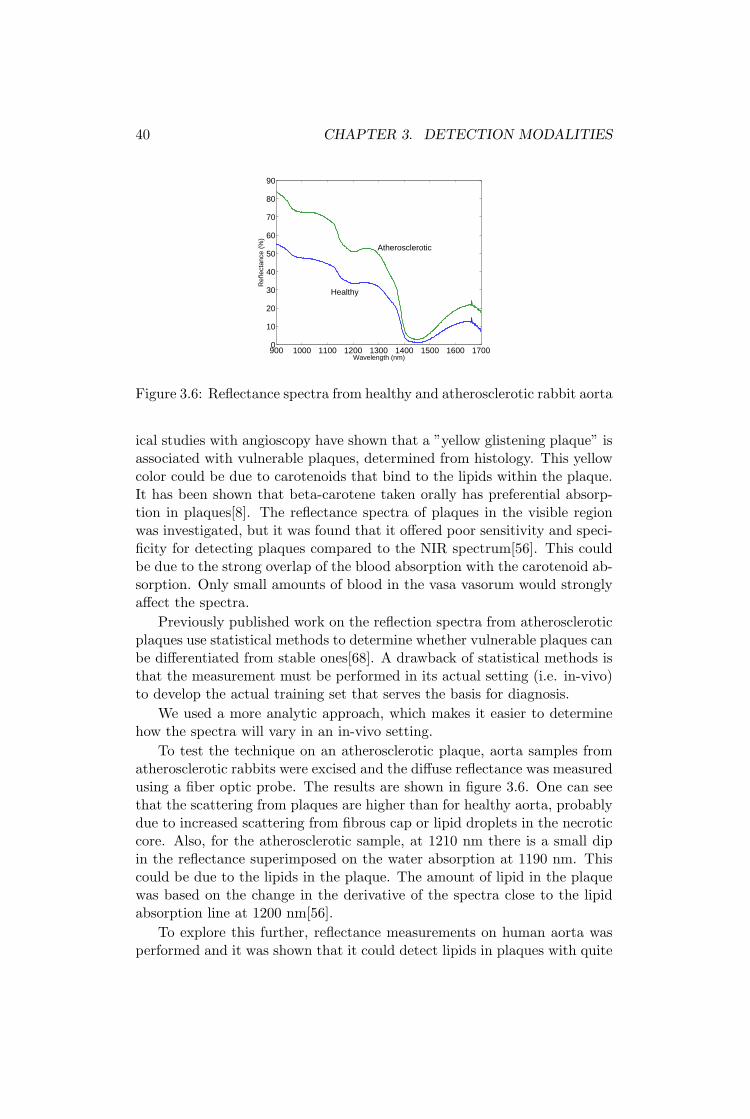
40 CHAPTER 3. DETECTION MODALITIES
900 1000 1100 1200 1300 1400 1500 1600 17000
10
20
30
40
50
60
70
80
90
Ref
lect
ance
(%
)
Wavelength (nm)
Healthy
Atherosclerotic
Figure 3.6: Reflectance spectra from healthy and atherosclerotic rabbit aorta
ical studies with angioscopy have shown that a ”yellow glistening plaque” isassociated with vulnerable plaques, determined from histology. This yellowcolor could be due to carotenoids that bind to the lipids within the plaque.It has been shown that beta-carotene taken orally has preferential absorp-tion in plaques[8]. The reflectance spectra of plaques in the visible regionwas investigated, but it was found that it offered poor sensitivity and speci-ficity for detecting plaques compared to the NIR spectrum[56]. This couldbe due to the strong overlap of the blood absorption with the carotenoid ab-sorption. Only small amounts of blood in the vasa vasorum would stronglyaffect the spectra.
Previously published work on the reflection spectra from atheroscleroticplaques use statistical methods to determine whether vulnerable plaques canbe differentiated from stable ones[68]. A drawback of statistical methods isthat the measurement must be performed in its actual setting (i.e. in-vivo)to develop the actual training set that serves the basis for diagnosis.
We used a more analytic approach, which makes it easier to determinehow the spectra will vary in an in-vivo setting.
To test the technique on an atherosclerotic plaque, aorta samples fromatherosclerotic rabbits were excised and the diffuse reflectance was measuredusing a fiber optic probe. The results are shown in figure 3.6. One can seethat the scattering from plaques are higher than for healthy aorta, probablydue to increased scattering from fibrous cap or lipid droplets in the necroticcore. Also, for the atherosclerotic sample, at 1210 nm there is a small dipin the reflectance superimposed on the water absorption at 1190 nm. Thiscould be due to the lipids in the plaque. The amount of lipid in the plaquewas based on the change in the derivative of the spectra close to the lipidabsorption line at 1200 nm[56].
To explore this further, reflectance measurements on human aorta wasperformed and it was shown that it could detect lipids in plaques with quite

3.5. VESSEL WALL ANATOMY, COMPOSITION AND FUNCTION 41
900 1000 1100 1200 1300 1400 1500 1600 17000
10
20
30
40
50
60
70
Wavelength (nm)
Ref
lect
ance
(%
)
0 mm0.5 mm0.75 mm1.25 mm1.75mm3.0 mm
Figure 3.7: Measurement of a piece of adipose tissue taken from a bovineheart measured through a thin layer of blood, the thickness which is specifiedin the legend.
good sensitivity and specificity[56].In intravascular measurements, the presence of blood might cause a prob-
lem for detection of plaque since blood has a significant absorption in theNIR range. Figure 3.7 shows the reflectance spectra when a sample of adi-pose tissue was measured through a layer of blood and how the signal varieswith increasing distance between the probe and the sample. Through 3 mmof blood the absorption peaks due to lipids could no longer be seen.
Raman spectroscopy
When a photon interacts with a molecule it can be scattered inelastically,thereby slightly changing its wavelength. This is called Raman scattering.The wavelength change is highly characteristic of the type of molecule anddepends on the structure of the vibrational bands. The photon can bothloose and gain energy in this process (Stokes and anti-Stokes scattering, re-spectively). The interaction is very weak so that relatively high intensitylight and efficient light collection methods must be used. Traditional Ra-man spectroscopy used in material characterization used visible light. Inbiological tissue the absorption of visible light is quite strong leading to lowpenetration depths, and a lot of background fluorescence, making the Ramansignal harder to detect. Therefore, near-infrared sources were used instead.Since the Raman signal is so weak, many different statistical methods havebeen investigated to extract the signal in an efficient manner[86, 27].
The first studies on arterial tissue used a Nd:Yag laser and found strongRaman bands that could be attributed to vibrations in amid groups, C-Hgroups and phosphate groups[78, 5]. This indicated that the method wasuseful for detecting collagen (amid groups), lipids (C-H groups) and calcifi-

42 CHAPTER 3. DETECTION MODALITIES
cations (phosphate groups). Later this was confirmed by quantifying thesecomponents by Raman spectroscopy and comparing the results to chemicalmethods, where good agreement was found[12]. In a preliminary test ofthe clinical application of Raman spectroscopy, spectra were collected fromexcised coronary arteries[80]. A subset of the samples was defined as a train-ing set that was used to determine component spectra that indicated variousstates of disease. They then used these component spectra on the remain-ing samples and found that Raman spectroscopy served as a good predictorfor non-atherosclerotic vessel, non-calcified and calcified lesions. Buschmanet al. collected Raman spectra from different morphological structures andfound that these could serve as a complete basis set for spectra that were col-lected from an intact vessel, i.e. the measured spectra could be completelyreconstructed by adding various weights of the component spectra[18]. In-vivo trials on lamb and sheep found that blood only affected the signal asan added component and therefore relatively easily could be removed fromthe spectra[17]. Human in-vivo studies have recently been performed onvessels scheduled for endarterectomy and femoral bypass[69]. They foundthat vulnerable plaques could be detected with specificity of 84% and sen-sitivity of 79%. Raman spectroscopy has also been used in the monitoringof pharmacological treatment of atherosclerotic mice, where it was foundthat there was a strong reduction in cholesterol and calcifications within theartery after treatment of atorvastatin[109, 108].
Fluorescence spectroscopy
When a molecule is irradiated by light the electrons can be excited by theabsorption of a photon. This atom will then emit a photon as it decaysback to the ground state. However, some of the energy is lost to molecularvibrations before the decay so that the emitted photon has slightly longerwavelength. This process is called fluorescence.
There are several substances in the arteries that exhibit fluorescence.The most important are collagen, calcifications, ceroid and carotenoids. Theproblem with fluorescence is that all the different components have broadfluorescence spectra with large overlap, making it difficult to discern thevarious components. The fluorescence is also dependent on the chemicalenvironment of the molecule. One study compared the fluorescence of pureelements with different features of a plaque[4]. They found that the fluo-rescence spectra of atherosclerotic plaque was similar to collagen, the lipidcore to oxidized lipoproteins, and normal vessel to collagen.
The earliest works on fluorescence of atherosclerosis were for the auto-matic guiding of laser ablation techniques[51, 29]. Later, studies of whetherfluorescence can differentiate different types of plaques seem to end up withthe conclusion that they can differentiate between calcified and non-calcifiedregions[83, 79, 55]. Recently, it has also been shown that a combination of

3.5. VESSEL WALL ANATOMY, COMPOSITION AND FUNCTION 43
diffuse reflectance spectroscopy and intrinsic fluorescence could detect su-perficial foam cells in atherosclerotic plaques[3].
A problem with in-vivo fluorescence is the strong absorption of blood.Just a small amount of blood between the probe and tissue will have asignificant effect on the recorded spectra. One way to overcome this problemis to measure the blood layer and calibrate for it. One study used IVUS formeasuring the blood layer and found improved diagnostic ability with thiscalibration[115].
Another method is to use time resolved fluorescence spectroscopy and dif-ferentiate the plaques based on varying fluorescent decay time constants[33,2, 1]. The advantage is that this parameter is not affected by a layer ofblood between the probe and tissue.
3.5.6 Angioscopy
Angioscopy is a method to directly visualize the surface of the lumen. Angio-scopic catheters usually consist of a fiberoptic bundle attached to a detectorsystem, where each fiber creates a pixel in the image. This technique isone of the few where prospective studies have been conducted. It has beenfound that plaques with a yellowish color (xanthomatous plaques) are cor-related with unstable angina and higher risk of developing acute coronaryevents[75, 101]. A disadvantage of coronary angioscopy is that the vesselshave to be flushed with phosphate buffered saline during imaging, due tothe strong blood absorption.

44 CHAPTER 3. DETECTION MODALITIES

Chapter 4
Conclusions
4.1 Conclusions
Do not fear to be eccentric in opinion, for every opinion nowaccepted was once eccentric.Bertrand Russell, british philosopher and mathemati-cian.
The technology stands today at a point where it is possible for the clin-ician to get almost unlimited detail of the tissue in question if he so desires.From the movement of the myocardium as a whole to individual collagenfibers in a plaque (about five orders of magnitude different in size). How-ever, the drawback of more detail, is often higher cost, time expenditure,and invasiveness.
The question is then: How much detail is needed to find the necessaryclinical information. Many methods now exist for characterizing coronaryplaques and it seems likely that vulnerable plaques can be detected. Thebest method for characterizing plaques depends on the exact feature to bedetected and the resources available. More prospective studies are necessaryto determine this.
If treatment of vulnerable plaques is systemic, one might as well look forplaques in more accessible arteries to assess a more global plaque burden.This seems likely to give a more cost-effective clinical solution. However, iflocal treatment of vulnerable plaques is developed, methods for localizingthem within coronary arteries will become more valuable. Still, detailedimaging procedures are important for research purposes to determine whata vulnerable plaque really is.
If the future should bring us local treatment modalities that warrantsindividual plaque detection, a likely superior detection modality could bea combination of ultrasound for rapid size determination, NIR reflectionspectroscopy for rapid lipid-determination, and multiphoton techniques (orOCT) for cap thickness and structure characterization.
45

46 CHAPTER 4. CONCLUSIONS
Modality Invasive Resolution VP Comments
Systemicmarkers
No - Inflammation (?).
Biomarkers for atheroscle-rotic and non-specific in-flammation. Detect vulner-able blood.
EKG No - -Stress test for subclinicalstenosis. Detect vulnerableheart.
ECG No - -Stress test for subclinicalstenosis. Vulnerable heart.
SPECT No 10-15 mm Inflammation
Stress test for subclinicalstenosis. Targeted contrastagents for plaque compo-nents.
PET No 4-5 mm Inflammation
Stress test for subclinicalstenosis. Targeted contrastagents for plaque compo-nents. Image larger arteries.
MRI No 300 µm Size, inflammation,lipids.
Image carotid arteries andaorta.
CT No 500 µm Size, lipidMeasure stenosis and coro-nary calcium score. Imagelarger arteries
Ultrasono-graphy
No 200 µm Size, lipid (?).Image carotid arteries andaorta.
ABI No - -
Angiography Yes 500µm - Image stenosis.
IVUS Yes 50-100 µm Size, lipid.
Thermography Yes - Inflammation (?) Probably not working.
OCT Yes 10 µmFibrous cap, lipidcore, inflammation(?)
Multiphotonmicroscopy
Yes 1 µm Cap thickness andstructure
Opticalspec-troscopy
Yes - LipidNIR, fluorescence and Ra-man
Table 4.1: An overview of the properties of the detection modalities pre-sented in this work. The resolution of imaging techniques and the variousfeatures of vulnerable plaques that can be detected. A question mark isadded where the possibility of detecting a feature is uncertain.
Chapter 5
Future work
5.1 Future Work
Fear to be eccentric in opinion, for many opinions once eccentricare still eccentric.Magnus Lilledahl, Norwegian poet.
Even though the techniques of spectroscopy and multiphoton microscopymight be too advanced for plaque detection (since treatments are lacking),they will be a valuable tool in understanding plaque development that war-rants further development of the modalities. Furthermore, they show greatpromise for locally characterizing tissue. A microscopic tool that can beused in multiple organs with multiple sensors for characterizing tissue couldbe quite useful. This will open up in-vivo information to clinicians thatwere once the domain of pathologists. A miniaturized microscope, measur-ing various optical interactions (SHG, TPEF, CARS,....) could realize a trueoptical biopsy that has been promised for so long.
47

48 CHAPTER 5. FUTURE WORK

Bibliography
[1] S. Andersson-Engels, J. Johansson, U. Stenram, K. Svanberg andS. Svanberg. Time-resolved laser induced fluorescence spectroscopyfor enhanced demarcation of human atherosclerotic plaques. J. Pho-tochem. and Photobiol., 4:363–369, 1990.
[2] S. Andersson-Engels, J. Johansson and S. Svanberg. The use of time-resolved fluorescence for diagnosis of atherosclerotic plaque and ma-lignant tumours. Spectrochimica Acta A, 46:1203–1210, 1990.
[3] George O. Angheloiu, Joseph T. Arendt, Markus G. Muller, Abi-gail S. Haka, Irene Georgakoudi, Jason T. Motz, Obrad R. Scepanovic,Barry D. Kuban, Jonathan Myles, Frank Miller, Eugene A. Podrez,Maryann Fitzmaurice, John R. Kramer and Michael S. Feld. Intrin-sic fluorescence and diffuse reflectance spectroscopy identify superficialfoam cells in coronary plaques prone to erosion. Arterioscler. Thromb.Vasc. Biol., 26(7):1594–1600, 2006.
[4] K. Arakawa, K. Isoda, I. Toshimitu, K. Nakajima, T. Shibuya andF. Ohsuzu. Fluorescence analysis of biochemical constituents identifiesatherosclerotic plaque with a thin fibrous cap. Arterioscler. Thromb.Vasc. Biol., 1:1–71, 2002.
[5] J. J. Baraga, M. S. Feld and R. P. Rava. In situ optical histochem-istry of human artery using near infrared Fourier transform Ramanspectroscopy. PNAS, 89(8):3473–3477, 1992.
[6] Daniel S. Berman, Rory Hachamovitch, Leslee J. Shaw, John D.Friedman, Sean W. Hayes, Louise E. J. Thomson, David S. Fieno,Guido Germano, Nathan D. Wong, Xingping Kang and Alan Rozan-ski. Roles of nuclear cardiology, cardiac computed tomography, andcardiac magnetic resonance: Noninvasive risk stratification and a con-ceptual framework for the selection of noninvasive imaging in patientswith known or suspected coronary artery disease. The Journal of Nu-clear Medicine, 47(7):1107–1118, 2006.
[7] K. Bethge, G. Kraft, P. Kreisler and G. Walter. Medical applicationsof nuclear physics. Springer, 2004.
49

50 BIBLIOGRAPHY
[8] David H. Blankenhorn, David G. Freiman and Harvey C. Knowles.Carotenoids in man. The distribution of epiphasic carotenoids inatherosclerotic lesions. J. Clin. Invest., 35:1243–1247, 1956.
[9] T. Boulesteix, A. M. Pena, N. Pages, G. Godeau, M. P. Sauviat,E. Beaurepaire and M. C. Schanne-Klein. Micrometer scale ex vivomultiphoton imaging of unstained arterial wall structure. CytometryPart A, 69A(1):20–26, 2006.
[10] Robert W. Boyd. Nonlinear Optics. Accademic Press, Inc., 1992.
[11] G. Breithardt, J. Schwarzmaier, M. Borggrefe, K. Haerten, andL. Seipel. Prognostic significance of late ventricular potentials afteracute myocardial infarction. Eurupean Heart Journal, 4(7):487–95,1983.
[12] James F. Brennan III, Tjeerd J. Romer, Robert S. Lees, Anna M.Tercyak, John R. Kramer Jr. and Michael S. Feld. Determination ofhuman coronary artery composition by Raman spectroscopy. Circula-tion, 96(1):99–105, 1997.
[13] Mark Brezinski, Kathleen Saunders, Christine Jesser, Xingde Li andJames Fujimoto. Index matching to improve optical coherence tomog-raphy imaging through blood. Circulation, 103(15):1999–2003, 2001.
[14] Mark E. Brezinski, Guillermo J. Tearney, Brett E. Bouma, Joseph A.Izatt, Michael R. Hee, Eric A. Swanson, James F. Southern andJames G. Fujimoto. Optical coherence tomography for optical biopsy:Properties and demonstration of vascular pathology. Circulation,93(6):1206–1213, 1996.
[15] Edward Brown, Trevor McKee, Emmanuelle diTomaso, Alain Pluen,Brian Seed, Yves Boucher and Rakesh K. Jain. Dynamic imaging ofcollagen and its modulation in tumors in vivo using second-harmonicgeneration. Nature Medicine, 9(6):796–800, 2003.
[16] Allen P. Burke, Andrew Farb, Gray T. Malcom, You-Hui Liang, JohnSmialek and Renu Virmani. Coronary risk factors and plaque mor-phology in men with coronary disease who died suddenly. N. Engl. J.Med., 336(18):1276–1282, 1997.
[17] H. P. Buschman, E. T. Marple, M. L. Wach, B. Bennett, T. C.Bakker Schut, H. A. Bruining, A. V. Bruschke, A. van der Laarseand G. J. Puppels. In vivo determination of the molecular composi-tion of artery wall by intravascular Raman spectroscopy. Anal. Chem.,72(16):3771–3775, 2000.

BIBLIOGRAPHY 51
[18] Hendrik P. Buschman, Jason T. Motz, Geurt Deinum, Tjeerd J.Romer, Maryann Fitzmaurice, John R. Kramer, Arnoud van derLaarse, Albert V. Bruschke and Michael S. Feld. Diagnosis of humancoronary atherosclerosis by morphology-based Raman spectroscopy.Cardiovascular Pathology, 10(2):59–68, 2001.
[19] C. S. Colley, S. G. Kazarian, P. D. Weinberg and M. J. Lever. Spectro-scopic imaging of arteries and atherosclerotic plaques. Biopolymers,74(4):328–335, 2004.
[20] Vincent C. Cappendijk, Kitty B. J. M. Cleutjens, Alfons G. H. Kessels,Sylvia Heeneman, Geert Willem H. Schurink, Rob J. T. J. Welten,Werner H. Mess, Mat J. A. P. Daemen, Jos M. A. van Engelshoven andM. Eline Kooi. Assessment of human atherosclerotic carotid plaquecomponents with multisequence MR imaging: Initial experience. Ra-diology, 234(2):487–492, 2005.
[21] Ward Casscells, Marian Hathorn David, Tim Krabach, William K.Vaughn, Hugh A. McAllister, Greg Bearman and James T. Willer-son. Thermal detection of cellular infiltrates in living atheroscleroticplaques: Possible implications for plaque rupture and thrombosis. TheLancet, 347:1447–1449, 1996.
[22] Roberto Corti, Zahi A. Fayad, Valentin Fuster, Stephen G. Worthley,Gerard Helft, James Chesebro, Michele Mercuri and Juan J. Badimon.Effects of lipid-lowering by simvastatin on human atherosclerotic le-sions: A longitudinal study by high-resolution, noninvasive magneticresonance imaging. Circulation, 104(3):249–252, 2001.
[23] Roberto Corti, Valentin Fuster, Zahi A. Fayad, Stephen G. Worth-ley, Gerard Helft, Donald Smith, Jesse Weinberger, Jolanda Wentzel,Gabor Mizsei, Michele Mercuri and Juan J. Badimon. Lipid low-ering by simvastatin induces regression of human atherosclerotic le-sions: Two years follow-up by high-resolution noninvasive magneticresonance imaging. Circulation, 106(23):2884–2887, 2002.
[24] John R. Crouse. Imaging atherosclerosis: State of the art. Journal ofLipid Research, 47:1677–1694, 2006.
[25] John R. Davies, James H. F. Rudd, Peter L. Weissberg and JagatNarula. Radionuclide imaging for the detection of inflammation invulnerable plaques. J. Am. Coll. Cardiol., 47(8 Suppl C):C57–68,2006.
[26] M. J. Davies, N. Woolf, P. Rowles and P. D. Richardson. Lipid andcellular constituents of unstable human aortic plaques. Basic Res.Cardiol., 89 Suppl 1:33–9, 1994.
52 BIBLIOGRAPHY
[27] Jr Alderico R. de Paula and Sokki Sathaiah. Raman spectroscopy fordiagnosis of atherosclerosis: A rapid analysis using neural networks.Medical Engineering and Physics, 27(3):237–244, 2005.
[28] Thomas T. de Weert, Mohamed Ouhlous, Erik Meijering, Pieter E.Zondervan, Johanna M. Hendriks, Marc R. H. M. van Sambeek,Diederik W. J. Dippel and Aad van der Lugt. In vivo characteriza-tion and quantification of atherosclerotic carotid plaque componentswith multidetector computed tomography and histopathological cor-relation. Arterioscler. Thromb. Vasc. Biol., 26(10):2366–2372, 2006.
[29] Lawrence I. Deckelbaum. Fluorescence spectroscopy in cardiovasculardisease. Fundamental concepts and clinical applications. Trends incardiovascular medicine, 1(4):171–176, 1991.
[30] Philip C. J. Donoghue, Stefan Bengtson, Xi-ping Dong, Neil J.Gostling, Therese Huldtgren, John A. Cunningham, Chongyu Yin,Zhao Yue, Fan Peng and Marco Stampanoni. Synchrotron x-ray to-mographic microscopy of fossil embryos. Nature, 442(7103):680–683,2006.
[31] A. Einstein. Zur elektrodynamik bewegter korper. Annalen der Physik,322(10):891–921, 1905.
[32] Robert Eisberg and Robert Resnick. Quantum physics of atoms,molecules, soilds, nuclei and particles. John Wiley and sons, 1985.
[33] Q. Fang, J. Jo, T. Papaioannou, A. Dorafshar, T. Reil, Qiao Jian-Hua, C. M. Fishbein, J. A. Freischlag and L. Marcu. Validation ofa time-resolved fluorescence spectroscopy apparatus using a rabbitatherosclerosis model. In Proceedings of SPIE, vol. 5312, 294–299,2005.
[34] Andrew Farb, Allen P. Burke, Anita L. Tang, Youhui Liang, PoonamMannan, John Smialek and Renu Virmani. Coronary plaque erosionwithout rupture into a lipid core: A frequent cause of coronary throm-bosis in sudden coronary death. Circulation, 93(7):1354–1363, 1996.
[35] Steven B. Feinstein. The powerful microbubble: From bench to bed-side, from intravascular indicator to therapeutic delivery system, andbeyond. Am. J. Physiol. Heart. Circ. Physiol., 287(2):H450–457, 2004.
[36] Kenichi Fujii, Gary S. Mintz, Stephane G. Carlier, Jose di Riba-mar Costa Jr, Masashi Kimura, Koichi Sano, Kaoru Tanaka, Ri-cardo A. Costa, and Joanna Lui. Intravascular ultrasound profileanalysis of ruptured coronary plaques. The American Journal of Car-diology, 98(4):429–435, 2006.

BIBLIOGRAPHY 53
[37] S. D. Giattina, B. K. Courtney, P. R. Herz, M. Harman, S. Short-kroff, D. L. Stamper, B. Liu, J. G. Fujimoto and M. E. Brezinski,“Assessment of coronary plaque collagen with polarization sensitiveoptical coherence tomography (PS-OCT)”, International Journal ofCardiology 107(3), pp. 400–409, (2006).
[38] D. Hackett, G. Davies and A. Maseri. Pre-existing coronary stenosesin patients with first myocardial infarction are not necessarily severe.Eur. Heart J., 9(12):1317–1323, 1988.
[39] Richard C. Haskell, Lars O. Svaasand, T. Tsay, T. Feng, Matthew S.McAdams and Bruce J. Tromberg. Boundary conditions for the diffu-sion equation in radiative transfer. Journal of the Optical Society ofAmerica A, 11:2727–2741, 1994.
[40] A. G. ten Have, F. J. H. Gijsen, J. J. Wentzel, C. J. Slager, P. W.Serruys and A. F. W. van der Steen. A numerical study on the influ-ence of vulnerable plaque composition on intravascular thermographymeasurements. Phys. Med. Biol., 51(22):5875, 2006.
[41] Fritjof Helmchen, Michale S. Fee, David W. Tank and Winfried Denk.A miniature head-mounted two-photon microscope: High-resolutionbrain imaging in freely moving animals. Neuron, 31(6):903–912, 2001.
[42] Joerg Herrmann. New kits on the blot - can we microarray the futureof atherosclerosis? Cardiovascular Research, 60(2):220–222, 2003.
[43] Ik-kyung Jang. Cardiovascular optical coherence tomography. Ex-vivoresults. In The 4th vulnerable plaque satellite symposium at TCT,Chicago, 2002. Association for the eradication of heart attack.
[44] Ik-Kyung Jang, Brett E. Bouma, Dong-Heon Kang, Seung-Jung Park,Seong-Wook Park, Ki-Bae Seung, Kyu-Bo Choi, Milen Shishkov, KellySchlendorf, Eugene Pomerantsev, Stuart L. Houser, H. Thomas Aretzand Guillermo J. Tearney. Visualization of coronary atheroscleroticplaques in patients using optical coherence tomography: Compari-son with intravascular ultrasound. J Am Coll Cardiol, 39(4):604–609,2002.
[45] Juergen C. Jung, Amit D. Mehta, Emre Aksay, Raymond Stepnoskiand Mark J. Schnitzer. In vivo mammalian brain imaging usingone- and two-photon fluorescence microendoscopy. J. Neurophysiol.,92(5):3121–3133, 2004.
[46] Masanori Kawasaki, Hisato Takatsu, Toshiyuki Noda, Keiji Sano,Yoko Ito, Kenji Hayakawa, Kunihiko Tsuchiya, Masazumi Arai,Kazuhiko Nishigaki, Genzou Takemura, Shinya Minatoguchi, Takako

54 BIBLIOGRAPHY
Fujiwara and Hisayoshi Fujiwara. In vivo quantitative tissue char-acterization of human coronary arterial plaques by use of integratedbackscatter intravascular ultrasound and comparison with angioscopicfindings. Circulation, 105(21):2487–2492, 2002.
[47] W. Yong Kim, Matthias Stuber, Peter Bornert, Kraig V. Kissinger,Warren J. Manning and Rene M. Botnar. Three-dimensional black-blood cardiac magnetic resonance coronary vessel wall imaging detectspositive arterial remodeling in patients with nonsignificant coronaryartery disease. Circulation, 106(3):296–299, 2002.
[48] Ioannis Koktzoglou, Yiu-Cho Chung, Venkatesh Mani, Timothy J.Carroll, Mark D. Morasch, Gabor Mizsei, Orlando P. Simonetti,Zahi A. Fayad and Debiao Li. Multislice dark-blood carotid arterywall imaging: A 1.5 T and 3.0 T comparison. Journal of MagneticResonance Imaging, 23(5):699–705, 2006.
[49] Karsten Konig and Iris Riemann. High-resolution multiphoton tomog-raphy of human skin with subcellular spatial resolution and picosecondtime resolution. Journal of Biomedical Optics, 8(3):432–439, 2003.
[50] Chris L. de Korte, Anton F. W. van der Steen, E. Ignacio Cespedes,Gerard Pasterkamp, Stephane G. Carlier, F. Mastik, Arjen H. Schon-eveld, Patrick W. Serruys and Nicolaas Bom. Characterization ofplaque components and vulnerability with intravascular ultrasoundelastography. Phys. Med. Biol., 45(6):1465, 2000.
[51] M. B. Leon, Y. Almagor, A. L. Bartorelli, L. G. Prevosti, P. S.Teirstein, R. Chang, D. L. Miller, P. D. Smith, and R. F. Bonner.Fluorescence-guided laser-assisted balloon angioplasty in patients withfemoropopliteal occlusions. Circulation, 81(1):143–155, 1990.
[52] Wolfgang Lepper, Todd Belcik, Kevin Wei, Jonathan R. Lindner, JiriSklenar, and Sanjiv Kaul. Myocardial contrast echocardiography. Cir-culation, 109(25):3132–3135, 2004.
[53] Michael J. Levene, Daniel A. Dombeck, Karl A. Kasischke, Ray-mond P. Molloy, and Watt W. Webb. In vivo multiphoton microscopyof deep brain tissue. J. Neurophysiol., 91(4):1908–1912, 2004.
[54] Peter Libby. Inflammation in atherosclerosis. Nature, 420(6917):868–874, 2002.
[55] Magnus B. Lilledahl, M. Barkost, M. W. Gran, Olav A. Haugen, andLars O. Svaasand. The effect of a thin bloodlayer on intravascularfluorescence spectroscopy. In Proceedings of SPIE, 2006.

BIBLIOGRAPHY 55
[56] Magnus B. Lilledahl, M. Barkost, M. W. Gran, Olav A. Haugen, andLars O. Svaasand. Reflection spectroscopy of atherosclerotic plaque.Journal of Biomedical Optics, 11(2), 2006.
[57] Magnus B. Lilledahl, Eivind La Publa Larsen, and Lars O. Svaasand.An analytic an numerical analysis of thermography of vulnerableplaque. Phys. Med. Biol., In Press.
[58] Magnus Borstad Lilledahl, Catharina de Lange Davies, and Lars OtharSvaasand. Multiphoton microscoopy of unstained healthy andatherosclerotic aorta. Journal of Biomedical Optics Conditionally ac-cepted.
[59] Briain D MacNeill, Ik-Kyung Jang, Brett E Bouma, Nicusor Iftimia,Masamichi Takano, Hiroshi Yabushita, Milen Shishkov, Christopher RKauffman, Stuart L Houser, and H Thomas Aretz. Focal and multi-focal plaque macrophage distributions in patients with acute and sta-ble presentations of coronary artery disease. Journal of the AmericanCollege of Cardiology, 44(5):972–979, 2004.
[60] Mohammad Madjid, Alireza Zarrabi, Silvio Litovsky, James T. Willer-son, and Ward Casscells. Finding vulnerable atherosclerotic plaques:Is it worth the effort? Arteriosclerosis Thrombosis and Vascular Bi-ololgy, 24(10):1775–1782, 2004.
[61] Ramasamy Manoharan, Joseph J. Baraga, Richard P. Rava, Ra-machandra R. Dasari, Maryann Fitzmaurice, and Michael S. Feld.Biochemical analysis and mapping of atherosclerotic human artery us-ing FT-IR microspectroscopy. Atherosclerosis, 103(2):181–193, 1993.
[62] Wim Martinet, Dorien M. Schrijvers, Guido R. Y. De Meyer,Arnold G. Herman, and Mark M. Kockx. Western array analysis of hu-man atherosclerotic plaques: Downregulation of apoptosis-linked gene2. Cardiovascular Research, 60(2):259–267, 2003.
[63] Alessandro Mauriello, Giuseppe Sangiorgi, Stefano Fratoni, GiampieroPalmieri, Elena Bonanno, Lucia Anemona, Robert S. Schwartz, andLuigi Giusto Spagnoli. Diffuse and active inflammation occurs inboth vulnerable and stable plaques of the entire coronary tree: Ahistopathologic study of patients dying of acute myocardial infarc-tion. Journal of the American College of Cardiology, 45(10):1585–1593, 2005.
[64] F. J. van der Meer, D. J. Faber, J. Perra, G. Pasterkamp, D. BaraznjiSassoon, and T. G. van Leeuwen. Quantitative optical coherence to-mography of arterial wall components. Lasers in Medical Science,V20(1):45–51, 2005.

56 BIBLIOGRAPHY
[65] Roger Mills and Deepak L. Bhatt. The yin and yang of arterial inflam-mation. Journal of the American College of Cardiology, 44(1):50–52,2004.
[66] Gary S. Mintz, Steven E. Nissen, William D. Anderson, Steven R.Bailey, Raimund Erbel, Peter J. Fitzgerald, Fausto J. Pinto, KennethRosenfield, Robert J. Siegel, and E. Murat Tuzcu. American college ofcardiology clinical expert consensus document on standards for acqui-sition, measurement and reporting of intravascular ultrasound studies(IVUS): A report of the american college of cardiology task force onclinical expert consensus documents developed in collaboration withthe european society of cardiology endorsed by the society of cardiacangiography and interventions. Journal of the American College ofCardiology, 37(5):1478–1492, 2001.
[67] Robbert-Jan J. H. M. Miserus, Sylvia Heeneman, Jos M. A. van En-gelshoven, Marianne Eline Kooi, and Mat J. A. P. Daemen. Devel-opment and validation of novel imaging technologies to assist transla-tional studies in atherosclerosis. Drug Discovery Today: Technologies,3(2):195–204, 2006.
[68] Pedro R. Moreno, Robert A. Lodder, Raman Purushotaman,William E. Charash, William N. O’Connor, and James E. Muller.Detection of lipid pool, thin fibrous cap and inflammatory cells inhuman aortic atherosclerotic plaques by near-infrared spectroscopy.Circulation, 105:923–927, 2002.
[69] Jason T. Motz, Maryann Fitzmaurice, Arnold Miller, Saumil J.Gandhi, Abigail S. Haka, Luis H. Galindo, Ramachandra R. Dasari,John R. Kramer, and Michael S. Feld. In vivo Raman spectralpathology of human atherosclerosis and vulnerable plaque. Journalof Biomedical Optics, 11(2):021003–9, 2006.
[70] Akihiro Murashige, Takafumi Hiro, Takashi Fujii, Koji Imoto,Takashige Murata, Yusaku Fukumoto, and Masunori Matsuzaki. De-tection of lipid-laden atherosclerotic plaque by wavelet analysis of ra-diofrequency intravascular ultrasound signals: In vitro validation andpreliminary in vivo application. Journal of the American College ofCardiology, 45(12):1954–1960, 2005.
[71] Morteza Naghavi, Erling Falk, Harvey S. Hecht, Michael J. Jamieson,Sanjay Kaul, Daniel Berman, Zahi Fayad, Matthew J. Budoff, JohnRumberger, and Tasneem Z. Naqvi. From vulnerable plaque to vulner-able patient–part III: Executive summary of the screening for heartattack prevention and education (SHAPE) task force report. TheAmerican Journal of Cardiology, 98(2, Supplement 1):2–15, 2006.

BIBLIOGRAPHY 57
[72] Morteza Naghavi, Peter Libby, Erling Falk, S. Ward Casscells, SilvioLitovsky, John Rumberger, Juan Jose Badimon, Christodoulos Ste-fanadis, Pedro Moreno, Gerard Pasterkamp, Zahi Fayad, Peter H.Stone, Sergio Waxman, Paolo Raggi, Mohammad Madjid, AlirezaZarrabi, Allen Burke, Chun Yuan, Peter J. Fitzgerald, David S. Sis-covick, Chris L. de Korte, Masanori Aikawa, K. E. Juhani Airaksi-nen, Gerd Assmann, Christoph R. Becker, James H. Chesebro, An-drew Farb, Zorina S. Galis, Chris Jackson, Ik-Kyung Jang, WolfgangKoenig, Robert A. Lodder, Keith March, Jasenka Demirovic, Mo-hamad Navab, Silvia G. Priori, Mark D. Rekhter, Raymond Bahr,Scott M. Grundy, Roxana Mehran, Antonio Colombo, Eric Boer-winkle, Christie Ballantyne, Jr. Insull, William, Robert S. Schwartz,Robert Vogel, Patrick W. Serruys, Goran K. Hansson, David P. Faxon,Sanjay Kaul, Helmut Drexler, Philip Greenland, James E. Muller,Renu Virmani, Paul M. Ridker, Douglas P. Zipes, Prediman K. Shah,and James T. Willerson. From vulnerable plaque to vulnerable pa-tient: A call for new definitions and risk assessment strategies: PartI. Circulation, 108(14):1664–1672, 2003.
[73] Morteza Naghavi, Peter Libby, Erling Falk, S. Ward Casscells, SilvioLitovsky, John Rumberger, Juan Jose Badimon, Christodoulos Ste-fanadis, Pedro Moreno, Gerard Pasterkamp, Zahi Fayad, Peter H.Stone, Sergio Waxman, Paolo Raggi, Mohammad Madjid, AlirezaZarrabi, Allen Burke, Chun Yuan, Peter J. Fitzgerald, David S. Sis-covick, Chris L. de Korte, Masanori Aikawa, K. E. Juhani Airaksi-nen, Gerd Assmann, Christoph R. Becker, James H. Chesebro, An-drew Farb, Zorina S. Galis, Chris Jackson, Ik-Kyung Jang, WolfgangKoenig, Robert A. Lodder, Keith March, Jasenka Demirovic, Mo-hamad Navab, Silvia G. Priori, Mark D. Rekhter, Raymond Bahr,Scott M. Grundy, Roxana Mehran, Antonio Colombo, Eric Boer-winkle, Christie Ballantyne, Jr. Insull, William, Robert S. Schwartz,Robert Vogel, Patrick W. Serruys, Goran K. Hansson, David P. Faxon,Sanjay Kaul, Helmut Drexler, Philip Greenland, James E. Muller,Renu Virmani, Paul M. Ridker, Douglas P. Zipes, Prediman K. Shah,and James T. Willerson. From vulnerable plaque to vulnerable pa-tient: A call for new definitions and risk assessment strategies: PartII. Circulation, 108(15):1772–1778, 2003.
[74] Anuja Nair, Barry D. Kuban, E. Murat Tuzcu, Paul Schoenhagen,Steven E. Nissen, and D. Geoffrey Vince. Coronary plaque classi-fication with intravascular ultrasound radiofrequency data analysis.Circulation, 106(17):2200–2206, 2002.
[75] Tomohito Ohtani, Yasunori Ueda, Isamu Mizote, Jota Oyabu, KatsukiOkada, Atsushi Hirayama, and Kazuhisa Kodama. Number of yellow

58 BIBLIOGRAPHY
plaques detected in a coronary artery is associated with future riskof acute coronary syndrome: Detection of vulnerable patients by an-gioscopy. Journal of the American College of Cardiology, 47(11):2194–2200, 2006.
[76] Harry H. Pennes. Analysis of tissue and arterial blood temperaturesin the resting human forearm. Applied physiology, 1(2):93–122, 1948.
[77] Binh An P. Phan, Baocheng Chu, William S. Kerwin, Dongxiang Xu,Chun Yuan, Thomas Hatsukami, and Xue-Qiao Zhao. Effect of con-trast enhancement on the measurement of carotid arterial lumen andwall volume using MRI. Journal of Magnetic Resonance Imaging,23(4):481–485, 2006.
[78] R. P. Rava, J. J. Baraga, and M. S. Feld. Near infrared Fourier trans-form Raman spectroscopy of human artery. Spectrochimica Acta PartA: Molecular Spectroscopy, 47(3-4):509–512, 1991.
[79] R. Richards-Kortum, R. P. Rava, M. Fitzmaurice, J. R. Kramer, andM. S. Feld. 476 nm excited laser-induced fluorescence spectroscopy ofhuman coronary arteries: Applications in cardiology. American HeartJournal, 122:1141–1150, 1991.
[80] Tjeerd J. Romer, James F. Brennan III, Maryann Fitzmaurice,Michael L. Feldstein, Geurt Deinum, Jonathan L. Myles, John R.Kramer, Robert S. Lees, and Michael S. Feld. Histopathology of hu-man coronary atherosclerosis by quantifying its chemical compositionwith Raman spectroscopy. Circulation, 97(9):878–885, 1998.
[81] Lukasz Rzeszutko, Jacek Legutko, Grzegorz L. Kaluza, Marcin Wiz-imirski, Angela Richter, Michal Chyrchel, Grzegorz Heba, Jacek S.Dubiel, and Dariusz Dudek. Assessment of culprit plaque tempera-ture by intracoronary thermography appears inconclusive in patientswith acute coronary syndromes. Arterioscler. Thromb. Vasc. Biol.,26(8):1889–1894, 2006.
[82] T. Saam, M. S. Ferguson, V. L. Yarnykh, N. Takaya, D. Xu, N. L.Polissar, T. S. Hatsukami, and C. Yuan. Quantitative evaluation ofcarotid plaque composition by in vivo MRI. Arteriosclerosis Throm-bosis and Vascular Biology, 25(1):234–239, 2005.
[83] M. Sartori, R. Sauerbrey, S. Kubodera, F. Tittel, R. Roberts, andP. Henry. Autofluorescence maps of atherosclerotic human arteries- a new technique in medical imaging. Quantum Electronics, IEEEJournal of, 23(10):1794–1797, 1987.

BIBLIOGRAPHY 59
[84] Katja Schenke-Layland, Iris Riemann, Ulrich A. Stock, and KarstenKonig. Imaging of cardiovascular structures using near-infrared fem-tosecond multiphoton laser scanning microscopy. Journal of Biomed-ical Optics, 10(2):024017–5, 2005.
[85] Axel Schmermund, Jorg Rodermann, and Raimund Erbel. Intracoro-nary thermography. Herz, 28(6):505–512, 2003.
[86] Landulfo Silveira, Sokki Sathaiah, Renato A. Zangaro, Marcos T. T.Pacheco, Maria C. Chavantes, and Carlos A. G. Pasqualucci. Corre-lation between near-infrared raman spectroscopy and the histopatho-logical analysis of atherosclerosis in human coronary arteries. Lasersin Surgery and Medicine, 30(4):290–297, 2002.
[87] Herbert C. Stary, David H. Blankenhorn, A. Bleakley Chandler, Sey-mour Glagov, William Insull Jr., Mary Richardson, Michael E. Rosen-feld, Sheldon A. Schaffer, Colin J. Schwartz, William D. Wagner, andRobert W. Wissler. A definition of the intima of human arteries andof its atherosclerosis-prone regions. Circulation, 85(1):391–405, 1992.
[88] Herbert C. Stary, A. Bleakley Chandler, Robert E. Dinsmore, ValentinFuster, Seymour Glagov, William Insull Jr., Michael E. Rosenfeld,Colin J. Schwartz, William D. Wagner, and Robert W. Wissler. Adefinition of advanced types of atherosclerotic lesions and a histologicalclassification of atherosclerosis. Circulation, 92:1355–1374, 1995.
[89] Herbert C. Stary, A. Bleakley Chandler, Seymour Glagov, John R.Guyton, William Insull, Micheal E. Rosenfeld, Sheldon A. Schaffer,Colin J. Schwartz, William D. Wagner, and Robert W. Wissler. Adefinition of inital, fatty streak, and intermediate lesions of atheroscle-rosis. Arteriosclerosis and Thrombosis, 14(5):840–856, 1994.
[90] C. Stefanadis, K. Toutouzas, M. Vavuranakis, E. Tsiamis, D. Tou-soulis, D. B. Panagiotakos, S. Vaina, C. Pitsavos, and P. Toutouzas.Statin treatment is associated with reduced thermal heterogeneity inhuman atherosclerotic plaques. Eur. Heart J., 23(21):1664–9, 2002.
[91] Christodoulos Stefanadis. Increased local temperature in human coro-nary atherosclerotic plaques: An independent predictor of clinicaloutcome in patients undergoing a percutanous coronary intervention.Journal of the American College of Cardiology, 37:1277–1283, 2001.
[92] Christodoulos Stefanadis, Leonidas Diamantopoulos, John Dernellis,Emanuel Economou, Eleftherios Tsiamis, Konstantinos Toutouzas,Charalambos Vlachopoulos, and Pavlos Toutouzas. Heat production ofatherosclerotic plaques and inflammation assessed by the acute phase

60 BIBLIOGRAPHY
proteins in acute coronary syndromes. Journal of Molecular and Cel-lular Cardiology, 32(1):43–52, 2000.
[93] Christodoulos Stefanadis, Leonidas Diamantopoulos, CharalambosVlachopoulos, Eleftherios Tsiamis, John Dernellis, KonstantinosToutouzas, Elli Stefanadi, and Pavlos Toutouzas. Thermal heterogene-ity within human atherosclerotic coronary arteries detected in vivo: Anew method of detection by application of a special thermographycatheter. Circulation, 99(15):1965–1971, 1999.
[94] Christodoulos Stefanadis, Konstantinos Toutouzas, Eleftherios Tsi-amis, Manolis Vavuranakis, Costas Tsioufis, Elli Stefanadi, and Hari-sios Boudoulas. Relation between local temperature and c-reactiveprotein levels in patients with coronary artery disease: Effects of ator-vastatin treatment. Atherosclerosis, In Press, Corrected Proof, 2006.
[95] Norihide Takaya, Chun Yuan, Baocheng Chu, Tobias Saam, HunterUnderhill, Jianming Cai, Nam Tran, Nayak L. Polissar, Carol Isaac,Marina S. Ferguson, Gwenn A. Garden, Steven C. Cramer, Kenneth R.Maravilla, Beverly Hashimoto, and Thomas S. Hatsukami. Associa-tion between carotid plaque characteristics and subsequent ischemiccerebrovascular events: A prospective assessment with MRI–initial re-sults. Stroke, 37(3):818–823, 2006.
[96] Guillermo J. Tearney, Hiroshi Yabushita, Stuart L. Houser, H. ThomasAretz, Ik-Kyung Jang, Kelly H. Schlendorf, Christopher R. Kauffman,Milen Shishkov, Elkan F. Halpern, and Brett E. Bouma. Quantifica-tion of macrophage content in atherosclerotic plaques by optical co-herence tomography. Circulation, 107(1):113–119, 2003.
[97] Anna G. ten Have, Erasmus B. G. T. Draaijers, Frank J. H. Gijsen,Jolanda J. Wentzel, Cornelis J. Slager, Patrick W. Serruys, and Anto-nius F. W. van der Steen. Influence of catheter design on lumen walltemperature distribution in intracoronary thermography. Journal ofBiomechanics, In Press, Corrected Proof, 2006.
[98] Anna. G. ten Have, F. J. H. Gijsen, J. J. Wentzel, C. J. Slager, andA. F. W. van der Steen. Temperature distribution in atheroscleroticcoronary arteries: Influence of plaque geometry and flow (a numericalstudy). Phys. Med. Biol., 49:4447–4462, 2004.
[99] Anna G. ten Have, Frank J. H. Gijsen, Jolanda J. Wentzel, Cornelis J.Slager, Patrick W. Serruys, and Antonius F.W. van der Steen. In-tracoronary thermography, heat generation, transfer and detection.Eurointervention, 1(1):105–114, 2005.
BIBLIOGRAPHY 61
[100] Patrick Theer, Mazahir T. Hasan, and Winfried Denk. Two-photonimaging to a depth of 1000 micrometers in living brains by use of aTi:Al2O3 regenerative amplifier. Opt. Lett., 28(12):1022–1024, 2003.
[101] Torsten Thieme, Klaus D. Wernecke, Rudolph Meyer, Elke Bran-denstein, Dirk Habedank, Antje Hinz, Stephan B. Felix, Gert Bau-mann, and Franz X. Kleber. Angioscopic evaluation of atheroscleroticplaques: Validation by histomorphologic analysis and association withstable and unstable coronary syndromes. Journal of the American Col-lege of Cardiology, 28(1):1–6, 1996.
[102] Troels F. Thomsen, Dan McGee, Michael Davidsen, and Torben Jor-gensen. A cross-validation of risk-scores for coronary heart diseasemortality based on data from the Glostrup population studies andFramingham heart study. International Journal of Epidemiology,31(4):817–822, 2002.
[103] Gerard J. Tortora and Sandra Reynolds Grabowski. Principles ofAnatomy and Physiology. Wiley, 2003.
[104] K. Toutouzas, M. Drakopoulou, V. Markou, P. Stougianos, E. Tsi-amis, D. Tousoulis, and C. Stefanadis. Increased coronary sinus bloodtemperature: Correlation with systemic inflammation. Eur. J. Clin.Invest., 36(4):218–23, 2006.
[105] Konstantinos Toutouzas, Maria Drakopoulou, John Mitropoulos,Eleftherios Tsiamis, Sophia Vaina, Manolis Vavuranakis, VirginiaMarkou, Eirini Bosinakou, and Christodoulos Stefanadis. Elevatedplaque temperature in non-culprit de novo atheromatous lesions ofpatients with acute coronary syndromes. Journal of the AmericanCollege of Cardiology, 47(2):301–306, 2006.
[106] Rikin A. Trivedi, Jean-Marie U-King-Im, Martin J. Graves, Justin J.Cross, Jo Horsley, Martin J. Goddard, Jeremy N. Skepper, GeorgeQuartey, Elizabeth Warburton, Ilse Joubert, Liqun Wang, Peter J.Kirkpatrick, John Brown, and Jonathan H. Gillard. In vivo detectionof macrophages in human carotid atheroma: Temporal dependence ofultrasmall superparamagnetic particles of iron oxide-enhanced MRI.Stroke, 35(7):1631–1635, 2004.
[107] Mankei Tsang, Demetri Psaltis, and Fiorenzo G. Omenetto. Re-verse propagation of femtosecond pulses in optical fibers. Opt. Lett.,28(20):1873–1875, 2003.
[108] Sweder W. E. van de Poll, Dianne J. M. Delsing, J. Wouter Jukema,Hans M. G. Princen, Louis M. Havekes, Gerwin J. Puppels, and

62 BIBLIOGRAPHY
Arnoud van der Laarse. Raman spectroscopic investigation of ator-vastatin, amlodipine, and both on atherosclerotic plaque developmentin apoe*3 leiden transgenic mice. Atherosclerosis, 164(1):65–71, 2002.
[109] Sweder W. E. van de Poll, Tjeerd J. Romer, Oscar L. Volger, DianneJ. M. Delsing, Tom C. Bakker Schut, Hans M. G. Princen, Louis M.Havekes, J. Wouter Jukema, Arnoud van der Laarse, and Gerwin J.Puppels. Raman spectroscopic evaluation of the effects of diet andlipid-lowering therapy on atherosclerotic plaque development in mice.Arteriosclerosis Thrombosis and Vascular Biology, 21(10):1630–1635,2001.
[110] M. van Zandvoort, W. Engels, K. Douma, L. Beckers, M. oude Eg-brink, M. Daemen, and D. W. Slaaf. Two-photon microscopy for imag-ing of the (atherosclerotic) vascular wall: A proof of concept study.Journal of Vascular Research, 41(1):54–63, 2004.
[111] Stefan Verheye, Guido R. Y. De Meyer, Glenn Van Langenhove,Michiel W. M. Knaapen, and Mark M. Kockx. In vivo temperatureheterogeneity of atherosclerotic plaques is determined by plaque com-position. Circulation, 105(13):1596–1601, 2002.
[112] R. Virmani, Frank D. Kolodgie, Allen P. Burke, Andrew Farb, andSthepen M. Schwartz. Lessons from sudden coronary death. A com-prehensive morphological classification scheme for atherosclerotic le-sions. Arteriosclerosis Thrombosis and Vascular Biology, 17:1337–1345, 2000.
[113] Ron Waksman and Patrick W. Serruys, editors. Handbook of the vul-nerable plaque. Taylor and Francis, London, 2004.
[114] Jing Wang, Y. Geng, Bujin Guo, Tomas Klima, Birendra N. Lal,James T. Willerson, and S. Ward Casscells. Near-infrared spec-troscopic characterization of human advanced atherosclerotic plaque.Atherosclerosis, 39:1305–1313, 2002.
[115] S. Warren, K. Pope, Y. Yazdi, A. J. Welch, S. Thomsen, A. L. John-ston, M. J. Davis, and R. Richards-Kortum. Combined ultrasound andfluorescence spectroscopy for physico-chemical imaging of atheroscle-rosis. Biomedical Engineering, IEEE Transactions on, 42(2):121–132,1995.
[116] Robert L. Wilensky, Hee Kwon Song, and Victor A. Ferrari. Roleof magnetic resonance and intravascular magnetic resonance in thedetection of vulnerable plaques. Journal of the American College ofCardiology, 47(8 Suppl C):C48–56, 2006.

BIBLIOGRAPHY 63
[117] Peter W. F. Wilson, Ralph B. D’Agostino, Daniel Levy, Albert M.Belanger, Halit Silbershatz, and William B. Kannel. Predictionof coronary heart disease using risk factor categories. Circulation,97(18):1837–1847, 1998.
[118] www.wikipedia.org.
[119] Hiroshi Yabushita, Brett E. Bouma, Stuart L. Houser, H. ThomasAretz, Ik-Kyung Jang, Kelly H. Schlendorf, Christopher R. Kauffman,Milen Shishkov, Dong-Heon Kang, Elkan F. Halpern, and Guillermo J.Tearney. Characterization of human atherosclerosis by optical coher-ence tomography. Circulation, 106(13):1640–1645, 2002.
[120] Alvin T. Yeh, Marie J. Hammer-Wilson, David C. Van Sickle, Hilary P.Benton, Aikaterini Zoumi, Bruce J. Tromberg, and George M. Peavy.Nonlinear optical microscopy of articular cartilage. Osteoarthritis andCartilage, 13(4):345–352, 2005.
[121] Chun Yuan and William S. Kerwin. MRI of atherosclerosis. Journalof Magnetic Resonance Imaging, 19(6):710–719, 2004.
[122] Aikaterini Zoumi, Xiao Lu, Ghassan S. Kassab, and Bruce J.Tromberg. Imaging coronary artery microstructure using second-harmonic and two-photon fluorescence microscopy. Biophysical jour-nal, 87(4):2778–2786, 2004.

64 BIBLIOGRAPHY
Paper I
Characterization of atherosclerotic plaque by
reflection spectroscopy and thermography: A
comparison
Magnus B. Lilledahl, Olav A. Haugen, Lise L. Randebergand Lars O. Svaasand. Proceedings of SPIE, vol. 5686,415-425 (2005)


Characterization of Atherosclerotic Plaque by ReflectionSpectroscopy and Thermography: A comparison
Magnus B. Lilledahla, Olav A. Haugenb,c, Lise L. Randeberga and Lars O. Svaasanda
aDepartment of Electronics and Telecommunications, Norwegian University of Science andTechnology;
bDepartment of Morphology, Norwegian University of Science and Technology;cDepartment of Pathology, St. Olav’s University Hospital.
ABSTRACT
lipid-index
Keywords:
1. INTRODUCTION
1
vulnerable plaques
Photonic Therapeutics and Diagnostics, Bartels, Bass, de Riese, Gregory, Hirschberg, Katzir,Kollias, Madsen, Malek, McNally-Heintzelman, Tate, Trowers, Wong, eds., Proc. of SPIE Vol. 5686(SPIE, Bellingham, WA, 2005) · 1605-7422/05/$15 · doi: 10.1117/12.586548
415

2,3,4
5,6
2. MATERIALS AND METHODS
2.1. Reflectance measurements
2.1.1. Materials
2.1.2. Method and apparatus
416 Proc. of SPIE Vol. 5686

Figure 1.
900 1000 1100 1200 1300 1400 1500 1600 17000
0.5
1
1.5
2
2.5
3
3.5
4
Wavelength (nm)
Abs
orba
nce
fatcholesterolwater
Figure 2.
A log10 μall
μaA 1 mm 1
meas
ref
2.1.3. Histology
2.2. Modelling
7
s1 1
s8
4
9
Proc. of SPIE Vol. 5686 417
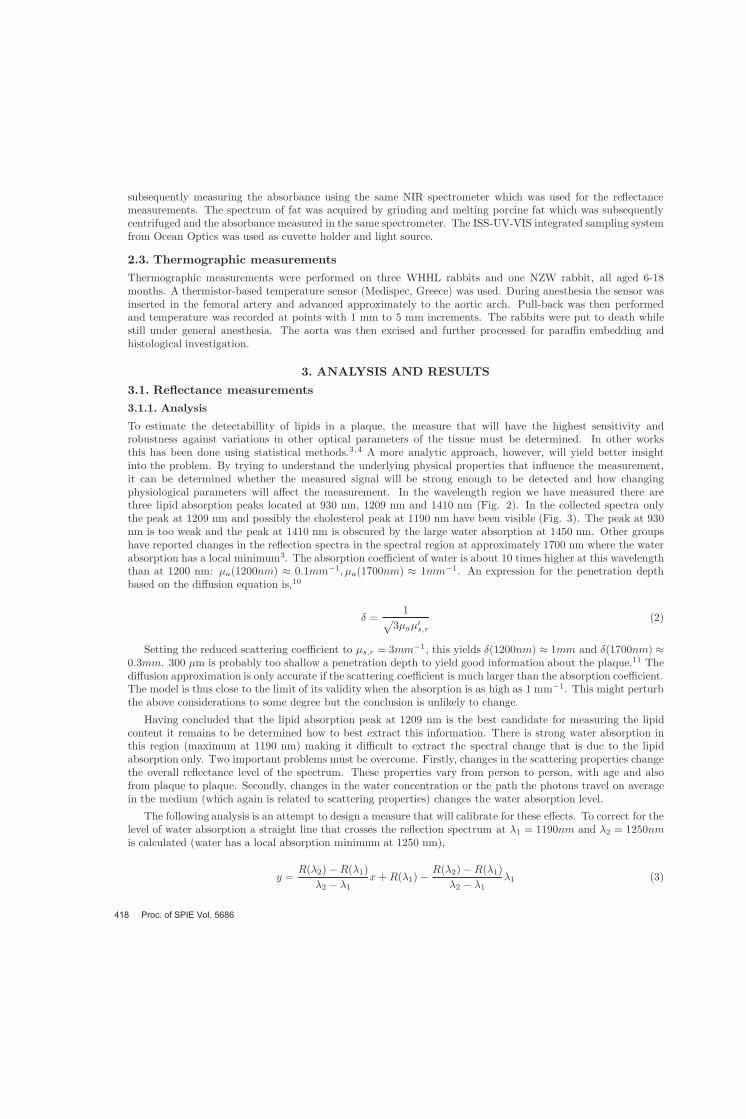
2.3. Thermographic measurements
3. ANALYSIS AND RESULTS
3.1. Reflectance measurements3.1.1. Analysis
3,4
3
a1
a1
10
a s,r
s,r1
11
1
1 2
2 1
2 11
2 1
2 11
418 Proc. of SPIE Vol. 5686

900 1000 1100 1200 1300 1400 1500 1600 17000
5
10
15
20
25
30
35
Wavelength (nm)
Ref
lect
ance
(%)
Figure 3.
1180 1200 1220 1240 1260 1280
27
27.5
28
28.5
29
29.5
30
30.5
Wavelength (nm)
Ref
lect
ance
(%)
Figure 4.
lipid-index,M
lipid1190 1250
11901190 1250
1209
3.1.2. Measurement results
Proc. of SPIE Vol. 5686 419

0 0.5 1 1.5 20.1
0.2
0.3
0.4
0.5
0.6
d (mm)
M (%
)
Figure 5.
0 0.5 1 1.5 20.05
0.1
0.15
0.2
0.25
0.3
0.35
0.4
d (mm)
M (%
)
Figure 6.
μ
3.1.3. Modelling
3.2. Thermographic measurements
4. DISCUSSION
4.1. Reflection measurements
420 Proc. of SPIE Vol. 5686

900 1000 1100 1200 1300 1400 1500 16000
10
20
30
40
50
60
70
80
90
Wavelength (nm)
Ref
lect
ance
(%)
Figure 7.
μ
00.1
0.20.3
0.4
00.1
0.20.3
0.4
0.5
1
1.5
2
2.5
x (mm)y (mm)
M (%)
Figure 8.
4.2. Thermographic measurements
6
12
13
mp3 3 4 3
Proc. of SPIE Vol. 5686 421

5 10 1536.2
36.21
36.22
36.23
36.24
36.25
36.26
36.27
36.28
Position (cm)
Temperature (C)
Figure 9.
3
4 3
3 3
3
15 5
4.3. Conclusion and future work
APPENDIX A. THERMAL HETEROGENITY IN PLAQUE
14,15
4 3
2
2
422 Proc. of SPIE Vol. 5686

0,008
0,01
0,004
0,006
0,002
d (m)
0,0050,0040,0030,0010 0,002
Figure 10.4 3
T
0,8
0
1
0,4
0,6
0,2
radius (m)
0,010,0080,0040,002 0,006
Figure 11.
2
2
12 2
2
3
2 2 2 2 2 2
zz
Proc. of SPIE Vol. 5686 423

V
ACKNOWLEDGMENTS
REFERENCES
Circulation 92
Atherosclerosis 47
Circulation 105
Atherosclerosis 39
The Lancet 347
Journal of theAmerican College of Cardiology 37
Lasers in MedicalScience 10
Thermally induced changes in optical properties of biological tissues
Journal of the OpticalSociety of America 64
Journal of the Optical Society of America A 11
IEEEJournal of Quantum Electronics 26
Biochimica et Biophysica Acta 1033
Principles of Anatomy and Physiology
Physics in Medicine and Biology 49
424 Proc. of SPIE Vol. 5686

Physics inMedicine and Biology 49
Proc. of SPIE Vol. 5686 425


Paper II
The effect of a thin bloodlayer on fluorescence
spectroscopy
Magnus B. Lilledahl, Marianne Barkost, Mari W. Gran,Olav A. Haugen and Lars O. Svaasand. Proceedings ofSPIE, vol. 6078, 60782J-1 (2006)


Effect of a thin blood layer on fluorescence spectroscopy
Magnus B. Lilledahla, Marianne Barkosta, Mari Warløs Grana, Olav A. Haugenb,c andLars O. Svaasanda
aNorwegian University of Science and Technology, Department of electronics andtelecommunications, O.S Bragstads plass 2A, 7049 Trondheim, Norway;
bNorwegian University of Science and Technology, Department of Laboratory Medicine,Children’s and Women’s Health, Olav Kyrres gate 17, 7006 Trondheim, Norway;
cSt.Olavs Hospital, Department of Pathology and Medical Genetics, Olav Kyrres gate 17, 7006Trondheim, Norway.
1. ABSTRACT
When performing intravascular spectroscopy there is always the possibility that there will be a thin layer ofblood between the probe and the vessel wall. This will affect measurements espescially below 600 nm whereblood absorption is strong (important for fluorescence and Raman measurements) and above 1400 nm where thewater absorption is strong. Between these two regions (the theraputic window) the absorption is fairly low andcan be neglected. This article explores the possibility of performing measurements outside the optical windowby minimizing blood layer and increasing the excitation signal.
Keywords: Fluorescence spectroscopy, atherosclerosis, intravascular, blood layer
2. INTRODUCTION
In recent years the paradigm has emerged that it is not the degree of stenosis but rather the composition of thearterial plaque which determines the risk of an acute coronary event. Plaque which are composed of a thick,necrotic, lipid-rich core, covered by a thin fibrous cap are typically prone to rupture and are thus denoted asvulnerable plaques.
Current non-invasive detection modalities (CT, MRI) are mainly effective at determining the geometry ofthe plaque, that is, the degree of stenosis, but is limited in determining the actual chemical and physiologicalcomposition. To determine the composition it might be necessary to perform an intravascular measurement ofthe plaques. Several optical methods have been proposed for intravascular spectroscopy: near infrared (NIR)reflection spectroscopy, fluorescence spectrosocpy and Raman spectroscopy. This work mainly deals with theeffect of a blood layer on fluorescence spectrosocpy.
Probably the earliest work in the field of fluorescence spectroscopy of atherosclerotic plaques was by Blanken-horn in 1957 which measured the fluorescence of various types of plaques and compared this to the presence ofvarious chromophores, especially carotenoids.1 Several studies have later confirmed these findings2–6 Filipidiesused double wavelength excitation of fluorescence to improve the detection of various types of plaque.7 A reviewof the field was given by Papazouglou in 1995.8
Most of the published studies investigating the possible uses of optical methods in plaque classification havebeen in-vitro studies except one study performed in rabbit aorta.9 In the ex-vivo studies there have been nosignificant amount of blood present in the experiments. Since blood could have an interfering effect on themeasurements, effectively as noise and reduction of signal level, conclusions on the feasability of the methodsbased on ex-vivo studies might need to be modified. In the in-vivo study in a rabbit model they were able todifferentiate between various types of atherosclerotic lesions using both the lifetime and fluorescence intensity
Further author information: (Send correspondence to Magnus Lilledahl.)Magnus B. Lilledahl: E-mail: [email protected], Telephone: +47 73591471
Photonic Therapeutics and Diagnostics II, edited by N. Kollias, H. Zeng, B. Choi, R. S. Malek, B. J.-F. Wong, J. F. R. Ilgner, E. A. Trowers, W. T.W. de Riese, H. Hirschberg, S. J. Madsen, M. D. Lucroy, L. P. Tate,
K. W. Gregory, G. J. Tearney, Proc. of SPIE Vol. 6078, 60782J, (2006) · 1605-7422/06/$15 · doi: 10.1117/12.645965
Proc. of SPIE Vol. 6078 60782J-1

of the signal.9 They avoided the interference of blood by saline irrigation and clamping of arteries duringmeasurement.
There are several techniques for removing or correcting for the effect of a blood layer between the probe andthe vessel wall. Flushing the vessel with saline is possible but how effective this removes the blood has to ourknowledge not been investigated. Constant irrigation or blocking of the artery could put too much of a burdenon the heart to be clinically safe. Lin et al. investigated the feasability of optical spectrosocpy in the prescenceof blood.10 Using signal processing methods they improved the detection of the fluorescence signal. Fluorescencelifetime measurements have also been shown to be independent of an interfering blood layer.11,12
The goal of the present work is to gain an understanding of how a blood layer can adversely affect an opticalmeasurement which seeks to determine the composition of atherosclerotic plaques. Firstly it is investigated howvariation in the signal due to a varying layer of blood will affect the differentation of various types of plaquebased on fluorescence spectroscopy. Secondly, it is considered how the temperature rise in a thin layer of bloodwill limit the allowed irradiation intensity.
Section 3 gives a description of measurements performed: 3.1 gives a description of fluorescent measurementson human plaques in the aorta, measured ex-vivo. 3.2 gives a description of measurements performed on afluorescent tissue phantom through a layer of blood with various thickness. In 3.4 are some calculations ontheoretically expected values on heat generation in blood due to light absorption and in 3.3 are models on thesignal reduction due to the blood layer.
3. MATERIALS AND METHODS
3.1. Fluorescence measurements of plaque
A section of the thoracic aorta was excised during autopsy from 21 patients. The work was approved by theNorwegian Board on Ethics in Medicine. The samples were opened longitudinally and fluorescent measurementswere performed on various locations, which from visual inspection appeared to be in various pathological states.The same samples were used for another study and a more complete description of the samples and their handlingis given there.13
The fluorescence measurements were performed with an optical fiber probe. The probe consisted of four 270µm optical fibers which were inserted in four equally spaced holes, drilled in the tip of an SMA fiber connector(Ocean Optics, Duiven, The Netherlands. Custom design). The distance between the centers of two adjacentfibers was about 500 µm. Only two adjacent fibers were used, one for the excitation light and one for collectionof fluorescent light. On the other end, each of the fibers were terminated in separate SMA connectors. A blueLED source at 470 nm (Ocean Optics, LS450), delivering about 10 µW into the fiber, was used as the excitationlight and a fiber optic spectrometer (SD2000, Ocean Optics) was used to measure the collected light.
The measurement sites were cut out in pieces roughly 4x10 mm. These were again divided in two with oneof the slices being frozen in liquid nitrogen and the other fixated in formalin. The sections were then sliced andstained for histology, one with Hemotoxylin-Eosin-Safron and the other with Sudan Red. From the histology thethickness of the lipid pool and the fibrous cap were found and the pathological classification were determined.
3.2. Fluorescence measurements of phantom through blood
Small fluorescent tissue phantoms approximately 1 cm thick and 1 cm in diameter were prepared in cylindricalsteel cups using a mixture of agar, intralipid and fluorescein. The agar was made from 3.1 g of agar (Sigma-Aldrich, agar-agar, A7002) disolved in 210 ml of water. 150 µl of intralipid solution (200 mg/l, Fresenius Kabi,Uppsala, Sweden) was then added to 10 ml of the agar/water mixture. Various amounts (100-500 µl) of afluorescein (fluorescin sodium salt, 67844, Sigma-Aldrich)/water solution (73 mg/l) were then added to 10 mlof the agar/intralipid mixture. This mixture was then poured into the steel cylinders while still hot and left tosolidify at room temperature covered with plastic film to avoid water evaporation.
The same equipment that was used for the measurements of the fluorescence of the aorta was used for themeasurements on the tissue phantoms. The fiber optic probe was positioned just at the surface of the samplewith a stand that could be adjusted up and down using a micrometer positioning system. A fluorescent spectrum
Proc. of SPIE Vol. 6078 60782J-2

Blood
Phantom
LEDSpectrometer
Probe
Plastic film
Figure 1. A schematic illustration of the measurement of fluorescence from a tissue phantom through a layer of blood.
was collected, excited by the 470 nm LED. The measurements were performed in a dark room to avoid affects ofstray light. The probe was then lifted without loosing the height reference to the phantom and a plastic film wasput on the phantom, assuring that it clung thigthly to the surface. This was done to avoid that blood diffusedinto the phantom, which it otherwise did quite rapidly. A small amount of blood (red blood cells in Sagmansolution, hematocrit≈40%) was then added on top of this film (see Fig. 1). The probe was then lowered towardsthe phantom, using the positioning screw, through the layer of blood and the reflected spectra were recorded atvarious heights. In the end the plastic film and blood was removed and another measurement was performed onthe top of the phantom surface.
3.3. Optical models
To model theoretically the reduction in signal due to a thin bloodlayer a simple one dimensional model was used.The signal reduction is then given by
I(x) = I0 exp−(µa,470 + µ
s,470 + µa,518 + µs,518)x
(1)
470 nm was the excitation wavelength of the LED and 518 nm is the emission maximum of fluorescein. Theabsorption coefficient µa was taken as 4.74 mm−1 and 4.02 mm−1 at 470 nm and 518 nm respectively∗ andthe reduced scattering coefficient µ
s as 20 mm−1 as a mean value of various values reported, was used for bothwavelengths.14 The reduced scattering is used since it seems unreasonable to assume that every scattering eventwill remove the scattered light from the measured region. The light that is absorbed in the blood layer is givenby,
I0 (1− exp(−µa,470x)) (2)
if one assumes that the light absorbed from the reflected light is negligable compared to what is absorbedfrom the incident light. This is valid if the thickness of the blood layer is at least two penetration depths,
d = 2δ =2µt=
2µa,470 + µs,470
≈ 30µm. (3)
∗taken from http://omlc.ogi.edu/spectra/hemoglobin/summary.html
Proc. of SPIE Vol. 6078 60782J-3

3.4. Temperature models
Analytical solutions to the heat diffusion equation quickly becomes unwieldly for complicated geomtries sosimplifications are necessary to find a managable solution in terms of familiar functions. Another method isto use numerical methods (FEM analysis), but often the response of the system to changes in variables is lesstransparent when using this method.
3.4.1. Model 1
As a first approximation one can use a simple model where it is assumed that no heat diffuses out from theirradiated volume during the irradiation (the validity of this will be discussed further down). The temperaturechange in the volume of blood irradiated by the light will be,
∆T =P t
ρcV(1− exp(−µa,470x)) , (4)
where P is the incident power, t is the time of irradiation and ρ and c the density and specific heat of theirradiated volume V.
3.4.2. Model 2
During the absorption process some of the heat will diffuse out of the irradiated area, especially through theprobe if it is made of a highly conductive material, e.g. steel. A rule of thumb for the distance d that heat diffusesin a time interval ∆t is d =
√χ∆t where χ is the diffusitivity of the material. Using for steel χst = 1.2 · 10−5
m2/s † and for blood χst = 1.5 · 10−7 m2/s we find that the diffusion depth during 0.1 s is 1 mm and 0.1 mmrespectively which is significant since the volume of the irradiated sample is less than 1 mm3. Hence, a morecomplicated model must be considered.
A more sophisticated model incorporating this effect is that of a heat generating sphere embedded in a con-ductive medium. The heat generation in the sphere represents the light absorbed by the blood. By surroundingthe sphere both by medium with similar properties as blood/tissue and by steel one can find bounds on thepossible temperature increase. The solution to this is given in.15
However the solution is so complicated that the advantages of an analytical solution is lost and it is moreadvantagous to use the more flexible finite element method (FEM).
3.4.3. FEM
A FEM structure was anlayzed using FEMLAB (Comsol AB, Stockholm, Sweden). The FEM analysis givesmore information on how the geometry affects the solution as complicated geometries are very difficult to solveanalytically. This consisted of a rectangular region (3x3x0.2 mm) representing the vessel wall, on top of thisa rectangular (3x3x0.5 mm) region representing the blood with a smaller cylindrical region (r = h = 0.5 mm)embedded in the blood representing the irradiated volume and on top of this a rectangular region (3x3x0.5 mm)representing the probe. The model is illustrated in figure 2 The thermal properties that were used in the modelwas given in the FEMLAB model library. For the probe, the properties of steel AISI 4340 was used. Bloodwas assumed to have the same thermal properties as water. For the tissue the thermal conductivity was set toκ = 0.4W/m·K, the specific heat capacity 2000 J/kg·K and 800 kg/m3 for the density.
4. RESULTS
4.1. Fluorescent spectra of plaque
The measurement sites on the aortas were classfied into six pathological classes based on the histology: Normal,fatty streak, fibrous, thin cap fiberatheroma, calcified and ruptured.16 Generally atheromas had low fluores-cence, normal, fibrous, and fatty streak had fairly similar fluorescence, while calcified plaques had the highestfluorescence.
†from FEMLAB material library
Proc. of SPIE Vol. 6078 60782J-4

Figure 2. FEM geometry.
450 500 550 600 650 700 750 8000
10
20
30
40
50
60
70
Wavlength (nm)
Ref
lect
ance
(%)
AB
Figure 3. Reflection spectra of a normal area of the vessel wall from two different aortas. The A curve is from a 78 yearold male and the B curve from 24 year old male. One can see that there is a large variation in the absorption which willaffect how much of the excitation signal that is absorbed. This can be seen as a redder color on visual inspection of theaortas.
However, there were large differences in the general level of fluorescence between various aorta samples. Thegeneral color of the aorta varied. The older the person from which the aorta was taken, generally the aorta hada more reddish color. This can be seen in the two absorption spectra in figure 3 which were taken from twodifferent aortas.
In figure 4 is a typical fluorescence spectrum from a single aorta. The spectra indicate that the difference influorescence between calcified, fibrous and atheromatous plaques can be differentiated.
In figure 5 is a plot of the mean value of the fluorescence at 560 nm for each of the classifications of plaquefrom all the aortas with error bars indicating the standard deviation. The fluorescence level of the calcifiedplaques clearly stand out. The trend in the other classes are masked by the large standard deviation.
Proc. of SPIE Vol. 6078 60782J-5

550 600 650 700
−20
0
20
40
60
80
100
120
140
160
Wavelength (nm)
Fluo
resc
ence
inte
nsity
(AU
)
AtheromaCalcifiedFibrousFibrousAtheroma
Figure 4. A typical fluorescence spectrum for a single aorta sample with various pathological classification of the mea-surement sites.
Normal Fibrous Fatty streak Atheroma Calcified Ruptured−200
0
200
400
600
800
1000
Fluo
resc
ence
Inte
nsity
Figure 5. Mean values of the fluoresence for the various pathological conditions for all the aorta samples with error barsindication the standard deviation.
Proc. of SPIE Vol. 6078 60782J-6

Normal Fibrous Fatty streak Atheroma Calcified Ruptured−0.2
0
0.2
0.4
0.6
0.8
1
1.2Fl
uore
scen
ce in
tens
ity (A
U)
Figure 6. Same as figure 5 but here each spectrum from each aorta has been normalized with the value of the spectrumof normal aorta from the same sample. We can see that the errorbars are smaller and differentiation between variouspathological states are better. The sample which had calcified plaques did not have a measurement of normal aorta andis therfore removed from this analysis.
Normal Fibrous Fatty Streak Atheroma Calcified Ruptured−0.1
0
0.1
0.2
0.3
0.4
0.5
0.6
Fluo
resc
ence
inte
nsity
(AU
)
Figure 7. Same as figure 6 but here each spectrum has had a random reduction in signal intensity due to a random layerof blood between 10-100 µm
Proc. of SPIE Vol. 6078 60782J-7
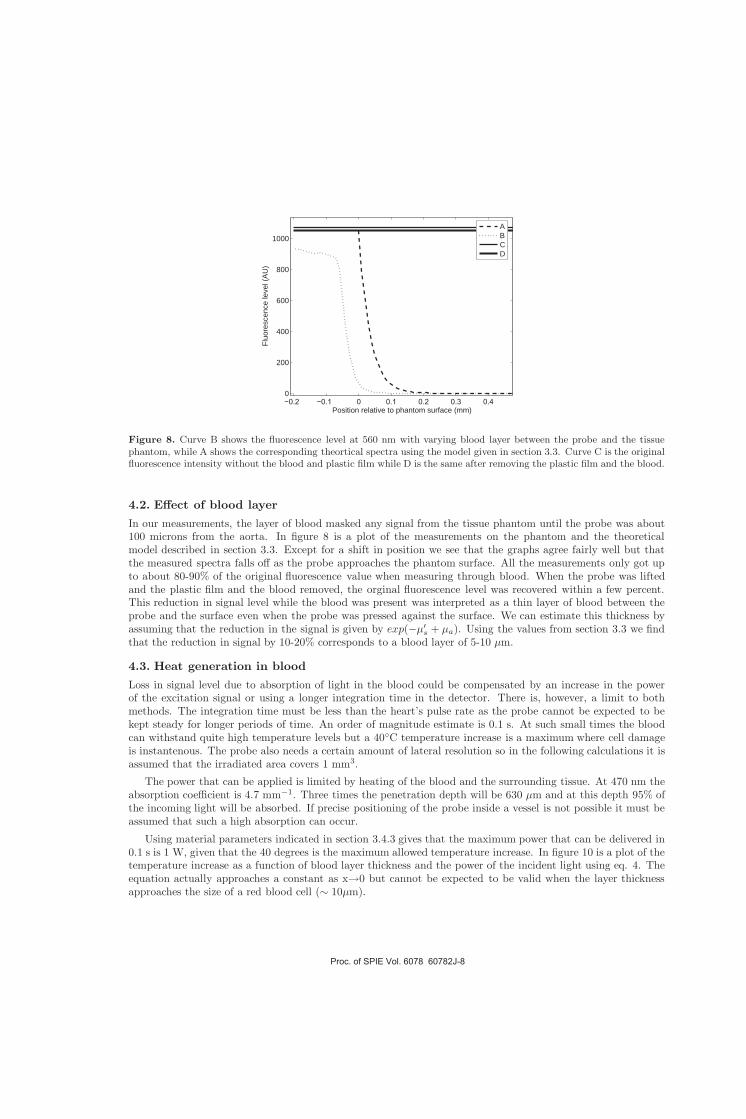
−0.2 −0.1 0 0.1 0.2 0.3 0.40
200
400
600
800
1000
Position relative to phantom surface (mm)
Fluo
resc
ence
leve
l (A
U)
ABCD
Figure 8. Curve B shows the fluorescence level at 560 nm with varying blood layer between the probe and the tissuephantom, while A shows the corresponding theortical spectra using the model given in section 3.3. Curve C is the originalfluorescence intensity without the blood and plastic film while D is the same after removing the plastic film and the blood.
4.2. Effect of blood layer
In our measurements, the layer of blood masked any signal from the tissue phantom until the probe was about100 microns from the aorta. In figure 8 is a plot of the measurements on the phantom and the theoreticalmodel described in section 3.3. Except for a shift in position we see that the graphs agree fairly well but thatthe measured spectra falls off as the probe approaches the phantom surface. All the measurements only got upto about 80-90% of the original fluorescence value when measuring through blood. When the probe was liftedand the plastic film and the blood removed, the orginal fluorescence level was recovered within a few percent.This reduction in signal level while the blood was present was interpreted as a thin layer of blood between theprobe and the surface even when the probe was pressed against the surface. We can estimate this thickness byassuming that the reduction in the signal is given by exp(−µ
s + µa). Using the values from section 3.3 we findthat the reduction in signal by 10-20% corresponds to a blood layer of 5-10 µm.
4.3. Heat generation in blood
Loss in signal level due to absorption of light in the blood could be compensated by an increase in the powerof the excitation signal or using a longer integration time in the detector. There is, however, a limit to bothmethods. The integration time must be less than the heart’s pulse rate as the probe cannot be expected to bekept steady for longer periods of time. An order of magnitude estimate is 0.1 s. At such small times the bloodcan withstand quite high temperature levels but a 40C temperature increase is a maximum where cell damageis instantenous. The probe also needs a certain amount of lateral resolution so in the following calculations it isassumed that the irradiated area covers 1 mm3.
The power that can be applied is limited by heating of the blood and the surrounding tissue. At 470 nm theabsorption coefficient is 4.7 mm−1. Three times the penetration depth will be 630 µm and at this depth 95% ofthe incoming light will be absorbed. If precise positioning of the probe inside a vessel is not possible it must beassumed that such a high absorption can occur.
Using material parameters indicated in section 3.4.3 gives that the maximum power that can be delivered in0.1 s is 1 W, given that the 40 degrees is the maximum allowed temperature increase. In figure 10 is a plot of thetemperature increase as a function of blood layer thickness and the power of the incident light using eq. 4. Theequation actually approaches a constant as x→0 but cannot be expected to be valid when the layer thicknessapproaches the size of a red blood cell (∼ 10µm).
Proc. of SPIE Vol. 6078 60782J-8
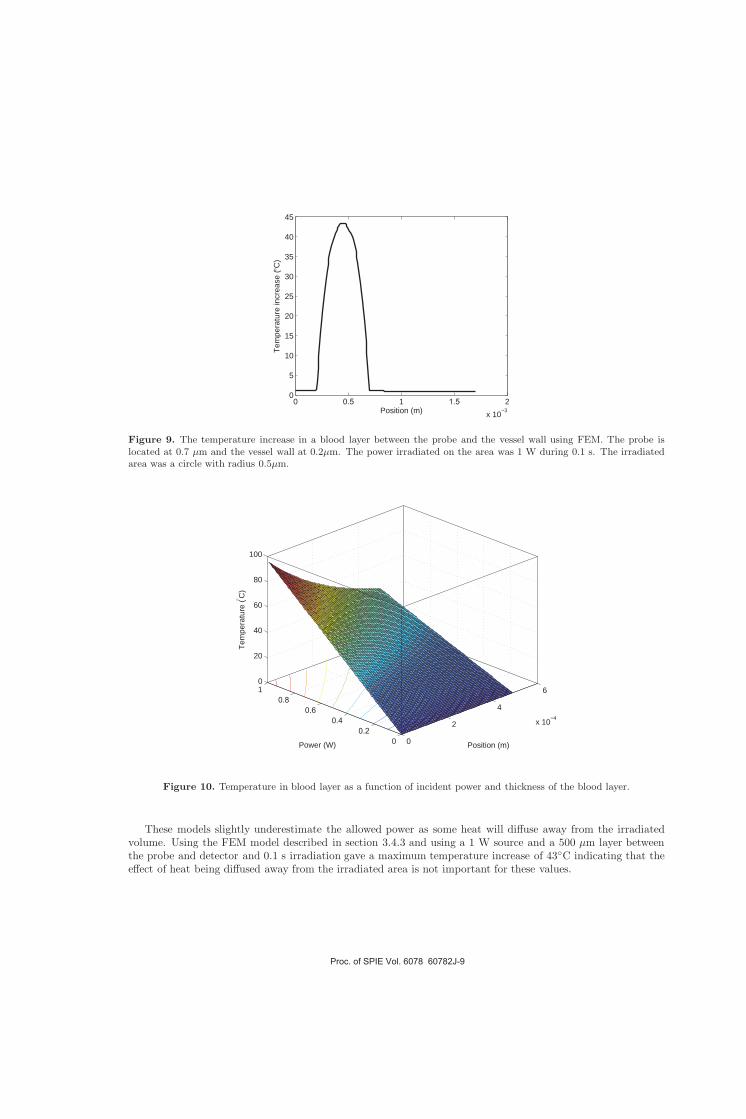
0 0.5 1 1.5 2x 10⁻³
0
5
10
15
20
25
30
35
40
45
Position (m)
Tem
pera
ture
incr
ease
(°C
)
Figure 9. The temperature increase in a blood layer between the probe and the vessel wall using FEM. The probe islocated at 0.7 µm and the vessel wall at 0.2µm. The power irradiated on the area was 1 W during 0.1 s. The irradiatedarea was a circle with radius 0.5µm.
0
2
4
6
x 10−4
00.2
0.40.6
0.810
20
40
60
80
100
Position (m)Power (W)
Tem
pera
ture
(° C)
Figure 10. Temperature in blood layer as a function of incident power and thickness of the blood layer.
These models slightly underestimate the allowed power as some heat will diffuse away from the irradiatedvolume. Using the FEM model described in section 3.4.3 and using a 1 W source and a 500 µm layer betweenthe probe and detector and 0.1 s irradiation gave a maximum temperature increase of 43C indicating that theeffect of heat being diffused away from the irradiated area is not important for these values.
Proc. of SPIE Vol. 6078 60782J-9

5. DISCUSSION
5.1. Effect of blood layer on fluorescence measurements
Fluorescence spectra can without the prescence of blood differentiate between various types of plaques based onthe level of fluorescence. However, it was found that at thin blood layer will form between the probe and thevessel wall that is about 10-20 microns thick. In addition the vessel wall is not completly flat, especially in thepresence of plaques so that even larger films of blood must be expected. If the film can vary up to 150 micronsthe signal variation due to the blood layer will be much larger than the expected variation in the fluorescencespectra. Washing the artery with saline could be possible but is stressfull for the organs and might be clinicallyundesirable. Especially when large parts of the coronary tree is to be mapped constant flushing might be toostressfull for this to be used as a screening method.
Some works have proposed variations in fluorescence lifetimes as a detection modality for plaque to avoid theinterference of the blood but here signal and heating issues could be important.9,11,12 As shown, about 1 Wis the limit on the power that can be used to irradiate to vessel wall to avoid serious damage to the blood. Asecurity margin should probably be incorporated into this number. The temperature issue is dependent on theexcitation wavelength used but 470 nm is close to the minimum in blood absorption in the wavelength regionwhere autofluorescence can be excited. If the temperature issue turns out to be a problem, perhaps some coolingmethod of the blood layer could be incorporated.
6. CONCLUSION
To conclude fluorescence measurements of aorta are not feasable unless an effective flushing method that is clin-ically safe can be incorporated in the method. If this is possible fluorescence spectra can differentiate atheroscle-rotic plaques and calcified plaques from other pathological or normal states of the vessel wall. Without flushingheating of the blood is an issue when increasing the power of the excitation signal to achieve enough power onthe detector due to the strong scattering and absorption of blood.
7. ACKNOWLEDGMENTS
The experiments in this report were approved by the Norwegian Board of Ethics in Medicine and was foundedby the Norwegian Research Council. The help of the Norwegian Blood Bank for supplying materials is greatlyappreciated. The authors greatly appreciates the aid of Eivind La Puebla Larsen, Andreas Meyer Winnem, LiseLyngsnes Randeberg and Kari Kilen in preparing the document.
REFERENCES
1. D. H. Blankenhorn and H. Braunstein, “Carotenoids in man. iii. the microscopic pattern of fluorescence inatheromas and its relation to their growth”, J. Clin. Invest. 37, pp. 160–165, 1958.
2. C. Kittrell, R. Willett, C. de los Santos-Pacheo, N. Ratliff, J. Kramer, E. Malk, and M. Feld, “Diagnosis offibrous arterial atherosclerosis using fluorescence”, Applied Optics 24, pp. 2280–2281, 2005.
3. R. Richards-Kortum, R. P. Rava, M. Fitzmaurice, J. R. Kramer, and M. S. Feld, “476 nm excited laser-induced fluorescence spectroscopy of human coronary arteries: Applications in cardiology”, American HeartJournal 122, pp. 1141–1150, 1991.
4. R. Richards-Kortum, R. P. Rava, M. Fitzmaurice, L. L. Tong, N. Ratliff, J. R. Kramer, and M. S. Feld,“A one layer model of laser-induced fluorescence for diagnosis of disease in human tissue: Applications toatherosclerosis”, IEEE Transactions on biomedical engineering 36, pp. 1222–1232, 1989.
5. K. Arakawa, K. Isoda, I. Toshimitu, K. Nakajima, T. Shibuya, and F. Ohsuzu, “Fluorescence analysis ofbiochemical constituents identifies atherosclerotic plaque with a thin fibrous cap”, Arterioscler. Thromb.Vasc. Biol. 1, pp. 1–71, 2002.
6. L. Marcu, Q. Fang, J. A. Jo, T. Papaioannou, A. Dorafshar, T. Reil, J.-H. Qiao, J. Baker, J. Freischlag,and M. Fishbein, “Fluorescence analysis of biochemical constituents identifies atherosclerotic plaque with athin fibrous cap”, Arterioscler. Thromb. Vasc. Biol. 181, pp. 1–71, 2005.
Proc. of SPIE Vol. 6078 60782J-10

7. G. Fillipidis, G. Zacharakis, A. Katsamouris, A. Giannoukas, and T. Papazoglou, “Single and double wave-length excitation of laser-induced fluorescence of normal and atherosclerotic peripheral vascular tissue”, J.Photochem. and Photobiol. B 56, pp. 163–171, 2000.
8. T. G. Papazoglou, “Malignancies and atherosclerotic plaque diagnosis - is laser induced fluorescence spec-troscopy the ultimate solution?”, J. Photochem. and Photobiol. B 28, pp. 3–11, 1995.
9. Q. Fang, J. Jo, T. Papaioannou, A. Dorafshar, T. Reil, J.-H. Qiao, C. M. Fishbein, J. Freischlag, andL. Marcu, “Validation of a time-resolved fluorescence spectroscopy apparatus using a rabbit atherosclerosismodel”, Proc. of SPIE 5312, pp. 294–299, 2005.
10. W.-C. Lin, S. A. Toms, E. D. Jansen, and A. Mahadevan-Jansen, “Intraoperative application of opticalspectroscopy in the prescence of blood”, IEEE journal on selected topics in quantum electronics 7, pp. 996–1003, 2001.
11. S. Andersson-Engels, J. Johansson, and S. Svanberg, “The use of time-resolved fluorescence for diagnosis ofatherosclerotic plaque and malignant tumours”, Spectrochimica Acta A 46, pp. 1203–1210, 1990.
12. S. Andersson-Engels, J. Johansson, U. Stenram, K. Svanberg, and S. Svanberg, “Time-resolved laser inducedfluorescence spectroscopy for enhanced demarcation of human atherosclerotic plaques”, J. Photochem. andPhotobiol. B 4, pp. 363–369, 1990.
13. M. B. Lilledahl, M. Barkost, M. Gran, O. A. Haugen, and L. O. Svaasand, “Reflection spectroscopy ofatherosclerotic plaque”, Journal of Biomedical Optics, To be published march 2006 .
14. V. Tuchin, Tissue Optics: Light scattering methods and Instrumentation for medical diagnostics, SPIEPress, 2000.
15. H. S. Carslaw and J. Jaeger, Conduction of heat in Solids, Oxford Science Publications, 1959.16. H. C. Stary, A. B. Chandler, R. E. Dinsmore, V. Fuster, S. Glagov, I. William, M. E. Rosenfeld, C. J.
Schwartz, W. D. Wagner, and R. W. Wissler, “A definition of advanced types of atherosclerotic lesions anda histological classification of atherosclerosis”, Circ. 92, pp. 1355–1374, 1995.
Proc. of SPIE Vol. 6078 60782J-11


Paper III
Reflection spectroscopy of atherosclerotic plaque
Magnus B. Lilledahl, Olav A. Haugen, Marianne Barkostand Lars O. Svaasand. Journal of biomedical optics11(2), 0210051-0210057 (2006)

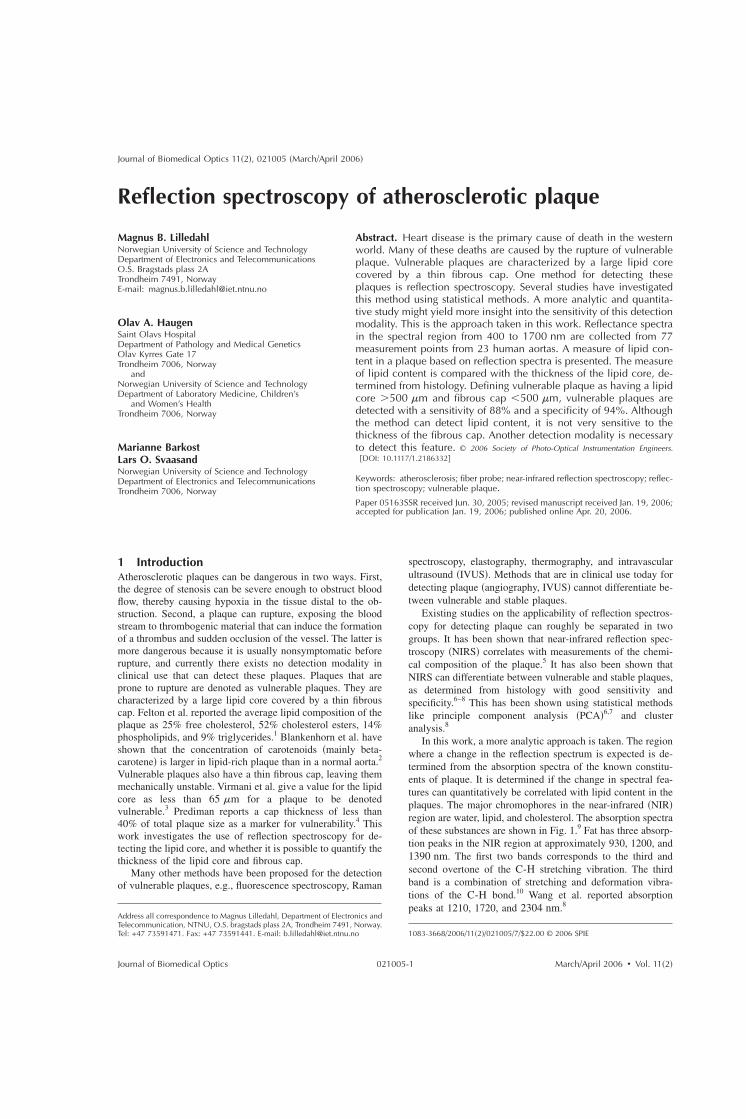
Reflection spectroscopy of atherosclerotic plaque
Magnus B. LilledahlNorwegian University of Science and TechnologyDepartment of Electronics and TelecommunicationsO.S. Bragstads plass 2ATrondheim 7491, NorwayE-mail: [email protected]
Olav A. HaugenSaint Olavs HospitalDepartment of Pathology and Medical GeneticsOlav Kyrres Gate 17Trondheim 7006, Norway
andNorwegian University of Science and TechnologyDepartment of Laboratory Medicine, Children’s
and Women’s HealthTrondheim 7006, Norway
Marianne BarkostLars O. SvaasandNorwegian University of Science and TechnologyDepartment of Electronics and TelecommunicationsTrondheim 7006, Norway
Abstract. Heart disease is the primary cause of death in the westernworld. Many of these deaths are caused by the rupture of vulnerableplaque. Vulnerable plaques are characterized by a large lipid corecovered by a thin fibrous cap. One method for detecting theseplaques is reflection spectroscopy. Several studies have investigatedthis method using statistical methods. A more analytic and quantita-tive study might yield more insight into the sensitivity of this detectionmodality. This is the approach taken in this work. Reflectance spectrain the spectral region from 400 to 1700 nm are collected from 77measurement points from 23 human aortas. A measure of lipid con-tent in a plaque based on reflection spectra is presented. The measureof lipid content is compared with the thickness of the lipid core, de-termined from histology. Defining vulnerable plaque as having a lipidcore 500 m and fibrous cap 500 m, vulnerable plaques aredetected with a sensitivity of 88% and a specificity of 94%. Althoughthe method can detect lipid content, it is not very sensitive to thethickness of the fibrous cap. Another detection modality is necessaryto detect this feature. © 2006 Society of Photo-Optical Instrumentation Engineers.
DOI: 10.1117/1.2186332
Keywords: atherosclerosis; fiber probe; near-infrared reflection spectroscopy; reflec-tion spectroscopy; vulnerable plaque.Paper 05163SSR received Jun. 30, 2005; revised manuscript received Jan. 19, 2006;accepted for publication Jan. 19, 2006; published online Apr. 20, 2006.
1 IntroductionAtherosclerotic plaques can be dangerous in two ways. First,the degree of stenosis can be severe enough to obstruct bloodflow, thereby causing hypoxia in the tissue distal to the ob-struction. Second, a plaque can rupture, exposing the bloodstream to thrombogenic material that can induce the formationof a thrombus and sudden occlusion of the vessel. The latter ismore dangerous because it is usually nonsymptomatic beforerupture, and currently there exists no detection modality inclinical use that can detect these plaques. Plaques that areprone to rupture are denoted as vulnerable plaques. They arecharacterized by a large lipid core covered by a thin fibrouscap. Felton et al. reported the average lipid composition of theplaque as 25% free cholesterol, 52% cholesterol esters, 14%phospholipids, and 9% triglycerides.1 Blankenhorn et al. haveshown that the concentration of carotenoids mainly beta-carotene is larger in lipid-rich plaque than in a normal aorta.2
Vulnerable plaques also have a thin fibrous cap, leaving themmechanically unstable. Virmani et al. give a value for the lipidcore as less than 65 m for a plaque to be denotedvulnerable.3 Prediman reports a cap thickness of less than40% of total plaque size as a marker for vulnerability.4 Thiswork investigates the use of reflection spectroscopy for de-tecting the lipid core, and whether it is possible to quantify thethickness of the lipid core and fibrous cap.
Many other methods have been proposed for the detectionof vulnerable plaques, e.g., fluorescence spectroscopy, Raman
spectroscopy, elastography, thermography, and intravascularultrasound IVUS. Methods that are in clinical use today fordetecting plaque angiography, IVUS cannot differentiate be-tween vulnerable and stable plaques.
Existing studies on the applicability of reflection spectros-copy for detecting plaque can roughly be separated in twogroups. It has been shown that near-infrared reflection spec-troscopy NIRS correlates with measurements of the chemi-cal composition of the plaque.5 It has also been shown thatNIRS can differentiate between vulnerable and stable plaques,as determined from histology with good sensitivity andspecificity.6–8 This has been shown using statistical methodslike principle component analysis PCA6,7 and clusteranalysis.8
In this work, a more analytic approach is taken. The regionwhere a change in the reflection spectrum is expected is de-termined from the absorption spectra of the known constitu-ents of plaque. It is determined if the change in spectral fea-tures can quantitatively be correlated with lipid content in theplaques. The major chromophores in the near-infrared NIRregion are water, lipid, and cholesterol. The absorption spectraof these substances are shown in Fig. 1.9 Fat has three absorp-tion peaks in the NIR region at approximately 930, 1200, and1390 nm. The first two bands corresponds to the third andsecond overtone of the C-H stretching vibration. The thirdband is a combination of stretching and deformation vibra-tions of the C-H bond.10 Wang et al. reported absorptionpeaks at 1210, 1720, and 2304 nm.8
1083-3668/2006/112/021005/7/$22.00 © 2006 SPIE
Address all correspondence to Magnus Lilledahl, Department of Electronics andTelecommunication, NTNU, O.S. bragstads plass 2A, Trondheim 7491, Norway.Tel: +47 73591471. Fax: +47 73591441. E-mail: [email protected]
Journal of Biomedical Optics 112, 021005 March/April 2006
Journal of Biomedical Optics March/April 2006 Vol. 112021005-1

In the visible region, the most significant change in thespectrum for lipid-rich plaques is probably due to a higherconcentration of carotenoids mainly beta-carotene.2 Figure 2shows the absorption spectrum of beta-carotene.11 Based onthe knowledge of this spectrum, regions where there is achange in the reflectance spectrum due to lipid content in theplaque has been identified. A simple measure of lipid contentin the plaque based on this information is proposed.
2 Materials and Methods2.1 MaterialsA section of the thoracic aorta from 23 patients 14 men and 9women were excised during autopsy. No special rules wereemployed in selecting the patients that were included in thestudy. Age of patients at death were 56±21 years. In the timebetween autopsy and measurements 2 h, the sample waskept in phosphate buffered saline PBS at room temperature.The section of the aorta was opened longitudinally and placed
on a piece of black cardboard with the lumen side facing up.For two of the samples, measurements were also collectedwith white copy paper as the bottom layer, but no systematicdifference in the reflectance was detected. Between one andseven measurement points were selected from each sample,depending on the prevalence of atherosclerotic plaque. Theselection was performed by visual inspection. One measure-ment point was chosen from a region that looked normal andthe remaining points from areas that looked like plaque. Theentire measurement series took about 2 h for each sample.During measurements, the samples were kept hydrated bydripping PBS on the samples with a pipette. Just before plac-ing a probe on the sample, the surface was lightly dried withpaper tissue.
2.2 Methods: Reflection MeasurementsReflection spectra in the wavelength range 400 to 1700 nmwere acquired for each measurement point using two differentspectrometers Ocean Optics SD2000, double channel; andOcean Optics NIR512, Ocean Optics, Duiven, The Nether-lands. The SD2000 spectrometer is sensitive in the regionfrom 400 to 1100 nm, and the NIR512 spectrometer from 900to 1700 nm. Three different probes were used in the measure-ments: 1. an integrating sphere Ocean Optics, ISP-REF, 2. afiber reflection probe Ocean Optics, VIS-NIR with sevenexcitation fibers placed in a circular fashion around a centralcollection fiber hereby denoted “circular probe”, and 3. afiber reflection probe Ocean Optics, custom design with fourfibers placed in a linear array hereby denoted “linear probe”.For the linear probe, the fiber furthest to the side was used asthe excitation fiber, and the three other fibers could act inde-pendently as collection fibers. For a schematic drawing anddimensions of the fiber probes, see Fig. 3. All the probes wereconnected to the spectrometers via fiber connections.
The integrating sphere was hand-held during measure-ments while the fiber probes were positioned using a mi-crometer positioning stand and kept just in contact with thetissue during measurements. The contact point was deter-mined by visual inspection. The sample was not fixed to thestand, so the placement of different probes at the same pointwas done visually. The error of the lateral position was esti-mated to be less than 2 mm.
Spectra were recorded as percent reflection relative to areflection standard SRS-99-010, LabSphere, North Sutton,United Kingdom. The integrating sphere was placed in directcontact with the standard for the reference measurements. For
Fig. 1 Absorption spectra of the most important absorbers in the NIRspectral region.9
Fig. 2 Molar extinction coefficient of beta-carotene.11
Fig. 3 A schematic view of the tip of the two fiber probes used in theexperiment. The white circles represent excitation fibers and the grayrepresent collection fibers.
Lilledahl et al.: Reflection spectroscopy of atherosclerotic plaque
Journal of Biomedical Optics March/April 2006 Vol. 112021005-2

the circular and linear probes, the tip of the probe was posi-tioned 15 mm from the surface of the reflectance standard.The reflectance standard has a very high scattering coefficient,so the penetration depth is very small. If the fiber probes areput on the surface, very few photons will reach a fiber that isseparated from the excitation fiber by more than one penetra-tion depth. This effect might be wavelength dependent, andthis is the reason that the fibers were positioned away fromthe surface of the reflectance standard. The reflectance valuesfor the probes are thus not relative to 100% reflectance, butrelative to a spectrally flat standard of unknown absolute re-flectance. A black-painted copper cylinder was placed aroundthe probe to shield from ambient lighting. The same blackcylinders were used during measurements to shield from theambient lighting, but the probes were then in contact with thetissue. The procedure is illustrated in Fig. 4.
2.3 Methods: HistologyThe samples were prepared for histology immediately afterthe spectroscopic measurements. A rectangle 104 mmwas cut out around the measurement point with a scalpel anddivided along the long center line. One part was fixed in 10%buffered formalin and embedded in paraffin, while the otherwas frozen in liquid nitrogen. The samples were then slicedand stained. The formalin sample was stained withhematoxylin-eosin-saffron HES and the frozen sections withSudan3. The sections were then photographed through a mi-croscope at three different magnifications 2, 10, and 20.To be able to quantify the size of histological sections, a mi-croscopic measurement stick was also photographed at thevarious magnifications. The size of the histological featurestotal plaque, lipid core, and cap thickness was measured bymanually comparing prints of the sample and the measure-ment stick, at the same magnification, using a ruler.
3 Analysis3.1 Spectral AnalysisThe first derivative of the NIR spectra was computed usingthe method of Savitzky and Golay using the software package
Matlab Mathworks, Natick, MA.12 The lipid peak around1200 nm causes a local minimum in the spectrum that is su-perpositioned on the reflectance minimum due to the waterabsorption see Fig. 5. The derivatives of these spectra areshown in Fig. 6. For the normal vessel, the derivative in-creases monotonically i.e., a decrease in the negative slope ofthe reflectance spectra, while for the lipid-rich plaque, thederivative starts to decrease around 1168 nm due to the su-perpositioning of the lipid absorption band over the waterabsorption band. The difference between the peak and thevalley of this spectrum is assigned as the lipid index denotedCl. This is illustrated in Fig. 6.
Fig. 4 A schematic view of the reference measurement used for thefiber probes. For the reference measurement left, the fiber probeswere positioned 1.5 cm away from the standard but were in contactwith the tissue during reflection measurements right.
Fig. 5 Example reflectance spectra from the NIR region. For the lipid-rich plaque solid line, there is an additional local minimum around1200 nm that is superimposed on the broader minimum due to waterabsorption.
Fig. 6 Illustration of the lipid index Cl=dR /d=1168−dR /d=1178.The figure shows the derivative of the spectra in Fig. 5. For the normalartery dashed line, the derivative increases monotonically, whereasfor the lipid-rich, there is a local minima due to the superimposedlipid absorption. Cl0 when a certain amount of lipid is present inthe sampling region of the probe.
Lilledahl et al.: Reflection spectroscopy of atherosclerotic plaque
Journal of Biomedical Optics March/April 2006 Vol. 112021005-3

Cl =dR
d
=1168− dR
d
=1178. 1
In the visible region, the lipid-index Cl was taken as thedifference between the reflection at 560 nm where there islittle beta-carotene absorption but substantial blood absorp-tion and the reflection at 450 nm the absorption peak ofbeta-carotene, divided by the reflection at 700 nm. At700 nm, the absorption of both beta-carotene and blood isrelatively small. Dividing by this value accounts for the over-all reflectance level of the spectrum due to scattering proper-ties.
Cl =R560 − R450
R700. 2
3.2 Histological AnalysisA picture was taken of a microscopic measuring stick for eachmagnification so that absolute lengths could be determined inthe histological photographs. From these photographs, thethickness of the total plaque, the fibrous cap, and the lipidcore were determined. The total plaque thickness was deter-mined from the HES stained sections as the distance from themedia defined as the presence of red colored elastin fibers tothe endothelium Fig. 7. The core thickness was determinedfrom the Sudan Red stained sections as the thickness of thearea where red stained lipid droplets were present. The fibrouscap thickness was defined as the distance from the inner liningof the vessel to the start of the lipid core Fig. 8.
4 ResultsFigures 9 and 10 contain typical reflectance data from an ar-tery for the NIR and visible spectral region. The correspond-ing aorta sample is shown in Fig. 11. The only change in theNIR reflectance spectra where there is known lipid absorptionwas at a point around 1200 nm. In the visible region, thereseemed to be an increased absorption from 450 to 500 nm forlipid-rich plaques.
The spectral analysis, defined in Sec. 3.1 was then com-pared with the histological studies. In Figs. 12–15, plots of Cl
and Cl are plotted against the lipid core thickness. In theseplots, plaques with a lipid core greater than 500 m or a
fibrous cap less than 500 m are defined as vulnerable. Formeasurements in the NIR, a line has been drawn at Cl=0 as apossible demarcation between a lipid-index, indicating astable or vulnerable plaque. For the visible region Fig. 15,the demarcation line was arbitrarily put at 0.25, which seemedto yield the best results. Only data for the circular probe arepresented for the visual region. Using these definitions, thesensitivities and specificities for the various measurementswere calculated. The results are tabulated in Table 1.
5 DiscussionWater is an important absorber in the NIR region. Eventhough the samples were put in PBS, which has the sameosmotic pressure as tissue, there might be some absorption ofwater into the tissue, which can cause swelling. This mightchange the optical properties of the tissue. However, the en-dothelium of the aorta is constantly exposed to the liquid en-vironment of the blood stream, so it seems likely that thesample should be somewhat resistant to this effect. On theother hand, since the combined measurements took up to 2 h,there might be some dehydration during the experiment, evenif PBS was often dripped onto the sample. This swelling ordehydration effect whichever is stronger might affect thereflectance spectra on which the calculation of Cl is based.
The thickness of the vessel wall was different as deter-mined from the formalin fixed sections compared to the fro-zen sections. Size artifacts are known problems in histology.13
The measurement of the lipid core thickness might thereforehave an inherent systematic error. The precision of the sizemeasurements was estimated to be about 50 m. This wascalculated as the average size difference of the same structure,measured in the frozen and in the formalin fixed sections. Thisgives no estimate on how well the measurements compare tothe original size of the plaque, as there might be other sys-tematic errors linked to the fixation process.
From Fig. 10, it seems like the difference in the spectrabetween a normal vessel and a lipid containing plaque isstronger in the visible region than in the near-infrared region.However, Fig. 15 shows that the correlation with lipid contentis poorer. This is most likely due to the large blood absorptionthat overlaps the absorption spectra of beta-carotene. Smalldifferences in the vasculature of the vessel can have largeimplications on the measured spectra. This can be seen in Fig.
Fig. 7 Definition of plaque thickness. Fig. 8 Definition of lipid core thickness and fibrous cap thickness.
Lilledahl et al.: Reflection spectroscopy of atherosclerotic plaque
Journal of Biomedical Optics March/April 2006 Vol. 112021005-4
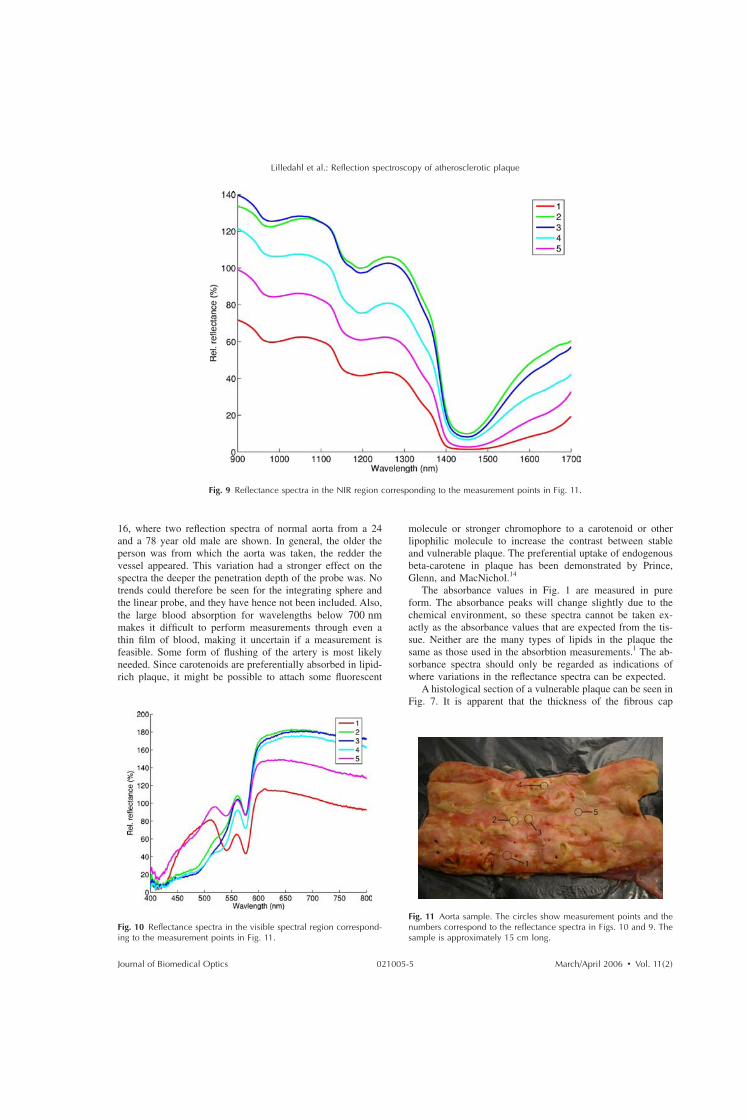
16, where two reflection spectra of normal aorta from a 24and a 78 year old male are shown. In general, the older theperson was from which the aorta was taken, the redder thevessel appeared. This variation had a stronger effect on thespectra the deeper the penetration depth of the probe was. Notrends could therefore be seen for the integrating sphere andthe linear probe, and they have hence not been included. Also,the large blood absorption for wavelengths below 700 nmmakes it difficult to perform measurements through even athin film of blood, making it uncertain if a measurement isfeasible. Some form of flushing of the artery is most likelyneeded. Since carotenoids are preferentially absorbed in lipid-rich plaque, it might be possible to attach some fluorescent
molecule or stronger chromophore to a carotenoid or otherlipophilic molecule to increase the contrast between stableand vulnerable plaque. The preferential uptake of endogenousbeta-carotene in plaque has been demonstrated by Prince,Glenn, and MacNichol.14
The absorbance values in Fig. 1 are measured in pureform. The absorbance peaks will change slightly due to thechemical environment, so these spectra cannot be taken ex-actly as the absorbance values that are expected from the tis-sue. Neither are the many types of lipids in the plaque thesame as those used in the absorbtion measurements.1 The ab-sorbance spectra should only be regarded as indications ofwhere variations in the reflectance spectra can be expected.
A histological section of a vulnerable plaque can be seen inFig. 7. It is apparent that the thickness of the fibrous cap
Fig. 9 Reflectance spectra in the NIR region corresponding to the measurement points in Fig. 11.
Fig. 10 Reflectance spectra in the visible spectral region correspond-ing to the measurement points in Fig. 11.
Fig. 11 Aorta sample. The circles show measurement points and thenumbers correspond to the reflectance spectra in Figs. 10 and 9. Thesample is approximately 15 cm long.
Lilledahl et al.: Reflection spectroscopy of atherosclerotic plaque
Journal of Biomedical Optics March/April 2006 Vol. 112021005-5

varies over the extent of the plaque. Any clinical implemen-tation of this method will need to have a lateral resolution lessthan 1 mm, or vulnerable plaques might be incorrectly char-acterized as stable even though they have a very thin cap onthe edge, where the mechanical forces are strongest.
The spectroscopic measurements are to a certain degreesensitive to the thickness of the cap, as can be seen in Figs. 12through 15. Even though a plaque has a large lipid core, itgives a low value of Cl, since it is covered by a thick fibrouscap. However, in the literature a plaque with cap thicknessless than 65 m is defined as a vulnerable plaque, and this isnot detectable with the current instrumentation.3 The defini-tion used in this work is partially based on the discriminationthat could be expected, given the geometry of the probes thatwere used, and partially warranted by the definition given inone of the references.4 If the minimum cap thickness of65 m had been used, many points in the upper right quad-rant of Figs. 12 through 15 would be considered stable instead
of vulnerable. If plaques with lipid cores less than 500 mhad been considered vulnerable if the cap was thin enough,many points in the lower left quadrant of Figs. 12 through 15would be vulnerable instead of stable. The definition used waschosen to show that the method detects the presence of lipidand is also partially sensitive to the thickness, but that prob-ably an additional method with high resolution is needed tomeasure the cap, e.g., optical coherence tomography, confocalmicroscopy, or multiphoton microscopy. An array of verysmall fibers 10 m with very small fiber separation couldalso achieve this. There are also lipid absorption peaks higherup in the infrared spectrum where the penetration depth issmall due to the high water absorption. Using several wave-lengths with different penetration depths, it could be possibleto calculate approximately at what depth the lipid core is. Atomographic method that can also detect the lumen surface isprobably best, since the precise positioning of a probe inside acoronary artery is difficult. A sensor using reflection spectros-copy could be used to scan the artery. If the presence of lipid
Fig. 15 Lipid index Cl for the visible region versus thickness of thelipid core, measured with the circular fiber probe.
Fig. 12 Lipid index Cl versus thickness of lipid core, measured withthe circular fiber probe.
Fig. 13 Lipid index Cl versus thickness of lipid core, measured withthe linear fiber probe, using the fiber nearest to the excitation fiber asthe collection fiber. Using the other fibers as collection fibers gavepoorer correlation with the thickness of the lipid core.
Fig. 14 Lipid index Cl versus thickness of lipid core, measured withthe integrating sphere.
Lilledahl et al.: Reflection spectroscopy of atherosclerotic plaque
Journal of Biomedical Optics March/April 2006 Vol. 112021005-6

is detected, a high resolution method could be used to makean accurate measurement of the cap thickness.
The aorta is about a factor of 5 larger than the coronaryarteries. It must be determined if the method is still sensitivewhen all sizes are scaled down. Light will penetrate deeperinto vessel structures, so a method that only collects lightscattered from the plaque will be important.
6 ConclusionIt is shown that NIRS can detect the presence of lipid inplaque in the aorta with good sensitivity. It cannot, however,determine accurately the thickness of the cap. Some otherhigh resolution tomographic method would probably have tobe used to determine this. Reflection spectra in the visibleregion seem to be able to provide some information aboutlipid content, but yield poorer correlation than the NIR spec-tral region. Lateral resolution of at least 1 mm is necessary, asthe cap thickness can vary throughout the plaque area.
7 Future StudiesIt remains to be determined if this detection modality is stillpossible through a varying layer of blood, or if it is necessary
in some way to press the sensor against the vessel wall. Theadditional imaging modality that needs to be added must alsobe determined from viewpoints of resolution, contrast, size,and complexity. It must be determined if the methods are alsosensitive in the smaller coronary arteries.
AcknowledgmentsWe would like to thank Unn Granli for the preparation of thehistological sections, and all the people that have given con-structive feedback on this article: Lise Lyngsnes Randeberg,Eivind La Puebla Larsen, and Dag Roar Hjelme. This workwas part of a project funded by the Norwegian ResearchCouncil.
References1. C. Felton, D. Crook, M. Davies, and M. Oliver, “Relation of plaque
lipid composition and morphology to the stability of human aorticplaques,” Arterioscler., Thromb., Vasc. Biol. 17, 1337–1345 1997.
2. D. H. Blankenhorn, D. G. Freiman, and H. C. Knowles, “Carotenoidsin man: the distribution of epiphasic carotenoids in atheroscleroticlesions,” J. Clin. Invest. 35, 1243–1247 1956.
3. R. Virmani, F. D. Kolodgie, A. P. Burke, A. Farb, and S. M.Schwartz, “Lessons from sudden coronary death: a comprehensivemorphological classification scheme for atherosclerotic lesions,” Ar-terioscler., Thromb., Vasc. Biol. 17, 1337–1345 1997.
4. K. S. Prediman, “Mechanisms of plaque vulnerability and rupture,” J.Am. Coll. Cardiol. 41, 15S–22S 2003.
5. W. Jaross, V. Neumeister, P. Lattke, and D. Schuh, “Determination ofcholesterol in atherosclerotic plaques using near infrared diffuse re-flection spectroscopy,” Atherosclerosis 47, 327–337 1999.
6. P. R. Moreno, R. A. Lodder, R. Purushotaman, W. E. Charash, W. N.O’Connor, and J. E. Muller, “Detection of lipid pool, thin fibrous capand inflammatory cells in human aortic atherosclerotic plaques bynear-infrared spectroscopy,” Circulation 105, 923–927 2002.
7. A. M. K. Nilsson, D. Heinrich, J. Olajos, and S. Andersson-Engels,“Near infrared diffuse reflection and laser-induced fluorescence spec-troscopy for myocardial tissue characterisation,” Spectrochim. Acta,Part A 53, 1901–1912 1997.
8. J. Wang, Y. Geng, B. Guo, T. Klima, B. N. Lai, J. T. Willerson, andW. Casscells, “Near-infrared spectroscopic characterization of humanadvanced atherosclerotic plaque,” Atherosclerosis 39, 1305–13132002.
9. M. B. Lilledahl, O. A. Haugen, L. L. Randeberg, and L. O. Svaasand,“Characterization of atherosclerotic plaque by reflection spectroscopyand thermography: A comparison,” Proc. SPIE 5686, 415–4252005.
10. B. Osborne and T. Fearn, Near Infrared Spectrosocpy in Food Analy-sis, Longman Scientific and Technical 1988.
11. H. Du, R. A. Fuh, J. Li, A. Corkan, and J. S. Lindsey, “Photochem-cad: A computer-aided design and research tool in photochemistry,”Photochem. Photobiol. 68, 141–142 1998.
12. A. Savitzky and M. J. E. Golay, “Smoothing and differentiation ofdata by simplified least squares procedures,” Anal. Chem. 36, 1627–1639 1964.
13. M. McCall, C. J. Harkrider, V. Deramo, S. F. Bailey, K. P. Winter, B.A. Rockwell, D. J. Stolarski, and C. A. Toth, “Using optical coher-ence tomography to elucidate the impact of fixation on retinal laserpathology,” Proc. SPIE 4257, 142–148 2001.
14. M. R. Prince, M. L. Glenn, and E. F. MacNichol, Jr., “Increasedpreferential absorption in human atherosclerotic plaque with oral betacarotene,” Circulation 78, 338–344 1988.
Fig. 16 Variation in reflection spectra in the visible region from nor-mal aorta. In general, the absorption of hemoglobin was stronger theolder the person was, and the redder the vessel appeared.
Table 1 Sensitivities and specificities of the various measurements.
CircularprobeNIR
LinearprobeNIR
IntegratingsphereNIR
CircularprobeVIS
Sensitivity 88% 88% 44% 83%
Specificity 94% 81% 91% 79%
Lilledahl et al.: Reflection spectroscopy of atherosclerotic plaque
Journal of Biomedical Optics March/April 2006 Vol. 112021005-7


Paper IV
An analytic and numerical study of intravas-
cular thermography of vulnerable plaque
Magnus B. Lilledahl, Eivind L. P. Larsen and Lars O.Svaasand. Physics in medicine and biology. In press.To be published january 2007.


INSTITUTE OF PHYSICS PUBLISHING PHYSICS IN MEDICINE AND BIOLOGY
Phys. Med. Biol. 52 (2007) 961–979 doi:10.1088/0031-9155/52/4/007
An analytic and numerical study of intravascularthermography of vulnerable plaque
M B Lilledahl, E L P Larsen and L O Svaasand
Norwegian University of Science and Technology, 7018 Trondheim, Norway
E-mail: [email protected]
Received 30 August 2006, in final form 12 December 2006Published 24 January 2007Online at stacks.iop.org/PMB/52/961
AbstractIntravascular thermography has been proposed as a method for detectingvulnerable plaque. A marker of vulnerability in a plaque is inflammation,which is believed to reduce its mechanical stability. It has been hypothesizedthat this inflammation leads to a higher metabolic rate and therefore higher heatgeneration, causing increased temperature in the vicinity of the plaque. Thistemperature increase could be measured intravascularly using a temperaturesensor, e.g., a thermistor or a thermocouple. The aim of this study is to presenta thorough mathematical and physical analysis of the thermal distribution thatcan be expected in the plaque under various physiological conditions. Toget reasonable predictions on the expected temperature distributions, idealizedmodels with simple geometries are solved analytically. More realistic models,with more complex geometries, are solved numerically using the finite elementmethod (FEM). Based on this analysis, the maximum temperature increase thatcan be expected in a plaque due to increased metabolism is less than 0.1 K.
(Some figures in this article are in colour only in the electronic version)
1. Introduction
Cardiovascular disease is the most prevalent cause of death in the US and most of these deathsare due to myocardial infarction (Thom et al 2006). These are usually caused by an occlusivethrombosis in the coronary arteries, induced by the rupture or erosion of so-called vulnerableatherosclerotic plaques (Davies and Thomas 1985).
Vulnerable plaques have several characteristic properties that are relevant for theirdetection: a large lipid core covered by a thin fibrous cap and inflammation marked bythe presence of macrophages (Felton et al 1997). Inflammation decreases plaque stability bythe release of metalloproteinases which degrade the fibrous cap. It is hypothesized that thisinflammation increases the temperature at the plaque surface (Casscells et al 1996). Detecting
0031-9155/07/040961+19$30.00 © 2007 IOP Publishing Ltd Printed in the UK 961

962 M B Lilledahl et al
inflamed plaques could yield important clinical information about which plaques are likely todevelop quickly and cause a coronary thrombosis.
The use of temperature measurements for detecting plaques was first proposed by Casscellset al (1996). They investigated the temperature variation on the surface of carotid plaques,excised during endarterectomy. The surface temperature was measured with a thermistor. Theymeasured temperature differences up to 2.2 K on the surface. In one instance, temperaturedifferences of 0.6 K were measured at two sites only 1 mm apart. It was shown that temperaturedifference correlated positively with cell density in the plaque and negatively with the capthickness. These measurements were conducted at room temperature. Larger temperaturedifferences (0–5 K) were reported on measurements performed in an incubator at 37 C, butno further details were provided. Temperature was also measured with an infrared camera,but no results were presented.
Several in vivo measurements have shown temperature heterogeneity in coronary arteries.For a review of experimental results of thermography, see Madjid et al (2006). Some ofthese have correlated temperature heterogeneity with the type of coronary disease (Stefanadiset al 1999) and shown that it serves as a predictor for clinical outcome (Stefanadis 2001,Schmermund et al 2003). Temperature heterogeneity has also been correlated with biomarkers,e.g., C-reactive protein (Stefanadis et al 2000). A recent study by Rzeszutko et al (2006) foundthat the maximal temperature difference between blood and vessel wall was found in the culpritsegment in 57.5% of the patients examined.
Two FEM studies on temperature distribution due to an atherosclerotic plaque have beenpublished (ten Have et al 2004, 2005). In the first study they investigated the effect of plaquegeometry and of blood flow on the measured temperature. The heat generation they used inthe plaques ranged from 0.1×10⁹ W m−3 to 0.4×10⁹ W m−3. These values were determinedby requiring that the resulting temperatures fit published experimental values. Perfusion of thesurrounding tissue was not included in their modelling of the temperature distribution. Thesecond study investigated how the probe geometry and sensor material affect the temperaturemeasurements.
There is a large discrepancy amongst the measured values published in the literature. Theaim of this study is to present a thorough mathematical and physical analysis of the thermaldistribution that can be expected in plaques under various conditions. This framework can thenbe used to analyse experimental results. Since the published values vary so much, estimates ofmetabolic rates are derived by indirect consideration instead of requiring a fit to experimentalvalues. Analytical models were investigated for geometries that are simple enough to besolved analytically. This gives reasonable predictions on the temperature variations thatcan be expected and physical insight into how various parameters affect the measurements.Numerical calculations of more realistic models were computed with the finite element method(FEM)
2. Physics
2.1. Physical model
The temperature distribution in the vessel wall is calculated assuming that the heat generatedin the tissue is transported by conduction, convection by the flowing blood in the lumen,and perfusion in the surrounding tissue. The perfusion is modelled by the so-called bioheatequation:
κ∇2T − ρtct
∂T
∂t= −q + ρbcbω(T − T0). (1)

Thermography of vulnerable plaque 963
This equation was first presented by Pennes (1948) and has been further analysed inmany works, e.g., Chen and Holmes (1980). The assumption in this equation is that constanttissue temperature is maintained by the colder arterial blood removing heat from the tissuewhen passing through the capillary network. The heat generated in the body’s core must betransported to the lungs and skin via the blood. If the heat transport was via conduction alone,very high temperatures would result in the centre of the body. For the blood to transport heataway from the tissue, the temperature in the arterial network must necessarily be lower than thevenous network (this is not valid in the skin where the heat is dissipated and the blood is cooleron the venous side). The last term in (1) models the removal of the heat due to perfusion. ω
is the volume of perfused blood per volume of tissue per unit time (see appendix A). T is thetemperature of the tissue, and T0 is the temperature of the arterial blood. q represents the heatper unit volume per unit time (Q will be used for the total heat generated in a volume per unittime). ρt and ρb are the densities of tissue and blood respectively, ct and cb are the specificheats of tissue and blood respectively. κ is the thermal conductivity of tissue.
The total heat distribution in a system is the result of all the heat sources in the system.We will assume that the temperature in the system can be divided into the temperature T1 dueto the heat generation from the plaque q, and T2 due to the heat qs generated by the rest of thesystem. We thus write equation (1) as
κ∇2(T1 + T2) − ρtct
∂(T1 + T2)
∂t= −(qs + q) + ρbcbω(T1 + T2 − T0). (2)
This equation can be divided into two separate equations:
κ∇2T1 − ρtct
∂T1
∂t= −q + ρbcbω(T1) (3)
and
κ∇2T2 − ρtct
∂T2
∂t= −qs + ρbcbω(T2 − T0). (4)
By adding these two equations, the solution for the total temperature distribution results.Only (3) will be solved since T1 represents the deviation from normal temperature due tothe heat generation in the plaque, and this is the desired quantity. From now on T1 will bereferred to as T. The thermal gradients from (4) due to normal metabolism qs are relevant inthe measurement process. This is discussed in section 6.3. For a steady state, (3) becomes
∇2T = −q − PT
κ. (5)
Here PT = cbρbωT is the amount of heat removed per unit volume and time due toperfusion of the tissue. (5) is the equation solved in the analytic models. Radiation has beenproposed as a thermal transport mechanism but can have no significant effect in this system.This is discussed in appendix B.
In the numerical models the convection by the blood flowing in the lumen is included.For the blood it is assumed that the heat is transported by convection and conduction so thatthe equation to be solved is
κb∇2T − ρbcb
∂T
∂t= ρbcbvb · ∇T , (6)
where the last term represents the heat transport due to convection and vb is the velocity of theblood.
To determine the velocity profile of the blood stream, the steady-state Navier–Stokesequation for an incompressible fluid,
ρb(v · ∇)v = −∇p + η∇2v, (7)
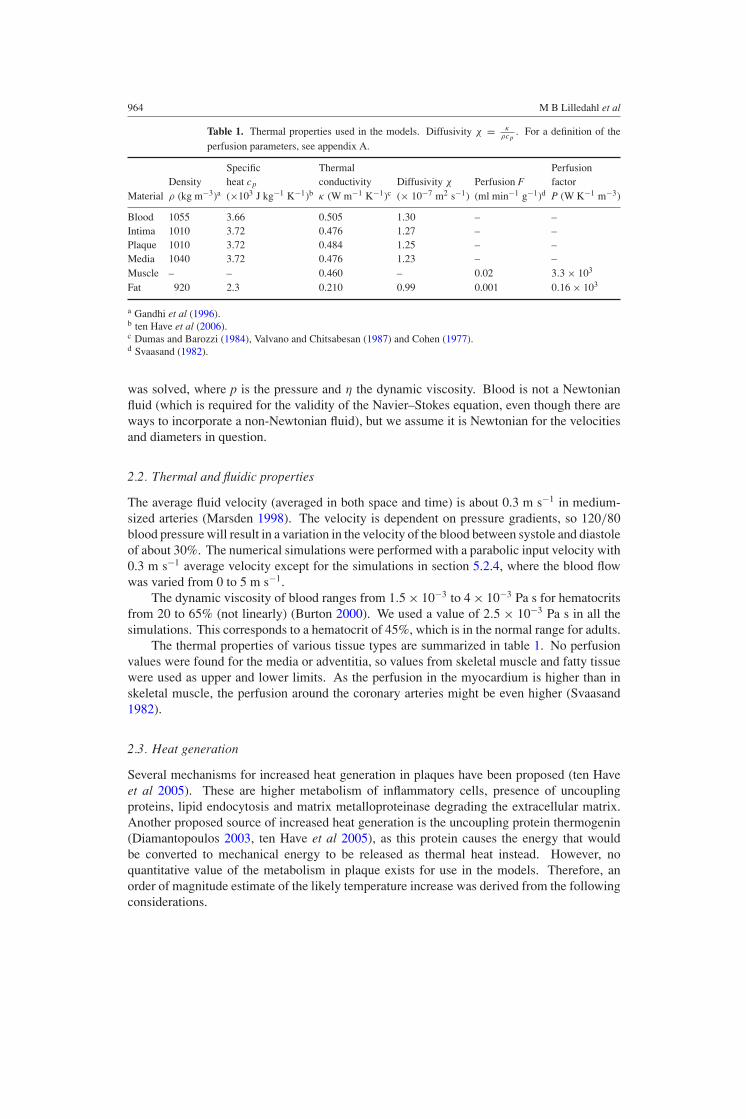
964 M B Lilledahl et al
Table 1. Thermal properties used in the models. Diffusivity χ = κρcp
. For a definition of theperfusion parameters, see appendix A.
Specific Thermal PerfusionDensity heat cp conductivity Diffusivity χ Perfusion F factor
Material ρ (kg m−3)a (×103 J kg−1 K−1)b κ (W m−1 K−1)c (× 10−7 m2 s−1) (ml min−1 g−1)d P (W K−1 m−3)
Blood 1055 3.66 0.505 1.30 – –Intima 1010 3.72 0.476 1.27 – –Plaque 1010 3.72 0.484 1.25 – –Media 1040 3.72 0.476 1.23 – –Muscle – – 0.460 – 0.02 3.3 × 10³
Fat 920 2.3 0.210 0.99 0.001 0.16 × 10³
a Gandhi et al (1996).b ten Have et al (2006).c Dumas and Barozzi (1984), Valvano and Chitsabesan (1987) and Cohen (1977).d Svaasand (1982).
was solved, where p is the pressure and η the dynamic viscosity. Blood is not a Newtonianfluid (which is required for the validity of the Navier–Stokes equation, even though there areways to incorporate a non-Newtonian fluid), but we assume it is Newtonian for the velocitiesand diameters in question.
2.2. Thermal and fluidic properties
The average fluid velocity (averaged in both space and time) is about 0.3 m s−1 in medium-sized arteries (Marsden 1998). The velocity is dependent on pressure gradients, so 120/80blood pressure will result in a variation in the velocity of the blood between systole and diastoleof about 30%. The numerical simulations were performed with a parabolic input velocity with0.3 m s−1 average velocity except for the simulations in section 5.2.4, where the blood flowwas varied from 0 to 5 m s−1.
The dynamic viscosity of blood ranges from 1.5 × 10⁻³ to 4 × 10⁻³ Pa s for hematocritsfrom 20 to 65% (not linearly) (Burton 2000). We used a value of 2.5 × 10⁻³ Pa s in all thesimulations. This corresponds to a hematocrit of 45%, which is in the normal range for adults.
The thermal properties of various tissue types are summarized in table 1. No perfusionvalues were found for the media or adventitia, so values from skeletal muscle and fatty tissuewere used as upper and lower limits. As the perfusion in the myocardium is higher than inskeletal muscle, the perfusion around the coronary arteries might be even higher (Svaasand1982).
2.3. Heat generation
Several mechanisms for increased heat generation in plaques have been proposed (ten Haveet al 2005). These are higher metabolism of inflammatory cells, presence of uncouplingproteins, lipid endocytosis and matrix metalloproteinase degrading the extracellular matrix.Another proposed source of increased heat generation is the uncoupling protein thermogenin(Diamantopoulos 2003, ten Have et al 2005), as this protein causes the energy that wouldbe converted to mechanical energy to be released as thermal heat instead. However, noquantitative value of the metabolism in plaque exists for use in the models. Therefore, anorder of magnitude estimate of the likely temperature increase was derived from the followingconsiderations.

Thermography of vulnerable plaque 965
The basal metabolic rate for a 70 kg man ranges from 5000–9000 kJ/day (Burton 2000).This is equivalent to 58–104 W. Assuming that the density of a man is about 800 kg m−3 and70% of the weight is living tissue gives a heat generation per volume of 663–1189 W m−3.Under strong exercise there can be up to a 20-fold increase in the metabolism (Tortora andGrabowski 2003), giving a maximal heat generation of about 2 × 10⁴ W m−3.
In a study of alveolar macrophages the metabolism of a single cell was found to be20 pW/cell (Thoren et al 1990). Assuming a tissue dense with macrophages of average size103 µm3 gives a heat generation of 2 × 10⁴ W m−3 (Lilledahl et al 2005).
In the work of Casscells et al (1996), thin samples excised during endarterectomy weretaken out and placed on a table in room temperature. Since the samples were thin (thicknessnot specified in paper) most of the heat will be lost to the air and the table and not so muchalong the tissue. The conductivity of air is 0.025 W K−1 m−1. Modelling the plaque asa sphere with radius a = 2 mm completely surrounded by air and assuming a temperaturedifference of 1 K at the surface, (9) yields a heat generation of 18 750 W m−3. Becausefew experimental details were disclosed in the paper, this simplistic model is uncertain. Thecalculation should be considered in the sense that the results of Casscells could be explainedby the heat generation we have used, rather than as an argument for a likely in-vivo value.
Bjørnheden and Bondjers (1987) found that for early lesions the oxygen consumptionincreases, but decreases below normal levels for more developed lesions. The initial increasewas of the order of 50–100%. Whether these plaques had macrophage infiltration was notspecified. A reduction in metabolism in highly developed plaques will reduce the effect of thehigher metabolism due the macrophage infiltration.
Heinle (1987) reported a decreasing content of glucose, glycerol and ATP, and increasingamounts of lactate with increasing distance into the vessel. This indicates an ineffective,anaerobic metabolism, which will counteract the increased heat generation due to themacrophages. This was in pre-necrotic core plaques, and it seems likely that the metabolismwould fall even further when a non-metabolizing necrotic core is present. Whether more heatis generated under anaerobic conditions since more energy is converted into heat instead ofadenosine triphosphate (ATP), or less heat is generated since the overall energy turnover isless, is unknown. Under aerobic conditions 60% of the metabolized energy is converted toheat (Tortora and Grabowski 2003), so the heat generation cannot increase by more than 40%under anaerobic conditions due to ineffective ATP production.
Based on these considerations we have used the metabolic rate of 2 × 10⁴ W m−3 in ourmodels (a 20-fold increase over normal metabolism). This value is comparable to the heatgenerated in a maximally working body or a tissue dense with macrophages. Based on theresults of Heinle (1987) and Bjørnheden and Bondjers (1987), where metabolic changes wereof the order of 50–100%, this order of magnitude estimate seems to represent an upper limiton the metabolic rate that can be expected in a plaque. Since Bjørnheden and Bondjers (1987)found oxygen consumption changes around 100%, 2 × 10³ W m−3 seems like a likely valueof the increased metabolism (a doubling of normal metabolism.)
3. Analytical models
Analytical models gives physical insight and order of magnitude estimates that can be usedto validate numerical models, even though simplified geometries must be used. They are alsouseful in providing estimates on expected experimental results. The only model which issomewhat mathematically tractable and still realistic is a system with spherical symmetry (seeappendix C).

966 M B Lilledahl et al
A sphere with heat generation q and radius a can model the plaque when the blood flowhas been obstructed and the perfusion in the surrounding media neglected (or stopped bythe obstructed blood flow). Assuming that the sphere has thermal conductivity κ1, and issurrounded by an infinite medium with no heat generation and thermal conductivity κ2, thesolutions as a function of the radial distance r of the steady-state heat equation (5) with P = 0are
T1(r) = q
6κ1(a2 − r2) +
qa2
3κ2, (8)
T2(r) = qa3
3κ2r, (9)
for the sphere and the surroundings, respectively.Adding perfusion in the surrounding medium gives a more realistic model of a plaque
in a vessel with obstructed blood flow, but with intact perfusion in the surrounding tissue.Assuming perfusion P in the surrounding medium (equivalent to a heat sink of PT ), andthermal conductivity κ in both regions, the solutions are given by
T1(r) = −qr2
6κ+
qa2
6κ
(2
a√
P/κ + 1+ 1
), (10)
T2(r) = qa3 exp (−√P/κ(r − a))
3κ(a√
P + 1)r, (11)
for the region of the heat generating sphere and the surroundings, respectively. From (11)one can define a thermal penetration depth (where the temperature has dropped by e−1) in aperfused media to be
d =√
κ
P. (12)
This was used to determine the necessary size of the geometries in the numerical modelsso that the effects of the finite boundaries could be minimized.
If the heat producing region is embedded in a region of lower conductivity, this couldproduce a higher temperature in the centre of the heat producing region, due to the insulatingeffect of the lower conductivity material (e.g. fatty deposits). This situation can be modelledby a heat producing sphere of radius a, with thermal conductivity κ1, surrounded by a shellof radius b > a with thermal conductivity κ2 < κ1, which again is surrounded by an infinitemedium with thermal conductivity κ1. The solutions to this model for the three regions arefrom centre and out,
T1(r) = − q
6κ1
(r2 − a2 b(2κ1 + κ2) − 2a(κ1 − κ2)
κ2b
), (13)
T2(r) = − q
6κ2
(2κ1a
3
κ2r− 2a3(κ1 + κ2)
bκ2
), (14)
T3(r) = qa3
3κ1r. (15)
To find the increase in temperature at the centre of the plaque due to the insulating material,we can take the ratio
f = T0(0)
Tins(0)= 1
3
(2κ1
κ2+ 1
)+
2a
3b
(κ1
κ2− 1
), (16)
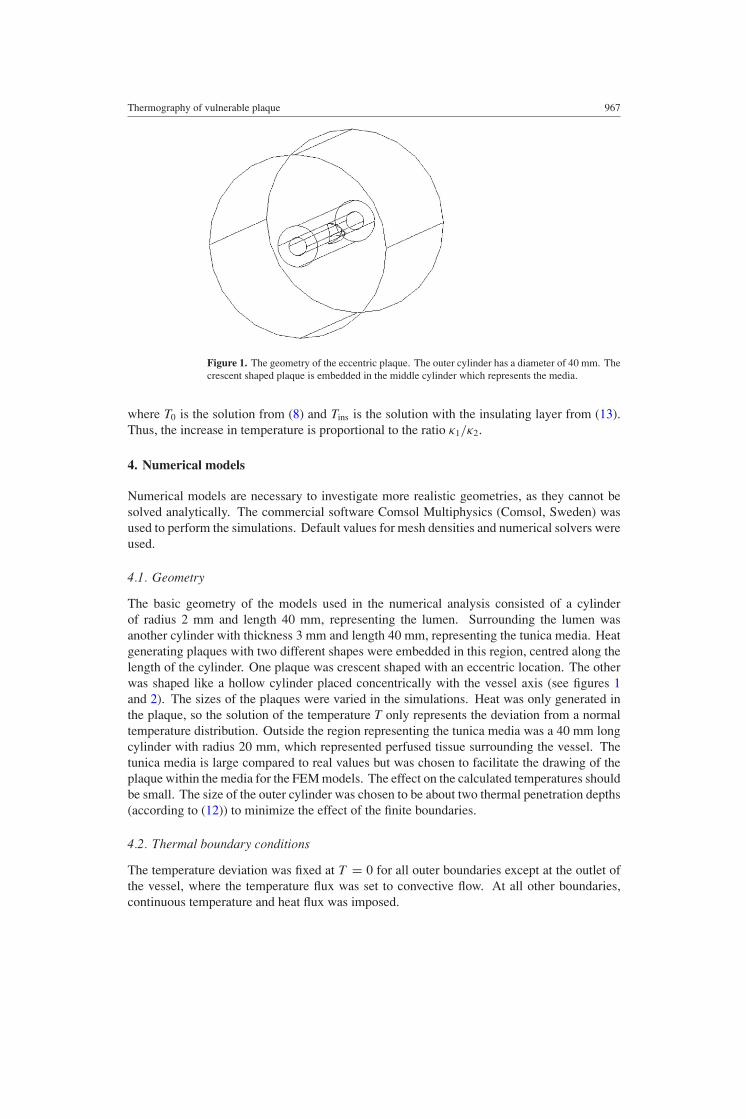
Thermography of vulnerable plaque 967
Figure 1. The geometry of the eccentric plaque. The outer cylinder has a diameter of 40 mm. Thecrescent shaped plaque is embedded in the middle cylinder which represents the media.
where T0 is the solution from (8) and Tins is the solution with the insulating layer from (13).Thus, the increase in temperature is proportional to the ratio κ1/κ2.
4. Numerical models
Numerical models are necessary to investigate more realistic geometries, as they cannot besolved analytically. The commercial software Comsol Multiphysics (Comsol, Sweden) wasused to perform the simulations. Default values for mesh densities and numerical solvers wereused.
4.1. Geometry
The basic geometry of the models used in the numerical analysis consisted of a cylinderof radius 2 mm and length 40 mm, representing the lumen. Surrounding the lumen wasanother cylinder with thickness 3 mm and length 40 mm, representing the tunica media. Heatgenerating plaques with two different shapes were embedded in this region, centred along thelength of the cylinder. One plaque was crescent shaped with an eccentric location. The otherwas shaped like a hollow cylinder placed concentrically with the vessel axis (see figures 1and 2). The sizes of the plaques were varied in the simulations. Heat was only generated inthe plaque, so the solution of the temperature T only represents the deviation from a normaltemperature distribution. Outside the region representing the tunica media was a 40 mm longcylinder with radius 20 mm, which represented perfused tissue surrounding the vessel. Thetunica media is large compared to real values but was chosen to facilitate the drawing of theplaque within the media for the FEM models. The effect on the calculated temperatures shouldbe small. The size of the outer cylinder was chosen to be about two thermal penetration depths(according to (12)) to minimize the effect of the finite boundaries.
4.2. Thermal boundary conditions
The temperature deviation was fixed at T = 0 for all outer boundaries except at the outlet ofthe vessel, where the temperature flux was set to convective flow. At all other boundaries,continuous temperature and heat flux was imposed.

968 M B Lilledahl et al
Figure 2. The geometry for the concentric plaque model. The outer cylinder has a diameter of40 mm. The plaque is the short cylinder and is embedded in the middle cylinder which representsthe media.
Numerical models must have a finite size, so boundary conditions cannot be at infinity.Applying fixed temperature boundary conditions can lead to spurious results as unlikely highheat fluxes are generated at the boundaries. To minimize the error of the boundaries, an upperlimit on the acceptable flux at the boundary is that
∮ j · dA/Q = Qj/Q 1, where j isthe heat flux, Q is the heat generated in the system and the integration is performed over theouter surface of the model, except the outlet of the vessel. This condition states that most ofthe generated heat is accounted for in the system that is analysed. In all systems that wereanalysed (except for simulations with very low blood flow) the heat lost through the outerboundary of the system was less than 10% of the energy generated in the system, indicatingthat the finite boundaries will have little effect on the calculated temperatures. Furthermore,the radius of the outer cylinder (20 mm) was chosen to be larger than the penetration depth inthe perfused tissue which was calculated to be d = 12 mm from (12).
Simulations of very low or no blood flow had higher thermal gradients at the surfaces.To determine if this would have a large impact on the solution, a numerical solution of asphere of radius 1 mm in a perfused medium with radius 20 mm was compared to an analyticsolution of a sphere in a perfused medium extending to infinity. This models the situationwith no blood flow. The result is shown in figure 3. The flux through the outer boundary wasQj = 6.6 × 10⁻⁵ W in the numerical calculations, and the total heat generation in the systemwas Q = 8.3 × 10⁻⁵ W. Even though the flux through the boundary accounts for a large partof the generated energy, the numerical solutions are very close to the analytic solution.
4.3. Fluid boundary conditions
The average blood velocity is about v = 0.3 m s−1 in coronary arteries, which is fairly lowcompared to the dynamic viscosity (η = 2.5 × 10⁻³ Pa s). The Reynolds number is given by
Re = ρvl
η. (17)
Here, l is a characteristic length of the system and ρ is the density of the fluid. Withl = 2 mm and using the density of blood from table 1 gives Re = 500. Usually, Re = 2300

Thermography of vulnerable plaque 969
0 0.002 0.004 0.006 0.008 0.01 0.012 0.014 0.016 0.018 0.02
0
0.005
0.01
0.015
0.02
0.025
Distance (m)
Tem
pera
ture
(° C)
Numerical
Analytic
Figure 3. Difference between analytic and numerical models of a heat generating sphere. For theanalytic model the surrounding medium was infinite and for the numerical model the sphere wasembedded in another sphere with radius 20 mm. The graph shows the temperature as a function ofdistance from the plaque centre. The heat generating sphere had a radius of 1 mm. The temperaturecalculated by the numerical model is slightly lower due to the imposed zero temperature at theboundary (see section 4.2), but the effect of the finite boundary on the temperature is small.
is given as a limit of laminar flow. Blood was therefore modelled with a parabolic velocityprofile (Poiseuille flow) with an average velocity of v = 0.3 m s−1 at the input and output asit would be in laminar flow. At the surfaces of the vessel the boundary condition was set tov = 0 (no slip condition).
5. Results
5.1. Analytic models
Assume a spheroidal plaque with radius a = 1 mm, with heat generation q = 2 × 10⁴ W m−3,embedded in an infinite medium representing the media. Using the physical properties fromtable 1, (8) yields a 0.025 C temperature increase at the centre of the plaque.
If we now include a perfusion of P = 3.3 × 10³ W K−1 m−3 in the infinite mediumsurrounding the plaque, the resulting temperature increase at the centre of the plaque becomes0.020 C.
An insulating layer could increase the temperature in the centre of the plaque, but noticethat the insulating region has no effect on the temperature distribution in the surroundingmedium (compare (9) and (15)). Using a sphere with radius a = 1 mm embedded in a 1 mmthick insulating layer of fatty tissue with lower conductivity (see table 1) yields a value of0.030 C at the centre of the sphere.
5.2. Numerical models
5.2.1. Eccentric plaque. A crescent shaped, eccentric plaque, with positive remodelling intothe media (no stenosis), was simulated. The geometry is shown in figure 1. Figure 4 showsvariation in the highest recorded temperature in the plaque as a function of the plaque volume
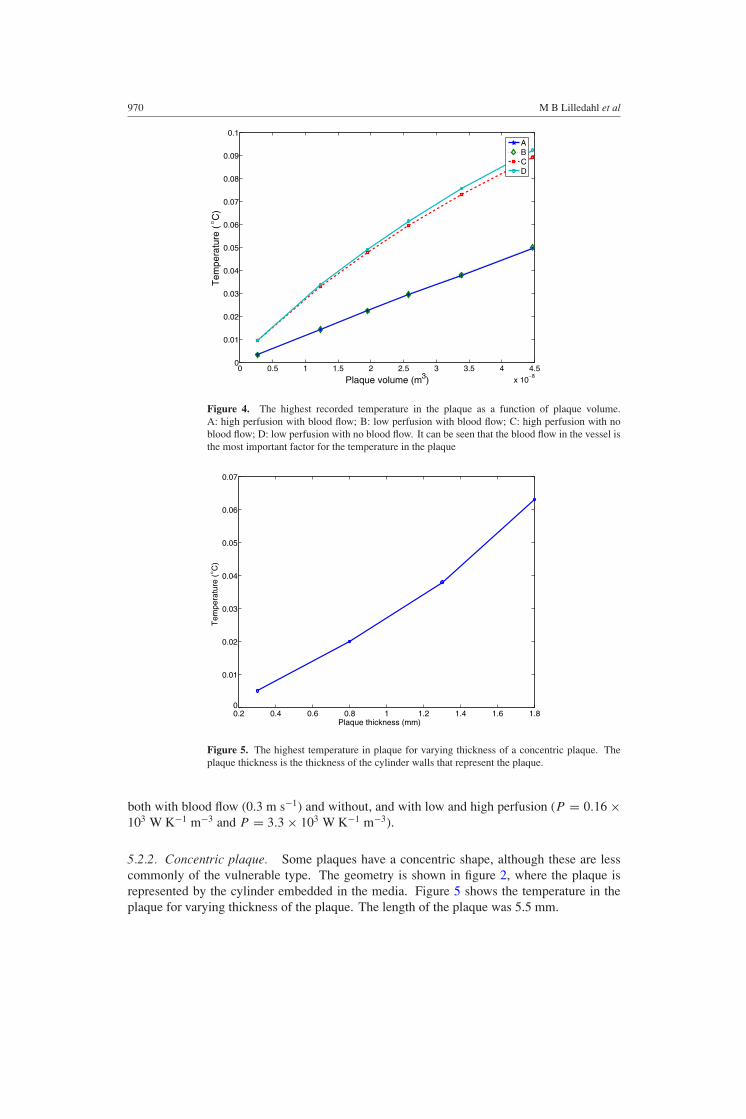
970 M B Lilledahl et al
0 0.5 1 1.5 2 2.5 3 3.5 4 4.5
x 10−8
0
0.01
0.02
0.03
0.04
0.05
0.06
0.07
0.08
0.09
0.1
Plaque volume (m3)
Tem
pera
ture
( ° C
)
ABCD
Figure 4. The highest recorded temperature in the plaque as a function of plaque volume.A: high perfusion with blood flow; B: low perfusion with blood flow; C: high perfusion with noblood flow; D: low perfusion with no blood flow. It can be seen that the blood flow in the vessel isthe most important factor for the temperature in the plaque
0.2 0.4 0.6 0.8 1 1.2 1.4 1.6 1.80
0.01
0.02
0.03
0.04
0.05
0.06
0.07
Plaque thickness (mm)
Tem
pera
ture
( ° C
)
Figure 5. The highest temperature in plaque for varying thickness of a concentric plaque. Theplaque thickness is the thickness of the cylinder walls that represent the plaque.
both with blood flow (0.3 m s−1) and without, and with low and high perfusion (P = 0.16 ×10³ W K−1 m−3 and P = 3.3 × 10³ W K−1 m−3).
5.2.2. Concentric plaque. Some plaques have a concentric shape, although these are lesscommonly of the vulnerable type. The geometry is shown in figure 2, where the plaque isrepresented by the cylinder embedded in the media. Figure 5 shows the temperature in theplaque for varying thickness of the plaque. The length of the plaque was 5.5 mm.

Thermography of vulnerable plaque 971
103
104
105
106
10−3
10−2
10−1
100
101
Heat generation (W m−3)
Tem
pera
ture
( ° C
)
Figure 6. A log–log plot of the temperature in the centre of an eccentric plaque for varying valuesof heat generation in the plaque. We can see the dependence on the heat generation is linear aspredicted by equation (8). The slope of the plot is 3.5 ×10⁻⁶ K m3 W−1.
5.2.3. Variation in heat generation. To investigate how the temperature at the centre of theplaque changes with varying metabolic rates, the heat generation in the plaque was variedbetween 2×10³ W m−3 and 6×10⁵ W m−3. A large eccentric plaque with volume equal to thelargest plaque in section 5.2.1 was used for this simulation. The results are shown in figure 6.
5.2.4. Variation in blood flow. The average blood flow in medium sized arteries (such asthe coronary arteries) is about 0.3 m s−1. Due to pressure variations during diastole andsystole, the velocity will vary up to 30%. The pulsation of the blood was not modelled but theupper and lower limits of the velocity were modelled and the resulting effect of the pulsatingblood must necessarily lie between these upper and lower limits. In figure 7 are plots of thetemperature at the surface and in the centre of the plaque for varying blood flows. Figures 8and 9 show cross sections of the temperature distribution with and without flow in the lumen,respectively.
5.2.5. Variation in perfusion. To get the functional dependence of the perfusion, this quantitywas varied from F = 0.012 ml min−1 g−1 for fatty tissue to F = 0.02 ml min−1 g−1 forcardiac muscle (Svaasand 1982). Using (A.1) and (A.2) we find that this corresponds to heatsinks of q = 3.3 × 10³T W K−1 m−3 and q = 0.16 × 10³T W K−1 m−3, respectively.
Arteries in the coronary tree can be surrounded either by thick adipose tissue or by cardiacmuscle. These tissue types have different perfusion rates (see table 1). To see how this affectsthe temperature of the plaque, a large eccentric plaque was simulated with perfusion from 0to 15 000 W K−1 m−3. The results are shown in figure 10.
6. Discussion
It was found that the temperature change in the centre of a plaque due to increased heatgeneration was less than 0.1 K. We have used what we consider as an upper limit of the heat

972 M B Lilledahl et al
10−1
100
101
0
0.01
0.02
0.03
0.04
0.05
0.06
0.07
0.08
0.09
Bloodflow (m s-1)
Tem
pera
ture
( °C
)
Centre of plaquePlaque surface
0
Figure 7. The variation in the temperature in the centre and at the surface of the plaque for varyingblood flows from 0 to 5 m s−1. The curve indicates that there is a certain threshold before theblood flow has any significant effect and that the temperature decreases linearly at high flow rates.The plaque surface is naturally more affected by the blood flow.
Figure 8. Thermal distribution in a vessel with flow. The temperature in the lumen is basicallyunaffected by the heat generation in the plaque.
generation and reported temperature values at the centre of the plaque. The temperature valuesat the surface of the plaque will therefore be significantly lower. This temperature seems toosmall to be measured accurately in the experimentally difficult environment of an artery.
6.1. Comparison of analytic and numerical results
According to (10), the temperature dependence for a sphere in a perfused medium follows ana2 dependence on the radius of the sphere, a 1/
√P dependence on perfusion, and is linear

Thermography of vulnerable plaque 973
Figure 9. Thermal distribution in a vessel with no flow.
0 5000 10000 150000.05
0.06
0.07
0.08
0.09
0.1
0.11
0.12
Perfusion factor, P (W K-1 m-3)
Tem
pera
ture
( °C
)
CentreSurface
Figure 10. The plot shows the temperature in the plaque for varying degrees of perfusion in thesurrounding medium. Physiological realistic values are between 160 and 3330 K−1. The top graphis the highest recorded value in a plaque, and the bottom is at the plaque surface, facing the lumen.
with the heat generation q. The a2 dependence on the radius is a V 2/3 dependence in termsof volume. In figure 4 we see that for the no-flow case, the temperature calculated from thenumerical model follows a trend that is similar to the V 2/3 dependence that was expectedfrom the analytic model. This is similar to what was reported by ten Have et al (2004). Thedifferences between flow and no-flow conditions varied between 78–180%. This is higherthan the values reported by Stefanadis et al (2003). The presence of the catheter, reducing themaximal flow compared to an empty artery, is the probable cause for this discrepancy. For

974 M B Lilledahl et al
the concentric model the T-dependence in figure 5 is in terms of plaque thickness instead ofvolume, and it can be seen that the graph seems to follow the a2 dependence that was expectedfrom the analytic model.
Figure 10 shows that the temperature in the numerical results follows the 1/√
P
dependence as predicted by the analytic model. It can be seen in figure 6 that T is linearwith q which was also predicted by the analytic model. The same dependence was alsoreported by ten Have et al (2004).
In figure 7 we can see that the nearly linear shape of the logarithmic plot above a certainthreshold indicates that T ∝ log v, which is the same that was reported by Diamantopouloset al (2003). The loss of dependence at high velocities that Diamantopoulos et al (2003)reported was not observed within the values simulated. However, at some point the reductionin temperature with increased velocity must necessarily decrease. Diamantopoulos et al (2003)found no temperature variations due to oscillations in the blood blow. This is in agreementwith figure 7 from which it can be determined that a 30% variation of blood flow only changesthe steady-state temperature by less than 0.01 K. The transient effect will be even smaller.
Since the analytic models compare well with the numerical models, the former are usefulfor easily predicting the effect that changing various parameters will have on the resultingtemperature.
6.2. Heat generation
In the estimate of the heat generation in the plaque, a tissue that was assumed to be dense withmacrophages was used. Since the plaque is by no means dense with macrophages, the valueused in this work represents an upper bound on the heat generation. We have in this paperplaced the heat generation in the plaque centre, not the cap where the macrophage infiltrationusually resides. Even though the heat source will be closer to the lumen, possibly making theheat generated there easier to measure, the volume they usually occupy is smaller than theones used in this study. The values reported in this study are of the highest temperature inthe plaque, not at the surface of the vessel. The temperatures reported here thus represent anupper limit on the value that can be measured.
Using the article by Casscells et al (1996) to determine heat generation is very uncertain.How ex vivo metabolism compares to in vivo metabolism is unknown. It could increase due toincreased oxygen supply, or decrease due to the lower availability of nutrients. In the analysis,free or forced convection was not taken into account; the article by Casscells et al (1996) didnot contain enough information to determine these. These factors would increase the heatloss to the air, and would increase the calculated metabolic rate. Despite these uncertainties,equation (16) shows that a heat generation which can yield a temperature increase of 1 K inair will yield about 0.05 K when embedded in a tissue since the thermal conductivity is about20-fold higher.
6.3. Causes of published values
Several studies have reported temperatures higher than the values predicted in this paper.Casscells et al (1996) found temperature variations above 1 C, but as discussed insection 6.2, the low thermal conductivity of air will give higher temperatures than if thesame heat generating region was surrounded by tissue.
Since it is the blood that transports heat away from the tissue and dissipates the heatthrough the lungs and skin, a thermal gradient must necessarily exist between the blood andtissue. The heart pumps about 5 l min−1 in an adult, resting person, and can rise to about

Thermography of vulnerable plaque 975
20 l min−1 during heavy exercise (Tortora and Grabowski 2003). Based on the physical modelof the bioheat equation (1), the blood is heated to normal tissue temperature during its passthrough the capillaries. Thus, for the blood to transport away the heat Q generated by thenormal metabolism, a thermal gradient must exist between the blood and the tissue. Themagnitude of this can be calculated by the equation
T cbρbVb = Q. (18)
Vb is the volume of blood passing through the capillaries per unit time. Letting Vb =5 l min−1 and Q = 100 W gives a temperature difference of T = 0.3 K, which is thesame as reported experimental values (Nybo et al 2002). This means that for the blood toremove the heat generated in the body, the arterial blood must have a temperature about0.3 K below tissue temperature. Because of this thermal gradient, the thermal contact betweenthe tissue and the temperature probe and how it is exposed to the cooler blood could have alarge impact on the measured values. This could for example explain the values measured bySchmermund et al (2003) using a catheter from Volcano Therapeutics yielding temperaturesfrom 0.14–0.36 K. The increased thermal heterogeneity that was reported for patients withstable angina, compared to a healthy vessel, could be attributed to the rough surface of aheavily atherosclerotic vessel. However, as Stefanadis et al (1999) points out, patients withstable and unstable angina and with acute myocardial infarction have the same degree of vesselremodelling. Thus, the effect due to probe contact should be similar in all of these, but thermalheterogeneity was still different in these patient groups. Positioning a temperature sensor inthe vessel lumen will affect the measured temperatures, both through conduction along thecatheter and disruption of normal blood flow. This has been investigated in detail for variouscatheter designs by ten Have et al (2006).
Another question that needs an answer is whether temperature differences in surroundingorgans can affect the temperature measurements. Thermal penetration depth is defined byequation (12). Using P = 3.3 × 10³ W K−1 m−3 gives a thermal penetration depth of12 mm. Clearly, if there is temperature heterogeneity in the myocardium, this will affectthe temperature along a vessel. This is not unlikely as an established diagnosis, determinedfrom positron emission tomography, is that stenotic coronary arteries can lead to regions ofthe myocardium with increased metabolism but reduced perfusion. Increased metabolismand reduced perfusion will lead to increased temperature. Likewise, if the lungs, which areexposed to the much cooler ambient air, are within 12 mm of the coronary arteries, this wouldaffect the temperature measurements. Some thermography studies have been performed onthe aorta and this vessel passes diverse organs as liver, bowels and lungs which will affect thetemperature.
One study has reported temperature variations that are closer to the values predicted inthis paper (Toutouzas et al 2006).
6.4. Heat source location
We have in these studies modelled the heat generation in a plaque a certain distance belowthe surface. However, the macrophages in a plaque are usually reported to be in the cap andnot in the lipid core. This could bring the location of the highest temperature in the plaquecloser to the surface, making it easier to measure. However, since the values in the numericalstudies are reported as the highest temperature in the plaque, not the temperature measured atthe surface, this value will not increase. Closer to the surface the plaque could to some degreebe insulated more from the perfusion but would be more strongly influenced by the bloodflow. It has been reported that there is increased vasculature in the media of large plaques

976 M B Lilledahl et al
which would indicate a higher perfusion rate (Davies and Thomas 1985) and more efficientremoval of heat from the plaque. When flow is present in the vessel, it accounts for the largestpart of the heat loss, but if the vessel is occluded, the perfusion is important for the resultingtemperature.
7. Conclusions
Based on the simulations and physical parameters in this study, the temperature increase thatcan be expected in the centre of a plaque is less than 0.1 C. All the reported temperaturesin this study are of the highest recorded temperature in the plaque. The temperature a sensorcould measure would be lower than this. The results depend on the estimated heat generation inthe plaque. A value significantly larger than estimated values was chosen, so that the resultanttemperatures gives an upper bound on the temperature increase that that can be expected.Temperature differences of the order of 0.5 K and higher that are reported in the literaturecould be due to normal temperature gradients in the body, but seem unlikely to be explainedby increased metabolism in the plaque.
Acknowledgments
This work was funded by the Norwegian Research Council. The help by Dag Roar Hjelmeand Andreas Meyer Winnem in preparing the manuscript is greatly appreciated.
Appendix A. Perfusion
When deriving the heat equation for a perfused medium (5) it is assumed that qp is the energythat leaves a unit volume per unit time through perfusion. If ω is the volume of blood leavinga unit volume of tissue per unit time, then
qp = ωcbρbT, (A.1)
where T is the temperature difference between the tissue and the arterial blood. Theperfusion factor P is thus P = ωcbρb. ω is related to other measures of blood perfusion by
ω = Fρt = W/ρb, (A.2)
where F is the volume of perfused blood per unit mass of tissue per unit time and W is themass of perfused blood per unit volume of tissue per unit time (Svaasand 1982).
Appendix B. Heat transfer by radiation
There has been some dispute on whether radiation is an important heat transfer mechanismin vivo. The Stefan–Boltzman law gives the transfer of energy by radiation between twoobjects separated by a non-absorbing medium. Wien’s law gives the wavelength of maximumemission for a given temperature. For 37 C, this wavelength is 9.35 µm. At this wavelengththe optical penetration depth is about 17 µm (Hale and Querry 1973). Thus, if radiation isa contributing factor, one must in the Stefan–Boltzman law enter the temperature differenceof objects which are of the order of 17 µm apart, which is on average how far a photon cantravel without being absorbed. Using (9), we find that the temperature gradient is 13 K m−1
at the plaque surface of a 1 mm3 plaque. This gives a temperature difference of two objectsseparated 10 µm of 1.3 × 10⁻⁵ K. Using the Stefan–Boltzman law with this temperaturedifference gives a heat flux due to radiation of 9 × 10⁻⁵ W m−2. Using (9) to find the thermal

Thermography of vulnerable plaque 977
flux due to thermal conduction gives a value of 6.7 W m−2. This is a difference of five ordersof magnitude, showing that radiation is negligible.
Furthermore, in all measurements of thermal conductivity of a material the effect of heattransport by radiation will be incorporated in the measurement, so that the effect of radiationin an IR-absorbing medium is incorporated in the value of the thermal conductivity.
Appendix C. Dimensionality
Reducing dimensionality requires a symmetry plane or axis. This in effect requires an infiniteplane or axis or a symmetry plane/axis so large/long that edge effects are negligible. Forexample, to use a polar, two-dimensional (2D) coordinate system would require that the plaqueextended infinitely far along the vessel axis. This is not in general the case, and a full three-dimensional model should be used. In this study, the only geometry that could be reduced indimension was the concentric plaque where a 2D model of a longitudinal cross section (butnot the transverse) of the vessel could be used.
An example can illustrate the erroneous results that can be generated. Consider aheat generating sphere (representing the plaque) with a diameter of 1 mm embedded inan infinite medium (representing the tissue). Assume that the heat generation in the sphere is104 W m−3 and that both regions have a thermal conductivity of 0.4 W K−1 m−1. Thetemperature in the centre is then, by (8), 0.0125 K in the centre of the sphere. An (incorrectly)simplified one-dimensional (1D) model of this sphere could be a 2 mm region with heatgeneration 104 W m−1 surrounded by a thermally conductive medium from x = −∞ tox = ∞.
The 1D model does not even have a finite solution when the boundary condition is zeroat infinity so the temperature must be set to zero at finite position. To choose this position thesphere model was used to find where the temperature had dropped by one order of magnitude.This gives 0.02 m by (9). The solution to the 1D model with heat generation from x = −c1
to x = c1 and zero temperature at ±c2 is
T1 = q
κ
(c2
1 − x)
+2q
κc1(c2 − c1), (C.1)
T2 = 2q
κc1(c2 − x). (C.2)
The temperature at the centre of the heat generating region (the plaque) is then from(C.1) 0.97 K. We see that the answer changes by two orders of magnitude following asimplification (reduction of dimensionality) which at first sight might seem reasonable. Thephysical explanation is that heat flux along one or two dimensions is suppressed.
Nor does a 2D model have a steady-state solution with zero temperature at infinity. Thesolution in cylindrical coordinates for a disc with radius a embedded in a larger disc withradius b and using zero temperature as the boundary condition is for the inner disc,
T (r) = −qr2
4κ+
qa2
2κ
(ln
(b
a
)+
1
2
). (C.3)
Setting a = 1 mm, b = 20 mm and q = 104 W m−2 gives T = 0.087 K, about eighttimes higher than the 3D model.
References
Bjørnheden T and Bondjers G 1987 Oxygen consumption in aortic tissue from rabbits with diet-induced atherosclerosisArteriosclerosis 7 238–47

978 M B Lilledahl et al
Burton R F 2000 Physiology by Numbers: An Encouragement to Quantitative Thinking (Cambridge: CambridgeUniversity Press)
Casscells W, David M H, Krabach T, Vaughn W K, McAllister H A, Bearman G and Willerson J T 1996 Thermaldetection of cellular infiltrates in living atherosclerotic plaques: possible implications for plaque rupture andthrombosis Lancet 347 1447–9
Chen M M and Holmes K R 1980 Microvascular contribution in tissue heat transfer Ann. New York Acad.Sci. 335 137–50
Cohen M L 1977 Measurement of thermal properties of human skin—a review J. Invest. Dermatol. 69 333–8Davies M J and Thomas A C 1985 Plaque fissuring—the cause of acute myocardial infarction, sudden ischaemic
death, and crescendo angina Br. Heart J. 53 363–73Diamantopoulos L 2003 Arterial wall thermography J. Int. Cardiol. 16 261–6Diamantopoulos L, Liu X, De Scheerder I, Krams R, Li S, Van Cleemput J, Desmet W and Serruys P W 2003 The
effect of reduced blood-flow on the coronary wall temperature: are significant lesions suitable for intravascularthermography? Eur. Heart J. 24 1788–95
Dumas A and Barozzi G S 1984 Laminar heat transfer to blood flowing in a circular duct Int. J. Heat MassTransfer 27 391–8
Felton C V, Crook D, Davies M J and Oliver M F 1997 Relation of plaque lipid composition and morphology to thestability of human aortic plaques Arterioscler. Thromb. Vasc. Biol. 17 1337–45
Gandhi O P, Lazzi G and Furse C M 1996 Electromagnetic absorption in the human head and neck for mobiletelephones at 835 and 1900 mhz IEEE Trans. Microw. Theory Tech. 44 1884–97
Hale G M and Querry M R 1973 Optical constants of water in the 200 nm to 200 micron wavelength region Appl.Opt. 12 555–63
Heinle H 1987 Metabolite concentration gradients in the arterial wall of experimental atherosclerosis Exp. Mol.Pathol. 46 312–20
Lilledahl M B, Haugen O A, Randeberg L L and Svaasand L O 2005 Characterization of atherosclerotic plaque byreflection spectroscopy and thermography: a comparison Proc. SPIE 5686 415–25
Madjid M, Willerson J T and Casscells S W 2006 Intracoronary thermography for detection of high-risk vulnerableplaques J. Am. Coll. Cardiol. 47 C80–5
Marsden J E 1998 Mathematical Phyiology (New York: Springer)Nybo L, Secher N H and Nielsen B 2002 Inadequate heat release from the human brain during prolonged exercise
with hyperthermia J. Physiol. 545 697–704Pennes H H 1948 Analysis of tissue and arterial blood temperatures in the resting human forearm Appl. Physiol. 1
93–122Rzeszutko L, Legutko J, Kaluza G L, Wizimirski M, Richter A, Chyrchel M, Heba G, Dubiel J S and Dudek D 2006
Assessment of culprit plaque temperature by intracoronary thermography appears inconclusive in patients withacute coronary syndromes Arterioscler. Thromb. Vasc. Biol. 26 1889–94
Schmermund A, Rodermann J and Erbel R 2003 Intracoronary thermography Herz 28 505–12Stefanadis C 2001 Increased local temperature in human coronary atherosclerotic plaques: an independent predictor of
clinical outcome in patients undergoing a percutanous coronary intervention J. Am. Coll. Cardiol. 37 1277–83Stefanadis C, Diamantopoulos L, Dernellis J, Economou E, Tsiamis E, Toutouzas K, Vlachopoulos C and Toutouzas
P 2000 Heat production of atherosclerotic plaques and inflammation assessed by the acute phase proteins inacute coronary syndromes J. Mol. Cell. Cardiol. 32 43–52
Stefanadis C, Diamantopoulos L, Vlachopoulos C, Tsiamis E, Dernellis J, Toutouzas K, Stefanadi E and ToutouzasP 1999 Thermal heterogeneity within human atherosclerotic coronary arteries detected in vivo: a new methodof detection by application of a special thermography catheter Circulation 99 1965–71
Stefanadis C, Toutouzas K, Tsiamis E, Mitropoulos I, Tsioufis C, Kallikazaros I, Pitsavos C and Toutouzas P 2003Thermal heterogeneity in stable human coronary atherosclerotic plaques is underestimated in vivo: the ‘coolingeffect’ of blood flow J. Am. Coll. Cardiol. 41 403–8
Svaasand L O 1982 Properties of thermal waves in vascular media; application to blood flow measurements Med.Phys. 9 711–4
ten Have A G, Gijsen F J H, Wentzel J J, Slager C J and van der Steen A F W 2004 Temperature distributionin atherosclerotic coronary arteries: influence of plaque geometry and flow (a numerical study) Phys. Med.Biol. 49 4447–62
ten Have A G, Gijsen F J H, Wentzel J J, Slager C J, Serruys P W and van der Steen A F 2005 Intracoronarythermography, heat generation, transfer and detection Eurointervention 1 105–14
ten Have A G, Gijsen F J H, Wentzel J J, Slager C J, Serruys P W and van der Steen A F W 2006 A numerical studyon the influence of vulnerable plaque composition on intravascular thermography measurements Phys. Med.Biol. 51 5875–87

Thermography of vulnerable plaque 979
Thom T et al 2006 Heart disease and stroke statistics–2006 update: a report from the american heart associationstatistics committee and stroke statistics subcommittee Circulation 113 e85–151
Thoren S A, Monti M and Holma B 1990 Heat conduction microcalorimetry of overall metabolism in rabbit alveolarmacrophages in monolayer and in suspensions Biochim. Biophys. Acta 1033 305–10
Tortora G J and Grabowski S R 2003 Principles of Anatomy and Physiology (New York: Wiley)Toutouzas K, Drakopoulou M, Mitropoulos J, Tsiamis E, Vaina S, Vavuranakis M, Markou V, Bosinakou E and
Stefanadis C 2006 Elevated plaque temperature in non-culprit de novo atheromatous lesions of patients withacute coronary syndromes J. Am. Coll. Cardiol. 47 301–6
Valvano J W and Chitsabesan H F 1987 Thermal conductivity and diffusivity of arterial wall and atheroscleroticplaque Lasers Life Sci. 1 219–29


Paper V
Characterization of vulnerable plaques by mul-
tiphoton microscopy
Magnus B. Lilledahl, Olav A. Haugen, Catharina Daviesand Lars O. Svaasand. Journal of biomedical optics.Conditionally accepted.


Characterization of vulnerable plaques by
multiphoton microscopy
Magnus Borstad Lilledahl∗
Norwegian University of Science and TechnologyDepartment of Electronics and TelecommunicationsO.S. Bragstads plass 2A7491 TrondheimNorwaytel. +47 73591471fax. +47 [email protected]
Olav Anton Haugen1. St. Olavs HospitalDepartment of Pathology and Medical Genetics2. Norwegian University of Science and TechnologyDepartment of Laboratory Medicine, Children‘s and Women‘s Health
Catharina de Lange DaviesNorwegian University of Science and TechnologyDepartment of Physics
Lars Othar SvaasandNorwegian University of Science and TechnologyDepartment of Electronics and Telecommunications
Keywords: Multiphoton microscopy, atherosclerosis, vulnerable plaque.
1

Abstract
Cardiovascular disease is the primary cause of death in the United States, themajority of these caused by the rupture of vulnerable plaques. An importantfeature of vulnerable plaques is the thickness of the fibrous cap that covers thenecrotic core. A thickness of less than 65 µm has been proposed as a valuethat renders the plaque prone to rupture. This work shows that multiphotonmicroscopy can image the plaque with µm resolution to a depth deeper than65µm. The fibrous cap emits primarily second harmonic generation due tocollagen in contrast to the necrotic core and healthy artery which emits primarilytwo-photon excited fluorescence from elastin. This gives a good demarcationof the fibrous cap from underlying layers, facilitating the measurement of thefibrous cap thickness. Based on a measure of the collagen/elastin ratio, plaqueswere detected with a sensitivty of 65% and specificity of 81%. Furthermore thetechnique gives detailed information on the structure of the collagen networkin the fibrous cap which gives a direct measure of its mechanical strength andthus also the vulnerability to rupture.
2

1 Introduction
Coronary heart disease is the cause of the majority of deaths in the UnitedStates[1]. Most of these deaths are caused by coronary thrombosis occurringat an atherosclerotic plaque, leading to myocardial infarction[2]. Plaques proneto developing thrombosis are denoted as vulnerable plaques[3]. These plaquescan lead to thrombosis either by rupture of a thin fibrous cap covering a lipidcore, or by erosion of the endothelium. Plaques prone to rupture are charac-terized by a large, lipid-rich necrotic core, covered by a thin, fibrous cap, andby infiltration of numerous macrophages[4]. The plaque cap consists mainlyof collagen and a cap thickness of <65 µm has been proposed as a value thatrenders the plaque unstable[5]. There is currently no clinically accepted methodfor detecting vulnerable plaque, but numerous detection modalities are beinginvestigated, e.g. optical coherence tomography (OCT), magnetic resonanceimaging, intravascular ultrasound (IVUS), near infrared spectroscopy and com-puted tomography[3].
Autopsy studies have shown that there exist several vulnerable plaques in thecoronary tree in addition to the culprit lesion[5]. This has led to the hypothesisthat perhaps a more detailed stratification of plaque vulnerability is necessary todetermine which plaque is the most likely to rupture. For example, polarizationsensitive OCT has been proposed as an improvement over conventional OCT[6].The birefringence of collagen in the fibrous cap will affect the polarization of thelight, which can be used to infer properties about the fiber structure. Anotherway to collect additional information, is to improve the resolution of the imagingmodality. In the same way that OCT improves the resolution by an order ofmagnitude compared to IVUS[7] (100 µm → 10 µm), multiphoton microscopy(MPM) can improve the resolution by another order of magnitude (10 µm → 1µm). The increase in resolution with MPM compared to OCT is accompaniedby a decrease in penetration depth, usually reported to be a few 100 µm inbiological tissue even though one study reported a penetration depth of 1 mm[8].
Multiphoton microscopy uses the nonlinear optical properties of tissue andcan achieve three dimensional microscopy. Second order nonlinear optical phe-nomena depend quadratically on the intensity of the light, so that for a focusedbeam the signal is only generated in a small volume around the focus. Thelonger wavelength of the light used in MPM also gives increased penetrationdepth and reduced out-of-focus photobleaching compared to conventional laserscanning microscopy.
In biomedical application, the most common nonlinear effects used for mi-croscopy are second harmonic generation (SHG) and two-photon excited fluo-rescence (TPEF). SHG is generated by noncentrosymmetric molecules such ascollagen, and autofluorescence generated by two-photon excitation is seen fromcollagen, elastin and cellular components[9]. Elastin is abundant in the mediaof the aorta and collagen is the primary component in the cap of atheroscle-rotic plaques. MPM may thus be used to study the formation and progressionof atherosclerotic plaques. In addition, it could have other applications in themanagement of cardiovascular disease, e.g. to monitor restenosis after stenting,and assess the effect of medication.
An advantage of MPM over regular histology is that it can be performedon intact tissue, and carries the promise of in-vivo monitoring of atheroscle-rotic plaques which is of great clinical value. A cathether-based intravascular
3
microscopy probe could be developed along the lines of existing intravascularOCT probes, but with additional scanning optics[10]. Several miniaturized,intra-vital microscopes for MPM have been tested[11, 12, 13, 14, 15]. However,for intravascular applications, further minaturization is necessary, which couldbe realized by microoptical devices.
The goal of this study is thus to investigate the physiological informationof the vascular structure that can be detected by MPM, and to what degreehealthy vessels and atherosclerotic lesions can be classified compared to histo-logical classification[16, 17, 18]. The spectral response of various tissue struc-tures is reported and penetration depths in tissue in various pathological statesare found. Photobleaching and photodamage can be incurred in tissue duringlaser irradiation, and these processes are investigated as their understanding isnecessary to develop a safe in-vivo imaging modality.
2 Materials and Methods
2.1 Materials
Eight specimens of human aortas were excised during autopsy from 8 differentpatients (54.5 ± 10.9 years, 5 male, 3 female). The samples were put in closedcontainers, with some tissue paper soaked in phosphate buffered saline (thetissue samples were not in contact with the paper tissue) and stored at 4C.Measurements were performed 1.45± 1.75 days after autopsy.
After microscopy the samples were fixed in formalin and embedded in paraf-fin. Thin sections were cut and stained with Hematoxylin-Eosin-Saffron (HES),Elastica and Van Gieson. HES stains cell nuclei black, cytoplasm pink, andconnective fibers yellow. Elastica stains elastic fibers dark purple. Van Giesonstains muscle cells yellow and connective fibers red.
2.2 Instrumentation
The samples were investigated using a laser scanning inverted microscope (ZeissLSM 510 Meta). Excitation was provided by a Ti:Sapphire laser (Coherent Mira,model 900 F), pumped by a 5W solid state laser (Coherent Verdi). The outputof the Ti:Sapphire laser was about 750 mW, mode-locked at 800 nm. All themeasurements were performed at 800 nm except the measurements describedin section 2.3.3 where the wavelength was tuned from 800 nm to 840 nm in10 nm increments. A plan-apochromat 40x 1.2 NA water immersion objectivewas used in all the measurements. An acusto-optic modulator (AOM) wasused to regulate the power output. A setting of the AOM at 80%, which wasused in all the measurements unless otherwise noted, gave about 20 mW atthe objective. Laser power was measured by a Coherent LM-10 laser meter.The microscope was equiped with a Zeiss metadector, which uses a gratingto disperse the generated light to 32 different channels in the spectral rangefrom 377 nm to 710 nm at about 10 nm intervals. For all the measurementsSHG was collected at 387-409 nm and TPEF at 473-505 nm, except for themeasurements in section 2.3.3 where the signals were collected separatley ineach of the 32 channels. All measurements were performed in the reflectionmode (epi-collection).
4

The emitted fluorescence of a solution of fluorescein (280 µM) was measuredin the microscope and compared with the one-photon fluorescence of the samesolution, measured in a spectrofluorimeter (Fluorolog 3 Jobin Yvon, The HoribaGroup). Since the normalized spectra overlapped well with mean deviation of5%, no further spectral calibration of the emission signals was performed.
The transmission in the system was measured by comparing the power atthe laser output and at the objective for wavelengths from 800-840 nm to givethe relative transmission,
Tr(λ) =Pobj(λ)Plas(λ)
. (1)
This was used to calibrate the spectral measurements (see section 2.3.3 fordetails).
2.3 Study protocol
2.3.1 Sample preparation
The aorta samples were cut into pieces of about 5 x 5 mm for microscopicinvestigation. Out of the 8 aorta specimens, a total of 24 smaller samples wereobtained. The samples were placed in a glass well with the lumen side of thevessel facing the coverglass. In the following, x and y will refer to the axesparallel to the lumen, and z to the axis perpendicular to the lumen.
2.3.2 Image collection
Selection of measurement sitesThe sample holder was placed in the microscope and a scan over an area cov-
ering 2.3 mm x 2.3 mm was carried out. Based on these images, three primarymeasurement sites were defined as well as three reference sites. The measure-ments in the remainder of this section and section 2.3.3 were then performedon each of the primary measurement sites. The images collected at each sitecovered an area of 230 x 230 µm. The reference sites were shifted 115 µm fromthe primary sites, thereby covering half of the primary measurement sites, andthus served as an indication of whether any changes had occurred in the tissueduring the study protocol. Images of the reference sites were collected at thebeginning and end of the protocol.
Z-stack of imagesAt each of the primary measurement sites, a z-stack of images was collected.
Each image covered 230 x 230 µm, and frames were collected at 4 µm intervalsin the z-direction. The average SHG and TPEF intensities, Is(z) and It(z),were calculated for each frame to determine how the generated signals varied asa function of z. Is(z) and It(z) were normalized by dividing by their maximumvalue, Is,max and It,max(z), respectively,
Is,norm(z) =Is(z)Is,max
It,norm(z) =It(z)It,max
. (2)
The depth z where Is,norm(z) and It,norm(z) had dropped to e−1 was deter-mined.
5

At structures within the stack that were deemed interesting, single planeimages were collected at higher resolution and longer acquisition times.
At a slice approximately 25 µm below the surface, the number of pixelscovered by fibrous structure was counted. This depth was chosen so that nosurface would be present in the images due to tilted image plane or surfaceirregularities, and to ensure that the signal was still strong. A few images weremanually investigated to determine the background signal. The backgroundsignal was defined as the signal level in regions of the images where no fibrillarstructure could be perceived, and determined to be 30 (out of 255) in the SHGimages and 50 (out of 255) in the TPEF images. These values were then usedas cut-off values for thresholding the images into regions containing fibrousstructure, and regions defined as background. The ratio of SHG to TPEF wasused as a measure of a collagen-to-elastin ratio Rc/e, and was computed as theratio of the number of pixels N with values above threshold.
Rc/e =NSHG
NTPEF. (3)
Cross-sectional imagesCross sectional images in the x, z and y, z planes were collected. Each line
parallel to the surface was 230 µm and each line was collected with a z intervalof 0.46 µm. The gain of the detectors was increased through the scan to improvesignals from deeper layers without saturating the signal at the surface.
2.3.3 Spectral response
At each primary site, the signal from one image frame was collected in eachof the 32 channels of the spectral detector. The excitation light was tunedfrom 800 to 840 nm in 10 nm intervals. The excitation power, Pl(λex), wasmeasured at the output of the laser for each wavelength and the resulting spectrawere calibrated by dividing by (Pl(λex)Tr(λex))2. The images were 230 x 230µm. The adjustment of gain and offset were kept constant for all the spectralmeasurements of the samples.
2.3.4 Photobleaching and photodamage
To investigate the response of the tissue to long illumination times at variousexcitation powers, an area of 115 x 115 µm was scanned 200 times and theimage was stored for each scan. Each scan took 1.97 s. The imaging plane wasplaced 10-20 µm under the surface. The laser power was varied from 50-100%in increments of 10%, which corresponded to about 10-35 mW at the objective.If structural tissue changes were severe, the imaging series was halted before the200 scans were completed. After the procedure had been completed a z-stackof images through the damage was collected. These images were collected witha frame size of 230 x 230 µm to assess the lateral and transversal extent of thephotodamage.
Finite element analysis (FEM) of the thermal distribution in the tissue wasperformed to determine whether thermal changes in the tissue were incurreddue to 1-photon or 2-photon absorption. Details of the analysis are given inappendix A.
6

3 Results
3.1 General features
SHG and TPEF images demonstrated different structures and distributions ofconnective fibers. The SHG in the images is due to collagen, and fibrous struc-tures with TPEF, but without SHG, was interpreted as elastin. SHG is shownin red and TPEF in green in all the images. All the presented images havebeen processed to enhance contrast, so signal levels between SHG and TPEFcan therefore not be compared directly.
Normal arteries were defined by no intimal changes observed in the histologi-cal images (see Fig. 1d-f). Thus, atherosclerotic lesions of type I - III accordingto the American Heart Association (AHA) classification are included in thisgroup[17]. These early lesions are recognized by increased lipid content butwithout intimal disruptions.
In the MPM images of normal arteries, individual elastin fibers could beseen clearly down to a size of about 1 µm. The structure of the fibrous networkvaried but some general features were observed. On the surface a thin layerof elastic fibers over a layer of collagen was observed (Fig. 1a). Below oneor more of these layers was a layer of thicker, ordered elastic fibers with somescattered thicker collagen fibers (Fig. 1b). Next, a layer of thin, ordered elasticfibers was found, where the fibers were oriented at 90 degrees to the above layer(Fig. 1c). In the cross sectional images, layers of elastic laminas could clearlybe distinguished (Fig. 2a). The large scale images (2.3 x 2.3 mm) had lowerresolution than the other images, but yielded structure information about theconnective fibers at a different size scale (Fig. 3a).
Atherosclerotic plaques were classified macroscopically by being clearly raisedfrom the surrounding lumen surface and where the histological images showedthe presence of a collagen cap over a lipid core (Fig. 4d-f). This corresponds totype V plaque in the AHA classification (fibroatheroma).
In the MPM images of the cap of an atherosclerotic plaque, the collagenappeared in thick bundles, in a non-directional structure (Fig. 4a), and weredifferent from the collagen fibers seen in the normal vessel. There was signifi-cantly more collagen in the plaque cap than in the normal aorta. Small, round,fluorescent objects of various sizes could be seen clustered in the spaces betweenthe collagen fibers. Plaques with a macroscopically yellow color seemed to havemore of these fluorescent objects, though this was not confirmed quantitatively.In one instance the fibrous cap of a highly developed plaque was dissected, ex-posing the lipid core. The inside of the plaque was placed against the coverglassand the resulting image is shown in Fig. 4b. Many fluorescent objects withvarious sizes and shapes can be seen. The large scale images also showed suchfluorescent objects and in this image their location relative to the collagen fiberscan be seen (Fig. 3b). The fibers seem to have some directional orientation atthis scale.
Calcified plaques (type Vb) were recognized macroscopically by very hardareas and in the histological images by an empty area surrounded by a darkpurple color in the HES stained images. An MPM image of a calcificationcan be seen in Fig. 4c. These areas exhibited very strong TPEF and onlya non-fibrillar structure could be seen. Some SHG could be seen within thecalcification.
7

3.2 Spectral response
The spectrum of collagen was obtained from an image rich in collagen, seen bystrong SHG. The image obtained with 800 nm excitation was used to defineregions in the image as collagen. Pixels where the SHG was greater than half ofthe SHG from the pixel with the maximum value were defined as collagen. Thesame pixels were used to obtain the spectra at all excitation wavelengths (Fig.5a).
The spectra of elastin were found by defining a region of interest (ROI) inan image where fibers exhibiting TPEF could be seen, but where there wasno fibrillar structure in the SHG (i.e. only background). The spectra wereextracted from the pixels within this ROI (Fig. 5b).
A ROI that only contained the non-fibrillar structure related to calcificationswere used to extract the spectra of the calcification (Fig. 5c). The TPEF signalfrom the calcification was very strong so excitation power was reduced by settingthe AOM to 70% when measuring the spectra to avoid saturation.
The autofluorescence from the objects seen in the lipid core were strongcompared to the signal from the conective tissue (Fig. 4b). A spectrum of oneof the fluorescent objects within the fibrous cap was extracted by defining aROI that only contained one of these objects and is shown in Fig. 5d. This ismarkedly different from the autofluorescence from the connective fibers.
3.3 Penetration depth
The depth where maximum signal was found, and the depth where the nor-malized signal had fallen to e−1 were determined as described in section 2.3.2.The samples were classified into normal vessel and fibroatheromas based on his-tology, according to the description in section 3.1. For each of these classes,the mean values of the depth of the maximum signal and the depth where thenormalized signal had fallen to e−1 were determined. These values are plottedin Fig. 6.
3.4 Collagen-elastin ratio
By defining that the presence of a fibrous cap is detected by a collagen-elastinratio Rc/e of greater than one, the MPM images could be used to detect thepresence of a plaque with a sensitivity of 65% and a specificity of 81% withhistology as the reference (14 plaques and 9 normal samples. Calcified plaqueswere excluded). Sensitivity was defined as the number of detected plaques minusthe number of false negatives divided by the total number of plaques. Thespecificity was defined as the number of plaques detected minus the number offalse positives divided by the total number of plaques. The average value ofRc/e for samples classified as normal was 0.44, and 16.5 for plaques.
3.5 Photobleaching and photodamage
The reference sites were displaced 115 µm from the primary measurement sites,thereby containing half of the primary measurement sites (which were 230 x 230µm). No changes could be seen in these images at the end of the study protocol.
During the measurements described in section 2.3.4 significant bleaching andtissue changes were incurred. After some time bubbles appeared in the images
8

and increased in size with time (Fig. 7a). The higher the incident powers, theearlier the bubbles appeared (within a few seconds), and the faster they grew.The z-stacks of images collected about 30 minutes after the bleaching/heatingprocedure indicated that the bubbles caused irreversible damage (Fig. 7b).They also showed that damage was confined closely to the illuminated area andthat damage could only be seen in a layer 15-20 µm thick.
A finite element model of the temperature distribution in the tissue wasdeveloped (see appendix A). Based on this model, it was shown that the tem-perature is close to the steady state temperature within one second (Fig. 8b).Since the equation of heat (Eq. (4)) is linear, the shape of the time develop-ment is independent of the amount of heat generated as long as it is similarlydistributed. Increasing the heat generation will only raise the graph vertically.The bubbles, however, appeared as late as after 30-40 s for low excitation pow-ers. The spatial distribution of the temperature around the focus for linearabsorption and second order absorption can be seen in Fig. 8a.
Such a system, where there is a process with a given rate (defined as theinverse of the time of the appearance of bubbles) which is a function of temper-ature (defined to be proportional to the square of the incident power) can bedescribed by an Arrhenius type equation. An Arrhenius plot of the inverse ofthe time of bubble formation versus the inverse of the incident power squared,is plotted in Fig. 8d.
4 Discussion
4.1 Tissue characterization
MPM can detect caps of atherosclerotic plaques without exogenous staining,and with good contrast compared to healthy vessels. Images can be collecteddown to a depth of >65 µm, providing a measure of one of the key featuresof vulnerable plaques. Three dimensional images with µm resolution of thestructural protein network can be generated without having to cut numeroushistological sections, yielding important information on the mechanical strengthof the cap.
SHG is only generated by fibrillar collagen in biological tissue[19]. The strongSHG from the plaque cap, known to be rich in collagen I and III, confirmes this(Fig. 2b)[18]. We have therefore assumed fibrillar structure producing SHG tobe collagen. The SHG that can be seen in the spectra other than collagen couldbe background signal generated at various surfaces within the optical system asSHG is known to be generated at interfaces (Fig. 5b-c).
TPEF on the other hand are seen from many biological structures. The aut-ofluorescence spectra of elastin and collagen are very similar (Figs. 5a and 5b).This is in agreement with another study that found significant spectral overlapin the autofluorescence from collagen and elastin[20]. This study reported thatelastin had a fluorescent peak at 495 nm and cellular components at 510 nm[20].These peaks can be seen in our spectra but are present in both collagen andelastin spectra, rather than directly related specifically to elastin or cellular com-ponents (Fig. 5). Based on the abundance of autofluorescent fibers in healthyelastic artery (Fig. 1) and previous studies on cardiovascular structures[20, 21],fibrous structures without SHG but with TPEF were classified as elastin. An-
9

other study on atherosclerotic mice found that collagen had autofluorescencein the blue part of the spectrum whereas elastin gave autofluorescence cover-ing a wider spectral range, which does not agree with our results[21]. SomeTPEF without SHG were seen from fibers in the plaque cap (Fig. 4a). Thisautofluorescence seemed to come from the surface of the collagen fiber bundles.Whether this is due to elastin fibers or collagen not generating SHG has notbeen determined.
The thin, disorganized elastic fibers seen at the surface of the healthy ves-sels probably belong to the subendothelial connective tissue, while the thickerordered layers are the elastic laminas (Fig. 1a-c). Scattered collagen fibers canbe seen, apparent in Fig. 3a.
The structure of the fibrous cap could be imaged at several levels of detail(compare Fig. 4a and Fig. 3b). This fibrous structure is directly related to themechanical strength of the plaques, and might yield some insight into why someplaques rupture and others do not. The structure of the collagen fibers canperhaps also be used to better understand the nature of the signals collected bypolarization sensitive OCT.
The origin of the fluorescent objects seen in the fibrous caps and lipid coreshave not been determined but could arise from several sources. In the plaquesthe objects seem to be clustered in small groups between the collagen fibers (Fig.4a). This could be foam cells (macrophages with intracellular lipid droplets).The lipid core is mainly necrotic and the fluorescent objects seen here appearin different sizes which could be related to extracellular lipid droplets (Fig.4b). The abundance of the fluorescent objects within the yellow plaque andwithin the plaque core supports the hypothesis that these objects are related tolipid-related substances. Blankenhorn reported strong, green one-photon aut-ofluorescence from the lipid core of atherosclerotic plaques and related this tocarotenoids which are known to be lipophilic[22]. Another study found one-photon autofluorescence from various biochemical components known to bepresent in atherosclerotic plaques, e.g. oxidized lipoproteins and cholesterolesters, further supporting the hypothesis that that TPEF signal is related tolipid-rich substances in the plaques[23]. The autofluorescence from some of theunidentified objects that were observed in the plaque caps had a fluorescentpeak at 575 nm (Fig. 5d). Since the images collected in this study, except thespectral measurements, measured the fluorescence in the interval from 473 nm to505 nm, the objects with a fluorescent peak at 575 were probably not detected.The strong TPEF from the lipid core could further enhance the demarcationbetween the fibrous cap and the lipid core. However, all the plaques imaged inthis study had plaques thicker than the penetration depth of the system, so thiswas not confirmed.
The spectral calibration of the metadetector with fluorescein was limited bylow signals below 475 nm and above 625 nm, so that inaccuracies might existin these parts of the spectra. Furthermore since the spectra were generated atdifferent depths and the excitation power decreases with depth, the intensity ofthe measured spectra can not directly be compared.
The technique was able to differentiate normal vessels from atheroscleroticplaques based on the collagen/elastin ratio with fairly good sensitivity and speci-ficity (65% and 81% respectively). The erroneous classifications were due tosome samples with high collagen content in the intima even though they ap-peared normal in the histological sections. In one instance the fibrous cap was
10

only visible down to a depth of 20 µm in the MPM images, even though a thickcap was seen in the histology. This also generated an erroneous classification.A limitation of these values is that the same observer performed both classi-fications and was only blinded to the histological results and not vice versa.Another limitation of the study is that the position of the MPM measurementsand histological sections are not necessarily colocalized in the samples.
The collagen/elastin ratio, Rc/e, could be calculated for each layer in thevessel wall yielding an image of the fibrous cap since this type of tissue has amuch higher value of Rc/e compared to the normal vessel. An important featureRc/e is the large difference in its value between the vessels classified as normaland those classified as plaque, mean values of 0.44 and 16.5, respectively. Thisis more than an order of magnitude difference in the signal and could yieldimprovements over methods like OCT and ultrasound where contrast in thesignal between different tissue types is often a limiting factor.
Imaging was acheived down to a depth of about 100 µm which representsthe upper layers of the relativly thick aorta (2-3 mm) (Fig. 6). The cornaryarteries are much thinner so that more of the vessel anatomy could be imaged.The penetration depth in tissue is determined by scattering, which reduces thepower at the focus, and dispersion which degrades the pulse shape at the focus.The effect of scattering can be reduced by using an objective with a smallernumerical aperture, albeit at a loss in resolution. However, the generated signalwill be lower since a less tight focusing will reduce field intensities, resulting inless second order processes. The best trade off will thus depend on the resolutionnecessary for the application at hand.
Since scattered photons do not affect the collected signal (as they do inOCT), the loss due to scattering can to some degree be compensated for by in-creasing the excitation power. Of course, availability of laser sources and heatingdue to linear absorption will limit this approach. However, as was observed inthis study, the heat damage seems to arise from a second order process, so thereduction in light at the focus due to scattering can be compensated for byincreasing the incident power without creating tissue damage.
The penetration depths reported in this study do not necessarily compareto in-vivo values. As described by Zoumi et al. the fiber structure changessignificantly under physiological pressures and thereby also the scattering[20].Also, the present study investigated the aorta, and values for the coronaryarteries could be different. One feature of vulnerable plaques is a fibrous capthinner than 65 µm, so this feature of vulnerable plaques can be detected withMPM.
4.2 Photobleaching and photodamage
Significant photobleaching was observed during the procedure described in sec-tion 2.3.4. Photobleaching was seen to strongly affect the TPEF signal. TheSHG signal also decayed during the procedure, albeit at a slower rate. After acertain time, dependent on the incident power, bubbles appeared in the images.The photodamage was incurred in a very narrow region, only 15-20 µm deep,indicating that the damage arises from second order absorption. This can beappreciated from the spatial dependence of the temperature determined fromthe finite element model (Fig. 8b), where the assumption of second order ab-sorption better describes the extent of the photodamage. Using reported values
11

of linear absorption in the aorta yielded a maximum temperature increase of2.3 K after 200 s. In this case we assumed that convection at the upper surfaceskept the surface temperature close to the temperature of the surrounding air,so that fixed temperature was used as the boundary condition. We also usedthermal insulation as the boundary condition for all the surfaces, resulting in atemperature increase of 8.8 K after 200 s. These temperatures seem too smallto generate the observed bubble formation, further indicating that nonlinearabsorption is the primary source of the damage.
The bubble formation could be due to gas release of absorbed gases in thetissue due to the reduction in the amount of gas that can be dissolved in thetissue with increasing temperature. This process must be well understood beforea clinical tool can be developed, so that excitation powers can be kept well withinsafe levels.
5 Conclusion
MPM can assess tissue structure at a resolution not achievable by other imagingmodalities for atherosclerotic plaque. Fibrous cap can be imaged to a depth of>65 µm with good contrast compared to underlying layers, thereby measuringone of the key characteristics of vulnerable plaque. The mechanical stability of avulnerable plaque is directly related to the likelihood of rupture. The network ofcollagen fibers is what determines the mechanical stability and this can imagedby MPM.
Several characteristic physiological features of vessels can be seen with MPM,e.g. elastic laminas and collagen fibers in the plaque cap. All images in thisstudy were collected in the reflection mode and the technique can therefore betransfered to an in-vivo intravascular imaging modality. The information couldhave important applications, both clinically, and in pathophysiological research.
A Finite element model
A FEM model was used to find the temperature distribution in the samplesduring irradiation. A commercial software (Comsol multiphysics, Comsol AB,Sweden) was used to perform the analysis. Default settings for mesh densitiesand solvers were used.
The equation to be solved to find the temperature T is the heat equation,
∇2T − 1χ
∂T
∂t= − q
κ, (4)
where χ = κρcp
is the diffusivity. κ is the thermal conductivity, ρ the densityand cp the specific heat. See table 1 for the values used in the model. q is theheat generation per unit volume per unit time, see below for values used.
A water immersion objective with NA = 1.2 was used in the measurementsand this yields a cone of illumination with angle to the illumination axis ofabout 60 degrees. We will assume that the shape of the beam is a perfect coneso that the radius of the cone is given by r =
√3∆z where ∆z is the distance
from the focus. This geomtrical optics approximation to the light distribution isnot valid near the focus, but since we are scanning the beam over a large area,
12

and only looking for approximate solutions, the details of the light distributionnear the focus is not important. Since the beam is scanned over an area withsides a = 115 µm the total area illuminated by the beam a distance ∆z fromthe focus is At = π(
√3∆z)2 + a2 + 4
√3∆za. The area of a cross-section of the
cone perpendicular to the illumination axis is Ac = π(√
3∆z + 0.25µm)2. Theterm 0.25 µm is added for the finite waist size of the beam at the focus.
The change in intensity due to absorption in a layer ∆z (i.e the heat gen-erated per area per time) is given by ∆I = µ
(1)a I∆z, where µ
(1)a is the linear
absorption coefficient. Since I = PAc
, the heat generated per unit volume perunit time is then
q =∆IAc
At∆z=
µaI∆zAc
At∆z=
µP (z)At
. (5)
For two-photon absorption the absorption is quadratic in the intensity sothat ∆I = µ
(2)a I2∆x, where µ
(2)a is a nonlinear absorption coefficient. The heat
generated per unit volume per unit time is then,
q =µ(2)P (z)2
AcAt. (6)
Eq. (5) and (6) were used for the heat generation in the FEM models. Sincethe beams are focused and not collimated the absorption coefficients shouldinclude a factor between 1 and 2 due to the increased pathlength but this wasnot taken into account. The reported values should be interpreted with this inmind. Linear absorption and scattering coefficients of human aorta tissue areµa = 80 m−1 and µs = 250 m−1[24]. Values reported in the literature vary butwe have used the highest value found. The power as a function of distance fromglass/tissue interface z was thus described by P = P exp(−(µa + µs)z).
The geometry (see Fig. 8c) consisted of a disc with radius 5 mm, thickness170 µm, made of glass, representing the coverglass. The tissue was modeledas box with sides 4 x 4 x 2 mm, with the light cone inscribed. The boundarycondition at the bottom of the glass was set to thermal insulation while all otherboundaries were set to constant temperature.
Using the reported value of the linear absorption coefficient yielded a max-imum temperature increase of 2.3 K after 200 s. The nonlinear absorptioncoefficient is not known but the normalized temperature distribution near thefocus is shown in Fig. 8a. The temperature as a function of time is shown inFig. 8b. The structure was also simulated with all boundaries set to thermalinsulation which resulted in a temperature increase of 8.8 K after 200 s.
Acknowledgments
The authors would like to thank the following people for invaluable asisstance:Edrun Andrea Schnell, Thor Bernt Melø, Arne Eriksson, Unn Granli, Lise Lyn-gsnes Randeberg and Eivind La Puebla Larsen. This work was funded by theNorwegian Research Council.
13
References
[1] T. Thom, N. Haase, W. Rosamond, V. J. Howard, J. Rumsfeld, T. Mano-lio, Z.-J. Zheng, K. Flegal, C. O’Donnell, S. Kittner, D. Lloyd-Jones,D. C. Goff Jr., Y. Hong, R. Adams, G. Friday, K. Furie, P. Gorelick,B. Kissela, J. Marler, J. Meigs, V. Roger, S. Sidney, P. Sorlie, J. Stein-berger, S. Wasserthiel-Smoller, M. Wilson, and P. Wolf, “Heart disease andstroke statistics–2006 update: A report from the american heart associa-tion statistics committee and stroke statistics subcommittee”, Circulation113(6), pp. e85–151, (2006).
[2] M. J. Davies and A. C. Thomas, “Plaque fissuring–the cause of acute my-ocardial infarction, sudden ischaemic death, and crescendo angina”, BritishHeart Journal 53(4), pp. 363–73, (1985).
[3] R. Waksman and P. W. Serruys, eds., Handbook of the vulnerable plaque,Taylor and Francis, London, (2004).
[4] C. V. Felton, D. Crook, M. J. Davies, and M. F. Oliver, “Relation of plaquelipid composition and morphology to the stability of human aortic plaques”,Arterioscler. Thromb. Vasc. Biol. 17, pp. 1337–1345, (1997).
[5] A. P. Burke, A. Farb, G. T. Malcom, Y.-H. Liang, J. Smialek, and R. Vir-mani, “Coronary risk factors and plaque morphology in men with coronarydisease who died suddenly”, N. Engl. J. Med. 336(18), pp. 1276–1282,(1997).
[6] S. D. Giattina, B. K. Courtney, P. R. Herz, M. Harman, S. Shortkroff, D. L.Stamper, B. Liu, J. G. Fujimoto, and M. E. Brezinski, “Assessment of coro-nary plaque collagen with polarization sensitive optical coherence tomogra-phy (PS-OCT)”, International Journal of Cardiology 107(3), pp. 400–409,(2006).
[7] M. E. Brezinski, G. J. Tearney, B. E. Bouma, J. A. Izatt, M. R. Hee,E. A. Swanson, J. F. Southern, and J. G. Fujimoto, “Optical coherencetomography for optical biopsy: Properties and demonstration of vascularpathology”, Circulation 93(6), pp. 1206–1213, (1996).
[8] P. Theer, M. T. Hasan, and W. Denk, “Two-photon imaging to a depthof 1000 micrometers in living brains by use of a Ti:Al2O3 regenerativeamplifier”, Opt. Lett. 28(12), pp. 1022–1024, (2003).
[9] E. Brown, T. McKee, E. diTomaso, A. Pluen, B. Seed, Y. Boucher, andR. K. Jain, “Dynamic imaging of collagen and its modulation in tumors invivo using second-harmonic generation”, Nature Medicine 9(6), pp. 796–800, (2003).
[10] J. G. Fujimoto, S. A. Boppart, G. J. Tearney, B. E. Bouma, C. Pitris, andM. E. Brezinski, “High resolution in vivo intra-arterial imaging with opticalcoherence tomography”, Heart 82(2), pp. 128–133, (1999).
[11] F. Helmchen, M. S. Fee, D. W. Tank, and W. Denk, “A miniature head-mounted two-photon microscope: High-resolution brain imaging in freelymoving animals”, Neuron 31(6), pp. 903–912, (2001).
14

[12] D. Bird and M. Gu, “Compact two-photon fluorescence microscope basedon a single-mode fiber coupler”, Opt. Lett. 27(12), pp. 1031–1033, (2002).
[13] F. Helmchen, “Miniaturization of fluorescence microscopes using fiber op-tics”, Experimental Physiology 87(6), pp. 737–745, (2002).
[14] J. C. Jung and M. J. Schnitzer, “Multiphoton endoscopy”, Opt. Lett.28(11), pp. 902–904, (2003).
[15] W. Gobel, J. N. D. Kerr, A. Nimmerjahn, and F. Helmchen, “Miniaturizedtwo-photon microscope based on a flexible coherent fiber bundel and agradient-index lens objective”, Opt. Lett. 29(21), pp. 2521–5253, (2004).
[16] H. C. Stary, D. H. Blankenhorn, A. B. Chandler, S. Glagov, W. I. Jr.,M. Richardson, M. E. Rosenfeld, S. A. Schaffer, C. J. Schwartz, W. D.Wagner, and R. W. Wissler, “A definition of the intima of human arteriesand of its atherosclerosis-prone regions”, Circulation 85(1), pp. 391–405,(1992).
[17] H. C. Stary, A. B. Chandler, S. Glagov, J. R. Guyton, W. Insull, M. E.Rosenfeld, S. A. Schaffer, C. J. Schwartz, W. D. Wagner, and R. W. Wissler,“A definition of inital, fatty streak, and intermediate lesions of atheroscle-rosis”, Arteriosclerosis and Thrombosis 14(5), pp. 840–856, (1994).
[18] H. C. Stary, A. B. Chandler, R. E. Dinsmore, V. Fuster, S. Glagov, W. I.Jr., M. E. Rosenfeld, C. J. Schwartz, W. D. Wagner, and R. W. Wissler,“A definition of advanced types of atherosclerotic lesions and a histologicalclassification of atherosclerosis”, Circulation 92, pp. 1355–1374, (1995).
[19] W. R. Zipfel, R. M. Williams, R. Christie, A. Y. Nikitin, B. T. Hy-man, and W. W. Webb, “Live tissue intrinsic emission microscopy usingmultiphoton-excited native fluorescence and second harmonic generation”,PNAS 100(12), pp. 7075–7080, (2003).
[20] A. Zoumi, X. Lu, G. S. Kassab, and B. J. Tromberg, “Imaging coronaryartery microstructure using second-harmonic and two-photon fluorescencemicroscopy”, Biophysical journal 87(4), pp. 2778–2786, (2004).
[21] M. van Zandvoort, W. Engels, K. Douma, L. Beckers, M. oude Egbrink,M. Daemen, and D. W. Slaaf, “Two-photon microscopy for imaging ofthe (atherosclerotic) vascular wall: A proof of concept study”, Journal ofVascular Research 41(1), pp. 54–63, (2004).
[22] D. H. Blankenhorn and H. Braunstein, “Carotenoids in man. iii. the micro-scopic pattern of fluorescence in atheromas and its relation to their growth”,Journal of Clinical Investigation 37, pp. 160–165, (1958).
[23] K. Arakawa, K. Isoda, I. Toshimitu, K. Nakajima, T. Shibuya, andF. Ohsuzu, “Fluorescence analysis of biochemical constituents identifiesatherosclerotic plaque with a thin fibrous cap”, Arterioscler. Thromb. Vasc.Biol. 1, pp. 1–71, (2002).
[24] M. Keijzer, R. Richards-Kortum, S. L. Jacques, and M. S. Feld, “Fluores-cence spectroscopy of turbid media: Autofluorescence of the human aorta”,Appl. Opt. 28, pp. 4286–4292, (1989).
15
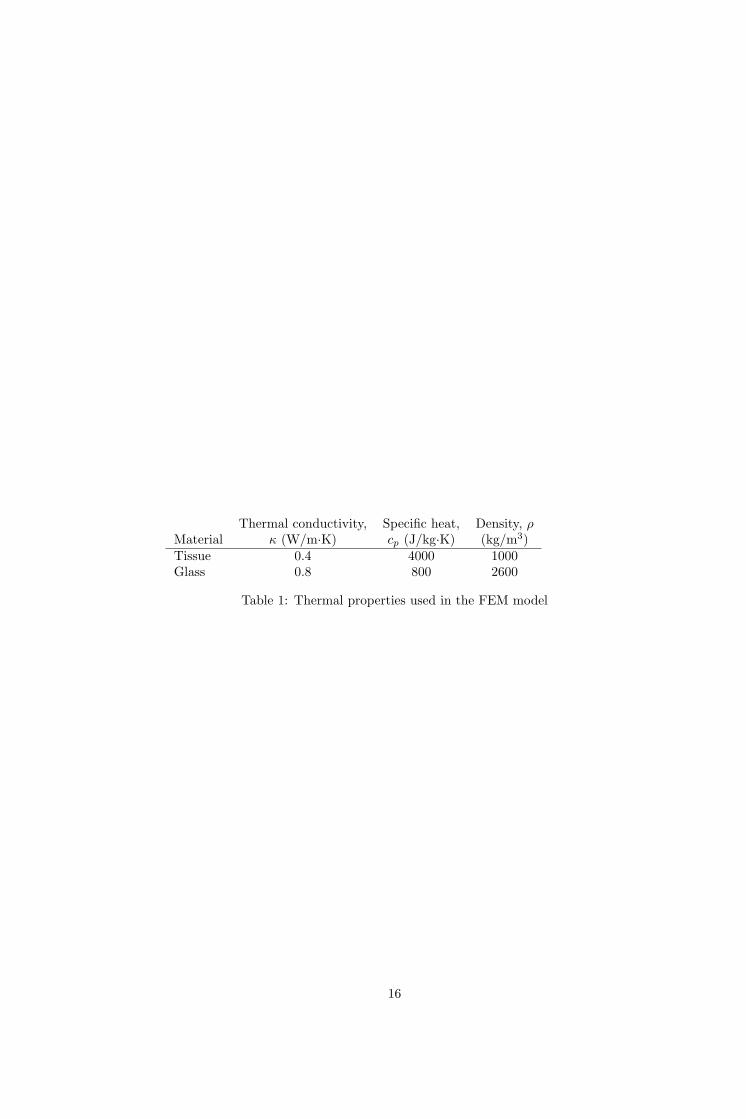
Thermal conductivity, Specific heat, Density, ρMaterial κ (W/m·K) cp (J/kg·K) (kg/m3)Tissue 0.4 4000 1000Glass 0.8 800 2600
Table 1: Thermal properties used in the FEM model
16

Figure 1: MPM images of normal vessel in the x, y plane (green is TPEF andred SHG) and corresponding histological images in the x, z plane. a) Normalvessel at the surface. There is a thin layer of elastic fibers over a layer of thin,wavy collagen fibers. The dark areas are regions where the wavy surface is belowthe image plane. b) A dense layer of relatively thick, ordered elastic fibers, wasusually seen below the layers of thinner elastic fibers at the surface. Thick,randomly oriented collagen fibers can be seen in between. c) Image taken about20 microns below the surface. Several layers can be seen since they are at anangle to the image plane. The deepest structure is oriented 90 to the layerabove. Figures d-f show histological sections of normal aorta at 10x. d) HESstain. e) Elastica stain were the elastica laminas can clearly be seen. f) VanGieson stain. Connective fibers are stained red. Bars are 20 µm in the MPMimages and 200 µm in the histology images.
17

Figure 2: Cross sectional images (x, z plane). Green is TPEF and red is SHG.a) The elastic laminas of a normal aorta can clearly be seen. b) An early lesion.Layers of collagen about 20 µm thick over elastic laminas. c) Cross section of athick fibrous cap. The horizontal fluorescent points in the top is at the surfaceof the coverglass. Collagen layers can be seen down to a depth of about 60 µm.Bars are 20 µm.
18
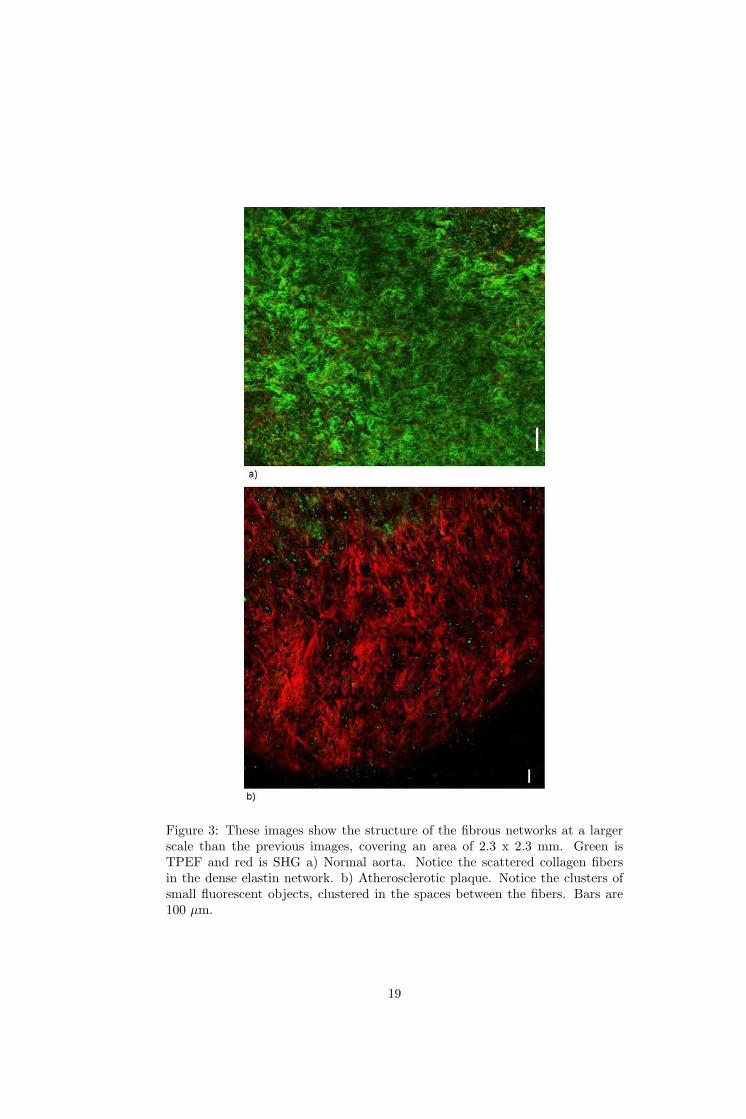
Figure 3: These images show the structure of the fibrous networks at a largerscale than the previous images, covering an area of 2.3 x 2.3 mm. Green isTPEF and red is SHG a) Normal aorta. Notice the scattered collagen fibersin the dense elastin network. b) Atherosclerotic plaque. Notice the clusters ofsmall fluorescent objects, clustered in the spaces between the fibers. Bars are100 µm.
19

Figure 4: a) The cap of a thick fibroatheroma showing bundles of collagenfibers. Also notice the small fluorescent objects of unknown origin that mightbe autofluorescence from lipid deposits or cellular structures. b) The insideof an atherosclerotic plaque. A large amount of fluorescent objects was seenthat might be attributable to lipid droplets within the necrotic core. Also,some collagen fibers can be seen. The gain could not be adjusted separatelyfor the SHG and TPEF signals, so that to get adequate SHG signal, some ofthe autofluorescens saturated. c) Calcified plaques showed strong non-fibrillarautoflourescence. Some SHG can be seen that seems to emanate from withinthe calcification. d-e) Histology of a fibroatheroma. d) HES stain. e) Elasticastain, showing no elastic fibers within the plaque. f) Van Gieson stain, wherethe red indicates the connective tissue within the cap. Bar is 20 µm in the MPMimages and 200 µm in the histology images.
20
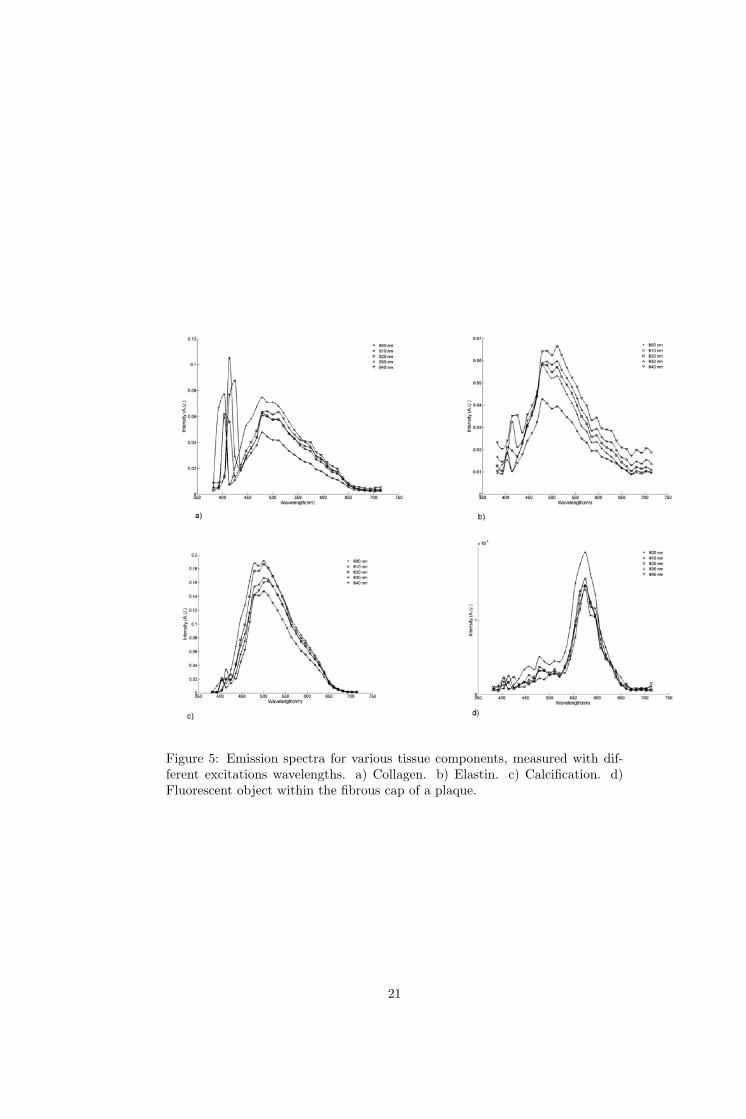
Figure 5: Emission spectra for various tissue components, measured with dif-ferent excitations wavelengths. a) Collagen. b) Elastin. c) Calcification. d)Fluorescent object within the fibrous cap of a plaque.
21

SHG depth TPEF depth SHG max TPEF max−20
0
20
40
60
80
100
120
140
Pen
etra
tion
dept
h (µ
m)
All samplesFibroatheromaHealthy
Figure 6: The mean of the penetration depth defined as the point where thesignal had fallen to e−1 of the maximum value, and the mean of the depth wherethe maximum signal was found, for various vessel states. It is the differencebetween these two that defines the penetration depth in the sense of signaldecay due to scattering and absorption. The first value indicates how deep wewere able to see structures with the current experimental setup. The error barsrepresent the standard deviation.
22

Figure 7: a) Bubble formation in the tissue during the bleaching/heating pro-cedure. Image is 115 x 115 µm b) Image taken 30 minutes after heating oftissue, indicating that the damage incurred is irreversible and confined to theilluminated region. Image is 230 x 230 µm.
23

Figure 8: a) Temperature close to focus calculated by finite element method.Since the thermal changes in the tissue were localized to about 15-20 µm thethermal shape of the nonlinear absorption better describes this observed effect.Also notice the maximum for the linear absorption is displaced from the focus.Since the beam is scanned over an area that is much larger than the focus,the area scanned by the beam only increases significantly after the cone of thebeam has become on the order of the scanned area. b) Time dependence ofthe temperature at the focus, calculated with the finite element model, withnonlinear absorption causing the heating. It is clear that the temperature isvery close to the steady state value after only one second. However, bubbleformation was at low excitation power first observed at times of around 40s. This indicates that there is a significant time delay between the observedphenomena (bubbles) and the onset of steady state temperature. c) Geometryused in the FEM simulation. The disk represents the coverglass, the box isthe tissue sample and the cone inscribed in the box defines the area with heatgeneration. d) An Arrhenius plot where the rate is defined as the inverse of thetime of bubble formation and the temperature is assumed to be proportional tothe square of the excitation power.
24

Copyright © 2022 FDOKUMEN