livelihood analysis of vulnerable groups (differently abled ...
149
-
Upload
khangminh22 -
Category
Documents
-
view
0 -
download
0
Transcript of livelihood analysis of vulnerable groups (differently abled ...


LIVELIHOOD ANALYSIS OF VULNERABLE GROUPS (DIFFERENTLY ABLED) UNDER MGNREGS
Dr. Anuradha Palla
Centre for Wage Employment & Livelihoods NATIONAL INSTITUTE OF RURAL DEVELOPMENT AND PANCHAYATI RAJ
(Ministry of Rural Development, Government of India) Rajendranagar, Hyderabad –500030
nirdpr.org.in

National Institute of Rural Development and Panchayati Raj ISBN: 978-81-944719-2-9 April 2020
Published by: NATIONAL INSTITUTE OF RURAL DEVELOPMENT AND PANCHAYATI RAJ (Ministry of Rural Development, Government of India) Rajendranagar, Hyderabad-500030, India nirdpr.org.in
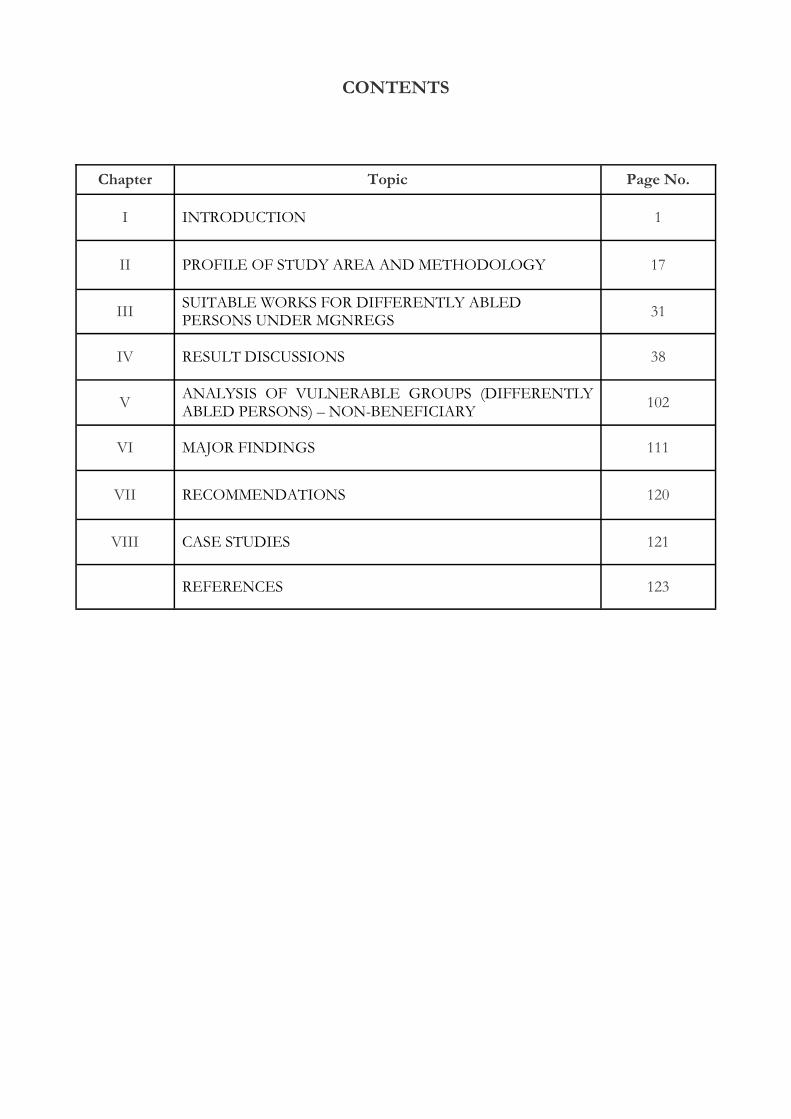
Chapter Topic Page No.
I INTRODUCTION 1
II PROFILE OF STUDY AREA AND METHODOLOGY 17
III SUITABLE WORKS FOR DIFFERENTLY ABLED PERSONS UNDER MGNREGS 31
IV RESULT DISCUSSIONS 38
V ANALYSIS OF VULNERABLE GROUPS (DIFFERENTLY ABLED PERSONS) – NON-BENEFICIARY
102
VI MAJOR FINDINGS 111
VII RECOMMENDATIONS 120
VIII CASE STUDIES 121
REFERENCES 123
CONTENTS

LIST OF TABLES
Table No.
Topic Page No.
2.1 Differently abled population in India –Census 2011 17
2.2 Percentage of proportion of differently abled population by social total population of India –Census 2011 17
2.3 Number of differently abled persons (disability-wise) as per Census 2011 19
2.4 No. of differently abled persons (block-wise) 20
2.5 Percentage of differently abled persons employed in different States and Union Territories under MGNREGS 21
2.6 Status of MGNREGS in Dhalai district: Person-days generated in FY 2012-13 to 2016-17 for differently abled persons 22
2.7 Important demographic indicators of the district as per Census 2011 24
2.8 Performance of MGNREGS in Tripura State 26
2.9 District-wise Employment Days provided under MGNREGS at the State level
26
2.10 Chawmanu block: Category-wise population of Gram Panchayats 28
2.11 Manu block: Category-wise population of Gram Panchayats 29
4.1 Age-group distribution of wage seekers 38
4.2 Gender-wise distribution of wage seekers 39
4.3 Marital status-wise distribution of wage seekers 40
4.4 Types of family systems followed by beneficiaries 40
4.5 Number of family members in a family 41
4.6 Educational Status of the household 41
4.7 Social Group-wise distribution of beneficiaries 42

4.8 Religion-wise distribution of beneficiaries 43
4.9 Average family size of the households 44
4.10 Primary occupation-wise distribution of beneficiaries 44
4.11 Secondary occupation-wise distribution of beneficiaries 45
4.12 No. of persons with disabilities employed under NREGS 45
4.13 Average person-days and wages in Chawmanu and Manu blocks 46
4.14 Nature of disability of beneficiaries 47
4.14.1 Average number of working days (Disability-wise) 47
4.14.2 Average number of working days during 2013-14 48
4.14.3 Average number of working days during 2014-15 48
4.15 Average number of working days during 2015-16 49
4.16 Percentage of Disability 49
4.17 Average number of days for beneficiaries worked (with help) 50
4.18 Average man-days beneficiaries spent for different categories of works (work done independently)
51
4.19 Status of the Shrama Shakti Sanghas (SSS) 52
4.20 Composition of the groups 53
4.21 Registration status of the groups 53
4.22 Earning Members in Chawmanu and Manu blocks 54
Table No.
Topic Page No.

Table No.
Topic Page No.
4.23 Land holding pattern in Chawmanu and Manu blocks 54
4.24 No. of beneficiaries holding white ration card 55
4.25 Involvement of MGNREGS beneficiaries in SHG 55
4.26 Do the beneficiaries consider the MGNREGS beneficial? 56
4.27 No. of development programmes accessed by beneficiaries 57
4.28 Attendance in Gram Sabha meetings 57
4.29 Beneficiaries’ participation in village development activities 58
4.30 Beneficiaries’ participation in CBO activities 58
4.31 Beneficiaries’ participation in the Rozgar Diwas 59
4.32 Have you ever shared your ideas in Gram Sabha? 59
4.33 If yes, do you think your ideas have been considered? 60
4.34 Mode of conveying information about MGNREGS 60
4.35 Whether the information on MGNREGS was instantly available? 60
4.36 Beneficiaries’ perception on essentiality of basic literacy skills to access information
61
4.37 Beneficiaries’ perception on essentiality of basic literacy skills to access information on MGNREGS (Education-wise)
61
4.38 Awareness issues in reference to MGNREGS- 100 days of employment 62
4.39 Awareness issues in reference to MGNREGS- Right to employment 62
4.40 Awareness issues in reference to MGNREGS- Wage employment in local area
63

4.56 No. of beneficiaries getting disability pension from the GP 70
4.57 Details of amount received by beneficiaries per month 71
4.58 Details of beneficiaries receiving pension 71
4.59 Awareness of disability-friendly tools 71
Table No.
Topic Page No.
4.41 Awareness issues in reference to MGNREGS – worksite facilities 63
4.42 Awareness issues in reference to MGNREGS – period of wages 64
4.43 Awareness issues in reference to MGNREGS – prescribed wages 64
4.44 Awareness issues in reference to MGNREGS – equal wages 65
4.45 Awareness issues in reference to MGNREGS – exclusive manual works
65
4.46 Awareness issues in reference to MGNREGS – type of works 66
4.47 Awareness issues in reference to MGNREGS – mate system 66
4.48 Awareness issues in reference to MGNREGS – shelf of works 66
4.49 Awareness issues in reference to MGNREGS – works on demand 67
4.50 Awareness issues in reference to MGNREGS – medical aid/treatment 67
4.51 Awareness issues in reference to MGNREGS – social audit 68
4.52 Awareness issues in reference to MGNREGS – travel allowance 68
4.53 Awareness issues in reference to MGNREGS – timely wage payment within 15 days
69
4.54 Awareness issues in reference to MGNREGS – any other 69
4.55 The activities of the coordinator 70

4.68 Awareness of approaching officials/others if work is not given within 15 days
75
4.69 Awareness of approaching officials/others if wages are not paid within 15 days
76
4.70 Sources for availing information on MGNREGS 76
4.71 Factors responsible for low participation 77
4.72 Motivating factors for the beneficiaries 78
4.73 Factors responsible for low participation - lack of sufficient agricultural activity
79
4.74 Factors responsible for low participation – low market wages 80
4.75 Factors responsible for low participation – migration 80
4.76 Factors responsible for low participation - illiteracy 80
4.60 No. of beneficiaries still using general tools/equipment at worksite 72
4.61 Awareness of Labour Groups 72
4.62 Is the Labour Group homogeneous/heterogeneous? 73
4.63 Awareness of mandatory facilities to be provided at the worksite – first aid
73
4.64 Awareness of mandatory facilities to be provided at the worksite – drinking water
73
4.65 Awareness of mandatory facilities to be provided at the worksite - creche
74
4.66 Awareness of mandatory facilities to be provided at the worksite – shade
74
4.67 Awareness of approaching officials/others – non-issuance of job cards 75
Table No.
Topic Page No.

4.77 Factors responsible for low participation – lack of skills 81
4.78 Factors responsible for low participation – flood 81
4.79 Factors responsible for low participation – drought 82
4.80 Factors responsible for low participation – lack of continuous work 82
4.81 Perception of personal gains – financial security 82
4.82 Perception of personal gains – decline in incidence of migration 83
4.83 Perception of personal gains – IAY household 83
4.84 Perception of personal gains – land development 84
4.85 Perception of personal gains – personal care of children 84
Table No.
Topic Page No.
4.86 Perception of personal gains – more attention to children’s education 84
4.87 Perception of personal gains – better care for infants at worksite 85
4.88 Perception of personal gains – improved household savings 85
4.89 Perception of personal gains – increase in alcohol consumption by the head of household
86
4.90 Perception of personal gains – could able to meet expenditure on health-related issues
86
4.91 Perception of personal gains – able to spend more on clothes for self, children, etc.
87
4.92 Perception of personal gains – could able to get better or more wages in agricultural sector
87
4.93 Perception of personal gains – increase in wage negotiation capability 87
4.94 Professional Issues – unity with other workers 88
4.95 Professional Issues – realising more personal abilities 88

Table No.
Topic Page No.
4.96 Professional issues – rights and responsibilities of self 89
4.97 Professional issues – access to wider information 89
4.98 Professional issues – technical information on works 89
4.99 Professional issues – measurement of works 90
4.100 Professional issues – self-help among workers 90
4.101 Professional issues – interaction with officials 91
4.102 Professional issues – utility of works undertaken 91
4.103 Professional issues – understanding on natural resources 92
4.104 Personally consider best gain from MGNREGS – equal wages 92
4.105 Personally consider best gain from MGNREGS – wage opportunities in the vicinity
93
4.106 Personally consider best gain from MGNREGS – timely wages 93
4.107 Personally consider best gain from MGNREGS – regulated working hours
93
4.108 Personally consider best gain from MGNREGS – works with rights 94
4.109 Personally consider best gain from MGNREGS –worksite facilities 94
4.110 Personally consider best gain from MGNREGS – reduced burden of distress migration
95
4.111 Nature of disability-wise & year-wise average employment days 97
4.112 Percentage of disability-wise & gender-wise average employment days 98
4.113 Average wages and employment days with t-ratios 100
4.114 Average scores of motivation, awareness and participation 101

5.5 Number of members in a family 104
5.6 Educational Status-wise distribution of non-beneficiaries 104
Table No.
Topic Page No.
5.7 Social group-wise distribution of non-beneficiaries 105
5.8 Religion-wise distribution of non-beneficiaries 106
5.9 Distribution of Members 106
5.10 Distribution by primary occupation 106
5.11 Distribution by secondary occupation 107
5.12 Nature of disability 108
5.13 Percentage of disability 108
5.14 Details of non-beneficiaries getting disability pension from GP 109
5.15 Details of disability pension received by non-beneficiaries per month 109
5.16 Nature of Disability (Social Group-wise) 110
5.17 Percentage of Disability ( Social Group-wise) 110
Annexures 131
5.1 Age-wise distribution of non-beneficiaries 102
5.2 Gender-wise distribution of non-beneficiaries 103
5.3 Marital Status-wise distribution of non-beneficiaries 103
5.4 Types of family of non-beneficiaries 103

Acknowledgements
I would like to express my sincere gratitude to the Director General, National Institute of Rural
Development and Panchayati Raj (NIRDPR), Hyderabad Dr. W. R. Reddy, IAS, for his
encouragement and guidance in completing the project on differently abled wage seekers under
MGNREGS. I take this opportunity to express my sincere thanks to Dr. Jyothis Sathyapalan,
Professor and Head, Centre for Wage Employment & Livelihoods (CWE&L), NIRDPR.
I shall be failing in my duty if I do not express my sincere thanks to the District Magistrate,
Assistant District Magistrate, District Statistical Officer, Block Development Officers and Gram
Panchayat Officials of Dhalai district, Tripura State for their valuable suggestions.
I express my deep sense of gratitude to Dr. S.V. Rangacharyulu, Senior Fellow (Centre for Wage
Employment & Livelihoods) and Dr. K. Jayasree, Research Associate, NIRDPR for their technical
and moral support in completing my work.
Last but not least, I am grateful to all the ministerial staff working in CWE&L for their support
in completing the project.
Anuradha Palla Assistant Professor

Executive Summary
Mahatma Gandhi National Rural Employment Guarantee Act (MGNREGA) is the most
progressive and social safety net instrument ever implemented in the country to recognise
employment as “rights” and not as welfare intervention of the government. There were expectations
that the Scheme, developed for implementation of the Act, will have a major impact on the inclusion
of the marginalised in the development process. The Scheme has specified focus on “inclusive
development” and different processes enshrined in the Scheme favour the inclusion of the
marginalised. However, unfortunately, one specific focus of inclusive development- including the
differently abled people in the workforce - has been largely ignored during the implementation of the
programme.
Differently abled people are one of the largest vulnerable groups in the world and are starved
of services and facilities provided to their non-disabled peers. Being differently abled, they face many
challenges like lack of access to education, employment, better quality of living, etc., and their
situation is even worse by the negative attitude of society. Despite various initiatives of the
government, still, the fruit of benefits failed to reach the target group. The Mahatma Gandhi National
Rural Employment Guarantee Act becomes an important source of economic and employment
support for persons with disabilities (PwD) in rural areas. The study reveals that though the
participation of differently abled persons in the scheme is very low, yet their participation is gradually
increasing day by day which depicts a positive picture. The awareness level of the differently abled has
increased due to their participation in employment. The employment provided by the scheme makes
them more financially secured, aware of rights and entitlements, and enable them to interact with
various officials, negotiate the wage rate, participate in a various local level institution and share ideas,
which in turn, enrich their self-dignity and brought down the negative attitude of the family and
society. They felt that after the introduction of the scheme, there is a noticeable improvement in land
development, increase in wage rate in agriculture, reduction in distress migration, improved access of
rural people to wider information and a better understanding of natural resources. The study also
revealed that there are some lacunas such as personal care of children, better care of infants, negative
attitude of non-disabled workers which seeks kind attention of the MGNREGS officials and related
service provider to ensure better participation and continue the success of the state in providing
highest person-days to the rural and vulnerable poor.

Livelihood Analysis of Vulnerable Groups (Differently Abled) under MGNREGS
1
CHAPTER – I
INTRODUCTION
The definition of the population with disabilities is a key element in the design of a data
collection activity, for it sets the scope and coverage of the whole data collection process. From the
conceptual point of view, there is no universal definition of what constitutes a disability or who
should be considered as having a disability. Moreover, there is no static condition of disability. A
disability is a result of the interaction between a person with a health condition and a particular
environmental context. Individuals with similar health conditions may not be similarly differently
abled or share the same perception of their disability, depending on their environmental adaptations.
For example, having access to technical aids, services or medication, or physical adaptation to the
environment may allow individuals to overcome their disabling conditions. Disability is not an all-or-
nothing phenomenon but involves degrees of difficulty, limitation or dependence ranging from slight
to severe. Questions should be designed to capture those with severe as well as those with less severe
forms of disabling conditions and should take into account any assistive devices or accommodations
that the person may have.
Mahatma Gandhi National Rural Employment Guarantee Act (MGNREGA) is the most
progressive and social safety net instrument ever implemented in the country to recognise
employment as “rights” and not as welfare intervention of the Government. There were expectations
that the Scheme developed for implementation of the Act will have a major impact on the inclusion of
the marginalised in the development process. The Scheme has specified focus on “inclusive
development” and different processes enshrined in the Scheme favouring the inclusion of the
marginalised. However, unfortunately, one specific focus of inclusive development, including the
differently abled people in the workforce, has been largely ignored in the implementation of the
programme.
In India, the rights of the differently abled people are protected by ‘The Persons with
Disabilities (Equal Opportunities, Protection of Rights and Full Participation) Act, 1995.’ The
said Act defines the role of the State actors as well as the private actors concerning the differently
abled people. Section 40 of the Act indicates that “the appropriate Governments and local
authorities shall reserve not less than three per cent in all poverty alleviation schemes for the
benefit of persons with disabilities (PwD).”
Operational guidelines for MGNREGS incorporate the following provision concerning this

Livelihood Analysis of Vulnerable Groups (Differently Abled) under MGNREGS
2
marginalised section of the society: “if a rural differently abled person applies for work, work
suitable to his/her ability and qualifications will have to be given. This may also be in the
form of services that are identified as integral to the programme. Provisions of the Persons
with Disabilities (Equal Opportunities, Protection of Rights and Full Participation) Act, 1995,
will be kept in view and implemented.” However, unlike the case of women, there is no specific
direction to the State Governments or the project implementing agencies as to the minimum
percentage of employment to be reserved for the differently abled. In the absence of such a
stipulation, we may presume that the minimum should positively confirm with the PWD Act, 1995.
The disabled or differently abled persons defined under the Persons with Disabilities (Equal
Opportunities, Protection of Rights and Full Participation) Act, 1995 (1 of 1996) as persons with
disabilities, the severity of which is 40 per cent and above would be considered as a special category of
vulnerable persons for MGNREGA. The differently abled persons, as defined in the National Trust
for Welfare of Persons with Autism Cerebral Palsy, Mental Retardation and Multiple Disabilities Act,
1999 (44 of 1999), are also to be considered as differently abled for inclusion in MGNREGA.
In 2010, the Ministry of Rural Development, Government of India formed several working
groups to suggest improvement in the implementation of MGNREGA in the country. One such
working group was on ‘Specific Needs of Special Categories under MGNREGA.’ The report,
submitted in July 2010, identified the following problems concerning the differently abled people in
MGNREGA:
Non-inclusion in the MGNREGS (low coverage)
Unfavourable work norms in MGNREGS
Distance to worksites
Lack of sensitivity of the delivery system towards differently abled
Low social capital- lack of access to formal and informal organisations
The working group made the following set of recommendations for integration of the
differently abled and the aged people in MGNREGS:
1. All those workers above 65 years are treated as ‘aged’. 2. The claim of the differently abled should be supported by the doctor’s certificate or by
fellow workers. In case of the wrong certification, the fellow worker should be made liable to lose the job card.
3. The district administration should strive to graduate all the differently abled towards skilled status in a specific time frame.

Livelihood Analysis of Vulnerable Groups (Differently Abled) under MGNREGS
3
4. In the selection of Mates, Gram Rozgar Sahayak (GRS) and Technical Assistants, the literate and/or semi-skilled persons with disabilities (PWDs) belonging to labour households be given preference.
5. A system of flexible hours should be adopted for PWDs and aged so that they can execute the work at convenient times during the day.
6. The length of actual work time is relaxed for PWDs and aged and they may be allowed to work for 5.30 hrs a day (This is recommended based on Work Time Motion Studies undertaken by an NGO (SWADHIKAR, AP).
7. The work norms (as per SoRs) for PWDs and age should be reduced by 30 per cent. 8. The PWDs and aged be given separate and independent job cards within a household. It
has been observed that the households having a PWD and aged at home generally avail the benefit for a non-disabled member in the family and PWDs are not allowed to work in the site and earn. Having a separate job card will make the PWDs and aged independent for pursuing employment under the scheme if she/he chooses to do so.
9. Exclusive staff may be posted at the block and district levels for mobilisation of PWDs and to look after the special needs of the workers with disabilities. He will act as a channel between the officials/PIA and workers with disabilities and strive for creating a conducive environment for PWDs to work. He will also look after the information, communication and education (IEC) needs of PWDs. The salary and allowances of such staff may be borne out of the administrative expenses of the scheme.
10. In the matters of deciding the work and also the location of work, the PWDs and aged be allowed to exercise their choice (in a situation where different types of work are being carried out and at different locations) and priority should be given to their preferences.
11. The PWDs and aged be given travel allowances at a higher rate on a preferential basis. For the travel from the place of residence to a worksite, the travel allowance may be paid @ 10 per cent of the minimum daily wages for the initial distance up to 5 km and @ 20 per cent for above 5 km.
12. At Gram Panchayat, block, and district levels, monitoring and reporting mechanism of the works meant for PWDs and aged be put in place, and monitoring and reporting should be done on a regular and continuous basis. The present institutional arrangements in MGNREGA be strengthened/modified to accommodate this. A dedicated cell at the State and district levels and an additional PO would help in effective monitoring and coordinating with other departments.
13. In Andhra Pradesh, there is a system of providing Rs. 3 per person per man-day for mobilising PWDs in MGNREGS. The CSOs/NGOs are engaged in mobilising PWDs and the system seems to be working very well. This system may be replicated in other States. The NGOs and CSOs may also act as an implementing agency and can mobilise PWDs under this system. This suggestion is not duplicating the suggestion given at Point No.14 above. The staff to be posted at the block and district levels will be performing a job of moderator and facilitator and provide necessary intervention to facilitate a smooth work environment for PWDs and the aged.
14. A suitable shelf of works and opportunities may be created for the semi-skilled PWDs having soft and traditional skills and crafts like a computer, carpentry, masonry, etc.
15. The land owned by the PWDs be given preference in the execution of MGNREGA individual works.

Livelihood Analysis of Vulnerable Groups (Differently Abled) under MGNREGS
4
16. Works that facilitate accessibility and barrier-free entry to all public places like schools, PHCs, water sources, parks, etc., should be undertaken on priority and may be included in the shelf of projects as mentioned at Point No. 11.
17. The worksite facilities must be such that it takes care of the specific needs of PWDs and the aged.
Mahatma Gandhi NREGA Operational Guidelines 2013 made a provision to provide wage
employment to vulnerable groups and particularly it had indicated types of works to be assigned to
disabled/differently abled persons of different categories of disabilities. It had mentioned certain
special categories of vulnerable people who will otherwise remain excluded.
Some of the special categories are:
Persons with disabilities
Vulnerable Tribal Groups
Nomadic Tribal Groups
De-notified Tribes
Women in special circumstances
Senior citizens above 65 years
HIV positive persons
Internally displaced persons
Some of the critics State that the vulnerable groups are reluctant to work under the Mahatma
Gandhi NREGS as there is a delay in wage payments for a period ranging from 30 to 90 days. Hence,
the vulnerable groups are unable to achieve 100 days of employment under the Mahatma Gandhi
NREGS, as they are not receiving any delay in wage compensation. Ministry of Rural Development is
encouraging the implementing officials to capture the demand of the vulnerable and disadvantaged
section through organising Rozgar Diwas and involving different stakeholders in the planning process
through Intensive Participatory Planning Exercise – II (IPPE-II) to address the issues which promote
the participation of vulnerable and disadvantaged sections.
It is estimated that around five per cent of the population in rural areas will fall into the category
of differently abled and this group is one of the most deprived and vulnerable. Depending upon the
demand for the work by a differently abled/special category persons, works could be opened
specifically for the differently abled and in case of large GPs with a substantial population of
differently abled and vulnerable, separate works could be opened at the habitation level. (Operational
Guidelines 2013, MGNREGS). Therefore, this has led to the collection of data on the percentage of
differently abled persons who participated in the MGNREGS works. The website of MGNREGS
shows that the percentage of differently abled who participated over the past four years in India is

Livelihood Analysis of Vulnerable Groups (Differently Abled) under MGNREGS
5
only 0.64 and the States in which highest percentage of differently abled persons who participated in
MGNREGS over the past four years are Andhra Pradesh (1.3 per cent) and Tripura having(1.16 per
cent). As against the 5 per cent differently abled rural population in India, only 0.64 per cent has
participated in MGNREGS. Therefore, it is felt necessary to study the profile of wage employment
among differently abled persons in terms of minimum wage rate, 100 days of employment, types of
works assigned, delay in wage payment and other relevant parameters.
Mahatma Gandhi NREGA Operational Guidelines 2013 specifically indicated specific types of
works such as drinking water arrangements, help in looking after children, plantation, irrigation-canal
digging, earth backfilling, dumping mud outside, filling sand, sprinkling water, farm bundling, etc., that
can be allocated to different categories of differently abled such as persons with one weak hand,
persons with weakness in both hands, persons with one weak leg, persons with weakness in both legs,
persons with one weak leg and one weak hand, etc.
In this context, it is interesting to focus on the level of access to specific provisions made under
Mahatma Gandhi NREGS among the vulnerable groups given the problems associated with them.
Since the Mahatma Gandhi National Rural Employment Guarantee Act has the mandate to improve
the livelihoods of these vulnerable groups through special provisions, it is important to study the level
of access and also its impact on strengthening their livelihoods. It is also important to study the
process of involvement and measures adopted thereof. Further, it is also important to analyse the role
of Mahatma Gandhi NREGS in reducing the vulnerability among these groups.
The following are the exclusive measures for the promotion of the participation of the
differently abled persons under MGNREGS:
Identification of suitable works
Mobilisation of differently abled persons by focusing on awareness and special provisions
Specifically identified works for differently abled persons in the case of large GPs
Preference to appoint as mates and as workers for providing drinking water, to manage
crèches, etc., at the worksite
Adoption of tools and equipment/facilities at workplaces
Treating persons with disabilities with respect
Special drive to ensure 100 days of employment to such households
Provide special job card of a distinct colour
As much of the existing literature is not focused on this aspect, it is proposed to analyse the
livelihoods among the vulnerable groups in the context of provisions and pattern and process of

Livelihood Analysis of Vulnerable Groups (Differently Abled) under MGNREGS
6
access to special provisions and its impact. This in context, the present study is proposed.
Among the vulnerable groups, the differently abled persons assume more importance because
of the difficulties they face in terms of their livelihoods. They also constitute an important segment in
terms of promoting livelihood security, especially under the realm of Mahatma Gandhi NREGA.
Hence, the present study, in specific, is focused on differently abled persons who registered under the
Objectives
Keeping the specifically focused vulnerable group, the objectives are
1. To study the participation profile of differently abled persons in the MGNREGS.
2. To study the livelihoods of differently abled persons with and without MGNREGS.
3. To analyse types of works assigned among various categories of differently abled persons.
4. To suggest measures for assignment of relevant works among different categories of differently
abled persons to ensure their higher participation.
Hypothesis
Implementation of all 24 specified works would enable many differently abled to participate and
thereby result in higher wages for them.
Limitations
In places where disability is a stigma, people are reluctant to report it. Also, this being a very
sensitive question, the investigators were being adequately trained to collect data on disabilities. To
identify persons in the population with disabilities was a complex problem. Language, climate and bad
roads were also some of the limitations.
Available Review of Literature
The disabled or differently abled persons defined under the Persons with Disabilities (Equal
Opportunities, Protection of Rights and Full Participation) Act, 1995 (1 of 1996) as persons with
disabilities, the severity of which is 40 per cent and above would be considered as a special category of
vulnerable persons of MGNREGA. The disabled persons as defined in the National Trust for Welfare
of Persons with Autism Cerebral Palsy, Mental Retardation and Multiple Disabilities Act, 1999 (44 of
1999) are also to be considered as disabled for inclusion in MGNREGA. Since these categories of

Livelihood Analysis of Vulnerable Groups (Differently Abled) under MGNREGS
7
people are differently abled, special conditions are to be created to facilitate their inclusion in
MGNREGA. It is estimated that around five per cent of the population in rural areas will fall into the
category of differently abled and this group is one of the most deprived and vulnerable (Operational
Guidelines 2013, MGNREGS).
Depending upon the demand for the work by the differently abled persons/special category
persons, works could be opened specifically for the differently abled and in case of large GPs with a
substantial population of differently abled and vulnerable, separate works could be opened at the
habitation level. The efforts should be to ensure that the special category persons are given work close
to their place of residence so that they need not travel long distances for MGNREGA works
(Operational Guidelines 2013, MGNREGS).
According to Chapter - 9 (Strategy for Vulnerable Groups) of Mahatma Gandhi NREGA
Operational Guidelines – 2013, to provide a strong social safety net for vulnerable groups under
Mahatma Gandhi NREGA, extra efforts need to be made for certain special categories of vulnerable
people who will otherwise remain excluded. Some of the special categories are: i) Persons with
disabilities ii) Primitive Tribal Groups iii) Nomadic Tribal Groups iv) De-notified Tribes v) Women in
special circumstances vi) Senior citizens above 65 years of age vii) HIV positive person viii) Internally
displaced person ix) Rehabilitated bonded labour. Women in special circumstances include widowed
women, deserted women and destitute women who are highly vulnerable and require special attention.
The GP should identify such women and ensure that they are provided 100 days of work. Pregnant
women and lactating mothers (at least up to 8 months before delivery and 10 months after 80
Mahatma Gandhi NREGA Operational Guidelines 2013 delivery) should also be treated as a special
category. Special works that require less effort and are close to their house should be identified and
implemented for them. At least one labour-intensive public work with at least one work which is
suitable for Particularly Vulnerable Groups especially the aged and the differently abled which shall be
kept open at all times to provide work as per demand.
K. P. Kumaran (2013) in his report concluded that the current level of work participation of the
differently abled population either in the skilled or unskilled employment sector is very low despite the
protective measures extended through the Disability Act, 1995. One of the reasons for low
participation is due to the social and environmental barriers erected around them. But the
introduction of MGNREGS heralded a new chapter in the history of wage employment for the
differently abled. The sample-based study showed that many of those differently abled who were
hitherto denied or deprived of employment in the unskilled sector got an opportunity to take up wage
employment for the first time in their life and earn a modest income. The study revealed that those

Livelihood Analysis of Vulnerable Groups (Differently Abled) under MGNREGS
8
who suffered not only from locomotors disability but non-locomotors disability also undertook wage
employment. However, the national-level data, considering the total population of the differently
abled, showed that the number of them engaged in MGNREGS is too small. Considering their
vulnerability, physical and mental condition there is a need to provide a conducive working
environment by discounting of work norms to attract them into MGNREGS work. Such an action
will help the differently abled to realise their potential and contribute their mite in the nation-building.
Nidhi Vij (2012) in the paper “Empowering the marginalised: Mahatma Gandhi National Rural
Employment Guarantee Act in India” analyses the policy provisions, implementation and monitoring
mechanism of MGNREGA to argue that policy designs with legally enforceable mechanisms and
collaborative governance systems can lead to the empowerment of the marginalised sections.
Rebecca Holmes’ (2010) study on gendered risk, poverty and vulnerability analysis of
MGNREGA through a gender lens highlights specific progressive gender-sensitive design features
which support women’s participation in employment – through the one-third quota, the provision of
equal wages for women and men through the Equal Remuneration Act and the promotion of
women’s active engagement in the planning and evaluation of community assets through, for example,
the social audit forums. However, our findings also suggest that both the conceptual design of
NREGA and its implementation need to be strengthened to further support gender-equitable
outcomes of the Act.
Work Participation by Persons with Disabilities
In India, it is a fair presumption that PwDs are not seen as human resources who could
contribute and participate in nation-building. Their talent, skills and potential mostly remain untapped,
under-utilised or underdeveloped. Further, the education and employment rates for persons with
disabilities are far lower than the non-disabled persons. The opportunities for PwDs to earn are less
while their expenses are more, which results in them remaining one of the more impoverished
communities in India. Even though the country is clocking an average annual GDP growth rate of
8.45 per cent (2004-2011) and employment opportunities have increased in the last two decades, the
percentage of persons with disabilities fell from 43 per cent in 1991 to 38 per cent in 2002 despite the
galloping economic growth. According to the employment projections given in the Eleventh Plan, an
estimated 116 million employment opportunities would be created in the 11th and 12th Plan periods.
The unemployment rate at the end of the 12th plan period is projected to fall a little over 1 per cent.
Further, a Skill Development Mission was launched during the 11th Five-Year plan, which envisions
creating 500 million skilled workers by 2022. However, slow progress can be seen in the 11thplan
period to achieve these targets vis-a-vis person with disabilities and as a result, the inequality gap is
steadily increasing.

Livelihood Analysis of Vulnerable Groups (Differently Abled) under MGNREGS
9
A recent draft of the Social Assessment Report 14 on National Rural Livelihoods Project
(NRLP) mentions, ‘some groups are more disadvantaged than others. The analysis shows clearly that
Scheduled Tribes, Scheduled Castes, some religious minorities such as Muslims, women, and people
with disabilities are amongst the poorest groups.’ It further accepts the fact that the differently abled
or physically/mentally challenged often have limited access to education, employment and public
services. Some barriers to their inclusion are physical, such as the inaccessibility buildings or transport
while others may be institutional (e.g. discriminatory practices) and attitudinal (e.g. the stigma attached
to persons who are HIV+ and suffering from AIDS).
PwDs face serious barriers in getting jobs. Unequal access to education and training
programmes is a major challenge that needs to be resolved on a priority basis. Then, they must to be
able to learn about jobs and obtain it, which they can physically access and perform despite their
disability. They also face social and psychological barriers - ignorance, myths, prejudice, stereotyping
and misconceptions about their capacities, acceptance by fellow workers, low self-esteem, fear and
over-protective families. Bringing about changes to the existing infrastructure is a key for improving
access to the physically disabled as employers are also often reluctant to provide accessibility and
supportive facilities. In general, there is little legislative support for the differently abled, and where
protective laws exist, they may be poorly enforced. Technology may provide support in certain areas –
for example, computers and the Internet could help those with mobility or communication difficulties,
but these have to be made available consciously to poor people (De Marco, 2009). For incorporating
the differently abled people in the NRLP, these technologies would be required whereas other issues
should be squarely addressed.
While mentioning the strategies, the report emphasises that PwDs face immense challenges and
both poverty reduction and human rights programmes have a lot of ground to cover. Community
Driven Development Programmes (CDDP) have typically addressed disability through sub-project
level interventions that are geared towards vulnerable groups such as the differently abled, elderly or
children/youth at risk. The Andhra Pradesh Rural Poverty Reduction Programme (APRPRP) applied
the principles of participation and voice in organising differently abled people into self-help groups
(SHGs) and federations. The project links these SHGs to the wider community and other
stakeholders. It aims to empower and build the social capital of differently abled people so that they
can effectively articulate their interests and needs, and participate actively in the development of
options to address these. In the context of livelihood projects, training programmes are a significant
step that could help improve their situations. A useful package for PwDs would be vocational
guidance and skills training, and entrepreneurship development or employment placement.
The picture is not very encouraging in the non-government arena as very few NGOs are

Livelihood Analysis of Vulnerable Groups (Differently Abled) under MGNREGS
10
working in the field of livelihood for PwDs. Further, whatever little is happening in the area of
livelihood options for PwDs is hardly being shared; thus minimising the chances of replication of
good practices from the field. The documentation of such initiatives to further nationwide emulation
thus becomes the need of the hour. Learning regarding what works and what does not work could be
most valuable to avoid reinventing the wheel. There is also a need to develop a basic understanding of
the diversity and heterogeneity of PwDs concerning designing livelihood options. Diversity in
categories of PwDs poses immense challenges in planning livelihood strategies in a compartmentalised
manner. The methodology of doing the same work could be different for different categories. This
may call for either remodelling the workplace or redesigning machine tools or both.
Legislative Frameworks in India The legislative provisions around disability in India are managed by four different laws, which
govern different and varied aspects of disability.
a. Rehabilitation Council of India (RCI) Act, 1992
The Rehabilitation Council of India was set up under the 1992 Act of the Parliament. The Council
regulates and monitors the training of rehabilitation professionals and personnel, and promotes
research in rehabilitation and special education.
b. Persons with Disabilities (Equal Opportunities, Protection of Rights and Full
Participation) (PwD) Act, 1995
This is the main Act concerning disability in the country. It provides for education, rehabilitation,
employment, non-discrimination and social security for persons with disabilities. It ensures a three per
cent reservation for PwDs in poverty alleviation programmes as well as in certain job categories. It
casts obligations on the central government, State governments and local authorities to ensure full
citizenship benefits to PwDs.
c. National Trust for the Welfare of Persons with Autism, Cerebral Palsy, Mental Retardation
and Multiple Disabilities Act, 1999
This Act is concerned with enabling and empowering PwDs to live independently and as fully and
close to their community as possible, to evolve procedures for appointments of guardians and trustees
for PwDs, to extend support to registered organisations to provide need-based services, to facilitate
the realisation of equal opportunities, protection of rights and full participation of PwDs.
d. Mental Health Act, 1987
Mental illness is one of the disabilities mentioned in the PwD Act of 1995. However, treatment and
care of mentally ill persons are governed by this Act, which is administered by the Ministry of Health

Livelihood Analysis of Vulnerable Groups (Differently Abled) under MGNREGS
11
and Family Welfare. It is largely concerned with the regulation of admission to mental hospitals, the
appointment of guardianship or custody of mentally ill persons who are incapable of managing their
affairs, providing legal aid to mentally ill persons on state expense and also regulating and
management of psychiatric hospitals across the country.
Policy Framework and Government Schemes
The National Policy for Persons with Disabilities, 2006 The National Policy recognises that PwDs are a valuable human resource for the country and
seeks to create an environment that provides them with equal opportunities, protection of their rights
and full participation in society. It is in spirit with the basic fundamental rights of equality and
freedom that are enshrined in the Constitution of India. It mandates an inclusive society for all and
recognises the fact that a majority of persons with disabilities can lead to a better quality of life if they
have equal opportunities and effective access to rehabilitation measures.
Poverty Reduction Schemes There are several livelihood schemes or poverty reduction schemes as they are popularly called.
Some of these schemes provide three per cent reservation for PwDs as a means to livelihood and
hence are incorporated in the study to assess the status. Brief details of these schemes are given below.
Swarnjayanti Gram Swarozgar Yojana (SGSY) The objective of SGSY is to bring the assisted families above the poverty line within three years
by providing them income-generating assets through a mix of bank credit and government subsidy.
The rural poor such as those with land, landless labour, educated-unemployed, rural artisans and
differently abled are covered under the scheme. The assisted families known as Swarozgaris can be
either individuals or groups and would be selected from BPL families by a three-member team
consisting of the Block Development Officer, a banker and the Sarpanch.
The SGSY will focus on vulnerable sections of the rural poor. Accordingly, SCs/STs will
account for at least 50 per cent, women 40 per cent and the differently abled three per cent of those
assisted. SHGs under SGSY may consist of 10 to 20 persons belonging to BPL families. In the case of
minor irrigation and the case of differently abled persons, this number may be a minimum of five
persons. The group shall not comprise more than one member of the same family. A person should
not be a member of more than one group.

Livelihood Analysis of Vulnerable Groups (Differently Abled) under MGNREGS
12
Sampoorna Grameen Rozgar Yojana (SGRY)
The primary objective of the scheme is to provide additional wage employment in all rural areas
and thereby provide food security and improve nutritional levels. The secondary objective is the
creation of a durable community, social and economic assets and infrastructural development in rural
areas. The programme is to be implemented as a centrally sponsored scheme on a cost-sharing basis
between the Centre and the States in the ratio of 75:25 of the cash component of the programme. In
the case of Union Territories (UTs), the Centre provides the entire (100 per cent) funding required
under the scheme. Foodgrains are provided to the States/UTs free of cost. The SGRY is open to all
the rural poor who require wage employment and wish to do manual and unskilled work in and
around their village/habitat. The programme is self-targeting in nature. While providing wage
employment, preference is give to agricultural wage earners, non-agricultural unskilled wage earners,
marginal farmers, women, SCs/STs and parents of child labourers withdrawn from hazardous
occupations, and parents of handicapped children or adult children of handicapped parents who are
desirous of working for wage employment.
Mahatma Gandhi National Rural Employment Guarantee Act (MGNREGA)
The Mahatma Gandhi National Rural Employment Guarantee Act (MGNREGA) guarantees
100 days of employment in a financial year to any rural household whose adult members are willing to
do unskilled manual work. In the guidelines, the “Allocation of Employment Opportunities” section
States that, “If a rural disabled person applies for work, work suitable to his/her ability and
qualifications will have to be given. This may also be in the form of services that are identified as
integral to the programme.” Provisions of the Persons with Disabilities (Equal Opportunities,
Protection of Rights and Full Participation) Act, 1995 will be kept in view and implemented.
Swarna Jayanti Shahari Rozgar Yojana (SJSRY)
The SJSRY seeks to provide gainful employment to the urban unemployed and underemployed
poor by encouraging self-employment ventures, or by providing wage employment. This programme
relies upon the creation of suitable community structures and the delivery of inputs under this
programme is through the medium of such community structures. The scheme rests on a foundation
of community empowerment. Neighbourhood Groups (NHGs), Neighbourhood Committees
(NHCs) and Community Development Societies (CDSs) shall be set up in the target areas. The CDSs
shall be the focal point for the identification of beneficiaries, preparation of applications, monitoring

Livelihood Analysis of Vulnerable Groups (Differently Abled) under MGNREGS
13
of recovery and for the provision of whatever other support is generally necessary for the
effectiveness of the programme. The CDSs will also identify viable projects suitable for that particular
area. The target group is the urban public living below the poverty line. The percentage of women
beneficiaries under this programme shall not be less than 30 per cent; SCs and STs must be benefited
at least to the extent of the proportion of their strength in the local population. A special provision of
three per cent shall be reserved for the differently abled under this programme.
Prime Minister’s Employment Generation Programme (PMEGP)
The Government of India has approved the introduction of a new credit linked subsidy programme
called the Prime Minister’s Employment Generation Programme (PMEGP) by merging two schemes,
namely the Prime Minister’s Rozgar Yojana (PMRY) and Rural Employment Generation Programme
(REGP), for the generation of employment opportunities through the establishment of micro
enterprises in rural as well as urban areas. PMEGP will be a central sector scheme to be administered
by the Ministry of Micro, Small and Medium Enterprises (MoMSME). The Khadi and Village
Industries Commission (KVIC) will implement the scheme. Its objectives are:
To generate employment opportunities in rural as well as urban areas of the country through
the setting up of new self-employment ventures/projects/micro-enterprises.
To bring together widely dispersed traditional artisans/rural and urban unemployed youth
and give them self-employment opportunities to the maximum extent possible, at their
place.
To provide continuous and sustainable employment to a large segment of traditional and
prospective artisans and rural and urban unemployed youth in the country, to help arrest the
migration of rural youth to urban areas.
To increase the wage-earning capacity of artisans and contribute to the growth rate of rural
and urban employment.
The guidelines mention inclusion of PwDs as follows:
Categories of beneficiaries under PMEGP - General Category and Special including SC/ST/OBC/
Minorities/Women, Ex-servicemen, Physically handicapped, NER, Hill and Border areas, etc.
The Institutions/Production Cooperative Societies/Trusts specifically registered as such and SC/ST/
OBC/Women/Physically Handicapped/Ex-Servicemen and Minority Institutions with necessary
provisions in the bye-laws to that effect are eligible for Margin Money (subsidy) for the special
categories.

Livelihood Analysis of Vulnerable Groups (Differently Abled) under MGNREGS
14
What is the impact of MGNREGA work on the incomes and livelihoods of the poor and
vulnerable households?
Studies reveal that MGNREGA has helped rural households (HHs) in a sustained manner to
smooth consumption between the agricultural peak season and lean season. Klonner and Oldiges
(2013, 2014) report in their research that the poverty gap between Phase I and Phase II districts has
decreased. Among SC/ST households, both Phase 1 and Phase 2 districts experienced a decline in
inequality with the effect being more for Phase 1 districts. The authors used a fuzzy regression
discontinuity design to estimate programme effects using NSSO data and also presented a detailed
descriptive analysis from 2003 to 2011. They constructed a district-wise panel and found that while
there were no statistically significant differences for all rural households, the vulnerable households as
a sub-set showed statistically significant large effects on consumption and consumption-based poverty
measures for the agriculture lean season while no such effect was revealed in the agriculture peak
season. This demonstrates two significant results: Firstly, the poor and the vulnerable are indeed
‘targeting’ themselves and secondly, the programme is smoothening consumption for these
households. Therefore, the main conclusion of their study is that the programme has been successful
not only in increasing consumption levels of particularly vulnerable HHs but also in reducing these
HHs’ exposure to the risk of seasonal drops in consumption. The pattern of these effects is consistent
with the pattern of MGNREGS expenditure.
According to the authors, the Act appears to have successfully delivered on its two goals,
improving livelihood security and reaching out to most vulnerable rural inhabitants. They substantiate
their findings with similar analysis by Ravi and Engler (2009), which used a smaller dataset but a
robust analysis; Liu and Deninger (2013) who used a panel data for 4,000 households and Bose (2013)
who also used NSS data, but the DiD method for analysis. Further, some research focused on the
effect of rainfall deficit on participation in MGNREGA and found a negative relationship between the
amount of deficit in the rainfall and MGNREGA participation, concluding that MGNREGA has
been used by farmers for income smoothing.
Similarly, in a search study conducted in the coastal areas of Andhra Pradesh, Johnson (2009)
used secondary data provided by the Andhra Pradesh government to estimate the responsiveness of
programme participation to changes in rainfall. In order to control other potential direct impacts of
rainfall on participation, the author analysed the impact of rainfall in each agricultural season on
NREGA participation in the following non-agricultural (lean) season, the assumption being that
NREGA participation in the lean season would increase after a particularly bad agricultural season.
Regression estimates of the impact of rainfall (as measured by different weather indicators) on wages

Livelihood Analysis of Vulnerable Groups (Differently Abled) under MGNREGS
15
per working-age adult were done. The findings support the conclusion from other studies that non-
normative rainfall during the agricultural season leads to higher overall participation in NREGA
programmes during the following lean season and vice versa; good weather leads to lower
participation levels. This study too confirmed the impact of MGNREGS as a risk-mitigating
mechanism for households.
In a robust econometric analysis, Zimmerman (2014) showed the labour-market impacts of
MGNREGS. Firstly, in a household time allocation model, the author shows that the flexibility in
demand allows households to use the programme ‘both as an alternative form of employment and as a
safety net after economic shocks.’ The author used a regression-discontinuity design to estimate the
programme’s effects to suggest that MGNREGS is used more as a safety net rather than as an
alternative form of employment. The author estimated a base model which did not include
MGNREGA and later introduced MGNREGA in the second model specification. However, it must
be noted that the presence of a safety net influenced a household’s decision on several parameters.
The author concludes, “Overall, these results suggest that MGNREGA is ineffective at raising private-
sector casual wages through increased competitiveness in rural labour markets or better enforcement
of minimum wage laws. The programme seems to work better at providing a safety net for rural
populations.” That MGNREGS works as a safety net has been addressed with different implications.
Evidence shows that MGNREGS, as a safety net, has affected cropping decisions, alternative
employments and an increase in the productivity of the land.
A study by the independent research consulting organisation, Sambodhi Research Organisation,
was primarily undertaken to evaluate the effects of the creation of assets on lands of small and
marginal farmers, SCs/STs and IAY beneficiaries in the six States of Andhra Pradesh, Chhattisgarh,
Madhya Pradesh, Odisha, Rajasthan and Uttar Pradesh. The study not only confirmed that
MGNREGA work on individual beneficiaries’ lands has had a significant impact on improving the
quality of their land and generating extra incomes but that this has also aided small and marginal
farmers in moving to dual and multi-cropping and in creating alternative sources of livelihood for
these households. Similar evidence is provided by Gehreke (2013), who demonstrates that households
with access to MGNREGA found an increase in the share of inputs allocated to more profitable
crops. According to the author, MGNREGA, by enabling a shift to high risk-profitable crops, raised
incomes of small marginal farmers.
There have been frequent references in popular media and in perceptions that MGNREGS has
led to the casualisation of labour and non-farm work. Based on multivariate analyses, Jatav and Sen
(2013) report two major findings. One, that though non-farm employment in rural areas is primarily

Livelihood Analysis of Vulnerable Groups (Differently Abled) under MGNREGS
16
distress-driven, there are some significant entry barriers for rural workers in the non-farm sector in
terms of education, age and gender. The authors emphasise the importance of the scheme and
indicate that the crisis of joblessness in rural labour markets would have been more acute without it.
Liu and Deninger (2013; presented in 2014) looked at the short and medium-term impacts of
MGNREGS employment on various development indicators in Andhra Pradesh, which is widely
credited with a good performance record. As the authors acknowledge, this clearly shows the potential
of MGNREGA if implemented with administrative commitment. The authors find that in the short-
term, participants’ caloric and protein intakes increased, indicating that one of the most important
immediate effects of MGNREGS employment was an improvement in participants’ food security and
nutrition. Medium-term effects, on the other hand, seemed to centre on more generalised
investments, particularly the accumulation of land. Overall, participants from SC and ST households
as well as those who relied on casual labour benefited the most from MGNREGS employment.
Interestingly, the authors report that, “We also do not find evidence that the MGNREGS program
discourages other forms of employment, as has been suggested by the program’s critics. We find that
in Andhra Pradesh, increased expenditures on the MGNREGS program translate almost directly into
an increase in additional employment opportunities.”
As such, not many studies are focused on the issue of vulnerable groups (differently abled
persons) in terms of accessing the livelihood opportunities in the context of Mahatma Gandhi
NREGA. Hence, the study has been taken up to address the issues and concerns of the differently
abled persons.

Livelihood Analysis of Vulnerable Groups (Differently Abled) under MGNREGS
17
CHAPTER – II
PROFILE OF STUDY AREA AND METHODOLOGY
In this chapter, the procedure adopted in the identification of State, districts and Gram
Panchayat and methodology followed are presented in detail.
According to the Census 2001, there were approximately 22 million persons with disabilities in
India who constituted 2.13 per cent of the total population. They include persons with visual, hearing,
speech, locomotor and mental disabilities. However, according to the World Bank Report 2009,
approximately 6 per cent of the Indian population has some form of disability. To top it up, the
World Health Organisation (WHO) figure is started at 10 per cent of the total population.
In India, out of the 121 crore population (As per the Census 2011), 2.68 crore are differently
abled (2.21 per cent of the total population) (Table 2.1). Among the differently abled population, 56
per cent (1.5 crore) are males and 44 per cent (1.18 crore) are females. In the total population, the
male and female populations are 51 per cent and 49 per cent, respectively. A majority (69 per cent) of
the differently abled population resided in rural areas (1.86 crore persons in rural areas and .81 per
cent in urban areas). In the case of the total population also, 69 per cent are from the rural area while
the remaining 31 per cent resided in urban areas.
Table 2.1: Differently abled population in India - Census 2011
Social Group Population, India 2011
(in crores) Differently abled persons, India 2011 (in
crores)
Persons Males Females Persons Males Females
Total 121.08 62.32 58.76 2.68 1.5 1.18
SC 20.14 10.35 9.79 0.49 0.28 0.215
ST 10.45 5.25 5.20 0.21 0.114 0.10
Other 90.49 46.72 43.77 1.97 1.11 0.87
Source: Disabled persons in India – A statistical profile 2016 (www.mospi.gov.in)
Table 2.2: Percentage of proportion of differently abled population by social total population of India - Census 2011
Social Group Share of Differently
abled persons in total population
Share of Males Share of Females
Total 2.21 2.41 2.01
SC 2.45 2.68 2.2
ST 2.05 2.18 1.92
Other than SC/ ST 2.18 2.37 1.98
Source: Disabled persons in India – A statistical profile 2016 (www.mospi.gov.in)

Livelihood Analysis of Vulnerable Groups (Differently Abled) under MGNREGS
18
The percentage of the differently abled population among males and females is 2.41 per
cent and 2.01 per cent, respectively. At all-India level as well as disaggregated by various social
groups, the proportion of differently abled in the corresponding population is higher for males
than females. Pursuant of Table 2.2, it is observed that the share of differently abled in male
(2.68 per cent) and female (2.2 per cent) population is higher among the Scheduled Castes (SC)
than the Scheduled Tribes (ST) and Other than SC/ST (Refer Figure 2.1).
India has a total of 2.6 crore differently abled population of which, the highest differently abled
is in the category of speech (20.3 per cent) followed by hearing (18.9 per cent), seeing (18.8 per cent)
and mental illness (18.4 per cent). However, the share of mental illness (2.7 per cent) and mental
retardation (5.6 per cent) is comparatively low. (Table: 2.3)
In the case of Tripura district, disability recorded under category of any other (18.4 per cent),
hearing (18.2 per cent), movement (18.2 per cent) and seeing (16.8 per cent) is highest. The lowest
disability is noticed in mental illness (4.5 per cent) followed by mental retardation (6.7 per cent) and
speech (7.1 per cent). The order of preference of differently abled under the categories of hearing,
speech and movement can achieve the desired task under MGNREGS rather than the other
categories of differently abled.
Dhalai is the study district identified for examining the provisions provided to the differently
abled population in Tripura State. It is estimated that around five per cent of the population in rural
areas will fall into the category of differently abled and this group is one of the most deprived and
vulnerable. Depending upon the demand for the work by a differently abled person/special category
persons, works could be opened specifically for the differently abled, and in the case of large GPs with
a substantial population of differently abled and vulnerable, separate works could be opened at the
habitation level (Operational Guidelines 2013, MGNREGS). Therefore, this has led to the

Livelihood Analysis of Vulnerable Groups (Differently Abled) under MGNREGS
19
compilation of data on the percentage of differently abled persons who participated in the
MGNREGS works and the website of MGNREGS provides that the percentage of differently abled
who participated over the past four years in India is only 0.64 and the States in which highest
percentage of differently abled persons who participated in MGNREGS over the past four years are
Andhra Pradesh (1.3 per cent) and Tripura (1.16), respectively. As against 5 per cent differently abled
rural population in India, only 0.64 per cent differently abled have participated in MGNREGS.
Therefore, it is felt necessary to study the profile of wage employment among differently abled
persons in terms of minimum wage rate, 100 days’ employment, types of works assigned, delay in
11 J&K 361153 66448 74096 18681 58137 16724 15669 66957 44441
12 Jharkhand 769980 180721 165861 46684 147892 37458 20157 11237
2 58835
13 Karnataka 1324205 264170 235691 90741 271982 93974 20913 24672
1 100013
14 Kerala 761843 115513 105366 41346 171630 65709 66915 96131 99233
15 Madhya Pradesh
1551931 270751 267361 69324 404738 77803 39513 29503
5 127406
S. No.
State
No.of disabled popula-tion as
per Census
2011
No. of Differently abled Persons (Disability-wise)
Seeing Hear-
ing Speech
Move-ment
Mental Retarda-
tion
Mental Illness
Any Other
Multiple Disabil-
ity
1 Andhra Pradesh
2266607 398144 334292 219543 538934 132380 43169 40977
5 190370
2 Arunachal Pradesh
26734 5652 8127 1538 3235 1264 631 3878 2409
3 Assam 480065 80553 101577 39750 76007 26374 18819 87461 49524
4 Bihar 2331009 549080 572163 170845 369577 89251 37521 43172
8 110844
5 Chhattis-garh
624937 111169 92315 28262 190328 33171 20832 76903 71957
6 Delhi 234882 30124 34499 15094 67383 16338 10046 37013 24385
7 Goa 33012 4964 5347 5272 5578 1817 1675 5784 2575
8 Gujarat 1092302 214150 190675 60332 245879 66393 42037 19772
5 75111
9 Haryana 546374 82702 115527 21787 116026 30070 16191 11682
1 47250
10 Himachal Pradesh
155316 26076 26700 8278 32550 8986 5166 29024 18536
16 Maharash-tra
2963392 574052 473271 473610 548418 160209 58753 51073
6 164343
Table 2.3: Number of differently abled persons (disability-wise) as per Census 2011

Livelihood Analysis of Vulnerable Groups (Differently Abled) under MGNREGS
20
17 Manipur 54110 18226 10984 2504 5093 4506 1405 8050 3342
18 Mizoram 15160 2035 3354 1163 1976 1585 1050 1914 2083
19 Meghalaya 44317 6980 12353 2707 5312 2332 2340 8717 3576
20 Nagaland 29631 4150 8940 2294 3828 1250 995 4838 3336
21 Odisha 1244402 263799 237858 68517 259899 72399 42837 172881 126212
22 Punjab 654063 82199 146696 24549 130044 45070 21925 165607 37973
23 Rajasthan 1563694 314618 218873 69484 427364 81389 41047 199696 211223
24 Sikkim 18187 2772 5343 1577 2067 516 513 2459 2940
25 Tamil Nadu 1179963 127405 220241 80077 287241 100847 32964 238392 92796
26 Tripura 64346 10828 11695 4567 11707 4307 2909 11825 6508
27 Uttar Pradesh
4157514 763988 1027835 266586 677713 181342 76603 946436 217011
28 Uttarakhand 185272 29107 37681 12348 36996 11450 6443 30723 20524
29 West Bengal 2017406 424473 315192 147336 322945 136523 71515 402921 196501
30 A&N Islands 6660 1084 1219 531 1593 294 364 838 737
31 Chandigarh 14796 1774 2475 961 3815 1090 756 2583 1342
32 Daman & Diu
2196 382 309 149 620 176 89 264 207
33 D&N Haveli 3294 429 715 201 682 180 115 483 489
34 Lakshadweep 1615 337 224 73 361 112 96 183 229
35 Puducherry 30189 3608 6152 1824 9054 2335 853 4137 2226
Total 26810557 5032463 5071007 1998535 5436604 1505624 722826 4927011 2116487
Source: http://disabilityaffairs.gov.in
In total, there are 8202 differently abled in the study district. The highest number of differently
abled persons was noticed under the ortho category (3540) followed by locomotor (860). A similar
phenomenon was noticed in two blocks, i.e. Chawmanu and Manu blocks. (Table-2.5)
Table 2.4: No. of differently abled persons (block-wise)
Total dis-abled population as per the Social Wel-fare De-partment
No. of Differently Abled Persons (Disability-wise)
Visual Hearing Mental Ortho Multiple Mental Illness
Loco-motor
Hearing Impair-ment
Blind-ness
Low Vision
Chaw-manu 632 43 31 28 374 19 3 50 57 25 2
Manu 1697 189 183 140 656 71 10 191 147 89 21
Dhalai 8202 851 753 634 3540 368 63 860 644 385 104
State

Livelihood Analysis of Vulnerable Groups (Differently Abled) under MGNREGS
21
Based on the secondary data available on the website (www.nrega.nic.in) for four years (i.e. 2012
-13 to 2015-16), the employment provided for differently abled under MGNREGS was analysed and
presented in Table 2.5. Table 2.5 reveals that out of 30 States and a few Union Territories, five States
have provided them highest per cent of employment. Of these, States like Gujarat, Telangana and
West Bengal have also provided them considerable per cent of employment. However, consistency in
employing the differently abled is noticed in States like Andhra Pradesh and Tripura. Besides the
higher percentage of work provided to them, other factors such as consistency, difficult terrain condi-
tions and several studies conducted were also considered in identifying Tripura as the study area.
Hence, the study was carried out in Tripura, having the highest percentage of differently abled persons
participated in MGNREGS over the past four years, i.e. 1.16 (next to Andhra Pradesh 1.30).
Table 2.5: Percentage of differently abled persons employed in different States and Union Territories under MGNREGS
S. No.
State/UT Percentage of differently abled persons worked
2012-13 2013-14 2014-15 2015-16 1 Andhra Pradesh 1.24 1.35 1.35 1.27 2 Arunachal Pradesh 0.05 0.05 0.05 0.05 3 Assam 0.15 0.16 0.12 0.18 4 Bihar 0.19 0.18 0.2 0.16 5 Chhattisgarh 0.48 0.49 0.47 0.53 6 Goa 0 0.02 0.03 0.03 7 Gujarat 1.22 1.09 0.85 0.76 8 Haryana 0.06 0.07 0.07 0.08 9 Himachal Pradesh 0.27 0.24 0.21 0.23 10 Jammu and Kashmir 0.68 0.73 0.43 0.61 11 Jharkhand 0.28 0.29 0.35 0.35 12 Karnataka 0.18 0.18 0.18 0.17 13 Kerala 0.1 0.11 0.12 0.12 14 Madhya Pradesh 0.14 0.56 0.66 0.85 15 Maharashtra 0.74 0.89 0.9 0.84 16 Manipur 0.12 0.19 0.18 0.18 17 Meghalaya 0.05 0.05 0.05 0.05 18 Mizoram 0.04 0.04 0.04 0.05 19 Nagaland 0.02 0.02 0.02 0.02 20 Odisha 0.15 0.14 0.16 0.17 21 Punjab 0.07 0.11 0.12 0.13 22 Rajasthan 0.06 0.06 0.08 0.11 23 Sikkim 0.12 0.14 0.14 0.17 24 Tamil Nadu 0.71 0.93 0.95 0.88 25 Telangana 0 0 1.42 1.4 26 Tripura 1.21 1.17 1.16 1.11 27 Uttar Pradesh 0.18 0.19 0.19 0.2 28 Uttarakhand 0.09 0.1 0.11 0.13 29 West Bengal 1.21 1.21 1.07 1.01 30 Andaman and Nicobar Islands 0.31 0.28 0.27 0.37 31 Lakshadweep 0.72 0.64 2.03 2.7 32 Puducherry 0.17 0.07 0.19 0.08 33 India 0.57 0.66 0.67 0.65

Livelihood Analysis of Vulnerable Groups (Differently Abled) under MGNREGS
22
Similar criteria were followed in the selection of a district and two blocks. From the Dhalai
district, two blocks such as Chawmanu and Manu were selected and from each block, adequate
number of differently abled persons was selected as the participation of this category of the vulnerable
group was less. In pursuance of Table 2.6, the number of differently abled persons registered in
MGNREGS is highest in Manu block (784 out of 1500 differently abled population) followed by
Chawmanu (589 out of 1500 differently abled population) block. In Chawmanu block, only 50 per
cent of the differently abled job cardholders have got employment opportunities under MGNREGS
work while in Manu block, only 52 per cent of the job cardholders could work in MGNREGS project.
The study covered 100 PwD beneficiaries of MGNREGS covering an average of 50 persons per
block. Besides, 20 non-beneficiary respondents were also interviewed from the two blocks.
Table 2.6: Status of MGNREGS in Dhalai district: Person-days generated in FY 2012-13 to 2016-17 for differently abled persons
Block 2012-13 2013-14 2014-15 2015-16 2016-17 Cumulative HHs
(2012-13 to 2016-17)
Ambassa 74 67 13 12 13 179
Chawmanu 334 368 361 294 258 1615 Dumburnagar 50 115 73 115 137 490
Durgachowmuhani 36 33 37 46 52 204
Ganganagar 4 0 0 4 Manu 521 485 528 413 448 2395 Raishyabari 0 0 34 41 40 115 Salema 202 188 178 185 181 934 Total 1217 1256 1228 1106 1129 5936
Source: www.nrega.nic.in
Instruments used to achieve the objectives:
A pre-structured schedule was developed to collect the primary data from the vulnerable groups
and focus group discussions. Secondary data were collected from the official records available with
District Programme Coordinator, Programme Officer, and Gram Panchayat, etc. Copy of schedule is
placed as Annex – I.
Profile of the State:
Tripura is the third smallest State in the country next to Goa and Sikkim, having a geographical
area of 10,491 km2. The State has eight districts and 58 blocks. As per the Census 2011, the State has
0.3 per cent (36.71 lakh) of the country’s population. Around 75 per cent of the population resides in
rural areas. The Scheduled Tribes and Scheduled Castes represent, respectively, 32 per cent and

Livelihood Analysis of Vulnerable Groups (Differently Abled) under MGNREGS
23
around 18 per cent of the total population.
The sex ratio is 960 (females per 1000
males) while the national ratio is only 943.
The literacy rate of the State was around 88
per cent and as per the latest report is
around 97 per cent (2016). The temperature
of the State ranges from 7OC during winter
and 20-36OC in summer. Forests cover
more than half of the geographical area, in
which bamboo and cane tracts are com-
mon. Due to its geographical isolation, eco-
nomic progress in the State is hindered.
Poverty and unemployment continue to
plague Tripura, which has limited infra-
structure and slow industrialisation.
Tripura government’s independent assessment based on consumption distribution data reported that
in 2001, 55 per cent of the rural population was below the poverty line.
Tripura is an agrarian State with more than half of the population dependent on agriculture and
allied activities, although the service sector is the largest contributor to the State’s GDP. As per SECC
data, the State records 2.11 lakh landless casual labourers. Due to hilly terrain and forest cover, only 27
per cent of the land is available for cultivation. Rice occupies 91 per cent of the cropped area followed
by potato, sugarcane, mesta, pulses and jute crop. Traditionally, most of the indigenous population
practised Jhum method (a type of slash and burn) of cultivation. However, dependency on Jhum is
declining over the years (https//wikipedia.org).
District profile:
Located in the north-eastern part of Tripura, the district covers an area of about 2426 sq km. It
is mainly located between two hills, namely Atharamura Range and Sakhan Range. More than 70 per
cent of the area is hilly and forest-covered.
The terrain is mostly undulating and hilly with small water streams (chharas), rivers and fertile
valleys intervening. Major rivers originating from Dhalai are Dhalai, Khowai, Gomati and Manu.
Major hills are Atharamura, Longtharai, Kalajhari and part of Sakhan. The district headquarters at
Ambassa is located at a distance of about 85 km from the State capital Agartala.

Livelihood Analysis of Vulnerable Groups (Differently Abled) under MGNREGS
24
It is connected through National Highway (NH-44) and takes around two-three hours to reach
the district headquarters from Agartala. In January 2015, broad gauge rail link has been established at
Ambassa. The district is bordered by Bangladesh on the northern and southern sides.
The district has tropical climate with hot and humid summers, a prolonged rainy season and
warm winters. Maximum temperature in summers and winters is 36 degrees Celsius and 28 degrees
Celsius, respectively. The minimum temperature in summers and winters is 17 degreesCelsius and 5.3
degrees Celsius, respectively.
Demography:
Table 2.7: Important demographic indicators of the district as per Census 2011
S.No. PARTICULARS UNIT DHALAI TRIPURA INDIA
1. Area Sq Km 2426 10,491 3,28,72,40
2. Total Population Lakhs 3.78 36.71 12,101
3. Male Lakhs 1.95 18.71 62,372
4. Female Lakhs 1.84 17.99 49,656
5. Sex Ratio Per 1000 944 960 943
6. Population Density Per Sq Km 157 350 382
7.
*Literacy Rate % 96.79 96.82 74.04
Male % 96.91 97.93 82.14
Female % 95.69 95.71 65.46
8. SC Population(2011) % 16.31 16 16.2
9. ST Population (2011) % 55.68 31 8.2
10. Urban Population % 6 18.24 27.8
11. Rural Population % 94 81.76 72.2
*Literacy rates of Tripura are based upon the evaluation undertaken by the Indian Statistical Institute in September 2014, whereas the figures for India are based upon Census 2011. Major Tribes:
As it is evident that the district is largely a tribal district with 56 per cent tribal population, the
major tribes are Tripuri, Reang, Kuki (Halam/Darlong/Hrangkhawl), Koloiand Chakma. Reangs are
one of the primitive tribal groups (PTG) as classified by the Government of India. Tribals mostly
reside in the remote hilly forested areas with the fertile valleys being occupied by the non-tribals
(mostly Bengalis).

Livelihood Analysis of Vulnerable Groups (Differently Abled) under MGNREGS
25
Economy:
Socio-economically, it is the most backward district of the State. In 2006, the Ministry of
Panchayati Raj included Dhalai in the list of the country's 250 most backward districts (out of a total
of 640). The strengths of the district are its huge natural resources, fertile land, conducive climate,
adequate and well-spread rainfall, high literacy rate and strategic location as the district being well
connected by the National Highway (NH 44). If all these resources are utilised properly, rapid
development can be achieved. But for the lack of required infrastructure and inaccessibility of many
tribal areas, the district is still very backward. The main factors for the backwardness of the district can
be summarised as follows:
Poor infrastructure
Poor connectivity and communication facilities
Lack of stable economic activities
Poor irrigation facilities
Poor marketing facilities
Poor health and sanitation facilities
Livelihood profile of the district:
As it is evident from the
above diagram, an
overwhelming 76 per cent of
the workers are dependent on
agriculture for their livelihood.
The practice of Jhum
cultivation (shifting
cultivation) continues in many
parts of the district by the
tribals residing in the deeply
forested hills. However, in
recent times, due to the effects
of the efforts of State Government and district administration like granting pattas to hardcoreJhumias
under RoFR Act, 2006, undertaking plantation works like horticulture, sericulture, etc., the Jhum
cultivation has decreased to a large extent in the district. The fertile valleys are mostly occupied by the
non-tribals, mostly Bengalis and are the primary centres of economic activity in the district. In Dhalai,
25 per cent of the households are in below poverty line (BPL) category.

Livelihood Analysis of Vulnerable Groups (Differently Abled) under MGNREGS
26
Mahatma Gandhi National Rural Employment Guarantee Scheme (MGNREGS) in Tripura: The programme is being implemented in the State as the National Rural Employment
Guarantee Scheme Tripura (NREGS Tripura). The State Government has framed the Tripura Rural
Employment Guarantee Scheme, 2006 (TREGS, 2006) and the Tripura Rural Employment Guarantee
Rules, 2006 (TREGR, 2006) under that of the NREG Act.
Table 2.8: Performance of MGNREGS in Tripura State
Financial Year 2016-2017 2015-2016 2014-2015 2013-2014
Total HHs provided employment (in lakh) 5.77 5.70 5.82 5.97
Total Person-days (in lakh) 461.18 538.75 511.76 523.26
SC% 16.59 17.32 17.47 17.68
ST% 45.98 43.32 42.42 42.25
Women % 49.04 50.11 47.42 46.57
HHs completed 100 days 1,16,620 3,04,864 251,444 285,699
Average person-days per HH 79.88 94.46 87.96 87.67
Table 2.9: District-wise eEmployment Days provided under MGNREGS at the State level
Districts 2012-13 2013-14 2014-15 2015-16 2012-13 2013-
14 2014-15 2015-16
(in Lakhs) (in Percentage)
Dhalai 68.61 67.07 74.65 72.85. 13.23 12.82 14.59 13.52
Gomati 74.57 74.45 76.81 78.78 14.38 14.23 15.01 14.62
Khowai 55.81 55.80 56.49 57.78 10.76 10.66 11.04 10.72
North Tripura 48.70 50.89 50.30 52.31 9.39 9.73 9.83 9.71
Sepahijala 72.12 75.04 58.03 71.31 13.91 14.34 11.34 13.24
South Tripura 69.14 80.13 77.25 80.77 13.34 15.31 15.09 14.99
Unakoti 46.61 40.32 39.23 42.95 8.99 7.71 7.67 7.97
West Tripura 82.93 79.55 78.98 81.98 15.99 15.20 15.43 15.22
Total 518.51 523.26 511.75 538.75 100.00 100.00 100.00 100.00
Source: www.nrega.nic.in.

Livelihood Analysis of Vulnerable Groups (Differently Abled) under MGNREGS
27
Chawmanu Block
Chawmanu Rural Development block established in the year 1969is one of the oldest
administrative blocks in Tripura. It is dedicated to the overall development of the local area. In
Chawmanu, 94 per cent of the population belongs to Mongoloid Scheduled Tribes comprising Reang,
Chakma and Tripuri communities. It is 17km away from the sub-divisional headquarters (SDM,
LongtaraiValley). Chawmanu is bounded by Manu towards the north, Ambassa towards the west,
Dasda and Jampui Hills towards the east. Khowai, Kailashahar, Dharmanagarand Udaipur are the
cities near to Chawmanu. It has an elevation of 80m (altitude). Ambassa, Mamit, Unakoti, Kailasharar
and Aizawl are nearby popular tourist destinations.
Agroclimatic condition of Chawmanu:
Summer is not warm in Chawmanu where the maximum day temperature ranges from 24o C to
37o C. The average temperature in the months of January, February, March, April and May is 15o C,
20o C, 25o C, 27o Cand 26oC, respectively.

Livelihood Analysis of Vulnerable Groups (Differently Abled) under MGNREGS
28
Table 2.10: Chawmanu block: Category-wise population of Gram Panchayats
S. Name of No. of Families No. of persons
No.
GP/Village ST SC OBC Mi-
nority UR Total ST SC OBC
Mi-nority
UR To-
tal
1 2 3 4 5 6 7 8 10 11 12 13 14
1 Chaltacherra 600 0 24 0 0 624 3451 0 114 0 0 3565
2 Debacherra 385 0 0 0 0 385 2159 0 0 0 0 2159
3 Durgacherra 341 9 131 0 0 481 2017 47 478 0 0 2542
4 East Gobindabari
428 0 0 0 0 428 2367 0 0 0 0 2367
5 East Malidhar 401 0 0 0 0 401 2077 0 0 0 0 2077
6 Makarcherra 429 29 22 5 49 534 2047 115 97 19 237 2515
7 Manikpur 633 0 0 0 0 633 2653 0 0 0 0 2653
8 Natin Manu 574 0 0 0 0 574 2736 0 0 0 0 2736
9 Paschim Chawmanu
244 24 42 0 261 571 1288 116 195 0 1319 2918
10 Purba Chawmanu
296 0 0 0 0 296 1548 0 0 0 0 1548
11 Rajdhar 578 0 0 0 0 578 2850 0 0 0 0 2850
12 Uttar Longtharai
449 6 2 28 0 485 2712 24 8 124 0 2868
13 West Gobindabari
720 0 0 0 0 720 3691 0 0 0 0 3691
14 West Malidhar 406 0 0 0 0 406 2560 0 0 0 0 2560
TOTAL ADC VILLAGE :
6484 68 221 33 310 7116 34156 302 892 143 1556 37049
Source: http://documents.gov.in/TR/2149.pdf.
Manu block
Manu block was established as Rural Development Block in the year 1994, bifurcating 26 Gram
Panchayats from Chawmanu RD block under Longtharai Valley subdivision of Dhalai district in
Tripura. The geographical area of this block is bordered by Kumarghat block in the north, Chawmanu
in the south, Kanchanpur sub-division in the east and the famous Longathrai Range to its west. The
area of this block is 278.27 sq. km.
The famous Manu River flows from south to north direction of this block making the land on
its banks fertile. The block experiences the following seasons:
Summer (March to May)
Monsoon (June to September)
Post-Monsoon (October and November)
Winter (December to February)

Livelihood Analysis of Vulnerable Groups (Differently Abled) under MGNREGS
29
Table 2.11: Manu block: Category-wise population of Gram Panchayats
S. No
Name of GP/Village
No. of Families No. of persons
ST SC O
BC Mi-
nority UR
Total ST SC OBC
Mi-norit
UR Total
1 Battala 465 0 0 0 0 465 2296 0 0 0 0 2296
2 Chailengtha 227 242 359 17 141 986 1207 976 1537 79 584 4383
3 ChichingCherra 473 25 0 0 0 498 2223 126 0 0 0 2349
4 Dakshin Dhumacherra
549 61 56 22 1 689 2697 266 270 177 4 3414
5 Dalucherra 489 0 0 0 0 489 2347 0 0 0 0 2347 6 Demcherra 363 0 0 0 0 363 2243 0 0 0 0 2243 7 Deo R.F. 527 0 0 0 0 527 2655 0 0 0 0 2655 8 Gainama 357 0 338 25 0 720 1561 0 1066 130 0 2757 9 Jamircherra 976 65 17 0 71 1129 5124 347 81 0 319 5871
10 Kanchancherra 617 33 49 1 17 717 2935 131 206 7 62 3341
11 Karaticherra 542 24 2 3 69 640 2084 108 10 21 235 2458 12 Labancherra 617 0 0 0 0 617 3068 0 0 0 0 3068 13 Lalcherra 1004 0 2 0 1 1007 4561 0 14 0 5 4580
14 Longtharai R.F. 447 0 0 0 0 447 2015 0 0 0 0 2015
15 Mainama 751 14 344 24 46 1179 3627 88 2057 150 230 6152
16 Manu 368 586 205 5 387 1551 1765 2807 962 24 1650
7208
17 Naitang Cherra 449 46 94 0 30 619 2117 205 376 0 275 2973
18 Nalkata 334 179 67 0 102 682 1570 789 312 0 409 3080
19 Paschim Karam-cherra
155 115 95 0 92 457 716 411 380 0 379 1886
20 Paschi Kathalcherra
561 5 100 0 0 666 2780 28 566 0 0 3374
21 Paschim Masli 259 144 54 0 94 551 1277 739 247 0 433 2696
22 Purba Karamcherra
594 0 0 0 0 594 2907 0 0 0 0 2907
23 Purba Kathalcherra
401 77 198 1 4 681 2033 396 1026 5 25 3485
24 Purba Masli 61 429 178 0 222 890 306 1839 775 0 1020
3940
25 Sindhukumar Para
715 15 2 1 0 733 3216 74 12 11 0 3313
26 Uttar Dhumacherra
683 34 0 15 127 859 3436 88 0 99 632 4255
Total ADC Village : 1298
4 2094
2160
114 1404
18756
62766
9418 9897 703 6262
89046
Source: http://documents.gov.in/TR/2149.pdf.

Livelihood Analysis of Vulnerable Groups (Differently Abled) under MGNREGS
30
The block also receives a good amount of rainfall every year. The average annual rainfall of this
area is about 260 cm. Manu RD block has the distinction in terms of experimenting a wide range of
rural development programmes and massive allocation of resources ever since the establishment of
this block. While some of the programmes have made a significant impact on the improvement of the
quality of life of rural people, others have met with little success. In light of this experimentation, the
priority sector of development has critically been examined while preparing the planning. Rural con-
nectivity, agriculture and irrigation, education, supply of safe drinking water, pisciculture, ARD and
electrification are the priorities for taking up the development activities of this block.

Livelihood Analysis of Vulnerable Groups (Differently Abled) under MGNREGS
31
CHAPTER – III
SUITABLE WORK FOR DIFFERENTLY ABLED PERSONS UNDER MGNREGS
The disabled or differently abled persons defined in the Persons with Disabilities (Equal Oppor-
tunities, Protection of Rights and Full Participation) Act, 1995 (1 of 1996) as persons with disabilities,
the severity of which is 40 per cent and above would be considered as a special category of vulnerable
persons for the purposes of MGNREGA. The disabled persons as defined in the National Trust for
Welfare of Persons with Autism Cerebral Palsy, Mental Retardation and Multiple Disabilities Act,
1999 (44 of 1999) are also to be considered as disabled for their inclusion in MGNREGA.
Since this category of people is differently abled, special conditions have to be created to facili-
tate their inclusion in MGNREGA. It is estimated that around five per cent of the population in rural
areas will fall into the category of differently abled and this group is one of the most deprived and vul-
nerable.
Identification of works: Each State government will identify specific works, which can be done by
the differently abled and vulnerable persons. In a village, different categories of persons with disabili-
ties will be organised to come together as a fixed group to accomplish the works proposed for them
under the Scheme, in a way that makes it possible for them to exercise their choice. On no grounds
should the differently abled and vulnerable persons be paid lower wages as compared to other
persons employed in MGNREGA works.
Mobilisation: The Coordinator (Vulnerable Groups) can utilise the services of a facilitator/mate
from among the differently abled to mobilise the differently abled and vulnerable persons for
MGNREGA work. This facilitator will function as a mate and will be responsible among other things,
for bringing all the differently abled persons to the worksite. Efforts should be made to mobilise the
differently abled and vulnerable to groups. Arrangements should also be made to orient the persons
with disabilities to a suitable job as and when necessary. However, no individual with a disability
would be denied work where efforts to form a ‘group’ does not succeed.
Works: Depending upon the demand for the work by a differently abled person/special category per-
son, works could be opened specifically for them and in the case of large GPs with a substantial
population of differently abled and vulnerable, separate works could be opened at the habita-
tion level. Efforts should be taken to ensure that the special category persons are given work close to
their place of residence so that they need not travel long distances for MGNREGA works.

Livelihood Analysis of Vulnerable Groups (Differently Abled) under MGNREGS
32
Engaging differently abled and vulnerable persons in other works: The differently abled persons
should be given preference for appointment as mates for MGNREGA works and as workers
for providing drinking water, to manage crèches, etc., at the worksites.
Adaptation of tools and equipment/facilities at workplaces: The Coordinator (Vulnerable
Groups), in consultation with the workers with disabilities, will facilitate necessary modifications to
the existing tools/equipment. The Coordinator (Vulnerable Groups) will then mobilise and or identify
suitable institutions for making modified tools/assistive devices or making adaptation to the general
tools/equipment being used in the worksite. The workers with disabilities may be provided with
modified tools/assistive devices or modified general tools/equipment required for the work.
Treating Persons with Disabilities with respect: The persons with disabilities, at work-sites, shall
be called by their names alone. Similarly, their name, as well as their surnames, shall be properly regis-
tered in the job cards. The authorities shall take proper measures to ensure a stigma-free environment
at the workplace so that the workers with disabilities shall not be ill-treated/looked down upon or face
any form of discrimination (using abusive language, calling them with their disability name, use of
denigrating language, insulting them or hurting their feelings in any form) and the Coordinator
(Vulnerable Groups) shall organise awareness programmes to ensure the same.
Monitoring and Timeframe: There should be a special drive to identify all persons with disabilities
and other vulnerable persons, enumerated in these guidelines, and provide 100 days of work to each
of the households that they belong to in all the villages within a specified timeframe. The Coordina-
tor (Vulnerable Groups) shall hold a monthly meeting to review the progress of such imple-
mentation with Block and Gram Panchayat level officials. The Coordinator (Vulnerable Groups)
will submit monthly and quarterly progress reports to the DPC.
Identifying suitable work for differently abled persons
An indicative list is summarised below: Possible classification of work according to the capacity of differently abled people under MGNREGS 1. Drinking water arrangements 2. Helping in looking after children 3. Plantation
4. Irrigation - canal digging 5. Earth backfilling 6. Dumping mud outside or in trolleys 7. Building construction - making concrete material 8. Shifting concrete and other building material from one place to the other 9. Carrying cement and bricks 10. Filling sand or pebbles in pans

Livelihood Analysis of Vulnerable Groups (Differently Abled) under MGNREGS
33
11. Sprinkling water on a newly built wall 12. Well deepening – filling baskets with excavated mud inside the well 13. Helping in pulling out the sludge from the well 14. Transferring the sludge to a trolley 15. Digging out the sludge from the ponds 16. Putting the waste in iron containers 17. Transferring contents of filled-up pans into the trolley 18. Carrying stones 19. Setting stones in the right place 20. Land levelling 21. Farm bunding 22. Digging pits in water conservation land 23. Setting the mud from the pits in a different place 24. Sprinkling water, putting pebbles 25. Building roads
Work which could be done by orthopedically handicapped people - possible work for a person with one weak hand
1. Drinking water arrangements 2. Plantation 3. Filling pans with sand/pebbles 4. Farm bunding 5. Assisting in looking after children 6. Carrying cement and bricks 7. Sprinkling water on the newly built wall 8. Pouring water/putting pebbles
Work which could be done by a person with both hands weak
Work done with help Work done independently
1. Drinking water arrangements 2. Assisting in looking after children 3. Plantation 4. Sprinkling water on newly built walls 5. Filling pans with sand or pebble
1. Drinking water arrangements 2. Assisting in looking after children 3. Plantation 4. Irrigation - digging canals 5. Filling earth 6. Digging out mud / putting in the trolley 7. Construction – repairing concrete material 8. Transferring concrete material from one place to other 9. Carrying cement and bricks 10. Filling metal containers with sand or pebble 11. Sprinkling water on newly built walls 12. Deepening wells putting the sludge inside the well into
baskets 13. Helping in pulling out the sludge from wells

Livelihood Analysis of Vulnerable Groups (Differently Abled) under MGNREGS
34
Work done with help Work done independently 14. Transferring the sludge to trolleys
15. Digging out the sludge from ponds 16. Filling up pans with waste 17. Transferring filled up pans to trolleys 18. Carrying stones 19. Setting stones in the right place 20. Land levelling 21. Farm bunding 22. Digging pits in land meant for water conservation work 23. Transferring the mud from pits to another site 24. Building roads 25. Sweeping kuchha roads with brooms
Work which could be done by a person with two weak legs
a. Assisting in looking after children b. Plantation c. Filling pans with sand or pebble d. Pulling out the sludge from wells (the sludge from the wells is filled in huge containers and to
pull it out at least 10-15 people are required. But if this sludge is filled in smaller containers, 3-4 dif-
ferently abled people can do the same, even while they are sitting. The benefit is that the work will
be faster, the labour required will be less as well as the differently abled people will be employed).
Work which could be done by a person with one weak hand and one weak leg and work done with help work done independently
Work done with help Work done independently
1. Organising drinking water 2. Assisting in looking after children 3. Planting trees 4. Sprinkling water on the newly built wall 5. Filling pans with sand or pebble
1. Organising drinking water 2. Assisting in looking after children 3. Planting trees 4. Sprinkling water on the newly built wall 5. Sprinkling water, putting pebbles
Work which could be done by hunch-backed persons
a. Drinking water arrangements b. Assisting in looking after children c. Plantation d. Sprinkling water on newly built walls on construction sites e. Sprinkling water, putting pebbles
Possible work for visually impaired people a. Possible work for a person blind in one eye whose other eye is also weak
1. Drinking water arrangements 2. Helping in looking after children

Livelihood Analysis of Vulnerable Groups (Differently Abled) under MGNREGS
35
3. Plantation 4. Irrigation-digging canals 5. Filling earth 6. Dumping mud outside or in trolleys 7. Building construction- making concrete material 8. Shifting concrete and other materials from one place to the other 9. Carrying cement and bricks 10. Filling sand or pebbles in pans 11. Sprinkling water on the newly built walls 12. Helping in pulling out the sludge from the well 13. Transferring the sludge to trolley 14. Digging out the sludge from the ponds 15. Putting the waste in pans 16. Transferring the filled up pans into the trolley 17. Carrying stones 18. Setting stones in the right place 19. Land Levelling 20. Farm bunding 21. Digging pits in land for water conservation 22. Setting the excavated mud in a different place 23. Sprinkling water, putting pebbles
b. Work which could be done by people with total visual impairment
i) Plantation ii) Filling pans with sand or pebble iii) Drinking water arrangements
Other family members should also be employed on the site so that they realise that the handi-capped person is not a burden but is instead a source of income for the family. The handicapped per-son should be patiently trained. Proper training should be given on the way to do work as well as to measure the distance covered in terms of their footsteps. c. Work which could be done by a person with a weak vision
1. Organising drinking water 2. Helping in looking after children 3. Planting trees 4. Irrigation-digging canals 5. Filling soil 6. Dumping mud outside or in trolleys 7. Building construction- making concrete material 8. Shifting concrete and other materials from one place to the other 9. Carry cement and bricks 10. Filling sand or pebbles in metal pans 11. Sprinkling water on the newly built wall

Livelihood Analysis of Vulnerable Groups (Differently Abled) under MGNREGS
36
12. Helping in pulling out the sludge from the well 13. Transferring the sludge to trolley 14. Digging out the sludge from the ponds 15. Putting the waste in iron containers 16. Transferring the filled up metal container into the trolley 17. Carrying stones 18. Setting the stones in the right place 19. Land levelling 20. Farm bunding 21. Digging pits in water conservation land 22. Setting the excavated mud in a different place 23. Sprinkling water, putting pebbles
d. Work which could be done by mentally handicapped people Work which could be done by people who are severely mentally challenged
1. Drinking water arrangements 2. Helping in looking after children 3. Plantation 4. Irrigation-digging canals 5. Filling earth 6. Dumping mud outside or in trolleys 7. Shifting concrete and other material from one place to the other 8. Carry cement and bricks 9. Filling sand or pebbles in metal pans 10. Transferring the sludge to trolley 11. Digging out the sludge from the ponds 12. Putting the waste in pans 13. Transferring the filled up pans into the trolley 14. Carrying stones 15. Setting the stones in the right place 16. Land levelling 17. Farm bunding 18. Digging pits in land for water conservation 19. Setting the excavated mud in a different place 20. Sprinkling water, putting pebbles
Note: Such people should be instructed sequentially and slowly. They can produce good work once they have understood it well. e. Work which could be done by a person who is mildly mentally challenged
1. Drinking water arrangements 2. Helping in looking after children 3. Plantation 4. Filling earth 5. Dumping mud outside or in trolleys
Livelihood Analysis of Vulnerable Groups (Differently Abled) under MGNREGS
37
6. Filling sand or pebbles in metal pans 7. Transferring the sludge to trolley 8. Sprinkling water, putting pebbles
Such people may be good at assisting and supporting others. They can carry pans of sludge and
dump it if they are assisted in lifting them.
Work which could be done by people under treatment for mental illness – such people can do
all kinds of work. Only the amount of work done may be quantitatively less.
Work which could be done by hearing and speech impaired people – such people can do all kinds of
work but it is required that they are instructed properly in sign language.
Under MGNREGS, specified works are allotted to the differently abled people to help them
perform their work in an easy and better manner.

Livelihood Analysis of Vulnerable Groups (Differently Abled) under MGNREGS
38
CHAPTER – IV
RESULT DISCUSSIONS
The primary data collected from the respondent of the study area have been analysed by using
SPSS package. The analysed data are presented in tabular form and discussed under different sub-
headings:
1. Demographic of the selected blocks/study area
2. Socio-economic conditions
3. Participation in development programmes
4. Awareness on MGNREGS
5. Empowerment
6. Benefits accrued from MGNREGS
7. Factors responsible for participation
8. Motivating factors
9. Perception of personal gains
10. Professional issues
The age of the wage seekers is an important aspect while perceiving the issues concerned and
their participation in the MGNREGS. The age profile of the wage seekers was collected, analysed and
presented in Table 4.1.
Table 4.1: Age-group distribution of wage seekers
Block Age-Group
<=39 40-62 >=63 Total
Chawmanu 35 10 5 50
70.0% 20.0% 10.0% 100.0%
Manu 30 16 4 50
60.0% 32.0% 8.0% 100.0%
Total 65 26 9 100
65.0% 26.0% 9.0% 100.0%
Source: Field Survey, 2017.
The above table shows the age-wise distribution of the MGNREGS beneficiaries among the
Chawmanu and Manu RD blocks. It reveals that majority of the beneficiaries in both Chawmanu (70
per cent) and Manu RD blocks (60 per cent) were in the aged 39 years or below followed by benefici-
aries in the age groups of 40-62 years (26 per cent) and above 63 years (9 per cent), respectively.

Livelihood Analysis of Vulnerable Groups (Differently Abled) under MGNREGS
39
Table 4.2: Gender-wise distribution of wage seekers
Block Gender
Male Female Total
Chawmanu 41 9 50
82.0% 18.0% 100.0%
Manu 33 17 50
66.0% 34.0% 100.0%
Total 74 26 100
74.0% 26.0% 100.0%
Source: Field Survey, 2017.

Livelihood Analysis of Vulnerable Groups (Differently Abled) under MGNREGS
40
The above table shows the gender-wise distribution among the beneficiaries in the Chawmanu
and Manu RD blocks. In both RD blocks, the participation of male beneficiaries excels their female
counterpart. It was observed that in Chawmanu RD block, the male-female ratio was 82:18. Similarly,
in Manu RD block, the ratio was 66:34. It is to be mentioned here that although in Tripura the female
participant ratio is much higher than the male, the ratio is lower than their male counterpart in the
case of differently abled persons.
The marital status of wage seekers had influenced their perception of various issues. Hence, an
attempt was made to understand the marital status of wage seekers. The analysed data have been pre-
sented in Table 4.3.
Table 4.3: Marital status-wise distribution of wage seekers
Block
Marital Status
Unmarried Married Total
Chawmanu 16 34 50
32.0% 68.0% 100.0%
Manu 10 40 50
20.0% 80.0% 100.0%
Total 26 74 100
26.0% 74.0% 100.0%
Source: Field Survey, 2017. The above table shows the marital status of the beneficiaries in the Chawmanu and Manu RD
blocks. The table depicts that majority of the beneficiaries were married. Only 32 per cent of benefici-
aries in the Chawmanu RD block and 20 per cent of beneficiaries in Manu RD block were unmarried.
The particulars on the status of family norm practised were collected and presented in Table 4.4.
Table 4.4: Types of family systems followed by beneficiaries
Block Types of Family
Nuclear Joint Total
Chawmanu 16 34 50
32.0% 68.0% 100.0%
Manu 22 28 50
44.0% 56.0% 100.0%
Total 38 62 100
38.0% 62.0% 100.0%
Source: Field Survey, 2017.
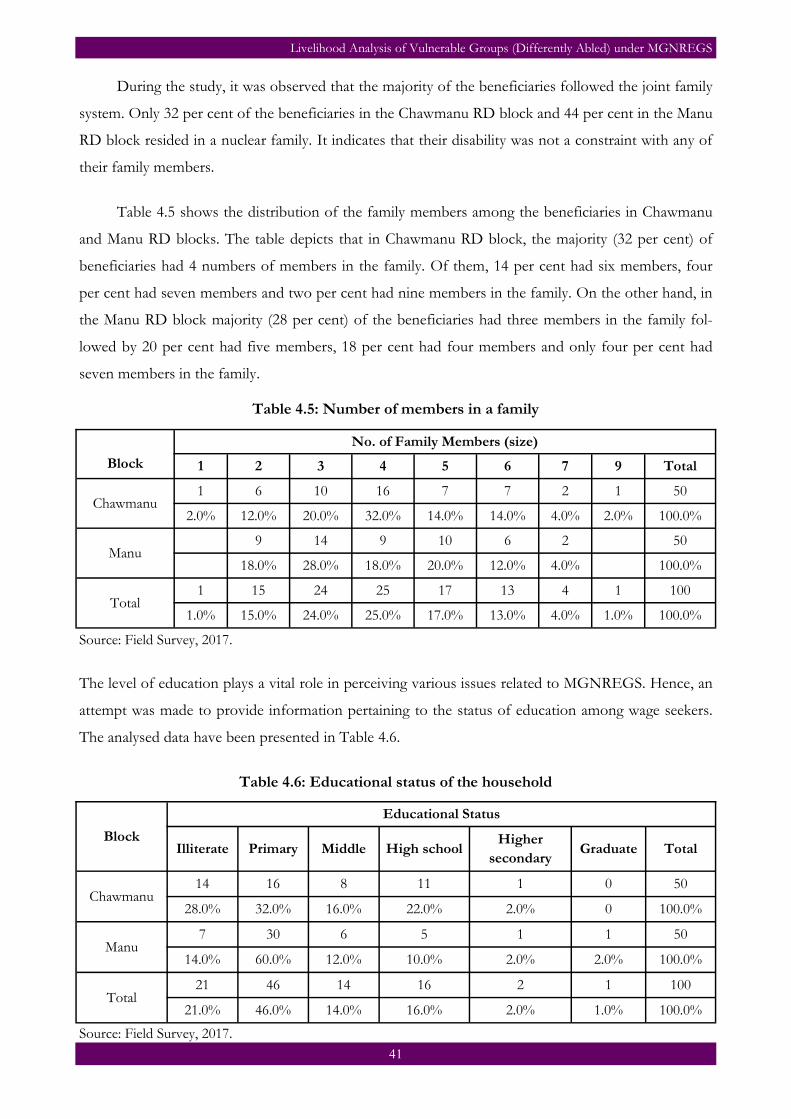
Livelihood Analysis of Vulnerable Groups (Differently Abled) under MGNREGS
41
During the study, it was observed that the majority of the beneficiaries followed the joint family
system. Only 32 per cent of the beneficiaries in the Chawmanu RD block and 44 per cent in the Manu
RD block resided in a nuclear family. It indicates that their disability was not a constraint with any of
their family members.
Table 4.5 shows the distribution of the family members among the beneficiaries in Chawmanu
and Manu RD blocks. The table depicts that in Chawmanu RD block, the majority (32 per cent) of
beneficiaries had 4 numbers of members in the family. Of them, 14 per cent had six members, four
per cent had seven members and two per cent had nine members in the family. On the other hand, in
the Manu RD block majority (28 per cent) of the beneficiaries had three members in the family fol-
lowed by 20 per cent had five members, 18 per cent had four members and only four per cent had
seven members in the family.
Block
No. of Family Members (size)
1 2 3 4 5 6 7 9 Total
Chawmanu 1 6 10 16 7 7 2 1 50
2.0% 12.0% 20.0% 32.0% 14.0% 14.0% 4.0% 2.0% 100.0%
Manu 9 14 9 10 6 2 50
18.0% 28.0% 18.0% 20.0% 12.0% 4.0% 100.0%
Total 1 15 24 25 17 13 4 1 100
1.0% 15.0% 24.0% 25.0% 17.0% 13.0% 4.0% 1.0% 100.0%
Source: Field Survey, 2017.
The level of education plays a vital role in perceiving various issues related to MGNREGS. Hence, an
attempt was made to provide information pertaining to the status of education among wage seekers.
The analysed data have been presented in Table 4.6.
Table 4.6: Educational status of the household
Block
Educational Status
Illiterate Primary Middle High school Higher
secondary Graduate Total
Chawmanu 14 16 8 11 1 0 50
28.0% 32.0% 16.0% 22.0% 2.0% 0 100.0%
Manu 7 30 6 5 1 1 50
14.0% 60.0% 12.0% 10.0% 2.0% 2.0% 100.0%
Total 21 46 14 16 2 1 100
21.0% 46.0% 14.0% 16.0% 2.0% 1.0% 100.0%
Source: Field Survey, 2017.
Table 4.5: Number of members in a family

Livelihood Analysis of Vulnerable Groups (Differently Abled) under MGNREGS
42
From the above table, it was observed that in Chawmanu RD block, the majority (32 per cent) of the
beneficiaries have completed the primary level of education (i.e. from Class I-V) followed by 22 per
cent who have completed high school education. It was also observed that a significant portion of
beneficiaries (i.e. around 28 per cent) was still illiterate and only two per cent of them have completed
higher secondary (i.e. Class XI-XII) education. On the other hand, in Manu RD block, around 60 per
cent of the beneficiaries have completed the primary level of education followed by 12 per cent who
have completed the middle school level of education (Class VI-VIII). Around 14 per cent of them
were illiterate.
When both the RD blocks were compared, the educational status of beneficiaries of the Manu
RD block was better than that of Chawmanu RD block. Expect one respondent, none from Manu
block has secured degree certificates despite the support provided by the government for physically
challenged under the provisions of Right of Children to Free & Compulsory Education (RTE) Act,
2009 that came into force from April 1, 2010. The RTE Act provides for free and compulsory educa-
tion to children including children with disabilities as mentioned in Persons with Disabilities (Equal
Opportunities, Protection of Rights and Full Participation) (PwD) Act, 1995 and the National Trust
for the Welfare of Persons with Autism, Cerebral Palsy, Mental Retardation and Multiple Disabilities
Act, 1999, namely i) Blindness, ii) Low vision, iii) Leprosy cured, iv) Hearing impairment, v) Locomo-
tor disabilities, vi) Mental retardation, vii) Mental Illness, viii) Autism and ix) Cerebral Palsy, and even-
tually cover speech impairment, learning disabilities, etc., in the age group of 6-14 years at the elemen-
tary level in a neighbourhood school. The government is implementing Sarva Shiksha Abhiyan (SSA)
as the main programme for universalising education for all children in the age group of 6-14 years.
The profile of social groups dominates the perception of wage seekers. An attempt was made to un-
derstand the distribution of social groups among the wage seekers selected for the study. The trends
observed in this regard were presented in Table 4.7.
Table 4.7: Social Group-wise distribution of beneficiaries
Block Social Groups
SC ST OBC Others Total
Chawmanu 1 44 2 3 50
2.0% 88.0% 4.0% 6.0% 100.0%
Manu 4 36 6 4 50
8.0% 72.0% 12.0% 8.0% 100.0%
Total 5 80 8 7 100
5.0% 80.0% 8.0% 7.0% 100.0%
Source: Field Survey, 2017.

Livelihood Analysis of Vulnerable Groups (Differently Abled) under MGNREGS
43
Social group-wise distribution of beneficiaries shows that in both RD blocks, almost all the
beneficiaries belonged to Scheduled Tribes (ST) categories. In Chawmanu RD block, 88 per cent of
beneficiaries belonged to Scheduled Tribes whereas in Manu RD block ST beneficiaries comprised 72
per cent. In both the RD blocks, only a few of them belonged to other social groups, as the propor-
tion of ST population in Dhalai district is 55.7 per cent.
Table 4.8: Religion-wise distribution of beneficiaries
Block Religion
Hindu Muslim Christian Buddhists Other Total
Chawmanu 29 1 1 17 2 50
58.0% 2.0% 2.0% 34.0% 4.0% 100.0%
Manu 47 0 3 0 0 50
94.0% 0 6.0% 0 0 100.0%
Total 76 1 4 17 2 100
76.0% 1.0% 4.0% 17.0% 2.0% 100.0%
Source: Field Survey, 2017.
The above table depicts the religious distribution of MGNREGS beneficiaries in Chawmanu
and Manu RD blocks. It was observed that in Manu RD block, almost all the beneficiaries belonged to
the Hindu community followed by only six per cent of beneficiaries who profess Christianity. On the
contrary, in Chawmanu RD block, 58 per cent of MGNREGS beneficiaries belonged to the Hindu
community. Around 34 per cent of them follow Buddhism and only 2 per cent of them adheres to
Islam. It is to be mentioned that beneficiaries in Chawmanu RD block belonged to almost all religions
such as Hinduism, Islam, Christianity and Buddhism while the majority of the beneficiaries in Manu
RD block followed Hinduism and a few Christianity.

Livelihood Analysis of Vulnerable Groups (Differently Abled) under MGNREGS
44
Table 4.9: Average family size of the households
Categories Block
Chawmanu Manu Total
Adult Male 93 75 168
Adult Female 76 75 151
Adult Total 169 150 319
Children male 19 20 39
Children female 17 23 40
Children Total 36 43 79
Total Members 205 193 398
Average family size 4.1 3.9 3.9
Source: Field Survey, 2017.
The above table depicts that the average size of the household in Chawmanu was 4.1 whereas it was
3.9 in the Manu RD block. The table also depicts that there was a big gap in the male-female ratio in
Chawmanu RD block as compared to the Manu RD block. As the wage employment accessed by the
wage seekers was only additive employment, data pertaining to the principal occupation of the wage
seekers were obtained and presented in Table 4.10.
Table 4.10: Primary Occupation-wise distribution of beneficiaries
Block
Occupational Status (Primary)
Agriculture Agri Labour Non-Agri Labour
Skilled Labour
Business Other Total
Chawmanu 24 8 11 - 3 4 50
48.0% 16.0% 22.0% - 6.0% 8.0% 100.0%
Manu 14 9 22 1 4 - 50
28.0% 18.0% 44.0% 2.0% 8.0% - 100.0%
Total 38 17 33 1 7 4 100
38.0% 17.0% 33.0% 1.0% 7.0% 4.0% 100.0%
Source: Field Survey, 2017.
The primary occupational status of MGNREGS beneficiaries shows a deviant picture. The above ta-
ble depicts that in Chawmanu RD block, the majority (48 per cent) of the beneficiaries were engaged
in agriculture whereas 22 per cent of them were non-agricultural labourers and 6 per cent of them
were agricultural labourers. On the contrary, in Manu RD block, the majority (4 per cent) of the bene-
ficiaries were non-agricultural labourers and 28 per cent of them were engaged in agriculture. Only 2
per cent of beneficiaries in the Manu RD block were skilled labourers. In Chawmanu and Manu RD

Livelihood Analysis of Vulnerable Groups (Differently Abled) under MGNREGS
45
blocks, only 6 per cent and 8 per cent of the beneficiaries, respectively, were engaged in business. Dur-
ing the survey, it was observed that MGNREGS beneficiaries depend on agriculture and its related
occupation as their primary occupation. As most of them have a lower education level, they could not
get into the service sector.
Table 4.11: Secondary occupation-wise distribution of beneficiaries
Block Occupational Status (Secondary)
Agriculture Agri Labour Non-Agri Labour
Skilled Labour
Business Other Total
Chawmanu 1 27 11 0 0 11 50
2.0% 54.0% 22.0% 0 0 22.0% 100.0%
Manu 4 12 27 2 1 4 50
8.0% 24.0% 54.0% 4.0% 2.0% 8.0% 100.0%
Total 5 39 38 2 1 15 100
5.0% 39.0% 38.0% 2.0% 1.0% 15.0% 100.0%
Source: Field Survey, 2017.
This table shows that in Chawmanu RD block, 24 per cent of the MGNREGS beneficiaries did
not have any secondary occupation. Around 54per cent of them had agriculture as their secondary
occupation and 22 per cent were non-agricultural labourers. In Manu RD block, the majority (54 per
cent) of the beneficiaries were non-agricultural labourers and 24 per cent worked as agricultural la-
bourers.
Table 4.12: No. of persons with disabilities employed under NREGS
Block Number of members
Chawmanu 80
Manu 73
Total 153
Source: Field Survey, 2017.
This table shows the number of Persons with Disabilities who were employed under the
MGNREGS. Around 80 members in the Chawmanu RD block and 73 members in the Manu RD
block were employed under the MGNREGS.

Livelihood Analysis of Vulnerable Groups (Differently Abled) under MGNREGS
46
Table 4.13: Average person-days and wages in Chawmanu and Manu blocks
Years Days (No.) Wages (Rs.)
Chawmanu Manu Total Chawmanu Manu Total
2014 84 82 83 10764 11421 11113
2015 95 90 93 13516 13002 13242
2016 92 96 94 13322 13834 13601
2017 82 84 83 18163 13573 17214
Source: Field Survey, 2017.
The above table depicts the average person-days and wages in Chawmanu and Manu blocks. It
was observed that in Chawmanu block, the average person-days were 84 which increased to 95 in the
year 2015. The average person-days again decreased to 92 and 82 in the years 2016 and 2017, respec-
tively. The provision of works in the vicinity of the villages has increased person-days. In 2016, the
works in Chawmanu were implemented away from the villages (at a distance of >10 km). As a result,
there was a decline in the number of differently abled persons participated in the works. On the con-
trary, the average wages to the beneficiaries gradually increased from Rs. 10,764 in the year 2014 to Rs.
13,322 in the year 2016. In Manu RD block, the average person-days increased from 82 in the year
2014 to 90 in 2015 and 96 in 2016. Similar to Chawmanu RD block, the wage amount increased from
Rs. 11,113 in the year 2014 to Rs. 13,601 in the year 2016 due to raise in notified wages from Rs. 155
in 2013 toRs.172 in 2016 accordingly.
It is to be mentioned here that the average wage amount gradually increased in both the RD
blocks and the average man-days has also increased. The better performance of Tripura in implement-
ing MGNREGS reflects the success story of the State. This has helped Tripura to consistently secure
top ranks among the States in the country in the implementation of the MGNREGS. The nature of
disability of the beneficiaries in Chawmanu and Manu RD blocks was depicted in Table 4.14.
From Table 4.14, it was observed that the majority of beneficiaries, i.e. 82 per cent in Chaw-
manu RD block and 54 per cent in Manu RD block were having locomotors disability. In Chawmanu
RD block, 6 per cent of the beneficiaries have a hearing impairment and visual impairment and
around 4 per cent of them were mentally retarded. On the contrary, in Manu RD block, 24 per cent
were visually impaired and 22 per cent were hearing impaired. Among the beneficiaries in the Manu
RD block, there were no mentally retarded persons.

Livelihood Analysis of Vulnerable Groups (Differently Abled) under MGNREGS
47
Table 4.14: Nature of disability of beneficiaries
Block
Type of Disability
Locomotor Disability
Hearing impaired
Visually impaired
Mentally impaired
Others Total
Chawmanu 41 3 3 2 1 50
82.0% 6.0% 6.0% 4.0% 2.0% 100.0%
Manu 27 11 12 0 0 50
54.0% 22.0% 24.0% 0 0 100.0%
Total 68 14 15 2 1 100
68.0% 14.0% 15.0% 2.0% 1.0% 100.0%
Source: Field Survey, 2017.
Table 4.14.1: Average number of working days (Disability-wise)
Nature of Disability Average Number of Days
2013-14 2014-15 2015-16 2016-17
Locomotor Disability 71 87 92 79
Hearing impaired 78 91 91 76
Visually impaired 86 88 95 80
Total 75 88 92 79

Livelihood Analysis of Vulnerable Groups (Differently Abled) under MGNREGS
48
Table 4.14.2: Average number of working days during 2013-14
Type of work
Nature of Disability
Locomotor disability
Hearing impaired Visually impaired Total
Drinking water arrangements 72 88 81 75
Child care (Aaya) 78 67 92 80
Plantation 66 82 86 73
Curing the cement structures 71 74 - 72
Total 71 78 86 75
During 2013-14, differently abled were employed under four categories of works, viz. drinking
water arrangements, childcare (Aaya), plantation and curing new cement structures. Among three
types of disability, visually impaired people were able to earn the number of days compared to those
with locomotor disability and hearing impairment as they were found to be efficient than the latter.
Table 4.14.3: Average number of working days during 2014-15
Work
Nature of Disability
Locomotor disability
Hearing impaired
Visually impaired
Total
Drinking water arrangements 73 87 - 76
Child care (Aaya) 86 91 85 87
Plantation 86 91 89 88
Curing the cement structures 92 95 88 92
Filling pans with sand or pebble 98 - 90 96
Total 87 91 88 88
In 2014-15, the MoRD geared up to enhance the skills and build the capacities of implementing
officers at various capacity through a series of training programmes such as operational guidelines-
2013; SAMARTHYA, barefoot technicians, etc., which have generated awareness on the expansion of
works for the differently abled persons. Therefore, we could find additional work provided to the dif-
ferently abled during 2014-15, i.e. filling pans with sand or pebbles, digging out loose soil and con-
struction-repairing concrete material during 2015-16, etc. However, differently abled persons have

Livelihood Analysis of Vulnerable Groups (Differently Abled) under MGNREGS
49
shown less interest to get employment under a new category of works during 2015-16 and 2016-17. It
is also interesting to note that there is a gradual increase in the number of working days under
MGNREGS for the persons with locomotor disability when compared to those with hearing and
visually impairment during the period from 2013-14 to 2016-17. To sustain the interest of the hearing
and visually impaired people to get employment under MGNREGS, it is necessary to provide the na-
ture of the job that they are comfortable with. From cross-tabulations, it is also noticed that the total
number of employment days accrue by the differently abled has declined in 2016-17 as compared to
Work
Nature of Disability
Locomotor disability
Hearing impaired
Visually impaired Total
Drinking water arrangements 93 84 92 90
Child care (Aaya) 94 - 83 91
Plantation 98 91 126 100
Curing the cement structures 84 99 93 90
Filling pans with sand or pebble 99 - 94 97
Digging out loose soil 96 - - 96
Construction – repairing concrete ma-terial
55 - - 55
Total 92 91 95 92
This table shows the percentage of disability among the beneficiaries in Chawmanu and Manu
RD blocks.
Table 4.16: Percentage of Disability
Block Percentages of Disability
Chawmanu
40% 50% 60% 70% 80% 100% Total
9 5 14 8 9 5 50
18.0% 10.0% 28.0% 16.0% 18.0% 10.0% 100.0%
Manu
12 4 12 5 7 10 50
24.0% 8.0% 24.0% 10.0% 14.0% 20.0% 100.0%
Total 21 9 26 13 16 15 100
21.0% 9.0% 26.0% 13.0% 16.0% 15.0% 100.0%
Field Survey, 2017.
Table 4.15: Average number of working days during 2015-16

Livelihood Analysis of Vulnerable Groups (Differently Abled) under MGNREGS
50
It is evident from the above table and the figure that in Chawmanu RD block, 28 per cent of
the beneficiaries were having 60 per cent of disability followed by 18 per having 80 per cent, 14 per
cent having 40 per cent and around 10 per cent having 100 per cent of disability. On the other hand,
in Manu RD block, 24 per cent of the beneficiaries were having 60 per cent of disability, around 20
per cent having 100 per cent of disability and 22 per cent having 40 per cent of disability. It is to be
mentioned that in both RD blocks, the majority of the beneficiaries were having 60 per cent of dis-
ability or more.
Table 4.17: Average number of days for beneficiaries worked (with help)
Block Work code 2013-14 Work code 2014-15
Chawmanu
Drinking water arrangements 61 Drinking water arrangements 69
Plantation 47 Plantation 76
Sprinkling water on newly built walls 51 Sprinkling water on newly built walls
99
Total 54 Filling pans with sand or pebble 116 Assisting in looking after children 65 Total 81
Manu
Drinking water arrangements 84 Drinking water arrangements 87
Assisting in looking after children 80 Assisting in looking after children 91
Plantation 83 Plantation 88
Sprinkling water on newly built walls 77 Sprinkling water on newly built walls
91
Total 82 Filling pans with sand or pebble 89 Total 90
Total
Drinking water arrangements 75 Drinking water arrangements 76
Assisting in looking after children 80 Assisting in looking after children 87
Plantation 73 Plantation 88
Sprinkling water on newly built walls 72 Sprinkling water on newly built walls
92
Total 75 Filling pans with sand or pebble 96 Total 88
Field Survey, 2017.

Livelihood Analysis of Vulnerable Groups (Differently Abled) under MGNREGS
51
Table 4.16 highlighted the average number of days the beneficiaries worked with someone’s
help at the worksite of MGNREGS. It was observed that in Chawmanau RD block, in the FY 2013-
14, the beneficiaries generally arranged drinking water at the worksite and the average number of days
was 61 followed by sprinkling water in the newly built walls (51) and plantation (47). In the FY 2014-
15, the beneficiaries were engaged in sprinkling water in the newly built walls (99) followed by
plantation (76) and drinking water arrangements (69).
In Manu RD block, in the FY 2013-14, beneficiaries primarily arranged drinking water at the
worksite and the average person-days was 84 followed by engaged in plantation (83), assisting in
looking after children (80) and sprinkling water on newly built walls. In addition to the work in the
previous year, in the FY 2014-15, the beneficiaries were also engaged in filling pans with sand or
pebble. The following table gives the average person-days for different categories of work that were
done independently by the differently abled beneficiaries. It was observed that the beneficiaries were
engaged in irrigation, digging wells, construction-repairing concrete material, moving concrete material
from one place to another, land levelling, farm bunding, etc., and these works were done by them
independently.
Table 4.18: Average man-days beneficiaries spent for different categories of works (work done independently)
Activities/ work code Chawmanu Manu
2013-14 2014-15 2015-16 2016-17 2013-14 2014-15 2015-16 2016-17
Drinking water arrangements 82 105 93 107 82 85 102 53
Assisting in looking after children - - 110 - 70 97 - -
Plantation 85 95 78 71 83 97 100 -
Irrigation digging canals 47 103 98 102 88 92 114 -
Filling earth - - - - 83 91 - -
Digging out mud / putting in the trolley
83 - - - 91 - - -
Construction - repairing concrete material
89 118 82 40 - - - -
Transferring concrete material from one place to other
- - 107 65 - 81 95 -
Carrying cement and bricks - 81 102 102 - - - -
Filling mental containers with sand or pebble
- - - - 86 91 96 -
Sprinkling water on newly built walls
- - 125 95 - 106 92 -
Deepening wells putting sludge from wells
- 74 138 92 84 - - -
Helping in pulling out the sludge from wells
- - 96 75 - 97 88 -

Livelihood Analysis of Vulnerable Groups (Differently Abled) under MGNREGS
52
Transferring the sludge to trolleys - - - - 95 84 92 -
Digging out the sludge from ponds - - - - - 79 - -
Filling up pans with waste - - - - 88 - 90 -
Transferring filled up pans to trol-leys
- - - - 77 95 81 -
Carrying stones 100 96 114 109 - - 83 -
Setting stones in the right place - 93 110 - - 80 99 83
Land levelling 84 - - - 88 92 104 81
Farm bunding - - - - - 90 90 -
Digging pits in land meant for wa-ter conservation work
- - - - 26 88 100.00
Transferring the mud from pits to another site
- - - - 88 - - -
Building roads - 90 50 96 - - 86 -
Sweeping kuchha roads with brooms
- - 91 68 - - 85 -
Sprinkling water, putting pebbles - 109 99 64 87 95 105 -
Total 82 99 94 79 81 90 96 77
Activities/ work code Chawmanu Manu
2013-14 2014-15 2015-16 2016-17 2013-14 2014-15 2015-16 2016-
17
Field Survey, 2017.
Table 4.19 below deals with the status of the Shrama Shakti Sanghas (groups) in Chawmanu and
Manu RD blocks.
Table 4.19: Status of the Shrama Shakti Sanghas (SSS)
Block
Members of the group – At the time of formation
Members of the group – At present
Male Female Total Male Female Total
Chawmanu 231 128 359 235 123 358
Manu 275 217 492 274 215 489
Total 506 345 851 509 338 847
Field Survey, 2017.
This table shows the status of the Shrama Shakti Sanghas in Chawmanu and Manu RD blocks.
In Chawmanu RD block, 359 group members were enlisted at the time of formation comprising 231
males and 128 females. During the study, there were 358 members in the group comprising 235 males
and 123 females. On the other hand, in Manu RD block, 492 group members were enlisted at the time

Livelihood Analysis of Vulnerable Groups (Differently Abled) under MGNREGS
53
of formation comprising 275 males and 217 females. During the study, the group had 489 members
comprising 274 males and 215 females.
Table 4.20: Composition of the groups
Block Not Answered Homogeneous Heterogeneous Total
Chawmanu 18 3 29 50
36.0% 6.0% 58.0% 100.0%
Manu 0 0 50 50
0 0 100.0% 100.0%
Total 18 3 79 100
18.0% 3.0% 79.0% 100.0%
Field Survey, 2017.
The above table shows the composition of the SSS group in Chawmanu and Manu RD blocks.
In Chawmanu RD block, 36 per cent of the beneficiaries could not identify whether the group was
homogeneous or heterogeneous. Around 58 per cent of them depict that the group was
heterogeneous and only 6 per cent identified the group to be homogeneous. On the contrary, in Manu
RD block, all the beneficiaries identified that the group was heterogeneous.
Table 4.21: Registration status of the groups
Block
Response
Yes No Total
Chawmanu 25 25 50
50.0% 50.0% 100.0%
Manu 37 13 50
74.0% 26.0% 100.0%
Total 62 38 100
62.0% 38.0% 100.0%
Field Survey, 2017. The table shows that the registration of the groups in the Manu RD block was higher than
Chawmanu RD block. In Chawmanu RD block, 50 per cent of the groups were registered and in
Manu RD block, 74 per cent of the groups were registered. A few newly formed groups are yet to be
registered.

Livelihood Analysis of Vulnerable Groups (Differently Abled) under MGNREGS
54
Table 4.22: Earning Members in Chawmanu and Manu blocks
Block
Earning
members - Male
Earning members –
Female
Total
Chawmanu 81 45 126
Manu 57 24 81
Total 138 69 207
Field Survey, 2017.
This table shows the status of the earning members among the Chawmanu and Manu RD
blocks. In Chawmanu RD block, the majority of the male members (81) were the earning member of
the family and only 45 female beneficiaries were the earning members. Similar to Chawmanu RD
block, 57 male members of the family in Manu RD block were the earning member in comparison to
24 female earning members. The above table clearly depicts that even today, a majority of the females
are not engaged in the earning sector. This table shows the landholding pattern in the study areas. In Chawmanu RD block, 67 acres
of land were used for dryland cultivation, 43acres were used as dryland fallow, 18.5 acres were used
for wetland cultivating. In Manu RD block, 74.25 acres of land were used for dryland cultivation, 26
acres were used as dry land fallow and 5.5 acres were used for wetland cultivation.
Table 4.23: Land holding pattern in Chawmanu and Manu blocks
Block
Land holding Patterns (in acres)
Dryland Wetland
Cultivating Fallow Total Cultivating Total
Chawmanu 67.00 43.75 103.75 18.5 21.5
Manu 74.25 26.00 95.25 5.5 5.5
Total 141.25 69.75 199.00 24.0 27.0
Field Survey, 2017.
The data highlight that a major portion of land, i.e. 103.75 acres in Chawmanu RD block and
95.25 acres in Manu RD block, was dryland and a large portion (67 acres in Chawmanu and 74.25
acres in Manu) was used for dryland cultivation.

Livelihood Analysis of Vulnerable Groups (Differently Abled) under MGNREGS
55
Table 4.24: No. of beneficiaries holding white ration card
Block
Response
Yes Total
Chawmanu 50 50
100.0% 100.0%
Manu 50 50
100.0% 100.0%
Total 100 100
100.0% 100.0%
Field Survey, 2017. The above table shows that all the MGNREGS beneficiaries in both Chawmanu and Manu RD
blocks hold a white ration card.
UNESCO data reveal that a majority of PwDs are unable to earn any livelihood due to lack of
adequate education, training or skills (United Nations Education, Scientific and Cultural
Organisation,1998). The family members or sometimes the PwDs themselves have preconceived ideas
regarding their capabilities and accessibility issues. Compared to their able-bodied peers,
unemployment among PwDs is usually high. The situation of women with disabilities is even worse,
with more discrimination and fewer opportunities. As a result, “Poor people are disproportionately
disabled and people with disabilities are disproportionately poor’ (Mr. Holzmann, World Bank).
Table 4.25: Involvement of MGNREGS beneficiaries in SHG
S. No. Particulars Chawmanu Manu Total
Yes No Yes No Yes No
1. SHG 2 48 - 50 2 98
2. Village Organisation 3
(6.0) 47
(94.0) 2
(4.0) 48
(96.0) 5
(5.0) 95
(95.0)
3. Watershed Committee 3
(6.0) 47
(94.0) 2
(4.0) 48
(96.0) 5
(5.0) 95
(95.0)
4. MahilaMandali 1 49 - 50 1 99
5. Religious Organisation 1
(2.0) 49
(98.0) 1
(2.0) 49
(98.0) 2
(2.0) 98
(98.0)
6. PRIs 3
(6.0) 47
(94.0) 2
(4.0) 48
(96.0) 5
(5.0) 95
(95.0)
7. Any other 1
(2.0) 49
(98.0) -
50 (100.0)
1 (1.0)
99 (99.0)

Livelihood Analysis of Vulnerable Groups (Differently Abled) under MGNREGS
56
SHGs: Principles of participation and voice to organising differently abled people into self-help
groups (SHGs) and federations. The project links these SHGs to the wider community and other
stakeholders. It aims to empower and build the social capital of differently abled people so that they
can effectively articulate their interests and needs and participate actively in the development of
options to address these. In the context of livelihood projects, training programmes are a significant
step that could help improve their situations.
The above table highlighted the involvement of MGNREGS beneficiaries in the SHG in
Chawmanu and Manu RD blocks. In Manu RD block, none of the beneficiaries was involved in any
SHG. Similarly, in Chawmanu RD block, 96 per cent of beneficiaries were not involved in any SHG
and only 4 per cent of them were SHG members. This reveals the gloomy picture where the local level
institution of both the State and Central governments failed to form self-help group (SHG) of the
differently abled members despite the formation of more than a hundred SHGs every year. As per the
SRLM, provision has been made for the inclusion of differently abled for improving skills and
entrepreneurial abilities. However, the benefits of SRLM have not peculated to the beneficiary level. The above table shows the status of the beneficiaries who were engaged in the village-level
organisation. In Chawmanu RD block and Manu RD block, only 6 per cent and 4 per cent of the
beneficiaries, respectively, were the members of village-level organisation.
Table 4.26: Do the beneficiaries consider the MGNRES beneficial?
Block Agreed Agree to a
large extent Agree to some
extent Disagree Total
Chawmanu 33 5 12 0 50
66.0% 10.0% 24.0% 0 100.0%
Manu 29 18 2 1 50
58.0% 36.0% 4.0% 2.0% 100.0%
Total 62 23 14 1 100
62.0% 23.0% 14.0% 1.0% 100.0%
Field Survey, 2017.
The beneficiaries were asked whether they consider the MGNREGS beneficial or not. The
above table depicts that in Chawmanu RD block, 66 per cent of the beneficiaries agreed that
MGNREGS was beneficial to them, 10 per cent agreed to a large extent about the benefit of the
scheme and 24 per cent agreed to some extent that the scheme is beneficial. On the other hand, in
Manu RD block, 58 per cent of the beneficiaries agreed that the scheme was beneficial to them, 36 per
cent agreed to a large extent, 24 per cent agreed to some extent that and only one per cent of them did
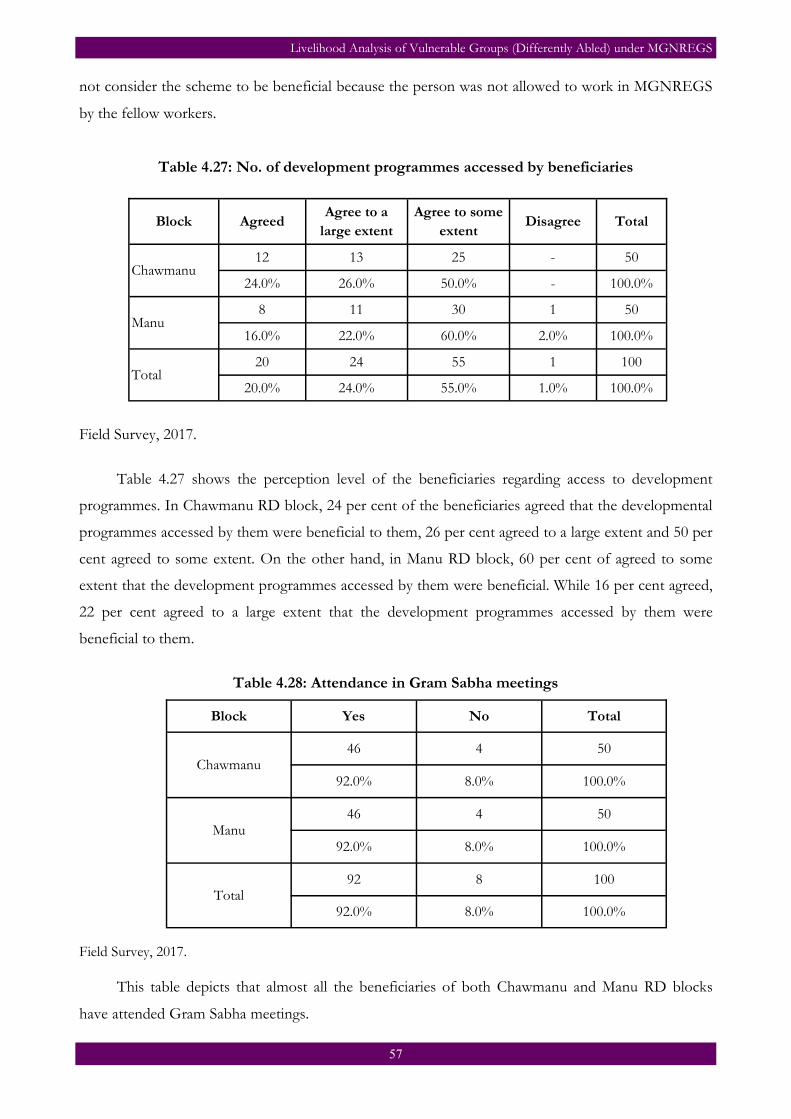
Livelihood Analysis of Vulnerable Groups (Differently Abled) under MGNREGS
57
not consider the scheme to be beneficial because the person was not allowed to work in MGNREGS
by the fellow workers.
Table 4.27: No. of development programmes accessed by beneficiaries
Block Agreed Agree to a
large extent Agree to some
extent Disagree Total
Chawmanu 12 13 25 - 50
24.0% 26.0% 50.0% - 100.0%
Manu 8 11 30 1 50
16.0% 22.0% 60.0% 2.0% 100.0%
Total 20 24 55 1 100
20.0% 24.0% 55.0% 1.0% 100.0%
Field Survey, 2017.
Table 4.27 shows the perception level of the beneficiaries regarding access to development
programmes. In Chawmanu RD block, 24 per cent of the beneficiaries agreed that the developmental
programmes accessed by them were beneficial to them, 26 per cent agreed to a large extent and 50 per
cent agreed to some extent. On the other hand, in Manu RD block, 60 per cent of agreed to some
extent that the development programmes accessed by them were beneficial. While 16 per cent agreed,
22 per cent agreed to a large extent that the development programmes accessed by them were
beneficial to them.
Table 4.28: Attendance in Gram Sabha meetings
Block Yes No Total
Chawmanu 46 4 50
92.0% 8.0% 100.0%
Manu 46 4 50
92.0% 8.0% 100.0%
Total 92 8 100
92.0% 8.0% 100.0%
Field Survey, 2017. This table depicts that almost all the beneficiaries of both Chawmanu and Manu RD blocks
have attended Gram Sabha meetings.

Livelihood Analysis of Vulnerable Groups (Differently Abled) under MGNREGS
58
Table 4.29: Beneficiaries’ participation in village development activities
Block Yes No Total
Chawmanu 28 22 50
56.0% 44.0% 100.0%
Manu 42 8 50
84.0% 16.0% 100.0%
Total 70 30 100
70.0% 30.0% 100.0%
Field Survey, 2017. Table 4.29 shows the participation of beneficiaries in village development activities. It was
observed that 56 per cent of the beneficiaries in Chawmanu RD block and 84per cent of them in
Manu RD block participated in the village development activities. This highlights the better
performance of the PRI system in village-level activities that ensures participatory rural development.
Table 4.30: Beneficiaries’ participation in CBO activities
Block Yes No Total
Chawmanu
6 44 50
12.0% 88.0% 100.0%
Manu
2 48 50
4.0% 96.0% 100.0%
Total 8 92 100
8.0% 92.0% 100.0%
Field Survey, 2017. Table 4.30 shows that the majority of the beneficiaries in Chawmanu and Manu RD blocks have
not participated in CBO activities. Only 12 per cent of beneficiaries in the Chawmanu RD block and
4 per cent of them in the Manu RD block participated in CBO activities.

Livelihood Analysis of Vulnerable Groups (Differently Abled) under MGNREGS
59
Table 4.31: Beneficiaries’ participation in the Rozgar Diwas
Block Income generating
schemes (IGS)
Rozgar Diwas Social Audit Total
Chawmanu
1 40 9 50
2.0% 80.0% 18.0% 100.0%
Manu
1 49 0 50
2.0% 98.0% 0 100.0%
Total
2 89 9 100
2.0% 89.0% 9.0% 100.0%
Field Survey, 2017. Table 4.32 highlighted that the majority of the beneficiaries in the study area participated in
Rozgar Diwas. In Chawmanu RD block, 80 per cent of beneficiaries participated in Rozgar Diwas, 18
per cent in social audit and 2 per cent in income generating schemes (IGS). On the other hand, 98 per
cent of the beneficiaries in Manu block participated in Rozgar Diwas and 2 per cent participated in
IGS whereas none of them participated in the social audit.
Table 4.32 shows that the sharing of ideas was not prevalent among the beneficiaries of
Chawmanu and Manu RD blocks. Only 10 per cent and 2 per cent of beneficiaries in Chawmanu and
Manu RD blocks, respectively, have shared their ideas. Table 4.32 shows that only 20 per cent of the
beneficiaries, who have shared their ideas, think that occasionally their ideas were considered. The
ideas put forth by differently abled people were not taken into consideration and this discouraged
them from sharing their ideas in the community.
Table 4.32: Have you ever shared your ideas in Gram Sabha?
Block Yes No Total
Chawmanu
5 45 50
10.0% 90.0% 100.0%
Manu
1 49 50
2.0% 98.0% 100.0%
Total
6 94 100
6.0% 94.0% 100.0%
Field Survey, 2017.

Livelihood Analysis of Vulnerable Groups (Differently Abled) under MGNREGS
60
Table 4.33: If yes, do you think your ideas have been considered?
Block Agree Some are extended
Sometimes Considered
Total
Chawmanu 2 2 1 5
40.0% 40.0% 20.0% 100.0%
Manu 1 - - 1
100.0% - - 100.0%
Total 3 2 1 6
50.0% 33.3% 16.7% 100.0%
Field Survey, 2017.
Table 4.34: Mode of conveying information about MGNREGS
Block Govt. Officials PRI members Fellow workers Total
Chawmanu 5 41 4 50
10.0% 82.0% 8.0% 100.0%
Manu 1 39 10 50
2.0% 78.0% 20.0% 100.0%
Total 6 80 14 100
6.0% 80.0% 14.0% 100.0%
Field Survey, 2017.
In both Chawmanu and Manu RD blocks, majority of the beneficiaries were informed through
PRI members. Only a few of them were informed by government officials and fellow workers. This
highlights that in both the surveyed village PRIs were playing an active role in the dissemination of
information to the beneficiaries.
Table 4.35: Whether the information on MGNREGS was instantly available?
Block Yes No Total
Chawmanu
42 8 50
84.0% 16.0% 100.0%
Manu
42 8 50
84.0% 16.0% 100.0%
Total
84 16 100
84.0% 16.0% 100.0%
Field Survey, 2017.

Livelihood Analysis of Vulnerable Groups (Differently Abled) under MGNREGS
61
This table shows the availability of information about the MGNREGS. Majority of the
beneficiaries in both RD blocks admitted that the information about the scheme was instantly
available to them.
Block Totally Agree Agree to a large ex-tent
Agree to some extent Total
Chawmanu
9 21 20 50
18.0% 42.0% 40.0% 100.0%
Manu
9 17 24 50
18.0% 34.0% 48.0% 100.0%
Total 18 38 44 100
18.0% 38.0% 44.0% 100.0%
Field Survey, 2017.
In Table 4.36, it is observed that in Chawmanu RD block, 18 per cent of the beneficiaries agree
that basic literacy skills were essential to access information about MGNREGS whereas 42 per cent
agreed to a large extent and 40 per cent agreed to some extent. In Manu RD block,18 per cent of the
beneficiaries agree that basic literacy skills were essential to access information about MGNREGS
while 34 per cent agree to a large extent and 48 per cent agree to some extent regarding its essentiality.
The table highlights that majority of the beneficiaries agree to some extent regarding the essentiality of
literacy skill to avail information about MGNREGS. It is observed in table 4.37 basic literacy skills to
access information on MGNGREGS is essential 44 per cent of the total sample agreed to some extent
and agreed and 18 per cent totally agreed that basic literacy skills are essential to access information on
MGNREGS.
Table 4.37: Beneficiaries’ perception on essentiality of basic literacy skills to access information on MGNREGS (Education-wise)
Educational Status Totally Agree Agree to a large
extent Agree to some
extent Total
Illiterate 5 7 9 21
23.8% 33.3% 42.9% 100.0%
Primary 5 21 20 46
10.9% 45.7% 43.5% 100.0%
Middle 2 4 8 14
14.3% 28.6% 57.1% 100.0%
High school and above 6 6 7 19
31.6% 31.6% 36.8% 100.0% Total 18 38 44 100
18.0% 38.0% 44.0% 100.0%
Table 4.36: Beneficiaries’ perception on essentiality of basic literacy skills to access information

Livelihood Analysis of Vulnerable Groups (Differently Abled) under MGNREGS
62
Table 4.38 depicts that all the beneficiaries of Chawmanu RD block were aware of 100 days of
employment in a financial year. On the contrary, in Manu RD block, 94 per cent of them were aware
of the fact and the rest of 6 per cent had no idea.
Table 4.38: Awareness issues in reference to MGNREGS- 100 days of employment
Block Yes No Total
Chawmanu 50 0 50
100.0% 0 100.0%
Manu 47 3 50
94.0% 6.0% 100.0%
Total 97 3 100
97.0% 3.0% 100.0%
Field Survey, 2017.
Table 4.39: Awareness issues in reference to MGNREGS- right to employment
Block Yes No Total
Chawmanu
45 5 50
90.0% 10.0% 100.0%
Manu
49 1 50
98.0% 2.0% 100.0%
Total
94 6 100
94.0% 6.0% 100.0%
Field Survey, 2017.
Table 4.39 demonstrates the level of awareness among the beneficiaries regarding the right to
employment in MGNREGS. In both Chawmanu and Manu RD blocks, almost all the beneficiaries
were aware of their right to employment. Around 90 per cent of beneficiaries in Chawmanu and 98
per cent in Manu RD block were aware of the right to employment in MGNREGS.
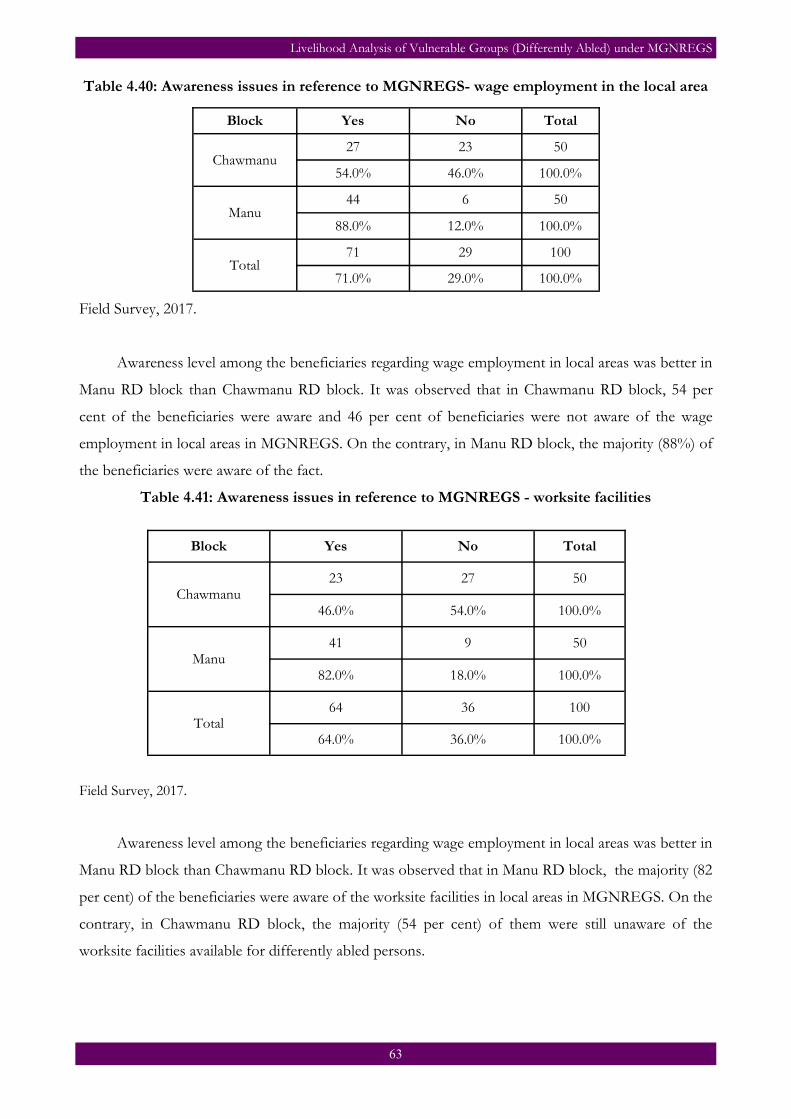
Livelihood Analysis of Vulnerable Groups (Differently Abled) under MGNREGS
63
Block Yes No Total
Chawmanu 27 23 50
54.0% 46.0% 100.0%
Manu 44 6 50
88.0% 12.0% 100.0%
Total 71 29 100
71.0% 29.0% 100.0%
Table 4.40: Awareness issues in reference to MGNREGS- wage employment in the local area
Field Survey, 2017.
Awareness level among the beneficiaries regarding wage employment in local areas was better in
Manu RD block than Chawmanu RD block. It was observed that in Chawmanu RD block, 54 per
cent of the beneficiaries were aware and 46 per cent of beneficiaries were not aware of the wage
employment in local areas in MGNREGS. On the contrary, in Manu RD block, the majority (88%) of
the beneficiaries were aware of the fact.
Table 4.41: Awareness issues in reference to MGNREGS - worksite facilities
Block Yes No Total
Chawmanu 23 27 50
46.0% 54.0% 100.0%
Manu 41 9 50
82.0% 18.0% 100.0%
Total 64 36 100
64.0% 36.0% 100.0%
Field Survey, 2017.
Awareness level among the beneficiaries regarding wage employment in local areas was better in
Manu RD block than Chawmanu RD block. It was observed that in Manu RD block, the majority (82
per cent) of the beneficiaries were aware of the worksite facilities in local areas in MGNREGS. On the
contrary, in Chawmanu RD block, the majority (54 per cent) of them were still unaware of the
worksite facilities available for differently abled persons.
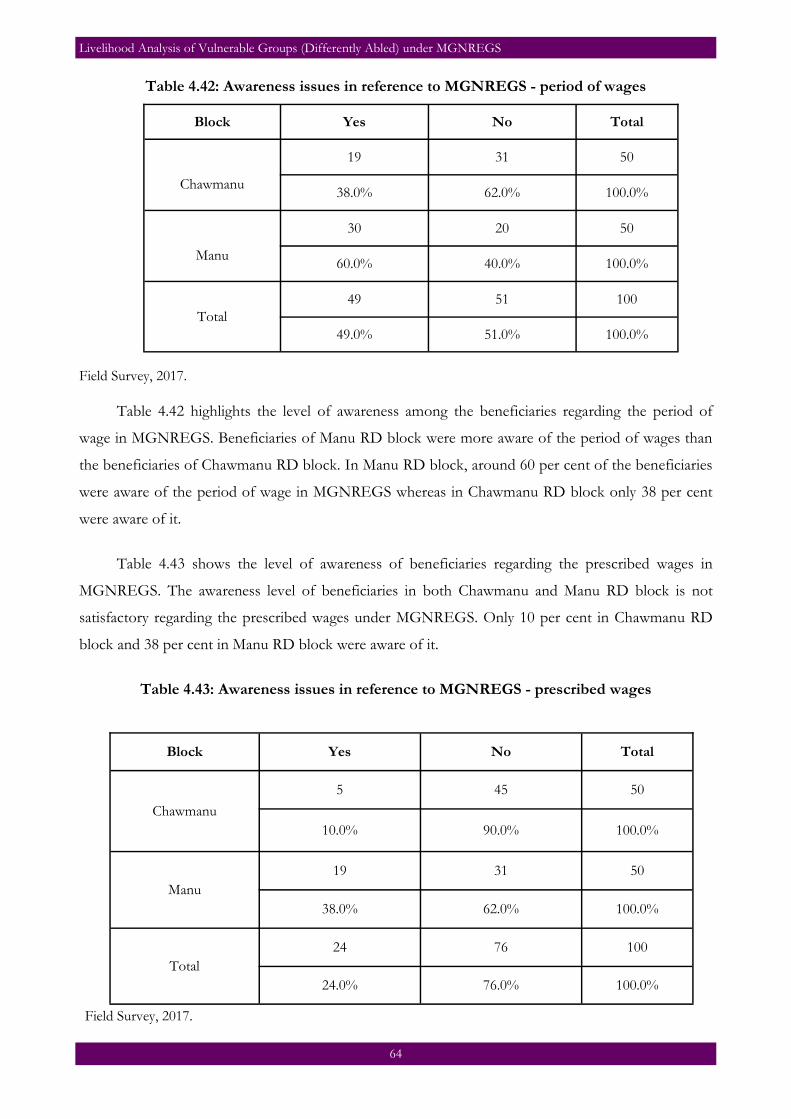
Livelihood Analysis of Vulnerable Groups (Differently Abled) under MGNREGS
64
Table 4.42: Awareness issues in reference to MGNREGS - period of wages
Block Yes No Total
Chawmanu
19 31 50
38.0% 62.0% 100.0%
Manu
30 20 50
60.0% 40.0% 100.0%
Total 49 51 100
49.0% 51.0% 100.0%
Field Survey, 2017. Table 4.42 highlights the level of awareness among the beneficiaries regarding the period of
wage in MGNREGS. Beneficiaries of Manu RD block were more aware of the period of wages than
the beneficiaries of Chawmanu RD block. In Manu RD block, around 60 per cent of the beneficiaries
were aware of the period of wage in MGNREGS whereas in Chawmanu RD block only 38 per cent
were aware of it.
Table 4.43 shows the level of awareness of beneficiaries regarding the prescribed wages in
MGNREGS. The awareness level of beneficiaries in both Chawmanu and Manu RD block is not
satisfactory regarding the prescribed wages under MGNREGS. Only 10 per cent in Chawmanu RD
block and 38 per cent in Manu RD block were aware of it.
Table 4.43: Awareness issues in reference to MGNREGS - prescribed wages
Block Yes No Total
Chawmanu
5 45 50
10.0% 90.0% 100.0%
Manu 19 31 50
38.0% 62.0% 100.0%
Total 24 76 100
24.0% 76.0% 100.0%
Field Survey, 2017.

Livelihood Analysis of Vulnerable Groups (Differently Abled) under MGNREGS
65
Table 4.44: Awareness issues in reference to MGNREGS - equal wages
Block Yes No Total
Chawmanu
19 31 50
38.0% 62.0% 100.0%
Manu 16 34 50
32.0% 68.0% 100.0%
Total 35 65 100
35.0% 65.0% 100.0%
Majority of the beneficiaries (62 per cent) in the Chawmanu RD block and Manu RD block (68
per cent) were aware that a differently abled person was also entitled to equal wages in MGNREGS as
their non-disabled peers.
Table 4.45: Awareness issues in reference to MGNREGS - exclusive manual works
Block Yes No Total
Chawmanu 7 43 50
14.0% 86.0% 100.0%
Manu 8 42 50
16.0% 84.0% 100.0%
Total 15 85 100
15.0% 85.0% 100.0%
Field Survey, 2017.
Table 4.45 depicts that the majority of the beneficiaries of both Chawmanu and Manu RD
blocks were unaware of exclusive manual work for the differently abled beneficiaries. Only 14 per cent
and 16 per cent of beneficiaries, respectively, in the Chawmanu and Manu RD blocks, were aware of
the exclusive manual works.
It was observed that in Chawmanu RD block, only 8 per cent of the beneficiaries and in Manu
RD block, 26 per cent were aware of the type of works in MGNREGS.
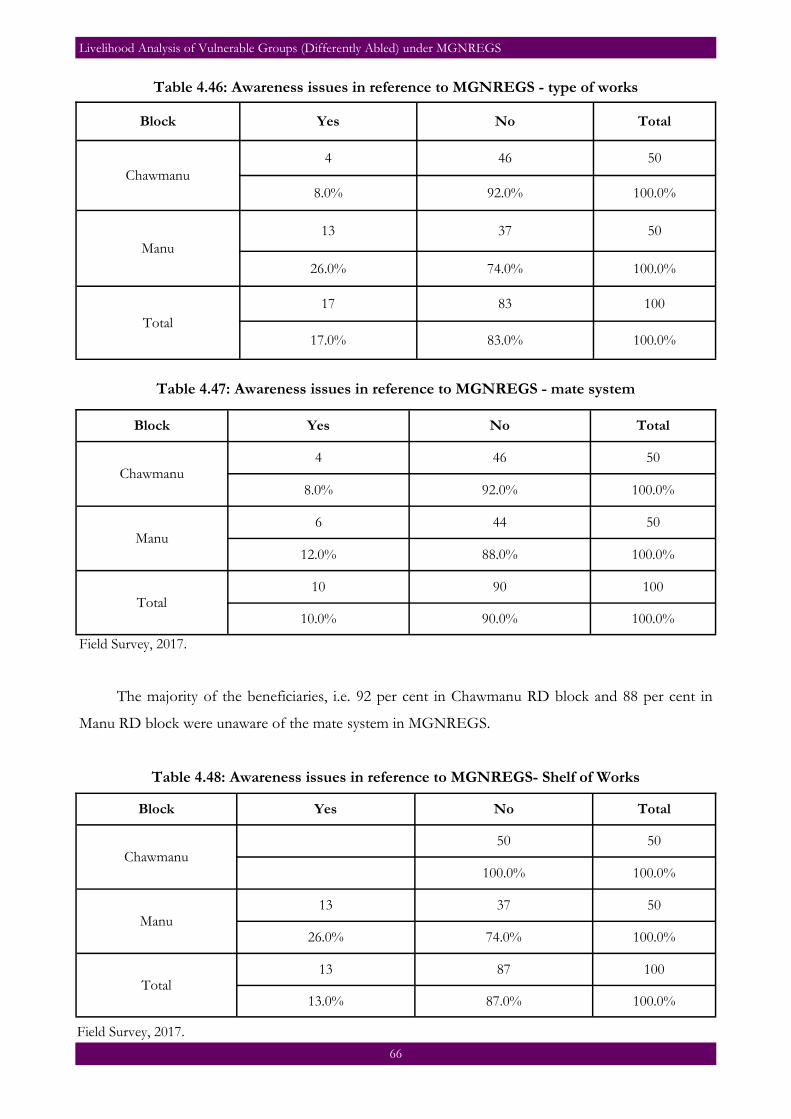
Livelihood Analysis of Vulnerable Groups (Differently Abled) under MGNREGS
66
Table 4.46: Awareness issues in reference to MGNREGS - type of works
Block Yes No Total
Chawmanu 4 46 50
8.0% 92.0% 100.0%
Manu 13 37 50
26.0% 74.0% 100.0%
Total 17 83 100
17.0% 83.0% 100.0%
Table 4.47: Awareness issues in reference to MGNREGS - mate system
Block Yes No Total
Chawmanu 4 46 50
8.0% 92.0% 100.0%
Manu 6 44 50
12.0% 88.0% 100.0%
Total 10 90 100
10.0% 90.0% 100.0%
Field Survey, 2017.
The majority of the beneficiaries, i.e. 92 per cent in Chawmanu RD block and 88 per cent in
Manu RD block were unaware of the mate system in MGNREGS.
Table 4.48: Awareness issues in reference to MGNREGS- Shelf of Works
Block Yes No Total
Chawmanu 50 50
100.0% 100.0%
Manu 13 37 50
26.0% 74.0% 100.0%
Total 13 87 100
13.0% 87.0% 100.0%
Field Survey, 2017.

Livelihood Analysis of Vulnerable Groups (Differently Abled) under MGNREGS
67
Table 4.48 depicts that all the beneficiaries of Chawmanu RD block and 26 per cent in Manu
RD block were unaware of the shelf of works in MGNREGS.
This table highlights the level of awareness issues among the beneficiaries in reference to works
on-demand in MGNREGS. It was seen that24 per cent and 26 per cent of the beneficiaries,
respectively, in Chawmanu and Manu RD blocks were aware of the works on-demand in MGNREGS.
Table 4.49: Awareness issues in reference to MGNREGS - works on demand
Block Yes No Total
Chawmanu 12 38 50
24.0% 76.0% 100.0%
Manu 13 37 50
26.0% 74.0% 100.0%
Total 25 75 100
25.0% 75.0% 100.0%
Field Survey, 2017.
Table 4.50: Awareness issues in reference to MGNREGS - medical aid/treatment
Block Yes No Total
Chawmanu 13 37 50
26.0% 74.0% 100.0%
Manu 22 28 50
44.0% 56.0% 100.0%
Total 35 65 100
35.0% 65.0% 100.0%
Field Survey, 2017.
Majority of the beneficiaries in both Chawmanu and Manu RD blocks were unaware of the
medical aid/treatment provided in MGNREGS worksite. In Chawmanu and Manu RD blocks, 26 per
cent and 44 per cent of the beneficiaries, respectively, were aware of medical aid in MGNREGS.

Livelihood Analysis of Vulnerable Groups (Differently Abled) under MGNREGS
68
Table 4.51: Awareness issues in reference to MGNREGS - social audit
Block Yes No Total
Chawmanu 13 37 50
26.0% 74.0% 100.0%
Manu 19 31 50
38.0% 62.0% 100.0%
Total 32 68 100
32.0% 68.0% 100.0%
Field Survey, 2017. Although the social audit is an important process in MGNREGS to review the functioning of
the scheme, yet it was observed that the majority of the beneficiaries in both Chawmanu and Manu
RD blocks were unaware of it. In Chawmanu and Manu RD blocks, only 26 per cent and 38 per cent
of the beneficiaries, respectively, were aware of the social audit in MGNREGS.
Table 4.52: Awareness issues in reference to MGNREGS - travel allowance
Block Yes No Total
Chawmanu 2 48 50
4.0% 96.0% 100.0%
Manu 7 43 50
14.0% 86.0% 100.0%
Total 9 91 100
9.0% 91.0% 100.0%
Field Survey, 2017. It was observed that in Chawmanu RD block, only 4 per cent of the beneficiaries and in Manu
RD block, only 14 per cent of the beneficiaries were aware that differently abled beneficiaries were
provided travel allowance in MGNREGS.

Livelihood Analysis of Vulnerable Groups (Differently Abled) under MGNREGS
69
Table 4.53: Awareness issues in reference to MGNREGS - timely wage payment within 15 days
Block Yes No Total
Chawmanu 3 47 50
6.0% 94.0% 100.0%
Manu 6 44 50
12.0% 88.0% 100.0%
Total 9 91 100
9.0% 91.0% 100.0%
Field Survey, 2017.
As per Table 4.53, the majority of the beneficiaries were unaware that in MGNREGS work
wages should be paid within 15 days from the day of work. In Chawmanu RD block, only 6 per cent
and in Manu RD block, 12 per cent of the beneficiaries were aware of timely wage payment within 15
days.
Table 4.54: Awareness issues in reference to MGNREGS - any other
Block Yes No Total
Chawmanu 2 48 50
4.0% 96.0% 100.0%
Manu 5 45 50
10.0% 90.0% 100.0%
Total 7 93 100
7.0% 93.0% 100.0%
Field Survey, 2017. In Chawmanu RD block, only 4 per cent of the beneficiaries and in Manu RD block, 10 per
cent of the beneficiaries were aware of other information about MGNREGS.

Livelihood Analysis of Vulnerable Groups (Differently Abled) under MGNREGS
70
Table 4.55: Activities of the coordinator
Block Awareness genera-
tion Organise monthly
meeting Monthly review pro-
gress Total
Chawmanu 26 0 7 33
78.8% 0 21.2% 100.0%
Manu 42 1 6 49
85.7% 2.0% 12.2% 100.0%
Total 68 1 13 82
82.9% 1.2% 15.9% 100.0%
Field Survey, 2017.
Table 4.55 highlights the major activities of the coordinator in MGNREGS. It was observed
that in Chawmanu RD block, the majority (78.8 per cent) of the beneficiaries State that the major
activities done by the coordinator were awareness generation followed by monthly review progress.
Similarly, in Manu RD block, the majority (85.7per cent) of the beneficiaries note that the major
activities done by the coordinator were awareness generation followed by monthly review progress
and organisation of the monthly meeting.
Table 4.56: No. of beneficiaries getting disability pension from the GP
Block Yes No Total
Chawmanu 36 14 50
72.0% 28.0% 100.0%
Manu 45 5 50
90.0% 10.0% 100.0%
Total 81 19 100
81.0% 19.0% 100.0%
Field Survey, 2017. From Table 4.56, it was observed that the majority of beneficiaries in Chawmanu RD block (72
per cent) and Manu RD block (90 per cent) were getting disability pension. Although a majority of the
beneficiaries avail the disability pension, yet around 28 per cent of in Chawmanu RD block and 10 per
cent in Manu RD block were still out of reach of the pension which needs significant attention.
A variation was observed in the disability pension available to the differently abled beneficiaries
that seek keen attention. In Chawmanu RD block, disability pension was identified to be Rs. 600 by
58.3 per cent of beneficiaries, Rs.400 by 5.6 per cent, Rs. 500 by 25 per cent, Rs. 700 by 5.6 per cent,

Livelihood Analysis of Vulnerable Groups (Differently Abled) under MGNREGS
71
Rs. 900 by 2.8 per cent and Rs. 100 by 2.8 per cent of beneficiaries. On the other hand, in Manu RD
block, 57.8 per cent of beneficiaries identified that the disability pension was Rs. 500 whereas the rest
of the beneficiaries identified the pension to be Rs. 600. This alarming issue seeks keen attention of
the service provider.
Table 4.57: Details of amount received by beneficiaries per month
Block 400 500 600 700 900 1000 Total
Chawmanu 2 9 21 2 1 1 36
5.6% 25.0% 58.3% 5.6% 2.8% 2.8% 100.0%
Manu 0 26 19 0 0 0 45
0 57.8% 42.2% 0 0 0 100.0%
Total 2 35 40 2 1 1 81
2.5% 43.2% 49.4% 2.5% 1.2% 1.2% 100.0%
Field Survey, 2017.
Table 4.58: Details of beneficiaries receiving pension
Block Bank Total
Chawmanu 36 36
100.0% 100.0%
Manu 45 45
100.0% 100.0%
Total 81 81
100.0% 100.0%
Field Survey, 2017. In both Chawmanu and Manu RD blocks, all the beneficiaries get their disability pension
through a bank account.
Table 4.59: Awareness of disability-friendly tools
Block Not aware Modified Assistive device Total
Chawmanu 21 22 7 50
42.0% 44.0% 14.0% 100.0%
Manu 44 6 50
88.0% 12.0s% 100.0%
Total 21 66 13 100
21.0% 66.0% 13.0% 100.0%
Field Survey, 2017.
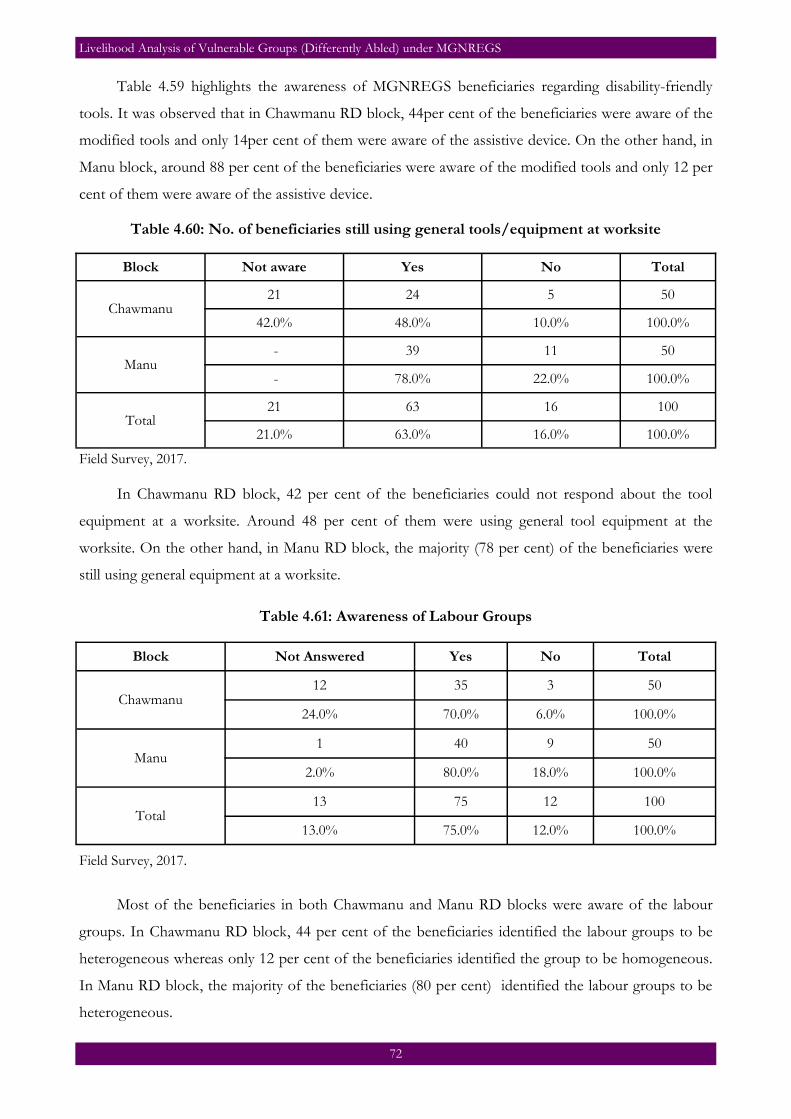
Livelihood Analysis of Vulnerable Groups (Differently Abled) under MGNREGS
72
Table 4.59 highlights the awareness of MGNREGS beneficiaries regarding disability-friendly
tools. It was observed that in Chawmanu RD block, 44per cent of the beneficiaries were aware of the
modified tools and only 14per cent of them were aware of the assistive device. On the other hand, in
Manu block, around 88 per cent of the beneficiaries were aware of the modified tools and only 12 per
cent of them were aware of the assistive device.
Block Not aware Yes No Total
Chawmanu 21 24 5 50
42.0% 48.0% 10.0% 100.0%
Manu - 39 11 50
- 78.0% 22.0% 100.0%
Total 21 63 16 100
21.0% 63.0% 16.0% 100.0%
Field Survey, 2017. In Chawmanu RD block, 42 per cent of the beneficiaries could not respond about the tool
equipment at a worksite. Around 48 per cent of them were using general tool equipment at the
worksite. On the other hand, in Manu RD block, the majority (78 per cent) of the beneficiaries were
still using general equipment at a worksite.
Block Not Answered Yes No Total
Chawmanu 12 35 3 50
24.0% 70.0% 6.0% 100.0%
Manu 1 40 9 50
2.0% 80.0% 18.0% 100.0%
Total 13 75 12 100
13.0% 75.0% 12.0% 100.0%
Field Survey, 2017.
Most of the beneficiaries in both Chawmanu and Manu RD blocks were aware of the labour
groups. In Chawmanu RD block, 44 per cent of the beneficiaries identified the labour groups to be
heterogeneous whereas only 12 per cent of the beneficiaries identified the group to be homogeneous.
In Manu RD block, the majority of the beneficiaries (80 per cent) identified the labour groups to be
heterogeneous.
Table 4.60: No. of beneficiaries still using general tools/equipment at worksite
Table 4.61: Awareness of Labour Groups

Livelihood Analysis of Vulnerable Groups (Differently Abled) under MGNREGS
73
Table 4.62: Is the Labour Group homogeneous/heterogeneous?
Block No Response Homogeneous Heterogeneous Total
Chawmanu 22 6 22 50
44.0% 12.0% 44.0% 100.0%
Manu 9 1 40 50
18.0% 2.0% 80.0% 100.0%
Total 31 7 62 100
31.0% 7.0% 62.0% 100.0%
Table 4.63: Awareness of mandatory facilities to be provided at the worksite - first aid
Block Agree Agree to some
extent Not aware Total
Chawmanu 28 10 12 50
56.0% 20.0% 24.0% 100.0%
Manu 40 1 9 50
80.0% 2.0% 18.0% 100.0%
Total 68 11 21 100
68.0% 11.0% 21.0% 100.0%
Field Survey, 2017. In Chawmanu and Manu RD blocks,56 per cent and 80 per cent of the beneficiaries,
respectively, agreed that mandatory facilities such a first aid should be provided at the worksite. Only
24 per cent of the beneficiaries in Chawmanu and 18 per cent in Manu RD block were unaware of the
fact.
Block Agree Agree to some extent Not aware Total
Chawmanu 31 9 10 50
62.0% 18.0% 20.0% 100.0%
Manu 44 1 5 50
88.0% 2.0% 10.0% 100.0%
Total 75 10 15 100
75.0% 10.0% 15.0% 100.0%
Field Survey, 2017.

Livelihood Analysis of Vulnerable Groups (Differently Abled) under MGNREGS
74
Majority 62 per cent of the beneficiaries in the Chawmanu RD block and 88 per cent of the
beneficiaries in Manu RD block agreed that mandatory facilities such drinking water should be
provided at the worksite of MGNREGS work. Only 20 per cent of the beneficiaries in Chawmanu
and 10 per cent of beneficiaries in Manu RD block were unaware that drinking water should be
provided at the workplace.
Table 4.65: Awareness of mandatory facilities to be provided at the worksite - creche
Block Agree Agree to some extent Not aware Total
Chawmanu 1 32 17 50
2.0% 64.0% 34.0% 100.0%
Manu 4 30 16 50
8.0% 60.0% 32.0% 100.0%
Total 5 62 33 100
5.0% 62.0% 33.0% 100.0%
It was observed that only 2 per cent and 8 per cent of the beneficiaries, respectively, in
Chawmanu and Manu RD blocks agreed that crèche facility should be provided at the workplace. The
majority of the beneficiaries (64 per cent) in Chawmanu RD block and Manu RD block (60 per cent)
agreed to some extent that mandatory facilities such a crèche facility should be provided at the
worksite. Around 34 per cent of the beneficiaries in Chawmanu and 32 per cent of beneficiaries in
Manu RD block were unaware of it.
Table 4.66: Awareness of mandatory facilities to be provided at the worksite - shade
Block Agree Agree to some extent Not aware Total
Chawmanu 1 33 16 50
2.0% 66.0% 32.0% 100.0%
Manu 8 31 11 50
16.0% 62.0% 22.0% 100.0%
Total 9 64 27 100
9.0% 64.0% 27.0% 100.0%
Field Survey, 2017. It was observed that only 2 per cent and 16 per cent of the beneficiaries in Chawmanu and
Manu RD blocks agreed that provision of shade should be arranged at the workplace. Whereas

Livelihood Analysis of Vulnerable Groups (Differently Abled) under MGNREGS
75
majority of the beneficiaries in Chawmanu RD block (66 per cent) Manu RD block (62 per cent)
agreed to some extent that mandatory facilities such a shade facility should be provided at the
worksite. Around 32 per cent of the beneficiaries in Chawmanu and 22 per cent of beneficiaries in
Manu RD block were unaware of it.
Table 4.67: Awareness of approaching officials/others – non-issuance of job cards
Block Aware Aware to some extent Not aware Total
Chawmanu 30 6 14 50
60.0% 12.0% 28.0% 100.0%
Manu 34 13 3 50
68.0% 26.0% 6.0% 100.0%
Total 64 19 17 100
64.0% 19.0% 17.0% 100.0%
Field Survey, 2017. In case of non-receipt of job cards, some of the beneficiaries were not aware of approaching the
officials or others for the job card. In Chawmanu and Manu RD blocks, 60 per cent and 68 per cent
of the beneficiaries knew that they have to contact officials for job cards.
Table 4.68: Awareness of approaching officials/others if work is not given within 15 days
Block Aware Aware to some extent Not aware Total
Chawmanu 21 12 17 50
42.0% 24.0% 34.0% 100.0%
Manu 23 22 5 50
46.0% 44.0% 10.0% 100.0%
Total 44 34 22 100
44.0% 34.0% 22.0% 100.0%
Field Survey, 2017. In case the work was not provided within 15 days of demand, a significant portion, i.e. 34 per
cent of the beneficiaries in Chawmanu RD block were unaware of approaching the officials or others.
While 42 per cent of them were totally aware, 24 per cent of them were aware to some extent about

Livelihood Analysis of Vulnerable Groups (Differently Abled) under MGNREGS
76
contacting the officials demanding work. On the other hand, in Manu RD block, 46 per cent were
totally aware and 44 per cent were aware to some extent about seeking official assistance. Only 10 per
cent of beneficiaries were unaware of it.
Table 4.69: Awareness of approaching officials/others if wages are not paid within 15 days
Block Aware Aware to some extent Not aware Total
Chawmanu 2 31 17 50
4.0% 62.0% 34.0% 100.0%
Manu 13 32 5 50
26.0% 64.0% 10.0% 100.0%
Total 15 63 22 100
15.0% 63.0% 22.0% 100.0%
Field Survey, 2017.
In case wages were not paid within 15 days of work done, a significant portion, i.e. 34 per cent
of the beneficiaries in Chawmanu RD block were not aware of approaching officials or others for
wage payment. Whereas 62 per cent were aware to some extent, only 4 per cent were totally aware of
meeting officials demanding wage payment. On the other hand, in Manu RD block, 64 per cent of the
beneficiaries were aware to some extent while only 13 per cent of them were totally aware of it.
Table 4.70: Sources for availing information on MGNREGS
Block not answered GP SHG Officials Rozgar Sevak Total
Chawmanu 4 29 2 1 14 50
8.0% 58.0% 4.0% 2.0% 28.0% 100.0%
Manu 13 27 5 1 4 50
26.0% 54.0% 10.0% 2.0% 8.0% 100.0%
Total 17 56 7 2 18 100
17.0% 56.0% 7.0% 2.0% 18.0% 100.0%
Field Survey, 2017. Majority of the beneficiaries in Chawmanu RD block (58 per cent) and Manu RD block (54 per
cent) got the information about MGNREGS work from their respective Gram Panchayats (GPs).
Only a few of them in both the blocks got information from SHGs, government officials and rozgar
sevaks.

Livelihood Analysis of Vulnerable Groups (Differently Abled) under MGNREGS
77
Table 4.71: Factors responsible for low participation
Factors Chawmanu Manu
Fully Agree To some
extent Not at
all Total
Fully Agree
To some extent
Not at all
Total
No sufficient agricultural activity
35 (70.0)
14 (28.0)
1 (2.0)
50 (100.0)
36 (72.0)
14 (28.0)
- 50
(100.0)
Low market wages 30
(60.0) 19
(38.0) 1
(2.0) 50
(100.0) 27
(54.0) 23
(46.0) -
50 (100.0)
Migration 10
(20.0) 26
(52.0) 14
(28.0) 50
(100.0) 9
(18.0) 18
(36.0) 23
(46.0) 50
(100.0)
Illiteracy 18
(36.0) 30
(60.0) 2
(4.0) 50
(100.0) 13
(26.0) 32
(64.0) 5
(10.0) 50
(100.0)
Lack of skills 8
(16.0) 41
(82.0) 1
(2.0) 50
(100.0) 5
(10.0) 37
(74.0) 3
(16.0) 50
(100.0)
Flood 3
(6.0) 32
(64.0) 15
(30.0) 50
(100.0) 5
(10.0) 10
(20.0) 35
(70.0) 50
(100.0)
Drought 2
(4.0) 33
(66.0) 15
(30.0) 50
(100.0) 3
(6.0) 11
(22.0) 36
(72.0) 50
(100.0)
Lack of continuous work
8 (16.0)
38 (76.0)
4 (8.0)
50 (100.0)
3 (6.0)
25 (50.0)
22 (44.0)
50 (100.0)
Field Survey, 2017. Table 4.71 highlights the factors responsible for low participation in MGNREGS work. It was
observed that around 70 per cent and 72 per cent of the beneficiaries, respectively, in Chawmanu and
Manu RD blocks fully agreed that no sufficient agricultural activity was responsible for the
participation of beneficiaries in MGNREGS.
The table also shows the factors responsible for low participation in MGNREGS work. It was
observed that majority, i.e. 60 per cent and 54 per cent of the beneficiaries, respectively, in Chawmanu
and Manu RD blocks fully agreed that low market wages was responsible for the participation of
beneficiaries in MGNREGS.
The table further explains the factors responsible for low participation in MGNREGS work. It
was observed that around 52 per cent and 36 per cent of the beneficiaries, respectively, in Chawmanu
and Manu RD blocks agreed to some extent that migration was responsible for the participation of
beneficiaries in MGNREGS.
It was observed that majority, i.e. 60 per cent of the beneficiaries in Chawmanu RD block and
64 per cent of them in Manu RD block agreed to some extent that illiteracy was responsible for the
participation of beneficiaries in MGNREGS.

Livelihood Analysis of Vulnerable Groups (Differently Abled) under MGNREGS
78
It was observed that majority, i.e. 82 per cent of the beneficiaries in Chawmanu RD block and
74 per cent of them in Manu RD block agreed to some extent that lack of skills was responsible for
the participation of beneficiaries in MGNREGS.
It was observed that majority, i.e. 64 per cent of the beneficiaries in Chawmanu RD block and
only 20 per cent of them in Manu RD block agreed to some extent that flood was responsible for the
participation of beneficiaries in MGNREGS.
It was observed that majority, i.e. 66 per cent of the beneficiaries in Chawmanu RD block and
only 22 per cent of them in Manu RD block agreed to some extent that drought was responsible for
the participation of beneficiaries in MGNREGS.
It was observed that majority, i.e. 76 per cent of the beneficiaries in Chawmanu RD block and
50 per cent of them in Manu RD block agreed to some extent that lack of continuous work was
responsible for the participation of beneficiaries in MGNREGS.
Table 4.72: Motivating factors for the beneficiaries
S. No. Motivating Factors No. of beneficiaries having Positive Responses
Chawmanu % Manu %
A Minimum wages 46 92.0% 50 100.0%
B Timely wages 29 58.0% 36 72.0%
C Work taken up on their own land 11 22.0% 34 68.0%
D Assets created which are beneficial 9 18.0% 34 68.0%
E *Support from the family 29 58.0% 33 66.0%
F Higher MGNREGS wages than market wages 7 14.0% 11 22.0%
G Equal wages 19 38.0% 10 20.0%
H Group arrangement 6 12.0% 11 22.0%
I Mode of payment 3 6.0% 12 24.0%
J Worksite facilities 5 10.0% 13 26.0%
K Attitude/sensitivity of officials 4 8.0% 12 24.0%
L Timely employment 16 32.0% 9 18.0%
M SHG membership 1 2.0% 6 12.0%
N Local NGOs encouragement 1 2.0% 5 10.0%
O Self-esteem/Self-dignity 16 32.0% 12 24.0%
Source: Field Survey, 2017. *Note: Multiple Responses

Livelihood Analysis of Vulnerable Groups (Differently Abled) under MGNREGS
79
Table 4.73: Factors responsible for low participation - lack of sufficient agricultural activity
Block Fully Agree To Some Extent Not at all Total
Chawmanu
35 14 1 50
70.0% 28.0% 2.0% 100.0%
Manu
36 14 - 50
72.0% 28.0% - 100.0%
Total
71 28 1 100
71.0% 28.0% 1.0% 100.0%
Field Survey, 2017. Table 4.73 highlighted the factors responsible for low participation in MGNREGS work. It was
observed that around 70 per cent of the beneficiaries in Chawmanu RD block and 72 per cent in
Manu RD block fully agreed that no sufficient agricultural activity was responsible for the
participation of beneficiaries in MGNREGS.
Table 4.72 highlighted the motivating factors for the MGNREGS beneficiaries to participate in
the work. It was observed that in Chawmanu RD block, the majority (92 per cent) of the beneficiaries
identified minimum wages as the motivating factor. Around 58 per cent of them identified support of
the family and 58 per cent identified timely wages, 38 per cent identified equal wages and 32 per cent
identified self-dignity as the motivating factor to participate in the work under MGNREGS. Very few
beneficiaries identified group arrangement, mode of payment, NGO encouragement, SHG
membership, and attitude of the officials as the motivating factors.
Similarly, in Manu RD block, all the beneficiaries identified minimum wages as the motivating
factor. Around 72 per cent of them identified timely wages, 68 per cent identified work taken upon
their own land, 68 per cent identified the creation of beneficial assets, 26 per cent identified worksite
facilities, 28per cent of them identified the mode of payment and attitude of officials as the motivating
factors to participate in the work under MGNREGS. Very few beneficiaries identified equal wages,
group arrangement, NGOs encouragement and SHG membership as the motivating factors.

Livelihood Analysis of Vulnerable Groups (Differently Abled) under MGNREGS
80
Table 4.74: Factors responsible for low participation - low market wages
Block Fully Agree To Some Extent Not at all Total
Chawmanu 30 19 1 50
60.0% 38.0% 2.0% 100.0%
Manu 27 23 50
54.0% 46.0% 100.0%
Total 57 42 1 100
57.0% 42.0% 1.0% 100.0%
Field Survey, 2017. Table 4.74 highlighted the factors responsible for low participation in MGNREGS work. It was
observed that majority, i.e. 60 per cent of the beneficiaries in Chawmanu RD block and 54 per cent in
Manu RD block fully agreed that low market wages were responsible for the participation of
beneficiaries in MGNREGS.
Table 4.75: Factors responsible for low participation – migration
Block Fully Agree To Some Extent Not at all Total
Chawmanu 10 26 14 50
20.0% 52.0% 28.0% 100.0%
Manu 9 18 23 50
18.0% 36.0% 46.0% 100.0%
Total 19 44 37 100
19.0% 44.0% 37.0% 100.0%
Table 4.75 highlights the factors responsible for low participation in MGNREGS work. It was
observed that majority, i.e. 52 per cent of the beneficiaries in Chawmanu RD block and 36 per cent
in Manu RD block agreed to some extent that migration was responsible for the participation of
beneficiaries in MGNREGS.
Table 4.76: Factors responsible for low participation – illiteracy
Block Fully Agree To Some Extent Not at all Total
Chawmanu 18 30 2 50
36.0% 60.0% 4.0% 100.0%
Manu 13 32 5 50
26.0% 64.0% 10.0% 100.0%
Total 31 62 7 100
31.0% 62.0% 7.0% 100.0%
Field Survey, 2017.

Livelihood Analysis of Vulnerable Groups (Differently Abled) under MGNREGS
81
Table 4.76 highlights the factors responsible for low participation in MGNREGS work. It was
observed that majority, i.e. 60 per cent of the beneficiaries in Chawmanu RD block and 64 per cent in
Manu RD block agreed to some extent that illiteracy was responsible for the participation of
beneficiaries in MGNREGS.
Table 4.77: Factors responsible for low participation - lack of skills
Block Fully Agree To Some Extent Not at all Total
Chawmanu 8 41 1 50
16.0% 82.0% 2.0% 100.0%
Manu 5 37 8 50
10.0% 74.0% 16.0% 100.0%
Total 13 78 9 100
13.0% 78.0% 9.0% 100.0%
Field Survey, 2017. Table 4.77 highlights the factors responsible for low participation in MGNREGS work. It was
observed that majority, i.e. 82 per cent of the beneficiaries in Chawmanu RD block and 74 per cent in
Manu RD block agreed to some extent that lack of skills was responsible for the participation of
beneficiaries in MGNREGS.
Table 4.78: Factors responsible for low participation – flood
Block Fully Agree To Some Extent Not at all Total
Chawmanu 3 32 15 50
6.0% 64.0% 30.0% 100.0%
Manu 5 10 35 50
10.0% 20.0% 70.0% 100.0%
Total 8 42 50 100
8.0% 42.0% 50.0% 100.0%
Field Survey, 2017. Table 4.78 highlights the factors responsible for low participation in MGNREGS work. It was
observed that 64 per cent of the beneficiaries in Chawmanu RD block and 20 per cent in Manu RD
block agreed to some extent that flood was responsible for the participation of beneficiaries in
MGNREGS.
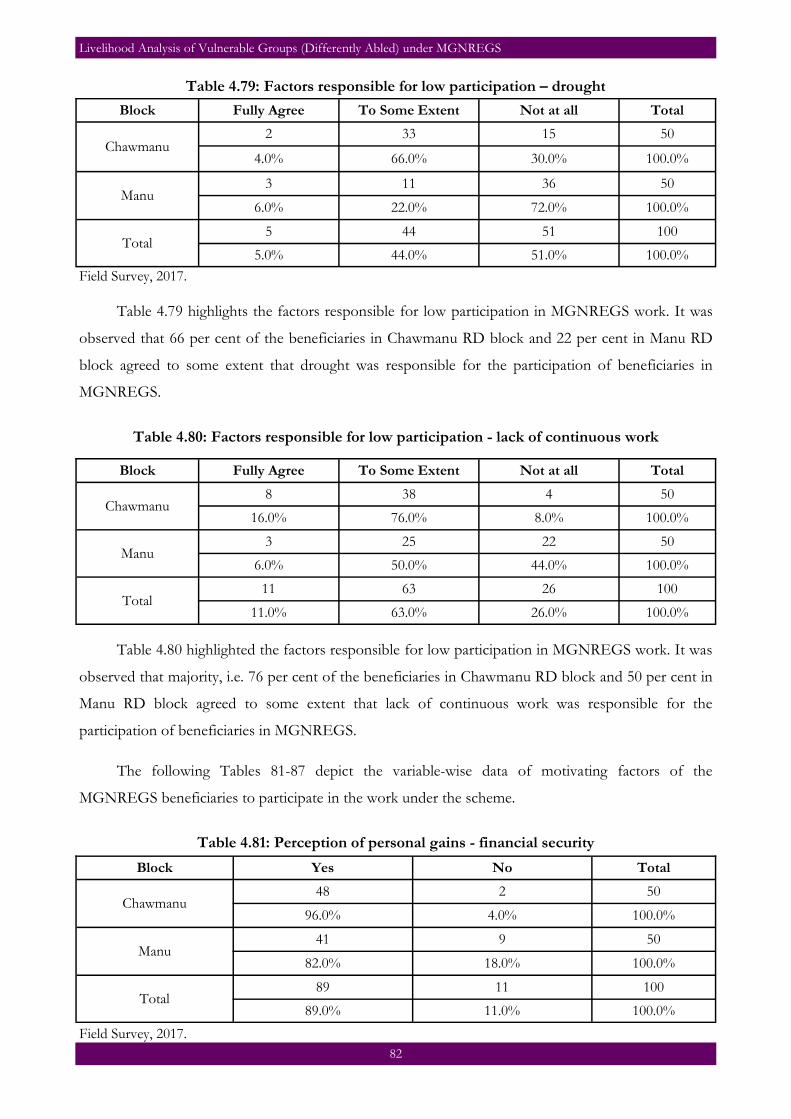
Livelihood Analysis of Vulnerable Groups (Differently Abled) under MGNREGS
82
Table 4.79: Factors responsible for low participation – drought
Block Fully Agree To Some Extent Not at all Total
Chawmanu 2 33 15 50
4.0% 66.0% 30.0% 100.0%
Manu 3 11 36 50
6.0% 22.0% 72.0% 100.0%
Total 5 44 51 100
5.0% 44.0% 51.0% 100.0%
Field Survey, 2017.
Table 4.79 highlights the factors responsible for low participation in MGNREGS work. It was
observed that 66 per cent of the beneficiaries in Chawmanu RD block and 22 per cent in Manu RD
block agreed to some extent that drought was responsible for the participation of beneficiaries in
MGNREGS.
Table 4.80: Factors responsible for low participation - lack of continuous work
Block Fully Agree To Some Extent Not at all Total
Chawmanu 8 38 4 50
16.0% 76.0% 8.0% 100.0%
Manu 3 25 22 50
6.0% 50.0% 44.0% 100.0%
Total 11 63 26 100
11.0% 63.0% 26.0% 100.0%
Table 4.80 highlighted the factors responsible for low participation in MGNREGS work. It was
observed that majority, i.e. 76 per cent of the beneficiaries in Chawmanu RD block and 50 per cent in
Manu RD block agreed to some extent that lack of continuous work was responsible for the
participation of beneficiaries in MGNREGS.
The following Tables 81-87 depict the variable-wise data of motivating factors of the
MGNREGS beneficiaries to participate in the work under the scheme.
Table 4.81: Perception of personal gains - financial security
Block Yes No Total
Chawmanu 48 2 50
96.0% 4.0% 100.0%
Manu 41 9 50
82.0% 18.0% 100.0%
Total 89 11 100
89.0% 11.0% 100.0%
Field Survey, 2017.

Livelihood Analysis of Vulnerable Groups (Differently Abled) under MGNREGS
83
Table 4.81 depicts the perception of the beneficiaries about the personal gains after involvement
in MGNREGS. It was observed that almost all the beneficiaries of Chawmanu (96%) and Manu
(82%) RD block agreed that they became financially secured after getting employment under
MGNREGS. This gives an understanding that the majority of the differently abled persons in the
study area are accessing MGNREGs and getting financially benefited.
Table 4.82: Perception of personal gains - decline in incidence of migration
Block Yes No Total
Chawmanu 17 33 50
34.0% 66.0% 100.0%
Manu 23 27 50
46.0% 54.0% 100.0%
Total 40 60 100
40.0% 60.0% 100.0%
Field Survey, 2017. Table 4.82 depicts the perception of the beneficiaries about the reduction of the incidence of
migration after involvement in MGNREGS. It was observed that 66 per cent of the beneficiaries in
Chawmanu RD block and 54 per cent in Manu RD block did not consider that the incidence of
migration reduced after the employment under MGNREGS. Only a few beneficiaries in both the
blocks felt that the incidence of migration decreased after the introduction of the scheme.
Table 4.83: Perception of personal gains - IAY household
Block Yes No Total
Chawmanu 32 18 50
64.0% 36.0% 100.0%
Manu 34 16 50
68.0% 32.0% 100.0%
Total 66 34 100
66.0% 34.0% 100.0%
Field Survey, 2017.
Table 4.83 depicts the perception of the beneficiaries regarding houses under IAY after
involvement in MGNREGS. It was observed that 64 per cent of the beneficiaries of Chawmanu RD
block and 68 per cent of them in Manu RD block agreed that they availed IAY household after getting
employment under MGNREGS. Nearly 34 per cent were unmarried and are following the joint family
system.

Livelihood Analysis of Vulnerable Groups (Differently Abled) under MGNREGS
84
Table 4.84: Perception of personal gains - land development
Block Yes No Total
Chawmanu 9 41 50
18.0% 82.0% 100.0%
Manu 30 20 50
60.0% 40.0% 100.0%
Total 39 61 100
39.0% 61.0% 100.0%
Field Survey, 2017. Table 4.84 highlights the perception of the beneficiaries of the land development after the
introduction of MGNREGS and it depicts a variant picture. It was observed that in Chawmanu RD
block, 82 per cent of the beneficiaries felt that there was no land development after the introduction
of the scheme. On the contrary, in Manu RD block, 60 per cent of the beneficiaries admitted that land
was developed by the MGNREGS.
Table 4.86: Perception of personal gains - more attention to children’s education
Block Yes No Total
Chawmanu 16 34 50
32.0% 68.0% 100.0%
Manu 10 40 50
20.0% 80.0% 100.0%
Total 26 74 100
26.0% 74.0% 100.0%
Field Survey, 2017.
Block Yes No Total
Chawmanu 15 35 50
30.0% 70.0% 100.0%
Manu 11 39 50
22.0% 78.0% 100.0%
Total 26 74 100
26.0% 74.0% 100.0% Field Survey, 2017.
Table 4.85: Perception of personal gains - personal care of children
Table 4.85 highlights the perception of the beneficiaries about the personal care of children after
their involvement in MGNREGS. Around 70 per cent of the beneficiaries in Chawmanu RD block
and 78 per cent in Manu RD block considered that the level of personal care of children saw a dip due
to their involvement in work. Few beneficiaries in both the RD blocks consider that the level of
personal care of the children bettered on account of financial security provided b the work.

Livelihood Analysis of Vulnerable Groups (Differently Abled) under MGNREGS
85
Table 4.86 highlights the perception of the beneficiaries about more attention to the education
of their children after involvement in MGNREGS. Around 68 per cent of the beneficiaries in
Chawmanu RD block and 80 per cent in Manu RD block considered that they were unable to give
more attention to the education of their children due to their involvement in work. Few beneficiaries
of both the RD blocks consider that after getting the job they were financially secured and were able
to give more attention to the education of their children.
Table 4.87: Perception of personal gains - better care for infants at worksite
Block Yes No Total
Chawmanu 14 36 50
28.0% 72.0% 100.0%
Manu 9 41 50
18.0% 82.0% 100.0%
Total 23 77 100
23.0% 77.0% 100.0%
Field Survey, 2017.
Table 4.87 highlights the perception of the beneficiaries about better care for infants at
MGNREGS worksite. The majority, i.e. 72 per cent of the beneficiaries in Chawmanu RD block and
82 per cent in Manu RD block did not felt that better care was provided to the infants at the worksite.
This seeks the kind attention of the MGNREGS officials and related service providers to ensure
better care for infants at the worksite, which will increase the participation rate.
Table 4.88: Perception of personal gains - improved household savings
Block Yes No Total
Chawmanu 29 21 50
58.0% 42.0% 100.0%
Manu 13 37 50
26.0% 74.0% 100.0%
Total 42 58 100
42.0% 58.0% 100.0%
Field Survey, 2017. Table 4.88 highlights the perception of the beneficiaries about improvement in household
savings after involvement in MGNREGS and this shows a deviant picture. In Chawmanu RD block,
majority (58 per cent) of the beneficiaries believe that their household savings have improved after the
employment under MGNRES. On the other hand, in Manu RD block, the majority (74 per cent) of
the beneficiaries found no improvement in their household savings.
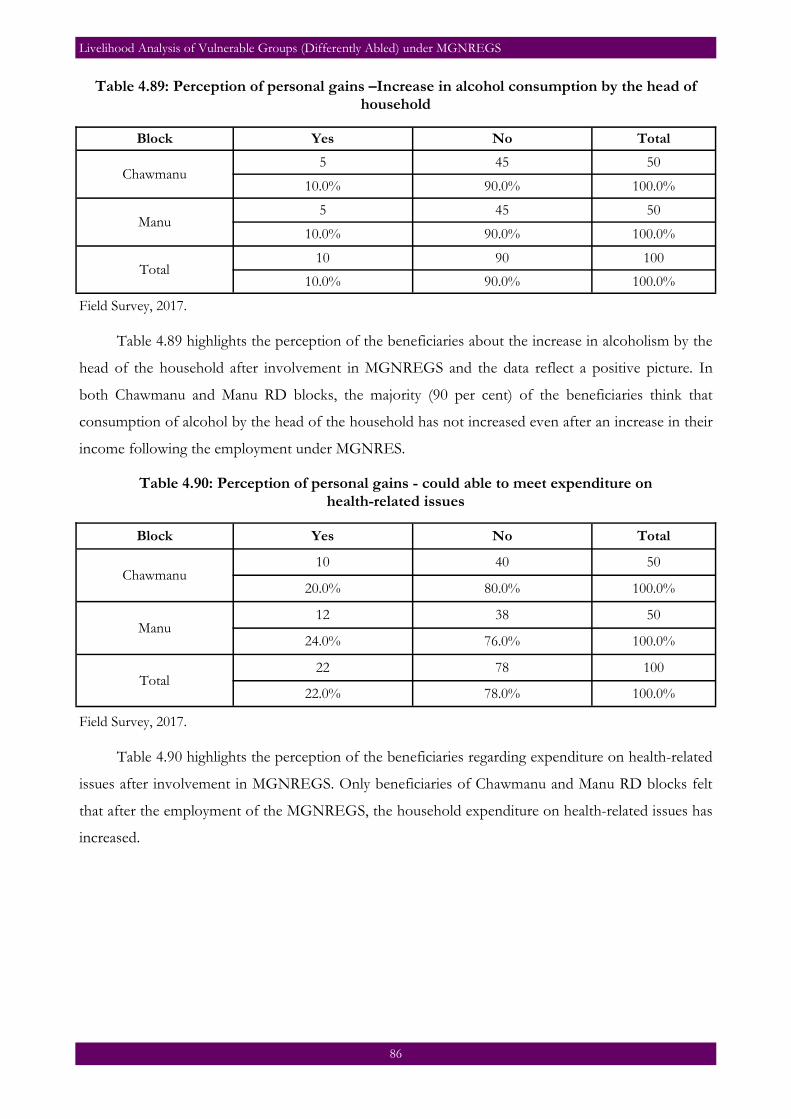
Livelihood Analysis of Vulnerable Groups (Differently Abled) under MGNREGS
86
Table 4.89: Perception of personal gains –Increase in alcohol consumption by the head of household
Block Yes No Total
Chawmanu 5 45 50
10.0% 90.0% 100.0%
Manu 5 45 50
10.0% 90.0% 100.0%
Total 10 90 100
10.0% 90.0% 100.0%
Field Survey, 2017. Table 4.89 highlights the perception of the beneficiaries about the increase in alcoholism by the
head of the household after involvement in MGNREGS and the data reflect a positive picture. In
both Chawmanu and Manu RD blocks, the majority (90 per cent) of the beneficiaries think that
consumption of alcohol by the head of the household has not increased even after an increase in their
income following the employment under MGNRES.
Table 4.90: Perception of personal gains - could able to meet expenditure on health-related issues
Block Yes No Total
Chawmanu 10 40 50
20.0% 80.0% 100.0%
Manu 12 38 50
24.0% 76.0% 100.0%
Total 22 78 100
22.0% 78.0% 100.0%
Field Survey, 2017. Table 4.90 highlights the perception of the beneficiaries regarding expenditure on health-related
issues after involvement in MGNREGS. Only beneficiaries of Chawmanu and Manu RD blocks felt
that after the employment of the MGNREGS, the household expenditure on health-related issues has
increased.

Livelihood Analysis of Vulnerable Groups (Differently Abled) under MGNREGS
87
Table 4.91: Perception of personal gains - able to spend more on clothes for self, children, etc.
Block Yes No Total
Chawmanu 13 37 50
26.0% 74.0% 100.0%
Manu 8 42 50
16.0% 84.0% 100.0%
Total 21 79 100
21.0% 79.0% 100.0%
Field Survey, 2017.
Despite the employment provided through MGNREGS, only 26 per cent in Chawmanu RD
block and 16 per cent in Manu RD block considered that they were able to spend more on clothes for
self, children, etc., as they have to spend the amount for food.
Table 4.92: Perception of personal gains - could able to get better or more wages
in agricultural sector
Block Yes No Total
Chawmanu 10 40 50
20.0% 80.0% 100.0%
Manu 6 44 50
12.0% 88.0% 100.0%
Total 16 84 100
16.0% 84.0% 100.0%
Field Survey, 2017.
After the introduction of MGNREGS, beneficiaries in both Chawmanu and Manu RD blocks
detected an increase in the wage rate in the agricultural sector. This is because, after the introduction
of the scheme, agricultural labourers opt for the work under MGNREGS as they were getting the
wages on time.
Table 4.93: Perception of personal gains - increase in wage negotiation capability
Block 0 Yes No Total
Chawmanu 1 5 44 50
2.0% 10.0% 88.0% 100.0%
Manu 5 45 50
10.0% 90.0% 100.0%
Total 1 10 89 100
1.0% 10.0% 89.0% 100.0%
Field Survey, 2017.

Livelihood Analysis of Vulnerable Groups (Differently Abled) under MGNREGS
88
Table 4.93 shows the perception of personal gains after engaging in MGNREGS such as
improved wage negotiation capability. In both Chawmanu and Manu RD blocks, a few of the
beneficiaries agreed that after engaging in MGNREGS, wage negotiation capability of the beneficiaries
was improved.
Table 4.94: Professional Issues - unity with other workers
Block Agree Agree to some extent Total
Chawmanu 34 16 50
68.0% 32.0% 100.0%
Manu 43 7 50
86.0% 14.0% 100.0%
Total 77 23 100
77.0% 23.0% 100.0%
Field Survey, 2017. Table 4.94 highlights the professional gains such as unity with other workers of the beneficiaries
after engaging in MGNREGS. The majority of the beneficiaries in Chawmanu RD block (68 per cent)
and in Manu RD block (86 per cent) agreed that after engaging in MGNREGS their unity with other
workers has improved.
The table highlighted the realisation of the personal abilities of the beneficiaries after engaging
in MGNREGS. It was observed that the majority of the beneficiaries in Chawmanu RD block (66 per
cent) and in Manu RD block (80 per cent) agreed that after engaging in MGNREGS, their realisation
about their personal ability has improved.
Table 4.95: Professional issues - realising more personal abilities
Block Agree Agree to some extent Total
Chawmanu 33 17 50
66.0% 34.0% 100.0%
Manu 40 10 50
80.0% 20.0% 100.0%
Total 73 27 100
73.0% 27.0% 100.0%
Field Survey, 2017.

Livelihood Analysis of Vulnerable Groups (Differently Abled) under MGNREGS
89
Table 4.96: Professional issues - rights and responsibilities of self
Block Agree Agree to some extent Total
Chawmanu 36 14 50
72.0% 28.0% 100.0%
Manu 41 9 50
82.0% 18.0% 100.0%
Total 77 23 100
77.0% 23.0% 100.0%
Field Survey, 2017.
Table 4.96 highlighted the self-right and responsibilities of the beneficiaries after engaging in
MGNREGS. It was observed that the majority of the beneficiaries - 72 per cent in Chawmanu RD
block and 82 per cent in Manu RD block - totally agreed that their awareness about self-right and
responsibilities have improved after participating in MGNREGS work.
Table 4.97: Professional issues - access to wider information
Block Agree Agree to some extent Total
Chawmanu 26 24 50
52.0% 48.0% 100.0%
Manu 27 23 50
54.0% 46.0% 100.0%
Total 53 47 100
53.0% 47.0% 100.0%
Field Survey, 2017.
Table 4.97 highlights the beneficiaries’ access to wider information after engaging in
MGNREGS. It was observed that the majority of them - 52 per cent in Chawmanu RD block and 54
per cent in Manu RD block - totally agreed that their access to information has improved after
participating in MGNREGS work. They are now more aware of their rights and benefits.
Table 4.98: Professional issues - technical information on works
Block Agree Agree to some extent Not aware Total
Chawmanu 2 47 1 50
4.0% 94.0% 2.0% 100.0%
Manu 16 33 1 50
32.0% 66.0% 2.0% 100.0%
Total 18 80 2 100
18.0% 80.0% 2.0% 100.0%
Field Survey, 2017.

Livelihood Analysis of Vulnerable Groups (Differently Abled) under MGNREGS
90
Table 4.98 highlights the awareness of the beneficiaries regarding technical information after
engaging in MGNREGS. It was observed that the majority of the beneficiaries - 94 per cent in
Chawmanu RD block and 66 per cent in Manu RD block - were agreed to some extent that their
technical information on work has improved after participating in MGNREGS work.
Table 4.99: Professional issues - measurement of works
Block Agree Agree to some extent Not aware Total
Chawmanu 1 48 1 50
2.0% 96.0% 2.0% 100.0%
Manu 5 44 1 50
10.0% 88.0% 2.0% 100.0%
Total 6 92 2 100
6.0% 92.0% 2.0% 100.0%
Field Survey, 2017.
Table 4.99 highlights the measurement of work in MGNREGS. It was observed that the
majority of the beneficiaries - 96 per cent in Chawmanu RD block and 88 per cent in Manu RD block
- agreed to some extent that the measurement of MGNREGS works has improved.
It was observed that the majority of the beneficiaries - 90 per cent in Chawmanu RD block and
92 per cent in Manu RD block - agreed to some extent that self-help among the differently abled
beneficiaries has improved after participating in MGNREGS work.
Table 4.100: Professional issues - self-help among workers
Block Agree Agree to some extent Not aware Total
Chawmanu 5 45 50
10.0% 90.0% 100.0%
Manu 3 46 1 50
6.0% 92.0% 2.0% 100.0%
Total 8 91 1 100
8.0% 91.0% 1.0% 100.0%
Field Survey, 2017.

Livelihood Analysis of Vulnerable Groups (Differently Abled) under MGNREGS
91
Block Agree Agree to some extent Not aware Total
Chawmanu 6 44 50
12.0% 88.0% 100.0%
Manu 4 45 1 50
8.0% 90.0% 2.0% 100.0%
Total 10 89 1 100
10.0% 89.0% 1.0% 100.0%
Field Survey, 2017. Table 4.101 highlights the interaction of the beneficiaries with the officials after engaging in
MGNREGS. It was observed that the majority of the beneficiaries -88 per cent in Chawmanu RD
block and 90 per cent in Manu RD block - agreed to some extent that their interaction with various
officials has improved after participating in MGNREGS work. Only a few beneficiaries in both the
RD blocks totally agreed that their interaction has improved.
Table 4.102: Professional issues - utility of works undertaken
Block Agree Agree to some extent Not aware Total
Chawmanu 3 47 50
6.0% 94.0% 100.0%
Manu 3 46 1 50
6.0% 92.0% 2.0% 100.0%
Total 6 93 1 100
6.0% 93.0% 1.0% 100.0%
Field Survey, 2017.
Table 4.101: Professional issues - interaction with officials
Table 4.102 highlights the utility of works undertaken in MGNREGS. It was observed that the
majority of the beneficiaries - 94 per cent in Chawmanu RD block and 92 per cent in Manu RD block
- agreed to some extent that the utility of MGNREGS work undertaken has improved.
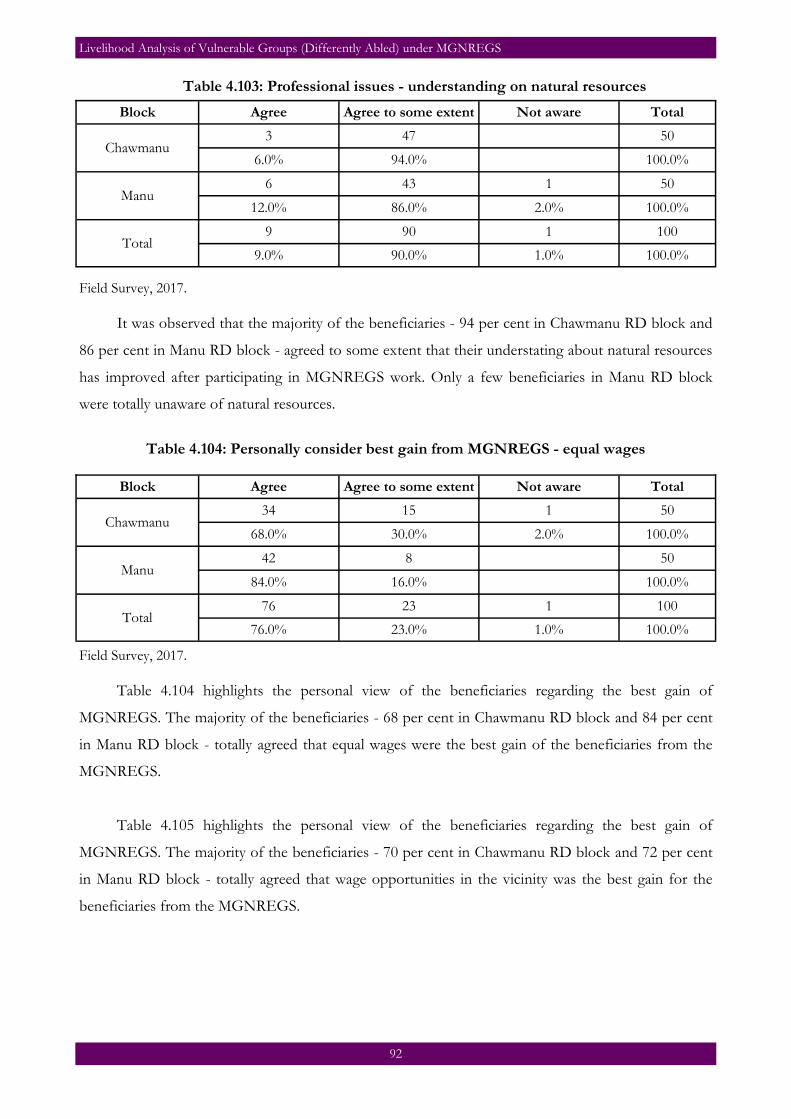
Livelihood Analysis of Vulnerable Groups (Differently Abled) under MGNREGS
92
Table 4.103: Professional issues - understanding on natural resources
Block Agree Agree to some extent Not aware Total
Chawmanu 3 47 50
6.0% 94.0% 100.0%
Manu 6 43 1 50
12.0% 86.0% 2.0% 100.0%
Total 9 90 1 100
9.0% 90.0% 1.0% 100.0%
Field Survey, 2017. It was observed that the majority of the beneficiaries - 94 per cent in Chawmanu RD block and
86 per cent in Manu RD block - agreed to some extent that their understating about natural resources
has improved after participating in MGNREGS work. Only a few beneficiaries in Manu RD block
were totally unaware of natural resources.
Table 4.104: Personally consider best gain from MGNREGS - equal wages
Block Agree Agree to some extent Not aware Total
Chawmanu 34 15 1 50
68.0% 30.0% 2.0% 100.0%
Manu 42 8 50
84.0% 16.0% 100.0%
Total 76 23 1 100
76.0% 23.0% 1.0% 100.0%
Field Survey, 2017. Table 4.104 highlights the personal view of the beneficiaries regarding the best gain of
MGNREGS. The majority of the beneficiaries - 68 per cent in Chawmanu RD block and 84 per cent
in Manu RD block - totally agreed that equal wages were the best gain of the beneficiaries from the
MGNREGS.
Table 4.105 highlights the personal view of the beneficiaries regarding the best gain of
MGNREGS. The majority of the beneficiaries - 70 per cent in Chawmanu RD block and 72 per cent
in Manu RD block - totally agreed that wage opportunities in the vicinity was the best gain for the
beneficiaries from the MGNREGS.
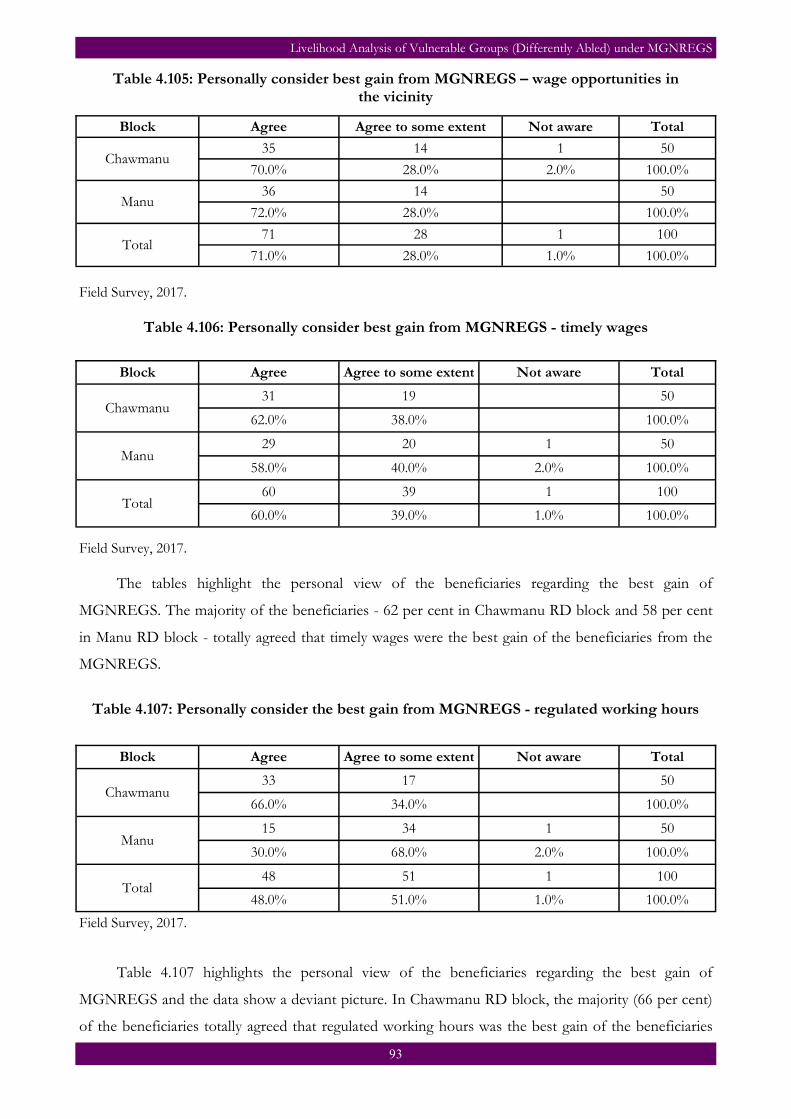
Livelihood Analysis of Vulnerable Groups (Differently Abled) under MGNREGS
93
Table 4.105: Personally consider best gain from MGNREGS – wage opportunities in the vicinity
Block Agree Agree to some extent Not aware Total
Chawmanu 35 14 1 50
70.0% 28.0% 2.0% 100.0%
Manu 36 14 50
72.0% 28.0% 100.0%
Total 71 28 1 100
71.0% 28.0% 1.0% 100.0%
Field Survey, 2017.
Table 4.106: Personally consider best gain from MGNREGS - timely wages
Block Agree Agree to some extent Not aware Total
Chawmanu 31 19 50
62.0% 38.0% 100.0%
Manu 29 20 1 50
58.0% 40.0% 2.0% 100.0%
Total 60 39 1 100
60.0% 39.0% 1.0% 100.0%
Field Survey, 2017. The tables highlight the personal view of the beneficiaries regarding the best gain of
MGNREGS. The majority of the beneficiaries - 62 per cent in Chawmanu RD block and 58 per cent
in Manu RD block - totally agreed that timely wages were the best gain of the beneficiaries from the
MGNREGS.
Table 4.107: Personally consider the best gain from MGNREGS - regulated working hours
Block Agree Agree to some extent Not aware Total
Chawmanu 33 17 50
66.0% 34.0% 100.0%
Manu 15 34 1 50
30.0% 68.0% 2.0% 100.0%
Total 48 51 1 100
48.0% 51.0% 1.0% 100.0%
Field Survey, 2017.
Table 4.107 highlights the personal view of the beneficiaries regarding the best gain of
MGNREGS and the data show a deviant picture. In Chawmanu RD block, the majority (66 per cent)
of the beneficiaries totally agreed that regulated working hours was the best gain of the beneficiaries
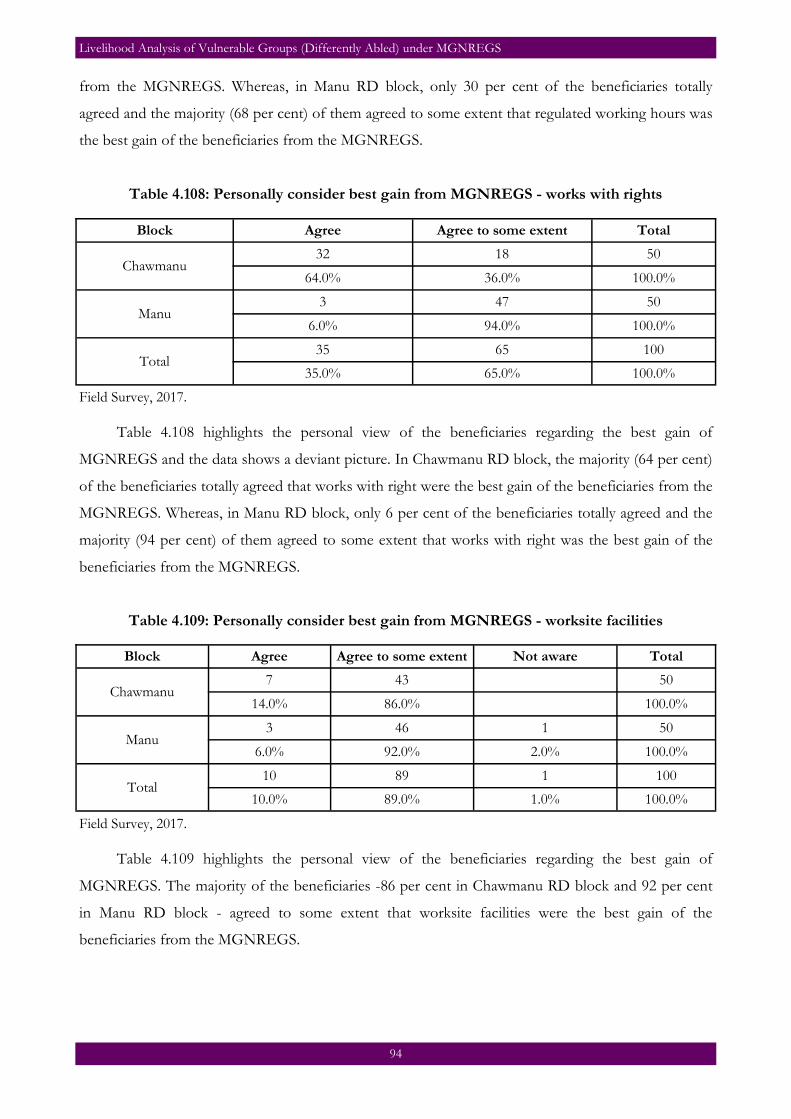
Livelihood Analysis of Vulnerable Groups (Differently Abled) under MGNREGS
94
from the MGNREGS. Whereas, in Manu RD block, only 30 per cent of the beneficiaries totally
agreed and the majority (68 per cent) of them agreed to some extent that regulated working hours was
the best gain of the beneficiaries from the MGNREGS.
Table 4.108: Personally consider best gain from MGNREGS - works with rights
Block Agree Agree to some extent Total
Chawmanu 32 18 50
64.0% 36.0% 100.0%
Manu 3 47 50
6.0% 94.0% 100.0%
Total 35 65 100
35.0% 65.0% 100.0%
Field Survey, 2017. Table 4.108 highlights the personal view of the beneficiaries regarding the best gain of
MGNREGS and the data shows a deviant picture. In Chawmanu RD block, the majority (64 per cent)
of the beneficiaries totally agreed that works with right were the best gain of the beneficiaries from the
MGNREGS. Whereas, in Manu RD block, only 6 per cent of the beneficiaries totally agreed and the
majority (94 per cent) of them agreed to some extent that works with right was the best gain of the
beneficiaries from the MGNREGS.
Table 4.109: Personally consider best gain from MGNREGS - worksite facilities
Block Agree Agree to some extent Not aware Total
Chawmanu 7 43 50
14.0% 86.0% 100.0%
Manu 3 46 1 50
6.0% 92.0% 2.0% 100.0%
Total 10 89 1 100
10.0% 89.0% 1.0% 100.0%
Field Survey, 2017. Table 4.109 highlights the personal view of the beneficiaries regarding the best gain of
MGNREGS. The majority of the beneficiaries -86 per cent in Chawmanu RD block and 92 per cent
in Manu RD block - agreed to some extent that worksite facilities were the best gain of the
beneficiaries from the MGNREGS.

Livelihood Analysis of Vulnerable Groups (Differently Abled) under MGNREGS
95
Table 4.110: Personally consider best gain from MGNREGS - reduced burden of distress migration
Block Agree Agree to some extent Not aware Total
Chawmanu 3 47 50
6.0% 94.0% 100.0%
Manu 1 47 2 50
2.0% 94.0% 4.0% 100.0%
Total 4 94 2 100
4.0% 94.0% 2.0% 100.0%
Field Survey, 2017.
Table 4.110 highlights the personal view of the beneficiaries regarding the best gain of
MGNREGS. The majority of the beneficiaries - 94 per cent in Chawmanu RD block and 94 per cent
in Manu RD block - agreed to some extent that reduced burden of distress was the best gain of the
beneficiaries from the MGNREGS.
Statistical tools and techniques
One of the objectives set for the study relates to studying the livelihoods of the sample
respondents’ households. This is accomplished by computing the average number of days of
employment each sample household got from MGNREGS and also the corresponding wages earned
by the households. To understand whether any pattern exists in employment levels and also the wages
across the recent years, (2013-14, 2014-15 and 2015-16), data were collected both on employment and
wages for these three years separately.
As can be gleaned from the Tables 4.111 to 4.113, some differences (both positive and negative)
are noticed both in employment and wage figures from 2013-14to 2015-16. But to examine whether
these differences are real in the populations from which the samples are drawn or they occurred
because of sampling fluctuations, paired t-test of significance has been carried out for two sets of data
separately for employment and wages, the sets being those that relate to 2013-14 and 2014-15, and
2014-15 and 2015-16. The results so obtained are presented in Table 4.113 and discussed in the
following paras:
Average number of days of employment: (t-ratio)
Table 4.113 gives the social group-wise average employment days from MGNREGS and it is
clear from the table that the ST households are found to be having an edge over other groups in all

Livelihood Analysis of Vulnerable Groups (Differently Abled) under MGNREGS
96
the three time periods. To test if the differences in the employment days of a given social group
between two successive years are significant, the following hypotheses are postulated:
Null Hypothesis (Ho: No significant difference exists in the average number of days of employment
of a given social group between – i) 2013-14 and 2014-15 and ii) 2014-15 and 2015-16 in the
populations).
The alternative hypothesis would be (H1: Significant difference exists in the employment days
between 2013-14 and 2014-15, and 2014-15 and 2015-16 in the populations).
As the analysis shows, t-ratios have turned out significant in respect of SCs and BCs - the
average employment days have registered an increase from 2013-14 to 2014-15. However, in the case
of 2014-15 and 2015-16, only SCs could register a significant increase in the average employment days,
as the test shows. This implies that we reject the null hypothesis (and accept the alternative hypothesis
in respect of SCs and BCs for the period 2013-14 and 2014-15. As regards the next period (2014-15
and 2015-16), the null hypothesis is rejected in respect of SCs only.
When a similar exercise is carried out for wages, it is seen that t-ratios are significant only in
respect of STs and BCs for data relating to 2013-14 and 2014-15. This implies that these two groups
of respondents (namely STs and BCs) could realise relatively higher wages (resulting in higher
differences) from 2013-14 to 2014-15 while the other two groups (SCs and ‘others’) could not show
any difference in the wages. And the interpretation would be that SCs and others were, by and large,
having the same wage levels in the populations.
As discussed in the report, there is a graduation in the number of days of employment the
sample respondents (not the households) got from the scheme - starting from 80 days on an average
in 2013-14 to 2015-16 to 96 days. When a similar analysis is done gender-wise, it is seen that woman
respondents derived larger benefit from the scheme in two years (2013-14 and 2015-16) than the male
counterparts and the difference is to the extent of 4 to almost 6 days on an average (Table 4.111)
An attempt was also made to identify the respondents, who were able to take more advantage of
the scheme in terms of larger employment days. The analysis in this regard reveals that out of three
types of disabilities, namely locomotor, hearing impaired and visually impaired, the visually impaired
stood to gain more from the scheme than the others. (It may be noted that this analysis is carried out
only to identify the nature of disability of the respondents deriving larger benefit but not to develop a
causal relationship between the disability – cause- and employment - days). And, this trend is by and

Livelihood Analysis of Vulnerable Groups (Differently Abled) under MGNREGS
97
large also in evidence in the gender-wise analysis of employment data across the major disabilities.
Female respondents have an edge over their male counterparts in accessing the scheme for
employment regardless of the nature of the disability.
No doubt, disability can be taken as a factor that may be associated with employment days (but
not a causal factor). More relevant than this is to understand how gender-wise employment days vary
based on the percentage of disability. The following table presents the results through which the two
issues can be further analysed.
Table 4.111: Nature of disability-wise & year-wise average employment days
Nature of Disability Gender Res_days_2013_14 Res_days_2014_15 Res_days_2015_16
Locomotor Disability
Male N 49 45 45 Mean 75.43 92.62 94.00
Female N 14 14 13 Mean 82.50 88.00 101.92
Total N 63 59 58 Mean 77.00 91.53 95.78
Hearing impaired
Male N 9 9 9 Mean 84.33 91.89 90.00
Female N 4 4 4 Mean 79.25 91.25 98.50
Total N 13 13 13 Mean 82.77 91.69 92.62
Visually impaired
Male N 8 8 8 Mean 85.25 92.63 92.75
Female N 7 7 7 Mean 85.43 93.00 95.43
Total N 15 15 15 Mean 85.33 92.80 94.00
Mentally impaired
Male N 1 1 1 Mean 104.00 111.00 101.00
Total N 1 1 1 Mean 104.00 111.00 101.00
Others Male
N 1 1 1 Mean 83.00 97.00 50.00
Total N 1 1 1 Mean 83.00 97.00 50.00
Total
Male N 68 64 64 Mean 78.29 92.87 92.70
Female N 25 25 24 Mean 82.80 89.92 99.46
Total N 93 89 88 Mean 79.51 92.04 94.55

Livelihood Analysis of Vulnerable Groups (Differently Abled) under MGNREGS
98
The following conclusions can be drawn from Table 4.112:
Regardless of gender and year, the average employment figures keep an increasing pace with
the percentage of disability (in other words, the higher the percentage of disability, the larger
is the employment. It is not clear how such a trend is occurring from the analysis). Is it
because respondents with a higher percentage of disability are preferred to others in
showing employment under the scheme?
Female respondents have an edge over the male counterparts in the receipt of employment
under the scheme across the three time points. It is also evident from the analysis that the
higher the percentage of disability, the larger is the extent of employment obtained,
especially by female respondents covered in the sample.
Table 4.112: Percentage of disability-wise & gender-wise average employment days
% of Disability Gender Res_days_2013_14 Res_days_2014_15 Res_days_2015_16
30
Male N 2 2 2
Mean 74.00 109.00 102.00
Female N 1 1 1
Mean 100.00 112.00 82.00
Total N 3 3 3
Mean 82.67 110.00 95.33
40
Male N 12 12 12
Mean 78.92 91.42 94.67
Female N 6 6 6
Mean 81.33 95.00 110.17
Total N 18 18 18
Mean 79.72 92.61 99.83
50
Male N 7 7 7
Mean 85.14 99.57 102.86
Total N 7 7 7
Mean 85.14 99.57 102.86
60
Male N 18 16 16
Mean 75.78 93.81 89.31
Female N 7 7 6
Mean 75.14 74.86 96.00
Total N 25 23 22
Mean 75.60 88.04 91.14
70
Male N 10 10 10
Mean 81.60 76.90 81.90
Female N 2 2 2
Mean 82.00 103.00 102.50
Total N 12 12 12
Mean 81.67 81.25 85.33

Livelihood Analysis of Vulnerable Groups (Differently Abled) under MGNREGS
99
80
Male N 11 9 9
Mean 74.09 93.56 91.67
Female N 4 4 4
Mean 87.50 88.00 92.25
Total N 15 13 13
Mean 77.67 91.85 91.85
100
Male N 8 8 8
Mean 79.75 102.50 100.00
Female N 5 5 5
Mean 88.40 96.80 98.80
Total N 13 13 13
Mean 83.08 100.31 99.54
Total
Male N 68 64 64
Mean 78.29 92.87 92.70
Female N 25 25 24
Mean 82.80 89.92 99.46
Total N 93 89 88
Mean 79.51 92.04 94.55
Several scheme-related dimensions have been considered in the study and they are aware of the
sample respondents on various issues relating to the employment guarantee scheme factors (100 days
of employment, right to employment, worksite facilities, etc.) that motivate the households to
participate in the programme like low market wages, need for migration, lack of skills, etc. Another
aspect is mandatory facilities to be provided at the worksite, including first aid, drinking water, crèche
and shade. A brief description of the items/factors that constitute each dimension is given below:
Awareness: Total score on awareness of the respondent households has been worked out on 16
factors constituting this dimension.
Motivation score: This dimension consists of 15 factors, including minimum wages, timely wages,
work taken up on their land, etc., and the reaction of the respondent to each factor has been captured
in terms of ‘yes’ or ‘no’ responses which are assigned scores of one and zero, respectively. The overall
score is arrived at by aggregating individual factor-wise score and this overall score represents the
motivation score of each respondent.
Mandatory facilities: The items considered under this dimension include first aid, drinking water,
crèche and shade and the responses have been sought in terms of ‘agree’, ‘agree to some extent’ and
‘not aware’ responses which are assigned scores of three, two and one, respectively. The overall score
is computed by aggregating factor-wise scores for each respondent.
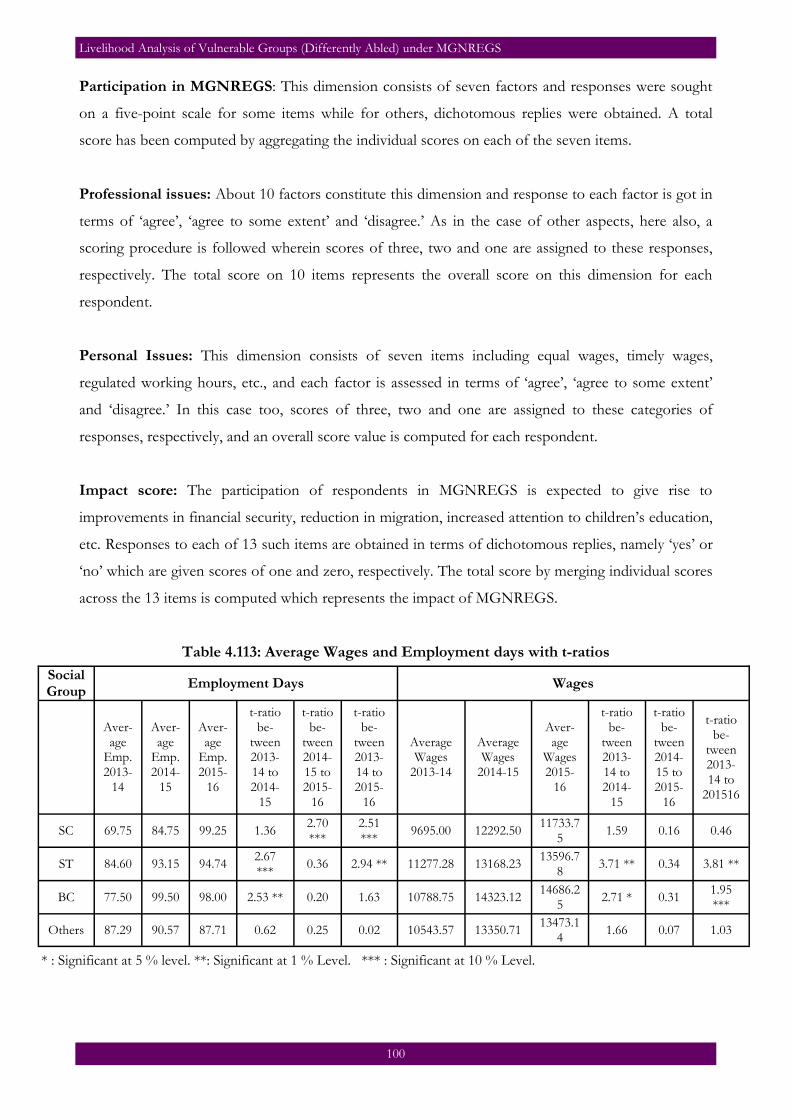
Livelihood Analysis of Vulnerable Groups (Differently Abled) under MGNREGS
100
Participation in MGNREGS: This dimension consists of seven factors and responses were sought
on a five-point scale for some items while for others, dichotomous replies were obtained. A total
score has been computed by aggregating the individual scores on each of the seven items.
Professional issues: About 10 factors constitute this dimension and response to each factor is got in
terms of ‘agree’, ‘agree to some extent’ and ‘disagree.’ As in the case of other aspects, here also, a
scoring procedure is followed wherein scores of three, two and one are assigned to these responses,
respectively. The total score on 10 items represents the overall score on this dimension for each
respondent.
Personal Issues: This dimension consists of seven items including equal wages, timely wages,
regulated working hours, etc., and each factor is assessed in terms of ‘agree’, ‘agree to some extent’
and ‘disagree.’ In this case too, scores of three, two and one are assigned to these categories of
responses, respectively, and an overall score value is computed for each respondent.
Impact score: The participation of respondents in MGNREGS is expected to give rise to
improvements in financial security, reduction in migration, increased attention to children’s education,
etc. Responses to each of 13 such items are obtained in terms of dichotomous replies, namely ‘yes’ or
‘no’ which are given scores of one and zero, respectively. The total score by merging individual scores
across the 13 items is computed which represents the impact of MGNREGS.
Table 4.113: Average Wages and Employment days with t-ratios
Social Group Employment Days Wages
Aver-age
Emp. 2013-
14
Aver-age
Emp. 2014-
15
Aver-age
Emp. 2015-
16
t-ratio be-
tween 2013-14 to 2014-
15
t-ratio be-
tween 2014-15 to 2015-
16
t-ratio be-
tween 2013-14 to 2015-
16
Average Wages
2013-14
Average Wages
2014-15
Aver-age
Wages 2015-
16
t-ratio be-
tween 2013-14 to 2014-
15
t-ratio be-
tween 2014-15 to 2015-
16
t-ratio be-
tween 2013-14 to
201516
SC 69.75 84.75 99.25 1.36 2.70 ***
2.51 ***
9695.00 12292.50 11733.7
5 1.59 0.16 0.46
ST 84.60 93.15 94.74 2.67 ***
0.36 2.94 ** 11277.28 13168.23 13596.7
8 3.71 ** 0.34 3.81 **
BC 77.50 99.50 98.00 2.53 ** 0.20 1.63 10788.75 14323.12 14686.2
5 2.71 * 0.31
1.95 ***
Others 87.29 90.57 87.71 0.62 0.25 0.02 10543.57 13350.71 13473.1
4 1.66 0.07 1.03
* : Significant at 5 % level. **: Significant at 1 % Level. *** : Significant at 10 % Level.

Livelihood Analysis of Vulnerable Groups (Differently Abled) under MGNREGS
101
Table 4.114: Average scores of motivation, awareness and participation
Social Group
Awareness score
Motivation score
Mandatory facilities
Participation MGNREGS
Professional issues
Personally issues
N
SC 8.20 6.00 6.20 4.80 15.40 10.60 5
ST 5.80 4.67 7.37 4.26 16.92 11.20 80
BC 5.25 5.00 7.75 4.12 16.00 10.62 8
Others 7.43 6.57 8.00 4.57 16.00 9.81 7

Livelihood Analysis of Vulnerable Groups (Differently Abled) under MGNREGS
102
CHAPTER – V
ANALYSIS OF VULNERABLE GROUPS (DIFFERENTLY ABLED PERSONS) – NON-BENEFICIARY
Introduction
In this chapter, an analysis of vulnerable groups (differently abled persons who are non-
beneficiaries of MGNREGS) has been recorded. A sample of 10 non-beneficiaries from each block
was identified, interviewed and taken as a control group. When compared with the beneficiaries of
MGNREGS, the lives of non-beneficiaries are miserable. In Table 5.1, the distribution of age of the
non-beneficiaries was recorded.
Table 5.1: Age-wise distribution of non-beneficiaries
Block <=39 40-62 Total
Chawmanu 9 1 10
90.0% 10.0% 100.0%
Manu 8 2 10
80.0% 20.0% 100.0%
Total 17 3 20
85.0% 15.0% 100.0%
Field Survey, 2017.
The table shows the distribution of the age of differently abled persons who were non-
beneficiaries. In Chawmanu RD block, almost all the non-beneficiaries of the scheme were aged 39
years or below. Only 10 per cent of them belonged to the age-group of 40 to 62 years. In Manu RD
block, 80 per cent of the non-beneficiaries were aged 39 years or below, followed by 20 per cent of
them who belonged to the age group of 40 to 62 years.

Livelihood Analysis of Vulnerable Groups (Differently Abled) under MGNREGS
103
Table 5.2: Gender-wise distribution of non-beneficiaries
Block Male Female Total
Chawmanu 6 4 10
60.0% 40.0% 100.0%
Manu 9 1 10
90.0% 10.0% 100.0%
Total 15 5 20
75.0% 25.0% 100.0%
Field Survey, 2017. The table highlights the gender-wise distribution of non-beneficiaries in Chawmanu and Manu
RD blocks. In both the RD blocks, the majority of the non-beneficiaries were males. Only 40 per cent
of non-beneficiaries in Chawmanu RD block and 10 per cent in Manu RD block were females.
Table 5.3: Marital Status-wise distribution of non-beneficiaries
Block Unmarried Married Total
Chawmanu 6 4 10
60.0% 40.0% 100.0%
Manu 7 3 10
70.0% 30.0% 100.0%
Total 13 7 20
65.0% 35.0% 100.0%
Field Survey, 2017. In the study area, the majority (60 per cent) of the beneficiaries in Chawmanu RD block and 70
per cent in Manu RD block were unmarried.
Table 5.4: Types of family of non-beneficiaries
Block Nuclear Joint Total
Chawmanu 5 5 10
50.0% 50.0% 100.0%
Manu 6 4 10
60.0% 40.0% 100.0%
Total 11 9 20
55.0% 45.0% 100.0%
Field Survey, 2017.
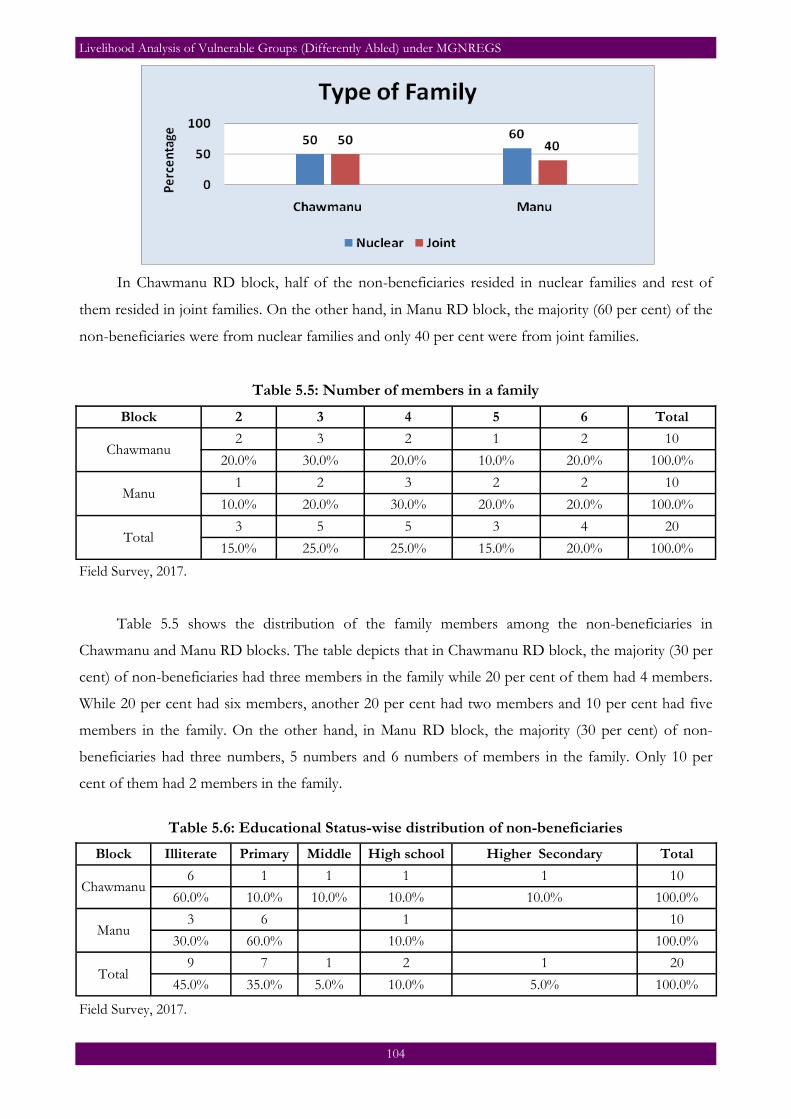
Livelihood Analysis of Vulnerable Groups (Differently Abled) under MGNREGS
104
In Chawmanu RD block, half of the non-beneficiaries resided in nuclear families and rest of
them resided in joint families. On the other hand, in Manu RD block, the majority (60 per cent) of the
non-beneficiaries were from nuclear families and only 40 per cent were from joint families.
Table 5.5: Number of members in a family
Block 2 3 4 5 6 Total
Chawmanu 2 3 2 1 2 10
20.0% 30.0% 20.0% 10.0% 20.0% 100.0%
Manu 1 2 3 2 2 10
10.0% 20.0% 30.0% 20.0% 20.0% 100.0%
Total 3 5 5 3 4 20
15.0% 25.0% 25.0% 15.0% 20.0% 100.0%
Field Survey, 2017.
Table 5.5 shows the distribution of the family members among the non-beneficiaries in
Chawmanu and Manu RD blocks. The table depicts that in Chawmanu RD block, the majority (30 per
cent) of non-beneficiaries had three members in the family while 20 per cent of them had 4 members.
While 20 per cent had six members, another 20 per cent had two members and 10 per cent had five
members in the family. On the other hand, in Manu RD block, the majority (30 per cent) of non-
beneficiaries had three numbers, 5 numbers and 6 numbers of members in the family. Only 10 per
cent of them had 2 members in the family.
Table 5.6: Educational Status-wise distribution of non-beneficiaries
Block Illiterate Primary Middle High school Higher Secondary Total
Chawmanu 6 1 1 1 1 10
60.0% 10.0% 10.0% 10.0% 10.0% 100.0%
Manu 3 6 1 10
30.0% 60.0% 10.0% 100.0%
Total 9 7 1 2 1 20
45.0% 35.0% 5.0% 10.0% 5.0% 100.0%
Field Survey, 2017.

Livelihood Analysis of Vulnerable Groups (Differently Abled) under MGNREGS
105
Table 5.6 highlights the educational status of the non-beneficiaries in Chawmanu and Manu RD
blocks. In Chawmanu block, the majority (60 per cent) of the non-beneficiaries were illiterate, 10 per
cent completed primary level of education, 10 per cent completed middle school (Class VI-VIII) and
10 per cent completed high school and 10 per cent completed higher secondary level. In Manu RD
block, the majority (60 per cent) of the non-beneficiaries completed the primary level of education, 30
per cent were illiterate and only 10 per cent completed high school.
Table 5.7: Social group-wise distribution of non-beneficiaries
Block SC ST Total
Chawmanu 10 10
100.0% 100.0%
Manu 4 6 10
40.0% 60.0% 100.0%
Total 4 16 20
20.0% 80.0% 100.0%
Field Survey, 2017.
Table 5.7 depicts that all the non-beneficiaries in Chawmanu RD block belonged to the
Scheduled Tribes category. In Manu RD block, the majority (60 per cent) of the non-beneficiaries
belonged to the Scheduled Tribes category and 40 per cent were from Scheduled Castes.

Livelihood Analysis of Vulnerable Groups (Differently Abled) under MGNREGS
106
Table 5.8: Religion-wise distribution of non-beneficiaries
Block Hindu Christian Buddhists Other Total
Chawmanu 4 1 3 2 10
40.0% 10.0% 30.0% 20.0% 100.0%
Manu 10 10
100.0% 100.0%
Total 14 1 3 2 20
70.0% 5.0% 15.0% 10.0% 100.0%
Field Survey, 2017. Table 5.8 highlights that all the non-beneficiaries of the Manu RD block were from Hindu
community. On the other hand, 40 per cent of the non-beneficiaries in Chawmanu RD block followed
Hinduism, 30 per cent followed Buddhism, 10 per cent followed Christianity and 20 per cent followed
either Islam or others.
Table 5.9: Distribution of Members
Block Adult Male
Adult Female
Adult Total
Children male
Children female
Children Total
Chawmanu 12 14 26 5 1 6
Manu 23 16 39 1 1 2
Total 35 30 65 6 2 8
Field Survey, 2017.
Table 5.9 depicts that in Chawmanu RD block, there were 26 adult members and 6 children in
the family of non-beneficiaries. Majority of the adult members were female whereas the majority of
children were males. In the Manu RD block, there were 39 adult members and 2 children in the family
of non-beneficiaries. Majority of the adult members were males.
Block Don’t have Agriculture
Agri Labour
Non-Agri Labour Business Other Total
Chawmanu - 5 2 1 1 1 10
- 50.0% 20.0% 10.0% 10.0% 10.0% 100.0%
Manu 9 - - 1 - - 10
90.0% - - 10.0% - - 100.0%
Total 9 5 2 2 1 1 20
45.0% 25.0% 10.0% 10.0% 5.0% 5.0% 100.0%
Field Survey, 2017.
Table 5.10: Distribution by primary occupation

Livelihood Analysis of Vulnerable Groups (Differently Abled) under MGNREGS
107
The primary occupational status of non-beneficiaries of MGNREGS shows a gloomy picture.
Table 5.10 depicts that in Chawmanu RD block, the majority (50 per cent) of the non-beneficiaries
were engaged in agriculture whereas 20 per cent were agricultural labourers, 10 per cent were non-
agricultural labourers and 10 per cent were engaged in business. On the contrary, in Manu RD block,
90 per cent of the non-beneficiaries were not engaged in any occupation whereas only 10 per cent
were non-agricultural labourers. During the survey, it was observed that the non-beneficiaries of
MGNREGS depend on agriculture and related activities as their primary occupation.
Table 5.11: Distribution by secondary occupation
Block Don’t have Agriculture Agri Labour Non-Agri Labour Other Total
Chawmanu 1 2 3 2 2 10
10.0% 20.0% 30.0% 20.0% 20.0% 100.0%
Manu 8 - - 2 - 10
80.0% - - 20.0% - 100.0%
Total 9 2 3 4 2 20
45.0% 10.0% 15.0% 20.0% 10.0% 100.0%
Field Survey, 2017.
Other than the primary occupation, 30 per cent of the non-beneficiaries of MGNREGS of
Chawmanu RD block were agricultural labourers, 10 per cent were engaged in agriculture, and 20 per
cent were non-agricultural labourers. In Manu RD block, 80 per cent of the non-beneficiaries did not
have any secondary occupation and only 20 per cent were non-agricultural labourers.

Livelihood Analysis of Vulnerable Groups (Differently Abled) under MGNREGS
108
Table 5.12: Nature of Disability
Block Locomotor Disability Hearing impaired Visually impaired Others Total
Chawmanu 4 2 2 2 10
40.0% 20.0% 20.0% 20.0% 100.0%
Manu 5 2 2 1 10
50.0% 20.0% 20.0% 10.0% 100.0%
Total 9 4 4 3 20
45.0% 20.0% 20.0% 15.0% 100.0%
Field Survey, 2017.
Table 5.12 shows the nature of the disability of the non-beneficiaries among the Chawmanu and
Manu RD blocks. In Chawmanu RD block, the majority (40 per cent) of the non-beneficiaries had
locomotor disability, 20 per cent of them were hearing impaired, 20 per cent of them were visually
impaired. On the other hand, the majority (50 per cent) of the non-beneficiaries in Manu RD block
have locomotor disability, 20 per cent were hearing impaired and 20 per cent of them were visually
impaired.
Block 30 40 60 70 80 90 100 Total
Chawmanu 2 1 2 1 4 10
20.0% 10.0% 20.0% 10.0% 40.0% 100.0%
Manu 1 2 2 1 4 10
10.0% 20.0% 20.0% 10.0% 40.0% 100.0%
Total 2 1 1 4 3 1 8 20
10.0% 5.0% 5.0% 20.0% 15.0% 5.0% 40.0% 100.0%
Field Survey, 2017.
Table 5.13: Percentage of disability

Livelihood Analysis of Vulnerable Groups (Differently Abled) under MGNREGS
109
Table 5.13shows the percentage of the disability among the non-beneficiaries in Chawmanu and
Manu RD blocks. In Chawmanu RD block, 40 per cent of the non-beneficiaries were having 100 per
cent of disability, 20 per cent had 30 per cent of disability, 10 per cent had 40 per cent and 10 per cent
had 80 per cent of disability. In Manu RD block, 40 per cent of the non-beneficiaries were having 100
per cent of disability, around 20 per cent had 70 per cent of disability, 20 per cent had 80 per cent of
disability and 10 per cent had 90 per cent of disability. It is to be mentioned that in both RD blocks,
the majority of the non-beneficiaries were having 60 per cent of disability or more.
Table 5.14: Details of non-beneficiaries getting disability pension from GP
Block Yes No Total
Chawmanu 2 8 10
20.0% 80.0% 100.0%
Manu 9 1 10
90.0% 10.0% 100.0%
Total 11 9 20
55.0% 45.0% 100.0%
Field Survey, 2017.
Data in Table 5.14 on the disability pension depict a deviant picture. It was observed that the
majority (80 per cent) of the non-beneficiaries in Chawmanu RD block were not getting disability
pension. On the other hand, the majority (90 per cent) of the non-beneficiaries in Manu RD block
were getting disability pension.
Table 5.15: Details of disability pension received by non-beneficiaries per month
Block 500 600 Total
Chawmanu 1 1 2
50.0% 50.0% 100.0%
Manu 6 3 9
66.7% 33.3% 100.0%
Total 7 4 11
63.6% 36.4% 100.0%
Field Survey, 2017.
In Chawmanu RD block, half of the non-beneficiaries of the MGNREGS were getting monthly
disability pension of Rs. 500 and the rest were getting Rs.600. In Manu RD block, the majority (66.7
per cent) were getting Rs.500 and 33.3 per cent were getting Rs.600.

Livelihood Analysis of Vulnerable Groups (Differently Abled) under MGNREGS
110
Table 5.16: Nature of Disability (Social Group-wise)
Social Group
Nature of Disability Total
Locomotor Disability
Hearing impaired
Visually im-paired
Mentally impaired
Others
SC 4 1 5
80.0% 20.0% 100.0%
ST 56 11 11 2 80
70.0% 13.8% 13.8% 2.5% 100.0%
BC 2 2 3 1 8
25.0% 25.0% 37.5% 12.5% 100.0%
Others 6 1 7
85.7% 14.3% 100.0%
Total 68 14 15 2 1 100
68.0% 14.0% 15.0% 2.0% 1.0% 100.0%
Table 5.17: Percentage of Disability (Social Group-wise)
Social Group
Percentage of Disability Total
30 40 50 60 70 80 100
SC 2 1 2 5
40.0% 20.0% 40.0% 100.0%
ST 3 13 8 18 12 14 12 80
3.8% 16.2% 10.0% 22.5% 15.0% 17.5% 15.0% 100.0%
BC 1 3 2 2 8
12.5% 37.5% 25.0% 25.0% 100.0%
Others 2 3 1 1 7
28.6% 42.9% 14.3% 14.3% 100.0%
Total 3 18 9 26 13 16 15 100
3.0% 18.0% 9.0% 26.0% 13.0% 16.0% 15.0% 100.0%

Livelihood Analysis of Vulnerable Groups (Differently Abled) under MGNREGS
111
CHAPTER – VI
MAJOR FINDINGS
Findings from the surveyed area
1. In both the surveyed areas, MGNREGS beneficiaries were in the aged 39 years or below
and were married.
2. Although the female participation rate in MGNREGS work is much higher than their male
counterparts in Tripura, it was seen that among the differently abled beneficiaries, the
participation of male beneficiaries was more than their female counterparts.
3. In the study area, the majority of the beneficiaries resided in joint families having 4 members
or more in the family. The average size of household in Chawmanu was 4.1 whereas it was
3.9 in Manu RD block.
4. In Chawmanu RD block, the majority (32 per cent) of beneficiaries have completed primary
level of education (i.e. from Class I-V) and a significant portion of beneficiaries (i.e. around
28 per cent) was still illiterate. In Manu RD block, the majority (60 per cent) of the
beneficiaries have completed the primary level of education. When compared, the
educational status of beneficiaries of Manu RD block was better than that of Chawmanu
RD block.
5. In both RD blocks, almost all the beneficiaries belonged to Scheduled Tribes (ST) category.
6. In Manu RD block, almost all the beneficiaries belonged to the Hindu community followed
by beneficiaries who profess Christianity. In Chawmanu RD block, beneficiaries generally
belonged to almost all the religions such as Hinduism, Islam, Christianity and Buddhism.
7. The beneficiaries of Chawmanu RD block either opt for agriculture or related works such as
agricultural labourer as their primary occupation. In Manu RD block, beneficiaries opt for
non-agricultural labourer, agriculture, skilled labour or business as their primary occupation.
During the survey, it was observed that MGNREGS beneficiaries depend on agriculture and
related activities as their primary occupation.
8. In Chawmanu RD block, 24 per cent of the MGNREGS beneficiaries did not have any
secondary occupation. Around 30 per cent of them had agriculture as their secondary
occupation and 22 per cent were non-agricultural labourers. In Manu RD block, the
majority (54 per cent) of the beneficiaries were non-agricultural labourers and 24 per cent of
them worked as an agricultural labourer for their additional income.
9. Around 80 members in Chawmanu RD block and 73 members in Manu RD block were
employed under the MGNREGS. The average wage amounts gradually increased in both
the RD blocks and the average man-days have also increased. The better performance of

Livelihood Analysis of Vulnerable Groups (Differently Abled) under MGNREGS
112
Tripura in implementing MGNREGS reflects the success story of the State. This has helped
Tripura to consistently secure top ranks among the States in the country in the
implementation of the MGNREGS.
10. Majority of beneficiaries - 82 per cent in Chawmanu RD block and 54 per cent in Manu RD
block - were having a locomotor disability. In Chawmanu RD block, 6 per cent of the
beneficiaries have hearing impairment and visual impairment and around 4 per cent of them
were mentally retarded. On the contrary, in Manu RD bock 24 per cent of them were
visually impaired and 22 per cent were hearing impaired. Among the beneficiaries, there
were no mentally retarded persons in Manu RD block. In both RD blocks, the majority of
the beneficiaries were having 60 per cent of disability or more.
11. At the time of formation, 359 group members in Chawmanu RD block were enlisted in the
SSS group. At present, the number of members has been reduced to 358. Majority of the
groups were heterogeneous and a few of them were homogenous. In Manu RD block, 492
group members were enlisted at the time of formation and at present, only 489 numbers of
members existed in this group and it was heterogeneous. The homogeneous group
comprised of ST members. The registration of the groups was highest in Manu RD block in
comparison to Chawmanu RD block.
12. In both Chawmanu and Manu RD blocks, the male members were the earning member in
most of the families. Despite several initiatives of the government and line departments, a
large number of women were found not to be a part of the earning sector.
13. In the study areas in both the blocks, a major portion of land, i.e. 103.75 acres in Chawmanu
RD block and 95.25 acres in Manu RD block was dryland and a large portion of it (67 acres
in Chawmanu and 74.25 acres in Manu) was used for dryland cultivation.
14. All the MGNREGS beneficiaries in both Chawmanu RD block and Manu RD block hold a
white ration card.
15. In both the study areas, the participation of beneficiaries in various local institutions such as
SHGs, village-level organisations, watershed committee, Mahila Mandali, religious
organisations, PRIs and others was very low. Only a few of them were members of SHGs,
PRIs and the others which depict a gloomy picture. Despite various policies and programme
for persons with disabilities, the service provider failed to include the differently abled in the
development programmes and therefore, the fruit of the benefits of development was still
beyond their reach.
16. In both Chawmanu and Manu RD blocks, the majority of the beneficiaries agreed that
MGNREGS was beneficial to them.
17. In Chawmanu and Manu RD blocks, 24 per cent and 16 per cent of the beneficiaries,
respectively, agreed that the developmental programmes accessed by them were beneficial.

Livelihood Analysis of Vulnerable Groups (Differently Abled) under MGNREGS
113
18. All the beneficiaries of both Chawmanu and Manu RD blocks have attended Gram Sabha
meetings.
19. The participation of beneficiaries in the village development activities is better. This
highlighted the better performance of the PRI system in village-level activities that ensures
participatory rural development.
20. The majority of the beneficiaries in Chawmanu and Manu RD blocks have not participated
in CBO activities. Only 12 per cent of beneficiaries in Chawmanu RD block and 4 per cent
of them in Manu RD block participated in CBO activities.
21. In both Chawmanau and Manu RD blocks, the majority of beneficiaries participated in
Rozgar Diwas. In Chawmanu only 18 per cent and 2 per cent of them participated,
respectively, in social audit and income generating schemes. In Manu RD block, none of
them participated in social audit whereas only 2 per cent participated in IGS.
22. The sharing of ideas was not prevalent among the beneficiaries of Chawmanu and Manu
RD blocks. Among the beneficiaries who have shared their ideas, only 20 per cent of them
think that sometimes their ideas were considered.
23. In both Chawmanu and Manu RD blocks, the majority of the beneficiaries were informed
through PRI members. Only a few of them were informed by government officials and
fellow workers. This highlights that in both the surveyed villages, PRIs were playing an
active role in the dissemination of information to the beneficiaries.
24. The majority of beneficiaries of both RD blocks admit that the information about the
scheme was instantly available to them.
25. In both the study areas, the majority of the beneficiaries agree to some extent about the
essentiality of literacy skill to avail information about MGNREGS.
26. All the beneficiaries of Chawmanu RD block were aware of100 days of employment in a
financial year. On the contrary, in Manu RD block, 94 per cent of them were aware of it
whereas 6 per cent had little idea.
27. In both Chawmanu and Manu RD blocks, almost all the beneficiaries were aware of their
right to employment.
28. Awareness level among the beneficiaries regarding wage employment, worksite facilities and
the period of wages in local areas was better in Manu RD block in comparison to
Chawmanu RD block.
29. In both Chawmanu and Manu RD blocks, the awareness level of beneficiaries was not
satisfactory regarding prescribed wages, exclusive manual work for the differently abled
beneficiaries, type of works for the differently abled, mate system, work on demand medical
aid/ treatment, travel allowances and timely wage payment entitled under MGNREGS.

Livelihood Analysis of Vulnerable Groups (Differently Abled) under MGNREGS
114
30. Majority of the beneficiaries in both Chawmanu and Manu RD blocks were aware that a
differently abled person was also entitled to equal wages as their non-disabled peers.
31. Although the social audit is an important process in MGNREGS to review the functioning
of the scheme, yet it was observed that the majority of the beneficiaries in both Chawmanu
and Manu RD blocks were unaware of the social audit in MGNREGS. In Chawmanu and
Manu RD blocks, only 26 per cent and 38 per cent of the beneficiaries, respectively, were
aware of the social audit in MGNREGS.
32. The major activities done by the coordinator were awareness generation, monthly review
progress and organisation of the monthly meeting.
33. Although the majority of beneficiaries in Manu RD block were getting disability pension, yet
around 28 per cent and 10 per cent of beneficiaries in Chawmanu RD and Manu RD
blocks, respectively, were still out of reach of the pension which needs significant attention.
In the study area, it was seen that there was variation in the amount of disability pension.
Some of the beneficiaries were getting Rs.400 while others were getting. 500, Rs. 700 and
Rs.1000. This highlighted an alarming issue and seeks keen attention of the service provider.
All the beneficiaries receive their disability pension through their bank accounts.
34. Beneficiaries of MGNREGS were aware of the modified tools and also about the assistive
device. Majority of the beneficiaries were still using general equipment at the worksite.
35. Most of the beneficiaries in both Chawmanu and Manu RD blocks were aware of the labour
group which was heterogeneous in nature.
36. In both Chawmanu and Manu RD blocks, the beneficiaries either fully agreed or agreed to
some extent that mandatory facilities such a first aid, drinking water, crèche facility,
provision of shade should be provided at the MGNREGS worksite.
37. Beneficiaries were not fully aware of approaching the officials or others for job cards,
seeking work within 15 days of demand, or timely wage payment and other facilities. Only a
few of them were having interaction with the officials.
38. Majority of the beneficiaries in both RD blocks got the information about MGNREGS
work from their respective Gram Panchayats (GPs). Only a few of them got information
from SHGs, government officials and rozgarsevaks.
39. Beneficiaries of the study areas felt that insufficient agricultural activity, low market wages,
migration, illiteracy, lack of skills, flood, drought and lack of continuous work were
responsible for low participation in MGNREGS.
40. In Chawmanu RD block, the majority (92per cent) of the beneficiaries identified minimum
wages as the motivating factor for participation in the MGNREGS followed by support of
the family, timely wages and equal wages. Very few beneficiaries identified group
arrangement, mode of payment, NGOs encouragement, SHG membership and the attitude
Livelihood Analysis of Vulnerable Groups (Differently Abled) under MGNREGS
115
of the officials as the motivating factors. Similarly, in Manu RD block, all the beneficiaries
identified minimum wages as the motivating factor followed by timely wages, work taken
upon their land, creation of beneficial assets, worksite facilities, mode of payment and
attitude of officials as the motivating factors to participate in the work under MGNREGS.
Very few beneficiaries identified equal wages, group arrangement, NGOs encouragement
and SHG membership as the motivating factors.
41. Almost all the beneficiaries either agreed or agreed to some extent that financial security,
reduction of migration and houses under IAY were some of the personal gains that the
beneficiaries achieved after participation in MGNREGS.
42. In Chawmanu RD block, the majority (82 per cent) of the beneficiaries felt that there was
no land development after the introduction of the scheme. On the contrary, in Manu RD
block, 60 per cent of the beneficiaries admitted that land was developed by the MGNREGS.
43. The beneficiaries felt that their involvement in MGNREGS affected their level of intensity
of personal care of children/better care of infants and attention on the education of
children. This seeks kind attention of the MGNREGS official and related service provider
to ensure better care of an infant at the worksite and other facilities which will lead to
improvement in the participation rate.
44. The beneficiaries also felt that after the participation of MGNREGS, there was an
improvement in household savings, expenditure in health-related issues, expenditure on
food and clothing, wage rate in agriculture and negotiation capability of the beneficiaries.
45. The beneficiaries felt that after the employment in MGNREGS, the alcohol consumption of
the head of the household has not increased which reflects a positive picture.
46. Beneficiaries either fully agreed or partially agreed that participation in MGNREGS has
improved some of the professional issues such as unity with other workers, realisation of
personal abilities, self-right and responsibilities, access of beneficiaries to wider information,
technical information about MGNREGS work, measurement of work, self-help among the
differently abled beneficiaries, interaction of the beneficiaries with various officials, utility of
MGNREGS work and understanding about natural resources.
47. Majority of the beneficiaries agreed that equal wages, wage opportunities in the vicinity
timely wages regulated working hours, work with right, worksite facilities and reduced
burden of distress were the best gain from the MGNREGS.

Livelihood Analysis of Vulnerable Groups (Differently Abled) under MGNREGS
116
Findings from Focus Group Discussion
1. MGNREGS was the only source of income/livelihood for the poor and the differently
abled persons in the lean period.
2. It was learnt that the differently abled persons were getting employment opportunities only
through MGNREGS as there were no other employment opportunities.
3. Those who possess land and agriculture have other sources of livelihood.
4. People with 50 per cent of disability (locomotor) were able to access at least 50-80 person-
days in a year under MGNREGS.
5. Differently abled persons face a lot of discrimination at the worksite.
6. As we are aware that MGNREGS works are at piece rate at the time of work distribution,
the abled bodies are reluctant to take the differently abled persons in the group. This has
caused a psychological disturbance with the challenged.
7. Three members revealed that they were not called by their names but were addressed by
their disabilities.
8. It was found that the lives of non-MGNREGS beneficiaries were miserable; some of them
do not even get the social benefit (pension, etc.).
9. Some of the non-MGNREGS beneficiaries did not get the job cards and the GP president
is reluctant to accept their written application because they do not support his/her political
party.
10. None of the MGNREGS beneficiaries is aware of their rights and entitlements and
permissible works.
11. Majority of the beneficiaries feel proud that they are able to contribute additional income
to their family. Majority of them feel that MGNREGS is the only source of income for
their family.
12. Differently abled people accessing MGNREGS were given hard works at the worksite and
officials were silent about these kinds of issues in few cases.
13. Some of the differently abled persons reveal that skill development activities like computer
training, soft skills, etc., should be given.
14. The major finding of the study is that MGNREGS is creating employment opportunity to
the differently abled persons by allowing them to have a life with dignity, providing an
opportunity to have good meals thrice a day and supporting their children’s education.

Livelihood Analysis of Vulnerable Groups (Differently Abled) under MGNREGS
117
Findings from the field from non-beneficiary of the MGNREG scheme
1. Majority of the differently abled persons aged 39 years or below were the beneficiaries of
the MGNREGS, yet many of them were still not receiving the benefits of the scheme.
2. In both the RD blocks, the majority of the non-beneficiaries were males.
3. In the study area, the majority of non-beneficiaries were unmarried.
4. In Chawmanu RD block, half of the non-beneficiaries resided in nuclear families and the
rest in joint families. On the other hand, the majority (60 per cent) of the non-
beneficiaries in Manu RD block were from nuclear families.
5. In both the RD blocks, the majority of the family of non-beneficiaries have four or more
members in the family.
6. In Chawmanu block, the majority of the non-beneficiaries (60 per cent) were illiterate and
in Manu RD block, majority of the non-beneficiaries (60 per cent) have completed only
primary level of education. The educational status of the non-beneficiaries was very poor
in comparison to the educational status of the beneficiary of the MGNREG scheme.
7. In Chawmanu RD block, all the non-beneficiaries belonged to Scheduled Tribes category.
In Manu RD block, 60 per cent and 40 per cent of the non-beneficiaries, respectively,
belonged to Scheduled Tribes and Scheduled Castes.
8. All the non-beneficiaries of Manu RD block were Hindus. On the other hand in
Chawmanu RD block non-beneficiaries belonged to different religions such as Hinduism,
Buddhism, Christianity, Islam or others.
9. Majority of the family members of the non-beneficiaries were adults; only a few were
children and the situation was the same in both the RD blocks.
10. The primary occupational status of non-beneficiaries of MGNREGS shows a gloomy
picture. In Chawmanu RD block, the non-beneficiaries were engaged in agriculture. Few
of them were either agricultural labourers or non-agricultural labourers and few were
engaged in business. On the contrary, the majority of the non-beneficiaries in Manu RD
block were not engaged in any occupation whereas only 10 per cent of them were non-
agricultural labourers. As a secondary occupation, non-beneficiaries chose agriculture or
related activities.
11. In both Chawmanu and Manu RD blocks, the majority of the non-beneficiaries had
locomotor disability, followed by persons with hearing impairment and visual impairment.
12. In Chawmanu RD block, 40 per cent of the non-beneficiaries were having 100 per cent
disability, followed by non-beneficiaries with 30 per cent of disability, 40 per cent and 80
per cent disability. On the other hand, 40 per cent of the non-beneficiaries in Manu RD
block were having 100 per cent disability followed by non-beneficiaries with 70 per cent,

Livelihood Analysis of Vulnerable Groups (Differently Abled) under MGNREGS
118
80 per cent disability, 10per cent and 90 per cent disability. It is to be mentioned that in
both RD blocks, the majority of the non-beneficiaries were having 60 per cent disability
or more.
13. The condition of the non-beneficiaries in Chawmanu RD block was worse than that of
their counterparts in Manu RD block. Around 80 per cent of the non-beneficiaries in
Chawmanu RD block were not getting disability pension. But in Manu RD block, 90 per
cent of them were getting disability pension. In Chawmanu RD block, half of the non-
beneficiaries of the MGNREGS were getting disability pension of Rs. 500 and the rest
were getting Rs.600 per month. In Manu RD block, 66.7 per cent of the non-beneficiaries
were getting Rs.500 and 33.3 per cent of them were getting Rs.600.
Summary & Conclusion
Differently abled people are one of the largest vulnerable groups in the world and are starved of
services and facilities provided to their non-disabled peers. Being differently abled, they face many
challenges like lack of access to education, employment, better quality of living, etc., and their
situation is worsened by the negative attitude of society. Despite various initiatives of the government
still, the fruits of benefits have not reached the target group. The Mahatma Gandhi National Rural
Employment Guarantee Act becomes an important source of economic and employment support for
PwDs in rural areas.
The study reveals that though the participation of differently abled persons in the scheme is very
low, yet their participation is gradually increasing day by day which depicts a positive picture. The
awareness level of the differently abled has increased due to their participation in employment. The
employment in the scheme makes them more financially secured, aware, enable them to interact with
various officials, and negotiate the wage rate, participate in various local-level institutions and share
ideas, which in turn, enrich their self-dignity, and reduce the negative attitude of the family and
society. They felt that after the introduction of the scheme, there is a noticeable improvement in land
development, increase in wage rate in agriculture, reduction in distress migration, improvement in
access of rural people to wider information and betterment in their understanding of natural
resources.
The study also revealed some lacunas such as personal care of children, better care of infant
children, negative attitude of non-disabled workers, etc., which seeks kind attention of the
MGNREGS officials and related service providers in ensuring better participation to continue the
success of the state of Tripura in providing the highest number of person-days to the rural and
vulnerable poor.

Livelihood Analysis of Vulnerable Groups (Differently Abled) under MGNREGS
119
Conclusion
There are several GoI programmes facilitated for the benefit of differently abled persons to
promote livelihood opportunities. Some of the programmes like NRLM, MGNREGS and PMEGP,
and schemes of Ministry of Micro, Small & Medium Enterprises (MoMSME), NHFDC (National
handicapped Finance and Development Corporation), etc., were implemented. Besides, there are
other available alternatives in enhancing livelihood skills (exploring farm and non-farm based
employment) and options for the differently abled. The gap in employment between differently abled
and non-disabled persons has increased in the past decade, which is a major cause of concern. The
economic boom failed to make an impact on the employment of PWDs.
Challenges:
Underutilisation of the quota for PwDs in schemes such as NRLM and MGNREGS has reduced
the livelihood opportunities of the differently abled.
No action has been initiated for the non-compliance of the provisions of the MGNREGA in
promoting employment opportunity under MGNREGS.

Livelihood Analysis of Vulnerable Groups (Differently Abled) under MGNREGS
120
CHAPTER – VII
RECOMMENDATIONS
MGNREG Act, 2013 has made provision for inclusion of differently abled by including
additional works for different categories of differently abled for their effective participation. In study
blocks (Chawmanu and Manu), the total population of the differently abled is 2329, while only 706
person-days have been generated during 2016-17. The study has revealed that differently abled have
become self-reliant and self-esteemed due to employment under MGNREGS. Earlier, family
members and relatives, who were restricting them in social gathering, are now approaching them as
they became self-dependent and earning members of the family. However, gender equity is not being
addressed while employing the PwDs. Males aged 39 years and below are getting employment while
others are unable to approach the local body to claim their rights. Hence, the following
recommendations are made:
1. In the study area, several differently abled are unaware of their rights and entitlements, as
there is a dearth of awareness of the differently abled among the implementing agency,
elected representatives and the PwDs themselves.
2. Differently abled are not aware that they can demand employment at their convenience.
There is a need for mobilising the implementing agency on equity and inclusiveness of
differently abled in all MGNREGS activities, especially for stakeholders such as Gram Rozgar
Sahayaks (GRS), community mobilisers, elected representatives, social audit coordinator,
junior engineer, etc.
3. Several employed under MGNREGS offend to work with differently abled, as they achieve
fewer targets and low wages due to the inclusion of differently abled persons in the working
group. MGNREG Act may be amended to make mandatory provisions to include differently
abled in every working group, as per the availability of the differently abled population.
4. Special Gram Sabha needs to be conducted for the differently abled to enrol them under
MGNREGS and provide exclusive job cards.
5. Rozgar Diwas needs to be focused on mobilising the differently abled and list their demands,
as the households are scattered in the North Eastern Region.
6. Stakeholders at every level should look for inclusion of differently abled category while
processing the labour budget before onward transmission to block, district and State.
7. Skill development programmes need to be implemented to encourage farm and off-farm
activities/entrepreneurs among the differently abled under NRLM. This will enable the
widow-headed household with a differently abled sibling.

Livelihood Analysis of Vulnerable Groups (Differently Abled) under MGNREGS
121
CHAPTER – VIII
CASE STUDIES
Successful Case Studies
Case 1
Eswar Dev Brahma bearing Job Card number TR-04-004-022-005/68 was 42 years old
married man having two children. He resides in Katick para village of North Domshira Gram
Panchayat of Manu Block. Shri Dev Brahma says that agricultural labour was the only primary source
of income for his family. He adds that employment opportunities were very limited in the village
Before the year 2010. But after getting the job, employment was available to him within the village and
in a year, the average employment days is 50 which helps to generate an additional income for his
family. He proudly says that in the financial year (FY) 2013-14, his family got 76 days of employment
and earned Rs.10, 640. In the FY 2014-15, he got 100 days of employment and he along with his wife
worked together and earned Rs.15,000. In FY 2015-16, his family got 126 days of employment and
earned around Rs.19,530. Shri Dev Brahma also notes that he gets a disability pension of Rs.500 per
month. He expressed his happiness in getting the employment opportunity within the village as this
has made his life comfortable and also improved the living standard and quality of life. He says that
earlier, due to bad weather conditions, lack of transportation and bad roads, it was difficult for him to
avail good employment opportunities at the block level. Thereafter, because of the earnest initiative of
the officials, the MGNREGS programme is now implemented within the village. As a result, Shri Dev
Brahma along with other village members are able to earn the bread within the village for which he
has shown his earnest gratitude towards the officials.
Shri Dev Brahma also shared a painful situation with the researcher. Once he was asked to
supply drinking water to all the fellow workers and some of them used to discriminate and comment
that with less effort he is earning more wages. These kinds of comments from fellow workers cause
psychological disturbance and cause inconvenience in performing his duties.
Case 2
Harendra Tripura bearing the Job Card number-TR-04-004-222-005/36 resides in Wakhirai
para village of Demcherra Gram Panchayat of Manu RD Block. He was 23 years old and was
unmarried living in a nuclear BPL family. He studied up to matriculation and belongs to Scheduled
Tribes (ST) category. After getting the Job Card under MGNREGS, he was able to earn income for
himself and invest the money on his education (currently, he was studying in B.A 2nd year) and self-
development. His family consists of only two members. His elder brother, who was 25 years old, took

Livelihood Analysis of Vulnerable Groups (Differently Abled) under MGNREGS
122
his responsibility for all the education and household management but after getting employment
opportunity, he was getting average employment days of 40-60 days. He also said that he was also
aware of the rights and entitlements under MGNREGS but did not possess knowledge on the
permissible works for the “Differently Abled Persons” under MGNREGS.
Since childhood, he was suffering from 70 per cent locomotor disabilities (both the legs). He
proudly says that only because of MGNREGS programme, he and his brother were able to earn an
average increase of Rs.10,000- 15,000 in a year. He also shared that sometimes he travels 15 km to
access MGNREGS works but travel allowances were not paid to him. He also shared his opinion that
differently abled persons and those who are unable to do the hard works/manual works can be given
skill development training like computer training or teaching skills, etc. No doubt, MGNREGS was
helping them by providing wage employment but improving the skills of the differently abled person
can create a sustainable livelihood.
Case Study with Difficulty (MGNREGS Beneficiary)
Kiran Joy Tripura bearing Job card number Tr-04-002-005/64 resides in West Gobindabari
village of Gobindabari Gram Panchayat of Chawmanu RD Block. He was 29 years old having 80 per
cent locomotor disability in both the legs. He was also suffering from viral infections on the skin for
the last three years. Due to his disability and viral infection, the non-disabled peers in the village
refused him to be a part in their groups in the MGNREGS manual works. Kiran also depicts that he
was discriminated for his disability. He says that though the government is supporting the helpless
people by providing 100 days of employment to lead a dignified life, yet society is not allowing him to
have the fruits of it. It was painful for him when someone rejects or neglects him.
Case study with difficulty (Non-MGNREGS)
Dhananjoy Tripura, aged 24, years resides in BinayKunar R/P, North Longturai, Chawmanu
RD block. He reveals that he was deserted by his family. He is unmarried and has 70 per cent
locomotor disability on his right leg. He was getting disability pension of Rs.500 per month. He says
that he was denied to get a job card as he does not have a family. Earlier, when he was with his family,
he did not get the opportunity to access MGNREGS works because his brother accessed the
employment whenever the works were announced. Even though he has qualified Madhyamik, yet no
employment opportunity was available to him in the village or at the block level. Whenever he gave
the written application to the Pradhan (Village Head), his application was rejected just because
Dhananjoy did not support Pradhan’s political party. He has no other livelihood opportunities to
perform and he finds it very different to lead his life with only Rs.500 in a month. He feels that
everyone should be equally treated and no one should be discriminated.

Livelihood Analysis of Vulnerable Groups (Differently Abled) under MGNREGS
123
REFERENCES
Joshi, Omkar, et al. (2014), MGNREGA: Employer of the Last Resort? New Delhi: India
Human Development Survey, Working paper 2014-1, NCAER and University of Maryland,
December.
Desai, Sonalde (2014), Available at http://www.ncaer.org/publication_details.php?
pID=240. www.ncaer.org. [Online] December.
Datta P., R. Murgai, M. Ravallion and D. Walle (2012), ‘Does India’s Employment
Guarantee Scheme Guarantee Employment?’ Economic and Political Weekly, XLVII (16).
Datta, Pooja, et al. (2014), Right to Work? Assessing India’s Employment Guarantee
Scheme in Bihar. Washington DC: The World Bank.
Liu, Y. and C. Barett (2012), Heterogeneous Pro-Poor Targeting in India’s Mahatma
Gandhi National Rural Employment Guarantee Scheme. Delhi: IFPRI.
Rao, Srinivas Kumar Alamuru and B.V. Madhusudhan (2013), Role of MGNREGA in
Improving Land Productivity. Centre for Budget & Policy Studies, Bangalore for
Department of Rural Development, Government of Karnataka.
Klonner, S. and C. Oldiges (2014), Employment Guarantee and its Welfare Effects in India.
Mumbai: IGIDR, ‘MGNRGA: Taking Stock and Looking Ahead. Proceedings of the
International Conference on MGNREGA’, 26-28 March.
Johnson, Doug (2009), Available at http://ifmrlead.org/can-workfare-serve-as-a-substitute-
for-weatherinsurance-the-case-of-nrega-in-andhra-pradesh/.ifmrlead.org. [Online].
Zimmerman, Laura (2013), ‘Why Guarantee Employment? Evidence from a large public
works program’, paper presented at IGIDR conference on MGNREGA, University of
Michigan, February.
Sambodhi Research and Communications Pvt. Ltd. (2012-13). Impact Assessment of assets
Created on Individual Land under Mahatma Gandhi National Rural Employment
Guarantee Act. Submitted to UNDP.
Gehrke, G. (2013), Does the Indian Employment Guarantee reduce households’ risk
exposure? Assessing the effects of the NREGA on crop choice. German Development
Institute.
Jatav, Manoj and Sucharita Sen (2013), Drivers of Non-Farm Employment in Rural India -
Evidence from 2009- 10 NSSO Round. Economic and Political Weekly, Vol - XLVIII No.
26-27, June 29, 2013.
Liu, Yanyan and Klaus Deninger (2014), ‘Welfare and Poverty Impacts: The Mahatma
Gandhi National Rural Employment Guarantee Scheme’, MGNREGA: Taking Stock and
Livelihood Analysis of Vulnerable Groups (Differently Abled) under MGNREGS
124
Looking Ahead. Proceedings of the International Conference on MGNREGA. Mumbai:
IGIDR, 26-28 March.
Ravi, Shamika and Monika Engler (forthcoming), Workfare as an Effective Way to Fight
Poverty: A case of India’s NREGA. World Development.
Dasgupta, Aparajita (2013), ‘Can the Major Public Works Policy Buffer Negative Shocks in
Early Childhood? Evidence from Andhra Pradesh’, MGNREGA: Taking Stock and
Looking Ahead. Proceedings of the International Conference on MGNREGA. Mumbai:
IGIDR.
Mani, Subha, et al. (2013), ‘Impact of the NREGA on Schooling and Intellectual Human
Capital. Bill and Melinda Gates Foundation’, MGNREGA: Taking Stock and Looking
Ahead. Proceedings of the International Conference on MGNREGA. Mumbai: IGIDR.
Islam, Md. and A. Sivasankaran (2014), ‘How does Child Labor respond to changes in
Adult Work Opportunities? Evidence from NREGA’, paper presented in International
Conference on MGNREGA. Mumbai: Impact Indira Gandhi Institute of Development
Research.
Narayanan, Sudha and Upasak Das (2014), ‘Women Participation and Rationing in the
Employment Guarantee Scheme’, Economic and Political Weekly XLIX (46).
Rao, Srinivas Kumar Alamuru and B.V. Madhusudhan (2013), Role of MGNREGA in
Improving Land Productivity. Centre for Budget & Policy Studies, Bangalore for
Department of Rural Development, Government of Karnataka.
Klonner, S. and C. Oldiges (2014), Employment Guarantee and its Welfare Effects in India.
Mumbai: IGIDR, ‘MGNRGA -Taking Stock and Looking Ahead Proceedings of the
International Conference on MGNREGA’, 26-28 March.
Johnson, Doug (2009), Available at http://ifmrlead. org/can-workfare-serve-as-a-substitute
-for-weatherinsurance-the-case-of-nrega-in-andhra-pradesh/ifmrlead.org. [Online].
Zimmerman, Laura (2013), ‘Why Guarantee Employment? Evidence from a large public
works program’, paper presented at IGIDR conference on MGNREGA, University of
Michigan, February.
Household Time Allocation Model used by Zimmerman estimates how the households
allocate their time between private sector jobs and self-employment. MGNREGA
introduces a third option as a safety net.
Sambodhi Research and Communications Pvt. Ltd. (2012-13). Impact Assessment of assets
Created on Individual Land under Mahatma Gandhi National Rural Employment
Guarantee Act. A Report submitted to UNDP
Gehrke, G. (2013), Does the Indian Employment Guarantee reduce households’ risk

Livelihood Analysis of Vulnerable Groups (Differently Abled) under MGNREGS
125
exposure? Assessing the effects of the NREGA on crop choice. German Development
Institute.
Jatav, Manoj and Sucharita Sen (2013), Drivers of Non-Farm Employment in Rural India-
Evidence from 2009- 10 NSSO Round. Economic and Political Weekly XLVIII (26-27).
Liu, Yanyan and Klaus Deninger (2014), ‘Welfare and Poverty Impacts: The Mahatma
Gandhi National Rural Employment Guarantee Scheme’, MGNREGATaking Stock and
Looking Ahead. Proceedings of the International Conference on MGNREGA. Mumbai:
IGIDR, 26-28 March.
The Difference in Difference (DiD) method is a quasi-experimental technique used in
econometrics and sociology to measure the effect of treatment at a given period in time.
DiD measures a pre-post, within subjects’ differences for treatment and comparison group.
World Bank Report, ‘People with Disabilities in India From Commitments to
Outcomes,2007,http://siteresources.worldbank.org/INDIAEXTN/Resources/295583-
1171456325808/Chapter05.pdf
Report of the ‘Sub Group on Economic Empowerment of Persons with Disabilities’,
August 2011. Under the Working Group on Empowerment of Persons with Disabilities for
formulation of XII Five Year Plan (2012-2017)
‘Social Assessment Report’, Ministry of Rural Development, Government of India, New
Delhi, February 2011

Livelihood Analysis of Vulnerable Groups (Differently Abled) under MGNREGS
126
PHOTO GALLERY
Dhananjoy-Tripura
BDO of Chawmanu block and district level officials addressing the differently abled persons
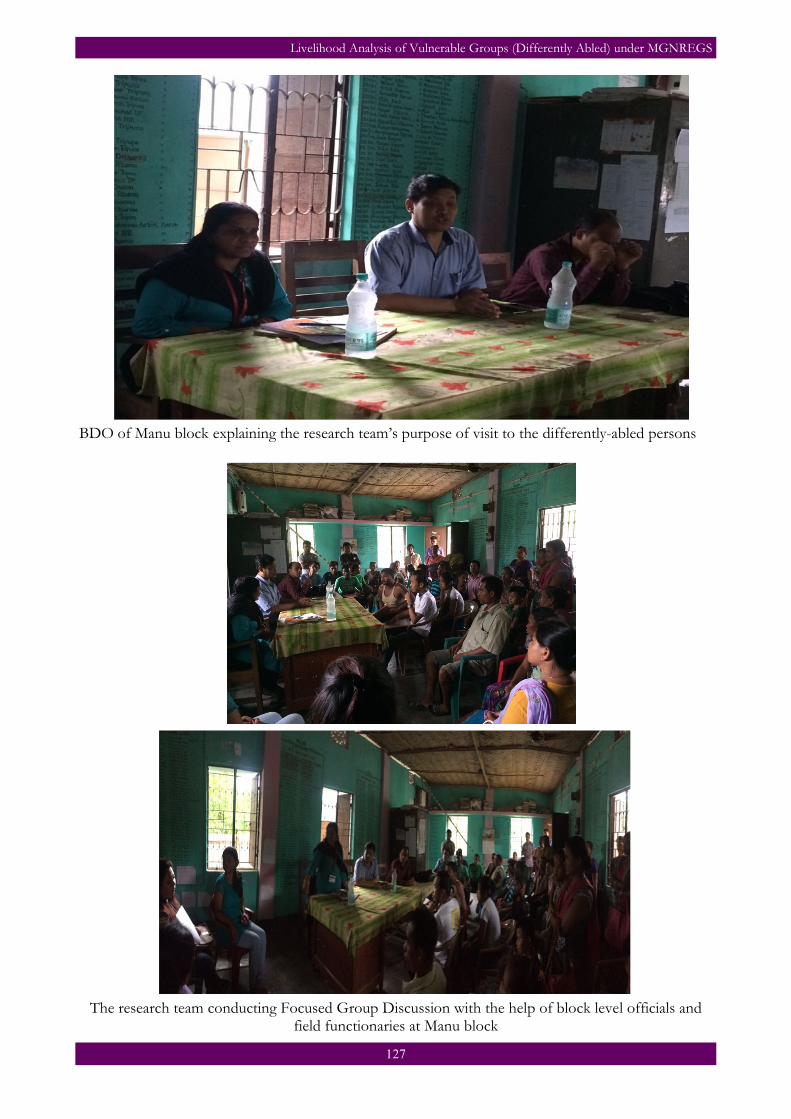
Livelihood Analysis of Vulnerable Groups (Differently Abled) under MGNREGS
127
BDO of Manu block explaining the research team’s purpose of visit to the differently-abled persons
The research team conducting Focused Group Discussion with the help of block level officials and field functionaries at Manu block

Livelihood Analysis of Vulnerable Groups (Differently Abled) under MGNREGS
128
Beneficiaries briefing their problems to the research team

Livelihood Analysis of Vulnerable Groups (Differently Abled) under MGNREGS
129
MGNREGS beneficiaries participating in the Focus Group Discussion at Chawmanu RD block
Research team members interacting with the beneficiaries to understand their problems

Livelihood Analysis of Vulnerable Groups (Differently Abled) under MGNREGS
130
Kiran Joy –Tripura

Livelihood Analysis of Vulnerable Groups (Differently Abled) under MGNREGS
131
ANNEXURES
DETAILED TABLES OF MOTIVATING FACTORS Table 1: Motivating factors - Minimum wages
Block Yes No Total
Chawmanu 46 4 50
92.0% 8.0% 100.0%
Manu 50 50
100.0% 100.0%
Total 96 4 100
96.0% 4.0% 100.0%
Field Survey, 2017.
Table 2: Motivating factors - Timely wages
Block Yes No Total
Chawmanu 29 21 50
58.0% 42.0% 100.0%
Manu 36 14 50
72.0% 28.0% 100.0%
Total 65 35 100
65.0% 35.0% 100.0%
Field Survey, 2017.
Table 3: Motivating factors - Work taken upon their land
Block Yes No Total
Chawmanu 11 39 50
22.0% 78.0% 100.0%
Manu 34 16 50
68.0% 32.0% 100.0%
45 55 100
45.0% 55.0% 100.0% Total
Field Survey, 2017.
Table 4: Motivating factors - Assets created which are beneficial
Block Yes No Total
Chawmanu 9 41 50
18.0% 82.0% 100.0%
Manu 34 16 50
68.0% 32.0% 100.0%
Total 43 57 100
43.0% 57.0% 100.0%
Field Survey, 2017.

Livelihood Analysis of Vulnerable Groups (Differently Abled) under MGNREGS
132
Table 5: Motivating factors - Support from the family
Block Yes No Total
Chawmanu 29 21 50
58.0% 42.0% 100.0%
Manu 33 17 50
66.0% 34.0% 100.0%
Total 62 38 100
62.0% 38.0% 100.0%
Field Survey, 2017.
Table 6: Motivating factors - Higher MGNREGS wages than market wages
Block Yes No Total
Chawmanu 7 43 50
14.0% 86.0% 100.0%
Manu 11 39 50
22.0% 78.0% 100.0%
Total 18 82 100
18.0% 82.0% 100.0%
Field Survey, 2017.
Table 7: Motivating factors - Equal wages
Block Yes No Total
Chawmanu 19 31 50
38.0% 62.0% 100.0%
Manu 10 40 50
20.0% 80.0% 100.0%
Total 29 71 100
29.0% 71.0% 100.0%
Field Survey, 2017.
Table 8: Motivating factors - Group arrangement
Block Yes No Total
Chawmanu 6 44 50
12.0% 88.0% 100.0%
Manu 11 39 50
22.0% 78.0% 100.0%
Total 17 83 100
17.0% 83.0% 100.0%
Field Survey, 2017.

Livelihood Analysis of Vulnerable Groups (Differently Abled) under MGNREGS
133
Table 9: Motivating factors - Mode of payment
Block Yes No Total
Chawmanu 3 47 50
6.0% 94.0% 100.0%
Manu 12 38 50
24.0% 76.0% 100.0%
Total 15 85 100
15.0% 85.0% 100.0%
Field Survey, 2017.
Table 10: Motivating factors - Worksite facilities
Block Yes No Total
Chawmanu 5 45 50
10.0% 90.0% 100.0%
Manu 13 37 50
26.0% 74.0% 100.0%
Total 18 82 100
18.0% 82.0% 100.0%
Field Survey, 2017.
Table 11: Motivating factors - Attitude/sensitivity of officials
Block Yes No Total
Chawmanu 4 46 50
8.0% 92.0% 100.0%
Manu 12 38 50
24.0% 76.0% 100.0%
Total 16 84 100
16.0% 84.0% 100.0%
Field Survey, 2017.
Table 12: Motivating factors - Timely employment
Block Yes No Total
Chawmanu 16 34 50
32.0% 68.0% 100.0%
Manu 9 41 50
18.0% 82.0% 100.0%
Total 25 75 100
25.0% 75.0% 100.0%
Field Survey, 2017.

Livelihood Analysis of Vulnerable Groups (Differently Abled) under MGNREGS
134
Table 13: Motivating factors - SHG membership
Block Yes No Total
Chawmanu 1 49 50
2.0% 98.0% 100.0%
Manu 6 44 50
12.0% 88.0% 100.0%
Total 7 93 100
7.0% 93.0% 100.0%
Field Survey, 2017.
Table 14: Motivating factors - Local NGOs’ encouragement
Block Yes No Total
Chawmanu 1 49 50
2.0% 98.0% 100.0%
Manu 5 45 50
10.0% 90.0% 100.0%
Total 6 94 100
6.0% 94.0% 100.0%
Field Survey, 2017.
Table 15: Motivating factors – Self-esteem/Self-dignity
Block Yes No Total
Chawmanu 16 34 50
32.0% 68.0% 100.0%
Manu 12 38 50
24.0% 76.0% 100.0%
Total 28 72 100
28.0% 72.0% 100.0%
Field Survey, 2017.