Circulating chemokines accurately identify individuals with clinically significant atherosclerotic...
23
Circulating Chemokines Accurately Identify Individuals with Clinically Significant Atherosclerotic Heart Disease Diego Ardigo * 1, 2 Themistocles Assimes * 1 Stephen P. Fortmann 3 Alan S. Go 4 Mark Hlatky 1 Evangelos Hytopoulos 5 Carlos Iribarren 4 Philip S. Tsao 1 Raymond Tabibiazar 1, 5 Thomas Quertermous 1 for the ADVANCE Investigators 1 Division of Cardiovascular Medicine, Stanford University, Stanford, CA 94305; 2 Department of Internal Medicine and Biomedical Sciences, Parma University, Parma, Italy; 3 Stanford Prevention Research Center, Stanford University, Stanford, CA 94305, 4 Kaiser Division of Research, Kaiser of Northern California, Oakland, CA 94611; 5 Aviir, Inc., Palo Alto, CA 94303 This work was supported by a grant from the Donald W. Reynolds Foundation, Las Vegas, Nevada. *These authors contributed equally to this work. Correspondence should be addressed to R.T. or T.Q. Stanford Medical School, Division of Cardiovascular Medicine 300 Pasteur Drive, Falk CVRC Stanford, CA, 94305 Tel: 650-723-5012, Fax: 650-725-2178 Emails: [email protected], [email protected] 1 Page 1 of 23 Articles in PresS. Physiol Genomics (August 14, 2007). doi:10.1152/physiolgenomics.00104.2007 Copyright © 2007 by the American Physiological Society.
-
Upload
independent -
Category
Documents
-
view
4 -
download
0
Transcript of Circulating chemokines accurately identify individuals with clinically significant atherosclerotic...

Circulating Chemokines Accurately Identify Individuals with Clinically
Significant Atherosclerotic Heart Disease
Diego Ardigo * 1, 2
Themistocles Assimes *1
Stephen P. Fortmann 3
Alan S. Go 4
Mark Hlatky 1
Evangelos Hytopoulos 5
Carlos Iribarren 4
Philip S. Tsao 1
Raymond Tabibiazar 1, 5
Thomas Quertermous 1
for the ADVANCE Investigators
1Division of Cardiovascular Medicine, Stanford University, Stanford, CA 94305; 2Department of Internal
Medicine and Biomedical Sciences, Parma University, Parma, Italy; 3Stanford Prevention Research
Center, Stanford University, Stanford, CA 94305, 4Kaiser Division of Research, Kaiser of Northern
California, Oakland, CA 94611; 5Aviir, Inc., Palo Alto, CA 94303
This work was supported by a grant from the Donald W. Reynolds Foundation, Las Vegas, Nevada.
*These authors contributed equally to this work.
Correspondence should be addressed to R.T. or T.Q.
Stanford Medical School, Division of Cardiovascular Medicine
300 Pasteur Drive, Falk CVRC
Stanford, CA, 94305
Tel: 650-723-5012, Fax: 650-725-2178
Emails: [email protected], [email protected]
1
Page 1 of 23Articles in PresS. Physiol Genomics (August 14, 2007). doi:10.1152/physiolgenomics.00104.2007
Copyright © 2007 by the American Physiological Society.

ABSTRACT
Background: Serum inflammatory markers correlate with outcome and response to therapy in subjects
with cardiovascular disease. However, current individual markers lack specificity for the diagnosis of
coronary artery disease. We hypothesize that a multi-marker proteomic approach measuring serum levels
of vascular derived inflammatory biomarkers could reveal a ‘signature of disease’ that can serve as a
highly sensitive and specific diagnostic tool for the presence of coronary atherosclerosis.
Methods: We simultaneously measured serum levels of seven chemokines (CXCL10 (IP10), CCL11
(Eotaxin), CCL3 (MIP1alpha), CCL2 (MCP1), CCL8 (MCP2), CCL7 (MCP3), and CCL13 (MCP4)) in
48 subjects with clinically significant CAD (‘cases’) and 44 healthy controls from the ADVANCE Study.
We applied three different classification algorithms to identify the combination of variables that would
best predict case-control status (logistic regression, linear discriminant analysis and recursive partitioning)
and assessed the diagnostic performance of these models with Receiver Operating Characteristic (ROC)
Curves.
Results: The serum levels of six out the seven chemokines were significantly higher in cases compared
with controls (p <0.05). All three classification algorithms entered 3 chemokines in their final model and
only logistic regression selected clinical variables. Logistic regression produced the highest ROC of the
three classification algorithms (AUC=0.95; SE=0.03), which was markedly better than the AUC for the
logistic regression model of traditional risk factors of CAD without (AUC=0.67; SE=0.06) or with CRP
(AUC=0.68; SE=0.06).
Conclusions: A combination of serum levels of multiple chemokines identifies subjects with clinically
significant atherosclerotic heart disease with a very high degree of accuracy. These results need to be
replicated in larger cross sectional studies and their prognostic value explored in prospective studies.
Multimarker approach utilizing informed biomarkers may ultimately lead to improved screening,
diagnosis, and monitoring of cardiovascular disease.
KEYWORDS: Coronary Artery Disease, Multi-marker, Biomarkers, Atherosclerosis, Protein microarray,
Proteomic, Inflammation, Chemokines.
2
Page 2 of 23

CONDENSED ABSTRACT
Chemokines have been correlated with cardiovascular disease. In a study of 48 subjects with confirmed
coronary heart disease and 44 subjects without known disease, we demonstrate that a multimarker
proteomic approach measuring serum levels of chemokines can distinguish case from control subjects
with a very high degree of accuracy. These results need to be replicated in larger cross sectional studies
and the prognostic value of the multimarker profile to be explored in prospective studies. Similar
approaches may ultimately lead to improved screening, diagnosis, and monitoring of cardiovascular
disease.
3
Page 3 of 23

INTRODUCTION
Atherosclerotic cardiovascular disease (ASCVD) is the primary cause of morbidity and mortality in the
developed world (3, 4). Despite the chronic nature of the disease, ASCVD is generally undiagnosed before
onset of symptoms or complications. The first clinical presentation of more than half of the subjects with
coronary artery disease (CAD) is either myocardial infarction or death (16). This grim reality is at least in
part due to the lack of markers that accurately identify active atherosclerotic disease before complications
occur.
Inflammation has been implicated in all stages of ASCVD and is considered to be one
pathophysiological basis of atherogenesis (10, 19, 24). Inflammation may therefore serve as a potential
marker of the disease process itself. In large epidemiological studies, various serum markers of systemic
inflammation such as C-reactive protein (CRP), fibrinogen, and Interleukin-6 (IL6) have been shown to
predict cardiovascular events and to correlate with response to therapy (22, 23). Although potentially
useful in risk stratification, the current systemic markers of inflammation lack sufficient disease
specificity to be used satisfactory as a screening tool in the diagnosis of CAD(21). The inaccuracy of
current markers may reflect the fact that they are neither derived primarily from the vascular wall nor
produced primarily by cells involved in the vascular inflammatory process. Furthermore, they may signal
inflammation in a number of different organs and tissues, which may or may not have direct implications
for the vasculature. Recently, a number of studies have examined several other biomarkers on an
individual basis as potential novel risk factors for ASCVD (12, 25). Although these studies demonstrate
that some of these inflammatory markers (those known to be expressed in the diseased blood vessel) can
predict the onset of clinically significant ASCVD, none of the markers provide clinically meaningful
incremental value over traditional risk factors in predicting CAD complications. However, it is highly
likely that, due to the heterogeneity of the disease phenotype in the population at risk, a single marker may
not provide sufficient biological information for an accurate assessment of vascular damage in the
coronary circulation.
Thus, there remains a critical need to develop non-invasive tests that more accurately detect the
presence and activity of ASCVD and improve our ability to predict and prevent clinical events. In this
proof-of-concept study, we hypothesized that a measure of multiple serum proteins of inflammation
derived from the blood vessel wall can be used to reveal a ‘signature of disease’ that reliably identifies
individuals with CAD. To test our hypothesis, we studied a subset of “cases” with confirmed CAD and
“controls” without history of clinically significant CAD from the ADVANCE (Atherosclerotic Disease,
VAscular FuNction, & GenetiC Epidemiology) study, a population-based case control study with a focus
of uncovering novel genetic determinants of coronary atherosclerosis. Using serum samples collected at
the time of first study clinic visit, we simultaneously measured seven chemokines with a commercially
4
Page 4 of 23

available protein microarray and compared the ability of these measures to identify subjects with clinically
significant CAD to that of traditional cardiovascular risk factors.
METHODS
Source population and Study subjects
The ADVANCE study was approved by the IRBs at both Stanford University and the Kaiser Permanente
of Northern California (KPNC) Division of Research. The source population included adults (age ≥18
years) living in or near the San Francisco Bay Area who were receiving medical care within KPNC, a
population generally representative of the local and statewide insured adult population. (13, 18) Between
October 28, 2001 and December 31, 2003, 3179 subjects from the source population living in or near the
San Francisco Bay Area were recruited into 5 separate groups: (1) subjects with clinically significant CAD
at an age < 45 years for males and < 55 years for females (n = 500), (2) subjects with incident stable
angina at an older age (n = 468), (3) subjects with incident acute myocardial infarction (AMI) at an older
age (n=924), (4) young subjects with no history of CAD (n = 264), and (5) subjects aged 60 to 72 at the
time of their study clinic visit with no history of CAD, ischemic stroke (CVA), or peripheral arterial
disease (PAD) (n =1,023). Extensive details of the eligibility criteria, sampling strategy and the
recruitment statistics for all cohorts are available elsewhere (http://med.stanford.edu/advance/) (11, 15,
29)
For this study, we selected a stratified random sample based on race, age, and gender of 50
subjects from group 3 with incident AMI to serve as our “cases” of and 48 subjects from group 5 to serve
as our healthy “controls”. All cases were in the age range of 60 to 69 years at the time of their qualifying
event and all controls were in the same age range at the time they were identified by the computerized
databases as eligible to participate in 2001(29). All subjects were also of white/European descent and half
in each group were selected to be female.
Clinical measures
Clinical information was derived from a comprehensive questionnaire completed by all participants which
was reviewed and collected at the first study clinic visit. For cases, this clinic visit occurred a median of
3.2 (range 1.9 to 18.8 months) after the qualifying AMI. Thereafter, a targeted physical exam was
performed to document the blood pressure, heart rate, height, weight, and the waist circumference of all
participants. Finally, blood was collected for measurements of various serum proteins including fasting
insulin, fasting glucose, and C-reactive protein (CRP). Plasma concentrations of glucose and insulin were
measured with standard methodologies. CRP was determined by standard high-sensitivity ELISA assay.
5
Page 5 of 23

Hypertension, high cholesterol, and diabetes were defined based on self-report. For cases, each of
these risk factors was considered present only if subjects reported that the risk factor was diagnosed by a
health care provider prior to the time of the qualifying AMI. Smoking was classified as “ever” vs. “never”
relative to the clinic date. “Ever” smokers were subjects who reported smoking cigarettes regularly for at
least 3 months at any time prior to the study visit as well as at least 100 cigarettes throughout their
lifetime.
Protein Microarray hybridization and Data processing
To assess the concentrations of 9 different chemokines CXCL10 (IP10), CCL11 (Eotaxin), CCL3
(MIP1alpha), CCL2 (MCP1), CCL8 (MCP2), CCL7 (MCP3), CCL13 (MCP4), CXCL8 (IL-8), and CCL5
(RANTES), we used a commercially available Schleicher and Schuell protein microspot array (FastQuant
Human Chemokine, S&S Biosciences Inc., Keene, NH, US). This array platform utilizes multiple
monoclonal highly-specific antibodies spotted onto standard microscope slides coated with a 3-D
nitrocellulose surface. The sensitivity and specificity of these markers and correlation with conventional
ELISA has been demonstrated previously (17). Lack of cross-reactivity among these markers has been
established previously (17, 28). Plasma samples were hybridized to protein arrays using manufacturer’s
instructions, followed by addition of a biotinylated secondary antibody and Cy5-streptavidine conjugate.
Resulting fluorescence intensity was measured using an Axon Genepix 4000B microarray scanner in
conjunction with feature extraction software (Array Vision Fast 8.0, S&S Biosciences) to convert the
scanned image into numeric intensities. Absolute concentrations were measured by interpolation of
intensity values with internal standard references run in parallel. Depending on the specific analyte,
FastQuant protein arrays present control variability ranging from 3 to about 15 % and sensitivity from 1 to
10 pg/ml. Accuracy of FastQuant protein arrays are comparable to the correspondent ELISA
determinations (1, 2) with a similar linear range. Detailed supplemental methods and quality control
results for the current study are provided online on publisher’s website, including array reproducibility and
standard curves (Supplemental Material). Numerical raw data were subsequently both analyzed in local
Windows workstations and migrated into an Oracle relational database specifically designed for
microarray data analysis.
RANTES and IL-8 were not considered for further analyses. The RANTES standard curve was
non-sigmoidal and, therefore, did not have a linear portion for calculating concentrations. In both case and
control subjects, most of the IL-8 values were outside the standard curve limits.
Statistical analysis
6
Page 6 of 23

Subjects missing only 1 chemokine value (6 cases and 1 control) were maintained in the analysis by
imputing this missing value using the K-nearest neighbor (KNN) method with the nearest 10 neighbors
(31). Subjects missing 2 or more of the 7 chemokine values (2 cases and 4 controls) were excluded from
further analyses since these methods are not robust with >15% missing values (31). Missing values for
glucose, insulin, and CRP for 2 subjects were also imputed using the KNN method.
We examined relationships between variables in our final dataset independent of case-control
status in several ways. First, we performed a two dimensional hierarchical clustering analysis (2D-HC)
and built heat maps using the open-source software TMev, ver. 3.0 (TM4 suite, The Institute for Genomic
Research, Rockville, MD) (26) with complete linkage and Pearson’s correlation as distance metrics.
Second, we used Multidimensional scaling (MDS) implemented as function “cmdscale” in R language.
Third, we performed a multivariate linear regression analysis to test the marginal effect of each traditional
risk factor of CAD and the use of specific medications on each of the 7 chemokines independent of case-
control status. Finally, we calculated Spearman correlation coefficients between chemokines levels and
the number of days elapsed from the time of the qualifying AMI to the time of the clinic visit in cases.
Detailed methods are provided in Online Supplemental Material.
Differences in clinical characteristics between cases and controls were examined using standard
parametric and non-parametric methods including a t-test for normally distributed continuous variables, a
Wilcoxon test for non-normally distributed variables, and a Chi-square test for all binary variables.
We explored the performance of three different classification algorithms on our data: logistic
regression (LR), linear discriminant analysis (LDA), and recursive partitioning (RP). Three different
algorithms were used to maximize the probability of identifying the combination of clinical and biomarker
variables that would most accurately predict case-control status: For logistic regression, we used a
forward sequential automated model selection technique setting the α (SLENTRY) to 0.10 to select
independent predictors of case-control status. A stepwise approach was used with LDA with the
performance metric being the “correctness rate” (9). For Recursive partitioning, we used the library
“rpart” of the R language (30). Further details on the LDA and RP algorithms we used are provided in the
supplementary appendix. We also used logistic regression to test whether a forward sequential automated
selection technique would select any of the chemokines after first forcing all traditional risk factors into
the model.
To quantify the diagnostic performance of the final model derived from each classification
algorithm, we built Receiver Operating Characteristic (ROC) curves and calculated the Area Under the
Curve (AUC) (33). Using LR, we also generated ROC curves to calculate the AUC for each biomarker of
inflammation in isolation and for a model that included all traditional factors without and with CRP. To
7
Page 7 of 23

test for differences in the AUCs of any 2 models derived by LR, we used a cross-validation approach (see
supplementary appendix for detailed methodology).
RESULTS
Unsupervised data analysis and independent predictors of chemokines levels
Two-dimensional hierarchical clustering indicated that case and control subjects tend to form large
homogeneous clusters, although occasionally individual cases and controls remain outside these large
clusters (Fig. 1) suggesting a common profile within each group. MDS demonstrates that chemokines
cluster together and away from traditional risk factors and parameters related to insulin resistance (Fig. 2).
They explain the most variance within the dataset. Of interest, CRP clusters more closely with metabolic
parameters rather than chemokines. After adjustment for case-control status, levels of all 7 chemokines
were significantly correlated with diabetes and BMI (Table 1). Chemokine levels varied less consistently
with age and hypertension. There were no significant associations between chemokine levels and other
clinical variables including the use of aspirin, statins, and ACE-inhibitors. We did not find an association
between chemokine levels and days elapsed from the time of the qualifying event in cases to the time of
the sample collection (Spearman’s correlations range: -0.08 to 0.06, p value range: 0.59 to 0.94).
Characteristics of the subjects stratified by case-control status
Most clinical characteristics of cases and controls differed as expected (Table 2). Despite sampling cases
and controls in the same age range, controls were slightly older than cases. This association, in the
direction opposite of what one would expect, is a consequence of the eligibility criterion for age set in the
two cohorts from which we randomly selected our cases and controls (5, 11, 29). Despite this slight
difference in age, cases as expected had a higher BMI, waist circumference, insulin, and glucose
compared with controls, as well as a higher prevalence of smoking, hypertension, high cholesterol and
diabetes. Cases also had a much higher prevalence of use of drugs that are routinely prescribed for
secondary prevention of CAD including aspirin, statins, and ACE-inhibitors. The majority of chemokines
measured were also significantly higher in cases compared to controls. None of the cases or the controls
reported suffering from a chronic inflammatory disorder such as rheumatoid arthritis, lupus, or
inflammatory bowel disease (details not shown).
Variables selected for prediction of case-control status using different classification algorithms
Each of the three classification algorithms entered 3 chemokines into its final model although each
selected a slightly different combination (Table 3). Only the logistic regression algorithm entered
traditional risk factors into the final model. The classification algorithm that produced the best AUC was
8
Page 8 of 23

logistic regression (AUC = 0.95). Of note, the variable “age” was forced into the LR and LDA models
given the spurious association between age and case-control status described above. For recursive
partitioning, we could not force “age” into the model. For LR and LDA, we also initially attempted to
force in the variables indicating aspirin, statin, and ACE-inhibitor use but doing so led to model converge
problems probably as a consequence of our small sample size and the high correlation between these
variables and case-control status (Table 1). Therefore, these medication use variables were omitted from
these analyses. In the absence of any significant association between these variables and each of the 7
chemokines (Table 1), it is unlikely that their omission had any meaningful impact on the model derived
by each classification algorithm. For the LR model where all traditional risk factors were forced in, we
had to reduce the SLENTRY from 0.10 to 0.01 to avoid convergence problems. At this SLENTRY, 2
chemokines entered the model (IP10, and MCP3).
ROC plots and AUC for individual biomarkers of inflammation, models using traditional risk factors, and
best models derived by classification algorithms
Figure 3a shows the ROC plots for each of the chemokines individually and for CRP while Figure 3b
shows the ROC plots for the combination of traditional risk factors of CAD (age, waist circumference,
diabetes, hypertension, high cholesterol and smoking) without and with CRP and for the model derived by
our LR classification algorithm. Several of the chemokines alone have a higher AUC than the models
using traditional risk factors but none had an AUC higher then the best model derived by LR. CRP did
not improve the AUC of the model using traditional risk factors. The best model derived by LR appears
far more accurate than the either model using traditional risk factors. The best model derived by LDA
(AUC=0.94; SE 0.03) and the best model derived by RP (AUC=0.89; SE 0.03) is also more accurate than
either model using traditional risk factors (data not shown).
Pair-wise comparisons of AUC for models derived by logistic regression
The AUC of the best LR model derived by a forward sequential automated model selection technique was
statistically significantly higher than the AUC of the model using all the traditional risk factors (Table 4).
The AUC for the best LR model was also higher than the AUC of the two chemokines that best predicted
case-control status in isolation. Although the difference in these AUCs did not reach statistical
significance at the 0.05 level, the results demonstrated a very strong trend towards significance (for IP10,
p = 0.06 and for MCP4, p = 0.1). IP10, Eotaxin, MCP1, and MCP4 each in isolation performed better
than the model using traditional risk factors without or with CRP (p < 0.05 for all, details not shown).
9
Page 9 of 23

DISCUSSION
There is a great need for improved tools to diagnose active ASCVD prior to clinical presentation.
Although insights into the mechanisms and circumstances of atherosclerosis are expanding, methods for
identifying subjects with active disease and predicting the efficacy of primary prevention strategies remain
suboptimal. We hypothesized that a multidimensional approach utilizing profiles of several biomarkers of
inflammation could reveal a ‘signature’ of atherosclerosis-related vascular inflammation. The present
study provides strong preliminary experimental support for this hypothesis and suggests that measurement
of multiple biomarkers may reliably identify subjects with confirmed coronary heart disease.
Since vascular inflammation is an underlying pathophysiological basis of atherosclerosis,
chemokines, which are produced in the atherosclerotic vessel, are prime candidates as markers of CAD.
Chemokines form a network of chemotactic proteins produced by activated leukocytes as well as vascular,
endothelial, and smooth muscle cells (7). Their main role is to promote accumulation and activation of
leukocytes in tissues, and their interaction with several cellular receptors contributes to the specificity of
the inflammatory infiltrate (20, 27). Chemokines are often present as groups with varying composition,
and the biological effect of such groups can be quite different from that of individual factors in isolation.
Thus, measuring global patterns of cytokine and chemokine expression plausibly may yield more relevant
biological information than individual protein assays.
Our data demonstrate that plasma concentrations of the chemokines are differentially regulated in
individuals with clinical CAD compared to subjects with no history of CAD. Although chemokines were
correlated with traditional risk factors, these correlations were weak for most risk factors. Furthermore,
our MDS analyses showed that chemokine levels did not cluster with traditional risk factors or CRP.
Models using multiple chemokines more accurately distinguished cases and controls compared to models
using traditional risk factors. These comparisons reached statistical significance despite a majority of
cases being on medical therapy which can acutely suppress markers of inflammation (22). Models using
multiple chemokines also demonstrated a very strong trend towards being more valuable than individual
chemokines despite the relatively small sample size. Of note, CRP was not selected by any of the
classification algorithms. Furthermore, CRP had relatively poor diagnostic performance alone or in
combination with traditional risk factors. Taken together, our findings suggest that the chemokine profile
represents a strong signal of vascular disease which appears to be much more specific than traditional risk
factors and CRP.
Our study has several limitations. First, the serum samples from the case subjects were generally
collected several months after the myocardial infarction. Prior studies indicate that inflammatory markers
such as CRP (6) and metalloproteinases (MMPs) (32) are labile after acute events. However, little is
known regarding circulating chemokines under these circumstances. As such, we cannot be certain that
10
Page 10 of 23

the levels we measured in cases after initial AMI are a stable reflection of the underlying biology.
However, given that measures of inflammation taken after acute events generally subside to pre-event
levels within days, it appears unlikely that the chemokine profile at 3-18 months is simply a reaction to
myocardial infarction. Moreover, a linear model to evaluate a possible relationship between chemokine
levels and time-from-event did not reveal a correlation supporting the notion that the chemokine levels are
not due to the acute event. Furthermore, the complete lack of correlation between chemokine levels and
time elapsed from the qualifying event to the clinic visit also suggests that the AMI had no enduring
impact on serum chemokine levels beyond perhaps a few days post event. Second, some of the clinical
variables not related to chemokine levels were not optimally measured which may have reduced the AUC
for the models using these variables. For example, replacing self report of hypertension and high
cholesterol with accurate measures of blood pressure and serum cholesterol would probably improve the
diagnostic ability of the models using traditional risk factors. Furthermore, the model including traditional
risk factors and CRP may have had a higher AUC if CRP was measured off medications known to
influence its levels such as statins and ACE inhibitors (22). Third, this cross-sectional study does not
establish prognostic value for the models derived by the classification algorithms. However, given their
high discriminatory performance and the participation of chemokines in atherosclerosis, it is likely that
some prognostic information can be gleaned with appropriate study design. In fact, two recent prospective
studies (8, 14) have demonstrated the prognostic value of MCP1. A third prospective study did not clearly
demonstrate incremental prognostic value of chemokines. The different results of the three studies could
be explained by the various follow up period of each study. Whereas the first two studies had a mean
follow up of <10 months and 5.3 years, the third study had a mean follow up time of 11 years. Based on
these trends in prospective studies and the results of several case control studies including ours, it appears
that plasma chemokine level may be most valuable in the prediction of near term CAD events. Lastly,
chemokine measurements used in this study have not been standardized, which precludes their routine use
in clinical practice at the present time. In our study, inter-assay coefficients of variation for these
biomarkers were relatively high (>5%) which might have reduced the strength of the associations
uncovered.
We do not consider the panel of biomarkers of inflammation studied here to be comprehensive.
Indeed, the use of a wider array of analytes may improve sensitivity and specificity for the diagnosis of
active ASCVD. However, this study demonstrates the feasibility of using protein microarrays to
simultaneously measure multiple biomarkers and the potential usefulness of these measurements for
identifying ‘signatures’ of active ASCVD based on the levels of these biomarkers.
In summary, serum levels of a combination of chemokines measured using a multi-marker
approach can accurately distinguish subjects with clinically significant CAD from those with no prior
11
Page 11 of 23

history of CAD. A larger scale study is needed to validate our findings as measures of model
discrimination are generally higher in derivative samples, and prospective studies are also necessary to
determine the incremental prognostic value of these measures over current risk stratification tools.
Algorithms based on panels of informed biomarkers may ultimately lead to improved screening,
diagnosis, and monitoring of cardiovascular disease.
ACKNOWLEDGEMENTS:
We wish to thank the many individuals who contributed to the ADVANCE study, including Joan Fair (co-
investigator); Phenius Lathon (patient recruitment); Malini Chandra, Solomon Henry, Gail Husson,
Mohammed Mahbouba, Balasubramanian Narasimhan, Richard Olshen, Ann Varady (data management);
and Mary Chen, Heideh Fattaey, Emiko Miyamoto (project administration).
REFERENCES:
1. http://www.fastquant.com/Information/AntibodyMenu.html.
2. http://www.fastquant.com/Information/Literature.html.
3. NHLBI fact book, fiscal year 2003. Bethesda, Md.: National Heart, Lung, and Blood
Institute, February 2004. 2003, p. 35-53.
4. NHLBI morbidity and mortality chartbook, 2002. Bethesda, Md.: National Heart, Lung,
and Blood Institute, May 2002. 2002.
5. Armstrong EJ, Morrow DA, and Sabatine MS. Inflammatory biomarkers in acute
coronary syndromes: part IV: matrix metalloproteinases and biomarkers of platelet
activation. Circulation 113: e382-385, 2006.
6. Cannon CP, Braunwald E, McCabe CH, Rader DJ, Rouleau JL, Belder R, Joyal SV,
Hill KA, Pfeffer MA, and Skene AM. Intensive versus moderate lipid lowering with
statins after acute coronary syndromes. N Engl J Med 350: 1495-1504, 2004.
7. Charo IF, and Taubman MB. Chemokines in the pathogenesis of vascular disease. Circ
Res 95: 858-866, 2004.
8. de Lemos JA, Morrow DA, Sabatine MS, Murphy SA, Gibson CM, Antman EM,
McCabe CH, Cannon CP, and Braunwald E. Association between plasma levels of
monocyte chemoattractant protein-1 and long-term clinical outcomes in patients with
acute coronary syndromes. Circulation 107: 690-695, 2003.
12
Page 12 of 23

9. Garczarek UM. Classification rules in standardized partition spaces. Dissertation
http://deposit.ddb.de/cgi-bin/dokserv?idn=965050130.
10. Glass CK, and Witztum JL. Atherosclerosis. the road ahead. Cell 104: 503-516, 2001.
11. Go AS, Iribarren C, Chandra M, Lathon PV, Fortmann SP, Quertermous T, and
Hlatky MA. Statin and beta-blocker therapy and the initial presentation of coronary heart
disease. Ann Intern Med 144: 229-238, 2006.
12. Herder C, Baumert J, Thorand B, Martin S, Lowel H, Kolb H, and Koenig W.
Chemokines and incident coronary heart disease: results from the MONICA/KORA
Augsburg case-cohort study, 1984-2002. Arterioscler Thromb Vasc Biol 26: 2147-2152,
2006.
13. Hiatt RA, and Friedman GD. Characteristics of patients referred for treatment of end-
stage renal disease in a defined population. Am J Public Health 72: 829-833, 1982.
14. Hoogeveen RC, Morrison A, Boerwinkle E, Miles JS, Rhodes CE, Sharrett AR, and
Ballantyne CM. Plasma MCP-1 level and risk for peripheral arterial disease and incident
coronary heart disease: Atherosclerosis Risk in Communities study. Atherosclerosis 183:
301-307, 2005.
15. Iribarren C, Go AS, Husson G, Sidney S, Fair JM, Quertermous T, Hlatky MA, and
Fortmann SP. Metabolic syndrome and early-onset coronary artery disease: is the whole
greater than its parts? J Am Coll Cardiol 48: 1800-1807, 2006.
16. Kannel WB, and McGee DL. Epidemiology of sudden death: insights from the
Framingham Study. Cardiovasc Clin 15: 93-105, 1985.
17. Knight PR, Sreekumar A, Siddiqui J, Laxman B, Copeland S, Chinnaiyan A, and
Remick DG. Development of a sensitive microarray immunoassay and comparison with
standard enzyme-linked immunoassay for cytokine analysis. Shock 21: 26-30, 2004.
18. Krieger N. Overcoming the absence of socioeconomic data in medical records: validation
and application of a census-based methodology. Am J Public Health 82: 703-710, 1992.
19. Libby P. Inflammation in atherosclerosis. Nature 420: 868-874, 2002.
20. Luster AD. Chemokines--chemotactic cytokines that mediate inflammation. N Engl J
Med 338: 436-445, 1998.
21. Pearson TA, Mensah GA, Alexander RW, Anderson JL, Cannon RO, 3rd, Criqui M,
Fadl YY, Fortmann SP, Hong Y, Myers GL, Rifai N, Smith SC, Jr., Taubert K,
13
Page 13 of 23
Tracy RP, and Vinicor F. Markers of inflammation and cardiovascular disease:
application to clinical and public health practice: A statement for healthcare professionals
from the Centers for Disease Control and Prevention and the American Heart Association.
Circulation 107: 499-511, 2003.
22. Ridker PM, Cannon CP, Morrow D, Rifai N, Rose LM, McCabe CH, Pfeffer MA,
and Braunwald E. C-reactive protein levels and outcomes after statin therapy. N Engl J
Med 352: 20-28, 2005.
23. Rifai N, and Ridker PM. Inflammatory markers and coronary heart disease. Curr Opin
Lipidol 13: 383-389, 2002.
24. Ross R. Atherosclerosis--an inflammatory disease. N Engl J Med 340: 115-126, 1999.
25. Rothenbacher D, Muller-Scholze S, Herder C, Koenig W, and Kolb H. Differential
expression of chemokines, risk of stable coronary heart disease, and correlation with
established cardiovascular risk markers. Arterioscler Thromb Vasc Biol 26: 194-199,
2006.
26. Saeed AI, Sharov V, White J, Li J, Liang W, Bhagabati N, Braisted J, Klapa M,
Currier T, Thiagarajan M, Sturn A, Snuffin M, Rezantsev A, Popov D, Ryltsov A,
Kostukovich E, Borisovsky I, Liu Z, Vinsavich A, Trush V, and Quackenbush J.
TM4: a free, open-source system for microarray data management and analysis.
Biotechniques 34: 374-378, 2003.
27. Sallusto F, Mackay CR, and Lanzavecchia A. Selective expression of the eotaxin
receptor CCR3 by human T helper 2 cells. Science 277: 2005-2007, 1997.
28. Stillman B, Parker B, Tonkinson J, and Harvey M. Applying Multiplexed Microspot
Immunoassays. Genetic Engineering News 24: 6, 2004.
29. Taylor-Piliae RE, Norton LC, Haskell WL, Mahbouda MH, Fair JM, Iribarren C,
Hlatky MA, Go AS, and Fortmann SP. Validation of a New Brief Physical Activity
Survey among Men and Women Aged 60-69 Years. Am J Epidemiol 2006.
30. Team RDC. The R Project for Statistical Computing http://www.R-project.org/. [3/15/06,
2006].
31. Troyanskaya O, Cantor M, Sherlock G, Brown P, Hastie T, Tibshirani R, Botstein
D, and Altman RB. Missing value estimation methods for DNA microarrays.
Bioinformatics 17: 520-525, 2001.
14
Page 14 of 23

32. Webb CS, Bonnema DD, Ahmed SH, Leonardi AH, McClure CD, Clark LL, Stroud
RE, Corn WC, Finklea L, Zile MR, and Spinale FG. Specific temporal profile of
matrix metalloproteinase release occurs in patients after myocardial infarction: relation to
left ventricular remodeling. Circulation 114: 1020-1027, 2006.
33. Zweig MH, and Campbell G. Receiver-operating characteristic (ROC) plots: a
fundamental evaluation tool in clinical medicine. Clin Chem 39: 561-577, 1993.
15
Page 15 of 23
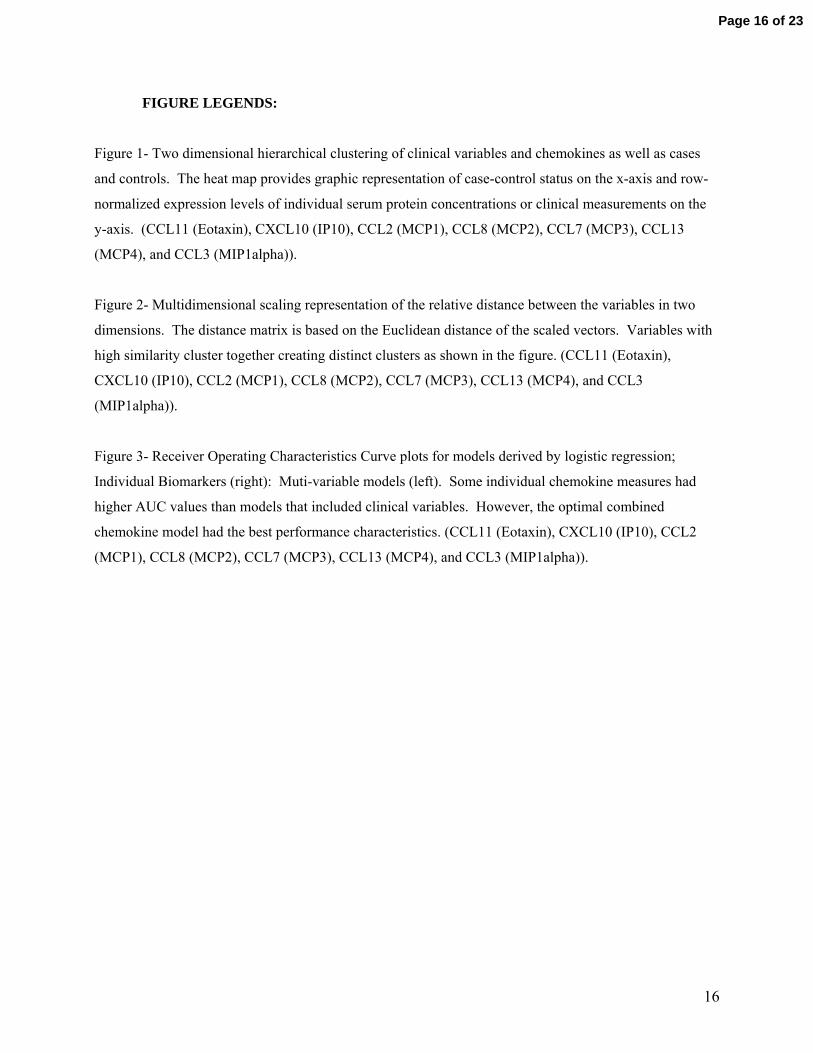
FIGURE LEGENDS:
Figure 1- Two dimensional hierarchical clustering of clinical variables and chemokines as well as cases
and controls. The heat map provides graphic representation of case-control status on the x-axis and row-
normalized expression levels of individual serum protein concentrations or clinical measurements on the
y-axis. (CCL11 (Eotaxin), CXCL10 (IP10), CCL2 (MCP1), CCL8 (MCP2), CCL7 (MCP3), CCL13
(MCP4), and CCL3 (MIP1alpha)).
Figure 2- Multidimensional scaling representation of the relative distance between the variables in two
dimensions. The distance matrix is based on the Euclidean distance of the scaled vectors. Variables with
high similarity cluster together creating distinct clusters as shown in the figure. (CCL11 (Eotaxin),
CXCL10 (IP10), CCL2 (MCP1), CCL8 (MCP2), CCL7 (MCP3), CCL13 (MCP4), and CCL3
(MIP1alpha)).
Figure 3- Receiver Operating Characteristics Curve plots for models derived by logistic regression;
Individual Biomarkers (right): Muti-variable models (left). Some individual chemokine measures had
higher AUC values than models that included clinical variables. However, the optimal combined
chemokine model had the best performance characteristics. (CCL11 (Eotaxin), CXCL10 (IP10), CCL2
(MCP1), CCL8 (MCP2), CCL7 (MCP3), CCL13 (MCP4), and CCL3 (MIP1alpha)).
16
Page 16 of 23

TABLES:
Clinical Variable CCL11 CXCL10 CCL2 CCL8 CCL7 CCL13 CCL3age 0.131 0.036 0.269 0.04 0.035 0.378 0.018Body Mass Index1 0.003 0.009 0.053 0.012 0.013 0.007 0.042Waist Circumference 0.076 0.095 0.291 0.222 0.288 0.082 0.116smoker (never vs ever) 0.927 0.761 0.803 0.898 0.409 0.987 0.826hypertension (self report) 0.002 0.129 0.013 0.019 0.194 0.012 0.231fasting glucose1,2 0.561 0.341 0.962 0.196 0.155 0.724 0.081fasting insulin1,2 0.49 0.848 0.477 0.205 0.527 0.707 0.943diabetes (self report) <0.001 0.004 0.032 0.005 0.025 0.002 0.016high cholesterol 0.216 0.823 0.219 0.207 0.452 0.339 0.45C-Reactive Protein1 0.194 0.562 0.994 0.506 0.27 0.779 0.97Use of Statins 0.848 0.699 0.581 0.897 0.767 0.677 0.874Use of Aspirin 0.883 0.34 0.764 0.491 0.348 0.892 0.631Use of ACE Inhibitors 0.53 0.966 0.131 0.959 0.815 0.198 0.6241 A natural log transformation of this variable was used in the regression2 Subjects with a history of diabetes or who were not fasting at the time of the blood draw were excluded
Biomarker1
Table 1. Summary of p-values for the marginal effects of each clinical variable on each biomarker adjusted for Case-Control Status (p values <0.05 in bold)
3 CCL11 (Eotaxin), CXCL10 (IP10), CCL2 (MCP1), CCL8 (MCP2), CCL7 (MCP3), CCL13 (MCP4), and CCL3 (MIP1alpha).
17
Page 17 of 23
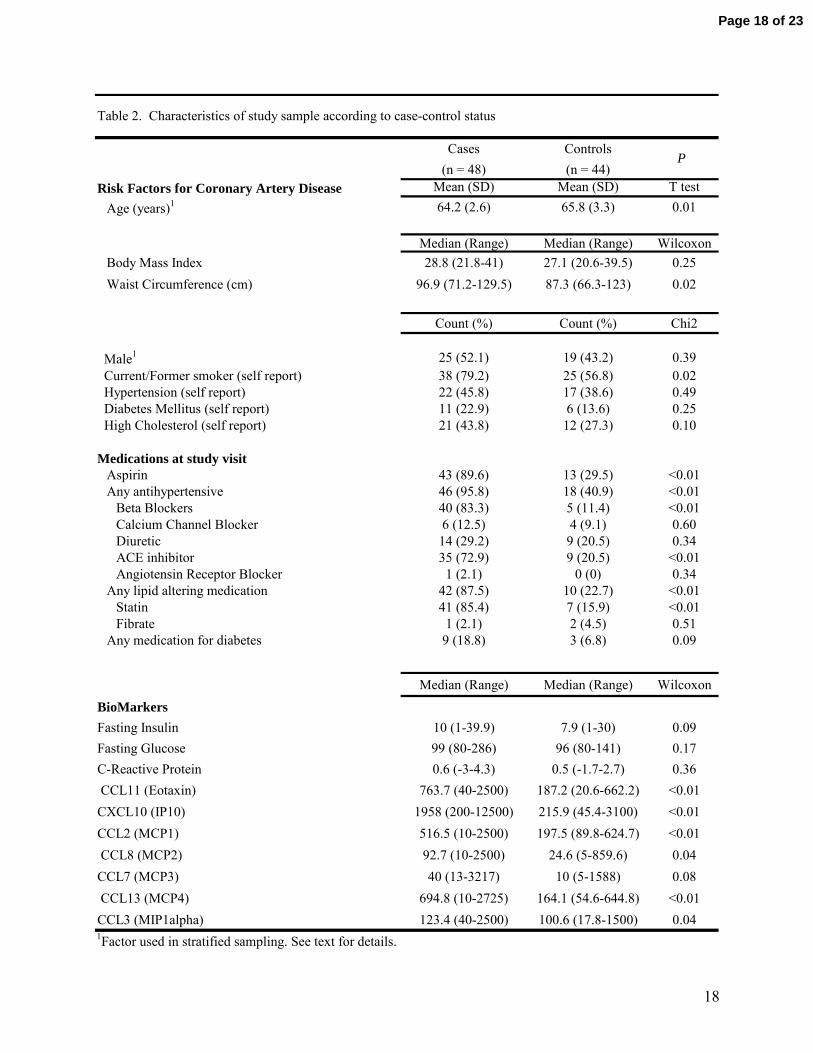
Cases Controls(n = 48) (n = 44)
Risk Factors for Coronary Artery Disease Mean (SD) Mean (SD) T testAge (years)1 64.2 (2.6) 65.8 (3.3) 0.01
Median (Range) Median (Range) WilcoxonBody Mass Index 28.8 (21.8-41) 27.1 (20.6-39.5) 0.25Waist Circumference (cm) 96.9 (71.2-129.5) 87.3 (66.3-123) 0.02
Count (%) Count (%) Chi2
Male1 25 (52.1) 19 (43.2) 0.39 Current/Former smoker (self report) 38 (79.2) 25 (56.8) 0.02 Hypertension (self report) 22 (45.8) 17 (38.6) 0.49 Diabetes Mellitus (self report) 11 (22.9) 6 (13.6) 0.25 High Cholesterol (self report) 21 (43.8) 12 (27.3) 0.10
Medications at study visitAspirin 43 (89.6) 13 (29.5) <0.01Any antihypertensive 46 (95.8) 18 (40.9) <0.01
Beta Blockers 40 (83.3) 5 (11.4) <0.01Calcium Channel Blocker 6 (12.5) 4 (9.1) 0.60Diuretic 14 (29.2) 9 (20.5) 0.34ACE inhibitor 35 (72.9) 9 (20.5) <0.01Angiotensin Receptor Blocker 1 (2.1) 0 (0) 0.34
Any lipid altering medication 42 (87.5) 10 (22.7) <0.01Statin 41 (85.4) 7 (15.9) <0.01Fibrate 1 (2.1) 2 (4.5) 0.51
Any medication for diabetes 9 (18.8) 3 (6.8) 0.09
Median (Range) Median (Range) WilcoxonBioMarkersFasting Insulin 10 (1-39.9) 7.9 (1-30) 0.09Fasting Glucose 99 (80-286) 96 (80-141) 0.17C-Reactive Protein 0.6 (-3-4.3) 0.5 (-1.7-2.7) 0.36 CCL11 (Eotaxin) 763.7 (40-2500) 187.2 (20.6-662.2) <0.01CXCL10 (IP10) 1958 (200-12500) 215.9 (45.4-3100) <0.01CCL2 (MCP1) 516.5 (10-2500) 197.5 (89.8-624.7) <0.01 CCL8 (MCP2) 92.7 (10-2500) 24.6 (5-859.6) 0.04CCL7 (MCP3) 40 (13-3217) 10 (5-1588) 0.08 CCL13 (MCP4) 694.8 (10-2725) 164.1 (54.6-644.8) <0.01CCL3 (MIP1alpha) 123.4 (40-2500) 100.6 (17.8-1500) 0.04
P
Table 2. Characteristics of study sample according to case-control status
1Factor used in stratified sampling. See text for details.
18
Page 18 of 23

Classification Algorithm Variables selected (in order) AUC (SE)
Logistic Regression1 CXCL10, CCL3, waist circ, CCL7, smoking 0.95 (0.03)
Linear Discriminant Analysis1 CCL13, CCL3, CXCL10 0.94 (0.03)Recursive Partitioning CCL7, CCL11, CCL13 0.88 (0.04)
AUC = Area under the Receiver Operating Curve, SE = standard error1age was forced into model (see text for details)
Table 3. Summary of variables selected by each classification algorithm and the respective diagnostic performance in predicting case control status
Model1 AUC (SE) P
Best model derived by LR2 0.95 (0.03) referenceTraditional Risk Factors3 0.67 (0.06) <0.001Traditional Risk Factors3 + CRP 0.68 (0.06) <0.001CCL3 (MIP1alpha) 0.69 (0.06) <0.001CCL7 (MCP3) 0.74 (0.05) <0.001CCL8 (MCP2) 0.79 (0.05) 0.001CCL11 (Eotaxin) 0.86 (0.04) 0.037CCL2 (MCP1) 0.87 (0.04) 0.05CXCL10 (IP10) 0.90 (0.03) 0.06CCL13 (MCP4) 0.90 (0.04) 0.1AUC = Area under the Receiver Operating Curve, SE = standard error1variable 'age' was forced into all models (see text for details)2variables MCP3, IP10, MIP1alpha 3variables waist circumference, diabetes, hypertension, high cholesterol, and smoking
Table 4. Comparison of AUC values between the multimarker model and other models derived by logistic regression
19
Page 19 of 23

Figure 1
Page 20 of 23

Figure 2
Page 21 of 23

Figure 3A
Page 22 of 23

Figure 3B
Page 23 of 23