Determinants of assemblage structure in Neotropical dry forest lizards
19
Determinants of assemblage structure in Neotropical dry forest lizards FERNANDA de PINHO WERNECK, 1 GUARINO RINALDI COLLI 1 * AND LAURIE JOSEPH VITT 2 1 Departamento de Zoologia, Universidade de Brasília, 70910-900 Brasília, DF, Brazil (Email: grcolli@ unb.br); and 2 Sam Noble Oklahoma Museum of Natural History, Norman, Oklahoma, 73072 USA Abstract We investigated the structure of a lizard assemblage from Seasonally DryTropical Forest enclaves in the Brazilian Cerrado biome, by testing the roles of ecological and historical components.We analysed data from 469 individuals, belonging to 18 lizard species, sampled by a combination of pitfall, funnel and glue traps, as well as by haphazard sampling. Null model analyses and Canonical Phylogenetic Ordination analysis, coupled with Monte Carlo simulations, revealed lack of both ecological and phylogenetic structure in microhabitat use. Conversely, these analyses revealed a mean overlap in diet composition significantly smaller than expected by chance and significant historical structure. Structure in diet composition was due to phylogenetic effects corresponding to the most basal divergence of the squamate phylogeny (Iguania/Scleroglossa) and the clades Teiidae and Gymnophthalmidae. Among lizards, evolutionary constraints on microhabitat use appear less than on prey use, suggesting that the availability of historically preferred prey types moderates microhabitat selection. The lack of structure in microhabitat use suggests absence of competitive interactions on the spatial component. On the other hand, food preferences have a deep historical basis and do not reflect current competitive interactions. Key words: Canonical Phylogenetic Ordination, Cerrado, community ecology, lizard, phylogenetic constraint, Seasonally Dry Tropical Forest. INTRODUCTION During community assembly, different species may invade, persist and become extinct, sometimes repeat- edly (Hang-Kwang & Pimm 1993). Throughout this process, the time interval and the particular sequence of species invasions may influence the observed final structure (Drake 1991; Putman 1996). Both stochastic (Connor & Simberloff 1979, 1983; Bell 2001; Gains- bury & Colli 2003) and deterministic (historical or ecological, Diamond & Gilpin 1982; Roughgarden 1983; Gotelli & McCabe 2002) events can influence community structure and assembly. Considering deterministic events, studies on the structure of bio- logical communities should investigate both causal levels: proximate, related to ecological or current pro- cesses, and ultimate, related to historical or evolution- ary processes (Brooks & McLennan 1991; Losos 1996; Webb et al. 2002). At the ecological level, competition is often viewed as most important in structuring communities (Diamond & Gilpin 1982; Roughgarden 1983; Gotelli & McCabe 2002). Nevertheless, predation, mutual- ism, environmental heterogeneity, temporal variation of conditions and resource partitioning (temporal, spatial or dietary) may also influence communities (Pianka 1973; Brooks & McLennan 1993; Brown 1995). Because current ecological patterns may reflect phylogenetic inertia instead of adaptation, neither should be used as the sole hypothesis to investigate community structure (Losos 1994). Hence, related species should not be treated as independent units in conventional statistical analyses that investigate com- munity structure (Brooks & McLennan 1991, 1993; Miles & Dunham 1993). The historical approach rec- ognizes that community composition results from a combination of vicariant (association by descent), dis- persing (association by colonization) and in situ evolu- tionary (speciation) events, the resultant community being a mosaic of historical and ecological influences (Brooks & McLennan 1991, 1993; Webb et al. 2002). In Cerrado, a vast, predominantly open-vegetation biome that covers the central Brazilian Plateau (Oliveira & Marquis 2002) and one of the 25 global biodiversity hotspots (Myers et al. 2000), local lizard richness is comparable to that of Neotropical forests, in some cases reaching 25 species (Colli et al. 2002). This is partially due to a rich mosaic of vegetation types, including grasslands, woodlands and forests (e.g. Eiten 1972, 1979; Oliveira & Marquis 2002), among which different lizard species are distributed (Colli et al. 2002; Nogueira et al. 2005; Vitt et al. 2007a). Thus, forest ecosystems in Cerrado, such as *Corresponding author. Accepted for publication February 2008. Austral Ecology (2009) 34, 97–115 © 2009 The Authors doi:10.1111/j.1442-9993.2008.01915.x Journal compilation © 2009 Ecological Society of Australia
-
Upload
independent -
Category
Documents
-
view
2 -
download
0
Transcript of Determinants of assemblage structure in Neotropical dry forest lizards

Determinants of assemblage structure in Neotropicaldry forest lizards
FERNANDA de PINHO WERNECK,1 GUARINO RINALDI COLLI1* ANDLAURIE JOSEPH VITT2
1Departamento de Zoologia, Universidade de Brasília, 70910-900 Brasília, DF, Brazil (Email: [email protected]); and 2Sam Noble Oklahoma Museum of Natural History, Norman, Oklahoma, 73072 USA
Abstract We investigated the structure of a lizard assemblage from Seasonally DryTropical Forest enclaves in theBrazilian Cerrado biome, by testing the roles of ecological and historical components. We analysed data from 469individuals, belonging to 18 lizard species, sampled by a combination of pitfall, funnel and glue traps, as well as byhaphazard sampling. Null model analyses and Canonical Phylogenetic Ordination analysis, coupled with MonteCarlo simulations, revealed lack of both ecological and phylogenetic structure in microhabitat use. Conversely,these analyses revealed a mean overlap in diet composition significantly smaller than expected by chance andsignificant historical structure. Structure in diet composition was due to phylogenetic effects correspondingto the most basal divergence of the squamate phylogeny (Iguania/Scleroglossa) and the clades Teiidae andGymnophthalmidae. Among lizards, evolutionary constraints on microhabitat use appear less than on prey use,suggesting that the availability of historically preferred prey types moderates microhabitat selection. The lack ofstructure in microhabitat use suggests absence of competitive interactions on the spatial component. On the otherhand, food preferences have a deep historical basis and do not reflect current competitive interactions.
Key words: Canonical Phylogenetic Ordination, Cerrado, community ecology, lizard, phylogenetic constraint,Seasonally Dry Tropical Forest.
INTRODUCTION
During community assembly, different species mayinvade, persist and become extinct, sometimes repeat-edly (Hang-Kwang & Pimm 1993). Throughout thisprocess, the time interval and the particular sequenceof species invasions may influence the observed finalstructure (Drake 1991; Putman 1996). Both stochastic(Connor & Simberloff 1979, 1983; Bell 2001; Gains-bury & Colli 2003) and deterministic (historical orecological, Diamond & Gilpin 1982; Roughgarden1983; Gotelli & McCabe 2002) events can influencecommunity structure and assembly. Consideringdeterministic events, studies on the structure of bio-logical communities should investigate both causallevels: proximate, related to ecological or current pro-cesses, and ultimate, related to historical or evolution-ary processes (Brooks & McLennan 1991; Losos1996; Webb et al. 2002).
At the ecological level, competition is often viewedas most important in structuring communities(Diamond & Gilpin 1982; Roughgarden 1983; Gotelli& McCabe 2002). Nevertheless, predation, mutual-ism, environmental heterogeneity, temporal variationof conditions and resource partitioning (temporal,
spatial or dietary) may also influence communities(Pianka 1973; Brooks & McLennan 1993; Brown1995). Because current ecological patterns may reflectphylogenetic inertia instead of adaptation, neithershould be used as the sole hypothesis to investigatecommunity structure (Losos 1994). Hence, relatedspecies should not be treated as independent units inconventional statistical analyses that investigate com-munity structure (Brooks & McLennan 1991, 1993;Miles & Dunham 1993). The historical approach rec-ognizes that community composition results from acombination of vicariant (association by descent), dis-persing (association by colonization) and in situ evolu-tionary (speciation) events, the resultant communitybeing a mosaic of historical and ecological influences(Brooks & McLennan 1991, 1993; Webb et al. 2002).
In Cerrado, a vast, predominantly open-vegetationbiome that covers the central Brazilian Plateau(Oliveira & Marquis 2002) and one of the 25 globalbiodiversity hotspots (Myers et al. 2000), local lizardrichness is comparable to that of Neotropical forests,in some cases reaching 25 species (Colli et al. 2002).This is partially due to a rich mosaic of vegetationtypes, including grasslands, woodlands and forests(e.g. Eiten 1972, 1979; Oliveira & Marquis 2002),among which different lizard species are distributed(Colli et al. 2002; Nogueira et al. 2005; Vitt et al.2007a). Thus, forest ecosystems in Cerrado, such as
*Corresponding author.Accepted for publication February 2008.
Austral Ecology (2009) 34, 97–115
© 2009 The Authors doi:10.1111/j.1442-9993.2008.01915.xJournal compilation © 2009 Ecological Society of Australia

‘cerradão’, gallery forest and Seasonally Dry TropicalForest (SDTF) enclaves, are important to the main-tenance of viable populations of forest species, con-tributing to the regional diversity and to communitydynamics (Silva 1995a,b; Brandão & Araujo 2001;Silva & Bates 2002; Werneck & Colli 2006).
Seasonally Dry Tropical Forests are tree-dominatedecosystems that occur on fertile soils under stronglyseasonal climates (Murphy & Lugo 1986; Bullocket al. 1995; Pennington et al. 2006). SDTFs havea discontinuous distribution in the Caribbean andCentral and South America, from Mexico to Argen-tina, with three recognized nuclei: the ‘Caatingasnucleus’ of northeastern Brazil, the ‘Misiones nucleus’on the Paraguay-Paraná River and the ‘SubandeanPiedmont nucleus’ of south-western Bolivia andnorth-western Argentina (Prado & Gibbs 1993;Pennington et al. 2000; Prado 2000; Pennington et al.2006). Because of their fertile soils, SDTFs are highlysuitable for cultivation and are under drastic con-version into agricultural lands. This, combined with areduced attention from conservation agencies, makesSDTFs one of the most threatened tropical ecosystems(Janzen 1988; Scariot & Sevilha 2003; Sánchez-Azofeifa et al. 2005; Scariot & Sevilha 2005; Mileset al. 2006; Pennington et al. 2006; Prance 2006;Vieira & Scariot 2006). Several less-studied and more-isolated SDTF remnants occur as enclaves withinCerrado, in areas of favourable edaphic conditionsderived from basic rocks (Ratter et al. 1978; Silva1995a; Silva & Bates 2002). Some of the largest rem-nants occur in northeastern Goiás state, in the muni-cipality of São Domingos (Scariot & Sevilha 2000,2003, 2005; Felfili 2003). A biogeographical analysisof lizard assemblages from São Domingos SDTFenclaves (Werneck & Colli 2006) revealed the com-bined influences of dispersal (from neighbour Cerradoassemblages), history/vicariance (from Caatinga) andin situ evolution (e.g. Mabuya sp.). Herein we investi-gate the role of species interactions (mainly competi-tion) and historical constraints in the formation of thelizard assemblage in São Domingos SDTF enclaves.More specifically, we test for the presence of assem-blage structure, in terms of microhabitat use anddiet composition, using null models (Gotelli & Graves1996; Gotelli 2000) and Canonical PhylogeneticOrdination analysis (Giannini 2003).
METHODS
Study site
The Paranã River basin is a depression in centralBrazil, between the Divisor São Francisco-Tocantinsand the Central Goiano plateaux (IBGE 1995). The
headwaters of the Paranã River are in Serra Geralde Goiás, whereas in the city of Paranã, southernTocantins state, the Paranã River merges with theTocantins River, a major tributary of the AmazonasRiver. SDTFs are the dominant native vegetation inthe Paranã River valley. Altitude in the region rangesfrom 400 to 600 m (IBGE 1995), and the climatefalls into Köppen’s Aw category (Nimer 1989), witha mean annual temperature of 24°C, mean annualrainfall of 1500 mm/year, and at least 5–6 monthsreceiving less than 200 mm. During the 1980s, intensehuman occupation in the Paranã River valley reducedSDTFs to small fragments in flat, lowland areas or onlimestone outcrops (Scariot & Sevilha 2000, 2003;Felfili 2003). Cattle ranching (70%), farming, forestryand charcoal production are the main uses of themodified matrix among fragments (Scariot & Sevilha2005). Because of its high biodiversity and conserva-tion threats, the region was recently considered as ofextremely high ecological relevance for conservation(MMA 1999).
Lizard sampling
We conducted four expeditions spanning wet and dryperiods, to account for seasonal effects (30 August–11September 2003, 19 November–15 December 2003,14–22 March 2004, and 22 November–1 December2004), totalling 59 days of field work. We sampledlizards in both disturbed and undisturbed SDTFfragments, on flat lowlands and limestone outcropsin the municipality of São Domingos, Goiás, Brazil(13°23′54″S, 46°16′06″W) (Fig. 1). We installed 25arrays of pitfall traps with drift fences, 30 m apartfrom each other, along a trail in an undisturbed250 ha SDTF fragment at Fazenda Flor do Ermo(13°39′26″S, 46°45′09″W). Each array consisted offour 30-L plastic buckets arranged in a ‘Y’, with acentral bucket connected to each of three peripheralbuckets by a 5 m long and 0.5 m high plastic driftfence, forming three 120° angles (Fig. 1E). We buriedthe base of the plastic fences in the soil (ca. 10 cm) toprevent lizards from passing underneath. We checkedarrays daily and closed the buckets between expe-ditions to prevent unwarranted captures. We also col-lected additional specimens in neighbouring SDTFfragments using funnel traps (Fig. 1F), glue trapsand haphazard sampling (by hand, noose or using ashotgun).
We euthanized captured lizards with a lethal injec-tion of Tiopental and fixed them in 10% formalin.We deposited all specimens in Coleção Herpetológicada Universidade de Brasília. During manual captures,we recorded the time of capture and microhabitatwhere lizards were first sighted.We investigated assem-blage structure in microhabitat use (spatial niche) and
98 F. de PINHO WERNECK ET AL.
© 2009 The Authorsdoi:10.1111/j.1442-9993.2008.01915.xJournal compilation © 2009 Ecological Society of Australia

diet composition (alimentary niche). Even thoughfine-scale temporal differences may enable species coe-xistence (Goodman 2007), the temporal niche is lessimportant in this lizard assemblage, because mostspecies are diurnal, except Gymnodactylus carvalhoi
(Colli et al. 2003) and Phyllopezus pollicaris (Vitt1995), which are primarily nocturnal. Additionally,general lack of finer time partitioning has beenpreviously reported in other tropical lizard communi-ties (Vitt & Zani 1996).
Fig. 1. Seasonally Dry Tropical Forests in the region of São Domingos, Goiás and details of pitfall and funnel traps. (A) Wetseason, September 2003 (RN Leite). (B) Dry season, December 2003 (RN Leite). (C) Landscape fragmentation in the region(FPWerneck). (D) Intense habitat deforestation and fragmentation (FPWerneck). (E) Pitfall traps at SDTF fragment at FazendaFlor do Ermo (AB Gamble). (F) Funnel traps at SDTF fragment at Fazenda Flor do Ermo (RN Leite).
ASSEMBLAGE STRUCTURE IN DRY FOREST LIZARDS 99
© 2009 The Authors doi:10.1111/j.1442-9993.2008.01915.xJournal compilation © 2009 Ecological Society of Australia

Data analyses
Sampling efficiency
To determine the efficiency of our sampling effort,we produced a sample-based rarefaction curve(sensu Gotelli & Colwell 2001), using 10 000 randomsamples of the original data, without replacement,with EstimateS v. 7.5 (Colwell 2005).The data used inthis analysis consist of a matrix in which each speciesis a row and each sampling day is a column. Entriesin the matrix are the number of lizards collectedfor each species on each day. Additionally, we esti-mated expected richness in the assemblage usingthe ‘Abundance-based Coverage Estimator (ACE)’,which accounts for species not captured (Colwell &Coddington 1994; Colwell 2005).
Microhabitat use
We used the following categories of microhabitats usedby lizards when first sighted: branch, building (walls),burrow, leaf litter, log, open ground, rock, rock crevice,trunk, under leaf litter, under log and under treebark. Individuals collected in pitfall trap arrays werenot included in this analysis. For each species, wecomputed the microhabitat niche breadth using theinverse of Simpson’s diversity index (Simpson 1949):
Bpi
i
n=
=∑
1
2
1
,
where i is the microhabitat category, n is the number ofcategories, and p is the proportion of microhabitatcategory i. Simpson’s diversity index varies from 1 (asingle microhabitat category is used) to n (equal use ofthe n microhabitat categories). We also calculated theoverlap in microhabitat use among all species pairsusing Pianka’s overlap index (Pianka 1973):
φij
ij iki
n
iji
n
iki
n
p p
p p
= =
= =
∑
∑ ∑1
2
1
2
1
,
where P represents the proportion of microhabitat cat-egory i, while j and k represent the species pair beingcompared. Pianka’s overlap index varies from zero(no overlap) to one (complete overlap).
Diet composition
In the laboratory, we removed stomachs from allcollected lizards and analysed stomach contents under
a stereoscope, identifying prey items following Pianka(1986), with the exception of ants (Formicidae),which we considered a separate category.We recordedthe length and width of intact prey to the nearest0.01 mm, with Mitutoyo electronic calipers and esti-mated prey volume (V) as an ellipsoid:
Vw l= ⎛
⎝⎞⎠
⎛⎝
⎞⎠
43 2 2
2
π ,
where w is prey width and l is prey length. Thisapproximation has been criticized (Magnusson et al.2003). However, it is broadly used in works on lizardecology and widely regarded as the best estimate of thevolume of most prey consumed by lizards (e.g. Vitt &Zani 1996, 1998b; Colli & Zamboni 1999; Vitt et al.1999; Colli et al. 2003; Mesquita et al. 2006b). Inaddition, use of this measure allows comparison withother data sets.
For each species, we calculated the numeric andvolumetric percentage of each prey category basedon the pooled stomachs (all individuals consideredas a single stomach). From these percentages, wecomputed niche breadths and overlaps as explainedabove.Values of diet niche breadth refer to the averagebetween numeric and volumetric niche breadths.
To determine the relative importance of eachprey category for each lizard species, we calculatedan importance index (I) for pooled stomachs, whichconsiders the numeric percentage (N%), volumetricpercentage (V%) and percentage of occurrence (F%,number of stomachs with prey category i, divided bythe total number of stomachs) of each prey category,
IF N V= + +% % %
.3
Null model analyses
To determine if mean overlap in microhabitat use anddiet composition among all pairs of lizard species issmaller than expected by chance, we obtained nullmodels by randomizing the original assemblage data(Gotelli & Graves 1996; Gotelli 2001). Null modelswere used to build a null hypothesis, simulatingassemblage organization in the absence of biologicalinteractions, such as interspecific competition. Weinvestigated the presence of non-random patternsin microhabitat use and diet overlap using the NicheOverlap Module of EcoSim v.7 (Gotelli & Entsminger2004). Data in this analysis consist of a matrix, inwhich lizard species are rows and microhabitat or preycategories are columns. Cell values are utilization fre-quencies for each microhabitat category or I values foreach prey category. We used the following options ofEcoSim: Pianka’s niche overlap index, randomizationalgorithm two (RA2), and 10 000 randomizations ofthe original matrix. RA2 replaces the microhabitat or
100 F. de PINHO WERNECK ET AL.
© 2009 The Authorsdoi:10.1111/j.1442-9993.2008.01915.xJournal compilation © 2009 Ecological Society of Australia

prey category in the original matrix with a randomuniform number between zero and one, but retains thezero structure of the matrix (Winemiller & Pianka1990). In this manner, RA2 assumes that, even in theabsence of biological interactions among species, somemicrohabitats or prey categories are unavailable tosome species. The result of the analysis is a null dis-tribution of niche overlap values against which theobserved (mean) value of niche overlap in the assem-blage is checked with a one-tailed Z-test. We consid-ered the significance level of 0.05 to reject the nullhypothesis.
To avoid miscalculation of null models because ofthe small sample size of some species, we repeatedboth analyses (overlap in microhabitat use and dietcomposition) retaining only the most abundantlizard species and using two different cut-offs (n > 5and n > 15). As both approaches produced identicalresults, we only present results for the more com-plete data set (including all species with n > 5). Formicrohabitat use, we excluded Ameiva ameiva(n = 3), Cnemidophorus ocellifer (1), Iguana iguana (3),Mabuya nigropunctata (5), Polychrus acutirostris (2),Tropidurus torquatus (1), Tupinambis merianae (3) andTu. quadrilineatus (1). For diet composition, weexcluded Am. ameiva (5), Lygodactylus klugei (4), Tr.torquatus (1) and Tu. merianae (1). For diet com-position, we also repeated the analysis excludingprey categories with an importance index less than5% for at least one lizard species. Excluded preycategories were Acari, Dermaptera, Diplopoda,Mantodea, plant material, lizard skin, Odonata,Opiliones, insect eggs, Pseudoscorpionida, Scorpi-onida and Solifuga.
Canonical Phylogenetic Ordination
To assess the role of history in structuring the lizardassemblage from SDTFs enclaves, we combined phy-logenetic hypotheses from different studies (Presch1974; Kluge 1987; Estes et al. 1988; Frost & Etheridge1989; Frost et al. 2001; Lee 2005) to build a supertreerelating all lizard species in the assemblage (Sandersonet al. 1998; Webb et al. 2002) (Fig. 2). We also ran aseparate analysis considering a recent, molecularphylogeny for Squamata, in which Iguania is nestedwithin, and not forming a basal dichotomy with Sclero-glossa, as in the traditional, morphological phylogeny(Townsend et al. 2004; Vidal & Hedges 2005; Fry et al.2006). To test the existence of phylogenetic effects,we used Canonical Phylogenetic Ordination (CPO)(Giannini 2003) coupled with Monte Carlo permuta-tions (9999), in canoco 4.5 forWindows (Ter Braak &Smilauer 2002). CPO is a multivariate ordination tech-nique that relates the variation in a matrix of dependentvariables (microhabitat use or diet composition) withanother matrix of independent variables (phylogeneticstructure of the supertree), maximizing their corre-lations (Ter Braak 1986; Giannini 2003; Vitt & Pianka2005). When more than one clade showed significanteffects, we conducted a stepwise, manual selectionof variables in CPO. In this analysis, after testingeach variable individually to obtain F- and P-values,we added only significant variables to the model, indecreasing order of importance. Because of differencesin completeness of data for microhabitat use and dietcomposition, we used two different supertrees (Fig. 3).As in the case of null model analyses, we repeated theabove-mentioned steps after the exclusion of species
Tupinambis quadrilineatusTupinambis merianaeCnemidophorus ocelliferAmeiva ameivaColobosaura modestaMicrablepharus maximilianiMabuya nigropunctataMabuya spPhyllopezus pollicarisLygodactylus klugeiGymnodactylus carvalhoiColeodactylus meridionalisTropidurus oreadicusTropidurus torquatusTropidurus spPolychrus acutirostrisAnolis nitens brasiliensisIguana iguana
Iguania
Scleroglossa
Polychrotidae
Tropiduridae
Gekkota
Gekkoninae
Scincidae
Autarchoglossa
Teiidae
Teiinae
Tupinambinae
Gymnophtalmidae
Fig. 2. Supertree of the lizard assemblage from Seasonally Dry Tropical Forest enclaves in São Domingos, Goiás, Brazil.Phylogeny based on several authors (see text for details).
ASSEMBLAGE STRUCTURE IN DRY FOREST LIZARDS 101
© 2009 The Authors doi:10.1111/j.1442-9993.2008.01915.xJournal compilation © 2009 Ecological Society of Australia

with n � 5 and the exclusion of prey categories withI � 5%. The analysis is highly conservative becauseit uses clade membership relying only on topologicalinformation rather than distance values.
Taxonomic note
We identified two undescribed species in SDTFenclaves: Mabuya sp. and Tropidurus sp. Mabuya sp. islikely endemic to the region and is similar to M.frenata, whereas Tropidurus sp. shows some affinitieswith T. itambere and has been previously recorded byus on rock outcrops in other Cerrado localities (seeWerneck & Colli 2006).
RESULTS
Sampling efficiency, species richnessand abundance
During 59 days, and considering captures bothin traps and in haphazard sampling, we collected
469 individuals belonging to 18 lizard speciesand seven families (Table 1). From the total abun-dance, we gathered ecological data of microhabitatuse and composition from 240 and 359 indivi-duals, respectively. The most abundant specieswas Anolis nitens brasiliensis (n = 129), followed byG. carvalhoi (105) and Mabuya sp. (55). The mostdiverse families in the assemblage were Gekkonidaeand Teiidae, with five and four species, respectively(Table 1).
The rarefaction curve showed the observedrichness approaching the estimated assemblageasymptote (Fig. 4). According to the randomi-zation results, an average of 13 species would becollected with 10 days of sampling (17% of thetime), corresponding to 72% of the total obser-ved richness. In addition, an average of 18 specieswould be collected at the 35th day, after whichthe rarefaction curve stabilized. Additionally, bothobserved and expected richness had similar asy-mptotes, around 18 species, with the differencethat the ACE stabilized faster, around the 20th day(Fig. 4).
Microhabitat Diet
Anolis nitens brasiliensis
Polychrus acutirostris
Tropidurus sp.
Tropidurus torquatus
Mabuya sp.
Mabuya nigropunctata
Micrablepharus maximiliani
Tupinambis merianae
Ameiva ameiva
A
H
B
D
E
I
K
J
Tropidurus oreadicus
Gymnodactylus carvalhoi
Phyllopezus pollicaris
C
Coleodactylus meridionalis
GAnolis nitens brasiliensis
Polychrus acutirostris
Tropidurus sp.
Tropidurus torquatus
Mabuya sp.
Mabuya nigropunctata
Colobosaura modesta
Micrablepharus maximiliani
Tupinambis merianae
Ameiva ameiva
A
H
B
D
E
F
I
K
J
Tropidurus oreadicus
Gymnodactylus carvalhoi
Phyllopezus pollicaris
Lygodactylus klugei
C
Coleodactylus meridionalis
G
Iguana iguana
Tupinambis quadrilineatus
Cnemidophorus ocellifer
F
L
Fig. 3. Individual groups used in Canonical Phylogenetic Ordination for microhabitat and diet data.
102 F. de PINHO WERNECK ET AL.
© 2009 The Authorsdoi:10.1111/j.1442-9993.2008.01915.xJournal compilation © 2009 Ecological Society of Australia

Microhabitat use
Niche breadth (Bm) based on microhabitat useranged from 1.00 to 5.34 in the São Domingos lizardassemblage (Table 1). The teiids Am. ameiva (n = 3),
Tu. merianae (3) and Tu. quadrilineatus (1), exclusivelyassociated with open ground, and the iguanid I. iguana(3), exclusively associated with tree branches, hadmore restricted use of microhabitats (B = 1). Tropidu-rus torquatus and C. ocellifer, represented by a singleindividual each, were observed on trunk and underlog, respectively. On the other hand, G. carvalhoi(B = 5.34, n = 45) and Micrablepharus maximiliani(5.12, 16) had the largest values of niche breadth(Table 1, Fig. 5).
Niche overlap in microhabitat use varied fromnone to almost complete (Table 2), the greatest overlapoccurring between Tropidurus sp. and Ph. pollicaris(0.98), two species that primarily used rocks (Fig. 5).Anolis nitens brasiliensis and the teiids exclusively asso-ciated with open ground (mentioned above) also hadhigh overlaps in microhabitat use. Conversely, nicheoverlap among the most abundant species (An. nitens,Mabuya sp., G.carvalhoi and Coleodactylus meridionalis)was low (however not significantly different fromrandom as shown below). In addition, niche overlapamong phylogenetically related species (sister speciesin the assemblage supertree, Fig. 2) varied from 0.0
Table 1. Composition and abundance of 18 lizard species from Seasonally Dry Tropical Forest enclaves of São Domingos,Goiás and respective values of microhabitat use niche breadth (Bm)
Species Abundance Bm Microhabitat
GekkonidaeColeodactylus meridionalis (D) 30 2.57 (11) LL, OG, RC, UGGymnodactylus carvalhoi (D/N) 105 5.34 (45) LL, LO, OG, RC, RO, TB, TR, UG, ULLygodactylus klugei (D) 7 – –Phyllopezus pollicaris (N) 34 1.32 (30) BD, RO, TB, TR
IguanidaeIguana iguana (D) 8 1.00 (3) BR
PolychrotidaeAnolis nitens brasiliensis (D) 129 2.72 (37) BU, LL, OGPolychrus acutirostris (D) 9 2.00 (2) BR, OG
TropiduridaeTropidurus oreadicus (D) 17 3.33 (10) LO, OG, RC, ROTropidurus sp. (D) 23 1.71 (20) LO, OG, RO, TRTropidurus torquatus (D) 2 1.00 (1) TR
ScincidaeMabuya nigropunctata (D) 11 3.57 (5) LL, LO, OG, ULMabuya sp. (D) 55 3.02 (52) BU, LL, LO, OG, RO, TB, TR, UG
TeiidaeAmeiva ameiva (D) 6 1.00 (3) OGCnemidophorus ocellifer (D) 2 1.00 (1) UGTupinambis merianae (D) 4 1.00 (3) OGTupinambis quadrilineatus (D) 1 1.00 (1) OG
GymnophthalmidaeColobosaura modesta (D) 8 – –Micrablepharus maximiliani (D) 18 5.12 (16) LL, LO, OG, RC, TB, UL
Total abundance 469
Values inside parentheses correspond to sample size by species. Activity: D, diurnal; N, nocturnal. Microhabitats: BD, building(walls); BR, branch; BU, burrow; LL, leaf litter; LO, log; OG, open ground; RC, rock crevice; RO, rock; UG, under log; UL,under leaf litter; TB, under tree bark; TR, trunk.
20
18
16
14
12
10
8
6
4
Speci
es
6050403020100Days
Fig. 4. Sample-based rarefaction curve for lizard speciescollected during 59 sampling days in SDTFs remnants, SãoDomingos, Goiás, Brazil. The line represents rarefactionmeans � SD and points represent the Abundance-basedCoverage Estimator.
ASSEMBLAGE STRUCTURE IN DRY FOREST LIZARDS 103
© 2009 The Authors doi:10.1111/j.1442-9993.2008.01915.xJournal compilation © 2009 Ecological Society of Australia

100
75
50
25
0
100
75
50
25
0
100
75
50
25
0
100
75
50
25
0
100
75
50
25
0
100
75
50
25
0
100
75
50
25
0
100
75
50
25
0
100
75
50
25
0
100
75
50
25
0
100
75
50
25
0
100
75
50
25
0
100
75
50
25
0
100
75
50
25
0
100
75
50
25
0
100
75
50
25
0
A. ameiva (3) A. nitens (37)
C. meridionalis (11)
I. iguana (3)
Mabuya sp (52)
P. pollicaris (30)
T. oreadicus (10)
T. torquatus (1)
T. quadrilineatus (1)
C. ocellifer (1)
G. carvalhoi (44)
M. nigropunctata (5)
M. maximiliani (16)
P. acutirostris (2)
Tropidurus sp (20)
T. merianae (3)
BU TB OG LL BR BD RO UL RC UG LO TR BU TB OG LL BR BD RO UL RC UG LO TR
Fig. 5. Frequency distribution of individuals according to microhabitat categories for SDTFs of São Domingos lizards.Microhabitats: BD, building (walls); BR, branch; BU, burrow; LL, leaf litter; LO, log; OG, open ground; RC, rock crevice;RO, rock; UG, under log; UL, under leaf litter; TB, under tree bark; TR, trunk. Sample sizes in parentheses.
104 F. de PINHO WERNECK ET AL.
© 2009 The Authorsdoi:10.1111/j.1442-9993.2008.01915.xJournal compilation © 2009 Ecological Society of Australia

Tab
le2.
Pia
nka’
sni
che
over
lap
inde
xba
sed
ondi
etco
mpo
siti
on(u
pper
diag
onal
)an
dm
icro
habi
tatu
se(l
ower
diag
onal
)of
lizar
dsfr
omS
easo
nally
Dry
Tro
pica
lFor
este
ncla
ves
inS
ãoD
omin
gos,
Goi
ás,
Bra
zil
Aam
Ani
Coc
Cm
eC
mo
Gca
Iig
Lkl
Mni
Msp
Mm
aP
poP
acT
orT
spT
toT
quT
me
Aam
0.73
–0.
580.
000.
29–
0.04
0.54
0.26
0.37
0.70
0.20
0.52
0.34
0.65
–0.
66A
ni0.
85–
0.75
0.33
0.50
–0.
370.
840.
510.
760.
920.
210.
490.
340.
73–
0.78
Coc
0.00
0.18
––
––
––
––
––
––
––
–C
me
0.15
0.58
0.15
0.19
0.86
–0.
170.
680.
910.
380.
870.
090.
640.
220.
47–
0.54
Cm
o–
––
–0.
19–
0.84
0.13
0.14
0.37
0.14
0.00
0.25
0.00
0.00
–0.
00G
ca0.
100.
180.
310.
38–
–0.
220.
510.
940.
250.
600.
120.
800.
410.
33–
0.12
Iig
0.00
0.00
0.00
0.00
–0.
00–
––
––
––
––
––
Lkl
––
––
––
–0.
150.
130.
560.
200.
420.
280.
120.
23–
0.00
Mni
0.38
0.76
0.38
0.77
–0.
250.
00–
0.55
0.69
0.76
0.22
0.37
0.15
0.52
–0.
58M
sp0.
370.
380.
030.
15–
0.27
0.00
–0.
570.
200.
680.
070.
610.
160.
28–
0.28
Mm
a0.
430.
640.
000.
80–
0.52
0.00
–0.
700.
490.
550.
200.
190.
200.
42–
0.38
Ppo
0.00
0.00
0.00
0.00
–0.
640.
00–
0.00
0.05
0.01
0.25
0.50
0.30
0.77
–0.
84P
ac0.
710.
600.
000.
10–
0.07
0.71
–0.
270.
260.
300.
000.
240.
200.
60–
0.17
Tor
0.73
0.62
0.00
0.19
–0.
580.
00–
0.41
0.62
0.52
0.55
0.52
0.75
0.52
–0.
10T
sp0.
130.
120.
000.
02–
0.65
0.00
–0.
100.
210.
090.
980.
090.
680.
63–
0.10
Tto
0.00
0.09
0.00
0.00
–0.
100.
00–
0.00
0.13
0.00
0.04
0.00
0.00
0.07
–0.
73T
qu1.
000.
850.
000.
15–
0.10
0.00
–0.
380.
370.
430.
000.
710.
730.
130.
00–
Tm
e1.
000.
850.
000.
15–
0.10
0.00
–0.
380.
370.
430.
000.
710.
730.
130.
001.
00
Aam
,A
mei
vaam
eiva
;A
ni,
Ano
lisni
tens
bras
ilien
sis;
Coc
,C
nem
idop
horu
soc
ellif
er;
Cm
e,C
oleo
dact
ylus
mer
idio
nalis
;C
mo,
Col
obos
aura
mod
esta
;G
ca,
Gym
noda
ctyl
usca
rval
hoi;
Iig,
Igua
naig
uana
;Lkl
,Lyg
odac
tylu
skl
ugei
;Mni
,Mab
uya
nigr
opun
ctat
a;M
sp,M
abuy
asp
;Mm
a,M
icra
blep
haru
sm
axim
ilian
i;P
po,P
hyllo
pezu
spo
llica
ris;
Pac
,Pol
ychr
usac
utir
ostr
is;
Tor
,Tr
opid
urus
orea
dicu
s;T
sp,
Trop
idur
ussp
;Tto
,Tr
.tor
quat
us;T
qu,
Tupi
nam
bis
quad
rilin
eatu
s;T
me,
Tu.m
eria
nae.
ASSEMBLAGE STRUCTURE IN DRY FOREST LIZARDS 105
© 2009 The Authors doi:10.1111/j.1442-9993.2008.01915.xJournal compilation © 2009 Ecological Society of Australia

(Am. ameiva vs. C. ocellifer and Tr. torquatus vs. Tr.oreadicus) to 1.0 (Tu. merianae vs. Tu. quadrilineatus).However, in most cases these values were low ormoderate (Table 2, see pairs of sister species).
Mean overlap in microhabitat use was not signifi-cantly different from random (Fig. 6), taking either allspecies (x̄f = 0.28; P = 0.29) or only the most abun-dant species (x̄f = 0.39; P = 0.42), indicating lack ofassemblage structure with respect to microhabitat use.The CPO, coupled with Monte Carlo simulations,revealed no significant phylogenetic effects upon pat-terns of microhabitat use, taking either all lizardspecies or only the most abundant (Table 3) and alsoconsidering the molecular phylogenetic hypothesis(results not shown).
Diet composition
We analysed 359 stomachs belonging to 15 of the 18collected species (C. ocellifer, I. iguana and Tu. quadri-lineatus had empty stomachs). We identified 24 preycategories (Table 4), whose importance indices variedfrom 0.45 (Opiliones for An. n. brasiliensis) to 70.99(Formicidae for Tropidurus sp.). Taking all lizard
species together, the most important prey categorieswere spiders (Ma. nigropunctata and Mi. maximiliani),roaches (Colobosaura modesta and L. klugei), termites(Cole. meridionalis, G. carvalhoi and Mabuya sp.), ants(Tropidurus sp.), orthopterans (An. n. brasiliensis, Ph.pollicaris, Tu. merianae and Tr. torquatus) and insectlarvae (Am. ameiva and Tr. oreadicus) (Table 4).
Niche breadth based on diet composition variedfrom 1.00 (Tu. merianae and Tr. torquatus) to 5.51(An. n. brasiliensis) (Table 4). However, excluding Tu.merianae and Tr. torquatus, each with a single analysedstomach, the lowest values of diet breadth were of Colo.modesta (1.35) and Am. ameiva (2.20). Overlaps in dietcomposition ranged from zero (Am. ameiva vs. Colo.modesta, Colo. modesta vs. Po. acutirostris, Colo. modestavs. Tropidurus sp., Colo. modesta vs. Tr. torquatus, Colo.modesta vs.Tu. merianae and L. klugei vs.Tu. merianae)to 0.94 (G. carvalhoi vs. Mabuya sp.) (Table 2).The highest overlaps in diet composition occurredamong species that feed preferentially on termites(Cole. meridionalis, G. carvalhoi and Mabuya sp.). Likeobserved patterns of microhabitat use, sister species inthe assemblage supertree (Fig. 2) showed low to mod-erate overlaps in diet composition, from a minimumof 0.200 (L. klugei vs. Ph. pollicaris) to a maximum of0.748 (Tropidurus sp. vs. Tr. oreadicus) (for all pairssee Table 2). Mabuya sp. and Ma. nigropunctata pre-sented high overlaps with almost all species, but onlya moderate value between themselves (0.546).
Null model analyses showed that mean overlap indiet composition was not significantly different fromrandom, taking either all lizard species (x̄f = 0.41; P =0.62) or only the most abundant (x̄f = 0.42; P = 0.32).However, after the exclusion of under-representedprey categories, mean overlap in diet composition wassignificantly smaller than expected by chance, both forall lizard species (P = 0.03) or only the most abundant(P < 0.001; Fig. 7), indicating assemblage structurealong the food niche axis.
With all prey categories and all lizard speciesincluded in the analysis, the CPO coupled with MonteCarlo simulations revealed significant phylogeneticeffects only for Iguania/Scleroglossa (Table 5). Afterthe exclusion of infrequent lizard species, the twoclades Iguania/Scleroglossa and Gymnophthalmidaeaccounted for significant fractions of the total variationin diet composition (Table 5). Including only themost important prey categories and all lizard species,we identified two historical dietary divergences(Iguania/Scleroglossa and Teiidae) that, in combi-nation, accounted for 58.4% of the total variation(Table 6). After the exclusion of infrequent lizardspecies, dietary divergences were only evident in Gym-nophthalmidae and Iguania/Scleroglossa, explaining68.1 % of the total variation (Table 6). Iguania andScleroglossa, the most basal clades of Squamataaccording to the traditional, morphological phylogeny,
200
150
100
50
0
Simulation means of microhabitat overlap
0.500.450.400.350.30
200
150
100
50
0.360.340.320.300.280.260.240.22
p = 0.29
p = 0.42
↓
↓
0.28
0.39
(A)
(B)
Sim
ula
tion fre
quencie
s
Fig. 6. Observed and expected mean microhabitat nicheoverlap among lizards from SDTFs of São Domingos, con-sidered all species (A) and only the most abundant species(B). Arrows indicate observed means, P-values are probabili-ties that observed means are smaller than expected randommeans (10 000 simulations).
106 F. de PINHO WERNECK ET AL.
© 2009 The Authorsdoi:10.1111/j.1442-9993.2008.01915.xJournal compilation © 2009 Ecological Society of Australia
were diametrically opposite in diet composition(Fig. 8). Iguanians fed mainly on coleopterans, antsand other hymenopterans, whereas scleroglossans fedmore on termites, orthopterans and spiders (Fig. 8).Teiidae and Gymnophthalmidae had similar diets,with dominance of the same prey categories as otherscleroglossans, in addition to insect larvae and roaches(Fig. 8). In agreement with these results, the CPObased on the recent, molecular phylogeny and usingall combinations of data sets (varying both number oflizard species and prey categories included) revealedsignificant phylogenetic effects for the clade Iguaniaand for at least one of the following clades,Teiidae andGymnophthalmidae.
DISCUSSION
Sampling efficiency, species richnessand abundance
The lizard assemblage of São Domingos SDTFenclaves was phylogenetically diverse, including repre-sentatives of the major clades of Neotropicalsquamates. As in other parts of the globe, Scleroglossa(12 species, snakes excluded) was more species-richthan Iguania (six species), reflecting the adaptivesuccess of this lineage, presumably a result of anancient competitive superiority in terrestrial micro-habitats (Vitt et al. 2003). Despite the substantialisolation of Cerrado SDTF enclaves relative to other
SDTFs in South America (Prado & Gibbs 1993;Prado 2000), local lizard richness in São Domingoswas high compared with other open-vegetation sites inthe Neotropical realm (e.g. Vitt 1995; Colli et al. 2002;Nogueira et al. 2005; Mesquita et al. 2006a,b), high-lighting its importance for conservation.
Our sampling effort was adequate to represent locallizard richness, given the shape of the rarefaction curveand the similarity between the observed and estimatedrichness. Nevertheless, this does not imply assemblagesaturation, which seems to be only rarely observed(Cornell & Lawton 1992; Cornell 1993; Westoby1993). Therefore, the lizard assemblage of São Dom-ingos SDTFs may still be colonized by new speciesfrom the regional pool. For instance, among the 20species known to occur in the São Domingos region(Werneck & Colli 2006), the gekkonid Briba brasilianaand the gymnophthalmid Vanzosaura rubricauda werenot recorded in SDTF enclaves.These potential invad-ers are apparently more associated with open Cerradohabitats in the region.
The large number of gekkonids in São DomingosSDTFs, relative to other sampled sites within theCerrado biome (Vitt 1991; Colli et al. 2002, 2003;Nogueira et al. 2005), reflects the affinities of SDTFenclaves with the Caatinga of northeastern Brazil(Vitt 1995; Werneck & Colli 2006). Nocturnal habitsof most gekkonids (but not Cole. meridionalis and L.klugei) allow them to inhabit rich assemblages withlittle temporal overlap with other lizard species (Pianka1986; Morton & James 1988; Morton 1993).
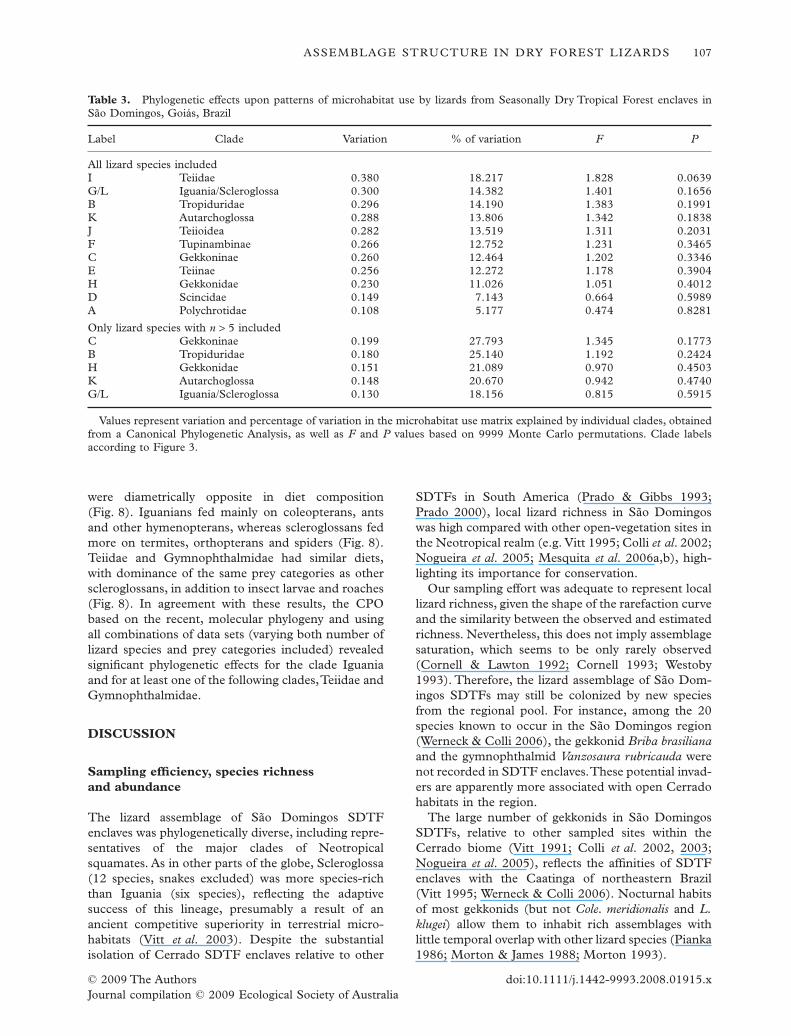
Table 3. Phylogenetic effects upon patterns of microhabitat use by lizards from Seasonally Dry Tropical Forest enclaves inSão Domingos, Goiás, Brazil
Label Clade Variation % of variation F P
All lizard species includedI Teiidae 0.380 18.217 1.828 0.0639G/L Iguania/Scleroglossa 0.300 14.382 1.401 0.1656B Tropiduridae 0.296 14.190 1.383 0.1991K Autarchoglossa 0.288 13.806 1.342 0.1838J Teiioidea 0.282 13.519 1.311 0.2031F Tupinambinae 0.266 12.752 1.231 0.3465C Gekkoninae 0.260 12.464 1.202 0.3346E Teiinae 0.256 12.272 1.178 0.3904H Gekkonidae 0.230 11.026 1.051 0.4012D Scincidae 0.149 7.143 0.664 0.5989A Polychrotidae 0.108 5.177 0.474 0.8281
Only lizard species with n > 5 includedC Gekkoninae 0.199 27.793 1.345 0.1773B Tropiduridae 0.180 25.140 1.192 0.2424H Gekkonidae 0.151 21.089 0.970 0.4503K Autarchoglossa 0.148 20.670 0.942 0.4740G/L Iguania/Scleroglossa 0.130 18.156 0.815 0.5915
Values represent variation and percentage of variation in the microhabitat use matrix explained by individual clades, obtainedfrom a Canonical Phylogenetic Analysis, as well as F and P values based on 9999 Monte Carlo permutations. Clade labelsaccording to Figure 3.
ASSEMBLAGE STRUCTURE IN DRY FOREST LIZARDS 107
© 2009 The Authors doi:10.1111/j.1442-9993.2008.01915.xJournal compilation © 2009 Ecological Society of Australia

Tab
le4.
Impo
rtan
cein
dex
ofea
chpr
eyca
tego
ryan
dva
lues
ofdi
etni
che
brea
dth
inth
edi
etof
lizar
dsp
ecie
sfr
omS
DT
Fs
encl
aves
ofS
ãoD
omin
gos,
Goi
ás
Pre
yca
tego
ryA
amA
niC
me
Cm
oG
caL
klM
niM
spM
ma
Pac
Ppo
Tm
eT
orT
spT
to
Aca
ri–
–3.
09–
––
––
––
––
––
–A
rana
e17
.76
17.6
36.
40–
8.20
–41
.31
4.62
29.7
1–
7.63
–8.
036.
082.
03N
on-i
dent
ified
–6.
538.
3819
.05
6.17
16.6
7–
4.04
13.4
7–
8.64
–3.
43–
–B
latt
aria
–14
.66
7.56
80.9
58.
9843
.01
7.79
8.36
15.8
0–
5.19
–17
.52
––
Col
eopt
era
8.96
0.91
––
4.78
18.9
07.
790.
81–
61.0
03.
74–
14.5
48.
4323
.15
Isop
tera
–10
.22
36.8
7–
48.7
9–
19.3
661
.52
––
21.2
2–
36.0
56.
332.
11S
corp
ioni
da–
––
–0.
49–
–1.
99–
––
––
––
For
mic
idae
–5.
64–
–12
.85
––
0.81
––
4.58
–36
.31
70.9
923
.66
Ort
hopt
era
57.5
837
.21
26.9
2–
6.61
–33
.28
18.0
119
.22
10.9
443
.03
100
6.92
8.11
39.6
8H
ymen
opte
ra–
1.72
––
1.49
––
3.95
–14
.67
5.09
–8.
179.
828.
17In
sect
larv
ae62
.36
8.89
13.3
5–
12.5
6–
–5.
64–
–7.
46–
41.2
127
.46
9.15
Odo
nata
–0.
48–
––
––
––
––
––
––
Man
tode
a–
0.48
––
––
––
––
––
––
–G
astr
opod
a–
2.77
––
0.51
––
0.84
–5.
56–
–7.
822.
242.
60O
pilio
nes
–0.
45–
––
––
––
––
––
––
Liz
ard
eggs
––
––
––
––
––
1.73
––
––
Pha
smid
a–
0.53
––
––
––
–5.
39–
––
–1.
80H
emip
tera
/H
omop
tera
–8.
84–
–3.
4921
.42
––
29.2
216
.09
5.45
––
16.6
010
.90
Dip
lopo
da–
1.73
––
––
–1.
03–
––
––
––
Pse
udos
corp
ione
s–
––
–1.
00–
––
––
––
––
–D
erm
apte
ra–
–3.
23–
––
––
––
––
––
–P
lant
part
s–
––
––
––
0.81
–4.
85–
––
1.84
2.23
Sol
ifug
a–
––
––
––
0.92
––
––
––
–S
hed
skin
–0.
743.
99–
––
––
––
1.73
––
––
N5
115
177
824
745
99
281
1019
1B
dn1.
987.
573.
541.
692.
364.
003.
901.
204.
173.
105.
181.
002.
571.
481.
00B
dv2.
423.
444.
181.
003.
021.
542.
073.
542.
661.
682.
701.
002.
963.
691.
00B
diet
a2.
205.
513.
861.
352.
692.
772.
992.
373.
422.
393.
941.
002.
772.
591.
00
The
mai
npr
eyca
tego
ryfo
rea
chsp
ecie
sis
inbo
ldfa
ce.B
dn,n
umer
icni
che
brea
dth;
Bdv
,vol
umet
ric
nich
ebr
eadt
h;B
diet,m
ean
betw
een
Bdn
and
Bdv
.Aam
,Am
eiva
amei
va;A
ni,
Ano
lisni
tens
;C
me,
Col
eoda
ctyl
usm
erid
iona
lis;
Cm
o,C
olob
osau
ram
odes
ta;
Gca
,G
ymno
dact
ylus
carv
alho
i;L
kl,
Lyg
odac
tylu
skl
ugei
;M
ni,
Mab
uya
nigr
opun
ctat
a;M
sp,
Mab
uya
sp.;
Mm
a,M
icra
blep
haru
sm
axim
ilian
i;P
ac,
Poly
chru
sac
utir
ostr
is;
Ppo
,P
hyllo
pezu
spo
llica
ris;
Tm
e,Tu
pina
mbi
sm
eria
nae;
Tor
,Tr
opid
urus
orea
dicu
s;T
sp,
Trop
idur
ussp
.;T
to,
Trop
idur
usto
rqua
tus.
108 F. de PINHO WERNECK ET AL.
© 2009 The Authorsdoi:10.1111/j.1442-9993.2008.01915.xJournal compilation © 2009 Ecological Society of Australia

Microhabitat use
In São Domingos SDTFs, G. carvalhoi and Mi.maximiliani showed the broadest use of availablemicrohabitats. Previous studies indicated much nar-rower microhabitat preferences in G. carvalhoi, pri-marily in association with rock outcrops and epigeoustermite nests, which provide both shelter and food(Colli et al. 2003; Vitt et al. 2007b). In São DomingosSDTFs, however, G. carvalhoi uses a wider range ofmicrohabitats (Fig. 5), presumably because of a lackof epigeous termite nests and the limited availabilityof rock outcrops in the study sites (FPW, pers. obs.2003). Considering the thermal ecology of this species(low body temperatures, Colli et al. 2003; Vitt et al.2007b), the dry forest may produce a less thermallyextreme environment, resulting in ecological release.Microhabitats under surface objects like dead trees(logs) may not be much different from living in atermite nest or under a rock. In addition, a broaderspatial niche may reduce frequency of intraspecificencounters, as in termite nests G. carvalhoi oftenoccurs in singles or pairs, or simply be a mechanism tolocate their preferred prey (termites). Micrablepharusatticolus can occur in association with leaf-cutter ant
nests (Vitt 1991; Vitt & Caldwell 1993), but in SãoDomingos Mi. maximiliani uses primarily the openground, leaf litter and rock crevices (Fig. 5).
Despite their high overlap in microhabitat use, it isunlikely that Tropidurus sp. and Ph. pollicaris interactdirectly, because Ph. pollicaris is nocturnal (Vitt 1995)and Tropidurus is diurnal. Likewise, the high overlapbetween An. n. brasiliensis and the species of teiidsexclusively associated with open ground (Am. ameiva,Tu. merianae and Tu. quadrilineatus) does not reflectdirect competition. Teiids are heliothermic and usepreferentially forest borders, which receive more directsunlight (Vitt & Colli 1994; Vitt et al. 1997b), whereasAn. n. brasiliensis uses the leaf litter of the forest floor(Vitt et al. 2001) (Fig. 5).
The low overlap in microhabitat use between thesister-species, Ma. nigropunctata and Mabuya sp.,may have permitted the successful establishment ofMabuya sp. in São Domingos SDTFs. Neotropicalspecies of Mabuya are similar in morphology andecology, which explains why the genus is usually rep-resented by a single species in local assemblages (Vitt& Zani 1996). When two or more species of Mabuyacoexist, niche overlap is low, but at this point, wecannot determine whether this is a result of ecologicalinteractions or a more ancient historical divergence(Mesquita et al. 2006a). The evolutionary relationshipbetween the two species of Mabuya in São Domingosis unknown, therefore the basis for their differencesin microhabitat use and diet composition cannot beascertained (Losos 1996).
Even though overlap in microhabitat use amongthe most abundant species and between sister-speciesof the São Domingos lizard assemblage was low,the null model analysis indicated lack of assemblagestructure (Table 2 and Fig. 6). Other Neotropicallizard assemblages have similar patterns (e.g. Mesquitaet al. 2006a,b). Thus, no evidence exists for ongoingcompetition for microhabitats among lizard speciesin São Domingos SDTFs. Likewise, we detected nosignificant phylogenetic effects on patterns of micro-habitat use. Among lizards, evolutionary constraintson microhabitat use are less common than on dietcomposition, that is, within-clade variation in micro-habitat use is much higher than variation in diet com-position (Vitt et al. 1999). Thus, it is likely that theavailability of the (historically) preferred prey typesmoderates microhabitat selection.
Diet composition
Diets of most lizard species in São Domingos SDTFsresemble those of conspecific or congeneric species inother Neotropical assemblages, including Am. ameiva(insect larvae and orthopterans, Vitt & Colli 1994),An. nitens (orthopterans and spiders, Vitt et al. 2001),
200
150
100
50
0.500.480.460.440.420.400.38
160
140
120
100
80
60
40
20
0.540.520.500.480.460.44
Simulation means of diet overlap
(A)
(B)
p = 0.03
p < 0.001
↓0.41
↓0.42
Sim
ula
tio
n f
req
ue
ncie
s
Fig. 7. Observed and expected mean diet niche overlapamong lizards from SDTFs of São Domingos, consideredmost common prey items and all species (A) most commonprey items and only the most abundant species (B). Arrowsindicate observed means, P-values are probabilities thatobserved means are smaller than expected random means(10 000 simulations).
ASSEMBLAGE STRUCTURE IN DRY FOREST LIZARDS 109
© 2009 The Authors doi:10.1111/j.1442-9993.2008.01915.xJournal compilation © 2009 Ecological Society of Australia

Table 5. Phylogenetic effects upon patterns of diet composition by lizards from Seasonally Dry Tropical Forest enclaves inSão Domingos, Goiás, Brazil
Label Clade Variation % of variation F P
All lizard species includedG/K Iguania/Scleroglossa 0.205 24.551 2.118 0.009*F Teiidae 0.179 21.437 1.817 0.0524E Gymnophthalmidae 0.176 21.078 1.783 0.0570B Tropiduridae 0.158 18.922 1.573 0.0812I Teiioidea 0.147 17.605 1.456 0.1192J Autarchoglossa 0.143 17.126 1.405 0.1422A Polychrotidae 0.112 13.413 1.079 0.3844H Gekkonidae 0.106 12.695 1.018 0.4148D Scincidae 0.097 11.617 0.927 0.4884C Gekkoninae 0.067 8.024 0.622 0.8426
Only lizard species with n > 5 includedE Gymnophthalmidae 0.216 29.711 1.944 0.0388*G/K Iguania/Scleroglossa 0.201 27.648 1.787 0.0175*A Polychrotidae 0.158 21.733 1.345 0.2074B Tropiduridae 0.156 21.458 1.326 0.2276J Autarchoglossa 0.156 21.458 1.330 0.1458H Gekkonidae 0.112 15.406 0.918 0.5693D Scincidae 0.102 14.030 0.822 0.6073C Gekkoninae 0.054 7.428 0.420 0.9777
Values represent variation and percentage of variation in the diet composition matrix (all prey categories included) explainedby individual clades, obtained from a Canonical Phylogenetic Analysis, as well as F and P values based on 9999 Monte Carlopermutations. Clade labels according to Figure 3. Significant P values are marked with an asterisk.
Table 6. Phylogenetic effects upon patterns of diet composition by lizards from Seasonally Dry Tropical Forest enclaves inSão Domingos, Goiás, Brazil
Label Clade Variation % of variation F P
All lizard species includedG/K Iguania/Scleroglossa 0.180 29.654 2.545 0.0117*F Teiidae 0.174 28.666 2.450 0.0262*E Gymnophthalmidae 0.172 28.336 2.405 0.0322B Tropiduridae 0.145 23.888 1.977 0.0633I Teiioidea 0.136 22.405 1.834 0.0764J Autarchoglossa 0.125 20.593 1.667 0.1055A Polychrotidae 0.076 12.521 0.959 0.4368D Scincidae 0.065 10.708 0.822 0.4991H Gekkonidae 0.050 8.237 0.621 0.7680C Gekkoninae 0.038 6.260 0.463 0.8764
Only lizard species with n > 5 includedE Gymnophthalmidae 0.208 41.188 2.860 0.0228*G/K Iguania/Scleroglossa 0.173 34.257 2.259 0.0135*B Tropiduridae 0.144 28.515 1.796 0.1550J Autarchoglossa 0.136 26.931 1.682 0.0909A Polychrotidae 0.123 24.356 1.498 0.2517D Scincidae 0.070 13.861 0.790 0.5484H Gekkonidae 0.045 8.911 0.500 0.8359C Gekkoninae 0.016 3.168 0.172 0.9693
Values represent variation and percentage of variation in the diet composition matrix (only most important prey categoriesincluded) explained by individual clades, obtained from a Canonical Phylogenetic Analysis, as well as F and P values based on9999 Monte Carlo permutations. Clade labels according to Figure 3. Significant P values are marked with an asterisk.
110 F. de PINHO WERNECK ET AL.
© 2009 The Authorsdoi:10.1111/j.1442-9993.2008.01915.xJournal compilation © 2009 Ecological Society of Australia

G. carvalhoi (termites, Vitt 1995; Colli et al. 2003),Ma. nigropunctata (spiders, orthopterans, termites,Mesquita et al. 2006a,b), Mi. maximiliani (spiders,hemipterans/homopterans, orthopterans, Mesquitaet al. 2006a,b), Ph. pollicaris (termites and orthopter-ans, Vitt 1995), Tropidurus oreadicus (ants, termites,insect larvae, Colli et al. 1992; Faria & Araujo 2004)and Tr. torquatus (orthopterans, ants, coleopterans,Araujo 1987; Bergallo & Rocha 1994). Thus, lizarddiets seem to be evolutionarily constrained, with littleintra-clade variation.
Individual niche breadth values were relatively lowcompared with the same species in other assemblages(e.g. Vitt & Carvalho 1995; Dias & Lira-da-Silva 1998;Vitt et al. 1999, 2001), suggesting some overall dietpartitioning for lizards in São Domingos SDTFs.On the other hand, the relatively high values of dietoverlap between some particular species (Cole. meri-dionalis, G. carvalhoi, Mabuya sp.), relative to otherassemblages (e.g. Vitt 1995; Vitt & Carvalho 1995;Vitt & Zani 1996, 1998b), may have arisen from theuse of the same prey, particularly termites. As with
microhabitat use, pairs of closely related speciesshowed moderate to low values of diet overlap. Thispattern may have resulted from in situ divergence, tominimize competitive interactions, or by inheritancefrom more remote ancestors, thus facilitating coexist-ence (Brooks & McLennan 1991).
The lizard assemblage of São Domingos SDTFs isstructured with respect to diet composition, a patternfound in many lizard assemblages of Neotropicalforests (Vitt & Zani 1996, 1998a,b), but uncommonin Neotropical savannas (Gainsbury & Colli 2003;Mesquita et al. 2006a,b). Non-random patterns ofdiet composition may arise by ecological interactionsamong coexisting species, where low values of dietoverlap obviate the need to invoke ongoing com-petition for food. Conversely, lizard species in theassemblage may coexist because ancestral characters(evolved prior to the formation of the assemblage)promote niche segregation, thus preventing com-petition. In this case, species are able to enter theassemblage if they bear characteristics not in conflictwith the existing assemblage structure (Brooks &
Aranae
Blattaria
Coleoptera
Isoptera
Formicidae
Ortoptera
Hymenoptera
Insect larvae
Gastropoda
Phasmida
Hemiptera
Scleroglossa
Gymnophthalmidae
CPO axis 1
CP
O a
xis
2Teiidae
Iguania
1.5
1.5-1.5
-1.5
Non identified
Fig. 8. Biplot showing results of the canonical phylogenetic ordination analysis. This plot shows the position of each preycategory (triangles) on the first two axes of dietary niche space. Clades with significant association with prey categories areindicated by arrows. Clades of Squamata that explained significant amounts of the total variation in diet composition are plottedwith vectors radiating out from the origin. Length of vectors indicates significance strength, whereas distance of arrow tips totriangles represents relative importance of prey categories in lizard diets for each clade.
ASSEMBLAGE STRUCTURE IN DRY FOREST LIZARDS 111
© 2009 The Authors doi:10.1111/j.1442-9993.2008.01915.xJournal compilation © 2009 Ecological Society of Australia
McLennan 1993).The CPO indicated that differencesin diet composition among lizards in São DomingosSDTFs have a historical basis, not necessarily reflect-ing current ecological interactions (Losos 1996).
The first and more dramatic dietary shift inthe evolution of Squamata presumably occurredduring the lateTriassic, when Iguania and Scleroglossadiverged from a pleurodont ancestor (Vitt & Pianka2005). The historical advent of derived characters forScleroglossa, such as cranial mesokinesis, chemicalprey discrimination, vomeronasal system, jaw prehen-sion and wide foraging, facilitated access to new foodsources, and we should expect a detectable divergencein diet composition between Iguania and Scleroglossa,at least on a global scale (Vitt et al. 2003). Therefore,some differences in diet composition among lizardspecies in São Domingos SDTFs, determined by theability to chemically discriminate prey, were definedlong before the formation of the assemblage. Inaddition to the Iguania/Scleroglossa dichotomy,we identified significant phylogenetic effects in theSão Domingos assemblage among teiids and gymno-phthalmids. Members of these clades have highlyconserved ecologies, with little influence of localenvironmental conditions, as indicated by geographi-cal variation analyses (e.g. Vitt & Colli 1994; Vitt et al.1997a; Mesquita & Colli 2003). These taxa, prevalentin Neotropical assemblages, often form homogeneousguilds in these assemblages (Mesquita et al. 2006a,b).Conversely, other clades represented in the SãoDomingos assemblage (with no detectable phyloge-netic effects) were identified in a global analysis asexerting significant phylogenetic effects on diet com-position (Vitt & Pianka 2005).This highlights the factthat taxonomic composition may influence the abilityto detect phylogenetic constraints in assemblage struc-ture (Cadle & Greene 1993; Vitt et al. 1999; Andersonet al. 2004; Mesquita et al. 2006a). For instance,because Scleroglossa (12 species) is better representedthan Iguania (6) in the São Domingos assemblage, itmight be harder to detect significant phylogeneticeffects among the latter.
A complex mixture of historical, ecological andstochastic influences, which allow species coexistence,structures-rich and phylogenetically diverse assem-blages (Ricklefs & Schluter 1993). The lizard assem-blage of São Domingos SDTFs enclaves is historicallystructured in terms of diet composition, but shows nostructure regarding microhabitat use, indicating lackof ongoing interspecific interactions along these nichedimensions. However, other niche dimensions nothere considered, such as body size and shape, mightalso be important in the structure and maintenance ofthe São Domingos assemblage. The incorporation ofadditional data, such as evolutionary rates, betterresolution of the phylogenetic hypothesis or eventhe discovery of new species in the assemblage, might
corroborate or challenge our conclusions regarding theinfluence of phylogenetic constraints upon assemblagestructure.
ACKNOWLEDGEMENTS
We thank J. P. Caldwell, D. B. Shepard, A. H. Soares,C. Maximiliano, D. O. Mesquita, G. A. Fajardo, G. C.Costa, H. C. Wiederhecker, R. N. Leite, S. Balbino,Anthony B. Gamble, V. Brau for assistance with fieldwork; A. Scariot, A. Sevilha and EMBRAPA-CENARGEN for logistic support. This study wassupported in part by graduate fellowships fromCoordenação de Aperfeiçoamento de Pessoal de NívelSuperior (CAPES) and Conselho Nacional de Desen-volvimento Científico e Tecnológico (CNPq) to FPW;by a research fellowship (#302343/88-1) from CNPqto GRC; by Programa Nacional de DiversidadeBiológica PROBIO/MMA, project ‘Inventário daBiodiversidade do Vale e Serra do Paranã e do Sulde Tocantins’; by Departamento de Ecologia, Uni-versidade de Brasília; and by the National ScienceFoundation under Grant No. DEB-0415430. Anyopinions, findings and conclusions or recommen-dations expressed in this material are those of theauthor(s) and do not necessarily reflect the viewsof the above-mentioned funding agencies. IACUCAssurance Number A3240-01, University of Okla-homa, applies to this study. Specimens were collectedunder permits 007/2003-CGFAU/LIC, 050/03-IBAMA-RAN and 0188/2004-CGFAU/LIC.
REFERENCES
Anderson T. M., Lachance M-A. & Starmer W. T. (2004) Therelationship of phylogeny to community structure: thecactus yeast community. Am. Nat. 164, 709–21.
Araujo A. F. B. (1987) Comportamento alimentar dos lagartos:o caso dos Tropidurus do grupo Torquatus da Serra deCarajás, Pará (Sauria: Iguanidae). An. Etol. 5, 203–34.
Bell G. (2001) Neutral Macroecology. Science 293, 2413–18.Bergallo H. G. & Rocha C. F. D. (1994) Spatial and trophic
niche differentiation in two sympatric lizards (Tropidurustorquatus and Cnemidophorus ocellifer) with different foragingtactics. Aust. J. Ecol. 19, 72–5.
Brandão R. A. & Araujo A. F. B. (2001) A herpetofauna asso-ciada às matas de galeria do Distrito Federal. In: Cerrado:Caracterização e Recuperação de Matas de Galeria (eds J. F.Ribeiro, C. E. L. Fonseca & J. C. Sousa-Silva) pp. 561–604.Embrapa Cerrados, Planaltina.
Brooks D. R. & McLennan D. A. (1991) Phylogeny. Ecology andBehavior, a Research Program in Comparative Biology. TheUniversity of Chicago Press, Chicago.
Brooks D. R. & McLennan D. A. (1993) Historical ecology:examining phylogenetic components of communityevolution. In: Species diversity in Ecological Communities,Historical and Geographical Perspectives (R. E. Ricklefs &
112 F. de PINHO WERNECK ET AL.
© 2009 The Authorsdoi:10.1111/j.1442-9993.2008.01915.xJournal compilation © 2009 Ecological Society of Australia

D. Schluter) pp. 267–80. The University of Chicago Press,Chicago.
Brown J. H. (1995) Macroecology. The University of ChicagoPress, Chicago.
Bullock S. H., Mooney H. A. & Medina E. (1995) Seasonally DryTropical Forests. Cambridge University Press, Cambridge.
Cadle J. E. & Greene H. W. (1993) Phylogenetic patterns,biogeography, and the ecological structure of Neotropicalsnake assemblages. In: Species Diversity in Ecological Com-munities: Historical and Geographical Perspectives (eds R. E.Ricklefs & D. Schluter) pp. 281–93. University of ChicagoPress, Chicago.
Colli G. R. & Zamboni D. S. (1999) Ecology of the worm-lizardAmphisbaena alba in the Cerrado of central Brazil. Copeia1999, 733–42.
Colli G. R., Araujo A. F. B., Silveira R. & Roma F. (1992) Nichepartioning and morphology of two syntopic Tropidurus(Sauria: Tropiduridae) in Mato Grosso, Brazil. J. Herpetol.26, 66–9.
Colli G. R., Bastos R. P. & Araújo A. F. B. (2002) The characterand dynamics of the Cerrado herpetofauna. In: The Cerradosof Brazil: Ecology and Natural History of a NeotropicalSavanna (eds P. S. Oliveira & R. J. Marquis) pp. 223–41.Columbia University Press, New York.
Colli G. R., Mesquita D. O., Rodrigues P. V. V. & Kitayama K.(2003) Ecology of the gecko Gymnodactylus geckoides amaraliin a neotropical savanna. J. Herpetol. 37, 694–706.
Colwell R. K. (2005) EstimateS: Statistical estimation of speciesrichness and shared species from samples. Version 7.5. User’sGuide and application published at: http://purl.oclc.org/estimates (accessed 13 Oct 2008).
Colwell R. K. & Coddington J. A. (1994) Estimating terrestrialbiodiversity through extrapolation. Philos. T. R. Soc. B 345,101–18.
Connor E. F. & Simberloff D. (1979) The assembly ofspecies communities: chance or competition? Ecology 60,1132–40.
Connor E. F. & Simberloff D. (1983) Interspecific competitionand species co-occurence patterns on islands: null modelsand the evaluation of evidence. Oikos 41, 455–65.
Cornell H. V. (1993) Unsaturated patterns in species assem-blages: the role of regional processes in setting local speciesrichness. In: Species Diversity in Ecological Communities:Historical and Geographic Perspectives (eds R. E. Ricklefs &D. Schulter) pp. 243–52. The University of Chicago Press,Chicago.
Cornell H. V. & Lawton J. H. (1992) Species Interactions,local and regional processes, and limits to the richness ofecological communities: a theoretical perspective. J. Anim.Ecol. 61, 1–12.
Diamond J. & Gilpin M. E. (1982) Examination of the ‘null’model of Connor and Simberloff for species co-occurenceson islands. Oecologia 52, 64–74.
Dias E. J. R. & Lira-da-Silva R. M. (1998) Utilização dos recur-sos alimentares por quatro espécies de lagartos (Phyllopezuspollicaris,Tropidurus hispidus, Mabuya macrorhyncha e Vanzo-saura rubricauda) da Caatinga (Usina Hidroelétrica doXingó). Braz. J. Ecol. 2, 97–101.
Drake J. A. (1991) Community-assembly mechanics and thestructure of an experimental species ensemble. Am. Nat.137, 1–26.
Eiten G. (1972) Cerrado vegetation of Brazil. Bot. Rev. 38,201–341.
Eiten G. (1979) Formas fisionômicas do Cerrado. Rev. Bras. Bot.2, 139–48.
Estes R., de Queiroz K. & Gauthier J. (1988) Phylogeneticrelationships within Squamata. In: Phylogenetic Relationshipsof the Lizard Families.Essays Commemorating Charles L.Camp(eds R. Estes & G. Pregill) pp. 119–281. Stanford UniversityPress, Stanford.
Faria R. G. & Araujo A. F. B. (2004) Syntopy of two Tropiduruslizard species (Squamata: Tropiduridae) in a rocky Cerradohabitat in central Brazil. Braz. J. Biol. 64, 775–86.
Felfili J. M. (2003) Fragmentos de Florestas Estacionais doBrasil Central: diagnóstico e proposta de corredoresecológicos. In: Fragmentação Florestal e Alternativas de Desen-volvimento Rural na Região Centro-Oeste (ed. R. B. da Costa)p. 246. UCDB, Campo Grande.
Frost D. R. & Etheridge R. (1989) A phylogenetic analysis andtaxonomy of iguanian lizards (Reptilia: Squamata). Univ.Kansas Mus. Nat. Hist. Misc. Publ. 81, 1–65.
Frost D. R., Etheridge R., Janies D. & Titus T. A. (2001) Totalevidence, sequence alignment, evolution of polychrotidlizards, and a reclassification of the Iguania (Squamata:Iguania). Am. Mus. Novit. 3343, 1–38.
Fry B. G., Vidal N., Norman J. A. et al. (2006) Early evolutionof the venom system in lizards and snakes. Nature 439,584–8.
Gainsbury A. M. & Colli G. R. (2003) Lizard assemblages fromnatural Cerrado enclaves in Southwestern Amazonia: therole of stochastic extinctions and isolation. Biotropica 35,503–19.
Giannini N. P. (2003) Canonical phylogenetic ordination. Syst.Biol. 52, 684–95.
Goodman B. A. (2007) Microhabitat separation and nicheoverlap among five assemblages of tropical skinks. Aust. J.Zool. 55, 15–27.
Gotelli N. J. (2000) Null model analysis of species co-occurrencepatterns. Ecology 81, 2606–21.
Gotelli N. J. (2001) Research frontiers in null model analysis.Global Ecol. Biogeogr. 10, 337–43.
Gotelli N. J. & Colwell R. K. (2001) Quantifying biodiversity:procedures and pitfalls in the measurement and comparisonof species richness. Ecol. Lett. 4, 379–91.
Gotelli N. J. & Entsminger G. L. (2004) EcoSim: Null ModelsSoftware for Ecology. Acquired Intelligence Inc. & Kesey-Bear, Jericho, VT. Available at: http://garyentsminger.com/ecosim/index.htm (accessed 13 Oct 2008).
Gotelli N. J. & Graves G. R. (1996) Null Models in Ecology.Smithsonian Institution Press, Washington, DC.
Gotelli N. J. & McCabe D. J. (2002) Species co-occurrence: ameta-analysis of J. M. Diamond’s assembly rules model.Ecology. 83, 2091–6.
Hang-Kwang L. & Pimm S. L. (1993) The assembly of ecologi-cal communities: a minimalist approach. J. Anim. Ecol. 62,749–65.
IBGE (1995) Zoneamento Geoambiental e Agroecológico do Estadode Goiás: Região Nordeste. IBGE/Divisão de Geociências doCentro-Oeste. (Estudos e Pesquisas em Geociências, n.3),Rio de Janeiro, RJ.
Janzen D. H. (1988) Tropical dry forests: the most endangeredmajor tropical ecosystem. In: Biodiversity (ed. E. O. Wilson)pp. 130–7. National Academy Press, Washington, DC.
Kluge A. G. (1987) Cladistic relationships in the Gekkonoida(Squamata, Sauria). Misc. Publ. Mus. Zool., Univ. Michigan173, 1–54.
Lee M. S. Y. (2005) Squamate phylogeny, taxon sampling, anddata congruence. Org. Divers. Evol. 5, 25–45.
Losos J. B. (1994) Historical contingency and lizard communityecology. In: Lizard Ecology: Historical and Experimental
ASSEMBLAGE STRUCTURE IN DRY FOREST LIZARDS 113
© 2009 The Authors doi:10.1111/j.1442-9993.2008.01915.xJournal compilation © 2009 Ecological Society of Australia

Perspectives (eds L. J. Vitt & E. R. Pianka) pp. 319–33.Princeton University Press, Princeton.
Losos J. B. (1996) Phylogenetic perspectives on communityecology. Ecology 77, 1344–54.
Magnusson W. E., Lima A. P., Silva W. A. & Araújo M. C. (2003)Use of geometric forms to estimate volume of invertebratesin ecological studies of dietary overlap. Copeia 2003, 13–19.
Mesquita D. O. & Colli G. R. (2003) Geographical variationin the ecology of populations of some Brazilian species ofCnemidophorus (Squamata, Teiidae). Copeia 2003, 285–98.
Mesquita D. O., Colli G. R., França F. G. & Vitt L. J. (2006a)Ecology of a Cerrado lizard assemblage in the Jalapão regionof Brazil. Copeia 2006, 460–71.
Mesquita D. O., Costa G. C. & Colli G. R. (2006b) Ecology ofan Amazonian savanna lizard assemblage in Monte Alegre,Pará state, Brazil. S. Am. J. Herpetol. 1, 61–71.
Miles D. B. & Dunham A. E. (1993) Historical perspectives inecology and evolutionary biology: the use of phylogeneticcomparative analyses. Annu. Rev. Ecol. Syst. 24, 587–619.
Miles L., Newton A. C., DeFries R. S. et al. (2006) A globaloverview of the conservation status of tropical dry forests.J. Biogeogr. 33, 491–505.
MMA (1999) Ações Prioritárias para a Conservação da Biodiver-sidade do Cerrado e Pantanal. MMA, Funatura, ConservationInternational, Fundação Diversitas & Universidade deBrasília, Brasília.
Morton S. R. (1993) Determinants of diversity in animal com-munities of arid Australia. In: Species Diversity in EcologicalCommunities: Historical and Geographic Perspectives (eds R. E.Ricklefs & D. Schluter) pp. 159–69. The Chicago UniversityPress, Chicago.
Morton S. R. & James C. D. (1988) The diversity and abundanceof lizards in arid Australia – a new hypothesis. Am. Nat. 132,237–56.
Murphy F. G. & Lugo A. E. (1986) Ecology of tropical dryforest. Annu. Rev. Ecol. Syst. 17, 67–88.
Myers N., Mittermeier R. A., Mittermeier C. G., Fonseca G. A.B. & Kent J. (2000) Biodiversity hotspots for conservationpriorities. Nature 403, 853–8.
Nimer E. (1989) Climatologia do Brasil. Fundação InstitutoBrasileiro de Geografia e Estatística – IBGE, Rio de Janeiro.
Nogueira C., Valdujo P. H. & França F. G. R. (2005) Habitatvariation and lizard diversity in a Cerrado area of CentralBrazil. Stud. Neotrop. Fauna E. 40, 105–12.
Oliveira P. S. & Marquis R. J. (2002) The Cerrados of Brazil:Ecology and Natural History of a Neotropical Savanna.Columbia University Press, New York.
Pennington R.T., Lewis G. P. & Ratter J. A. (2006) An overviewof the plant diversity, biogeography and conservation ofNeotropical Savannas and Seasonally Dry Forests. In: Neo-tropical Savannas and Seasonally Dry Forests: Plant Diversity,Biogeography and Conservation (eds R. T. Pennington,G. P. Lewis & J. A. Ratter) pp. 1–29. CRC Press Taylor &Francis Group, Boca Raton.
Pennington R. T., Prado D. E. & Pendry C. A. (2000) Neotro-pical seasonally dry forests and Quaternary vegetationchanges. J. Biogeogr. 27, 261–73.
Pianka E. R. (1973) The structure of lizard communities. Annu.Rev. Ecol. Syst. 4, 53–74.
Pianka E. R. (1986) Ecology and Natural History of Desert Lizards:Analyses of the Ecological Niche and Community Structure.Princeton University Press, Princeton.
Prado D. E. (2000) Seasonally dry forests of tropical SouthAmerica: from forgotten ecosystems to a new phytogeo-graphic unit. Edinburgh J. Bot. 57, 437–61.
Prado D. E. & Gibbs P. E. (1993) Patterns of species distribu-tions in the dry seasonal forests of South America. Ann. Mo.Bot. Gard. 80, 902–27.
Prance G. T. (2006) Tropical savannas and seasonally dryforests: an introduction. J. Biogeogr. 33, 385–6.
Presch W. F., Jr (1974) Evolutionary relationships and biogeog-raphy of the macroteiid lizards (Family Teiidae, SubfamilyTeiinae). B. South. Calif. Acad. Sci. 73, 23–32.
Putman R. J. (1996) Community Ecology. Chapman & Hall,London.
Ratter J. A., Askew G. P., Montgomery R. & Gifford D. R. (1978)Observations on forests of some mesotrophic soils in centralBrazil. Rev. Bras. Bot. 1, 47–58.
Ricklefs R. E. & Schluter D. (1993) Species Diversity in EcologicalCommunities: Historical and Geographical Perspectives. TheUniversity of Chicago Press, Chicago.
Roughgarden J. (1983) Competition and theory in communityecology. Am. Nat. 122, 583–601.
Sánchez-Azofeifa G. A., Kalacska M., Quesada M., Calvo-Alvarado J. C., Nassar J. M. & Rodríguez J. P. (2005) Needfor integrated research for a sustainable future in TropicalDry Forests. Conserv. Biol. 19, 285–6.
Sanderson M. J., Purvis A. & Henze C. (1998) Phylogeneticsupertrees: assembling the trees of life. Trends Ecol. Evol. 13,105–9.
Scariot A. & Sevilha A. C. (2000) Diversidade, estrutura emanejo de florestas deciduais e as estratégias para aconservação. In: Tópicos Atuais em Botânica: Palestras Con-vidadas do 51o Congresso Nacional de Botânica (eds T. B.Cavalcanti & B. M.T. Walter) pp. 183–8. Embrapa RecursosGenéticos e Biotecnologia, Brasília.
Scariot A. & Sevilha A. C. (2003) Desmatamento e fragmen-tação do Cerrado: destruição das florestas estacionais e aconservação da biodiversidade. In: Ecossistemas Brasileiros:Manejo e Conservação (ed. V. Claudino-Sales) pp. 163–9.Expressão Gráfica e Editora, Fortaleza.
Scariot A. & Sevilha A. C. (2005) Biodiversidade, estrutura econservação de florestas estacionais deciduais no Cerrado.In: Cerrado: Ecologia, Biodiversidade e Conservação (edsA. Scariot, J. C. Sousa-Silva & J. M. Felfili) pp. 123–39.Ministério do Meio Ambiente, Brasília.
Silva J. M. C. (1995a) Biogeographic analysis of the SouthAmerican Cerrado avifauna. Steenstrupia 21, 49–67.
Silva J. M. C. (1995b) Birds of the Cerrado region, SouthAmerica. Steenstrupia 21, 69–92.
Silva J. M. C. & Bates J. M. (2002) Biogeographic patternsand conservation in the South American Cerrado: a tropicalsavanna hotspot. BioScience 52, 225–33.
Simpson E. H. (1949) Measurement of diversity. Nature. 163,688.
Ter Braak C. J. F. (1986) Canonical Correspondence Analysis: anew eingenvector technique for multivariate direct gradientanalysis. Ecology 67, 1167–79.
Ter Braak C. J. F. & Smilauer P. (2002) CANOCO ReferenceManual and CanoDraw forWindows User’s Guide: Software forCanonical Community Ordination. Microcomputer Power,Ithaca.
Townsend C. R., Larson A., Louis E. & Macey J. R. (2004)Molecular phylogenetics of Squamata: the position ofSnakes, Amphisbaenians, and Dibamids, and the root ofthe squamate tree. Syst. Biol. 53, 735–57.
Vidal N. & Hedges S. B. (2005) The phylogeny of squamatereptiles (lizards, snakes, and amphisbaenians) inferredfrom nine nuclear protein-coding genes. C. R. Biol. 328,1000–8.
114 F. de PINHO WERNECK ET AL.
© 2009 The Authorsdoi:10.1111/j.1442-9993.2008.01915.xJournal compilation © 2009 Ecological Society of Australia
Vieira D. L. M. & Scariot A. (2006) Principles of natural regen-eration of tropical dry forests for restoration. Restor. Ecol. 14,11–20.
Vitt L. J. (1991) An introduction to the ecology of Cerradolizards. J. Herpetol. 25, 79–90.
Vitt L. J. (1995) The ecology of tropical lizards in the Caatingaof northeast Brazil. Occas. Pap. Ok. Mus. Nat. Hist. 1, 1–29.
Vitt L. J. & Caldwell J. P. (1993) Ecological observationson Cerrado lizards in Rondônia, Brazil. J. Herpetol. 27,46–52.
Vitt L. J. & Carvalho C. M. (1995) Niche partitioning in atropical wet season – lizards in the Lavrado area of northernBrazil. Copeia 1995, 305–29.
Vitt L. J. & Colli G. R. (1994) Geographical ecology of aNeotropical lizard: Ameiva ameiva (Teiidae) in Brazil. Can.J. Zool. 72, 1986–2008.
Vitt L. J. & Pianka E. R. (2005) Deep history impacts present-day ecology and biodiversity. P. Natl. Acad. Sci. Biol. 102,7877–81.
Vitt L. J. & Zani P. A. (1996) Organization of a taxonomicallydiverse lizard assemblage in Amazonian Ecuador. Can. J.Zool. 74, 1313–35.
Vitt L. J. & Zani P. A. (1998a) Ecological relationships amongsympatric lizards in a transitional forest in the northernAmazon of Brazil. J.Trop. Ecol. 14, 63–86.
Vitt L. J. & Zani P. A. (1998b) Prey use among sympatric lizardspecies in lowland rain forest of Nicaragua. J.Trop. Ecol. 14,537–59.
Vitt L. J., Zani P. A., Caldwell J. P., Araujo M. C. D. & Magnus-son W. E. (1997a) Ecology of whiptail lizards (Cnemi-dophorus) in the Amazon Region of Brazil. Copeia 1997,745–57.
Vitt L. J., Zani P. A. & Lima A. C. M. (1997b) Heliotherms intropical rain forest: the ecology of Kentropyx calcarata
(Teiidae) and Mabuya nigropunctata (Scincidae) in theCuruá-Una of Brazil. J.Trop. Ecol. 13, 199–220.
Vitt L. J., Zani P. A. & Esposito M. C. (1999) Historical ecologyof Amazonian lizards: implications for community ecology.Oikos 87, 286–94.
Vitt L. J., Sartorius S. S., Ávila-Pires T. C. S. & Espósito M. C.(2001) Life on the leaf litter: the ecology of Anolis nitenstandai in the Brazilian Amazon. Copeia 2001, 401–12.
Vitt L. J., Pianka E. R., Cooper W. E. & Schwenk K. (2003)History and the global ecology of squamate reptiles. Am.Nat. 162, 44–60.
Vitt L. J., Colli G. R., Caldwell J. P., Mesquita D. O., Garda A. A.& França F. G. R. (2007a) Detecting variation in microhabi-tat use in low diversity lizard assemblages across small-scalehabitat gradients. J. Herpetol. 41, 653–62.
Vitt L. J., Shepard D. B., Caldwell J. P., Vieira G. H. C., FrançaF. G. R. & Colli G. R. (2007b) Living with your food: geckos(Gymnodactylus carvalhoi) in termitaria of Cantão. J. Zool.272, 321–8.
Webb C. O., Ackerly D. D., McPeek M. A. & Donoghue M. J.(2002) Phylogenies and community ecology. Annu. Rev.Ecol. Syst. 33, 475–505.
Werneck F. P. & Colli G. R. (2006) The lizard assemblage fromSeasonally Dry Tropical Forest enclaves in the Cerradobiome, Brazil, and its association with the Pleistocenic Arc.J. Biogeogr. 33, 1983–92.
Westoby M. (1993) Biodiversity in Australia compared withother continents. In: Species Diversity in Ecological Commu-nities: Historical and Geographical Perspectives (eds R. E. Rick-lefs & D. Schluter) pp. 170–7. The University of ChicagoPress, Chicago.
Winemiller K. O. & Pianka E. R. (1990) Organization in naturalassemblages of desert lizards and tropical fishes. Ecol.Monogr. 60, 27–55.
ASSEMBLAGE STRUCTURE IN DRY FOREST LIZARDS 115
© 2009 The Authors doi:10.1111/j.1442-9993.2008.01915.xJournal compilation © 2009 Ecological Society of Australia