Stable nitrogen isotope studies of the pelagic food web on the Atlantic shelf of the Iberian...
17
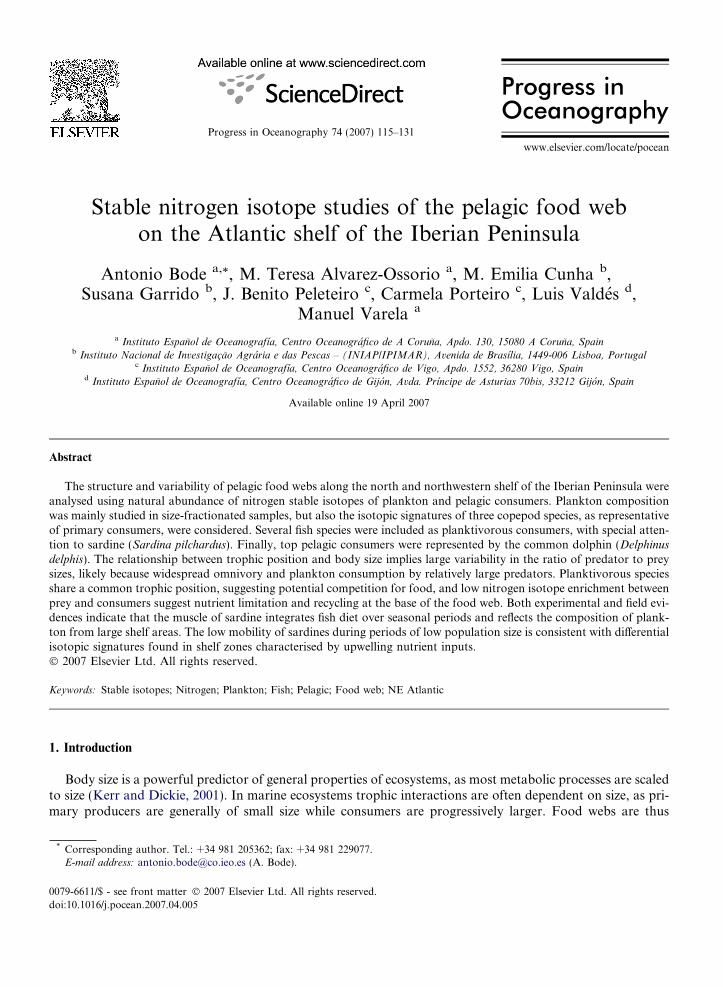
Stable nitrogen isotope studies of the pelagic food web on the Atlantic shelf of the Iberian Peninsula Antonio Bode a, * , M. Teresa Alvarez-Ossorio a , M. Emilia Cunha b , Susana Garrido b , J. Benito Peleteiro c , Carmela Porteiro c , Luis Valde ´s d , Manuel Varela a a Instituto Espan ˜ol de Oceanografı ´a, Centro Oceanogra ´ fico de A Corun ˜a, Apdo. 130, 15080 A Corun ˜a, Spain b Instituto Nacional de Investigac ¸a ˜o Agra ´ ria e das Pescas – (INIAP/IPIMAR), Avenida de Brası ´lia, 1449-006 Lisboa, Portugal c Instituto Espan ˜ol de Oceanografı ´a, Centro Oceanogra ´ fico de Vigo, Apdo. 1552, 36280 Vigo, Spain d Instituto Espan ˜ol de Oceanografı ´a, Centro Oceanogra ´ fico de Gijo ´ n, Avda. Prı ´ncipe de Asturias 70bis, 33212 Gijo ´ n, Spain Available online 19 April 2007 Abstract The structure and variability of pelagic food webs along the north and northwestern shelf of the Iberian Peninsula were analysed using natural abundance of nitrogen stable isotopes of plankton and pelagic consumers. Plankton composition was mainly studied in size-fractionated samples, but also the isotopic signatures of three copepod species, as representative of primary consumers, were considered. Several fish species were included as planktivorous consumers, with special atten- tion to sardine (Sardina pilchardus). Finally, top pelagic consumers were represented by the common dolphin (Delphinus delphis). The relationship between trophic position and body size implies large variability in the ratio of predator to prey sizes, likely because widespread omnivory and plankton consumption by relatively large predators. Planktivorous species share a common trophic position, suggesting potential competition for food, and low nitrogen isotope enrichment between prey and consumers suggest nutrient limitation and recycling at the base of the food web. Both experimental and field evi- dences indicate that the muscle of sardine integrates fish diet over seasonal periods and reflects the composition of plank- ton from large shelf areas. The low mobility of sardines during periods of low population size is consistent with differential isotopic signatures found in shelf zones characterised by upwelling nutrient inputs. Ó 2007 Elsevier Ltd. All rights reserved. Keywords: Stable isotopes; Nitrogen; Plankton; Fish; Pelagic; Food web; NE Atlantic 1. Introduction Body size is a powerful predictor of general properties of ecosystems, as most metabolic processes are scaled to size (Kerr and Dickie, 2001). In marine ecosystems trophic interactions are often dependent on size, as pri- mary producers are generally of small size while consumers are progressively larger. Food webs are thus 0079-6611/$ - see front matter Ó 2007 Elsevier Ltd. All rights reserved. doi:10.1016/j.pocean.2007.04.005 * Corresponding author. Tel.: +34 981 205362; fax: +34 981 229077. E-mail address: [email protected] (A. Bode). Progress in Oceanography 74 (2007) 115–131 Progress in Oceanography www.elsevier.com/locate/pocean
Transcript of Stable nitrogen isotope studies of the pelagic food web on the Atlantic shelf of the Iberian...
Progress in Oceanography 74 (2007) 115–131
Progress inOceanography
www.elsevier.com/locate/pocean
Stable nitrogen isotope studies of the pelagic food webon the Atlantic shelf of the Iberian Peninsula
Antonio Bode a,*, M. Teresa Alvarez-Ossorio a, M. Emilia Cunha b,Susana Garrido b, J. Benito Peleteiro c, Carmela Porteiro c, Luis Valdes d,
Manuel Varela a
a Instituto Espanol de Oceanografıa, Centro Oceanografico de A Coruna, Apdo. 130, 15080 A Coruna, Spainb Instituto Nacional de Investigacao Agraria e das Pescas – (INIAP/IPIMAR), Avenida de Brasılia, 1449-006 Lisboa, Portugal
c Instituto Espanol de Oceanografıa, Centro Oceanografico de Vigo, Apdo. 1552, 36280 Vigo, Spaind Instituto Espanol de Oceanografıa, Centro Oceanografico de Gijon, Avda. Prıncipe de Asturias 70bis, 33212 Gijon, Spain
Available online 19 April 2007
Abstract
The structure and variability of pelagic food webs along the north and northwestern shelf of the Iberian Peninsula wereanalysed using natural abundance of nitrogen stable isotopes of plankton and pelagic consumers. Plankton compositionwas mainly studied in size-fractionated samples, but also the isotopic signatures of three copepod species, as representativeof primary consumers, were considered. Several fish species were included as planktivorous consumers, with special atten-tion to sardine (Sardina pilchardus). Finally, top pelagic consumers were represented by the common dolphin (Delphinus
delphis). The relationship between trophic position and body size implies large variability in the ratio of predator to preysizes, likely because widespread omnivory and plankton consumption by relatively large predators. Planktivorous speciesshare a common trophic position, suggesting potential competition for food, and low nitrogen isotope enrichment betweenprey and consumers suggest nutrient limitation and recycling at the base of the food web. Both experimental and field evi-dences indicate that the muscle of sardine integrates fish diet over seasonal periods and reflects the composition of plank-ton from large shelf areas. The low mobility of sardines during periods of low population size is consistent with differentialisotopic signatures found in shelf zones characterised by upwelling nutrient inputs.� 2007 Elsevier Ltd. All rights reserved.
Keywords: Stable isotopes; Nitrogen; Plankton; Fish; Pelagic; Food web; NE Atlantic
1. Introduction
Body size is a powerful predictor of general properties of ecosystems, as most metabolic processes are scaledto size (Kerr and Dickie, 2001). In marine ecosystems trophic interactions are often dependent on size, as pri-mary producers are generally of small size while consumers are progressively larger. Food webs are thus
0079-6611/$ - see front matter � 2007 Elsevier Ltd. All rights reserved.
doi:10.1016/j.pocean.2007.04.005
* Corresponding author. Tel.: +34 981 205362; fax: +34 981 229077.E-mail address: [email protected] (A. Bode).

116 A. Bode et al. / Progress in Oceanography 74 (2007) 115–131
structured in terms of organism size, as demonstrated in plankton (Fry and Quinones, 1994; Rolff, 2000) andfish communities (Jennings et al., 2002a; Jennings and Mackinson, 2003). Furthermore, the position of a par-ticular fish species in the food web may be more dependent on its individual size than on its taxonomical status(Jennings et al., 2001). One application of size-based analysis has been to describe the structure of benthic foodwebs and their response to human impacts (France et al., 1998; Jennings et al., 2002b). Food web changes arealso expected in the pelagic domain because of the large environmental variability (e.g. Cushing, 1978) andfishing pressure (Pauly et al., 2001). Omnivory and large variability in diet of most consumers, however, com-plicates the analysis of pelagic food webs from examination of gut-contents (Varela et al., 1990; Olaso et al.,1999; Garrido, 2003). Alternatively, the trophic position of consumers in the food web can be estimated fromthe accumulation of heavy isotopes in their structural tissues, as lighter isotopes are easily mobilised in met-abolic reactions. Nitrogen stable isotopes are often used because they display relatively large variations inmost food webs (Wada and Hattori, 1991; Vander Zanden and Rasmussen, 2001). The comparison of isotopicsignatures of species with very different generation times is complicated by the different turnover of the iso-topes in each species: from days in plankton to months or years in large predators (O’Reilly et al., 2002; Post,2002). Field studies overcome this difficulty by sampling at spatial scales large enough to cover most of therange of variability in the nutrient sources at the base of the food web (Sholto-Douglas et al., 1991; Jenningset al., 2001, 2002a,b), which is the primary determinant of isotopic enrichment at upper trophic levels (Post,2002). Such strategy is particularly suited to upwelling ecosystems where there are marked variations in thenutrient sources over relatively short spatial and temporal scales.
Two different types of food webs are expected in the pelagic shelf ecosystem in the Atlantic margin of theIberian Peninsula. First, the seasonal upwelling from March to October produces significant inputs of nutri-ents sustaining high values of plankton biomass (Alvarez-Salgado et al., 2002). The upwelling is forced bynorthern winds that produce the Ekman transport of surface waters offshore. The effects of upwelling inthe western shelf (Portugal and Galicia) are higher than those in the northern region (Mar Cantabrico), whichreceives lower nutrient inputs (Botas et al., 1990). During upwelling, a metazoan food web based on new nutri-ents from the upwelling (as nitrate) would be expected (Cushing, 1978). On the other hand, a coastal polewardcurrent flows during autumn and winter in an opposite direction to upwelling surface currents (Alvarez-Sal-gado et al., 2003; Cabanas et al., 2003). Waters inside the poleward current contain less nutrients than watersfertilised by the upwelling and display low plankton biomass (Fernandez et al., 1993). In this situation, amicrobial food web based on the remineralisation of the organic matter would be expected. As light isotopesare preferentially mobilised in metabolic processes, plankton growing on nutrients remineralised in situ isexpected to have a lower proportion of heavy isotopes than plankton growing on new nutrients originatedin deep waters, as those supplied by upwelling (e.g. Wada and Hattori, 1991). Both oceanographic and trophicsituations can be found during the transition from winter to spring (Calvo-Dıaz et al., 2004).
Large populations of planktivorous fish, such as the sardine (Sardina pilchardus) show ample fluctuations insize and distribution over the Atlantic Iberian shelf (Carrera and Porteiro, 2003; ICES, 2005). Upwellingintensity was shown to affect both positively and negatively sardine recruitment in this area (Dickson et al.,1988; Roy et al., 1995) but the main direct effect was due to the transport of eggs and larvae offshore by north-ern winds (Guisande et al., 2001). In this way, strong upwelling during the recruitment season would decreasethe probability of survival of sardine larvae as they are dispersed to outer shelf and oceanic zones. In contrast,southerly winds favour the progress of the poleward current, and tend to accumulate fish larvae near the coastwhere plankton biomass and production are high (Fernandez et al., 1993). At high population sizes, sardinespawning and distribution areas extend over the whole continental shelf and the adults display feeding migra-tions to the upwelling area off Galicia, while at low population sizes a reduction in the mobility of adult sar-dines between the Mar Cantabrico and Galicia is expected (Carrera and Porteiro, 2003). In the latter case,sardines will remain in the same areas where they were hatched.
The objective of the study was to determine the trophic structure of the pelagic ecosystem on the Atlantic shelfof the Iberian Peninsula and its spatial and interannual variability. For this purpose, the natural abundance ofnitrogen stable isotopes was measured in plankton and representative nektonic species. Special attention wasgiven to the case of the sardine, as a key pelagic species. Previous studies have explored the applicability of stableisotopes to elucidate the complexity of the pelagic food web (Bode et al., 2003, 2006), the diet of sardines (Bodeet al., 2004a) and the succession of zooplankton (Bode and Alvarez-Ossorio, 2004) in this region.

A. Bode et al. / Progress in Oceanography 74 (2007) 115–131 117
2. Materials and methods
2.1. Survey cruises
Samples of plankton and pelagic fish were collected mostly during the annual surveys of pelagic fishes in theAtlantic coast of the Iberian Peninsula between 1998 and 2004 (Table 1). The main objective of these cruiseswas to estimate the size of the spawning populations of the small pelagic fish species. Details of the methodsfor estimating fish biomass and geographic coverage can be found in ICES (2005). Each of the surveys coveredat least the northern and northwestern shelves and included plankton and sardines. For comparative purposes,the study area was divided into several zones (Fig. 1). Zone I included the Portuguese shelf south of Cabo daRocha (ca. 39 �N). Zone II extended over the northern Portuguese and Galician shelves, entering into thesouthern Bay of Biscay up to 8 �W. This zone was further divided in two subzones IIa and IIb, north andsouth of Cape Finisterre (ca. 43 �N), respectively. Finally, zone III included all samples in the southernBay of Biscay (Mar Cantabrico) between 8 �W and 46 �N. The studied area corresponds approximately toICES fishery areas VIIIc and IXa (ICES, 2005). General oceanographic conditions for the sampling years weresummarized by the upwelling and poleward index values. The former indicated the strength of the upwellingdue to North-East winds (Alvarez-Salgado et al., 2002) and the latter the strength of the winter poleward flowof shelf water, generally associated to downwelling conditions (Alvarez-Salgado et al., 2003; Cabanas et al.,2003). The upwelling index was computed from geostrophic wind in a 2� · 2� cell centred at 42�30 0N,
Table 1Source of samples
Date Cruise Zone Type of samples
March–April 1998 PELACUS 0398 II, III SardineMarch 1999 PELACUS 0399 II, III Sardine, PlanktonMarch–April 2000 PELACUS 0300 II, III PlanktonApril 2001 PELACUS 0401 II, III Sardine, PlanktonMarch 2002 PELACUS 0302 II, III Sardine, Plankton, other fish speciesJune 2002 Commercial landings II SardineMarch–April 2003 PELACUS 0303 II, III Sardine, Plankton, other fish speciesMarch–April 2004 PELACUS 0304 II, III Sardine, PlanktonJune 2004 Capricornio 03050504 I, II Sardine, Plankton
Zones are marked in Fig. 1.
10° 8° 6° 4° 2° 0°
fish samples
10° 8° 6° 4° 2° 0°
36°
38°
40°
42°
44°
46°
plankton samples
Longitude W
Latit
ude
N
Zone I
Zone IIZone III
Zone I
Zone IIZone III
IIa
IIb
IIa
IIb
Mar CantábricoMar Cantábrico
Por
tuga
l
Por
tuga
l
GaliciaGalicia
fish samplesplankton samples
Zone I
Zone IIZone III
Zone I
Zone IIZone III
IIa
IIb
IIa
IIb
Mar CantábricoMar Cantábrico
Por
tuga
l
Por
tuga
l
GaliciaGalicia
Fig. 1. Location of plankton and fish samples along the Atlantic shelf of the Iberian Peninsula. The 200 m isobath, taken as the limit forthe shelf-break, is shown. The shelf is divided in several zones for spatial analysis of d15N.

118 A. Bode et al. / Progress in Oceanography 74 (2007) 115–131
12�30 0W by the Pacific Environmental Laboratory (PFEL, http://www.pfeg.noaa.gov/). Monthly upwellingindex values were averaged between March and October (upwelling season) for the year preceding each sam-pling cruise. The poleward index was computed as the upwelling index but in this case the cell was centred at43�N, 11�W and the averaging period was from October to December (Alvarez-Salgado et al., 2003; Cabanaset al., 2003).
2.2. Plankton
Plankton samples were generally collected during the night using a conical net from 100 m depth to thesurface at stations distributed over the shelf up to the shelf-break (Fig. 1). The size of the mesh was 20 lmfor most cruises and 40 lm for PELACUS 0303 and 0304. Most samples were subsequently fractionatedthrough sieves of 40, 80, 200, 500, 1000 and 2000 lm and each fraction was carefully washed with filtered sea-water, transferred to glass–fibre filters and stored frozen. The plankton retained by the 2000 lm sieve (gener-ally large salps) was not used in this study. In addition, water from the surface was pre-filtered through a sieveof 20 lm mesh-size and subsequently filtered through Whatman glass–fibre GF/F filters to characterise seston<20 lm. These filters were stored frozen and processed as the filters with net plankton samples.
The natural abundance of 15N in selected copepods, which were assumed to be representative of primaryconsumers, was analysed in samples collected at 43�40 0N, 5�35 0W off Gijon (NW Spain) between March2001 and May 2004. Adult copepods of genera Acartia, Calanus and Centropages (mostly A. clausi, C. helgo-
landicus and C. typicus, respectively) were selected from samples collected with vertical hauls of a WP2 type net(200 lm mesh-size) between 100 m depth and the surface.
2.3. Planktivorous and top consumers
Fish samples were collected by means of a pelagic trawl, in the case of annual fish surveys, or purse seinenets, in the case of commercial landings of sardine. Squid (Allotheuthis spp.) were occasionally collected bypelagic trawl. Individuals of each species was measured (±5 mm), weighted (±0.2 g) and dissected to obtainportions of white muscle, which were stored frozen for isotopic determinations. Samples of the muscle ofthe common dolphin (Delphinus delphis) were obtained from individuals stranded on the coast (Bode et al.,2003).
2.4. Stable isotope determinations
Natural abundance of 15N (d15N, &) was measured using an isotope-ratio mass spectrometer (FinniganMatt Delta Plus) coupled to an elemental analyser (Carlo Erba CHNSO 1108) after oven drying plankton(50 �C, 24 h) or freeze-drying muscle samples in the case of large organisms. The determinations were cali-brated against atmospheric nitrogen. Precision (±1 se) of triplicate d15N determinations was better than0.03& (Bode et al., 2004a; Bode and Alvarez-Ossorio, 2004).
2.5. Experiments with sardines in captivity
The permanence of the isotopic signature in sardine muscle tissues was studied by rearing wild sardines inthe aquaculture facilities of IEO Vigo for several months. Several hundred sardines were captured from thecoast using a commercial fishing vessel in July 2003 and carefully transferred to tanks in the laboratory.The sardines were fed with a commercial food (Gemma 0.3, Skretting), composed of particles of 0.3–0.6 mm in diameter. After conditioning the sardines for 6 months to the artificial food, the experiment startedin February 2004 and was organised in two steps. First, an initial group of 50 sardines (mean ± selength = 20.0 ± 0.2 cm) was maintained without food for 30 days. Thereafter, food was provided for an addi-tional 50 days period. A control group of 50 sardines was kept in a separate tank and fed regularly. The tankswere under shadow nets and filled with coastal water filtered by gravity through a 2 mm mesh and subse-quently through gravel and sand particles. Seston (>20 lm) entering the tanks was <1 mg l�1. The tempera-ture of the tanks was similar to that of the coastal waters (mean ± se = 13.6 ± 0.1 �C, n = 66). At intervals

A. Bode et al. / Progress in Oceanography 74 (2007) 115–131 119
between one and 10 days, three individuals from each control or experimental tank were sacrificed to obtainsamples of white muscle for isotopic determinations. Samples of the food were also analysed.
2.6. Trophic positions
Trophic positions (TP) of consumers in the pelagic food web were estimated as in Vander Zanden and Ras-mussen (2001):
Fig. 2.the x-arange.P < 0.0
TP ¼ 2þ ðd15Nc � d15NhzÞ=3:4
where d15Nc and d15Nhz are mean d15N values of a given consumer and of herbivorous zooplankton, respec-tively, the latter used as the reference baseline value (TP = 2). The value of d15Nhz was estimated from themeasurements in the 20–200 lm fraction of plankton and the mean isotopic fractionation value between adja-cent trophic levels was 3.4& (Vander Zanden and Rasmussen, 2001).
The relationship between isotopic composition and the individual size of organisms was studied by linearregression of d15N and log2 weight size-classes (Jennings et al., 2001, 2002b). Size-fractionated plankton sam-ples were assigned to individual weight classes determined from allometric equations (Rodriguez and Mullin,1986; Bode et al., 1998, 2003) by assuming that the individual length was the geometric mean of the mesh-sizelimits for each fraction. The nominal lower and upper limits of the weight classes considered between planktonand dolphins were 1.86 ng and 131 kg, respectively.
3. Trophic structure
3.1. The trophic position of plankton
The distribution of d15N in plankton showed high variability and low mean enrichment between size-classes(Fig. 2a). Indeed, mean d15N of plankton between 40 and 500 lm was remarkably constant. In this way, sig-
20 40 80 200 500 1000 2000
0
5
10
176 119 134 131 159 162 165
abccccd
Size (µm)
δ15N
(‰)
Acartia Calanus Centropages0
3
5
8
10
a, ba
b
24 31 28
δ15N
(‰)
Variability of d15N (&) in plankton size-classes (a) and selected copepod genera (b). The upper size limit of each class is marked inxis of panel a. Each box encompasses the 25% and 75% percentiles, the line indicates the median value and the vertical lines theThe numbers below each box indicate the number of data. Significant differences between means (ANOVA and Dunnett-C tests,5) are indicated by different letters.

120 A. Bode et al. / Progress in Oceanography 74 (2007) 115–131
nificant differences (P < 0.05) were only found between four size-class groups <20, 20–500, 500–1000 and1000–2000 lm. The average enrichment in d15N between these significant groups was 0.52, 0.80 and 0.39&,respectively.
All selected copepod genera had similar variations in d15N. Significant differences only appeared betweenmean values of Calanus (6.26&) and Centropages (5.42&), while Acartia (mean d15N = 5.87&) had the largestrange of values encompassing those of the other genera. The mean value for all species (5.9 ± 1.3&), however,is not significantly different from the mean of the 200–500 lm plankton size-class (Table 2). This further jus-tifies the use of the latter as a representative mean value of zooplankton primary consumers in the pelagic foodweb when computing trophic positions.
3.2. The trophic position of planktivorous fish
As found for copepods, planktivorous fish displayed similar variations in d15N in all species (Table 2).Interestingly, sardines and anchovies (Engraulis encrasicolus) showed almost equivalent trophic positions,despite the reported consumption of phytoplankton by the former (Varela et al., 1990; Garrido, 2003) andthe exclusive dependence on zooplankton by the latter (Plounevez and Champalbert, 1999). Only Trachurus
trachurus had mean values significantly higher than those from other species.S. pilchardus had a mean d15N similar to most planktivores (Table 2). Earlier studies reported a significant
negative correlation between d15N and size for sardines P18 cm collected in Galicia (Bode et al., 2003). In thisstudy, however, and considering a large number of measurements (Fig. 3), correlations were not significant
Table 2Mean ± s.d. trophic position of pelagic consumers computed from mean (±s.d.) d15N values (&) of primary plankton consumers
Component d15N G Trophic position
Mean ± s.d. n
Plankton 20–200 lm 5.6 ± 1.7 159 – 2.0Sardina pilchardus larvae 9.3 ± 0.4 10 – 3.1Sardina pilchardus 10.7 ± 0.8 447 b 3.5Trachurus trachurus 11.3 ± 0.4 44 a 3.7Scomber scombrus 10.6 ± 1.0 45 b 3.5Macroramphosus scolopax 10.7 ± 0.3 10 b 3.5Engraulis encrasicolus 10.5 ± 0.5 15 b 3.4Capros aper 10.7 ± 0.2 10 b 3.5Boops boops 10.3 ± 0.4 20 b 3.4Allotheuthis spp. 10.1 ± 0.5 6 – 3.3Delphinus delphis 13.1 ± 0.8 5 – 4.2
G: fish species groups with non-significantly different means (ANOVA and Dunnett-C test, P < 0.05). Trophic position =2 + (d15Nsardine � d15Nplankton)/3.4. n: number of data.
8
10
12
14
5 10 15 20 25Length (cm)
δ15N
(‰
)
< 18 cm> 18 cm
Fig. 3. Variability of d15N (&) with individual length in Sardina pilchardus. Two size-classes (<18 and P18 cm) were considered (see text).

-30 -20 -10 0 10 20 300
5
10
15
log2(w)δ1
5 N (‰
)
plankton
fishdolphin
-30 -20 -10 0 10 20 300
5
10
15
log2(w)δ1
5 N (‰
)
plankton
fishdolphin
Fig. 4. Relationship between mean d15N (&) and individual weight (w, g). d15N standard errors are indicated by bars. The regression lineis d15N = 9.386 + 0.194 log2(w) (r = 0.970, P < 0.0001, n = 20).
A. Bode et al. / Progress in Oceanography 74 (2007) 115–131 121
(ANOVA, P > 0.05), indicating large variability in diet also for larger sardines. Taking into account the meand15N, adult sardines have a trophic position of 3.5 trophic levels, i.e., that of a secondary consumer (Table 2).Sardine larvae were only slightly below in mean trophic position (3.1 trophic levels) but these differences werelower than the error in the estimations (ca. 0.5 trophic levels).
As a consequence of the similarity in mean d15N values, planktivorous fish species were in a narrow rangebetween 3.4 and 3.7 trophic levels (Table 2). Taking into account the standard deviation of these estimates, allspecies analysed can be considered as equivalent in terms of their trophic role in the food web. For compar-ison, we also computed the trophic position of the squids Allotheuthis and dolphins. The former shared withplanktivorous fish the position of a secondary consumer, while the position of dolphins indicates that the stud-ied pelagic food web would have less than five trophic levels.
3.3. The pelagic food web
All food web components can be arranged according to their individual size to reveal the size-structureof the food web (Fig. 4). The obtained relationship reveals a general size dependence of trophic position inthis pelagic ecosystem, when examples of primary producers and top consumers are included. This generalrelationship, however, may be different when only parts of the food web are considered. For instance, theslope of the log-linear relationships between d15N and size for plankton or fish is much smaller that theoverall slope and statistically not significant. One of the applications of this type of relationship is the esti-mation of a mean ratio between the size of predators and prey for the log-linear slope, by assuming thatd15N values are representative of each size-class and a mean trophic fractionation between trophic levels of3.4&, as 23.4/slope. Despite the fact that we sampled individual fish species, their isotopic composition wasquite similar in a relatively large range of sizes (Table 2, Fig. 4), thus supporting the assumption of repre-sentative sampling. In this way, the average predator–prey body-size ratio for the entire food web would beca. 2 · 105:1.
4. Spatial and temporal variability
4.1. Variability of stable isotope composition in plankton
Considering all cruises pooled (Table 3), samples from all plankton classes larger than 80 lm in shelf waterswere significantly enriched in 15N (<200 m depth) relative to shelf-break samples (>200 m depth). The differ-ence between means was ca. 1& (0.6–1.1&). Small plankton (including phytoplankton), however, was notenriched. This implies the uncoupling between zooplankton and phytoplankton in the coast and the presenceof meroplanktonic larvae in the former. In contrast, there were no significant differences in mean d15N of<20 lm (mostly phytoplankton) or >200 lm plankton classes (mostly zooplankton) between geographic shelfareas in 2004 (Fig. 5).

Table 3Mean and s.d. values of d15N (&) in plankton size-classes collected in shelf (<200 m depth) and shelf-break waters (>200 lm)
Size-class Shelf Shelf-break
Mean s.d. n Mean s.d. n P
<20 lm 4.9 1.5 122 5.3 1.3 53 0.08820–40 lm 5.7 1.5 85 5.4 1.3 34 0.29540–80 lm 5.5 1.6 98 5.4 1.2 36 0.70080–200 lm 5.8 1.7 95 5.2 1.6 36 0.049200–500 lm 5.9 1.6 113 4.8 1.8 46 0.000500–1000 lm 6.7 1.5 114 5.7 1.6 48 0.0011000–2000 lm 7.1 1.2 116 6.1 1.4 50 0.000
P: significance between means (ANOVA), n: number of data.
Zone I Zone II Zone III 0
2
4
6
8
10 20 12
δ15 N
(‰)
Zone II Zone II Zone III 0
2
4
6
8
11 21 12
δ15 N
(‰)
10 20 12
11 21 12
Fig. 5. Mean (+se) d15N values (&) of phytoplankton (a) and zooplankton (b) in three shelf zones (see Fig. 1). Differences between zonemeans are not significant in both cases (ANOVA, P > 0.05). The values of the smallest size-class sampled in each area (<20 lm) areassumed to be representative of phytoplankton, while those of the 200–500 lm size-class (>200 lm in zones I and IIa in Fig. 1) areassumed to represent zooplankton. The numbers within each bar indicate the number of data averaged.
122 A. Bode et al. / Progress in Oceanography 74 (2007) 115–131
Due to the different geographic coverage of cruises it was not possible to include in a single statistical anal-ysis all space and time variability factors. However, the 200–500 lm size-class was sampled all years in zonesIIa, IIb and III, thus allowing for the exploration of possible interactions between spatial and interannual var-iability. The results of a two-way ANOVA, however, indicate significant effects of both between-zones andbetween-years variability factors, but no significant interaction between them (Table 4). This suggests thatthe spatial differences were consistent all years, with the plankton of the southern zone IIa more enriched thanin northern zones, even though all zones were influenced by upwelling (Fig. 6a). Taking into account interan-nual differences in d15N (Fig. 6b), samples can be arranged in three periods of maximum (years 2001 and2003), intermediate (years 2000 and 2004) and minimum isotopic enrichment (years 1999 and 2002).
4.2. Variability of stable isotope composition in sardine
Seasonal differences in sardine d15N appeared to be small. Mean values of sardines of zone II sampled inMarch–April and June 2002 were not significant (Mann–Whitney test, P > 0.05) and the same result was

Table 4Results of ANOVA on d15N (&) of 200–500 lm plankton variability across cruise years (1999–2004) and three shelf zones (zones IIa, IIband III in Fig. 1)
Factor SS DF MS F P
Year 97.714 5 19.543 13.950 0.000Zone 30.053 2 15.027 10.727 0.000Year · zone 16.049 10 1.605 1.146 0.338Error 124.677 89 1.401
Total 3554.322 107
SS: sum of squares, DF: degrees of freedom, MS: mean squares, F: variance ratio, P: significance.
47 35 25
12 16 38 20 12 9
zone IIa zone IIb zone III0
2
4
6
8a
b b
47 35 25
δ15N
(‰)
1999 2000 2001 2002 2003 20040
2
4
6
8a a
bb, c
cc
12 16 38 20 12 9
year
δ15N
(‰)
Fig. 6. Mean (+se) d15N (&) of plankton 200–500 lm sampled in different shelf zones marked in Fig. 1 (a) and years (b). Significantdifferences between means (ANOVA and Dunnett-C tests, P < 0.05, Table 4) are indicated by different letters. The numbers within eachbar indicate the number of data averaged.
A. Bode et al. / Progress in Oceanography 74 (2007) 115–131 123
found for 2004 cruises. Furthermore, our experimental feeding studies revealed that the sardines maintainedd15N values in the muscle for up to 80 days, even when fasting for relatively long periods (30 days). There wereno significant correlations between sardine variables (length, weight, nitrogen content or d15N) and time, andmost of the differences between the values measured in the control and treatment groups were not significant(Table 5). In both groups, mortality was <10%. Only sardines in the treatment group reached a higher meanweight than those in the control group when the former returned to normal feeding after fasting. Despite thevariations induced in feeding, the isotopic signatures of sardines remained within a narrow range of values(mean ± s.d. = 11.3 ± 0.3&) during the experiment. Taking into account the d15N value of the food(mean ± s.d. = 9.7 ± 0.1&, n = 5), the isotopic enrichment between sardine muscle and the consumed foodwas 1.6 ± 0.1&. This value is much smaller than the mean value of 3.4& generally assumed as the enrichmentbetween adjacent trophic levels.
The large geographical coverage of cruises in 2004, allowed the study of variability in sardine d15N over theentire shelf. In this case, the mean value for zone II was significantly higher than those of adjacent zones(Fig. 7a). However, when using data from other years, and despite significant variability between years andsampling zones, there was significant interaction between both factors (Table 6). This interaction implies that,in contrast with plankton, the geographical location of maximum and minimum d15N values in sardine varied

Table 5Results of the feeding experiment with S. pilchardus in captivity
Variable Time interval Control Treatment Significance
Length (cm) 0–30 days 19.8 ± 0.6 19.9 ± 1.0 P > 0.0531–80 days 19.8 ± 1.4 20.3 ± 1.0 P > 0.05
Weight (g) 0–30 days 77.1 ± 15.6 79.2 ± 15.8 P > 0.0531–80 days 76.1 ± 24.9 86.0 ± 16.0 P < 0.05
%N 0–30 days 10.6 ± 3.0 11.0 ± 4.1 P > 0.0531–80 days 11.5 ± 3.2 11.7 ± 2.6 P > 0.05
d15N (&) 0–30 days 11.2 ± 0.6 11.2 ± 0.3 P > 0.0531–80 days 11.4 ± 0.7 11.3 ± 0.3 P > 0.05
Mean ± s.d. (n = 12). Differences between treatment and control values were analysed with Mann–Whitney tests.
14 95 79
IIaIIbIII
a
b
wwwxx
yyy
z zz
x
14 95 79
I II III8
9
10
11
12
a
b b
14 95 79
zone
δ15N
(‰)
1998 1999 20018
9
10
11
12 IIaIIbIII
a
b
wwwxx
yyy
z zz
x
year
δ15 N
(‰)
Fig. 7. Mean (+ se) d15N (&) of sardine in zones I, II and III during 2004 (a) and in zones IIa, IIb and III in 1998, 1999 and 2001 (b).Significant differences between means (ANOVA and Dunnett-C tests, P < 0.05) are indicated by different letters.
124 A. Bode et al. / Progress in Oceanography 74 (2007) 115–131
with the sampling year, at least for zones II and III between 1998 and 2001. High d15N values correspond toyears 1998 and 1999, particularly in zones IIa and III (Fig. 7b). During 2001, however, all zones had similarlylow values.
4.3. Isotopic enrichment and population size
Considering mean values of d15N in zone II, the area most sampled in the study period, there is a mismatchbetween maximum and minimum values in 200–500 lm plankton compared to sardines (Fig. 8). Years of highd15N in sardines, as in 1999, coincided with low values in plankton, and vice versa, maximum d15N in planktonwere associated to minimum values in sardines, as in 2001 and 2003. Such differences cannot be attributed todifferences in the individual size of sardines in the annual samples (mean ± se length = 18 ± 3 cm, n = 347,ANOVA P > 0.05). There is a significant negative linear relationship between mean annual d15N of sardineand plankton, indicating that sardines were on average 40% more enriched than plankton (Fig. 9). This rela-
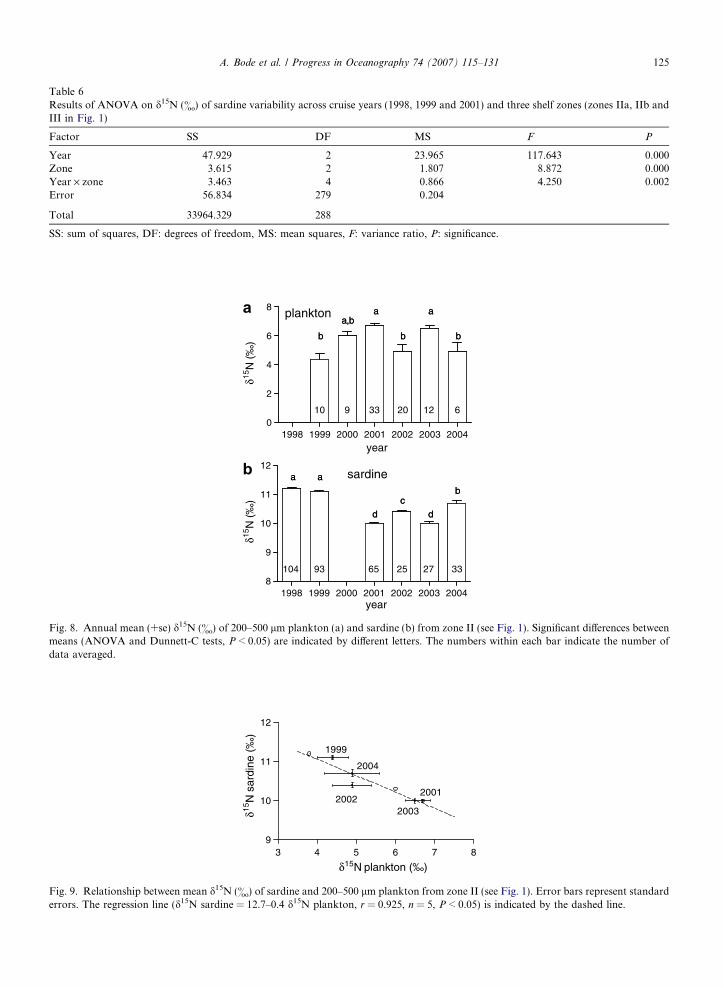
Table 6Results of ANOVA on d15N (&) of sardine variability across cruise years (1998, 1999 and 2001) and three shelf zones (zones IIa, IIb andIII in Fig. 1)
Factor SS DF MS F P
Year 47.929 2 23.965 117.643 0.000Zone 3.615 2 1.807 8.872 0.000Year · zone 3.463 4 0.866 4.250 0.002Error 56.834 279 0.204
Total 33964.329 288
SS: sum of squares, DF: degrees of freedom, MS: mean squares, F: variance ratio, P: significance.
10 9 33 20 12 6
aaa,b
bbb
104 93 65 25 27 33
a
b
a
c
dd
1998 1999 2000 2001 2002 2003 20040
2
4
6
8
10 9 33 20 12 6
aaa,b
bbb
plankton
year
δ15 N
(‰)
1998 1999 2000 2001 2002 2003 20048
9
10
11
12
104 93 65 25 27 33
a
b
a
c
dd
sardine
year
δ15 N
(‰)
Fig. 8. Annual mean (+se) d15N (&) of 200–500 lm plankton (a) and sardine (b) from zone II (see Fig. 1). Significant differences betweenmeans (ANOVA and Dunnett-C tests, P < 0.05) are indicated by different letters. The numbers within each bar indicate the number ofdata averaged.
3 4 5 6 7 89
10
11
12
2001
2003
1999
2002
2004
δ15N plankton (‰)
δ15N
sar
dine
(‰
)
Fig. 9. Relationship between mean d15N (&) of sardine and 200–500 lm plankton from zone II (see Fig. 1). Error bars represent standarderrors. The regression line (d15N sardine = 12.7–0.4 d15N plankton, r = 0.925, n = 5, P < 0.05) is indicated by the dashed line.
A. Bode et al. / Progress in Oceanography 74 (2007) 115–131 125

1998 1999 2000 2001 2002 2003 20040
2
4
6
8
0
200
400
600
800
Δδ15NSSB
yearΔδ
15 N
(‰) S
SB
(Gg)
1997 1998 1999 2000 2001 2002 20030
100
200
300
400
0
50
100
150
year
Upw
ellin
g In
dex
(m3 s
-1km
-1) P
oleward Index (m
3 s-1 km
-1)
Fig. 10. Annual variations of (a) mean difference between d15N (&) of sardine and 200–500 mm plankton (Dd15N) from zone II(continuous line) compared to sardine spawning stock biomass (SSB, Gg = 103 tonnes, dashed line) and (b) mean upwelling (continuousline) and poleward (dashed line) index values of the preceding year (m3 s�1 km�1). SSB was obtained from ICES fishery areas XIa andVIIIc (ICES, 2005). Missing Dd15N values for 1998 and 2000 (open circles) were estimated from the regression line in Fig. 9.
126 A. Bode et al. / Progress in Oceanography 74 (2007) 115–131
tionship was used to estimate the missing values for years 1998 (when no plankton samples for zone II wereavailable) and 2000. The absolute value of enrichment of sardines relative to plankton showed a decreasebetween 1998 and 2000 followed by a general increase in recent years (Fig. 10a). This pattern was parallelto a marked increase in the size of the sardine population since 2000 and a decreasing trend in upwelling inten-sity (Fig. 10b). In contrast, the poleward index first decreased before 2000 but showed alternative high and lowvalues thereafter. Sardine stock and upwelling were significantly correlated (r = �0.708, n = 7, P > 0.05).Mean isotopic enrichment, however, was not significantly correlated with the size of the sardine population(r = �0.205, n = 7, P > 0.05) or the upwelling index (r = 0.294, n = 7, P > 0.05).
5. Discussion
5.1. Size-structure of the food web
Our results on d15N indicate that the main trophic compartments of the pelagic ecosystem are weakly struc-tured in terms of size and species composition. First, plankton values were very variable in all sizes considered,and only certain sizes resulted with significant differences. The average enrichment between plankton size clas-ses (between 0.39 and 0.80&), however, was smaller than the average value of 3.4& expected between adjacenttrophic levels (e.g. Vander Zanden and Rasmussen, 2001; Post, 2002). Also, there were small differences ind15N between the representative primary consumers, the selected copepods, even though they differ consider-ably in size. Such low enrichment between size-classes confirm our previous reports for part of the study area(Bode et al., 2003) and agrees with reports in other oceanic (Fry and Quinones, 1994) and coastal areas (Rolff,2000). A large overlap in the size of organisms at different trophic levels, as the presence of phytoplanktonchains that can be larger than protozoan heterotrophs, and widespread omnivory (e.g. Calbet, 2001) can bethe cause of the low isotopic enrichment observed.
Second, most planktivorous consumers displayed similar average d15N values. This would imply eitherstrong competition for the same prey or spatial and temporal segregation of their populations. While the latter

A. Bode et al. / Progress in Oceanography 74 (2007) 115–131 127
explanation is not supported by the frequent observations of mixed shoals and schools of the main species (e.g.Muino et al., 2003), the former agrees with the information derived from gut-content studies (Varela et al.,1990; Plounevez and Champalbert, 1999; Olaso et al., 1999; Garrido, 2003). Furthermore, our study revealedthat previously reported ontogenic changes in d15N values may be not significant when the observations areaveraged over large areas and several years. For instance, a decrease of d15N with individual size was describedfor sardines sampled in 1998 and 1999 in zones II and III (Bode et al., 2003, 2004a). This decrease was attrib-uted to the higher efficiency of large sardines in capturing phytoplankton, less enriched in 15N than zooplank-ton prey. Adding more observations from different areas and years, however, revealed that the decrease wasnot significant (Fig. 3), as d15N content in sardines decreased, and that of mesozooplankton increased, inrecent years (Fig. 8). In addition, the average isotopic content of sardine larvae was similar to that of adults.Other species may display different patterns in d15N variability with size, as found in Trachurus trachurus
(Bode et al., 2006).Strong size-structure, however, was found across all compartments, particularly when top predators along
with phytoplankton were included. A similar result was previously reported for demersal fish communities,where species composition was not the main source of variability in d15N (Jennings et al., 2001). Further stud-ies including benthic (Jennings et al., 2002b) and whole shallow water, coastal communities (Jennings et al.,2002a) illustrated the applicability of the slope of the size-trophic position relationship as a measure of eco-system structure. In our study, considering only pelagic components, we found a slope lower that thosereported for other studies. A smaller slope implies a larger average predator: prey body-size ratio whichcan be explained by the dominance of large consumers of small prey (planktivorous fish and mammals) inpelagic ecosystems in contrast with benthic communities where most predators are only slightly higher thantheir prey (Cushing, 1978). For instance, values of this ratio in studies including benthic components are inthe order of 102–103 (Jennings et al., 2001, 2002a,b) compared to 105 in our study. These values, however,are only mean values for the trophic continuum in a given ecosystem. Actual predator: prey size ratiosmay vary for each predator between 102 and 1010, if we consider sardines feeding on phytoplankton or dol-phins feeding on sardines, respectively (Bode et al., 2006). Still, the relationship between trophic position andsize may be a general indicator of changes in the pelagic food web over long periods or areas (e.g. decrease ofpredators) providing representative samples of plankton and top consumers are included.
5.2. Variability of trophic positions
When considering individual species, average trophic positions derived from d15N data were rather homo-geneous. Assuming that copepods are the primary consumers, planktivores varied only between 3.4 and 3.7trophic levels, while the top predator was only at 4.2 trophic levels. This result is in agreement with previousassumptions indicating that pelagic food webs in upwelling areas were relatively short due to the prevalence ofplankton consumers (Ryther, 1969). Trophic positions computed using gut-content analysis (e.g., http://www.fishbase.org) were almost coincident with our estimations, with the exception of sardine, which was gen-erally considered as a partial herbivore due to the presence of phytoplankton in their guts (Bode et al., 2006).Isotopic analysis of muscle samples in sardine, however, showed that most of nitrogen was provided by zoo-planktonic prey, while phytoplankton contributed to a small fraction of carbon (Bode et al., 2004a).
The general coincidence between gut-content and isotopic estimates seems to confirm the validity of theassumption of a constant isotopic enrichment of 3.4& between adjacent trophic levels, as used in our study.However, several studies showed that, although most compilations converge towards the mean value of 3.4&,there is a large variability in enrichment between predators and prey (Vander Zanden and Rasmussen, 2001;Post, 2002; McCutchan et al., 2003). In this way, average isotopic enrichment between plankton size-classes inour study varied between 0.4 and 0.8&, and similar values can be found between the size-class typically com-posed of phytoplankton (<20 lm) and copepod species. Also, our experiment with sardines in captivityrevealed an enrichment of only 1.6& between food and muscle. In contrast, isotopic enrichment values closeto 3.4& were reported for predatory fish (e.g. Vander Zanden and Rasmussen, 2001). Nitrogen limitation andthe remineralisation of organic matter in microbial food webs, significant in the study area despite the upwell-ing (Alvarez-Salgado et al., 2002; Bode et al., 2004b), may be responsible for the low enrichment betweenplankton size-classes. Rapid consumption of substrates would prevent the discrimination of light versus heavy

128 A. Bode et al. / Progress in Oceanography 74 (2007) 115–131
nitrogen isotopes and the composition of substrates and products (and similarly the composition of prey andpredator) would converge. Other studies also report low enrichment between zooplankton classes (Fry andQuinones, 1994) and particularly in plankton fractions <20 lm (Rau et al., 1990; Rolff, 2000). The isotopicenrichment between planktivorous fish and the top predator in our study was between 2& and 3&, revealinga larger isotopic discrimination than in the case of plankton, likely because of the higher nitrogen content oftheir diet (Adams and Sterner, 2000).
In any case, average trophic positions derived from d15N are of low indicator value if the large variability inthe isotopic composition of prey and predators, as occurs in upwelling ecosystems, is not adequately measured(O’Reilly et al., 2002). We overcome the temporal variability of d15N in plankton (Bode and Alvarez-Ossorio,2004) by sampling at large spatial scales that integrate successional stages occurring at seasonal scales (Bodeet al., 2004a). Seasonal averages of d15N were reported to reduce the uncertainty in trophic position estimatescaused by the variability of plankton signatures (Matthews and Mazumder, 2005). Significant differences inthe isotopic composition of plankton between shelf areas, as those found in our study, can be interpretedas indicators of different food webs (Perry et al., 1999). In our case most planktivores are widely distributedand feed in both shelf and shelf-break areas (Carrera and Porteiro, 2003), thus differences between consumerscollected in across-shelf transects are not expected. In the generally narrow shelf studied, along-shore differ-ences due to differential upwelling fertilisation would be more relevant for food web characterisation. In thisway, we found significant 15N enrichment in plankton from shelf zone IIa, where upwelling is more active andnew nitrate inputs are frequent during spring (Alvarez-Salgado et al., 2002), while plankton in zone III (South-ern Bay of Biscay) was less enriched, likely due to the use of regenerated nitrogen.
5.3. Consumers in mid trophic levels: S. pilchardus
Taking sardine as a representative planktivore, the results of our feeding experiment, along with the com-parison of field values in spring and summer, indicate that the isotopic signature in the muscle was relativelyconstant for periods between weeks and months, even in the absence of food. Thus, d15N in the muscle effec-tively integrates the diet over such periods, as reported for other fish species (Tieszen et al., 1983), and we canassume that the isotopic composition of consumers measured in our study match that of plankton sampledconcurrently over a large area. The variability in the trophic position of sardine found in this study can betypical of mid trophic levels in pelagic food webs, which may experience both top-down and bottom-up con-trols (Cury et al., 2000). Their ability to consume a large variety of phyto- and zooplanktonic prey wouldallow overcoming the lack of a particular type and the patchy distribution of plankton. A large variabilityin muscle d15N values depending on the relative amount of phytoplankton consumed would be expected,as illustrated with the dispersion of d15N values with fish size. However, we found that the isotopic composi-tion of muscle varied in general in a narrow range, due not only to the small difference in d15N values betweenplankton classes but also to the time integration of diets. This characteristic allows for an estimation of therelative mobility of sardines along the shelf, providing that there were different isotopic signatures of planktonin the different shelf areas, as demonstrated for zones IIa and III. This approach has been successfullyemployed to show mobility in other fish species (e.g. Hanson et al., 1997). Sardines feeding preferentially inzone IIa during relatively long periods would have higher d15N values than those feeding in other shelf zones.Our results revealed that sardines collected in zone II were generally more enriched than those collected inother zones and therefore that there was a low mobility between zones.
Mobility, however, may vary between years. Both absolute d15N and relative enrichment between planktonand sardines varied significantly between years, suggesting that the mobility of sardines was different. Rela-tively low values of plankton d15N before 2000 may be related to the strength of the winter poleward currentduring 1998 and 1999 (Cabanas et al., 2003), as this currents transports warm and low nitrate surface water(Alvarez-Salgado et al., 2003). The predominant use of 14N relative to 15N from regenerated nitrogen by phy-toplankton in these years, would be transmitted up to zooplankton in the food web. The continuous decreasein upwelling intensity and the irregular pattern of the poleward index, however, suggest that the increase inplankton d15N after 2000 may have been due to the interaction between upwelling and downwelling eventsthrough changes in the nutrient sources. Unfortunately there are no time-series data of the isotopic signaturesof nitrogen sources to verify this interpretation. Interestingly, sardine and plankton d15N followed an inverse

A. Bode et al. / Progress in Oceanography 74 (2007) 115–131 129
interannual pattern. Both variables should be positively correlated, however, if nutrient inputs were dependentonly of upwelling intensity, thus supporting the hypothesis of interaction between upwelling and downwelling.Large differences in d15N between consumer and prey are expected when there is nitrogen limitation and thereis internal recycling in the former, whereas lower differences are expected when nitrogen is sufficient (Adamsand Sterner, 2000). In this way, the negative relationship between d15N of plankton and sardines is consistentwith a large isotopic fractionation and nitrogen recycling when plankton is mainly consuming regeneratednitrogen, as in 1999. Changes in the type of prey consumed may also alter the isotopic signature of sardines.In addition, sardines feeding in low nutrient areas may experience starvation and consequently higher isotopicfractionation than those in high nutrient areas. Due to the lack of a simple relationship between plankton d15Nand upwelling–downwelling forcing the interpretation of the differential signatures between plankton and sar-dines would need further studies taking into account nutrient levels, plankton composition and sardine growthin the different areas that are beyond the scope of the present study. These differences, however, can also beinterpreted as the result of the large mobility of sardines in years when muscle d15N values are close to those ofplankton, as in 2001 and 2003. Sardines feeding in all shelf zones would have d15N values lower than thosefeeding mainly in zone II, as plankton of zones I and III was less enriched. Moreover, the distribution of sar-dine d15N in shelf zones in years 1998 and 1999 was more heterogeneous than in 2001, thus indicating theadaptation to local plankton. Such changes in mobility are consistent with the interpretation of the sardinepopulation as separate subpopulations that are restricted to different shelf areas in years of low abundancebut merge when the population increase (Carrera and Porteiro, 2003).
6. Conclusions
The relationship between trophic position and body size in the pelagic food web studied is less constrainedthan those reported for other ecosystems. As a result, the ratio between the sizes of predators and prey is lar-gely variable. Widespread omnivory and plankton consumption by relatively large predators are the likelycauses. Size-structuring among the groups considered, however, was stronger than within them, as found inother studies. Trophic positions of plankton consumers vary in a narrow range of values, suggesting potentialcompetition for food. Low nitrogen isotope enrichment between prey and consumers indicate nutrient limita-tion and recycling at the base of the food web. This suggests a bottom-up control of planktivorous fish andagrees with the described seasonal variability of nitrogen fluxes and heterogeneous distribution of upwellingzones within the studied shelf. The composition of nitrogen isotopes in the muscle of sardine integrates fishdiet over seasonal periods and reflects the composition of plankton over large shelf areas. Differential isotopicsignatures in high and low upwelling zones are consistent with low mobility of sardines during periods of lowpopulation size, thus suggesting the use of isotopic abundance as a measure of the ability of sardines to exploitdifferent areas. The lack of a simple relationship between the main oceanographic events at a regional scaleand the isotopic signature of plankton and sardine, however, calls for more studies to understand the roleof mobility and nutrient enrichment in the isotopic composition.
Acknowledgements
We are grateful to the captain and crew of R/V Thalassa for their assistance during PELACUS cruises. Thecollaboration of all cruise participants, but especially of J. Lorenzo, P. Iglesias, B. Castro, U. Auton and J.Valencia, made possible the collection and preparation of a large number of plankton and fish samples. S. Lensprovided dolphin samples and M. Lema made the isotopic determinations at the SXAI (Universidade da Cor-una, Spain). The useful comments and suggestions of S. Jennings and an anonymous referee greatly improvedthe original manuscript. This research was supported in part by projects PELASSES (99/10), and SARDYN(QLRT-2001-00818) of the European Union, and is a contribution to the GLOBEC-Spain Programme.
References
Adams, T.S., Sterner, R.W., 2000. The effect of dietary nitrogen content on trophic level 15N enrichment. Limnology and Oceanography
45, 601–607.

130 A. Bode et al. / Progress in Oceanography 74 (2007) 115–131
Alvarez-Salgado, X.A., Beloso, S., Joint, I., Nogueira, E., Chou, L., Perez, F.F., Groom, S., Cabanas, J.M., Rees, A.P., Elskens, M., 2002.
New production of the NW Iberian shelf during the upwelling season over the period 1982–1999. Deep Sea Research 49, 1725–1739.
Alvarez-Salgado, X.A., Figueiras, F.G., Perez, F.F., Groom, S., Nogueira, E., Borges, A.V., Chou, L., Castro, C.G., Moncoiffe, G., Rıos,
A.F., Miller, A.E.J., Frankignoulle, M., Savidge, G., Wollast, R., 2003. The Portugal coastal counter current off NW Spain: new
insights on its biogeochemical variability. Progress in Oceanography 56, 281–321.
Bode, A., Alvarez-Ossorio, M.T., 2004. Taxonomic versus trophic structure of mesozooplankton: a seasonal study of species succession
and stable carbon and nitrogen isotopes in a coastal upwelling ecosystem. ICES Journal of Marine Science 61, 563–571.
Bode, A., Alvarez-Ossorio, M.T., Gonzalez, N., 1998. Estimations of mesozooplankton biomass in a coastal upwelling area off NW Spain.
Journal of Plankton Research 20, 1005–1014.
Bode, A., Carrera, P., Porteiro, C., 2006. Stable nitrogen isotopes reveal weak dependence of trophic position of planktivorous fishes from
individual size: a consequence of omnivorism and mobility. In: Povinec, P., Sanchez-Cabeza, J.A. (Eds.), International Conference on
Isotopes in Environmental Studies, Radioactivity in the Environment, vol. 8. Elsevier, Amsterdam, pp. 281–294.
Bode, A., Carrera, P., Lens, S., 2003. The pelagic foodweb in the upwelling ecosystem of Galicia (NW Spain) during spring: natural
abundance of stable carbon and nitrogen isotopes. ICES Journal of Marine Science 60, 11–22.
Bode, A., Alvarez-Ossorio, M.T., Carrera, P., Lorenzo, J., 2004a. Reconstruction of trophic pathways between plankton and the North
Iberian sardine (Sardina pilchardus) using stable isotopes. Scientia Marina 68, 165–178.
Bode, A., Barquero, S., Gonzalez, N., Alvarez-Ossorio, M.T., Varela, M., 2004b. Contribution of heterotrophic plankton to nitrogen
regeneration in the upwelling ecosystem of A Coruna (NW Spain). Journal of Plankton Research 26, 1–18.
Botas, J.A., Fernandez, E., Bode, A., Anadon, R., 1990. A persistent upwelling off the Central Cantabrian Coast (Bay of Biscay).
Estuarine Coastal and Shelf Science 30, 185–199.
Cabanas, J.M., Lavın, A., Garcıa, M.J., Gonzalez-Pola, C., Tel Perez, E., 2003. Oceanographic variability in the northern shelf of the
Iberian peninsula (southern Bay of Biscay) 1990–1999. ICES Marine Science Symposia 219, 71–79.
Calbet, A., 2001. Mesozooplankton grazing effect on primary production: A global comparative analysis in marine ecosystems. Limnology
and Oceanography 46, 1824–1830.
Calvo-Dıaz, A., Moran, X.A.G., Nogueira, E., Bode, A., Varela, M., 2004. Picoplankton community structure along the N and NW
Iberian coastal transition zone in late winter–early spring. Journal of Plankton Research 28, 1069–1081.
Carrera, P., Porteiro, C., 2003. Stock dynamic of the Iberian sardine (Sardina pilchardus, W.) and its implication on the fishery off Galicia
(NW Spain). Scientia Marina 67 (Suppl. 1), 245–258.
Cury, P., Bakun, A., Crawford, R.J., Jarre, A., Quinones, R.A., Shannon, L.J., Verheye, H.M., 2000. Small pelagics in upwelling systems:
patterns of interaction and structural changes in ‘‘wasp-waist’’ ecosystems. ICES Journal of Marine Science 57, 603–618.
Cushing, D.H., 1978. Upper trophic levels in upwelling areas. In: Boje, R., Tomczak, M. (Eds.), Upwelling Ecosystems. Springer-Verlag,
Berlin, pp. 101–110.
Dickson, R.R., Kelly, P.M., Colebrook, J.M., Wooster, W.S., Cushing, D.H., 1988. North winds and production in the eastern North
Atlantic. Journal of Plankton Research 10, 151–169.
Fernandez, E., Cabal, J., Acuna, J.L., Bode, A., Botas, A., Garcıa-Soto, C., 1993. Plankton distribution across a slope current-induced
front in the southern Bay of Biscay. Journal of Plankton Research 15, 619–641.
France, R., Chandler, M., Peters, R., 1998. Mapping trophic continua of benthic foodwebs: body size-delta N-15 relationships. Marine
Ecology Progress Series 174, 301–306.
Fry, B., Quinones, R.B., 1994. Biomass spectra and stable isotope indicators of trophic level in zooplankton of the northwest Atlantic.
Marine Ecology Progress Series 112, 201–204.
Garrido, S., 2003. Alimentacao de Sardina pilchardus (Walbaum, 1792) ao largo da costa continental portuguesa e implicacoes da
condicao nutricional das femeas na qualidade dos oocitos. MSc Thesis, Universidade do Porto, Porto, Portugal, unpublished.
Guisande, C., Cabanas, J.M., Vergara, A.R., Riveiro, I., 2001. Effect of climate on recruitment success of Atlantic Iberian sardine Sardina
pilchardus. Marine Ecology Progress Series 223, 243–250.
Hanson, S., Hobbie, J.E., Elmgren, R., Larsson, U., Fry, B., Johansson, S., 1997. The stable nitrogen isotope ratio as a marker of food-
web interactions and fish migration. Ecology 78, 2249–2257.
ICES, 2005. Report of the ICES Advisory Committee on Fishery Management Advisory, Committee on the Marine Environment and
Advisory Committee on Ecosystems, 2005. In: ICES Advice, vol. 7. International Council for the Exploration of the Sea, Copenhagen.
Kerr, S.R., Dickie, L.M., 2001. The Biomass Spectrum. Columbia University Press, New York.
Jennings, S., Mackinson, S., 2003. Abundance–body mass relationships in size-structured food webs. Ecology Letters 6, 971–974.
Jennings, S., Warr, K.J., Mackinson, S., 2002a. Use of size-based production and stable isotope analyses to predict trophic transfer
efficiencies and predator–prey body mass ratios in food webs. Marine Ecology Progress Series 240, 11–20.
Jennings, S., Pinnegar, J.K., Polunin, N.V.C., Boon, T.W., 2001. Weak-cross species relationships between body size and trophic level
belie powerful size-based trophic structuring in fish communities. Journal of Animal Ecology 70, 934–944.
Jennings, S., Pinnegar, J.K., Polunin, N.V.C., Warr, K.J., 2002b. Linking size-based and trophic analyses of benthic community structure.
Marine Ecology Progress Series 226, 77–85.
Matthews, B., Mazumder, A., 2005. Consequences of large temporal variability of zooplankton d15N for modeling fish trophic position
and variation. Limnology and Oceanography 50, 1404–1414.
McCutchan, J.H., Lewis, W.M.J., Kendall, C., McGrath, C.C., 2003. Variation in trophic shift for stable isotope ratios of carbon,
nitrogen, and sulfur. Oikos 102, 378–390.
Muino, R., Carrera, P., Iglesias, M., 2003. The characterization of sardine (Sardina pilchardus Walbaum) schools off the Spanish-Atlantic
coast. ICES Journal of Marine Science 60, 1361–1372.

A. Bode et al. / Progress in Oceanography 74 (2007) 115–131 131
O’Reilly, C.M., Hecky, R.E., Cohen, A.S., Plisnier, P.-D., 2002. Interpreting stable isotopes in food webs: recognizing the role of time
averaging at different trophic levels. Limnology and Oceanography 47, 306–309.
Olaso, I., Cendrero, O., Abaunza, P., 1999. The diet of the horse mackerel, Trachurus trachurus (Linnaeus 1758), in the Cantabrian Sea
(north of Spain). Journal of Applied Ichthyology 15 (6), 193–198.
Pauly, D., Palomares, M.L., Frioese, R., Sa-a, P., Vakily, M., Preikshot, D., Wallace, S., 2001. Fishing down Canadian aquatic food webs.
Canadian Journal of Fisheries and Aquatic Sciences 58, 51–62.
Perry, I., Thompson, P.A., Mackas, D.L., Harrison, P.J., Yelland, D.R., 1999. Stable carbon isotopes as pelagic food web tracers in
adjacent shelf and slope regions off British Columbia, Canada. Canadian Journal of Fisheries and Aquatic Sciences 56, 2477–2486.
Plounevez, S., Champalbert, G., 1999. Feeding behaviour and trophic environment of Engraulis encrasicolus (L.) in the Bay of Biscay.
Estuarine Coastal and Shelf Science 49, 177–191.
Post, D.M., 2002. Using stable isotopes to estimate trophic position: models, methods, and assumptions. Ecology 83, 703–718.
Rau, G.H., Teyssie, J.-L., Rassoulzadegan, F., Fowler, S.W., 1990. 13C/12C and 15N/14N variations among size-fractionated marine
particles: implications for their origin and trophic relationships. Marine Ecology Progress Series 59, 33–38.
Rodriguez, J., Mullin, M.M., 1986. Relation between biomass and body weight of plankton in a steady state oceanic ecosystem.
Limnology and Oceanography 31, 361–370.
Rolff, C., 2000. Seasonal variation in d13C and d15N of size-fractionated plankton at a coastal station in the northern Baltic proper.
Marine Ecology Progress Series 203, 47–65.
Roy, C., Porteiro, C., Cabanas, J., 1995. The optimal environmental window hypothesis in the ICES area: the example of the Iberian
sardine. In: Hagen, E., Da Silva, A.J. (Eds.), Dynamics of Upwelling in the ICES area. International Council for the Exploration of the
Sea, Copenhagen, pp. 57–65.
Ryther, J.H., 1969. Photosynthesis and fish production in the sea. Science 166, 72–76.
Sholto-Douglas, A.D., Field, J.G., James, A.G., Van der Merwe, N.J., 1991. 13C/12C and 15N/14N isotope ratios in the Southern Benguela
Ecosystem: indicators of food-web relationships among different size-classes of plankton and pelagic fish; differences between fish
muscle and bone collagen tissues. Marine Ecology Progress Series 78, 23–31.
Tieszen, L.L., Bouton, T.W., Tesdahl, K.G., Slade, N.A., 1983. Fractionation and turnover of stable carbon isotopes in animal tissues:
implications for d13C analysis of diet. Oecologia 57, 32–37.
Vander Zanden, M.J., Rasmussen, J.B., 2001. Variation in d15N and d13C trophic fractionation: Implications for aquatic food web studies.
Limnology and Oceanography 46, 2061–2066.
Varela, M., Alvarez-Ossorio, M.T., Valdes, L., 1990. Metodo para el estudio cuantitativo del contenido estomacal de la sardina.
Resultados preliminares. Boletın del Instituto Espanol de Oceanografıa 6, 117–126.
Wada, E., Hattori, A., 1991. Nitrogen in the sea: forms, abundances, and rate processes. CRC Press, Boca Raton.