Dynamics of pelagic fish distribution and behaviour - Horizon ...
365
-
Upload
khangminh22 -
Category
Documents
-
view
1 -
download
0
Transcript of Dynamics of pelagic fish distribution and behaviour - Horizon ...


Dynamics of Pelagic FishDistribution and Behaviour:
Effects on Fisheries andStock Assessment
Pierre FreonORSTOM, BP 5045, 3402 Montpellier, France
OIe Arve Misund[MR, PO Box 1870, N-5024 Bergen, Norway
Fishing News Books


Copyright © 1999
Fishing News BooksA division of Blackwell Science LtdEditorial Offices:Osney Mead, Oxford OX2 OEL25 John Street, London WCIN 2BL23 Ainslie Place, Edinburgh EH3 6AJ350 Main Street, Maiden
MA 021485018, USA54 University Street, Carlton
Victoria 3053, Australia10, rue Casimir Delavigne
75006 Paris, France
Other Editorial Offices:
Blackwell Wissenschafts-Verlag GmbHKurfiirstendamm 5710707 Berlin, Germany
Blackwell Science KKMG Kodenmacho Building7-10 Kodenmacho NihombashiChuo-ku, Tokyo 104, Japan
The right of the Author to be identified as theAuthor of this Work has been asserted inaccordance with the Copyright, Designs andPatents Act 1988.
All rights reserved. No part of this publication maybe reproduced, stored in a retrieval system, ortransmitted, in any form or by any means,electronic, mechanical, photocopying, recording orotherwise, except as permitted by the UKCopyright, Designs and Patents Act 1988, withoutthe prior permission of the publisher.
First published 1999
Set in IOjl2.5pt Timesby DP Photosetting, Aylesbury, BucksPrinted and bound in Great Britain atthe University Press, Cambridge
DISTRIBUTORS
Marston Book Services LtdPO Box 269AbingdonOxon OXI4 4YN(Orders: Tel: 01865206206
Fax: 01865721205Telex: 83355 MEDBOK G)
USABlackwell Science, Inc.Commerce Place350 Main StreetMaiden, MA 021485018(Orders: Tel: 800759 6102
781 3888250Fax: 781 388 8255)
CanadaLogin Brothers Book Company324 Saulteaux CrescentWinnipeg, Manitoba R3J 3T2(Orders: Tel: 2048372987
Fax: 2048373116)
AustraliaBlackwell Science Pty Ltd54.University StreetCarlton, Victoria 3053(Orders: Tel: 0393470300
Fax: 03 9347 5001)
A catalogue record for this title is availablefrom the British Library
ISBN 0-85238-241-3
For further information onFishing News Books, visit our website:http://www.blacksci.co.ukjfnbj

Contents
Foreword ixPrej"ace xi
1 Introduction 11.1 Recent history of animal behaviour studies and focus on
fish behaviour· 11.2 Brief history of stock assessment methods 51.3 Scope of the book 8
2 Pelagic Fisberies 102.1 World catch of small pelagic species 102.2 World catch of large 'mackerel and tuna 142.3 Fishing methods for pelagic species 15
2.3.1 Purse seining 152.3.2 Midwater trawling 182.3.3 Line fishing 19
2.4 Summary 20
3 Habitat Selection and Migration 213.1 Introduction 213.2 Habitat selection according to different time and space scales 223.3 Influence of abiotic (physical) factors 27
3.3.1 Temperature 283.3.2 Salinity 323.3.3 Dissolved oxygen 333.3.4 Water transparency 363.3.5 Light intensity 363.3.6 Current, turbulence and upwelling 383.3.7 Depth of the fish in the water column 403.3.8 Bottom depth and the nature of the sea bed 413.3.9 Floating objects 44
3.4 Influence of biotic factors 443.4.1 Conspecifics and the ideal free distribution 443.4.2 Other species 483.4.3 Prey 483.4.4 Predators 52
3.5 Conclusion 54

IV Contents
4 Schooling Behaviour4.1 Introduction4.2 School definitions4.3 Genetic basis of schooling4.4 Ontogeny of schooling4.5 Schooling and shoaling4.6 Functions of schooling
4.6.1 Surviving predatory attack4.6.2 Effective feeding4.6.3 Hydrodynamic advantages4.6.4 Migration4.6.5 Reproduction4.6.6 Learning
4.7 School size4.8 School organisation
4.8.1 Study methods4.8.2 Minimum approach distance4.8.3 Nearest neighbour distance4.8.4 Spatial distribution4.8.5 Internal synchrony4.8.6 Individual preferences and differences4.8.7 Packing density4.8.8 Packing density structure4.8.9 School shape4.8.10 Factors affecting school structure4.8.11 Factors selecting for homogeneity, structure and
synchrony4.9 Mixed-species schools.4.10 Spatial distribution (clustering)4.11 Communication
4.11.1 Vision4.11.2 Lateralline4.11.3 Hearing
4.12 Schooling, modern fishing and natural selection4.13 Conclusion
5 Avoidance5.1 Avoidance of sounds from vessel and gear
5.1.1 Ambient noise in the sea5.1.2 Noise from vessels5.1.3 Fish hearing5.1.4 Fish reactions to noise
5.2 Visually elicited avoidance5.2.1 Light in the sea5.2.2 Fish vision
56565657585960606363646465656868707172757778798082
8688939495979898
100
102102102103108116122122123

Contents v
5.2.3 Avoidance reactions elicited by visual stimuli of vesseland gear 124
5.3 Conclusion 126
6 Attraction and Association 1286.1 Attraction to light 1286.2 Attraction to bait 1316.3 Associative behaviour 133
6.3.1 Association with floating objects 1336.3.2 Association with other species 1546.3.3 Summary of associative behaviour 157
7 Learning 1597.1 Introduction 1597.2 Learning in fish predation 159
7.2.1 Individuallevel 1607.2.2 Interactions at the group level 1637.2.3 Interactions among the prey 1647.2.4 Key stimuli in learning 1647.2.5 Hypothesis on interactive learning 1677.2.6 From natural predators to fishing gear 167
7.3 Other learning processes 1717.4 Conclusion 173
8 Effects of Behaviour on Fisheriesand Stock Assessment using PopulationDynamic Models 1748.1 Introduction 1748.2 Stock assessment by population dynamic models 174
8.2.1 Stock assessment by surplus-production models 1748.2.2 Stock assessment by age-structured models and yield
per recruit 1798.2.3 Stock-recruitment relationship 182
8.3 Habitat selection and its influence on catchability andpopulation parameters 183
8.3.1 Yearly changes in abundance, density, habitat andcatchability in relation to exploitation and theenvironment 183
8.3.2 Some attempts at modelling the yearly variability ofcatchability in relation to habitat selection 193
8.3.3 Seasonal variability of catchability in relation to habitatselection 200
8.3.4 Circadian variation of catchability related to habitatselection 204
8.3.5 Spatial variability of catchability in relation tohabitat selection 208

VI Contents
8.3.6 Influence of habitat selection on growth estimate 2148.3.7 Influence of habitat selection on mortality estimate by
ASA models 2148.4 Influence of aggregation on fisheries and population
dynamic models 2158A.I Influence of aggregation on catchability 2158.4.2 Influence of mixed-species schools on abundance indices 2308.4.3 Influence of aggregation on growth estimates and
age-length key 2328.5 Influence of avoidance on abundance indices 2358.6 Influence of attraction and associative behaviour on population
modelling 2368.6.1 Influence of attraction 2368.6.2 Influence of association 236
8.7 Influence of learning on-stock assessment 2398.7.1 Influence of learning on surplus-production models 2408.7.2 Influence of learning on intraspecific diversity and stock
identification 2448.7.3 Influence of learning on structural models 2478.7.4 The strength of paradigms 248
8.8 Conclusion 249
9 Effects' of Behaviour on Stock Assessment using Acoustic Surveys 2519.1 Introduction 2519.2 The hydroacoustic assessment method 2519.3 Effects of habitat selection 2529.4 Effects of social behaviour 254
9.4.1 Distribution function of densities 2549.4.2 Target strength 2549.4.3 Acoustic shadowing 256
9.5 Effects ofavoidance 2589.5.1 Methods to study vessel avoidance 2589.5.2 Observations of vessel avoidance during surveys 2609.5.3 Avoidance of vessel light 2669.5.4 Vessel avoidance during sampling by trawls 2679.5.5 Instrument avoidance 2699.5.6 Sampling gear avoidance 270
9.6 Replicability of acoustic survey estimates 2719.7 Conclusion 272
10 Other Methods of Stock Assessment and Fish Behaviour 27410.1 Fishing gear surveys 274
10.1.1 Methodology and assumptions 27410.1.2 Influence of fish behaviour on fishing gear surveys 275
10.2 Aerial surveys 27610.2.1 Methodology and assumptions 276

Contents vii
10.2.2 Influence of fish behaviour on aerial survey 27710.3 Ichthyoplankton surveys 279
10.3.1 Objectives, methodology and assumptions 27910.3.2 Influence of fish behaviour on ichthyoplankton surveys 281
10.4 Capture-recapture 28210.4.1 Methodology and assuptions 28210.4.2 Influence of fish behaviour on capture-recapture methods 283
10.5 Conclusion 284
11 Conclusion
ReferencesIndex
285
290339


Foreword
By Alain Laurec and Anne E. M agurran
The arrival of this book is timely. A split has occurred in fisheries research, betweenthose population dynamicians who use only indirect methods derived from cohortanalysis and those who prefer direct assessment. Freon and Misund show how thisdivision is unnecessary, and how behavioural techniques can put a different light onthe study of fisheries resources.
The authors are wellqualified to establish such a link between the two camps. Theirindividual experience is complementary, particularly at the geographical level wheretheir knowledge covers a wide area from tropical to Arctic seas and includes freshwater, pelagic coastal fish, and large migratory species.
The book will form a useful reference guide for scientific research, and it is hopedthat it will ease the dialogue between scientists and fisheries professionals. The bookexplains clearly the problems and, in particular, how fishermen's observations can bereconciled with scientific findings.
Fisheries biologists are warmly advised to read this innovative book, which is basedon the authors' experience and a comprehensive reference list. They will find heremuch information of interest to give a new perspective on their subject. A nonspecialist reader will also find the book contains key information about fisheriesresearch and management.
Alain LaurecDirector, DG XIV
European CommissionBrussels
Fish are often seen as unsophisticated creatures, immortalised in the myth about thegoldfish which has a memory span about as long as the time it takes to circumnavigate its bowl. However, recent investigations by behavioural ecologists andevolutionary biologists have revealed that these creatures have complex abilities.For example, fish can recognise and remember the identities of particular individuals, and choose with whom to associate on the basis of past encounters. Fishschools, one of the most impressive and indeed widespread of animal social groupings (over 80% of species school at some phase of their lives), represent the sum ofthese individual behaviours. Fish schools are also of immense economic importance.Pelagic schooling species, such as anchovy, herring, mackerel and tuna, underpin the

x Foreword
global fishing industry, and in 1994 alone the world catch of these fish was around45 million tonnes.
To date, there have been few attempts to make links between fish biologistsinterested in behavioural mechanisms and function and fisheries biologists concernedwith stock assessment. Yet effective stock assessment and fisheries managementdemand a good understanding of fish behaviour. Pelagic fish will, for instance, showavoidance behaviour to survey vessels thus biasing density and distribution estimates.Pierre Freon and Ole Arve Misund recognise this need and in this book bring togetherthese previously isolated domains of science for the first time, making a compellingcase for strengthened interactions between the disciplines. Fisheries biologists will bepersuaded to pay increased attention to behaviour while behavioural biologists will bereminded of applied problems outside their normal remit.
Freon and Misund also emphasise a major limitation in applying current knowledge of fish behaviour to the questions that interest fisheries biologists. Mostinvestigations of behaviour use freshwater species, small schools, and take place inlaboratories. Such a bias is inevitable given the need for replicated and well-controlledexperiments to test specific hypotheses about schooling tendency or mate choice orpredator avoidance. Pelagic species, by contrast, often live in schools much largerthan those studied in the laboratory. We know little about the consequences of thisdifference or the extent to which the dynamics of small schools can be extrapolated tolarge ones.
It is sobering to note that schooling, the behaviour that protects fish against theirnatural predators, has facilitated their over-exploitation by human ones. Largenumbers no longer confer safety, but are instead a liability because modern technology can readily detect and capture entire schools. As Freon and Misund observe,the test of this new dialogue between those who study fish and those who exploitthem, will ultimately be the preservation of the resource for future generations.
Anne E. MagurranSchool ofEnvironmental & Evolutionary Biology
University ofSt AndrewsScotland

Preface
Knowledge of fish behaviour has always been a basic prerequisite for successfulfishing. Fishermen often find that changes in fish location, vertical distribution,aggregation behaviour, reaction to fishing gear, etc., influence catch rates drastically.The effects of fish behaviour may influence stock assessment by indirect methods thatrely on catch statistics, especially if fishermen's experience is not properly taken intoaccount. There is also an increasing awareness that effects of fish behaviour maygreatly influence stock assessment by direct methods, such as hydroacoustics.
Pioneer fisheries scientists identified effects of fish behaviour on fisheries at thebeginning of the twentieth century, and during the last two decades there have beensubstantial scientific efforts to study fish behaviour in relation to fisheries and stockassessment. However, there has been no comprehensive text that summarises theeffects of fish behaviour on catch rates and stock assessment by indirect and directmethods. Our intention with this book is therefore to provide a review of dynamics offish distribution and behaviour and its effects on fisheries and stock assessment.Throughout the book, examples are given for pelagic species from all over the world;We limit the book to small pelagic fish because such species contribute about onethird of the total world catch, show substantial plasticity in their behaviour, and areassessed by both indirect and direct methods.
The book is written mainly for scientists working on or interested in stockassessment and fish behaviour, and may serve as an introductory text for graduatestudents. One of our aims in this book has been to bridge the gap between academicwork onfish behaviour and fisheries research. We have tried to show how advances infish behaviour can improve stock estimation and our wish is to see workers on fishbehaviour directing their efforts towards remaining problems.
Over 1200 references are provided. There are several reasons. First, the bookintends to cover two fields of research: fish behaviour and fish assessment. Second,field studies of fish behaviour are performed under uncontrolled conditions andtherefore provide contrasting results, often difficult to interpret by themselves. Thereis a need to compare these different results among themselves and with controlledlaboratory studies to validate some conclusions. As far as field studies of fish behaviour are concerned, there is a large body of 'grey' literature that covers this point andthat we have cited. Some of these papers are excellent, others (including some of ours)are just working group papers, suffering from poor presentation or a lack ofappropriate statistical analysis, weak discussion, etc. Nevertheless, these paperscontain valid field observations that deserve to be taken into account within theframework of the comparative approach.

XII Preface
We are grateful to several people for helping us in developing this book. The firstscientific content was discussed by the authors with Francois Gerlotto, who is warmlyacknowledged for his input and for the revision of some chapters. The preparation ofthe book was made possible through a 6 month employee contract from ORSTOM,France, to Ole Arve Misund in 1992, and a guest scientist scholarship for 2 monthsfrom the Norwegian Research Council to Pierre Freon in 1993.We are also gratefulto many colleagues who took time to revise several chapters and to provide usefulcomments. Among them we extend special thanks to P. Cayre, A. Fonteneau and F.Marsac. Additional comments were provided by D. Binet, F. Conand, V. Csanyi, P.Cury, E. Cillaurren, F. Laloe, D. Gaertner, P. Petitgas, M. Soria, J.-M. Stretta and D.Reid. Anne Brit Tysseland and Jofrid 0vredal prepared the figures, and VirgineDelcourt, Elen Hals and Laurence Vicens helped us with the reference list. Specialthanks go to Chuck Hollingworth for his skilful editorial comments and suggestionsfor improving our English. Finally we would like to thank Blackwell Science forpublishing our book, and for patience during its preparation.
P. FreonO.A. Misund

Chapter 1Introduction
1.1 Recent history of animal behaviour studies and focus onfish behaviour
The foundation of animal behaviour studies occurred only in the nineteenth centuryand presently studies of animal behaviour or ethology can be subdivided into fourmajor approaches (Drickamer and Vessey, 1992):
(1) Comparative psychology investigates the mechanisms controlling behaviour bysystematic and objective observation or controlled experiments (Dewsbury,1984).
(2) Ethology (sensu stricto) is mainly based on the principle that behavioural traitscan be studied from the evolutionary viewpoint; it is at the origin of the definition of basic concepts such as the distinction between appetitive and consummatory behaviours. This period is dominated by two famous ethologists:Konrad Lorenz (1903-1989) and Niko Tinbergen (1907-1988), who developedtheir concepts mainly from in situ observations.
(3) Behavioural ecology, which emerged in the 1950s, reinforces the studies ofinteractions between animals and their environment (including other animals,conspecificsor predators). It focuses on the implication of behaviour for survival. For instance, the foraging advantage of flocking in birds was demonstrated by Krebs et al. (1972), and the anti predator advantage of schooling infishes by Neill and Cullen (1974). One of the most famous findings of behavioural ecology is the optimal foraging theory which predicts how an animalshould proceed to achieve a maximal rate of energy intake in the most economicway (Stephens & Krebs, 1987). Investigations are generally conducted both inthe field and in the laboratory. In the introduction of a multi-author book on thebehavioural ecology of fishes (Huntingford & TorriceIli, 1993), Huntingford(1993) reviewed the evolution of behavioural ecology through the changes in thethree editions of the major book of Krebs and Davies (1978, 1984, 1991). Thefirst edition focused on space use and territoriality, foraging, predator avoidance, mating, sexual selection, evolution of sociality and of cooperative breeding, and finally life history strategies. The second edition covered more or lessthe same topics but marked the end of the 'romantic era' of behavioural ecology.Some accepted theory, like optimal foraging, was found to be too simple and theusual analytical techniques were criticised (e.g. the comparative approach).

2 Chapter 1
Huntingford (1993) spelled out six points characterising the third edition that weclassify as follows according to the scope of this book:
(a) Bridging of the gap between the analysis of behavioural adaptations at theindividual level and processes in population and community ecology. (Wewill distinguish population (the whole set of individuals which exchangegenes regularly) from the stock which is the exploited fraction of (ideally)one population.)
(b) Extension of optimality models to trade-off conflicting demands (e.g.reduction of predation risk and maximum rate of food intake) in order tomaximise fitness
(c) Introduction of stochastic dynamic modelling to bridge the gap betweenbehaviour now and fitness later
(d) Links between behaviour and structural/physiological traits, and the needto understand the mechanisms (e.g. proximate cues that elicit feeding, roleof learning in foraging)
(e) Increase in the precision of genetic relatedness due to the development ofDNA fingerprinting
(f) Interest in parasitism behaviour (especially sexual displays as indicators ofdisease resistance). . .
(4)Sociobiology emerged from the 1970s onwards and is often associated with thework ofWilson (1975). It focuses on the study ofsocial systems ofanimals livingin groups from the perspective of evolutionary biology (Drickamer & Vessey,1992).
From a genetic point of view, Mayr (1976) distinguishes two kinds of ethologicalprogrammes according to the degree of plasticity of the corresponding phenotype.'Closed programmes' do not allow modification by experience, as do 'openprogrammes'. Most of the behavioural traits related to intra- or inter-species behaviour are related to closed programmes because they are linked to the emission and/orreception of signal from other individuals. On the other hand non-communicativebehaviour (feeding, habitat selection) is related to open programmes.
The history of animal behaviour is largely dominated by the observation ofmammals and birds. Nevertheless, fishes have retained the attention of many workers(see Barlow (1993) for a review), but until recently this was mainly the case forfreshwater and/or demersal fish, as for instance the famous three-spined stickleback(Gasterosteus aculeatus), or different species of coral fish. Reproductive behaviour(Dulzetto, 1928), especially mating. behaviour (Clark et al., 1954; Constantz, 1974;Farr, 1977)and parental care (Fryer & lies, 1972; review in Baylis, 1981) were studiedearly in fish. The advantages of group life were also investigated early in fish, especially the antipredator function (von Frisch, 1938; Neill & Cullen, 1974) and feeding(Roberston et al., 1976). Observations on fish also contributed to testing optimalitytheory (Werner & Hall, 1974; Kislalioglou & Gibson, 1976), exemplified the use ofrules' of thumb during foraging (O'Brien et al., 1976) and revealed physiologicalconstraints on diet selection (Werner, 1977). Milinski (1979) used sticklebacks to

Introduction 3
confirm the 'ideal free distribution' theory initially developed in birds by Fretwell andLucas (1970). The trade-off between habitat selection, feeding and predator avoidance was studied in fishes (Milinski & Heller, 1978;Werner et al., 1983), and Milinski(1985) demonstrated how parasites modify fish behaviour to promote transmission tothe main host. Fishes were used also in experimental tests of the predictions of gametheory (Turner & Huntingford, 1986; Enquist et al., 1990). The cost and benefitsapproach, pioneered in terrestrial animals by MacArthur and Pianka (1966), was alsoapplied to the territoriality in fish (Ebersole, 1980;McNicol & Noakes, 1984). Finally,fishes also supported numerous studies on alternative reproductive strategies (Jones,1959; Gross & Charnov, 1980).
Pelagic fish are difficult to study because they are not easy to manipulate withoutbeing damaged and because in situ observation is made difficult by their low contrastwith the environment, their great numbers in schools and their often strong avoidancereaction to human observers or to photographic light. New technologies have allowedeasier observation of natural behaviour, especially acoustic devices and low-lightlevel cameras. Pioneer tank or aquarium observations and experiments on pelagic fishbehaviour were conducted by Parr (1927), Breder (1954) and later Shaw (1969) ontheir most typical behavioural trait: schooling (Chapter 4). Breder also made pioneerobservations on the flight of flying fish by using advanced flash photography (Breder,1929). During the same period, fishery biologists accumulated, and still continue toaccumulate, a large number of field observations on pelagic fish behaviour (especiallyhorizontal and vertical migrations), but this work remained mainly descriptive.References of these pioneer works are available in the selected bibliography compiledby Russel and Bull (1932).
Researchers from the USSR were probably the earliest to develop a real school onfish behaviour studies from the 1950sas did, to a certain extent, Keenleyside (1955) inCanada. Radakov (1973) and eo-workers developed advanced techniques to observeschool behaviour and most of their interpretations are still in use. For instance, thetrade-off between hunger and gear avoidance was already noticed by Radakov (1973)for sardines, which were observed to detect a trawl later when-in the presence of prey.Lebedev (1969) gave a synthesis of his own work and of his colleagues' and proposeda theory of elementary populations which has not been completely supported byrecent findings.
In North America, Strasburg and Yuen (1958) made pioneer visual underwaterobservations on skipjack tuna (Katsuwonus pelamis) behaviour in the wild. Winn andOlla (1972) edited a book gathering different papers on behaviour of marine vertebrates, but it is limited to US works. During the last decades of the twentieth century,Japanese, Canadian and US scientists participated increasingly in InternationalCouncil for the Exploration of the Sea (ICES) working groups and committees and inother international events on fish behaviour (review in Bardach et al., 1980).
Even though other aspects of fish behaviour (distribution, growth, natural mortality) were addressed by a symposium held in 1958 (Kesteven, 1960), early on adifferent approach to fish behaviour studies was related to the recognition of fishbehaviour as an important factor in improvements to fishing technology (1957 firstFAO international fishing gear congress, Kristjonsson, 1959). In the early 1960s,

4 Chapter 1
scientists from France, Germany, Netherlands, Norway, Sweden and the UK founded IF (International Fishing Technology Working Group), which was orientatedtoward trawl construction but also took up applied behavioural studies. The secondFAO international fishing gear congress took place in 1963(Finn, 1964)and the thirdone in 1967(Ben-Tuvia & Dickson, 1968).This third FAO international congress waseo-organised with ICES and named Conference on Fish Behaviour in Relation toFishing Techniques and Tactics; it represented a turning point in research in this field.Finally, in 1968 an All-Union Conference was held in the USSR (Alekseev, 1968)which indicates the importance given by the international community to these aspectsduring this II year period (1957-1968).
The IF working group was recognised and adopted by ICES and renamed theFishing Gear Technology Working Group in 1969. In 1972, a new working group onsound and vibration in relation to fish capture was established with the aim ofimproving the understanding of acoustic stimuli in fish behaviour during fishingoperations. Both working groups were connected to the ICES Fish Capture Committee and were later merged into a single group renamed the Fish Technology andFish Behaviour (FTFB) group. In 1979 a specific working group on acoustics wascreated, the Fish Acoustic Sciences Technology (FAST) group. These two workinggroups held joint sessions, recognising the importance of improving the understanding of fish behaviour in relation to their work. Even though ICES workinggroups devoted much time to technical and methodological improvements, there wasa clear trend towards the use of acoustics as a scientific tool for studying fish behaviour and stock abundance. This trend, and a growing interest in applied fish behavioural studies, were also observed in a symposium held in 1992 in Bergen on FishCapture and Fish Behaviour (Wardle & Hollingworth, 1993) and in the recent bookof Ferno and Olsen (1994). Japanese scientists attended the Bergen symposium andgave a larger audience to Japanese works previously published in national journals.
Mainly from in situ studies, great progress took place in the fields of the ICESFTFB and FAST working groups. At the beginning, most of the scientific productionconsisted of the design ofgear or technical acoustic devices and appeared mostly inthe grey literature. As underlined by Ferno (1993), often fisheries behavioural studieslack rigorously defined units for measuring behaviour and remain mainly qualitative.But from .the 1980s, the scientific production shifted towards the primary literature,and .the above-mentioned symposia were edited by ICES after conventional refereeing. Unfortunately, behaviourists (sensu stricto) never attend these meetings, andfisheries biologists working on behaviour do not participate in behavioural ecologyevents; these two related branches of investigation seem to ignore each other, despitethe clear needs expressed by the fisheries biologists (Harden Jones, 1978). Manybehaviourists are investigating conceptual aspects of fish behaviour, especially fromthe perspective of modern behavioural ecology, mainly from studies in space-limitedand controlled environments (Huntingford & Torricelli, 1993;Pitcher, 1993);as far aspelagic fish are concerned, schooling behaviour received a greater attention (e.g.Pitcher & Parrish, 1993) and will be largely developed in this book.
Independently, some fishery scientists intend to evaluate the effect of fish behaviouron direct or indirect stock assessment methods by direct measurements or by

Introduction 5
modelling (review in Freon et al., 1993a; Chapters 8 and 9 of this book). Behaviouralecology studies are sometimes considered more academic than fisheries studies. Thisis less and less true and, as in many branches of science, academic and appliedresearch are complementary-and can take advantage of each other. On this line, therecent approach 'of behavioural studies by artificial life (Langton, 1989) is promisingfor modelling individual fish behaviour by oriented object languages. Huth andWissel (1990, 1994) applied it successfully in the case of schooling behaviour, confirming the fact that a leader is not useful for the cohesion of a moving school.
1.2 Brief history of stock assessment methods
After a long debate on the causes of fluctuations in stock abundance (natural fluctuation vs. influence of fisheries), which culminated in 1883 during the LondonExposition, it was recognised that better knowledge was needed to manage thefisheries (review in Smith, 1988, 1994). This task was assigned to the InternationalCouncil for the Exploration of the Sea (ICES), officially created in 1902 after theanalysis of the data from the first experimental analysis of stock depletion bytrawling, named the Garland experiment (Fulton, 1896), along with commercial dataanalysis of the English fisheries (Garstang, 1900). While the ICES overfishingcommittee, chaired by William Garstang, focused initially on the causes of stockabundance, the migration committee, chaired by Johann Hjort, paid attention to fishmovements and the availability of fish to fishermen. In 1907 Hjort (1908) first suggested that fish age distribution be studied in order to understand the variability incatches. His suggestion of an international programme for collecting herring scalesfor ageing was finally adopted in 1909, but unfortunately he did not convince ICES ofthe value of this approach. One of the main criticisms of Hjort's approach, whichdelayed its wide acceptance for many years, was dealing with fish behaviour. D.W.Thompson, one of his primary antagonists, argued that schools of herring are likelyto be composed of fish of the same age, so the age composition of samples would notrepresent the ages in the population.
Fish tagging started with the pioneer work of FuIton and Petersen on plaice at theend of the nineteenth century, but for the more abundant and fragile pelagic fish, thistechnique was not really applicable before the 1960s with the use of small internalmagnetic tags. These tags were used for tagging small AtIanticherring (Dragesund&Hognestad, 1960) and menhaden (Brevoortia tyrannus) over 100 mm (Carlson &Reintjes, 1972; Pristas & Willis, 1973). They are automatically detected during fishprocessing (Parker, 1972). Egg surveys were .initiated on demersal species at thebeginning of the 1920s to back-calculate the size of the spawning stock, knowing thefecundity of females (review in Gunderson, 1993). This method was more difficult toapply to pelagic stocks because the spawning areas of-these are wider and eggs sufferadvection processes. In addition, many pelagic fishes are indeterminate spawnerswhich are continuously maturing broods of eggs during the spawning season. Thislast problem was only overcome in the 1990s by the daily production method (Hunteret al., 1993).

6 Chapter J
After Hjort's pioneer work, the idea of structured models was again proposedindependently in the USSR, mainly by Baranov (1918)and Derzhavin (1922);(reviewin Ricker, 1971, 1975). Then it was developed by Fry (1949), but Beverton (1954)andlater Beverton and Holt (1957) and Paloheimo (1958) emphasised estimation ofmortality rates given catch and effort data. From that period, natural mortality wasincluded in the models and fishing mortality was defined as the product of fishingeffort and catchability. Throughout this book we will see how catchability is relatedto fish behaviour. The other improvementsto the structured models will be developedin Chapter 8, along with the surplus-production models which appeared during thesame period (Hjort et al., 1933; Graham, 1935; Sette, 1943; Schaefer, 1954, 1957).These models were applied mainly to pelagic stocks. The surplus-production modelsconsider the change in abundance of the whole population and do not require the agecomposition of the catches to be known, but are more sensitive to knowledge of thecatchability, which is assumed to be constant in most of these models.
During the period following the Second World War, two analytical approacheswere studied: the yield per recruit and theoretical mechanisms relating stock andrecruitment (Ricker, 1954; Beverton & Holt, 1957). Even though the second approachremains largely theoretical owing to the difficulty of estimating the recruitment and tothe large variability of the relationship between stock and recruitment, these twoapproaches allow us to distinguish between two sorts of overfishing: recruitmentoverfishing, when catches affect the reproductive capacity of the stock, and growthoverfishing, when fish are caught before reaching an optimal weight. In contrast todemersal species, pelagic species have a fast growth and usually suffer recruitmentoverfishing, which is responsible for many stock collapses (often in conjunction withenvironmental changes) as reviewed by Csirke (1988). Nevertheless in the case of theAtlantic menhaden (Brevoortia tyrannus) fishery, Ahrenholz et al. (1987) suggested agrowth overfishing. This exception is probably due to the relatively slow growth of
. this species in relation to its long life span (> 8 years).Direct methods of stock assessment making use of fishing gears started at the
beginning of the twentieth century and were at first limited to demersal fish caught bybottom trawl (swept-area method). They were much later extended to midwatertrawl, but in only a few instances (Parmanne & Sjoblom, 1988) owing to the socialbehaviour of pelagic fish resulting in an extremely patchy distribution and therefore alarge variability in the results. Recentlyspecific midwater trawls have been designedfor the estimation of pelagic postlarval abundance of demersal species (Potter et al.,1990) or juveniles (God" & Valdemarsen 1993). Planes and helicopters have beenused for many years by commercial fleets to locate schools of coastal pelagic fish ortunas (for instance in the menhaden fishery of the south-eastern USA or in theAtlantic tuna fishery). But aerial surveys with the aim of fish stock abundance estimation are not common (but often used for mammals). The reason for this poorsuccess is that aerial detection is limited to surface schools and there is usually a largevariability in the vertical distribution of schools. Visually based surveys of coastalpelagic fish are conducted during the day, but use of low-light-level video enablessurveying during the night (Squire, 1972; Cram, 1974; Williams, 1981). New techniques which are less dependent on fish depth (light detecting and ranging - LIDAR;

Introduction 7
Kronman, 1992) or on cloud coverage (compact airborne spectrographic imager CASI; Borstad et al., 1989; Nakashima & Borstad, 1993) are still on the methodological stage.
Following the pioneer work on stock assessment, where the main basis of population dynamics was established, a long period of improvement and refinement ofmethods took place and is still continuing. This was facilitated by the increasing use ofelectronic computation, which permitted complex and time consuming mathematicaland statistical methods such as fitting by iteration. Computers also allowed for anincreasing use of simulations in population dynamics. Simulations are not consideredto be assessment methods, but are of great help for understanding and improvingthese methods, especially to estimate the risk of collapse in terms of probability.Nevertheless, as remarked by Francis (1980), during this period:
'More attention has been paid to developing mathematically sophisticated methodsof fitting various analytic models than to the basic structure and assumptions of themodels themselves ... The inference is made that, because the analytic models(gross abstraction of the reality) have long-term equilibrium properties, so too mustthe populations to which they are applied. This seems rather a backwardsapproach.'
The great novelty in the second half of the twentieth century has been the use ofhydro-acoustics first by fishermen and then by fishery biologists. After the first worldwar, hydro-acoustic detection improved considerably for military purposes (LeDanois, 1928; Marti, 1928). The technology was soon applied to experimental fishdetection (Kimura, 1929; Sund, 1935). During the second world war, the militarytechnology improved again and after the war it started to be used by fishermen.Fisheries biologists started to use it for describing the horizontal and vertical distribution of pelagic fish (e.g. Cushing, 1952; Trout et al., 1952; Harden Jones &McCartney, 1962; Mais, 1977). The next step was the quantification of biomass byechointegration, which started around 1970, following the pioneer work of Dragesundand Olsen (1965). The technique was rather imprecise at the beginning due toproblems of electronic calibration and imprecise knowledge of the intensity of fishecho energy (target strength), and as a result it was not well accepted by the scientificcommunity familiar with indirect methods of stock assessment. In the 1970s and1980s, considerable technical and methodological improvements took place (reviewsin Foote et al., 1987; MacLennan & Simmonds, 1992; Simmonds et al., 1992). Fivesymposia (four of them under the auspices of ICES) present milestones in the historyof fisheries acoustics and behaviour: the 1979Cambridge (Massachusetts) symposiumas part of a joint programme between the USA and USSR (Suomala, 1981), the 1973Bergen symposium (Margetts, 1977), the 1982 Bergen symposium (Venema &Nakken, 1983), the 1987 Seattle symposium (Karp, 1990) and the 1995 Aberdeensymposium (Simmonds & MacLennan, 1996).
The imprecision of the former equipment and methodology is now replaced by thepossibility of performing absolute measurements of fish .abundance (Foote &Knudsen, 1994) and the method is now used for providing fishery-independentestimates of many economically important stocks around the world. Nowadays the

8 Chapter J
technique has reached a high degree of sophistication with the use of dual-beam(Ehrenberg, 1974) or split-beam (Carlson & Jackson, 1980; Foote et al., 1984)echo sounders which allow the length distribution of dispersed fish to be estimated.Moreover, automatic echo-classification permits the identification and characterisation of schools and layers (Rose & Leggett, 1988; Souid, 1988; and additionalreferences in section 4.8.3). The last important improvement is the use of omnidirectional multibeam sonar for counting the schools in a large range around theboat, with a concomitant estimation of their size and preliminary attempts at biomassestimation (Misund, 1993a; Gerlotto et al., 1994). Nevertheless, the acoustic method,like any other, still suffers from some limitations, mainly due to fish behaviour, andthe quantification of the bias still represents an important research field as observedduring the 1995 Aberdeen symposium.
1.3 Scope of the book
The brief histories of fish behaviour studies and stock assessment methods tell us thatthese two fields of science were developed relatively independently of each other.Former researchers in population dynamics had clearly identified the main problemsrelated to fish behaviour, but this was done mainly from a theoretical point of view.Most of the fish behavioural studies have been performed on the one hand by animalbehaviourists, working on a small scale with the aim of fundamental understanding ofbehaviour, and on the other hand by fishery technologists working in the field toimprove gear efficiency. Recently, fisheries biologists involved in direct methods ofstock assessment (mainly acoustic surveys and secondarily tagging experiments andaerial survey) have been experimenting in situ with the effect of fish behaviour on theaccuracy of their estimates. But research teams including both animal behaviouristsand fishery biologists remain scarce. The authors of this book are fisheries biologistsand partly self-taught in fish behaviour. Throughout this book we will try to bridgethe gap between these two fields of investigation and show how fish behaviourinteracts with the different stock assessment methods.
In most cases, fish behaviour introduces bias into assessment methods because it isnot fully taken into account. In indirect estimation of stock abundance throughpopulation dynamics, the central problem is the variation of catchability due todifferent fish behaviours. As far as direct estimations are concerned, and particularlyduring acoustic surveys or aerial survey, knowledge of fish behaviour is necessary atdifferent levels: vertical and horizontal avoidance, packing density, geographic distribution, etc. We will try to identify the biases, quantify them and present someavailable methods to limit them when possible.
Chapter 2 offers a brief review of the major pelagic fisheries of the world, subdivided into an analysis of the catches and a short description of the main gears usedto catch pelagic fish. Chapter 3 describes habitat selection and migration. We devoteChapter 4 to fish schooling, a major trait of pelagic fishes, including among othertopics the function of schooling, school organisation, and mixed species schools.Chapter 5 focuses on avoidance reactions, elicited either by sounds (vessel or gear) or

Introduction 9
by visual cues. Chapter 6, in contrast, discusses attraction, by light, bait or by floatingobjects in the case of the tunas (associative behaviour). Chapter 7 deals with learningprocesses and their effects on fish behaviour and fisheries. Chapter 8 is devoted to theeffects of fish behaviour on fisheries and stock assessment by population dynamicsmodels. Similarly, Chapter 9 briefly presents the acoustic assessment methods anddetails the influence of habitat selection, social behaviour, avoidance and learning onthese direct methods of stock assessment. Chapter 10 reviews the importance of fishbehaviour on other stock assessment methods: midwater trawl surveys, aerial surveys,egg surveys and capture-recapture from tagging experiments.
We limit the scope of this book to marine pelagic species, including both smal1coastal species (herring, sardine, anchovies, mackerels, horse mackerels, etc.) andvarious oceanic species (mainly tunas). Demersal fishes (especial1y gadoids) wil1 beconsidered only during their pelagic stage when they can be investigated with theusual tools applied to pelagic species. Examples from temperate and tropical areas arepresented to illustrate the different problems and make use of the comparativeapproach.

Chapter 2Pelagic Fisheries
The following remarks on world fisheries are based on the catch statistics provided inthe FAO yearbook, Fishery Statistics, Catches and Landings (FAO, 1997), and arelimited to the period 1985-1994.
The total world catch of aquatic organisms, including marine and freshwater fishes,crustaceans and molluscs, exceeded 100 million tonnes in 1993, and climbed to about110 million tonnes in 1994. This is a rise in catches of aquatic organisms of about 10million tonnes since 1988. The increase in catches of marine organisms in the period1988-1994 was about 4.7 million tonnes, and that of freshwater organisms in the sameperiod was about 5.7 million tonnes.
2~1 World catch of small pelagic species
The total world catch of small pelagic, marine species such as anchovies, herrings,jacks, mackerels, mullets, sardines and sauries amounted to about 40 million tonnesor about 36 % of the total world catch in 1994.This is an increase in the catch of thesespecies ofabout 2 million tonnes since 1988. Here we present catch statistics of 14small pelagic species that have produced an annual average catch of more than 0.5million tonnes each during the decade between the mid 1980s and mid 1990s (Table2.1). For most of these species the annual catches varied by a factor of about twobetween the mid 1980s and mid 1990s, in the extreme case of anchoveta by a factor of12.
In terms of catch quantity, the most important of the small pelagic species betweenthe mid 1980s and mid 1990s is the anchoveta or the Peruvian anchovy (Engraulisringens). The catch of this species climbed enormously from about I million tonnes in1985to nearly 12million tonnes in 1994(Table 2.1). About 80% of the'catch is landedin Peru, making the country the second largest fishing nation in the world. The rest ofthe catches of Peruvian anchovy are landed in Chile. The south-eastern Pacific is alsothe habitat of other important small pelagic species such as the Chilean jack mackerel(Trachurus murphyl) and the South American pilchard (Sardinops sagaxy. The catchof the Chilean jack mackerel doubled from 2.1 million tonnes in 1985 to 4.2 milliontonnes in 1994, while the catch of South American pilchard declined from 6.5 milliontonnes to 1.8 million tonnes in the same period (Table 2.1). Since the mid 1990s about95% of the catch of Chilean jack mackerel has been landed in Chile, the rest in Peru.In the mid 1980s,about 25% of the catch was taken by distant water trawlers from the

Pelagic Fisheries II
Table 2.1 Total annual world catch (1985-1994) of the 14 most important small pelagic species (FAO,1997).
Species Latin name Total annual catch (thousand tonnes)
1985 1988 1990 1992 1994
Anchoveta Engraulis ringens 987 3613 3772 5488 11896Chilean jack mackerel Trachurus murphyi 2148 3245 3828 3371 4254Atlantic herring Clupea harengus 1450 1685 1535 1536 1886South American pilchard Sardinops sagax 6509 5383 4254 3043 1793Chub mackerel' Scomber japonicus 1742 1825 1328 958 1507Japanese pilchard Sardinops melanostictus 4773 5429 4732 2488 1294European pilchard Sardina pilchardus 926 1366 1549 1188 1208Capelin M allotus villosus 2216 1142 980 2114 884Scads Decapterus spp. 553 570 827 915 910Atlantic mackerel Scomber scombrus 597 709 660 783 857Gulf menhaden Brevortia patronus 884 639 520 433 768European anchovy Engraulis encrasicolus 599 859, 539 412 534Sardinellas spp. Sardinella spp. 671 602 608 733 814Japanese anchovy Engraulis japonicus 349 303 536 662 820
former USSR, but this activity stopped around 1990. The South American pilchardwas fished about equally by Chile and Peru in the middle of the 1980s,but in the 1990sthis species has been most available to Peruvian purse seiners which in ,1994 tookabout 90% of the catch.
The chub mackerel (Scomber japonicus) is caught in sub-tropical and tropicalregions worldwide, but most of the catch (70-80%) is taken by Japan, China andKorea in the north-west Pacific. The total catch of chub mackerel varied between 1.0and 1.8 million tonnes during the period from the mid 1980s to the mid 1990s. Thesecountries also have major fisheries of Japanese pilchard (Sardinops melanostictusi andJapanese anchovy (Engraulis japonicus) in the same region. The total catch of Japanese pilchard, which is fished mainly by Japan, declined from 4.7 million tonnes to 1.3million tonnes between the mid 1980s and mid 1990s (Table 2.1). On the other hand,the total catch ofJapanese anchovy increased from 0.35 million tonnes to 0.82 milliontonnes in the same period.
The Atlantic herring (Clupea harengus) has discrete stock units in the north-westernAtlantic ofTCanada and USA, off Iceland (Icelandic summer-spawning herring), offNorway (Norwegian spring-spawning herring), and several stock units in the NorthSea and around the British Isles (North Sea herring), in the Skagerrak (north ofDenmark), and in the Baltic. The catch of the different stock units fluctuated substantially, but the total landings of Atlantic herring were remarkably stable at around1.5 million tonnes between the mid 1980s and mid 1990s. The catch of this species isexpected to increase in the years to come since the stock of Norwegian springspawning herring has recovered from its collapse of the late I 960s, and the total quotafor this stock alone was 1.5 million tonnes in 1997. Between the mid 1980s and mid1990s the major catches of Atlantic herring were taken by Norway (0.2-0.5 milliontonnes), Canada (0.2-0.3 million tonnes), Denmark (0.1-0.2 million tonnes) and

12 Chapter 2
Sweden (0.1--0.2 million tonnes). Finland, Germany, Netherlands, Poland, Russia,and the UK each took annual catches up to around 0.1 million tonnes of Atlanticherring.
The Atlantic mackerel (Scomber scombrus) and the capelin (Mallotus villosus) arealso caught on both sides of the northern Atlantic; but the major fisheries for thesespecies are conducted in the north-eastern Atlantic. The total catch of Atlanticmackerel increased to 0.9 million tonnes between the mid 1980s and mid 1990s, andthe major fisheries are conducted by the UK, Norway and Ireland in the North Seaand west of the British Isles. The total catch of cape1in varied between 0.8 and 2.1million tonnes, and the major catches were taken by Norway and Russia on theBarents Sea stock, which spawns on the coast of northern Norway, by Iceland on theIcelandic stock, which spawns on the coast of southern Iceland, and by Canada on theNewfoundland stocks. Due to low stock levels, there were no quotas for capelin in theBarents Sea in 1988-1990, and from 1994 onwards.
The scads (Decapterus spp.) are caught mainly in eastern and south eastern Asia.The total annual catch increased from 0.6 million tonnes to 0.9 million tonnesbetween the mid 1980s and mid 1990s. The major catches of scads are landed byChina, the Philippines, and Indonesia.
The sardinellas (Sardinella spp.) are fished in tropical waters off Africa and Asia.The total annual catch remained remarkably stable between the mid 1980s and midI990s, varying only from 0.6 to 0.8 million tonnes. The main fisheries are off Senegal,ofTThailand and along the Philippines.
The Gulf menhaden (Brevortia patronus) is caught along the coast of the southernUSA in the Caribbean Gulf. Between the mid 1980sand mid 1990sthe annual catcheshave been rather stable, varying from 0.4--0.9 million tonnes.
The European pilchard (Sardina pilchardus) and European anchovy (Engraulisencrasicolus) are fished in coastal areas of the eastern Atlantic and in theMediterranean. Total catches of these species were rather stable between the mid1980s and mid 1990s. The total catch of European pilchard varied from 0.9 milliontonnes (1985, Table 2.1) up to 1.6 million tonnes (1990), while the total catch ofEuropean anchovy varied from 0.4 million tonnes (1992) to 0.9 million tonnes. Themajor fishery for European pilchard is along the coast of north-west Africa, whereabout 55% of the total catch is taken, mainly by Morocco and Spain. About 25% ofthe total catch is taken in the Mediterranean, and about 20% is taken in the southern North Sea, in the Bay of Biscay and along the Iberian Peninsula. The majorfishery for European anchovy is in the Mediterranean, where up to 90% of the totalcatch is taken. There is also an important fishery for this species ofTnorth-westernAfrica.
The fisheries for the 14species listed in Table 2.1 contribute nearly 75% of the totalworld catch of small pe1agic species. Other small pe1agic species that sustain important fisheries with annual catches between 0.1 and 0.9 million tonnes are given inTable 2.2. Also for these species there are substantial annual variations inthe catches,which in most cases varied by a factor of about two between the mid 1980s and mid1990s. In the extreme case, for the Arauchanian herring in Chile, the catches varied bya factor of 15 for that decade. However, there are also examples of species that have

Pelagic Fisheries 13
Table 2.2 Minimum - maximum total annual catch of small pelagic species that have given annual catchesof about 0.1-{).9 million metric tonnes during the last decade (1985-1994) (FAO, .1997).
Min - max totalSpecies Latin name Fishing area . catch (tonnes)
Pacific herring Clupea pallasii Northern Pacific, coast 184000-349000Goldstripe sardinella . Sardinella gibbosa South-east Asia, coast 108000-158 000Indian oil sardine Sardinella longiceps Southern Asia, coast 204000-338000Round sardinella Sardinella aurita Central Atlantic, coast 193000-438000California pilchard Sardinops caeruleus Central eastern Pacific coast 194000-509 000Southern African pilchard Sardinops ocellatus Southern Africa coast 88000-210000Atlantic menhaden Brevoortia tyrannus South-eastern USA, coast 256000-428000Bonga shad Ethmalosa fimbriata Central Africa, coast 100000-134000European sprat Spattus sprattus North Sea - Mediterranean 220000-581 000Arauchanian herring Strangomera bentincki Chile, coast 38000-583000Southern African anchovy Engraulis capensis Southern Africa, coast 167000-969000Pacific achoveta Cetengraulis mysteticus Central eastern Pacific, coast 72 000-254000Stolephorus anchovies Stolephorus spp. South-east Asia, coast 240000-281 000Pacific saury Cololabis saira North-western Pacific 227000-436000Mullets Mugilidae Worldwide, coast 169000-240000Atlantic horse mackerel Trachurus trachurus Eastern Atlantic - 216000-563000
MediterraneanJapanese jack mackerel Trachurusjaponicus North-western Pacific 122000-371000Cape horse mackerel Trachurus capensis Southern Africa 284 000-584000Jacks Caranx spp. Tropical waters 124000-193000Carangids Carangidae Tropical waters : 210000-294000Japanese amberjack _Ser~ola....quinqerJ!giata__Japan- --- 142000-166000
given a remarkably stable yield, such as the Stolephorus anchovies (Stolephorus spp.)and the Japanese amberjack (Seriola quinqueradiata) for which the annual catchesvaried by no more than 15%.
There are also fisheries on other small pelagic species which give annual catches inthe range from 10000 to 100000 tonnes, and that is of vital importance to specificregions. An example is the fishery of Bali sardinella (Sardinella lemuru) in Indonesiawhich yielded catches of 54000-145000 tonnes between the mid 1980s and mid1990s.
In many regions there are pelagic fisheries for species that are distributed in deepwaters, that aggregate in a limited season during spawning, or that are semi-pelagic.An example of an important pelagic fishery on a species in deep waters is that ofAlaska pollock (Theragra calcograma) which is distributed in deep waters over largeareas in the northern Pacific. West of the British Isles there is a large pelagic fishery ofblue whiting (Mieromesistius poutassou) that aggregates for spawning. In Nowegianfjords there is a purse seine fishery with an annual yield of about 50000 tonnes forsaithe (Pollachius virens) that is schooling pelagically. The sand lance (Ammodytidae)in the North Sea, which often takes refuge by burying in the sand, is fished by highopening bottom trawls when schooling close to bottom. The annual yield of thisspecies can be up to about I" million tonnes.

14 Chapter 2
2.2 World catch of large mackerel and tuna
The total world catch of large mackerel, tunas, bonitos and billfishes amounted toabout 4.5 million tonnes or about 4% of the total world catch in 1994 (FAO; 1997)(Note that statistics provided by the FAO are slightly lower than those provided byinternational bodies devoted to tuna management.). This figure is an increase in thecatch of these species of about 1.3 million tonnes since 1985. The total catch of the fishspecies in this category that have produced average annual catches exceeding 100000tonnes in the period 1985-1994 is given in Table 2.3. The ten species of large mackereland tunas listed in Table 2.3 contributed about 90% of the total world catch of tunas,bonitos and billfishes in 1994. Compared with the substantial variations in the annualcatches of small pelagic fishes considered in the preceding section, the annual catchesof tunas are much more stable. For example, the annual catches of narrow barredSpanish mackerel (Scomberomorus commersoni varied by at most 25000 tonnes or bya factor of 1.23 during this decade. The catches of skipjack tuna (Katsuwonus pelamis)increased by about 550000 tonnes or about 60% during the same decade.
Table 2.3 Total annual world catch (1985-1994) of the most important tuna species (FAO, 1997).
Species
Narrow barred Spanishmackerel
Japanese Spanishmackerel
Frigate and bullet tunas
KawakawaSkipjack tunaLongtail tunaAlbacoreYellowfin tunaBigeye tunaTuna-like fishes
Scomberomoruscommerson
Scomberomorusniphonius
Auxis thazard, Auxisrochei
Euthynnus a/finisKatsuwonus pe/a"""isThunnus tonggo/Thunnus a/a/ungaThunnus a/bacaresThunnus obesusScombridae
Total annual catch (tonnes)
1985 1988 1990 1992 1994
109000 134000 108000 113000 120000
121000 170000 247000 172000 2.28000
153000 183000 194000 224000 212000
141000 151000 144000 168000 179000914000 I 285000 I 306000 I 428000 I 463000912000 141000 166000 112000 101000190000 226000 231000 216000 194000724000 909000 1065 000 I 124000 I 075000242000 231000 274000 271000 293000178000 205000 241000 240000 251000
The narrow-barred Spanish mackerel is caught in the Indian Ocean and in Polynesia,and the largest catches are taken by Indonesia, the Philippines and India. TheJapanese Spanish mackerel (Scomberomorus niphoniusi is caught in the northernPacific by China, Korea and Japan. The Kawakawa (Euthynnus affinis) and longtailtuna iThunnus tonggol) are caught both in the Pacific and in the Indian Ocean, and thePhilippines, Thailand and Malaysia land the largest catches of these species. Frigatetuna (Auxis thazard), bullet tuna (Auxis rochei), skipjack tuna (Katsuwonus pe/amis),albacore tThunnus alalunga), yellowfin tuna (Thunnus albacares), and bigeye tunaiThunnus obesusi are caught in subtropical and tropical areas worldwide.
The annual catches ofskipjack and yellowfin tuna exceeded 1 million tonnes during

Pelagic Fisheries 15
most of the decade between the mid 1980s and mid I990s,and are about one order ofmagnitude larger than the annual catches of the other tuna species. About 70% of thetotal catch of skipjack tuna is taken in the Pacific, and the largest catches are landedabout equally by Indonesia, Japan, Korea, the Philippines and the USA (Plate I)(opposite page 20). Similarly, about 60% of the annual total world catch of yellowfintuna is taken in the Pacific, and the biggest catches are taken by Mexico, Indonesia,Japan, Korea, the Philippines and the USA. The catches of skipjack and yellowfintuna in the Indian Ocean amount to about 20% of the total world catch of thesespecies, and the Maldives, Spain and France take most of the catches of these speciesin the region. In the Atlantic fishery for skipjack and yellowfin tuna, France andSpain also take the biggest catches.
2.3 Fishing methods for pelagic species
The main fishing methods for catching small pelagic species are purse seining andmidwater trawling (von Brandt, 1984). Tunas are caught by purse seining, longliningand pole-and-line.
2.3.1 Purse seining
In principle, a purse seine is a large net that is set from the aft of a purse seiner in anapproximate circle to surround fish shoals. The top is kept floating by a line of floatsat the surface, and the lower part of the net sinks by the force ofa heavy leadline alongthe ground. The net will thus be stretched out as a circular wall surrounding the fishshoal (Fig. 2.1). The mesh size is so small that the net wall acts as an impenetrablefence preventing escape. When the purse seine has been set out and allowed to sink forsome minutes, so that it reaches deeper than the target fish shoals, it can be closed byhauling the purse line, so that the ground of the purse seine will be confined, andpulled to the surface. When this operation is finished itis impossible for fish shoals toescape if the net is not torn. However, flying fishes (Exocoetidae) can still jump overthe floatline.
The size of the purse seine depends on the behaviour of the fish to be captured andthe size of the vessel from which it is operated. For catching fast-swimming, deep fish
. shoals, purse seines must be long, deep, have a high hanging ratio and be heavilyleaded. Hanging ratio is the length of mounted net divided by length of stretched net.For catching slower-swimming, near-surface distributed fish shoals, purse seines canbe shorter, shallow, and have a low hanging ratio. The relationships between fishspecies, vessel size and purse seine characteristics are given in Table 2.4.
Modern purse seining is mostly dependent on detection and location of fish shoalsby hydroacoustic instruments (Misund, 1997). Hydroacoustic fisheries instrumentshave a transducer mounted to the hull under the vessel. The transducer transmitssequential sound pulses, at a frequency between 18kHz and 180kHz and at aduration of 3-·":50 milliseconds (ms), that propagate through the sea (MacLennan &Simmonds, 1992). The pulses are reflected by objects like fish that have acoustic

16 Chapter 2
Fig. 2.1 Schematic drawing of a purse seine operation when the net is set around a fish school and pursingis about to start.
properties different from the surrounding sea water. Air-filled cavities like swimbladders give strong reflections or echoes. A horse mackerel which has a swimbladderwill thus give a much stronger echo than an Atlantic mackerel which lacks a swimbladder. The sea bottom gives especially strong reflections. The transducer switchessequentially between transmission and reception mode, and echoes from fish or seabottom can thus be recorded in reception mode. The echoes are converted to electricsignals that are digitised, amplified and presented on a display in the wheelhouse.
Purse seiners are equipped with sonars that can train and tilt the transducer underthe hull so that the transmitted sound pulse searches through large volumes in the sea.To enhance the volume coverage, some sonars can transmit sound pulses omnidirectionally, others transmit multiple beams, and the most advanced can be set to
Table 2.4 Relationship between target fish species, approximate purse seine characteristics (length, depth,mesh size, hanging ratio, lead line weight, sinking speed) and vessel size.
Mesh Hanging Leadline Sinking ( VesselSpecies Length Depth size ratio weight speed size
(m) (m) . (mm) (kg/m) (rn/rnin) (m)
Anchoveta 600 80 15 0.20 5.0 45Capelin 600 160 22 0.45 7.0 15 60Herring 650 160 35 0.45 6.0 18 60Chilean jack mackerel 1000 200 35 0.40 7.0 18 60Atlantic mackerel 650 160 35 0.45 6.0 18 60Saithe 650 150 60 0.45 1.5 14 27Tuna 2000 200 150 0.25 1.5 . 70

Pelagic Fisheries 17
transmit in a single beam, a multi-beam or an omnidirectional mode. The detectioncapability is another important characteristic of fisheries sonars. In sea water, soundabsorption increases exponentially with sound frequency (MacLennan & Simmonds,1992). The detection range of fish shoals is therefore much longer for a low-frequency(18-34 kHz) than for a high-frequency (95-180 kHz) sonar. Many purse seiners havea low frequency sonar for detection of fish shoals at long range. However, theresolution of low-frequency sonars is usually rather limited because the width of thebeam of such sonars is usually about 10°. High-frequency sonars have beam widths ofabout 5°, and thus better resolution. Many purse seiners therefore have a highfrequency sonar for more detailed mapping of shoal size and fish behaviour inrelation to the vesseland the net. On the larger purse seiners (> 40 m) it is common tohave both a low- and a high-frequency sonar to optimise fish detection and to makepossible the detailed imaging of fish schools.
Purse seining is conducted on fish aggregated in dense shoals (Pitcher, 1983)or onfish occurring in distinct schools, in which the density is much higher than in shoals.Normally, purse seining on shoals takes place in darkness during night-time, whileschool fishing is limited to the daylight hours. In some fisheries, profitable purseseining is possible both when the fish are schooling during daytime and when they areshoaling at night. For example, this is usually the case during the winter fishery forcapelin on the coast of northern Norway, and on the spawning grounds of Norwegianspring-spawning herring on the coast of western Norway in winter. Other purse seinefisheries are profitable only when the fish are shoaling at night or when they are
~Iing during daytime. An example of the former is the large Chilean fishery forChilean jack mackerel, which normally is conducted when the fish occur in denseshoals near the surface at night (Hancock et al., 1995). Most of the purse seinefisheries for herring and mackerel in the North Sea in summertime are conductedwhen the fish are schooling during the daylight hours.
The fishing capacity of purse seiners is normally proportional to vessel size. In theChilean jack mackerel fishery where there is no limitation set by fishing quotas, thetotal annual catch of purse seiners was related to the hold capacity of the vesselthrough the equation:
total annual catch (tonnes) = 33.3 x hold capacity (m') + 18.2(Hancock et ai, 1995)
In the 1992 season, a purse seiner with a hold capacity of 1350m3 was able to landabout 65000 tonnes of Chilean jack mackerel!
In some regions, artificial light is used to attract fish at night-time (see section 6.1).When sufficient fish have aggregated near the light source, they are caught by purseseining (Ben-Yami, 1976). This technique is probably ofgreatest importance for purseseine fisheries in Asian countries where it is used offshore. The technique is alsocommon in the Mediterranean, the Black Sea, and in the Russian and African lakes.In other regions the technique is mostly used inshore, as during the sprat, herring andsaithe fisheries in the fjords of southern Norway.
Tuna purse seining is conducted by large vessels (mostly> 60 m) with large nets(Table 2.4) in tropical/subtropical regions in the Atlantic and Indian Ocean

18 Chapter 2
(Mozambique Channel, Seychelles), ofT Australia, and in the western and easternPacific. In the Atlantic and Indian Ocean, the tuna is caught by set made on freeswimming schools or by set made on fish associated with logs (floating objects ofnatural or artificial origin, mostly trees, branches, etc.). In the eastern Pacific, tunaare also caught by set made on dolphin herds with which the tuna is associated (Anon,1992). The dolphin herds are visible on the surface and rather easy to encircle by thefastgoing tuna seiners. Usually large tuna are present underneath the dolphins. Whenthe purse seine is closed around the encircled dolphins and tuna, an attempt is made torelease the dolphins by the backdown procedure. This causes the floatline of thedistant part of the purse seine to submerge so that the dolphins can swim and jumpover. However, dolphins frequently become entangled in the purse seine and drown.The tuna pursers operating in this region were therefore under pressure to change thefishing strategy or fishing operation to decrease the accidental killing of dolphins,which is now achieved. The total dolphin mortality decreased from more than 130000individuals in 1986 to 3274 in 1995 (Anon, 1992, 1997). The association behaviour oftuna is considered especially in Chapter 6.
2.3.2 Midwater trawling
Pelagic species are also caught in large quantities by midwater trawling (also calledpelagic trawling), both single boat and pair trawling. In the Atlantic fisheries, capelin,herring, horse mackerel, mackerel, sardines and sprat are caught by midwatertrawling, OfT Ireland there is a large pelagic trawl fishery for blue whiting, whichaggregate for spawning during winter and spring. In the northern Pacific, there is,alarge pelagic trawl fishery for Alaska pollock.
In principle, a pelagic trawl is a net bag towed after a single vessel (Fig. 2.2) orbetween two vessels operating together. The two boats pullthe trawl 'and open ithorizontally by travelling parallel but some distance apart (500-1000 m). A singleboat trawl is kept open by the lateral forces of two large trawl doors (5-15 rrr') in frontof the trawl. The doors are attached to the warps from the vessel, and the trawl.isconnected to the doors via a pair of two or more sweeps. The length of the' sweepsdepends on the vertical opening of the trawl, and is about 180 m for a 30 m high trawl.A pair of weights (50-2000 kg), attached to the lower wings, and the weight of thedoors pull the trawl downwards. The fishing depth ofthe trawl is adjusted by the warp
Fig. 2.2 .Schematic drawing of a midwater trawl operation.

Pelagic Fisheries 19
length, the towing speed and the vertical inclination of the doors. At a towing speed ofabout 6 ms! (3.5 knots), a warp length of about 500 m gives a fishing depth of about200 m for a trawl with 30 m vertical opening, 1000 kg weights and about 3300 kgweight of the doors (Valdemarsen & Misund, 1995). To open the trawl vertically,there is a pair of weights (50-2000 kg) attached to the lower wings of the trawl to giveit a downward pull. In most cases there are also floats or kites attached to the headlineto give the trawl an upward pull. On single boat pelagic trawls, designed to catchsmall pelagic fish such as capelin (about 15cm in length), there can be a pair of extradoors attached to the upper wings to give the trawl a proper opening. Such trawls aretowed at low speed (about 3 ms '), and the lateral pull of just two doors will be toolittle to give the trawl the intended opening. According to the size, the vertical openingof a pelagic trawl varies by about an order of magnitude, from about 15to 150m. Thehorizontal opening is usually about equal to the vertical, and the total opening ofpelagic trawls thus varies by about two orders of magnitude, from about 200 to20000m2
..
Pelagic trawls are constructed according to specific drawings denoting the meshsize, twine, tapering and panel depth. Normally, the trawls are constructed of two orfour panels that are Joined in the selvedge or laced together. The size of the trawl isgiven as the circumference of the trawl opening. This is calculated as the number ofmeshes in the trawl opening (minus the number of meshes in the selvedge) multipliedby the stretched mesh size. The mesh size of pelagic trawls can be up to tens of metresin the front part, but decreases gradually to a few centimetres in the bag. The meshesin the front part of the trawl must only herd the target fish into the centre of the trawlopening (nevertheless, if these meshes are too large the target fish can escape, and thecatching efficiency of the trawl decreases). In contrast, the meshes in the codend mustbe so small that it is physically impossible for the target fish to escape .:
Pelagic trawling is conducted mainly on fish occurring in large shoals, extendedaggregations and layers. The fish can be recorded by sonar or echo-sounder, and thetrawl opening is normally monitored by a cable-connected net sonde or a trawl sonar.These instruments provide information on. the opening of the trawl, and the presenceof fish inside or outside the trawl opening. There are also acoustic sensors to monitorthe door spread and the headline height and depth, and catch sensors that areactivated when there is catch in the codend.
2.3.3 Line fishing
Large tunas, marlins and swordfish are also caught on hooks on longlines or withpole-and-linefishing. Longlining is conducted by Japanese, Korean and Taiwanesevessels in tropical and subtropical regions worldwide, and in total about 400000tonnes of tuna are caught by longlining (Bjordal & Lekkeborg, 1996). Bigeye tuna arefished almost exclusively by longlines, but substantial catches of yellowfin tuna andalbacore are also taken.
Longlines for tuna are long ropes of synthetic fibres, with snoods of baited hooksattached up to 50 m apart (Bjordal & Lekkeborg, 1996). The snoods are often ofmonofilament and are attached to the mainline by a metal snap. To catch pelagic

20 Chapter 2
species, the longlines are set drifting in depths from the surface down to about 300 m.The pelagic longlines have marker buoys at each end, and are suspended by float andfloatlines at regular intervals.'
Pole-and-line is used to catch tuna shoaling near the surface. It is a traditionalfishery around the Maldives area, which is now also developed in the western PacificOcean by Japanese fleets and on both sides of the Atlantic Ocean mainly by theVenezuelan fleet and the Senegalese, Cote d'Ivoire and French fleets. The pole can beoperated manually or automatically. Attached to the pole there is a monofilamentline with a barbless, shiny hook at the end, baited with a small fish or mounted withcoloured filament forming a lure. Tuna that bite on the hook are immediately thrownonboard by swinging the hook. This can be a heavy job when catching large fishmanually, and in some cases two fishermen operate a common hook so that they areable to handle large fish. A pole-and-line operation starts when the vessel has beenmanoeuvred gently into a shoal of tuna near the surface. To attract and keep the tunanear to the boat, live baitfish is thrown in the water regularly. Water spray from hosesat the rail may also help to attract fish.
2.4 Summary
In this chapter we have considered the major pelagic fisheries and the main fishingmethods used to catch pelagic species. In particular we have focused on the annualvariations in catches, which for most pelagic species are quite substantial but oftenunstable. We have also briefly presented the different gears commonly used and thefleets. One of the characteristics of most of the commercial fleets is their highmobility, from one country to another, when the resource is much depleted. Forinstance, the small pelagic fleet of purse seiners moved from California to Peru afterthe Californian sardine fishery collapse, then from Peru to Chile and to South Africa(some of these changes are reported by Glantz and Thompson, 1981). Similarly alarge part of the purse seiner tuna fleet of the eastern Atlantic moved to the IndianOcean at the beginning of the 1980s. Similar movements were observed between theeastern and western Pacific at the same period, mainly in reaction to a series of strongEl Nifio events.
In the next five chapters we will consider the major behaviour patterns of pelagicspecies that may affect fisheries and fish stock assessment. We start by habitatselection which can be quite variable for pelagic species that often live in the free watermasses away from fixed landmarks.

(,,0" S I I J I I I I I I I I I ! I I I
zo0-xrw
~- ~'
-e - . . - . ...e -
·UI' \\(ltl" \\-i xr r l o.lO" ' : 160' 1:: l W " W I tflr w 14fT'W t;:tY \\ 1lJ)" v..· W " \ \'100t F."," le60" ~LUI~ Hr f
....., />l -~ ~~T~_ . /. ~ -rn- : -::----;~. . ..- . . : . .tl~~ffiflmo=' " -.. . .
. . .. ..~~~~/ JC~~~~~~~~~t--;----:-1::~~T~441~~I:---r---r---:-Y '.. . .'0' S
"" x IF I I I I I ::;p=.....", I 3i""P K I - I 15 <-"'Lt I I I ~j.1
Yellowfin
Species_ Bluefin
Albacore
_ Bigeye
_ Skipjack
I) Z (X_"fl.:.1l1'------'
lEq wlltJrlltl d, wancc l
Catches(in metric tons):
~OOOO - @10000 -
1 nlJO - r-
Plate 1 Average total catches of the tuna fisheries (purse-seine, pole-and-line. longline), 1989-1993.

Plate 2 Th ree-dimensional reco nstruc tio n o f a pelagic school of sardine (Sardina pilchardusi from imagesprovided by a mul ti-beam so nar opera ted in side -scan mode. Note the hete rogenei ty in pac king densi ty andthe irregu lar shape of the school (same cross sections of the schoo l by a co nve ntio nal sing le beam so narwould give a misleading image of two separated schoo ls).

Chapter 3Habitat Selection and Migration
3.1 Introduction
An animal's habitat is a complex of physical and biotic factors which determines ordescribes the place where the animal lives (Partridge, 1978). According to Fitzgeraldand Wootton (1986), the optimal habitat is a place where an animal can maximise itslifetime production of offspring. In this book, 'habitat selection' will be used in abroader sense and refers both to the choice ofa global environment favourable for thestock or at least the species and to a selection of a given micro-habitat at small timescale. Territoriality, which is irrelevant for most pelagic species in the wild, is excludedfrom our definition. Habitat selection is therefore an important behavioural functionfor adult fish especially in feeding, reaction to predator, agonistics, and sexual andparental behaviour (Huntingford, 1986). It has been also extensively studied in othervertebrates, particularly in birds (Rosenzweig, 1981, 1985).
For a number of economically important fishes, the selection of habitat varies withstages of the life history, because feeding and spawning often take place in differentareas. Additionally, in order to maximise their fitness (physiological or physicalfactors), many fishes change habitat according to a circadian or seasonal rhythmicity,and sometimes from year to year. This results in fish migrations within and amongareas (Harden Jones, 1968; McCleave et al., 1982; Dingle, 1996). Baker (1978)broadly defines migration as 'the act of moving from a spatial unit to another', andmentions that 'spatial unit' has no restrictive overtones, unlike the term 'habitat'.Nevertheless, Dingle (1996) notes that most migrations are related to a change inhabitat. In this book, migration, in the broad sense of the term (vertical and horizontal, short range and long range), refers to cyclical movement of a substantial partof the stock and is considered in this chapter with habitat selection.
Habitat selection and migration are of primary interest in stock assessment andmanagement because they are key factors in the identification of stock units inrelation to exploitation. It is necessary to know the distribution and time variability atdifferent scales (circadian, seasonal, interannual) of the part of the species' populationfor which assessment data are collected, in relation to the fisheries that exploit it. Thisinformation will help to know how many fisheries are exploiting a given stock andconversely how many stocks a given fishery is exploiting. Moreover, habitat selectionand migration govern the availability of the fish in both the horizontal and verticaldimension, and therefore the catch rates. The reasons for fluctuations in catch ratesare of economic interest for fishermen, while they present a scientific interest for

22 Chapter 3
fishery biologists who use them as abundance indices in stock assessment models.Without this information, and an understanding of how it might change withenvironmental factors, the adequacy of assessments and related management adviceis open to considerable doubt.
A naive observer of the marine environment could be surprised by the followingdiscussion on habitat selection because, in contrast with the demersal realm, thepelagic environment looks uniform. In fact, numerous abiotic (temperature, oxygen,salinity, transparency, light intensity, current speed) or biotic factors (presence ofconspecifics, prey or predators) characterise the pelagic environment. Fish are able todetect these characteristics and consequently react to their variation by horizontal orvertical displacement.
Habitat selection is presented here in three parts. First, the variation of habitatselection according to different time and space scales is reviewed, then the bioticfactors which can be potential habitat cues are listed, and finally abiotic factors areconsidered.
3.2 Habitat selection according to different time and space scales
Changes in habitat selection may occur at different times (instantaneous, circadian,tidal, lunar,· seasonal or interannual) and space .scales. After Tinbergen (1963),Noakes (1992) applies the general terms 'ultimate' and 'proximate' to refer to different factors influencing behaviour. Ultimate refers to the final, long-term, evolutionary consequences of behaviour (function). Proximate refers to the immediate,short-term, physiological mechanisms of behaviour (causation).· Instantaneoushabitat selection is related to proximate cues and is expected to occur on a smallspatial scale (micro habitat) and according to drastic changes in the environment.This is clearly the case of internal waves, which abruptly change the water masscharacteristics, or predator arrival. This instantaneous selection and its relationshipwith the environment is usually easy to observe and to quantify. In contrast, ultimaterelationships may be much more difficult to detect. For instance, two groups ofindividuals of the same species in the same population might differ in habitat selectionrelative to temperature.
If the survival of eggs and larvae is dependent on temperature for this species, therewill be a difference in the reproductive success of the two groups and one of them willbe favoured by natural selection. In this example, temperature is an ultimate factorthat determines reproductive success and will usually act on large scales of time andspace for pelagic species. In turn, once the selective,pressure has been effective inselecting a particular behaviour, this behaviour may last for centuries, even whenmajor change occurs in the environment. Carscadden et al. (1989) found that the onlystock of capelin (Ma//otus vil/osus) that was not an intertidal spawner was selectingareas of major deposition of gravel corresponding to ancestral beaches of theWisconsin glaciation period. An opposite situation, but also interpreted as a' behaviour-genetic case, is the discussion by Wyatt et al. (1986) of the unusual location ofspawning grounds for sardine (Sardina pi/chardus). The usual spawning grounds are

Habitat Selection and Migration 23
coastal for this species, but a deep spawning ground is observed in an area that wascoastal during the post-Pleistocene transgression. These two examples show thathabitat selection during spawning can be the result of remote ultimate factors.
Circadian habitat selection is related mostly to light intensity and therefore to preyor predator behaviour, and is usually linked to a physiological and behaviouralrhythm often in relation to the pineal organ (see Ali, 1992, for a review). A typicalexample of circadian habitat selection is the diel vertical migration of many fishspecies, which usually are found closer to the surface during the night than during theday during most of their life span (see Neilson & Perry, 1990, for review). Menhaden(Brevoortia patronus) move inshore and towards the surface at night, but are foundoffshore and close to the bottom during the day (Kemmerer, 1980). Most endogenousrhythms are synchronised by a natural cyclical phenomenon (such as light, temperature,tides); often termed 'zeitgeber' (Neilson & Perry, 1990). Inverted circadianvertical migration is sometimes observed, as in the case of the whitefish (Coregonuslavaretus), during the spawning season which is interpreted as the result of a selectivepressure aimed to increase encounter probability among mature specimens and toavoid cannibalism on the eggs (Eckmann, 1991).
Lunar and semi-lunar rhythms in behaviour (especially migration) have beenobserved in different species like eels and salmon (Leatherland et al., 1992), freshwater fish (Daget, 1954; Ghazai et al., 1991; Luecke & Wurtsbaugh, 1993). As far aswe know, there is little documentation on this point related to marine pelagic species,except some variation of catch rate according to the lunar phase (e.g. Park, 1978;Anthony & Fogarty, 1985;Thomas and Schulein, 1988; Freon et aI., 1993a) that willbe analysed in Chapter 8. Nevertheless, it is likely that during the night the depth ofthe fish concentration in the water column and the level of aggregation depend onlight intensity and therefore on the lunar phase.
Seasonal habitat selection is related to trophic and reproductive migrations andoccurs at medium or large scale according to the species. Most pelagic species (bothcoastal and offshore) perform such seasonal migrations related to reproduction,feeding or wintering (Harden Jones, 1968; McCleave et al., 1982; Cayre, 1990). Thegeneral triggering mechanism (zeitgeber) is usually thought to be the seasonal variation in daylength. Nevertheless, for most pelagic species, we do not clearly understand the key factors in the precise timing of migration and the mechanism ofsynchronisation between different schools belonging to the same group (cluster) ofschools.
There are many well-documented examples of seasonal migration in coastal speciesderived from fish tagging or fisheries data analysis. In the Gulf of California,Hammannetal. (1991) indicated that the catch per unit of effort (CPU E) of sardinetSardinops sagax caeruleus) was higher in autumn and that fish was pushed northward by the intrusion of tropical waters in the gulf during the spring. In northernChile,sardines (Sardinops sagax) and anchoveta (Engraulis ringens) perform seasonalmigration to the north from the cold season to the warm season. Nevertheless,thispattern of migration is altered by strong anomalies of sea surface temperature relatedto El Nifio events as shown by Yafiez et al. (1995). The life cycle of the Atlanticmenhaden (Brevoortia tyrannus) is well documented due to large scale tagging

24 Chapter 3
experiments. While the distribution of the young stage depends on salinity, large fishmigrate northward along the coast in spring and stratify by age and size duringsummer, the large and oldest fish proceeding farthest north. A southward migration isobserved in late autumn (Nicholson, 1978).
Hiramoto (l99i) proposed a subdivision of the Pacific population of the Japanesesardine tSardinops melanostictus) into two basic groups according to the amplitude ofseasonal migration (and to the age of first reproduction). The coastal group lives inbays and coastal waters and displays limited coastal migration range. In contrast, theoceanic group displays extended seasonal migration to spawning grounds by late fallor early winter. It is interesting to note that the sardines that grow more slowly remainin the bays for a longer period of time..In west Africa, adult gilt sardine (Sardinellaaurita) migrate according to the upwelling season. The bulk of the northwestern stockis found in Mauritania during summertime because the.trade winds are strong enoughto generate an upwelling all year long only in this area, whereas during wintertime thestock is spread between Guinea and Mauritania due to the geographical extension ofthe upwelling (Boely et al., 1982).
Finally, in South Africa the anchovy stock (Engraulis capensis) is distributed overthe whole western coast, from 28°S to 36° S, but there is a single main spawning arealocated on the Agulhas Bank, at the southernmost location. This spawning ground islocated upstream of the strong Benguela current, a shelf-edge jet which transportseggs and larvae over the whole area of distribution, and spawning occurs in earlysummer when the current speed is still high (Shelton & Hutchings, 1982; Nelson &Hutchings, 1983;Armstrong & Thomas, 1989; Boyd et al., 1992). In this last case, thehabitat selection is obviously related to an ultimate factor because the spawningground is not productive during the season of reproduction.
Such spatial and temporal changes in habitat selection are cyclical and thereforepredictable. We will see in Chapters 8 and 9 how to take them into account in stockassessment methods. In contrast the interannual changes in habitat selection, whichcan also be termed emigration in opposition to migration (Heape, 1931), are notcommon in pelagic fish. Unlike migration, emigration does not involve return to theoriginal habitat and is not cyclical. During drastic changes in population size,dramatic shifts in the distribution area of the stock may occur. Such changes mayaffect the annual migrations of pelagic fish stocks. A first example is the changes inmigration behaviour of the Atlanto...Scandian herring in the late 1960s.
Due to a severe overfishing, both on the recruits and the Atlanto-Scandian adultstock of herring, the population declined drastically during the 1960s (Dragesund etal., 1980). A stock which amounted to more than 10million tonnes in the 1950s, wastherefore reduced to only about 100 000 tonnes around 1970. Along with the declinein the stock size, the adult population changed the migration range and migrationroute during the feeding migrations in the Norwegian Sea.
Between World War I and 11 Iceland developed a substantial summer fishery onlarge herring that was feeding in the cold waters north ofIceland in summertime (Fig.3.1). By recapture of tagged herring, Fridriksson and Aasen (1950) proved that thisherring belonged to the same large stock as the herring that spawned on the west coastof Norway in winter. By use ofa naval sonar onboardRV G.O. Sars, Devoid (1953)

Habitat Selection and Migration 25
75'
wCl:::::lI-
~70'
I
~0z
65'
60'
Norwegian Sea
Baren!s Sea
30'20'10'0'10'20'
55' -t----.---,...~.L-__l._,r_---....:J~,.c::::~-._l_--___r_----.J30'
WEST LONGITUDE EAST
Fig. 3.1 Migration pattern of the Atlanto-Scandian herring iClupea harengusi during a period of highstock level (redrawn from Bakken, 1983).
noted that herring concentrated in large aggregations in the deep waters east ofIceland in late autumn, and migrated to the spawning grounds at the coast of westernNorway in December and January. This migration pattern with spawning at the coastof western Norway, feeding in summertime in the waters north of Iceland.: concentration east of Iceland in late autumn, and migration back to western Norway forspawning in early winter, was maintained when the stock was large throughout the1950s (Jakobsson, 1962, 1963; Devoid, 1963, 1969; 0stvedt, 1965; Jakobsson &0stvedt, 1996). As fishing mortality increased substantially throughout the 1960sthestock declined rapidly (Dragesund et al., 1980), and in 1965 a change occurred inmigration pattern (Jakobsson & 0stvedt, 1996). Following the usual pattern of thelast decades, the stock migrated out into the Norwegian Sea for feeding in the spring/early summer, but then theherring did not migrate across the East Icelandic currentto the usual feeding grounds north of Iceland. That year the East Icelandic current,which brings cold polar water to the areas east of Iceland, was stronger than usual.The temperature in the areas east of Iceland in May 1965 was about IQC lower thanaverage for the last decade. This was the beginning ora cold period in the waters eastand north of Iceland, and the herring did not enter these waters for feeding in" the

26 Chapter 3
summertime any more. Due to the heavy fishing mortality in the 1960s, the stock inthe late 1960s was only about 1% of the stock size in the 1950s.
In the middle of the 1960s, a subpopu1ation of Atlanto-Scandian herring wasidentified in the northern Norwegian Sea (Devold, 1968). This subpopu1ationspawned off northern Norway in winter and migrated to the Bjameya area forfeeding in summertime. In autumn 1966, the whole subpopu1ation migrated to theeast coast of Iceland and joined the rest of the stock (Jakobsson, 1968).
From about 1970 the herring was not observed to undertake the seasonal feedingmigrations in the Norwegian Sea in summertime, but confined its distribution area tothe coast of western Norway all year. As before, the herring spawned off westernNorway in winter, but limited the feeding migration to the waters off north-westernNorway, and entered fjords in north-western or northern Norway in autumn forhibernating (Rattingen, 1990). One component of the population overwinteredin theNordmere fjords, another in the Lofoten fjords. The population was now namedNorwegian spring spawning herring because its distribution area was totally confinedto Norwegian waters. When the population recovered during the late 1980sand early1990s, the herring made more extended feeding migrations in the Norwegian Sea insummertime. In autumn, the herring migrated to the coast of northern Norway foroverwintering, and from 1988 the whole population has concentrated in the Ofoten/Tysfjord area from October to January (Rettingen, 1992).
In 1996 the stock of Norwegian spring spawning herring again reached a level ofabout 10 million tonnes (Anon., 1996), and in May 1996 the component of the stockfeeding in the Norwegian Sea was estimated by conventional echo integration (Chapter9) to be about 8 million tonnes or about 50billion individuals (Misund et al., 1997).Theherring was then distributed over large areas in the Norwegian Sea. However, thewestward migration still seemed limited by the East Icelandic current, as before thestock collapse in the 1960s,the westward migration seemed limited by the 2aC isotherm(Jakobsson & 0stvedt, 1996;Misund et al., 1997).The stock is expected to grow in theyears to come (Anon., 1996), and a shift in the migration pattern and overwinteringarea may occur in the near future, especially if the temperature in the waters influencedby the East Icelandic current increases in early summer:
Other examples of interannual variation of habitat selection are:
• The shift in summer distribution of the adult herring of the North Sea in the 1980s,related to the previous example (Corten & van de Kamp, 1992)
• The dramatic change in both timing and route of the western mackerel (Scombrusscombrus) during its return southerly migration to Scotland and Ireland (Walsh &Martin, 1986; Anon., 1988)
• The excursion of capelin (Mallotus villosus) outside their normal range despite alow level of exploitation (Frank et al., 1996)
• .The large-scale changes in the distribution of the northern cod stock(s) (DeYoung& Rose, 1993; Hutchings & Myers, 1994; and other references in section 8.3.1related to the shrinkage ofthe stock distribution)
• The decline of the sardine (Sardina pilchardus) production in the central fishery ofMorocco related to a possible change in the migration pattern (Anon., 1996)

Habitat Selection and Migration 27
• The recent confinement of most of the northern Benguela pilchard stock to theAngolan area (Boyer et al., 1995)
• The modifications of the horizontal and vertical distribution of the north-eastArtic cod (Nakken & Michalsen, 1996)
• The changes in the distribution pattern of the blue whiting (Micromesistius poutassou) spawning stock in the north-east Atlantic (Monstad, 1990), etc.
In all these examples the influence of abiotic factors and/or biomass changes (relatedor not to exploitation) is mentioned. Seasonal migration seems regulated by theenvironment (e.g. Castonguay et al., 1992; McCleave et al., 1984; Walsh et al., 1995)and possibly interannual variations in migration patterns are due to internannualchanges in the abiotic factors. Nevertheless, another interpretation could be thatmigratory and sedentary.populations are genetically distinct and that intensive fishingon the migratory fraction would select sedentary fish (Anon., 1996), a hypothesis thatmerits further investigations (see also section 7.3 on learning).
Let us see now in detail how biotic and abiotic factors can influence habitatselection at different time and space scales.
3.3 Influence of abiotic (physical) factors,. "}
Despite an abundant literature describing the water mass characteristics where different pelagic species live, or their tolerance under artificial conditions, it is not easy todefine their precise preferendum (in the sense of active search for a specific watermass). Habitat selection is often the outcome of balanced conflicts between differentdeterminants such as hereditary factors, learning, predation and optimal feeding.Also, the range of preferred experimental conditions changes according to the physiological state (hunger, reproductive stage, condition, etc.), age, season or previousacclimation, and is sometimes found outside the ecological range (Wootton, 1990).Moreover, in some instances, such as the temperature preferendum, the fish mightreact more to the.gradient than to the absolute value of the parameter. This gradientcan be spatial (e.g. Sharp & Dizon, 1978; Magnuson et al., 1980, including discussionpp. 381-2; Cayre, 1990; Cayre & Mar-sac, 1993), or both temporal and spatial(Mendelssohn & Roy, 1986; Stretta, i991).
As far as tuna species are concerned, Petit (1991) proposed a general hypothesis ofopportunistic attraction of tunas by any kind ofanomaly detectable by the perceptionorgans of these animals: thermal structures but also structures related to oxygen orsalinity, floating objects and bathymetric structures (shelf break, canyons, seamounts,islands). This hypothesis is difficult to validate at the moment, due to our poorknowledge of tuna physiology. .
Finally, the different factors (biotic and abiotic) that characterise the habitat areoften linked in such a way that it might be difficult to identify the key factor. Forinstance, in the coastal upwelling areas, a common habitat of pelagic species, it is wellknown that wind stress is responsible for raising cold and nutrient-rich water to thesurface, resulting in high phytoplankton production. This makes it difficult to

28 Chapter 3
distinguish between the effects of temperature and plankton abundance. Moreover, itis obvious that in most cases there is not a single key factor, but a combination offactors which interact or impose a trade-off between conflicting demands.
3.3.1 Temperature
While most fishes are ectotherms, they are nevertheless able to thermoregulate byselecting appropriate water temperatures and avoiding those which are harmful.Reports of in situ mortality due only to low temperature are exceptional in pelagicfishes - in contrast to the less mobile demersal fish - and examples of such mortalityof pelagic fish occur inside bays where circulation is limited. For instance, Esconomidis and Vogiatzis (1992) reported mass mortality of Sardinella aurita in Thessaloniki Bay (Greece) during an abrupt temperature fall in February 1991. Mortalitydue to high temperature is seldom observed and is always difficult to distinguish fromthe effect of the related decrease in dissolved oxygen (see section 3.3.3).
Populations of the same species inhabiting different thermal environments oftenexhibit differences in thermal physiology and behaviour, which presumably have agenetic basis{Reynolds & Casterlin, 1980). This seems also to be the case for mosttuna species, despite their physiological thermoregulation (Sharp & Dizon, 1978).Nevertheless, the distribution of the southern bluefin, Thunnus maccoyii, is intriguing(Caton, 1991). This species exhibits a large tolerance to temperature variation,allowing large-scale migration from sub-tropical areas (south of Java) where reproduction occurs to circumpolar (l1-l3°C) areas south of 300S. In contrast, thenorthern bluefin populations (Thunnus thynnus) of the Pacific Ocean and AtlanticOcean display a narrower range of habitat temperature (Table 3.1).
A precise knowledge of habitat is of primary interest for tuna fisheries becausetunas have an extremely wide distribution in the open oceans and perform rapidhorizontal and vertical migrations; they are therefore difficult to locate. Studies in thisfield are now advanced, and temperature. was identified early on as a key factor(Laevastu & Rosa, 1963). More recent studies show that even with a wide water
Table 3.1 Compilation of information relative to the effect of sea water temperature on the main commercial species of tuna: minimum lethal temperature, average temperature in the distribution area andtemperature in areas of highest catches according to the gear.
Min. lethal Average Highest catches/gear ("C)Species temperature distribution Surface Deep longline
("C) (0C)
Yellowfin 14 18-31 24-30 19-22Skipjack 15 17-30 20-29 nilBigeye 7 11-28 23-28 17-22Albacore 9 ·11-25 16-19 . 17-21Bluefin 5 10-28 ·17-20' 13-15
23-26b
• Temperatre areasb Tropical and Mediterranean areas

Habitat Selection and Migration 29
temperature range where fish are distributed, there is a narrower range of optimalcatches. From a review of the available literature (Grandperrin, 1975; Sund et al.,1981; Collette and Nauen, 1983; Stretta and Petit, 1989; Holland et al., 1990) weobtained the values presented in Table 3.1.
Table 3.1 distinguishes between surface fisheries (pole-and-line, purse seiners,trollers, surface longlines) and the deeper long-line fishery. Fish caught by surfacegears are generally smaller than those caught by long-line, suggesting a lengthdependent tolerance to cold temperature. This length-dependence relationship seemsgeneral in fish and can be interpreted as an influence of the ratio body-surface: bodylength on the rate of caloric exchange with the water, or by the ratio gill surface: bodyweight (see next section).
Most pelagic species are able to detect temperature variations as small as 0;I°C(Sund et al., 1981) or less (Murray, 1971;Hoar & Randall, 1979),which allows themto orientate toward areas favourable to their metabolism, or more often to detectremote frontal areas where prey are usually more abundant. Comparisons betweensatellite images and the location of tuna catches confirm this fact (Fiedler & Bernard,1987; Stretta, 1988). As far as small pelagic species are concerned, the combination ofacoustic surveys and oceanographic observations indicated that often a higher concentration and patchiness in the distribution is found where frontal gradients arestrongest, as in the case of the horse mackerel Trachurus trachurus capensis on theedge of the Agulhas Bank (Barange, 1994). Experimental observations on thermalpreferendum or resistance of fish indicate the influence of thermal history and suggestthat the response to temperature changes according to the season (e.g. Olla et al.,1985).
The thermoc1ine (which can be simply defined as a· horizontal plane where thevertical gradient of temperature is at a maximum) often limits the vertical migrationof surface pelagic species. For instance, young yellowfin tuna (Thunnus albacares)often stay above the thermoc1ine, which explains a change of their availability topurse seining. The catch rate is on average greater when the thermocline is shallow(Fig. 3.2) and presents a sharp gradient (Green, 1967; Sharp, 1978a; GonzalezRamos, 1989). A physiological interpretation of the fence role of such a sharpgradient is provided by Brill (1997) who observed in tank a drastic decrease of thecardiac rhythm when the temperature decrease reached 100e. This low cardiacrhythm certainly decreases the oxygen input. .
Nevertheless, recent acoustic tagging experiments have shown that the thermoclineis not an absolute fence. Fish can make short and repeated incursions below it (Carey& Robinson, 1981; Levenez, 1982; Holland et aI., 1990), or remain within the area ofmaximum gradient of temperature (Cayre & Marsac, 1993). This behaviour has been.related to the mechanism of thermoregulation of tunas (Sharp & Dizon, 1978;Cayre,1985; Carey, 1992), but as far as young yellowfin (Thunnus albacares) and skipjacktuna (Katsuwonus pelamis) are concerned, the short duration of the stay was attributed to the low level of dissolved oxygen usually observed below the thermoc1ine.Nevertheless, recent observations of such incursions have also been performed inareas where the gradients of temperature and oxygen around the thermoc1ine werevery low (Cayre & Chabanne, 1986). In the case of coastal pelagic species the vertical

30 Chapter 3
Y=0.0105 A=37X2 -2.345 r=0.863X + 139.88
...
110
lOO
90
80
70
60
50
40
30
20
10
O+---.----.-.-.----.---,-,......--,a----.-,--'---,---+---,o 10 20 30 40 50 60 70 80 90 100 110 120 130
-oIIICIl.c:oellU
Depth of the thermocline (m)
Fig. 3.2 Relationships between catches of skipjack tuna (Katsuwonus pe/am is) and the depth of thetherrnoc1ine in Gran Canaria (Canary Islands) in 1982 (redrawn from Gonzalez-Ramos, 1989).
distribution of schools is difficult to interpret because it is difficult to distinguishbetween the effects of depth, temperature and distance to the bottom. Neverthelesssome convincing examples are available, as for instance in the east coast of SouthAfrica where the thermocline follows an oblique angle to the surface (Fig. 3.3, afterArmstrong et al., 1991).
Nonparametric regression methods, as the generalised additive models, can be usedto distinguish the roles of different environmental factors, including the thermocline,the temperature at a given depth, the bottom depth, etc. (Swartzman et al., 1994,1995). In the Bering Sea, walleye pollock (Theragra chalcogramma) vertical distribution is related to the thermoc1ine (Swartzman et al., 1994). In deep water, adultsremain below the thermocline when mid-water temperatures are below O°C, whileage-O pollockpredominate above it. The authors hypothesise that the thermoclineserves as an effective barrier in the summer, separating age-O pollock from potentiallycannibalistic adults, due to different location of the prey of each group (euphausiidsbelow the thermocline for adults and copepods in the upper water column for age-O).At the opposite end, O-group haddocks (Melanogrammus aeglefinus) are pelagic anddistributed predominantly at the thermocline on Georges Bank (Neilson & Perry,1990). The variability of results according to the species indicates that variousdetermining factors (temperature, prey, distance to the bottom, etc.) can be involvedin the process of habitat selection related to the thermocline, and therefore can affectthe catchability.
Habitat selection during spawning is important for stock assessment because thebulk of the catch is often made before or during the reproductive season, when fishare concentrated and/or more vulnerable to the gears. For instance, Carscadden et al..(1989) found mature capelin (Mallotus villosus) in the north-west Atlantic mainly on

Habitat Selection and Migration 31
Transect 22
Transect 25
. _------20·C
~- -<!- 1t'-7~ o'
~--. r." , ~:te'l,,;_--~?~~~~W .~~~_ - - - - .~~~~-,;r~-~..,~.. ~ "'f\l..~"'~"''''''''.''- .
Transect 30
------------ --- --- --- --- -----20 IOC
0
20
40
60
80
100
0
---- 20E
'-"40
..c+J
60Q.Q)
0 80
100
0
20
40
60
80
100
Offshore Inshore
-------± 10 nautical miles ------
Fig. 3.3 Echograms from s~le~ted transects during the June 1990 acoustic survey on the East' Coast ofSouth Africa, showing pelagic fish targets in relation to the vertical temperature structure (redrawn fromArmstrong et al., 1991).
grounds where the bottom temperature was within the 2--4°C range. From a review ofherring behaviour and spawning grounds in the Atlantic (Clupea harengus harengus)and in the Pacific (Clupea harengus pallasi), Haegele and Schweigert (l985) indicatedthat herring typically congregate near their spawning grounds for several weeks tomonths prior to spawning. While adults usually have a wide tolerance to temperature,the range of critical values is generally narrower for eggs and larvae, and may interactwith salinity (Alderdice & Hourston, 1985). This is one reason why most pelagicspecies spawn in particularspatio-temporal windows, with temporal changes for agiven species according to the latitude, as for instance in the case of different herringpopulations in the Atlantic and adjacent seas or in the Pacific Ocean (Haegele &Schweigert, 1985; Hay, 1985).
_Among the other numerous reasons explaining the link between temperature (ortemperature gradient) and spawning is a precise timing with optimal environmentalfactors, such as prey abundance, stability of the vertical column or low advection(Parrish et al., 1983; Bakun & Parrish, 1990). Recently some authors suggested that

32 Chapter 3
this link could be mainly due to an 'obstinate reproductive strategy' which consists ofsearching for the environmental conditions of their own birth for spawning (Cury,1994; Baras, 1996). This hypothesis is based on the generalisation of the natal homingbehaviour, which is well documented in birds, sea turtles and salmon. These animalsare known to be imprinted by environmental conditions a few hours or days afterbirth, and are able to come back to their native area for spawning, althoughimprinting and learning of smolts salmon during their seaward migration also playsan important role (Quinn et al., 1989; Hansen & Jonsson, 1994).The possibility thatnatal homing in fish could greatly exceed the case of salmonids was first proposed byBlaxter and Holliday (1963) and then by Sharp (l978a). Later Hourston (1982)noticed that Canadian herring return to the spawning ground where they spawned forthe first time in their life, and therefore possibly where they were born. The implication of imprinting on stock unity will be discussed in section 8.7.2.
The originality of the generalisation of the obstinate reproductive strategyhypothesis to pelagic species involves considering that these fishes are able to triggertheir spawning from year to year in different spatio-temporal strata, taking intoaccount only physical characteristics of the watermass (e.g. temperature). This promising hypothesis needs to be confirmed by experimental and in situ observations,and does not necessarily apply to all species (for instance Motos et al., 1996 foundthat I-year-old anchovy (Engraulis encrasicolus) do not share the same spawninggrounds with older anchovy, which is difficult to conciliate with this theory). Interestingly, some simulations suggest that the obstinate strategy could be more efficientthan the opportunistic strategy for avoiding population extinction (Le Page & Cury,1996).
3.3.2 Salinity
Most of the main commercial stocks of marine pelagic fish develop their whole lifehistory in sea water where the salinity is generally over 32 psu. Nevertheless, there areremarkable exceptions in coastal pelagic fish. The menhaden (Brevoortia tyrannus)stocks, found along the south-east coast of the USA and secondarily in the Gulf ofMexico, spawn at sea but the juveniles migrate actively to brackish waters in the'sounds' areas after an oceanic phase of 1.5 to 2 months, and stay there for severalmonths before coming back to the continental shelf (Nelson et al., 1977). Along theWest African shelf, Ethmalosafimbriata migrates far up rivers for spawning, in almostfreshwater bodies where the salinity is over 4 psu (Charles-Dominique, 1982). In boththese cases the adults are perfectly adapted to the high sea water salinity and canperform extensive migration (especially B. tyrannus), but their habitat selection isconditioned by the proximity of brackish waters. To a lesser extent, another Africanclupeoid, Sardinella maderensis, is related to coastal waters of lower salinity than asimilar species of sardine, S. aurita, despite a large overlap in the distribution of thosespecies (Boely, 1980a). At the opposite end, another species of gilt sardine (Sardinellamarquesensis) is very tolerant of salinity and is found in the range of 8.6 to 36.0 psu(Nakamura & Wilson, 1970),which indicates large variability of tolerance within thesame genus.

Habitat Selection and Migration 33
The influence of salinity on habitat selection during spawning might be complexbecause the survival of larvae sometimes results from an interaction between severalenvironmental variables (salinity, temperature, dissolved oxygen) and may alsodepend on the environmental past history of the larvae during hatching. Alderdiceand Hourston (1985) studied the Pacific herring (Clupea harengus pallasi) and indicated a complex interaction between salinity and temperature on hatching. Moreover,they mentioned that survival of eggs on substrate, related to respiratory activity,appeared to be influenced by transport and perfusion velocity of interstitial water inan egg mass. They concluded that these factors, especially temperature and salinity,have a commanding influence on the reproductive cycle and thereby the distributionof the species (ultimate factor).
Salinity influence also seems important in the habitat selection of anchovies(Engraulis encrasicolus) as suggested by echo-survey observation (Masse et al., 1995)and eggs collection (Motos et al., 1996). The distribution of this species in the Bay ofBiscay is related to the Gironde river plume (but also shelf edge fronts and oceaniceddies). From acoustic observations combined with commercial data on the mackerel, Walsh et al. (1995) studied the migration of the western mackerel (Scombrusscombrus) and supposed that its distribution was related to the salinity and thetemperature, despite the low range of variability in the area. In such cases it is alwaysdifficult to distinguish the role of salinity by itself from the role of associated factorscharacteristic of the water mass (plankton composition, turbidity, temperature, etc.)due to the colinearity in their variability as shown by Reid et al. (1997).
Salinity does not seem directly to influence the distribution and behaviour of themost common commercial species of tunas within the range of their usual habitat (32to 36 psu) (Blackburn, 1965; Dizon, 1977; Sund et al., 1981; Stretta, 1988; Stretta &Petit, 1989). The geographical distribution of catches in the skipjack tuna surfacefishery in the western Pacific is limited by the boundary of the 35 psu isohaline; this isnot interpreted as the result of the salinity itself, but as the indicator of a convergencearea (Donguy et al., 1978).
3.3.3 Dissolved oxygen
Oxygen in the aquatic environment is provided by phytoplanktonic photosynthesisand, in the upper layer, by exchanges with the atmosphere. A number of factors affectoxygen solubility (temperature, salinity, exchange with atmosphere, turbulence, etc.).Of major importance is the decline ofsolubility of oxygen in water with increasingtemperature (and salinity but not significantly as far as the marine environment isconcerned). In sea water (e.g. 35 psu) at 5cC the saturation is around 10 mg I-I andfalls to 6 mg I-I at 30cC. All these factors are responsible for a large variation ofoxygen in the ocean, both in the horizontal and vertical distribution and also in time,which contrasts with the relative stability of oxygen concentration in the atmosphere.The oxygen demand of fish varies mainly according to activity, temperature, bodysize and the availability of oxygen. Among pelagic species, the Scombridae have a.special status in that they are committed to continuous pelagic swimming becausethey cannot breathe by means other than by ram ventilation (except for Atlantic

34 Chapter 3
mackerel, Scomber scombrus), and consequently this continuous swimming increasestheir demand (Holeton, 1980; Holeton et al., 1982).
Fish are able to rely on glycolytic fermentation or so called 'anaerobic metabolism'to cover high short-term energy requirements such as burst swimming in response to apredator or to fishing gear. According to Brett (1979), for periods of about 20 s theymay expend energy at a rate about lOO times the basal rate. The maximum burst speedand the duration of the flight vary with temperature, and temperature is expected toinfluence the yield of trawl (Wardle, 1980; He, 1991; Smith & Page, 1996). Nevertheless, recent controlled experiments on acclimated Atlantic cod (Gadus morhua) andAmerican plaice (Hippoglossoides platessoides) did not support this view and suggestthermal compensatory responses (Winger et al., 1997).
Dizon (1977) found that the lethal value of-dissolved oxygen for skipjack tuna isaround 4 ppm (3 ml I-I), in contrast to yellowfin tuna and especially bigeye tuna(Thunnus obesus) which is more adapted to deeper habitat. Sharp (1978a) estimatedthe lower oxygen tolerances for the main commercial tuna species according to theirsize, from energetic budget equations. The results ranged from 0.5 mll- I for a 50 cmbigeye tuna to 2.89 mll- I for a 75 cm fork length skipjack tuna and were related to thehorizontal and vertical distribution of the species. Bushnell and Brill (1992) indicatedthat yellowfin tuna are sensitive (decreases of heart rate) to reduced oxygen valuesbetween 4.3 and 3.6 ml I-I, despite the fact that lethal concentrations are usuallyestimated at 2.1 mi r '. However, mortality of pelagic fish due to hypoxic conditions isseldom observed because pelagic species are quickly able to change their habitat and/or behaviour in response to low oxygen levels. For instance, in the· Gulf of Guinea,Cayre et al. (1988) indicated that dissolved oxygen in the upper layer (0-50 m) neverreached the threshold of tolerance mentioned above for yellowfin and bigeye tuna.Nevertheless, Cayre and Marsac (1993) observed that tagged juvenile yellowfin tunadid not exceed the maximum vertical gradient of oxygen concentration (oxycline) andproposed a tentative modelling of the habitat selection of this species according to thevertical profiles of temperature and oxygen. Similarly, the occurrence of yellowfinandskipjack tuna off the west coast of South Africa during December-March isrelated to the seasonal occurrence of oxygen-depleted water observed at the boundaryof the Agulhas current/return current system (Chapman, 1988).
The worldwide distribution of bigeye tuna catches (Fig. 2.1) indicates that thisspecies is mainly caught in areas of depleted oxygen in the deep layers, below 150 m(Hanamoto, 1975; Cayre, 1987; Fonteneau, 1997), as if this species was takingadvantage of its physiological capabilities for limiting competition with other tunaspecies. Nonetheless, bigeye tuna avoid the extremely low oxygen concentration« 0.1 ml I'") observed in the eastern Pacific (Fonteneau, 1997) and in the northernIndian Ocean (Bay of Bengal and Arabian Sea, Isshiki et al., 1997). As pointed out byKramer (1987), 'although traditionally left to physiologists, breathing is also fundamentally a behavioural process; an ethological perspective immediately revealsmany interesting problems from temporal organisation to motivation and sociality'.
There is a largevariability in the. avoidance reaction to low oxygen concentrations(Holeton, 1980), but a common behavioural response is an increase in general activityand movement towards the surface where higher oxygen concentrations are to be

Habitat Selection and Migration 35
expected. Nevertheless, the immediate increase in activity, which seems contradictoryto the expected reduction ofenergy expense, is difficult to interpret because it can alsoindicate attempted avoidance. Kramer (1987) distinguishes four categories of behavioural responses by fish to compensate for low oxygen availability:
(1) Changes in activity(2) Increased use ofair breathing (for species able to perform it)(3) Increased use of aquatic surface respiration on surface film(4) Vertical or horizontal habitat changes.
Some years demersal fish can colonise the pelagic ecosystem. In the summer of 1978,Peruvian hake (Merluccius gayiperuanus) became semi-pelagic and available to purseseiners, which caught 172 000 tonnes within two months. This change from ademersal habitat was related to changes in the oxygen and temperature distribution(Woznitza-Mendo & Espino, 1986).
For schooling fish the level of dissolved oxygen is more crucial especially for largeschools with a high packing density (Chapter 4). There is a depletion of oxygen insidedensely packed schools, especially in the rear part (Macfarland & Moss, 1967). Whenthese schools live in a confined area, as in the case of hibernating herring schools inNorwegian fjords, the level of oxygen may decrease throughout the water body in thelayer where the schools are living (Dommasnes et al., 1994). Feeding activity of theBaltic herring (Clupea harengus) is highest close to the bottom in the shallow area, butoccurs above the oxygen depleted bottom layer in the central basin of the Baltic(Koester, 1989). Off Peru, anchoveta (Engraulis ringens) schools change their maximal depth from 40 m in normal years to 20 m during El Nifio events where there is anoxygen depletion (Mathisen, 1989). In areas of extremely intense upwelling (Yemen,Peru), during some peak upwelling seasons massive mortality of pelagic fish has beenobserved, attributed to the lack of oxygen in upwelled water (A.Y. Bakhdar, pers.comm.).
The body length-dependence of fish vertical and horizontal distribution isinterpreted by Pauly (1981) as a combination of change in oxygen demand and gillsurface:body weight ratio. The author submits that, in fishes, it is primarily oxygen,rather than food supply, which limits anabolism and growth performance because thegillarea of fishes does not grow as fast as body weight (see also Longhurst &Pauly,1987). Since oxygen demand increases with increasing temperature due to proteindenaturation, large fish are less tolerant of high temperature than small ones andselect their habitat accordingly. We think that this hypothesis is interesting to explainvertical dependance of fish distribution, in addition to the influence of the ratio bodysurface:body length. It also provides a valuable insight into the length-dependentmigration distance (in addition to swimming performance) and to the lengthdependent date emigration from warm to cold waters reported in this chapter.Nevertheless Pauly's (1997a) interpretation of the horizontal migration of pelagicspecies between Senegal and Mauritania by this theory does not explain why there is asedentary fraction of the pelagic populations in Mauritania. The fraction of themigrating population and the timing of its migration to Senegal seems more related to

36 Chapter 3
the relaxation of the upwelling in Mauritania than to its intensity in Senegal (Freon,1986).
3.3.4 Water transparency
Except for a few strict phytoplankton feeders which filter only passively, most marinepelagicfish forage actively on prey with the help of vision (Guthrie & Muntz, 1993;sections 5.2.1 and 5.2.2). Aksnes and Giske (1993) derived and tested with experimental data a model for visual feeding by aquatic predators. It emphasised the predator's visual range according to its visual capability, surface light, watertransparency, and size and contrast of the prey. Visual range increases almost linearlywith increasing prey size and decreases non-linearly with increasing turbidity.Therefore water transparency is of primary importance in fish distribution (Nakamura, . 1969; Gonzalez-Ramos, 1989)~ However, as the topic has received littleattention, we can only speculate on the relationship between water transparency anddensity. Possibly also this relationship is difficult to investigate because it is expectedto be non-monotonic for particulate feeders, with a medium optimal value in watertransparent enough to allow vision, but relatively turbid due to planktonicproductivity.
Nevertheless, several coastal species are very tolerant to turbidity, like the Marquesan sardine (Sardinella marquesensisy which can be found either in white sandbeaches of clear water or in bays of very turbid water (Nakamura & Wilson, 1970). InWest Africa, S. maderensis is also observed in a wide range of turbidity, unlike S.aurita, which prefers clear water (Boely, 1980a, b).
Some species seem to select habitat of optimal turbidity at the first stage of theirontological development. Uotani et al. (1994) performed experimental studies on theresponse and behaviour ofpostlarval Japanese anchovy 'shirasu' tEngraulis japonicasto differences in turbidity, prey density, and salinity. In an experiment on variouscombinations of conditions, anchovy showed a strong positive reaction only to turbidity. More than 90% of postlarvae moved from the tank section without turbidityto the section of turbid water of 5-1 0 ppm, while more than 75% moved to the sectionof 20-30 ppm turbidity. At much higher turbidity in the range of 40-50 ppm, shirasuwere at first attracted into the turbid water, but soon escaped from it.
3.3.5 Light intensity
Clupeoids usually perform diel vertical migrations that seem mainly related to a lightintensity preferendum but may be initiated by changes in brightness (Blaxter &Hunter, 1982). These migrations are probably related to an optimal combination ofschooling ability, which depends largely on vision (section 4.8), decrease of predationrisk and feeding behaviour. According to Hunter and Nicholl (1985), the thresholdlight intensity for schooling in northern anchovy (Engraulis mordax) estimated on 50adults in the laboratory is 6 x 10-11 W cm-2 (2.6 x 10⁻⁴ meter candel). This was estimated to occur at a depth of 30 m on a starlit night and at 38 m during a full moon,when the chlorophyll concentration is 0.2 mg Chl-a m-3
. At 2.0 mg Chl-a m", the

Habitat Selection and Migration 37
threshold occurs at a depth of 8 m on a starlit night and at 20 m under full moon light.Sufficient light appears to exist at night within the upper 10 m for schooling to occurin most of the habitat of the anchovy.
In addition some species can use near-ultraviolet and polarisation vision toimprove detection of targets. Shashar et al. (1995) demonstrated that polarisationvision increased by up to 82% detection range for transparent targets. A similarimprovement is likely to exist for transparent organisms such as zooplankton, whosetissues depolarise light. Browman et al. (1994) tested the hypothesis that ultravioletphotoreception contributes to prey search in small juvenile rainbow trout (Oncorhynchus mykiss) and pumpkinseed sunfish (Lepomis gibbosus) while they are foragingon zooplankton, and they concluded that for both species,prey pursuit distances andangles were larger under full-spectrum illumination than under ultraviolet-absentillumina tion.
From a literature survey, James (1988) indicated that planktivores generally displaydiel feeding cycles, foraging either during the day or at twilight and by night. There isan agreement in the literature to classify Clupea harengus as a twilight forager despitethe fact that -like most of the Clupeoid with the exception of menhaden - this speciescan perform both filter-feeding at night when exploiting dense patches of food and
. particulate-feeding during the day (Batty et al., 1986). Data on the feeding periodicityof other c1upeidsare more conflicting, and probably result from the influence of otherenvironmental and biological factors, the opportunism of some species and fromsampling strategies.
Asa consequence of the above-mentioned effect of light intensity on the schoolingand feeding behaviour, the mean depth and the level of aggregation are expected tochange, not only according to sunlight, but also to the moonlight. Such changes havebeen observed during acoustic survey of pelagic fish (primarily Bonneville ciscoes,Prosopium gemmifer) inthree lakes of the USA. During the new moon, the fish wereat the depths of 10-20 m, while at full moon, they were much closer to the bottom(Luecke & Wurtsbaugh, 1993).
In the Cote d'Ivoire purse seine fishery of small pelagics, Marchal (1993) found aclear negative correlation between the catch per unit of effort (CPUE) of Sardinellamaderensis and an index of light intensity in situ (combining water transparency andsurface light intensity). His interpretation was that fish were closer to the surfacewhen light intensity in the water column was lower, and therefore more available forpurse seiners.
From ultrasonic tagging experiments, several studies (e.g. Cayre & Chabanne,1986; Holland et al., 1990; Cayre, 1991; Marsac et al., 1996) have confirmed thatyellowfin tuna, skipjack and bigeye tuna swim in shallower water during night-time.In addition, Marsac et al. (1996) suggested that yellowfin habitat selection is influenced by the lunar phase. The fish swim in shallower water during nights of full moon;this probably relates to their feeding behaviour, which depends on light intensity. Oneof the best documented fisheries affected by circadian migration, probably in relationto light intensity, is the long-line fishery of swordfish (Xiphias gladius). This species iscaught by deep long-line (200-400 m) during the day and by sub-surface long-line(0-50 m) during the night (Nakano & Bayliff (1992).

38 Chapter 3
Neilson and Perry (1990) reviewed a large number of works (including their own)on vertical migration in relation to light intensity, and particularly the hypothesis thatfish follow an isolume. They concluded that the role of light is questionable. Despitethe fact that light obviously plays an important role in mediating diel verticalmigrations, other factors might interact (predator avoidance, prey availability, depthof the thermocline, etc.).
3.3.6 Current, turbulence and upwelling
While temperature often sets limits on the geographical extent of species distribution,in the recent literature it appears to be less important than upwelling processes andlocations promoting retention of larvae in thisadvective system. Such a retention area- often located near the coast - minimises turbulent mixing of the water column(Parrish et al., 1981, 1983; Bakun & Parrish, 1991). Recent work on circulationindicates that retention can occur in certain areas even when a wind-driven upwellingis fully developed, due to special topographical features which favour double cells ofcirculation (Graham & Largier, 1997; Roy, 1998). Bakun (1996) defined the 'triad' ofprocesses suitable for coastal pelagic fish reproductive habitat: enrichment (upwelling, mixing etc.), concentration (water column stability, convergence, frontal formation) and retention of ichthyoplankton within (or drift towards) appropriatehabitat. In this triad, some factors are related to long-term habitat selection andothers to the short term. Among the latter, the current and turbulence play a majorrole, and optimal values of wind during the reproduction period are expected toprovide a suitable compromise for larval survival (Roy et al., 1992).
The current in an upwelling area is often relatively strong near the surface (around0.5 knot along shore) and can be higher in particular current systems such as theKuroshio current or the Agulhas current, which often exceed 2 knots (Watanabe etal., 1991; Boyd et al., 1992). Fish usually avoid this area, probably to limit loss ofenergy through swimming against the current so as to remain in the upwelling area.The mean offshore velocity of the mixed layer in the Peruvian upwelling system vadesfrom 0.09 to 0.3 knots according to the season (Bakun, 1985), and current speed alongthe coast in the Californian or Saharan upwellingsystem is estimated to be between0.2 and 0.5 knots (Jacques & Treguer, 1986). Despite the weakness of these speeds,they represent several km per day (I knot ~ 44 km day"). Moreover, high wind speed(over 15 m S-l) generates high turbulence in the upper layer, which is probablyuncomfortable for swimming but might be suitable for feeding up to a certain optimallevel of turbulence (Littaye-Mariette, 1990). Unfortunately, references on the influence of turbulence seem only available for larvae behaviour (Rothschild & Osborn1988; MacKenzie & Leggett 1991). This problem is difficult to investigate acousticallysince high turbulence generates bubbles which limit detection in the surface layer.
Despite these negative effects of strong currents or high turbulence on fish behaviour, weak currents are known to play an important role in fish orientation ortransport during migration (Harden Jones, 1968; McCleave et al., 1982; Dingle,1996). Blaxter and Hunter (1982) reported occasional passive transport of North Seaherring. From a long-range sonar survey, Revie et al. (1990) indicated that move-

Habitat Selection and Migration 39
ments of sprat (Sprattus sprattus) schools over a six-day period agreed well with thatexpected from alternating tidal currents, i.e. schools were passively transported by thewater mass. From scanning observations performed along the fishing grounds off thecoast of Japan, Inoue and Arimoto (1989) noticed that the route of many pelagicspecies (flying fish, spotted mackerel, salmon) corresponded with the water flow. InSouth Africa, when anchovy spawners, Engraulis capensis.. return to spawninggrounds upstream of the Benguela current, they make use of inshore currents insteadof swimming against the main current (Nelson & Hutchings, 1987). On the otherhand, Walsh et al. (1995) found that the direction of migration of western mackerel(Scombrus scombrus) was counter to the direction of flow along the line of the shelfedge. The mean residual speed of this current was 17.1 cm S-I in the core of the currentand the migration speed varied from 13~O to 25.9 cm s:'.
Fish avoid migration against a strong current, but can use a weak counter-currentto orientate during migration. The highest current speeds are observed in limitedcoastal areas where tidal movement of the water mass is amplified by the localtopography (shallow water, capes, estuaries etc.). Even though some demersal speciesare able to select these tidal currents for migration (Arnold et al., 1994), most pelagicspecies are simply transported if they are not able to compensate for the water flow.Nevertheless, in an extreme situation of strong tidal streams in the mouth of the Gulfof St Lawrence (Cabot Strait), where the current speed is up to 75 cm s', Castonguayand Gilbert (1995) observed by acoustics a large variation in densities of the Atlanticmackerel (Scomber scombrus) according to the tidal cycle. They suggested thatmackerel use selective tidal stream transport to enter the Gulf of St Lawrence,although they were not able to document the vertical migration through which suchtransport would occur.
Once the role ofcurrents in migration is admitted, the following questions arise:how do fish detect current without visual (optomotor) contact with the ground, andhow do they choose the appropriate current? These questions are still under debate,except for some species such as salmon and eels which are known to detect chemicalcues associated with water masses. According to Dingle (1996), fish using tidal streamtransport display what appear to be programmed vertical movements. It is likely thatfish also use the 'trial and error' process, which supposes that they have the ability toorient and navigate. Dingle (1996) reviewed the different mechanisms of orientationand navigation presently known or strongly suspected in animals (chemical, visualand physical cues, including among others sun or stellar orientation and magneticorientation). He concluded that, despite recent progress, these aspects -are poorlyknown and require further investigation.
A commonly advocated physical cue in fish migration is the temperature gradient.Satellite images of infrared channels have shown the complexity of spatial structuresof temperature distribution, especially in upwelling areas (front, eddies, filaments,etc.). Large-scale tuna movements have been modelled using daily sea surface temperature from satellite observation and artificial life techniques such as neural networks and genetic algorithm (Dagorn et al., in press). A rule-based model exploitingknowledge on relationships between tuna and thermal gradients failed to reproduceknown large-scale movements. In contrast individual based models using learning

40 Chapter 3
techniques and fine scale description of the oceanic environment (oceanic landscape)make it possible to mimic some large-scale movements of real fish in 15% of the cases.Other mechanisms of orientation are probably. used by tuna during migration(Hunter et al., 1986)but they have not been fully investigated (e.g. magnetic detectionin yellowfin tuna; 'Walker et al., 1982; Walker, 1984). Moreover, in some oceanicspecies like skipjack tuna and - to a certain extent - yellowfin tuna, it is not easy todistinguish opportunistic large-scale movement from regular seasonal migration(Hilborn & Sibert, 1986).
Tunas are also found in coastal upwelling areas, usually near the edge of thecontinental shelf where a thermal front is often observed between cold upwelledwaters and warm offshore waters (e.g. Dufour & Stretta, 1973). They are alsoobserved in the coastal domain near river plumes where haline fronts may be observed(Fiedler & Laurs, 1990). But in many instances they are located in specific offshoreareas related to the large oceanic circulation systems like the thermal front ofdivergence zones, convergence ,zones and thermal ridges (Dufour & Stretta, 1973;Stretta & Petit, 1989). Although all thermal domes are productive, the link with theconcentration of top predators is not obvious, as underlined by Marsac (1994) in theIndian Ocean, where the density of tuna catches along the lO° south latitude dome islower than that of the other areas of the fishery.
Stretta and Petit underlined also the presence of tuna in oligotrophic areas forunknown reasons except when their migration route crosses these areas. A firstpossible reason why tuna stay in oligotrophic areas was advanced by Voituriez andHerbland (1982). They demonstrated that in the tropical Atlantic, the higherphytoplankton production was observed during the warm season at the top of thenitracline which defined a two-layer production system (the upper one is nutrientlimited and the deeper one light limited), without major influence of the current.During the cold season, however, an upwelling takes place at the equator, bringingcold and nutrient-rich water to the surface. A second explanation is related to the hightuna catch rate in the western Pacific oligotrophic area ('warm pool'). Paradoxically,this area is one of the more productive for tuna fisheries targeting skipjack andyellowfin tuna (Fonteneau, 1997). This could be due to the combination of delays inthe food web and the horizontal transport by current of the zooplankton andplankton feeders (Lehodey et al., 1997).
3.3.7 Depth of the fish in the water.column
The vertical distribution of fish in the water column is obviously related to the lightintensity, which decreases dramatically according to depth (in transparent waters thelight intensity at 100m depth is only I% of the surface light) and can seriously limitthe vision and consequently the schooling capability (see section 4.8 for discussion).Nevertheless, we have seen that temperature also plays an important role in thevertical distribution. Moreover, pressure is certainly an important factor because itincreases rapidly with depth (the change in pressure is around one bar - nearly I kgcm-2 -per 10m depth interval) and so the volume of the swimbladder isgreatlyaffected by changes in depth. Some species have an open swimbladder (physosto-

Habitat Selection and Migration 41
mous) due to an anterior canal from the swim bladder to the oesophagus and aposterior canal from the swimbladder to the anus (Blaxter & Batty, 1990). They areable to release gas when coming up to the surface and cannot suffer damage due to gasexpansion. Some of these species, like salmonids, secrete gas when they are in deepwater to compensate for their decrease in buoyancy, but this process is slow (morethan one day to compensate for a descent from the surface to 20 m) or nonexistent inother species like.herring, Surprisingly, the value of acoustic target strength - whichdepends mainly on the swimbladder volume (Chapter 9) - does not vary as much asexpected according to depth (Reynisson, 1993), which suggests other mechanisms ofcompensation.
Blaxter and Batty (1984) suggest that herring replenish the swimbladder by swallowing air at the surface, even to such an extent that an above atmospheric pressure isbuilt up in the swimbladder (the big gulp hypothesis, Thorne & Thomas, 1990).However, opening of physoclist swimbladders of fish caught at shallow depths oftenindicates a substantial gas pressure in the swimbladder that is difficult to explain justby swallowing. In addition, Suuronen (1995, Suuronen et al. 1996b) did not find asignificant difference in the survival of herring in cages when the fish had or did nothave access to the surface. In wintertime this species is able to spend several monthsunder the ice cover without access to the surface.
Rapid changes of depth may damage the fish, make it vulnerable to loss of depthcontrol when rising to the surface, or force it to adopt a high-energy-consuming tiltangle when swimming to compensate for positive or negative buoyancy. For instance,overwintering Norwegian spring-spawning herring occupy deep water (50 to 400 m)in fjords and therefore are constantly negatively buoyant because they cannot refilltheir swimbladder. They compensate for their low buoyancy by constant swimming,which generates lift when the pectoral fins are used as spoilers, and they often adopt a'rise and glide' swimming strategy (Huse & ana, 1996).
Species having a closed swimbladder (physoclists) represent the majority ofgadoids. They have a rete mirabile which is an organ for secretionjresorbtion of gasfrom the blood to the closed swimbladder. However,the buoyancy-regulating processis slow, and physostomous fishes are not believed to be neutrally buoyant throughtheir often substantial die! vertical migrations (Blaxter & Tytler, 1978).Those pelagicfish species that are able to perform large vertical migrations (tunas and tuna-likespecies) have either no swimbladder or a small one. In the case of tunas, especiallyyellowfin and bigeye tuna, vertical migration seems not only related to temperatureand oxygen concentration, but also to periods of possible fly-glide behaviour aimed atsaving energy (Holland et al., 1990; Marsac et al., 1996).
3.3.8 Bottom depth and the nature of the sea bed
Many pe!agic species display a depth-dependent distribution (as illustrated by thefollowing examples) which must be taken into account by an appropriate stratification when estimating their abundance from fishing data or direct observation. On thePetite Cote of Senegal (South of Cap Vert) the two species of sardinella present adifferent depth-related distribution despite an overlapping of their distributions,

42 Chapter 3
Sardinella maderensis being more coastal than S. saurita /Boely et al., 1982). InNorthern Chile, the Spanish sardine (Sardinops sagax) is usually found in deeper·waters than the anchoveta (Engraulis ringens), which is located in coastal waters(Yaiiez et al., 1993).
In addition to such depth-dependent distribution, some species display a depthrelated length or age distribution. Usually younger fish are more coastal than adults.This is the case with both species of sardinella mentioned above, where young fish arefound over 5-25 m grounds and adults over grounds deeper than 25 m, but also ofother species from Senegal, such as horse mackerels (Caranx rhonchus, Trachurustrecae). Similarly, in South Africa the Agulhas bank horse mackerel (Trachurus trachurus capensis) are caught from 20 to 50 m depth when young and then progressivelyextend up to the shelf-break when adults (Barange, 1994; Kerstan, 1995). Similarexamples are provided by Stevens et al. (1984) on Trachurus declivis and by Priedeetat: (1995) on Scomber scombrus. Fishery management can benefit from this depthrelated length or age distribution by prohibiting fishing in nursery areas whenapplicable.:
The shelf-break is the favourite habitat ofmany 'semi-pelagic' species, at least whenadults. In addition to the Agulhas Bank horse mackerel, this is the case with thehorse-mackerel (Trachurustrecae) in the Gulf of Guinea - contrary to its more coastaldistribution in the Senegalese area (Boely & Freon, 1979)which suggests the influenceof some factor other than bottom depth (probably temperature). In the same way,tuna concentrations are also found around islands (Gonzalez- Ramos, 1992) andalong the shelf break (Stretta & Petit, 1991). In addition, tuna fishermen concentratetheir activity around seamounts which are known to attract tunas, as demonstratedby one Of the pioneer works on ultrasonic tagging performed by Yuen (1970) onskipjack tuna around the Kaula Bank (Hawaii). This fishing tactic was developed inthe central Pacific (Boehlert & Genin, 1987) and the eastern tropical Atlantic whereyoung yellowfin, skipjack and bigeye tuna are caught in similar proportion (Petit etal., 1989; Fonteneau, 1991). In the eastern tropical Atlantic, the mean total catch on30 sensed seamounts between 1980 and 1987 was 2835 t per year, that is 95 t perseamount and per year, with a record of 1158 t for a single seamount (Fonteneau,1991). More recently the Indian Ocean tuna fleet adopted the same tactic, but hereyellowfin (53%) and skipjack (42%) tunaare more abundant than bigeye tuna (5%)and this proportion of species is different from the catch composition of setsperformed on 'logs' (nearly any natural or artificial floating object above a fewcentimetres in size) (Hallier & Parajua, 1992a). The catches are performed mainly on asingle seamount located near the equator line along the 56th meridian line, which hasbeen exploited since 1984. The mean catch per year was 3800 t during the 1984-1990period. In all these situations it is suspected that the relief generates a higher production. Genin and Boehlert (1985) found structures like Taylor's cells over theMinami-kasuga seamount, in the northwest Pacific, associated with a higher concentration of chlorophyll and zooplankton in layers deeper than 80 m.
Some pelagic species select habitat according tothe nature of the sea bed, especiallythe demersal spawners. The different populations of Pacific herring (Clupea harenguspallasiy, Atlantic herring (Clupea harengus harengus) and capelin (Mallotus villosus)

Habitat Selection and Migration 43
select areas of major deposition of gravel, especially the intertidal-spawningpopulations, or shallow coastal areas covered with marine vegetation in the case ofshelf spawners (Haegele & Schweigert, 1985; Carscadden et al., 1989).
Pelagic fish may also relate their habitat to the depth of the sea bed, but theproximate reasons may not always be obvious. A striking feature is the distribution ofmost coastal pelagic species on the shelf platforms, even when the prey distribution ismuch wider. For instance, on both sides of the Atlantic (West Africa,South Africa,northern part of South America, North America), several acoustic or aerial surveysindicate that the limit of distribution of all pelagic species is the continental shelfbreak, even though this physical limit varies from 80 to 200 m depth according to thearea. Remote-sensing measurements of chlorophyll in West Africa indicated thatduring the upwelling season, the planktonic production often extended to a distancefrom the shore double that of the width of the shelf (Dupouy & Demarcq, 1987).
We have mentioned that in upwelling areas the continental shelf often providesretention areas which are necessary to reproduction success, but this does not explainthe adult distribution all year long. We can only speculate on the reasons for thishabitat selection, but it could be related to the daily vertical migration of these species,which are often observed on the bottom during the day, as mentioned by Boely et al.(1978) for the gilt sardine tSardinella aurita) in Senegal. Nieland (1982) found in thestomach of this species a large proportion of mud and sediments that had a nonnegligible energetic value. Moreover, the shelf may be used by. this species fororientation during their migrations (Harden Jones, 1968; Kim et al., 1993), ahypothesis that merits further exploration. Of course there are notable exceptions tothis distribution pattern over the continental shelf, especially off Peru and Chile,where most of the small pelagic species (except anchoveta) are abundant up to 160 kmfrom the coast although the continental shelf is often less than 30 km wide (Johannesson & Robles, 1977; Yafiez et al., 1993).
Another important feature of habitat selection related to the sea bed is the frequentassociation of pelagic species (both coastal and offshore) with sudden breaks in thebottom depth. For instance, coastal pelagic schools are often observed on the top ofsubmarine hills or big rocks, or conversely in escarpment areas of steep bottomgradients, submarine canyons and deepwater basins located close to shore. The latterexamples are reported by Mais (1977) from the analysis of 38 acoustic surveys on thenorthern anchovies (Engraulis rnordax) in the California current system. J.-P. Hallier(pers. comm.) reports that large yellowfin tuna are found above submarine canyonsand trenches ofT Mauritania. Recently a surprising example of site homing andfidelity to underwater reef has been discovered by multiple acoustic tagging experiments and video camera observations on two schooling gadoides species (Glass et al.,1992;Smith et al., 1993;Sarno et al., 1994).The studies were conducted in Loch Ewe,on the west coast of Scotland, on a 4471 m2 reef located at 400 m offshore. During thefirst experiment, six saithe (Pollachius virens), length 35 to 43 cm, were tagged andtracked simultaneously by a hydrophone array over I to 21 days according to theindividual. Each of the fish spent more than 68% of its time during the day on the reefwhile at night activity was restricted almost entirely to the reef (> 90%). Moreoverthe fish displayed movements to another smaller reef during the day. Underwater

44 Chapter 3
television indicated that the taggedfish comprised part of a large schooling group offish (Glass et al., 1992; Smith et al., 1993). During the second experiment, two saithe(results similar to the previous experiment) and two pollack (P. pollachius; 43 and 44cm) were tracked simultaneously for 170 h. Pollack covered less than 50% of the reef,did not go to the second reef and were swimming more slowly than saithe during theday (but at the same speed at night). A large scale quantification of this kind ofassociation between fish and bottom topography seems possible now with automaticclassification of the sea bed (Reid,· 1995). Most of the previous habitat selectionaccording to bottom structure seems directly or indirectly related to the increase incurrent velocity and turbulence created by this structure. These hydrodynamicchanges favour production and predation as mentioned earlier.
3.3.9 Floating objects
Many pelagic species (and some young stages of demersal species) are attracted byfloating objects, especially offshore. This behaviour could be classified in the broadcategory of habitat selection. Indeed some species of small fish can spend a large partof their .life under natural floating objects drifting offshore, but in many cases theseare demersal species which have found a substitute habitat (Hunter & Mitchell, 1967).In pelagic species, especially tunas and tuna-like species, floating objects do notrepresent a temporary habitat because fishes associated with the object remain farfrom it.(up to several miles). Even though the contact (visual or auditory) with theobject can occur during a certain number of days, those pelagic species might spendseveral weeks without contact with the object. Therefore we have developed thisspecific behaviour in section 6.3 on 'associative behaviour'.
3.4 Influence of biotic factors
Most pelagic species are social animals living in groups (shoals, schools; see section4.2 for distinction) and present a highly patchy distribution. Nevertheless, someinternal (not reviewed here) and external regulating factors must limit their concentration in a single place. The external factors are the abiotic and biotic factors.Among biotic factors, we will see that different life history stages prey upon differentspecies which do not necessarily have the same spatial distribution. Moreover, cannibalism of some species on their offspring is an additional reason for differentialdistribution of the different stages, either as the result of selective pressure (Foster et .al., 1988)or as the result of defensive behaviour of the offspring. Finally, we will seethat predators might influence habitat selection.
3.4.1 Conspecifics and the ideal free distribution
The density-dependent habitat selection (DDHS) theory was first developed byornithologists during the middle of the twentieth century. They observed differentialrelationships between change in local densities and changes in population abundance.

Habitat Selection and Migration 45
Later Fretwell and Lucas (1970) conceptualised the 'ideal free distribution' (lFD)which is a behavioural model explaining the DDHS. In the IFD theory and itsnumerous derivatives, individuals occupy initially habitats with the highest basic'suitability', 'profitability' or 'fitness', but as realised suitability of these habitatsdeclines due to increasing population density, other previously less suitable unoccupied habitats become equally attractive and are colonised. Criticisms of the IFD andcommon misconceptions are reviewed by Kennedy and Gray (1993) and Tregenza(1994), who insist that the original theory considers a situation in which food patchesconsist of continuously arriving resources. Since planktonic food is not evenly distributed, fish have to search for patches of plankton. Therefore Sutherland (1983)proposed a modified IFD model incorporating a level of interference between competitors. As a result the density in the best habitat is lower than expected from theoriginal IFD theory. Parker and Sutherland (1986) contemplated the situation wherecompetitors benefit from different capabilities, which logically leads to a segregationof the phenotypes according to the quality of the habitat. Other derivations of theIFD theory have been proposed and are reviewed by Gauthiez (1997). Bernstein et al.(1988) studied the case of limited food input and poor knowledge of the environmentby the competitors. Bernstein et al. (1991) focused on the cost of displacernents andthe spatial structure of the environment.
The above-mentioned works are mainly theoretical or do not apply to fish. Severalauthors apply the IFD approach to demersal fish populations, including facultativeschooling species, or at least discuss their results in the context of the IFD. In mostcases, the results indicate that the less favourable habitats are occupied only when thestock abundance overpasses a certain threshold (e.g. Myers & Stokes, 1989; Crecco &Overholtz, 1990; Rose & Leggett, 1991; Swain & Wade, 1993; Swain & Sinclair, 1994;Gauthiez, 1997). These results contrast with those of Swain and Morin (1996) on aless mobile and gregarious demersal species, the American plaice (Hippoglossoidesplatessoidesi.
Another approach, involving diffusion models, is traditionally used by fisheryscientists (see Mullen, 1989 for a review). Simple sets of equations are used, incorporating a 'diffusion coefficient' a2 and a mean velocity vector v to characterise themovements of entire populations. Usually a2 is assumed constant. Nevertheless,several scientists exploring tuna behaviour (e.g. Bayliff, 1984) reported that estimatesofa2 varied by one or two orders of magnitude for both yellowfin and skipjack tuna inthe eastern Pacific. These results are interpreted as the consequence of permanent rich :areas close to island and shallow banks. M ullen (1989) compared the results ofsimulation models where a2 is either constant or proportional to the local abundancedivided by the local carrying capacity of the ecosystem. As expected, models withvariable a2 simulated higher patchiness of fish distribution because these modelsallow fish to spend more time in good habitats. A more recent approach for modellingspatial heterogeneity due to fish behaviour is to use individual-based models (lBMs),which depict populations in which individuals follow specific rules of behaviouraccording to their environment (see review by Tyler & Rose, 1994).
MacCall (1990) extended the density-dependent habitat selection (DDHS) theoryfrom discrete habitats to an entire population, i.e. a pelagic fish population. He

46 Chapter 3
reviewed some examples of expansion and contraction of population range or differential utilisation of marginal habitat with changes in population abundance infishes, birds, insects, reptiles and mammals. The author developed a 'basin model'where habitat suitability is depicted graphically as increasing downward. Habitat istherefore described as a continuous geographic suitability topography having theappearance of an irregular basin (we will see in Chapter 8 how the populationresponds to climatic changes according to this model). The suitability of habitat isdefined by MacCall (1990) according to different biotic and abiotic factors whichfavour the individual and population growth. The underlying mechanisms of densitydependence rely on conventional population dynamics theory (cannibalism, starvation,· individual growth), but implicitly the theory supposes that somewhere in theprocess it is the individual fish's decision to move from one habitat to another and thetheory supposes that fish are able to detect gradients of suitability. The author doesnot try to explore this behavioural decision except on one occasion where a possiblehabitat selection according to detection of a food gradient is mentioned. He suecessfullyapplied his model to the northern anchovy (Engrau/is mordax) population ofthe west coast of North America and concludes that although the basin model'presents a grossly simplified and abstract view of population behaviour, the modelconveys a strong intuitive image which allows holistic grasp of an entire suite ofimportant considerations: abundance, distribution and geographic structure, movements and population growth'. Similar results of negative relationships betweenspawning biomass and spawning area have been observed in other stocks, as forinstance the anchovy population of the Bay of Biscay (Uriarte et aI., 1996).
Notwithstanding the interest of the basin global approach, it seems that the IFDtheory is not likely to be met in shoaling fish because individuals vary in their abilityto compete or forage on food located by others (Wolf, 1987; Milinski, 1988).Aquarium and tank experiments suggest .that in larger shoals fish find food faster,spend more time feeding despite predator threat because they are less timid and takeadvantage of vigilance from conspecifics, sample the habitat more effectively and areable to transfer information about feeding sites (Pitcher & Parrish, 1993). Pitcher(1997) proposed an alternative basin model for pelagic species in which the basin is'flat-bottomed' in opposition to the irregular shape of MacCall's basin (Fig. 3.4). Inthis flat basin, fitness of individuals changes only at the lip of the basin, due toabrupt changes in the environment. This concept was developed mainly to provethat the shrinkage of the population area, also named 'range collapse', can besimulated without environmental determinants, but only with shoaling behaviouralrules.
The two models produce contrasted spatial predictions of range collapse. InMacCall's basin, fish remain in specific areas corresponding to the best habitats, whilein Pitcher's basin, fish concentrations are randomly located (which is not a commonobservation). The model proposed by Pitcher (1997) looks like a simple IBM structured on shoals as proxy for individuals. This approach seems promising but shouldbenefit from the incorporation of more realistic spatial structures (variable size of theshoals, clusters) and deterministic hypotheses on school behaviour related to foraging, predation, reproduction and mutual attraction. Despite the pedagogical.interest

Habitat Selection and Migration 47
(0)
I 1I II II II II high 1 I II· II I low ~ i
(b)~t~-_\\_\----,,\IJ
Fig. 3.4 Conceptual basis of twoalternative 'range collapse' models.Vertical axis and profile of basins indicate relative habitat quality: deeperbasin is better habitat. Spatial range ofthe fish stock at high and low abundance are indicated by arrows. (a)MacCall's basin model structured onhabitat quality; (b) Pitcher's basinmodel (not structured) (redrawn fromPitcher, 1997)..
of the 'flat-bottom basin' hypothesis, we think that a combination of irregular basinand schooling behaviour would better reflect the real world situation.
At a microscale, pelagicfishes usually school according to body size (Chapter 4),and on some occasions according to sex. For instance, the capelin (Mallotus villosus)of the east coast of Canada segregate in schools according to sex during theirreproductive migration from offshore areas to coastal beaches in June and July.Males tend to school close to the beach and females congregate in schools in deeperwater. When the females are ready to spawn, they move towards the beach throughthe male schools. These females are the main target of an intensive fishery (purseseine, trap and beach seines) to supply a lucrative Japanese capelin roe market(Nakashima et al., 1989). Similarly the deep pelagic species named orange roughy(Hoplostethus atlanticusi presents a marked sex segregation and some evidence thatmales arrive on the spawning ground first (Pankhurst, 1988).
The role of pheromones in such habitat selection relative to conspecifics is likely,even though· it seems poorly documented in marine species (Stacey, 1987)contrary tocontinental fish species (Myrberg, 1980) or insects. There is evidence that insectsrespond to aggregation pheromones (e.g. Brossut et al., 1974; Rivault & Cloarec,1992).As far as we know such aggregation pheromones have not been investigated infish but could be a possible means ofenhancing encounter frequency of dispersed fishor small schools with larger schools. We have found some references on. sexualpheromones in pelagic species. From laboratory observation on captive Pacific herring(Clupea harengus pallasi), Stacey and Hourston (1982) suggested the existence of apheromone in herring milt because spawning behaviour is rapidly initiated in ripe(ovulated and spermiated) herring of either sex following exposure to herring milt or toa filtrate ofripe herring testes. Later Sherwood et al. (1991)confirmed the existence ofapheromone-like spawning substance by males of this herring species and characterisedits biochemical properties which are similar to those of polar steroids, prostaglandins,or their conjugated forms. A behavioural bioassay was successfully performed. Themilt and testicular extracts retained their bioactivity during purification. The role of amale pheromone maybe synchronisation of spawning in schools.

48 Chapter 3
3.4.2 Other species
In pelagic species the influence of the presence of other species (except prey orpredators) on habitat selection is not easy to interpret. Competition - defined byMayr (1970) as being related to two species looking simultaneously for a basic andrare environmental need (e.g. food, space, shelter) - is certainly an important aspect,but as noted by Mayr, during the evolutionary process the speciation is supposed tolargely limit the competition between species. If two species have exactly the sameneeds all through their life cycle they are not supposed to coexist ('competitiveexclusion principle'; Hardin, 1960). Nevertheless, competition between two speciescan take place during a limited number of stages. Moreover, following Brown andWilson (1956), Mayr suggested that strong competition is likely when two specieshave been in recent contact or when large environmental changes modify the previousdynamic of equilibrium between them. Despite the fact that such situations are likelyto occur in upwelling ecosystems, Mayr said he did not know any valid example ofcompetition or exclusion in planktivorous pelagic species. How species modify theirhabitat selection in the case of such competition is not well documented, nor is it clearwhether it is an individual behaviour or a population behaviour.
The influence ofcompetitors on the ideal free distribution (lFD) and its derivativesseems obvious but is not well documented. Different pelagic species often cohabit inthe same area where they form ecological communities. The interaction among species of the community is not well known as far as habitat selection is concerned. Only
.some studies onfreshwater fish in fluvarium are available. For instance, Allan (1986)shows that minnows (Phoxinus phoxinus) moved higher in the water and downstreamin the presence of dace (Leuciscus leuciscus). Gudgeon (Gobio gobio) moved lower inthe water and downstream in the presence of dace and of minnows. Rosenzweig(1981) stressed the importance of interspecific competition in the results of spatialmodelling. According to the characteristics of the habitat, interspecific competitionfavours certain species over the others. As a consequence of this, the density is higherin the richest habitat than expected from the conventional IFD models. On a smallerscale, mixed-species schools are often observed (section 4.9) and in this case the IFDtheory, and its limits, could apply if the two species are competing for the same prey.Similarly, inter-specific (and also intra-specific) competition for bait is reported forlong-lines, the dominant individuals frighten and chase away the others from thebaited hooks (review in Lekkeborg & Bjordal, 1992).
3.4.3 Prey
Let us first review the main types of prey in pelagic fish and the way they are detected.Most of the carangid species (Caranx spp., Trachurus spp.) are omnivorous whenadults, preying on large zooplankton items (including ichthyoplankton) and smallfishes (e.g. Brodeur, 1988). Most coastal clupeids are microphagous, preying onphytoplankton and/or zooplankton. From an extensive and critical review of theavailable literature, James (1988) stated that there are few true phytophagous fish inthis group, contrary to the common belief. Most are omnivorous microphages,

Habitat Selection and Migration 49
capable of particulate and filter feeding upon a wide range of particle sizes, butderiving the bulk of their energy from zooplankton. In northern anchovy (Engraulismordax) for instance, the filtering mechanism acts over a 0.05 to 1.50 mm range ofprey length, while selective particulate feeding occurs from 1.51 to 5.00 mm. Althoughphytoplankton is by number the main component of the stomach contents of thisspecies, zooplankton prey. are consistently the major source of carbon in the diet(Chiappa-Carrara & Gallardo-Cabello, 1993). Gibson and Ezzi (1992), who observedfeeding behaviour of herring (Clupea harengus), estimated that the energy cost offiltering may be from 1.4 to 4.6 times higher than that of biting on the same zooplankton prey. Tunas and mackerels are carnivorous and feed on a large variety ofitems, from crustaceans to fish but also cephalopods, having a wide size distribution(Brock, 1985; Olson & Boggs, 1986; Stretta, 1988; Roger, 1993; Buckley & Miller,1994). Despite a relationship between the maximum size of the prey and the fish size,large tunas still prey chiefly on small items (Roger, 1993). Large schooling semipelagic gadoids (cods, saithes, pollocks) are top predators that feed mainly on smallfish, crustaceans and invertebrates.
How fish locate and orientate to their prey is a key question to understandinghabitat selection. The range of vision in sea water is usually limited, especially forsmall prey. For instance, the visual field for prey detection of northern anchovy(Engraulis mordax) was estimated at 104 mm and the basal area of the vision cone at125cm2 otTthe west coast of Baja California (Chiappa-Carrara & Gallardo-Cabello,1993). Even in the favourable case of large oceanic predators preying on large prey inclear waters, the range of visual discrimination of two points 2.4 cm apart is around4.4 m due to the limited penetration of light in sea water (Tamura et al., 1972).Therefore, most pelagic fish detect their prey by vision at short range, even under lowlight condition (Guthrie & Muntz, 1993), while at large and medium range, chemicalsenses (smell 'and taste, two often overlapped senses) are recognised as the mainfactors (Atema,1980; Hara, 1993).
Atema (1980) distinguished three major situations as far as chemical stimuli distribution is concerned: nondirectional active space, gradient and trail (odour corridor). The nondirectional 'active space' is defined as any area where a chemicalstimulus is present above a threshold enabling its detection-but not the location of thestimuli source owing to a too small gradient. This small gradient is due to s~veralfactors: irregular direction in the movement of the releasing source, turbulence of theenvironment or intermittent release of chemical stimuli (e.g. faeces). In contrast thegradient and trail (especially polarised trail) are special cases of active spaces becausethey are directional and therefore make easier the detection of the emitting source(e.g. carcass in decomposition laying on the bottom).
Nondirectional active space seems more common than gradient and trail in thepelagic marine environment, especially in turbulent upwelling areas. Therefore it isbelieved that the exact location of the source in a large three-dimensional active spacecannot be determined from chemical cues alone but requires the use ofother senses, inparticular vision in the case of pelagic fishes. Olfactory stimulation appears to be apowerful means of alerting a fish to the presence of distant prey, exciting it and thenkeeping it motivated to pursue its search by vision. When tuna (little tuna, Euthynnus

50 Chapter 3
affinis, or yellowfin tuna, Thunnus albacares) detect chemical cues coming from preyextracts they react by increasing swimming speed, changing swimming pattern andhead thrusts. Interestingly the water collected from a liveprey school elicited predatorresponses (Magnuson, 1969; Atema, 1980; Atema et al., 1980). Amino acids are amajor component of tuna's prey odour image and the olfactory threshold of detectionis about 10-11 m.
Experimentation on captive fish of different species indicates that amino acids (e.g.betaine, glycine, alanine) and related compounds present in faeces, mucus or skinproducts elicit both neurophysiological and behavioural responses (review in Atema,1980). This capacity appears very early during the ontogeny. From experimentalstudies and a review of the available literature, Deving and Knutsen (1993) indicatethat marine fish larvae use chemotaxis and respond to the concentration of metabolites emanating from planktonic prey for searching for, finding and remainingwithin clusters of food organisms.
One of the functions of diel vertical migration observed for most pelagic fish is tofollow the vertical migration of their prey. In the eastern Bering Sea, O-group walleyepollock (Theragra chalcogramma) modify their diel migration pattern according toprey availability. When prey are abundant, the pollock either do not migrate vertically or delay their migration for several hours (Bailey, 1989). Data on the feedingperiodicity of coastal pelagic fish are scarce and conflicting, probably because mostspecies are opportunistic foragers having flexible feeding cycles according to localconditions (James, 1988). Nevertheless, particulate feeding is often associated withpeak feeding activity at dusk and dawn.
An interesting example of habitat selection related to prey is the recently investigated case of tuna concentrations found during summertime along the equator offCote d'Ivoire and Liberia, which is not claimed to be a productive area. According toMarchal and Lebourges (1996), in this area tunas are feeding on a Photichthyidaespecies of the DSL, Vinciguerria nimbaria, which is surprisingly observed in the upperlayer during daytime, providing excellent visual condition for tunas preying. At leastduring this period of the year, Vinciguerria nimbaria seems to have a reversedphototaxism for a reason not completely investigated but probably related tobreeding. This species is therefore available to tunas in the upper layer during daytime, when the tunas can actively prey upon them owing to good visual conditions.An additional example is provided by Carey (1992), who followed by acoustic telemetry the location of a swordfish (Xiphias gladius) from 0200 to 0800h. The fish wasclearly following the descent of an acoustic sound-scattering layer of prey detected bya 50 kHz echosounder from one hour before sunrise (0445h) to 0630 h (Fig. 3.5).Similar observations were performed on a 100 cm bigeye tuna in the open ocean inFrench Polynesia by Josse et al. (1998). During daytime, these authors also observed asmaller bigeye tuna (77 cm) swimming inside the DSL layer of maximum acousticintensity. Josse et al. (1998)also tracked vertical movements of a 60cm yellowfin tunaperforming from time to time short incursions from the surface layer into the100--200 m layer, and remaining precisely inside a concentration of prey for nearly onehour when detected (Fig. 3.6).
The relationship between the distribution of fish and their prey at a given time is

Habitat Selection and Migration 51
I08:00
I07:00
I06:00
~~~~~~~~k~~*~TI~:···...'
I04:00
0
100
200.........E 300'-"
.c......400a.
Q)
0
500
600
700 i i02:00 03:00
I05:00
Time
Fig.3.5 Vertical movement (the black line) of an acoustically telemetered swordfish (Xiphias g/adius) onGeorges Bank in 1982, shown with respect to the movement of its presumed prey, as indicated by a 50-kHzechogram (shaded areajDawn was at 0445h (redrawn from Carey, 1992).
Vertical movementsof the tracked fish
Fig. 3.6 Vertical movements (blackline) of an acoustically telemeteredyellowfin tuna iThunnus albacores),60 cm fork length, near Maupiti island(French Polynesia), shown with respectto the location of presumed prey concentration (dense scattering layer).(Redrawn from Figure 3 of Josse, E.,Bach, P. and Dagorn, L. (1998) Tunaprey relationships studied by simultaneous sonic tracking and acoustic surveys. Hydrobiologia (in press). Withkind permission from Kluwer Academic Publishers.)
i
9:00p.rn.
Time
8:30p.m.
Prey concentration(scattering layer)
.J::. 250+'a.a>o
0,......E
100'--'
.J::.+'a. 200a>
0
3006:00 8:00 10:00 12:00p.rn, p.m. p.m. a.m.
0

52 Chapter 3
not easy to investigate because relevant parameters are not easy to collect simultaneously (except for phytoplankton measurement by satellite) and this relationship isnot necessarily linear. Maravelias and Reid (1997) applied generalised additivemodels (GAMs) on prespawning herring distribution measured by acoustic andsimultaneous recorded data of zooplankton, temperature and salinity in the northernNorth Sea. They found that the location of ocean fronts derived from oceanographicdata was related to the herring distribution as in a previous study (Maravelias& Reid,1995) and that this link was likely to be indirect and due to the availability of zooplankton prey in some water masses (Atlantic water).
Horizontal seasonal migrations related to prey selection are well documented(Harden Jones 1968; McCleave et al., 1982; Dingle, 1996), but it seems that in someinstances, interannual habitat selection might be related to prey abundance. Polovina(1996) suggested that changes that occurred during the previous decade in the proportion of northern bluefin tuna (Thunnus thynnus) migrating from the westernPacific to the eastern Pacific, were related to the decrease in prey abundance (of theJapanese sardine, Sardinops melanostictai. Similarly, Leroy and Binet (1986) speculatedon the causes of the quasi-disappearance of this species in the North Sea and theNorwegian sea from the 1960s, and suggested the decrease of small pelagic preyabundance (especially herring), in addition to climatic changes .
. In summary, prey abundance is an important factor of habitat selection variabilityboth horizontally and vertically and at different scales of space and time (fromminutes to years). Unfortunately the information on prey abundance is seldomavailable and therefore not taken into account in most of the assessment methods.The only attempts in this direction have been mainly applied to demersal ecosystems(Laevastu, 1990a, b) or have been limited to understanding the trophic food web in asteady-state situation (ECOPATH model, Polovina, 1984; Christensen & Pauly,1992), which is a necessary but preliminary step. A dynamic ECOPATH model isinvestigated by Waiters et al., (1997) which is a promising approach despite the risk ofoverparameterisation in many insufficiently documented ecosystems.
3.4.4 Predators
Fish are able to detect and identify their predator at short distance by vision and atlong distance by olfaction and sometimes by hearing. Predators can not only changethe.microdistribution of their prey, which usually react by increasing their packingdensity and performing a large repertoire of local evading manoeuvres includingschool splitting and avoidance, but can also cause a large decrease of abundance inthe area due to long-distance flight by the prey. We did not find such evidence oflongdistance flight in the literature on pelagic fish, but during acoustic surveys of Sardine//a aurita in Venezuela, we observed that the fish disappeared when dolphinsarrived in the area. Sunfish (Lepomis macrochirusi in the presence of predators moveto a suboptimal habitat (Werner et aI., 1983). In this species an ontogenetic habitatshift is observed and Werner (1986) demonstrated that experimental habitat use isaltered by the size-dependent risk of predation. In their review of the development of

Habitat Selection and Migration 53 -
predator defences in fishes, Fuiman and Magurran (1994) give other examples ofhabitat shifts resulting from the trade-off between foraging and predation risk. Inaddition they underline the fact that niche shifts may also be mediated by the influence of the programme for morphological development on sensory or behaviouralcapabilities, especially when related to predator defences (camouflage, detection,evasion).
In the Bay of Biscay, the combination of pelagic trawl results and simultaneousschool measurements by acoustics suggests that anchovy schools change their verticalhabitat selection according to the occurrence of predators. When they are thedominant species, anchovies (Engraulis encrasicolus) are usually observed 16m abovethe bottom, while they are observed 30 m above the bottom in the presence of horsemackerel (Trachurus spp.) in the bottom layer (Masse et al., 1996), In this work theauthors noticed that, surprisingly, this change in vertical distribution of the preyoccurred despite the fact that the prey and the predator species had similar mean size(l4cm). We suggest that this could be due to predator recognition by prey, which isusually related to a limited number of key stimuli (see Chapter 7 for details). Forinstance we observed repeatedly the defensive behaviour of small sardine (Sardinapilchardus) schools during their encounter with schools of other species - includingsmall predators - in the Carnon harbour (South of France) in November 1995. Whensardines encountered large mullets (Mugil spp.), they did not react at all and the twoschools crossed one over the other, but during encounters with small· mackerels(Scomber japonicus) of similar body length to the sardine (around 12 cm), a strongavoidance reaction was displayed by the sardine school.
In large pelagic species, adult fish often prey on juveniles of their own species(section 6.3.1).
In addition to direct reaction to the presence of a predator, it is likely that pelagicfish can select their habitat according to the ability of predators to detect them, whichdepends on how conspicuous they are in this specific habitat. It is accepted that manypredators take advantage of the reduced visual capabilities of prey to perform attacksduring short twilight periods of dawn and dusk in tropical areas (Helfman, 1992; butsee Parrish, 1992a for the importance of diurnal predation). Some predators have abetter relative visual acuity than their prey during the crepuscular period because theypossess larger (but fewer) cones in their retina (Munz & McFarland, 1973).Accordingto McFarland et al. (1979), French and white grunts (Haemulidae) seem to reducetheir level of conspicuousness during their dusk offshore migration by hugging thesubstrate in tight groups, which minimises the backlight effect. Another example ofinteraction between predator and habitat in freshwater fish is presented by Ekloevand Hamrin (1989).
The vertical distribution is likely to be affected by intensive bird predation,resulting in an increase of the mean school depth. We did not find references to this inmarine habitats, except for describing the depth of predation by birds which can beimportant in some avian species (30 m on average for rhinoceros auklets; Burger etal., 1993). We found some references to experimental work on juvenile chinook salmon which indicated such increase in depth in the presence of a bird model (Gregory,1993) and similar experimental results in freshwater fish (Lonzarich & Quinn, 1995).

54 Chapter 3
3.5 Conclusion
We have seen that the determination of habitat selection and migration is the result ofmany interactions at different space and time scales. Habitat selection depends onnumerous biotic or abiotic factors which vary according to the species, the age and thephysiological stage of the fish. These factors might be different according to thetemporal and spatial scales, but they are sometimes conflicting in a given place at-thesame moment. Seasonal migrations over relatively large distances are usually relatedto reproduction and alimentation while habitat selection on other temporal andspatial scales depends on many other interacting factors. An example of such complexity is given by Swain and Kramer (1995) who studied interannual variation intemperature selection by cod in the southernGulf ofSt. Lawrence from 1971 to 1991.They found that temperature selection was highly variable depending on year and ageclass. When density was high, old age classes tended to occupy colder waters and theauthors suggested a trade-off between the density-dependent benefits of greatersupplies in warm water and the density-dependent benefits oflower metabolic costs inthe deeper water.
These facts can be linked to the classification of ethological programmes accordingto Mayr (1976). According to this classification, habitat selection programmes are'open programmes' and the related phenotypic behaviour can be modified accordingto experience and to external constraints. This flexibility is an advantage because thedifferent components which define an optimal habitat (especially predators, prey,physical needs) are highly variable. For instance, a strict mechanism of diel verticalmigration in response to light intensity would in certain situations be a handicap forpreying or predator avoidance. An additional difficulty encountered by students ofhabitat selection results from the fact that fishes living in unstable habitats mayforever seek their environmental preferenda without achieving them, as a result of thecomplexity of the dynamics of habitat and behaviour (Neill & Gallaway, 1989).Thissituation could explain the difficulties in the studies of the distributional responses offish to environment. The lack of dynamic models coupling environmental changesand fish movement dynamics could explain the high level of 'noise' in the deterministic modelling. Another interpretation of this 'noise' could be the mixture of different 'obstinated' strategies followed by different individuals belonging to the samestock (Cury, 1994). Finally, the depletion of prey byfish predation can also make itdifficult to study the relationship between standing crop and fish density.
In other instances, the dynamics of the food chain process can be responsible forcomplex and time-lagged relationships between the effect of physical factors andbiological factors responsible for habitat selection. Stretta (1991) proposed a dynamicmodel aimed at forecasting suitable tuna fishing areas according to the dynamics ofsea surface temperature in the eastern Atlantic. The ideal thermal scenario leading tofood availability for tuna is:
(I) Upwelling (cold water)(2) Maturation of the water during four weeks (increase in surface temperature)(3) Thermal stabilisation for two weeks.

Habitat Selection and Migration 55
In this situation it is likely that tunas are not able to take advantage of such a complexlink between the temporal dynamic of a physical factor (temperature) and the location of the.favourable habitat (presence of prey)..
In this chapter we have seen that some biotic or abiotic factors responsible forhabitat selection are easily predictable due to their circadian, seasonal or lunarperiodicity, in contrast to other unpredictable factors (mainly the interannual variations .and the biotic factors). The influence of all these factors on catch rates andpopulation sampling is obvious. In contrast, it is not straightforward to take intoaccount the influence of unpredictable factors for survey design. Therefore temporalor spatial pre-stratification is often useless in pelagic fish studies, contrary to thepermanency of spatial structures in many benthic species and some demersal ones.Consequently the approaches by post-stratification (with all related difficulties inestimating a proper variance estimation) or better geostatistics are often used inpelagic fish stock assessment. Similar difficulties are encountered during the processing of commercial data aimed at computing abundance indices, with the additional problem of no control on the sampling strategy. From the experienceaccumulated during several generations, fishermen have learned how to takeadvantage of fish habitat selection to maximise their profits. We will detail in Chapter8 how the different kinds of habitat selection and the consequent fishermen's strategywill generate error or biases in indirect methods of assessment and how easy or difficult it is to remove or limit these effects. We will do the same in Chapters 9 and lOinrelation to direct methods of abundance estimation and distribution. In the nextchapter we move to the important matter of fish schooling, which is another fundamental behaviour pattern of many economically important fish stocks.

Chapter 4Schooling Behaviour
4.1 Introduction
Fish can distribute and behave individually, they can aggregate in more or less socialgroups - for instance during feeding and spawning - and some species can swim inlarge, dense schools. These behaviour patterns determine to a large extent the volumeoccupied by the individuals in a stock (Pitcher 1980), and consequently have asignificant influence on sampling.
Schooling behaviour is common among fishes. Shaw (1978) has estimated thatabout 25% of the approximately 20000 teleost species are schoolers. Moreover,about 80% of all fish species exhibit a schooling phase in their life cycle (Burgess &Shaw 1979), and schooling as juveniles is especially prevalent. Even benthic speciessuch as the naked goby (Gobiosoma bosci) that live among oyster shells and other hardsubstrates, school at the larval stage (Breitburg, 1989). Other aquatic organisms suchas squids (Hurley, 1978), tadpoles (Wassersug et al., 1981), and krill(Strand&Hamner 1990)may form aggregations that resemble fish schools. Even the behaviourofairborne bird flocks during migrations is a close analogy to fish schooling (Major &Dill 1978).
Schooling pelagic fishes, such as most clupeoids, scombroids and carangids, are thefoundation of major worldwide fisheries and fishing industries. To optimise the longterm yield, fisheries on these stocks are regulated on the basis of biomass estimatesfrom direct and indirect stock assessment methods. However, the schooling behaviour of these species puts important limitations on the applicability and accuracy ofboth indirect and direct stock assessment methods (Ulltang, 1980; Aglen, 1994).
In this chapter, the characteristic patterns of the schooling behaviour of fish aredescribed, and features thatdifferentiate schooling from other aggregative behavioursare emphasised. The function of schooling behaviour are considered, but most of thechapter will be devoted to illustrating how fish organise and maintain schooling.Finally, the senses involved during schooling, and communication between schoolingindividuals, are outlined.
4.2 School definitions
Since the first studies of fish schooling, there has been a debate about what the term'school' really describes. Parr (1927) considered schools as fish herds, having an

Schooling Behaviour 57
apparently permanent character and being a habitual, spatial relationship betweenindividuals. The schools were claimed to exist on a diurnal basis, and to result fromvisual, mutual attraction and subsequent adjustment of direction to parallel swimming. Breder and Halpern (1946) simplified the definition by stating that schools aregroups of fish that are equally orientated, regularly spaced, and swimming at the samespeed. Distinguishing the schooling habit among species, Breder (1967) suggested theterm 'obligate schoolers' for species swimming most of their lives in coherentlypolarised and permanent groups, while species forming such groups temporarily werecalled 'facultative schoolers'. Radakov (1973) considered a school just to be a groupof fish swimming together. Shaw (1978) ended this group-emphasising tradition byarguing that groups of fish united by mutual attraction, and which may be eitherpolarised or nonpolarised, should be considered as schools.
Illustrating that it is the individual's own decision to join, stay with, or leave agroup of companions, Partridge (1982a) argued that schools should be characterisedby independent measures of time spent schooling and degree of organisation. Thisview was developed further to the statement that a school is a group of three or morefish in which each member constantly adjusts its speed and direction to match those ofthe others (Partridge I 982b). Pitcher (1983) defined schooling simply as fish inpolarised and synchronised swimming. The basic criterion of both these definitions isthe element of organised motion accomplished by the participation ofeach individualin the school. A school is a functional unit.
4.3 Genetic basis of schooling
Like all other living creatures, fishes struggle to do what they have to do, i.e. avoidpredators, feed so as to reach maturity, find a partner and reproduce so that their genesare passed to succeeding generations. Some species reproduce several times (iteropari ty), others, such as the capelin (Mallotus villosus) reproduce just once (semelparity)and die afterwards. Tactics for predator avoidance also differ among species even ifthere can be striking similarities. At the juvenile stage most species perform schoolingto enhance survival, but the pattern of schooling may differ among closely relatedspecies such as cod (Gadus morhua) and saithe (Pollachius virensi. (Partridge et al.,1980). Distinct patterns of behaviour unique to certain species contribute to reproductive isolation among species. As for all other living creatures, the behaviour offishesis set within limits determined by their genetic constitution, which has been formed bynatural selection through the evolution of their life histories.
If there is a certain degree of genetic variation within the population, naturalselection may operate. In the case of fish behaviour, there are several intraspecificexamples which illustrate how natural selection has been acting on genotypes so thatthe behaviour differs. Among the best known is the schooling behaviour of guppies(Poecilia reticulata) in various isolated streams in Trinidad (Seghers, 1974a).Schooling is well developed in populations living in rivers with a high density ofpiscivores (charachids and cichlids) taking all life stages of the guppy, isintermediately developed in populations living in streams with a high density of one

58 Chapter 4
fish species (Rivulus hartiii predating mainly on immature guppies, and is poorlydeveloped or absent in populations livingin streams with medium and low densities ofthis predator. The final evidence of a genetic basis for this intraspecific difference inbehaviour was given by Magurran and Seghers (1990), who demonstrated that thedifferences in schooling behaviour among the various guppy populations were alsopresent in newborn fish.
Similarly, European minnow (Phoxinus phoxinus) that live sympatrically withpredatory pike (Esox lucius) organise more cohesive schools and perform betterintegrated evasion tactics than fish from waters without the predator (Magurran,1990).There was obviously a genetic, inheritable basis for this population difference,as Magurran (1990) reared the minnow populations studied in identical conditions ina laboratory without exposure to the predator. Moreover, the antipredator behaviourwas modified most by early experience of a model predator in the population sympatric with pike, which indicates a genetic predisposition to respond to earlyexperience that also varies intraspecifically.
Another way of revealing the genetic influence on fish behaviour is comparison ofhybrids. In river populations of Astyanax mexicanus, schooling is prevalent, while it isnot observed in blind cave populations. The inability to school can be caused by theloss of visual orientation, or a genetic change as a result of life in the caves with noselection for schooling. When crossing the fish from a cave and a river, it was revealedthat .despite good visual orientation, the hybrids showed a weaker tendency forschooling. This indicates that there exists a genetic reduction of schooling behaviourin the cave populations compared with the river populations. Similarly, genetic differences are expressed in different locomotor activity, fright reaction, feeding andsexual behaviour between cave and river populations of Astyanax mexicanus(Parzefall, 1986).
4.4 Ontogeny of schooling
Most fish larvae do not have fully developed sensory organs and locomotory systemswhen they are born; these develop gradually throughout the first critical stage of thelife history. Due to the small size of most larvae (around I mm) and their weaklocomotory ability, the viscous forces in the water make movement difficult. Thehydrodynamic constraint put on objects moving in water by the viscous forces areexpressed through the Reynolds number (dimensionless), which depends both on thesize and on the speed of the object. At Reynolds numbers less than 10 the viscousforces are strong, at Reynolds numbers between 10and 200 the viscous forces have anintermediate influence, and at Reynolds numbers over. 200 they can be ignored.Fuiman and Webb (1988)estimated that newly hatched zebrafish (Danio rerio) have aReynolds number less than 10during ordinary swimming bouts, which means that thelarvae are in fact moving in 'syrup', and reach a Reynolds number larger than 200justfor short periods during swimming bursts. Obviously, organisms living under suchconstraints have no possibility for synchronised, polarised movements .in groups.
As the locomotory system develops, the larvae become capable of continuous

Schooling Behaviour 59
swimming. The eyes which initially consist only of cones become more functional, andthe number of rods necessary for perception of motion increases (Blaxter & Hunter,1982). Most larvae hatch with free neuromasts, but when these become innervated, amoving larva becomes capable of detecting water movements generated by othernearby larvae. More pigmentation makes the initially transparent larvae more conspicuous and easier to keep sight of. Through these developments, the larvae mayorientate in relation to conspecifics by monitoring their movements visually and thedistance to them by the lateral line (Shaw, 1970).
As the sensory and locomotory organs of the larvae become more and morefunctional, the 'following response' develops. Shaw (1960, 1961) and Magurran(1986) describe how this response develops into schooling for silverside (Menidiamenidia) and European minnow, respectively. The following response starts to beexhibited when the gradually developed larvae encounter conspecifics of the same lifehistory stage. At first, encounters are followed by immediate withdrawals. Gradually,the larvae seem to be more mutually attracted and swim together as a ·pair, oneleading, the other following somewhat behind and to one side. The duration of suchfollowing responses also increases gradually. Schooling develops as several pairsencounter and start swimming together as a group, at first for short periods, butregular schooling may rapidly be established.
The development ofschooling behaviour is species dependent, and there is a clear .relationship between the degree offunctionality of the larvae at hatching and the timeuntil schooling is fully established. Well-developed larvae of the ovoviviparous guppyin rivers on Trinidad are capable of fully developed schooling immediately after theyhatch (Magurran & Seghers, 1990). This is very different from the poorly developedlarvae 0'£ most marine pelagic species. The Atlantic silverside (Menidia menidia) is10-12 mm in length or about 20 days old when polarised, synchronised swimming is .established (Shaw, 1960; 1961). Other species that school before metamorphosis arenorthern anchovy (Engraulis mordax), which starts at lengths between 10 and 15 mm(Hunter & Coyne, 1982), and Atlantic menhaden when 22-25 mm in length (Blaxter& Hunter, 1982). Atlantic herring reach 35-40mm and are at the onset ofmetamorphosis before schooling (Gallego & Heath, 1994). For European minnows,
. which emerge from eggs buried in gravel, schooling is fully developed about fourweeks after the onset of free swimming (Magurran, 1986).
Schooling behaviour continues to develop after its initiation in the second half ofthe larval life stage. Van Olst and Hunter (1970) observed that for anchovy, jackmackerel (Trachurus sp.), and silversides (Atherinops sp.) the mean nearest neighbourdistance and deviation in heading among fish in the school decreased from larvae nearmetamorphosis (20-40 mm long)· to juveniles (60-80 mm long). The integratedschooling observed for adults is therefore a process that starts in the middle larvalstage and continues through a substantial part of juvenile life.
4.5 Schooling and shoaling
At night-time, fish schools commonly disperse and extend in aggregations and layers(Shaw 1961;John 1964; Blaxter & Hunter 1982). Apart from being a social assembly

60 Chapter 4
of fish in one particular area, such groupings display no strict coordination amongindividuals. To distinguish them from schools, Pitcher (1983) proposes that such fishaggregations be termed 'shoals'. As with the flocking of birds, there are no implications for structure and function in fish shoals. By this heuristic definition, Pitcher(1983) argues that schooling is a special case of shoaling, but with strict criteria forsynchronised and polarised motion.
Older literature often made no distinction between the behaviour patterns of fishschooling or shoaling in layers and aggregations (Radakov 1973; Shaw 1970), andaccording to Pitcher (1986) the term 'school' is still used in North America to describeboth these behavioural patterns.
The long debate on how to define and distinguish schooling behaviour isa probablereason for the semantic confusion over how to describe the aggregative behaviour offish. In addition, when observing fish at sea with low-resolution acoustic equipment,the degree of coordination in the movements within the fish recordings is nearlyimpossible to detect. In such situations, the distinction of the fish aggregative behaviour is made by considering the density and extent of the recordings. Experiencedusers of acoustic fish-detection equipment often term recordings offish shoals of ratherlow density as .slar' or layers which are easily differentiated from recordings of fishschools. When schools of large Norwegian spring-spawning herring disperse intoshoals at night, the fish density in the recordings may drop by two orders ofmagnitudefrom an average of about I fish m-3 to 0.02 fish m-3 (Beitestad & Misund 1990).Inothersituations, for instance on the spawning grounds or when herring are hibernating in.narrow fjords, there may be no large diurnal change in the extent and fish density of theaggregations, but the diurnal vertical migration may be substantial. Toresen (1991)measured densities of about I fish m", even at night, of large herring in a fjord innorthern Norway. Despite the high fish density, the degree ofcoordination among theindividuals in such aggregations at night is not known. Similarly, the aggregativebehaviour ofSardinella aurita in the GulfofCariaco, Venezuela, varied temporally andspatially, and dense schools were even detected at night. However, using criteria offishdensity, it was still possible to group the recordings as schools, shoals (concentrations)and dispersed fish (Freon et al., 1989). Shoal-to-school transitions in behaviour areabsent for some species, and the sand lance (Ammodytes sp.) takes refuge in the sandwhen not schooling (Kuhlman and Karst 1967; Meyer et al., 1979).
4.6 Functions of schooling
Schooling is regarded as an efficient way of conducting underwater movements, andis beneficial to the individual participants. This is achieved mainly through a higherprobability ofsurviving predators, more effective feeding, hydrodynamic advantagesand more precise migration when schooling than when solitary (Pitcher, 1986).
4.6.1 Survivingpredatory attack
It is suggested that aggregating in groups decreases the probability of predation

Schooling Behaviour 61
because of reduced probability of being detected (Olson, 1964; Breder, 1967; Cushing& Harden Jones, 1968). However, an advantage to a group member is present only ifthe consumption rate of a predator is less when feeding on groups, and not because ofreduced probability of detection (Pitcher, 1986). Besides, many schooling fishes live inrather close proximity to their predators (Parrish, 1992b; Pitcher et al., 1996). Inaddition, pelagic fish schools often occur close to the surface, and in such situationsare more easily detected by predatory sea birds than are solitary fish.
Bertram (1978) and Foster and Treherne (1981) argue that the probability of beingthe victim during a .predatory attack declines inversely with group size through anumerical dilution effect. Morgan and Godin (1985) show that such an effect operatesin a laboratory study of white perch (Morone americana) predation on schoolingkillifish (Fundulus diaphanus). The perch attack rate per killifishdecreased with schoolsize by a slope no different than -Ion a double logarithmic plot, as predicted by thedilution effect (Fig. 4.1).
Because the dilution effect applies only to members of a group being attacked,Pitcher (1986) argues that simple dilution will not promote the evolution of grouping.If the attack rate of the predator increases in proportion to the size of the schools, theprobability of being the victim is the same both for solitary and for schooling fish, andthe dilution effect will be a fallacy. However, Morgan and Godin (1985) observed thatthe perch attack rate was independent of the killifish school size.
Pitcher (1986) and Turner and Pitcher (1986) suggest that the 'attack abatement'effect, in which predator search and attack dilution interact, can favour the evolutionof grouping. In this case, a solitary fish will benefit by joining a group because even ifthe probability of detection is the same, the probability of being the victim of anattack decreases from 1.0 to an inverse proportion of the number of fish in the school.
An advantage of schooling for surviving attacks by predators is an earlier detectionof approaching predators through the many eyes watching, and a repertoire ofcooperative escape tactics (Godin, 1986; Pitcher, 1986). A stalking predator is oftenout-manoeuvred by the fountain effect, in which the schooling individuals maximisetheir speed relative to the attacker, avoid sideways, and reassemble behind it. Whenavoiding attacks from faster predators, the Trafalgar effect (Treherne & Foster, 1981)ensures that a flight reaction is transmitted through the school at a faster speed thanthe approach of the predator. The flight transmission speed through killifish schoolswas about twice the approach speed of a chasing perch model (Godin & Morgan,1985).
Many predators can attack at a speed that is much faster than the burst speed Ofschooling prey. Still, such predators suffer a much lower capture success for schoolingthan for dispersed or solitary prey (Neill & Cullen 1974; Major 1978). A prey schoolwill be a mass of moving targets within the visual field of the predator, which maythereby suffer a confusion effect arising from sensory channel overload or cognitiveconfusion (Pitcher, 1986). The predator may therefore hesitate and give the schoolingprey more time to avoid, or it may perform imprecise attacks. To enhance the confusion effect, schools are often observed to perform a flash expansion in which .theindividuals respond to a striking predator by fleeing in all directions and rapidlyreassembling after swimming 10 to 15 body lengths (Pitcher, 1979a; Pitcher & Wyche,

62 Chapter 4
(a) 3.0
2.0
I" 1.0g'JII!9'JII!9'c:
E ~~~~..e;>..e;> ..e;>
~ 0.5 ~..e;> ..e;>
en'+-
.:Y:.
en.:Y:.u
~ a.' 0
0
..c:0.05u
l-Q) ..e;>..e;>
0... ..e;> ..e;>0
~ ..e;>
0.01 .:\ 5.,School size
"0
,10
I7
..
I I2 3
iI
\ ..0\,,
\ ..,,,,,"
'" 0-,~~, ..
~~----------.------------------------- ..
(b) IJQ)
1.0I-::J
a.0 0.8u
s:en 0.6
'+-
'+-D 0.4c:D
:..=;. 0.2l-
Da.D 0.0I-
0...
School size. .
Fig. 4.1 The dilution effect. (a) Relationship between the rate of perch attacks per individual killifish andkillifish school size (broken line = observed; solid line = predicted). (b) Proportion ofkillifish captured byperch from different school sizes (after Morgan & Godin, 1985).
1983). For.a similar reason, European minnow (Phoxinus phoxinus) under threat mayperform an individual skittering behaviour (Magurran & Pitcher 1987), whichconsists of rapid startle acceleration and subsequent rise in the water column. Byperforming this behaviour, an individual will have higher benefit than its schoolingcompanions by confusing a predator that may have chosen that individual as a target.
Similar tendencies to gain higher individual benefits may be found when schoolerstry to take refuge by packing in a dense ball. This behaviour may represent anexample ofHamilton's (1971) selfish herd principle, in which individuals try to avoid

Schooling Behaviour 63
the dangerous margins by seeking shelter in the central part of the group. However,when attacked by a black sea bass (Centropristis striata), Atlantic silversides (Menidiamenidia) in central positions of the school suffered a higher attack rate than those inperipheral positions (Parrish, 1989a).
4.6.2 Effective feeding
When coming across patches of food, schools may break up into more looselyorganised shoals because of individual activities needed to search for, capture andhandle prey items. The distinction between schooling and shoaling during feedingmay often be rather fluid; however. Freon et al. (1992) observed that some parts ofHarengula schools became disorganised to feed for short periods while the rest of theschool continued its polarised and synchronised swimming. Anchovy maintainorganised schooling during filter feeding on planktonic organisms (Koslow, 1981).Piscivorous fishes also often hunt and attack in schools.
A higher aggregated search rate results in faster food localisation for fish in largergroups (Pitcher et al., 1982), and feeding sites are more effectivelysampled (Pitcher &Magurran, 1983). Similarly, enhanced vigilance (Magurran et al., 1985) and reducedtimidity in larger groups enables the individuals to allocate more time to feeding, evenwhen predators are present (Magurran & Pitcher, 1983; Morgan & Colgan, 1987).
Predator grouping may suppress the confusion effect when feeding on swarmingprey; this happens through a reduced reliance on vigilance (Smith & Warburton,1992). Similarly, when attacking schooling prey, schooling predators are moreeffective than solitary ones (Major, 1978). Probably schooling predators overcomethe confusion effect by a better ability to split prey schools, creating stragglers that areeasier to capture.
4.6.3 Hydrodynamic advantages
If schooling fish are swimming in the vortices left by the tailbeats of fish in front, theymay gain hydrodynamic advantage (Weihs, 1973; 1975). This implies adopting acertain structure swimming in a diamond lattice, 0.4 body lengths away from lateralneighbours and 5. body lengths behind those in front. Such swimming was notobserved when recording the structure of herring, saithe and cod schools cruising inan annular tank (pitcher & Partridge, 1979).
Schooling fishes may also obtain hydrodynamic advantage through an improvedthrust efficiency by swimming alongside each other, preferably at a distance of 0.3body lengths. Tendencies to swim with neighbours of similar size in herring andmackerel schools (Pitcher et al., 1982, 1985) and the alongside positioning of individuals within two-dimensional giant bluefin tuna schools (Partridge et al., 1983)areindications that the lateral neighbour effect may operate when schooling. Abrahamsand Colgan (1985) observed that shiner (Notropis heterodont adopted a twodimensional; hydrodynamically efficient school structure when swimming in anenvironment without predators, but reorganised to a three-dimensional structure thatenhanced vigilance when a predator was present.

64 Chapter 4
Breder (1976) argues that mucus, being continuously washed from fish in the frontpart of a school, will reduce the drag experienced by those following behind. To testthis hypothesis, Breder (1976) added non-toxic polyox, an ethylene polymer of highmolecular weight, to the water of one aquarium tank, but not to that of a controltank. He then observed menhaden (Brevoortia patronus) swimming in the two tanks,and found that fish in the treated water swam with twice the tail beat frequency andproportionally faster than those in the controL However, the experiment does notprove that the higher tail beat frequency was the result of the fish experiencing a lowerdrag. Parrish and Kroen (1988) measured the amount of mucus sloughed off individual silversides (Menidia menidia). Then they used polyox at different concentrations in the sea water to simulate the drag reduction due to the combined effect ofsolubilised mucus sloughed off a school of 10 000 silversides. The authors did notnotice any changes in the tail beat frequency, even when the polyox concentration wastwo orders of magnitude higher than necessary to simulate the mucus effect.
4.6.4 Migration
Because the mean direction of a migrating group is likely to be more precise than eachindividual's choice (Larkin & Walton 1969), schools may also migrate more accurately. This effect will favour the formation of large schools, as are often observedwhen pelagic species like herring and capelin undertake long spawning migrations.
At the onset of migrations, there may be substantial individual differences in theunderlying motivation within populations. For instance, the hunger level creating amotivation for feeding that initiates feeding migrations may vary substantially amongconspecifics within an area. In such cases it is probable that schooling behaviour actsas a filtering mechanism so that only individuals having the same level of motivationparticipate in the migrating schools, while others continue doing something else. Thisfiltering may be observed at the onset of the spawning migration of capelin in theBarents Sea. Both mature and immature fish are present in the same areas in the
. north-eastern Barents Sea, where .they were feeding during the previous summer andautumn. In late autumn/early winter, most fish are distributed in layers that mayextend over large areas. Within such layers, the maturing fish start organising denseschools that begin the long migration towards the coast of northern Norway forspawning. In this process, the schooling is a behavioural mechanism that separatesthe spawners from the immature population.
4.6.5 Reproduction
Schooling may be of adaptive significance for reproduction as a mechanism thatfacilitates mate-finding. This may be valid for pelagic fishes that often migrate overlarge distances and spend a relatively short time at the spawning ground. Thespawning behaviour of herring seems to be of the promiscuous type where a largenumber of fish aggregate at the spawning ground and spawn simultaneously (Turner,1986).Aneer et al. (1983) were not ableto identify any pairing or courtship behaviourwhen observing a school of spawning Baltic herring, and describe the behaviour as 'a

Schooling Behaviour 65
mass orgy of indiscriminate spawning with no apparent coordination between the twosexes'. However, many individuals were observed to spawn when swimming in parallel or alongside each other in mills, and it is possible that such behaviour representspairwise spawning ..Such spawning in schools may reduce the probability of predation, and during littoral spawning, as in the Baltic, herring may be exposed both topiscivorous fishes and to avian predators (Aneer et al., 1983).
For many pelagic species that have the ability to school, the process of reproduction involves an element of competition among males. This may induce agonisticbehaviour among the males when trying to find mates; when dismissing competitorsthat try to interfere with courtship behaviour, and when defending the spawninglocation. When such behaviour patterns start occurring, schools may rapidly disperse.During the spawning migration, schools of capelin tend to sort by sex. The malesdominate in schools that first enter the spawning grounds near shore. There theschools more or less disperse as the males establish 'leks' (Turner 1986) where theystart defending small territories and try to attract, court and mate with arrivingfemales (Seetre & Gjaseether, 1975). In a large tank in the Marineland Aquarium inHawaii, Magnusson and Prescott (1966) observed that during spawning, Pacificbonito (Sarda chiliensisi formed pairs and conducted courtship behaviour withinschools. The pair swim at a slightly faster speed than the rest of the school, with thefemale leading in a wobbling path and the male close behind. This courtship behaviour may end in circular swimming, temporarily separating the pair from the school,and during which the gametes may be released. The courtship behaviour ends if thepair is intercepted by one or several other males, and the pairing male tries to dismissintruders by lateral threat display. If pair formation is maintained after the disturbance, courtship behaviour may be resumed. It is possible that such pair formationand courtship behaviour may lead to a gradual dispersal of schooling in. situ.Mackerel seems not to organise into the usual large schools during the spawningseason in the North Sea (Misund & Aglen, 1992).
4.6.6 Learning
Schooling may enhance social facilitation (Shaw, 1970). Carp trained to escapethrough a moving net were more successful when in a group than as isolates (Hunter& Wisby, 1964). .
Soria et al. (1993) conditioned schooling thread herring (Opisthonema oglinumi, byemitting a 500Hz sound stimulus to which the fish were previously habituated duringthe hoisting of a net from the bottom of a tank. When mixed with naive fish, theconditioned fish seemed to transmit their experience throughout the inexperiencedschool by leading conditioned responses when exposed to the sound stimulus withoutthe net being hoisted.
4.7 School size
When the school size increases, the advantage of grouping during feeding may bereduced due to increased competition for food among school members. Ranta and

66 Chapter 4
Kaitala (1991) found that the number of strikes made by sticklebacks feeding onbenthic prey increased with school size up to about 10 individuals and then levelledofT. The advantage of schooling foravoiding predation probably increases asymptotically with school size. Pitcher (1986) therefore discusses the possibility of theexistence of an optimal school size that has a maximum benefit/cost ratio. From asimple energy-balance model, Duffy andWissel (1988) suggested that lower limits toschool size are unlikely to be set by food but rather by predation, while upper limitsdepend on both food availability and school behaviour. When quantifying school sizeof herring, sprat and saithe in different geographic regions and seasons in the NorthSea and in Norwegian fjords, Misund (l993b) observed a variation in school size byfour orders of magnitude from about 100 to several million individuals in the sameschool (Fig. 4.2). In a majority of the different regions and seasons, the mode in the
(a) en50 Coastal fishing area
00 meon=21 000~ 40 mox=133 000u N=57en
30.....'0
20'-(l)
..0 10E
, '::::l0Z 102 103 104 105 106
(b) en 50Hibernating fiord
0meon= 153 0000
~ 40 mox=2 186 000u N=78en
30.....0
20'-(l)
..0 10E::::l
Z 0
(c) en 50Spawning ground
0 mean= 145 0000~ 40 mox=942 000u N=45en
30Fig. 4.2 School sizedistribution of Norwegian.....
0
'-20 spring spawning herring (average length 33cm)
(l) recorded by echo integration and sonar (a) at a..0 10 coastal feeding area in Lofoten, northern Nor-E way, in September, (b) in a hibernating fjord,::::l
Z 0102 103 104 105 106
northern Norway, in October, and (c) at thespawning ground otTwestern Norwayin Feb-
Number of fish ruary (after Misund, 1993b).

Schooling Behaviour 67
school size distributions was in the order of 10 000 individuals. Variation in schoolsize among regions and seasons probably reflects the fact that school sizeis influencedby the conflicting demands of avoiding predators and conducting feeding. In thiscontext, it must be noted that the smallest herring schools were observed in the regionwhere the predation pressure was most obvious, as schooling saithewere frequentlyobserved to attack and split the herring schools.
In theory, the net benefits of schooling may be zero or even disadvantageous toparticipating individuals if the cost due to intraspecific competition increases withschool size. However, on certain occasions such costs may be absent, as for instancewhen herring more or less stop feeding during hibernation and spawning migrations(DevoId, 1969). In such situations, there will be a net advantage in joining schools ofcountless numbers. Rather than being examples of the 'tragedy of the commonprinciple', huge schools such as those frequently observed in Norwegian fjords inautumn (Fig. 4.2) illustrate that on certain occasions the advantages of forming aschool can still pay, even to millions of individuals.
Dramatic shifts in the motivational status of schooling fishes may be reflectedthrough substantial changes in school size. Nettestad et al. (l996)observed that theaverage size of herring schools at a coastal spawning site ofTsouth-western Norwayvaried by a factor of at least four. The herring entered the spawning site in large anddense immigrating schools that split into smaller but denser searching schools (Fig.4.3). Spawning took place in a dense spawning layer from which small, short-lastingspawning schools erupted. After spawning, the herring aggregated in loose anddynamic feeding schools and left the spawning site in larger and rather uriidirectionalemigration schools.
0
10
20
30
,...., 40E'-'
..c 50a.Q)
0 60
70
80
90
100
Feeding
o Io Increasing
~ detty
IZz:2! Spawning layer
Fig. 4.3 Relative distribution of school size, density, depth, and location of herring schools at a coastalspawning site ofTsouthern Norway (after Nettestad et al., 1996).

68 Chapter 4
The size of schools is not stable over time. Helfman (1984) observed that individuals in yellow perch schools frequently joined and left. Pitcher et al. (1996) recordedthat herring schools on feeding migrations in the Norwegian Sea split and joined onaverage every 70 minutes. Hilborn (1991) estimated that 16-63% of individuals inschools of skipjack tuna (Katsuwonus pelamis) left the schools each day to join otherschools. Based on tagging data, Bayliff (1988) estimated that individuals in a school ofskipjack tuna became randomly mixed into other schools within 3-5 months.Anderson (1980) proposed a stochastic model for simulating the frequency distribution of fish school diameter observed acoustically. In this model the entrance rateof fish into a school is independent of the number of fish in the school, while the exitrates is proportional to this number. Wide distribution of school size is favoured bylarge entrance rates and a large amount of randomness to the schooling process. Incontrast narrow distribution is simulated by large exit rates and low randomness. Inconclusion to this section, further studies are required to better understand the distribution of school size of marine fish populations and its dynamics.
4.8 School organisation
Individuals in schools tend to take up positions that maximise the flow of informationabout the swimming movements of their neighbours (Partridge et al., 1980). Thisresults in. a functional school structure which enables the individuals to performcomplicated manoeuvres synchronously and in polarisation. In this section, thebehavioural rules that fish apply when organising schools will be considered. Thestructural patterns that arise when fish swim in schools will be described through theparameters used to quantify school structure. Similarly, the variability of the schoolstructure as well as the. factors that affect it will be outlined. In addition, factors thattend to stabilise the school organisation are -discussed. To describe how fish communicate when schooling, the senses involved are also considered. Vision and lateralline perception are recognised as the main sensory systems to maintain schooling, butthe possibility that communication within schools can rely on hearing will also bediscussed.
Measurement of fish school structure demanded development of special methodology. How knowledge of school organisation has been collected is therefore outlined here through a review of the development of methods applied for quantifyingschool structure. As most of this knowledge has emerged from studies conducted inlaboratories, the focus here is on visual methods to quantify school structure in smalltanks.
4.8.1 Study methods
Attempts to quantify the internal structure of fish schools were first conducted byBreder (1954), who measured the two-dimensional structure from photographs takenabove a school cruising in a small tank. Keenleyside (1955) tried to take account of

Schooling Behaviour 69
the three-dimensional school structure by estimating density within a small schoolvisually. By using stereophotography or the shadow of each individual as a reference,Cullen et al. (1965) were able to find the coordinates of each individual of a smallschool of pilchard in the three-dimensional space. The shadow method was found tobe most appropriate for such an investigation, the main argument against stereophotography being that the accuracy was reduced too much for the necessary camerato-object distance.
Measurements of internal school structure easily generate a substantial amount ofdata, and the results of the pilchard study were therefore based on coordinate analysisfrom just 11 photographs of the school. Hunter (1966) developed a procedure forquantification of two-dimensional school structure based on coordinate readings onmotion picture frames, automatic digitising and recording, and computer calculationof the mean separation distance, mean nearest neighbour distance, and mean angulardeviation for each frame.
Pitcher (1973) used the shadow method sideways to quantify the three-dimensionalstructure of schooling minnows held in a small tank. The school was photographedfrom the side against a mirror, and a calibration grid in front enabled the coordinatesof each individual to be accurately calculated.
The above-mentioned methods were based on stationary cameras and smallaquaria, a few metres wide only. This allowed testing of very small schools - fewerthan 30 individuals could be used - and the study of Hunter (1966) was based on sixjack mackerels only. Even if three or more fish swimming together in a polarised andsynchronised pattern can be defined as a school (Partridge, 1982a), the degree ofschool organisation increases with the number of schooling companions (Partridge,1980). A school of three minnows has a substantial element of leader-followerrelations, while a school of six minnows has a more complicated organisation. Also,the small tanks put substantial constraints on the swimming movements, and behavioural changes induced by the tank edges can influence the school structure. Hunter(1966) observed an increase in mean angular deviation each time the jack mackerelschool turned.
Partridge et al. (1980) used a 10 m annular gantry tank where fish could swimendlessly around without having to orientate towards edges. Schools of 20-30 cod,saithe and herring were conditioned to follow a red spotlit area on the tank floorprojected at an angle from a rotating gantry (Fig. 4.4). The schools were filmed fromthe gantry while moving, and the conditioning gave the opportunity to regulate theswimming speed of the schools. The three-dimensional coordinates ofeach individualwere calculated very accurately (± 0.25 cm) using the shadow method. The data setcollected was considerable; about 20 000 film frames were analysed and more than 1.2million individual fish coordinates were calculated.
Underwater acoustics can be used to study internal structure and school shape,especially by using the smallest resolution of the sounder (e.g. one pulse x 0.5 m). Thefirst step is to identify a school and many sounders now have an internal processorwhich does this automatically according to given thresholds of geometry, reflectedenergy and spatial continuity between echoes (e.g. Weill et al., 1993). At this scale it ispossible to obtain with a reasonable precision geometrical descriptors of the school

70 Chapter 4
Fig. 4.4 Quantification of three-dimensional school structure using the shadow method in a circular tankwith a rotating gantry (after Partridge, 1982b).
(height, width, perimeter, surface), estimates of the biomass, density and theirvariability, and the position of the school in the water column (distance to the bottomand to the surface). Another approach is to use image analysis algorithms whichconsider the smallest resolution as pixel (Reid & Simmonds, 1993).
Finally, an approach to evaluate hypotheses on school organisation is to performsimulation by object-oriented models. The interest of such an IBM model is to test if aminimum number of simple individual fish behavioural rules are able to generate theemergence of a realistic school behaviour. If the simulation is not able to reproducethe fish behaviour, itmeans that the proposed behaviour is not acceptable (or at leastnot alone). Nevertheless the emergence of a realistic school behaviour is not a sufficient condition to accept a model since similar results can be obtained with differentbehaviour rules and parameters. Pioneer work in this field has been carried out byAoki (1982) and Huth and Wissel (1994).
4.8.2 Minimum approach distance
A fundamental behavioural rule for orgarusmg schools is that each individualmaintains an empty space around itself. This became evident when the structure of asaithe school was compared with that of points generated at random with the samedensity and within a similar structure as the real school (Partridge et al. 1980).Whenplotting the cumulative frequency of neighbours at different distances related to thecube of the distance, it appears that the neighbours in the real school are distributedfarther away and in a narrower interval than expected at random (Fig. 4.5). Thisindicates that each individual maintains a certain minimum approach distance ..Consequently, if individuals come too close they quickly orientate away from eachother. This has been observed in a school of jack mackerel in that the mean separation

Schooling Behaviour 71
(a) >, 1.0oc(l) 0.8::l0-(l)
.t: 0.6
(l)> 0.4:;:;.2::l 0.2E::lU 0
0 1 2 3 4 5 6
Log(distance to neighbours)3
3.02.01.004---,-------.-----,-----,---...,..------,
o
co(l)
::::E
(b) &i(l)
~.... III(l) C
..0 0(l)'c
0,[§ E
oc o 20o~O'lo co~0.0(l)..r:;III u
III
Number of. body lengths betweenschooling companions
Fig. 4.5 Minimum approach distance in schools. (a) Cumulative frequency distribution of nearestneighbour distances in saithe school (after Partridge et al., 1980); (b) mean separation angle betweenindividuals in jack mackerel school (after Van Olst & Hunter, 1970). .
angle between neighbouring individuals increased drastically if they came closer than0.2 body lengths (Van Olst & Hunter 1970, Fig. 4.5).
Each species seems to have a specific minimum approach distance. In saitheschools, the individuals obey a minimum approach distance ofabout 0.3 body lengths(Partridge et al. 1980), while schooling pilchard have been observed as close to eachother as 0.1 body length (Cullen et al., 1965).
4.8.3 Nearest neighbourdistance
The minimum approach distance rule results in the seemingly regular distance amongschooling individuals. Typically, the average nearest neighbour distance is below onebody length, but with a substantial variation and differences among species. Pilchardschool at about 0.6 body lengths from their neighbours (Cullen et al., 1965). Thefacultatively schooling minnow organises somewhat looser schools, as the nearestneighbours occur about 0.9 body lengths (SD = 0.4 body lengths) apart (Pitcher,

72 Chapter 4
1973; Partridge, 1980). Cod will school at a smaller distance from their nearestneighbour. than saithe, while in herring schools there is a greater distance amongnearest companions (Partridge et al. 1980).
A cause of the substantial variation in nearest neighbour distance is the relativepositions in space (Partridge et al., 1980). Neighbours at the same level are generallyfarther apart than those above or below (Fig. 4.6). Herring swimming directlyalongside are farther away than those in front and behind, a pattern also found formackerel, jack mackerel, northern anchovy and silversides (Van Olst & Hunter,1970). The gadoids, however, have their neighbours closer directly alongside than infront.and behind (Fig. 4.6).
4.8.4 Spatial distribution
Schooling fishes tend to organise in certain spatial patterns at preferred positionsrelative to each other. Pilchard appears to school at diagonal positions relative tothe nearest neighbour in both the horizontal and vertical planes (Cullen et al.,
(a)1.0
0.8..............JCD 0.6'-'
0 0.4ZZ
0.2
~~---------~~~~~-----~~~~-~~~~~~
~~. Herring
Saithe
". Cod
o ~ r-,..---,...--r-----r---r----r------,
-70 -50 -.30 -10 10 .30 50 70
Elevation n(b)
1.0
0.8..............JCD 0.6'-'
0 0.4ZZ
0.2
o
------- ~ .......... ........,. ............ ...Hernng------ -------- Saithe
............. Cod
20 .60 100
Bearing n140 180
Fig.4.6 Nearest neighbour distance (NND, in body lengths) as a function of (a) elevation and (b) bearingfor cod, herring and saithe (after Partridge et al., 1980).

Schooling Behaviour 73
1965, Fig. 4.7). Similarly, species like mackerel, jack mackerel and topsmelt havebeen observed to prefer nearest neighbours in diagonal positions horizontally,while schooling anchovy had their neighbours more directly to the front and rear(Van Olst & Hunter 1970). Minnows also tend to clump in preferred positions relative to the nearest neighbour, both horizontally (15°, 45°, 75°, 135° and 170°) andvertically (-45°,15°) (Pitcher, 1973). It is claimed that optimal packing (maximumnumber of equidistant neighbours) will be obtained in a tetradecahedral pattern(Pitcher, 1973). The schooling minnows tend to pack in a suboptimal tetrahedralpattern, while the diagonal positioning of pilchard resembles cubic lattice packing.
The idea that schooling individuals pack in a certain complicated geometricstructure is appealing. Breder (1976) argued that the general school structure couldnot be regular cubic lattices because the individuals would then appear in regimentedrows and colums, a structure 'so striking that the details of the regimentation wouldhave been recorded long ago'. He argued that fish schools resemble more a rhombiclattice, which would give a denser packing because the number of equidistantneighbours increases from six, as in a cubic lattice, to twelve. If fishes in a school were
(a)
(b)
Vertical plane
Fig.4.7 Spatial distribution of nearest neighbours in (a) horizontal and (b) vertical planes in a pilchardschool (after Cullen et al., 1965).

74 Chapter 4
packed in such a pattern, they would be swimming in each others' vortex trails atpoints which, according to the theoretical analysis ofWeihs (1973),would give them ahydrodynamic benefit. Also, considerations and observations of school turningsupport packing in a rhombic structure. Schools seem to turn in clear sectors if theirmembers are organised in a rhombic lattice, while if they are organised in a cubiclattice the turns of the school will occasionally be in sectors that cause individuals tocollide.
If fish schools were organised in a regular lattice, the neighbours would have to bedistributed at a uniform distance. However, the proportions between the first andsecond nearest neighbour in schools of herring, saithe and cod deviate from the oneto-one relationship found in regular lattices (Partridge et al. 1980). Fish schoolsconsequently do not seem to be organised according to a regular geometric pattern,but there are still tendencies for the individuals to prefer specific positions relative toeach other. Also, each species organises schools that have a characteristic spatialstructure. Saithe and herring tend to school at different vertical positions from theirneighbours, while this is not the case for cod (Partridge et al. 1980, Fig. 4.8). The
(a) 0.20
0.16~
VJ...~c: :::J
0 0 0.12:;:i.o... ~o 0'0.. .-o ID 0.08... c:
Cl. Soithe-0 Herring·0.04
Cod
0 , I i I I r I i-70-50-30-1010 .3050 70
Elevation n(b) 0.16
VJ...c: :::Jo 0:;;.0o~ 0.08g- '(ij... c:
Cl. o 0.04
/ ..~- -. Herring" ..... Soithe
" Cod
o I i I I I I I i20 40 60 80 100 120 140 160
Bearing (')
Fig.4.8 Spatial distribution of nearest neighbours as a function of (a) elevation and (b) bearing in schoolsof cod, herring and saithe (after Partridge et al. 1980)..

Schooling Behaviour 75
gadoids are more likely to have their neighbours directly alongside, while herring tendto prefer neighbours at 45° and 135° (Fig. 4.8). Partridge et al. (1980) thereforeconcluded that individuals in schools position themselves so that they can mostquickly respond to their neighbours, a statement that so far has ended the search foran undiscovered geometric packing structure of fish schools. They also argue that thespatial school structure reflects the sensory capabilities and manoeuvrability of eachspecies.
The degree of structure in the school organisation is species dependent. The nearestneighbour proportions show that herring schools are more structured than those ofsaithe and cod. Partridge et al. (1980) claim that the structure mirrors the amount oftime the fish spend in schools because the obligate schooler herring arrange moreorganised schools than facultative schoolers like the gadoids. The cod school structure is close to that expected at random, however, which is in agreement with theimpression of cod as a weakly facultative schooler.
4.8.5 Internal synchrony
The position of individuals in schools is not fixed even if there are tendencies to acertain spatial structure within the school based on preferred angles and distances tothe schooling companions. The individual swimming speed varies considerably in aschool moving at constant speed, and the individual positions within the schoolchange substantially (Partridge; 1981).
The synchrony of the moving school is maintained, however, as individuals matchchanges in swimming speed of their neighbours with a time lag of about 0.2 s (Hunter,1969).The time lag is longer for neighbours changing speed in front and rear than forthose directly alongside (Fig. 4.9). This is because the response to a neighbourchanging velocity depends on perception of relative motion. The number of degreesthrough which the neighbour changes position will be,greater and easier to detectalongside than in front and rear. In the narrow binocular field directly in front, theperception of changes in relative motion is increased, and consequently the lag isreduced. The result of the relative motion perception is that the fish shows maximumcorrelation to the movements ofneighbours directly alongside and in front (Partridge,1981). In response to fright stimuli, sticklebacks (Gasterosteus aculeatus) minimise theapproach time to a conspecific according to body orientation and initial distance(Krause & Tegeder, 1994).This means that the stickleback is able to take into accountthe time necessary for turning and for swimming toward the conspecific which isfaster to join.
The individual fish matches the swimming speed to its nearest neighbour betterthan to the second and third nearest neighbour (Partridge, 1981). However, a certaincorrelation to the speed of the second nearest neighbour at short lags indicates thatthe individual fish does orientate to more than one neighbour. Similarly, the correlations of heading to neighbours in a school are not very high, and no better to thenearest neighbour than to the second or third nearest neighbour (Partridge, 1981).This implies that individuals adjust their heading not only according to that ofthenearest neighbour, but also on the basis of headings of a number of surrounding fish.

76 Chapter 4
90' -
\
/
O·
I
I180·
/
\
- 90·
I
~Fig. 4.9 Reaction latency of schooling jack mackerel to swimming behaviour change of nearest neighbourrelated to bearing. Full circles represent 0.1, 0.2 and 0.3 s latency, respectively (after Hunter, 1969).
These findings were used in simulation by object-oriented models by Huth andWissel (1993, 1994) to test the 'front priority rule'. This rule means that only theneighbours in front ofa fish are recognised by this fish. They averaged the influence ofa maximum of four front neighbours on the swimming behaviour of a given fish(repulsion at short distance, parallel orientation at intermediate distance, attractionat long distance). The authors compared successfully the results ,of their simulations(frequency of nearest neighbour distance, index of polarisation, time spent by a fish atthe top of the school) to experimental data found in the literature. They showed that aleader fish is unnecessary for simulation of realistic school behaviour (merging of twoschools, splitting, exploitation of a food path, higher efficiency of the school tomigration according to a gradient of better abiotic condition compared to a singlefish). Nevertheless, the Huth and Wissel model fails to simulate the formation processof schools, as underlined by Reuter and Breckling (1994) who proposed an alternativeIBM in which a fish is influenced by all visible neighbours. Huth and Wissel (1994) didnot agree with this model and instead suggested a modification to their own model byincorporating a dynamic range of sight which would allow a longer range of sight forfish not surrounded by neighbours. This controversy illustrates the need for a combination of field observations, laboratory experiments (e.g. distance of perception byvision and lateral line) and simulations in this branch of science as in many others.
Formation of subgroups can also affect school synchrony. Subgroups can be quitestable over time, and members of one subgroup show high correlations to members ofthe same group, but low or negative correlations to members of other groups (Partridge, 1981). For the school to exist as a unit, the movements of adjacent subgroupsmust be linked even if they are not quite synchronous (Pitcher, 1973).

Schooling Behaviour 77
4.8.6 Individualpreferences and differences
There are individual preferences for positions within a school. These may induce sizesegregation within schools because of each individual's preference to swim amongneighbours of similar size, as observed for herring and mackerel when schooling in asmall net cage (Pitcher et al., 1985; Fig. 4.10). The size preference may indicate afunctional aspect of schooling in that individuals swimming beside neighbours ofsimilar size may gain a hydrodynamic advantage (Weihs, 1973). Individual positionpreferences that are not size dependent may also exist within schools. This wasobserved in a saithe school in which individuals varied in length by a factor of 2.5(Partridge, 1981). Magurran et al. (1994) observed schooling preferences for familiarfish in small schools (12-15 fish) ofguppy (Poecilia reticulatai. The existence of such apreference in schools of several thousand individuals, a common size for marinepelagic fish, is questionable.
Individual differences in ability to school are also quite plausible. Herring diseasedby the fungus Ichthyophonus hoferi are not able to participate in normal schools andare less able to avoid trawls (Kvalsvik & Skagen, 1995). During predator-evasionmanoeuvres, individuals frequently become isolated from the rest of the school. To
(a) 26
... 24::30.0 ...........c E
22O>(.J.~ '-'"
C..c-- 0> 20Ul ce Q)0-Q)
Z 18
16 j j j j
24 28 32 36
(b)
...::3o.0 .........s: EO>(.J
0Qj '-'"
C..c--0>Ul Ce Q)0Q)
z
36
32
28
24
20 i44
Length of reference fish (cm)
Fig. 4.10 Distribution of nearestneighbour size in (a) herring and (b)mackerel schools swimmingin net cagessubmerged in a Scottish sea loch (afterPitcher et al., 1985).

78 Chapter 4
keep within the functional school is fundamental as isolates or stragglers are moreeasily predated (Major, 1978). Within the functional school, however, peripheralindividuals may in fact be safer than those sited more centrally if the predator performs striking attacks (Parrish, I989a). Individual differences in schooling abilityamong those that keep within the functional school are therefore probably not easy todetect but can be simulated by object-oriented models (Romey, 1996). Of five saitheexamined within a school containing a total of 16individuals, there was no consistentdifference in nearest neighbour distance or degree to which the five individualsmatched either the velocity or the heading of their nearest neighbours (Partridge,1981).
4.8.7 Packing density
The school volume is generally proportional to the number of individuals and thecube of the average body length (Pitcher & Partridge, 1979). This means that thepacking density of schools in number of individuals per unit volume decreases ininverse proportion to the length of the fish. The mean volume per/fish is larger insaithe schools than in herring schools. This indicates that even if the nearest neighbour distance is larger in herring schools, the overall structure is more compact anddense than that of the saithe schools. The density in the herring school observed byPitcher and Partridge (1979) is comparable to that observed for minnows and pilchard when schooling in small tanks, but free-swimming herring schools in natureseem to school at a density which is an order of magnitude lower (Radakov, 1973;Serebrov, 1974; Misund, 1993b; Fig. 4.11). This discrepancy has caused speculationon the reliability of school structure studies on fish confined in artificial environmentsin small tanks, but also on the accuracy of the observation methods used in the field.
1000
,.....,I')
I
E
oc'-'
$'(jicQ)
"0
0"C:i:oon,
O.I.Jrr~......~...,.J,-,.....Iy-~"""'~"""'~""""'''''''''''~''''''''~TTT''''''''''''''''''.-.-r"l5 10 15 20 25 30 35 40 45 50 55 60
Fish length (cm)
Fig.4.11 Packing density of schools relined to fish size (after Misund, 1993b).0 = Saithe; 0 = herring; 0
= sprat.

Schooling Behaviour 79
4.8.8 Packing density structure
When observing herring and sprat schools with a high resolution sonar, Cushing(1977) observed that the packing structure within the schools was rather heterogeneous. This has been confirmed by measurements of free-swimming schools usingphotography and high-resolution echo integration, which shows that the packingdensity distribution in capelin and clupeoid schools varies considerably (Serebrov,1984; Freon et al., 1992; Misund, 1993b). Regions of high density are usually foundwithin the schools, and even empty vacuoles have been recorded. In capelin andherring schools, the packing in the densest regions is comparable to that recorded inlaboratories (Serebrov, 1984;Misund, 1993b). Similar high-density regions have beenrecorded by photographing within anchovy schools in the Pacific (Graves, 1977).Misund and Floen (1993) observed by repeated echo integration that there were largevariations in internal packing density among schools, but that a single school seemedto maintain a certain packing density structure for time intervals of up to about 10min (Fig. 4.12).
EIIIN
50 m
Density no. m-3
D,~~••<0.1 0.1-1 1-3 3-8 >8
Fig. 4.12 Packing density structure of aherring school as recorded during threesuccessive transects by a small researchvessel (after Misund & F1oen, 1993).
To explain how such large internal variations in packing density may occur within aschool, Misund (1993b) proposed the 'moving mass dynamic' hypothesis. This is basedon the great dynamic of individual positions within schools (Partridge, 1981) whichresults in rapid changes of neighbours and small differences in swimming speed amongindividuals. School members matching changes in speed and direction of their nearest

80 Chapter 4
neighbours within short time lags (Hunter, 1969; Partridge, 1981) may cause shortterm variation in speed and level of arousal among different regions of a moving massof individuals. If individuals pack more densely at greater speeds or level of arousal(Pitcher & Partridge, 1979; Partridge et al., 1980),this could cause variation in packingdensity between regions of the school. As relatively small changes in nearest neighbourdistances may create large changes in number of fish per unit volume, such variationmay be especially pronounced in free-swimming schools with a much lower overalldensity compared with more compact 'aquaria' schools. The internal speed and densityvariations may be especially apparent when large schools change direction, comeacross patches offood or respond to predators. High-density regions or empty lacunasmay thereby be the result of the moving mass dynamic within the schools.
Freon et al. (1992)explain the internal variations in packing density of schools by acompressing/stretching mechanism. According to this hypothesis, the interfish distance decreases, especially at the periphery, when the school is confronted by danger(Fig. 4.13). When the stress is very strong, the interfish distance decreases rapidly to aminimum and all the vacuoles in the near part of the school collapse quickly. Thereaction may be rapidly transmitted throughout the school, but due to a certainattenuation in the propagation, several repeated stimuli may be necessary to compressthe school as a whole. From such a dense packing, the school stretches out as individual exploratory behaviour starts taking place, and the interfish distance may reachthe upper limit. Then the stretching/tearing phenomenon occurs: a given individualmust choose which fish to join in order to maintain this maximum stretching distancewithin the normal range, and small vacuoles start appearing (Fig. 4.14). The individual following the 'disrupting' fish then faces the same problem, but with a greaterintensity because the possibility of keeping an equal distance from neighbours meansa greater withdrawal from each of them. As a consequence the vacuole enlarges.Freon et al. (1992) observed that such internal vacuoles do not move with the school,but rather that the fish move around the vacuoles as a river flows around rocks.
4.8.9 . School shape
Adopting a special external school shape may reduce the probability of detection bypredators. Several authors (Breder, 1959, 1976; Cushing & Harden Jones, 1968;Radakov, 1973)claim that this is achieved with a spherical shape in which the area-tovolume ratio is minimised. Partridge and Pitcher (1980) argue that a disc shape willbetter reduce the chance of being discovered.
In general, the horizontal dimensions of schools are greater than the vertical. Thisgives a discoid shape that differs to a certain extent among species. Oshihimo (1996)found that the horizontal extent was about five times the vertical extent in anchovy(Engraulisjaponicus) schools that were ,distributed in shallow water « 50 m depthjinthe China Sea. The shape is seldom constant, but changes continuously as individualsperform various manoeuvres. Freoner al. (1992) observed from an aircraft that aHarengula clupeola school in a shallow bay at Martinique varied from an.amoeboid,unstructured form to a densely packed, egg-shaped type (Fig. 4.15). During a onehour period the surface area of the school varied from 145-522 m2
• Some species.Iike

(c)
Schooling Behaviour 81
Fig. 4.13 Compression of a school during apredator evasion reaction (after Freon et al.,1992).
herring, form schools in which the shape varies less than schools of other species(Partridge et al. 1980).
By aerial photographs of daytime schools or night-time school bioluminescence,Squire (1978) found that most schools of northern anchovy (Engraulis mordax) wereshaped like rods and ovals. The average length-to-width ratio of the schools was 2.1:Iduring the day and 2.5:I at night. Misund et al. (1995) found that about 70% of theherring schools in the North Sea had a compact appearance (circular, oval or square),about 20% were more stretched (shaped like a rod or parabola), and about 10% wereamorphous. Hara (1985) observed that the shape of Japanese sardine iSardinopsmelanostictat schools was related to size. Elongated or crescent-like schools were 10min width and 100-200 m in length, while oval schools were at most 20-30 m across.
. The shape of herring schools is dependent on swimming depth (Misund, 1993b).Midwater schools are spherical while schools close to the surface and bottom are

82 Chapter 4
(a)
(b)
limei lime i + 1
Fig. 4.14 The stretching of a 'school through formation of internal lacunas (after Fre~n et al., 1992).
discoidal. This may indicate that the spherical shape is primary according to thedetection-minimisinghypothesis, but that other functional or ecological aspects resultin more flattened schools close to the surface or sea bottom.
4.8.10 Factors affecting school structure
A school is a functional unit in which each individual participates to its own benefit.In principle, everything that affects the individual's fitness may also affectthe school

Schooling Behaviour 83
145 m2 405 m2
522 m2
Fig.4.15 Variation of horizontal area of a Harengula c1upeolaschool during one hour as recorded from anaircraft. The small black bar represents the size of an observing scuba diver (after Freon et al., 1992).
structure. Most schooling fishes live in close contact with their predators (Major,1977), and the main function of a school is not to minimise detection probability butrather to reduce predation probability after detection (Pitcher, 1986). This reductionis achieved when the schooling individuals cooperate in complicated predator-evasionmanoeuvres such as fountain, ball packing or flash expansion in which the schoolstructure changes dramatically within tenths of a second. Freon et al. (1993b)observed that a bonito lure that approached Harengula schools induced mainly localchanges in school structure, whereas the changes due to attacks from real bonitoswere dramatic (Fig. 4.16), and could even lead to splitting of the school.
Schooling fishes find food faster and can spend more time feeding in the vicinity ofpredators due to increased vigilance and reduced timidity (Pitcher, 1986). Duringfeeding, the individuals may behave more or less independently and thereby break upthe functional school to a more loosely organised shoal. However, if necessary due toa severe predator threat, individuals in visual contact can rapidly reorganise theschool. In free-swimming Sardinella schools, Freon et al. (1992) often observed thatone part of the school broke up the structure to feed, while the rest of the schoolcontinued polarised and synchronised swimming.
Among the proximate factors affecting the functional school structure is hunger.Individuals deprived of food tend towards an individual food-search behaviour andthereby loosen the school structure (Morgan, 1988; Robinson & Pitcher, 1989a,b; Fig.4.17). A similar explanation has been given for the phenomenon that youngerindividuals organise looser school structures than adults because the younger andfast-growing stages have relatively higher food requirements (Van Olst & Hunter1970).
The benefits of schooling increase asymptotically as the number of participants

84 Chapter 4
•••••••••••••• • ••••••••
................ . .
-:Iil*" ------'/E,p,li"@W-----e----·.y... 11-. "::::::::::::::. .:::.
...., .-----·--._5/;:i__ ._. .__._._~
• Dinghy (5 m 2 )
• ModelCJ Moderate density~ High density
Fig. 4.16 Aerial observations of Harengula c/upeola school reactions during three passes of a dinghytowing a model predator above the same school (after Freon et al., 1993b).
14
z;. 12"Cii ...--...c.cIV (J1
"U;.;:::
0'C 0~ L.o IV0.0Q.EC :JoSIV~
10
8
6
4 i
After 24 hIo
i5
I10
I15
i20
i25
Minutes after food
Fig.4.17 Packing density of a herring school as a function of diet ration (after Robinson & Pitcher 1989a).(....) 130g diet; (- - -) 40 g diet; (-) 10g diet.

Schooling Behaviour 85
goes up. Individual benefits will therefore be highest when school size increases fromlow numbers. This is reflected as a tendency towards more compact packing as theindividuals rely more on the movements of their neighbours when the size of smallschools increases (Partridge et al. 1980). Ross and Backman (1992) found that subyearling American shad (Alosa sapidissima) spent more time schooling the larger thegroup, and that schooling in larger groups enhanced vigilance.
At faster swimming speed, individuals also pack more densely (Partridge et al.1980; Partridge 1981). Individuals gain a better monitoring of each other's movements when the interfish distance is reduced, and this may be necessary for keeping upthe functional school structure at faster speed. A lower internal synchrony, with arelatively wider range of individual speed variation and change of positions, indicatesthat the internal school structure is more difficult to maintain when swimming faster(Partridge, 1981).
A source of substantial variation in internal school structure is the formation ofsubgroups. Such groups have been observed in saithe schools containing more than10 individuals (Partridge, 1981),and in small schools of minnows (Pitcher, 1973) andherring (Pitcher & Partridge, 1979). Relatively independent movements of suchclusters of individuals can open up empty spaces and cause large variation in schoolvolume.
Physical environmental factors also to a certain extent affect the structure ofschools. This probably occurs indirectly as the schooling individuals have preferencesfor environmental conditions such as current, temperature, light level and oxygencontent, within certain limits. This probably affects just the external organisation ofschools. As the schooling individuals may prefer to swim within definite depthintervals due to such preferences, this will set the limits for the vertical extent of theschools. Off Peru most anchoveta (Engraulis ringens) are found between 20 m downand a vertical boundary at 40 m depth where there is an onshore undercurrent with anoxygen content less than 2 ml C' (Villanueva, 1970). During the 1977 El Nifio, thisvertical boundary occurred at about 20 m depth and forced the schools closer to thesurface, where they were exposed to an offshore current and high temperatures(Mathisen, 1989).
It is more doubtful whether physical environmental conditions directly affect theinternal structure of schools. In schools of migrating Mugil cephalus, MacFarlandand Moss (1967) observed that the amount of dissolved oxygen declined towards therear of the schools where surface rolling, the highest packing densities, and tendenciestowards loosening of the school structure by leaving of small subgroups, occurred.The higher densities at the rear were probably not an effect, but rather the cause, ofthe lower dissolved oxygen content. The schools' structural changes were thereforemore likely the result of predator-prey interactions taking place at the rear, becausemigrating Mugil cephalus suffer from heavy predation (Petersen, 1976).
Koltes (1984) observed seasonal variation in the packing density of an Atlanticsilverside (Menidia menidia) school (Fig. 4.18). The school was loose, but activethroughout spring, less active in a compact mill in summer, dense in the autumn, andmostly had a random organisation of individuals in winter. The packing density of theschool was not correlated with temperature or photoperiod, but there was some

86 Chapter 4
3.5 Spring Summer rail Winter
.D
----- 3.0QJ
U·c
Q 2.5....,(f)
"0
I.-2.0
:l0
.D 1.5..cOl
'Qjc 1.0
....,(f)QJ
0.5l.-QQJ
Zo I i i i i i
140 184 228 272 316 360
Time (Julian day)
Fig. 4.18 Seasonal variation in packing density of an Atlantic silverside school (after Koltes, 1984).
indication of a lunar cycle. Koltes (1984) argued that the seasonal variation in thepacking density of the school correlated with annual spring and autumn migrations
. within New England estuaries. Similarly, Hergenrader and Hasler (1968) observedthat yellow perch (Perca flavescens) formed dense schools in summer, but looseaggregations in winter.
The numerous factors affecting school structure and shape ofa given species make itdifficult to automatically allocate echo recordings to different species. Due to theplasticity of school geometry and internal structure, the algorithms used for schoolidentification have limited performance. These algorithms are able to identify onlysome species with an acceptable error, though their performance improves if they arecalibrated for each survey when used in neural networks, or if they have input fromsophisticated wideband frequency equipment which has been tested only on caged fish(Haralabous & Georgakarakos, 1996; Scalabrin et aI., 1996; Simmonds et aI., 1996).
4.8.11 Factors selecting for homogeneity, structure and synchrony
After having considered all these proximate factors affecting school organisation, wemay reasonably ask if there is any school structure at all. From their detailedinvestigation of the three-dimensional structure ofherring, cod and saithe schools,Partridge et al. (1980) claimed that the school structure is present in a statistical senseonly. Similary, Pitcher (1986) concludes that homogeneity and synchrony have beenoveremphasised in schooling. Both arguments are in clear contrast to the groupselectionistic view of schools as regularly spaced, synchronously behaving units ofonespecies of equal size. The variations quantified in relative positioris, speed, interfishdistance and spatial distribution weretoo great to support arguments ofschools beingorganised according to regular geometric . lattices, however. There is also clearevidence of interindividual tensions in schools such as the skittering behaviour .of

Schooling Behaviour 87
minnows under predator threats (Pitcher, 1986). Such selfish behaviour indicates thatindividuals try to maximise the advantage of schooling at the expense of others. Theonly remains of a homogeneous, synchronised behaving geoinetric organisation isthat schooling individuals maintain a minimum of free space around themselves,prefer certain positions relative to each other, and match changes in the swimmingmovements of their neighbours within short time lags.
However, there is doubt as to whether the experimentally based conclusion isconsistent with our image of schooling. Laboratory observations have been madeexclusively in small tanks and net enclosures, some rectangular, others circular. In allset-ups, however, the observed schools have been constantly turning. Therefore thequantified structure is skewed. In addition, the coordinates of neighbours on bothsides of an individual have been pooled. Even if there were no significant differencesamong coordinates from the right and left sides of an individual, the total variance islikely to have increased, thereby creating an impression of a more random schoolstructure than is real.
In most studies of schooling, the nearest neighbour distance has been used as ameasure of structure. Whether this parameter is appropriate for this purpose isdoubtful, however. Due to the internal dynamic, individuals may rapidly changeneighbours. Two fish that are nearest neighbours in one video tape frame may beinvolved in different nearest neighbour relationships in the next frame. If the interfishdistance varies within preferred limits, a neighbour's status as the nearest, secondnearest etc. may alternate constantly. The nearest-to-second-nearest-neighbour proportion may therefore give the impression that the school structure is more occasionalthan in reality.
In many circumstances it is the characteristic homogeneous, synchronised andstructured organisation that makes schooling advantageous. During migrations, theroute may be more precise as the path of the school will be the average of eachindividual's preference. On such occasions, individuals may gain an additionalhydrodynamic advantage if they swim with neighbours of similar size and in certainpositionsrelative to each other. Such preference of similar-sized neighbours, as hasbeen shown to exist in herring and mackerel schools (Pitcher et al., 1985), thereforeselects for homogeneity in schools. Similarly, large size variation may cause splittingof schools into separate size groups due to asymmetric pay-offs in .intraspeciescompetition during feeding (Pitcher et al., 1986), and size-assortative schooling in thepresence of predators (Ranta et al., 1992). These factors select for homogeneity in sizeof the' individuals participating in a school, as has been shown to exist in capelinschools in the Barents Sea (Gjeseter & Korsbrekke, 1990) and gilt sardines offSenegal (Freon, 1984).
In large pelagic schools, not all fish can be expected to have consumed equalamounts offood and the same occurs in large schools of migrating gadoids (DeBlois& Rose, 1996). Hungry schooling fish tend towards individual food-searchingbehaviour, which may create tensions among the individuals, and this may eventuallybreak up the school structure into subschools of more equally fed individuals(Robinson & Pitcher 1989b). This indicates that the homogeneity of schools mayapply also to the motivational state of each individual participating.

88 Chapter 4
During predator threats, the factors resulting in homogeneous, synchronisedschools may be especially pronounced. In mixed-species schools, one species may bemore conspicuous than the other, and sorting by speciesmay reduce the probability ofone species beingmore susceptible to predation than the other. Similarly, there maybe species differences in organisation and performance of predator-evasion tactics(see following section).
To be effective, tactics to evade attacking predators rely on the cooperation ofeachindividual. The point of such tactics is performance of organised spatial structureswith precisely synchronised swimming movements. This increases the confusion ofthe predator and enhances the survival probability of the individuals. Those individuals performing best have the highest probability of surviving, those losing positionare most likely to be predated. The selection forces for homogeneous, synchronisedand structured schooling are therefore quite strong and obviously are evolutionarilystable.
4.9 Mixed-species schools
Mixed-species schools or shoals seem common in demersal and semi-demersal fishcommunities, especially in coral reef ecosystems in the tropics (e.g. Ehrlich & Ehrlich,1973;Alevizon, 1976).In contrast, fewer in situ observations of mixed-species pelagicschools are reported. Hobson (1963) observed the association of flatiron herring(Harengula thrissina) and juvenile anchovetas (Cetengraulis mysticetus) in the sameschool in the Gulf of California. Radovich (1979) observed large schools of northernanchovy (Engraulix mordax) surrounded by small groups of Californian sardines(Sardinops sagax). This low number of direct observations seems due to the poortransparency of the water in areas where several of the large commercial pelagicstocks are living (upwelling or river discharge areas). One of the best documentedexamples of in situ observation of mixed-species aggregation is provided by Parrish(1989b) in the relatively transparent waters of Bermuda (see later in this section).
Purse seine-fishery data may be used to identify the presence of such mixed-speciesschools of commercial species. Each set of a purse seiner is usually performed on aschool or a dense shoal which is totally or partially caught. The analyses of temperatefisheries data suggest that mixed-species schools are seldom caught, or that theassociation between species lasts only a short time and in particular areas. Forinstance, herring and mackerel can mix in schools for a short period during summer inthe North Sea. In the Bay of Biscay, mixed schools of anchovy and sprat or anchovyand horse-mackerel are often observed, even though their proportion is difficult toestimate using a pelagic trawl (Masse et al., 1996). Nevertheless, a single species isoften largely dominant in number and represents the bulk of the school. This contrasts with tropical or sub-tropical areas, where mixed-species schools are frequent.
In the Senegalese fishery, for instance, a database of 15419 sets performed from1969to 1987shows that most of the schools of gilt sardine are a mixture of two species(Sardinella aurita and S. maderensis) or an association with horse mackerel (mainlyCaranx rhonchus) or mackerel (Scomber japonicus) (Table 4.1). The proportion of

Table 4.1 Half Burt table showing the eo-occurrence of the two species of gilt sardine in a single set, according to their body length group (empirical commercialcategories by increasing size from I to VIII), from 1969 to 1987. The lower line represents the mixing ratio of the two species, regardless ofgroup size and other species,and the diagonal line of numbers corresponds to non-mixed schools (from Freon, 1991).
Species Size Sardinella aurita Sardinella maderensisI 11 III IV V VI VII VIII I 11 III IV V VI VII
S. aurita I 8811 0 86III 0 4 476IV 0 I 4 2608V I 2 0 5 3314VI 0 0 0 0 5 305VII 0 0 I 8 2 0 3258VIII 0 0 0 0 0 0 0 136
S. maderensis I 42 5 10 9 6 0 0 0 8911 0 45 13 45 2 0 2 0 0 113III 36 11 210 164 175 4 3 3 4 3 641IV 2 14 108 1746 1487 50 132 44 2 0 7 4724 V:l...,V 0 2 9 110 1083 77 375 26 0 0 5 10 2103 ;:r-
eVI 0 0 0 5 34 63 7 0 0 0 5 6~ 11 121 e-.VII 0 0 0 6 4 0 99 0 0 0 0 0 0 0 120 ~.
Mixing ratio % 91 90 74 80 84 64 19 54 81 95 94 76 80 90 91 I~l:l-ec'l:::..,
00\0

90 Chapter 4
mixed schools varies according to season and to the threshold retained for the definition of mixed-species schools (Fig. 4.19). In most cases, one of the species is largelydominant. The different species in a mixed school would usually have similar bodylengths, and in general, species of similar body shape school together (Freon, 1984).The comparison of length ranges in individual mixed schools of gilt sardines and allschools caught in the small fishing area shows that the association between species isrelated first to similarities in body length and shape and then to species groups (Table4.2). Nevertheless, the usual dominance in number of a single species in mixed schoolsstrongly suggests that fish of the secondary species join a school of a different specieswhen they are not abundant in a large enough number to form a school on their own.This supposition is supported by the low abundance of the secondary species duringthe season of its common association with other species in the area.
80
70>.uc 60Q):::lCT 50Q)'--"0 40Q)....
30.2:::l
E 20:::l
U10
o 70 65 60 55 50 45 40 35 30 25 20 15 10 5 1
Threshold of mixing rate(% secondary species)
Fig.4.19 Cumulative frequency of the occurrence of mixed schools in the Senegalese commercial fisheryaccording to the threshold of mixing rate chosen (expressed as a percentage of the secondary species).
Similarly, tuna are known to seldom school only with conspecifics. Skipjack tuna(Katsuwonus pelamis) are mainly caught by purse seine or pole and line in associationwith other tunas in the Eastern Atlantic (Table 4.3; Cayre, 1985)and in the Pacific aswell (Brock, 1954). Tuna are frequently associated with drifting floating objects('logs' or drifting artificial objects set by fishermen), or with fixed, permanentstructures (anchored FADs, seamounts, islands, etc.). In a given area, the assemblageof mixed-species schools in this various type of object is different, and it also differsfrom the assemblage in non-associated schools (Hallier & Parajua, 1992a). Anotherparticularity of tunas is their frequent association with schools of dolphins, especiallyin the eastern Pacific Ocean (Chapter 6). This association between fish and mammalscan be considered as a mixed school in so far as there is no predator-prey relationshipbetween the two groups, the two species being of similar size.
The arrangement of the different small pelagic species inside the school is not welldocumented. Nevertheless Parrish (l989b) observed layering in a heterospecificassemblage of four species of morphologically and ecologically similar fish: two

Schooling Behaviour 91
Table 4.2 Comparison between length ranges in individual mixed schools of gilt sardine Sardinella auritaand Sardinella maderensis and all schools caught in the small fishing area (15 n.mi") from May to November1978 in Senegal (from Freon, 1984).
Mixed schools All schoolsS. aurita + S. maderensis S. aurita S. maderensis
Month Mean Length n Length n Length nrange range range
27.2 8 319
528.1 7 202
22 3131 14 94222.8 II 32723.9 12 213
24.7 9 214
623.4 II 269
22 2470 20 27542\.8 II 49624.0 8 25623.0 9 306
23.4 12 386
722.4 8 355
11 1168 16 318422.9 8 26122.0 7 35023.3 8 216
23.4 9 218
823.2 10 327
23 1215 15 342420.6 10 366
22.9 10 23421.1 10 256
920.5 12 333
I1 1667 22 402920.0 13 39620.4 II 36622.9 II 327
21.9 . 7 256
\021.7 9 270
19 2119 19 339621.6 8 29720.6 8 26520.0 8 380
21.1 8 362
1121.1 9 276
24 1989 18 238419.8 15 40218.4 14 374
. .
Table4.3 Frequency of skipjack tuna (Katsuwonus pe/amis) monospecies and mixed schools (with othertuna species) in the east Atlantic (from Cayre, l985). .
Purse seinePole and line
Monospecific skipjack schools
10.1%-11.5%
Mixed skipjack schools
89.9%88.5%

92 Chapter 4
clupeids (Jenkensia lamprotaenia and Harengula humeralis), an engraulid (Anchoachoerostoma) and an atherinid (Allanetta harringtonensis). Up to seven fish-typeswere defined according to the species and the size (except for A. harringtonensiswhich had a single fish-type). Usually two to four fish-types were observed in asingle aggregation. This assemblage formed shoals or schools, and it was possible toidentify three distinct layers inside. The surface layer was occupied by A. harringtonensis, the middle one by J. lamprotaenia (juveniles and adults) as well as juveniles ofA. choerostoma and H. humeralis, and the lowest layer occupied by adults of A.choerostoma and H. humeralis. In general, smaller fish were found in higher positions than large ones. The big tunas associated with dolphins are travelling underthem at the same speed (Anon., 1992). Aggregations of tuna under floating objectsalso stratify according to body size and species: the smallest fish are near the surface(skipjack tuna, juveniles of other tuna species) and larger fish are found below,sometimes as deep as 200 m, and therefore there is no continuity between the tworelated schools (Anon, 1992; Josse, 1992). Therefore layering according to the sizeand species seems frequent in mixed-species schools (other examples are reported byParrish, 1989b).
Other types of spatial segregation between species, besides layering, have beendescribed. Hobson's (1963, 1968) in situ observations indicate that the anchovetaswere forming well defined sub-units, often located in the centre of the school, surrounded by herring. During her observation of mixed-species layers, Parrish (l989b)noticed that juveniles of H. humeralis were usually observed in small discrete schoolssingle. Freon (1988) described tropical, mixed clupeoid schools inside large enclosuresin coastal waters of Venezuela where three species occupied different positions: thebulk of the school consisted of Sardinella aurita while Opisthonema oglinum wereobserved in the rear part and Harengula jaguana partially covered the upper part ofthe school.
Some of the advantages of monospecific schools remain obviously the same formixed schools: effective food detection (when the diet is the same), hydrodynamicadvantages (when existing), and some aspects of survival to predators such as dilutioneffect or early detection. However, the confusion effect may decrease when the different species in a school are so different in colour or shape that they can be distinguished by the predator, especially if one species is present in a low proportion.Hobson (1963, 1968) reported that in a school consisting of 90% herring and 10%anchovetas, the latter suffered a selective predation by pompano (Trachinotus rhodopus) in a ratio of 6 to 1 although located in the centre of the school. This authorsuggested that anchovetas were more conspicuous because of their flashing gillcovers. Coral reef species abandon mixed group when threatened, leaving sooner if agroup has fewer conspecific members, but continue schooling if enough of their ownspecies are present (Wolf, 1985). Allan and Pitcher (1986) observed that mixed shoalsof cyprinids actively segregated when under threat of predation (by a pike model) by atendency to join conspecifics. Similar findings exist for other animals, especially birds(Powell, 1974; Bertram, 1978; Caraco, 1980). This tactic could be selected for tworeasons: better coordination with conspecific neighbours and therefore more effectiveevasion manoeuvres, and enhancing the predator's confusion by increasing locally the
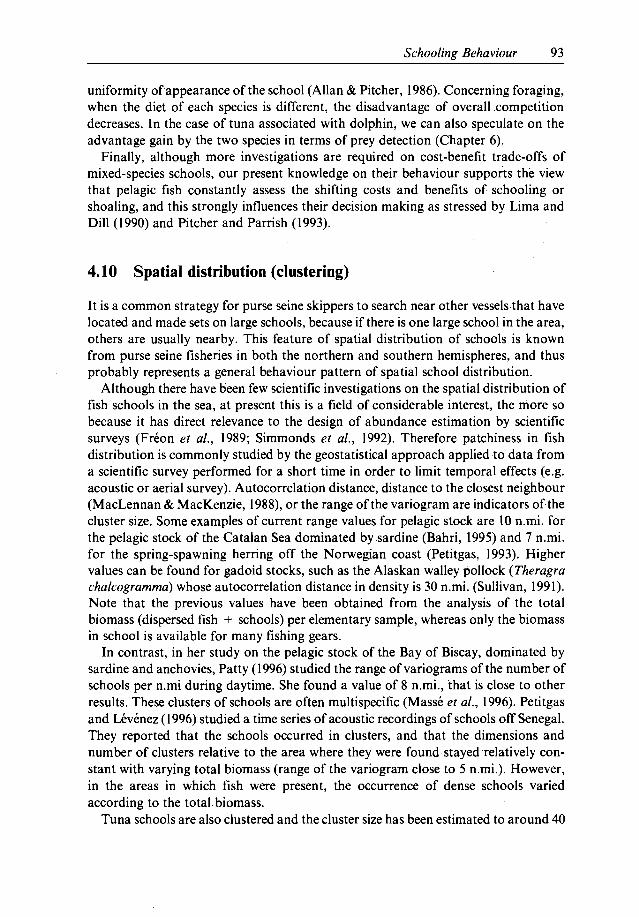
Schooling Behaviour 93
uniformity ofappearance of the school (Allan & Pitcher, 1986). Concerning foraging,when the diet of each species is different, the disadvantage of overall competitiondecreases. In the case of tuna associated with dolphin, we can also speculate on theadvantage gain by the two species in terms of prey detection (Chapter 6).
Finally, although more investigations are required on cost-benefit trade-offs ofmixed-species schools, our present knowledge on their behaviour supports the viewthat pelagic fish constantly assess the shifting costs and benefits of schooling orshoaling, and this strongly influences their decision making as stressed by Lima andDill (1990) and Pitcher and Parrish (1993).
4.10 Spatial distribution (clustering)
It is a common strategy for purse seine skippers to search near other vessels that havelocated and made sets on large schools, because if there is one large school in the area,others are usually nearby. This feature of spatial distribution of schools is knownfrom purse seine fisheries in both the northern and southern hemispheres, and thusprobably represents a general behaviour pattern of spatial school distribution.
Although there have been few scientific investigations on the spatial distribution offish schools in the sea, at present this is a field of considerable interest, the more sobecause it has direct relevance to the design of abundance estimation by scientificsurveys (Freon et al., 1989; Simmonds et al., 1992). Therefore patchiness in fishdistribution is commonly studied by the geostatistical approach applied to data froma scientific survey performed for a short time in order to limit temporal effects (e.g.acoustic or aerial survey). Autocorrelation distance, distance to the closest neighbour(MacLennan & MacKenzie, 1988),or the range of the variogram are indicators ofthecluster size. Some examples of current range values for pelagic stock are 10 n.mi. forthe pelagic stock of the Catalan Sea dominated by sardine (Bahri, 1995) and 7 n.mi.for the spring-spawning herring off the Norwegian coast (Petitgas, 1993). Highervalues can be found for gadoid stocks, such as the Alaskan walley pollock (Theragrachalcogramma) whose autocorrelation distance in density is 30 n.mi. (Sullivan, 1991).Note that the previous values have been obtained from the analysis of the totalbiomass (dispersed fish + schools) per elementary sample, whereas only the biomassin school is available for many fishing gears.
In contrast, in her study on the pelagic stock of the Bay of Biscay, dominated bysardine and anchovies, Patty (1996) studied the range ofvariograms of the number ofschools per n.mi during daytime. She found a value of 8 n.mi., that is close to otherresults. These clusters of schools are often multispecific (Masse et al., 1996). Petitgasand Levenez (1996) studied a time series of acoustic recordings of schools off Senegal.They reported that the schools occurred in clusters, and that the dimensions andnumber of clusters relative to the area where they were found stayed relatively constant with varying total biomass (range of the variogram close to 5 n.mi.). However,in the areas in which fish were present, the occurrence of dense schools variedaccording to the total biomass.
Tuna schools are also clustered and the cluster size has been estimated to around 40

Schools
94 Chapter 4
n.mi. by Fonteneau (1985) using georeferenced data of purse seiner catches on a smalltemporal and spatial scale. Similarly small scombroids like the western mackerel(Scombrus scombrus) display a patchy distribution, in large clusters of about 40 n.mi,and the clusters are separated by distances of up to 50 n.mi. during migration (Walshet al., 1995).
The reason for school clustering remains largely speculative. It is probably relatedto the patchiness of the environment (Schneider, 1989; Swartzman, 1997), but socialbehaviour is also likely to play an important role which is presently not well understood.
Finally, the spatial structure of pelagic fish species (one or several mixed species)can be qualified by 'fractal' distribution (Fig. 4.20): in a wide area of the speciesdistribution there are different discrete populations and within each populationseveral clusters of schools can be found. Within the school the spatial distribution canalso be very heterogeneous with several nuclei or cores.
Population 1
~~~\!ti..Y~~------
Population 2
4.11 Communication
Fig.4.20 Simplified diagram showing the 'fractal' distributionof pelagic fish species.
Fish aggregate in schools to increase their individual fitness. Organisation of theschool unit does not fulfil the rules for packing in rigid geometrical patterns, but thereare tendencies to preferred positions relative to other individuals. This probablyindicates that each individual tries to maximise the information flow from itsneighbours, so as to keep up with the movements of the functional school. Theparticular school structure is therefore organised to enhance interfish communication. In fact, during predator threats, schooling blackchin shiners reorganise from aflat, hydrodynamically effective positioning to a vertically extended structure inwhich the visual field of each individual is improved (Abrahams & Colgan, 1985).

Schooling Behaviour 95
Efficient interfish communication is a fundamental factor when individuals performcomplicated predator-avoidance manoeuvres with remarkable synchrony andprecision without colliding.
4.11.1 Vision
Visual sensing is fundamental to the formation of schools. A common behaviouralfeature of pelagic schooling species is that the schools break up into looser-organisedshoals at night. This dispersal is thought to arise mainly because the individuals losevisual contact with each other in darkness. Experiments have shown that schoolstructure breaks up at light intensities around 10-8 j.lE S-l m-2 for jack mackerel(Hunter, 1968) and at 10-7 j.lE S-l m-2 for Atlantic mackerel and Astyanax (John,1964;Glass et al., 1986;Fig. 4.21). Other authors claim higher values for other species(about 1O-6j.lE S-l m-2 for northern anchovy, Hunter & Nicholl, 1985) butcomparison of light intensity thresholds for schooling is difficult due to differences inexperimental set-up and measurement procedures.
Position holding and movement monitoring within functional schools are also
Light intensity VJ,Es-1 m-2 )
Fig. 4.21 (a) Nearest neighbour distanceand (b) angular deviation of schoolingmackerel related to light intensity. Curve =
average. Shaded region = ± standarddeviation (after Glass et al., 1986).
,....~ 75c.9"0.:;
50QI"0
'- 'v---J.2
~~::J0" 25c-c
o I i10-0 1.0
(a) ,....E'-'
QI0.65
;~ ~oc i11 ~ ~:,BVl
:.0 0.45
'-::J0.0..c::
0.250"'q;c
.....VlQI 0.05 I'- 10-0 10-8 10-3 10 30 1.0QIz
(b) 100

96 Chapter 4
based partly on visual sensing. Fish deprived of other sensory information by havingthe afferent lateral line nerves cut or by being placed behind transparent barriers arestill able to perform schooling behaviour, but the position preferences relative toother fish are changed. Such fish have to rely purely on visual cues for their positioning and therefore tend to take up positions directly alongside and nearer theirneighbours to better monitor changes in swimming movements (Cahn 1972; Pitcher1979b; Partridge & Pitcher, 1980; Fig. 4.22). Determination of heading to individualsalongside is more difficult than to those in front. In a school oflateral-sectioned saithethis results in an increase in angular deviation from 2.5° as for a normal school to10.4°. Partridge & Pitcher (1980) therefore claim that vision is of primary importancefor maintaining interfish position.
VISUAL
o01
I
/-'
NORMAL
do
do
..............---_.... "
igO
g'O50Bearing to neighbour n
o r-,---r----r----,r-----,10,
(a) 70
... 60::J0
.D
..c,....... 50·~E(1) uc"'-" 40-- (1)(J) o(1)... c0 0 30(1)--c.~
"0 20c0(1)
::::; 10
0 , ,10 50
(b) 0.3
'0 (J)... 0.2c ::J0 0
:..J..o... ..co 0'a..- 0.1o (1)... ca..
Fig.4.22 (a) Nearest neighbour distance and (b) spatial distribution of neighbours related to direction ofbearing of lateral line-sectioned saithe. (-) Normal nearest neighbour. (- - -) Visual orienting nearestneighbour (lateral line sectioned) (after Partridge & Pitcher, 1980).
Social communication in schools is mainly visual. For predator-evasion tactics tobe efficient, individuals in the school that do not see the predator must perceive andreact to the change in behaviour of their neighbours. As in the Trafalgar effect, thismay occur faster than the approach of the predator itself. Minnows that could see a

Schooling Behaviour 97
group of conspecifics, but not a predator model, stopped feeding and started hidingwhen their conspecifics reacted to the approaching predator by inspection behaviourand skittering (Magurran & Higham 1988). Likewise, isolated juvenile chum salmon(Oncorhynchus keta) stopped feeding and remained motionless when exposed toalarmed conspecifics (Ryer & Olla, 1991). When some school members come acrossfood patches and start feeding, neighbouring individuals will observe the changedbehaviour and join the foragers (Pitcher, 1986).
4.11.2 Lateral line
Swimming fishes generate low-frequency water displacements or net flow that can besensed by neighbouring fish through the lateral line system. During schooling,gathering information on the swimming movements of neighbours through the lateralline system is fundamental for maintaining a normal school structure. Pitcher et al.(1976) showed that blinded saithe were able to school, but with slighly changedpositional preferences. Quite surprisingly, blinded fish school at greater nearestneighbour distance (Partridge & Pitcher 1980; Fig. 4.23). Such fish tend to take upnormal bearings, however, but slightly above their nearest neighbours. Blinded fish
(a) ... 60:::J0.0.r:;,..... 50.Q' ECl) uc'-'" 40..... Cl)IIICl) U... c
30o 0Cl) .....c .!Q
-020c
0Cl)
::::E 10
0 , ,10 50 do 170
NORMAL
,\\
\
~~I
II
-'
(b) 0.3
--o III
C ~ 0.2o 0~..Q... .r:;g,ge ~. 0.1
a..
LATERAL,
\\
\
o0,I
I
"do9'0
,50
o r-,--,.-----r--,..----,10
Bearing to neighbour (")
Fig.4.23 (a) Nearest neighbour distance and (b) spatial distribution of neighbours related to direction ofbearing of blinded saithe. (-) normal nearest neighbour. (- - ') lateral line orientating nearest neighbour(blinded) (after Partridge & Pitcher, 1980): .

98 Chapter 4
are also able to match short-term changes in swimming movements as well as normalfish, which led Partridge and Pitcher (1980) to conclude that lateral line sensing isparticularly important for monitoring changes in swimming speed and direction ofneighbours. This is especially important during quick predator-evasion manoeuvres.Fish with severed lateral lines occasionally collide during startle responses (Partridge& Pitcher 1980), whereas normal fish never do (Blaxter et al., 1981). However, even ifmaintainance ofschool structure is possible by lateral line sensing alone, formation ofschools probably is not.
4.11.3 Hearing
During swimming, the movements of fish are preceded by transient pressure pulses(Gray & Denton 1991). The pulses have their maximum intensity at low frequenciesand within the hearing range of fish. The pulses decay rapidly with distance from thesource, for whiting by the power of-1.5, for herring by the power of-2.5. This indicatesthat the pulses are nearfield effects, but their sound intensities are above the detectionlevel offish at a distance below about 0.5 m. The spatial distribution and polarity differfor species like whiting and herring. Whether the fast pressure pulses play a role ininterfish communication during schooling has not been tested. However, there arecertain factors that indicate that this is likely, even if saithe that were both blinded andlateralis sectioned were not able to school (Partridge & Pitcher 1981).
The pressure pulses are detectable at interfish distances observed during normalschooling (below one body length). For herring, the quadri-lobed emission pattern ofthe pressure pulses coincides with the diagonal position preferences in that the individuals tend to take up bearings in which there are minima in the pressure fields.fromthe neighbour (Fig. 4.24). In these positions the individuals can best monitor changes inswimming speed and direction of the neighbour on the basis ofchanges in the pressurefields. If hearing plays a role complementary to the other senses during schooling, thepossibility exists that schools can be maintained perfectly in the absence of thedominant visual sense. In fact, herring have frequently been observed to school atsubstantial depth even in darkness at night-time (Devoid, 1969; Misund, 1990).
4.12 Schooling, modern fishing and natural selection
Fish schools are easier to locate in the sea than fish swimming individually. This.applies for visual detection when fish schools are breaking the surface, and when theschools generate bioluminescence close to the surface at night. Similarly, for fishfinding by acoustic instruments, the probability of detection is much higher forschools than for single fish (MacLennan & Simmonds, 1992).
When schooling, pelagic species often aggregate in great numbers in a unit thatoccupies a limited volume. This greatly increases the potential for catching a largeamount of fish in a short time, and has led to the development of surrounding netsand large towed nets. In particular, the combination of large purse seines orpelagictrawls, hydraulic handling equipment and acoustic fish detection instruments hasproved to be a very effective way of fishing. By these methods, several of the biggest

Schooling Behaviour 99
oE:I l'J 0 Ii!I
~OOoD'/lO
IlJID
0.5
<1 Po"1-2 Po • D
2-5 Po IiI 0
5-10 Po Ell 0>10 Po fI 0
Fig. 4.24 Distribution of low-frequency pressure pulses around swimming herring. Filled squares =
compression; open squares = decompression (after Gray & Denton, 1991).
clupeoid stocks in the world have been fished down to very low levels. This has beenthe fate of the Hokkaido-Sakhalin herring, the Downs herring, the Atlantic herring,the Pacific sardine, the Japanese sardine, the South African sardine and the Peruviananchoveta, and has caused the loss of a total fish production in the order of 10 milliontonnes annually (Murphy, 1980).
The life history parameters of the clupeoid stocks can indicate a critical stockrecruitment depensation (Ulltang, 1980).This means that if the stockofspawners fal1sbelow a certain critical value, it wil1 not be able to produce the number of offspringnecessary to sustain the population. Theoretically, clupeoid fish populations maythereby go extinct. Bjerndal and Conrad (1987) showed that the closure ofthe fishery atthe end of the 1977 season saved the North Sea herring from possible extinction.
From a conservation-orientated view, we may therefore argue that schooling offishes is a disadvantage because this makes such species more vulnerable to capture.When many pelagic species reach a fishable size, the mortality due to fishing is oftenmuch higher than the natural mortality. The argument may therefore be put forwardthat the advantages of schooling gained in predator avoidance may be lost throughthe higher probability of being fished.
We may therefore speculate on how the modern fishery affects the schoolingbehaviour of fishes. Because the fishery may be the main cause of mortality whenmany species reach a certain size, does the fishery thereby select against schooling?Does the fishery exhibit a selection force that in the long run mediates a geneticallydetermined change in the schooling behaviour of fish? Could this result, for instance,in enhanced vigilance and avoidance of fishing vessels, and smal1er schools that aremore difficult to capture? Certainly there is no evidence to support such speculations,but there are some indications that may support them.

100 Chapter 4
The capture success for Norwegian purse seiners when fishing herring in the NorthSea was about 63% for the 1985 and 1986 seasons, and at about the same level asexperienced when the purse seine fishery started in this area in 1963 (Misund, 1986).At that time the biomass was about three times higher than in the 1985 and 1986seasons, but since then the stock has been fished down to a critically low level (Burd,1990). The equipment used for fishing in the 1980s was considerably improved fromthat being used in 1963. The purse seines have nearly doubled in size, the vessels aremuch bigger, the hydraulic gear-handling equipment is more powerful, and theacoustic fish detection instruments are far more sophisticated. Modern sonars notonly detect schools but also have a substantial tactical improvement in that they noware able to track the movements of both vessels and fish schools (Bodholdt & Olsen,1977;Bodholdt, 1982).Still, there does not seem to have been any improvement in thecapture success for schools in the Norwegian summer fishery for herring in the NorthSea in this period. We may therefore reasonably speculate whether there has been achange in behaviour of the schools so that they have become more difficult to catch,and whether this change is genetically determined. The possibility that the changemay have been caused by learning is less probable, as the fishery was closed from 1977to 1984 while the stock recovered.
However, even if the fish exhibit 'the highest mortality when many pelagic speciesreach a certain size, it is still the forces of natural selection that exert the main impacton the younger life stages. The natural death rate is tremendous in the first larvalstages, probably mostly due to predation, but also probably in part due to starvationif the larvae hatch in areas with little food or are brought out of such areas byadvection. When the larvae start schooling, the natural death rate levels off (Moksness & 0iestad, 1987). The adaptive value of schooling is therefore significant, andthere will be strong selective forces for schooling in the youngest stages of the lifehistory. Most schooling pelagic species are also preyed upon inlater life stages, andthis, together with the other functional advantages of schooling, will select forschooling throughout the life history of these species.
On certain occasions the predation pressure may be so great that large stocks ofsmall pelagic species may be reduced to a fraction of their usual size. In the BarentsSea, large stocks of young cod and herring exerted such heavy predation pressureupon the capelin that the stock declined from about 2.5 million tonnes in 1984 to afew hundred thousand tonnes in 1986 (Hamre, 1991). Other stocks of small pelagicspecies may undergo similar or even more dramatic stock size fluctuations because ofenvironmental events such as the inflow of warm water (El Niiio) that affects thestock size of the Peruvian anchoveta (Pauly & Palomares, 1989). However, this doesnot exclude the possibility that in the long run, heavy fishing mortality may modifythe behaviour of schools.
4.13 Conclusion
In this chapter we have considered probably the most characteristic and admirablebehaviour of pelagic fish: their schooling. The development of the understanding of

Schooling Behaviour 101
fish schooling behaviour is reviewed in a historical perspective, leading up to thepresent definition of schooling as fish in polarised and synchronised swimming. Thereis a genetic basis for schooling, and fish from populations that live sympatrically withpredators seem to be better schoolers than fish from less exposed populations. Theschooling behaviour develops when the locomotory and sensory systems becomefunctional in the latter part of the fish larvae stage.
The main function of fish schooling is to survive predatory attack, enhance feeding,gain hydrodynamic advantages during swimming, contribute to more precisemigration, and facilitate reproduction and learning. Fish organise schools thatbecome structured by maintaining a minimum approach distance and tendencies topreferred nearest neighbour distances and spatial positions relative to neighbouringindividuals. It is now possible to mimic schooling behaviour by IBM. The packingdensity in terms of number of individuals decreases in inverse proportion to the cubeof the length of the fish, and the density in free-swimming schools is usually an orderof magnitude lower than in schools in captivity. However, the packing densitystructure of free-swimming schools is rather heterogeneous, and regions of highdensity have been recorded. The horizontal dimensions of schools are generally largerthan the vertical, which gives schools a discoid appearance. This is the common shape
. of schools near surface or bottom, while mid water schools tend to be more spherical.However, the shape of schools varies considerably and is affected by predators,foraging, hunger, swimming speed, formation of sub-groups, and physical environmental factors. Mixed-species schools are common in some areas, and schools tend tooccur in clusters.
To keep the high synchrony within schools, fish communicate through vision,lateral line and possibly hearing. Vision is essential for school formation, but ablinded fish can still school through lateral line sensing.

Chapter 5Avoidance
Avoidance is a general term for behavioural patterns fish perform to move away fromstimulation that elicits fright or is sensed as unpleasant. During fisheries and stockassessment, avoidance can be of significance if the vessel, the monitoring instrumentsor the sampling gear generate stimuli to which fish react in a way that causes themeasured density to be lower than the actual value, or the recorded species composition and distribution of size groups to be different from the undisturbed ones. Withregard to avoidance behaviour of pelagic fish, Whichare mainly caught by large purseseines or pelagic trawls and directly assessed by the hydroacoustic method, we willconcentrate on avoidance elicited by sounds from vessel and gear. This is simplybecause avoidance reactions during pelagic fishing or hydroacoustic surveys oftenoccur within the range of sound detection, but usually beyond the range of visualdetection of vessel and gear. Despite this, vision plays a major role in an acousticsurvey when the fish is close to the vessel (Gerlotto & Freon, 1990). This occurs forsurface fish and in shallow water. Moreover visualsensing may be a determiningfactor in the capture of pelagic fish, because the final result of fish capture by purseseines and pelagic trawls may be determined by near-field avoidance reactions to thegear (Misund, 1994; Wardle, 1993).
5.1 Avoidance of sounds from vessel and gear
5.1.1 Ambient noise in the sea
People often describe the sea as a silent world. Few sounds revealing underwateractivity can be detected at the surface, and even during diving few sounds are detectedby the human ear. The reason is that the water-air interface is an effective barrier forpropagating sounds, and the human ear has evolved to detect sounds in air, not inwater. If a wideband hydrophone is put in the sea and connected to a loudspeaker, theunderwater environment appears far from silent. Adding a frequency analyser to thecircuit would reveal loud sounds beyond the frequency range of sound detection bythe human ear.
The sea is always in motion. Surface winds set up waves that wash the shores and. create oscillating bubbles and spray as the surface breaks and air is hit into the water.The wind also generates turbulence and pressure fluctuations due to wave and currentmotion: The sounds produced by these sources are usually dominant underwater. Inaddition, seismic events generate vibrations that are readily transmitted .as sound

A voidance 103
waves in water, and that can be detected hundreds of kilometres away from thesource. Then there are the marine animals which may produce sound to communicateor as a result of their motions. Man-made activities may also contribute, and oceantraffic may constitute a substantial part of the underwater sound in many regions.More locally and regionally, geological mapping by use of explosives to generateseismic waves may generate substantial sound underwater.
According to Wenz (1962), the various sources produce a composite ambient soundspectrum that is characterised by a dominant low-frequency region up to about100Hz. The low-frequency component falls off rather steeply by about -10 dB peroctave. Turbulence-pressure fluctuations due to eddies and long waves constitute themajor natural source of these sounds. However, depending on time and location,sounds from seismic sources such as earthquakes and underwater explosions maydominate parts of the spectrum below 100Hz. In the region 100--10000Hz thespectrum level drops by about -6 dB per octave, and the ambient level in this region isabout 5dB higher in shallow water than in the deep. The sources of the sound in thisregion are oscillating and collapsing bubbles (cavitation) and spray from surfaceagitation. Most of the sounds produced by ships are within this frequency region,with maximum energy output between 50 and 200 Hz. In addition, many soundsproduced by marine animals, such as the whale barks, the crackling potpourri ofshrimps and the chorus of croakers are within this frequency region. Above 20 kHz,thermal noise from molecular agitation starts appearing. The echolocation sounds ofthe porpoises are also of high frequency.
As the natural sound sources underwater are the result of wind-driven movements,the sound level in the region below about 20 kHz may vary substantially. In shallowwater, the wind may cause variations in the low-frequency component by about20 dB. Then there may be additional regional variation depending on the bottomdepth, degree of shelter and proximity to seismic sources. However, even during calmweather with a mirror-like surface, there may still be substantial sound in the lowfrequency region underwater due to the turbulence-pressure fluctuations generated byeddies and long waves. In the frequency region from 100 to 10000 Hz the wind maycause variations in the ambient sound level by about 40 dB.
5.1.2 Noisefrom vessels
Modern fishing and fisheries research vessels are steel-hulled and are powered bydiesel engines that drive the propeller. A running diesel engine generates substantialsound due to the cylinder firing and friction created by the revolving engine parts, andresulting vibrations in the engine block. These sounds are really an unwanted outputfrom the engine system and are therefore termed noise (Mitson, 1989). The noisesproduced are so loud that being in the engine room of an operating vessel for longperiods without ear protection may be damaging to human hearing. The noises arealso readily transmitted through the steel structure of the vessels, and the noise levelmay be irritatingly high in the cabins and working rooms of many older vessels.Legislation in many countries now sets limits to the maximum noise level in the

104 Chapter 5
various rooms and sections of vessels, and modern vessels are therefore built withprecautions that reduce internal noise substantially. -
The steel hull transmits some of the engine noise underwater. The hull may alsovibrate due to the hydrodynamic forces that act as it moves through the sea. Inaddition, the hull is affected by the propeller shaft which sets up vibrations andgenerates friction, and by the propeller itself at a frequency equal to the blade rate(rotations per minute multiplied by the number of propeller blades and divided by60). A revolving propeller also sets up strong negative pressures in the water thatpasses the propeller blades. This creates small bubbles that rupture and therebygenerate a loud, sharp sound, the cavitation noise (Urick, 1983). The sound fromthousands of collapsing bubbles merges into a continuous and characteristic 'hiss'from the propeller. The main cavitation mechanisms are negative pressure set up fromfront to rear along the propeller blade surface,and the vortex stream of bubblescaused by the tip of the revolving propeller blades (Mitson, 1992).
Underwater, the noise from the engines, the propeller shaft and the blade rate of thepropeller is transmitted by the hull mainly as discrete line frequencies. The frequencyrange in which these sources may be recognised will depend on the number ofrevolutions, but the shaft rate will usually lie from below 1 up to a few Hz, the bladerate from a few to about 10Hz, and the engine firing rate from below 10 up to over100Hz (Fig. 5.1). The line frequencies are superimposed on a more continuous
2000500125
: \i~. V~J.0 Engine and cavitation
Eos:
31.5
Q)"0_o
CD
B
.~coEo..c
~....o
..cl/l
>,ucQ)
::l0-
~~....o
..c-C/l
~- 110-
1'20~
160
E 170
-'--'0-
mu 100
2
150-0
o[fJ
o 1400-oI-o 130
E
Frequency (Hz)
Fig. 5.1 Distribution of sound intensity recorded at 10m depth, analysed in 1/24 octave and calculated tosource level at starboard side from the Norwegian purse seiner MV Ligrunn (769 GRT, engine 2250HP)when cruising at 10 knots.

Avoidance 105
spectrum generated by the propeller cavitation (Urick, 1983). This is best demon'strated if the vessel-generated noise is illustrated in a spectrum that presentsmeasurements carried out with a narrow, I Hz bandwidth. In such graphs the linefrequencies will appear as distinct spikes that rise above the more continuousspectrum. Harmonics to loud engine- or propeller-generated spikes may then berecognised at higher frequencies.
However, it is difficult to get a clear overall picture of a vessel's noise signaturefrom narrow band spectrum graphs. This can be gained by using a third-octaveanalysis where the energy is averaged over 1/3 of each doubling of the frequency, andwhich permits graphing of the whole vessel noise signature over the whole frequencyrange up to several hundred kilohertz. It is more difficult to distinguish line frequencies as the higher the frequency interval in which they appear, the more they willbe smoothed out, but they will contribute to a general rise in the actual frequencyintervals. The maximum energy output from the cavitation noise is in the frequencyrange from about 50 Hz up to about 1000Hz.
The vessel-generated sound follows the physical laws for transmission of sound. underwater. The noise energy therefore decays due to geometrical spread, whichcauses a decibel reduction in the level equal to 20 multiplied by the logarithm of therange from the source. Shadowing by the hull and the bubbles in the propeller wakegenerate a certain directivity in the transmitted sound (Urick, 1983). In front and aftof the vessel there will be lower noise intensity than to the sides (Misund et al., 1996).In a horizontal plane close to the surface, the minima will occur within 200 in the foreand-aft direction (Fig. 5.2). There will also be a similar directivity in the vertical plane.The noise intensity may also differ between the port and starboard sides of the vessel,depending on the direction of the revolution of the propeller and where noisyauxiliaries are positioned.
There are many other sources of variation in the underwater noise radiated fromoperating vessels. Naturally, the noise depends on the construction, power output andmounting of the engine and the auxiliaries, the size and construction of the vessel, thesize, number of blades and their design, and the pitch of the propeller. Therefore,different vessels will have different noise signatures. Comparison of some Europeanfisheries research vessels when running at 11 knots revealed an overall variation of asmuch as about 30 dB between the most silent and the most noisy vessel (Gamier et al.,1992). Even rather similar vessels may have substantial differences in the noise signature. Comparison of three Norwegian factory trawlers built after the same sheerdraught, that were equipped with engines of equal power output but with slightlydifferent propeller units, revealed substantial differences over the whole frequencyrange (Engas et al., 1995; Fig. 5.3). Modern vessels are often equipped with axialgenerators for production of electricity that require constant revolution of the mainengine. To adjust the speed,such vesselsare often equipped with a controllable-pitchpropeller that can be considered as an almost infinitely variable noise generator(Mitson, 1992).
At the end of the I960s, some concern was aroused in the Icelandic and Norwegianherring purse seine fleet that the underwater noise generated by the vessels had asignificant influence on the catch rates (Olsen, 1971). A series of noise measurements

Fig. 5.2 Horizontal distribution of vessel sound level at different centrefrequencies in 1/1 octave bandwidth recorded at 5 m depth. The dots in the125Hz plot mark the positions of the individual measurements. The soundlevel in dB//I mPa for each isoline is given in the figure (after Misund et al.,1996).
o0\
9.§~...Vi
RN 'Johan Hjort'
200o-200200o
130
~
-200200o-200200o-200
-250
500
.......E........ 250Q)0C0-(f)
0(5
Distance (m)

A voidance 107
150
o0...::t.
CD"0
QlL
::lIIIIIIQlL-a."0c::loVl
140
130
120
110
I i I I I I i12.5 31.5 80 200 500 1250 3150
I
5I
21OOJ rr-----r--,--...,------,--,-------.---,--.------,
0.8
1/3-octove centrefrequency (Hz)
Fig.5.3 Frequency disjribution at maximal sound intensity in 1/3 octave bandwidth during passage oftrawlers A, H, and C (after Engas et al., 1995).0 = Vessel A; 0 = vessel H; 0 = vessel C.
confirmed that operating purse seine vessels could be very noisy (Gjestland, 1968). Insome cases, extreme sound sources such as strongly cavitating propellers were diagnosed and the necessary action to reduce the noise was prescribed. There was also,some concern that the vessel-generated noise might have significant influence on thecatch rates in other fisheries and for other fishing methods (Chapman & Hawkins,1969; FAO, 1970).
A problem that has received some attention, especially on fisheries research vessels,is that the vessel noise can interfere with echo sounders and sonars working at about10kHz and higher, and can be a limiting factor in the fish detection capability of theseinstruments. However, most vessels are rather silent at such high frequencies.
Throughout the 1970sand 1980s, little effort was given to reducing the underwaternoise emitted from fishing and fisheries research vessels. The last, generation ofNorwegian factory trawlers, delivered between 1987 and 1989, was therefore builtwithout any special precautions to reduce underwater noise. Some of these vesselsexperience lower catch rates than expected and this is claimed to be the result ofstrong fish avoidance reactions (Engas et al., 1995). Special attention was paid to oneof the vessels which was claimed to be very noisy and to fish significantly less than theother trawlers. Indeed, a rumour arose that the other vessels had developed a tactic totake up a position somewhat behind and slightly to the side of the noisy vessel whentrawling. This was claimed to give higher catches because some of the fish in the pathof the noisy vessel were scared to the side and into the path of the trawlers following.
Likewise, series of fisheries research vessels have been built without any otherprecautions for the noise radiated underwater than that it must not interfere too muchwith the working frequencies of the acoustic fish recording instruments. An exceptionto this trend was the English RV Ernest Holt driven by diesel-electric engines mountedin an acoustic enclosure to reduce the radiated noise (FAO, 1970). On the Polish RV

108 Chapter 5
Pro! Siedilecki, antinoise and antivibration precautions such as an elastically supported propulsion system made the vessel more silent than conventionally builtresearch vessels (Ojak, 1988).
In some of the more recently delivered fisheries research vessels substantial effortshave been made to reduce the noise radiated underwater. The English RV Corystesdelivered in 1988 is so far the most silent among the operating European fisheriesresearch vessels (Gamier et al., 1992). A maximum noise level radiated underwaterwas specified for this vessel when contracted, and the vessels was therefore designed,constructed andengined to be silent (Kay et al., 1991). Control measurements ofunderwater noise during test trials revealed unacceptably loud noise due to thealternating current speed control, and a solution that eliminated this noise source wastherefore mounted (Mitson, 1989).It was also detected that polyamide bearings of therudder flap produced a loud squeal above I kHz each time the rudder moved (Mitson,1992), and therefore had to be replaced by bearings of another material.
For the Japanese Kaiyo-Maru, which was delivered in 1991, there were alsospecified certain criteria for maximum radiated noise underwater (Furusawa &Takao, 1992).A series of noise-reducing actions were therefore taken during building,and selection and installation of the engines and propulsion systems. Among others,the vessel is equipped with two engine systems: one diesel-engined propulsion systemfor ordinary operation, and one silent electric propulsion system to be used duringquantitative echo integration. Underwater noise measurements revealed that thevessel was more silent than specified. To avoid unwanted effects of vessel-generatednoise, future fishing and fisheries research vessels should be constructed and equippedso that the radiated noise underwater is minimised. Such objectives were appliedduring the new building of the French Thalassa and the Scottish Scottia.
5.1.3 Fish hearing
The hearing ability of fish has been mapped through experiments to find thefrequency range of sounds that fish can detect, and whether fish can detect thedirection and distance to the sound source. Several studies have also been conductedto reveal whether fish can discriminate frequencies, amplitudes and temporal structure of sound (Schwarz, 1985).Many experiments have been conducted in small tanksand aquaria, often constructed and arranged so as to reduce the noise from thesurroundings (Hawkins, 1981). Special tanks have also been constructed for standingwaves and with the possibility of varying the pressure and particle motion of thesound independently (Hawkins & MacLennan, 1976). To avoid unpredictable effectsfrom the tank walls, some experiments have been conducted in midwater in sea lochsand fjords, well away from reflecting boundaries (Chapman, 1970; Chapman andHawkins, 1974; Schuijf, 1975).
The hearing organ
Fish detect sounds through the otolith organs which are embedded in a pair oflabyrinths located in the skull: The labyrinths are complicated structures of canals,

A voidance 109
sacs and ducts filled with an endolymph fluid. There are three semicircular canalsorientated at right angles to each other. At the base of each canal there is an ampullacontaining sensory hair cells embedded in a cupula of jelly. Through these structures,fish sense spatial acceleration because the endolymph will lag behind movements ofthe canals and bend the cupula and thereby stimulate the hair cells.
Each labyrinth has three otoliths, the utriculus, sacculus and lagena. The otolithsare located in sacs connected to each other and the semicircular canals, and they areorientated at different axes in space. The stone-likeotoliths are made of calciumcarbonate and inorganic salts covered by jelly, and lie on a thin membrane thatprotects a macula of numerous hair cells. The membrane connects to both structuresand holds them in the same position relative to each other. The hair cells are made of abundle of apical cilia with an eccentrically positioned kinocilium and more than 40stereocilia (Rogers et al., 1988). There are numerous hair cells in the sensory epitheliaunder each otolith, and the hair cells are orientated in groups which have the kinocilium in the same direction as the ciliary bundle.
Each hair cell is directionally sensitive. Maximum depolarisation receptor potential is generated when the ciliary bundle of the hair cells bends directly in the direction of the kinocilium. Bending in the opposite direction causes a hyperpolarisationreceptor potential, while bending in any other direction induces a receptor potentialthat is proportional to the cosine of the direction of stimulation (Rogers et al.,1988)..
The otoliths are three times denser than water and the flesh of the fish, and thushave different acoustic properties. Imposed sound waves will cause movements of thefish body at the same amplitude and phase as in the surrounding water. The denserotoliths, however, will move at smaller amplitudes than the rest of the body and inadifferent phase. The otoliths and the sensory epithelia with the hair cells will thereforemove relative to each other as they are connected only by the thin otolith membrane.The cilia of the hair cells will bend proportionally to the particle displacerrients fromthe relative motions between the otoliths and the sensory epithelia. As the hair cellsbend they will produce physiological responses that are transmitted through thenervous system to the brain, where they are interpreted and analysed as sound. Thusthe signals from the hair cells contain information on the amplitude, the frequencyand the direction of the sound stimuli. Besides the function of sound detection, theotoliths are also gravistatic receptors, giving the necessary signals for determiningspatial orientation in most fishes (Platt & Popper, 1981).
The principle for sensing the particle motion component of imposed sound waves isregarded as the direct method of sound detection. Many fishes also have the possibility of sensing sounds through indirect detection of the pressure component ofimposed sound fields. This is possible through the swimbladder. Due to the highcompressibility of gas, sound pressure fluctuations will set up proportional motionsof the swimbladder wall (Sand & Enger, 1973;Sand & Hawkins, 1973).These motionsreradiate some of the imposed sound energy, and the reflected sound waves have anenhanced particle-displacement-to-pressure ratio. The reflected sound waves will setup proportional movements of the otoliths relative to the sensory epithelia, therebyproducing the necessary physiological signals for sound detection. This indirect

110 Chapter 5
method of sound detection seems most effective for frequencies above a few hundredHz(Fay & Popper, 1974, 1975).
Detection of direction and distance to sound sources
Implicit from the structure of the sensory epithelia of the hearing organs, fish are ableto detect the direction of a sound source. By observing the direction of avoidanceresponses of caged herring, Olsen (1969, 1976) found that herring could sense thedirection ofsound sources to within at least 45°, a result confirmed by Sorokin (1989).Using reward conditioning, Schuijf (1974) observed that the wrasse (Labrusberggylta) located sound sources to within + 20°. Similar accuracy in the ability to detectsound direction has been documented through both cardiac and reward conditioningexperiments for cod (Chapman & Johnston, 1974; Schuijf & Siemelink, 1974; Schuijf,1975; Hawkins & Sand, 1977).
Even a single sound wave in the sensitive frequency range is enough for the herringto receive sufficient information on amplitude and direction of the sound source, andthereby elicit directional avoidance responses (B1axter et al., 1981). The polarity (i.e.whether the sound wave starts with a compression or a decompression) does notmatter. This indicates that fish have a precise sensory system for spatial hearing thatrapidly determines the direction of the sound source. Although a proper, generalexplanation of how. such a system functions is still lacking, promising suggestionshave been put forward.
For fish without a swim bladder or any other sound-reflecting organ, the particlemotion of an impinging sound wave will make the hair cells of the sensory maculabend proportionally to and fro in the direction of the sound. This may indicate thatsimple vector determination of the direction of stimulation will give the fish thedirection of the sound source. The problem, however, is that sounds from directlyopposing sources will cause identical movements of the hair cells, and thereby produce the same nervous signals. This gives rise to 180° ambiguity in simple vectordetermination of the sound direction.
For fish having a swimbladder, an impinging sound wave will reach the otolithsboth directly and indirectly as a reradiation from the swimbladder. The indirectsound wave will contain no information on the direction of the sound source as itsdirection is only determined by the geometry of the swimbladder-labyrinth system.However, the direct and indirect sound waves will be out of phase. Moreover, soundwaves from diametrically opposite sources will produce unequal differences in phasebetween the direct and indirect stimuli. Schuijf (1975, 1976) therefore suggested that asystem for directional hearing could operate by resolving this phase difference inaddition to vector determination of the direct input.
There is experimental support for such a mechanism. Cod (Gadus moruha) havebeen shown to be able to discriminate sounds from sources positioned in front andbehind (Schuijf & Buwalda, 1975)and this was confirmed by Berg (1985) on whiting(Odontogadus merlangus), catfish iIctalurus nebulosus) and cod. The phase differencewas shown to be essential for this ability, as the fish interpreted the sound to comefrom a diametrically opposite source when there was an artificial inversion of this

A voidance Ill.
difference. Buwalda et al. (1983) showed that cod could discriminate sounds comingfrom opposite sources also in the vertical and transversal planes. Experiments withmanipulating the phase relationships in standing wave fields confirmed that the phasedifference of the direct and indirect stimuli was necessary for detection of the direction of the sound source. Rogers et al. (1988) put forward a complete hypothesis forfish hearing, including a numerical model for the directional determination based onvector and phase analysis in the central nervous system of the signals from the sensorymacula. The direction ofa sound source could be determined either by the principle ofperformed beams in which the sound is located to be within a definite directioninterval, or by an algorithm for detecting the incident angle of the sound directly.
The movements of the hair cells set up by an impinging sound wave will be thevectorial sum of the direct and indirect stimuli (Fig. 5.4). M unck and Schellart (1987)calculated that the particle displacement in waves reradiated from a prolate spheroidal air bubble which resembles a swimbladder will be elliptical orbits. By calculatingthe resulting displacements of the hair cells from the direct and indirect stimuli vectors, Schellart and M unck (1987) proposed that directional hearing could operatethrough simple vector analysis of the resulting elliptical displacement orbits of thehair cells. This model had difficulty in explaining how fish could separate sources at 0°and 180° which gave rather similar orbits. The model could also provide fish withdirectional hearing with just one ear, even though Schuijf (1975) had shown that twointact labyrinths were necessary for this ability. Based on experiments with rainbowtrout (Oncorhynchus mykissi, Schellart and Buwalda (1990) proposed a revised version of the orbit analysis model by incorporating an angle of90° of the indirect stimulivectors between the two otholiths in the calculation of the displacement of the haircells. This gave different displacement orbits for two functional ears for soundscoming from all different directions (Fig. 5.5).
However, despitethis promising hypothesis for directional hearing of fish having aswimbladder, it still remains to be explained how this is done in fish. without a
Directstimulation vector
Indirectstimulation vector
. Scatteredwaves
Fig.5.4 Direct and indirect stimulation of the inner ear by sound waves originating from the sound source .and scattered by the swimbladder, respectively (after Schellart & Buwalda, 1990).

112 Chapter 5
£.7~~5'
<> \~ 62 1
.5'
... \ ~~ I~ Cl
....... / 0~ ~
90'
Sound+
source
Left orbi~tRight orbit -
/ .
r..I~L5m
QVY1.
()
".:o~
r180'
eo
Fig.5.5 Orbits of the utricular maculae of a 30 cm cod with a 90° difference in the indirect vector acting oneach otolith. The upper and lower ellipses represent the left and right utricular orbit, respectively. Eachorbit pair gives the position of the swim bladder of the fish relative to the source position. The dashed linewithin each orbit represents the direct input. Left-right mirrored fish positions give the same result (afterSchellart & Buwalda, 1990).
swimbladder. Like sharks that have been shown to orientate towards low-frequencysound sources (Myrberg et al., 1976), it is probable that such fish have directionalhearing. As a substitute for the lack of an organ that transforms sound pressure toparticle displacement, Schuijf (1975) proposed that fish without a swimbladder, andsharks, could utilise the sounds reradiated from the surface or the sea bottom asindirect stimuli.
As with fish having a swimbladder, the threshold for directional hearing for thoselacking this organ lies above the absolute threshold for sound detection. In fish with aswimbladder, indirect stimuli will be stronger than direct stimuli, while the oppositewill. be the case for fish without a swimbladder. For cod, which has a swimbladder,Schuijf (1975) found that the threshold for directional hearing was about 6 dB abovethe absolute hearing threshold.
The phase relationship between the indirect sound stimuli transformed from soundpressure and the direct particle motion stimuli is dependent on range from the source.Analysis of this phase relationship could. therefore provide fish with perception ofdistance to the sound source. The distance dependence is most pronounced close tothe source. Based on experiments to determine the minimum phase difference codcould detect, Buwalda et al. (1983) proposed that cod could distinguish distances incategories of 0-1, 1-2,2-5 and more than 5m. Indeed, Schuijf and Hawkins (1983)found that cod were able to distinguish between sound sources placed 1.3, 4.5 and7.7 m away. Fish are therefore probably able to perceive the distance to sound sourcesat close range.

A voidance 113
Frequency range offish hearing
The frequency range that fish can sense is illustrated through audiograms (Fig. 5.6),which show the relationship between the minimum detectable sound level and frequency. Such audiograms have been established for a number cifspecies ranging fromherring and small goldfish (Enger, 1967),pollack (Pollachius virens; Chapman, 1973)and eastern mackerel (Scomber japonicus; Sorokin, 1987) to large yellowfin tuna(Thunnus albacares; Iversen, 1969). The general trend is that fish are most sensitive tofrequencies up to a few kilohertz, and seem incapable of detecting frequencies aboveID kHz. This means that fish are most sensitive to sounds in the frequency regionwhere fishing and fisheries research vessels have the maximum sound energy output.On the other hand, fish are not able to detect the working frequencies of mostechosounders and sonars (from 24 kHz to about 200kHz) .
.--...."- 500.o0"- 40()
'E30
<,OJ
20"U-.....-
cv 10>~
cv 0"-:::>(11(11 -10cv"-0..
"U -20c:l0 -30 I I i i i I I i
UJ 30 4050 100I I
200 300I I i I i I i
500 1000 2000 4000
Frequency (Hz)
Fig.5.6 Audiograms of pelagic fishes: herring (after Enger, 1967),eastern mackerel, Scomber japonicus(afterSorokin, 1987), pollack, Po//achius pollachius (after Chapman, 1973), little tuna, Euthynnus a/finis,and yellowfin tuna, Thunnus albacares (after lversen, 1969). 0 = Little tuna; 6 = yellowfin . tuna;• = eastern mackerel; 0 = pollack; • = herring.
Differences in the sensitive frequency range among species are linked to differencesin their anatomy. Fish having a linkage between the swimbladder and the inner ear,the otolith organs, can sense sounds both at lower intensities and over a wider frequency range than fish without a swimbladder or those having an isolated one.Hearing ability istherefore welldeveloped in the ostariophysan fishes, like the catfishtIctalurus nebulosus) and thecyprinids that have a bony structure (the Weberianossicles) between the swimbladder and the skull where the inner ear is embedded(Hawkins, 1986). In the cypriniform fishes there is also a close connection between thetwo organs, and in the Holocentridae the hearing ability seems proportional to thedegree of linkage between the swimbladder and the inner ear (Hawkins, 1986).

114 Chapter 5
Among pelagic species, the herring seems to have a very good hearing ability, beingable to sense frequencies of up to about 4 kHz (Enger, 1967). For cod that have anisolated swimbladder, hearing ceases above 470 Hz (Chapman & Hawkins, 1973).This is the case also for other gadoids such as haddock (Melanogrammus aeglefinust,ling (Molva molva), and pollack (Chapman, 1973; Fig. 5.6).. The herring has a direct coupling by a pair of pro-otic bullae connecting gas-filled
diverticula extending from the swimbladder to the perilymph of the otholith organ(Allen et al., 1976). A thin membrane under tension separates the swimbladder gasand the perilymph in the pro-otic bullae. When the herring changes depth, thecompressible swimbladder will change volume and gas will pass through the diverticula.to equalise the pressure. This probably ensures that the pressure in the gas ofthe otic bullae is equal to that in the perilymph at all depths and maintains a constanttension on the membrane (Blaxter, 1985). Imposed sound waves will be amplified bythe swimbladder and will set up vibrations in the membrane which are therebytransmitted to the perilymph and the inner ear. In herring there is also contactbetween the lateral line and the inner ear through a membrane on each side of theskull that separates the perilymph and the endolymph of the lateral line system.
Older audiograms indicated that the sensitivity to sounds decreased towards thevery low frequencies. However, more recent experiments have shown that species likecod (Sand & Karlsen, 1986), plaice (Karlsen, 1992a), perch (Karlsen, 1992b) andAtlantic salmon (Knudsen et al., 1992) can detect sounds in the infrasound region« 10Hz) at about the same low intensities as for higher frequencies (Fig. 5.7). Asgenerating very-Iow-frequency sound underwater is rather difficult, these experimentswere conducted in a specially constructed, standing-wave tube with the fish placed in
I I I i I IIj0.3· 1
I0.1
10- 3
,...,N
1Il<,E'-'
c0
10-4:;;0L.Q)
Qj00<i
I 1 i I i Ilq I i I I'ill I I I3 10 30 lQO 300
Frequency. (Hz)
Fig. 5.7 Infrasound threshold for cod for frequencies < 30 Hz, and with the ~otion sensitivity of theotolith organs for frequencies> 30 Hz recalculated from Chapman and Hawkins (1973) (after Sand &Karlsen, 1986).
,r,II,,,,
I,/IIII
.tI/
//
//
//
\ /\ /\ /\ I\ /\ . I\ I\ I~"

Avoidance 115
a central plastic cage. The sound waves were generated by vibrator-driven pistons ateach end of the tube.
The ambient noise level in the sea is a limiting factor for the hearing of fish,especially for those having a swimbladder (Hawkins, 1986). Buerkle (1968) showedthat the hearing threshold for cod could vary by nearly 20 dB depending on thebackground noise level in the experimental tank, and Chapman (1973) established adirect relationship between the background noise level and the minimum sensitivitylevel of pollack (Fig. 5.8). This ambient noise dependence induces difficulty incomparingaudiograms established both for a single species and among species. Theaudiograms established for goldfish differ by up to about 40dB in the most sensitivefrequency region, probably due in part to varying ambient noise levelsin the differentexperiments (Hawkins, 1973).
-5
~
'-Z -10o ''-.~
E<,ID3 -15
:2o •.cIII
~ -20.cI-
o
••
oo
o
I I i I-45 -40 -35 -30
Noise spectrum level (dB/microbar)
-25-',.-------,---.,---------,----,------,-50
Fig. 5.8 Relationship between thresholds obtained from pollack and ambient noise level for three frequencies (after Chapman, 1973).0 = 110Hz; 0 = 160Hz;" = 310Hz.
Another reason for caution when comparing various audiograms is that differenttechniques may have been used to measure the sensitivity of the fish. In mostexperiments, the fish have been conditioned to respond to detectable sounds byobtaining reward (food) or punishment (electric shock) in association with the stimuli. A much-used and objective technique is cardiac conditioning, where a clearlydetectable sound stimulus is followed by an electric shock. After repeated treatment,the fish willdevelop the cardiac response, which consists of a slowing of the heart rateupon detection of sound stimuli. Some experiments have also been based on electrophysiological recordings of the functioning of the hearing organs. For instance, asherring may be a difficult species to keep alive arid condition in controllablelaboratory conditions, Enger (1967)established a tentative audiogram for this speciesby measuring electric potentials in the brain of anaesthetised individuals. It istherefore to be hoped that a proper audiogram for live herring with full sensory

116 Chapter 5
capacity will be established in future experiments, as observations on the swimmingbehaviour during survey and fishing operations of this economically importantspecies are accumulating.
There are now indications that clupeoids in fresh water are able to detect soundstwo orders of magnitude higher in frequency than older literature indicates. Nestler etal. (1992) observed that blueback herring (Alosaaestivalis) reacted more strongly tohigh-frequency sounds between 110 and 140 kHz than to low-frequency soundsbetween 0.1 and 1kHz. Dunning et al. (1992) also found that the alewife (Alosapseudoharengus) responded to high-frequency sounds. Nestler et al. (1992) speculatethat high-frequency sound may be detected through the auditory bullae system, andthat the detection of high-frequency sounds may have evolved as a predator warningof the high-frequency echolocation clicks of whales.
Discrimination offrequencies. amplitude and temporal structure of sound
Fish can distinguish between frequencies of sounds. As with sound intensity, there areclear species differences in this ability (Hawkins, 1986). Fay (1970) found that agreater separation interval was required, the higher the frequencies to be distinguished. As a means for discriminating frequencies, fish seem able to filter out andtune in on particular frequencies. This enables detection of weak tones in the presenceof a high ambient noise level. However, sounds may be masked. by high noise thatoccurs at about the same frequency band (Buerkle 1969), and the higher the frequencyof the sound, the wider the frequency band of the noise that can mask it (Hawkins &Chapman, 1975).
Some fishes can produce and use sounds to communicate, for instance to findmates, during courtship or agonistic behaviour, but as far as we know this kind ofcommunication does not exist for pelagic species. The sounds produced are not verycomplex in frequency structure but can be modulated with a complex repetition rateand varying intensity. To be able to receive information through such sounds fishhearing has adapted to resolve the temporal structure of the sound, and goldfish seemable to distinguish pulses of short duration better than humans (Fay, 1970). Similaradaptations may exist for discrimination of sounds differing in amplitude, and haddock are able to separate 50 Hz tones differing by only 1.3dB in intensity (Hawkins,1986).
5.1.4 Fish reactions to noise
Fishermen have observed that the approach of noisy vessels might scare the fish. Thiswas especially noted during purse seine fisheries for herring in the I960s (Olsen, 1971).The reactions could often be observed during sudden changes of the vessel manoeuvring which caused simultaneous changes in the vessel noise. This was thereforetaken as a clear indication that the avoidance reactions were elicited by vessel noise.
Similarly, comparison of audiograms of gadoids and noise spectra emitted fromfisheries research and fishing vessels revealed that fish were most sensitive to soundsin the low-frequency region where the vessel noise was most intense (Olsen, 1967;

A voidance 117
Hering, 1968; Chapman & Hawkins, 1969; Freytag & Karger, 1969). Based on anaudiogram established by food rewarding of cod and noise measurements of theNorwegian research vessels RV G.O. Sars and RV Johan Hjort, Olsen (1967) suggested that the cod could hear the two vessels at distances of up to at least about 80 m.Hawkins and Chapman (1969) established another audiogram for cod by cardiacconditioning which indicated that the fish could be sensitive to noise from vesselsseveral miles away. The discrepancy between these two estimates is most probablydue to different ambient noise levels during the fish hearing experiments. This factorwas taken into account by Buerkle (1974), who measured the noise from a trawler atthe same location during summer, and in winter when the ambient noise level wasabout 10dB higher. Comparison of these measurements with previously establishedaudiograms for cod under different noise conditions (Buerkle, 1968, 1969), indicatedthat the fish could hear the trawler at 3.2 km away in summer and at 2.5 km in winter.Buerkle (1977) recorded higher gillnet catches of cod in the presence of a trawler,which indicated that the cod reacted to sound of the nearby trawler with increasedswimming activity and thereby higher probability of being caught by the gillnet.
The Olsen model
By generalising a substantial number of fish reactions to .an approaching surveyvessel, Olsen et al. (l983a) proposed a vessel avoidance model in which the lowfrequency vessel noise is supposed to be the eliciting stimulus (Fig. 5.9). At close rangeto the vessel, it is also assumed that the hydrodynamic pressure wave produced by thehull when moving through the water may have some effect. The model assumes thatthe vessel noise can be sensed by detection of the particle motion component of soundvia thereradiated indirect stimuli from the pressure-converting swimbladder.Avoidance reactions are supposed to be triggered mainly by a momentary increase inthe sound pressure, but the actual noise level from the vessel is also of importance.The sound pressure gradient will therefore be a relevant measure of the stimulus thatelicits the avoidance. To formulate the model mathematically, let P, be the pressureamplitude of the vessel noise as perceived by a fish at a distance R from the noisesource. The vessel noise pressure in the position of the fish is related to the pressure atthe noise source (Po) by:
Pr = Po/R (5.1)
If the vessel is running at a speed V and the fish is at an angle a from the horizontal ina plane coordinate system with the noise source in the centre, the pressure gradient ofthe vessel noise is expressed by:
dPf/dR = -Po/R2
• sin a· (V· cos a) (5.2)
The term (sin a) is an approximation for the assumed directivity characteristicsof thenoise source, and (V • cos a) is the component of the vessel speed in the direction ofthe fish. To reduce the strength of the imposed noise stimuli, the fish may react to theapproaching vessel by trying to swim away from it. This will alter the vessel noisegradient by:

118 Chapter 5
Distance
280 240 200 160 120
o
Acousticaxis
40160 120 80
Distance (m)
200
-f-----_ry/
//
//
//Max
/,<"'-pressure/ gradient
~
40
80
E 120
.cCl. 160'"0
200
240
280
(b)
(a)
Fig.5.9 The Olsen model. (a) Vertical distribution of pressure gradients from RV G.D., Sars at 12 knots.(b) Propagation of different stimuli. S, = pressure amplitude; S2 = pressure gradient; S3 = deviation fromdirect approach.
dPr/dR = -Po/R2 * sin a * {(V * cos a)-[Vr * cos (a-b)]} .(5.3)
The term [Vr * cos (a - b)] is an expression for the swimming speed component Vr ofthe fish away from the vessel where b is the tilt angle of the fish.
The connection between the sound pressure and the sound pressure gradient asrelated to the distance to approaching vessels is illustrated in Fig. 5.9. The soundpressure increases gradually as the vessel approaches, but reaches an asymptote justbefore the vessel passes over. This leads to a sharp drop in the sound pressure gradientjust before the vessel passes. Due to the directivity of the vessel noise, the fall in thesound pressure gradient occurs further in front of the vessel the greater the depth.Figure 5.9 also illustrates that fish that adjust their behaviour to minimise the noisestimuli directly approaching can reduce the imposed noise pressure substantially.
The pressure wave (Ph) induced by the movement of the hull may be sensed by fishclose to the surface. The nature of this stimulus is looked upon as originating from aBernoulli source, and is proportional to the length (L) and speed (V) of the vessel:
Ph =L2 * V2/R2 (5.4)
This indicates that the pressure gradient in this noise source will decrease in a manner inversely proportional to the cube of the depth. This is also the case for the

A voidance 119
nearfield wave stimuli from the propeller where the particle motion component (dp)
is given by:
dp = (l/R + l/R2) (5.5)
According to this model of the vessel noise stimuli, fish may minimise the imposednoise stimuli by performing avoidance swimming directly away from the approachingnoise source. Fish that react according to this principle will increase their swimming
. speed and swim gradually more downward as the vessel approaches. If fish come soclose to the vessel that they detect the nearfield stimulus from the hull or the propelleritself, panic reactions with fleeing in all directions may be elicited. The avoidanceswimming will cease when the fish are out of the near field and start perceiving thatthe avoidance swimming outruns the approach of the noise source.
Playback experiments
To study the isolated effect of vessel noise on fish behaviour, experiments have beenconducted by playback of vessel noise recordings to fish in pens. Schwarz and Greer(1984) recorded sounds from seiners (size 18-20m), trollers (size ISm), and gillnetters (size 12m). The sound pressure level was highest for the bigger vessels, whichalso generated most of the sound energy at lower frequencies than the smaller vessels.The sounds were projected at about 30 to 40 dB above the ambient noise level togroups of about 500 Pacific herring (Clupea harengus pal/as i) shoaling in a small netpen. To most sounds from the different vessel categories, the herring showed directional avoidance responses away from the sound projector. The responses occurred aschanges from shoaling activities such as feeding to organisation in structuredschooling and swimming in the lower part of the pen.
Occasionally, the herring performed startle responses with quick swimmingmovements for a short time when exposed to the vessel noise playbacks. Theresponses were most pronounced to the noise from the bigger vessels, but were alsosignificant for smaller vessels on accelerated approach, or triads of synthesisedsounds, contrary to natural sounds (rain on the water, predator noise or conspecificnoise). There was an inverse relationship between the number of groups thatresponded to a noise category and the number of groups that habituated to thatcategory. This indicates that the more effective the sound from a certain vesselcategory in eliciting avoidance responses, the lower the probability that the herringwere habituated to that sound.
A similar playback experiment was set up by Engas et al. (1995) to study fishreactions to sounds from a Norwegian factory trawler that was claimed to be noisyand therefore fishing less than the sister vessels (vessel A, Fig. 5.3). Groups of about20 cod or herring were placed in a small net pen (3 x 3 x 3 m) and exposed toplayback of sound recordings of the trawler through an underwater loudspeakerpositioned at 2 m depth and 11 m away from the pen. At that distance the fish wereheld outside the near field of the lowest frequencies transmitted of about 20 Hz(Hawkins, 1986). The fish were exposed to the original sounds recorded when the

120 Chapter 5
vessel was towing a bottom trawl, emitted at an intensity of at most about 40 dBabove the ambient noise level at the experimental site.
Both cod and herring reacted when exposed to the vessel noise. The cod packedtogether, polarised and swam slowly down to the bottom of the pen, up along the netwalls, and down to the bottom again. Prior to the playbacks, the herring were mostlyshoaling slowly just above the bottom of the pen. When exposed to the sound, theherring began strict schooling and swam in a diagonal path along the bottom of thepen. The reactions of both cod and herring were interpreted as distinct avoidance. Noalarm responses - as seen when the cod fled at burst speed to the bottom of the pen onbeing approached closely by a small skiff running at full speed - were observed duringthe playback sequences. The reason is probably the need for combined visual andauditive stimuli to elicit alarm responses.
To study whether there were frequency-dependent effects, the fish werealso exposed to sequences filtered to contain the original sound in frequencyregions to which the cod, according to Chapman and Hawkins (1973), has maximumsensitivity (60-300 Hz) and decreasing sensitivity (20-60 Hz and 300-3000 Hz).The herring seem to be maximally sensitive to sounds from 50 Hz to about 1200Hz(Enger, 1967), and should thereby have rather similar sensitivity to the threefrequency categories. Despite the filtering, the sound sequences contained substantialsound outside untouched frequency regions. The maximum sound level during theprojections of these sequences was from about 20 to 30 dB above the ambient noiselevel.
In the most sensitive frequency region for both species (60-300 Hz), the soundlevel for the sequences of the 20-60 Hz category reached about 118dB re I mPa.This is about 10dB above the hearing threshold for cod at an ambient noise level of90dB re I mPa when extrapolating from Chapman and Hawkins (1973). However,both cod and herring hardly reacted to the 20-60 Hz sequences, but performeddistinct reactions to the other sequences, which reached 5 to 10dB higher in themost sensitive frequency region. This indicates that the vessel noise level in themost sensitive frequency region is the main determinant for eliciting avoidancereactions.
Because fish are capable of discriminating sounds differing in temporal structure,sequences were also presented in which the temporal variation in the original vesselsound had been smoothed. These were obtained by editing the original recordingsby an automatic gain-controlled amplifier and subsequent triangle amplification.The fish were exposed to both full and frequency-filtered sequences that weresmoothed.
The. fish started to react to the smoothed sequences at the same time as to theoriginal sequences, which indicated that sound components that elicit the avoidanceresponses were present also in the smoothed versions. However, both cod and herringclearly judged the smoothed sequences to be different from the original ones as thefrequency of responses decreased and the reactions ceased earlier. This indicates thatthe temporal structure of vessel noise may have significance for the avoidancebehaviour offish, Similarly, Schwarz and Greer (1984) found that herring reactedmore to pulsed than to continuous sound.

A voidance 121
Analysis of catch data .
The catching efficiency of vessels depends on a number of factors, and acceptableconnections between the catch results and the sound characteristics of vessels aretherefore scarce. Engas et al. (1995) found that a Norwegian factory trawler, claimedto fish less than the others due to heavy noise, actually caught about the same per unitofeffort and even more cod (Table 5.1) than some of the more silent sister vessels (Fig.5.3). For saithe, however, the noisy vessel caught significantly less than the others(Table 5.1). At least this indicates that the heavy noise of this vessel may have anegative effect on the catching efficiency of saithe.
Table 5.1 Catch per unit effort (CPU E) in tonnes per hour of the noisy vessel A compared with the sistervessels Band C. The comparisons are made from catch data when the trawlers fished with bottom trawls inthe same area at the same time in the North Sea and the Barents Sea in 1988 (after Engas et al. 1995).
Species Vessel A Vessel B n Vessel A Vessel C nCPUE CPUE CPUE CPUE
Cod 0.72 0.45 41* 0.33 0.49 37Saithe 0.24 0.38 26* 0.16 0.28 31*
n = number of comparisons* = significant paired t-test at p < 0.01
Erickson (1979) found that trolling vessels that generated distinct, high-intensityspikes above 1500Hz in the frequency spectrum caught significantly less albacoretuna than those vessels generating a more even frequency spectrum. Foote (1979)proposed that this result could alternatively be explained by attraction to the vessels·generating a smooth sound spectrum because these vessels also generated the highestintensity at the lowest frequencies. However, Bercy and Bordeau (1987a) have alsoshown that high-intensity spikes in the frequency spectrum of vessel noise can affectthe catch of tuna. They categorised the sound spectrum from pole-and-line vesselsfishing for tuna in the Indian Ocean into those with a smooth spectrum, those withmedium-intensity spikes, and those with high-intensity spikes ranging 3-5 dB over theaverage spectrum (Fig. 5.10). The catch results of the vessels were then groupedaccording to the respective sound spectrum category. This revealed a rather evidentconnection between the catching efficiency and the sounds emitted by the vessel. Theless spiky the frequency spectrum, the better the catching efficiency. However, theamount of data is rather limited, and it is not known whether there are othercharacteristics of these vessels such as speed, rigging and handling equipment,instrumentation, age etc. that could categorise the vessels in a similar manner andthereby also contribute to the observed differences in catching efficiency.
Nicholson et al. (1992) conducted a fishing experiment with RV Corystes to test theeffect of a spike at about 300 Hz which ranged high above the spectrum level. Thespike was due to an alternating current speed control of the diesel-electric engines. Itwas possible to switch this speed control and thereby the spike on and off, and thiswas conducted during alternating trawl hauls in the North Sea. However, analysis of

21.5
Average catch: 22.7 tons
Average catch: 18.6 tons
Average catch: 16.6 tons
0.5
122 Chapter 5
10
0
~ -10L-o
.Cl-20
~CD"0.....,
10Qj>~ 0QJL- -10:J(11(11
QJ -20L-a.
"0c 0:Jo
(f)
-10
-20
-300
Frequency (kHz)
Fig. 5.10. Characteristic sound spectra and average catch rates of trolling vessels in the French tuna fleet(after Bercy & Bordeau, 1987a). . .
the catch data did not reveal any systematic influence of the high-intensity spike eitheron the species composition or on the size of the catches.
5.2 Visually elicited avoidance
As described in Chapter 4, vision is a fundamentally sensory modality for pelagic fishbehaviour, and school formation, social communication, feeding, and predatoravoidance rely on visual sensing of conspecifics, prey and predators. However, visionis a sensory modality for near-field orientation because of the high absorption oflightwaves in the sea. Avoidance reactions of pelagic fish that are initiated at some distance from vessel or fishing gear are therefore not elicited by visual stimuli, but ratherby sounds from vessel and gear as described in section 5.1. Nevertheless, visualsensing of approaching vessels and fishing gears such as purse seines or trawls at closerange may probably initiate even stronger avoidance reactions than those elicited bydistant sounds (Geriotto & Freon, 1990).
5.2.1 Light in the sea
Light is rapidly attenuatedin water by the water molecules, suspended matter andobjects present. Inclear sea water, lightcan reach down to more than 100m. Then the

A voidance 123
sea has a blue colour because maximum penetration is for wavelengths between 400and 500 nano-meter (nm). When the sea contains high concentrations of phytoplankton near the surface, most light is absorbed above 25 m, and maximum penetration is for wavelengths between 500 and 600 nm, giving the sea a more greenishcolour. The amount and spectral quality of the light sensed by fish will depend on theline of sight involved (Guthrie, 1986). Maximum visibility underwater is only about40 m in clear sea water under the most favourable light conditions (Tyler, 1969). In thepresence of high concentrations of phytoplankton or other suspended matter, thevisibility is often reduce to 10m or less.
5.2.2 Fish vision
Pelagic fishes have paired image forming eyes which conform to the vertebrate type(Guthrie, 1986). Lens focusing is done by muscular control of the distance to thereceptor cells, and not by changing the shape of the lens as in mammals. The fish eyehas a weak pupillary function only. The inverted retina contains rod pigments withpeak absorbency usually within the range 480-530 nm, and middle-or long-wavesensitive cones that probably assist discrimination of brightness contrast. Accordingto a classification by Levine et a/. (1980), fish living near the surface have doublecones that absorb in the range 460-570 nm with offset single cones absorbing atwavelength near 415 nm. Nonetheless, near-ultraviolet and polarised light photosensitivity have been described in several species of fishes, both freshwater and marinetaxa (Loew & McFarland, 1990). For mid water species, the pigment range is shiftedupwards by about 40 nm as an adjustment to the longer wavelengths presentmidwater.
The fish eye sees a field of vision of about 180°, and fish have binocular visionwhere the two fields overlap in a sector of 20°-30° to either side in front. There is acorresponding blind zone of about 20°-30° to each side of the fish tail. Therefore,when escaping a predator, a fishing gear or a vessel, fish perform a zigzag swimmingor display a circular movement around the detected danger ('fountain effect') in orderto maintain visual contact with it (Hall et al., 1986). To each side fish have a relativelylarge field of monocular vision of about 120°-140° where the ability for distanceperception is limited. When seen with one eye, it is difficult to distinguish a 7m meshof 23 mm twine at 40 m range from 1.7m mesh of 6 mm rope at 10m because bothobjects give a 10° image (Wardle, 1993). This is probably the reason why large meshesof thick ropes are effective in herding fish in the mouth of large midwater trawls.
The visual acuity of the fish eye determines the maximum sighting distance ofobjects, and is dependent on density of cones in the retina and the size of the object(Zhang & Arimoto, 1993). On the basis of the cone density in the eye of large walleypollock (Theragra chalcogramma), Zang and Arimoto (1993) estimated a minimumseparation angle of0.17°, and calculated the maximum sighting distance according to:
D = tt«
where I = object size and r:t. is the minimum separable angle in radians. According tothis, a 4 cm object can be recognised at a distance of 13m by large pollock. Smaller

124 Chapter 5
fish have a larger separable angle and thus shorter distance recognition. Visual acuityreduces with decreasing light intensity, and visual range is also influenced by thecontrast of the target. Anthony (1981) found that cod had about the same ability forcontrast discrimination as man, and observed a reduction of reaction distance withreduced contrast.
5.2.3 Avoidance reactions elicited by visual stimuli of vessel and gear
During pelagic fishing, visually based avoidance reactions probably depend onfishing gear, time of day, species, and motivational state of the species. When purseseining mature, shoaling herring on the.spawning grounds off western Norway inwinter darkness there is normally little avoidance, and the capture success exceeds90% of the sets (Misund, 1993c). In contrast, when purse seining mature, schoolingherring in the North Sea in summer daylight, the herring schools often avoid the netand escape out under the groundline or through the opening before the net is closed inabout 35% of the sets. Similarly, in the North Sea mackerel fishery in autumn daylight, the capture success is only about 65% due to avoidance reactions and escapement out of the net (Misund, 1993c). In both the herring and mackerel fisheries in theNorth Sea, the avoidance of the gear and subsequent escapement occur during the lastpart of the pursing when the fish are in close contact with the lower part of the net,and are probably frightened or herded out by the sight of the net (Misund, 1993c) inthe same way as in front of trawls (Mohr, 1971;Wardle, 1993).Similar day-and-nightdifferences in behaviour towards purse seines as described here for mature herring inwinter darkness and summer daylight are also reported for Pacific tuna (Scott &Flittner, 1972).
As described above for purse seining, pelagic fish are normally easier to catch bypelagic trawls when shoaling at night-time than when schooling in daytime. Thisindicates that visual sensing in daytime enables precise location of the gear andenhances coordinated escape reactions. On the basis of underwater observations,Wardle (1993) describes a fish behaviour model to trawl gear where the sound of thevessel causes the fish to swim deeper, eventually towards the bottom; However, thesound of vessel and gear mainly causes curiosity, and the first reaction generallyoccurs when the trawl boards can be seen. The fish then avoid the trawl boards byswimming so that the trawl boards are kept at an angle of 1550 or at the rear edge ofmonocular vision. Fish that come between the boards are guided by the bridles (if theboards touch the bottom there will also be a guiding sand cloud) towards the trawlmouth, where the fish turn and attempt to swim forward at the same speed as thetrawl. This optomotor response (Harden Jones, 1963) to try to hold the same relativeposition to the visual stimulus of the moving gear, lasts until the fish are exhausted.
The swimming ability of fish depends on size and species (Viedeler & Wardle,1991); small fish are rapidly exhausted and turn and drop back towards the codend.Larger fish can swim for a long time in the trawl mouth, and when trawling on fastswimming fish such as mackerel or sardinella, the speed must exceed 4 knots foreffective capture.. Observations of fish behaviour when pelagic trawling indicate a strong effect of

A voidance 125
avoidance reactions elicited by sounds of both vessel, and gear. Misund and Aglen(1992) observed that midwater herring schools in the North Sea avoided downwardsto the bottom when approached by a survey vessel towing a pelagic sampling trawlwith about IS m vertical opening in daytime. Behind the vessel the schools seem soonto be influenced by stimuli (possibly low frequency vibrations or visual detection)from the warps and the gear, and were recorded to swim in the same direction as theapproaching gear. When at close range, the sight of the gear obviously elicited strongavoidance reactions, and the schools tended to compress towards the bottom. Toobtain catches, the trawl had to be lowered close to the bottom at the location of theschools. Similar strong avoidance reactions have been reported by Mohr (1969) whenpelagic trawling on spawning migrating herring schools in the Norwegian Sea in the1960s. In front of the vessel the schools performed strong downwards avoidance,dived 50--100m, frequently changed swimming direction, and even split up. Theherring seemed to be visually aware of the approaching net at a distance of 30--50 m,swam in front of it for some time, and then avoided downwards (Fig. 5.11).
Fig.5.11 Reaction of migrating herring schools to pelagic trawl (after Mohr, 1969).
At low light levels there is normally no ordered reaction pattern to approachingnets (Glass & Wardle, 1989; Walsh &Hickey, 1993). Inoue et al. (1993) observed thatwalleye pollock were mostly inactive when captured by trawl at depths of 150--300mat low light levels and low sea temperature north of Japan in autumn. However, whenpelagic trawling on dispersed herring concentrations off east Iceland in autumn in the1960s, Mohr (1969) observed a general downward flight to the approaching gear, andthe fish seemed to concentrate in the upper half of the trawl mouth (Fig. 5.12). Denseconcentrations of herring were often present under the trawl, and an effective tech-

126 Chapter 5
Fig.5.12 Reaction of dispersed herring to pelagic trawl (after Mohr, 1969).
nique was therefore to allow the net to sink slowly when towing through an aggregation.
5.3 Conclusion
In this chapter we have defined avoidance as a general term for behaviours that fishperform to move away from stimulation that elicits fright or is sensed as unpleasant.We have focused on avoidance elicited by sounds and visual stimuli from vessel andgear. Avoidance reactions at long range during pelagic fishing and hydroacousticsurveys are probably caused by sounds, while visual sensing of the vessel and fishinggear at close range may be a determining factor during gear surveys and fish capture.
The ambient noise in the sea, produced by sea motion as waves, currents, turbulence, bubbles, animal communication etc., has a composite frequency spectrumdominated. by low-frequency noise. Noise from vessels generated by the enginesand propeller cavitation also has the main energy in the low frequency region(10-1000 Hz). The line frequencies generated by the engines are superimposed on amore continuous spectrum generated by propeller cavitation. In the 1970s and 1980s,little effort was given to reducing the underwater noise emitted from fishing and
. fisheries research vessels, but on more recently delivered fisheries research vesselsactions have been taken to reduce the emitted noise.
Fish detect sounds through the otolith organs embedded in a pair of labyrinths inthe skull. The three calcium carbonate otoliths (utriculus, sacculus and lagena) lieupon a thin membrane that protects a macula of numerous directionally sensitive haircells. The otoliths are three times denser than the surrounding flesh of the fish, andwill thus move at smaller amplitudes than the rest of the fish body when imposed onby sound waves. The relative movements of the otoliths and the hair cells cause

A voidance 127
physiological responses that are analysed as sound and enable discrimination of itsintensity, frequency, and direction and distance to the sound source. The swimbladder enhances sound detection through amplification. Fish audiograms show thatmost species are sensitive to low frequency sounds of up to a few kilohertz.
Field observations, playback experiments, and analysis ofcatch data show that fishreact to vessel noise, and the Olsen model is a conceptual model of avoidancebehaviour elicited by vessel sound stimuli.
Light is rapidly attenuated in the sea, and maximum underwater visibility is about40 m. Maximum penetration is for wavelengths between 400-500 m giving the sea ablue colour. Pelagic fish have paired image forming eyes with muscular control of thedistance between the lens and the receptors cells - rods and cones in the invertedretina. The field of vision of the fish eye is about 180°, and fish have binocular visionwhere the two fields overlap in a sector of 20°-30° to either side in front. The visualacuity that determines the maximum sighting distance of objects is dependent on thedensity of cones in the retina, the size of the object, light intensity and contrast.
Visually elicited avoidance reactions have been observed during purse seining andpelagic trawling in daylight, Such reactions often enable pelagic fish to escapecapture.

Chapter 6Attraction and Association
6.1 Attraction to light
Fishing with light was a major technique for coastal pelagic fish and tuna up to themiddle of the twentieth century. Many pelagic fisheries around the world are stillbased on aggregating fish by use of artificial light (Chapter 2). Pole-and-line tunafisheries usually fish the bait with light.
Schools of pelagicspecies usually disperse at dusk and become distributed in looseconcentrations throughout the night. The density in such concentrations is often toolow for feasible fishing. However, most pelagic schooling species can be attracted toareas illuminated by artificial light at night. The source of the illumination may besimple, such as a wooden fire, a burning chemical, oil or gas, or it may be an electriclamp. Normally, the light source hangs above the surface in the rigging of a vessel, butthere are electric lamps that can be immersed to 200m depth.
A recent fishing technique combining fishing with light and association with afloating object (see next section) was implemented in the middle of the 1980s by thepole-and-line fishery based in Dakar (Senegal) when it operated near Mauritania.This 'log-boat' tactic consists of using a drifting fishing boat as an artificial log toconcentrate a huge school (1 to 8 days) and then to exploit it for several months,replacing one vessel by another when necessary, usually during the night (Fonteneau& Diouf, 1994). The boat usually stops its engine during the night and drifts, usingpowerful lights (25 kW). Usually two pole-and-line boats take turns on the sameassociated school, but sometimes a third, non-fishing vessel is used as a 'buffer'between rotations. When the vessel shifts to unsuitable areas, the skipper is able tomove it slowly using the engine without losing contact with the school. According tothe skippers, a permanent vessel speed of I to 3 knots is typical. Therefore thistechnique seems a hybrid technique which combines attraction by light and association. The expression 'offshore sea ranching' proposed by Fonteneau and Diouf ispartly justified by the fact that fishermen provide additional food and light in order toincrease the productivity, as in some ranches (e.g. battery chicken). This fishing tacticis very efficient for catching the three dominant commercial species of tuna in thisarea (yellowfin, skipjack and bigeye) plus a bycatch species, the black skipjack tuna(Euthynnus alleteratus). Young fish dominate the catches, with an average weight of2.4 kg for skipjack, 6.8 kg for yellowfin and 10.4kg for bigeye tuna. The average dailycatch rate is 5.6 t per fishing day (1988-1991) and 10 to 20 t per day are commonlyrecorded; days without catch are extremely rare, unlike the conventional pole-and-

Attraction and Association 129
line technique (Fonteneau & Diouf, 1994). The 'log-boat' tactic is also used by theSpanish tuna fleet based on the Canary Islands from the beginning of the 1990s(Delgado de Molina et al., 1995).
The behaviour of pelagic species towards artificial light is to a certain extent speciesdependent, but varies within species according to age and physiological or environmental conditions (Ben-Yami, 1976). Some species are positively phototaxic and areattracted to artificial light, others are negatively phototaxic and avoid artificial light.Small herring are generally positively phototaxic while large herring may be negatively phototaxic (Ben-Yami, 1976). According to Dragesund (1957), the behaviourof herring during illumination by surface lights can be generalised in four behaviourpatterns:
(I) The density of the herring layer increases, and the fish swim deeper(2) The herring disappear from the illumination area(3) The herring rise quickly towards the light source, and then either disappear Of
swim deeper and denser(4) The herring swim denser and rise slowly towards the light source.
Light is rather quickly absorbed in water, and the distance of light penetrationdepends on light intensity, water turbidity, and colour. The radius of attraction ofkilka (Caspian sprat, Clupeonella spp.) in the pump fishery in the Caspian Seaincreased asymptotically from 35m in response to a 15W lamp to 72 m to 9 kW lamps(Ben-Yami, 1976). An electric surface lamp of 1.5kW affected the herring within aradius of about 50-60 m (Dragesund, 1957). Using a 3.5 kW lamp underwater at 5 mdepth, Beltestad and Misund (l988b) observed that large herring (24-38 cm) concentrated in a region at 50-110m depth.
In water with high turbidity due to algae or planktonic organisms or inorganicparticles, light penetration may be very limited. In the turbid waters in the Finnisharchipelago, Tshernij (1988) measured that the light intensity at 6 m depth was only0.03% of that at the surface. Still, the Baltic herring (Clupea harengus membras L.)aggregated in shoals up to 7m in horizontal diameter and 10m in vertical extentbelow a light source made of three 20 W underwater lamps. From comparativeexperimental trials, Ona and Beltestad (1986) concluded that saithe seem moreattracted to blue than to red light. The aggregation behaviour of herring was similartowards red, blue and white light sources (Beltestad & Misund, 1988b). Kilka(Clupeonella spp.) in the Caspian Sea and saury (Cololabis spp.) in the Pacific seemmost attracted to yellow light (Ben-Yami, 1976). Other factors such as water current,surface waves, moonlight,. presence of food or predators may also have stronginfluence on the aggregation behaviour of pelagic species towards artificial light (BenYami, 1976; Mohan & Kunhikoya, 1985).
The vertical distribution towards a light source probably depends on the initialnatural vertical distribution (Beltestad & Misund, 1988). In one season, large herringwere distributed from 0 to 50 m naturally, and then concentrated both at the surfaceat 45-100 m to the side and a 20-70 m below the source when illuminated by artificiallight (Fig. 6.1). During another season in the same Norwegian fjord, herring wereconcentrated at 50-100 m depth when illuminated by a 3.5 kW light source at 5 m

130 Chapter 6
Distance (m)
40 60 80 100
!~~100 80 60 40 20 20
---'----'-L--'----,cf7:~~'7f=7='
~20
60
s: 40+'a.Qlo
80
Fig. 6.1 Distribution of herring (Clupea harengus) in a vertical section around the light sources as recordedby SIMRAD FS3300 during trials by underwater light in a Norwegian fjord (redrawn after Beltestad andMisund, 1988a).
depth; this was also the vertical distribution range when not influenced by artificiallight. At such depths, the herring were still unavailable to coastal purse seiners withshallow nets. A solution for such occasions was to lower a lamp with an upwardreflector under the herring concentration. When it was switched on, the herring roserapidly to the surface at a speed of 20m/min.
A substantial part of the light from a source above the surface will be reflected atthe surface and will not penetrate the water. Such surface reflection will be avoided ifthe light source can function underwater. To test if underwater light is more efficientthan surface light, Beltestad and Misund (1988) compared the attraction of largeherring (24-38 cm) to 3.5 kW surface (lamp 1m above surface) or underwater light(lamp at 5m depth). The abundance of herring aggregated to the two light sourceswithin one hour was similar, but the herring seemed to aggregate somewhat faster tothe underwater light than to the surface light (Fig. 6.2a). The vertical distribution ofherring when attracted to the underwater light was about twice as deep as whenattracted to the surface light. This indicated that the light penetrated much deeperwhen the source was underwater than at the surface. When the light intensity wasgradually reduced after one hour, the herring schooled more densely and rose towardsthe light source (Fig. 6.2b).
There are several hypotheses why most pelagic schooling species are attracted toartificial light. Fish perceiving the artificial light may become curious and search theilluminated area to explore it. Since planktonic organisms may be concentratedwithin the illuminated region, the fish may stay in the area because of enhancedfeeding opportunities. In the above-mentioned case of tunas associated with a poleand-line vessel for several days and aggregated by powerful light (commonly 25000watts) at night, J.-P. Hallier (pers. comm.) reported active feeding in the illuminatedarea. Another hypothesis is that the artificial illumination enables the visual contactnecessary for establishing schooling behaviour, and when coming into the illuminatedregion, fish find it advantageous to join schooling. Possibly, pelagic species combineschooling and feeding in the artificially illuminated region as observed for sardinella

Attraction and Association 131
(a) (b)
0300
c-, 10='= 250 »r--; 20Vlc
200 E 30Q)
"0150 ..c 40
Q) ......> a. 50
:;:; 100 Q)
0 0 60Q) 50 700::
80 I I I I t I I I10 20 30 40 50 60 70 80 0 20 30 40 50 60 70 80
Time (min)t Time (min)t
0300 !::SS UW light
£10
250 ~ SW light20Vl --....
c200 E 30Q)
"040150 ..c
Q) ......> a. 50
:;:; 100 Q)
0 0 60Q) 50 700::
0 805 10 15 20 25 30 35 40 45 50 55 60 0 10 20 30 40 50 60
Time (min) Time (min)
Fig.6.2 Interval of variation for reflected echo energy (a) and depth distribution (b) of herring (C/upeaharengusi during comparing trials by surface (SW) and underwater (UW) light in a Norwegian fjord afterstarting to reduce light intensity (redrawn after Beltestad and Misund, 1988b).
(Sardinella aurita) in the eastern Mediterranean (Ben Yami, 1976), or for tuna speciesin the eastern Atlantic (Hallier, pers. comm.).
6.2 Attraction to bait
Several gears (handline, longline, pole-and-line, some type of trap) use bait forattracting the fish. Nevertheless, as far as pelagic species are concerned, use of bait islimited to tunas and tuna-like fishes which are caught by different types of line intropical regions worldwide (Chapter 2).
It was usually accepted that skipjack, yellowfin and bigeye tuna rest at night(review in Cayre et al., 1988) and feed visually during daytime, which suggested thatthe visual stimulus of the bait is a major determinant for the attraction of tunas tobaited hooks. Nevertheless, the previous results were based on stomach contentstudies of fish caught by surface fisheries (pole-and-line or purse seiner). Recentfindings (see section 6.3.1 and Josse et al., 1998) suggest.that nocturnal foraging mightalso occur, at least in some areas, at certain depth and for some species. In the FrenchPolynesia EEZ. (Exclusive Economic Zone), acoustic surveys are simultaneouslydeployed with sonic trackings to observe the biological environment of the trackedtuna. A yellowfin tuna (Thunnus albacares) tagged by an ultrasonic device and

132 Chapter 6
tracked during 21 hours around Maupiti Island remained in a non-migrant scatteringlayer at 45 n.mi. during daytime and 30 n.mi. during night-time where its behavioursuggested foraging (ECOTAP project, 1995).
Chemical stimuli, which are related to the soaking time and the type of bait, couldalso play an important role as for most other fish caught by bottom long-lines(Lekkeborg & Johannessen, 1992; Lekkeborg, 1994). The influence of chemical stimuli and their diffusion according to the current explains why the catch rate isincreased when the line is set perpendicularly to the current and upstream of fishlocation (Bjordal & Lekkeborg, 1997). Chemical stimuli are likely to explain whySivasubramaniam (1961) found a negative relationship between soaking time andcatch of tuna, in the Japanese long-line fisheries. In addition, the size of the bait mightplay a significant role in species and size selectivity, but is not directly related toattraction (Lekkeborg & Bjordal, 1992). From laboratory experiments, Johannessenet al. (1993) found that haddock (Melanogrammus aeglefinus) bit only a part of the bigbait; leaving the hook outside the mouth, and would then jerk or rush to tear the baitapart.
To our knowledge, little is known about tuna baiting behaviour except in the caseof swordfish (Xiphias gladius) longlining, which is performed at night-time (e.g.Berkeley & Waugh, 1989)and recently incorporated light sticks from place to placealong the line, thus combining bait attraction and light attraction (Mejuto & De laSerna, 1995). Nonetheless, recent studies have been performed in the Pacific aroundHawaii and Tahiti islands on other tuna species. These studies are based on longlinesequipped with depth and time recorders, including recorders of the baiting time onhooks (hook timers). Preliminary results obtained around Tahiti (ECOTAP, 1995)indicate that the depth of a given longline depends on the strength of the current,among other parameters, as expected from previous theoretical models (Yoshihara,1954), but here with a gain of precision (84% of variance explained). It is thereforeimportant to take current into account, since the proportion of the target species inthe catch is related to the depth of the hooks. Bigeye tune (Thunnus obesus) is caughtin deeper - and therefore colder and darker - waters than albacore (Thunnus alalunga)and yellowfin (Thunnus albacares). The time of baiting seems also to vary according tothe species. Albacore bite during daytime as well as at night, with a maximum at dawnand around 0010 h. Bigeye tuna was not caught at night, but only four long line setswere performed at night-time and therefore it cannot be firmly concluded that thisspecies does not bite at night. Nevertheless, in the Hawaii-based longline fishery, mostof the longline sets targeting tuna and swordfish are performed during the night andbigeye tuna is the dominant species (Boggs, 1997).
.An interesting aspect of the biting behaviour is related to the moment of baitingaccording to the fishing operations. Fish bite not only when the longline is completely set, but also during the setting and hauling operations. Nearly one third ofthe bites are observed during these two operations, mainly during setting for yellowfin and albacore, and mainly during hauling for bigeye tuna (ECOTAP, 1995).Around Hawaii, hook timers indicated that 32% of the striped marlin tTetrapturusaudux), 21% of the spearfish (T. angustirostris) and 12% of the bigeye tune (Thunnusobesus) were caught on sinking or rising hooks (Boggs, 1992). The increase of biting'

Attraction and Association 133
during fishing operation suggests that bait movement is an important stimulus,implying that this movement favours visual attraction (but an increase of odourdiffusion cannot be eliminated).
The case of pole-and-line fisheriesis particular in the sense that fish schools are notdirectly attracted by the bait but are first detected by the skippers (through visualobservations of birds, logs or directly of the school); then the fish is maintained closeto the boat by feeding it with live bait (usually small coastal pelagic fishes). The hookof the pole-and-line can be baited with a fish, especially at the beginning of the fishingperiod, or with artificial lures which must be in movement to attract the fish.Nevertheless, the success of the catch depends strongly on the quantity and quality ofthe available bait. The effectiveness of baiting is related to the species used for baitingand to the targeted tuna species (Hallier & Kulbicki, 1985; Mohan & Kunhikoya,1985; Argue et al., 1987). From a field study in New Caledonia and a review of thepioneering work of Yuen (1959, 1969) and Strasburg (1961), Conand et al. (1988)classified small fish from the lagoon of New Caledonia according to their potentialefficiency during baiting operations of a pole-and-line fishery. He suggested thatefficiency depends on the species' attractiveness for tuna, which is related to its tasteand smell, but also depends on its silvered aspect and its behaviour. The mostinteresting species are those that tend to remain and swim actively at the surface, nearthe boat, rather than those that dive or escape rapidly.
To some extent attraction by lure can be related to bait attraction. Lures are mainlyused in recreational fisheries, in pole-and-line fishery in association with bait fish (BenYami, 1995), but also in some professional small-scale trolling fisheries around FADs(fish aggregating devices) or in open waters (Drew, 1988).
In conclusion, bait attraction seems to be based both on olfactory stimuli and onvisual stimuli. Movement represents an important aspect for artificial lures but alsofor natural bait, alive or dead. The combination of attraction by light and by baitseems promising.
6.3 Associative behaviour
6.3.1 Association with floating objects
Overview ofassociation
The attraction of tuna, tuna-like species and many other pelagic or bottom species tonatural floating objects (logs,mammals, etc.) or artificial ones (often termed FADs:fish aggregating devices) is well known. Tuna fishermen have taken advantage of thisassociation for many years, especially in Asian countries (e.g. Uda, 1933; von Brandt,1984). But there are many other species that display such association. Let us overviewthis strange phenomenon of association before focusing on tunas.
Hunter and Mitchell (1967) made 70 purse seining collections around natural andartificial floating objects in Pacific waters offshore of Costa Rica. They found that 12families of fishes (Lobotidae, Carangidae, Coryphaenidae, Mullidae, Kyphosidae,

134 Chapter 6
Pomacentridae, Scombridae, Blenniidae, Stromateidae, Mugilidae, Polynemidae andBalistidae) and 32 species were represented in the collections, dominated by thecarangids (nine species), particularly Caranx cavallus and Selar crumenophtalmus.Parin and Fedoryako (1992) have gathered a large amount of information collectedon board Soviet research vessels in all the oceans since the mid 1950s. They indicatethat the total number of fish species associated with floating seaweeds and flotsamvaries from 186 (60 families) in neritic to 81 (27 families) in oceanic areas. The speciesassemblages are similar between flotsam (logs) and seaweeds. Similar results wereobtained in the Atlantic and Indian Oceans by Stretta et al. (1996).
Sharks and barracuda are also attracted by floating objects, as reported by Stequertand Marsac (1989) in the Indian Ocean, by Au (1991) and Hall (1992a) in the easternPacific and by Batalyants (1992) in the eastern Atlantic, who mentioned differentspecies of Carcharinidae, Sphyrnidae and Sphyraenidae.
Flyingfishes are attracted by floating objects, but unlike tunas, the determinism is·clearly identified: these species are searching for any floating substrate for spawning(Oxen ford et al., 1993). In the Caribbean Sea, especially around Barbados, fishermenuse coconut branches to attract flyingfish and catch them with dip nets or gill nets(Gomes et al., 1994) and a similar technique is used around Sao Tome island in theeastern Atlantic (F.X. Bard, pers comm.).
The attraction by objects in the water might also exist for some coastal smallpelagic species in some areas, but as far as we know, unlike tunas or flyingfishes,coastal pelagic species attracted by floating objects are not commercially exploited,with the notable exception of the Java Sea fishery. This traditional small-scale fisheryuses floating or submerged bamboo, named 'rumpons', to attract different species ofsmall pelagic fishes (mainly: Decapterus russelli, D. macrosoma, Rastrelliger kana-
· gurta, Sardinella spp., Amblygaster sirm and Selar crumenophtalmus) (Potier & Sad-· hotomo, 1995). Some of these species ha ve an oceanic stage of their life, but others donot. This is the case of Sardinella gihosa and Sardinella lemuru, despite the fact thatthe same genus is not known to display such an associative behaviour in other areaswhere large stocks are exploited (e.g. Sardinella aurita and Sardinella maderensis inthe Atlantic). Here also the mechanism of attraction is not well known (except from1987, when fishermen started to combine the use of rum pons with light). Similarly,several small-scale fisheries based on islands take advantage of the association ofsmall or medium-size pelagic fish to floating objects, but as far as we know it concernsoceanic species.
In coastal waters near Sydney, Druce and Kingsford (1995) used natural (algae)and experimental drifting objects. Drift algae attracted mainly pigmented juveniles,but also larvae (ambassids and gerreids) and a few adult fishes (mullids, pomacentrids, teraponids). Experimental drifting objects attracted mainly juvenile carangids,sphyraenids, mullids, mugilids and larval ambassids, sillaginids, spa rids and gerreids,but many larval species demonstrated no affinity for floating objects, as for instanceclupeids and atherinids.
The colonisation of the floating object is usually very fast, often less than one week,as reported in the works mentioned above. In the eastern Atlantic, Bard et al. (1985)
indicated that tuna schools were attracted a few days after setting a drifting F AD, and

Attraction and Association 135
that a FAD set in the vicinity ora school (probably skipjack tuna) was immediately'adopted' by the fish. In the western Indian Ocean, Yu (1992) performed short timescale observation of the colonisation of drifting FADs by visual and hydroacousticmethods and concluded that species of Aluteridae, Carangidae and Serranidaearrived 25-35 hours after setting and concentrated in the immediate vicinity of theFAD (S-20m), while predators (mainly Coryphaenidae, Sphyraenidae, Scombridaeand Carcharrhinidae) were observed regularly within a longer range (50-lOOm).After this period, a stabilisation of the specific composition within 50m of the FADwas observed, followed by a mere increase of its biomass. Usually the tuna schoolsarrived 30-S0 hours after setting the FAD: first small schools of juvenile yellowfintuna, followed by small schools of skipjack tuna, then other juveniles or adults ofthose two species.
Midwater artificial structures which resembled a pup tent (Fig. 6.3) were positionedoff Panama City in the Gulf of Mexico and were effectivein attracting up to 25 tonnesof small pelagic mixed school: round scad (Decapterus punctatus), Spanish sardine(Sardinella aurita) and scaled sardine (Harengula pensacolae). Larger pelagic specieswere also attracted during this experiment (Seriola spp., Elegatis bipinnulata andCaranx chrysos) but were not observed to feed on the smallest ones (Klima &Wickham, 1971). The authors observed that attraction to structures relies on theindividual fish or school passing within the visual range of the structure or of fishalready associated with it. Wickham et al. (1973) concluded that structures functiononly to concentrate fish already present in the vicinity. The association with structuresseems rather transientas individuals and schools have been observed to move towardsand away from structures rather frequently (Klima & Wickham, 1971).
There seem to be certain species-dependent behaviour patterns when associatingwith structures. In the above-mentioned observations of Hunter and Mitchell (1967)in offshore Pacific waters of Costa Rica, juvenile fishes were more abundant andlocated closer (vertically and horizontally) to the floating object than adult fishes.These juveniles usually stratify vertically according to thespecies and the wholedistribution resembles a cone, the apex of which is at the underside of the floatingobject. In the study of Klima and Wickham (1971) off Florida, the baitfish grouptended 'to maintain position upcurrent from the structure and in the upper half of thewater column, while the jacks stayed close to and at the same depth or slightly belowthe structure (Fig. 6.3). The baitfish group seemed to behave as mixed speciesschools.The baitfish were frequently observed feeding while associated with the structures,but not the jacks. Presence ofwounded individuals of both groups indicated predation attempts by great barracuda (Spyranea barracuda) and sharks observed in thevicinity of the structures. However, there are indications that prey fish are able to takeadvantage of the structure for predator avoidance and sheltering. Little tunny andking mackerel immediately launched successful attacks on baitfish when a structurewas removed, while such attacks were seldom successful when the structure waspresent (Wickham et al., 1973).
The characteristics of floating objects that facilitate attraction have been studied byseveral authors in the search for the reason for the associative behaviour. Hunter andMitchell (1968) evaluated different kinds of artificial floating objects in the same area.

136 Chapter 6
~ Jacks_ Baitfish
- -'IIII!!' 'IIIl''IIIl' ~...,.
'Ill!!!' -'" ...,.~------ -.-<Current flow
108
Q) 105"-::J--0::J
104"---Ul
<,.c
10J~
'0 Jacks
"- 102 -, . /\Q) "\ /1 I \.D
,I, I \E , I v 1
I1 1::J 'I1_.1 I \Z 10
\
o i 3 5 7 9 1'1 13 1'5
Days followingstructure placement
Fig.6.3 Position of baitfish and jacks in relation to submerged structure set off Panama City (redrawnfrom Figures 2 and 6 from Klima, E.F: and Wickham, D.A. (1971) Attraction of coastal pelagic fishes withartificial structures. Transactions of the American Fisheries Society 100, 86-99).
They found that surface objects attracted more fish than submerged ones of the samesize. Moreover, they indicated that a plastic sheet, bent at a 60° angle at its midline sothat .it resembled a small tent which floated with both sides submerged, was moreeffective than horizontal floating sheets. Unfortunately the authors did not mention ifthe differences observed in fish density were mainly due to small fish, solitary predators or tunas and such experiments were not repeated.
Duringthe Inter-American Tropical Tuna Commission (lA TTC) symposium, Hallet al. (1992b) presented observations on 5518 floating objects, made on board commercial tuna purse seiners in the eastern Pacific, of which 2793 resulted in a set. Fromthis database they studied the influence of the characteristics of the floating object on

Attraction and Association 137
the concentration of tuna. Their conclusions were that the size of the object is not animportant factor for medium-sized objects (I to 6 m for the longest dimension) butthat very small and large objects are less attractive (see also Akishige et al., J996, .onthis point). The results are similar when surface or volume are considered. It seemsthat the aggregation of several objects is more attractive than a single object (this lastresult is in agreement with the above-mentioned experimental results of Wickham etal. (1973)). Artificial objects seem more attractive, especially for skipjack tuna. Thepercentage of the surface of the object covered by epibionts did not appear to play arole in its attractiveness, nor the time at sea as already mentioned by Bard et al.(1985). The percentage of the submerged volume seems to play a role for yellowfin,but it should be confirmed by experimental observation. In Hall et al.'s study, thecolour does not seem to play a major role, except that black seems to be preferred-Ibutthere were not enough objects of this colour in the database to validate the observeddifference). Nevertheless, in the recent study of tuna fisheries performed in theAtlantic and Indian oceans, Stretta et al. (1996) reported that more than half of thefloating objects associated with tuna were brown and that black objects representedaround 20% on a total of 792 observations.
Association of tunas with floating objects
During the last three decades, industrial tuna purse seining has increasingly used astrategy which consists of localising and searching around biotic and abiotic objectsat the surface. Thereasoo is that tuna tend to aggregate underneath and are less activeand therefore easier to catch. In the western Indian Ocean, for instance, the frequencyof unsuccessful sets between 1984 and 1990 was only 8% on 'logs', against 53% onnon-associated schools (Hallier & Parajua, 1992b). Similar results have been obtainedfor the French aod Spanish fleets operating in the Atlantic and Indian oceans in 1995(Stretta & Slepouka, 1986; Stretta et al., 1996). Catches from a few hundred kilos upto several hundred toones of tuna are taken under logs or floating timber.kelp,branches etc. (Greenblatt, 1979). Association with mammals is also frequent and willbe developed in section 6.3.2, even though this type of association could depend onthe same behaviour as association with floating objects..
Fishermen have discovered that the aggregative behaviour of tuna also applies tonon-natural objects at sea, and in many countries it has become very common forfishermen to construct and deposit artificial fish aggregating devices (FADs) toenhance aggregation of tuna (Marsac & Stequert, 1986; Josse, 1992). Those FADscan be either anchored or oot, and we wiII see many differences between driftingFADS - the most commonly used by commercial fisheries - and anchored ones.Curiously, costly anchored FADs were first used, usually near islands for artisanaltrolling fisheries, during the 1980s. In French Polynesia for instance, FADs have beenanchored since 1981 and have completely modified the exploitation pattern in thearea (Josse, 1992) and increased by 33% the number of fish caught per fishing day.During the I990s, purse seiners used drifting FADs which are identified, easy tolocate (radar reflector, radio beacons; Fig. 6.4) and frequently re-collected on board

w00
1 Flag
Radar reflector
Q{i.~...0\
Bamboo raft with palm fronds
----
~------------
Radio beacon
-----------.------
------
----- -
/'
--- '--- '-----
Loose lashing
/<....
--------- '-~G-
2-4mf ~
Fig.6.4 A common drifting floating aggregative device (FAD) used in the purse seine tuna fisheries (modified after Bard et al., 1985).

Attraction and Association 139
and displaced (Hallier, 1995). Some FADs are equipped with an echo-sounder whichautomatically transmits data to the fishing vessel by radio. In the Spanish fishery ofthe Atlantic, supply vessels are used only to build drifting FADs on board, releasethem and alert the purse seiners when the tuna concentration is estimated to be highenough for a commercial catch (Ariz et al., 1992).
Fishing under artificial floating objects is traditional in the Philippines fisherywhere 95% of the catches are performed under 'payaos' (Barut, 1992). At thebeginning of the 1990s, the proportion of catches related to floating objects was over50% of the total catch in the western Indian Ocean purse seine fishery (HaIJier &Parajua, 1992b), in the western Pacific (Hampton & Bailey, 1992; Suzuki, 1992) andin the south of the Caribbean Sea (Gaertner & Medina-Gaertner, 1992). Log fisheryaccounted for only 15% in the eastern tropical Atlantic at the beginning of the 1990s(Ariz et al., 1992) but according to Stretta et al. (1996), in 1995 the Spanish andFrench purse seiner fleets performed around 80% of their catches under floatingobjects (90% of these objects were artificial) in the Atlantic Ocean and more than
.90% in the Indian Ocean (50% artificial objects). In the eastern Pacific, this proportion is only known (or large purse seiners (26% at the end of the 1980s) but isprobably larger for the small ones (Hall et al., 1992a).
Due to this increase of tuna commercial catches under natural or artificial floating objects, the Inter-American Tropical Tuna Commission (lATTC) convoked in1992 an international workshop on the floating objects and tunas (Hall, I992b).The situation is contrasted according to the different species and oceans (Gaertner& Medina-Gaertner, 1992). Skipjack tuna are more often associated with floatingobjects than are other commercial tuna species (yellowfin, bigeye), as shown in Fig.6.5 (Fonteneau, 1992; Hall et al., 1992a; Hallier & Parajua, 1992b). Yellowfindominate the association with large mammals and therefore are more abundant in
. the landings of the Venezuelan fishery which target such association (probably dueto the lack of logs). The tuna catches under floating objects are substantial allaround the world, but more important in the Indian Ocean, West Pacific andPhilippines area (where anchored devices locally named 'payaos' are commonlyused). The association of tuna with natural 'logs' is most common in tropicalcoastal waters off mangrove regions or off large rivers that supply the ocean surface with floating trees, branches etc. (Stretta & Slepoukha, 1986; Ariz et al., 1992;Hall et al., 1992b).
At the beginning of the industrial tuna fisheries, floating objects were mainly partsof trees transported by rivers to the sea, and secondarily dead mammals. The conventional 'log' fishing was therefore predominantly coastal. But nowadays theimportance of tree residuals (logs, large branches) used as a help for fishing is lowerthan in the past. Tree residuals represent less than half the total number of floatingobjects found by fishermen (47% in the eastern Pacific for instance). Most of theobjects result from human activity - boards, parts of fishing gears (net, floats, ropes),housing, etc. - and artificial logs are launched by fishermen. As a consequence, 'log'fishing is now conducted in productive offshore regions, in the eastern Pacific (Hall etal., 1992a), in the eastern Atlantic (Ariz et al., 1992), and in the western Indian Ocean(Hallier & Parajua, I992b).

+;.o
• Floatingobjects ~
, . " "p ...~~::;:;; ayaos.:"' . • Whole
Shark whole
Q~~....0\
~~
(74.1")
(1~
~(81.1")
(3.0")
• !-
tliar(69.o,,)
)ll!hmwll'unllilctl I... . 11 ••• i .~
Yellowfin
25 '~~'...;" , '~' I 'f' tIt , , , '~ .,j~" 'jt--L----L-' , , '" I ,
~g1 \\ A ~.~ (?l~..nllweste:~ ~aclllcl; ~L _.~.j~ '. 1 Ii I105o I /
-5-10-15-20 J_---1I_1.1.L1 --.J[L ...:\:L_~·:- 2'="!v=="~"u~'='===!...'--LJ ""'/:::::. .1)...11-25
Bigeye
•
. . . . . (5.8") (19.6")
::1:!:::::1::::::::::::::::Skipjack (74.7")
Fig.6.5 Synopsis of tuna catches associated with floating objects in 1990: main fishing areas, total catches per fisheries and species composition (modified afterFonteneau, 1992).

Attraction and Association 141
The range of body length of fishes in catches associated with floating objects issimilar to those of unassociated fishes in the case of skipjack tuna, but yellowfinand, to a lesser extent, bigeye tuna, are usually smaller. In many fisheries (Fonteneau, 1992; Hall et al., I992a; Hallier & Parajua, 1992b; Stretta et al., 1996), abimodal distribution of length frequencies is observed both in associated and unassociated schools, but the relative size of each mode is different, with a higher proportion of small fishes in the case of associated schools of yellowfin and bigeyetuna (Fig. 6.6). This difference in length frequency distribution is a major problemfor stock management due to the growing percentage of tunas caught under floating objects, the smallest being discarded dead. The scientific community workingon tuna is at present targeting this problem. The fishermen themselves decided toprohibit tuna catches under floating objects in the eastern Atlantic Ocean for aperiod of three months beginning I November 1997, controlled by observersonboard and encouraged by the International Commission for the Conservation ofAtlantic Tunas (ICCAT).
Despite the fact that the mean individual weight is lower in associated fishes thanin set schools, the school weight is usually higher. This is especially true in the eastern Atlantic and in the eastern Pacific oceans, where the mean catch per set of logschools is more than double that of non-associated schools (Fonteneau, 1992; Hall,1992a).
Cillaurren (1994) analysed a large amount of data on experimental fishing aroundfive offshore FADs anchored in the Pacific off Efate island (Vanuatu) during thedaylight hours. The results, expressed in catch per hour trolling, suggest interactionsbetween time, space and body-length effects. A decrease in tuna abundance withincreasing distance from the FADs was observed within the o-I600m range for thetwo main tuna species: yellowfin and skipjack (3796 and 3442 individuals respectively). Altogether, 77% of the fish were caught within 200m of the FAD, 20%between 200 and 500m and 3% beyond 500m, but the yellowfin tuna tended to belocated nearer to the FADs than the skipjack tuna.
The daily fluctuations of the yield clearly varied according to the distance from theFADs. No catches were observed during the afternoon over 300m from the FADsand after 00 I0 hover 500 m. This suggested that the radius of distribution around theFAD decreases from sunrise to sunset (nevertheless note that the temporal distribution of fishing effort without catch is not known). The best catches of yellowfinwithin a lOOm range were observed around midday and secondarily around sunrise,whereas for skipjack tuna the yield decreased from one hour before sunrise to sunset,with a secondary peak three hours prior to sunset. According to Cillaurren (1994),this variability in the yield within the daylight period could be due both to dailymigration and to feeding rhythms. Body length frequency distributions indicate thatsmall specimens (30-40 cm) are found at all ranges, but large ones, especially yellowfin, are found mainly over 300m from the FAD. Moreover, the proportion ofsmaller fish increases throughout the day and the author suggested that this indicatesthat the smaller fish progressively take the place left by the departure of larger fish, inagreement with the model proposed by Hallier (1986) for log-schools in the westernPacific. All these results are fruitful for the management of FAD fisheries, but their

142 Chapter 6
(0)
15
.......~.........
10>.()c:Q)
::JCTQ).....u,
5
025 31 37 43 49 55 61 67 73 79 85
Fork length (in cm)
20(b)
15
~.........c-,() 10c:Q)::J
~CT 1\Q) I ........u, ~ "I
5 I \, b,
,/ "--- 'b,.-/' ..
....0
28 48 68 88 108 128 148 168
Fork length (in cm)
Fig.6.6 Sizefrequency distribution of (a) skipjack tuna (Katsuwonus pelamis), (b) yellowfintuna (Thunnusalbacores) and (c) bigeye tuna iThunnus'obesus) in the French purse seine fishery of the western IndianOcean from 1984 to 1990 (redrawn after Hallier and Parajua, I992a). For all figures: It = log set;o = school set.
interpretation for the reason for fish aggregation is limited due to the unknown effectof time-dependent catchability and fisherman behaviour.
The turnover of fishes under a floating object seems relatively high, at least whenfish are removed by exploitation, because series of successful sets are often observedunder the same object every day for a few days (Cayre & Marsac, 1991). In the IndianOcean, .there is a slow decrease in the catches only due to a lower abundance of

16
14
12".....
~'-' 10>-oc 8Q)
=':if 6Lu,
4
2
(c)
"""", '", ', ', .
, I, ., ~, ,: 'tj
t \, ~1 •, ,1 , ,, "1 "I ", ., .,
11•I
I
Attraction and Association 143
o "o<li..................~~,......_"""T""""-'''''''"_.......,,......--+-i-_.......32 52 72 92 112 132 152
Fork length (in cm)
Fig. 6.6 Con/d.
skipjack tuna, while the catch of yellowfin remains constant (Fig. 6.7), which indicates a steady recruitment of fish under the log (Hallier & Parajua, 1992c). In theeastern Pacific, Hall and Garcia (1992) observed a similar decrease in repeated sets onthe same object and a lower decrease of yellowfin abundance compared with skipjacktuna. In the tropical western and central Pacific, the catches decreased markedlybetween the first and the second set but then remained similar or increased in subsequent sets (Suzuki, 1992), which was probably due to the higher proportion ofskipjack tuna compared with the Indian Ocean. Despite the high turnover suggestedby these results, one must bear in mind that they have been obtained on a limitednumber of days (commonly seven) and probably depend on the local abundance.Longer experiments show that once the local abundance is depleted, the catch per setof all species decreases markedly (Farman, 1985; Ianelli, 1987). It seems that theremoval of fish around the floating object makes possible the arrival of new individuals, possibly responding to an optimal distribution around a favourable habitat, asstated in the ideal free distribution. Interestingly, F. Marsac (pers. comm.) noted thatthe removal of young fish by purse seining results in the arrival of older ones (whichare usually found in deeper layers) as if they could then occupy the space made free bythis removal. Nevertheless, in unexploited concentrations it is not certain that a realturnover occurs and possibly the same fish remain associated with a given FAD ( orset of FADs) for several days.
The fidelity of tuna to anchored FADs is now better known. Hunter and Mitchell(1968) tagged fish that remained near moored objects from 8 days for Labotes pacijicus (33cm) to over 32 days for Sectator ocyurus (8-16 cm)..Estimates of residencywere 11-14 days for untagged yellowfin tuna and 9 days for black skipjack tuna(Euthynnus lineatus). Recently, Klimley and Holloway (l996a) tagged 14 yellowfintuna with ultrasonic transmitters and attached detectors on five FADs around OahuIsland (Hawaii, USA). The experiment was seven months old at the time of pub-

144 Chapter 6
60
7
Fig.6.7 Average catch by species (including mixture of species) and total average catch according to thenumber of repeated sets on the same floating object in the French purse seine fishery of the western IndianOcean from 1984 to 1991 (redrawn after Hallier and Parajua, 1992b). 0 = Skipjack; 0 = yellowfin;'V = bigeye; '" = mixture; bars = total.
lication and is continuing at the time of writing. They observed that tunas returnedfrom one to ten times to the same FAD at which they were tagged over periods of1-18 days, usually in two large periods centred on sunrise (0200-0900) and sunset(1500-2200). Moreover, the authors noticed on several occasions that two tunasarrived at the FAD less than a minute apart after absences of many days, indicatingthat yellowfin tuna can remain together within a single school on the above time scaleof several months.
A more detailed study on a group of five among fourteen tagged fish (Klimley &Holloway, 1996b) suggests that there is a fidelity of tuna to a given FAD (tunas arefaithful to a FAD and rarely visit the other ones located at less than 6 miles). Inaddition, the time of visiting the FAD seems different according to the schools. It ispossible that separate schools have separate feeding routes or, conversely, themajority of schools visit the same waypoint at the same times. The authors did notcomment on the fact that most of the tagged yellowfin remained in the Hawaii areaduring the seven months of observation, which is partially in contradiction to thecommon belief of seasonal migration of this species (Suzuki, 1994), but can beexplained by low seasonal variation of surface temperature in this area.
From an experiment with ordinary dart tags, Kleiber and Hampton (1994) foundevidence of the effect of FADs and of islands on the movements of skipjack tuna.They fitted a model of fish movements to the tag data and estimated that the presenceof up to four or five FADs per 50 km2 can reduce the propensity of skipjack tuna toleave that area by approximately 50%. Possibly part of the tuna population (at least

Attraction and Association 145
for yellowfin and skipjack tuna) is sedentary and remains all year round associatedwith FADs or with other landmarks such as islands, underwater reefs or seamounts(Holland & Kajiura, 1997).
The associative behaviour of tuna towards logs is believed to be nocturnal becausemost purse seine sets on tuna shoals associated with logs are conducted before sunrise(Fig. 6.8; Hall et al., 1992a; Hallier & Parajua, 1992b; Hampton & Bailey, 1992).Purse seiners stay close to logs during the night and make a set early next morning iftuna are detected underneath the log. It is believed the association breaks or is not soclose during the morning when the tuna shoal starts searching for food. Still, logs areinvestigated by purse seiners throughout the day, and about 17% of successful sets areperformed in the Indian Ocean from 0800 to 1800h (Fig. 6.8). Interestingly Hamptonand Bailey (1992) found a second peak of sets at dusk, which suggests that fish getcloser to the floating object when visual conditions are still good. All these factsindicate that the association is not strictly nocturnal, and possibly that there arevariations according to the areas (but we do not know if this is due to differences infishing strategies, fishing equipment, environment or fish behaviour). In the next
(a) Log sets 50
40g>, 30ocCIJ
is- 20CIJ...
I..L.10
11111 11 _ .. ..
(b) School sets 12
10,.....~ 8>,0c 6CIJ:ler 4CIJ...
I..L.
2
0
45678910111213141516171819
Time of day
I I 114 5 6 7 8 9 10 11 12 13 14 15 16 .17 18 19
Time of day
Fig. 6.8 Time of (a) log sets and (b) school sets performed by the western Indian Ocean by purse seinersfrom 1981 to 1989(redrawn after Hallier and Parajua, 1992a).

146 Chapter 6
section we will see that ultrasonic and acoustic surveys around anchored FADs givecontrasting results, often opposed to those related to log-associations.
Different attempts at modelling the influence on tuna aggregation of populationdynamics have been proposed during the last two decades of the twentieth century(seesection 8.3). These models are sensitive to the estimates of the radius of attractionof FADs. From ultrasonic tagging experiments performed around anchored FADs,Cayre and Chabanne (1986) estimated this radius at 6 n.mi., Hilborn and Medley(1989)at 4.3 n.mi., Holland et al. (1990)at 5nmi., Cayre (1991) at 7 n.mi.and Marsacand Cayre (1998) at 5 n.mi. As far as we know, there is unfortunately no radiusestimate available in the case of drifting objects, nor on the fishes' fidelity to theobject. Hall and Garcia (1992) speculated on different possible options for visits toone or several objects by tuna and concluded that there most likely is an associationwith any object encountered in the evening by the tuna instead of fidelity to one orseveralobjects as described above for anchored FADs.
The puzzling determination of association
The underlying mechanism of association is controversial. We review the differenthypotheses on this topic, from the oldest to the recent ones. Hunter and Mitchell(1967) analysed the 'concentration of food supply hypothesis' proposed by previousworkers (e.g. Kojima, 1956), which argued that small fish, zooplanktori and sessilebiota are more abundanton or near the floating objects, but they did not find strongevidence to support it and proposed two other suggestions. The first, 'the schoolingcompanion hypothesis', which was first proposed by Atz (1953); is based on theobservation that many schooling fish associate frequently with animals other thantheir own species. Atz suggested that for schooling fish an aggregating companioncould represent merely a simplepoint of reference for optical fixation; We will namethe second hypothesis 'substitute environment hypothesis', which is mainly based ona generalisation of the observation of Carlisle et al. (1964) that artificial reefsestablished in sandy locations rapidly attract groups of demersal fishes that would nototherwise inhabit these areas (nowadays many fisheries in the world take advantageof this. behaviour). Similarly for species not adapted to a pelagic life, and othersundergoing a change from pelagic to other modes of existence, a floating object mayfunction as a substitute.
As did Hunter and Mitchell (1967), Gooding and Magnuson (1967) discarded the'concentration of' food supply hypothesis' and proposed the 'cleaning stationhypothesis.for some of the fishes, based on observations ofrough triggerfish (Canthidermis maculatus) consuming parasites on conspecific and on other species; Butfinally, on the base of their in situ observation from a raft with an observationchamber, Gooding and Magnuson (1967) preferred the 'shelter from predator'hypothesis (but surprisingly they did not observe tuna during their two drifts whichlasted over a week in the central Pacific). This hypothesis had already been proposedby Suyehiro (1952) and Soemarto (1960) and received later support from theexperiment of Helfman (1981), who made visual observations of a black and whitecylinder (12cm high, 6.5cm in diameter) below the surface, by snorkling under a

Attraction and Association 147
shelter. He noted that a shaded observer could see a sunlit target at more than 2.5times the distance at which a sunlit observer can see a shaded target. This is due to thereduced background light and .veiling brightness of the shaded object. ThereforeHelfman (1981) concluded that a fish hovering in the shade is better able to seeapproaching objects and is simultaneously more difficult to see. Nevertheless, it islikely that this conclusion does not apply for silvered fish, as their coloration is anadaptation to diminish the contrast with the surface, but this could explain theobservation of Hunter and Mitchell (1967), who stated that unlike silvery fishes, darkcoloured fishes swim. close to floating objects. More recently, Rountree (1989)compared the effects of structure size on fish abundance around coastal midwaterFADs located in 14m of water off South Carolina. The structures attracted mostlyround scad (Decapterus punctatus) and exhibited a significant linear FAD size effect.This suggests that the FADs can be used as shelter by such small bait fishes.
Klima and Wickham (1971) proposed that floating objects and underwaterstructures provide spatial references around which fish orientate in the otherwiseunstructured pelagic environment, but this hypothesis is difficult to demonstrate and isnot valid for objects quickly drifted by the wind. Hunter and Mitchell (1967) markedten adults ofCanthidermis maculatus and released them separately at 7.5, 15and 30.5mfrom their .original log. One hour and 30 minutes later, three out of four released at7.5 m and three out of four released at 15m had returned. Neither of the two fishesreleased at 30.5m returned to their log. Despite the low number ofobservations in thisin situ experiment (which would merit being repeated with other species), it seems thatthis species of fish returned to the log when it was within visual range.
In contrast, experiments on ultrasonic tagged tunas clearly established the existenceof a homing behaviour related to anchored FADs. These observations of tagged fishwere performed onyellowfin and bigeye tuna (Holland et al., 1990), on skipjack andyellowfin tuna (Cayre & Chabanne, 1986; Cayre, 1991; Marsac et al., 1996) or onyellowfin tuna only (Brill et al., 1996). They indicate that the fish tended to remaintightly associated with the FADs only during the day, but most of them were able toswim as far as 10n.mi. away from the FAD during the night and return directly to it inthe morning. These experiments indicate also that the fish can locate the FAD andcome directly back to it. For instance, Marsac et al. (1996) reported that a yellowfintuna covered the 7 n.m.i. distance between two FADs in less than 2 hours. Nevertheless, it is not clear whether the fish are able to detect the FAD at long distance (byits noise signature or by olfaction, for instance) or whether they navigate aftermemorising its geographical position as suggested by the authors (see Chapter 7, onlearning capabilities in fish). Even though some daytime excursions were alsoobserved during tagging experiments around anchored FADs, the predominance ofnight-time excursions contrasts with the log-set fishing data analysis already reported,which mentioned that catches around logs occur chiefly around sunrise. Acousticsurveys performed around FADs in French Polynesia gave conflicting results in termsofdaily variability of abundance (Depoutot; 1987; Josse, 1992), partially due to thedifficulty of echo identification. Despite many uncertainties, it is obvious that fishbehaviour associated with anchored FADs differs from the behaviour of fishassociated with drifting objects.

148 Chapter 6
It is noteworthy that in some areas where natural floating objects are not abundant,some tuna species were seldom caught before the use of artificial floating objects. Thisis observed in the eastern Atlantic tuna fishery, south of the Equator, where dispersed
. skipjack tuna are concentrated by artificial floating objects and caught in substantialquantities (Fonteneau, 1992). In contrast, A. Fonteneau (pers. comm.) indicates thatartificial FADs do not give the expected result in the Canary current area wherenatural logs are few. Nevertheless, we have seen in the previous section that the 'logboat' tactic was used successfully in this area. According to A. Fonteneau, artificialFADs are not efficient in this area because they drift too rapidly due to the strength ofthe Canary current and/or to the trade-wind in the case of partially submergedobjects. This movement could result in a loss of geographical reference for the fish.The 'log-boat', however, is able to remain in a given area by use of its engine. Thebiomass associated with the baitboat is usually large, around 500 t according toskippers' estimates. It is reduced by only about 50% at the end of the fishing season,despite the fact that total catches might exceed 500t. In addition to a permanentrecruitment near the log-boat, there are indirect evidences of a high turnover of thefish associated with it, for instance a large day-to-day variability in the proportions ofthe three species in the catches.
As tentative explanationfor the association between fish and floating objects, Parinand Fedoryako (1992) proposed a classification of the animals associated withfloating objects. They distinguished three ecological communities related to floatingobjects. The two first communities are directly related to the floating object: the'intranatant' animals (invertebrates, fishes) live inside or less than half a metre fromthe object, whereas the 'extranatants' are located between half a metre and two metresfrom the object but may come closer when they need shelter. The fauna of these twofirst communities originates mainly from the coast or the continental shelf and simplyfollows the drifting object, or is made up of juvenile pelagic fishes. In a typical logconsisting of a 4 m tree trunk, the average biomass of these two communities is verylow (less than I t) compared with the third community of 'circumatants' which aremainly young or adult predators temporarily associated with the floating object andswimming at a greater distance, generally on the leeward side of the floating objectand often out of the field of vision, up to 5-7 n.mi. The biomass of this third community of predators generally exceeds 10 t (usually in the order of I(}-100t). Therefore it is obvious that the concentration of prey around the floating object is notsufficient to sustain tunas, which need to eat approximately 5% of their weight eachday (Olson & Boggs, 1986), despite the fact that they are able to starve for severaldays.
Nevertheless, the reason for the associative behaviour is still unclear for tunas,especially its link with feeding behaviour on remote prey. Batalyants (1992) agreesthat the 'concentration of food supply hypothesis' explained above is not relevant fortunas, but could be a good one for sharks and large dorado (Coryphaena hippurus)which may have small tunas in their stomach, even though there is no evidence offeeding under the floating objects. For tunas this author proposes the 'comfortabilitystipulation hypothesis', which means that tunas rest near floating. objects for regenerating energy when satiated, even though he does not exclude the possibility of a

Attraction and Association 149
hungry tuna resting after an unsuccessful search for prey. According to Batalyants'hypothesis, feeding of associated tunas is supposed to occur during the night on preymigrating to the surface layers (which could fit in with previously mentioned swimming behaviour observed with acoustic tagging, but not with most of the stomachcontent studies performed on anchored FADs, e.g. Buckley& Miller, 1994) andaround noon, and resting occurs early in the morning and during the afternoon. Thishypothesis is based on stomach content analysis, but the reason why tunas choosefloating objects to rest instead of any other place is not clearly explained.
Buckley and Miller (1994) did not find any significant difference in diet betweenyellowfin tuna associated and unassociated with FADs, and reinterpreted contradictory results in the literature (e.g. Brock, 1985) in order to defend the similarity offeeding behaviour. They suggest that tunas are not feeding atnight but may prey onvertically migrating mesopeiagic organisms during crepuscular periods. Nevertheless,the night-time excursions of yellowfin away from FADs (or island reefs) are interpreted by Holland et al. (1990) as a foraging behaviour targeting on squids andshrimp, and Brock (1985) found that 84% of the yellowfin in the FAD fish community feed almost exclusively (92% by volume) on deep-dwelling oplophoridshrimp, against only 4% of the non-FAD-associated yellowfin. Brock interpreted thisshift in feeding habits as the result of the high competition for food under the FADsdue to concentration of tunas and other predators. In the case of seamounts, Yuen(1970) had a similar interpretation of skipjack tuna nocturnal excursions, which wererelated to feeding and exploration of the surroundings.
The seven former hypotheses are:
(I) Concentration of food supply hypothesis(Kojima, 1956 or earlier)(2) Schooling companion hypothesis (Hunter & Mitchell, 1967)(3) Substitute environment hypothesis (Hunter & Mitchell, 1967)(4) Cleaning station hypothesis (Gooding & Magnuson, 1967)(5) Shelter from predator hypothesis (Suyehiro, 1952; Soemarto, 1960; Gooding &
Magnuson, 1967)(6) Spatial reference hypothesis (Klima & Wickham, 1971)(7) Comfortability stipulation hypothesis (Batalyants, 1992).
Two new hypotheses are:
(I) Generic-log hypothesis (and related hypotheses) (Hall, 1992a)(2) Meeting point hypothesis (Soria & Dagorn, 1992; Dagorn, 1994;and this book).
Hall (l992a) proposed a long series of hypotheses in order to explain the migratorycycle of yellowfin in the eastern Pacific Ocean. Among those hypotheses, fourcomplementary ones ('indicator-log', 'generic-log', 'follow-the-local' and 'dolphins-
. are-simply-fast-logs') are related to associative behaviour, but can be regroupedunder the name of the second one, 'the generic-log' hypothesis. The author states firstthat the association of tunas with floating objects develops in response to the tunas'need to remain within a biologically rich water mass when they are not searching forprey, especially during the night. Floating objects are often indicators of such watermasses and are moving with them or are trapped in vertical convection cells named

150 Chapter 6
Langmuir cells (Fedoryako, 1982) or in convergence areas. This hypothesis fits withthe second of the three requirements necessary in a habitat suitable for reproductionin pelagic fishes according to Bakun (1996):
(I) Enrichment (upwelling, mixing, etc.)(2) Concentration processes (water-column stability, convergence, frontal forma-
tion)(3) Retention of ichthyoplankton within an appropriate habitat.
Possibly the association with floating objects is the result of an evolutionary processin tunas which could facilitate their detection of, and remaining in, concentrationareas. When they associated with anchored FADs they could simply have been misled(but see below for other interpretation related to anchored FADs). The 'generic-log'hypothesis itself is simply a generalisation. It relates association with any floatingobject (natural, FADs, boat) to association with animals of other species (dolphins,whales), dead or alive. Tunas associate with anything on the surface, floating orswimming, because it is an indicator, the only constraint being that the object doesnot move faster than the tunas can swim. This would explain why only tunas canassociate with fast-swimming dolphins (see next section). Let us argue now on ourpreferred hypothesis, the 'meeting point hypothesis'.
The meeting point hypothesis
We name as the 'meeting point hypothesis' the possible enhancement of fish aggregations by floating objects as a process aimed to favour the encounter rate betweensmall schools or isolated individuals. The idea was first suggested during a workshopon fish aggregation in Montpellier, France (Soria & Dagorn, 1992), along withanother hypothesis related to a possible effect of schooling reinforcement underfloating objects that we will not develop here. Later, the meeting point hypothesis wassuccessfully simulated by artificial life (Dagorn, 1994), and we will try to develop itfurther here. .
First the meeting point hypothesis considered the facilitation of aggregation ofdispersed fish around the object which would act as a meeting point. This facilitationcan occur for fish dispersing during the day or the first part of night, and resumingschooling during the second part of the night around the floating object (at least in thecase of non-anchored objects). Second, this hypothesis also considered the possibilityfor small schools, which might be under an 'optimal size' (Sibly, 1983) to takeadvantage of a meeting point for gathering and might therefore benefit from thenumerous advantages of schooling (sections 4.6 and 4.7). This could explain the directobservations reported by Yu (l9~2), who noticed that small schools appeared beforelarge schools around floating objects. Moreover, it can explain the 'snowballingeffect' observed around the floating objects: biomass increases with time and we havementioned that schools under floating objects are larger than free-swimming schools(Fonteneau, 1992) despite the fact that the frequency of repeated sets on floatingobjects certainly contributes to the decrease in the expected biomass under naturalconditions. This snowballing effect has been successfullysimulated by Dagorn (1994).

Attraction and Association 151
In fact Dagorn did not simulate specifically FADs' effect on aggregation but moregenerally the attraction of any detectable anomaly in the tuna's field of perception,following that in Petit (1991). We feel that association with FADs is not comparableto attraction by other anomalies, but this point does not interfere with the interpretation of the results obtained by Dagorn (1994). The meeting point hypothesis(and others) can also explain why artificial drifting objects (including the 'log-boats')are so successful in areas where natural logs are few. As in the generic-log hypothesis,evolutionary theory could explain the selection of this behavioural trait.
In addition, Dagorn (1994) supposes that the smaller length of individuals (especially yellowfin) caught under floating objects compared with those from freeswimming schools could be explained by the 'critical school biomass' expressed inweight of school. If this critical school biomass is exceeded, the individuals in theschool do not look for other conspecifics, they have no further interest in searchingfor a floating object, nor in remaining around it, and they leave it. Since the criticalschool biomass requires fewer individuals to be reached for large fish (for instance a50 tonne school requires 25000 individuals of 2 kg whereas the same biomass isreached with only 500 individuals of 100kg), this could explain why a majority ofsmall fish are caught under floating objects.
We think that another factor related to predation could explain the smaller lengthof individuals associated with floating objects compared with those in free-swimmingschools. Small tunas can suffer attacks from different predators such as mammals particularly killer whales (Orcinus orca) - or other tunas, including billfish (Istiophoridae) and conspecifics (Tsukagoshi, 1983; Kikawa & Nishikawa, 1986; Zavalacamin, 1986; Reiner & Lacerda, 1989;Nitta & Henderson 1993), whereas large tunasare too big and swim too fast for most top predators. Despite the lack of behaviouralobservation on schools of small tunas suffering attack, we can suppose that they reactsimilarly to small pelagic fish, that is by a large repertoire of manoeuvres, includingschool splitting (Pitcher & Parrish, 1993). In addition, the cohesion of a school certainly decreases with the number of individuals under different circumstances (attackby predators but also feeding, migration, night dispersion). Therefore, for a givenschool biomass, the conservation of school integrity is probably more difficult for alarge school of smalltunas than for a small school oflarge ones. Once more this couldexplain a more frequent need to use a meeting point for small tunas than for largeones. "
A remaining question could be the reason for the variability of differences in lengthaccordingto the species (similar lengths for skipjack and bigeyetuna when associatedor not with floating objects, but smaller lengths for yellowfins associated with floatingobjects compared with free-swimming schools). The reason could be a difference inhabitat selection (mainly depth and oxygen; see section 3.3) between the two largetuna species when adult: large bigeye tuna live deeper and are less available to surfacegears than large yellowfins. Skipjack tuna is a smaller surface species, "in whichmaximum fork length seldom exceeds 70cm in commercial landings, and it sufferspredation during most of its life span (Zavala-camin, 1986). Nevertheless, an interesting exception in the size distribution of this species is the western Pacific, where fishover 70 cm are caught in substantial numbers (Hampton & Bailey, 1992). A detailed

152 Chapter. 6
comparison between length frequency distributions made on a large number of fishcaught under logs and length frequency distributions from non-associated schools inthis area indicates that these large skipjack tuna are found only in non-associatedschools and are nearly totally absent under logs (Fig. 6.9). Therefore the associationwith logs in the surface layer could be more size dependent than species dependent.
3000
2500
2000
....QJ
.D
E 1500·:::Jz
1000
500·
025 35 45 55 65 75
Fork length (cm)85
Fig. 6.9 Size frequency distribution ofskipjack tuna (Katsuwonus pelamisy fromschool sets and log sets by US purse seiners in the western Pacific from 1988 to1991 (redrawn after Hampton and Bailey,1992). School sets (§;§), n = 48 148; logsets (i!l'!ll), n = 20 172.
In the case of isolated fish, as in a small school, the probability of encounteringconspecifics by simple random swimming in the wide habitat of tunas is very low,taking into account the limited range of vision, especially during the night and atdawn. If we assume that tuna are not able to maintain schooling all nightlong, it islikely that they resume schooling before sunrise, and possibly drifting objects canenhance this aggregation. This difficulty of encountering conspecifics can be compared to the problem of some solitary terrestrial animals during the mating season,especially when they are in a situation where vision is limited. They have developedsophisticated cues in order to detect the mate at long distance. In nocturnal solitaryinsects, like the bombyx moth, the male is able to detect very low concentration ofpheromone emitted by the female at more than 10km (Fabre, 1930). In pelagic fish,aggregation pheromones have not been extensively investigated but could be aninteresting candidate to explain the social behaviour (section 3.3). In the forest, forinstance, the bell of the hart is a low frequency sound that can be heard at severalkilometres by the females. Similarly, the low-frequency components in the song ofhumpback whales can be used in long-distance location ofconspecifics. In tunas, if weimagine that when encountering a floating object a fish remains around it for a certainperiod of time before searching for another floating object (or a conspecific), thismechanism would not necessarily increase the probability of encounter with otherconspecifics. But if the floating objects are easier to detect than conspecifics, andneither too numerous nor too greatly dispersed, then there is certainly again tothis

Attraction and Association 153
behaviour. Usually floating objects are less numerous than tunas and are clustered byphysical processes. They are probably easier to detect by vision than conspecificsbecause, like most pelagic fishes, tuna species are countershaded. Floating objects,however, are seldom silvered, and it seems that dark objects are more attractive.
Auditory detection of floating objects is probably also possible, especially formedium or large objects that can amplify the noise of slapping on the surface in achoppy sea. Anchored FADs probably also emit sounds from mooring-line vibrations, and drifting pole-and-line vessels used as FADs are not silent because theirsecondary engine is working permanently. Olfactory detection is also possible, dueeither to the object itself (wood, synthetic material) or to the epifauna. Nevertheless,when a tuna patrols in the vicinity of an FAD it can be either upcurrent (e.g. Hollandet al., 1990)or on the leeward side (e.g. Parin & Fedoryako, 1992; Cillaurren, 1994,but only in 'the case of yellowfin tuna), and only this last location is believed to favourdetection by olfaction. Moreover, we have already reported from the literature evidence for the possibility that tuna come back to the same anchored FAD from severalmiles upstream. This suggests an orientation capability not related to olfaction (e.g.geomagnetic field; section 3.3.6).
If tuna are to resume schooling before sunrise (as do coastalpelagic fish, e.g. Freonet al., 1996), they need to be close to the floating object to meet at this time. As withthe effect of light attraction, the school is probably easier to capture at this particularmoment. This could explain why tuna fishermen perform their sets mainly arounddawn, despite the fact that schools could remain at a few miles from the floatingobject during daytime. It could also explain the larger catch per set if we suppose thatthe whole school is caught under a floating object whereas part of it can escape inother circumstances (but note that the meeting point hypothesis can explain higherschool biomass under floating objects if dispersive processes are more important thanaggregative processes away from the floating object's influence). Some contradictionsfound in the literature on the times of day that are believed to correspond to closerassociation between the fish and the floating object could also be partially explainedby the circadian variation of the distance between the school and the object. Association around anchored FADs seems mainly diurnal, whereas it seems nocturnal forlogs.. But contrary to ultrasonic observations around FADs, log data come fromfishermen and depend on the range of exploration around the object and on thedefinition of daytime and night-time. Possibly catches made not exactly under logsare reported as non-associated school catches. In addition, the importance of twilighttransitionperiods could be underestimated, especially at dawn.
Nevertheless, it is likely that differences between log-associated and anchoredFAD-associated tuna behavioural mechanisms do exist. They could be due to the factthat tuna can more readily locate an anchored FAD than a log, not only because it isfixed but due to its size (always greater than the one metre length limit found by Hallet al., 1992b), together with its vertical extension due to the mooring, its probablysound emission and in many cases its light signal (also present on some driftingFADs). It seems that association with FADs can be related to association with seamounts, underwater reefs and islands, contrary to association with drifting objects. Inall these situations, the permanence of the structure and its close distance to a coast or

154 Chapter 6
island allows for the development of learning capabilities related for instance toorientation to usual coastal foraging areas, as suggested by Yuen (1970), Holland etal. (1990) or Klimley and Holloway (1996a). These interpretations on anchored FADassociated tuna are compatible with the need for a meeting point. Similar in situobservation of searching strategy involving site fidelity, spatial memory and expectation have been observed by Noda et al. (1994). In addition Warburton (1990)studied the use of local landmarks by fish (see section 7.3 for details). Some authorsspeculated on other specific mechanisms of tuna association with anchoredFADs,but their proposals are not very convincing'. An additional difference between adrifting object and an anchored FAD is that fish associated with an anchored FADmight have to swim against the current, and this can be energy consuming in certainsituations, contrary to the case of log-associated fish (except if emerged structuresallow for fast wind drifting). '
The meeting point hypothesis is not incompatible with some of the others. Itpresents some obvious relationships with the spatial reference hypothesis, at least inthe case of anchored FADs, but at a larger range than stated by Klima and Wickham(1971).The comfortability stipulation hypothesis (Batalyants, 1992) could be complementary to our hypothesis since the need for tunas to rest can be combined withthe need to wait for conspecifics at a meeting point. Even if association with a logwould not in~rease the probability of encounter but just keep it equal, it would stillpresent the enormous advantage of saving energy by limiting displacements. Themean travelling speed of tuna has been estimated by different authors (Carey &Olson, 1982; Cayre & Chabanne, 1986;Holland et al., 1990; Brill et al., 1996; Marsac& Cayre, 1998)and is usually around 2.5 n.mi. per hour. The generic-log hypothesis,and more specifically the indicator-log sub-hypothesis (Hall, I992a), specifies apossibility for tunas to gatherin an area where prey concentration is likely to be high,and to follow this concentration by remaining around drifting objects (logs or driftingFADs). This is not in contradiction with the idea of a meeting point, but the genericlog hypothesis does not apply to anchored FADs - except if we imagine that tunas aremisled by these artificially fixed objects - nor for logs drifting mainly by' the wind,which do not necessarily fit with the concentration of pelagic prey.
6.3.2 Association with other species
In the eastern Pacific Ocean, surface yellowfin schools are often observed associatedwith dolphin schools,and a major part of the catches are taken by aiming the fishingdirectly at dolphin schools (Perrin, 1969; HaIl1992b). In this portion of the oceanthere is a rather shallow thermocline « 100m) that. probably facilitates the
I Holland et al. (1990) suggested that by orienting to FAD~ the fish could maintain a fixed position in thecurrent flow and may feed on current-borne prey, similarly to trout holding station in a river. But the resultspresented in their paper do not support this hypothesis because during the day fish are found movingpermanently and are located out of the visual range of the FAD (> 500m), an observation also made byMarsac and Cayre (1998). Buckley and Miller (1994) suppose that at night tunas avoid a fixed point ofreference where nocturnal predators may easily find them.:

Attraction and Association 155
encounter and preserves the stability of the association (Hall et al., 1992a).. Thespecies of dolphin most frequently involved is the spotted dolphin (Stenella attenuata). Other tuna species (skipjack, bigeye, black skipjack Euthynnus Iineatus andfrigate tuna Auxis spp.) and dolphin species (mainly Stenella longirostris and Delphinus delphis) are also involved, but much less frequently than the associationbetween yellowfinand spotted dolphin (Perrin, .1968; Alien, 1985;Au & Pitman, 1988;Hall, 1992a). Usually only large tunas associate with dolphins and the reason for theassociation of tunas with dolphins is still uncertain. Stuntz (1981) and Hall (1992a)summarise the main hypotheses in the early literature:
(1) In the 'contagious distribution hypothesis', both species are large piscivores thatfeed upon concentrations of similar food at the same place; this hypothesis doesnot explain the fact that the two species are swimming so closely to each other.
(2) In the 'innate schooling behaviour hypothesis', schooling is interpreted as acover-seeking habit that evolved in a pelagic habitat where objects that provideshelter are rare, which would explain the occurrence of mixed schools; thishypothesis does not match the present interpretation of schooling behaviour,unlike the following one. ..
(3) The 'predator avoidance hypothesis' is based on evidence that predators aremore easily detected and confused by schooling prey; this is obvious for smallpelagic species, including juvenile tunas, but in the case of tuna-dolphin associations the large species involved have few predators.
(4) The 'food finding' hypothesis suggests that tunas and dolphins travellingtogether can prey more efficiently by complementary sensory modes (visual andolfactory for the tunas, sonar and visual for the dolphins) and by cooperativehunting. There are no in situ visual observations to support this hypothesis aridindirect observations provide contrasting results. From simultaneous acoustictracking of tunas and dolphins, Scott et al. (1995) concluded that their association often breaks due to opposite diel vertical migrations. A study of thecomparison of feeding behaviour of yellowfin tuna and dolphins (Olson &Galvan-Magafia, 1995)indicates the different feeding periods and prey. Buttwoyears later and with more data the same authors found a substantial overlappingin the diet of these two animals (Galvan-Magafia & Olson, 1997).
From the end of the 1980s to the beginning of the 1990s, fishermen were underpressure from environmentalists due to the killing of dolphins during tuna fishing inthe eastern Pacific purse seining fishery. The cooperation of fishermen and theimplementation of systems permitting dolphin escapement have now resulted in avery low mortality of the mammals (Chapter 2).
The reason why yellowfin are found associated with dolphins in only the easternPacific Ocean remains unexplained. In the European purse seine fisheries of theAtlantic and Indian oceans, despite the presence of these cetaceans, the mean numberof dolphins circled by net in 1995 was very low: 0.1 in the Atlantic on a sample of 360sets, and 0.05 in the Indian ocean on a sample of 432 sets. The mortality is even lowerbecause most of the dolphins escape or are released before the end ofthe circlingprocess (Stretta et al., 1996). We speculate on the possible role of the marked

156 Chapter 6
thennocline and especially oxycline in the eastern Pacific (Fonteneau, 1997), whichcould limit deep excursions of dolphins. In other oceans those deep excursions couldbe possible only for dolphins and not foryellowfin, which have a narrower preferendum of temperature and oxygen.
Marine birds are currently observed near surface tuna schools because they feed onthe same prey as tuna or on prey associated with tuna prey (Au, 1991) and the presence of birds is used to spot the tuna schools. Fishermen use powerful binoculars andhigh-resolution radars to detect flocks of birds (Herve et al., 1991). Interestingly,birds are more often seen above non-associated schools than above schools associatedwith floating objects. Stretta et al. (1996) estimated that birds were observed in 68%of the set schools caught in the eastern Atlantic and 64% of those caught in the IndianOcean. In contrast, birds were present above only 23% of the schools associated withfloating objects in the Atlantic and 32% in the Indian Ocean. Despite the likelyunderestimation of the proportion of surface schools not surrounded by birds andtherefore not detected by fishermen, these observations reinforce the idea that thereason for the association of tuna with floating objects is not related to prey.
.In some areas, catches of tuna are also taken in association with larger marineanimals such as the whale shark and whales (Stretta & Slepoukha, 1986; Fonteneau &Marcille, 1988). In the tropical west Atlantic, a study during 1987-1991 indicated thatmore than half the tuna catches (dominated by yelIowfin) were made under whales(22%) or whale sharks (32%), against less than 1% under logs, while the rest of thecatch was made on non-associated schools (Gaertner & Medina-Gaertner, 1992). Anegative trend with time in the proportion of schools associated with whales isobserved, but no information is available to relate this decrease to a possible decreaseof whale abundance. The main whale species present in the Caribbean are Baleanoptera edeni, Megaptera novaeangliae, Ziphius cavirostris and Physeter macrocephalus. The main whale shark species is Rhincodon typus. This kind ofassociation isscarce in the other oceans (Fonteneau, 1992; Stretta et al., 1996). Here we also lack avalid explanation for the reason for this association. Nevertheless, contrary to thetuna-dolphin association, which is very dynamic, the association with shark whalescould be considered similar to the floating object association discussed in the previoussection, especially in the case of dead whales. Similar to observations reported onfloating objects, repeated sets on carcasses during a week or even more indicate a slowdecrease in the catch (Bard et al., 1985; Cayre et al., 1988). Here also the hypotheses ofmeeting points or water-mass indicators, among others, can apply.
In the west Pacific the association of tunas with whales is less frequent. From ananalysis of the South Pacific Commission database, Hampton and Bailey (1992)estimated a 2% occurrence of this type of association in the purse seine fishery,despite' large variation according to the flag of the tuna fleet. But due to the hugelanding of the international fishery, this represents more than 40000 tonnes. Theauthors identified three distinct association types. The first type is tuna aggregatingand feeding with sei whales (Balaenoptera borealis) and, to a lesser extent, minkewhales (B. acutorostrata) on ocean anchovy (Stolephorus punctifer]. This is notconsidered a real association but a eo-occurrence of species feeding on the same preyfor a short period of time. The second is schools aggregating around floating car-

Attraction and Association 157
casses of sperm whales (Physeter catodon), which is similar to log association. Thethird type of association, considered as intermediate between the two previous ones,consists of schools associated with the slow-moving whale shark (Rhincodon typus). Inthis last case there is also a common prey (ocean anchovy), but the association can bemaintained for some time.
6.3.3 Summary ofassociative behaviour
Many pelagic species display an associative behaviour with items located at thesurface or subsurface, either drifting ('logs', drifting FADs) or anchored (anchoredFADs), either object or animals (dolphins, sharks, whales, either dead or alive), eithernatural or artificial. Nevertheless, only some coastal. pelagic species display thisbehaviour, especially towards anchored FADs, and most of these coastal species havean oceanic stage of life. In contrast tunas are champions of all types of associations,but the underlying behavioural mechanism(s) are not well understood despite thelarge number of descriptive works produced during the last 10 years. It is not certainthat a single behavioural trait can account for the different kinds of association,especially for the three main groups:
(I) Drifting objects or animals(2) Anchored FADs(3) Fast-moving mammals.
At least in the case of tuna, it seems that these associations depend on geneticbehavioural trait(s), probably related to the schooling behaviour of this species.
Among the numerous hypotheses proposed to explain this behaviour in tunas, wethink that the two most credible ones are the 'generic-log' hypothesis (Hall, ·1992a),which permits the fish to detect and follow prey concentration areas by following adrifting object, and the 'meeting point hypothesis' (Soria & Dagorn, 1992; Dagorn,1994; and this book), which could favour schooling behaviour and save waste ofenergy in searching for conspecifics. Both hypotheses agree with the fact that the onlyfactors which seem to influence the attractiveness of floating objects are related to thepossibility of detecting them (minimum size, submerged area, dark colour, noise).Nevertheless, further studies are required to understand the difference in tunabehaviour according to their association with logs or anchored FADs. Possibly. theadditional complexity and variability of association with fixed items (anchoredFADs, islands, seamounts) can be partially explained by the possibility of learninghow to use a reference point, which does not exist with drifting objects. This couldexplain differences in the results of studies aimed at studying school fidelity in tunas.
From the frequency of rare allele in Pacific yellowfin and Pacific skipjack tuna,Sharp (I 978b) suggested long-term fidelity to school of these two species of tuna.External tag experiments performed by Bayliff (1988) out of anchored FADs (butmaybe around logs) indicate that after three to five months at liberty, tagged anduntagged skipjack tuna were randomly mixed. In contrast, Klimley and Holloway(1996b) demonstrated that yellowfins tagged around FADs are able to remain in thesame school for at least seven months. It seems advisable to recommend ultrasonic

158 Chapter 6
tagging experiments based around drifting objects (natural logs or drifting FADs) inorder to better understand the differences in tuna behaviour according to whether theobject is fixed or not. .
The association with mammals, especially with dolphins, is also puzzling. Possiblyit is related to the floating object association as suggested by Hall (I 992a), but it seemsmore easily explained by the 'food-finding' hypothesis (Stuntz, 1981) based on thecomplementary sensory modes (visual for the tunas, sonar and visual for the dolphins) in prey detection. For other species, especially bait fish, young stages ofdemersal fish and non-schooling top predators, other hypotheses might be valuable,especially the 'concentration offood supply hypothesis' (Kojima, 1956, or earlier) andthe 'shelter from predator hypothesis' (Gooding & Magnuson, 1967).

Chapter 7Learning
7.1 Introduction
Early ethologists believed that animal behaviour was mainly instinctive or preprogrammed and that experience did not play a major role, which was mainly true forinsect behaviour (Fabre, 1930). In contrast, psychologists claimed that experience andlearning were the major determinants. Even in the case of fish, it is now recognisedthat neither of the two opposite viewpoints is entirely correct. Animal behaviour ingeneral and learning in particular are the result of a complex interaction of genotype,physiology and experience.
Different types of learning can be identified. The following ones are commonlyidentified:
• Habituation (persistent waning of a response to a repeated stimulus, withoutreinforcement)
• Social facilitation (an individual learns from its conspecifics)o Conditioning, including classical conditioning or reflex conditioning (typically
Pavlov's salivary responses of dog) and operant conditioning (association of theanimal's behaviour with the consequences of that behaviour)
• Imprinting (fast and irreversible acquisition; in fish biology, the most importantclass of imprinting is locality imprinting by larvae or juveniles, which are then ableto identify their place of birth during the natal homing process)
• Avoidance learning (also named aversive conditioning).
The classification of these types of learning varies with different authors (e.g.Guyomarc'h, 1980; Eibl-Eibesfeldt, 1984; Lorentz, 1984; Drickamer & Vessey, 1992;Soria, 1994).
In this chapter we will review the most important categories of learning regardingspatial dynamics and stock assessment of pelagic fish. Unfortunately, most of thiswork has been performed on coral reef species or freshwater species. Nevertheless, it islikely that most of the results can apply to other species and, as far as possible, we willgive several references in order to show the possible generalisation of the authors'conclusions.
7.2 Learning in fish predation
In fish, the anti predator influence of learning has retained the attention of scientistsfor the last two decades of the twentieth century. In their review of learning in fish

160 Chapter 7
predation, Csanyi and Doka (1993) distinguish four classes of interactions betweenprey and predator fish: individual level, group level, among prey level and learning bypredator (small section, not reported here). These authors also present aquariumexperiments designed to determine the key stimuli in learning and hypotheses oninteractive learning. We try here to summarise their work and incorporate some othernew references. Finally, wegive some thoughts on the comparison between learning inavoiding predators and in avoiding fishing gear.
7.2.1 Individual level
The individual level involves recognition and inspection of the predator, includingdiscrimination between a hungry and a satiated one, and finally defence responses.We will review these different aspects and terminate this section by some considerations on the mechanisms of learning and on trade-off and learning.
Fish, like most vertebrates, are able to recognise their natural predators withoutprior experience and respond appropriately on their first exposure to them, whichsuggests a strong genetic component (Pitcher & Parrish, 1993). Studies on theontogeny of antipredator behaviour indicate that ability to recognize predatorsappears in paradise fish larvae (Macropodus opercularis) between 15 and 20 days oldand is under broad genetic control (Miklosi et al., 1995). This genetic control wasalready evidenced on the Trinidadian guppy (Poecilia reticulata): local variation inpredation pressure significantly affects the avoidance, schooling behaviour andcourtship behaviour of this species, even on laboratory-reared populations, as shownby Seghers (1974b), Magurran and Seghers (1990, 1991)and Magurran et al. (1993).These results were also confirmed by observations on sticklebacks (Gasterosteusaculeatusi (Giles & Huntingford, 1984).
Despite the strong genetic component in both predator recognition and inspection,Csanyi (1985) and Csanyi et al. (1989) have observed in 'naive' paradise fish(Macropodus opercularis) a decrease in duration of inspection in front of another fishspecies, the goldfish Carassius auratus (here, and in the rest of the book, 'naive' meansa fish that has no experience regarding a given stimulus). This decrease was stillsignificant if the second encounter took place three months later (Fig. 7.1). If theolfactory nerves of the paradise fish are cut, the inspection duration does not decreaseas fast during repeated encounters as in the controls (Fig. 7.2 from Miklosi & Csanyi,1989). This suggested that the memory formed during the encounters contains notonly visual but also olfactory information (also confirmed by Gerlai (1993) inexperiments on the same species and by Magurran (1989) on the European minnow,Phoxinus phoxinus). Moreover, paradise fishes which experienced repeated attacks bya predator diminished their inspection and finally tried to 'escape' by constantlyswimming perpendicular to the glass wall of the aquarium (Fig. 7.3). Even though thismanoeuvre was unsuccessful, it suggests some learning process expressed as anattempt to avoid the next encounter (Csanyi, 1985). Similarly Chivers and Smith(1994a, I994b) found no response of predator-naive fathead minnows (Pimephalespromelas) to chemical stimuli from northern pike (Esox lucius) while wild-caught fishof the same age and size did respond. Fourteen days were necessary for minnows from

....0'2
60cc·C :J:J 0-ou
c 40.cQ)o0-0o c
20.... 0Q.uQ.Q)
<l:: rn
~Q)0
:5
Learning 161
:3 h 1 day 1 month 2 months :3 months
Time interval between the firstand second encounters
Fig. 7.1 The percentage of time spent in exploration during a second encounter of paradise fish (Macropodus opercularis) with a goldfish (Carassius auratus) at various intervals after the first encounter. Barsrepresent means of observation within a group (+ SE). (Redrawn from Csanyi et al., 1989.)0 = Control;III = treated.
a pike-free pond to acquire recognition of pike odour (Chivers & Smith, 1995).Theseresults suggest that previous experience is necessary for chemical predator recognition. Nevertheless, the experiment also demonstrated that reinforcement was notrequired for predator recognition to be retained.
In schooling species, Magurran and Pitcher (1987) also found some evidence oflearning in the so-called 'predator inspection visit', which is the observation of apredator by an individual fish leaving the school for a few seconds to approach apredator and return to the school (Pitcher et al., 1986b). Magurran and Pitcher (1987)found inspection of pike by minnows ceased after a successful attack on another fish,which strongly suggests some learning during the process. Huntingford and Coulter(1989) found habituation of predator inspection in sticklebacks. Habituation topredator models was observed by Welch and Colgan (1990).
Csanyi and Doka (1993) found little information on the role of learning in thediscrimination between hungry and satiated predators by paradise fish. In contrast
40
30
~ 20
10
o2 :3
Sessions
4 5
Fig. 7.2 Percentage of time spent byparadise. fish (Macropodus opercularis)with approach towards the goldfish(Carassius auratus) in each of the fivesessions (mean + SD). (-) = shamoperated control fish; (- - -) = olfactorynerves destroyed prior to experiment(olfl); or (....) after the first session(01£2). (Redrawn after Mikl6si &Csanyi, 1989.)

162 Chapter 7
100
50
2
Trials
4 5
Fig.7.3 Percentage of time in each of the five trials spent in escape behaviour of paradise fish (Macropodus. opercularis) in the presence of a satiated pike (Esox lucius). Bars represent group mean C± SE). Emptyo = group of fish kept in total isolation from conspecifics or other fish (control); Isolated (mm) = isolatedas the empty group but found a satiated pike in each session; Naive = (~) not isolated, found a satiatedpike in each session; Chased (.) = survivors after experiencing the presence of a hungry pike at the firstand third sessions. (Redrawn after Csanyi, 1985. Published by Brill, Leiden, The Netherlands).
Licht (1989) found that guppy (Poecilia reticu/ata) could discriminate between hungryand satiated predators. He argued that a flexible response to the differential threatcan help to lower the costs of anti-predator behaviour. Magnhagen and Forsgren(1991) showed that sand goby (Pomatoschistus minutus) did not discriminate between
.hungry and satiated cod, even though hungry cod ate more gobies. Despite the limitednumber of experiments on discrimination of level of hunger in the predator, it seemslikely that fish are able to learn from the predator's behaviour its level of hunger.Personal in situ observations by one of the authors of this book on the behaviour ofpelagic or reef-species schools in the presence of barracuda (Sphyraena barracuda)indicate that on many occasions the preyfish is not scared by the predator even whenit is only a very short distance away.
Behavioural genetic studies on the paradise fish indicate that many elements ofdefensive behaviour, or whole sequences, can be determined by genetic factors(Csanyi & Gervai, 1986; Csanyi & Gerlai, 1988; Gerlai & Csanyi, 1990).Nevertheless,in many cases this genetically programmed defence behaviour pattern can be modified by learning. Conditioning experiments on the. same. species show that theduration and frequency of the passive feeding responseswere influenced by learning(Csanyi, 1993). In another experiment, three groups of fish of the same species wereobserved in a large shuttle aquarium where a hungry or a satiated pike was resident inthe largest. part. Members of the control group had not encountered pike before;members of the second and third group had experienced a hungry or a satiated pikerespectively. Only fish of the second group quickly learned to avoid the largest part ofthe aquarium. In the same kind of aquarium, the authors observed the reaction of the

Learning 163
same species in front of a large carp. Even though this carp never attacked theparadise fish, at the beginning the avoidance reaction was similar to that towards ahungry pike. But this avoidance decreased rapidly and ceased completely after thefifth or sixth trial, with the paradise fish ignoring the presence of the big carp. Thisindicates the role of experience and learning in the relationship with other species.
The mechanism of learning still remains largely unknown but it is traditionallyaccepted that it is gradual (Krechevsky, 1932). In addition, Zhujkov (1995) studieddefensive learning and observed large differences in learning capacities among individuals, classified as fast- or slow-learning individuals. He hypothesised the existenceof two simultaneously developing independent learning processes: formation of thecause-effect relationship between conditioned and unconditioned stimuli, and formation of the motor avoidance response to the unconditioned stimulus. Nevertheless,recent findings on individual learning in fish suggest an 'all or nothing' type at thelevel of a particular individual, while variability in a group of fish comes from individual differences in. the number of repetitions necessary to reach conditioning(Csanyi, 1993). On the same line some authors working on commercial speciesindicate the possibility that fish that experience enormous stress from contact withfishing gear might undergo a 'one-trial learning' process (Beukema, 1970; Ferno &Huse, 1983; Pyanov, 1993; section 7.2.6). .
Decision-making in fish is often a trade-off between foraging profitability andpredation risk (Fraser & Huntingford, 1986; Hart, 1986; Huntingford et al., 1988);Even though few specific examples on fish are available at the moment, it is likely thatvarious learning mechanisms play an important role at this level (Lima & Dill, 1990).Huntingford and Wright (1992) show how inherited population differences inpredator reaction combine with learning processes and trade-off. Three-spinedsticklebacks from a predator-free site learned more slowly than fish from a predatorabundant site the avoidance of patches where simulated attacks of a model avianpredator were performed, despite the fact that those patches were previously favouredfor feeding.
7.2.2 Interactions at the group level
Shoaling is a fundamental behavioural pattern for many pelagic fishes (Chapter 4),but there is little direct evidence for the involvementoflearning in shoaling. RecentlyGallego et al. (1995) tried to assess whether the presence of schooling conspecificsencourages the premature development of schooling in herring (Clupea harengusilarvae. Laboratory-reared larvae (length 29-31 mm) were exposed to wild-caughtschooling juveniles (length 55mm) and their behaviour was compared to non-exposedlarvae, before and after feeding them. Larvae seemed to opt for the increasing protection of the school of juveniles even when competition for food was disadvantageous for them. Experiments on predator inspection visits in Europeanminnows tPhoxinus phoxinus) strongly suggest that the active.or passive transfer ofinformation between the inspecting fish and the rest of the school is favou~ed by socialfacilitation (Pitcher et al., 1986b; Magurran & Highman, 1988). .
Intraspecific and interspecific experiments on fathead minnows (Pimephales pre-

164 Chapter 7
melas) and brook sticklebacks (Culaea inconstans) demonstrated that individuals thatlive in groups may have the opportunity to learn to recognise unfamiliar predators byobserving the fright response of experienced individuals in the group (Mathias et al.,1996). In this experiment the predator stimulus used for conditioning the prey wasonly pike (Esox lucius) odour. Naive prey gave fright responses to this chemical stimulus when paired with pike-experienced prey of conspecifics or heterospecifics butnot when paired with pike-naive prey.
An interesting example of interaction at the group level is given by the frightreaction to an alarm substance released by injured fish belonging to the Ostariophysiand discovered first by von Frisch (1941) in the zebra danio iBrachydanlo rerio). Thisalarm substance acts to initiate learning of a eo-occurring novel and behaviourallyneutral chemosensory stimulus. The new learned chemosensory stimulus can be abase of a cultural tradition (Suboski & Templeton, 1989). It is noteworthy that thefright reaction differs considerably from species to species of the same group.Moreover, it is generally accepted to be mediated by olfaction, but involvement oftaste or vision is not entirely ruled out. For instance, when two aquaria with a groupof'fish in each are placed close together, a fright reaction induced by an alarm substance in one tank would trigger a fright reaction in the other aquarium without watercommunication. The number of ostariophysans but also non-ostariophysans reported to possess alarm pheromone systems continues to expand and includes somemarine species, but at present none of the main peiagic species (reviews: Smith, 1992;Hara, 1993).
7.2.3 Interactions among the prey
Social facilitation is well documented in fish (see section 7.3), but few experimentsgive evidence of stable conditioning. Patten (1977) observed that naive fry of cohosalmon (Oncorhynchus kisutchi fell prey at a significantly higher rate than did naivefry exposed to the same predators but in the company of conspecific survivors ofearlier exposure to predators. Soria et al. (1993) found that conditioned tropicalsardines (Opisthonema oglinum) were able to initiate a global response of a school to aneutral stimulus (series of three sound pulses), even when this school contained 50%of naive fishes. In this experiment the punishment was the hoisting of a horizontalrigid net from the bottom to the surface of the tank (Fig. 7.4).
7.2.4 Key stimuli in learning
To investigate whether there were key stimuli connected to predators; Csanyi (1986)repeated the shuttle aquarium conditioning mentioned in section 7.2.1 in a differentway. The predator was a live goldfish and there were also dummy predators whichlooked more and more like a fish (Fig. 7.5), associated or not with mild electric shocks(punishment). Neither the dummies, the presence of a live goldfish nor the electricshock alone caused significant changes in latency. Nor did latency increase inresponse to a combination of punishment and a: dummy head with a 'single eye' orwithout eyes. However, the latency significantly increased if punishment was

Learning 165
27
HABITUATION PHASE
12 StR108642o .JU.IIAL ............ _
1 11 11 I"
12LFR10864~ .I--'IUIL- _
12~Di108642o .I__L- _
1
CONDITIONING PHASE TRANSMISSION PHASE
o 91 138 353 395
I( Sound emission
- Conditioned fish
!1 Hoisting the net
..c:> Noive fish
, Video camera
Fig. 7.4 Three phases of the experirrienttupper) and results (lower) on thread herring (Opisthonemaoglinum) expressed as frequency histograms of reactions to the conditioned stimuli in the tank with a net(black bars) and in the other tank (white bars). StR = startle response; IM = imperfect mill; FR = flightreaction; DI = dislocation. Set refers to sets of three sound pulses. (Redrawn after Soria et al., 1993.)

166 Chapter 7
Dummy: D D. A 8 C 0
0 .c 0 s:.!!! Ul...
~...
1 1 ~&:;:- i& -c C "0
0 0 00 0 01
+50mA
900
c-,o~ 500
+J
o
t-----i Duncanranges
2 3 5 4- 6 7 8 9 10 groups
Fig. 7.5 Increase in latency in groups of paradise fish (Macropodus opercularisi treated by variousdummie~. Bars represent means + SE: Duncan ranges are also shown. (Redrawn after Csanyi, 1986.)
combined with more realistic dummies. The largest increases were obtained with thelive goldfish, and secondarily with a dummy having two lateral eye-like spotsarranged horizontally (vertically arranged spots were not so efficient). Other similarexperiments with a live pike or catfish and dummies confirm that eyes or lateral eyelike spots on a body have key-stimulus character and are used in learning by theparadise fish (Altbacker & Csanyi, 1990). Nevertheless, Gerlai (1993) observed differences in reactions of paradise fish towards a sympatric predator (Channa micrope/tes) and an allopatric predator or harmless species and concluded that eyes alonemay not differentiate the harmful species from the innocuous. He suggested thatadditional visual stimuli and olfactory stimuli are also necessary. Altbacker andCsanyi (1990) indicated that motion is very likely to be an additional factor in the keystimulus, or maybe a key stimulus itself.
Part of the previous experimental findings are confirmed by Freon et a/.'s (1993a)observations during in situ experiments on a pelagic species. A realistic model predator (bonito, Auxis thazard) was towed by a dinghy and passed over the same schoolof Harengu/a c/upeoa. A real attack by predators (genus Euthynnus, species notidentified) was also observed on the same species. The school was observed simultaneously with a vertical sounder, an underwater video camera and aerial photography. One conclusion was that the intensity of the school reaction depends on theintensity,. number and duration of stimuli. This is a generalisation of the rule ofheterogeneous stimuli summation initially developed ona single individual byTinbergen (1950) and Lorentz (1974): the intensity of the response of an individual (in

Learning 167
our case a group of schooling individuals) fluctuates according to the intensity,number and duration of stimuli.
7.2.5 Hypothesis on interactive learning
On the basis of observations and experiments on the paradise fish, Csanyi (1987,1988, 1989)proposed his interactive learning hypothesis. He stated that the main partof the mechanism of predator avoidance is the organised system of the memory tracesin the animal brain acquired during daily experiences. This system is connected tocertain behaviour mechanisms which are mainly genetically determined. Exploratorybehaviour is activated by a new environment or stimulus and enables the animal togain experience and knowledge about new objects and to store them during thelearning process. As far as predators are concerned, eyes on a body, motion andpresumably smell are the key stimuli (see section 7.2.1) which promote recognition,recording and learning.. If the exploration is not associated with an unpleasantstimulus or pain, habituation occurs. Otherwise, avoidance reactions are activated(but see introduction of the book and sections 3.3, 3.4 and 7.2.1 for a less simplifiedresponse, when conflicting behaviours lead to a trade-off). In summary, memorytraces representing the predator form links with escape reactions, while thoserepresenting harmless fishes link to neutral behaviour units.
We find at least two references related to memory traces in the fish brain acquiredduring learning - one by Matzel et al. (1992), who studied biophysical andbehavioural correlates of memory. storage, degradation, and reactivation, andanother by McElliott et al. (1995) on the effect of temperature on the normal andadapted vestibulo-ocular reflex in the goldfish.
7.2.6 From natural predators to fishing gear
A large majority (if not all) of fish species seem able to learn, and from a comparative study of learning ability on 14 species, Coble et al. (1985) and later Zhujkovand Trunov (1994) indicated that this ability is not related to phylogenetic positionand could depend on. the level of motor activity of the species. We have seen thatfish are able to adapt their behaviour towards predators through learning. In thefirst analysis, there is no reason to consider that the learning mechanisms towardsactive fishing gear are different from those towards predators. Nevertheless, thefisherman is a recent predator in the history of the species and can be seen by thefish as a polymorphic predator because he is able to change or improve his fishingtactics by constant technological progress; Therefore the genetic basis of learningin the case of fishing gear, if any, will be difficult to demonstrate (Allendorf et al.,1986) and cannot be compared to the genetic basis of learning about predators. Toa certain extent the assumption of'optimality of behavioural ethology is violated,especially when the fishing gear is designed to make fish behave maladaptively, asunderlined by Ferno (1993). In front of a trawl wire, fish react maladaptively .andare herded into the path of the trawl (Wardle, 1986). Similarly, fish are stimulated

168 Chapter 7
to bait by the movements of neighbours hooked by a longline (Ferno et al., 1986;Lekkeborg et al., 1989).
An additional reason that makes it difficult to associate learning in fish predationto learning in fishing might be the likely importance of olfaction in predator identification. It is not obvious that fish are able to identify fishing gears by their odour.Although it seems possible for passive gears, especially nets or traps that can beimprinted with fish odour, it does not seem likely that fish have time to detect andreact to the odour of fast-moving gear or vessels. It is more likely that auditory stimuliassociated with fishing gear or fishing operations can be identified (sounds emitted bythe fishing vessel or by the fishing gear). We have seen in Chapter 5 that it is nowproved that fish are able to locate the direction of a sound emission, that they are ableto perform acoustic distance discrimination at short distance, that sudden changes inrevolution or pitch while circling a school might scare the fish and finally thatplayback of vessel noise results in fish avoidance reaction.
Despite these preliminary remarks, we have spotted in the literature some examplesoffish learning to avoid or escape an active fishing gear. Unfortunately most of themconcern demersal species. Nevertheless, Soria et al. (1993) were able to conditionthread herring (Opisthonema og/inum) by associating a series of sound pulses with astress related to a net. Individual reaction and school stability measurements indicated the efficiency of conditioning after 3 to 12 trials (Fig. 7.4). Similarly, Pyanovand Zhujkov (1993) demonstrated the facility of reflex conditioning in aquaria. Engaset al. (1991) found that cod captured and marked by an acoustic tag onboard a smalltrawler always avoided the same vessel during subsequent fishing trials in shallowwater the following days. From an angling experiment, Beukema (1970) indicatedthat carp (Cyprinus carpio) are able to substantially decrease their catchabilitythrough 'one-trial learning'. Zaferman and Serebrov (1989) reported a decrease inconsecutive bottom trawls on marine demersal species.
Pyanov (1993) made repeated sets of experimental trawling on bream (Abramisbrama) in a reservoir where commercial trawling had never been practised before. Hefound a significant difference in catch rate between the first and the second repeatedhauls in the same area, but no difference between subsequent ones (up to four).Moreover, he showed that the decrease in catchability was greater in old fish than inyoung ones (Fig. 7.6). The one-trial learning hypothesis was reinforced by the resultsof simultaneous tagging experiments with ultrasonic tags. All tagged fish displayedavoidance reactions during trawling at about 50 m from the vessel while other naivefish were caught. Pyanov (1993). also performed aquarium experiments on smallfreshwater species, which reinforced his hypothesis. Small dip nets were used toperform catch trials on groups of tetra (Hemigrammuscaudovittatus), and also rosybarb (Barb us conchonius). After one to three trials, the behaviour of the fish waschanged and they displayed school defensive behaviour when the operator and thegear appeared: escapement or increased avoidance distance according to the species.Finally, from commercial fishery data analysis, Le Gall (1975) reported that thecatchability of albacore (Thunnus alalunga) caught by trolling was significantly higheron the recruited age class (age 2) than in older fish, which can be related to learning.
In a series of passive avoidance conditionings performed on paradise fish, Csanyi

Learning 169
. .. .. .
1.0
0.5
C 0<,N
c:'-'"
01 -0.50
...J
-1.0
-1.50 10 20 30
• I •
40 50
Fish length (cm)
Fig.7.6 Change in the value of the ratio of the second catch to the first onein different size groups ofbream (Abramis brama). (Redrawn after Pyanov, 1993.)
and Altbacker (1990) found that the most easily learned tasks were the ones whichhad several different solutions, like avoiding by staying on the left side of the aquarium (Fig. 7.7, session B), which can be comparedto avoiding the vicinity of a passivegear. When the task was reversed, i.e. staying in the left side was punished by mildelectric shocks, fish reacted in the opposite way (Fig. 7.7, session C). Interestingly, thisreversibility was not so clear in conditioning to decrease the frequency of escapebehaviour; fish had more difficulty learning to decrease this frequency (Fig. 7.8,session B) than to increase it (Fig. 7.8, session C). This last result can be related to thefacility of fish to learn avoidance of active gears by active escape.
Soria et al. (1993) showed that under certain conditions, experienced thread herringcan transmit avoidance behaviour to a naive school. In the above-mentionedexperiment, when sound-conditioned fish were mixed. with naive fish, the mixedschool also displayed a conditioned reaction, This indicated that the learning capabilities of fish are effective and make them able to avoid fishing gear after havingescaped. Aversive learning experiments on several freshwater species indicate that fishcan retain their learned experience for months, especially striped bass (Morone saxatilis) and largemouth bass (Micropterus salmoides), although performance deteriorated with time (Coble et al., 1985).
Fish are also able to learn how to avoid or escape from passive gear. Ferno andHuse (1983) observed cod (Gadus morhua) learning from baited hooks. SimilarlyJohannessen 'et at. (1993) observed that during the period of an experiment on thebaiting behaviour of cod and haddock, the hooking frequency gradually changedthrough learning. Zhujkov and Pyanov (l993a,b) demonstrated that tetra (Hemigrammus caudovittatus) are able to learn how to escape an experimental trap net. Asin the case of the experiment on active nets previously mentioned (Soria et al., 1993),Zhujkov and Pyanov's (l993b) experimental results suggest social facilitation in thetetra school. They noted that the exploratory behaviour depends on the compositionof the school: 'In the case of great differences between the school members, the

170 Chapter 7
Session A Session B Session C
Staying at left
Groups: Rev. _ ExL
100
**
~ 50 +---'--,-----'----l
o...!----'------'------'------'--'---0-5 5-10 10-15 15-20 20-25 25-30 30-35 35-40 40-45 45-50
Intervals (min)
Fig.7.7 Time percentages spent at the left side of the experimental tank during the consecutive sessions ofavoidance conditioning. Group means ±. SE are shown. Asterisks indicate significant differences atp:< 0.05 level. Session A: control (before punishment). Session B: contingent punishment. Session C:reversal conditioning for group Rev (punishment abandoned for group Ext). (Redrawn after Csanyi &.Altbacker, 1990.)
Session A Session B Session C
100
~ 50
Escape
*
Groups: Rev. _ ExL
*
**
o...!----'------'------'------'--0-5 5-10 10-15 15:-20 20-25 25-30 30-35 35-40 40-45,
Intervals (min)
Fig.7,.8 Time percentages spent by paradise fish (Macropodus opercularis) in escape reaction (ESC) duringthe consecutive sessions of avoidance conditioning. See Fig. 7.7 for key. (Redrawn after Csanyi & AItbacker, 1990.)

Learning 171
behaviour of the school is dictated by the reactions of individuals rapidly perceivingnew information, rather than an arithmetic mean for the school'.
7.3 Other learning processes
We will see now a limited number of other learning processes that might influencespatial dynamics and stock assessment of pelagic fish. From a literature survey,Dodson (1988) suggested that learning is an important process in orientation andmigration of many vertebrates, including fish. He argued that experience and learningmay influence the direction of movement and how the goal can be recognised in thefollowing processes: imprinting, early experience and spatial learning, including socialtransmission of migratory routes and directions. Rettingen (1992)contended that thisapplied to herring (Clupea harengus) in the Norwegian Sea where new generationswere guided to feeding grounds by older experienced herring. A similar social facilitation was suggested by Corten (1993) for the choice of spawning grounds, but alsooverwintering grounds and feeding areas of the North Sea herring. Corten arguedthat young fish will-follow older ones which have already learned how to migrate toselected spawning grounds, and repeat this migration pattern during the followingyears. The author did not mention how these former preferential grounds wereinitially selected and how convergence of the population to a limited number of areasis possible. - -
It is difficult to test the previous hypotheses, but various in situ experiments orobservations support them. Observations on French grunts (Haemulonjlavo/ineatus)clearly indicate the existence of social transmission. This species is known for longterm fidelity to foraging areas (Helfmanet al., 1982) but individuals transplanted tonew 'schooling sites and allowed to follow residents at the new sites used the newmigration routes and returned to the new site (Helfman & Schultz, 1984). Similar insitu observations of searching strategy involving spatial memory and expectationhave been observed in zooplankton feeders by Noda et al. (1994).The authors noticedthat stout-body chromis (Chromis chrysurus) usually stayed for more than one hour ingiven areas, irrespective of the presence or absence of prey, and searched there with atortuous pattern with reduced speed. In contrast, movements between regions tendedto be rapid with almost no feeding. Moreover, laboratory experiments on goldfish(Carassiusauratus) indicate that fish can learn how to use local landmarks forchoosing favourable foraging areas (Warburton, 1990).
In the case of spawning grounds, Corten's hypothesis could appear in competitionwith the natal homing hypothesis for pelagic fish mentioned in section 3.3.1. If newborn pelagic fish are imprinted by temporally and spatially variable water-masscharacteristics, as suggested by Cury(l994), it is unlikely that they will be able tospawn in their native area when adults. Following Cury'shypothesis of the generaladaptive value of obstinate reproductive strategy, we do believe that homing is moregeneralised than expected in pelagic fish. But, as earlier suggested by Mathisen (1989)for the Peruvian anchoveta, we think that permanent chemi~al stimulipresent in thespawning grounds provide imprinting cues for many pelagic species, as in the well

172 Chapter 7
known cases of salmonids or eels. These stimuli could be related to the local marineecosystem and/or to continental inputs (rivers, estuaries, lagoons). Nevertheless, it isnow accepted that natal imprinting is not the only way salmon recal1 the river they leftas juveniles. Coho salmon, Oncorhynchus kisutch, released from two hatcheries andtransported around much of their migratory route, returned primarily to their releasesite. This suggests that they needed to learn sequences of odours during their seawardmigration in order to home in a complex river system (Quinn et al., 1989). Such asequence of odours is less likely to occur in the sea due to the three dimensionaldispersion, except in coastal areas. In their review of learning in fish behaviour,Kieffer and Colgan (1992) suggested that homing behaviour of fish may be partly theresult of the development of specific parts of the brain and partly of'changes inbehaviour with experience, which in a sense conciliates the imprinting and the socialfacilitation approaches.
Whatever is the dominant ethological process explaining fidelity to spawninggrounds, this fidelity is likely to generate intraspecific diversity by favouring theemergence ofsympatric subpopulations and therefore substocks. Even when differentsub-populations spawn at the same time on the same spawning ground, there is notnecessarily crossed fertilisation between them probably due to smal1 spatial andtemporal scale differences in their distribution. On the basis of microsatel1ite DNA,Ruzzanteet al. (1996a) demonstrated that within a 20km diameter sampled duringthree weeks, the aggregation of larval cod was formed by more than one genetical1ydistinct larval group and it was even possible to identify a cohort of larvae resultingfrom a single spawning event. Genetic heterogeneity in a pelagic population wasmentioned early on by Hedgcock et al. (1989). Cury and Anneville (1997) reviewedmany examples of pelagic stocks of the same species having distinct spawninggrounds due to social facilitation or natal homing, but that are found mixed duringsome period of their life: North Sea herring, Northwest Atlantic herring, northern codand north Atlantic bluefin tuna, among others. The observations are based either onfishing data or on genetic studies. We wil1 see in Chapter 8 how overfishing maydecrease intraspecific diversity and lead toa long-term decline in productivity of anassemblage of stocks .
.Interaction at the group level, mentioned in section 7.2.2, is not limited to predation, and many works suggest the importance of interactive learning in the foragingprocess (see the review of Kieffer andColgan, 1992). For instance, Ryer and Ol1a(1992) and Baird et al. (1991b) noted that juvenile walleye pol1ock (Theragra chalcogramma) are more successful at exploiting spatial1y variable ephemeral food patches when foraging in groups than alone. They attribute this result to localenhancement (information from conspecifics) and to social facilitation of feedingmotivation (fish initiated feeding sooner when grouped than when alone). Socialfacilitation might be seen as an evolutionary behaviour which favours rapid patchexploitation. Some foraging models incorporating learning (among other processes)have been proposed (e.g. Clark & Mangel, 1986; Hart, 1986).
Finally, in some species recognition of individuals has been demonstrated. Itapplies either to the ability of parents to learn to recognise their fry (Noakes &Barlow, 1973;Hay, 1978) or to the ability of any fish to recognise a particular con-

Learning 173
specific (review in Kieffer & Colgan, 1992). Such examples are limited and neverapply to pelagic fish. Nevertheless, the intriguing examples of school fidelity mentioned (Chapter 3) in the case of tunas regularly associated with FADs raise thequestion of possible individual recognition in pelagic fish.
7.4 Conclusion
We have seen in this chapter that different forms of learning play an important role inthe behaviour of fish. We have focused our attention on learning about predators,which is an associative form of learning favoured by inherited predisposition. Themain key stimuli in learning are visual stimuli, but they seem often associated witholfactory stimuli. There is growing evidence that fish are able to learn about fishing,either from repeated associative learning or by one-trial learning in situations ofextreme stress. Despite the fact that the genetic basis of learning in the case of fishinggear is uncertain due to the short history of human exploitation (but see section 4.11),we hypothesise that inherited predispositions for learning about predators can favourlearning about active fishing gears. As far as passive gears are concerned,especiallytraps and hooked lines, avoidance learning seems to play a major role. In active gears,sound seems to be an additional key stimulus. In both types of gear, social facilitationseems important either to decrease the gear efficiency or, less frequently, to favour thecatch process (biting on hooks for instance).
Social facilitation seems also to play an active role in fish migration, habitatselection and foraging. The role of imprinting in natal homing behaviour is welldocumented for some long-range migratory species, but its possible application topelagic fish is an interesting hypothesis. It is difficult to separate the effects of learningfrom indirect sampling bias or error effects when analysing commercial fishing data,especially because fishermen are also learning about fish behaviour. Nevertheless,both migration route learning and natal homing might change our view of the stockidentity in the near future if more evidence is obtained.
In Chapter 8 we will show how the five major traits of pelagic fish distribution andbehaviour (habitat selection, schooling, avoidance, attraction or association andlearning) might affect fisheries and stock assessment by current population dynamicsmodels. We will look more closely at the basic assumptions and necessary input datafor these models, and the effects of behaviour on catchability.

Chapter 8Effects of Behaviour on Fisheries and StockAssessment using Population DynamicModels
8.1 Introduction
In this chapter we first present briefly the main stock assessment models, their inputdata and basic equations. Models are subdivided into surplus-production models,age-structured models (and the related yield per recruit model) andstock-recruitmentrelationships (readers familiar with these concepts are recommended to skip section.8.2). For easy comprehension, the structure of the rest of this large chapter reflects thefive previous chapters: we will review successively the influence of habitat selection,social behaviour (aggregation), avoidance, attraction, associative behaviour in relation to floating object~and learning on fisheries and stock assessment by populationdynamic models.
8.2 Stock assessment by population dynamic models
8.2.1 , Stock assessment by surplus-production models'
Surplus-production models are also commonly called production models or catcheffort models. Theoretically, the surplus production represents the amount of catchthat can be taken while maintaining the biomass at constant size in an equilibriumsituation. Nevertheless, this situation of equilibrium is practically never reachedowing to the rapid variation of fishing effort. Such fluctuations usually result from a'natural' high growth rate of fishing effort owing to overcapitalisation (Sharp, 1978a;Hilborn & Waiters, 1992; Mackinson et al., 1997) or conversely from managementactions that freeze the fishing effort or stop it abruptly by a fishing ban. Surplusproduction models have been adapted to this non-equilibrium or transition situation;Hilborn and Waiters (1992) proposed 'to rename them 'biomass dynamic models',which also has the advantage of distinguishing them more clearly from the agestructured models. The inputs of these models are limited to time series of catches andfishing effort. One of the most used (and criticised) outputs is the maximum surplus ormaximum sustainable yield (MSY), followed by the corresponding 'maximum effort'also improperly termed 'optimum effort' (EMSY) '

Effects of Behaviour on Fisheries and Stock Assessment 175
Surplus-production models were the major assessment tool for many pelagicfisheries from the 1950s to the 1970s, despite the early development of the agestructured models. Nevertheless, structured models. were then preferred - at leastwhen the required data were available - because they use a more detailed demographic approach and were therefore believed to be more reliable (but we shall seethat fishery management based only on these models does not guarantee stock viability). However, surplus-production models benefited from a second youth aftersome improvements in their formulation (Fletcher, 1978; Rivard & Bledsoe, 1978;Roff & Fairbairn, 1980; Uhler, 1980; Waiter, 1986)leading to a rehabilitation of theirperformance in terms of parameter estimates (Schnute, 1977, 1989; Hilborn, 1979;Uhler, 1980; Butterworth & Andrew, 1984; Lleonart et al., 1985; Ludwig & Waiters,1985, 1989; Babayan & Kizner, 1988) and to the incorporation of additional variables, as detailed in this chapter.
One reason for the success ofsurplus-production models is the limited input datathey require, but this is also their weakness (Butterworth, 1980; Laloe, 1995).The userjust needs a time series of total catches C, and fishing effort E, over a time period i,i = 1-+ n. Usually the period ~sed in fisheries is one year (which does not necessarilystart on I January), in order to limit the seasonal effects. Nonetheless, it is possible touse a shorter period on deseasonalised data sets, or to incorporate the seasonal effectin the model (e.g. Laloe & Samba, 1991). The data series must be as long as possible,especially if many year classes are exploited, and the range of variation of the fishingeffort must be wide enough to observe a large range of stock abundance (paradoxically, the ideal situation is to cover a period encompassing both under:'exploitation and overexploitation). The fishing effort input is assumed. to bestandardised from nominal fishing such that qEt = Ft> where F, is the instantaneouscoefficient of fishing mortality and q is the catchability coefficient, including availability to the fishery and vulnerability to the fishing gear. The q coefficient is definedas the fraction of the stock caught, on average, by a unit ofeffort. Conventional unitsof fishing effort for most pelagic fisheries (purse seiners, midwater trawlers or poleand line boats) are based on the total time at sea, the time spent on the fishing groundsor, better still, the searching time (i.e. the time on the fishing grounds minus the time.devoted to the operations of capture themselves). If q is constant, the fishing effortwill be proportional to the fishing mortality, and then the annual catch per unit ofeffort (CPUEt = Ct/Et for year t) is an appropriate abundance index (B,= CPUEtlq,where Bis the biomass).
Five main basic assumptions are required to use the production models under non....equilibrium conditions (which is the usual situation):
(I) The model must be applied to a closed, single-unit stock(2) The age groups being fished have remained, and will continue to remain; the
same(3) Time lags in processes associated with population change have negligible effects
on the production rate(4) Deviations from the stable age structure at any population level have negligible
effects on the production rate

176 Chapter 8
(5) The catchability remains constant over the studied period and therefore thecatch per unit of effort is proportional to the abundance.
Additional discussion of these assumptions can be found in Schaefer and Beverton(1963), Pella and Tomlinson (1969) and Fox (1974). We will see in further detail how,owing to fish behaviour, assumptions (I), (2) and (5) may fail and therefore introducebias in the abundance estimates.
Failures of the last assumption might also result from other factors (not directlyrelated to fish behaviour) such as change in the fishing power, which have long beenrecognised (Gulland, 1955, 1964; Robson, 1966; Rothschild, 1978). Nowadays, acommon technique to limit these biases it the estimation of an annual abundanceapplying a general linear model (gLM), an old method (Draper & Smith, 1966)whichis now usable on large data sets thanks to modern computing facilities (e.g. SASInstitute, 1989). Because this procedure is also useful for limiting biases caused by fishbehaviour, let us now see its principle. The idea is to express the CPUEt,i of any vesselcategory i during any year t, as a function ofa given fishing unit and year, for instanceCPUE1,l (i.e. CPUE of the first fishing unit during the first year) arbitrarily chosen asthe reference or standard unit. If a multiplicative model is retained:
(8.la)
where at is a factor relating the mean CPUE in year t relative to year I, b, the efficiencyof fishing unit i relative to the standard category, and Ct,i the residuals. If the computational resources allow the whole original data set to be processed, it is recommended to work on individual observation - instead of means as in equation (8.la) having the subscript j and to fit the model:
(8.1b)
A reasonable estimation of annual CPUE series can be obtained from these models often termed 'least square mean' - and the corresponding standardised effort issimply obtained by dividing the total catch by this CPUE. A logarithmic transformation allows a linearisation of the model:
10g(CUEt,D = log(CPUE1,D + logta.) + 10g(bD + C't,i (8,2)
The consequences of this logarithmic transformation, which limits the influence of thehighest values, are discussed in Robson (1966), Laurec and Le Gall (1975) and Laurecand Fonteneau (1978) who preferred it to an additive model without transformation.They also discuss the importance of the basic assumptions underlying this model(independence, normal distribution of the residuals) and the different fittingprocedures (least square, maximum likelihood, stochastic model). The generalised linearmodels (GLM) allow the treatment of a loss of normal error distributions (McCullagh & Nelder, 1989). They are now commonly available owing to recent computerfacilities and they will certainly be more and more often used in fishery work (e.g,Gaertner et al., 1966). In certain cases, GLM have been shown to avoid bias in theestimation assuming normal or lognormal distribution (Gauthiez, 1997). In this book

(8.3)
Effects of Behaviour on Fisheries and Stock Assessment 177
we will limit our presentation to general linear models (gLM) - which are particularcases of GLM - to ease the presentation.
We do not develop here the derivations from the basic model (8.2), but we will seein the following sections how other attributes concerning fish behaviour can beincorporated in the linear model.
The different surplus-production models are all derived from the equation forlogistic population growth:
an,(it = k Bt(l - (Br/Boo))'
After subtracting the catches (q Et Bt) this becomes:
as,(it = k Bt (I - (Bt/Boo)) - q Et B, (8.4)
(8.5)
where B, is the biomass at time t, Boo the environmentally limited maximum biomassor carrying capacity and k the intrinsic growth rate of the population (these last twoparameters are denoted K and r by terrestrial ecologists). Another expression ofequation (8.4) is obtained when h is defined as the slope of the relative rate of stockincrease (h = k/Boo):
dBt<.it = h B, (Boo - Bt) - q Et B1
~~
production catch
In the Schaefer model (Graham, 1935; Schaefer, 1954), the equilibrium yield CPUEe
derived from (8.5) under equilibrium conditions (dBt/dt = 0) is a linear function ofeffort:
(8.6)
and the equilibrium yield is strictly a parabola (Fig. 8.1, curve m = 2, where m is anadditional parameter incorporated in the generalised model of Pella and Tomlinson,1969):
(8.7)
while in other related models (Table 8.1; Fig. 8.1, where m < 2) the decline of yield inthe right part of the graph is more flexible (generalised model, Pella & Tomlinson,1969; exponential model, Garrod, 1969; Fox, 1970). Fitting these models can beperformed either by integration of the differential equation 8.5 or by fitting equations8.6 or 8.7 assuming equilibrium conditions (which is usually unacceptable) or usingthe past-averaging approach (Gulland, 1969; Fox, 1970). For the purposes of thisbook it is enough to remember that these models all use, directly or indirectly, theCPUE as an index of abundance (except if F is estimated directly by other methodsand replaces E in the equation, but then a proper estimation of q is required toreconnect the model to the fishing effort).

Table 8.1 Main surplus production models.-.l00
Author Model' Fitted equation MSY EM SY
Graham (1935) LinearSchaefer (1954)
Garrod (1969) ExponentialFox (1970)
Pella & Tomlinson (1969) Generalised
Fox (1974) Density-dependentq = exB~
CPUE~ = kq/h - q 2E/h
or: = CPUEoo - b E
CPUEe
= q e-{k/h - qE/h)
or: = CPUEoo e-bE
Ye = qE«k/h) - qE/h)j<I/(m - I»
CPUEe
= (_ c'd'/a'b,)(I/(b' - d'))
where: a' = h/( ex)«p + 2)/<P + I»
b' = (m - I - ~)/(~ + I)c' = - k/(ex)«~ + 2)/(~ + I))
d' = - P/(~ + I)
k2/4hor: a2/4b
(h/e) elk/h)
or: CPUEoo/be
k«1 - m)/m)(k/mhj<I/(m - I))
c'(1 - m)(c' /(a'm))(l/(m-I))
m
k/2qor: a/2b
h/qor: CPUEoo/e
(k/q)/«I - m)/m)
c'(1 - m) (~)(~/(I-m»m a'm
9{;~.,00
Fox (1974)
Clark & Mangel (1979)
Freon (1988)
Laloe (1988)
Die et al. (1990)
Two mixed and exploitedsub-stocks
Association andaggregation
CLIMPROD·
Inaccessible biomassv"
.Variable area
Equation (8.24) in the text
Model A: (bXex'BK/W) EModel B: (bxQ·K') E
CPUEe = q(V) Boo(V)-q(V)2 E/h
dB, 'dt = h(ex) B, (Boo - B,) - q
E(B, - exBoo).h(ex) = h(1 - ex) or h(ex) = h···Equations (8.25) and (8.26) in thetext
Depends on the mixing rate andthe effort ratio between the twosub-stocks
Not given by the authors, butfinite value
[Boo(v)f h/4
ex < 0.5: - heal a;,/4ex = 0.5 and E --+ 00: - h(ex) a;,/4ex> 0.5 and E --+ 00: - h(ex) Boo'(ex(ex - I))
Depends on the mixing rate TNo mixing: kexBoo/4··High mixing (T = K): kBoo/4
Depends on the mixing rate andthe effort ratio between the twosub-stocks
Not given by the authors, butfinite value
Boo(V) h/2q(V).
-r- h Boo/(2q(l - 2ex))
, Depends on the mixing rate TNo mixing: k/2 'High mixing (T = k): k/2ex
• See Table 8.4 for additional models•• ex is the fraction of inaccessible biomass related to Boo••• according to the model retained (see text).

Effects ofBehaviour on Fisheries and Stock Assessment 179
co
:;;U::l
"Uo.....a.
m=O
--T----__.....:c· m = l
m=O.5
Effort
Fig. 8.1 Equilibrium catch-effort curves from the generalised model according to the value of the parameter m (adapted from Pella & Tomlinson, 1969).
To overcome the limitations of theconventional production models, the auxiliaryinformation is nowadays commonly used. It can be either internal information on theexploited stock or external variables of the environment. Examples of internalinformation are direct estimates of the biomass, catchability estimates or mortalityestimates (e.g. Csirke & Caddy, 1983; Caddy & Defeo, 1996). In the delay-differencemodels (Deriso, 1980; Schnute, 1985, 1987; Fournier & Doonan, 1987), considered asa bridge between the surplus-production models and the age-structured models; theinternal information consists of individual growth parameters, natural survival rateand annual recruitment. External variables, often related to fish behaviour, have beenincluded in global production models to take into account the influence of theenvironment in different ways: on the catchability or the abundance (Freon, 1986,1988, 1991), on the accessibility of the biomass (Laloe, 1989), on the rate of exchangebetween sub-stocks (Fox, 1974) oron the changes in the areacovered by the fishingfleet (Die et al., 1990). Among the numerous developments from the original surplusproduction model, we will present in subsequent sections only those that can berelated to fish behaviour, and particularly those related. to change in catchability(failure of assumption 5).
The reader must have in mind that all these models oversimplify reality and that,despite any improvements to them, they cannot pretend to offer by themselves anaccurate diagnostic on the fishery. Instead of debating which is the correct approach,our feeling is that fishery biologists and managers must use as many of the availableassessment tools as possible and compare the different 'benchmarks' provided bythese tools. This comparison, and the analysis of the reasons for observed differences,can be fruitful in the search for the best management advice (see Caddy & Mahon,1995, for discussion).
8.2.2 Stock assessment by age-structured models and yield per recruit
The historical period of stock assessment by structured models is briefly presented inChapter l. Megrey (1989) presents a detailed review and comparison of availablemodels (see also Laurec, 1993; Gascuel, 1994). No substantial development has takenplace since then, except the improvement of the separability approach, and we presenthere only the general principles governing age structured models. In this section we

180 Chapter 8
will use Megrey's naming conventions, which regroup under the generic name of agestructured stock assessment (ASA) all the methods used to estimate fishing mortalityrates and absolute population abundance, given catch-at-age data and possibly somedata independent of the commercial fishery. It includes, among others, the wellknown VPA (virtual population analysis) and cohort analysis. The term 'cohort'designates all the fish in the population that share the same birth year (or season whenthere are several reproductive seasons within a year).
ASA methods estimate the number of fish alive in each cohort for each past period- usually a year - simply by assuming that from one period to the next the decrease inabundance results from catches and natural mortality:
(8.8a)
where NI and NI + I are the number of fish alive at the beginning of two consecutiveperiods, Cl is the catch during the period and D, is the number dying from naturalmortality. Negative exponential functions are used to compute mortality according toelapsed time intervals:
NI = N, e -(M + F)(l-l;) (8.8b)
where M and F are respectively the natural mortality and the fishing mortality. Themain equations of AS A models must be solved interactively or by approximations.Therefore most ASA models implicitly make the assumption that fishing mortality isconstant throughout the year (or at least at the middle of the year in the case of pulsefisheries). Nevertheless, Tomlinson (1970) incorporated the effect of seasonal catchesto circumvent the standard assumption that fishing mortality is constant throughoutthe year (see also Mertz & Myers, 1996).
The method requires annual data of catches by age, an estimate of the naturalmortality, and a starting point of abundance of the cohort for a given year forinitiating the iterative process ofestimation. The former methods used the recruitment in the fishery as a starting point (forward methods), but the backward solution. .proposed by Gulland (1965) is more common owing to its feature of convergingduring the iterative process. It requires a starting guess of the fishing mortality rate forthe oldest age of the cohort ('terminal F').
A major inconvenience of ASA models is that final parameter estimates dependcritically on the choice of terminal F in the backward approach and several solutionscan provide equally good fits (Pope, 1977; Shepherd & Nicholson, 1986). Formermethods were analysing one cohort at a time (or artificially combined cohorts) andestimates of different cohorts cohabiting in the population were not related to eachother. The introduction of the separability assumption during the 1970s, in which thefishing mortality is represented as the product of an age-specific and a year-specificcoefficient, improved the quality of the estimates substantially (despite the risk ofover-parameterisation). It allowed for taking into account variation in availability,vulnerability, exploitation pattern, or selectivity, but did not overcome the problem ofestimating F in the most recent years - that is, the most important ones for management implementation - with acceptable precision (Doubleday, 1976; Pope, 1977;Pope & Shepherd, 1982). Usually the terminal F of partially exploited cohorts are

Effects of Behaviour on Fisheries and Stock Assessment 181
assumed equal to the F value obtained from fully exploited cohorts, but this methoddoes not reflect rapid changes in the exploitation level (e.g. Brethes, 1998). Morerecently, 'calibrated' or 'tuned' models have been proposed to use fishery-independent data to solve this problem. First, fishing effort (or CPUE) was used in differentmethods reviewed and compared by Pope and Shepherd (1985). Some of thesemethods assume a constant catchability (Saville, Hoydal-Jones, modified gamma,partial exploited biomass, Laurec-Shepherd and Armstrong-Cook, but only for thelast three years of exploitation), others a monotonic variation with time (linearvariation in rho method, exponential variation in log-rho and hybrid methods) orrelate it to the population by a power function (gamma method). We will see in thischapter that these assumptions are often violated.
Since the 1980s, other methods of tuning virtual population analysis (VPA) havemade use of biomass estimation by different kinds of survey (acoustic surveys onrecruits or adults, aerial surveys, egg surveys or experimental surveys by fishing with agear) or sometimes by recreational fisheries. Acoustic surveys are also influenced byfish behaviour as described in Chapter 9, as are other surveys (Gunderson, 1993;Chapter 10).To estimate the most recent years is therefore still problematic as shownin a review of the different tuning methods used in herring stock assessments presented by Stephenson (1991). Some generalised models incorporate into the separability assumption the possibility of integrating fishing effort and fishery-independentdata such as fecundity by age, ageing error or catch estimate error (Fournier &Archibald, 1982; Deriso et al., 1985). Quinn et al. (1990) reviewed techniques forestimating the abundance of migratory populations and proposed a new agestructured model using migration rate among regions.
Another major difficulty when using ASA models is to estimate properly thenatural mortality. The effect of natural mortality is the same as the effect of fishingmortality and the two factors cannot be distinguished because they appear at the samelevel in the sets of equations (e.g. equation 8.8). As a consequence, an overestimationof natural mortality will lead to an underestimation of fishing mortality and viceversa.
Another approach derived from the ASA is the length-based VPA first proposed byJones (1974, 1981). It makes use of the growth equation to follow the cohorts directly
. from the length distribution. Pauly et al. (1984) and Fournier et al. (1990) developedrespectively the ELEFAN and MULTIFAN software for estimating both the growthequation and the mortality vector from the length data. Despite some weaknessunderlined by Hilborn and Waiters (1992), these methods are useful for tropical areaswhere age composition is often not available. The new FiSAT software (Gayanilo etal., 1996) integrates the different routines using length- or age-structured data.
The yield per recruit models allow investigation of the consequences of change insize of first capture according to the natural and fishing mortalities (Thomson & Bell,1934) and are commonly presented as a complement to ASA models. In pelagicspecies, it is now recognised that growth overfishing is seldom the key problem,mainly because these species usually have fast growth and a high natural mortality.Therefore the critical size is usually smaller than the minimum size of interest tofishermen for commercial or technical reasons, such as minimum size required for

182 Chapter 8
canned species, entanglement of small fish in the purse seine, or unavailability ofyoungest stages because of their different habitat selection. Nevertheless, exceptionsmight exist, as for instance the large beach seines used in Ghana which for some yearsoverwhelmingly ea ught fish smaller than 12cm (Anon. 1976). Growth overfishing canalso occur in pelagic species having a medium life span and/or a medium growth rate(e.g. menhaden, horse mackerel, tuna and other scombroids). Note also that inoverexploited resources, the mean age of individuals tends to decrease owing to thedynamics of the population, but owing also to changes in the fishing strategy so as tomaximise profit (Pauly, 1995). Therefore a survey of the changes in the size of firstcapture and the influence of these changes on the yield per recruit model is recommended.
Considering that natural mortality is usually roughly estimated, differenthypotheses must be tested (e.g. Le Guen, 1971; Freon, 1994a; Caddy & Mahon, 1995,among others). The results are usually very sensitive to these hypotheses on naturalmortality (M) and therefore the knowledge of this parameter is still a bottleneck instock assessment. Moreover, because ofour ignorance of the variability of the naturalmortality, Mis considered constant in all the exploited year-classes, which is certainlynot true.
8.2.3 Stock-recruitment relationship
Although studying the stock-recruitment relationship is not an assessment method,this relationship is now recognised as one of the central problems in the populationdynamics of most exploited species and can be related to fish behaviour in manyinstances (see next sections). This density-dependent relationship is implicitly included in the 'black box' of the surplus-production models, while age-structured modelsignore it because they take into account only the post-recruitment dynamics. Someauto-regenerative models integrate the whole life cycle by combining the stockrecruitment relationship and the yield per recruit (e.g. Laurec, 1977; Laurec et al.,1980).
The first formulation of the stock-recruitment relationship was given by Ricker(1954), who proposed a flexible function:
R = as e-bS. (8.9)
where R is the recruitment in numbers, S the spawning stock expressed as biornass,and a and b are coefficients. The different curves resulting from the values of a and bare dome shaped. There is an increasing recruitment according to S at low levels of thestock and then, after a maximum, a declining recruitment at higher stock sizes.Among the most common biological processes behind thismodel are cannibalism ofthe first stages by adults and density-dependent predation, both related to fishbehaviour.
In contrast, Beverton and Holt (1957) proposed an alternative function where therecruitment increases toward an asymptote as the spawning stock increases:
R=S/(aS + b) (8.10)

Effects of Behaviour on Fisheries and Stock Assessment 183
where a and b are coefficients. In this model it is assumed that the density-dependentmortality is limited to a critical period in the early life history, mainly owing tocompetition for food. Deriso (1980) generalised this function by adding a thirdparameter which gives more flexibility:
R = as(1 - bcS)I/c (8.11 )
A detailed discussion on these functions can be found in Cushing (1988) and Hilbornand Walters (1992).
8.3 Habitat selection and its influence on catchability and populationparameters
Because population dynamics models generally use large databases regrouping oncommercial fisheries over long time intervals (from months to years), they are notusually biased by very short-term (less than a couple ofhours) variability in habitatselection. Usually, a high number of observations reduce the variance of the estimates. In sections 8.3.2 to 8.3.4 we will deal with the influence of changes in habitatselection on catchability at different time scales (year, season, and day; moon cycleeffect is considered only in other sections despite its possible effect on vertical habitatselection). We shall see that this scale classification is somewhat artificial because thedifferent time scales present some interactions. Then we will focus on the spatialvariability of the catchability and lastly present two sections more related to ASAmodels: the influence of habitat selection on growth parameter estimates and onmortality estimates. But before moving to these topics, let us develop one of the keyquestions in pelagicfisheries which is related not only to fish behaviour: the biornassdependence of local density and catchability in relation to exploitation and environmental changes. Because this point is related both to habitat selection and to socialbehaviour, it will be a link between the following sections.
8.3.1 Yearly changes in abundance, density, habitat and catchability in relation toexploitation and the environment
The main debate at the end of the nineteenth century was to decide whether fishingactivity did or did not have a major influence on fish abundance (Chapter 1). Acentury later, after much investigation aimed at demonstrating the importance of theeffects of fisheries, and after the development of sophisticated direct or indirectmethods for measuring their impact and managing the fisheries accordingly, thedebate has resumed for both pelagic (e.g. Beverton, 1990) and demersal species (e.g.Hutchings, 1996). This kind of happening is not so scarce in the history of science. Ofcourse the question is now addressed in a different way. There is no longer any doubtthat fishing activities influence stock abundance, but the huge variations in stockabundance, from outburst of several hundred thousand tonnes to collapse, are moreand more related to other factors that probably interact with the fishery. Among
.them, changes in environmental conditions and the modification of stock distribution

184 Chapter 8
are likely to play a major role. From 1983, at least six international symposia havebeen devoted to this topic (Csirke & Sharp, 1984;Wyatt & Larrai'ieta, 1988;Kawasakiet al., 1990; Payne et al., 1992;Pillar et al., 1997; Durand et al., 1998)and from the endof the 1980sthe annual ICES meeting has had special sessions related to this problem.It is not the purpose of this book to review in detail the literature on this subject, butwe will have a 'behaviouristic look' at it, because a large part of the discussion isrelated to fish behaviour in terms of habitat selection and social behaviour.
One of the key questions concerning stock assessment of highly variable resourcesis how the large variations in abundance are expressed in terms of density, or conversely whether the area of distribution is related to abundance. Swain and Sinc1air(1994) found that the area containing 90% of the cod from the southern stock of theGulf of St Lawrence was density dependent, in contrast to the core area (50% of thestock). They modelled fish distribution and proposed a figure showing two extremecases of variation in fish spatial spread according to the biomass (constant density ordensity proportional to biomass) and a threshold of density used to define theexploited stock area (A). Gauthiez (1997), using a similar model, proposed a figurewhere in addition an intermediate case is simulated (Fig. 8.2). In Fig. 8.2a, when thebiomass increases the density increases non-uniformly in a manner consistent withdensity-dependent habitat selection (but the maximum density in the core remainsconstant)and the stock area increases substantially. In contrast, in Fig. 8.2c, the stockdensity increases uniformly over all areas when the biomass increases (as in the IFDmodel) and there is no change in the total area occupied by the stock. Nevertheless theexploited stock area A increased slightly. In Fig. 8.2b, the increase in biomass isassociated with an increase both in stock area and in mean density .
. Petitgas (1994) had already proposed hand drawing of density-dependence rathersimilar to Fig. 8.2, with in addition a particular case of very high density located in asmall core area. He also proposed the use of a conventional geostatistical 'selectivity
Constant density Intermediate case Density proportionalto Biomass
c
-4;Z 0:;1:4:::E-Al~:::
i:~A2~:i
:~A:l----;):
Distance to coreand stock area (A)
2.
3.0 ,.----.,.------,
o.
b
-4: : -~ 0 : 4i : '<:-Al~' : :!:~~:[
:(,---A:l~:
Distance to coreand stock area (A)
2.0
1.0
0.5
1.5
-4 : -2: 0 ::z : 4:<:-A,~: ::~~:
( A:l,--~
Distance to coreand stock area (A)
1.0
0.8>.
""lI) 0.6c:G>"C.J::.. 0.4lI)
u::0.2
0.0
Fig.8;2 Model of spatial variation in fish density according to the stock biomass (core is the centre of thedistribution area) (adapted from Swain & Sinclair, 1994, and Gauthiez, 1997). (....) Biomass high; (-)biomass medium; (- - -) biomass low.

Effects of Behaviour on Fisheries and Stock Assessment 185
curve' Q(T), better named 'aggregation curve'. in Petitgas (1997), to identify thespatial behaviour of the stock. Letus see the simplest case of a regular sampling gridwhere z(x) denotes the fish density at point x, T(z) the area where the random functionZ takes values greater than z and Q(z) the fish quantity that is standing on the surfaceT(z). The graph Q(T) gives the cumulative integrated fish quantity Q(z) as a functionof the occupied area T(z) for densities greater than z:
(8.12)
Zl < Zz < ... < Zn
Because Q(z) varies between zero and m (the mean of Z), to compare the differentQ(z) corresponding to different levels of abundance, Petitgas (1994, 1997) proposedto use relative values P(z) defined as the ratio Q(z)jm. This type of graph is symmetrical to the graphs showing the contribution to the mean of the class values ofdensity proposed by Freon et al. (I 993c). It is also related to the Lorenz curves whichrelate a percentage of biomass to the corresponding occupied area (e.g. Myers &Cadigan, 1995).
Most indirect methods of stock assessment are based on density estimation becausethey use the CPUE as an index of abundance (e.g. surplus-production models) or as atuning variable for ASA models. From a theoretical point of view, we can distinguishat least three main mechanisms of change in abundance in pelagic fish which willmatch better with one or the other of the extreme cases of change in density proposedby Swain and Sinclair.
In the first case (Fig. 8.3a), changes in biomass are mainly due to variations in thefishing mortality F, which can be related either to modifications in the nominal fishingeffort E (scenario a.), or to changes in the catchability coefficient q in relation tochanges in the environmental conditions (scenario az) without major change in thecarrying capacity. But this contrast between a variation in F due to the modification ofE or q is an oversimplification ofa complex reality because in the first scenario we have:
(8.13a)
where ;t and ..... represent increasing and decreasing values respectively, but thevariability of q is also likely to occur because the decline of the biomass B, mightincrease the catchability (MacCall, 1976, UlItang, 1976, 1980; Csirke, 1988).This willcreate a loop in the process, sometimes responsible for the stock collapse:
E;t _ F;t - B,..... _ q;t
i+-+-+-+-+-l(8.13b)
The social behaviour of fish is thought to be responsible for this increase in catchability because the population maintains a constant density, even when depleted, andtherefore the stock area shrinks. This kind of shrinkage in area is also called 'rangecollapse' (section 3.4.1).
Bycontrast, in the second scenario (az) the increase in catchability can be attributedto different mechanisms related to environmental modifications (V), such as changes

186 Chapter 8
in accessibility (e.g. modification of the vertical distribution owing to changes of thethennocline depth) or in vulnerability (e.g. modification of the avoidance reactionrelated to changes in turbidity):
V'" -+ q'" -+ F'" -+ Bt .... (or reversal changes) (8.14a)
(8.14b)
where V'" means an increase in favourable environmental conditions. In this scenario,there is less reason to suspect an acceleration in the process leading to an increase in Fthan in the previous scenario, or to suspect a shrinkage in the stock area, even thoughit can occur in the case of prolongation of unfavourable climatic conditions. But anincrease of the nominal fishing effort E due to higher catch rates can also create a loopin the process:
V'" -+ s> -+ F'" -+ B,.... -+ q." (or reversal changes)
! -+ E'" -+ i +- +- +- +- !It is not easy to relate practicalexamples to these different cases, but we think that thecollapse of the northern sardine stock of the eastern Pacific, the North Sea and northeast Atlantic herring stocks, and the northern cod off Newfoundland and Labrador,correspond mainly to scenario al. The Peruvian anchoveta stock could correspondmainly to scenario az. Let us now recall briefly the history of these stocks.
Northern sardine (Sardinops sagax caerulea) collapsed in 1961 and 1962, mainlydue to overfishing of this naturally unstable population (review in Troadec et al.,1980). Similarly, the North Sea and north-east Atlantic herring stocks sufferedoverexploitation and collapsed in 1970 because management actions came too lateand were not sufficiently restrictive (review in Saville and Bailey, 1980; Burd, 1985;Jakobsson, 1985).
(a.)
Medium orhigh biomass
Boo=cte; A=cte
Low biomass
•FT or qT =>FT
F,).
FT
Collapsel
•FT or qT => FT•t --
Fig. 8.3 Illustrations of changes in density, biomass and area according to fishing and environmentalparameters (rectangles delimit the normal habitat).

Effects of Behaviour on Fisheries and Stock Assessment 187
(b.)
Medium biomass
-F=cte or F.L
Ft
Collapse!
•
High biomass
Boo~; A=cte; reversibility
Boo~; A=cte; no reversibility
Ft e;:J
Collapse!
Fig. 8.3 Contd.
(c)
Medium or lowabundance
- •
High or very highabundance

188 Chapter 8
The analysis of catch per tow of northern cod (Gadus morhua) off eastern Canadawhich collapsed in the early 1990s - indicates that, as expected, the proportion of lowdensity tows « I00 kg/tow) increased while the proportion of high-density towsdeclined during surveys performed between 1981 and 1992. But surprisingly, theproportion of high-density tows (> 500 kg/tow) remained constant in a small, constant number ofdense aggregations (Hutchings, 1996). From trawl surveys, Atkinsonet al. (1997) provided two figures showing the range collapse of this stock: there is ashrinkage of the area where 90% of the stock is located, which also appears in contourellipses (Warren et al., 1992) of density (Fig. 8.4a and b). Despite a strict managementby quota, mainly based on ASA models and secondarily on trawl surveys (Baird et al.,1991a; Lear & Parsons, 1993), it is now accepted by many authors that this shrinkagein area arises mainly from overfishing (Myers & Cadigan, 1995; Myers et al.', 1996;Atkinson et al., 1997). Nevertheless, the role of environmental factors on a possiblechange in habitat selection on this assemblage of substocks is still open to debate (e.g.DeYoung & Rose, 1993; Hutchings & Myers, 1994; Kulka et al., 1995).
The Peruvian anchoveta stock collapse in 1972 appears to have resulted both froma low recruitment in 1971 (partly due to overfishing) and from changes in availabilityowing to the strong El Nifio event of 1972. Nevertheless, a noticeable effect of El Nifioon recruitment was observed for some years (Pauly & Tsukayama, 1987; Pauly et al.,1989).
The second case (Fig. 8.3b) corresponds to a variation of the biornass first initiatedby environmental changes which modify its carrying capacity:
v.... -> Boo.... -> Bt .... (or reversal changes) (8.15)
(8.16)
In general, this is associated with corresponding changes both in the area (A) of thehabitat and in the density, especially in upwelling areas (scenario b.) which can extendaccording to the strength of the wind stress. Nevertheless, the possibility of a changeonly in density could he contemplated, with reversibility (scenario b2) or not (scenariob3) . Usually the history preceding the collapse of such stocks - especially scenario b, starts with a period of increase in biomass owing to favourable environmental conditions, which usually allows large benefits and consequently investment in new boatsand therefore a subsequent increase in the fishing mortality (Fig. 8.5, adapted fromCsirke & Sharp, 1984). Then, when the environment becomes unfavourable, the areaof the habitat shrinks (as in a basin model, section 3.4.1). As a result, the local densityincreases suddenly, which in turn causes an increase of catchability. Therefore thefishing mortality is high and the stock collapses:
v"" -> Boo"" -> Bt "" -> E"""""" -> F"""""" -> B,.... +- V....i +- q"" +- !
In scenarios b, and b3, fish behaviour depends indirectly on the environment, unlikescenario b2 which is not so much dependent on fish behaviour and so is beyond thescope of· this book. There are some situations where environmental conditionsinfluence directly both the carrying capacity and the catchability, this is a mixture ofcases a and b.
The difficulty of investigating such situations comes from' the interacting

Effects of Behaviour on Fisheries and Stock Assessment 189
55.5 (a)
1987
53.6 19881989
----Z 1990'--" 51.7 1991
<I.>\J 1992::J.....
49.8 1993.....a-l
47.9
46485052545646.0 4----,----r------,r----,-------,----,
58
Longitude (W)
2.0
199119891987
Year
1985
o... "0
.•..... '-.../'0
1983
'0
1.8 ~
1.6 2I<'
1.4 C1l
g1.2 s1.0 ~
0.8 ro0
06 s. 30.4 DJ
IJI0.2 0.2 IJI
0.0 +-----,------.----,---r----,-------''4' 0.01981 1993
1.4 (b)
1.2
1.0 ----)t---
0.8
a<I.>I-
a<I.>
~ 0.6aQjCl::: 0.4
Fig; 8.4 Bivariate ellipses determined from the distribution of cod during the annual autumn surveys ofdivisions 2J3KJL during 1987-1993: (a) location of the ellipse; (b) relative area of distribution as determined by the ellipses compared to area with 90% of trawlable biomass and trawlable biomass from autumnsurveys (redrawn from Atkinson et al., 1997). For part (b): 11 = area with 90% ofbiomass; x = ellipse area;o = RV biomass estimate.
influence on the stock of both fishing effort and environment. Some scientistsargue that the fishery plays a minor role compared with the environment (Cushing,1982, 1995; Lluch-Belda et al., 1989, 1992; Kawasaki, 1992) because the mainstocks of sardine and anchovy showed similar worldwide fluctuations attributed toglobal climatic changes. Moreover, records of past history of some stocks fromanaerobic sediments indicate a large variation of biomass without exploitation(Soutar & Isaacs, 1974; Shackleton, 1987, among others), despite some criticismsaddressed to this method (Shackleton, 1988). Others claim that fishing mortality

190 Chapter 8
REDEVELOP-MENT GROWTH PHASEPHASE
FULLY EXPLOITED PHASEOVER
EXPLOITATIONPHASE
COLLAPSEPHASE
RECOVERYPHASE
.-'
' ... ...... ...... ...... ......
Time -+
- - - Abundance- ,- Fishing effort-- Total catch
Fig.8.5 Generalised history of a developed fishery that tends to fluctuate due to environmental conditi~ns(redrawn from Csirke & Sharp (eds), 1984),
dramatically increases the probability of collapse when combined with unfavourable environmental factors (Freon, 1988; Beverton, 1990; Hutchings & Myers,1994; Pauly, 1995). Our purpose is not to enter into this debate, but to stress howin such a situation, habitat selection and social behaviour may interfere with theabundance estimations.
A typical example of change in biomass and area (scenario b.) owing to environmental conditions is the sardine stock of the southern Canary current. Sardinapilchardus is usually considered as temperate and was found in abundance north ofthe 26th parallel along the Moroccan coast. From 1966 to 1977 this limit shiftedprogressively to the south, reaching the south of Mauritania (17°N) in 1977. Anindustrial fishery started to develop on new fishing grounds, providing annual catchesabove 500000t (Boely & Freon, 1979; Domanevski & Barkova, 1979). Few fish werefound far in the south in the Bay of Dakar, Senegal (Freon & Stequert, 1982; Freon,1986).Then the stock abundance and extension decreased during the 1980s.But at thebeginning of the 1990s,the stock displayed a second outburst and spreading, and oncemore catches were reported in the Senegalese fishery (Binet et al., 1997; Demarcq,1997). This extension of the area of distribution was attributed to an increase in thewind intensity, providing an intensification of the upwelling and a linkage betweenMauritania and Senegal by a tongue of cold water which provided a continuum ofhabitat between the two countries and the southern transport of the sardine larvae. Inaddition, the upwelling intensification increased the phytoplankton production whichin turn favoured the sardine stock.
The pelagic populations off Senegal are dominated by Sardinella aurita and S.maderensis and seem representative of scenario b2. From the results of routine

Effects of Behaviour on Fisheries and Stock Assessment 191
acoustic surveys performed on the southern coast of Senegal (Levenez et al., 1985),Petitgas (1994) showed that the distribution of the fish was not density dependentwhen the local abundance varied from high to medium (a single value of very lowabundance provided a different result, but as it is not reflected in the coastal fishery itremains questionable).
The third case (Fig. 8.3c) is an extension of habitat selection when a species starts tocolonise new biotopes verticalIy and/or horizontally, resulting in an outburst ofbiomass. Two examples can illustrate this situation: the trigger fish in West Africa andthe Japanese sardine.
The demersal trigger fish (Batistes carolinensisi was until 1971 considered rarealong the West African coast. Then this species started to colonise the pelagic ecosystem during the two first years of its life and was easily detected during acousticsurveys, while larger individuals colonised the demersal ecosystem and were abundantin experimental and commercial trawl catches (Caveriviere, 1982). This increase intotal abundance expanded along the coast from the core area of Ghana-Cote d'Ivoiremainly to the north (Table 8.2). The higher density was found in Guinea around 1975and the species invaded Cap-Vert (Senegal) in 1978. During the 1979 summer, incidental catches were reported as far as the south of Mauritania. In 8 years the triggerfish biomass increased from a few thousand to 700000 t. According to Caveriviere etal. (1980, 1981), this species largely dominated the catches during three bottom trawlsurveys performed in January from 1978 to 1980 in Cote d'Ivoire: 85% to 97% of thecatches in the 21-60 m depth ground were trigger fish. The average experimental yieldobtained during the 1978 survey performed with a medium bottom trawl (opening15 x 3 m) was 364 kg ha-Ion the sandy-muddy grounds, and reached 1350 kg ha- 1 insome substrata. The abundance of the species then decreased progressively and it is nolonger a dominant species in the ecosystems.
Table 8.2 Estimated biomass of trigger fish (Batistes carolinensisi from acoustic surveys performed. alongthe west African coast at the end of the 1980s (adapted from Caveriviere et al., 1980).
Country Year of Fish biomass (t) Trigger fish Estimated surface ofinvasion end of the 1980s biomass the continental shelf
(t) (n.mi/)
Senegal and Gambia 1979 1200000 80000 35000Guinea Bissau 1977 150000 30000 52500Guinea . }
1975 850000 45000039500
Sierra Leone 26900Liberia 17400Cote d'Ivoire 1974 71000 20000 11600Ghana 1972 310000 50000 21700Togo 1972 • 1700Burkina Faso .' 2600Nigeria (West of Dod river) 1976 75000 10000 37000Total observed 2656000 640000 245900Total extrapolated 2900000 700000
• No acoustic survey.

192 Chapter 8
The spawning grounds of the Japanese sardine (Sardinops melanostictus) werelocated on the continental shelf of the Pacific coast of Japan at the end of the 1970sand expanded progressively into the oceanic water around the Kuroshio currentduring a period of population increase in the first half of the 1980s (Figs 8.6 and 8.7;Watanabe et al., 1996).
In these examples, the increase in density remained long after the extension of thedistribution and therefore they cannot be modelled by MacCall's basin approach(section 3.4.1). The reasons for these sudden changes in abundance, density andbehaviour remain speculative, because in most cases no environmental modificationwas observed, or this modification was hardly related to the species' biology (e.g. theinfluence of salinity on trigger fish abundance). Nevertheless, in the reported examples, knowledge of the environmental changes was generally limited to a few parameters (mainly temperature and salinity) and the biology of the species was not
100.,....0s:
.~~ 50'0
E ~ E0 .:L
~.9 0.I:v Ul
o 0c '- .,o :J .... 50Ul~
0s:
QV Ul.!::
.I:..... E 100.:L
150 ii i i i , , I ,197B BO B2 B4 B6 BB 90 92
Year
Fig.8.6 Mean distance (± SD) of the spawning ground centre from the Kuroshio current axis in the mainspawning month from 1978 to 1992 (redrawn after Watanabe et al., 1996).
o~o c~6«0,
0>cC~oa.en
300
200
100
,82 8'4 i 86
Year
i
BB,
90i
92
Fig. 8.7 Changes in area of annualspawning grounds of sardine along theKuroshio current from 1978 to 1992(redrawn after Watanabe et al., 1996).

Effects of Behaviour on Fisheries and Stock Assessment 193
completely investigated. Therefore it is still possible to relate this third case to thesecond one.
8.3.2 Some attempts at modelling the yearly variability ofcatchability in relationto habitat selection
Correction ofabundance indices
In the case of unusual extension of habitat, the first step is to compute relevant indicesof abundance before modelling (except when the model does not intend to describethe stock abundance but only the CPUE as in the next section). If the changes in stockabundance occur without a trend in the spatial change in the stock distribution('proportional density', Fig. 8.2c), the mean CPUE will be proportional to abundance, provided that the fishing pattern remains the same and that no other biasesexist (but note the effect of a density threshold of the fishery in this figure). In contrast, in the case of change in stock distribution ('constant density' or intermediatecase, Fig. 8.2a and b), even if the fishery area follows the extension and retraction ofthe fluctuating stock, the mean CPUE will not give a reliable index of abundance. Inthe case of strict constant density and no density threshold, the mean CPUE isexpected to be constant. Under these conditions of density dependence, the stockcollapse can occur without warning given by the CPUE analysis. But in practice thefishing effort is usually not randomly distributed and the CPUE results from thecombination of the stock distribution and the fishing strategy. This is illustrated bysimulations performed by Gauthiez (1997) who used the two extreme cases of densitydistribution of Fig. 8.2 ('proportional density' and 'constant density') and fourmodels of fishing effort distribution:
(I) Model A: uniform distribution of effort over a threshold of density of the stockdistribution
(2) Model B: distribution of effort proportional to abundance(3) Model C: uniform distribution of effort over a constant surface area located
around the core of the stock (= core area)(4) Model D: uniform distribution outside the core area.
As expected, when fish density is proportional to abundance, the relationship betweenthe mean CPUE and abundance is linear, or displays a small departure from linearity(Fig. 8.8a). This departure from linearity is observed only for the model A of uniformeffort distribution, which is not a common situation (usually fishermen are able toallocate most of their effort to the more productive areas). In contrast, the relationship between CPUE and abundance is never linear when the fish density model isconstant, owing to a decrease in the catchability (models, A, Band C; Fig. 8.8b). Theonly relatively favourable case is model D, which is an unusual situation simulatingan unavailable area of high density (for technical reasons or owing to implementationof a refuge or sanctuary).

\0.j::>.
3.0i8~ 0003J~
(a)/
(J;::,..
rOj 6 .g
W w 0.002 ~ . ~...=> 00n, 4 0"
. . . o~ 1.0 / />. " 0.001
2
-i-+-i-+y.+y.+y. .....17 I I J I I I I I I I I I ~ J
0.0 i ---",- -- o~""'-i-+-i-+ 0.0I I I I I I i I I i
-4 ':"2 0 2 4 2 4 6 8 10 2 4 6 8 10
1.0~ ~'. 1.0i ..~ (b)
0.8, \ 0.8 0012
1\o Mod. A
I \ o Mod. B~
I \6 Mod. CI \'iij 0.6 I \ w 0.6
7 7- Mod. 0c: I \ 0.008<Il I \ =>U I \ n, 0"s: 0.4 I \ () 0.4Ul I \i.I: I \ 0.004
0.2 I \ 0.2I \
L
0.0-1 -----' ----- O.O-l~ 0.0-,------ I I I I I I I I I
-4 -2 0 2 4 0.5 1.0 1.5 2.0 2.5 3.0 0.5 1.0 1.5 2.0 2.5 3.0
Distancefrom core Abundance Abundance
Fig.8.8 From left to right: fish density distribution according to the distance from the core area of the stock, CPUE versus abundance; and catchability (q)versus abundance according to different models of fishing effort distribution (A,B,C and D): (a) fish density proportional to abundance; (b) constant density(redrawn from Gauthiez, 1997).

Effects of Behaviour on Fisheries and Stock Assessment 195
Instead of using the mean CPUE as an index of abundance, it is recommended tocollect geo-referenced data and to compute a weighted average CPUE· where theweighting factor is the stratum Ai,t of each fishing sector i during time t:
CPUEt = ~ (~CPUEi,t)I
(8.17)
The difficulty is then to get enough observations in the different strata. This is partlyobtained by enlarging the size of the strata, but there then arises the problem of intrastratum variability of the catchability, especial1y for highly aggregated pelagic species(see section 8.4.1). But the main problem is how to deal with the lack of data in stratawhere no fishing operations are performed. To obtain a consistenttimeseries of theabundance index when the density is not proportional to abundance, it is necessary torevisit historical data and to make some assumption on the fishing zone not visitedduring low biomass periods. Assuming that the abundance index was equal to zero inthese fishing zones is usual1y not realistic because fishermen allocate their effort to afishing zone only when the guess of yield is above an empirical threshold. Otherinformation apart from commercial data is usual1y necessary to make properassumptions (e.g. acoustic surveys, trawl surveys).
Modification of surplus production models
To take into account the influence of environmental factors on stock production,Freon (1986, 1988) proposed a modification of the conventional surplus-productionmodels. An additional environmental variable (V) has been inserted into the conventional models so as to overcome the failure to meet assumption (5) (section 8.2.1)regarding the constant catchability, or to take account of the changes in the carryingcapacity on the biomass. Three kinds ofmodels have been developed according to themechanism of environmental influence (Table 8.3):
(I) Influence only on the stock abundance(2) Influence only on catchability coefficient(3) Influence on both abundance and catchability.
Influence on stock abundance will not be detailed in this book, insofar as fishbehaviour is not directly affected by the variability of the carrying capacity of theenvironment. In the case of an increase of the carrying capacity owing toa change inhabitat selection, it could be tempting to use this kind of model. Nevertheless, wethink that it is not relevant because such changes occur suddenly, probably whensome environmental factor exceeds a threshold, but probably without immediatereversibility when the environmental conditions return to their usual values. We willdevelop the case of environmental influence on catchability in section 8.4.1 dealingwith the role of aggregation. But let us now see the interesting case of influence onboth abundance and catchability, which can be related to an increase of the biornassassociated with an increase in catchability and vice versa. .
Let Boo(V) be the function representing the fluctuations of Boo owing to environ-

196 Chapter 8
Table 8.3 Surplus production models available in the CLIMPROD software classified according to theenvironment (V) and fishing effort (E) effect. CPUE is the catch per unit of effort, q the catchabilitycoefficient, Boo the carrying capacity, a, b,c and d are parameters. (Adapted from Freon et al., 1991)
Type of model Equation Function FunctionCPUE = f(E) CPUE = f(V)
CPUE = f(E) CPUE = a + bE linearCPUE = a exp(bE) exponentialCPUE = (a + bEP/c - I) generalised
CPUE = f(V) CPUE = a + bV linearCPUE = a Vb exponentialCPUE = a + bye exponentialCPUE = aV + bV2 quadratic
CPUE = f(E, V); q = f(V) CPUE = aV + bE linear linearCPUE = a + bV + cE linear linearCPUE = aVb + cE linear exponentialCPUE = aV + bV2 + cE linear quadraticCPUE = (a + bY) exp(cE) exponential linearCPUE = aVexp(bE) exponential linearCPUE =a exp(bE) + cV + d exponential - linearCPUE = aVb exp(cE) exponential exponentialCPUE = aVb exp(cVd E)* exponential exponentialCPUE -= aV + bV2 exp(cE) exponential quadraticCPUE = «aVb) + CE)(I/(d - I» generalised exponential _CPUE = «a + bv2i d - I) + CE)(I/(d - I» generalised quadratic
CPUE = f(E, V); Boo = f(V) CPUE = aV + bV2 E linear linearCPUE = a + bV - (c + dV)2 E linear linear-CPUE = aVb + CV(2b) E linear expontialCPUE = aV exp(bVE) exponential linearCPUE = (a + bY) exp(- c(a + bV)E) exponential linearCPUE = aVb exp(cEVb) exponential exponentialCPUE = aV(b - cV) - dV2 (b:- cV2)E linear quadraticCPUE = aV(1 + bY) exp(cV(I + bV)E) exponential quadratic
CPUE = f(E, V); Boo = f(V) CPUE = aV(b + c) + dV(2b)E linear exponentialand q = f(V) exponential
CPUE = aV(1 + b)+ cyl2 + b)+ DV(2b)E linear quadraticexponential
_CPUE = aVb exp(cVdE)** exponential exponential
CPUE = (aV(I+b) + cV(2+b»exp(dVbE) exponential quadraticexponential
*without constraint** with sign constraint on band d
mental- factors, and q(V) the function representing theequations (8.6) and (8.7) become respectively (Fig. '8.9):
CPUEe = q(V) Boo(V) - q(V)2 E/h
Ye = q(V) Boo(V) E:..- q(V)2 E2/h
Therefore MSY and EMSY values will be functions of V:
fluctuations of q; then
(8.18)
- (8.19)

Effects of Behaviour on Fisheries and Stock Assessment 197
1400
1200
1000 ,,
E ,c: 8000
ts:;,"0 6000L-
a..
400
200
500 1000 1500 2000 2500 3000 3500 4000 4500 5000
Effort(E)
Fig.8.9 Equilibrium catch-effort curve from a surplus production model incorporating an environmentalvariable (sea surface temperature) which influence both the production and the catchability (CLIMPRODsoftware, Freon et al. (1991); Freon & Yafiez (1995)).l1li = Production (Y); (_. -) fitted function for V rnin =16.5; (-) fitted function for Vrniddle = 17.6; (- - -) fitted function for V rnax i = 18.8.
MSY = [Boo(V)fhj4
EM SY = Boo(V) hj2q(V)
(8.20)
(8.21)
Note that in such models, the CPUE does not pretend to represent an index ofabundance because it is accepted that q is not constant (nevertheless the fishing effortmust be standardised in order to take into account the variation of q owing to nonenvironmental factors, such as technological changes).
Another possibility in order to take into account the effect of V could be toincorporate it as an effect in the gLM aimed at obtaining an unbiased estimate ofCPUE and effort and then to fit a conventional surplus-production model. The firstincorivenience of such an approach is a confusion between the effect of V on catchability and on abundance (MSY will no longer depend on V). Second, it is better toestimate E and V effects in a single fit than in a two-step approach. Third, thestandardised effort taking into account V would then be difficult to use for management implementation because it would no longer be translatable into a nominaleffort: We then prefer to use equations derived from (8.18) to (8.21) which are anattempt to model the biological process.
The functions q(V) and Boo(V) are usually not precisely known and have to bechosen according to the data. Moreover, this choice must be combined with thechoice of the conventional production model: linear (as above), exponential orgeneralised. Table 8.3 presents the set of equations according to these different cases.

198 Chapter 8
The expert-system CLIMPROD (Freon et al., 1991, 1993d) helps users to select themodel corresponding to their case according to different ecological criteria and notonly to the best fit (see Saila, 1996, for comments on this approach) and uses the pastaveraging approach to deal with non-equilibrium situations (for both E and V).
In some instances, a substantial part of the biomass lives in a habitat inaccessible tothe fishery (deep grounds, remote areas or zones subject to strong currents, shallowwater, etc.) but the proportion of the biomass unavailable to fishermen may varyfrom year to year, depending on environmental changes which can affect the habitatselection. Laloe (1988) proposed two global production models taking account of this'inaccessible quantity of biomass'. He applied them to the stock of Sardinella aurita ofthe Cote d'Ivoire and Ghana, mainly exploited by short-range artisanal fisheries. Inthese fisheries, the distance of the stock from the coast depends on the extension of theriver plumes in the area, and therefore the accessibility of the stock is supposed todepend on the river flows (Binet, 1982). The apparent collapse of the stock in 1973was followed by a fast recovery in 1976 with three year classes immediately available,and therefore the time series of CPUE are difficult to interpret as an accurateabundance index. Even though Laloe (1988) had to define arbitrary thresholds of theenvironmental variable to get a good fit, his approach is conceptually interesting andthe derived equation can be applied when the inaccessible quantity of biomassdepends on the surface of the exploited area (Laloe, 1989). The formulations of themodels are derived from equation (8.3). When only the second term of this equation ismodified it becomes:
(8.22)
(8.23)
where etBoo is the inaccessible quantity of biomass. When both the first and secondterms of equation (8.3) are modified, supposing that h is a function of et such ash(et) = h(1-et), it becomes:
dB tdt = h(1 - Cl) B, (Boo - Bt) - q E(B t - etBoo)
The first formulation provides constant MSY regardless of et(Fig. 8.10a), while in thesecond, MSY varies inversely to Cl (Fig. 8. lOb; Table 8.1). Laloe (1988) recognise thatit is not always easy to decide which of these two formulations is the more realistic.Note that if the inaccessible quantity of biomass is defined as a proportion of theactual biomass Bt, equation (8.22) becomes: dBt/dt = hBt(Boo-Bt)-qE(etBt).Therefore, if etis a function of V, the resulting models are similar to those presented insection 8.4.1 where q is a function of V. Another approach to the situation of aconfined fishery, proposed by Mullen (1994), is based on diffusive transport ratherthan on a fraction of inaccessible biomass.
The rather common situation of a heterogeneous spatial distribution at the scale ofthe stock results in different subunits which can be exploited by different fleets(Chapters 3 and 5). In this case, assumption (1) of the surplus-production models isnot met. Fox (1974) modified the exponential surplus-production model for the

Effects of Behaviour on Fisheries and Stock Assessment 199
(a)
co
:.:;.U
:J"0o'-o, (b)
cx=0.5
Effort
Fig. 8.10 Equilibrium catch-effort curves (arbitrary units) from surplus production models with inaccessible quantity of biomass according to the value of parameter 0:: (a) model corresponding to equation8.22; (b) model corresponding to equation 8.23 (redrawn from Laloe 1988).
special situation where there are two substocks having a certain rate of exchange anddifferent levels of exploitation. For substock I:
dBl
. . .
dt = (kl Bit + T2 B2t) [(Bloo - B,d/Blool
- T, Bit [(B200 - iht)/B2oo] .; Fit Bit (8.24)
where B, is the biomass at time, t, k the intrinsic rate of population increase, and T therates ofbiomass transfer between stocks I and 2 (F arid BCX) have their usual meaning).The equation for substock 2 is obtained by replacing subscript I by 2 and vice versa inthe previous equation (see Table 8.1 for other equations of this model).
Die et al. (1990) adapted this model to the situation where a change in the area ofcoverage of the fishing fleet results in a change in the fraction of the stock that isavailable (similar to Laloe (1989», but conversely a change in the stock area with nochange in the fishery can benefit from this adaptation. Die et al. (1990) proposed twodifferentinodels according to the rate of mixing between the exploited and non-

200 Chapter 8
exploited fractions of the stock (high-mixing and no-mixing models). Assuming inequation (8.24) that the rates of population growth are identical (k = kl = k2) andthat the biomass transfer takes place exclusively from the unexploited to the exploitedsegment (T1 =0, TZ =T), it becomes:
dB,dt = (k Bit + TBj,) [(CXt Boo - BIt)/cxt Boo] - Fit Bit (8.25)
and
dBzdt = k BZt [(I - CXt) Boo - Bzt]/[(I - cxt)BooJ
- T BZt [(CXt Boo - BIt)/ CXt Boo] (8.26)
where CX t denotes the fraction of the virgin stock biomass that is potentially affected byfishing at any given time. Die et al. (1990) applied these models to the eastern Pacificyellowfin tuna fishery, which has experienced large changes in area coverage over thepast two decades. From their results it seems that the no-mixing model is moreappropriate, but the high-mixing model could probably find application in otherpelagic species.
The use of ASA models does not necessarily solve the problem of the difficulty indetecting catchability trends as stressed by Stokes and Pope (1987), who studied theresults of a generalised linear model for the multiplicative, integrated analysis ofcatch-at-age and commercial effort data. They used a simulated data set comprisingthree fleets, five years and four ages with a known increasing trend in catchability.Only an increasing trend in catchability equal to or greater than 13% per year mightbe detectable given a typical level of noise in the data (20%). Their conclusion is thatthese trends must be estimated externally. Along the same lines, Daan (1991) presented a simulation model that allows an evaluation ofpossible bias in the results ofstandard virtual population analysis (VPA) in combination with separable VPA andtuning methods when applied to a heterogeneous unit stock. The results indicate that,if a unit stock defined for assessment purposes is composed in reality of two or moresubstocks that are exploited differentially, the estimated exploitation curve is domeshaped, even when the exploitation pattern imposed upon each substock is flat topped. This bias may cause significant underestimates of fishing effort owing to anassociated change in apparent catchability.
8.3.3 Seasonal variability ofcatchabi/ity in relation to habitat selection
Many fish species choose to forage in different areas according to the season, andreproduction often occurs away from foraging areas (Chapter 3). Therefore, if thefishery does not cover the whole area of the stock distribution, or if fishing effort isnot equally allocated to the different subareas, then a seasonal component will appearin the CPUE.
A typical example of the effect of migration along the coast is the Senegalesesardine fishery, where adults of Sardinella aurita and other species mentioned in Fig.8.11a are caught only during the cold season whey they migrate south to the nursery

Temperature5ardinella ourito >25 cmCoronx rhonchus5ardinella maderensisPomadasys jubeliniGhloroscombrus chrysurus
-- Temperature5ardinella ourito <25 cm
1 , ,- ,-.--, I i i • i I
D J F M A M J J A SO NMonth
g;~:::.to,
~
~l::l-e'S'l:::....s~;:,-<'l>....~.
l::l;:sl::l..Col)
~
'";>;-
~
~~
.DI-o
...........
e-oI......
.---...UlVUv0...Ul
£UoV
WI::::>0o...'+-UUl
='=C:J
Hotseason
, I I I I I • i i i i i
D J F M A M J J A SONMonth
(b)
16"
18"
20"
24"
26"
22"
30"
28"
VI-:J......ol-V0...
EvI-
.---...U'-'
.---...Ul
.~Uv0...Ul
e-oI.......DI-o
...........
£UoV
WI::::>0o...'+-UUl......
C:J
II
...................,
Hotseason
(a)30"
28"/ \
.---... 26" 't\U :' I '.
'-' ' 1: I
24" "v 1I- 1:J 'i I...... I· ,0 22"
~l-v
V0...
E 20"I,
V . iI- ".'/i.
18" Vi\'\ \~,
\ \,' .......
16"
Fig. 8.11 Seasonal variability of the catch per unit of effort (CPUE) and the sea surface temperature in the Senegalese purse seine fishery(redrawn from Freon et al., 1978).
IVo

202 Chapter 8
grounds of the 'Petite Cote'. In contrast, species of the Guinean ecosystem are caughtmainly during the warm season (Champagnat & Domain, 1979), while the young ofSardinella aurita display a different pattern owing to local recruitment and emigration(Fig. 8.11b). A similar example in a temperate area is provided by Raid (1994), whodescribed the seasonal variation of length distribution of herring caught in the Gulf ofFinland. A typical example of inshore-offshore migration is given by the seasonalchanges in availability of the jack mackerel (Trachurus symmetricus murphyi) for thecoastal fisheries of Chile. This species is caught by the coastal purse seiner fleetsmainly during the intense feeding season along the coast. Then it migrates from thecoastal water to oceanic waters for spawning and there it is available only to thetransoceanic trawler fleets (Serra, 1991).
Such situations raise the problem of a proper estimate of an annual index ofabundance. Even ifmean annual values of catch and effort are used in surplus models,the CPUE will give an unbiased indication of abundance variation under twoassumptions:
(I) The seasonal timing' of migration must remain exactly the same from year toyear (in particular, the time spent by the stock in the area accessible to the fleetmust remain constant)
(2) The seasonal pattern of exploitation must also remain constant, particularly theyearly proportion of fishing effort allocated each season to the different fishingsectors and to the different target species in multispecific fisheries.
Let us see first the case where assumption (I) is met but not assumption (2). Thisproblem of seasonal variation in exploitation pattern was addressed very early byGulland (1955), who recommended that an index of concentration of the fleet (inspace or time) be computed. If this index is too high, it is suitable to subdivide thefishing season so as to compute an average estimate of abundance;
Nowadays, an efficient and objective procedure to deal with these problems ofabundance estimation when the availability varies seasonally is to use 'deseasonalised'CPUE. Laurec and Le Gall (1975) applied different methods to the data series of theAtlantic Japanese tuna long-line fishery on albacore (Thunnus alalunga) in order toestimate the three main components of the abundance index: yearly trend, seasonalcomponent and impact of fishing effort. The multiplicative model was found to bemore realistic than the additive one, especially when the interannual variability ofCPUE is high, which results in an overestimation of the seasonal component. Theyalso compared two ways to model trends, continuous or stepwise, and found the latter'more appropriate because it provided annual indices of abundance directly. They alsofound that during the fitting procedure by least squares, the variance of the estimatorcould be reduced by weighting the squared residual according to the fishing effort.Nevertheless, Laurec and Fonteneau (1978) noted that this method could introduce abias when the fishing effort is not independent of CPUE, which is the usual case(increasing effort during 'good years'). Modern statistical software allows for suchchoice of weighting factor in the gLM models. The general equation of such amodelwith a season effect is:

Effects of Behaviour on Fisheries and Stock Assessment 203
10g(CPUEti)=log(CPUElll) + log/a.) +log(bi) + logfc.) + Ctij (8.27a)
where everything is as in equation (8.2), except that now the subscript j refers toseason. An example of application of such a model is given by Chang and Hsu (1994)or Mejuto (1994) on tuna fisheries.
But as noted by Zijlstra and Boerema (1964), when the fishing effort is applied onlyduring the core of the season, and when the duration of the fishing season variesaccording to the abundance, this solution leads to bias. If one uses only the data of theactual fishing season for computing the mean annual CPUE, it results in an overestimate of the lowest abundance levels. In contrast, if the average at the lower level ofabundance is computed over the same period as at the high level.assuming the densityin the periods of no fishing to have been zero, it results in an underestimation of theabundance during the year of lower level (Fig. 8.12). This density-dependent variationin timing of the fishing season is similar to the density-dependent variation in space ofthe stock area (Fig. 8.2). The application of the gLM procedure in this case willincompletely solve the problem, especially if there are too many missing values ofCPUE per stratum in the data set as a result of changes in the fishing pattern.
J F M A M J J A SON
Month
iD
(8.27b)
Fig. 8.12 Hypothetical graphs of catch per unit of effort (CPUE) at two levels of abundance. Full.linesindicate period of fishing, while in the period of no fishing activity the expected CPUE is indicated bybroken lines (redrawn from Zijlstra and Boerema, 1964). (-) Observed; (- - -) expected ..
Let us see now the case where the relative abundance from one season of the year toanother (e.g. summer and spring) will vary according to the year, in contradictionwith assumption (1). This is observed if the pattern of migration changes from year toyear, whichmeans that an interaction between the year effect and the season effectwill occur. This interaction can be assessed by the incorporation of the term log (dtj) inequation (8.27a):
10g(CPUEtij) = log(CPUE 1I 1) + logta.) + logrb.) + logtc.)+ log(dtj) + Ctij
If this interaction is significant, it will make impossible the evaluation of an unbiasedestimate of the annual CPUE by the model. Then an attempt to obtain an unbiasedindex can rely on the computation of the CPUE only during the core of the fishingseason, that is when CPUE is at a maximum. But once more we face the problem ofthe definition of the duration of the fishing season. A suitable solution would be to

204 Chapter 8
identify the key factor responsible for the habitat selection, or the cue for migration.Then the CPUE could be computed only during this period, assuming zero yield whenthe absence of fishing activity can be related to nothing other than the absence of fish.But our present knowledge of fish ecology seldom allows the use of such a method.Another attempt could be the use of an empirical threshold of CPUE to define thefishing season each year. Besides the difficulty of choosing an optimal threshold, thisapproach raises the problem of deciding whether the threshold must be fixed for allyears (then it must be low) or may vary from year to year so as to take account of theinterannual change in abundance (but then the final abundance estimate will besensitive to this choice). Moreover, when a high instability of the CPUE is observedwithin the fishing season, it must be decided whether a decrease of the CPUE beyondthe threshold corresponds to a decrease in abundance of the stock or to its unavailability. In the previous example from the Senegalese fishery, adult S. aurita migratesouthward during the beginning of the fishing season and northward at the end, andduring some years they are absent from the fishing area between these two periods.
An additional problem arises when fish of different length groups and age groupsarrive in the area at different times, as in the North Sea herring, gulf menhaden orJapanese sardine fisheries. Then if the increasing fishing pressure is reducing the olderpart of the stock, and so reducing the duration of the fishing season, the abundance ofthe oldest year classes will be gradually underestimated whereas the abundance of theyounger fish will tend to be overestimated. As a result the mortality rate will beoverestimated by the ASA models (Zijlstra & Boerema, 1964).
8.3.4 Circadian variation ofcatchabilityrelated to habitat selection
Circadian variability is not a problem for indirect methods if the fishing operationsare decided randomly by day or by night, or in a constant proportion from year toyear. But if an interannual change occurs in the fishing pattern, 'this might introduce aserious bias in abundance index estimates resulting from simple averaging of theCPUEs, as exemplified in the following sections.
Midwater trawl fisheries
Diel variability in trawl efficiency has been mostly studied in bottom trawl fisheries(Ward le, 1983; Engas et al., 1988; Glass & Wardle, 1989; Walsh, 1991). Nevertheless,circadian variability in mid water trawl catchability was noted many years ago in theNorth Sea herring fishery, and was related to the size of the fish and their maturationstage (Lucas, 1936; Richardson, 1960; Woodhead, 1964). The efficiency of midwatertrawls is not as sensitive to the vertical distribution of fish compared with that ofpurse seines, which are unable to catch fish below a critical depth related to the heightof the net. Nevertheless, the diel vertical migration of pelagic fish might affect theCPUE of midwater trawls when the range of vertical migration of the species is verylarge. This is the case for herring, which can descend below 300 m during the day eastofIceland and come closer to the surface during the night (Mohr, 1969; Misund et al.,1997). Nowadays the high technology of acoustic detection and trawl positioning

Effects of Behaviour on Fisheries and Stock Assessment 205
limits such differences in availability with depth, but circadian variations in catchability resulting mainly from habitat selection are likely.
Joseph and Somvanshi (1989) found that horse mackerel (Megalaspsis cordyla)caught by midwater trawl along the north-west coast of'.India displayed circadianvariations in catchability, associated with migration and shoaling habit. The horsemackerel (Trachurus symmetricus murphyi) is caught in the southern Pacific by thelarge-scale fishery of midwater trawlers operated until recently by the former USSRand now by some countries of eastern Europe in the south-east and south-westPacific. Ivanova and Khmel'-nitskaya (1991) analysed the catch statistics of midwatertrawls on the 1979-1989 data series. They reported large diel variation of school sizeand school depth according to the season. In summer the vertical range is 2.5 timeswider in the daytime than at night. In winter the fish remain in large schools at lowerdepths and diel migrations are less pronounced. The catchability varies between 0.27and 0.37 at night and between 0.11 and 0.26 during daytime. This is a typical situationwhere the circadian effect and its interaction with the seasonal effect must be takeninto account during the estimation ofabundance indices based on CPUE, especially ifsome interannual change in the day/night ratio of fishing effort occurs.
Purse seine fisheries
In the multispecific Senegalese purse seine fisheries, some species are caught only ormostly in daytime (Sardinella maderensis, Pomadasys jubelini, Chloroscombrus chrysurus), others mostly at night-time (Trachurus trachurus, T. trecae, Scomber japonicus). The case of the main species (Sardinella aurita) is more complex: the young fishare caught mainly during the daytime while the adult migratory fish ate caught mostlyat night (Fig. 8.13). As the allocation of the fishing effort between day and night maychange from year to year by a factor of three, the CPUE gives different abundanceindices according to the computation (Fig. 8.14).
Frequency in the catchesduring the day (%) .
o 20 40 60 80 100I I ! ! ,
Pomadasys spp.CbloroscombruscbrysurusS. aurita. (young)
S. moderensis
S. aurito (adult)
Caranx rhonchus
Trochurus spp.
Fig.8.13 Day-night ratio of the catches of the different pelagic species exploited by the Senegalese purseseine fishery expressed in percentage of catches during the day.

206 Chapter 8
4
878583817977
---':""'.---," ............'~ " ........,---~ ---~
'" ,---75
o
·1
3.-.....co<,.:::, 2w::Jo,U
Year
Fig. 8.14 Discrepancy between abundance indices of Caranx rhonchus in the Senegalese purse seinefishery. (-) CPUE during the night; (- - -) CPUE during the day.
The mean depth of the captured schools in the Namibian fishery (Thomas &Schulein, 1988)also exhibits circadian cycles which vary according to the species. Thecycle is not significant for pilchards and very clear for anchovies, which are caught atabout 6m at night (depth of the top of the shoal) and about l3m at midday.
In some fisheries, the circadian variation in depth of the schools is the limitingfactor for setting the purse seine, as in the Chilean fishery for horse mackerel (Trachurus symmetricus murphyi) of the Talcahuano area during wintertime. Hancock etal. (1995) reported that in winter, successful sets were made mainly during the night atan average depth of 37 m when some of the schools reached the upper layer, whereasduring the day, most of them were located below 50 m, that is out of the range ofthepurse seine efficiency. The factors governing the variability in the depth of the schoolsduring the day are not documented for this species, but any slight interannualvariability of these factors will certainly play a great role in the variation of theabundance indices derived from the fishery.
In the above example, it is relatively easy to compute an unbiased abundance index(see recommendations). But let us see a last example where the bias in the annualabundance cannot be corrected. Dommasnes et al. (1979) observed ail unusualmarked diel vertical migration of the mature capelin in the Barents Sea during winter1974. During daytime the fish were located in unusually deep water,and thereforewere caught mostly by the vessels with the largest purse seines. In this particular year,the CPUE was underestimating the real abundance.
Long-line fisheries
The long-line fishery targeting bigeye tuna is performed by day with deep long-lines.Fedoseevand Chur (1980) indicated that maximum catches of bigeye tuna were

Effects of Behaviour on Fisheries and Stock Assessment 207
observed at 140G-1500h and 170G-1800h and corresponded to the mean values ofthe stomach filling index. In contrast the swordfish are caught during the night bysurface long-lines. Further examples of circadian variation in yield and catch composition in long-line fisheries are provided in section 6.2.
Gill net fisheries
Azuma (1991) investigated by gill net the circadian variations in the salmon catch inthe Bering Sea. Chum salmon (Oncorhynchus keta) exhibited a significant differencein circadian catches (with catches at night 1.8 times greater than daytime catches),while sockeye salmon (0. nerka) and pink salmon (0. gorbuschai did not. From 1989to 1993, Blaber et al. (1995) used gill net and beach seine to sample the fish communities of the shallow inshore waters of a tropical bay in the Gulf of Carpentaria,Australia. They found that water turbidity, tidal range, wind and day versus nightwere the only abiotic factors that correlated with the relative abundance. Accordingto Cui et al. (1991), vision is a major factor affecting catch rate by gill nets, whichcertainly explains the effect of turbidity and sunlight on these results.
Recommendations
These few examples of different gears indicate that the catchability coefficient canvary greatly according to the hour of the fishing operation in relation to diurnalhabitat selection-To overcome the above-mentioned problem of a yearly change inthe exploitation pattern, a day-night factor ek must be included in the gLM procedure(section 8.2.1):
10g(CPUEtijk)= log(CPUE II 11) + logta.) + Iogtb.) + log(cj) + log(d tj)+ log(ek) + Etijk (8.28a)
where everything is as in equation 8.27b, except that now the subscript k refers.to theperiod of the day (for instance 1 is day and 2 is night) and e is aparameter relating theabundance during the day to abundance during the night. If an interaction fik betweenthe day/night effect and the fishing unit classes is suspected (for instance if some unitsmight be better able to fish during the night than others but have a different globalefficiency), the model can be written:
10g(CPUEtijk)= log(CPUE 1111) + log(at) + logfb.) + log(cj) + logtd.)+ log(ek) + log(f;k) + Etijk (8.28b)
Many other interactions can be incorporated in the model if they are suspected tooccur. Buttwo important points must be underlined concerning such incorporations.First, over-pararneterisation of the model must be avoided. Because of the largeamount of data usually available (currently> 100000 observations), nearly all effectsand their interactions tend to be significant at a low level of probability (F test on theparameters), even if their contribution to the model is minor. This is also because thebasic assumption of independence of data is usually not met owing to temporal andspatial correlations.Therefore additional criteria of variable selection must be used to

208 Chapter 8
build the model, as the proportion of variance explained by each factor and the gain(or loss) of the incorporation (withdrawal) of a factor using stepwise methods.Second, in this respect a particularly crucial decision is whether or not to incorporatean interaction including the year effect, because only this type of interaction willprevent the estimation of an unbiased CPUE time series. As stressed by Lebreton etal. (1991), instead of intending to get the ideal model explaining the highest percentage of variance, it is preferable to allow some secondary and hypothetical effects inthe residuals and to focus on the main effects.
One example of such an interaction is found in the multispecific midwater trawlfishery of Peru. From the analysis of 25000 hauls from 1983 to 1987, Icochea et al.(1989) concluded that the daily variation in CPUE depended on the El Nifio eventsand on the occurrence of the southward coastal undercurrent. During an El Nifioevent, fishing depths are usually over 100m and the CPUE is high and relativelystable all day (i.e. over 24 hours). When a marked southward undercurrent occurs,fishing grounds are close to the coast and trawl sets are close to the surface at nighttime and deeper at daytime, with a higher CPUE than during the night. When theundercurrent is weak, fishing grounds become oceanic, catches more superficial andCPUE shows little daily variation, despite an intensification of the fishing effort atnight.
8.3.5 Spatial variability ofcatchability in relation to habitat selection
Despite the difficulty of separation between temporal and spatial components of thevariability in habitat selection - which also depends on the scale of measurement(Home & Schneider, 1995) - let us now see the situations where the main effect isstrictly spatial and not density-dependent.
Examples of spatial variability are easier to find in demersal fisheries than in pelagicones; Rocha et al. (1991) proposed the use of principal component analysis to definethe fisheries zones for each of six species caught by English trawlers in the North Sea:cod, plaice, sole, haddock, saithe and whiting. As far as coastal pelagic species areconcerned, most of the abiotic factors that structure habitat selection are related tothe water mass (temperature, salinity, dissolved oxygen, water transparency, lightintensity, current, etc.; Chapter 3) and therefore habitat is expected to vary moretemporally than spatially. In the case of the eastern Atlantic yellowfin tuna fishery,Fonteneau (1978) took advantage of the habitat selection of this species according tothe surface temperature to propose an annual index of abundance. Instead of computing the average CPUE in those I° latitude-longitude squares where the proportionof yellowfin tuna was > 50% in the total catches, as before; he selected only the areaswhere the surface temperature was over 23°C during a 15 day period. In addition, hefixed .a threshold of fishing effort for these spatial and temporal strata (12 or 24hours). The resulting figures provided a higher decreasing trend in the abundance ofthe stock compared with the conventional averaging methods. The advantage of thismethod compared with a threshold of the proportion of the species in the catches isthat the resulting abundance index of a given species does not depend on theabundance of the other species.

Effects of Behaviour on Fisheries and Stock Assessment 209
In pelagic ecosystems, some abiotic factors are rather permanent on a large scale,especially in the vertical plane (e.g. oxycline in tuna's habitat), and other abioticfactors are fixed features in the environment (bottom depth, nature of the sea bed). Asa consequence, some permanent productive fishing grounds can be observed atmedium and large scale for pelagic species. For coastal pelagic species, these fishinggrounds are usually defined (or structured) by a combination of bottom depthinterval and sectors of the coast which correspond to permanent or season areas ofenrichment by upwelling or river discharge (e.g. Fig. 8.15 from Barria, 1990, or Yafiezet al., 1995). For tunas, the more productive fishing grounds are defined in thehorizontal plane by offshore upwelling, or the proximity of coastal upwellingexporting part of their production offshore or by large gyres (Fig. 2.2). In Fig. 8.16,combining the catches of the whole tuna fleet in the eastern Atlantic from 1978 to1981, it appears that skipjack tuna concentrate in three main areas of upwelling (withmaybe an additional effect of Congo river discharge) while the yellowfin tuna areasare more numerous and dispersed. In the vertical plane, the catch rate and the speciescomposition and mean body size are known to vary largely according to the locationof the gear relative to the thermocline or oxycline depth (Chapter 3).
Gaertner and Medina-Gaertner (1992) reported that the purse seine tuna fishery inthe Caribbean Sea is limited to the south-east margin, because in the rest of the basinthe deeper depth of the thermocline and of the oxycline does not favour the concentration of yellowfin tuna schools in the upper layer where they would be accessibleto small and medium purse seiners. The abundance index in the rest of the basin istherefore largely underestimated because the vertical extension ofthe habitat is wider.Since this fishery started to develop during the 1990s, skippers have progressivelylearnt the location of the best availability of the resource and the fishing effort hasbecome increasingly concentrated in the south-east margin of the basin.
The previous examples strongly suggest that spatial variability in the catches is alsoan important factor to take into account in the computation of abundance indices inpelagic fisheries and in modelling. Collecting spatial-referenced data for these fisheries is therefore recommended as is incorporating both spatial and temporal variables in the gLM models aimed at producing mean annual CPVE series. A typicalmodel without interactions can be written:
10g(CPVEtijk,) = 10g(CPVElllll) + log(at) + logfb.) + log(cj) + log(dk)+ log(e,) + Etijkl (8.29)
where the incorporated effects are year (at), vessel type (BD, season (cj), day-night (dk)and geographic sector (el). Many interactions can be incorporated according to thesituation, but the most common one is an interaction between the season and thefishing sector (fjl):
10g(CPVEtijkl)=log(CPVElllll) + log/a.) + logib.) + log(cj) + log(dk)+ log(ej) + 10g(fjD + Etijkl (8.30)
Let us see now a last illustrative example of the effect on stock assessment of thehabitat selection in the vertical and horizontal planes combined with a trend in thefishery. That is the surplus production modelling of the Atlantic yellowfin tuna

tx1000
60---
1-
50 ----40 ----30 ---- .20 --- 10-- -0-----
Total catches = 1 329000t
Fig.8.15 Geographical distribution of the catches of horsemackerel (Trachurus murphyi) by 10' squares in the Talcahuano area (central-south of Chile) in 1987. Total catch is1.33 million tonnes, mainly caught in four squares (redrawnfrom Barria, 1990).
N-oQ{;~...00
~ ~~
<,
<,
<,
................"
<,
""
"" <,
38·S
<,<,
""
<.37'S
36·S

Effects of Behaviour on Fisheries and Stock Assessment 211
(0) Yellowfin
(b) Skipjock
O·
Fig. 8.16 Geographical distribution of the mean annual catches of tuna by 10 squares along the Africancoasts during the period 1978-1981, all surface fleets together: (a) yellowfin tuna iThunnus albacares); (b)skipjack tuna iKatsuwonus pelamis) (redrawn from Fonteneau, 1986a).• > 750 t yr"; ~ 200-700 t yr";o < 200 t yr- I
.
fishery summarised by Fonteneau (1988) (Fig. 8.17). The industrial tuna fisherystarted at the end of the 1950swith mainly surface long-line and pole-and-line vessels,but from 1968 the purse seiners' catches were predominant (Fonteneau & MarciIle,1988). In 1972 the MSY was estimated at 70000 tons by the generalised production

212 Chapter 8
10 >CIl::;;
W
~40 -:l
ooo..~
198419801975
......... - ... / .....
... --+-----*""'...--.".. .....
- ...-*
/--- ......r- A / \
I ....... 'V'...... ......V/ \t m= 0.0I
II
J",/ m= 1.0I
I
fI
;I1"/
/'
O+-~-----r~-~~~--.-~~~---+
1972
150
100.....000..-
>-(J)
::2:50
Fig.8.17 Trend in the estimation of maximum sustainable yield (MSY) and the optimal effort (Fopt =EM SY) of the yellowfin tuna (Thunnus albacares) in the eastern Atlantic according to the last year ofavailable data (data series started in 1962) (redrawn from Fonteneau, 1988).
model. In 1983 it reached 120000 or 150000 tons according to the value of thecoefficient mof the retained model. This increase in MSY is obviously due to thepermanent increase of the fishing area of the purse seine and longline vessels and by aprogressive access to deeper layers and therefore to older fish as a result of the use ofdeep longlines and deeper purse seines. This is reflected in the variability of thecatchability coefficient according to the age and the period (Fig. 8.18). A similarsituation is observed inthe eastern Pacific tuna industry. From the 1934-1955 dataseries on yellowfin tuna catches and effort, Schaefer (1967) estimated at around100000 t the MSY value, while the same analysis performed on a series ending in 1994provided a value of 320 000 t (Anon., 1995). Despite the violation of assumptions (2),(5) and probably (3) of surplus-production models (section 8.2.1), this situationjustified the use of the inaccessible biomass model, but here, instead of having a.varying according to the environment, it varied according to the horizontal rangeexplored by the fisheries (Laloe, 1989). Similarly the changes in the vertical rangecould be taken into account by this model.
Despite the limitations in the use of CPUE as an index of abundance, this approachis still valid when fishery data are properly collected and processed in order to takeinto account the various sources of variability mentioned in this section and theprevious one. In the Humboldt current area for instance, two different abundanceindices were computed independently by two different institutes: the abundanceestimated by VPA and the standardisedCPUE (taking into account the boat characteristics and the spatial and temporal factors). The coefficient of correlationbetween those two series (1961-1977) was highly significant (0.93) for the stock of

~~~
'"~
~I::>
'"o'l::....Cl:::
~~....~.
§I::>..VJB...,;>;-0
~
'"'"<I:l
'"'"ss....
Fig. 8.18 Variation of the catchability coefficient (q) ofyellowfin tuna (Thunnus albacaresi in the eastern Atlantic(a) according to the age of the fish and to the period ofexploitation (1969-1974 versus 1975-1979) and (b) corresponding horizontal extension of the purse seine fisheryestimated by the catch distribution (redrawn from Fonteneau et al., 1997).
o I '-..../ 1'-0..-/ '-../I '-../\,=~\
o
-10 I I I I I '.
10
20~---------------------------
40
30~----------------------------
Cl'"
o
03 5 7 9 11 13 15 17 19 21 23
Age (quarter)
20
" ... ~
1:::<' I I I--.,. "r-;
010
(a)
10 I I J= I I I
o I I I '=:::::A - j==-jl
-10 I I I I I '.
(b) 20
-15 I I I I I . I
30 20 10 0 -10 -15
Purse seiner catches 1969-1974
-15 I I I I I . I
30 20 10 0 - 10 - 15
Purse seiner catches 1975-1979 N.....w

214 Chapter 8
anchoveta (Engrau/is ringens) considered as shared by Peru and Chile. A similarcomparison was performed for the Chilean stock of Spanish sardine (Sardinopssagax) for the period 1974-1992 and the value of the coefficient was 0.95 (Yafiez,1998).
8.3.6 Influence ofhabitat selection on growth estimate
An interesting example of a depth-related trend in growth pattern is given by Kerstan(1995) for the Agulhas Bank horse mackerel (Trachurus trachurus capensis). Heclearly observed in one of the two years of the study (1992) a change in the meanlengths-at-age from Bhattacharya's modal separation method (which agreed wellwith otolith ageing). The 2-group increased in mean length from 23.5 cm at about80 m to 26cm at depths greater than 140m, while the 3-group increased from 28.2 cmto 31.6 cmat the same depths. This result cannot be interpreted as a change in growthrelated to temperature, because it would have a sign opposite to the expected one.More likely this is attributable to a change in habitat selection with body length at thesame age. This interpretation can be related to the influence of the ratio body-surface/body-length on the rate of heat exchange with the water and/or by the ratio gillsurface/body-weight, both resulting in a selection of deeper habitats for larger fish(section 3.3.1).
Whatever the biological processes of this change in the mean lengths-at-age, whichin some cases is also dependent on longitude (e.g. Arruda, 1984;Kerstan, 1995), it canbe a potential source of bias in growth parameter estimates. Therefore the samplingstrategy for age-length keys must take into account these spatial effects.
8.3.7 Influence ofhabitat selection on mortality estimate by ASA models
Conventional age-structured models estimate the mortality of cohorts from therelative abundance of the different year classes in the catches. If the catchabilitywithin the recruited cohorts changes with age, the basic assumption of those conventional ASA models is violated. There are many examples of large variation incatchability by age owing to change in vulnerability related to gear selectivity, butthese variations can be easily measured by size selectivity studies and taken intoaccount in the second-generation ASA models which use the separability assumption(section 8.2.2).
A more difficult case concerns variation in catchability by age related to fishbehaviour because these variations cannot be modelled in the absence of knowledgeof the source of variability. Swain etal. (1994) found an inverse relationship betweenthe catchability coefficient and the abundance for the younger ages (3 to 5) of Atlanticcod and a positive relationship for the older ages. Among various hypothesesexplaining these results, the authors mentioned age-dependent variation in habitatselection and the possible decrease in competition for density-dependent resourcesduring migration, spawning and overwintering. There are many other examples ofsimilar difficulty related to different migratory pattern according to age (sedentaryyoung fish versus migrant adults). In midwater trawl fisheries, underwater video

Effects of Behaviour on Fisheries and Stock Assessment 215
recording indicated that at high catch rates, mesh blockage occurred for severalmetres ahead of the catch bulge (codend) during the later part of the tow (Suuronen &Millar, 1992). Because most escapes occur at the front of the catch bulge, the sizeselectivity can change according to the level of saturation, especially with diamondmesh codends. In addition, Suuronen and Millar (1992) observed that during some ofthe higher-catch hauls, the codend was undulating, causing turbulence and hinderingthe process of active escape.
The relative shortness of this section on the influence of habitat selection on ASAmodels could give the false impression that the age-structured approach is less sensitive to the effect of fish behaviour. In fact the problems of catchability mentionedthroughout this book apply also to age-structured models, not only because some ofthem are tuned by CPUE data, but also because all of them require a proper estimateof the catchability coefficient when fishing mortality is converted into fishing effortfor management implementation. Nevertheless, ASA models do not require anabsolute estimate of the catchability coefficient, when the stock management advicerequired is based on quota.
8.4 Influence of aggregation on fisheries and populationdynamic models
We shall first develop the influence of aggregation on catchability, then the influenceof mixed species schools on abundance indices, and finally the role of aggregation ongrowth parameter estimates and age-length keys.
8.4.1 Influence ofaggregation on catchability
The linear relationship between CPUE and abundance (assumption 5 of the surplusproduction models) may be altered by the existence of a non-random distribution offish in space and time, once the fishermen have adapted to this distribution (Gulland,1964; Paloheimo & Dickie, 1964; Hilborn & Waiters; 1987). Pelagic fish populationsare usually spatially structured in schools and in clusters of schools (Chapter 4). It isimportant: to consider the variation in school size when abundance is changingbecause most indices of abundance used in pelagic fisheries are derived from gearsaimed at catching schools. Therefore we shall see first the small-scale effect owing toaggregation in schools (saturation of the fishing unit) and in clusters (effect ofpatchiness, co-operation and competition). Then the effect of circadian, weekly andseasonal change in patchiness will be reviewed, followed by the influence oflunar andannual changes in aggregation patterns.
Saturation of the fishing unit
An additional problem in estimating annual abundance index with CPUE is thesaturation of the fishing unit (gear or holding capacity of the boat). For most pelagicgears, the aggregation of pelagic fish in schools or dense layers is responsible for a

216 Chapter 8
reduction of the relative efficiency at high levels of abundance. If the mean school sizespotted by the fishermen is significantly larger than the capacity of the gear (or theboat capacity), this will lead to a non-linear relationship between abundance andCPUE (CPUEwill decline slower than abundance). Such saturation is likely to occurin small-scale coastal pelagic fisheries such as the Senegalese fisheries which usedpurse seines of 250-:-300 m length and transport canoes able to carry between 5 and16t in the former fishery, and up to 24 t from the end of the 1970s (Freon & Weber,1983). Saturation is documented in some coastal industrial fisheries on pelagic fishessuch as the jack mackerel (Trachurus dec/ivis) purse seine fishery of Tasmania (Williams & Pullen, 1993) in which schools are so big that fishermen have to set the net ononly a fraction of the school to avoid net outburst.
In surface tuna fisheries, saturation probably occurred in the past with small andmedium purse seiners, but is now limited with the common use of large tuna ships.Nonetheless, large catches are still avoided because the duration of fish loadingincreases the level of stress in tuna, and therefore the histamine level in the flesh. In gillnet fisheries, especially those using surrounding gill nets, the level of saturation isoften reached. At a low level of abundance, especially if the mean size of the schoolsdecreases, the saturation effect might be lower or may disappear, which would lead toan underestimation of the long-term decrease of biomass.
Saturation effects are also expected in longline fisheries: even when the distancebetween hooks is short, all the baits in certain locations along the line might be eaten(with a variable hooking success). As far as we know, this effect has not been studiedfor pelagic fisheries. An in situ experimental (and statistical) comparative studybetween the CPUE obtained by angling and visual density estimation (D) performedfrom a submersible is available for the quillback rockfish (Sebastes ma/iger) (Richards& Schnute, 1986). The authors provided first a comprehensive figure of all the possible relationships between CPUE and D and used two methods for fitting the models:an ordinary least squares method (OLS) assuming error only in CPUE, and a morerealistic 'errors-in-variable' (EV) method assuming errors both in CPUE and in D.Despite the fact that this study was not specifically aimed at studying saturation, athigh density the asymptotic value ofCPUE can be interpreted as a saturation effect insome figures.
It follows from these considerations that saturation potentially exists in most of thefisheries, even though it is not a fatality. It is often easy to identify, butmore difficultto quantity, especially because it often concerns the onset of a fishery (high abundance, smaller gear and vessel) i.e, historical data.
Influence ofpatchiness
Different theoretical cases of aggregation according to the density can be contemplated (Fig. 8.19): changes in abundance can be related to changes only in thenumber of schools, or to changes in the size of the schools (Freon, 1991); or to both(Petitgas & Levenez, 1996). From simulations and from the analysis of small-scale (intime and space) data on tropical tuna fisheries, Laurec and Le Guen (1978) drewseveral conclusions on the influence of the spatial distribution and structure of tuna

Effects of Behaviour on Fisheries and Stock Assessment 217
High density
•.,
Low density
• (a)• •3 schools
, ,• (b),
10 schools
.' (c)
• • •10 schools
(d)•
••
10 schools
•
5 schools
Fig. 8.19 Diagram of possible theoretical changes in school number arid school size according to thedensity: (a) fewer schools, all large (unrealistic); (b) same number of schools, all small; (c) same number ofschools, fewer large ones; (d) fewer large and small schools. This figure can also be used for representingclusters.
schools, and these conclusions vary according to the fishermen's strategy. One ofthese conclusions is that CPUE will be proportional to abundance (assumption (5) ofsurplus production models) only if the school distribution is random and if searchingtime is used as the unit ofeffort, that is days at sea minus the seining time (Greenblatt,1976) and night time. The searching activity is stopped during fishing operations andat night. (Note that at the time of this study, fishing on floating objects was notfrequent, or at least not reported.) Because fish schools are usually distributed inclusters, another important conclusion is that the validity of assumption (5) dependson the kind of response, at small scale, of the changes in stock abundance in conjunction with the ability of fishermen to detect clusters. (Fig. 8.19 can be used also forrepresenting the variability of clusters.)
CPUE will or will not give an acceptable measure of abundance depending on fishbehaviour and fishermen's behaviour on a small scale. Those behaviours are far fromwell known, neither are their interactions. Fish behaviour at the scale of the schoolconcentration is not well documented, because studies on school clusters are just

218 Chapter 8
starting (Chapter 4). However, some alternative hypotheses have been expressed (Fig.8.19). Fishermen's behaviour at sea(i.e. fishing tactics and strategy) is a rather newand promising field of study (Allen & McGlade, 1986, 1987; Sampson, 1991; Ferraris,1995; Gaertner et al., 1996). Fishermen's skill in recognising the presence and thelimits of a concentration is expected to vary according to its size or its density, anddepends largely on the vessel's equipment. The increasing use of long-range acousticequipment (multi beam sonar; high-resolution radars to detect bird flocks) and longrange visual observation (powerful binoculars for tracking surface schools, birds orlogs in tuna fisheries) reduces the probability of small or low-density concentrationsescaping to the fishermen's skylines. Some drifting FADs are equipped with anechosounder connected by radio to the tuna purse seiner. In addition, some fisheriesemploy. spotter planes or helicopters and receive thermal satellite data onboard (Petitet al., 1995).
Finally, Laurec and Le Guen (1978) recommend studying, among other things:
• The geographic distribution of the fishing fleet (which gives an idea of the numberof exploited concentrations) . .
• The length of the sequences of days with no catch (which could be related tosearching for concentration)
• The duration of the sequences without significant displacements (which could berelated to the duration of the exploitation of a concentration)
• The catch per set (which is proportional to the school weight when saturation doesnot occur).
The main conclusions of their work plus personal thoughts are summarised in Table8.4.
Mangel and Beder (1985) proposed a general theory for the estimation of stock sizefrom search data within a single fishing season. Their search model is an extension ofthe Poisson process to include depletion and take into account a parameter measuringsearch effectiveness during a random search (vessel speed, detection width, etc.). Thelimitations of the model are discussed, particularly the violation of the assumption onthe randomness of the search, the unexpected effect of clumped schools in clusters,learning of fishermen and the fact that recruitment is not included. The authorssuggest improvements and developments of their models to overcome these limitations, but as far as we know no further application has been proposed.
The use of the mean catch per set as an abundance index in purse seine fisheries wasproposed by Freon (1986, 1991); This implies the two following assumptions:
(I) The catch per set is proportional to .the school size(2) . The mean school size reflects the stock abundance.
No major saturation effect is required to satisfy the first assumption and fishermenare supposed to sample schools randomly or to use the same threshold for selectingthem. The second assumption requires a proportionality between the school size andthe total biomass of the stock. These assumptions seem to be met in the SenegaleseSardinella fisheries except that schools are not selected randomly but according to athreshold of minimum estimated size.This threshold varies in the medium and long

Effects of Behaviour on Fisheries and Stock Assessment 219
Table 8.4 Possible effects of the decrease in stock abundance according to the spatial scale of the structures from the authors' interpretation of Laurec and Le Guen (1978) and personal considerations(CPUEI = catch per time at sea; CPUEZ = catch per searching time; CPUE3 = catch per set; i increase; ldecrease proportional to abundance; .... decrease slower than abundance; 11'decrease faster than abundance;- stable).
Scale Effect on the fish Effect on the fishery Effect on the CPUE
Stock l area Usually l trip duration" i CPUE I; - CPUEZ; - CPUE3and/or l density i searching time for fishing l CPUE I; l CPUEZ; - CPUE3
grounds
Cluster l number of clusters i searching time for clusters .... CPUE I; .... CPUEZ; - CPUE3and/or l cluster area i searching time for clusters ....CPUEI; 11'or CPUEZ b
; -CPUE3
School l number of schools/ i searching time for schools .... CPUE I; l CPUEZ; - CPUE3cluster in cluster
l duration of exploitation of .... CPUE I; 11'CPUEZ; - CPUE3the cluster
and/or l school weight i time for fishing operations .... CPUE I; l CPUEZc; l CPUE3c
"except if the location of the core of the overexploited stock is far from the fishing harbour(s)b .... if the cluster and its Iimits are directly detected by the fishers, or 11' in the opposite caseC except if there is some saturation effect
term according to the global abundance and in the short term according to theremaining storage capacity on board. To limit these effects, the author retained onlythe sets above a fixed threshold (2 tonnes) and the trips with a single set or with severalsets if the total catch did not exceed 80% of the total loading capacity of the boat.
Wada and Matsumiya (1990) proposed an abundance index P' in purse seinefisheries which in addition to the mean school size uses the mean school densityintegrated over the fishing ground area. The school size is here also estimated by themean catch per set and the school density is assumed inversely proportional to thesearching time T: .
D,
p; = ~ (Yti/Xti)/Tti=1
(8.31)
where D. is the total number of fishing sectors for the period t, Yt i and Xti arerespectively the catch and the number of sets at period t and sector i. The applicationof this abundance index to the sardine fishery of the south-east of Hokkaido from1976 to 1984 indicated that the interannual variation in abundance was mainlyreflected by changes in the school size. Moreover, Wada and Matsumiya (1990) foundthat mean school size within ten-day periods was negatively correlated to the fishingground area (and secondarily to the school density) when the abundance was constant. The authors claim that this last result supports the validity of their approach.We think that the validity of P', as an index of abundance depends on other implicitassumptions. First, the fishing area is implicitly assumed to be proportional to thestock distribution which is a strong assumption. Second, as in the Senegalese fishery,it is assumed that there is no saturation of the gear and no density-dependent selectionof school size by the fishermen, in the estimation ofschool size. Third, the assumption

220 Chapter 8
that the searching time is inversely proportional to school density relies on the ran-dom distribution of the school and fishing effort inside the fishing sectors. .
Gauthiez (1997) simulated different combinations of small-scale aggregation andfishermen's ability to detect the resource. The distribution of density of the stock wasa gamma or a negative binomial density function (providing similar results). Inaddition, Gauthiez used Taylor's relationship between the variance V and the mean Eof the local abundance (V = aEb
) to constrain the data variance. In this relationship,he simulated three typical values of b which are related to some of the hypotheses wepropose in Fig. 8.19.
• b = I, linear relationship; obtained if the school biomass distribution withinclusters does not vary according to the cluster biomass (Fig. 8.19d)
• b = 2, low curvature of the relationship, constant coefficient of variation; obtainedif the mean school biomass within clusters is proportional to the cluster biomass(Fig. 8.19c)
• b = 3, high curvature of the relationship; obtained if the mean school biomassincreases faster than the cluster biomass (that is few big schools of clusters havingthe highest biomass; Fig. 8.19b)
The capability of the fisherman to locate the aggregation was simulated first byperforming n simulated random fishing operations in the strata and second by considering that the fisherman actually performed the best of these n operations. Ofcourse this does not correspond to the real situation (except in shrimp fisheries usingtrial nets) but provides an excellent non-deterministic simulation. If n equals 1, thefisherman is considered to fish randomly. Ifn is medium (typical value 10), a mediumknowledge of the strata is simulated, while high values of n (typically 50) are used tosimulate excellent knowledge of the strata because most of the simulated catches willbe located in rich concentrations. Figure 8.20 presents the relationships between themean random catch (that is the real local abundance) and the mean non-randomcatch (n > I):
• When b < 2, the curves are more and more convex when n increases, which reflectsa decreasing local catchability when the local abundance increases, especially forlow abundance levels. For medium and high abundance, the relationship is doseto a straight line having a positive ordinate for zero abundance.
• When b = 2, the relationships are linear, that is the simulated non-random CPUEprovides an index of abundance without bias.
• When b > 2, which is a realistic case in pelagic fisheries, the curves are more andmore convex when n increases, which reflects an increasing local catchability whenthe local abundance increases.
These results underline the key role of the spatial structure of abundance versus thefishermen's strategy and we suggest that b be estimated by experimental fishing oracoustic survey to quantify the bias resulting from the use of CPUE as an index ofabundance. In the case of an acoustic survey, the sensitivity of the estimate ofb to thelength.of the elementary sampling distance unit (ESDU) must be studied:
Patchiness in fish distribution is also commonly studied by the geostatistical

Effects of Behaviour on Fisheries and Stock Assessment 221
250
150
50
o
-'= b=20~
00
E 3000uc2 100I 0c0
Z
b=3600
n=50
200
oo
n=1
I i
20 40 60 80 100
Random catch
Fig. 8.20 Random mean catch versus non-randommean catch according to the number of simulated'trials' (n) virtually made by the fisherman and to theexponent (b) of the Taylor law (redrawn after Gauthiez, 1997).
approach. Spatial analysis (by variograms or autocorrelograms) is not adapted to theanalysis of large databases of crude yields originated from commercial fishery,without pre-processing. Vignaux (1996) proposed an interesting approach foranalysing the small-scale structure in these types of data. It simply consists ofstudying the spatial and temporal autocorrelation of the residuals of a linear modelaimed. at removing the seasonal, circadian, latitudinal and technological effects.Autocorrelation in the residuals from the model extended out to 11 n.mi.and persisted only during 14 days. This result suggests that the-patches are not related topermanent features in the environment or the bathyrnetry, even in the case of the deepbottom species, Macruronus novaezelandiae, studied.
Finally, unexpected variations of catch ability by age can also be related to changesin patchiness. The Chilean jack mackerel tTrachurus symmetricus murphyi) provides
. .
an example of an unknown reason for change in catchability. It seems that larger fish(fork length > 40cm) form looser or smaller schools than small fish, possibly inrelation to a different diet (Serra, 1991).
Cooperation and competition among fishing units
The tactic of cooperative fishing alters the relationship between the size or density of aconcentration and its probability of detection, because once a boat detects a con-

222 Chapter 8
centration, other boats join it and may exploit the concentration for several days. As aresult of all these considerations, the decrease in cluster area is likely to be underestimated by the CPUE.
A detailed study of such an effect of cooperation between boats is given by Hancock et al. (1995), who observed the fishermen's tactics in the fishery for the horsemackerel (Trachurus symmetricus murphyi) of the Talcahuano area in Chile. Theyreported that the fleet was mainly operating in one or two fishing groups eachincluding 3-14 boats with their nets set and several other boats searching or cruisingamong them. Within groups, the overall mean nearest neighbour distance(NND) ± SD between boats with set nets was 0.75 ± 0.39n.mi. The core areaoccupied bya fishing group was defined by the position of the boats with set nets.Additionally, two marginal areas surrounding the core area were defined, each havinga width of the mean NND plus one SD (Fig. 8.21). Within a fishing group, 90% of thetime was spent searching for schools, while outside the group, 94% of the time wasspent cruising into port or directly to fishing areas. The CPUE, expressed as catch persearching time, was 417 t h- I in the core compared with 40-50 t h- I in the margins and14t h- 1 outside the fishing group. These results mean that it is easier for skippers tofind fish by first finding other fishing boats than it is to make an independent searchfor new aggregations. In the Javanese purse seine fishery, there is first a cooperativestrategy to locate the fish concentration during the day and then a competition toexploit it during the night, using illuminated FADs (Potier et al., 1997). In suchsituations, CPUE is a measure of abundance only within the school concentration.
A particular form of cooperation appeared in some tuna fisheries in the 1980s: thatbetween purse seiners and pole-and-line boats. While the pole-and-line boat maintains the tuna school densely aggregated at the surface with baiting (but also througha 'boat-log' effect, see section 6.3.1), the purse seiner can set the net around it with alower risk of avoidance. In the southern Caribbean Sea, for instance, Gaertner andMedina-Gaertner (1991) reported that the number of unsuccessful sets was only 12%with such cooperation, against 41% without cooperation, but usually the catch per setwas lower with cooperation. Analysis of the fishermen's tactics indicates that mostprefer the less risky tactic of cooperation to the more productive tactic of fishing alone(except for the large purse seiners because they use deeper and fast-sinking nets).Therefore more than half of the catch of purse seiners is made in association withpole-and-line boats. The association is particularly fruitful for school sets (schools notassociated with floating objects or mammals) and when the thermocline or the oxycline are too deep to restrict the distribution of the fish in the upper layers (Gaertner etal., 1996). Before starting fishing operations, the skippers of the two fishing boatsagree by radio on how to share the catch. Usually 25% to 33% of the catch value isgiven to the pole-and-line vessel.
An additional reason for the failure of assumption (5) in relation to aggregation iscompetition between boats, which may occur only if schools are clustered. Competition has an effect on the relationship between CPUE and abundance opposite to theeffect ofcooperation. The effect ofcompetition between fishing units can be observedby detailed data analysis using small spatial and temporal resolution. The geographicresolution must be comparable to the cluster size and the temporal resolution eom-

Effects of Behaviour on Fisheries and Stock Assessment 223
• Boats with set"nets
o Boats searching
I I I01 2
Nautical miles
cP••••
,_- ~,-_.~-__--__-- ----- ------ --- ---a:,.0 0 000 i, ,.: • 0 e. ..• :I·········Q
,
,,,
,,,,..,,,
,",,~ .. .,
: '. 0 --i .... .: /" /
\ .~.• : ....0· //
{G·O~ · ·:>::" ·.· . · · · //:· / .Inner margin )/ ----------
Outer margin
Inside fishingaggregation
Outside fishingaggregation -"..,-----------\
Fig. 8.21 Distribution of purse seiners exploiting a cluster of schools in the horse mackerel (Trachurusmurphyi) fishery ofTalcahuano (see Fig. 8.15). Example of radar recording of boats with set nets (fiiledcircles) or not (open circles). Finely dotted lines show the nearest neighbour distance (NND) of boats withset nets. On this figure NND = 0.57 ± 0.27 n.rni and this value was used to delimit the width of the innerand outer margins (heavily dashed lines). (Modified after Fig. 4 from Hancock et al. (1995) by addition ofnon-fishing ships (data kindly provided by the authors).)
parable to the duration of the exploitation of a cluster, that is usually one or twoweeks. Fonteneau (1986a) analysed the CPUE of the tuna purse seine fishery in theeastern Atlantic using fortnight strata of I D squares in 1980 and 1981. The resultsclearly showed a decrease of the CPUE in the strata of higher effort, especially inconcentrations where skipjack tuna were more abundant.. A similar result wasobtained in yellowfin tuna: the CPUE in nine clusters exploited continuously duringperiods varying from 12 to 33 days displayed an increase during the first week andthen a decline owing to local depletion (Fonteneau, 1985). An estimate of the numberof fish per cluster clearly shows the absence of local recruitment and indicates thatnearly all the fish have been caught by the time the fleet leaves the cluster-(Fig. 8.22).

224 Chapter 8
300
........2000
00
x'-"
..r::(fl 150:;:
'+-0
'-<U.DE 100:JZ
Fig. 8.22 Estimation of variation in the numberof fish within nine clusters of yellowfin tunaexploited by purse seiners between 12and 33 days(redrawn from Fonteneau, 1985).
Because competition increases when the cluster - or the whole stock - abundancedecreases, the trend in the CPUE will exaggerate the real decline of the stock. It isattractive to hope that this overestimation of the decrease of abundance will compensate for the numerous reasons for underestimation previously mentioned. Butfishermen are as clever at limiting the competition effect as they are at takingadvantage of cooperation.
Circadian, weekly and seasonal changes in patchiness
The patchiness ofpelagic fish distributions is known to change according to circadianand seasonal rhythmicity, but we will also mention unusual examples of weekly andyearly variation.
In the Namibian purse seine fishery, Thomas and Schiilein (1988) found circadiancycles in the catch frequency and catch per set of the different species. Pilchard(Sardinops ocellatusy and, to a certain extent, adult anchovies (Engraulis capensisitend to form larger and fewer shoals during the day than at night. Recruited anchovyand horse mackerel (Trachurus trachurus capensis) are mainly caught during the daybut show no meaningful day/night difference in catch per set, even though the daily

Effects of Behaviour on Fisheries and Stock Assessment 225
cycle of the anchovy exhibits a consistent pattern with two maxima during dusk anddawn. Nevertheless, this pattern is uncommon for Engraulidae observed in otherareas, where they usually aggregate by day (with a higher packing density observed byacoustic methods) and disperse by night, as for instance E. anchoita off Argentina(Matsumiya & Hayase, 1982), or E. mordax off California (Mais,1977).
In the Senegalese purse seine fishery, the mean catch per set varies according to thetime of day, with higher values early in the morning (Fig. 8.23). This means thatbiggest schools occur early in the morning, at least if we assume that the catch per setis proportional to school size. This result is unexpected because pelagic fishes areknown to disperse at night and one might expect the reconstruction oflarge schools totake a long time. In fact it seems that large schools do not disperse completely inlayers during the night but remain in large and loose shoals which are able to reformrapidly just before sunrise (Freon et al., 1996). If the circadian or seasonal fishingpattern is changing from year to year for external reasons (market, changes in targetspecies, etc.), the consequences of circadian variability of q on the mean CPUE will bethe same as those mentioned in the sections on habitat selection (8.3.3, 8.3.4), i.e. abias in abundance estimates.
20
,........ 16+-''---"
+-'Q) 12l/)
l-Q)
a.
@ < 50 observations4 - Mornin9 (06-10h)
..... Night t 19-06h)- - Day (06-19h)
<, " ......."----""
'- -...:.:.." ~-"-<, .. ///
-.. "",,".
8-'=u+-'oo
o 1 .175 77
179
I81
Year
I83
1
85I
87
Fig.8.23 Mean catch per set according to the period of the'day in the Senegalese purse seine fishery from1975to 1987.Note that the 'day' period overlaps the 'morning' period because, in addition to two identifiedshorter periods (10-16 hand 16-19 h), it the includes the whole day period (06-19 h). This overlap increasesthe meaning of the difference between the two series (redrawn from Freon et al., 1994).
In the Louisiana area of the menhaden fishery, purse seiners' catch per unit ofeffortchanges according to the day of the week: it is higher on Monday than during otherdays of the week,owing both to an increase of the catch per set and to a highernumber ofsets per day (Kemmerer, 1980). The underlying mechanism is probably achange in fish behaviour as a result of fishing activity. Fish tracking (by boats and byplanes) and fishing operations might increase the school splitting and make moredifficult the natural coalescence of small schools into larger ones, except on Sundays,
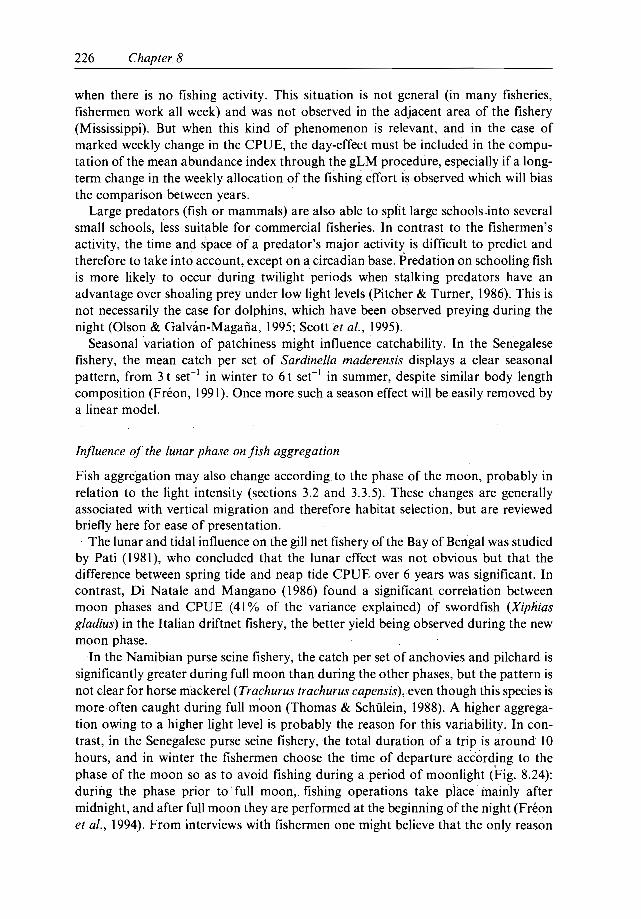
226 Chapter 8
when there is no fishing activity. This situation is not general (in many fisheries,fishermen work all week) and was not observed in the adjacent area of the fishery(Mississippi). But when this kind of phenomenon is relevant, and in the case ofmarked weekly change in the CPUE, the day-effect must be included in the computation of the mean abundance index through the gLM procedure, especially if a longterm change in the weekly allocation of the fishing effort is observed which will biasthe comparison between years. .
Large predators (fish or mammals) are also able to split large schools-into severalsmall schools, less suitable for commercial fisheries. In contrast to the fishermen'sactivity, the time and space of a predator's major activity is difficult to predict andtherefore to take into account, except on a circadian base. Predation on schooling fishis more likely to occur during twilight periods when stalking predators have anadvantage over shoaling prey under low light levels (Pitcher & Turner, 1986). This isnot necessarily the case for dolphins, which have been observed preying during thenight (Olson & Galvan-Magafia, 1995; Scott et al., 1995).
Seasonal variation of patchiness might influence catchability. In the Senegalesefishery, the mean catch per set of Sardinella maderensis displays a clear seasonalpattern, from 3 t set" in winter to 6 t seC' in summer, despite similar body lengthcomposition (Freon, 1991). Once more such a season effect will be easily removed bya linear model.
Influence of the lunar phase on fish aggregation
Fish aggregation may also change according to the phase of the moon, probably inrelation to the light intensity (sections 3.2 and 3.3.5). These changes are generallyassociated with vertical migration and therefore habitat selection, but are reviewedbriefly here for ease of presentation .. The lunar and tidal influence on the gill net fishery of the Bay of Bengal was studied
by Pati (1981), who concluded that the lunar effect was not obvious but that thedifference between spring tide and neap tide CPUE over 6 years was significant. Incontrast, Di Natale and Mangano (1986) found a significant correlation betweenmoon phases and CPUE (41% of the variance explained) of swordfish (Xiphiasgladius) in the Italian driftnet fishery, the better yield being observed during the newmoon phase.
In the Namibian purse seine fishery, the catch per set of anchovies and pilchard issignificantly greater during full moon than during the other phases, but the pattern isnot clear for horse mackerel iTrachurus trachurus capensis) , even though this species ismoreoften caught during full moon (Thomas & SchiiIein, 1988). A higher aggregation owing to a higher light level is probably the reason for this variability. In contrast, in the Senegalese purse seine fishery, the total duration of a trip is around 10hours, and in winter the fishermen choose the time of departure according to thephase of the moon so as to avoid fishing during a period of moonlight (Fig. 8.24):during the phase prior to full moon, fishing operations take place mainly aftermidnight, and after full moon they are performed at the beginning of the night (Freonet al., 1994). From interviews with fishermen one might believe that the only reason

Effects of Behaviour on Fisheries and Stock Assessment 227
Fishing time period
~ 19h-06h~ 24h-06h.19h-24h
1000
800ena.'L....0
600
LQ)
400.D
E:JZ
200
0
• e o o o ()Moon phase
Fig. 8.24 Number of trips according to the moon phase and the fishing time period of day in the Senegalese purse seine fishery from 1975 to 1987 (redrawn from Freon et al., 1994).
for this fishing pattern is an easier detection of fish schools on dark nights, facilitatedby the bioluminescence of plankton disturbed by the fish (no lateral sonar on board).Nevertheless, it is likely that fish are closer to the surface in total darkness, which isfavourable both to the detection of the bioluminescence and to the availability tosmall purse seines.
In summary, the influence of the lunar phase is not always observed, and when it issignificant, the phase associated with the highest CPUE depends on the species andthe gear. In such examples of lunar phase effect, if there is any interannual change inthe pattern of the fishery with respect to the lunar cycle (e.g. according to seasonalclosure of the fishery), it could be suitable to take this cycle into account in the gLMprocedure.
Annual changes in aggregation
In the above subsections, the conjunction of stable fish behaviour at intra-annualscales and unstable fishermen behaviour at the inter-annual scale was responsible fora bias. In contrast, section 8.3.1 focused on a density-dependent area of the habitatand some modified surplus-production models were proposed in section 8.3.2 to takeit into account. At a smaller scale, the aggregative behaviour of the fish might changefrom year to year and this change can also be density-dependent or related toenvironmental changes that are not always identified.
Long-term changes in stock abundance of pelagic species are often associated withsimultaneous changes in catchability, inversely proportional to the area occupied bythe stock (section 8.3.1; Ulltang, 1976, 1980; Shelton & Armstrong, 1983; Csirke,1988), which could be a social aggregation effect. In contrast, change in catchabilitymay occur without change in abundance when long-term changes in the environmentinfluence the aggregation pattern (Mangel & Beder, 1985). For pelagic stocks

228 Chapter 8
exploited by purse seiners, the usual CPUE is computed using the time spentsearching for schools. Evidently in such situations this CPUE will not reflect the rangeshrinkage of a stock, nor will it show variation that is related not to abundancefluctuations but only to change in the catchability.
MacCall (in Fox, 1974, and MacCall, 1976) suggests a non-linear relationshipbetween the catchability coefficient q and the biomass in the California Pacific sardine(Sardinops sagax caerulea) fishery from 1932 to 1950. He proposed the followingequation, even though he had to remove three years of observations to make itsignificant:
q=():BI3 (8.32)
where (): and ~ are parameters. He also attempted to take into account the changes inarea distribution by a geographical stratification of the data, but used only two largedivisions (San Pedro and Monterey), which perhaps were too few for the large geographical extent of this fishery. A wider audience for MacCall's findings was given byFox (1974), who introduced function (8.32) in the global production model (8.3) todescribe the depensatory regime in some fisheries:
(8.33)
Table 8.1 presents the equations at equilibrium derived from this model, which wasapplied to the California sardine fishery for the period 1932-1955. The model fits thedata reasonably well and a negative value of ~ allowed the collapse of the stock to beexplained. It was also applied to other stocks (e.g. Fig. 8.25). Other authors usedequation (8.33) to describe changes in catchability related to biomass in differentmodels (e.g. Winters & Wheeler, 1985; Crecco & Overholtz, 1990).
At the same time, Clark (1974) also proposed a structural depensatory productionmodel based on the modification of the stock-recruitment relationship which led tothe same kind of figure when the yield was plotted against the fishing effort. In bothcases, once the population is reduced past the critical point, it falls to zero even whenthe fishing effort is reduced. Nevertheless, two different underlying mechanisms areevoked in Fox's or Clark's model. In the first case, we have seen that it was a changein catchability with stock size, while in the second, Clark (1974) supposes that theschool size is reduced when the abundance decreases, which leads to an increase inrelative mortality by predation.
Let us review now the situation where interannual changes in aggregation are notlinked to stock abundance. In the Bay of Biscay, anchovies (Engraulisenerasicolus)are usually aggregated in clusters of small schools and their distance from the sea bedis at least 15 m. Masse et al. (1995) reported that in 1992 this pattern was completelydifferent and unlike anything previously observed by fisheries scientists or fishermen:the anchovies formed very dense layers, often in contact with the sea bed. Thischange, supposedly related to an unusually homogeneous vertical temperature profile.rnodified the catchability of the species. Another example is given by Mais (1977),who reported that northern anchovies (Engraulis mordax) of the California currentsystem are mostly located 10 to 50 m from the surface during daylight hours and aretoo small and evasive to fish profitably. The fish are available to the purse seine

Effects of Behaviour on Fisheries and Stock Assessment 229
---- 60.Q
0.7o0Cl.0 '-:.' --,:.' ..... -'.;..- ..-o~ 0.500
.D
*>,
0.30"D
6w:::l 0.1CL 75U 77
1000
----800
000
* 600~
~
c0
~ 400:J"D0I.-
CL
200
66
6010 20 30 40 50·
Effort (day * boat capacity)
O+--==;=--..:,-'..!----,--,--,....----,-----,----,---.----.--------,-----,--__.o
Fig. 8.25 Depensatory surplus-production model applied to the Chilean fishery-of anchovy (Engraulisringens) in the northern area, from 1959 to 1977 (redrawn from Drago & Yafiez, 1985).
fishery mainly when schooling densely at the surface, between midnight and dawn, fora period that lasts from 20 minutes to 7 hours, but which fails to occur some years orpersists only fora short period of several weeks. A highly favourable behaviouroccurs some years in late spring, when large dense surface schools form duringdaylight hours over the deep-water basins. A marginally favourable period for schoolcapture of this species occurs in the late winter when schools are moving offshore tospawn. Mais(l977) concludes that the success of the fishery in California is entirelyunrelated to overall abundance but depends instead on the erratic and unpredictable

230 Chapter 8
occurrence of favourable schooling behaviour. We present now a modelling approachof such interannual changes when the environmental factor responsible for suchchanges is known.
Surplus-production models can bemodified to take into account the influence ofenvironmental factors on both interannual changes in the catchability and carryingcapacity (equations 8.18 to 8.21), and the case for an influence onjust the catchabilitycoefficient (scenario a.) is a simplification of these equations when Boo is constant. Inthe linear production model it becomes (Freon, 1986, 1988):
CPUEe= q(V) Be= q(V) Boo - q(V)2 Ejh
=E CPUEe= q(V) BooE - «vi' E2jh
The MSY is constant in this model, unlike EM SY which is a function of V:
MSY = Boohj4
EM SY = Boohj2q(V)
(8.34)
(8.35)
(8.36)
(8.37)
Table 8.3 gives the set of final equations according to the choice of the q(V) functionand to the basic production model (linear, exponential or generalised).
It is not always easy to distinguish changes in catchability from changes in abundance in annual data series, and often the same data set can be fitted correctly todifferent classes of surplus-production model from a statistical point of view.Therefore it is recommended that the data series is analysed over a smaller time scale(month or trimester) and as far as possible ancillary data is used to choose the mostappropriate model from a biological and behavioural point of view. This model, andonly this one, might survive changes in the fishery and might allow reasonable shortterm prediction useful for management.
8.4.2 Influence of mixed-species schools on abundance indices
The major upwelling systems of the world are occupied by species communities ofthree to four main small pelagic species (Parrish et al., 1983) that have variabledegrees of interaction. We have seen that one of the consequences of social behaviour(section 4.9) was the formation of mixed-species schools. In those instances, it is quitedifficult to obtain reliable abundance indices for each species from the CPUE,especially for the non-dominant species which are not targeted by the fishery (butwhen there is not such a mixed-species school, the abundance index of some nondominant species can be less biased than the index of the dominant species).
In such circumstances it is common practice to use a global index of abundance fortwo or more species, in spite of a violation of assumption (I) of the surplus-production models (single stock). To a certain extent, this violation can be justified whenthe species forage largely at the same trophic level, which is generally the case inspecies schooling together (Medina-Gaertner, 1985). It must also be said that the

Effects of Behaviour on Fisheries and Stock Assessment 231
initial applications of the surplus-production approach were to aggregate stocks ofdifferent species (Graham, 1935).
Another approach is to compute separate CPUEs per species and per small spatialtemporal strata, using a threshold of relative abundance. Fonteneau (1986a)performed such a pilot study on eight multi-specific concentrations of tuna exploitedin the eastern Atlantic in 1981, based on 10 squares and five-day periods. An empiricalthreshold of 70% of the dominant species fairly discriminated effort targeted onyellowfin tuna from effort targeted on skipjack tuna, in contrast to the threshold of50% tested in a previous study (Fonteneau, 1978). This 70% threshold was used tocompute a series of abundance indices for the whole eastern Atlantic from 1971 to1981 and gave a more realistic (decreasing) trend than a conventional standardisedand deseasonalised CPUE (Fonteneau, 1986a).
A more objective way to substantiate abundance indices is to compare them, as didfor instance Wysokinski (1987) for the horse mackerel (Trachurustrachurus capensis),which is often mixed with other species in midwater trawls off Namibia. He comparedtwo CPUEs of two different fleets in the area with biomass estimates from VPA. Forthe first CPUE he used a unit of effort defined as the days fished when horse mackerelconstituted at least 30% of the daily catch of a given trawler. The second CPUE wasbased on hours fished regardless of the species. Only the first CPUE displayed apositive linear relationship with the biomass (Fig. 8.26). Nevertheless, the range ofvariation of the biomass was not very large (from 1.5 to 2.5 million tonnes) and therejection of days without catch during the computation of CPUE might overestimatethe very low levels of abundance. Therefore one must be very cautious when usingCPUE based on a threshold and it is recommended that the sensitivity of the
48
,-., 44>-o
-0
~ 40
~ 36n,u· 32
28
24
(a)
84 82
8~
84. 80
7978 ••
74
r=0,85
1,4 1,8 2,2
Biomass (10 -6 t)
2,6
9
8
7,-.,s:
~ 6w=:> 5n-u
4
3
2
(b)
81
83
75·
8f
77
r=-0,55
1,4 1,8 2,2
Biomass (10 -6 t)
80
2,6
Fig.8.26 CPUE versus biomass estimates by VPA on age groups 2-6 of horse mackerel (Trachurus trachurus capensisi in the Namibian Fisheries:'(a) fishing effort expressed as days fished when horse mackerelcatches are> 30% for standard 8-29 Polish trawlers; (b) fishing effort expressed as hours fished by USSRfleet (redrawn from Wysokinski, 1987).

232 Chapter 8
threshold is tested and trend analysis is performed on other variables (number of dayswithout catch, catch per set, etc.).
8.4.3 Influence ofaggregation on growth estimates and age-length key
All the structured models require the estimation of growth parameters and/or the agestructure of the population. This second goal is achieved either by a direct ageing ofsamples and an extrapolation to the whole population, or by a two-stage samplingusing the body length as an intermediate variable (Kimura, 1977). In this latter case,an age-length key is used to describe the statistical distribution of length at a givenage. It is supposed to be more efficient because it allows sampling to be concentratedon the less numerous, older year classes. The difficulty with all these techniques ariseswhen the samples used for ageing originate from individual schools, as in most pelagicfisheries (purse seine, midwater trawl, pole-and-line).
From fishery data on menhaden (Brevoortia tyrannus) , sardinella (S. aurita) andfrom simulations, Freon (1984) studied the variability in fish schools and cohorts. Thelength-frequency distribution within a fish school cannot be considered as representative of the length-frequency distribution of a cohort as a whole. As young fishgrow, the length variability increases more rapidly within cohorts than within schoolswith a similar mean length, especially before recruitment and if the period ofspawning lasts several months. On the other hand, for older fish the length variabilitydecreases within a given cohort as it gets older, but continues to increase in schools asthe mean length of fish in the schools increases (Fig. 8.27). The permanent increase inlength variability according to the mean length within schools arises from a constantcoefficient of variation of the size, probably in relation to the functional structure ofthe school (Chapter 4). As a result, schools of young fish represent only part of thelength distribution of a single cohort before recruitment. In contrast, schools of olderfish are made up of individuals belonging to different age classes, which school
5,-,
I/ ,,
I ,,II
4 I "0II ~o
C I 't'.l'.2 II
~-0 II";;; 3 I 4..
Q) Io?
U I
/ r : ..... ?<:-",U /1"- /10 2 "U /IC t t
/I0 /I
V; /I11
1111
1111
"/ ,~..~/ ~,.:... ",
0,,~
0 10 20Mean body length (cm)
Fig. 8.27 Diagram of the relationship betweenthe mean length and the standard deviation of thelength in schools and cohorts of gilt sardine (Sardinel/a aurita) in Senegal and menhaden (Brevooriatyrannus) in North Carolina, US (redrawn from
30 Freon, 1984). (-) Fitted observations; (- - - -)hypotheses.

Effects of Behaviour on Fisheries and Stock Assessment 233
together according to length similarity (Fig. 8.28). This is because of the higheroverlap in size between cohorts of older fish, which is mainly a consequence ofasymptotic growth. This difference in cohort number in the schools according tomean length can lead to serious sampling errors in age or length data from pelagicstocks. Consequently it can invalidate the resulting estimates based on these data. Anexample of the extreme difficulty of length data analysis is provided by the Senegalesepelagic fishery on S. aurita, where the combination ofschooling behaviour by size, thelong duration of reproduction and the permanent immigration/emigration in thefishing area keep the modal length frequency unchanged for 6 months, despiteextremely fast growth (19 cm during the first year). In similar cases, the use of anylength-based method is meaningless (Freon, I994b)..
age 0
c-,oCID:::J0IDL
u..
Body length
Fig.8.28 Theoretical diagram of frequency distribution of body length in schools and cohorts of pelagicfish (four year classes) (redrawn from Freon, 1985).
If time series of length distribution data are used directly to estimate the growth(Petersen's method or its derivations) or in other length-based stock assessmentmethods (VPA on length etc.), there is a risk that a modal length class corresponds tonothing else than an oversampled school. This risk is greater if this type of method isapplied to non-grouped samples, as is a common practice for studying growth ofyounger fish. To overcome this problem, it is recommended that the number of fishmeasured in each school is limited (around 30 individuals) and the number of sampledschools increased. The use of the age-length key gives rise to another kind of problem,especially if few catches per stratum are analysed so as to save on the costly work ofageing. From Fig. 8.28 it appears that samples from a given school made of two yearclasses will overestimate the mean size of the youngest fish and underestimate themean size of the oldest (e.g. schools BI and B2): the smallest fish of the school are thebiggest of the younger year class, and conversely the largest fish are the smallest of theoldest year class. This situation can be compared to the bias pointed out by Ricker(1975) when a size-selective gear is used: here the schooling behaviour plays the samerole as the selective gear. Different trials of estimation of the optimal two-stagesampling strategy have been performed, taking into account the relative costs ofageing and measuring. The results of these simulations show that in the case of short-

234 Chapter 8
lived pelagic fish of Senegal, the number of fish to age in order to get an acceptableprecision is over 10000, and that the advantage of the two-stage strategy over directageing is not obvious (Freon, 1985).
When the parameters of the growth equation are directly estimated from individualfish by reading their hard parts, different results can be obtained according to thesampling strategy. Simple random sampling of the catches will give an accurateestimate of growth for those year classes that are fully recruited and still abundant,but a poor estimate of the younger and oldest fish. This is especially true if the growthpresents a seasonality or departure from the classical von Bertalanffy growth equation, which requires an even precision in the range of age-length data (variousequations of seasonal growth are available in Pauly, 1997a). A better description ofthe growth will be obtained by systematic sampling of the range of sizes available irithe schools, even though this will overestimate the dispersion of the size around themean age.
Among the various density-dependent regulating factors that explain the naturalregulation of fish populations, variability in growth resulting from competition forfood is usually mentioned (Beverton & Holt, 1957; War, 1980). But Bakun (1989)proposed an additional explanation of density-dependent growth for schooling species: the effects of potential linkage of school size with population size. If mean schoolsize increases with stock abundance, the average supply of food per individual withinthe school will decrease. This condition will be met if the ratio of the volume of theschool toits cross-sectional area swept when it moves is proportional to the schoolsize. Bakun (1989) mentioned that this situation is likely to occur, even iflarge schoolsare strictly limited in the vertical dimension by external constraints, because bothhorizontal dimensions probably tend to increase or decrease together, 'excluding thecase where the length of the school axis parallel to its motion remainsconstant whileschool width,normal to the direction of motion, increases'.
Bakun (1989) underlined the fact that little information on school geometry wasthen available (except in the special case of20 giant bluefin tuna schools described byPartridge et al., 1983). Nowadays thisinformation is given by multi-beam sonars,while aerial observations provide knowledge on the orientation of moving schools. Inthe Catalan Sea (Mediterranean basin), for instance, following the three-dimensionalmeasurement technique used by Soriaet al. (1996), we have estimated the ratiobetween school length (maximum detected horizontal extension) and school width(minimum detected horizontal extension) and found a median value of 1.7. The meanratio between length and height (maximum vertical extension) was 2.8. The dominantspecies in this area was Sardina pilchardus. From aerial surveys to the south-east ofHokkaido island; Hara (1985, 1987) indicated that schools of Sardinopsmelanosticaare generally elongated in a direction perpendicular to the direction cif movement.These observed schooling behaviours compensate for the food limitation in largeschools and probably limit the effect of density-dependent growth related to schoolsize. In addition, for night feeders, the dispersion of fish during the night limits theeffect of competition for food inside the schools. Nevertheless, these observations-donotcompletely invalidate Bakun's hypothesis, especially because he also suggests thatother substances, such as dissolved oxygen, would need to be replenished where the

Effects of Behaviour on Fisheries and Stock Assessment 235
concentration may have been depleted, e.g. by respiration, in the rear part of theschool (McFarland, 1967).
In conclusion, the previous examples on the various influences of aggregationclearly indicate the need for behavioural studies to choose between different ethological hypotheses which can interfere with the biological parameter estimations, andtherefore invalidate the results of population dynamics estimates.
8.5 Influence of avoidance on abundance indices
The ability of fish to avoid gear may change diurnally or seasonally withoutany change in habitat. The circadian variation of catchability of midwater trawlsis well documented; the main factor is recognised as the variability ofavoidance according to light level (Nunnallee, 1991; see also Glass & Wardle, 1989,for bottom trawl). Suuronen et al. (1997) performed visual and acoustic observationson 1134commercial hauls of the Finnish fleet (mainly pair trawlers) fishing on herringoff the south-west coast of Finland. The authors indicate that avoidance reactions tothe midwater trawl occurred in 34% of the 493 hauls performed with fish observednear the trawl mouth, and they characterise some of these avoidance reactions. as'strong', resulting in escapement of most of the school. The proportion of strongavoidance reactions was significantly higher during daytime (16%) than at night(2%). Herring usually reacted less than 5m in front of the gear by swimming rapidlydownwards and returned to their earlier swimming depth as soon as the trawl hadpassed. .
Seasonal variation of avoidance reaction is often related to physiologicalchanges. The blue whiting (Micromesistius poutassou) is a small fish of the codfamily; its spawning habits in .theNorth Atlantic make it vulnerable to heavy fishing by midwater trawls towed at or below depths of 300--400 m. The fishing seasonis short and the ships need to be of large capacity and high powered to competewith the rest of the fleet (Anon., 1979; Monstad, ·1990). Herring hibernating inNorwegian fjords form huge schools of several hundred tonnes with a high packingdensity and have a lower avoidance than during other seasons. Because the wholestock is usually concentrated in one or two fjords, strict regulations are applied toavoid overexploitation and recently day fishing has been prohibited for large purseseines so as to limit the number of net bursts from overloading (Slotte & Johannessen, 1996).
The Atlantic herring in the Gulf of Maine region is more vulnerable to fixed gears(stop seine and weir) during the dark phases of the moon (Anthony & Fogarty,1985), probably owing to poorer vision and lower avoidance during these periods.The same. explanation certainly applies to the avoidance of gill nets according toturbidity (Cui et al., 1991) and probably bioluminescence, both factors known tovary seasonally.
The consequences of this periodic variation on abundance estimates are identical tothose presented in the section dealing with changes in habitat selection. They can beovercome by an appropriate use of the general linear model in most cases.

236 Chapter 8
8.6 Influence of attraction and associative behaviour onpopulation modelling
8.6.1 Influence ofattraction
Because the major factors influencing catch rate when fishing with light are themoonlight, the power of the lamps and their location relative to the sea surface, it isrecommended that they are incorporated in a general linear model aimed at estimating an abundance index. Unfortunately the necessary technical information is notalways available and there is currently a trend in the technology to increase the fishingpower (Potier & Sadhotomo, 1995), which can result in an overestimation of abundance indices derived from CPUE. An additional problem is the size selectivity ofattraction by light.As a result, only the smaller fish of the oldest available cohorts arerecruited, which can lead to growth-overfishing. Finally, difficulties appear whenestablishing growth parameters and an age-length key from the landed fish of fisheries, similar to those mentioned for the influence of aggregation.
In pole-and-line fisheries, the bait species and the quantity available play a role inthe catch rate and the species composition. This role is not quantified and notincorporated in abundance estimates, despite the likely effect of seasonal and interannual changes of the bait species.
In longline fisheries, attraction varies according to the type of bait, its soak time,itsmovement and the period of the day (see section 6.2), among other factors not relatedto attraction. In the best cases, only the period of fishing is known and can be includedin a gLM on CPUE, but because the gear remains submerged for a long time (12 to 24hours) this effect is not easy to take into account. Until recently, the species used forbaiting was fortunately the same one (Cololabis saira), at least in the Japanese, Taiwanese and Korean fisheries (Fonteneau & Marcille, 1988). But new species of baitare now being used and this change is not documented.
There is often a competition for the same bait ('gear saturation') because chemicalstimuli from the bait are able to attract the fish at long distance and/or because thefish are aggregated. The efficiencyof the long-line also depends on its orientation withrespect to the current but this information is seldom available.
Boggs et al. (1997) provided an interesting application of gLM and GAM models tothe Hawaii-based North Pacific longline fishery. The variance in CPUE of swordfishwas mainly explained by latitude and the number of light sticks per hook (amongother parameters related to temperature, temperature gradient, lunar index, etc.).These results confirm the necessity to take into account the gain in catchability arisingfrom the recent use of light sticks.
8.6.2 Influence ofassociation
The conventional indices cifabundance used in pelagic fisheries were defined mainlyfrom the experience gained on tuna fisheries. When fishing on artificial floatingobjects was not a common practice, the catch per unit of searching time was conesidered to be the most appropriate index of abundance for these fisheries (Greenblatt,

Effects of Behaviour on Fisheries and Stock Assessment 237
1976). Nowadays, the proportion of catches under artificial floating objects is predominant in many fisheries, and the yield depends more on the time necessary to finda floating object than on that to find a school. Of course this searching time for anobject is not related to the fish abundance, but the catch under an object, combinedwith the density of the floating objects, might reflect the local abundance. Clark andMangel (1979) proposed two classes of surplus-production model for the tuna surfacefishery in the eastern tropical Pacific Ocean (as well as derived models in appendices)~'
In Model A, tuna associate with a given 'attractor' (such as porpoise schools orfloating objects) at a rate (X'B proportional to the background population N, anddissociate at rate WQ, proportional to the current school size Q:
dQt/dt = elB,- ~Q, (8.38)
In this model, for a fixed B, the resulting equilibrium school size Q* is given by:
Q* = (X'B/W (8.39)
In model B, the maximum school size is a constant, Q'*, which is independent of thebackground population. Therefore equation (8.38) is replaced by:
d~, = (X'B, (1 - (Q,/Q'*))
These models are combined with the conventional Schaefer model (8.3):
dB, ",(It = kB, (I - Bt/Boo ) - {}
(8.40)
(8.41)
where 8 is the net rate of transfer to the surface population obtained from equations(8.38) or (8.39) according to the number of attractors K, the surface tuna populationS and the corresponding surface carrying capacity:
(Model A)(Model B)
(8.42)
(see Table 8.1 for other equations of these models). Clark and Mange! (1979) denoteelK as the 'intrinsic aggregation rate' or 'intrinsic schooling rate': If this intrinsic.schooling rate is less than the intrinsic growth rate of the' population (a'K < k) theequilibrium yield-effort curves for models A and B are similar, indicating that theyield approaches a positive asymptotic value as effort approaches infinity, whichmeans that the stock can never be overexploited (Fig. 8.29). On the contrary; when(X'K> k, model A indicates that the yield approaches zero for finite effort level and theshape of the model does not differ very much from conventional surplus-productionmodels (Fig. 8.30a). The worst situation occurs with mode! B: when schooling rate isgreater than the intrinsic growth rate, the yield undergoes a catastrophic transitionwhen effort exceeds a critical level Ec (Fig. 8.30b).
After Clark and Mangel's (1979) pioneer modelling, additional developments wereproposed by Samples and Sproul (1985) and Hilborn and Medley (1989), aimed atdetermining the optimum number of FADs and of vessels in a fishery. These modelsrequire field measurements of recruitment and loss of fish associated with FADs,

238 Chapter 8
(a)
Effort (E)
Fig. 8.29 Equilibrium catch-effort curves forequations 8.38 and 8.40, when the 'intrinsicaggregation rate' is lower than the 'intrinsicschooling rate' (IX'K < r). Models A (school sizeproportional to tuna abundance) and B (schoolsize independent from tuna abundance) providesimilar figures (redrawn from Clark & Mangel,1979).
(b)
\JQ)
>=
Effort (E)
Fig. 8.30. Equilibrium catch-effort curves forequation 8.40, when the 'intrinsic aggregation rate'is greater than the 'intrinsic schooling rate'(IX'K < r). Note that in this case (a) models A and(b) B provide different shapes (redrawn from Clark
. & Mangel, 1979).
which are at present roughly estimated. Nonetheless, Hilborn and Medley's modelwas tentatively applied to the skipjack tuna fishery of the western Pacific. Resultsshow that if the recruitment to FADs is proportional to the biomass not associatedwith FADs, then increasing the number of FADs beyond some limit will actuallydecrease the total catch. The model accounts for the fishing costs, including the costper FAD, but does not take into account catches of schools not related to the FADs('non-associated schools'), nor does it consider possible recruitment overfishing bythe incorporation of surplus production, as in Clark and Mangel's model. Despitetheir limitations, these models represent a substantial advance in modelling surfacetuna fisheries, but it is surprising how few applications they have generated so far. Inour opinion, the main reason is lack of knowledge on fish behaviour. Nevertheless, wehave seen in Chapter 3 that the increasingly widespread use of ultrasonic taggingbrings increasing amounts of information, especially on attraction distance and onfidelity to anchored FADs. If the same scientific effort were to be applied to theassociation of tuna with logs or drifting FADs, one could expect those models toreceive the attention they deserve.
The peak activity of setting on floating objects in the western Pacific occurs beforesunrise, and secondarily at dusk (section 6.3). It could, be interesting to enter in a gLMmodel a factor relative to the period of the day it;in equation (8.28) and a factorrelative to the type of set (non-associated school or log school) as practised in theInter-American Tropical Tuna Commission (lATIC). workshop in 1992 (Hall,1992b). Nevertheless, this precaution is insufficient because the time .spend searching

Effects of Behaviour on Fisheries and Stock Assessment 239
for floating objects is usually unknown, does not depend on the stock abundance, andvaries with the type of object (natural, artificial moored or drifting, set and owned bythe boat or not, etc.), In addition, fishermen attach a radio beacon to natural orartificial objects or use supply vessels drifting at sea or anchored on seamounts toattract and maintain schools (section 6.3.1). Finally, we have seen that the attractioneffect might change according to the type of object, even though this point is notsufficiently documented. All these factors represent a strong limitation to the use of asingle and simple gLM model for the whole fishing activity.
To overcome the difficulties linked to estimating abundance from fishing statistics,Fonteneau (1992) recommends the use of two separate gLM analyses: a conventionalone for non-associated schools, aimed at estimating the stock abundance from thecatch per searching time per stratum; and a second one for schools associated withfloating objects. This second gLM analysis would take into accountthe catch per setinstead of the catch per searching time - related to different factors such as the localfishing effort, the density of floating objects, their characteristics and any environmental variables influencing the efficiency with which the floating object will attractfish (e.g. water transparency). The results of this last gLM could better represent thelocal biomass by sector.
Nevertheless, Ariz et al. (1992), Fonteneau (1992) and Hallier (I 995)recognise thatone additional problem of the tuna fisheries using floating objects is related to the factthat the mean age of yellowfin and bigeye tuna associated with floating objects islower than the rest of the exploited population (unassociated schools or schoolsassociated with dolphins). Therefore assumption (2) of the surplus-productionmodels (the age groups being fished have remained and will continue to remain thesame) is not met if one wants to combine old data series with recent ones including amajor proportion of catches under floating objects. This problem is especially identified for some of the yellowfin and bigeye tuna stocks which are already heavilyexploited and will hardly support an increasing fishing pressure on the first year classowing to increasing use of fishing on logs. Multi-gear yield-per-recruit analyses wereconducted simultaneously on the three major species exploited by the eastern Atlanticfisheries (yellowfin, skipjack and bigeye tuna) by Ariz et al. (1992). Despite uncertainty concerning the level of exploitation, the results suggest that the log fisheryprovides an efficient way to increase the yield,especially for the skipjack tuna - whichis the dominant species caught under logs - because in the far offshore area thevulnerability of this species is dramatically increased by the use of drifting FADs.
8.7 .Influence of learning on stock assessment
We have seen in Chapter 7 that fish are able to learn, especially in relation to predation. There is growing evidence that fish are also able to learn about fishing gearsand tactics, probably in a way related to learning about predation. Predator recognition can be related to gear recognition, and predator avoidance to gear avoidance orescapement, despite some differences (see section 7.2.6 on maladaptive fish behaviour). In some cases, one-trial learning is likely to occur when the stress applied by

240 Chapter 8
fishing operations is huge. Finally, we mentioned the possibility of social facilitationin gear avoidance when experienced fish are mixed with naive fish. Let us see now howlearning might influence stock estimation by surplus-production models and bystructural models.
8.7.1 Influence oflearning on surplus-production models
To be effective at the stock level, fish learning related to fishing must be associatedwith a substantial rate of gear contact, and with a high rate of survival to suchcontact.
The importance of the escapement of small fish through the mesh of midwatertrawls or beach-seines is well known and depends on the mesh size relative to the bodyheight of the fish (e.g. Glass et al., 1993; Lamberth et al., 1995).But entire schools canescape a midwater trawl by movement in the vertical plane, usually by swimmingdownward when the gear is approaching (Suuronen et al., 1997). Fewer observationsare available for purse-seining. In Senegal, a limited number of in situ visual observations of Sardinella aurita during purse seining operations indicate that in many setsa substantial part of the school is able to escape the net before the purse seine closureis complete (Soria, 1994). In this fishery, as in most purse seine fisheries, the purseseine is set only in case of visual or acoustic detection of a school the biomass of whichis estimated to exceed a certain threshold (here around 1t). Nevertheless, the averageproportion of unsuccessful sets was around 20% from 1969 to 1987 (Freon et al.,1994).In addition, some unsuccessful sets result from unexpected behaviour of the netowing to current or to the rupture of some elements, allowing the fish to escape. Theaverage occurrence of such incidents in Senegal was 3% of the total number of setsover the same period. Tuna schools are probably also able to learn how to escapefrom a purse seine before the complete closure of the net. A yellowfin tuna school ofabout 100 tonnes escaped successively from ten purse seines within one hour (A.Fonteneau, pers. comm.).
The survival of fish avoiding or escaping a pelagic gear is far from negligible.Treschev et at. (1975) and Efanov(1981) studied the survival of Baltic herring (Clupeaharengus) escaping from a midwater trawl codend of 24-32 mm mesh sizes. Theyconcluded that about 90% of the fish survived after escaping. In contrast, the study ofSuuronen . et al. (1993, 1996a), performed on the same species, indicated that thesurvival was 10-40%. In another study, Suuronen et al. (1996b) found an even lowerrate of survival. Mortality did not depend on the mesh size or on the mounting of arigid sorting grid (except a slight decrease for larger fish) but was higher (96-100%)for small fish (12cm) than for large ones (12-17 cm; 77-100%) 14 days after theirtransfer to large holding cages. Mortality was mainly caused by loss of scales and skininfection. It is interesting to note the survival of the control fish in Suuronen et al.'s(1996a) experiment because to some extent it can be related to survival in purse seines.These fish were caught either by handline fitted with barbless hooks or by a smallpurse seine made of small-mesh knotless nylon netting and transferred in the holdingcages. The cumulative mortality of these fish reached only 9% in spring and 55% in

Effects of Behaviour on Fisheries and Stock Assessment 241
autumn. Similar results of high survival (93%) were obtained by Misund and Beltestad (1995) when transferring fish from a purse seine to a large net pen (> 1000m3
)
and storing them for 5 days. Very high survival rates were found during bottomtrawling by Soldal et al. (1993) on gadoids: around 90% for saithe (Pollachius virens)and haddock (Melanogrammus aeglefinus), while no mortality was observed on cod(Gadus morhua). Misund and Beltestad (1995) studied the survival of herring after twodifferent simulated net burst experiments by first purse seining a school, then transferring two groups of fish to two net pens: one for the experiment, the other as acontrol. The first net pen was pulled up by hydraulic power block until the net wastorn by the weight and force of the herring. In this extreme situation of successivestresses and compression, survival after a few days in two small net pens of differentsize (30 and 100m3 respectively) was very low (5% and 0%) and was mainly due tomassive scale loss (75% of the skin surface on the side of the fish). Nevertheless, in thisexperiment it is also interesting to note what occurred to the two control groupsbecause these fish also suffered stress and were damaged by the initial purse seiningoperation and during transfer to the control pen net, in a way equal to or higher thanfish escaping from the purse seine before its final closure. The survival rates were 2%and 88% respectively for the 30m 3 and 100m3 net pens and the surface of scale losswas 40% and 25%.·
Despite their variability, these results suggest that in a heavily exploited pelagicfishery, a substantial number of experienced fish will survive contact with the gear.Nevertheless, this experience is usually collective and many individuals from the sameschool are 'trained' atthe same time. Ifwe hypothesise that these fish have learnt howto avoid the fishing gear or to escape from it and that they are able to facilitate theavoidance of escapement of naive fish by social transmission, the remaining questionis: what is the rate of exchange between experienced and naive schools? The answerdepends on the turnover rate in schools and is related to the recurrent question ofschool fidelity.
Studies in school fidelity are scarce and give contrasting results. In tunas, fidelity isdemonstrated only in the special case of anchored FADs (section 6.3.1) and inminnows schools of few individuals observed in aquaria (Seghers, 1981). Fidelity wasalso observed on sedentary species living on coral reefs (McFarland & Hillis, 1982)orin bays of small lakes (Helfman, 1984). Moreover, several aquarium experimentssuggest kinship in small shoals of freshwater or coral species (e.g. Shapiro, 1983) andit has now been demonstrated by several studies that chemical cues are used to discriminate natural shoalmates from unfamiliar conspecifics (e.g. the study of Brownand Smith (1994) on fathead minnows Pimephales promelasi. Such kinship seemsunlikely to exist in pelagic fish, which spawn in groups and in the water column, andto a lesser extent in bottom spawners, because the ontogeny of schooling behaviouroccurs after the dispersal of the larvae. Nevertheless, the question of kin recognitionand school fidelity in pelagic fish is still open for three reasons. First, natal homingmight occur, at least for some of these species (section 3.3.1). Second, recent observations of Japanese sardine (Sardinops melanostictus) mating behaviour performed intanks and in situ indicates that, even in large schools, this species mates in single pairunits at night (Shiraishi et al., 1996). Third, intriguing deficiencies of heterozygotes

242 Chapter 8
have been obtained in Sardinella maderensis in West Africa by Chikhi (1995), similarto those obtained on the freshwater shiner (Notropis cornutus) by Ferguson andNoakes (1981). Chikhi suggested several possible explanations for these deficienciesof heterozygotes, one of them being kinship within schools.
Despite these uncertainties, it seems likely that the turnover rate in pelagic schoolsis large. Most in situ observations performed on coastal pelagic fish suggest that thereis a high rate of mixture between schools as a result of daily dispersal at night (eventhough dispersal is probably partial for large schools; Freon et al., 1996) and topermanent school splitting and merging under predation (Freon et al., 1993b; Pitcheret al., 1996). In addition, the high variability in growth performance suggests that fishborn at the same time are so heterogeneous in body length when recruited in thefishery that they will not be able to remain in the same school (Freon, 1984). Finally,notwithstanding the lack of quantitative data, we can conclude that the turnover inpelagic schools is high enough to significantly propagate gear-avoidance learning inan exploited stock.
The consequences of learning may be a long-term decrease in efficiency of thefishing gears, and resulting biases in the use of CPUE as indices of abundance. Forinstance, the conflicting results between the trends in long-line and purse seine tunafisheries of the eastern Pacific reported at the beginning of the 1970s (Hayasi, 1974)could be the result of learning. Similar observations were reported for the NorthAtlantic fishery on albacore (Thunnus alalungar by Shiohama (1978). The conventional linear surplus-production model can be modified to reflect a decrease of thecatchability coefficient q according to the fishing pressure during the previous years.We have simply used a linear function and simply apply the averaging methodrecommended by Fox (1975) in the case of conventional models of n exploited yearclasses toestimate E:
j=n-! j=n-I
qj = a - b [:E (n - j) Ei-j / :E (n - j)] = a - bEj=O j=O
(8.43)
(8.44)
(8.45)
where a and b are coefficients. Then, if we replace q by this function in equation (8.6)and replace the initial value of E by the same past-averaged fishing effort E (Fox,1975), we get:
CPUE j = (a - b E) Boo + (a - b EfE/h
Y, = «a - b E) Boo + (a - b E)2E/h) E,
The corresponding theoretical curve of production is very flexible and it can display abimodal shape owing to the power-four function of E. Nevertheless, this bimodalshape is obtained only when the variation of q is greater than two orders of magnitude, which is not realistic. When a more realistic variation ofq (less than one order ofmagnitude) is set (Fig. 8.31), a stock collapse is obtained by a slow decrease in production when optimum effort is exceeded (then the second mode of the productioncurve, which appears for E values much greater than the collapse value, is no longertaken into account). Similar figures are obtained by an age-structured model ofsimulation, which also provides figures where the production is asymptotic for

Effects of Behavi?ur on Fisheries and Stock Assessment 243
Effort
Fig. 8.31 Equilibrium catch-effort curves when thecatchability is a linear function of the fishing effort(equation 8.43, solid line) due to learning, compared toa conventionalSchaefer model (dotted line). (-) q = f(effort); (- - -) q = constant.
increasing effort. Fig. 8.32 is obtained assuming 'one-trial learning' for 5% of the fishescaping from the gear during fishing operations and a given stock-recruitmentrelationship following the Beverton and Holt equation (8.10). This situation theoretically prevents the stock from collapse.
The right-hand part of the curve in Figs 8.31 and 8.32 contrasts with the sharpdecrease displayed by the conventional linear model. It can be similar to that of theexponential model or of the generalised model for c values close to one. When thesetwo models were proposed in the early 1970s, they received great attention despite thefact that their basic equations were largely empirical and based on observations of
3500
3000
2500
2000
1500
1000
500
o
,I
II
I
I,,I,
IJII
I
I
\
\.\
\\I\
\
\\
I\\
\\
\
\
\
\\
\\\
\\
......
0.0. 0.5 1.0 1.5 2.0 2.5 3.0
Fig.8.32 Equilibrium catch-effort curves resulting from the simulation of an age structured model whendifferent proportions of fish learn how to escape the fishing gear ('one-trial learning'). From Freon, Laloe,Gerlotto and Soria (in preparation). (- - -) = No learning; (-) learning and a 6% level of escapees.

244 Chapter 8
case studies. Learning could be one of the major justifications for the superiority ofthese models over the linear model, even though in this case equation (8.44) would bemore appropriate. Nevertheless, we would definitely not recommend the general useof such models when the catch-effort curve does not suggest overfishing, becausemany other factors might give an opposite bias to fish learning. Two such factors arefishermen's learning and constant improvement in fishing technology, both of whichcan compensate for fish learning and usually result in an overestimation of theabundance during overfishing periods, which in turn leads to catastrophic management mistakes. In case of doubt, the precautionary approach must be used (Garcia,1994).
8.7.2 Influence of learning on intraspecific diversity and stock identification
Social facilitation during spawning migration or natal homing - which may occur inpelagic fish more frequently than expected - might favour intraspecific diversity(Chapter 7 and section 8.7.4). Overfishing such composite stocks might result in a lossof genetic diversity if the different substocks suffer different fishing pressures and/ordisplay different resilience levels in response to exploitation (Sharp, 1978a; Hilborn,1985).Cury and Anneville (1997) reviewed many composite pelagic stocks and noticedthat once a spawning site has been abandoned or fished out, it takes a long period oftime to be reoccupied by following generations. One of the most convincing examples isthe bluefin tuna (Thunnus thynnus thynnus). This species is strongly suspected ofperforming natal homing in two separate nurseries (south central Mediterranean Seaand Gulf of Mexico) and the spatial distribution of the catches has displayed dramaticchanges, with some traditional fisheries disappearing. Cury and Anneville (1997)suggest that the elimination of substocks by overfishing is responsible for long-termdecreasing productivity (Fig. 8.33), as observed by Beverton (1990). This last authorreviewed nine pelagic stocks experiencing collapse and recovery and noticed that onlyone had fully regained its original size. We present now in more detail differentscenarios ofoverfishing followed by a return to a suboptimal effort in the example of anassemblage of seven substocks having different MSY and EMSY.
In the first scenario, the exploitation rate of each substock at the time of maximumoverfishing (1.8 fold total EMSY) is proportional to its EMSY (Fig. 8.34a). In this idealsituation, the total production curve is reversible: once each substock is overexploited up to 180% of its own EMSY, the total production is again able to reach itsinitial maximum when the total effort is decreased. Such a situation is likely to occur ifthe fish from the different substocks have a density proportional to the abundance oftheir substocks and are equally available to the fishery (randomly mixed on the samefishing grounds or separated on equally accessible fishing grounds). This scenario canalso occur, but with more difficulty, when the density of each substock is not proportional to its abundance, if the substocks are exploited mainly when they do notoverlap (e.g. during reproduction) but are still equally available to the fishery. In thissituation, the fishery should first exploit the substock with highest productivity, butthen, long before reaching the total collapse of this substock (2.0 EMSY) , fishermenought to shift part of the effort toward less productive but less exploited substocks so

Effects of Behaviour on Fisheries and Stock Assessment 245
Intensificationof the exploitation
•
Seven populations
Four populations
~Fishing effort
)
Collapseof threepopulafions
Fig. 8.33 The erosion of the intraspecific diversity may affect the productivity of the fisheries as thedisappearance of populations under an intense exploitation (from seven to four populations) can have adetrimental effect on long-term marine fish catch. The associated decreasing productivity is illustrated bythe catch-effort diagram where two catch levels are possible for a given fishing effort according to the twostocks' composition (for the higher level the stock is composed of seven populations and for the lower levelof four remaining populations). (Redrawn from Cury & Anneville, 1997).
as to maximise their profits. At the end, these permanent small shifts of fishing effortfrom one substock to another will lead to roughly equal levels of exploitation among the different subunits. Mathisen (1989) proposed such a scenario for the anchovetastock off Peru.
In the second scenario, the fishing effort on each substock is proportional to theircatchability and strictly proportional to individual EM SY . Therefore all substocks willcollapse, starting from the substock having the lowest EM SY, except the one with the
_highest EM SY which will reach 1.8 EM SY (Fig. 8.34b). This situation might theoretically occur if individuals from different substocks are not mixed when they areexploited. They can be separated either at the level of the schools of different meanbiomass (bigger schools of a substock providing higher catchability), or clusters orfishing areas having different fish density but equally available to the fishery.
In the third scenario, which is the most realistic, the exploitation rate is randomlydistributed among the substocks. Then the shape of the total catch-effort curve willdepend on the allocation of fishing effort on the different substocks and Fig. 8.34c isonly one of the possible realisations. When coming back - to the suboptimumexploitation period after overexploitation, the exploitation rate -of a given substockwill possibly increase (e.g. substock 2) despite a general decrease of effort. In thissituation also the total production is not reversible, but the loss of production wheneffort is then decreased to its optimum value is less than in the previous scenario.

246 Chapter 8
7000 (a)6000
5000c:0
4000·13::;,"0ea. .. ;. ..... - .... --.
-1000
6000
5000
c: 40000
"133000::;,
"0ea.
2000
1000
0
6000
Effort
(b)
Effort
(c)
_. - SUb-stock 1
- ... - - Sub-stock 2
-- Sub-stock 3
_ ...- Sub-stock 4
- - - Sub-stock 5
~ Total forincreasing effort
Total for'" '" decreasing effort
c:o
.t5::;,"0ea.
Effort
Fig.8.34 Representation of theoretical situations of overexploitation (solid lines until 1.8fMSY of the totalstock) followed by a reduction of the fishing effort (broken lines) of a stock made of five substocks: (a)exploitation rate of each substock at the moment of maximum overfishing (1.8 EM SY) is proportional to itsEMSY; (b) fishing effort on each substock is proportional to their catchability and therefore to individualEMSY if EMSY is strictly proportional to q; (c) the exploitation rate is randomly distributed among thesubstocks. .

Effects of Behaviour on Fisheries and Stock Assessment 247
The problem of assessment and management of such substock assemblages issimilar to the mixed-species fisheries, especially when these species are competitorsrather than predator and prey. Conventional surplus-production models cannot beused because assumption (I) on stock unity is violated. An optimal total effort can becomputed according to different constraints (optimal yield, biodiversity preservation,etc.) as proposed by Murawski and Finn (1986) for the trawl fisheries exploitingdemersal fish stocks on Georges Bank, US (see also Polovina, 1989). But of coursesuch methods require an identification of the commercial catches from the differentsubstocks, which is usually not possible routinely. At present the first step is toidentify stock-by-stock the existence of such an assemblage ofgenetically independentsubstocks mixed in' a single exploited stock, to validate the generalisation of thisconceptual framework. This can be done by tagging spawners or by studies of thegenetic diversity on microsatellite DNA of larvae and adults so as to assess theimportance of this problem. Such a study was performed by Ruzzante et al. (l996b)for the identification of inshore and offshore Newfoundland overwintering substocksof cod, separated bya few hundred kilometres in winter but intermingled inshoreduring the summer feeding period. Itis also possible to study indirectly the overfishing of substocks .by episodic surveys aimed to quantify loss of genetic diversity,even by methods less expensive than microsatellite DNA. For instance, a significantdecrease in the heterozygosity of loci was observed in the orange roughy (Hoplostethus atlanticus) stock off New Zealand in a six year period corresponding to a 70%decrease of the virgin biomass (Smith et al., 1991). Nevertheless, the authors did notretain the hypothesis of elimination of substocks, but instead interpreted their resultsas the consequence of the removal of the oldest - and therefore most heterozygousindividuals by the fishery. This interpretation is probably right for such long-livedspecies, but the same method is more likely to identify possible elimination of substocks in short-lived species such as small pelagic fish. The second step is then to studythe possible colonisation of spawning sites either by a few survivors from the originalsubstock, or by strays from neighbouring substocks (particularly if there is anincrease in abundance of one of these substocks owing to changes in environmentalconditions or decrease of fishing effort). Such information is necessary to infer theresilience of a given pelagic stock to overexploitation, and particularly its ability torecover from collapse.
8.7.3 Influence of learning on structural models
If the oldest fish are more experienced with fishing gear because of higher cumulativenumbers of contacts with the gear, their fishing mortality may be lower than expected.This will affect structured models using the backward approach because they requirean a priori estimate of the fishing mortality of the oldest age groups ('terminal F'). Thecorresponding error in this estimate will propagate in the vector of mortality, especially when the exploitation rate is low (Pope, 1977; Mesnil, 1980; Bradford &Peterman, 1989). From a sensitivity analysis of VPA and yield per recruit, Pelletier(1990) indicates that terminal F plays a major role in both cases, especially for recentyears estimates in the case of VPA.

248 Chapter 8
We would like to give here a more optimistic note on the potential role of learningwhich is not completely reflected by surplus-production models. If we assume (orbetter still, have evidence) that older fish have a very low catchability coefficient,learning should prevent the stock from collapse owing to the high fecundity of thesespecimens out of reach of the fishermen. Unfortunately it is likely that fishermen'sskills and advancing technology compensate for (and possibly interact with) fishlearning. This is obvious when a fishery starts to exploit a stock (or use a new gear). Inthe Senegalese pelagic fishery for instance the CPUE increased steadily from 7 to 32 t10h- l from 1962 to 1967 despite a decrease of the upwelling index and an increase ofthe fishing effort (from one to three purse seiners) which both were supposed todecrease the abundance (Freon et al., 1994). Therefore, despite the likely effect of fishlearning on stock viability, the precautionary approach must remain the rule.
8.7.4 The strength ofparadigms
Some of the shapes of the catch-effort relationship obtained from surplus-productionmodels incorporating learning (Figs 8.31 and 8.32) or an assemblage of substocks(Fig. 8.34) might look unfamiliar to fishery biologists. These models might appear incontradiction with the paradigm implicit in the conventional linear productionmodels under equilibrium conditions: a collapse must occur if the fishing effortreaches a value close to twice the effort level necessary to obtain the maximumproduction (MSY). Despite the present disfavour of the conventional surplusproduction models (mainly owing to failures related, to the violation of basicassumptions), they have been successfully applied in the assessment of fish stocks andwe think that the above-mentioned paradigm has some biological justification.Nevertheless, wethink that the generalisation of this paradigm is not likely. We havementioned previous attempts to give more flexibility to the catch-effort relationship,but only the exponential model (Garrod, 1969; Fox, 1970) received significant
. attention. This model provides a slower decrease of the catch than the linear modelwhen Em sy is exceeded, but the improvement of the quality of the fit does not alwaysresult from the different shape of the catch curve. The improved fit obtained with theexponential model often comes from a reduction of the variance of the highest CPUEsowing to the logarithmic transformation of the data. The exponential model is not sodifferent from the linear model, contrary to the high flexibility of the generalisedmodel of Pella and Tomlinson (1969). The generalised model has been widely usedand was promoted by the computational facilities provided by Fox (1975), whoproposed the PRODFIT software.
Nevertheless, a survey of the literature indicates that papers presenting results fromthe generalised model either mention a use with the option of constraining theparameter m to fix values equal to 2 (equivalent toa linear model) or to 1 (equivalentto the exponential models), or a result where the software itself fitted m to values closeto I or 2 (example of exception: Guerrero & Yafiez, 1986). There are two interpretations of this observation. The first one is that it demonstrates that most stocksobey a linear or exponential model and that learning always has a secondary effect, oris counterbalanced by faster learning of fishermen and technological improvement.

Effects of Behaviour on Fisheries and Stock Assessment 249
The second one is that it only demonstrates the strength of a paradigm, largelybecause alternative values of m, especially outside the interval 1-2, were not supported by theoretical considerations. As a consequence, we suppose that scientistsfinding such results would be reluctant to publish them, if there are likely to be difficulties having them published owing to referees' caution. In addition, we havementioned that the situation where catchability could be a function of effort waslikely to occur in passive-gear fisheries, i.e. not in the major commercial fisherieswhich are the most studied.
We suggest that learning could be one explanation for departure from the conventionallinear models. We have seen that in the catch curve obtained from equation8.43 (Fig. 8.31), the stock collapse could occur with effort values much greater than2Emsy. We have already mentioned other possible explanations for such a departurefrom the conventional linear model, and underlined that the weak point of the surplus-production models is that several causes might give similar shapes to the catcheffort function. This results from the oversimplification of the surplus-productionapproach and/or from undetected violation of the basic assumptions (inaccessiblepart of the biomass, exchange with an underexploited substock, or collapse of unidentified substocks). Despite these restrictions, we encourage scientists who find suchindications of effort-related learning to report them. The comparative approach is away of validating a new concept.
8.8 .Conclusion
We have shown in this chapter how different the causes of biases or errors inpopulation dynamics related to fish behaviour can be.Some of these problems can beeasily resolved by a proper use of conventional tools of population dynamics. This isparticularly the case for the periodicity in the data (circadian, weekly, moon cycle,seasonal) and for some of the spatial effects. If these factors do not interact with theannual effect, a proper abundance index can be obtained from a general linear model.The three most difficult problems are the interannual change in catchability, theeffects of aggregation and the identification of a unit stock.
Interannual change in catchability can be due to different reasons such as change instock abundance, environmental change, the combination of these two changes, etc.As a result, conventional models are not able to distinguish a change in catchabilityfrom a change in recruitment, which can be easily shown by simulation (e.g. Fonteneau, 1986b).
The effects of aggregation are numerous and vary according to the scale (school,cluster, population). Fishermen only exploit a selected part of the structure, which isthe easiest available with the highest yields. Few gears are designed to catch dispersed fish, and fisherman resort to more efficient alternatives. This enables them tocatch large schools located in the right tail of the positively skewed frequency distribution of school size occurring in the largest clusters. In addition, they tend toexplore more intensively areas located nearest the harbour. Then we need to studynot only fish behaviour, but also how fishermen's behaviour is adapted to it. The

250 Chapter 8
tuna fisheries suffer from a specific problem related to the association of tuna withfloating objects.
Finally, it is difficult to verify if theassumptionofa single unit of stock - commonto all approaches - is respected, and if not to relax it. In many instances, a single stockis erroneously modelled as several independent stocks or, more frequently, severalstocks are confounded in a single one. As a result of this second mistake the overexploitation of one of several single stocks cannot be detected by any model. Thisproblem can be solved by a better knowledge of the species distribution and itsmigratory pattern in relation to the fishing effort distribution, and by high resolutiongenetic studies.
In most cases, appropriate solutions to correct those biases, errors or violations ofassumptions do exist, even if they are not perfect, but few authors use them. This ispartly due to the dominance of some conventional methods and to the strength ofparadigm. But a likely additional reason could be that these methods require adetailed understanding of the behavioural mechanisms, which is not always available.There are good reasons to hope that the progress now' being made in the understanding of fish behaviour and spatial structure (especially at medium and large scale)will favour the use of such approaches, the creation of new ones or the transfer ofexisting approaches to fishery biology (e.g. GIS (geographic information system);Meaden & Do Chi, 1996). For that purpose, modern techniques of observation, suchas acoustic tracking, multi-beam sonar, archive and 'pop-up satellite' tags, bothstoring data for several months (Block et al., 1997), electronic microchip hook timers;remote sensing, and amplified mitochondrial DNA analysis are of major interest. Atthe same time, more information on fishermen's strategy and tactics must be col-.lected, as fine time and space scales. Then, but only then, additional simulations(including the IBM approach) can also be very useful in better understanding fish andfishermen's behaviour from new input provided by in situ data. I turn these simulations will provide new insights and stimulate additional field research.
Conventionalacoustic studies are also of interest for a better understanding of fishbehaviour and for direct estimation of biomass independent from the indirectmethods of assessment reviewed in the present chapter (except when ASA models aretuned by acoustic data). Acoustic surveys suffer also from biases and error owing tofishbehaviour, but - as we shall see in the next chapter -the most important problemsin acoustics come from behavioural traits different from those mentioned in thischapter.

Chapter 9Effects of Behaviour on Stock Assessmentusing Acoustic Surveys
9.1· Introduction
The hydroacoustic method for estimating abundance of fish was mainly developedduring the last three decades of the twentieth century. The basis for the method waslaid by the invention of ttte echo integration system (Dragesund & Olsen, 1965), andinitial studies of the reflecting properties of the fish (Midtun & Hoff, 1962; MacCartney & Stubbs, 1971; Nakken & Olsen, 1977). During the 1980sthere was a rapiddevelopment of computerised echo integration systems (Bodholdt et al., 1989;Dawson & Brooks, 1989), accurate calibration procedures (Foote et al., 1987), andsophisticated post-processing systems (Foote et al., 1991).
Despite its rather recent development, the hydroacoustic method is widely used forproviding fishery independent estimates of fish abundance. Many of the mostimportant pelagic stocks of blue whiting, capelin, herring, sardinella and pilchard aresurveyed by this method. However, due to the many uncertainties connected with themethod, especially related to fish behaviour, the abundance estimates are mostly usedas relative indices to tune structured assessment models by which the stock assessments are made (see section 8.2.2). For a short-lived species such as capelin, whichdies after spawning, the acoustic abundance estimates are considered absolute, andthe stocks assessed accordingly (Vilhjalmsson, 1994).
In this chapter we will consider effects of fish behaviour on acoustic abundanceestiinates,starting with a short description of the basic principles of the hydroacousticassessment method. A complete introduction to the method is given by MacLennanand Simmonds (1992).
9.2 The hydroacoustic assessment method
The sound intensity (10) of a pulse emitted from an underwater transducer decreasesdue to geometrical spreading and absorption as it propagates through the sea. Thesound intensity (I) returning to the transducer from a fish density ofN individuals perunit volume at a certain range (R) in the sea, is expressed by the sonar equation(Forbes & Nakken, 1972; Burcynski, 1982):
1=10 , (ct/2) . !b2(9,cp)dn . e-21lR • R-2. (cr/41t) . N (9.1)

(9.2)
(9.3)
252 Chapter 9
where c = speed of sound underwater (~ 1500m/s), t = duration of sound pulse(~ 0.001 s), b = beam directivity -function, e= angle relative to the acoustic axis,<p = angle relative to a reference plane through acoustic axis, Q = solid angle,~ = attenuation coefficient, and a = back scattering cross section of the objects (rrr'),
The transmission loss due to geometrical spreading is-two way, which means thatthe total geometrical spread equals R4
. A compensation equal to R4 is therefore usedduring target strength measurements of single fish or of solid spheres during calibration of the echo integration system. When a sound pulse emitted from thetransducer propagates through the sea, the area of the pulse increases with range at anamount equal to R2.The larger the area of the pulse, the greater the number of fish ina layer with constant density that may be insonified. To correct for this rangedependency in the number of fish that may be insonified, the compensation fortransmission loss is reduced from a factor proportional to R4 to a factor proportionalto R2. To compensate for the transmission loss due to both geometrical spread andabsorption during echo integration surveys for fish abundance estimation, thereturning intensity is magnified by a time-varied gain function equal to R2·e2~R.
In an echo integrator the voltage (Y) of the returning signals is squared andsummed over defined range intervals to give an output (M) according to theequation:
M = J(R2. e2~R . y 2)dR
= J (R2 . e2~R . K· G· I)dR
where K = receiving voltage response, and G = gain function.-If the echo integration unit is calibrated by the use of a metal sphere with known
backscattering properties (Foote et al., 1987), the echo integrator output can beconverted to fish density per unit area (PA) by the equation (Dalen & Nakken, 1983):
PA= (CI!a) . M= sA/a
where Cl = calibration constant of the equipment, M = echo integration output (mm/nautical mile), and SA = area back scattering coefficient (m2/(nautical miler').
During surveys, the echo integrator is set to produce outputs for predetermineddepth channels over a certain distance sailed (e.g. 0.1 nautical mile, I nautical mile or5 nautical miles). The integrated output has to be partitioned to actual speciesaccording to fishing samples or other means of identifying the recordings (Dalen &Nakken, 1983). The number of fish of a given species in an area surveyed can then befound by multiplying the area density of the species by the distribution area.
9.3 Effects of habitat selection
Conventional acoustic assessment requires that fish be distributed from a few metresbelow the surface to a small distance ofT bottom (Mitson, 1983). An echo sounder

Effects of Behaviour on Stock Assessment using Acoustic Surveys 253
transducer is normally mounted in the bottom of the hull at a depth of 5-6 m on largesurvey vessels. For technical reasons the echo integration process is set to start 4-5 mfrom the transducer. Therefore, when surveying with large vessels there is an upperdead zone near the surface of about 10m (Aglen, 1994). Similarly, there is a bottomdead zone because the resolution of the acoustic beam near the bottom is dependenton pulse length, beam width and bottom depth (Ona & Mitson, 1996). Species livingpermanently close to the surface or on the bottom must therefore be assessed by othermethods. Fish schooling near the surface may be recorded by horizontal guided sonar(Hewitt et al., 1976; Misund, 1993a), and abundance indices of bottom fish areobtained by trawl surveys (Gunderson, 1993).
Several economically important species like cod and pollack live semipelagically,and to obtain the best possible coverage in such cases a combination of acoustic andtrawl surveys is applied (Wespestad & Megrey, 1990; Gode 1994). A substantialdifficulty for this approach is that the degree to which such species are distributeddemersally or pelagically may vary locally, seasonally and from year to year (God", &Wespestad, 1993). Diurnal variation in availability of semi-pelagic species to thesampling gear may indirectly influence acoustic abundance indices (Engas & Soldal,1992). On certain occasions, semi-pelagic fish may also choose to be either completelydemersal or pelagic (Gode & Wespestad, 1993). Similarly, species usually livingpelagically, like herring, may on certain occasions distribute themselves so close to thesurface or bottom that they become inaccessible to conventional acoustic assessment(Jakobson, 1983; Misund & Aglen, 1992).
The air-filled swimbladder accounts for about 90-95% of the backscattering crosssection of fish (Foote, 1980a). The swimbladder can be open (physostomous) orclosed (physoclist). The physoclist species like the gadoids have a rete mirabile whichis an organ for secretion/resorption of gas from the blood to the closed swimbladder.However, the buoyancy-regulating process is slow, andphysostomous fishes are notbelieved to be neutrally buoyant though they often perform substantial diel verticalmigrations (Blaxter & Tyler, 1978). Such migrations may affect the swimbladdervolume and thereby also the backscattering cross section of the fish. Nevertheless,Harden Jones and Scholes (1981) estimated that the effect of varying swimbladdervolume and thereby backscattering cross section through vertical migrations ofphysoclist fishes was probably less than that of tilt-angle-induced variations in theback-scattering cross section.
Physostomous species like the clupeoids lack a gas-producing organ. Mostphysostomous species have a posterior canal from the swimbladder to the oesophagus, and an anterior canal from the swimbladder to the anus (Blaxter & Batty, 1990).It is therefore supposed that the swimbladder is filled by swallowing air at the surface;even to such an extent that an above atmospheric pressure is built up in the swimbladder (the big gulp hypothesis, Thorne & Thomas, 1990). However, opening ofphysoclist swimbladders of fish caught at shallow depths often indicates a substantialgas pressure in the swimbladder that is difficult to explain just by swallowing.Nevertheless, the physostomous fishes are often characterised by substantial dielvertical migrations which undoubtedly may affect the back scattering cross section.Ona (1990) found that the swimbladder volume of herring followed a depth relation

254 Chapter 9
according to Boyle's law, and Halldorsson and Reynisson (1983) and Olsen andAhlquist (1989) found a certain reduction in the backscattering cross section ofherring withincreasing depth. Acoustic and photographic observations indicate thatthis can be the case for Norwegian spring spawning herring when hibernating in thedeep fjords in northern Norway (Huse & Ona, 1996). Herring distributed in deepwater (300-400 m) seem to adapt a rise and glide strategy to compensate for theirnegative buoyancy. Such swimming results in bimodal tilt angle distribution which inaddition' to reduced swimbladder volume when at great depth should result in areduced backscattering cross section of herring (Huse & Ona, 1996).
9.4 Effects of social behaviour
As described in Chapter 4, fish can distribute and behave individually, assemblesocially in shoals (for instance during feeding and spawning), or swim in synchronisedand polarised schools (Pitcher, 1983). These behaviour patterns determine to a largeextent the volume occupied by the individuals in a stock (Pitcher, 1980), and consequently have significant influence on sampling.
9.4.1 Distribution function ofdensities
Some fish species live mostly individually, others aggregate in shoals, while thehighest densities are formed by species that organise themselves into schools. Theaggregative behaviour induces a large dispersion and skewness in the distributionfunction of the data collected, both for direct and (or indirect sampling methods.This is especially evident when the fish assessed is schooling (Aglen, 1994). Theconfidencelimits of the estimates when using classical statistics may therefore bevery large, but are usually supposed to conform to the central limit theorem, andtherefore the two first moments (mean and variance) of the distribution functionare still finite.
However, there are examples where the distribution function of the data sampleddoes not have these properties, but instead an infinite variance (Levy, 1925).In such acase, an increase of the sampling rate has a limited effect on the precision of theestimator. The distribution function ofdata from 18acoustic surveys in tropical areasresembles that of a Pareto distribution with an infinite variance (Freon et al., 1993c).Even though curve fitting using the likelihood approach was not perfect fOT thehighest values ofbiomass, the results suggest that the arithmetic mean of the samplesmay not give a good estimate of the population.
9.4.2 Target strength
To convert the echo integral over a specific depth interval and distance sailed it isnecessary to know the backscattering cross section (er) of the fish. In classic literatureof underwater acoustics this quantity is usually referred to as the target strength (TS)of the fish,and is defined (Urick, 1983)as TS = 1010glO (er/41t). The target strength of

Effects of Behaviour on Stock Assessment using Acoustic Surveys 255
fish can be measured experimentally on tethered, anaesthetised individuals (Nakken& Olsen, 1977), on live fish in cages (Edwards & Armstrong, 1983) or in situ by thedual beam or the split beam technique (MacLennan & Simmonds, 1992). The variousmethods for target strength measurement of fish and the results obtained are reviewedby Foote (1987).
Social aggregation affects the orientation of fish. The tilt angle distributionis supposed to become. narrower and the mean more horizontal when fishare schooling, compared to when they are shoaling. The result is probably ahigher average target strength for fish schooling than for fish shoaling (Foote, 1980b;1981). This indicates a diurnal variation in target strength which has been observedfor caged cod, herring and mackerel (Edwards & Armstrong, 1983; MacLennan et al.,1989, 1990; MacLennan, 1990). The variation is especially large (about 5 dB) forAtlantic mackerel because this swim bladder-less species tilts upwards at low swimming speed when shoaling at night to keep an upward hydrodynamic lift (He &Wardle, 1986).
According to these findings, different target strength values should be applied forfish that school during the day and shoal at night during acoustic surveys. This is notyet practised because the validity of applying cage measurements to wild fish isquestioned (MacLennan et al., 1990). However, there are several indications ofdiurnal changes in social aggregation patterns of fish thataffect their orientation andthereby target strength. Tilt angle measurements of herring in a large net cage (Be1testad, 1974) and when free swimming (Buerkle, 1983) showed a change from slightlynegative tilt during daytime to slightly positive tilt during night-time. For walleyepollock (Theragra chalcogramma), the target strength has been observed to be 3dBlower by night than by day (Traynor & Williamson, 1983):
Due to the difficulties in measuring target strength in dense aggregations in situ, thenecessary information to differentiate target strength between. the different socialaggregation patterns is at present lacking (Foote, 1987). One possibility to overcomethe problem is to measure the tilt angle of fish when passed over by a survey vessel,both when schooling and when shoaling, by using a special tag (Mitson & Holliday,1990). The average target strength can be calculated according to the swim bladdermorphometry of the species and the tilt angle distribution observed (Foote, 1985).This may also be done directly from the tilt angle distribution if the scatteringproperties of the species are known (Foote, I980b).
An independent estimate of the target strength of fish in shoals or schools may beobtained by the comparison method. The principle is first to transect a shoal or aschool with an echo integration' system to obtain an estimate of the area backscattering cross section (SA), and then capture a known part of the shoal or the wholeschool by purse seine to obtain an independent estimate of fish density. The backscattering cross section (0') can then be found by rearranging equation (9.3). Themethod has been applied to obtain estimates of target strength of herring both whenshoaling at night (Hagstrern & Rettingen, 1982; Hamre & Dommasnes, 1994) andwhen schooling during the day (Misund & Beltestad, 1996). At present, the variationin the data collected by this method is too large to reveal any systematic difference intarget strength when shoaling or schooling.

256 Chapter 9
9.4.3 Acoustic shadowing
The conventional echo integration method has been experimentally proven to belinear (Foote, 1983), which means that the acoustically measured density and the realdensity are strictly proportional. This principle was found to be valid for measurements of herring about 27 cm long in a 0.7 rrr' cage at densities up to about 60 fish m"(Foote, 1983). Free-swimming herring of this size usually organise schools at anaverage density of about 2 fish m-3 (Misund, 1993b). Rettingen (1976) observed alinear proportionality between echo intensity and fish number up to a density ofabout lOO individuals m" for saithe about 35cm long and about 2000 individuals m-3
for sprat about 10cm long held in a net cage of about 2.7 m'. For higher densities, thelinearity decreased steadily and even declined for extremely high densities. For thesaithe measurements, Foote (1978) was able to deduce the mean extinction crosssection of the fish. Thereby the observed relationship between echo intensity and fishdensity could be reproduced fairly accurately as a function of the backscattering crosssection and the extinction cross section (Foote, 1978).
However, in natural fish aggregations that have a high density and a large verticalextent, substantial extinction of the sound energy emitted from an acoustic transducercan occur (Lytle & Maxwell, 1983). This is often observed during surveys by aweakening, and in some cases disappearance, of the bottom echo under large denseschools. Olsen (1986) quantified the effect of shadowing by a fish school on the echoenergy of a calibrated sphere.The energy decreased to 15% of its nominal value whenthe fish school passed between the transducer and the sphere. Similarly, Armstrong etal. (1989) demonstrated a linear relationship between the acoustic cross section ordensity of fish in a cage and the extinction of the echo energy of a reference spherebelow the cage. Appenzeller and Legget (1992) suggested that sound extinction whenfish occur in dense schools may cause an underestimation of biomass by up to 50%.For acoustic stock assessment the consequence of such extinction is underestimationof the fish density, but still the phenomenon has been neglected in survey work asadequate methods to compensate for the extinction have been lacking.
As an additional theorem to the linearity principle, Foote (1983) suggested anequation involving knowledge of the fish density and extinction cross section tocompensate for the extinction. Similarly, Lytle and Maxwell (1983) proposed threeapproximations to correct estimates of high density, all involving knowledge of theextinction cross section. As this parameter is difficultto quantify at sea, Olsen (1986)suggested that the extinction problem might be overcome by measuring the packingdensity in a small upper part of the school and applying this as the average density forthe whole school. The validity of this correction might be affected by an increase inpacking density of subsurface schools when passed over by a research vessel (Gerlotto& Freon, 1992). By recording the attenuationin the bottom echo as a function of thevertical extent of herring aggregations in a Norwegian fjord (Fig. 9.1), Toresen (1991)was able to fit equations to correct the fish density estimates for extinction. Thismethod can be used to derive the extinction cross section of fish in situ (Foote et al.,1992). Foote (1990) has extended his extinction correction solution for application toaggregations which vary in density both horizontally and vertically. This solution can

Effects of Behaviour on Stock Assessment using Acoustic Surveys 257
(a) (b)observedreol
~a..Q)
0
SA
(C) 1400
L.. 1200.90 1000L..OlQ) Q) 800..... :::lc_.- 0
600E >
.9 4000
200m
00 100 200 300 400 500
Integrator value(school)
Fig. 9.1 Acoustic shadowing by dense concentrations of fish. Acoustic shadowing by a large herringschool will often result in (a) a reduced bottom echo under the school and (b) a reduced area backscatteringstrength throughout the school. (c) Proportional reduction of the bottom echo integrator value withincreasing density of herring in the water column (after Toresen, 1991).
be implemented on modern postprocessing equipment (Knudsen, 1990; Foote et al.,1991), and used to compensate for the extinction during postprocessing of the echosignal data.
The algorithms suggested in the preceding paragraph have been applied to.quantifythe influence of extinction on acoustic abundance estimates. Gerlotto (1993) estimated the effect of acoustic shadowing during a survey in Venezuela to just 4% forthe total biomass of schools by applying the correction factor proposed by Olsen(1990) on the basis of an equation given by Foote (1983). Misund (1993b) found thatthe packing density of herring schools recorded in fjords in northern Norwayincreased by a factor of 1.3 in average and maximally by 2.4 when applying thecorrection derived by Toresen(1991). Rettingen et al. (1994) found that abundanceestimates of herring overwintering in Ofotfjord-Tysfjord in northern Norwayincreased by factors of about 1.4 when applying the extinction correction algorithmssuggested by Foote et al. (1992) and Foote (1994). Clearly, these results demonstratethat extinction may significantly influence acoustic abundance estimates of pelagicschooling fish, and thus should be taken into account when calculating acousticabundance estimates of such fish stocks.

258 Chapter 9
9.5 Effects of avoidance
Avoidance is a general term for behavioural patterns that fish perform to move awayfrom stimulation that elicits fright or is sensed as unpleasant. During stock assessment, avoidance can be significant if the vessel, the monitoring instruments or thesampling gear generate stimuli to which fish react in a way that causes the measureddensity to be lower than the actual, or the recorded composition of species and distribution of size groups to be different from the real ones.
9.5.1 Methods to study vessel avoidance
The behaviour of a fish in its naturalhabitat is usually not easy to observe, especiallywhen the fish is at some depth offshore. An additional difficulty when observingvessel avoidance reactions may be the substantial dynamic which may occur duringsuch situations. Avoidance reactions may alterthe distribution of fish completely andinduce movements that may rapidly bring the fish far from the position of observation. As a result, visually based observation techniques are usually inadequate forstudying vessel avoidance. Together with the need for night-time observations, thishas encouraged development of non-visual observation methods.
Due to the reflection properties of fish and the great range and volume coverage atvery short intervals, the use of underwater acoustics has proved successful forobservations of fish behaviour in the field (Mitson, 1983). To study vessel avoidanceof herring shoals during night-time, Olsen (1979) developed a technique based onsubmerged, downwards-or upwards-directed transducers connected to a smallobservation vessel positioned some distance. away. The position of the transducerswas marked by a buoy with a light signal. When herring shoals were detectedunderneath or above the transducers, a large research vessel was ordered to pass in astraight course as close as possible to the marker buoy. The reactions of the fish whenthe survey vessel approached and passed over could then be deduced from therecordings by the transducer. This method has been applied in sheltered waters infjords, and in the Barents Sea in good weather conditions (Olsen et al., 1983a).
A more convenient version of the method when dealing with fish that occur in moredynamic distributions is to position the transducer directly under a small vessel. Thetechnique requires only a small. transducer that is easily handled overboard. Thistakes advantage of the mobility of a small observation vessel to search for afavourable position relative to the actual fish distribution. When the small vessel hastaken up a favourable position over the fish, the survey vessel can be ordered to takeup a straight course so that it passes close to the small vessel. The behaviour of the fishas the survey vessel comes closer and passes, can then be monitored directly from thesmall vessel. This technique has been applied on distributions of cod and haddock.inthe Barents Sea (Ona & Chruickshank, 1985; Ona & God", 1990). In the Caribbean,the technique has been used to study the avoidance behaviour of pelagicspeciesoccurring both-in shoals and in distinct schools (Freon & Gerlotto, 1988a,b; Freoneral., 1990, Gerlotto & Freon, 1990, 1992). The latter was possible because the.schoolswere visible from the surface so that the observation vessel with the transducer could

Effects of Behaviour on Stock Assessment using Acoustic Surveys 259
be manoeuvred into a position straight on top of schools even if they were moving. Bymaintaining this position relative to the school, the behaviour of the fish during thepassage of the survey vessel could be recorded.
Another method for observing changes in distributions of fish when passed over bya survey vessel is to use a narrow-beamed sector-scanning sonar. Such equipment isbest mounted and operated from the survey vessel itself due to the many componentsinvolved and the requirements of electric current. Ona and Toreseri (l988a.) mountedthe mobile transducer of such a sonar on various positions on the:hull of a researchvessel when surveying herring concentrations in a Norwegian fjord. Thetransducerswere directed so as to give a vertical section of the water column. By this method itwas possible to record and compare the distributions of fish underneath and to thesides of the vessel. Similar observations are possible with a portable multi-beam sonarof high frequency (455 kHz) which gives the advantage of high resolution andsimultaneous observation of a vertical plane from 0 to 100m from the vessel (Gerlottoet aI., 1994). By combining several successive such cross-sections, three-dimensionalpresentation of fish distribution in relation to the survey vessel can be obtained (Plate2, opposite page 21). . '
Fish swimming in schools out of visible range of the surface are best observed byhorizontally guided sonar (with the transducer mounted directly on the hull of theresearch vessel). The behaviour of the schooling fish can thereby be studied from onboard the vessel itself. The sonar can be omnidirectional or multibeam, therebycovering a large volume in each ping. This ensures that quick movements of theschool are detected. The whole horizontal extent of a school will also be projected sothat changes in the external appearance of the school in vessel avoidance situationscan be investigated. Some sonars even have an additional beam fan so that the verticalextent and position in the water column of the school can be recorded. (Ona, 1994).However, for multibeam sonars that operate with rotational directive transmission, ablind zone is created at close range to the vessel « 50m) and the reactions of theschool just before the vessel passes over are not observed. Several sonars can displaythe movements both of the school and the vessel in true motion (Bodholdt & Olsen,1977). This enables detailed quantification of the avoidance behaviour. Thehorizontal and vertical swimming speed of the schools can be measured fairlyaccurately. To describe the avoidance behaviour, parameters that relate the movement of the school to that of the approaching vessel, such as the radial swimmingspeed, are easily estimated.
A horizontal guided sonar can also be used to measure the Doppler shift inreturning echoes from fish schools (Holliday, 1977). This can be useful for avoidancestudies because the frequency shift of the returning echo will reveal whether the fishare avoiding the approaching vessel or not. If the fish are avoidingthe ship, thefrequency shift will be positive, but if the fish is approaching the vesselthe frequencyshift will be negative. The swimming speed of the fish towards or away from the vesselcan be calculated from the frequency shift. The method may also be used on echosounders to measure the vertical swimming speed of fish, underneath the vessel; asdone by Olsen et al. (l983a) on capelin concentrations in the Barents Sea.
Studies of the avoidance behaviour of individual fish are more difficult with

260 Chapter 9
conventional acoustic equipment. However, they are partly possible with split-beamsounders using measurement of the phase angle to position the returning echoes in theacoustic beam (Brede et al., 1990). This requires that there be some space betweenindividuals within the acoustic beam to obtain the resolution necessary for positioning of single targets. If the distribution is dense, the resolution can be increased bylowering the split-beam transducer closer to the fish. The split-beam sounders enabletracing of the swimming behaviour of individual fish as they move through the beam(Ona, 1994). Nevertheless, to follow the movements of single, identified individualsthrough the whole avoidance behaviour phase during passage by a research vessel willstill be difficult.
Another alternative method for studying the avoidance behaviour of individuals isto use acoustic tags on the fish. Then it is possible to trace the movement of the fish byrecording the position of the tag through a system of passive listening buoys or a hullmounted sonar (Mitson, 1983). There are several techniques to place the tags on thefish. It can be done simply and safely by catching the fish first, and then mounting thetags internally or externally before releasing the fish again. A disadvantage of thistechnique is that the fish can be exposed to such stress during the capturing andmarking process that it will modify its behaviour strongly to avoid coming into asimilar situation during subsequent experiments (,one-trial learning' , see Chapter 7).Fish may be kept unaffected by the tagging process by putting the tag into food thatthey ingest in their natural habitat. However, to base an investigation on this methodcan be a time-consuming process because it is very dependent on appetite. Moreover,this method cannot be applied to plankton feeders.
9.5.2 Observations of vessel avoidance during surveys
According to the avoidance behaviour model of Olsen et al. (l983a), fish will react tothe noise stimuli by increasing speed and swimming radially with a downwardcomponent away from an approaching vessel. Such swimming behaviour may resultin a horizontal dilution of fish density in front of the vessel, and a reduction in targetstrength both due to compression of the swimbladder if rapid diving occurs, andbecause of an increase in the tilt angle (Ona, 1990). The total effect may be a substantial underestimation of fish density as recorded during the conventional acousticsurveys.
Echosounder observations from an independent small vessel showed that polar cod(Boreogadus saida) in the Barents Sea, avoided at about 150m in front of anapproaching survey vessel (Olsen et al., 1983a). It is possible thatthis species is verysensitive to vessel sound, because similar investigations on other species indicate littleor no avoidance more than 50 m in front of research vessels running at normal surveyspeed (about 5 m S-2 or 10knots). This is concluded from a large number of recordingson cod and haddock (Melanogrammus aeglefinus) in the Barents Sea (Olsen et al.,1983a;Ona & Chruickshank, 1985;Ona & God0, 1990).Similarly, there have been noindications of changes in the distributions of shoaling herring at some distance infront of the approaching survey vessel during experiments in Norwegian fjords(Olsen, 1979, 1980, 1990; Ona & Toresen, 1988b). The same pattern with no detect-

Effects of Behaviour on Stock Assessment using Acoustic Surveys 261
able changes in the fish concentrations in front of survey vessels has also been foundduring studies with echosounders operated from an independent vessel on smallclupeoids in the Caribbean Sea (Freon & Gerlotto, 1988a,b; Freon et al., 1990;Gerlotto & Freon, 1990, 1992).
It is possible that recordings with echosounders on. fish concentrations do notreveal slight changes in swimming behaviour of the individual fish as a survey vesselapproaches. Recordings made by omnidirectional or multibeam sonars indicate thathorizontal dilution of the density of schooling fish more than 50 m in front of surveyvessels may occur depending on species and geographic area. Goncharov et al. (1989)observed that schools of jack mackerel tTrachurus symmetricus) increased theswimming speed remarkably linearly within an interval of about 350 to 50 m in frontof a large, approaching vessel. This pattern was observed in three different areas (Fig.9.2). There were clear differences in the reaction distance among the three areas, butthe slope of the increase in swimming speed with decreasing distance from vessel toschool was much the same. Goncharov et al. (1989) argued that differences in the seatemperature caused the variations in reaction distance among the three areas.Another possibility is that the conditions for sound propagation varied so that thefish became aware of the vessel at different distances in the three areas.
2.0 3
~
Il/)
E 1.5
"0 00Q)Q) 00- 1.0l/)
CJl~o
cEE 0.5.~
(/)
0 I i i i I i i i I i
20 .30 4050 100 200 .300 400 500
Distance to the vessel (m)
Fig. 9.2 Swimming speed of jack mackerel schools as a function of distance to anapproaching vessel in three adjacent areasdenoted 1,2 and 3 (after Goncharov et al.,1989).
By use of an omnidirectional sonar, Diner and Masse (1987) observed that someschools of herring in the English Channel, and sardine and anchovy in the Bay ofBiscay, tended to avoid horizontally at about 150m in front ofan approaching surveyvessel. However, most of the schools seemed not to avoid the path of. the vessel.Misund et al. (1996) found that the distance of first reaction of herring schools in theNorth Sea varied from 50m to 1000m (Fig. 9.3). The schools that reacted weredistributed within 200 of each side of the bow.
Schools ofherring (Clupea harengus) and sprat (Sprattus sprattus) in the North Seathat reacted to the survey vessel tend to be guided by the approaching vessel (Fig. 9.4).It is suggested this is due to a supposed noise directivity pattern of the vessel. Due to

262 Chapter 9
, lOO
1000
'""'900
E'-" BOO
Q)u 700c0
~ 600"0
5000
C 4000N
'C 3000I 200
lOO
01000
o
ooo
BOO 600 400 200
Distance port (m)
o
o 200 400 600 BOO 1000
Distance starboard (m)
Fig. 9.3 Distance and direction to herring schools in the North Sea at first detection by a Simrad SR240sonar onboard RV Johan Hjort. (0) schools not avoiding the vessel; (e) schools avoiding the vessel; (*)position when school reacts to the vessel (after Misund et al., 1996).
3 . e" School start
~
600
500
'""'E 400
"0
~0
300UI
Q)UC0.....
200UI
0
100
0 IlOO
I50
Port sideo
I50
Starboard side
i100
Distance from vessel to school (m)
Fig. 9.4 Swimming patterns of herring school presumably reacting to the sound field of RV Johan Hjortwhen approaching at 1I knots (after Misund et al., 1996).

Effects of Behaviour on Stock Assessment using Acoustic Surveys 263
shadowing by the hull, there will be lobes of maximum intensity to each side of thevessel (Fig. 5.2) as suggested by Gerlotto and Freon (1990) by combining results fromMisund (1990) and Urick (1983), and confirmed by Misund et al. (1996). Just in frontof the vessel there will be a minimum intensity. Fish that sense and react to theincreasing sound intensity in front of an approaching vessel will thereby be guided infront of it. However, there seemed to be no relation between swimming speed,avoidance pattern and distance between vessel and school in the interval from about600 m to 50m in front of the vessel (Misund & Aglen, 1992). Schools of spawningmigrating capelin (Mallotus villosus) showed no avoidance in front of a survey vessel(Misund et al., 1993).
Just before, and as the vessel passes over, the avoidance model (Olsen et al., 1983b)predicts sudden escape reactions. This can affect acoustic stock assessment, boththrough a horizontal dilution of fish density in the path of the acoustic beam and by alower target strength than predicted, both because the fish is tilted downwards(Nakken & Olsen, 1977) and due to a compression of the swimbladder during fastdiving (Ona, 1990). The strength of the reactions depends upon the depth of the fish,the size of the vessel, and the vessel speed.
Echosounder recordings from small, independent vesselshave shown that this is thecase for shoaling herring in Norwegian Fjords, and cod, polar cod, and capelin in theBarents Sea (Olsen 1979, 1980, 1990; Olsen et al., 1983a). The resulting reductions indensity underneath the survey vesselshave been quantified to vary from 40% to 90%.In accordance with the avoidance behaviour model, the reactions seemed verydependent on the swimming depth of the fish. This is clearly seen from Table 9.1, inwhich the observations of herring are incorporated into a depth dependent factor forcorrecting the acoustic fish density estimate for avoidance behaviour. That theavoidance reaction depends on the vessel size (and engine power) is deduced fromcomparison of reactions of herring to the 300 GRT RV Johan Ruud and to the 900GRT RV G.O. Sars (Olsen et al., 1983a). How the speed of the vessel may influence
Table 9.1 Estimated avoidance of herring to a 300 tonnes research vessel running at 10 knots (after Olsenet al., 1983b). Mean tilt angle (~o), ratio of acoustic backscattering cross section disturbed/undisturbed(k"o = cr~O/crflO)' ratio of fish density disturbed/undisturbed (kpo = Po/Poo), and ratio of relative acousticbackscattering strength disturbed/undisturbed (kM O = k"o ' kpo),
Depth (m) ~o 'k"o kpo kM O " 100(degree) (%)
10 63 0.40 0.16 0.620 48 0.30 0.41 1230 42 0.44 0.67 2940 40 0.50 0.92 4650 33 0.61 1.00 6160 23 0.78 1.00 7870 15 0.91. 1.00 9180 9 0.98 1.00 9890 5 0.99 1.00 lOO
100 2 1.00 1.00 100

264 Chapter 9
the avoidance reactions has been studied by Doppler shift measurements of capelinwhen approached by a survey vessel (Olsen et al., 1983b). The vertical swimmingspeed increased more or less proportionally with increasing vessel speed.
That shoaling herring avoid a passing survey vessel has been confirmed by recentexperiments on large herring wintering at depths from 40 to 400 m in fjords ofnorthern Norway (Vabe et al., in pre.). Independent echo integration from a stationary transducer submerged from a float and connected to a small observationvessel, revealed depth dependent avoidance to the 2000 GRT vessel RV Johan Hjortwhen passing at survey speed (8-11 knots). For herring distributed between 40 andlOO m depth, the avoidance reactions resulted in a loss of echo energy in the order of80-90%. The effect of the avoidance reactions decreased with depth below lOO m, andwas insignificant below ISO m depth. The results suggested that the avoidance reactions above ISO m could cause an underestimation of the biomass of herring in thearea by about 50% for an acoustic survey run day and night by the specific vessel.
Other investigations on cod, haddock and herring in the same areas revealed no orjust weak avoidance reactions to fisheries research vessels running at normal surveyspeeds. By echosounder recordings from a small observation vessel, Ona and God0(1990) detected no avoidance reactions ofcod and haddock that were approached andpassed over by a survey vessel. When recording herring concentrations by a verticallyscanning sonar mounted at various positions on the hull, Ona and Toresen (l988a)detected no changes in the herring distributions when the sonar transducers weremounted on the bow and just in front of the echosounder transducers. This indicatesthat the herring performed no avoidance reactions that significantly affected thebiomass estimation by conventional acoustics.
Similar studies on clupeoid species in shallow, tropical areas showed no reductionin fish density during passage of small survey vessels either when sailing or motordriven (Freon et al., 1990; Gerlotto & Freon, 1990, 1992). Schools of Sardinella auritaoff Venezuela avoided vertically, but only in the upper 20 m when passed over by amedium sized survey vessel. This resulted in only slight underestimation of the densityas the average tilt angle during the dive was estimated to be less than 10° (Geriotto &Freon, 1992).
This significance of avoidance studies using an echosounder from a small observation vessel would have been easier to interpret if recordings from the survey vesselduring the experiments were also shown, and compared with the recordings from theindependent vessel. In future experiments, this should be done by using identical,calibrated echosounders on both vessels, and applying small echo integration intervals horizontally and vertically so that eventual avoidance reactions can be quantified.
Recordings by omnidirectional and multibeam sonars show that both horizontaland vertical avoidance of schools can occur close to the vessel. Schools of anchovyand sardine in the Mediterranean seemed to avoid laterally or compressed verticallywhen close to an approaching survey vessel, and fewer schools than expected wererecorded in the simulated sample volume of a vertically directed echo sounder (Soriaet al., 1996). About 15% of the herring schools in the North Sea that occurred in thepath of the survey vessel avoided horizontally when closer than 50 m in front of the

Effects of Behaviour on Stock Assessment using Acoustic Surveys 265
vessel and were not recorded by the echosounder (Misund & Aglen, 1992). Theschools that avoided were smaller and swimming shallower than those that wererecorded by the echosounder (Misund et al., 1993). Depending on the area, 35-65%of the jack mackerel schools observed by Goncharov et al. (1989) avoided horizontally and dived about 30 m when approached by a large vessel. Diving of herringschools has also been observed when they were passed over by purse seiners (Misund,1990). However, all schools of spawning migrating capelin that occurred in the pathof the survey vessel were recorded by the echosounder (Misund et al., 1993).
For better quantification of the underestimation of biomass due to avoidance ofschools, sonars with better resolution and ability to quantify school size are needed.As underestimation due to vessel avoidance reactions may vary temporarily andspatially, such instruments could be used as a basis in methods for continuous in situmonitoring of vessel avoidance reactions of schools (Misund et al., 1993; Gerlotto etal., 1994; Soria et al., 1996).
As vessel avoidance is claimed to be the outcome of vessel sound stimuli andnatural stimuli acting on the fish (Balchen, 1984), substantial variation may beexpected. Several biotic and physical factors may influence the response thresholdand response strength to vessel sound stimuli. Neproshin (1979) observed that thedistance at which Pacific mackerel (Pneumatophorus japonicus) reacted toapproaching trawlers varied substantially with time of day. The reaction distance wasless in the morning and the evening than in the middle of the day. This was explainedby arguing that jack mackerel avoids most when well fed and swimming in schools inthe middle of the day, and least when shoaling and feeding in the morning and evening. When the Pacific mackerel occurred in low-temperature water, the reactiondistance was less than when the fish were swimming in warmer water.
Avoidance behaviour may also depend on the life history stage of the fish. Herringhave been observed to react more strongly to an approaching vessels when on aspawning migration than when hibernating, feeding or on a feeding migration(Misund, 1990). This is indicated from a greater swimming speed horizontally, relative to the approaching vessel, and downwards, by herring that are on a spawningmigration compared with herring in other life stages (Table 9.2).
Herring have been observed to react less to approaching vessels, the better thesonar conditions (Misund & Aglen, 1992). This is concluded from a lower horizontaland relative swimming speed by herring schools occurring in areas with good conditions, compared with areas with worse conditions (Table 9.3). The sonar conditions
Table9.2 Swimming speeds of herring school when approached by a vessel (L, average fish length; VH ,
Horizontal speed; VRH, horizontal speed relative to vessel; Vv, vertical speed, negative if downwards; afterMisund, 1990).
Life stage Region L (cm) VH (m S-I). VR H (m S-I) VV (m S-I)
Feeding/migrating North Sea 27.2 1.26 0.31 0.00Hibernating Norwegian coast 35.5 1.49 0.13 0.02Prespawning Norwegian coast 37.3 1.94 0.79 -{).27

266 .Chapter 9
Table 9.3 Influence of sound propagation conditions on the swimming behaviour of herring whenapproached by a survey vessel in the North Sea. (VH = horizontal swimming speed, VRH = horizontalswimming speed relative to the vessel. After Misund and Aglen (1992».
Sonar Detection VH (m S-I) VRH(m S-I)
conditions range (m)
Very bad <400 1.10 0.88Bad (400-700) 1.21 0.88Good (700-1000) 1.00 0.73Very good > 1000 0.94 0.68
in an area reflect the properties for sound propagation. If there is no thermocline,there will be linear sound propagation (Smith, 1977) and good sonar conditions. Ifthere is a thermocline, the horizontally emitted sound waves will bend upwards ordownwards and the sonar conditions will be more difficult. During the investigationon herring in the North Sea, there were some areas with warm surface water butcolder water below about 30 m to 40 m deep. This thermocline could cause a drasticdownwards bending of the sonar sound waves, and consequently a reduced detectionrange of schools. The sonar conditions in different areas were therefore categorisedaccording to the detection range of schools, which is proportional to the degree ofsharpness of the thermocline and thereby the downwards sound-ray bending. Thereason that this categorisation also groups the avoidance behaviour of the herringschools is that the emission of noise from the vessel follows the same physical laws asthose of the sonar sound weaves. If the sonar conditions are bad, the noise from thevessel does not proceed very far due to downwards bending of sound waves. Theherring will then detect the vessel at a much shorter distance, than if the conditions forsound propagation were better. Probably the herring react more strongly to anapproaching vessel during such situations than if they had detected the vessel at a longdistance and experienced a gradually increasing noise intensity..
9.5.3 A voidanceof vessel light
At night, avoidance can occur as a response to visual stimulation by the light of the'vessel. This is well known to fishermen, and purse seiners fishing on dense shoals arevery careful in using light during circling, shooting and pursing of the seine. In mostcases only the necessary regulation lights are used. The consequences for stockassessment by acoustics because of avoidance reactions due to the light of surveyvessels may be the same as for avoidance reactions to vessel noise. Levenez et al.(1990) observed significant vertical avoidance by tropical clupeoids off Venezueladuring new moon when running a survey vessel with a 500W light on the bridge. Withregulation lights only, the fish were distributed more or less evenly from surface tobottom at about 50 m.When the light was turned on, the fish descended and concentrated in a narrow depth interval close to the bottom (Fig. 9.5). This distributionpattern could be generated by switching the light on and off. However, the mean echointegral was the same with the lamp on or off. When conducting a similar experiment

Effects of Behaviour on Stock Assessment using Acoustic Surveys 267
(a)Lights off Lights on
-------
III :~ E10
~~~i '~~~~~~:~~~:~::::::::
:~:;::::a:~::::
E10...t--
R6 n.mi
(b)50
~ 40~'-'"
30>.~
[J) 20cQ)
0 10
0
Fig. 9.5 Reaction of pelagic fish off Venezuela, mainly Sardinella aurita, to 500 Wbridge light aimed forward onboard RVCapricorne surveying at 7.5 knots. (a)Change in vertical distribution; (b) relativedensity distribution with lights off (.) andlights on (0) (after Levenez et al., 1990).
in the same area, Gerlotto et al. (1990) observed no vertical avoidance, but foundindications of species-or size-dependent horizontal avoidance when the lamp was on(Fig. 9.6). The last experiment was conducted during cloudy, dark nights, but.it wasstill during a full moon period. This might have had an influence on the fish so thatthey reacted less to light than during other moon phases. Even if these few observations indicate minor effects on acoustic stock assessment due to avoidancereactions to vessel light, survey vesselsshould be operated as dark as possible at nighttime to minimise the influence of such reactions. It is the experience of Icelandicsurvey vessels that excess lights from the decks and cabins can cause such strongavoidance reactions of herring that the acoustic measurements may be significantunderestimates (Halldorsson & Reynisson, 1983).
9.5.4 Vessel avoidance during sampling by trawls
To allocate recordings to species and size groups during acoustic stock estimation,sampling has to be conducted, usually by trawl (Dalen & Nakken, .1983). During thisoperation, vessel avoidance reactions may make sampling of certain species difficult.Acoustically tagged cod in shallow water (20 m depth) tend to swim in the samedirection as the approaching trawler and avoid rapidly sideways when close to thevessel (Engas et al., 1991). Shoaling herring avoided horizontally, and were not

268 Chapter 9
Fig. 9.6 Reaction of pelagic fish, mainlySardinella aurira, in Gulf of Caraico, Venezuela, to a 500 W lamp fixed above thetowed transducer body of a 25m sterntrawler running at 5 knots. (a) relative fishdensity for each elementary sampling distance unit (ESDU); (b) mean relative density.versus depth. (- - -) light on; (-) light off(after Gerlotto er al., 1990).
3025
'1~', '160
Density
10 15 20
ESDU number
(a) 16
J:;- 12';;;cQ)
"0
Q)8
>:;:;0
V 40::
0 -0 5
(b) 0
10
---E 20'-"
s:0- 30Q)
0
40
50 I0
available to a pelagic trawl towed directly in the path of the vessel (Ona & Toresen,1988b). Schooling herring may perform -strong horizontal and vertical avoidancereactions, and precise sonar-guided pelagic trawling is often necessary for successfulsampling (Misund & Aglen, 1992; Suuronen et al., 1997).Theexperience from pelagictrawl sampling in the North Sea is that the herring schools are most difficult to catchwhen they occur at midwater and avoid both horizontally and vertically. Schools thatare recorded at midwater when passed over by the survey vessel often avoid downwards, and can often be found at the sea bottom when passed over by the trawl.However, by taking advantage of this behaviour and lowering the trawl so that theground rope touches the bottom, the sampling success on such herring schools can besubstantially increased.
Vessel avoidance reactions during sampling may also affect acoustic stock estimation indirectly by altering the distribution of species and size groups available tothe gear. Similarly, such reactions may cause difficulties in combining the results fromswept-area and echo integration estimates of semipelagic fish (Nunnallee, 1991).When exposed to playback of the noise of an approaching trawler, penned codpolarised and dived slowly, but the reactions varied substantially (Engas et al., 1991).Ona and Chruickshank (1985) and Ona and Gode (1990) observed that the avoidancereactions of cod and haddock were stronger when the survey vessel was towing atrawl, and that diving made the fish more available to bottom trawl and less availableto pelagic trawl. Similarly, the in situ target strength of Cape horse mackerel (Tra-

Effects of Behaviour on Stock Assessment using Acoustic Surveys 269
churus capensis) shifted downwards by about 12dB during trawling, indicatingincreased tilt angle and downwards avoidance (Barange & Hampton, 1994). ForPacific whiting (Merluccius productus), Nunnallee (1991) observed no change invertical distribution, but a higher echo value probably due to a change in theorientation of the fish when a trawler passed over.
From studies made by the 1043 GRT RV Eldjarn, Misund and Aglen (1992) foundthat the North Sea herring maintained the same horizontal swimming speed whenapproached by the vessel when either cruising or trawling (Table 9.4). However, theswimming speed relative to the vessel increased during trawling. This indicates anincreased and more precise avoidance of the vessel when trawling than when cruising.A trawling vessel tends to produce more cavitation, which generates a high intensityof low-frequency noise (Chapman & Hawkins, 1969). It is therefore quite probablethat the more definite avoidance behaviour of the North Sea herring during trawlingwas a response to a more intense, low frequency noise from the vessel. Nevertheless,possible learning of trawl noise cannot be eliminated, and if this is the case the changein avoidance behaviour may be elicited by the changed noise spectrum generated bythe vessel when trawling.
Table 9.4 Swimming speed of North Sea herring during cruising and sampling by pelagic trawl. VH =
Horizontal swimming speed; VRH• horizontal swimming speed relative to the vessel; *. when behind vesselthe relative swimming speed is related to the trawl. After Misund and Aglen, 1992.
Vessel mode School position VH (m S-I) VRH (m S-I)
Cruising In front 1.06 0.22Trawling In front 1.06 0.46Trawling Behind 1.01 0.58*
In the region between the vessel and trawl, the horizontal swimming speed of theNorth Sea herring schools was about the same as that in front of the vessel. Nevertheless, there was a clear increase in the relative swimming speed (Table 9.4), whichfor the observations in this region was related to the approaching trawl rather than tothe departing vessel. The observations were made in the region just in front of andpartly between the trawl doors, and the swimming behaviour may therefore have beentheresult of visual orientation to the front part of the trawl such as the warps, trawldoors and bridles. The mean relative swimming angle is about 40° to starboard. Thisalso supports the view that the swimming behaviour is influenced by visual orientation, because the trawl tends to approach from the port side. This results from a slightstarboard turn of the vessel as part of the tactic to catch herring schools. The vessel isthen manoeuvred in a slight curve to the side of the school when passing, to try toreduce the effect of the avoidance behaviour.
9.5.5 Instrument avoidance
Anecdotal information from the fishermen using the first generation of fisheriessonars to locate herring schools in the Norwegian Sea indicated that the herring

270 Chapter 9
sensed and reacted to the sonar sound. Many fishermen therefore used to turn off thesonar on the main vessel when the master fisherman was in position over the schooland recorded it through his echo string (a thin copper string with a small lead weightin the end). It is not unlikely that the herring really detected the sound from some ofthe first-generation sonars because they were emitting at about 10kHz. Herring detectsounds at least up to about 4 kHz (Enger, 1967), and the possibility exists that theymay sense higher frequencies of a high intensity. Another possibility is that sonarsproduce loud, low frequency sounds due to the high energy transmitted.
Most fish are unable to detect sound in the ultrasonic region (> 20 kHz), wheremodern fish-detection instruments operate (Hawkins, 1993). Nevertheless, Bercy andBordeau (1987b) reported that mullets (Mugil sp.) increased swimming activitysubstantially, and that the cardiac rhythms of turbot (Psetta maxima) and wrasse(Labrus bergylta) changed when exposed to sound from transducers of 38 or 50 kHzin tanks. Measurements of the output of these transducers showed high-intensity,low-frequency components associated with the carrier frequencies, and which wereclaimed to elicit the responses. It is still doubtful that the sound from acoustic fishdetection instruments affects fish behaviour, and from numerous net cage experiments reactions to fish-detection instruments have not been reported. Similarly,countless observations at sea indicate that fish do not respond to modern echosounders and sonars.
9.5.6 Sampling gear avoidance
A basic assumption of fisheries acoustics is that samples by trawl are representative ofthe populations recorded. This principle. thereby enables an unbiased allocation ofintegrated echo intensity to different species and size groups (Dalen & Nakken, 1983).Accordingly, fish are assumed not to react to the approach of samplinggearin a waythat alters the species and size distribution present.
There is increasing evidence that the sampling principle is an oversimplification(Engas, 1994; God"" 1994). Main and Sangster (1981) observed that cod searchtowards the bottom when approached by a bottom trawl, haddock rise and mayescape over the headline in substantial numbers, while whiting tend to aggregate morein the middle of the trawl opening. Such species-dependent reactions may clearlyresult in a species composition in the trawl catch that is not representative for the areasampled. The reactions ofcod differ among size groups so that the smallest fish escapeunder the ground gear of ordinary sampling trawlsand are grossly underestimated inthe catches (Engas & Godo 1989; Walsh, 1991). Buerkle and Stephenson (1990)obtained substantial differences in the length distributions of herring depending onwhether the sampling was conducted by a pelagic trawl or a bottom trawl (Fig. 9.7).As the herring occurred in a dense aggregation extending up from the bottom; thisresult was probably caused partly by different vertical distributions but also by a fishsize-dependent reaction to the gear. Gear avoidance seems mainly to be elicited byvisual stimuli (see Chapter 5); and the reactions decrease at night-time (Glass' &Ward le, 1989).

Effects of Behaviour on Stock Assessment using Acoustic Surveys 271
(a) 240
200
'- 160Q)
.oE 120·
:::J
Z .80
1 I- Midwater night- - - - Midwater day
The very skewed distributions of pelagic stock density measurements by acousticsindicate that there may be substantial· variation in population estimates betweensurveys. In accordance with this, Buerkle and Stephenson (1990) found large variations in biomass estimates from repeated night-time surveys of herring in ChedabuctoBay, Canada. They claimed that the variations were caused by a great dynamic in theaggregations of the population. To some extent this variation may also have beencaused by the application of fixed transects so that parts of the stock may have beenout of the area, and thus not properly covered from one survey to another.. Aglen (1983) showed that the variability in acoustic survey estimates will decrease
with increasing degree of coverage. This is also indicated by Gerlotto and Stequert(1983), who demonstrated lower variability with shorter distance among transects.These factors have a certain implication for the design of acoustic surveys. If thepurpose of the survey is mostly exploratory, a rather large level of variation (50%)can be tolerated (Pope, 1982). If the survey is carried out to get an index for use intime series analysis, a more moderate variation (25-50%) may be allowed. Thevariation level for a survey designed to yield a population estimate that is to be used tocalculate a total allowable catch (TAC) is at most 25% (Pope, 1982).
To reach such a level in precision for acoustic surveys, several criteria must be

272 Chapter 9
fulfilled. The surveys must be designed to have a high degree of coverage of the wholefish stock. This requires detailed knowledge of where the fish are at the time of thesurvey. The species identification and allocation of echo recordings to species must bebased on adequate sampling gears that give representative samples (Dalen & Nakken,1983). The avoidance reactions must be monitored, the plankton contribution limitedby proper thresholding, and surveying must be conducted only at an appropriate timeof day if necessary. In addition, the survey must be carried out by calibrated, stableinstruments, and the target strength of the fish must be known.
It is the experience of many surveys conducted to give absolute population estimates that there is a fairly good precision. Hansson (1993) found that the averagecoefficient of variation between replicates from one night along a single transect whenrecording herring in a relatively closed Baltic coastal area was 20%. For replicates ofa transect from different nights, the average coefficient of variation increased to 29%due to migration. By use of the delta distribution, MacLennan and Mackenzie (1988)estimated a precision of approximately 25% in acoustic estimates of North Seaherring. Stremme and Seetersdal (1987) observed a variation of less than 20% whenrepeating surveys of one to seven days duration on pelagic stocks off Senegal andMorocco. Vilhjalmsson et al. (1983) showed a high replicability of acoustic estimatesof Icelandic capelin, and noticeable deviations were reasonably explained by ice coveror surface schooling. A three-year time series of repeated acoustic surveys of Norwegian spring-spawning herring in fjords of northern Norway show that the abundance estimates may vary by factors of 1.06-2.14 for surveys one to two months apart(Foote & Rettingen, 1995; Foote et al., 1996).
9.7 Conclusion
As described in this chapter, fish behaviour may have a dramatic effect on acousticabundance estimates. By selecting habitats near the surface or sea bottom, fish may bedistributed in the upper or bottom dead zones for conventional echo integration. Inthe first case the method may be extended by use of horizontal guided sonar, and forfish near the bottom a combination of acoustics and bottom trawling may be applied.Diurnal variation in habitat selection may also influence acoustic abundance estimates by affecting the swimbladder volume and thereby the reflecting properties ofthe fish.
The target strength of the fish is dramatically influenced by fish orientation. The tiltangle distribution of fish schooling is supposed to be narrower than for fish shoaling,and the target strength may change accordingly. At present, this variation is not takeninto account in acoustic surveys. Social aggregation resulting in high densities of fishmay cause acoustic shadowing, an effect which is quantified and possible to correctwhen surveying herring.
Low frequency vessel noise may elicit avoidance reactions to the approachingsurvey vessel, and cause significant underestimation of fish density. In front of thevessel, herring schools seem to be guided towards a noise minimum in the vessel pathcaused by shadowing by the vessel hull. Near the vessel, strong sideways and

Effects of Behaviour on Stock Assessment using Acoustic Surveys 273
downwards avoidance reactions may cause substantialunderestimation of fish density due to both dilution and unfavourable tilt angles. At night, lights from the vesselmay also generate avoidance reactions. However, avoidance reactions seem to varyaccording to factors such as local hydrographic conditions, time of day, maturationstage, between areas, or when conducting trawl sampling, but often fish do not seemto react to the presence of survey vessels at all.
Generally, there is a fairly good precision of acoustic abundance estimates, butvariations by a factor of about 2 have been observed for surveys on the same stockconducted only 1-2 months apart.

Chapter 10Other Methods of Stock Assessment and .Fish Behaviour
In this chapter we shall focus on fishing gear surveys (trawl, purse seine, beach seineand long-line), on aerial surveys, on ichthyoplankton surveys and finally on capturerecapture surveys. Underwater visual surveys (scuba, snorkelling or underwatercamera) .are not adapted to the survey of large pelagic stocks and therefore are notanalysed in this book.
10.1 Fishing gear surveys
10.1.1 Methodology and assumptions
The principle of this method is similar to any direct method of determining abundance, i.e, based on the extrapolation of density (or density index) observed per-unitof area, using a given sampling gear, to the entire survey area (review in Gunderson,1993).The main assumptions in a trawl survey (note that they are close to those of anacoustic survey and can be used for an aerial survey with slight modification) are:
(1) The survey covers the whole area of the stock distribution(2) The individual willbe sampled a single time and if migrationoccurs during the
survey, the mean speed of migration must be negligiblecompared with the speedof progression of the survey in the same direction
(3) The target species is completely vulnerable to the fishing gear(4) The area sampled by the fishing gear is known exactly (absolute abundance
estimation) or is constant from one survey to the next (relative abundanceestimation)
(5) .The sampling sites are selected randomly, or systematically if they are repre-sentative and if appropriate statistics are used for computing the variance ...
The advantage of fishing gear surveys over indirect methods based on commercialfishery data is that it is relatively easy to satisfy assumptions (I) and(5) owing to thefull control of the fishing sites. Nevertheless, in the case of drastic changes in habitatselection, unexpected failure of assumption (1) may occur. To benefit from one of themain advantages of gear surveys, it is recommended that the survey be carried outbeyond the bounds of the known stock area, even though this is seldom done owing tofinancial limitations. Assumption (4) is also easy to satisfy for bottom trawl surveys

Other Methods of Stock Assessment and Fish Behaviour. 275
applied, for instance, to gadoids. But as far as pelagic species are concerned, fishinggears are not commonly used alone for surveying the stocks because it is difficult toevaluate the area sampled by the gear - or by the combination of the gear anddetection devices such as sonar - and to get it constant.
Let us see now the influence of fish behaviour according to the different pelagicsampling gears. The case of bottom trawl surveys is fully covered by Gunderson(1993) and is not reviewed in this book. The real new developments since then lie instatistical analysis and survey design using stratification or geostatistics. For instance,Smith and Gavaris (1993) proposed a stratified random design based on historicalspatial distribution for estimating the abundance of Atlantic cod. Gear survey canalso benefit from the use ofgeostatistics to compute variance estimation (Conan et al.,1994), even when the survey design is not random (Petitgas, 1993, 1996; Pelletier &Parma, 1994).
10.1.2 Influence offish behaviour on fishing gear surveys
Gode and Valdemarsen (1993) designed a three level pelagic trawl for near surfacesampling of juvenile fish, Joseph and Somvanshi (1989) suggested assessment ofbiomass by 'swept volume' of a midwater trawl, similar to the technique used forbottom trawls. The authors intended to apply this method to the pelagic stocks ofhorse mackerel (Megalaspsis cordyla) along the north-west coast of India. Nevertheless they recognised the limitations of this method owing to unexpected variationsin catchability coefficient, associated with the shoaling habit and migration of smallpelagic fish, including diurnal variability. Smith and Page (1996) argue that the lateinter-annual variability in midwatertrawl surveys performed on the Atlantic codstock of the 4VsW division results mainly from age-and area-specific habitat selectionwith near-bottom water temperature and salinity. They proposed a model relating thevariability in the cold intermediate layer to the estimates of age-specific cod abundance obtained by trawl surveys to derive new survey indices of abundance. Thesenew indices do not have year-effects and seem more consistentthan the original timeseries. All the limitations owing to vessel and gear avoidance during sampling trawlsassociated with acoustic surveys apply fully to the midwater trawl survey method(Chapter 9) and we think that this method by itself is not adapted to abundanceestimation. It must be combined with other direct methods (e.g. acoustic surveyoraerial survey) if it is to be efficient. .
As far as we know, purse seining is not used in scientific surveys. We have foundonly one example of its application, on post-larvallingcod (Ophtodon elongatus) in theStrait of Georgia, which provided too large a sample variance for a proper monitoring of abundance (Hand & Richards, 1991). The mainreason is probably thelimited water volume sampled by this gear, which is considered useful only when fishare detected by acoustic equipment or visual observation. Another limitation, compared with the midwater trawl, is the limited vertical range of the water column that itis able to sample. Nevertheless, we think that it.could be interesting to investigate thepossibility ofusing this gear in association with acoustic survey for sampling when thebiomass is not too deep (a large purse seine can easily sample up to lOOm depth) ..

276 Chapter 10
The advantages of the purse seine over the midwater trawl vary according to thetype of echo sampled. On schools - that is usually during the day - it allows a betterseparation of individual schools, and therefore can improve the allocation of biomassto different species based on small spatial and temporal scales. The automatic classification of echoes is usually not efficient without such permanent calibration and itis nearly impossible in the case of mixed-species schools. In addition, size-dependentselectivity is limited when sampling with a purse seine. But the greatest advantageexpected from a purse seine is likely to occur on shoals or scattering layers of mixedspecies, in particular in tropical areas where usually at least four species contributesubstantially to the total biomass. In such cases, especially on scattering layers, thedifferent species of the assemblage are expected to be mixed randomly. Midwatertrawls are species selective in such a situation, in contrast to a purse seine. Of coursethe yield ofa purse seine on a layer will be poor (a few kg) but it can be expected thatthe samples will be less biased than with other gears.
Beach seine surveys can be used to estimate the abundance of juvenile fish (e.g.Hattala et al., 1988), but the main difficulty is to satisfy assumption (I) on the distribution area. If juveniles are too far from the coastline, they are no longer accessibleto this gear. Moreover, this method is time consuming and can be applied only on alimited area.
Longline surveys are sometimes used to assess the abundance of demersal orpelagic fish (e.g. Sigler & Fujioka, 1988; Pelletier & Parma, 1994; Bjordal & L0kkeborg, 1997). To relax the assumption of longline saturation and interspecificcompetition for hooks, Somerton and Kikkawa (1995) performed an experimentalsurvey of pelagic armourhead (Pseudopentaceros wheeleri) using a long-line equippedwith hook timers. This method is certainly interesting but is probably too expensivefor large-scale surveys.
Finally, we have to remember that all the fishing gear survey methods presented inthis section are sensitive to migration (failure of assumption' (2) if the stock ismigrating actively), aggregation behaviour, avoidance and learning, in a way oftendifficult to quantify (but see Gauthiez, 1997, on the effect of aggregation on trawlsurvey).
10.2 Aerial surveys
10.2.1 .Methodology and assumptions
Aerial survey is a common practice for pelagic species (coastal pelagic fish or tunas)and for mammals. Except for large animals like whales or the giant bluefin tuna(Thunnus thynnus) which can be counted individually (e.g. Lutcavage & Kraus, 1995),the unit of observation is the school, associated with a qualitative or semi-quantitativeestimate of its biomass. The most commonly used method is to perform a systematicsurvey along transect lines (e.g. Hara, 1986; Marsac et al., 1988). In Alaska theherring fishery is spread over 5000km along the coast and therefore aerial surveyshave been used to assess and manage the fishery (Belinay, 1994). The Alaska

Other Methods of Stock Assessment and Fish Behaviour 277
Department of Fish and Game decides the duration of the fishing season (usuallybetween 10 months and 4 hours!) according to previous aerial census and to maturitystage studies. Purse seine skippers also use planes to locate the schools rapidly, andthis is a good example of an overcapitalised fishery.
In addition to direct visual observation, other techniques are used: photography(e.g. Nakashima, 1983), video recording, low-light television (e.g. Cram & Hampton,1976), or more sophisticated techniques using spectral analysis (Nakashima et al.,1989), microwave from synthetic aperture radar (SAR) (Petit et al., 1992) or laserfrom LIDAR (light detecting and ranging) (Gauldie et al., 1996). Three types ofLIDAR are available and are reviewed and compared by Churnside and Hunter(1996). The radiometric LIDAR has no scanning system and a single elementdetector. It produces a two-dimensional picture (one axis is depth, the other is thetarget strength of the school). The imaging LIDAR produces a horizontal image at afixed depth, without scanning. The volumetric LIDAR uses a scanning system toconstruct a three-dimensional image. The limitation of this system is that it must beset for a particular depth, and then the user knows only whether the detected school isabove or below that depth. The authors conclude that the radiometric LIDAR isprobably the most cost-effective device for school fisheries. The typical penetrationdepth of LIDAR is 2o-30m and depends mainly on water transparency. A largefraction of pelagic schools are found below this depth during the day, and thistechnique is particularly adapted to shallow waters. Churnside and Hunter (1996)suggest that surveys should be performed during night-time because fish move closerto the surface at night and are able to remain in school due to stellar light ormoonlight.
The assumptions of aerial surveys are similar to those presented in the previoussection on fishing gear surveys, except that the complete vulnerability to samplinggears (assumption (3))is now replaced by complete visibility from aircraft. Moreover,in addition to the altitude, the sainpled area depends mainly on the size of the schooland its illumination (atmospheric condition, sun position with respect to the observer,the sea surface conditions). The quantification of these effects is not easy to achieve(review in Gunderson, 1993; Rivest et al., 1995). Some of them are largely relaxed bythe use ofLIDAR, but this promising technique is still in an experimental phase as faras stock assessment is concerned. The greatest advantage of aerial survey is that alargearea can be surveyed in a short time. Therefore assumption (2), of negligiblespeed of fish migration compared with the progress of the survey, is usually met.Moreover, the method is adapted to stocks encompassing a large area, such as tunas,which cannot be surveyed by a vessel in a reasonable time.
10.2.2 Influence of.fish behaviour on aerial surveys
The most important shortcoming of aerial survey is that it is assumed that all the fishare detectable, Of at least that the proportion of detectable fish does not vary substantially from one survey to the other (assumption (4) of the previous section). Inpelagic fish, this assumption is violated in most cases because only surface or subsurface schools are detectable. Unexpected variations in the fraction of the biomass

278 Chapter 10
visible from an aircraft are caused mainly by spatial and temporal changes in verticalhabitat selection and in the level of aggregation, as exemplified below.
Kemmerer (1980) indicated that the proportion of surface schools of menhadenmay vary by the hour of day. The level of fish aggregation can either make the fishimpossible to spot or can modify the area of the school for a given biomass. From afour year experience of aerial surveys in south-eastern Australia (including Tasmania), Williams (1981)concluded that the variability in the number of observed schoolswas related to moon phase and period of the day. More than double the amount ofjack mackerel (Trachurus declivis) was sighted during the new moon phase thanduring the full moon phase and there was a tendency for larger sightings to occur inthe early morning and late afternoon. Moreover, in the case of jack mackerel as forbluefin tuna iThunnus maccoyiii, the sea surface temperature is a relevant factor forthe species distribution. In this study, Williams (1981) underlined these sources ofvariability but did not include them in the abundance estimates. From an analysis ofthe purse seine commercial fishery on jack mackerel of Tasmania, Webb (1977)arrived at the conclusion that jack mackerel showed a trend towards an increase intonnage landed during the newmoon and first transitional periods. Williams andPullen (1993) reached complementary conclusions on the diurnal and seasonalvariability in the school size or ratio between surface and subsurface schoolsencountered by fishermen, but moon phase influence was not significant. From ourexperience in acoustic surveys, not only the school density is usually lower at night,but often the fish are dispersed in a dense layer, even when the light intensity providedby moonlight or starlight allows visual contact for schooling (occasionally layers havebeen observed by day). The reasons for this dispersion remain speculative (feeding,physical factors). In such cases the fish cannot be detected by aerial survey, even withLIDAR or SAR technologies.
Large size schools are easier to detect at large distances than smaller ones, and thisis one reason for violation of assumption (4), which assumes a known area ofdetection. Chen (1996) proposed the use of a bivariate detection function with distance and size of the school and considered the use of the kernel smoothing method.He proposed an example of application to the aerial survey of southern bluefin tuna.
The bias from diurnal (and secondarily lunar and seasonal) variation of verticalhabitat selection can be avoided by combining aerial and acoustic surveys. Fromaerial and sonar observation of northern anchovy (Engraulis mordax) in northwestern Mexico, Squire (1978) indicated that the percentage coverage of the school'sarea in relation to a circle drawn tangent about the school averaged 42% during theday and 29% during the night. The school area estimate by visual survey was overestimating the actual school area by 1.72: 1. Another way to combine aerial andacoustic surveys for stock management is given by the East Canada stock of capelin(Ma/lotus villosus), which is first surveyed by echosounding before the spawningseason, when the fish are located in deep water offshore, and secondly by aerial surveyduring the spawning season (Nakashima, 1983). The first surveys were done withconventional colour photography, but later Borstad et al. (1992)and Nakashima andBorstad (1993, 1996) improved the methodology using a compact airborne spectrographic imager (CASI) which permits work when the visibility is not optimal for

Other Methods of Stock Assessment and Fish Behaviour 279
conventional photography (clouds, high sun angle). Moreover, the CASI systemoffers the advantage of storing digitally and in real time the data, which can later beincorporated ina geographic information system (GIS). Strangely this promisingmethod does not seem to be used in other quarters. Better validation may be expected,especially from the combination with field experiments to assess the species identification and the probability of school detection according to the depth, size and seasurface condition.
The SAR observations are totally free of the influence of cloud coverage andsunlight effects (SAR can be operated by night). Concurrent independent aerialobservations, one with the SAR, the other by a trained spotter pilot, indicated thatwhen tuna schools were at the surface, small variations ofwater roughness induced byinternal waves made them detectable (Petit et al., 1992).The method also permits thedetection of vessels and of set purse seines. Nevertheless this method is not currentlyused for stock assessment, and once more this is probably because only surfaceschools can be detected.
10.3 Ichthyoplankton surveys
10.3.1 Objectives, methodology and assumptions
As far as stock assessment is concerned, ichthyoplankton surveys can be designedaccording to.two primary objectives: the estimation of the recruitment some years inadvance and/or the back-calculation of the size of the spawning stock, knowing thefecundity offemales (Heath, 1992). The first objective is usually difficult to reach inpelagic fish stocks because the natural mortality in early stages following eggs andlarvae is still very high and often unpredictable in species having a high fecundity andspawning pelagic eggs. Presently most of the egg and larval surveys of pelagic speciesare aimed at the second objective, that is the evaluation of the parental stock biomass,and we will focus mainly on this approach. Egg surveys are often preferred to larvalsurveysfor estimating the parental stock because this last approach requires estimatesof growth and mortality rates of the early stages (Hauser & Sissenwine, 1991; Heath,1993). Larval surveys are usually preferred for predicting recruitment for the samereason.:
Ichthyoplankton surveys are designed to cover the whole distribution of eggs and/or larvae of the target population by a sampling grid. This grid is usually systematic(e.g. Priede & Watson, 1993) instead of random, but if the location of the spawningground can be known in advance or is not variable from year to year, the survey canbe prestratified. This is for instance the case for a few pelagic species like herring orcapelin which are benthic spawners which deposit their eggs on characteristicspawning sites, and are known to display a natal homing. Then the egg density can beestimated by SCUBA egg deposition surveys (e.g.Schweigert, 1993).
A combination of prestratification and random sampling inside strata is proposedby Hampton et al. (1990). The approach by adaptive sampling is generally used fordeciding when to stop a transect (usually after two or three adjacent stations without

280 Chapter 10
eggs or larvae) but it can be also used to oversample the dense areas, despite thedifficulties of avoiding biases in the estimates of the abundance and of its variance. Inorder to take into account the spatio-temporal variability in egg density, Petitgas(1997) proposed a geostatistical model providing an estimation of the mean densityand its variance.
Several sampling gears can be used for collecting eggs and larvae. Larvae are moredifficult to sample than eggs because they are able to detect and avoid the gear. Eggsare sampled by plankton nets, horizontally, vertically or obliquely deployed (doubleoblique tow). Horizontal or oblique tow are usually performed with a pair of netsdeployed in a single frame (bongo). A bongo net is more stable than a single net, andlimits larval avoidance of the frame (the two nets of the bongo might have differentmesh size). A multiple opening--elosing net and environmental sensing system(MOCNESS) was designed in order to better estimate the vertical distribution of theichthyoplankton and of its local environment (Wiebe et al., 1976; Snyder, 1983).Vertically deployed gears sample a limited volume and can be used only when eggdensity is not too patchy at small scale. The CalVet (California Vertical Egg Tow) wasdesigned for sampling anchovy and sardine eggs during the long-term CalCOFIsurvey off California (Smith et al., 1985). In all these gears, a flowmeter provides ameasure of the distance travelled by the net in the water column. It must be calibratedproperly in order to avoid biases in the ichthyoplankton abundance estimates(Brander & Thomson, 1989).
Because operating research vessels is very expensive, over the past 60 years continuous plankton recorders (RPCs) have been towed behind merchant ships on regular routes in the north-east Atlantic Ocean. In early RPCs the plankton was retainedon a fixed filter screen; this has been replaced by a continually moving length of silkmesh. RPCs are aimed at providing information about plankton abundance anddistribution, but some authors intended to use them to monitor long term variation inichthyoplankton abundance (e.g, Dickson et al., 1992).
In order to increase the sampled volume and reduce the time consuming processof egg counting, plankton pumping and optical plankton counter (OPC) has beeninvestigated since the 1980s. Omori and Jo (1989) proposed a vortex planktonpump capable of sampling up to lOOm depth. From a literature survey, Checkleyet al. (1997) claim that although the depth of spawning varies within and betweenspecies, the distribution of eggs achieves a surface maximum in their early stage ofdevelopment. Therefore they designed a continuous. underway fish egg sampler(CUFES) which combines subsurface pumping and OPC. The performance ofCUFES has been compared in situ with that of MOCNESS and CalVET samplers.The CUFES system provides lower retention of eggs than the other samplers, butthe relationship between log-transformed abundance estimates are linear andhighly correlated.
There are three main methods for back-calculating the parental stock biomass ofpelagic stocks (review in Gunderson, 1993; Hunter & LO,1993): the annual eggproduction method (AEPM), annual larval production method (ALPM), dailyfecundity reduction method (DFRM), egg deposition method for benthic spawners(EDM) and finally the daily egg production method (DEPM) which is the most

Other Methods of Stock Assessment and Fish Behaviour 281
popular for multiple spawning pelagic fish (review in Alheit, 1993). All of themrequire an estimate of the number of eggs spawned per day (Et) during the survey:
Et = (Eij/dij) eZijtij (10.1)
where Eij is the number of eggs stage i in the survey area during survey j, dij theduration in days of egg stage i, Zij the instantaneous rate of daily mortality for eggsstage i, and tij the age of the egg in days (review and other equations in Gunderson,1993).
10.3.2 Influence offish behaviour on ichthyoplankton surveys
As far as fish behaviour is concerned, the main problem in egg surveys is directlyrelated to sampling errors and biases. Matsuura and Hewitt (1995) reviewed thecontagion in the dispersion of ichthyoplankton. They showed that the patchy distribution of eggs comes from the schooling behaviour of adults during spawning.Then patchiness decreases due to the dispersive process and increases in the subsequent stages due to the schooling behaviour ofjuveniles. As a result, the patchinessat-age curve for several species of schooling fish is V-shaped. Therefore, strictly froma sampling strategy point of view, it seems logical to prefer larval surveys to eggsurveys, especially for recruitment estimation. Nevertheless, an additional problem inlarval surveys is avoidance of the gear. As a result, the choice between an egg or larvalsurvey will depend on a trade-off between the advantages and inconveniences of bothmethods, and also on the final objective (spawning biomass or recruitment estimation). An additional behavioural effect is cannibalism by adults on their eggs andlarvae, which can lead to an underestimation of abundance, especially when thespawning area is not productive. This is typically the case of the Cape anchovy(Engraulis capensis) spawning over the Agulhas Bank (Valdes et al., 1987; Valdes,1993).
The difficulty in designing an appropriate ichthyoplankton survey often comesfrom the variability of the location and .surface of the spawning area, in relation toenvironmental effects (Muck, 1989; Boehlert & Mundy, 1994). In the vertical plan,another difficulty is to assess correctly the depth where the ichthyoplankton is mainlylocated, particularly in the case of larvae which usually display circadian verticalmigration (Kendall et al., 1994). An example of the complexity of the environmentalinfluence on the ichthyoplankton distribution is provided by Moser and Smith (1993)who studied the horizontal and vertical distributions of larval fish assemblages of theCalifornia current region. They concluded a major influence of the frontal zonebetween subarctic-transitional and central water masses and observed different patterns of vertical distribution for the same species at the north and south sides of thefront.
Larval avoidance is usually more important during the day, due to visual detectionof the gear, which is another factor explaining the circadian variability in the catches.Such examples are provided by Roepke (1989) on Scomber scombrus larvae and byBoehlert and Mundy (1994) on Thunnus albacares and other tunas.
In order to limit the effect of patchiness on ichthyoplankton surveys, Mangel and

282 Chapter 10
Smith (1990) proposed to estimate the spawning area and an index of abundance ofthe spawning biomass only from the collection of presence/absence data. The modelsare based on an underlying probabilistic description of the aggregation of eggs orlarvae, a search process.and a description of habitat structure. They suggested usingthis inexpensive method as a. continuous monitoring of a stock, alternately withconventional counts of eggs and larvae. They applied this approach to the Pacificsardine (Sardinops sagax) in the California current, but as far as we know, no otherapplication has been intended. This method seems especially appropriate to surveythe recovery of overexploited stocks.
Combining an ichthyoplankton survey and acoustic survey, which have differentadvantages and inconvenience, is a good wayto overcome their limits. Since 1984, theabundance of spawning Cape anchovy (Engraulis capensis) on the South Africancontinental shelf has been assessed by this approach (Hampton et al., 1990). Suchcombined surveys provide a basis for annual adjustment of a total allowable catch(TAC) aimed at maintaining constant risk of spawning escapement relative to 50% ofthe estimated unexploited biomass. The management method is adaptive in the sensethat initial estimates of risk based on spawner stock size are updated once the strengthof the recruiting year class has been determined by a second acoustics survey (SheItonet al., 1993; Hampton, 1996).
10.4 Capture-recapture
10.4.1 Methodology and assumptions
The field methodology consists of catching fish, tagging them by an external tagwhich is easy to detect or an internal. steel tag that can be detected magnetically,releasing them immediately, and finally, once they are diluted in the stock, recapturing them (by experimental surveyor commercial fishing) following differentsampling strategies, According to the number of tagging periods and recapture periods, different estimates can be expected: stock abundance, exploitation rate, survivalrate during a time period or recruitment (see Ricker, 1975,or Burnham et al., 1987fora review). All these techniques are based on the following assumptions:
• the mixing rate between tagged and non-tagged fish is random ..• the catchability oftagged fish is identical to the catchability of non-tagged fish• .the natural mortality of tagged fish is identical to the mortality of non-tagged fish
.(or the additional mortality caused by tagging is correctly estimated)• there is no tag loss or this loss 'is correctly estimated• all recaptured fish are reported..
Other assumptions must be added according to the type of study. For instance, in thecase of a single tagging experiment and single period of recapture, the recruitment inbetween tagging and recapture is supposed to be negligible. Then the rate ofexploitation (u) is simply estimated by the ratio between the number of recaptured (R)and the number of tagged fish (T):

Other Methods of Stock Assessment and Fish Behaviour 283
u = R/T (10.2)
The abundance in numberN can be estimated by the ratio u/C, where C is the totalcatch associated with the recapture ofR tagged fish. More sophisticated methods anddata analysis have been developed around this simple principle, in particular byterrestrial ecologists (e.g. Lebreton et al., 1992).
One of the main problems of the capture-recapture method ~ notrelated to fishbehaviour - is the difficulty of obtaining a good proportion of tag returns and estimating the proportion of tags not being detected or returned by fisherman. Asstressed by Hilborn and WaIters (1992), a common mistake is to underestimate thenecessary investment of time and money needed to achieve this second phase of theproject.
10.4.2 Influence offish behaviour on capture-recapture methods
We reported in Chapter 6 that fish are able to learn by a single experience ('one-triallearning') when they experience a strong stress, such as tagging (Fig. 7.6). Taggingoperations certainly represent a huge stress for the fish, especially when performedafter a traumatic capture (by hand line or purse seine) and out of the water. Anaesthesia is usually practised because it is supposed to limit the stress owing to theattachment of the tag to the fish's body (or similarly the stress through forcedingestion of an acoustic tag or intra-abdominal injection of a magnetic tag). Unfortunately, anaesthesia itself is an important stress (Carragher & Rees, 1994), especiallywhen carbon dioxide gas (MacKinlay et al., 1994) or MS-222 (Olsen et al., 1995) areused. Some workers on tagging experiments find that anaesthesia is not necessarilyhelpful when tagging trauma is low (Harris, 1989). In addition, anaesthesia is suspected tu increase mortality related to tagging (Hansen, 1988).
Whatever the reduction of stress by anaesthesia, fish manipulation related to thetagging operation, including the anaesthesia itself, is likely to favour 'one-triallearning' and therefore to decrease the probability of recapture. This lower catchability, compared with naive fish, is a potential source of bias in stock abundanceestimations performed from tagging experiments. Hampton (1986) observed a relatively low number of recaptures during the first five days after tagging southernbluefin tuna (Thunnus maccoyiii and our interpretation is that this result is mainlyexplained by 'one-trial' learning. The stress could also explain the decrease in theconditioning factor of fish 5-20 days after tagging in this experiment. Nevertheless,other tagging experiments on skipjack tuna caught by pole-and-line do not suggestlearning but, surprisingly, an increased catchability of the tagged fish during the dayfollowing tagging (Cayre, 1982). This was interpreted as caused either by dominanceof some fish and/or by a persistent level of hunger. We think that in apex predators,particularly in non-sedentary ones, the trade-ofT between feeding and predation risk(fisherman being one of the predators) is more often in favour of feeding than it is inplankton feeders. For a plankton feeder, it is obviously more important to escape apredator than to feed on a plankton patch, since it is relatively easy to come back tothis patch or to find another one. In contrast, in apex predators the probability of

284 Chapter 10
encountering a prey is low, energy consumption is high due to permanent swimmingand these species can suffer hunger and probably die of starvation on many occasions(Olson & Boggs, 1986). As a result they probably take more risk in feeding thanplankton feeders.
In addition to learning, other fish behavioural traits can influence the capturerecapture method during the process of recapture (in particular habitat selection andaggregation). Because these aspects are identical to those presented in Chapter 8, theyare not reviewed here.
10.5 Conclusion
None of the other methods of stock assessment briefly reviewed in this chapter arefree of bias, but the limiting factors are different according to the methods. Fishinggear surveys are sensitive to avoidance reactions, which vary according to the species.They are also sensitive to changes in catchability (mainly owing to changes in habitatselection), aggregative behaviour and probably learning. An investigation is recommended as to whether the use of a purse seine as a sampling gear for acoustic surveyscan solve the problem of midwater trawl selectivity (for species and size). The resultsof aerial surveys strongly depend on the assumption of constant vertical selection ofhabitat, in addition to proper correction for changes in visibility conditions. The useof LIDAR could partly solve these problems in the near future because this technology allows a larger depth range (from 10 to 40m according to the water transparency) to be sampled and is less sensitive to environmental conditions. Aerialsurveys would certainly benefit from an association with acoustic surveys, butrecommending such an association is not always realistic. The two methods are timeand fund consuming and difficult to implement owing to their heavy logisticaldemands. Combining them means more than twice the difficulties and sometimes thefinal result is not as good as expected, as stressed by Pullen et al. (1992). Finally,capture-recapture methods suffer mainly from the influence of learning and aggre- .gation;' in addition to the difficulty of assessing tag return. There is no doubt thattagging is a valuable technique for studying fish migration, association with floatingobjects and other behavioural traits. If tagging is used as a reliable method of stockassessment of pelagic species, there must be a good system for recording the taggedfish in the catches.

Chapter 11Conclusion
Behavioural ecology is still a young branch of science which had its origins in themiddle of the nineteenth century, and even later as far as fish are concerned. Despitethe benefits gained recently from technological advances in the study of fish behaviour, this branch of science is still immature compared with other branches such asphysics or medicine. In this book we have often mentioned conflicting results, but thisdoes not mean that one represents the truth, the other not. Unexpected (and thereforenot measured) factor(s) can explain such differences in the results. Certainly what weconsider 'noise' or 'random effects' at the level of the population hides a complexstructure of individual behaviour. Three examples can illustrate this apparentcomplexity.
First, the homing behaviour of tunas under anchored FADs indicates that theapparent randomness of the time of return to a given FAD arises from the juxtaposition of different deterministic behaviours of different schools, if not of individuals, having a precise time interval of arrival (section 6.3.1). Second, there is growingevidence that what is usually considered a single exploited stockis an assemblage ofspatially overlapping or mixed populations, each relatively independent from agenetic point of view, which results in a hysteresis effect when some of these populations collapse owing to local overfishing; when fishing effort is then decreased, thecatch-effort curve is no, longer reversible (sections 3.3.1,7.3 and 8.7.2). Third, somecomplex patterns of migration result from length (or age) dependence at the level ofseasonal migration - as in Atlantic menhaden (section 3.2) - or at the level of dailymigration of specific groups which have their own route - as in gadoids (section 3.3.8)or grunts (section 7.3). Archive and 'pop-up' tags will soon permit understanding ofspatial fish behaviour at the individual level, at least for fish large enough to carrysuch tags. Different simulation approaches, especially the IBM coupled with GIS, arealready available to incorporate the resulting findings and will certainly provide inreturn interesting suggestions for research through an interactive dialogue with fieldresearch, as occurs in terrestrial ecology (e.g. Drogoul et al., 1992).
Another weak point of our present knowledge concerns the interactions betweenspecies. Despite the fact that ecological literature is rich in equations relative to theseinteractions at the population level, the underlying mechanisms at the individual fishlevel are often not understood. How fish compete, interact or associate with others indifferent ecological niches definitely needs further investigation.
All stock assessment methods may suffer large biases owing to fish behaviour andmore particularly to spatial distribution at different scales (Table. 11.1). Age

286 Chapter JJ
Table 11.1 Summary of the biases in stock assessment methods due to fish behaviour (modified afterFreon et al., 1993a).
Behavioural Age structured Surplus Acoustic Gear Aerialpattern analysis (ASA) production models survey survey survey
Habitatselection
Short term 0 0 + + or-- + or- + or-Circadian 0 O· + + or-- + + or -- from - to ---Seasonal 0 O· + or- + + or-- from - to ---Yearly + or- + + + or --- 0 + + or -- from- to ---
Aggregation 0 + + + or--- + + or-- + + or-- + or-Avoidance 0 0 0Attraction/ 0 ++ 0 ++ 0associationLearning 0 0
+ overestimation- underestimation• except if interannual changes in the fishing pattern are not taken into account.
structured models seem to be an exception because the influence of fish behaviour onthem is more cryptic, but they can be directly responsive to habitat choice, and tolearning in extreme circumstances. In addition, owing to the difficulty in estimatingthe proper value of the terminal F of partly exploited cohorts, this method is notalways appropriate to reflect rapid changes in the exploitation level and can lead to apermanent underestimation of the rate of exploitation (Fig. 11.1, from Brethes, 1998).Moreover, ifage structured models can be useful for stock management, one of theirmain outputs - the fishing mortality coefficient - must be converted to fishing effort.This requires a proper estimate of the catchability coefficient (but we concede that thisis not directly the case for another important output, the TAC). In addition, manyASA models must be tuned by at least one parameter (fishing effort, CPUE, catchability coefficient or recruitment) estimated by other methods. Therefore, if thisparameter is overly dependent on fish behaviour, the management advice will beinappropriate. Better knowledge of the key factors governing catchability and habitatselection would in many instances be helpful for limiting such biases. Special attentionmust be paid to:
(I) The changes in factors governing the selection of habitat at different life historystages
(2) The importance of physical gradients to fish orientation and distribution(3) Possible long-term changes in habitat selection.
We still ignore which senses are predominant in the orientation of most pelagicspecies, and therefore we scarcely know which environmental cues they are using tofind their suitable habitat at a given time and to move to another one when necessary.
Direct stock assessment methods are sensitive to small-scale variations in naturalfish behavioural patterns, and reactions to the vessel or the fishing gear may have alarge effect on them. On some occasions, the variability in biomass estimate can also

Conclusion 287
1.2
"........
.~ 1.0
1::' 0.8oto 0.6EC1' 0.4c..c~ 0.2
..."..""
//
//
L/
//
"..-" ".." "...,
o f I I i I I r I I I I I I79 80 81 82 83 84 85 86 87 88 89 90 91
Year
Fig. 11.1 Comparison between mortality estimates of cod in the Gulf of St Lawrence from 1979 to 1991.• = F (year) - year by year estimate; .. = F (comv.) - a posteriori estimation for fully recruited cohorts byconvergence of the VPA. (Redrawn after Brethes, 1988.)
be explained by environmental or intrinsic (species, physiological stage) factors. Tounderstand the causes of the natural behavioural patterns and avoidance reactions,more detailed studies on the interactions within and between these two groups offactors are needed. Experiments in large tanks or mesocosrns with a controlledenvironment are necessary, but to study large-scale effects, in situ observations 'remainindispensable, especially for pelagic fish, which most of the time are schooling orshoaling in great numbers. We argue that such research must be escalated as there isgreat potential for increasing the accuracy of stock assessment methods throughbetter understanding· and knowledge of fish behaviour. Recent technologicalimprovements in acoustics and in visual observation make it possible to reach thisgoal, especially if fishery biologists benefit from the rigour in experiment design,definition of quantitative indicators and data analysis in use in experimental ethology.Field research is expensive because it requires time at sea. To place observers on boardcommercial fishing vessels is a more economical way to make observations, but wethink that in this field of investigation, research vessels are still indispensable. Notethat, paradoxically, most of the increase in catchability comes from increasingknowledge on fish behaviour (from fishermen or scientists) or from sophisticatedtechnological developments aimed at studying this behaviour or at least detectingfish. In turn this increase in catchability, if not properly controlled, leads to anincrease in catches and therefore favours stock collapse.
An appreciation of the interaction between the behaviour of fish and that offishermen is necessary to better understand the links between stock abundance andCPUE, and also between the large-scale geographical distribution of the stock and theusually smallest area covered by the fleet. These spatial aspects are poorly known butit is likely that they depend. on the level of aggregation of the fish (school, cluster,layers), on their availability (depth, distance to the harbour, etc.) and on social andeconomic factors ..Here scientific observers on board commercial vessels can be veryefficient at gaining some insight into fishermen's tactics and strategy which can be

288 Chapter 11
incorporated in a fishery GIS for instance. This is a promising field of investigationeven though modelling (both fish population dynamics, fishermen, and sometimesfish commercialisation) requires so many parameters that the corresponding modelsare mainly useful tor simulating scenarios rather than for prediction (Hilborn &Waiters, 1987). Adaptive management (Waiters, 1986) will probably remain an efficient way of avoiding stock collapse for many years.
Despite the fact that this book is largely devoted to stressing the importance of fishbehaviour on stock assessment, we are very concerned by other bottlenecks lessrelated to fish behaviour. It is not realistic to propose a universal prioritisation amongthe research needs related to stock assessment, because the priority depends on themethod and on the stock considered. Therefore the following list of weak pointsrelated to stock assessment, mixing behaviour-related studies with others, does notpretend to be ordered:
• Stock-unit identification (in too many cases the first assumption of populationdynamics models is violated because they are applied either to substocks or toseveral isolated stocks)
• Quesjienable value of the generalisation of natal homing and learning of migration routes in the population structure of pelagic species (micro satellite DNAanalysis and modern tagging techniques can be helpful in these investigations)
• Analysis of spatial effects at different scales, which first requires small temporaland spatial scale data collection
• Estimation of the absolute value of natural mortality, its interannual variation andits variability according to age (ASA models)
• Identification of the source of variation of catchability (availability, gear efficiency, cooperation, saturation, influence of learning, effect of the environment,etc.)
• Quantification of the effects of environmental changes on abundance (recruitment, mortality and growth)
" Identification of the key factors of the stock-recruitment relationship• Dynamics of the interactions within the whole ecosystem (food web, competition
between species, etc.)• Reason(s) for and variability of the association ofpelagic fish with floating objects
(fixed or drifting) or to spatial structure (seamounts, islands, etc.).
Most of these weak points are directly related to the assumptions of direct or indirectstock assessment methods. All applied methods have reached a high level ofsophistication, either at the conceptual level (modelling, mathematics, statistics) or atthe technological level (acoustic or visual sensors, signal processing, etc.). As a result,a fishing biologist can be compared to a driver who wishes to cross an unknown desertin a racing car with a GPS (global positioning system), assuming that there are goodroads and many petrol stations. A closer comparison to fish biology could be toimagine an entomologist studying the population dynamics of bees with a sophisticated demographic model and with a new brand bee detector, ignoring the existenceof bee-hives and queens and assuming that all individuals in a given area belong to thesame population, that they are able to reproduce and can be counted in the field when

Conclusion 289
gathering pollen. Nowadays our limits in stock assessment are more on the side ofbasic knowledge than on methods of representation and modelling.
Fisheries management is the next step following stock assessment and it requiresadditional inputs not contemplated in this book but that cannot be ignored: social,economic and political aspects, ecosystem management, trade-offs between fisheriesmanagement and management of other users of the sea or the coastal area (aquaculture, tourism, navigation, etc.). This makes fishery management a complex taskwhich requires a close cooperation of a broad category of actors as underlined byCaddy and Mahon(1995). The use of reserves for management is an old method,common in terrestrial ecology but curiously limited for marine species; It has enjoyeda renewal of interest (Roberts, 1995; Bohnsack & Ault, 1996; Pauly, 1997b; Roberts,1997), but as far as pelagic fish are concerned, the limit of the proper use of thismethod is once more our poor knowledge of population structure (number of stockunits and nurseries, diffusion of fish, migration pattern, natal homing, etc.).
The lack of basic knowledge on fish ecology (in the broad sense of the word) has leftthe door open for increasing fishing mortality and dramatic overexploitation. Atpresent the large majority of commercially exploited stocks are either overexploitedor fully exploited (FAO, 1996), and in most marine ecosystems, exploitation hasshifted from the apex predators (now largely overexploitedif not extinguished) tolower levels ofthe food chain, that is mainlysmallpelagic species (Pauly et al., 1997).These 'forage fish', like any schooling pelagic species, can be overexploited withoutgiving the 'warning' of a sharp decrease in yield, because their catchability oftenincreases when they are depleted. The overexploitation of forage fish can endangerthe whole ecosystem and modify it irreversibly, at least in the medium-term. The roleof fishery biologists is to stress the priority of resource preservation for future generations. Captain. J.-Y. Cousteau died a few days before we wrote these lines. He. wasa great populariser of science and inspired many vocations of marine scientists bypromoting underwater visual observation, but most of all he was an active defender ofour marine heritage. It is also the responsibility of fishery biologists to continue thiswork and to produce accurate stock assessments. A close cooperation between fisherybiologists and ethologists is one (and only one) way of increasing our knowledge offish behaviour. 'Knowledge is a patrimony of humanity', said Louis Pasteur (18221895), and this second patrimony is necessary to preserve the first and concrete one:the life on mother earth.

References
Abrahams, M.V. & Colgan, P. (1985) Risk of predation, hydrodynamic efficiency and their influence onschool structure. Environ. Bioi. Fish., 13, 195~202.
Aglen, A. (1983) Random errors of acoustic fish abundance estimates in relation to the survey grid densityapplied. FAO Fish. Rep., 300, 293-8.
Aglen, A. (1994) Sources of error in acoustic estimation of fish abundance. In: Marine Fish Behaviour inCapture and Abundance Estimation (eds. Feme, A. & Olsen, S.), pp. 107-33. Fishing News Books,Oxford.
Ahrenholz, D.W., Nelson, W.R. & Epperly, S.P. (1987) Population and fishery characteristics of Atlanticmenhaden, Brevoortia tyrannus. Fish. Bull. (USA), 85 (3), 569--600.
Akishige, Y., Yoshimura, H., Nishida, H., Kuno, T., Morii, Y. & Aoshima, T. (1996) Flotsam in theequatorial counter current region of the western Pacific with reference to tuna purse seine fishing.Bulletin of the Faculty of Fisheries, Nagasaki University, 77, 97-102.
Aksnes, D.L. & Giske,J.A. (1993) Theoretical model of aquatic visual feeding. Ecol. Model., 67 (2-4), 23350.
Alderdice, D.F. & Hourston, A.S. (1985) Factors influencing development and survival of Pacific herring(Clupea haregus pallasii eggs and larvae to beginning ofexogenous feeding. Can. J. Fish. Aquat. Sci., 42(Suppl. I), 56--68.
Alekseev, A.P. (ed) (1968) Fish Behaviour and Fishing Techniques. All-Union Conference held in Murmansk, 27 February to 1 March, 1968. Ministry of Fisheries of the USSR.
Alevizon, W.S. (1976) Mixed schooling and its possible significance in a tropical western Atlantic parrotfishand surgeonfish. Copeia,(4), 796-8.
Alheit, J. (1993) Use of the daily egg production method for estimating biomass of c1upeoid fishes: a reviewand evaluation. In: Advances in the Early Life History of Fishes. Part 2. Ichthyoplankton Methods forEstimating Fish Biomass (eds. Hunter, J.R., Lo, N.C.H. & Fuiman, L.A.), pp. 750--67. Bull. -Mar. Sci.(US), 53 (2).
Ali, M.A. (Ed.) (1992) Rhythms in Fishes. Plenum Press, New York.AlIan, J .R. (1986) The influence of species composition on behaviour in mixed-species cyprinid shoals. J.
Fish Bioi., 29 (Suppl. A), 97-106.AlIan, J.R. & Pitcher, T.1. (1986) Species segregation during predator evasion in cyprinid fish shoals.
Freshwater Bioi., 16, 653-9.Alien, J.M., Blaxter, J.H.S. & Denton, E.1. (1976) The functional anatomy and development of the
swimbladder-inner-ear-lateral line system in herring and sprat. J.Mar. Bioi. Assn. (UK), 56, 471-86.Alien, P.M. & McGlade, J.M. (1986) Dynamics.of discovery and exploitation: the case of the Scotian shelf
groundfish fisheries. Can. J. Fish. Aquat. Sci., 43, 1187-200.Alien, P.M. & McGlade, J.M. (1987) Modelling complex human systems: a fisheries example. Eur. J. Oper.
Res., 30, 147--67.Alien, R.L. (1985) Dolphins and the purse-seine fishery for yellowfin tuna. In: Marine Mammals and
Fisheries (eds. Beddington, J.R., Beverton, R.J.H. & Lavigne, D.M.), pp. 236-52. Alien and Unwin,Winchester. .
Allendorf, F., Ryman, N. & Utter, F. (1986) Genetics and fishery management: past, present and future. In:Population Genetics and Fishery Management (ed. Ryrnan, N.), pp. 1-22. University of WashingtonCity, Washington.
Altbacker, V.& Csanyi, V. (1990) The role of eye-spots in predator recognition and antipredatory beha. viour of the paradise fish (Macropodus opercularis). Ethology, 85,51-7.
Anderson, J.1. (1980) A stochastic model for the size of fish schools. Fish. Bull. (US), 79 (2),315-23.

References ' 291
Aneer, G., Florell, G., Kautsky, U., Nellbring, S. & Sjestedt, L. (1983) In-situ observations of the Balticherring (Clupea harengus membras) spawning behaviour in the Aska-Landsort area.jiorthern Balticproper. Mar. Bioi., 74, 105-10.
Anon. (1976) Rapport du groupe de travail sur la sardinelle (S. aurita) des cotes ivoiro-ghaneennes. FisheryResearch Unit Tema, Centre Rech. Oceanogr, Abidjan, Orstom Editions, Paris.
Anon. (1979) Small fish - big trawls. Fishing News International, 18 (2), 22.Anon. (1988) Report of the mackerel working group. ICES CM/1988, Assess: 12.Anon. (1992) Dolphins and the Tuna Industry. Washington, DC National Academy Press.Anon. (1995) Annual report of the Inter-American Tropical Tuna Commission (1995). La Jolla.Anon. (1996) Report ofthe northern pelagic and blue whitingfisheries working group. ICES CM 1996/Assess:
14.Anon. (1997) Annual report of the Inter-American Tropical Tuna Commission, La Jolla:Anthony, P.D. (1981) Visual contrast thresholds in the cod Gadus morhua L. J. Fish. Bioi., 19,87-103.Anthony, V.C & Fogarty, M.J. (1985) Environmental effects on recruitment, growth and vulnerability of
atlantic herring (Clupea harengus harengusi in the Gulf of Maine region. Can. J. Fish. Aquat. Sci., 42, (Suppl. I), 158-73. ,
Aoki, L (1982) ksimulation study on the schooling mechanism in fish. Bull. Japan. Soc.Sci. Fish., 48 (8),1081-8.
ApjJenzeller, A.R. & Legget, W.C (1992) Bias in hydroacoustic estimates of fish abundance due to acousticshadowing: evidence from day-night surveys of vertically migrating fish. Can. J. Fish. Aquat . Sci., 49(10), 2179-89.
Argue, A.W., WiIliams, M.J.,& Hallier, J.-P. (1987) Fishing performance of some natural and culturedbaitfish used by pole-and-line vessels to fish tunas in the central and western Pacific Ocean. South PacificCommission, Nournea. Tech. Rep. 18.
Ariz, X., Delgado, A. & Fonteneau, A. (1992) Logs and tunas in the eastern tropical Atlantic. A review ofpresent knowledge and uncertainties. In: International Workshop on the Ecology and Fisheriesfor TunasAssociated with Floating Objects and on Assessment Issues Arising from the Association of Tunas withFloating Objects (ed. Hall, M.) Inter-American Tropical Tuna Commission Intern. Rep., San Dieto(mimeo). '
Armstrong, F., Simmonds, E.J. & MacLennan, D.N. (1989) Sound losses through aggregations of fish.Proc. I.O.A., 11, 35-43.
Armstrong; M.J. & Thomas, R.M. (1989) Clupeoids. In: Oceans of Life off Southern Africa (eds. Payne,A.LL. & Crawford, R.J.M.), pp. 105-12. Vlaeberg, Cape Town.
Armstrong, M.J., Chapman, P., Dudley, S.F.J., Hampton, L & Malan, P.E. (1991) Occurrence andpopulation structure of pilchard Sardinops ocellatus, round herring Etrumeus whiteheadi andanchovyEngraulis capensis off the East coast of Southern Africa. S. Afr. J. Mar. Sci., 11, 227-49.
Arnold, G.P., Greer Walker, M., Emerson, L.S. & Holford, B.H. (1994) Movements of cod (Gadus morhuaL.) in relation to the tidal streams in the southern North Sea. ICES J. Mar. Sci., 51,207-32.
Arruda, L.M. (1984) Sexual maturation and growth of Trachurus trachurus(L.) along the Portuguese coast.Investigacion Pesq., 48 (3), 419-30. .
Atema, J. (1980) Chemical senses, chemical signals, and feeding behaviour in fishes. In: Fish Behaviour andIts Use in the Capture and Culture of Fishes: Proceedings of the Conference on the Physiological andBehavioral Manipulation of Food Fish as Production and Management Tools (eds Bardach,J.E.,Magnuson, J.J., May, R.C'& Reinhart, J.M.), pp. 57-101. Bellagio, Italy, 3-8 November 1977.ICLARM Conference Proceedings (Manila).
Atema, J., Holland, K. & Ikehara, W. (1980). Olfactory response of yellowfin tuna iThunnus albacares) toprey odours: chemical Search image. J. Chem. Ecol., 6, 457--65.
Atkinson, D.B., Rose, G.A., Murphy, E.F. & Bishop, CA. (1997) Distribution changes and abundance of. northern cod (Gadus morhua), 1981-1993. Can. J. Fish. Aquat. Sci., 54 (Suppl. I), 132-138.
Atz, J.W. (1953) Orientation in schooling fishes. In: Proc. Con! Orientation Anim., section 2,103-30. Off., Nav. Res. Washington D.C
Au, D. W. (1991) Polyspecific nature of tuna schools: shark, dolphin, and seabird associations. Fish. Bull.(US), 89 (3), 343-54.
Au, b.W.K. & Pitman, R.L. (1988) Seabird relationships with tropical tuna and dolphins. In: Seabirdsand Other Marine Vertebrates (ed. Burger, J.), pp. 174--212. Columbia University Press, NewYork.

292 References
Azuma, T. (1991) Diurnal variations in salmon catch by. surface gillnets in the Bering Sea during thesummer. Bull. Japan. Soc. Sci. Fish., 57 (11), 2045-50.
Babayan, V.K. & Kizner, Z.I. (1988) Dynamic models for TAC assessment: logic, potentialities,development. Coli. Scient. Pap. Int. Comm. SE Atl. Fish., 15 (1),69-83.
Bahri, T. (1995) Etude de la structure spatiale de la biomasse des poissons pelagiques cotters et analysepreliminaire des relations avec l'environnement: le cas de la Mer Catalane. Diplome d'Etudes Approfondies, Universite Paris VI (France).
Bailey, . K.M. (1989) Interaction between the vertical distribution of juvenile walleye pollockTheragra chalcogramma in the eastern Bering Sea, and cannibalism. Marc. Ecol.-Progr, Ser., 53,205-13.
Baird, J.W., Bishop, CA. & Murphy, E.F. (l99Ia) Sudden changes in the perception of stock size andreference catch levels for cod in north-eastern Newfoundland shelves. NAFO Sci. Coun. Studies, 16,111-19. .
Baird, T.A., Ryer, CH. & Olla, B.L. (1991b) Social enhancement of foraging on an ephemeral food sourcein juvenile walleye pollock Theragra chalcogramma. Environ. Bioi. Fish., 31 (3), 307-1.1.
Baker, R.R. (1978) The Evolutionary Ecology of Animal Migration. Hodder & Stoughton, London.Bakken, E (1983) Recent history of Atlanto-Scandian herring stocks. FAO Fish. Rep., 291 (2), 521-36.Bakun, A. (1985) Comparative studies and the recruitment problem: searching for generalisations. Cal-
COFI Rep., 26, 30--40.Bakun, A. (1989) Mechanisms for density-dependent growth in Peruvian anchoveta; alternatives to impact
on the regional-scale food supply. In: The Peruvian Upwelling Ecosystem: Dynamics and Interactions(eds Pauly, D., Muck, P., Mendo, J. & Tsukayama, I.), pp. 235--43. ICLARM, Manila.
Bakun, A. (1996) Patterns in the Ocean: Ocean Processes and Marine Population Dynamics. University ofCalifornia Sea Grant, San Diego,. California, USA, and Centro de Investigaciones Biologicas deNoroeste, La Paz, Baja California Sur, Mexico.
Bakun, A. & Parrish, R.H. (1990) Comparative studies of coastal pelagic fish reproductive habitats: theBrasilian sardine (Sardinella aurita), J. Cons. Int. Explor. Mer, 46 (3), 269-83.
Bakun, A. & Parrish, R.H. (1991) Comparative studies of coastal pelagicfish reproductive habitats: theanchovy Engraulis anchoita of the south-western Atlantic. ICES J; Mar. Sci., 48 (3), 343-61.
Balchen, J.G. (1984) Recent progress in the control of fish behaviour. Modelling, Identification andControl,52,113-21.
Barange, M. (1994) Acoustic identification, classification and structure of biological patchiness on the edgeof the Agulhas Bank and its relation to frontal features. S. Afr. J. Mar. Sci., .14,333--47.
Barange, M. & Hampton, I. (1994) Influence of trawling on in situ estimates of Cape horse mackerel(Trachurustrachurus capensis) target strength. ICES J. Mar. Sci., 51, 121-6.
Baranov, F.1. (1918) On the question of the biological basis of fisheries. Nauchnye Issledovaniya Ikhtiologicheskii Instituta Izvestiya, 1,81-128.
Baras, E. (1996) Comrnentaire al'hypothese de l'eternel retour de Cury (1994): proposition d'un mecanismefonctionnel dynamique. Can. J. Fish. Aquat. Sci., 53, 681--4.
Bard, F.-X., Stretta, J.-M. & Slepoukha, M. (1985) Les epaves artificielles comme auxiliaires de la pechethoniere en ocean atlantique. Quel avenir? La Peche Maritime, 655-9.
Bardach, J.A., Magnuson, J.1., May, R.C & Reinhart, J.M. (eds) (1980) Fish Behaviour and Its Use in theCapture and Culture of Fishes: Proceedings of the Conference on the Physiological and BehaviouralManipulation ofFood Fish as Production and Management Tools, Bellagio, Italy, 3-8 November 1977.ICLARM Conference Proceedings, Manila.
Barlow, G.W. (1993) Fish behavioural ecology: pros, cons and opportunities. In Behavioural Ecology ofFishes (eds Huntingford, F.A. & Torricelli, P.), pp. 7-27. Harwood Academic Publishers, Chur.
Barria, P. (1990) Situacion nacionaJ de los principales recursos pelagicos. In: Perspectivas de la ActividadPesquera en Chile (ed. Barbieri, M.A.), pp. 67-71. Escuela de Ciencias del Mar, Universidad catolica deValparaiso.
Barut, N.C (1992) The payao fisheries in the Philippines and some observation on the behaviour of tunasaround payao. In: International Workshop on the Ecology and Fisheries for Tunas Associated withFloating Objects and on Assessment Issues Arising from the Association of Tunas with Floating Objects(ed. Hall, M.). Inter-American Tropical Tuna Commission Int. Rep., San Diego.
Batalyants, K.Ya. (1992) On the hypothesis of comfortability stipulation of tuna association with naturaland artificial floating objects. ICCAT Rec. Doe. Sci., 40 (2), 447-53.

References 293
Batty, R.S., Blaxter, J.H.S. & Libby, D.A. (1986) Herring (Clupea harengus) filter-feeding in the dark. Mar.Bioi., 91,371-5.
Bayliff, W.H. (1984) Migrations of yellowfin and skipjack tuna released in the central portion of the easternPacific Ocean, as determined by tagging experiments. Inter-American Tropical Tuna Commission.Intern. Rep., 18.
Bayliff, W.H. (1988) Integrity of schools of skipjack tuna, Katsuwonus pelamis, in the eastern Pacific ocean,as determined from tagging data. Fish. Bull. (US), 84 (4),631-43.
Baylis, J .R. (1981) The evolution of parental care in fishes, with reference to Darwin's rule of male sexualselection. Environ. Bioi. Fish., 6, 223-51.
Belinay de, A. (1994) Hydros contre harengs. Info-Pilote, February, 20-22.Beltestad, A.K. (1974) Feeding behaviour, vertical migration and schooling among Osgroup herring (Clupea
harengus L.) in relation to light intensity. MSc. Thesis, University of Bergen(in Norwegian, unpublished).Beltestad, A.K. & Misund, O.A. (1988a) Behaviour of Norwegian spring spawning herring in relation to
underwater light. ICES FTFB Working Group 1988/04/18-19, Ostende.Beltestad, A.K. & Misund, O.A. (1988b) Attraction of Norwegian spring-spawning herring to underwater
light. In: Proceedings of World Symposium on fishing gear and fishing vessel design, pp. 190-2. TheMarine Institute, St. John's, Newfoundland.
Beltestad, A.K. & Misund, O.A. (1990) On the danger of incidental fishing mortality in herring purseseining. In: Proceedings of the International Herring Symposium, pp. 617-628. Anchorage, Alaska,USA, 23-25 October, 1990.
Ben-Tuvia, A. & Dickson, W. (eds) (1968) Proceedings of the conference on fish behaviour in relation tofishing techniques and tactics, Bergen, Norway, 19-22 October, 1967. FAO Fish Rep., 62.
Ben-Yarni, M. (1976) Fishing with Light. FAO of the United Nations. Fishing News Books, Oxford.Ben-Yami, M. (1995) Tuna fishing - a review: (part I - General). FAO Infofish International, 5/95, 69-76.Bercy, C. & Bordeau, C. (1987a) Effects of underwater noise radiated by tuna fishing boats on fish
behaviour. International Symposium on Fisheries Acoustics, 22-26 June, 1987, Seattle, Washington,USA, pp. 1-8.
Bercy, C. & Bordeau, A. (1987b) Physiological and ethological reactions of fish to low frequency noiseradiated by sounders and sonars. International Symposium on Fisheries Acoustics, 22-26 June, 1987,Seattle, Washington, USA, pp. 1-14.
Berg, A.B. van den (1985). Analysis of the phase difference between particle motion components of soundby teleosts. J. Exp. Bioi., 119, 183-97.
Berkeley, S.A. & Waugh,G.T. (1989) Considerations for regional swordfish management. Proceedings ofthe Gulfand Caribbean Fisheries Institute, Miami; 39, 171-80.
Bernstein, c., Kacelnik, A. & Krebs, 1. (1988) Individual decisions and the distribution of predators in apatchy environment. J. Anim. Ecol., 57, 1007-26.
Bernstein, C.; Kacelnik, A. & Krebs, J. (1991) Individual decisions and the distribution of predators in apatchy environment. 11. The influence of travel costs and structure of environment. J. Anim. Ecol., 60,205-25.
Bertram, B.C.R. (1978) Living in groups: predators and prey. In: Behavioural Ecology (eds Krebs, J.R. &Davis, N.B.), pp. 64--96. Blackwell Science, Oxford.
Beukema, J.1. (1970) Angling experiments with carp iCyprinus carpio L.), 2. Decreasing catchabilitythrough one-trial learning. Neth. J. Zool., 20 (1),81-92.
Beverton, R.1.H. (1954) Notes on the use of theoretical models in the study of the dynamics ofexploitedfishpopulations. U.S. Bureau of Commercial Fisheries, Fisheries Laboratory, Miscellaneous Contribution2, Beaufort, North Carolina.
Beverton, R.1. (1990) Small marine pelagic fish and the threat of fishing; are they endangered? J. Fish Biol.,37 (Supp.), 5-16.
Beverton, R.1.H. & Holt, SJ. (1957) On the dynamics of exploited fish populations. Fish. Invest. London,Ser. 11, 19, 1-533.
Binet, D. (1982) Influence des variations c1imatiques sur la pecherie des Sardinella aurita ivoiro-ghaneennes:relation secheresse-surpeche. Oceanol. Acta, 5 (4), 443-52.
Binet, D., Samb, B., Taleb Sidi, M., Levenez, J.L. & Servain, J. (1997) Sardine and other pelagic fisherieschanges associated with multi-year trade wind increases in the southern Canary current (26°N-14°N)1964--1993. In: Global versus Local Changes in Upwelling Systems (eds Durand, M.H., Cury, P.,Mendelssohn, R., Roy, c., Bakun, A. & Pauly, D.). Orstom Editions, Paris.

294 References
Bjordal, A. & Lakkeborg, S. (1997) Longlining. Fishing News Books, Oxford.Bjerndal, T. & Conrad, J .M. (1987) The dynamics of an open access fishery. Can. J. Econ., 20, 75-85.Blaber, SJ.M., Brewer,D.T. &Salini,J.P. (1995)Fish communities and the nursery roleofthe shallow inshore
waters of a tropical bay in the Gulf of Carpentaria, Aust. Estuar. Coast. Shelf Sci., 40 (2), 177-93.Blackburn, M. (1965) Oceanography and the ecology of tunas. Oceanogr. Mar. Bioi., 3, 299-322.Blaxter, J.H.S. (1985) The herring: a successful species. Can. J. Fish. Aquat, Sci., 42 (Suppl. 1),21-30.Blaxter, J.H.S. & Batty, R.S. (1984) The herring swimbladder: loss and gain of gas. J. Mar. Bioi. Assoc.
(UK), 64 (2), 441-59.Blaxter, J.H.S. & Batty, R.S. (1990) Swimbladder 'behaviour' and target strength. Rapp. P.-v. Reun.Cons.
Int. Explor.Mer, 189,233--44.Blaxter, J.H.S. & Holliday, F.G.T. (1963)The behaviour and physiology of herring and other c1upeids. Adv.
Mar. Bioi., 1,261-393.Blaxter, J.H.S. & Hunter, J.R. (1982) The biology of c1upeoid fishes. Adv. Mar. Bioi., 20, 1-223.Blaxter, J.H.S. & Tytler, P. (1978) Physiology and function of the swimbladder. Adv. Comp. Physiol.
. Biochem., 7, 311-67.Blaxter, J.H.S., Gray, J.A.B. & Denton, EJ. (1981) Sound and startle responses in herring shoals, J. Mar.
Bioi. Assn: (UK), 61, 851-69.Block, B.A., Dewar, H., Williams, T., Prince, E., Farwell, C. & Fudge, D. (1997) Archival and pop-up
satellite tagging of Atlantic bluefin tuna, Thynnus thynnus.In: 48th Tuna Conference at Lake Arrowhead (eds Scott, M. & Oson, R.). Inter-American Tropical Tuna Commission Int. Rep., San Diego.
Bodholdt, H. (1982) A multi-beam sonar for fish school observation. ICES/FAO Symposium on FisheriesAcoustics, Bergen, Norway, 21-24 June 1982, Doe. no. 55.
Bodholdt, H. & Olsen K. (1977) Computer-generated display of an underwater situation: applications infish behaviour studies. Rapp. P.-v. Reun. Cons. Int. Explor. Mer, 170,31-5.
Bodholdt, H., Ness, H. & Solli, H. (1989) A new echo-sounder system. Proc. Inst. Acoust., 11, 123-30.Boehlert, G.W. & Genin, A. (1987) A review of the effects of seamount on biological processes. In: Sea
mounts.Lslands and Atolls (eds Keating, RH., Fryer, P., Batiza, R. & Boehlert, G.W.), pp. 319-334. J.Mar. Res., 43.
Boehlert, G.W. & Mundy, B.C. (1994) Vertical and onshore-offshore distributional patterns of tuna larvaein relation to physical habitat features. Mar. Ecol. Prog. Ser., 107, 1-2, 1-13.
Boely, T. (1980a) Biologie des deux especes de Sardinelle: Sardinella aurita (Valenciennes 1847)et Sardinellamaderensis ( Lowe 1841) des cotes senegalaises. These de Doctorat de l'Universite de Paris VI (France).
Boely, T. (l980b) Etude du cycle sexuel de la sardine lie plate Sardinella maderensis (Lowe 1841)des cotessenegalaises, Cybium, 8 (3), 77-88.
Boely, R. & Freon, P. '(1979) Les ressources pelagiques cotieres. In: Les ressources halieutiques del'Atlantique Centre-Est. lere partie: les ressources du Golfe de Guinee, de l'Angola ala Mauritanie (edsTroadec, J.-P. & Garcia, S.),pp. 1-2-78. FAO Tech. Paper 186 (I).
Boely, T., Chabanne, J. & Freon, P. (1978) Schernas des cycles migratoires, lieux de concentration et. periodes de reproduction des principles especes de poissons pelagiques cotiers dans la zone senegalo
mauritanienne. In: Rapport du groupe de travail ad hoc sur les poissons pelagiques ciitiers ouest-africainsde la Mauritanie au Liberia (l6°N ti 5°N), pp. 63-70. COPACE/FAO, PACE series 78/10 fr.
Boely, T., Chabanne, J., Freon, P. & Stequert, B. (1982) Cycle sexuelet migrations de Sardinella aurita surle plateau continental ouest africain des iles Bissagos a la Mauritanie. Rapp. Pi-v, Reun. Cons. Int,Explor. Mer., 180, 350-5.
Boggs, C.H. (1992) Depth, capture time, and hooked longevity of longline-caught pelagic fish: timing bitesof fish with chips. Fish. Bull. (US), 90 (4), 642-58.
Boggs, C.H. (1997). Influence of sea surface temperature fronts and other environmental factors onswordfish and blue shark catches in the Hawaii-based longline fishery. In: 8th Tuna Conference at LakeArrowhead (eds Scott, M. & Oson, R.). Inter-American Tropical Tuna Commission, Int. Rep., SanDiego.
Boggs, C.H., Bigelow, K.A. & He, X. (1997) Influence of sea surface temperatue fronts and other environmental factors on swordfish and blue shark catch rate in the Hawaii-based longline fishery. In: 48thTuna Conference at Lake Arrowhead (eds Scott, M. & Oson, R.). Inter-American Tropical TunaCommission, Int. Rep., San Diego.
Bohnsack, J .A. & Ault, J .S. (1996) Management strategies to conserve marine biodiversity. Oceanography,9 (I), 73-82.

References 295
Borstad, G.A., Hill, D.A. & Kerr, R.C (1989) The compact airborne spectrographic imager (CASI): flightand laboratory examples. IGARRS' 89/12th. Canadian Symposium on' Remote Sensing, Vancouver,RC, 9-14 July (mimeo).
Borstad, G.A., Hill, D.A., Kerr, R.C & Nakashima, B.S. (1992) Direct digital remote sensing of herringschools. Int, J. Remote Sens., 13 (12), 2191-8.
Boyd, AJ., Taunton-Clark, J. & Oberholster, G.PJ. (1992) Spatial features of the near-surface and midwater circulation patterns off western and southern South Africa and their role in the life histories ofvarious commercially fished species. In: Benguela Trophic Functioning (eds Payne, A.LL., Brink, K.H.,Mann, K.H. & Hilborn, R.), pp. 189-206. S. Afr. J. Mar. Sci., 12.
Boyer, D., Boyer, H., D'Almeida, G., Cloete, R. & Agnalt, A.-L. (1995) The state of the northern Benguelapilchard stock. In: Annual Research Meeting (ed. Ministry of Fisheries and Marine Resources,Namibia), pp. 31-43, Rep. 1.
Bradford, M.J. & Peterman, R.M. (1989) Incorrect parameter values used in virtual population analysis(VPA) generate spurious time trends in reconstructed abundancies. In: Effect of Ocean Variability onRecruitment and an Evaluation of Parameters Used in Stock Assessment Models (eds Beamish, R.J. &McFarlane, G.A.), pp. 87-99. Can. Spec. Pub. Fish. Aquat. Sci., 108.
Brander, K. & Thomson, A. (1989) Diel differences in avoidance of three vertical profile sampling gears byherring larvae. J. Plankton Res., 11,775-84.
Brandt, A. von (1984) Fish Catching Methods of the World. Fishing News Books, Oxford.Brede, R., Kristensen, F.H., Solli, H. & Ona, E. (1990) Target tracking with a split-beam echo sounder.
Rapp. P.-v. Reun. Cons. Int. Explor. Mer, 189, 254-63.Breder, CM., Jr. (1929) Field observations on flying fishes: a suggestion of methods. Zoologica (USA), 9
(7), 295-312.Breder, CM., Jr. (1954) Equations descriptive of fish schools and other animal aggregations. Ecology, 35,
361-70.Breder, CM" Jr. (1959) Studies on social groupings in fishes, Bull. Am. Mus. Nat. Hist., 117, 393-482.Breder, CM., Jr. (1967) On the survival value of fish schools. Zoologica, 52, 25-40.Breder, CM., Jr. (1976) Fish schools as operational structures. Fish Bull. (US), 74, 471-502.Breder, CM., Jr. & Halpern, F. (1946) Innate and acquired behaviour affecting the aggregation of fishes.
Physiol. Zool., 19, 154--90.Breitburg, D.L.(1989) Demersal schooling prior to settlement by larvae of the naked goby. Environ. Bioi.
Fish., 26, 97-103.Brethes, J.-C (1998) Le poids de la science et de la gestion dans l'effondrement des stocks de poisson de
fond: I'example de la morue du sud du Golfe du Saint-Laurent. Aquat. Living Resour.(in press).Brett, J.R.(1979) Vol. VIII: Environmental factors and growth. In: Fish Physiology (eds Hoar, W.S.,
Randall, DJ. & Brett, J.R.), pp. 579--675. Academic Press, New York.Brill, R.W. (1997) How water temperature limits the vertical movement of pelagic fish. 48th Tuna Con
ference at Lake Arrowhead. Inter-American Tropical Tuna Commission, San Diego.Brill, R.W., Block, B., Boggs, C:, Bigelow, K., Freund, E. & Marcinek, D. (1996) Horizontal and vertical
movements of adultyellowfin tuna near the Hawaiian islands observed by acoustic telemetry. In:Sustaining Tuna Fisheries: Issues and Answers (eds Jackson, A., Rasmussen, R. & Bartoo, N.) Proceedings of the 47th tuna conference, Southwest Fisheries Science Center/National Marine FisheriesService, NOAA, La Jolla (mimeo).
Brock, R.E. (1985) Preliminary study of the feeding habits ofpelagic fish around Hawaiian fish aggregationdevices or can fish aggregation devices enhance local fisheries productivity? Bull. Mar. Sci., 37 (I), 4049.
Brock, V.E. (1954) Some aspects of the biology of aku, iKatsuwonls pelamis), in the Hawaiian Islands. Pac.Sci., 8 (I), 94--104..
Brodeur, R.D. (1988) Zoogeography and tophic ecology of the dominant epipelagic fishes in the northern. North Pacific. Japan-United States of America Seminar on the Micronection of the Subarctic Pacific,
Honolulu, HI (USA), 18 Mar 1985. Bull. Ocean Res. Inst. (Univ. Tokyo), 26, 1-28.Brossut, R., Dubois, P. & Rigaud, J. (1974) Le gregarisrne chez Blaberus craniifer: isolement et identifi
cation de la pheromone.v. Insect. Physiol., 20, 529-43.Browman, H.I., Novales-Flamarique, L & Hawryshyn, CW. (1994) Ultraviolet photoreception contributes
to prey search behaviour in two species of freshwater zooplanktivorousfishes. J. Exp. Bioi., 186, 18798.

296 References
Brown, G.E. & Smith, RJ.F. (1994) Fathead minnows use chemical cues to discriminate natural shoalmates from unfamiliar conspecifics. J. Chem. Ecol., 20 (12),3051--61.
Brown, W.L. & Wilson, E.O. (1956) Character displacement. Syst, Zool., 5, 49--64.Buckley, TW. & Miller, B.S. (1994) Feeding habits of yellowfin tuna associated with fish aggregation
devices in American Samoa. Bull. Mar. Sci., 55 (2-3), 445-59.Buerkle, U. (1968) Relation of pure tone thresholds to background noise level in the Atlantic cod. J. Fish.
Res. Board Can., 25 (6), 1155-60.Buerkle, U. (1969) Auditory masking and the critical band in Atlantic cod (Gadus morhua). J. Fish. Res.
Board Can., 26, 1113-19.Buerkle, U. (1974) Gill-net catches of cod (Gadus morhua L.) in relation to trawling noise. Mar. Behav.
Physiol., 2, 277-81.Buerkle, U. (1977) Detection of trawling noise by the Atlantic cod (Gadus morhua L.). Mar. Behav. Physiol.,
4,233--42.Buerkle, U. (1983) First look at herring distribution with a bottom referencing underwater towed instru
mentation vehicle 'BRUTIV'. FAO Fish. Rep., 300, 125--30.Buerkle, U. &Stephenson, R.L. (1990) Herring school dynamics and its impact on acoustic abundance
. estimation. Proceedings of the International Herring Symposium, Anchorage, Alaska, USA, 23-25October, 1990, pp. 185-208.
Burczynski, J. (1982) Introduction to the use of sonar system for estimating fish biomass. FAO Fish. Tech.Pap., 191 Rev. I.
Burd, A.c. (1985) Recent changes in the central and southern North Sea herring stocks. Can. J. Fish. Aquat,sa, 42 (Suppl. I), 192-206.
Burd, A.C. (1990) The North Sea herring fishery: an abrogation of management, pp. 1-22. In: Proceedingsof the International Herring Symposium, Anchorage, Alaska, USA, 23-25 October, 1990.
Burger, A.E., Wilson, R.P., Garnier, D. & Wilson, M.P.T (1993) Diving depths, diet, and underwaterforaging of rhinoceros auklets in British Columbia. Can. J. Zool., 71 (12), 2528--40.
Burgess, J.W. & Shaw, E. (1979) Development and ecology of fish schooling. Oceanus, 27, 11-17.Burnham, K.P., Anderson, D.R., White, G.c., Brownie, C. & Pollock, K.H. (1987) Design and analysis
methods for fish survival experiments based on release--eapture. American Fish. Soc. Monograph, 5.Bethesda, Maryland.
Bushnell, P.G. & Brill, R.H. (1992) Oxygen transport and cardiovascular response in skipjack tuna (Katsuwonus pelamis) and yellowfin tuna iThunnus albacares) exposed to acute hyposia. J. Comp. Physiol.B., 162, 131--43.
Butterworth, D.S. (1980) The value of catch-statistics-based management techniques for heavily fishedpelagic stocks with special reference to the recent decline of the South-West African pilchard stock.NA TO Symposium on Applied Operations Research in Fishing, Trondheim (Norway), 14 Aug 1979, 2,pp. 97-136.
Butterworth, D.S. & Andrew, P.A. (1984) Dynamic catch-effort for the hake stocks in ICSEAP divisions1.3 to 2.2. Coli. Sci. Pap. ICSEAFjRECL. Doe. Sci. CIPASE, II (1),29-58.
Buwalda, RJ.A., Schuijf, A. & Hawkins, A.D. (1983) Discrimination by the cod of sounds from opposingdirections. J. Comp. Physiol., 150, 175-84.
Caddy, J.F. & Defeo, O. (1996) Fitting the exponential and logistic surplus yield models with mortalitydata: some explorations and new perspectives. Fish Res., 25, 39--62.
Caddy, J.F. & Mahon, R. (1995) Reference points for fishery management. FAO Tech. Pap. 347.Cahn, P. (1972) Sensory factors in the side-to-side spacing and positional orientation of tuna, Euthynnus
affinis, during schooliong. Fish. Bull. (US), 70, 197-204.Caraco, T (1980) Stochastic dynamics of avian foraging flocks. Am. Nat., 115,262-75.Carey, F.G. (1992) Through the thermocline and back again - heat regulation in big fish. Ocean us, autumn,
79-85.Carey, F.G. & Olson, RJ. (1982) Sonic tracking experiments with tunas. Int, Comm. Conserv. Atl. Tuna.
Collect. Vol. Scient. Papers, 17 (2),458--66.Carey, F.G. & Robinson, B.H. (1981) Daily patterns in the activities of the swordfish Xiphias gladius,
observed by acoustic telemetry. Fish Bull. (US),79, 227-92.Carlisle, J. Jr., Turner, C. & Ebert, E. (1964) Artificial habitat in the marine environment. Calif. fish and
game, Fish Bull. (US), 124, 1-93.

References 297
Carlson, FT. & Reintjes, J.W. (1972) Suitability of internal tags for Atlantic menhaden. Fish. Bull. (USA),70 (2),514-17.
Carlson, TJ. & Jackson, D.R. (1980) Empirical evaluation ofthefeasibility ofsplit beam methodsfor direct insitu target strength measurement of single fish. Seattle Applied Physics Laboratory, University ofWashington (APL-WW 8006).
Carragher, J.F. & Rees, e.M. (1994) Primary and secondary stress responses in golden perch, Macquariaambigua. Comp. Biochem. Physiol., 107A (I), 49-56.
Carscadden, J .E., Frank, K.T. & Miller, D.S. (1989) Capelin (Mallotus vi//osus)spawning on the south-eastshoal: influence of physical factors past and present. Can. J. Fish. Aquat. Sci., 4(i, 1743-54.
Castonguay, M. & Gilbert, D. (1995) Effects of tidal streams on migrating Atlantic mackerel, Scomberscombrus L. ICES J. Mar. Sci., 52, 941~54.
Castonguay, M., Rose, G.A. & Legget, W.e. (1992) On movements of Atlantic mackerel (Scomberscombrus) in the northern Gulf of St Lawrence: association with wind-forced advections of warmedsurface waters. Can. J. Fish. Aquat. Sci., 49, 2232--41.
Caton, A.E. (1991) Review of aspects of southern bluefin tuna: biology, population and fisheries. In: WorldMeeting on Stock Assessment of Bluefin Tunas: Strengths and Weaknesses (eds Deriso, B. & Bayliff,W.), pp. 181-250. Inter-American Tropical Tuna Commission (USA), Special report.".
Caveriviere, A. (1982) Le baliste des cotes africaines (Balistes carolinensis): biologie, proliferation et possibilites d'exploitation. Oceanol. Acta, 5 (4),453-9.
Caveriviere, A. Gerlotto, F. & Stequert, B. (1980) Balistes carolinensis, nouveau stock africain. La PecheMaritime, August, 3-8.
Caveriviere, A., Kulbicki, M., Konan, J. & Gerlotto, F. (1981) Bilan des connaissances actuelles sur Balistescarolinensis dans le golfe de Guinee, Doe. Sci. Cent. Rech. Oceanogr. Abidjan, 12 (I), 1-28.
Cayre, P. (1982) Qu'est-ce qu'un banc de listao (Kasuwonus pelamis)? Quelques reflexions a partir d'observations faites lors des campagnes de marquage. ICCAT coli. vol. Scient. Pap., 17 (2), 467-70.
Cayre, P. (1985) Contribution al'etude de la biologie et de la dynamique du listao (Katsuwonus pelamis) ,Linnaeus 1958) de l'Ocean Atlantique. These de Doctorat, Universite Paris VI (France).
Cayre, P. (1987) L'oxygene dissous et la repartition des thons (albacore, listao et patudo) dans l'oceanAtlantique. La Peche Maritime, 1306, 92-5.
Cayre, P. (1990) Dispositifs de concentration de poissons et peche artisanale. In: Actes de la ConferenceThoniere Regionale. Commission De L'Ocean Indien (eds Le Gall, J.-Y., Reviers, X. & Roger, e.), pp.54-64. Colloques et Seminaires, Orstom Editions.
Cayre, P. (1991) Behaviour of yellowfin tuna (Thunnus albacares) and skipjack tuna (Katsuwonus pelamis)around fish aggregating devices (FADs) in the Comoros Islands as determined by ultrasonic tagging.Aquat. Living Resour., 4, \-\2.
Cayre, P. & Chabanne, J. (1986) Marquage acoustique et comportement de thons tropicaux (albacore:Thunnus albacares, et listao: Katsuwonus pelamis) au voisinage d'un dispositif concentrateur de poissons. Oceanogr. Trop., 21, 167-83.
Cayre, P. & Marsac, F. (199\) Report and preliminary results ofthe tagging programme ofnatural drift logs inthe tuna purse seine fishery area of the Western Indian Ocean. FAO lndo-Pacific Tuna Developmentand Management Progamme. Collect. Vol. Work. Doe., pp. 1-10.
Cayre, P. & Marsac, F. (1993) Modelling the yellowfin tuna (Thunnus albacares) vertical distribution usingsonic tagging results and local environmental parameters. Aquat. Living Resour., 6, 1-\4.
Cayre, P., Amon Kothias, J.B., Diouf; T. & Stretta, J.M. (1988) Biologie des thons. In: Ressources, peche etbiologie des thonides tropicaux de /'Atlantique centre-est (eds Fonteneau, A. & Marcille, J.), pp. 157266. FAO Fish. Tech. Pap. 292.
Champagnat, e. & Domain, F. (1979) Migrations des poissons demersaux le long des cotesOuest-Africaines de 10 a24° de latitude nord. Doe. Sci. Cent. Rech. Oceanogr. Dakar-Thyaroye, 68,78-110.
Chang, S.K. & Hsu, e.e. (1994) An updated assessment ofIndian Ocean albacore stock by ASPIC. 5. ExpertConsultation on Indian Ocean Tunas, Mahe (Seychelles), 4--8Oct 1993. IPTP Work. doe., pp. 102-7.
Chapman, CJ. (1970) Ship noise and hearing in fish. Scottish Fish Bull., 33, 22--4.Chapman, CJ. (1973) Field studies of hearing in teleost fish. Helgoldnder wiss. Meeresunters., 24, 371-90.Chapman, CJ. & Hawkins, A.D. (1969) The importance of fish behaviour in relation to capture by trawls.
FAO Fish. Rep., 62 (3), 717-29.

298 References
Chapman, C.J. & Hawkins, A.D. (1973). A field study of hearing in the cod, Gadus morhua. J. Comp.Physiol.,85, I47--{j7.
Chapman, CJ. & Johnstone, A.D. (1974)Some auditory discrimination experiments on marine fish. J. Exp.Bioi., 61, 521-8.
Chapman, P. (i988) On the occurrence of oxygen-depleted water south of Africa and its implications forAgulhas-Atlantic mixing. S. Afr. J. Mar. Sci., 7, 267-94.
Charles-Dominique, E. (i982) Expose synoptique des donnees biologiques sur l'ethrnalose (Etmalosafimbria ta, S. Bowdich, 1825). Rev. Hydrobiol. Trop., 15 (4), 373-97.
Checkley, D.M., Ortner, P.B:, Settle, L.R. & Cummings, S.R. (i997) A continuous, underway fish eggsampler. Fish. Oceanogr., 6 (2),58-73.
Chen, S.X. (i996) Studying school sizeeffects in line transect sampling using the kernel method. Biometrics,52, 1283-94.
Chiappa-Carrara, X, & Gallardo-Cabello, M. (i993) Estudio del regimen y habitos alimentarios de laanchoveta Engraulis mordax Girard (Pisces: Engraulidae), en Baja California, Mexico. Cienc. Mar., 19(3), 285-305.
Chikhi, L. (i995) Differenciation genetique chez Sardinella aurita et S. maderensis. Allozymes et ADN. mitochondrial. These de Doctorat; Universite Paris VI (France).
Chivers, D.P. & Smith, R.J.F. (i994a). The role of experience and chemical alarm signalling in predatorrecognition by fathead minnows, Pimephales promelas. J. Fish Bioi., 44 (2), 273-85.
Chivers, D.P.& Smith, R.J.F. (I994b) Fathead minnows, Pimephalespromelas, acquire predator recognitionwhen alarm substance is associated with the sight of unfamiliar fish. Anim. Behav., 48 (3), 597--605.
Chivers, D.P. & Smith, R.J.F. (i995) Free-living fathead minnows rapidly learn to recognise pike as predators. J. Fish. Bioi., 46, 949-54.
Christensen, V. & Pauly, D. (1992) ECOPATH 11, a software for balancing steady-state ecosystem modelsand calculating network characteristics. Ecol. Model., 61, 169--85.
Churnside, J.H. & Hunter, J.R. (I 996) Laser remote sensing of epipelagic fishes. Int. Soc. Opt. Engenir.. CISSelect. Pap., 2964, 38-53.
Cillaurren, E. (I994) Daily fluctuations in the presence of Thunnus albacares and Katsuwonuspelamisaround fish aggregating devices anchored in Vanuatu, Oceania. BulliMar. Sci., 55 (2-3), 581-91.
Clark, C.W. (I974) Possible effects of schooling on the dynamics of exploited fish population. J. Cons. Int,Explor. Mer, 36 (I), 7-14.
Clark,C.W. & Mangel, M. (i979) Aggregation and fishery dynamics: a theoretical study of schooling andthe purse seine tuna fisheries. Fish.'Bull. (US), 77 (2), 317-37.
Clark, C.W. & Mangel, M. (I986) The evolutionary advantages of group foraging. Theor. Popul. Bioi., 30,45-75.
Clark, E.L., Aronso, R.L. & Gordon, M. (1954) Mating behaviour patterns in two sympatric species ofXiphophorin fishes: their inheritance and significance in sexual isolation. Bull. Am. Mus. Nat. Hist.,103, 135-226.
Coble, D.W., Farabee, G.B. & Anderson, R.O, (I985) Comparative learning ability of selected fishes. Can.J. Fish. Aquat. Sci., 42, 791--6.
Collette, B.B. & Nauen, C.E. (i983) FAO species catalogue: Scombrids of the world. An annotated and .illustrated catalogue of tunas, mackerels, bonites and related species known to date. FAO Fish. Synop,125.
Conan, G.Y., Maynou, F., Stolyarenko, D. & Mayer, L. (i994) Mapping and assessment of fisheriesresources with coastal and depth constraints, the case study of snow crab in the Bay of Island Fjord(Newfoundland). ICES C.M. 1994/Joint Session on Estimating Abundance from Fishing Surveys andAcoustic Measurements.
Conand, F., Boely, T. & Petit, D. (l988)"Spatial distribution of small pelagic fish in the lagoon of NewCaledonia. Proceedings of the 6th International Coral Reef Symposium. Townsville, 2, 65--69.
Constantz, G.D. (1974) Reproductive effort in Poeciliopsis occidentalis (Poecilidae) Southwest. Nature, 19,17-42. .
Corten, A. (I993) Learning processes in herring migrations. ICES CM 1993/H18.Corten, A. & van de Kamp, G. (1992) Natural changes in pelagic fish stocks of the North Sea in the 1980s.
ICES Mar. sa. Symp., 195,402-17.Cram, D.L. (1974) Rapid stock assessment of pilchard populations by aircraft-borne remote sensors. In:
Proc. 9th Int, Symp. Remote Sensing Environ. Ann Arbor, 15-19 April, 1043-1050.

References 299
Cram, D.L. & Hampton, I. (1976) A proposed aerial/acoustic strategy for pelagic fish stock assessment. J.Cons. Int. Explor. Mer, 37 (1),91-7.
Crecco, V. & Overholtz, W. (1990) Causes ofdensity-dependent catchability for Georges Bank haddock,Melanogrammus aeglefinus. Can. J. Fish. Aquat. Sci., 47, 385-94.
Csanyi, V. (1985) Ethological analysis of predator avoidance by the Paradise fish (Macropodus opercularis):I. Recognition and learning of predators. Behaviour, 92, 227-40.
Csanyi, V. (1986) Ethological analysis of predator avoidance by the paradise fish (Macropodus opercularis):11. Key stimuli in avoidance learning. Anim. Learn. Behav., 14, 101-9.
Csanyi, V. (1987) The replicative evolutionary model of animal and human minds. World Future: J. Gen.Evol.,24, 174-214.
Csanyi, V. (1988) Contribution of the genetical and neural memory to animal intelligence. In: Intelligenceand Evolutionary Biology (eds Jerison, H. & Jerison, I.), pp. 299-318. Springer-Verlag, Berlin.
Csanyi, V. (1989) Evolutionary Systems and Society: A general Theory. Duke University Press, Durham.Csanyi, V. (1993) How genetics and learning make a fish an individual: a case study on the paradise fish. In:
Perspectives in Ethology (eds Bateson, P.P.G., Klopfer, P.H. & Thompson, N.S.), pp. I-52. Behaviourand Evolution, 10, Plenum Press, New York.
Csanyi, V. & Altbacker, V. (1990) Variable learning performance: the levels ofbehviour organization. ActaBioi. Hung., 41, 321-32.
Csanyi, V. & Doka, A. (1993) Learning interactions between prey and predator fish. In: BehaviouralEcology ofFishes (eds Huntingford, F.A. & Torricelli, P.), pp. 63-78. Harwood Academic Publishers,Chur.
.Csanyi, V. & Gerlai, R. (19&8) Open-field behaviour and the behaviour-genetic analysis of the Paradise fish(Macropodus opercularis). J. Comp. Psychol., 102, 226-36.
Csanyi, V. & Gervai, J. (1986) Behaviour-genetic analysis of the Paradise fish (Macropodus opercularis): ILPassive avoidance conditioning of inbred strains. Behav. Genet., 16, 553-7.
Csanyi, V., Csizmadia, G. & Mikl6si, A. (1989) Long-term memory and recognition of another species inthe paradise fish. Anim. Behav., 37, 908-11.
Csirke, J. (1988) Small schoaling pelagic fish stocks. In: Fish Population Dynamics, 2nd edn, (ed. Gulland,JA), pp. 271-302. John Wiley and Sons, New York.
Csirke, J. & Caddy, J.F. (1983) Production modelling using mortality estimates. Can. J. Fish. Aquat. Sci., 40(I), 43-51.
Csirke, J. & Sharp, G.D. (ed) (1984) Reports of the experts consultation to examine changes in abundanceand. species composition of neritic fish resources. FAO Fish. Rep., 291 (I).
Cui, G., Wardle, C.S., Glass, C.W., Johnstone, A.D.F. & Mojsiewicz, W.R. (1991) Light level thresholdsfor visual reaction of mackerel, Scomber scombrus L., to coloured monofilament nylon gillnetmaterials, Fish. Res., 10, 255-63.
Cullen, J.M., Shaw, E. & Baldwin, H.A. (1965) Methods for measuring the three-dimensional structure offish schools. Anim, Behav., 13, 534-43.
Cury, P. (1994) Obstinate nature: an ecology of individuals. Thoughts on reproductive behaviour andbiodiversity. Can J. Fisheries Aquat. Sci. (Perspectives), 51 (7), 1664-73.
Cury, P. & Anneville, O. (1998) Fisheries resources as diminishing assets: marine diversity threatened byanecdotes. In: Global versus Local Changes in Upwelling Systems (eds Durand, M.H., Cury, P.,Mendelssohn, R., Roy, C; Bakun, A. & Pauly, D.). Orstom Editions, Paris.
Cushing, D.A. (1982) Climate and Fisheries. Academic Press, London..Cushing, D.A. (1988) The Provident Sea. Cambridge University Press, Cambridge.Cushing, D.A. (1995) Population Production and Regulation in the Sea: a Fisheries Perspective. Cambridge
University Press,Cambridge.Cushing, D.H. (1952) Echo-surveys for fish. J. Cons. Int, Explor. Mer, 18,45--60.Cushing, D.H. (1977) Observations of fish schools with the ARL scanner. Rapp. P.-v. Reun. Cons. Int.
Explor. Mer, 170, 15--20.Cushing, D.H. & Harden Jones, F.R. (1968) Why do fish school? Nature, 218, 918-20.Daan, N. (1991) Bias in virtual population analysis when the unit stock assessed consists of sub-stocks.
ICES CM 1991/F:30.Daget, J. (1954) Les poissons du Niger superieur. Mem. IFAN, 36.Dagorn, L. (1994) Le comportement des thons tropicaux modelise selon les principes de la vie artificielle.
These de I'Ensar. TOM 133, Orstom Editions, Paris.

300 References
Dagorn, L., Petit, M. & Stretta, J.-M. (1997) Simulation of large-scale tropical tuna movements in relationwith daily remote sensing data: the artificial life approach. BioSystems, 44, 167-80.
Dalen, J. & Nakken,.O.M. (1983) On the application of the echo integration method. ICES CM 1983/B:19.Dawson, J.1. & Brooks, T.1. (1989) An innovative acoustic signal processor for fisheries science. Proc.lnst.
Acoust., 11, 131--40.DeBlois, E.M. & Rose, G.A. (1996) Cross-shoal variability in the feeding habits of migrating Atlantic cod
(Gadus morhua). Oecologia, 108 (I), 1992-96.Delgado de Molina, A., Santana, J.c., Ariz, J. & Delgado de Molina, R. (1995) Seguimiento de la pesca
. sobre 'rnanchas' de tunidos en las Islas Canarias. ICCAT Collect. Vol. Sci. Pap., 45 (3), 215-23.Demarcq, H. (1998) Spatial and temporal dynamics of the upwelling ofTSenegal and Mauritania: local
change and trend. In: Global versus Local Changes in Upwe//ing Systems (eds Durand, M.H., Cury, P.,Mendelssohn, R., Roy, C., Bakun, A. & Pauly, D.). Orstom Editions, Paris.
Depoutot, C. (1987) Contribution cl l'etude des dispositifs de concentration de poissons clpartir de l'experiencepolynesienne. Rapp. Orstom Papeete (Tahiti); 33 (mimeo):
Deriso, R.B. (1980) Harvesting strategies and parameter estimation for an age-structured model. Can. J.Fish. Aquat. Sci., 37, 268-82.
Deriso, R.B., Quinn, T.1. & Neal, P.R. (1985) Catch-age analysis with auxiliary information. Can. J. Fish.Aquat. Sci., 42, 815-24.
Derzhavin, A.N. (1922) The stellate sturgeon (Acipenser stellatus Pallas), a biological sketch. Byulletan'Bakinskoi Ikhtiologicheskoi Stantsii, I, 1-393.
DevoId, F. (1953) Tokter med G.O. Sars i. Norskehavet vinteren 1952/53 (Cruises with G.O. Sars in theNorwegian Sea, winter 1952-3). FiskDir. Smdskr., 6, 1-19 (in Norwegian).
Devold, F. (1963)The life history of the Atlanto-Scandian herring. Rapp. P-v. Reun. Cons. Int. Explor. Mer,154,98-108.
Devoid, F. (1968)The formation and the disappearance of a stock unit of Norwegian herring. FiskDir. Skr.Ser. Havunders., IS, 1-22.
Devoid, F. (1969) The behaviour of the Norwegian tribe of the Atlanto-Scandian herring. FAO Fish. Rep.,62,534-9.
Dewsbury, D.A. (1984) Comparative Psychology in the twentieth century. Hutchinson Ross, Stroudsburg,PA.
DeYoung, D. & Rose, G.A. (1993) On recruitment and distribution of Atlantic cod (Gadus morhua) ofTNewfoundland. Can. J. Fish. Aquat, Sci., 50, 2729--41.
Di Natale, A. & Mangano, A. (1986) Moon phases influence on CPUE: a first analysis of swordfish driftnetcatch data from the Italian fleet between 1990 and 1991. ICATT Coli. Vol. Sci. Pap., 44 (I), 264-7.
Dickson, R.R., Maelkki, P., Radach, G.; Seetre, R. & Sissenwine, M.P. (eds) (1992) Continuous planktonrecords: the North Sea in the 1980s. ICES Mar. Sci. Symp., 195, 243-8.
Die, D.1., Restrepo, V.R. & Fox, W.W. Jr: (1990) Equilibrium production models that incorporate fishedarea. Amer. Fish. Soc., 119, 445-54.
Diner, N. & Masse, J. (1987)' Fish school behaviour during echo survey observed by acoustic device.International Symposium on Fisheries Acoustics, 21-24 June, Seattle, USA.
Dingle, H. (1996) Migration. The Biology of Life on the Move. Oxford University Press, Oxford.Dizon, A.E. (1977) EfTect of dissolved oxygen concentration and salinity on swimming speed of two species
of tunas. Fish. Bull. (US) 75, 649-53.Dodson, J.1. (1988) The nature and role of learning in the orientation and migratory behaviour of fishes.
Environ. Bioi. Fish., 23 (3), 161782.Domanevski, L.N. & Barkova, N.A. (1979) Particularite de la repartition et etat du stock de sardine (Sardina
pilchardus) au large de I'Afrique nord-occidentale. COPACE/FAO, PACE Series 78/10, 86-88.Dommasnes, A., Midttun, L. & Monstad, T. (1979) Capelin investigations in the Barents Sea during the
winter 1978. FiskenHav., 1, 1-16.Dommasnes, A., Rey, F. & Rottingen, I. (1994) Reduced oxygen concentrations in herring wintering areas.
ICES J. Mar. Sci., 51, 63--{j9.Donguy, J .R:, Bour, W., Galenon, P. & Gueredrat, J .A. (1978) Les conditions oceanographiques et la peche
de la bonite iKatsuwonus pelamis) dans le Pacifique Occidental. Cah. Orstom Ser. Oceanogr., 16 (3--4),309-17.
Doubleday, W.G. (1976) A least squares appraoch to analysing catch at age data.lnt. Comm. Northw.Atlant, Fish. Res. Bull., 12,69-81.

References 301
Deving, K.B. & Knutsen, J.A. (1993). Feeding responses and chemotaxis in marine fish larvae. In: FishNutrition in Practice, Proceedings of the International Symposium on FishiNutrition and Feeding,Biarritz (France), 24-27 June 1991 (eds Kanshik, SJ. & Luquet, P.), pp. 579-587. Inst. Nat. Rech.Agron., 61.
Dragesund, O. (1957) Reactions of fish to artificial light with special reference to large herring and springherring in Norway. J. Cons. Int, Explor. Mer, 23 (2),213-27.
Dragesund, O. & Hognestad, P. (1960) Smasildunderse kelsene og Smasildfisket 1959/60. Fiskets Gang, 46,703-14.
Dragesund, O. & Olsen, S. (1965) On the possi bility of estimating year-class strength by measuring echoabundance of O-group fish. FiskDir. Skr. Ser. Havunders, 13,47-75.
Dragesund, 0., Hamre, J. &Ulltang, 0. (1980). Biology and population dynamics of the Norwegian springspawning herring. RapptP>v. Reun. Cons. Int. Explor. Mer, 177,43'--71.
Drago, G. & Yafiez, E. (1985) Dinamica de los principales stocks pelagicos. (Engraulis ringens y Sardinopssagax) explotados en la Zona Norte de Chile (l8°20'S-24°00'S) entre 1959 y 1983. In: Estudios enpesquerias chilenas (ed. Melo, T.), pp. 97-106. Escuela de Ciencias del Mar, Universidad Catolica deValparaiso.
Draper, N.R. & Smith, H. (1966) Applied Regression Analysis. John Wiley and Sons, New York.Drew, S. (1988) Trolling: a simple, effective and widely used method of line fishing. Infofish International,
(3), 35--6.Drickarner, L.C. & Vessey, S.H. (eds) (1992) Animal Behaviour: Mechanisms Ecology and Evolution, 3rd
edn. Wm. C. Brown Publishers, Dubuque.Drogoul, A., Corbara, B. & Fresneau, D. (1992) Applying etho-rnodelling to social organization in ants. In:
Biology and Evolution ofSocial Insects (ed. Leuven University Press), pp. 375-383. Leuven UniversityPress, Leuven.
Druce, B.E. & Kingsford, MJ. (1995) An experimental investigation on the fishes associated with driftingobjects in coastal waters of temperate Australia. Bull. Mar. Sci., 57 (2), 378-92.
Duffy, D.C. & Wissel, C. (1988) Models of fish school size in relation to environmental productivity. Ecol.Model., 40, 201-11.
DUfour, P. & Stretta, J.-M. (1973) Fronts thermiques et thermohalins dans la region du Cap Lopez (Golfede Guinee) en juin-juillet 1972: phytoplancton, zooplancton, micronecton et peche thoniere, Doe. SCi.Cent. Rech. Oceanogr. Abidjan, Orstom, 4 (3), 99-142.
Dulzetto, F. (I 928)Osservazionisulla vitasessualedi Gambusiaholbrooki. AttiR. Ace. Lincei, Rend., 8, 96--1 01.Dunning, DJ., Ross;Q.E., Geohegan, P., Reichle, J.J., Menezes, J.K. & Watson, J.K. (1992) Alewives
avoid high-frequency sound. N. Amer. J. Fish. Manag., 12,407-16.Dupouy, C. & Demarcq, H. (1987) CZCS as an aid for understanding modalities of the phytoplankton
productivity during upwelling off Senegal. Adv, Space Res., 7 (2), 63-71.Durand, M.H., Cury, P., Mendelssohn, R., Roy, C., Bakun, A. & Pauly, D. (eds) (1998) Global versus Local
Changes in Upwelling Systems. Orstom Editions, Paris.Ebersole, J.P. (1980) Food density and territory size: an alternative model and a test on the reef fish
Eupomacentrus leucostrictus. Amer. Naturalist, 115,492-505.Eckmann, R. (1991) A hydroacoustic study of the pelagic spawning behavior.of whitefish (Coregonus
lavaretus ) in Lake Constance. Can. J. Fish. Aquat. Sci., 48, 995-1002.ECOTAPP project (1995) Etude du comportement des thonides par I'acoustique et la peche ala palangre en
Polynesie Fran~aise.Rapp. Orstom Papeete (Tahiti) (rnimeo).Edwards, J.1. & Armstrong, F. (1983) Measurements of the target strength of live herring and mackerel.
FAO Fish. Rep., 300, 69-77.Efanov, S.F. (1981) Herring of the Gulf of Riga: the problem of escapement and mechanical impact of the
trawl. ICES CM 1981/J:7.Ehrenberg, J.E. (1974) Two applications for a dual-beam transducer in hydro-acoustic fish assessment
systems. In: Proc. Con! Engineering in the Ocean Environment, 21-23 August, 1974, Halifax, Nova:Scotia, Canada, pp. 152-5. IEEE, New York.
Ehrlich, P.R. & Ehrlich, A.H. (1973) Coevolution: heterospecific schooling in Caribbean reef fishes. Am.Nat., 107, 157--60.
Eibl-Eibesfeldt, I. (ed) (1984) Ethologie. Biologie du cornportement. 3rd edn. Naturalia et Biologia, Paris.Ekloev, P. & Hamrin, S.F. (1989) Predatory efficiency and prey selection: interactions between pike Esox
iucius, perch Perca fluviatilis and rudd Scardinus erythrophthalmus. Oikos, 56 (2), 149-56.

302 References
Enger, P.S. (1967) Hearing in herring. Comp. Biochem. Physiol., :Z:Z, 527-38.Engas, A.E. (1994) The effects of trawl performance and fish behaviour on the catching efficiency of
demersal sampling trawls. In: Maring Fish Behaviour in Capture and Abundance Estimation (eds Ferno,A. & Olsen, S.), pp. 45-68. Fishing News Books, Oxford.
Engas, A.E. & Gode, O.R. (1989) Escape of fish under the fishing line of a Norwegian sampling trawl andits influence on survey results. J. Cons. Int, Explor. Mer, 45, 269-76.
Engas, A.E. & Soldal, A.V. (1992) Diurnal variation in bottom trawl catches of cod and haddock and theirinfluence on abundance indices. ICES J. Mar. Sci., 49, 89-95.
Engas, A. Jacobsen, J.A. & Soldal, A,V"(l988) Diurnal changes in bottom trawl catches and vertical fishdistribution. ICES FTFBWorking Group Meeting, Ostende, Copenhagen (mimeo).
Engas, A.E., Misund, O.A., Soldal, A.V., Horvei.B, & Solstad, A. (1995) Reactions of penned herring andcod to playback of original, frequency-filtered and time-smoothed vessel sound. Fish. Res., :Z:Z, 243-54.
Engas, AE., Soldal, A.V. & 0vredal, J.T. (1991) Avoidance reactions of ultrasonic-tagged cod duringbottom trawling in shallow water. ICES CM 1991/B:41.
Enquist, M., Leimar, 0., Ljungberg, T., Mallner, T. & Segerdahl, N. (1990) A test of the sequentialassessment game: fighting in the cichlid fish Nannocara anomala. Anim. Behav., 40, 1-15.
Erickson, G.J. (1979) Some frequencies of underwater noise produced by fishing boats affecting albacorecatch. J. Acoust. Soc. Am., 66 (1),296-99.
Esconomidis, P.S. & Vogiatzis, V.P. (1992) Mass mortality of Sardinella aurita Valenciennes (Pisces,Clupeidae) in Thessaloniki Bay (Macedonia, Greece). J. Fish 8iol., 41 (I), 147-9.
Fabre, J.H. (1930) Souvenirs Entomologiques. Delagrave, Paris.FAO (1970) Report on a meeting for consultations on underwater noise, Rome, Italy, 17..:.19 December,
1968. FAO Fish. Rep., 76.FAO (1996) La Situation Mondiale des Peches et de l'Aquaculture (Sofia). FAO, Rome.FAO (1997) FAO Yearbook, Fishery Statistics, Catches and Landings. FAO Fisheries Series, No. 46; FAO
Statistics Series, No. 128. FAO of the United Nations, Rome.Farman, R.S. (1985) The dynamics offish aggregating under anchored rafts. South Pacific Commission Int.
Rep., 8 (mimeo).Farr, J.A. (1977) Male rarity or novelti, female choice behaviour, and sexual selection in the guppy, Poeci/ia
reticulata Peters (Pisces: Poeciliidae). Evolution, 31, 162-8.Fay, R.R. (1970) Auditory frequency discrimination in the goldfish (Carassius auratus). J. Comp. Physiol.
Psychol., 73, 175-80.Fay, R.R. & Popper, A.N. (1974) Acoustic stimulation of the ear of the goldfish (Carassius auratus). J. Exp.
Bioi., 61, 243-60.Fay, R.R. & Popper, A.N. (1975) Mod!s of stimulation of the teleost ear. J. Exp. Biol., 6:Z, 379-87.Fedoryako, B.l. (1982) Langmuir circulation as a possible mechanism of formation of fish association
around floating object. Oceanology, :Z:Z, 228-32.Fedoseev, Y.P. & Chur, V.N. (1980) Relationship between feeding intensity of bigeye tuna iThunnus obesus)
of the Gulf of Guinea and their catches in the day time. ICCA T Coli. Vol. Sci. Pap., 9 (2), 287-90.Ferguson, M.M. & Noakes, D.L.G. (1981) Social grouping.and genetic variation in common shiners,
Notropiscornutus (Pisces, Cyprinidae). Environ. Bioi. Fish., 6 (3/4), 357-60.Femo, A. (1993) Advances in understanding of basic behaviour: consequences for fish capture studies.
ICES Mar-Set. Symp, 1%, 5-11.Ferno, A. & Huse, I. (1983) The effect of experience on the behaviour of cod (Gadus morhua L.) towards a
baited hook. Fish. Res., :Z, 19-28.Ferno, A. & Olsen, S. (eds) (1994) Marine Fish Behaviour in Capture and Abundance Estimation. Fishing
News Books, Oxford.Ferno, A., Solemdal, P. & Tilseth, S. (1986) Field studies on the behaviour of whiting (Gadus merlangus L.)
. towards baited hooks. FiskDir. Skr. Ser. Havunders., 18, 83-95.Ferraris, J. (1995) Demarche rnethodologique pour l'analyse des comportements tactiques et strategiques
des pecheurs artisans senegalais, In: Question sur la Dynamique de l'ExploitationHalieutique (eds.Laloe, F., Rey,:H. & Durand, J.L.), pp. 263-295. Coli. Semin., Orstom Editions, Paris.
Fiedler, P.C. & Bernard, H.J. (1987) Tuna aggregation and feeding near fronts observed in satellite imagery.Contin. Shelf Res., 7 (8), 8n--81. .
Fiedler, P.C. & Laurs, R.M. (1990) Variability of the Columbia River plume observed in visible andinfrared satellite imagery. Int. J. Remote Sens., 11,999-1010.

References 303
Finn, D.B. (1964) Modern Fishing Gear of the World, vol. 2. Fishing News Books,Oxford.Fitzgerald, G.J. & Wootton, R.J. (1986) Behavioural ecology of sticklebacks. In: Behaviour of Teleost
Fishes, 2ndedn. (ed. Pitcher, T.J.), pp. 409-32. Chapman and Hall, London.Fletcher, R.I. (1978) On the restructuring of the Pella-Tomlinson system. Fish. Bull. (US), 76 (3),515-21.Fonteneau, A. (1978) Analyse de I'effort de peche des thoniers senneurs franco-ivoiro-senegalais, Cah.
Orstom, Ser, Oceanogr., 16 (3-4), 285-307.Fonteneau, A. (1985) Analyse de I'exploitation de quelques concentrations d'albacore par les senneurs
durant la periode 1980-1983, dans I'Atlantique Est. ICCAT SCRS/85/79, 81-98.Fonteneau, A. (I 986a) Elements relatifs aI'effort de peche exerce sur le Listao de l'Atlantique (Katsuwonus
pelamis) et ca1cul d'indices d'effort specifiques, In: Proceedings of the ICCA T conference on theinternational skipjack year program, Madrid (eds Symons, P.E.K., Miyake, P.M. & Sakagawa, G.T.E.),pp. 127-139. ICCAT.
Fonteneau, A. (1986b) Le modele global et la dynamique du Listao. In: Proceedings of the ICCAT conference on the international skipjack year program, Madrid (eds Symons, P.E.K., Miyake, P.M. &Sakagawa, G.T.E.), pp: 198-207, ICCAT.
Fonteneau, A. (1988) Modelisation, gestion et amenagement des pecheries thonieres dans l'AtlantiqueCentre-Est. In: Ressources, peche et biologie des thonides tropicaux de l'Atlantique Centre-Est (edsFonteneau, A. & Marcille, J .), pp. 317-356. FAO Doc. Tech. Peches, 292.
Fonteneau, A. (1991) Monts sous-rnarins et thons dans l'Atlantique tropical est. Aquat. Living Resour., 4,13-25.
Fonteneau, A. (1992) Peche thoniere et objets flottants: situation mondiale et perspectives. In: Internationalworkshop on the ecology andfisheries for tunas associated with floating objects and on assessment issuesarising from the association of tunas with floating objects (ed. Hall, M.) Inter-American Tropical TunaCommission Int. Rep., San Diego (mimeo).
Fonteneau, A. (1997) Scientific Atlas of Tropical Tuna Fisheries 'world wide'. Orstom Editions, Paris.Fonteneau, A. & Diouf, T. (1994) An efficient way of bait-fishing for tunas recently developed in Senega\.
Aquat, Living Resour., 7, 139-51.Fonteneau, A. & Marcille, J. (eds) (1988) Ressources, peche et biologie des thonides tropicaux de
l'At1antique Centre-Est. FAO Doc. Tech. Peches, 292, 1-391.Fonteneau, A., Gascuel, G. & Pallares, P. (1997) Vingt-cinq Ans d'Evaluation des Ressources Thonieres dans
l'Atlantique: Quelques Reflexions Methodologiques. ICCAT.Foote, K.G. (1978) Analysis of empirical observations on the scattering of sound by encaged aggregations
of fish. FiskDir. Skr. Ser. Havunders., 16, 423-56.Foote, K.G. (1979) Comment on 'Some frequencies of underwater noise produced by fishing boats
affecting albacore catch'. J. Acoust. Soc. Am., 66, 296-9.Foote, K.G. (1980a) Importance of the swimbladder in acoustic scattering by fish: a comparison of gadoid
and mackerel target strengths. J. Acoust. Soc. Am.; 67, 2084-9.Foote, K.G. (l980b) Effects of fish behaviour on echo energy: the need for measurements of orientation
distributions. J. Cons. Int. Explor. Mer, 39, 193-201.Foote, K.G. (1981) Evidence for the influence of fish behaviouron echo energy. In; Meeting on hydro
acoustical methods for the estimation ofmarine fish populations, 25-29 June 1979, vo\. 2 (ed. Soumala,J.B.), pp. 201-28. Charles Stark Draper Laboratory Inc., Cambridge, Massachusetts.
Foote, K.G. (1983) Linearity offisheries acoustics, with addition theorems. J. Acoust. Soc. Am., 73, 1932-40.Foote, K.G. (1985) Rather-high-frequency sound scattering by swimbladdered fish. J. Acoust. Soc. Am., 78,
688-700.Foote, K.G. (1987) Fish target strengths for use in echo integrator surveys. J. Acoust, Soc. Am., 82, 981-7.Foote, K.G. (1990) Correcting acoustic measurements of scatterer density for extinction. J. .Acoust. Soc.
Am., 88, 1543-:-6.Foote, K.G. (1994) Extinction cross section of herring: new measurements and speculation. ICES CM
. 1994/(B+D+G+.H):2, pp. 1-10.Foote, K.G. & Knudsen, H.P. (1994) Physical measurements with modem echo integrators. J. Acoust. Soc.
Jpn., 15, 393-5.Foote, K.G. & Rettingen, I. (1995) Acoustic assessment of Norwegian spring spawning herring in the
wintering area, December 1994 and January 1995. ICES CM 1995/H:9, pp. 1-22.Foote, K.G., Kristensen, F.H. & Solli, H. (1984) Trial of a new, split-beam echo-sounder. ICES CM 1984/
B:2I.

r
304 References
Foote, K.G., Knudsen, H.P., Vestnes, G., MacLennan, D.N. & Simmonds, E.J. (1987) Calibration ofacoustic instruments for fish density estimation: a practical guide. ICES Coop. Res. Rep. no. 144.
Foote, K.G.,.Knudsen, H.P., Korneliussen, R.J., Nordbe, P.E. & Reang, K. (1991) Postprocessing systemfor echo sounder data. J. Acoust. Soc. Am., 90, 37--47.
Foote, K.G., Ona, E. & Toresen, R. (1992) Determining the extinction cross section of aggregating fish. J.Acoust. Soc. Am., 91, 1983-9.
Foote, K.G., Ostrowski, M., Rettingen, l. Engas, A., Hansen, K., Hiis Hauge, K., Skeide, R., Slotte, A. &Torgersen, 0. (1996) Acoustic abundance estimation of the stock of Norwegian spring spawningherring, winter 1995-1996. ICES CM 1996/H:33.
Forbes, S.T. & Nakken, 0. (1972) Manual of Methods for Fisheries Resource Survey and Appraisal. Part 2.The Use ofAcoustic Instruments for Fish Detection and Abundance Estimation. (FAO Man. Fish. Sci. 5).FAO, Rome.
Foster, S.A., Garcia, B. & Town, M.Y. (1988) Cannibalism as the cause of ontogenic niche shift in habitat.. use by fry of the threespine stickleback. Oecologica, 74, 577-85.
Foster, W.A. & Treherne, H.E. (1981) Evidence for the dilution effect in the selfish herd from fish predationon a marine insect. Nature, 293, 466--7.
Fournier, D. & Archibald, c.P. (1982) A general theory for analysing catch at age data. Can. J. Fish. Aquat.Sci.,39, 1195-207.
Fournier, D. & Doonan, 1.1.(1987) A length-based stock assessment method utilising a generalized delaydifference model. Can. J. Fish: Aquat. Sci., 44, 422-37.
Fournier, D.A., Sibert, J. R., Majkowski, J. & Hampton, J. (1990)MULTIFAN a likelihood-based method forestimating growth parameters and age composition from multiple length frequency data sets illustratedusing data for southern bluefin tuna iThunnus maccoyil). Can, J. Fish. Aquat. Sci., 47 (2), 301-17.
Fox, W.W. Jr. (1970) An exponential surplus-yield model for optimising exploited fish populations. Trans.Amer. Fish. Soc., 99 (1),80--8.
Fox, W.W. Jr. (1974) An overview of production modelling; Workshop on population dynamics of tuna,ICCAT meeting, Nantes, 2-7 September 1974. ICATT Rec. Doe. Sci., 3, 142--6.
Fox, W.W. Jr. (1975) Fitting the generalised stock production model by least-squares and equilibriumapproximation. Fish. Bull. (US), 73 (I), 23-36.
Francis, R.C. (1980) Fisheries science now and in the future: a personal view. N.Z.J. Mar. Freshwater Res.,14 (I), 95-100.
Frank, K.T., Carscadden, J.E. & Simon, J.E. (1996) Recent excursions of capelin (Mallotus villosus) to theScotian Shelf and Flemish Cap during anomalous hydrographic conditions. Can. J. Fish. Aquat, Sci.,53, 1473-86.
Fraser, D.F. & Huntingford, F.A. (1986) Feeding and avoiding predation hazard: the behavioural response, of the prey. Ethology, 73, 56--68.
Freon, P. (1984) La variabilite des tailles individuells a l'interieur des cohortes et des banes de poissons:observations et interpretation. Oceanol. Acta, 7, 457--68.
Freon, P. (1985) La Variabilite des tailles al'interieur des cohortes et des banes de poissons: 2: Application ala biologie des peches, Oceanol. Acta, 8, 87-99.
Freon, P. (1986) Reponses et adaptations des stocks de clupeides d'Afrique de l'Ouest ti la variabilite du milieuet de l'exploitation. These de Doctorat, Universite d'Aix-Marseille 11 (France).
Freon, P. (1988) Introduction of environmental variables into global production models. In: InternationalSymposium on Long Term Changes in Marine Fish Populations Vigo (eds Wyatt, T. & Larraiieta,M.G.), pp. 481-528. Consejo Superior de Investigaciones Cientificas, Madrid.
Freon, P. (1991) Seasonal and interannual variations of mean catch per set in the Senegalese sardinefisheries: fish behaviour or fishing strategy? In: Long-term Variability of Pelagic Fish Populations andtheir Environment (eds Kawasaki, T., Tanaka, S., Toba, Y. & Taniguchi, A.), pp. 135--45. PergamonPress, Oxford.
Freon, P. (1994a) Rendements par recrue et biomasse feconde du stock de Sardinella aurita. In: Groupe detravail ad hoc sur les sardienelles et autresespeces de petits pelagiques cdtiers de la zone Nord duCOPACE (ed. Do Chi, T.), pp. 221-8. COPACE/FAO, PACE series 91/58.
Freon, P. (I994b) Simulation du cycle de vie de Sardinella aurita au Senegal: comment concilier croissancerapide, stabilite des tailles modales et absence d'un mode. In: Groupe de travail ad hoc sur les sardinelleset autres especes de petits pelagiques cotters de la zone Nord du COPACE (ed. Do Chi, T.), pp. 181-219.COPACEjFAO"PACE series 91/58.

References 305
Freon, P. & Gerlotto, F. (1988a) Influence offish behaviour on fish stock abundance estimations. ICES FASTWorking Group, Ostende, Belgium, 19-22 April 1988, pp. 1-7..
Freon, P. & Gerlotto; F. (l988b) Methodological approach to study the biases induced by the fish behaviour during hydro-acoustic surveys. ICES CM I988/B:52, pp. 1-16.
Freon, P. & Stequert, B. (1982) Note sur la presence de Sardina pilchardus (Walb.) au Senegal: etude de labiometrie et interpretation. Rapp. Pi-v. Reun. Cons. Int. Explor. Mer., 180,435-9.
Freon, P. & Weber, J. (1983) Djifere au Senegal: la peche artisanale et mutation dans un contexte industriel.Rev. Trav. Inst. Peches Mar., 47 (3-4),304.
Freon, P. & Yafiez, E. (1995) Influencia del medio ambiente en evaluacion de stock: una aproximacion conmodelos globales de produccion. Investigaciones Marinas., 23, 25-47.
Freon, P. Gerlotto, F. & Misund, O.A. (1993a) Consequences of fish behaviour for stock assessment. Int.Coun. Explor. Sea Mar. Sci. Symp., 196, 190-5.
Freon, P., Gerlotto, F. & Soria, M. (1990) Evaluation of the influence of vessel noise on fish distribution asobserved using alternatively motor and sails aboard a survey vessel. ICES FAST Working.Group,Rostock, 1990.
Freon, P., Gerlotto, F. & Soria, M. (1992) Changes in school structure according to external stimuli:description and influence on acoustic assessment. Fish. Res., 15; 45-66.
Freon, P., Gerlotto, F. & Soria, M. (l993b) Variability of Harengula spp. school reactions to boats orpredators in shallow water. ICES Mar. Sci. Symp., 196, 30-35.
Freon, P., Gerlotto, F. & Soria, M. (1996) Diel variability of school structure with special reference totransition periods. ICES J. Mar. Sci., 53 (2), 459-64.
Freon, P., Mullon, C. & Pichon, G. (1991) CLIMPROD: a fully interactive expert-system software forchoosing and adjusting a global production model which accounts for changes in environmentalfactors. In: Long-term Variability ofPelagic Fish Populations and their Environment (eds Kawasaki, T,Tanaka, S., Toba, Y. & Taniguchi, A.), pp. 347-57. Pergamon Press, Oxford.
Freon, P., Mullon, C. & Pichon, G. (I 993d) CLIMPROD: experimental interactive software for choosingand fitting surplus production models including environmental variables. FAO Computerised Info,Series, (fish.), 5.
Freon, P., Soria, M. & Gerlotto, F. (1989) Short-term variability of Sardinella aurita aggregation andconsequences on acoustic survey results. CIEM Statutory Meetings CM I989/H:53.
Freon, P., Soria, M., Mullon, C. & Gerlotto, F. (1993c) Diurnal variation in fish density estimate duringacoustic surveys in relation to spatial distribution and avoidance reaction. Aquat. Liv. Resour., 6, 221-34.
Freon, P., Sow, l. & Levenez, J.1. (1994) Trois decennies de peche sardiniere semi-industrielle au Senegal.In: L 'evaluation des Ressources Exploitables par la Peche Artisanale Senegalaise (eds Barry-Gerard, M.,Diouf, T. & Fonteneau, A.), pp. 265-,312. Colloques et Seminaires, Orstom Editions, Paris.'
Freon, P., Stequert, B. & Boely, R. (1978) La peche des poissons pelagiquescotiers en Afrique de l'Ouest desiles Bissagos au nord de la Mauritanie: description des types d'exploitation. Cah. Orstom Stir. Oceanogr., 18, 209-28.
Fretwell, S.D. & Lucas, J.R. (1970) On territorial behaviour and other factors influencing habitat distribution in birds. l. Theoretical development. Acta Biotheor., 19, 16-36.
Freytag, G. & Karger, W. (1969) Investigations on noises caused by fishing vessels and their sources. ICESCM 1969/B, 12, pp. 1-3.
Fridriksson, A. & Aasen, O. (1950) The Norwegian-Icelandic herring tagging experiments. FiskDir. Skr.Ser. Havunders., 9 (11), 1--44.
Frisch, K. von (1938) Zur Psychologie des Fish-Schwarmes. Naturwissenschaften, 26, 601-6.Frisch, K. von (1941) Ueber einen schreckstofTder fischhaut und seine biologische bedeutung. Z. Vergl.
Physio/., 29, 46-145.Fry, F.E.1. (1949) Statistics of a lake trout fishery. Biometrics, 5, 26-67.Fryer, G. & lies, TD. (1972) The cichlid fishes of the great lakes of Africa: their biology and evolution.
Oliver and Boyd, Edinburgh.Fuiman, L.A. & Magurran, A.E. (1994) Development of predator defences in fishes. Rev. Fish BioI.
Fisheries, 4, 145-83.Fuiman, L.A. & Webb, P.W. (1988) Ontogeny of routine swimming activity and performance in zebra
danois (Teleostei: Cyprinidae). Anim. Behav., 26, 250-61.FuIton, TW. (1896) Review ofthe trawling experiments of the 'Garland' in the Firth ofForth and St. Andrews
Bay in the years 1886-1895. Rpt. Fish. Bd. Scot., 14, Part Ill,Scientific Investigations, 128-49.

306 References
Furusawa, M. & Takao, Y. (1992) Acoustic specifications of fisheries research vessel Kaiyo-maru. ICESFAST &FTFB Working Groups Meeting, Bergen, 16 June 1992.
Gaertner, D. & Medina-Gaertner, M. (1991) Factores ambientales y pesca atunera de superficie en el MarCaribe. In: Report of the Yellowfin Year Program, ICCAT, Coli. Vol. Sci. Pap. 36, 523-50.
Gaertner, D. & Medina-Gaertner, M. (1992)Apercu sur lesrelations entre les thons et lesobjets flottants dansle Sud de la mer des Caraibes. In: International Workshop on Fishingfor Tunas Associated with FloatingObjects (ed. Hall, M.). Inter-American Tropical Tuna Commission Int. Rep.; San Diego (mimeo).
Gaertner, D., Pagavino, M. & Marcano, J. (1996) Utilisation de modeles lineaires generalises pour evaluerles strategies de peche thoniere a la senne en presence d'especes associees dans l'Atlantique ouest.Aquat, Living Resour., 9, 305-23.
Gallego, A. & Heath, M.R. (1994) The development of schooling behaviour in Atlantic herring Clupeaharengus. J. Fish. Bioi., 45, 569-88.
Gallego, A., Heath, M.R. & Fryer, R.J. (1995) Premature schooling of larval herring in the presence ofmore advanced conspecifics. Anim. Behav., 50 (2), 333--41.
Galvan-Magafia, F. & Olson, RJ. (1997) Trophic relations 'of apex predators in the bycatch of easternPacific purse-seiner fishery. In: 48th Tuna Conference at Lake Arrowhead (eds Scott, M. & Oson, R.).Inter-American Tropical Tuna Commission Int. Rep., San Diego.
Garcia, S.M. (1994) Precautionary principle: its implications in capture fisheries management. Ocean andCoastal Management, 22, 99-125.
Gamier, B., Beltri, E., Marchand, P. & Diner, N. (1992) Noise signature management of fisheries researchvessels:a European survey. ICES FTFB & FAST Working Groups Joint Session, Bergen, Norway, 16June 1992, pp. 1-5.
Garrod, DJ. (1969) Empirical assessments of catch effort relationship in the North Atlantic cod stocks .• Res. Bull: ICNAF, 6, 26-34.
Garstang, W. (1900) The impoverishment of the sea - a critical summary of the experimental and statisticalevidence bearing upon the alleged depletion of the trawling grounds. J; Mar. Bioi. Ass., 6,1--69.
Gascuel, D. (1994) Modelisation de la dynamique des stocks exploites par la peche artisanale senegalaise:interet, limites et contraintes de I'approche structurale. In: L 'evaluation des Ressources Exploitables parla Peche Artisanale Senegalaise (eds Barry-Gerard, M., Diouf, T. & Fonteneau, A.), pp. 385--403.Colloques et Seminaires, Orstom Editions, Paris.
Gauldie, R.W., Shanna, S.K. & Helsley, C.E. (1996) LIDAR applications to fisheries monitoring problems.Can. J. Fish. Aquat, Sci., 53, 1459--68.
Gauthiez, F. (1997) Structuration spatiale des populations de poissons marins demersaux: caracterisation,consequences biometriques et halieutiques. These de Doctorat, Universite Claude Bernard Lyon I
_(France).Gayanilo, F.C., Sparre, P. & Pauly, D. (1996) FAO-ICLARM Fish Stock Assessment (FiSAT) User's
Guide. FAO Computerised Info. Series, (Fish) 7.Genin, A. & Boehlert, G.W. (1985) Dynamics of temperature and chlorophyll structures above a seamount:
an oceanic experiment. J. Mar. Res., 43 (4), 907-24:Gerlai; R. (1993)Can paradise fish (Macropodus opercularis, Anabantidaeyrecognise a natural predator? An
ethological analysis. Ethology, 94 (2), 127-36._Gerlai, R. & Csanyi, V. (1990) Genotype-environment interaction and the correlation structure of beha
. viour elements in the paradise fish (Macropodus opercularis). Physiol. Behav., 47, 343-56.Gerlotto, F. (1993) Methodologie d'observation et d'evaluation parhydroacoustique des stocks tropicaux de
poissons pelagiques cotiers. These Universite de Bretagne Oceidentale.Gerlotto, F. & Freon, P. (1990) Review ofavoidance reactions of tropical fish to a survey vessel. ICES FAST
Working Group, Restock.Gerlotto, F. & Freon, P. (1992) Some elements on vertical avoidance of fish schools to a vesel during
-acoustic surveys. Fish. Res., 14,251-9.Gerlotto, F. & Stequert, c. (1983) Une methode de simulation pour etudier la distribution des densities en
poissons: application a deux cas reels. FAO Fish. Rep., 300, 278-92.Gerlotto, F., Petit, D. & Freon, P. (1990) Influence of the light ofa survey vessel on TS distribution. ICES
-FAST Working Group, Restock.Gerlotto, F., Freon, P., Soria, M.; Cottais, P.H. & Ronzier, L. (1994) Exhaustiveobservation of 3D school
structure using multibeam side scan sonar: potential use for school classification, biomass estimationand behaviour studies. ICES CMjI994, B:26.

References 307
Ghazai, M.E., Benech, V. & Paugy, D. (1991) L'alimentation de Brycinus leuciscus (Teleostei.Characidae)au Mali: aspects qualitatifs, quantitatifs et comportementaux. Ichthyol.iExpior.Fresh., 2 (I), 47-54.
Gibson, R.N. & Ezzi, I.A.(l992) The relative profitability of particulate-and filter-feeding in the herring,Clupea harengus L. J. Fish Bioi., 40, 577-90.
Giles, N. & Huntingford, F.A. (1984) Predation risk and.interpopulation variation in antipredator beha-viour in the three-spined stickleback. Anim. Behav., 32, 264--75. .
Gjestland, T. (l968)'Undervan~s steygenerering ved bdter, steyens karakter og dens betydning for fangst og. bruk av sonaranlegg (Underwater noise generation by boats, noise characteristics and its importance for
capture and use ofsonar equipment). MSc. Thesis, Norw. Techn.' Highschool, (Unpublished.)Gjaseter, H. & Korsbrekke, K. (1990) Schooling-by-sizein the Barents Sea capelin stock. ICES CM 1990/
D:28 Re!H.. . .' . . .Glantz, M.H. & Thompson, J.D. (1981) (eds) Resource Management and Environmental Uncertainty:
Lessons from Coastal Upwe//ing Fisheries. John Wiley& Sons, New York;Glass, C.W. & Wardle, C.S. (1989) Comparison of the reactions of fish to atrawl gear, at high and low light
intensities. Fish. Res., 7, 249--66.Glass, C.W., Wardle, C.S. & Mojsiewicz, W.R. (1986) A light intensity threshold for schooling in the
Atlantic mackerel, Scomber scombrus. J. Fish. Bioi., 29, 71-81.Glass, C.W., Johnstone, A.D.F., Smith, G.W. & Mojsiewicz, W.R. (1992). The movements of saithe
(Po//achius virens L.) in the vicinity of an underwater reef. In: Wildlife telemetry: Remote monitoringand tracking ofanimals. Conference on Wildlife Telemetry (eds Priede, I.G. & Swift, S.M.), pp. 328-340.Ellis Horwood, Chichester.
Glass, C.W., Wardle, C.S. & Gosden, SJ. (1993) Behavioural studies of the principles underlying meshpenetration by fish. ICES Mar. Sci. Symp., 196,92-97.
Godin, J.-G.J. (1986) Antipredator function of schooling in teleost fishes: a selective review. Nat, Can.(Quebec),7I, 149-55.
Godin, J.-G.J. & Morgan, J. (1985) Predator avoidance.and school size in a cyprindontid fish, the bandedkillifish (Fundulus diaphanus Lesueur). Behav, Ecol. Sociobiol., 16, 105-10.
God", O.R. (1994) Factors affecting the reliability of groundfish abundance estimates from bottom trawlsurveys. In: Marine Fish Behaviour in Capture and Abundance Estimation (eds Ferno, A. & Olsen, S.)pp. 166-99. Fishing News Books, Oxford.
God", O.R. & Valdemarsen, J.W. (1993) A three level pelagic trawl for near surface sampling of juvenilefish. ICES CM/1993, B:19, Re! H.
God", O.R. & Wespestad, V. (1993) Monitoring changes in abundance of gadoids with varying availability.to surveys. ICES J. Mar. sa, SO, 39-51.
Gomes, C, Mahon, R., Singh-Renton, S. & Hunte, W. (1994) The role ofdrifting objects in pelagic fisheriesin the south-eastern Caribbean. Caricom Fish. Res. Doc., Chap. 15..
Goncharov, S.E., Borisenko E.S. & Pyanov, A. (1989) Jack mackerel schools' defence reaction to a surveying vessel. Proc. I.O.A., H, 74-8.
Gonzalez-Ramos, A.J. (1989) Influencia de las condicionantes medio-arnbientales en la pesqueria superficial del atun listado (Katsuwonus pelamis) en aguas del Archipielago Canario. Col. Doe. Client.ICCAT., 30 (I), 138-49.
Gonzalez-Ramos, AJ. (1992) Bioecologia.del listado (Katsuwonus pelamis, linneatus 1758) en aguas delarchipielago Canario: modelo de gestion y explotacion mediante el uso de la teledeteccion: Thesis Uni-versidad de las Palmas de Gran Canaria (Spain). .
Gooding, R.M. & Magnuson, J.J. (1967) Ecological significance ofa drifting object to pelagic fishes. PacificScience, 21, 486-97.
Graham, M. (1935) Modern theory of exploiting a fishery, and application to North Sea trawling. J. Cons.Int, Explor. Mer, 10, 264--74.
Graharn, W.M. & Largier, J.L. (1997) Upwelling shadows as nearshore retention sites: the example ofnorthern Monterey Bay. Cont. Shelf Res., 17 (5), 509-32.
Grandperrin, R. (1975) Structures trophiques aboutissant aux thons de tongue ligne dans le Pacifique sudouest tropical. These'de Doctorat, Universite d'A.ix-Marseille (France).
Graves, J. (1977) Photographic method for measuring spacing and density within pelagic fish schools at sea.Fish. Bu//.(US) 74, 230-34.
Gray, J.A.B. & Denton, E.J. (1991) Fast pressure pulses and communication between fish. J. Mar. Bioi.Assn. (UK) 71,83-106.

308 References
Green, R.E. (1967) Relationship of the therrnocline to success of purse seining for tuna. Transactions of theAmer. Fish. Soc., 96 (2), 126-30.
Greenblatt, P.R. (1976) Factors affecting tuna purse seine fishing effort. ICCAT SCRS 76/75, 18-30.Greenblatt, P.R. (1979) Associations of tuna with flotsam in the eastern tropical Pacific. Fish. Bull. (US) 77
(I), 147-55.Gregory, R.S. (1993) Effect of turbidity on the predator avoidance behaviour of juvenile chinook salmon
tOncorhynchus tshawytscha). Can. J. Fisheries Aquat. Sci., 50 (2),241--6.Gross, M.R. & Charnov, E.L. (1980) Alternative male life histories in bluegill sunfish. Proc. Natl. Acad. Sci.
(USA) 77, 6937-40.Guerrero, A. & Yaiiez, E. (1986) Analisis de las principales pesquerias pelagicas desarrolladas en la zona de
Talcahuano (37°S-73.oW) entre 1965y 1984. Valparaiso. In: La pesca en Chile (ed. Arana, P.), pp. 223241. Escuela de Ciencias del Mar.
Gulland, 1.A. (1955) Estimation of growth and mortality in commercial fish populations. Fish. Invest ..Lond., Ser. 2, 18 (9).
Gulland, 1.A. (1964) Catch per unit effort as a measure of abundance. Rapp. Pi-v, Reun. Cons.Tnt. Explor.Mer, 155,8-14.
Gulland, 1.A. (1965) Estimation of mortality rates. Annex to Arctic Fisheries. Report of the WorkingGroup. ICES CM/1965, doe. 3 (mimeo).
Gulland, 1.A. (1969) Manual of methods for fish stock assessment Part I. Fish population analysis. FAOMan. Fish. Sci., 4.
Gunderson, D.R. (1993) Surveys 0/ Fisheries. Resources. John Wiley & Sons, New York.Guthrie, D.M. (1986) Role of vision in fish behaviour. In: The Behaviour of Teleost Fishes (ed. Pitcher, T.J.),
pp. 75-113. Croom Helm, London.Guthrie, D.M. & Muntz,W.R.A. (1993) Role of vision in fish behaviour. In: Behaviour of Teleost Fishes,
2nd edn, (ed. Pitcher, T.J.), pp. 89-128. Chapman and Hall, London.Guyomarc'h, l.-C. (1980) Abrege d'ethologie. In: Determinisme ifonction, ontogenese, evolution des com
portements. Masson, Paris.Haegele, C.W. & Schweigert, 1.F. (1985) Distribution and characteristics of herring spawning grounds and
description of spawning behavior. Can.' J. Fish. Aquat, Sci., 42 (Suppl. I), 39-55.Hagstrern, O. & Rettingen. l. (1982) Measurements of the density coefficient and average target strength of
herring using purse seine. ICES CM 1982/B:33, pp. 1-13.Hall, M. (I 992a) The association of tunas with floating objects and dolphins in the Eastern Pacific ocean:
VII. Some hypotheses on the mechanisms governing the association of tunas with floating 0 bjects anddolphins. In: International workshop ofl the ecology and fisheries for tunas associated with floatingobjects and on assessment issues.arisingfrom the association 0/tunas with floating objects (ed. Hall, M.).Inter-American Tropical Tuna Commission Int, Rep., San Diego.
Hall, M. (ed.) (I 992b) 1nternationalWorkshopon:the ecology and fisheries for tunas associated with floatingobjects and on assessment issues arising from the 'assocition 0/tunas with floating objects. Inter-AmericanTropical Tuna Commission Int. Rep., San Diego (mimeo).
Hall, M. & Garcia, M. (1992) ,The association .of tunas with floating objects and dolphins in the EasternPacific ocean: IV. Study of repeated sets on the same object. In: International workshop on the ecologyand fisheries for tunas associated with jloiliing objects and on assessment issues arising from the association 0/ tunas with floating objects (ed. Hall, M.). Inter-American Tropical Tuna Commission Int.Rep., San Diego. . . . ..
Hall, M., Lennert, C. & Arenas, P..(I992a) The ~ssociation of tunas with floating objects and dolphins inthe Eastern Pacific ocean:: It The purse-seine fishery for tunas in the eastern Pacific Ocean. In:International workshop on the ecology 'and fisheries for tunas associated with floating objects and onassessment issues arising from the association of'tunas with floating objects (ed. Hall, M.). InterAmerican Tropical Tuna Commission Int. Rep., San Diego.
Hall, M., Garcia, M. Lennert, C. & Arenas.P, (l992b). The association of tunas with floating objects anddolphins in the Eastern Pacific ocean: Ill. Characteristics of'floating objects and their attractiveness fortunas. In: International workshop on the ecology andfisheries for tunas associated with floating objectsand on assessment issues arising from the association 0/ tunas with floating objects (ed. Hall, M.). InterAmerican Tropical Tuna Commission Int. Rep., San Diego.
Hall, S.l., Wardle, C.S. & MacLennan, D.N. (1986) Predator evasion in a fish school: test ofa model for thefountain effect. Mar. Biol., 91 (I), 143-8.

References 309
Halldorsson, O. & Reynisson, P. (1983) Target strength measurement of herring and capelin in-situ. ICESCM 1983/H:36.
Hallier, J.-P. (1986) Purse seining on debrisassociated schools in the Western Pacific Ocean. Indo PacificTuna Development and Management Programme. Expert consultation on stock assessment of tunas inthe Indian Ocean in Colombo, Sri Lanka, 28 November-I 2 December 1985. IPTP work. doc., pp. 15056.
Hallier, J.P. (1995) Tropical tuna fishing with purse seine and log. FAO Infofish International, 4, 53-8.Hallier, J.-P. & Kulbicki, M. (1985) Analyse des resultats de la pecherie ala canne de la Nouvelle-Cale
donie. Rapp. Sci. Tech. Cent. Noumea Orstom, 36 (mimeo).Hallier, J.-P. & Parajua, J.1. (I 992a) Tropical tuna at sea: what are they associated withjIn International
workshop on the ecology and fisheries for tunas associated with floating objects and on assessment issuesarising from the association of tunas with floating objects (ed. Hall, M.). Inter-American Tropical TunaCommission Int. Rep., San Diego (mimeo).
Hallier, J.-P. & Parajua, J.1. (l992b) Review of tuna fisheries on floating objects in the Indian Ocean. In:International workshop on the ecology and fisheries for tunas associated with floating objects .and onassessment issues arising from the association of tunas with floating objects (ed. Hall, M.) InterAmerican Tropical Tuna Commission Int. Rep., San Diego (mimeo).
Hallier, J.-P. & Parajua, J.1. (I 992c) Fishing for tunas on the same floating object. In International workshopon the ecology and fisheries for tunas associated with floating objects and on assessment issues arisingfrom the association of tunas with floating objects (ed. Hall, M.) Inter-American Tropical TunaComission Int. Rep., San Diego (mimeo).
Hamilton, W.D. (1971) Geometry for the selfish herd. J. Theor. Biol., 31, 295-311.Hamilton, M.G., Nevarez-Martinez, M.O. & Rosales-Casian, J.A. (1991) Pacific sardine and northern
anchovy in the Gulf of California, Mexico: current results of SARP MEXICO. ICES CM/1991, H:20.Hampton, I. (1996) Acoustic and egg-production estimates of South African anchovy biomass over a
decade: comparisons, accuracy, and utility. ICES J. Mar. Sci., 53 (2), 493-500.Hampton, I., Arrnstrong, M.J., Jolly, G.M. & Shelton, P.A. (1990) Assessment of anchovy spawner bio
mass off South Africa through combined acoustic and egg-production surveys. Rapp. P.-v. Reun. Cons.Int. Explor. Mer, 189, 18-32.
Hampton, J. (1986) Effect of tagging on the condition of southern bluefin tuna. Thunnus maccoyii(Castlenau). Aust. J. Mar. Freshwater Res., 37 (6), 699-705.
Hampton, J. & Bailey, K. (1992) Fishing for tunas associated with floating objects: Review of the westernPacific fishery. In: International workshop on the ecology and fisheries for tunas associated with floatingobjects and on assessment issues arising from the association oftunas with floating objects (ed. Hall, M.).Inter-American Tropical Tuna Commission Int. Rep., San Diego (rnirneo).
Harnre, J. (1991) Interrelation between environmental changes and fluctuating fish population in theBarents Sea. In: Long-term Variability of Pelagic Fish Populations and their Environment (eds Kawasaki, T., Tanaka, S., Toba, Y. & Taniguchi, A.), pp..259-70. Pergamon Press.
Hamre, J. & Dommasnes, A. (1994) Test experiments of target strength of herring by comparing densityindices obtained by acoustic method and purse seine catches. ICES CM 1984/B:17, pp. 1-5.
Hanarnoto, E. (1975) Fishery oceanography of bigeye tuna. 11. Thermocline and dissolved oxygen contentin relation to tuna Iongline fishing grounds in the eastern tropical Pacific Ocean. Bull. Soc. FrancoJaponaise Ooceanogr., 13, 58-71.
Hancock, J., Hart, P.J.B. & Antezana, T. (1995) Searching behaviour and catch of horse mackerel (Trachurus murphyii by industrial purse-seiners off south-central Chile. ICES J. Mar. Sci., 52, 991-1004.
Hand, CM. & Richards, L.J. (1991) Purse-seine surveys of post-larval lingcod (Ophiodon elongatus) in theStrait of Georgia, 1989-90. Can. Manuscr. Rep. Fish. Aquat. Sci., 2106.
Hansen, L.P. (1988) Effects of carlin tagging and fin clipping on survival of Atlantic salmon (Salmo salarL.) released as smolts. Aquaculture, 70 (4), 391-4.
Hansen, L.P. & Jonsson, B. (1994) Homing of Atlantic salmon: effects of juvenile learning on transplantedpost-spawners. Anim. Behav., 47 (I), 220-22.
Hansson, S. (1993) Variation in hydroacoustic abundance of pelagic fish. Fish: Res., 16, 203-22.Hara, I. (1985) Shape and size of Japanese sardine school in the waters off the southeastern Hokkaido on
the basis of acoustic and aerial surveys. Bull. Japan. Soc. Sci. Fish., 51 (I), 41---{j.Hara, I. (1986) Stock assessment of Japanese sardine in the waters off the Southeast coast of Hokkaido
using line transect method. Bull. Jap. Soc. Sci. Fish., 52 (1),69-73.

310 References
Hara, I. (1987) Swimming speed of sardine school on the basis ofaeriaJ survey. Nippon Suisan Gakkaishi, 53(2),223-7. .
Hara, TJ. (1993) Role of olfaction in fish behaviour. In: Behaviour of Teleost Fishes, 2nd edn (ed. Pitcher,TJ.), pp. 171-99. Chapman and Hall, London.
Haralabous, J. & Georgakarakos, S. (1996) Artificial neural networks as a tool for species identification offish schools. ICES J. Mar. Sci., 53 (2), 173-80.
Harden Jones, F.R. (1963) The reaction of fish to moving backgrounds. J. Exp. Biol., 40, 437--46.Harden Jones, F.R. (1968) Fish Migration. St Martin's Press, New York.Harden Jones, F.R. (1978) Objectives and problems related to research into fish behaviour. In: Sea Fisheries
Research (ed. Harden Jones, F.R.), pp. 261-75. John Wiley and Sons, New York.Harden Jones, F.R. & McCartney, B.S. (1962) The use of electronic sector-scanning sonar for following the
movements of fish shoals: sea trials on RRS Discovery n. J. Cons. Int. Explor. Mer, 27, 141-9.Harden Jones, F.R. & Scholes, P. (1981) The swimbladder and vertical movements and the target strength
of fish. In: Meeting on Hydroacoustical Methodsfor the Estimation of Marine Fish Populations, 25-29June 1979, vol. 2 (ed. Soumala, J.B.), pp. 157-82. The Charles Stark Draper Laboratory, Cambridge,Mass., USA.
Hardin, G. (1960) The competitive exclusion principle. Science, 131, 1291-7.Harris, J.H. (1989) Planning of mark-recapture experiments to estimate population abundance in fresh
water fisheries. Tagging: solution or problem. Workshop, Australian Society for Fish Biology, Sydney,NSW (Australia), 21 July 1988. Proc. Bur. Rural Resour.. Australian Government Publishing Service,Canberra, 5, 43--4.
Hart, PJ.B. (1986) Foraging in Teleost Fishes. In: Behaviour of Teleost Fishes, 2nd edn. (ed. Pitcher, TJ.),pp. 211-35. Chapman and Hall, London.
Hattala, K., Stang, D., Kahnle, A. & Mason, W. (1988) Beach seine survey ofjuvenile fishes in the HudsonRiver estuary. Summary report for 1980--1986. New York State Dept. Environ. Conserv.
Hauser, J .W. & Sissenwine, M.P. (1991) The uncertainty in estimates of the production of larval fish derivedfrom samples of larval abundance. ICES J. Mar. Sci., 48, 23-32.
Hawkins, A.D. (1973) The sensitivity of fish to sounds. Oceanogr. Mar. Bioi. Ann. Rev., 11,291-340.Hawkins, A.D. (1981) The hearing ability of fish. In: Hearing and Sound Communication in Fishes (ed.
Tavolga, W.N., Popper, A.N. & Fay, R.R.), pp. 109-133. Springer-Verlag, New York.Hawkins, A.D. (1986) Underwater sound and fish behaviour. In: The Behaviour of Teleost Fishes (ed.
Pitcher, T.J.), pp. 114-51. Croom Helm, London.Hawkins, A.D. (1993) Underwater sound and fish behaviour. In: Behaviour of Teleost Fishes, 2nd edn (ed.
Pitcher, TJ.), pp. 129,..-{j9. Chaprnanee Hall, London.Hawkins, A.D. & Chap man, CJ. (1969) Afield determination of the hearing thresholds for the cod, Gadus
morhua L. International working group for fishing technology. Report of the 8th IF Meeting, Lowestoft, 29-30th April, 1969, pp. 89-97.
Hawkins, A.D. & Chapman, CJ. (1975) Masked auditory thresholds in the cod, Gadus morhua L. J. Comp.Physiol., 103, 209-:-26.
Hawkins, A.D. & MacLennan, D.N. (1976) An acoustic tank for hearing studies on fish. In: SoundReception in Fish (eds Schuijf, A. & Hawkins, A.D.), pp. 146-169. Elsevier, Amsterdam.
Hawkins, A.D. & Sand, O. (1977) Directional hearing in the median vertical plane by the cod. J. Comp.Physiol., 122, 1-8.
Hay, D.E. (1985) Reproductive biology of Pacific herring (Clupea harengus pallasii. Can. J. Fish. Aquat.Sci., 42 (Suppl. I), 11-126.
Hay, T.F. (1978) Filial imprinting in the convict cichlid fish, Cichlasoma nigrofasciatum. Behavior, 65, 13860.
Hayasi, S. (1974) Effort and CPUE as measure of abundance. ICATT Col/. Vol. Sci. Pap., 3, 12-31.He, P. (1991) Swimming endurance of Atlantic cod, Gadus morhua, at low temperatures. Fish. Res., 12,65
73.He, P. & Wardle, CS. (1986) Tilting behaviour of the Atlantic mackerel, Scomber scombrus, at low
swimming speeds. J. Fish. Bioi., 29, 223-32.'Heape, W. (1931) Emigration, Migration and Nomadism. Heffer, Cambridge, UK.Heath, M.R. (1992) Field investigations of the early life stages of marine fish. Adv. Mar. Biol., 28, 1
133.Heath, M.R. (1993) An evaluation and review of the ICES herring larval surveys' in the North Sea and

References 311
adjacent waters. In: Advances in the Early Life History of Fishes. Part 2. Ichthyoplankton Methods forEstimating Fish Biomass (eds Hunter, J.R., Lo, N.CH. & Fuiman, L.A.), pp. 795-817. Bull. Mar. Sci.(US), 53 (2).
Hedgecock, D., Hutchinson, E.S., Li, G., Sly, F.L. & Nelson, K. (1989) Genetic and rnorphometricvariation in the Pacific Sardine, Sardinops sagax caerulea: comparisons and contrasts withhistorical data and with variability in the northern anchovy, Engraulis mordax. Fish Bull. (US), 87 (3),653-71.
Helfman, G.S. (1981) The advantage to fishes of hovering in shade. Copeia, 2, 392-400.Helfman, G.S. (1984) School fidelity in 'fishes: the yellow perch pattern. Anim. Behav., 32 (3), 663-72.Helfman, G.S. (1992) Fish behaviour by day, night and twilight. In: Behaviour of Teleost Fishes, 2nd edn,
(ed. Pitcher. TJ.), pp. 479-512. Chap man and Hall, London.Helfman, G.S. & Schultz, E.T. (1984) Social transmission of behaviour in a coral reef fish. Anim. Behav., 32
(2), 379-84.Helfman, G.S., Meyer, J.L. & McFarland, W.N. (1982) The ontogeny of twilight migration patterns in
grunts (pisces: Haemulidae). Anim. Behav., 30, 317-26.Hergenrader, G.L. & Hasler, A.D. (1968) Influence of changing seasons on schooling behaviour of yellow
perch. J. Fish. Res. Board Can., 25, 711-16.Hering, G. (1968) Avoidance of acoustic stimuli by the herring. ICES, CM 1968/H:18, pp. 1-5.Herve, A., Bard, F.X. & Gonzales Costas, F. (1991) Facteurs d'accroissement potentiels de la puissance de
peche des senneurs tropicaux francais et espagnols entre 1985et 1989. ICCAT Collect. Vol. Sci. Pap.,35 (I), 8-13
Hewitt, R.P., Smith, P.E. & Brown, J.C (1976) Development and use of sonar mapping for pelagic stockassessment in the California current area. Fish. Bull., 74, 218-300.
Hilborn, R. (1979) Comparison of fisheries control systems that utilise catch and effort data. J. Fish. Res.Board Can., 36, 1477-89.
Hilborn, R. (1985) Apparent stock recruitment relationships in mixed stock fisheries. Can. J. Fish. Aquat.Sci., 42, 718-23.
Hilborn, R. (1991) Modeling the stability of fish schools: exchange of individual fish between schools ofskipjack tuna iKatsuwonus pelamis). Can. J. Fish. Aquat. Sci., 48, 1081-91.
Hilborn, R. & Medley, P. (1989) Tuna purse-seine with fish-aggregating devices (FAD): models of tunaFAD interactions. Can. J. Fish. Aquat. Sci., 46, 28-32.
Hilborn, R. & Sibert, J. (1986) Is international management of tuna necessary? South Pacific Comm. Fish.Newsl., 39, 31-9.
Hilborn, R. & Waiters, CJ. (1987) A general model for simulation of stock and fleet dynamics in spatiallyheterogeneous fisheries. Can. J. Fish. Aquat. Sci., 44, 1366-9.
Hilborn, R. & Waiters, CJ. (1992) Quantitative Fisheries Stock Assessment: Choice, Dynamics andUncertainty. Chapman and Hall, New York.
Hiramoto, K. (1991) The sardine fishery and ecology in the Joban and Boso waters of Central Japan. In:Long-term Variability ofPelagic Fish Populations and their Environment (eds Kawasaki, T., Tanaka, S.,Toba, Y. & Taniguchi, A.), pp. 117-128. Pergamon Press, Oxford.
Hjort, J. (1908) Some Results of the International Ocean Researches. Scottish Ocean. Lab., Edinburgh.Hjort, J., Jahn, G. & Ottestadt, P. (1933) The optimum catch. Hvalrad. Skr., 7, 92-127.Hoar, W.S. & Randall, DJ. (1979) Fish Physiology, vol. V. Academic Press, New York.Hobson, E.S. (1963) Selective feeding by the gafftopsail pompano Trachinotus rhodopus (Gill), in mixed
schools of herring and anchovies in the Gulf of California. Copeia, 3, 595-6.Hobson, E.S. (1968) Predatory behaviour of some shore fishes in the Gulf of California. Bur. Sport Fish.
Wild. Res. Rep., 73, 1-92.Holeton, G.F. (1980) Oxygen as en environmental factor of fishes. In: Environmental Physiology of Fishes,
series A (ed. Ali, M.A.), pp. 7-32. Plenum Press, New York.HoJeton, G.F., Pawson, M.G. & Shelton, G. (1982) Gill ventilation, gas exchange, and survival in the
Atlantic mackerel (Scomber scombrus L.). Can. J. Zool., 60(5), 1141-7.Holland, K.N. & Kajiura, S. (1997) Analysis of Hawaii sea mount tuna tagging program recaptures. In:
48th Tuna Conference at Lake Arrowhead (eds Scott, M. & Oson, R.). Inter-American Tropical TunaCommission Int. Rep., San Diego.
Holland, K.N., Brill, R.W. & Chang, R.K.C (1990) Horizontal and vertical movements of Pacific bluemarlin captured and released using sportfishing gear. Fish. Bull. (US), 88, 397-402.

312 References
Holliday, D.V. (1977) Two applications of the Doppler effect in the study of fish schools. Rapp. P.-v. Reun.Cons. Perm. Int, Explor. Mer, 170,21-30.
Horne, J.K. & Schneider, D.e. (1995) Spatial variance in ecology. Oikos, 74, 18-26.Hourston, A.S. (1982) Homing by Canada's west coast herring to management units and divisions as
indicated by tag recoveries. Can. J. Fish. Aquat, Sci., 39, 1414-22.Hunter, J.R. (1966) Procedure for analysis of schooling behaviour. J. Fish. Res. Board Can., 23,
547--62.Hunter, J.R. (1968) Effects of light on schooling and feeding jack mackerel, Trachurus symmetricus. J. Fish.
Res. Board Can., 25, 393-407.Hunter, J.R. (1969) Communication of velocity changes in jack mackerel (Trachurus symmetricus) schools.
Anim. Behav., 17, 507-14.Hunter, J.R. & Coy ne, K.M. (1982) The onset of schooling in the northern anchovy larvae, Engraulis
mordax. Cal. Coop. Oceanic Fish. Invest. R., 23, 246-51.Hunter, J.R. & Lo, N.e.H. (1993) Ichthyoplankton methods for estimating fish biomass introduction and
terminology. In: Advances in the Early Life History 0/ Fishes. Part 2. Ichthyoplankton Methods forEstimating Fish Biomass (eds Hunter, J.R., Lo, N.e.H. & Fuiman, L.A.), pp. 723-7. Bull. Mar. Sci.(US) 53 (2).
Hunter, J .R. & Mitchell, C.T. (1967) Association of fishes with flotsam in the offshore waters of CentralAmerica. Fish Bull. (US), 66 (I), 13-29.
Hunter, J.R. & Mitchell, C.T. (1968) Field experiments on the attraction of pelagic fish to floating objects.J. Cons. Perm. Int. Explor. Mer, 4] (3),427-34.
Hunter, J.R. & Nicholl, R. (1985) Visual threshold for schooling in northern anchovy, Engraulis mordax.Fish. Bull., 83 (3), 235-42.
Hunter, J.R. & Wisby, W.J. (1964) Net avoidance behaviour of carp and other species of fish. J. Fish. Res.Board Can., 2], 613-33.
Hunter, J.R., Argue, A.W., Bayliff, W.H., Dizon, A.E., Fonteneau, A., Goodman, D. & Seckel, G.R.(1986) The dynamics of tuna movements: an evaluation of past and future research. FAO Fish. Tech.Pap., 277.
Hunter, J.R., Lo, N.e.H. & Fuiman, L.A. (eds) (1993) Advances in the early life history of fishes. Bull. Mar.Sci. (US) 53 (2).
Huntingford, F.A. (1986) Development of behaviour in fish. In: Behaviour 0/ Teleost Fishes, 2nd edn, (ed.Pitcher, T.J.), pp. 57-83. Chapman and Hall, Londorf
Huntingford, F.A. (1993) Behaviour, ecology and teleost fishes. In: Behavioural Ecology 0/ Fishes (edsHuntingford, F.A. & Torricelli, P.), 11, 1-5. Harwood Academic Publishers, Chur.
Huntingford, F.A. & Coulter, R.M. (1989) Habituation of a predator inspection in the three-spinedstickleback, Gasterosteus aculeatus L. J. Fish Bioi., 35, 153-4.
Huntingford, F.A. & Torricelli, P. (eds) (1993) Behavioural Ecology 0/ Fishes. Ettore Majorana International Life Sciences Series, 11. Harwood Academic Publishers, Chur.
Huntingford, F.A. & Wright, P.J. (1992) Inherited population differences in avoidance conditioning inthree-spined sticklebacks, Gasterosteus aculeatus. Behaviour, 122 (3-4), 264-73.
Huntingford, F.A., Metcalfe, N.B. & Thorpe, J.E. (1988) Feeding motivation and response to predationrisk in Atlantic salmon parr adopting different life history strategies. J. Fish Bioi., 32, 777-82.
Hurley, A.e. (1978) School structure of the squid Loligo opalescens. Fish. Bull. (US) 76, 433-41.Huse, I. & Ona, E. (1996) Tilt angle distribution and swimming speed of overwintering Norwegian spring
spawning herring. ICES J. Mar. sa; 53, 863-73.Hutchings, J .A. (1996) Spatial and temporal variation in the density of northern cod and a review of
hypotheses for the stock's collapse. Can. J. Fish. Aquat. Sci., 53,943--62.Hutchings, J.A. & Myers, R.A. (1994) Timing of cod reproduction: interannual variability and the influence
of temperature. Mar. Ecol-Progr. Ser., 108, 21-31.Huth, A. & Wissel, e. (1990) The movement of fish schools: a simulation model. In: Lecture Notes in
Biomathematics. Biological motion, 89, 577-590.Huth, A. & Wissel, e. (1993) Analysis of the behaviour and the structure of fish schools by means of
computer simulations. Comm. Theor. Bioi., 3 (3), 169-201.Huth, A. & Wissel, e. (1994) The simulation of fish schools in comparison with experimental data. Ecol.
Model., 75/76, 135-46.Ianelli, J. (1987) A method/or estimating recruitment patterns oftunas to floating objects using removal data.
South Pacific Commission 1nl. Rep., II (mimeo).

References 313
Icochea, L., Chipollini, A. & Niquen, M. (1989) Analisis de pesqueria de arrastre pelagica en la costaperuana durante 1983-1987 y su relacion col el medio ambiente. Simposium Internacional de 10sRecursos Vivos y las Pesquerias en eI Pacifico Sudeste, Vina Del Mar (Chile), 9-13 May 1988. Rev.South Pacific Comm. (Special Issue), 455-65.
Inoue, Y. & Arirnoto, T. (1989) Scanning sonar survey on the capturing processoftrapnet. In: Proceedingsof World Symposium on Fishing Gear and Fishing Vessel Design (ed Marine Institute), pp. 417-21. StJohn's, Newfoundland, Canada.
Inoue, Y. Matsushita, Y. & Arimoto, T. (1993). The reaction behaviour of walleye pollock (Theragrachalcogramma) in a deep/low-temperature trawl fishing ground. ICES Mar. Sci. Symp., 196, 77-9.
Isshiki, T., Hanamoto, E., Mouri, M., Miyabe, N. & Takeuchi, S. (1997) The effect of dissolved oxygencontent on the distribution of bigeye tuna, Thunnus obesus, in the Indian Ocean. 48th Tuna Conferenceat Lake Arrowhead. Inter-American Tropical Tuna Commission, San Diego.
Ivanova, V.F. & Khmel'-nitskaya, G.N. (1991) On the distribution pattern of Peruvian horse mackerel inthe south-east and south-west Pacific and its influence on the catchability of midwater trawls. Ecological Fishery Investigations in the South Pacific (ed. Nesterov, A.A.), pp. 28-35. Rev. South PacificComm. (special issue).
Iversen, R.T.B. (1969) Auditory thresholds of the scombrid fish, Euthynnus affinis, with comments on theuse of sound in tuna fishing. FAO Fish. Rep., 62 (3), 849--59.
Jacques, G. & Treguer, P. (eds) (1986) Ecosystemes Pelagiques Marins. Masson, Paris.Jakobsson, J. (1983) Echo surveying of the Icelandic summer spawning herring 1973-1982. FA 0 Fish. Rep.,
300, 240-48.Jakobsson, J. (1962) On the migrations of the north coast herring during the summer season in recent
years with special reference to the increased yield in 1961 and 1962. ICES meeting, Doe. 98(mimeo).
Jakobsson, J. (1963) Some remarks on the distribution and availability of the north coast herring of Iceland.Rapp. Pi-v. Reun. Cons. Int. Explor. Mer, 154, 73-82.
Jakobsson, J. (1968) Herring migrations east of Iceland during the summer and autumn 1966 and 1967. FiskDir. Skr. Ser. Havunders., IS, 17-22.
Jakobsson, J. (1985) Monitoring and management of the north-east Atlantic herring stocks. Can. 1. Fish.Aquat, Sci., 42 (Suppl. 1),207-21.
Jakobsson, J. & 0stvedt, O.J. (1996) A preliminary review of the joint investigations on the distribution ofherring in the Norwegian and Iceland Seas 1950--1970. ICES CM/1996. H:I4.
James, A.G. (1988) Are clupeid microphagists herbivorous or omnivorous? A review of the diets of somecommercially important clupeids. S. Afr. J. Mar. Sci., 7,161-77.
Johannessen, T., Ferno, A. & Lekkeborg, S. (1993) Behaviour of cod (Gadus morhua) and haddock(Melanogrammus aeglefinusi in relation to various sizes of long-line bait. ICES Mar. Sci. Symp., 196,47-50.
Johannesson, K.A. & Robles, A. N. (1977) Echo surveys of Peruvian anchoveta. Rapp. P.-v. Reun. Cons. Int.Explor. Mer, 170, 237--44.
John, K.R. (1964) Illumination, vision and schooling of Astyanax mexicanus Fillipi. J. Fish. Res. BoardCan., 21, 1453-73.
Jones, J.W. (1959) The Salmon. Collins New Naturalist, London.Jones, R. (1974) Assessing the long term effect of changes in fishing effort and mesh size from length
composition data. ICES CM/1974. F:33.Jones, R. (1981) The use of length composition data in fish stock assessments (with notes on VPA and
cohort analysis). FAO Fish. Cir., 734.Joseph, A. & Somvanshi, V.S. (1989) Application of swept volume method in pelagic stock assessment of
Megalaspsis cordyla (Linnaeus) along north-west coast oflndia. Spec. Publ. Fish. Surv.lndia, 2, 136-48.Josse, E. (1992) Different ways of exploiting tuna associated with fish aggregating devices anchored in
French Polynesia. In: International workshop on the ecology and fisheries for tunas associated withfloating objects and on assessment issues arising from the association of tunas with floating objects (ed.Hall. M.). Inter-American Tropical Tuna Commission 1nl. Rep., San Diego (mimeo).
Josse, E., Bach, P. & Dagorn, L. (in press) Tuna/prey relationships studied by simultaneous sonic trackingsand acoustic surveys. Hydrobiologia.
Karlsen, H.E. (1992a) Infrasound sensitivity in the plaice (Pleuronectes platessa). J. Exp. Bioi., 171, 173-87.Karlsen, H.E. (I992b) The inner ear is responsible for detection of the infrasound in the perch (Perca
fluviatilis). J. Exp. Bioi., 171, 163-72.

314 References
Karp, W.A. (ed) (1990) Developments in fisheries acoustics. Symposium held in Seattle, 22-26 June 1987.Rapp. P.-v. Reun. Cons. Int. Explor. Mer, 189.
Kawasaki, T. (1992) Mechanisms governing fluctuations in pelagic fish populations. S. AJr. J. Mar. Sci., 12,873~9.
Kawasaki, T., Tanaka, S., Toba, Y. & Taniguchi, A. (eds) (1990) Long-term Variability of Pelagic FishPopulations and their Environment. Pergamon Press, Oxford.
Kay, B.1., Jones, D.K. & Mitson, R.B. (1991) FRVCorystes: a purpose-built fisheries research vessel. TheRoyal Institution of Naval Architects, London. Spring Meeting 1991.
Keenleyside, M.H.A. (1955) Some aspects of the schooling behaviour of fish. Behaviour, 8,183-248.Kemmerer, A.1. (1980) Environmental preferences and behaviour patterns of gulf menhaden (Brevoortia
patronusi inferred from fishing and remotely sensed data. In: Fish Behaviour and its use in the captureand culture oJfishes: proceedings oJ the conference on the physiological and behavioural manipulation oJfood fish as production and management tools (eds Bardach, J.E., Magnuson, J.1., May, R.e. &Reinhart, J.M.), pp. 345-70. Bellagio, Italy, 3-8 November 1977. ICLARM Conference Proceedings,Manila.
. Kendall, A.W., Incze, L.S., Ortner, P.B., Curnrnings, S.R. & Brown, P.K. (1994) The vertical distribution ofeggs and larvae of walleye pollock, Theragra chalcogramma, in Shelikof Strait, Gulf of Alaska. Fish.Bull. (US) 92 (3), 540--54.
Kennedy, M. & Gray, R.D. (1993) Can ecological theory predict the distribution of foraging animals? Acritical analysis of experiments on the Ideal Free Distribution. Oikos, 68, 158-66.
Kerstan, M. (1995) Ages and growth rates of Agulhas Bank horse mackerel Trachurus trachurus capensis:comparison of otolith ageing and length frequency analyses. S. AJr. 1. Mar. Sci., 15, 137-56.
Kesteven, G.L. (ed) (1960) Symposium on Fish Behaviour. Section l/l. Proceedings of Indo-Pacific FisheriesCouncil, 8th session, Columbo, Ceylon, 6-22 December 1958. IPFC Secretariat, FAO Regional Officefor Asia and the Far East, Bangkok.
Kieffer, J.D. & Colgan, P.W. (1992) The role oflearning in fish behaviour. Rev. Fish BioI. Fisheries, 2, 12543.
Kikawa, S. & Nishikawa, Y. (1986) Predators of skipjack, Katsuwonus pelamis, in the Atlantic Ocean and apreliminary indication of skipjack distribution. In: Proceedings oJ the ICCA T Conference on theInternational Skipjack Year Program (eds Symons, P.E.K., Miyake, P.M. & Sakagawa, G.T.), pp. 2968. ICCAT, Madrid.
Kim, M.-K., Arimoto, T., Matsushita, Y. & Inoue, Y. (1993) Migration behaviour offish schools in set-netfishing grounds. Bull. Japan Soc. Sci. Fish., 59 (3), 473-9.
Kimura, D.K. (1977) Statistical assessment of the age-length key. J Fish. Res. Board Can., 34 (3), 317-24.Kimura, K. (1929) On the detection of fish-groups by an acoustic method. J. Imp. Fish. Inst. Tokyo, 24, 41
5.Kislalioglou, M. & Gibson, R. (1976) Prey 'handling time' and its importance in food selection by the 15
spined stickleback, Spinachia spinachia. J. Exp. Mar. BioI. Ecol., 25, 151-8.Kleiber, P.M. & Hampton, J. (1994) Modelling effects of FADs and islands on movement of skipjack tuna
(Katsuwonus pelamis): estimating parameters from tagging data. Can. J. Fish. Aquat . Sci., 51, 2642-53.Klima, E.F. & Wickham, D.A. (1971) Attraction of coastal pelagic fishes with artificial structures. Trans.
Amer. Fish. Soc., 1,86-99.Klimley, A.P. & Holloway, e. (1996a) Automated monitoring of yellowfin tuna at Hawaiian FADs. N M FS
Tuna Newsletter, Nov. 1996.Klimley, P.A. & Holloway, e. (l996b) Automated monitoring of yellowfin tuna at Hawaiian FADs. In:
Proceedings of the 47th tuna conference: Sustaining tuna fisheries: Issues and answers (eds Jackson, A.,Rasmussen, R. & Bartoo, N.). Southwest Fisheries Science Center/National Marine Fisheries Service,NOAA, La Jolla (mimeo).
Knudsen, F.R., Enger, P.S. & Sand. O. (1992) Awareness reactions and avoidance responses to sound injuvenile Atlantic salmon, Salmo salar L. J. Fish. Biol., 40, 523-34.
Knudsen, H.P. (1990) The Bergen Echo Integrator: an introduction. J. Cons. Int. Explor. Mer, 47, 167-74.Koester, F.W. (1989) Feeding Activity of Baltic Herring in the Bornholm Basin. ICES Baltic Fish Comm.Kojima, S: (1956) Fishing for dolphins in the western part of the Japan Sea. II.Why do the fish take shelter
under floating materials? Bull. Japan. Soc. Sci. Fish., 21 (10), 1049-52.Koltes, K.H. (1984) Temporal patterns in three-dimensional structure and activity of schools of the Atlantic
silverside, Menidia menidia. Mar. Biol., 78, 113-22.

References 315
Koslow, J .A. (1981) Feeding selectivity in schools of northern anchovy in the southern Californian Bight.Fish Bull. (US) 79, 131-42.
Krarner, D.L. (1987) Dissolved oxygen and fish behaviour. Environ. Bioi. Fish., 18 (2),81-92.Krause, J. & Tegeder, R.W. (1994) The mechanism of aggregation behaviour in fish shoals: individuals
minimise approach time to neighbours. Anim. Behav., 48, 353-9.Krebs, J.R. & Davies, N.B. (1978) Behavioural Ecology: An Evolutionary Approach. Blackwell Science,
Oxford.Krebs, J.R. & Davies, N.B. (1984) Behavioural Ecology: An Evolutionary Approach, 2nd edn. Blackwell
Science, Oxford.Krebs, J.R. & Davies, N.B. (1991) Behavioural Ecology: An Evolutionary Approach, 3rd edn. Blackwell
Science, Oxford.Krebs, J.R.,-MacRoberts, M.H. & Cullen, J.M. (1972) Flocking and feeding in the Great Tit Parus major-
an experimental study. Ibis, 114, 507-30.Krechevsky, I. (1932) Hypothesis in rats. Psychol. Rev., 39, 516-32.Kristjonsson, H. (ed) (1959) Modern Fishing Gear of The World. Fishing News Books, Oxford.Kronman, M. (1992) LIDAR: Light detecting and ranging. Laser technology could revolutionise aerial fish
finding. NaTI. Fisherman, 72, 40-42.Kuhlmann, D.H.H. & Karst, H. (1967) Freiwasserbeobachtungen zum verhalten von tobiasfishschwarmen
i Ammodytidae) in ther westlichen Ostsee. Z. Tierpsychol, 24, 282-97.Kulka, D.W., Wroblewski, J.S. & Narayanan, S. (1995) Recent changes in the winter distribution and
movements of northern Atlantic cod (Gadus morhua Linnaeus, 1758) on the Newfoundland-LabradorShelf. ICES J. Mar. s«, 52, 889-902.
Kvalsvik, K. & Skagen, D.W. (1995) Trawl avoidance as a source of error in estimates of the prevalence ofIcthyophonushoferi disease in Norwegian spring spawning herreing (Clupea harengus L.) in the feedingarea. ICES CM 1995/H:8, pp. 1-8.
Laevastu, T. (1990a) UUSDYNE numerical dynamical ecosystem simulation (personal computer versionof Dynumes). National Marine Fisheries Service. Alaska Fisheries Science Center, Prog. Doe. 31.
Laevastu, T. (I 990b) FEBAP Fish Ecosystem Biomass Assessment Program (a bulk biomass simulation forresource assessment). National Marine Fisheries Service. Alaska Fisheries Science Center, Progr. Doe.
Laevastu, T. & Rosa, H.Jr. (1963) Distribution and relative abundance of tunas in relation to theirenvironment. FAO Fish. Rep., 6 (3),1835-51.
Laloe, F. (1988) Un modele global avec quantite de biomasse inaccessible liee aux conditions environnementales: application aux donnees de la peche ivoiro-ghaneenne de Sardinella aurita. Aquat.Living Resour., 1, 289-98.
Laloe, F. (1989) Un modele global avec quantite de biomasse inaccessible dependant de la surface de peche.Application aux donnees de la peche d'albacore (Thunnus albacares) de I'Atlantique Est. Aquat. LivingResour., 2, 231-9.
Laloe, F. (1995) Should surplus production models be fishery description tools rather than biologicalmodels? Aquat . Living Resour., 8, 1-16.
Laloe, F. & Samba, A. (1991) A simulation model of art isanaI fisheries of Senegal. ICES Mar. Sci. Symp.,193,281-6.
Larnberth, S.J., Bennett, B.A. & Clar.k, B.M. (1995) The vulnerability of fish to capture by commercialbeach-seine nets in False Bay, South Africa. S. Afr. J. Mar. Sci., 15,25-31.
Langton, e.G. (ed) (1989) Artificial Life. Santa Fe Institute Studies in the Sciences of Complexity, vol. VI.Addison-Wesley Publishing Company, Reading, Masschusetts.
Larkin, P.A. & Walton, A. (1969) Fish school size and migration. J. Fish. Res. Board Can., 26, 1372-4.Laurec, A. (1977) Analyse et estimation des puissances de peche, J. Cons. InT. Explor. Mer, 37 (2),173-85.Laurec, A. (1993) Etalonnage de l'analyse des cohortes en halieutique. In: Biometrie et Environnement (eds
Lebreton, J.D. & Asselain, J.), pp. 206-39. Masson, Paris.Laurec, A. & Fonteneau, A. (1978) Estimation de l'abondance d'une c1asse d'age: utilisation des CPUE de
plusieurs engins, en differentes zones et saisons. ICCAT, SCRS/78/86, 79-100.Laurec, A. & Le Gall, J.- Y. (1975) De-seasonalising of the abundance index of a species. Application to the
albacore (Thunnus alalunga) monthly catch per unit effort (CPU E) by the Atlantic Japanese longlinefishery. Bull. Far Seas Fish. Res. Lab., 12,181-204.
Laurec, A. & Le Guen, J.-e. (1978) CPUE des senneurs et abondance: impact des structures fines. ICCATColi. Vol. Sci. Pap., 7, 30-54.

316 References
Laurec, A., Fonteneau, A. & 'Champagnat, C (1980) A study of the stability of some stocks described byself-regenerating stochastic models. Rapp. P.-v. Reun. Cons. Int. Explor. Mer, 177,423-38.
Le Danois, E. (1928) Le sondeur ultra-sonore Langevin-Florisson. Rev. Trav. Off. Nch. Mar., 2 (1), 510.
Le Gall, J.-Y. (1975) Description, efficacite et selectivite des engins et techniques de peche de germoniThunnus alalunga) du Nord-Est Atlantique: La Peche Maritime, February, 94-8.
Le Guen, J .-C (1971) Dynamique des populations de Pseudotolithus ( Fonticulus ) elongatus (Bowd, 1825)Poisson Scianidae. Cah. Orstom, Stir. Oceanogr., 9 (1),3-84.
Le Page, C & Cury, P. (1996) How spatial heterogeneity influences population dynamics: simulations inSeaLab. Adaptive Behaviour, 4 (3/4), 255-81.
Lear, W.H. & Parsons, L.S. (1993) History and management of the fishery for northern cod in NAFODivisions 2J, 3K and 3L. Can. Bull. Fish. Aquat. Sci., 226, 55-90.
Leatherland, J.F. Farbridge, KJ. & Boujard, T. (1992) Lunar and semi-lunar rhythms in fishes. In:Rhythms in Fishes (ed. Ali, M.A.), pp. 83-107. Life Sci., Series A, 236.
Lebedev, N.V. (ed) (1969) Elementary Populations in Fish. Translated from Russian. Israel Program forScientific Translations, Jerusalem. .
Lebreton,J .D., Burnham, K.P.,Clobert,J. & Anderson, D.R. (1992) Modellingsurvival and testing biologicalhypothesis using marked animals: a unified approach with case studies. Ecol. Monogr., 62, 67-118.
Lehodey, P., Bertignac, M., Hampton, J., Lewis, T. & Picaut, J. (1997) El Nifio Southern Oscillation and. Tuna in the Western Pacific. Nature, 389, 16 October, 715-8.
Leroy, C & Binet, D. (1986) Anomalies thermiques dans I'Atlantique tropical- consequences possibles surle recrutement du germon (Thunnus alalunga). ICCAT SCRS/86/46.
Levenez, J .-J. (1982) Note prelirninaire sur l'operation senegalaise de tracking de listao. Coli. Vol. Sci. Pap.,ICCAT, 17,189-94.
Levenez, J., Samb, B. & Camarena, T. (1985) Resultats de la Campagne Echosar VI. Arch. Cent. de Rech.Oceanogr, Inst. Seneg. Rech. Agr. Dakar-Thiaroye.
Levenez, J.J., Gerlotto, F. & Petit, D. (1990) Reaction of tropical coastal pelagic species to artificial lightingand implications for the assessment of abundance by echo integration. Rapp. P.-v. Reun. Cons. Int .Explor. Mer, 189, 128-34.
Levine, J.S., Lobel, P.S. & MacNichol, E.F. (1980) Visual communication in fishes. In: EnvironmentalPhysiology of Fishes (ed Ali, M.A.), pp. 447-75. Plenum Press, New York.
Levy, J. (1925) Calcul des Probabilites. Gauthier-Villars, Paris.l.icht, T. (1989) Discriminating between hungry and satiated predators: the response of.guppies (Poecilia
reticulatai from high and low predation sites. Ethology, 82, 238-43. .Lima, S.L. & Dill, L.M. (1990) Behavioural decisions made under risk of predation: a review and pro
spectus. Can. f Zool., 68, 619-40.Littaye-Mariatte, A. (1990) Rendements de la peche sardiniere iSardina pilchardusi et conditions de vent,
dans le nord du golfe de Gascogne. Aquat. Living Resour., 3, 163-80.L1eonart, J., Salat, J. & Roel, B. (1985) A dynamic production model. Coli. Sci. Pap. Int. Comm. SE. Atl.
ns«, 12 (1), 119-46.L1uch-Belda, D., Crawford, RJ.M. Kawasaki, T., MacCall, A.D., Parrish, R.H., Schwartzlose, R.A. &
Smith, P.E. (1989) Worldwide fluctuations of sardine and anchovy stocks: the regime problem. S. Afr.J. Mar. Sci., 8, 195-205.
L1uch-Belda, D., L1uch-Cota, D.B., Hernandez-Vazquez, S. & Salinas-Zavala, CA. (1992) Sardinepopulation expansion in eastern boundary systems of the Pacific Ocean as related to sea surfacetemperature. In: Benguela Trophic Functioning (eds Pay ne, A.I.L., Brink, K.H., Mann, K.H. & Hilborn, R.). S. Afr. J. Mar. sa., 12, 147-57.
Loew, E.R. & McFarland, W.N. (1990) The underwater visual environment. In: The Visual System of Fish(eds Douglas, R.H. & Djamgoz, M.BA), pp. 1-44. Chapman and Hall, London.
Longhurst, A.R. & Pauly, D. (1987) Ecology of Tropical Oceans. Academic Press, San Diego.Lonzarich, D.G. & Quinn, T.P. (1995) Experimental evidence for the effect of depth and structure on the
distribution, growth, and survival of stream fishes. Can. J. Zool., 73 (12), 2223-30. ..Lorentz, K.·( 1974) Evolution et Modification du Comportement, Payot, Paris. Translation of: Evolution and
modification of behaviour (1966), the .University of Chicago Press, Chicago. \Lorentz, K. (1984) Les Fondements de l'Ethologie. Flarnrnarion. Traduit de l'ouvrage original: Vergle
ichende verhaltensforschung: grundlagen der Ethologie (1978), Springer-Verlag, Vienne.

References 317
Lucas, CE. (1936) On the diurnal variation of size groups of trawl-caught herring. J. Cons. Int. Explor.Mer, 11, 53-9.
Ludwig, D. & Waiters, C.1. (1985) Are age-structured models appropriate for catch-effort data? Can. J.Fish. Aquat. Sci., 42, 1066-72.
Ludwig, D. & Waiters, Cl. (1989) A robust method for parameter estimation from catch and effort data.Can. J. Fish. Aquat. Sci., 46, 137-44.
Luecke, C & Wurtsbaugh, W.A. (1993) Effects of moonlight and daylight on hydroacoustic estimates ofpelagic fish abundance. Amer. Fish. Soc., 122, 112-20.
Lutcavage, M. & Kraus, S. (1995) The feasibility of direct photographic assessment of giant bluefin tuna,Thunnus thynnus, in New England waters. Fish. Bull. (US), 93, 495-503.
Lytle, D.W. & Maxwell, D.R. (1983) Hydroacoustic assessment in high density fish schools. FAO Fish.Rep., 300, 157-71.
Lekkeborg, S. (1994) Fish behaviour and longlining. In: Marine Fish Behaviour in Capture and AbundanceEstimation (eds Ferno, A. & Olsen, S.), pp. 9-28. Fishing New Books, Oxford.
Lekkeborg, S. & Bjordal, A. (1992) Species and size selectivity in longline fishing: a review. Fish Res., 13,311-22.
Lekkeborg, S. & Johannessen, T. (1992) The importance of chemical stimuli in bait fishing: fishing trialswith presoaked bait. Fish. Res., 14, 21-9.
Lekkeborg, S., Bjordal, A. & Ferno, A. (1989) Responses of cod (Gadus morhua) and haddock (Melanogrammus aeglefinus) to baited hooks in the natural environment. Can. J. Fisheries Aquat. Sci., 46,1478-83.
MacArthur, R.H. & Pianka, E.R. (1966) On the optimal use ofa patchy environment. Amer. Naturalist,100, 603-9.
MacCall, A.D. (1976) Density dependence of catchability coefficient in the California Pacific sardine,Sardinops sagax caerulea, purse seine fishery. Cal. Coop. Ocean Fish. Invest. R. 18, 136-48.
MacCall A.D. (1990) Dynamic Geography of Marine Fish Populations. Books in Recruitment FisheryOceanography. Washington Sea Grant, University of Washington Press, Seattle.
MacCartney, B.S. & Stubbs, A. R. (1971) Measurements of the acoustic target strength of fish in dorsalaspect, including swirnbladder resonance. J. Sound Vib., 15, 397-420.
MacFarland, W.N. & Moss, S.A. (1967) Internal behaviour in fish schools. Science, 156, 260-62.MacKenzie, B.R. & Leggett, W.C (1991) Quantifying the contribution of small-scale turbulence to the
encounter rates between larval fish and their zooplankton prey: effects of wind and tide. Mar. Ecol.Prog. Ser., 73, 149-60.
MacKinlay, 0.0., Johnson, M.V.D. & Celli, D.C (1994) Evaluation of stress of carbon dioxide anaesthesia. In: Proceedings ofan International Fish Physiology Symposium, Vancouver, BC (Canada), 16-21luly 1994, pp. 421-4. University of British Columbia, Vancouver.
Mackinson, S., Sumaila, U.R. & Pitcher, T.1. (1997) Bioeconomics and catchability: Fish and fishersbehaviour during stock collapse. Fish. Res., 31 (1-2), 11-17.
MacLennan, D.N. (1990) Acoustical measurement of fish abundance. J. Acoust. Soc. Am., 87, 1-15.MacLennan, D.N. & MacKenzie, I.G. (1988) Precision of acoustic fish stock estimates. Can. J. Fish. Aquat.
Sci., 45, 605-16.MacLennan, D.N. & Simmonds, E.1. (1992) Fisheries Acoustics. Chapman & Hall, London.Macl.ennan, D.N., Hollingworth, CE. & Armstrong, F. (1989) Target strength and the tilt angle dis
tribution of caged fish. Proc. I.O.A., 11, 11-21.MacLennan, D.N., Magurran, A.E., Pitcher, T.1. & Hollingworth, CE. (1990) Behavioural determinants
of target strength. Rapp. P.-v. Reun. Cons. Int. Explor. Mer, 189,245-53.Magnhagen, C & Forsgren, E. (1991) Behavioural responses to different types of predators by sand goby,
Pomatoschistus minutus: an experimental study. Mar. Ecol-Progr, Ser., 70 (I), 11-16.Magnusson, 1.1. (1969) Swimming activity in the scombrid fish Euthynnus affinis as related to search of
food. FAO Conf. on Fish Behaviour as Related to Fishing Techniques and Tactics. FAO Fish. Rep., 62(2), 439-45.
Magnusson, 1.1. & Prescott, 1.H. (1966) Courtship, locomotion, feeding and miscellaneous behaviour ofPacific bonito (Sarda chiliensisi. Anim. Behav., 14, 54--67.
Magnusson, 1.1., Brandt, S.B. & Stewart, 0.1. (1980) Habitat preferences and fishery oceanography. In:Fish behaviour and its use in the capture and culture offishes: proceedings of the conference on thephysiological and behavioural manipulation offoodfish as production and management tools, Bellagio,

318 References
Italy, 3-8 November 1977.(eds Bardach, J.E., Magnusson, 1.1., May, R.C. & Reinhart, J.M.), pp. 37182. ICLARM Conference Proceedings (Manila).
Magurran, A.E. (1986) The development of shoaling behaviour in the European minnow, Phoxinusphoxinus. J. Fish. Bioi., 29A, 159-70.
Magurran, A.E. (1989) Acquired recognition of predator odour in the European minnow, Phoxinusphoxinus. Ethology, 82 (3), 216-23.
Magurran, A.E. (1990) The inheritance and development of minnow anti-predator behaviour. Anim.Behav., 39, 834--42.
Magurran, A.E. & Higham, A. (1988) Information transfer across fish shoals under predator threat.Ethology, 78, 153-8.
Magurran, A.E. & Pitcher, T.J. (1983) Foraging, timidity and school size In minnows and goldfish. Behav,Ecol.Sociobiol., 12, 147-52.
Magurran, A.E. & Pitcher, T.J. (1987) Provenance, shoal size and sociobiology of predator evasionbehaviour in minnow shoals. Proc. R. Soc. Lond. B, 229, 439--{j5.
Magurran, A.E. & Seghers, B.H. (1990) Population differences in the schooling behaviour of newbornguppies, Poecilia reticulata. Ethology, 84, 334--42.
Magurran, A.E. & Seghers, B.H. (1991) Variation in schooling and aggression amongst guppy, Poeciliareticulata, populations in Trinidad. Behaviour, 118,214-34.
Magurran, A.E., Oulton, W.J. & Pitcher, T.J.(l985) Vigilant behaviour and shoal size in minnows. Z.Tierpsychol.,67, 167-78.
Magurran, A.E., Seghers, B.H., Carvalho, G.R. & Shaw, P.W. (l91}3) Evolution of adaptive variation inantipredator behaviour. In: Behavioural Ecology ofFishes (eds Huntingford, F.A. & Torricel1i, P.), 11,pp. 29-44. Harwood Academic Publishers, Chur.
Magurran, A.E., Seghers, B.H., Shaw, P.W. & Carvalho, G.R. (1994) Schooling preferences for familiarfish in the guppy, Poecilia reticulata. J. Fish Biol., 45, 401--{j.
Main, J. & Sangster, G.I. (1981) A study of the fish capture process in a bottom trawl by direct observationsfrom an underwater vehicle. ScOIl. Fish. Rep., 23.
Mais, K.F. (1977) Acoustic surveys of northern anchovies in the California current system, 1966-0-1972.Rapp. Pi-v. Reun. Cons. Int, Explor. Mer, 170, 287-95.
Major, P.F. (1977) Predator-prey interactions in schooling fishes during periods of twilight: a study of thesilversides, Pranesus insularum, in Hawaii. Fish. Bull. (US) 75, 415-25.
Major, P.F. (1978) Predator-prey interactions in two schooling fishes, Caranx ignobilis and Stolephoruspurpureus.rnnim. Behav., 26, 760-77.
Major, P.F. & Dill, L.M: (1978) The three-dimensional structure of airborne bird flocks. Behav. Ecol.Sociobiol., 4, 111-22.
Mangel, M. & Beder, J.H. (1985) Search and stock depletion: theory and applications. Can. J. Fish. Aquat.Sci., 42, 150-63.
Mangel, M. & Smith, P.E. (1990) Presence-absence sampling for fisheries management. Can. J. Fish. Aquat,Sci., 47 (10), 1875-87.
Maravelias, C.D. & Reid, D.G. (1995) Relationship between herring (Clupea harengus, L.) distribution andsea surface salinity and temperature in the northern North Sea. Scientia Marina, 59 (3-4), 427-8. .
Maravelias, C.D. & Reid, D.G. (1997) Identifying the effects of oceanographic features on zooplankton onprespawning herring abundance using generalised additive models. Mar. Ecol. Progr. Ser., 147, 1-9.
Marchal, E. (1993) Biologie et ecologie des poissons pelagiques cotiers du littoralivoirien. In: Environnement et ressources aquatiques de Cote d'Ivoire. Vo\. I. Le milieu marin (eds Le Loeuff, P., Marchal, E. &Amon-Kothias, J.-B.), pp. 237--{j9. Orstom Editions, Paris.
Marchal, E. & Lebourges, A. (1996) Acoustic evidence for unusual diel behaviour of a mesopelagic fish(Vinciguerria nimbaria) exploited by tuna. Int. Coun. Explor. Sea J. Mar. Sci., 53 (2), 443-7.
Margetts, A.R. (ed) (1977) Hydro-acoustics in Fisheries Research. Symposium held-in Bergen, 19-22 June1973. Rapp. Pi-v, Reun. Cons.Tnt, Explor. Mer, 170.
Marsac, F. (1994) Yellowfin tuna fisheries in the past decade: Indian Ocean versus eastern Atlantic andeastern Pacific Oceans. 5th Expert Consultation on Indian Ocean Tunas, Mahe (Seychelles), 4-8 Oct1993. FAO/UNDP Indo-Pacific Tuna Development and Management Programme, Colombo (SriLanka). IPTP Coli., 8, 168-82.
Marsac, F. & Cayre, P. (1998) Telemetry applied to behaviour analysis of yellowfin tuna tThunnus albacares, Bonnaterre, 1788)movements in a network of fish aggregating devices. Hydrobiologia (in press).

References 319
Marsac, F. & Stequert, R (1986) La peche des thons autour d'epaves ancrees dans l'Ocean Indien. La PecheMaritime, 66 (1311), 439-46.
Marsac, F.,Cayre, P. & Conand, F. (1996) Analysis of small scale movements of yellowfin tuna around fishaggregating devices (FADs) using sonic tagging. In: Proceedings of the Expert Consultation on IndianOcean Tunas. 6th Session, Colombo, Sri Lanka, 25-29 Sept. 1995 (eds Anganuzzi, A.A., Stobberup,
K.A. & Webb, NJ.) IPTP Coll., 9,151-9.Marsac, F., Petit, M. & Stretta, J.M. (1988) Radiometrie Aerienne et Prospection Thoniere al'Orstom.
Orstom Editions, 68.Marty, P. Methodes Acoustiques. Rapp. P.-v. Reun. Cons. Int, Explor. Mer, 3, 27-32.Masse, J., Koutsikopoulos, C. & Patty, W. (1996) The structure and spatial distribution of pelagic fish
schools in multi species clusters: an acoustic study. ICES J. Mar. Sci., 53 (2), 155-60.Masse, J. Leroy, c., Halgand, D. & Beillois, P. (1995) Anchovy (Engrau/is encrasicolus, L.) adult and egg
distribution in the Bay of Biscay, in relation to environmental conditions.as observed during acousticsurveys (1990, 1991, 1992). Aetas del IV Coloquio Internacional sobre Oceanografia del. Go/fo de Viscaya, pp. 281-3.
Mathis, A., Chivers, D.P. & Smith, RJ.F. (1996) Cultural transmission of predator recognition in fishes:intraspecific and interspecific learning. Anim. Behav., 51, 185-20\.·
Mathisen, O.A. (1989) Adaption of the anchoveta, Engraulis ringens, to the Peruvian upwelling system. In:The Peruvian Upwe//ing Ecosystem: Dynamics and Interactions (eds Pauly, D:, Muck, P., Mendo, J. &Tsukayama, I.). ICCLARM Conference Proceedings 18,220-34.
Matsumiya, Y. & Hayase, S. (1982) Estimation of stock biomass of anchovy on continental shelf offArgentina by echosounder. Bull. Fac. Fish. Nagasaki. Univ., 52, 1-17.·
Matsuura, Y. & Hewitt, R. (1995) Changes in the spatial patchiness of Pacific mackerel, Scomber japonicus,larvae with increasing age and size. Fish. Bull. (US), 93, 72-178.
Matzel, L.D., Collin, C. & Alkon, D.L. (1992) Biophysical and behavioural correlates of memory storage,degradation, and reactivation. Behav. Neurosci., 106 (6), 954-63.
Mayr, E. (1970) Populations, Species and Evolution. Harvard University Press, Cambridge, Mass.Mayr, E. (1976) Evolution and the Diversity of Life. Harvard University Press, Cambridge, Mass.McNicol, R.G. & Noakes, D.L.G. (1984) Environmental influences in territoriality of juvenile brook char
Salvelinus fontinalis in a stream environment. Environ. Bioi. Fish., .10, 29-42..McCleave, J.D., Arnold, G.P., Dodson, J.J & Neill, W.H. (1982) Mechanisms of Migration in Fishes.
Plenum Press, New York.McCullagh, P. & Nelder, J.A. (1989) Generalised Linear Models. Chapman and Hall, London.McElligott, J.G., Weiser, M. & Baker, R. (1995) Effect of temperature on the normaland adapted vesti-
bulo-ocular reflex in the goldfish. J. Neurophysiol., 74 (4), 1463-72. .McFarland, W.N. (1967) Internal behaviour in fish schools. Science, 156,260-62.McFarland, W.N. & Hillis, Z.-M. (1982) Observations on agonistic behaviour between members of juvenile
.French and white grunts- family Haemulidae. Bull. Mar. Sci., 32, 255-68.McFarland, W.N., Ogden, J.c. & Lythgoe, J.N. (1979) The influence of light on the twilight migration of
grunts. Environ. Bioi. Fish., 4, 9-22.Meaden, GJ. & Do Chi, T. (1996) Geographical information systems: applications to marine fisheries.
FAO Tech.. Pap., 356,335.Medina-Gaertner, M. (1985) Etude du zooplancton cotter de la baiede Dakar et de son utilisation par lespoissons
comme source de nourriture, These de Doctorat, Universite de Bretagne Occidentale, Brest (France).Megrey, RA. (1989) Review and comparison of age-structured stock assessment models from theoretical
and applied points of view. In: Mathematical Analysis of Fish Stock Dynamics (eds Edwards, E.F. &Megrey, RA.), pp. 8-48. American Fisheries Society Symposium, 6.
Mejuto, J. (1994) Standardised indices of abundance at age for swordfish (Xiphias gladius) from the Spanishlongline fleet in the Atlantic, 1983-92. Coll. Vol.i Sci. Pap., 42 (I), 328-34:
Mejuto, J. & De La Serna, J.M. (1995) Standardised catch rates in number and weight for the swordfish(Xiphias gladius) from the Spanish longline fleet in the Mediterranean Sea, 1988-1993.ICCA T Collect.Vol. Sci. Pap., 44 (1),124:-9. . '
Mendelssohn, R. & Roy, C. (1986) Environmental influences on the French, Ivory Coast, Senegalese andMoroccan tuna catches in the Gulf of Guinea. In: Proceedings of the ICCA T Conference on theInternational Skipjack Year Program (eds Symonds, P.E.K., Miyake, P.M. and Sakagawa, G.T.), pp.170-88. ICCAT, Madrid.

320 References'
Mertz, G. & Myers, R.A. (1996) An extended cohort analysis: incorporating the effect of seasonal catches.Can. J. Fish. Aquat. Sci., 53, 159-63.
Mesnil, B. (1980) Theorie et pratique de l'analyse de cohortes. Rev. Trav, Instit. Pech. Mar., 44 (2), 11955.
Meyer, T.L., Cooper, R.A. & Langton, R.W. (1979) Relative abundance, behaviour and food habits ofthe American sand lance, Ammodytes arnericanus, from the gulf of Maine. Fish. Bull. (US) 1979,24353.
Midtun, L. & Hoff, I. (1962) Measurements of the reflection of sound by fish. FiskDir. Skr. Ser. Havunders,13,1-8.
Miklosi, A. & Csanyi, V. (1989) The influence of olfaction on exploratory behaviour in the paradise fish(Macropodus opercularis L.). Acta. Bioi: Hung., 40, 195-202.
Miklosi, A., Berzsenyi, G., Pongracz, P. & Csanyi, V. (1995). The ontogeny of antipredatorbehaviour in paradise fish larvae (Macropodus 'opercularis}: the recognition of eyespots. Ethology, 100,284-94.
Milinski, M. (1979) Can an experienced predator overcome the confusion of swarming prey more easily?. Anim. Behav., 27, I I 22---{j.
Milinski, M. (1985) Risk of predation taken by parasited sticklebacks foraging under competition for food.Behaviour, 93, 203-16.
Milinski, M. (1988) Games fish play: making decisions as a social forager. Trends Ecol. Evol., 3, 325-30.Milinski, M. & Helier, R. (1978) Influence of a predator on the optimal foraging behaviour of stickleback
Gasterosteus aculeatus. Nature, 275, 642-4.Misund, a.A. (1986) Sonarobservasjonar av stimdtferd under ringnotfisket etter sild (Sonar observations of
schooling behaviour during herring purse seining). Cand. Scient. thesis, University of Bergen, Bergen,Norway. (In Norwegian.)
Misund, a.A. (1990) Sonar observations of schooling herring: school dimensions, swimming behaviour andavoidance of vessel and purse seine. Rapp. P>v. Reun. Cons. lnt, Explor. Mer, 189, [35-46.
Misund, a.A. (1993a) Abundance estimation of fish schools based on a relationship between school areaand school biomass. Aquat. Living Resour. (FRA), 6,235-41.
Misund, a.A. (l993b) Dynamics of moving masses: variability in packing density, shape, and size amongherring, sprat and saithe schools. ICES 1. Mar. Sci., 50, I 45---{j0.
Misund, a.A. (I 993c) Avoidance behaviour of herring (Clupea harengus) and mackerel (Scomber scombrusiin purse seine capture situations. Fish Res., 16, 179-94.
Misund, a.A. (1994) Swimming behaviour of fish schools in connection with capture by purse seine andpelagic trawl: In: Marine Fish Behaviour in capture and abundance estimation (eds Ferno, A. & Olsen,S.), pp. 84-106. .
Misund, a.A. (1997) Underwater acoustics in marine fisheries and fisheries research. Rev. Fish. Bioi.Fisheries, 7, 1-34.
Misund, a.A. & Aglen, A. (1992) Swimming behaviour of fish schools in the North Sea during acousticsurveying and pelagic trawl sampling. ICES J. Mar. Sci., 49, 325-34.
Misund, a.A. & Beltestad, A.K. (1995) Survival of herring after simulated net bursts and conventionalstorage in riet pens. Fish. Res., 22 (3-4), 293-7.
Misund, a.A. & Beltestad, A.K. (1996) Target strength estimates of schooling herring and mackerel usingthe comparison method. ICES J. Mar. Sci., 53, 28[-4.
Misund, a.A. & Floen, S. (1993) Packing density structure of herring schools. ICES Mar. Sci. Symp., 196,26-9.
Misund, a.A.,Aglen, A., Johanessen, S.0., Skagen, D. & Totland, B. (1993) Assessing the reliability of fishdensity estimates by monitoring the swimming behaviour of schools during acoustic surveys. ICES.Mar. Sci. Symp., 196, 202-6.
Misund, a.A., Aglen, A. & Frenes, E. (1995) Mapping the shape, size and density of fish schools by echointegration and a high-resolutiori sonar. ICES J. Mar. Sci., 52, 11-20.
Misund, a.A., Melle, W. & Ferno, A. (1997) Migration behaviour of Norwegian spring spawning herringwhen entering the cold front in the Norwegian Sea. Sarsia, 82, 107-12.
Misund, a.A., Vilhjalmsson, H., Jakupsstovu, S.H., R0ttingen,l., Belikov, S., Asstthorrsson.: a.s.,Blindheim, J., Jonssen, J., Krysov, A., Malmberg,.S.A. & Sveinbjernsson, S.(l998) Distribution,migrations and abundance of Norwegian spring spawning herring in relation to temperature andzooplankton biomass in the Norwegian Sea in spring and summer 1996. Sarsia, 83,117-127.

References 321
Misund, O.A., 0vredal, J.T. & Hafsteinsson, M.T. (1996) Reactions of herring schools to the sound field ofa survey vessel. Aquat, Living Resour., 9,5-11.
Mitson, R.B. (1983) Fisheries Sonar, Fishing News Books,Oxford.Mitson, R.B. (1989) Ship noise related to fisheries research. Proc. I.O.A., 11 (3), 61-67.Mitson, R.B. (1992) Research vessel noise signatures. ICES, FTFB & FAST Working Groups Joint Session,
Bergen, Norway, 16 June 1992, pp. 1-6.Mitson, R.B. & Holliday, D.V. (1990) Future developments in fisheries acoustics. Rapp. P.-v. Reun. Cons.
Int. Explor. Mer, 189, 82-91.Mohan, M. & Kunhikoya, K.K. (1985) Comparative efficiency of live-baits for skipjack tuna Katsuwonus
pelamis fishery at Minicoy. J. Mar. BioI. Assoc. (India), 27 (1-2), 21-8.Mohr, H. (1969) Observations of the Atlanto-Scandian herring with respect to schooling and reactions to
fishing gear. FAO Fish. Rep., 62 (3),567-77.Mohr, H. (1971) Behaviour patterns of different herring stocks in relation to ship and midwater trawl. In:
Modern Fishing Gear of the World, Vol. 3. pp. 368-71 (ed. Kristjonsson, H.) Fishing News Books Ltd.,Oxford.
Moksness, E. & 0iestad, V. (1987) Interaction of Norwegian spring-spawning herring larvae (Clupeaharengus) and Barents Sea capelin larvae tMattoius villosus) in a mesocosm study. J. Cons. Int. Explor:Mer, 33, 32-42.
Monstad, T. (l990),Distribution and growth of blue whiting in the North-East Atlantic. ICES CM/1990.H:14.
Morgan, M.J. (1988) The effect of hunger, shoal size and presence of a predator on shoal cohesiveness inbluntnose minnows, Pimephales notatus Rafinesque. J. Fish. Bioi., 32, 963-71.
Morgan, M.J. & Godin, J.-G.J. (1985) Antipredator benefits of schooling behaviour in a cyprinodontidfish, the banded kiIIifish (Fundulus diaphanusi. Z. Tierpsychol., 70, 236-46.
Morgan, M.J. & Colgan, P.W. (1987) The effects of predator presence and shoal size on foraging inbluntnoseminnows, Pimephales notatus. Env. Bioi. Fishes, 20, 105-11.
Moser, H.G. & Smith, P.E. (1993) Larval fish assemblages of the California current region and theirhorizontal and vertical distributions across a front. In: Advances in the Early Life History of Fishes.Part I. Larval-Fish Assemblages and Ocean Boundaries (eds Moser, H.G., Smith, P.E. & Fuiman, L.A.),pp. 645-691. Bull. Mar. Sci. (US), 53 (2).
Motos, L., Uriarte, A. & Valencia, V. (1996) The spawning environment of the Bay of Biscay anchovy(Engraulis encrasicolus L.). Scientia Marina, 60 (Suppl. 2), 117-40.
Muck, P. (1989) Relationships between anchoveta spawning strategies and the spatial variability of seasurface temperature off Peru. In: The Peruvian Upwelling Ecosystem: Dynamics and Interactions (edsPauly, D., Muck, P., Mendo, J. & Tsukayama, I.), pp. 168-73. ICLARM, Manila.
Mullen, A.J. (1989) Aggregation of fish through variable diffusivity. Fish Bull., 87,353-62.Mullen, A.J. (1994) Effects of movement on stock assessment in a restricted-range fishery. Can. J. Fish.
Aquat, Sci., SI, 2027-33.Munck, le. de & Schellart, N.A.M. (1987) A model for the nearfield acoustics of the fish swim bladder and
its relevance for directional hearing. J. Acoust, Soc. Am., 81 (2), 556-60.Munz, F.W. & McFarland, W.N. (1973) The significance of spectral position in the rhodopsins of tropical
marine fishes. Vision Res., 13, 1829-74.Murawski, S.A. & Finn, J.T. (1986) Optimal effort allocation among competing mixed-species fisheries,
subject to fishing mortality constraints. Can. J. Fish. Aquat, sa.. 43 (I), 90-100.Murphy, G.!. (1980) Schooling and the ecology and management of marine fish. In: Fish Behaviour and Its
Use in the Capture and Culture of Fishes (eds Bardach, J.E., Magnusson, J.J., May, R.e. & Reinhart,J.M.), pp. 400-14. ICLARM Conference Proceedings 5, Manila, Philippines.
Murray, R.W. (1971) Temperature receptors. In: Fish Physiology, vol. V (eds Hoar, W.S. & Randall, D.J.).Academic Press, New York.
Myers, R.A. & Cadigan, N.G. (1995) Was an increase in natural mortality responsible for the collapse ofnorthern cod? Can. J. Fish. Aquat. Sci., 52, 1274-85.
Myers, R.A. & Stokes, K. (1989) Density-dependent habitat utilisation of ground-fish and the improvementof research surveys. ICES CM/1989, D:15.
Myers, R.A. Barrowman, N.J., Hoenig, J.M. & Qu, Z. (1996) The collapse of cod in eastern Canada: theevidence from tagging data. ICES J. Mar. Sci., 53 (3), 629-40. '
Myrberg, A.A. Jr. (1980) Sensory mediation of social recognition processes in fishes. In: Fish behaviour and

322 References
its use in the capture and culture offishes (eds Bardach, J.E., Magnusson, J.1., May, R.e. & Reinhart,J.M.), pp. 14&-78. ICLARM Conference Proceedings, Manila, Philippines.
Myrberg, A.R. Jr., Gordon, C.R. & Klimley, P. (1976) Attraction of free ranging sharks by low frequencysound, with comments on its biological significance. In: Sound Reception in Fish (eds Schuijf, A. &Hawkins, A.D.), pp. 205-28. Elsevier, Amsterdam.
Nakamura, E.L. & Wilson, R.e. (1970) The Biology of the Marquesan sardine, Sardinel/a marquesensis.Pacific Sci., 24 (3), 359-76.
Nakamura, H. (1969) Tuna Distribution and Migration. Fishing News Books, Oxford.Nakano, H. & Bayliff, W.H. (1992) A review of the Japanese longline fishery for tunas and billfishes in
the eastern Pacific Ocean, 1981-1987. Bulletin of the Inter-American Tropical-Tuna Commission,20 (5).
Nakashirna, B.S. (1983) Aerial photography of capelin (Mallotus villosusi schools in the coastal waters ofNewfoundland. Proc. RNRF Symp. Application of Remote Sensing 10 Resource Management, Seattle,Washington, 22-27 May 1983, pp. 655-60.
Nakashima, B.S. & Borstad, G.A.(l993) Detecting and measuring pelagic fish schools using remote sensingtechniques.1CES CM I993/B:7.
Nakashima, B.S. & Borstad, G.A. (1996) Relative abundance and behaviour of capelin (Mal/otus villosusischools from aerial surveys. In: Proceedings of the Symposium on the Role of Forage Fishes, Alaska,Nov. 1996.
Nakashima, B.S., Borstad, G.A., Hill, D.A. & Kerr, R.e. (1989) Remote sensing of fish schools: earlyresults from a digital imaging spectrometer. Proceedings of IGARRS' 89, 12th Canadian Symposium onRemote Sensing, Vancouver, BC, 10-14 July, pp. 2044-6.
Nakken, O. & Michalsen, K. (1996) Year to year variations in horizontal and vertical distribution of north"east Arctic cod: influence on survey estimates of abundance. ICES FAST Working Group Meeting,Woods Hole, 17-19 April 1996.
Nakken, O. & Olsen, K. (1977) Target strength measurements of fish., Rapp. Pi-v. Reun. Cons. Int. Explor.Mer, 170, 52-69.
Neill, S.R. SI. J. & Cullen, J.M. (1974) Experiments on whether schooling by their prey affects the huntingbehaviour of cephalopod and fish predators. J. Zool., 172, 549-69.
Neill, W.H. & Gallaway, B.1.(1989) 'Noise' in the distributional responses of fish to environment: anexercise in deterministic modelling motivated by the Beaufort sea-experience. Bioi; Pap. Univ, Alaska;24, 123-30.
Neilson, J.D. & Perry, R.1. (1990) Diel vertical migrations of marine fishes: an obligate or facultativeprocess? Adv, Mar. Biol., 26, 115-68.
Nelson, G. & Hutchings, L. (1983) The Benguela upwelling area. Prog. Oceanogr., 12 (3), 333-56~Nelson, G. & Hutchings, L. (1987) Passive transportation of pelagic system components in the southern
. Benguela area. In: The Bengula and Comparable Frontal Systems (eds Payne, A.I.L., Gulland, J.A. &Bring, K.H.S.), pp. 223-34. Afr. J. Mar. Sci., 5.
Nelson, W.R. Ingharn, M.e. &Schaaf, W:E. (1977) Larval transport and year-class strength of Atlanticmenhaden, Brevoortia tyrannus. Fish son; 75 (I), 23-41.
Neproshin, A.Y. (1979) Behaviour of the Pacific mackerel, Pneumatophorus japonicus, when affected byvessel noise. J. Ichthyol., 18, 695-9.
Nestler, J.H., Ploskey, G.H. & Pickens, J. (1992) Responses of bJueback herring tohigh-frequency soundand implications for reducing entrainment at hydropower dams. North American Journal of FisheriesManagement, 12, 667-83.
Nicholson, M.D., Rackham, B.O. & Mitson, R.B. (1992) Measuring the effect of underwater radiated noiseon trawl catches. ICES, FTFB·& FAST Working Groups Joint Session, Bergen, Norway, 16 June 1992,pp. 1-6.
Nicholson, W.R. (1978) Movements and population structure of Atlantic menhaden indicated by tagreturns. Estuaries, I (3), 141-50.
Nieland, H. (1982) The food of Sardinella aurita (Val.) and Sardinella eba (Val.) off the coast of Senegal.Rapp. Pi-v. Reun. Cons. Int.Explor. Mer, 180, 369-73.
Nitta, E.T.·& Henderson, J.R.. (1993) A review of interactions between Hawaii's fisheries and protectedspecies. Mar. Fish. Rev. (Washington DC) 55 (2),83-92.
Noakes, D.L.G. (1992) Behaviour and rhythms in fishes. In: Rhythms in Fishes (ed Ali, M.A.), pp. 39-50.Plenum Press, New York.

References 323
Noakes,'D.L.G. & Barlow, G.W. (1973) Ontogeny of parent-contacting in young Cichlasoma citrinellum.Behaviour, 46, '221-57.
Noda, M., Gushima, K. & Kakuda, S. (1994) Local prey search based on spatial memory and expectation inthe planktivorous reef fish, Chromis chrysurus (Pomacentridae). Anim. Behav., 47 (6), 1413-22.
Nunnallee, E.P. (1991) An investigation of the avoidance reactions of Pacific whiting (Merlucius productus)to demersal and midwater trawl gear. ICES CM 1991/B:5.
Nettestad, L., Aksland, M., Beltestad, A.K., Feme, A., Johannessen, A. & Misund, O.A. (1996) Schoolingdynamics of the Norwegian spring spawning herring (Clupea harengus L.) in a coastal spawning area.Sarsia, SO, 277-84.
O'Brien, W.J., Slade, N.A. & Vinyard, G.L. (1976) Apparent size as the determinant of prey selection byBluegill sunfish (Lepomis macrochirusi. Ecology, 57, 1304-11.
Ohshimo, S. (1996) Acoustic estimation of biomass and school character of anchovy Engraulis japonicus inthe East China Sea and the Yellow Sea. Fish. Sci., 62, 344-9.
Ojak, W. (1988) Vibrations and waterborne noise on fishery vessels. J. Ship. Res., 32 (2), 112-33.Olla, B.L., Studholme, A;L. & Bejda, A.J. (1985) Behaviour of juvenile bluefish Pomatomus saltatrix in
vertical thermal gradients: influence of season, temperature acclimatation and food. Mar. Ecol-Progr.Ser.,23, 165-77.
Olsen, K. (1967) A comparison of acoustic threshold in cod with recordings of ship noise. FAO Fish. Rep.,62,431-8.
Olsen, K. (1969) Directional responses in herring to sound and noise stimuli. ICES CM 1969/B:20, pp. 1-5.Olsen, K. (1971) Influence of vessel. noise on the behaviour of herring. In: Modern Fishing Gear of the
World: 3 (00. Kristjonsson, H.), pp. 291-4. Fishing News Books, Oxford.Olsen, K. (1976) Evidence for localisation of sound by fish in schools. In: Sound in fish. Proceedings of a
symposium held in honour ofProfessor Dr. Sven Dijkgraaf, Utrecht, The Netherlands, 16-18 April 1975,pp. 257-270. Elsevier, Amsterdam.
Olsen, K. (1979) Observed avoidance behaviour in herring in relation to passage of an echo survey vessel.ICES CM 1979/B:53.
Olsen, K. (1980) Echo surveyi,ng and fish behaviour. ICES FTFB Working Group meeting, Reykjavik,Iceland, May 1980.
Olsen, K. (1986) Sound attenuation within schools of herring. ICES CM 1986/B:44 (mimeo).Olsen, K. (1990) Fish behaviour and acoustic sampling. Rapp. P.-v. Reun. Cons. Int. Explor. Mer, 189, 147
58.Olsen, K. & Ahlquist, I. (1989) Target strength of fish at various depths, observed experimentally. ICES
CM 1989/B:35.Olsen, K., Angell, J. & Lavik, A. (l983a) Quantitative estimations ofthe influence of fish behaviour on
acoustically determined fish abundance. FAO Fish. Rep., 300, 131-8.Olsen, K., Angell, J., Pettersen, F. & Lavik, A. (I 983b) Observed fish reactions to a surveying vessel with
special reference to herring, cod, capelin and polar cod. FAO Fish. Rep., 300, 131-8.Olsen, Y.A., Einarsdottir, I.E. & Nilssen, K.J. (1995) Metomidate anaesthesia in Atlantic salmon, Salmo
salar, prevents plasma cortisol increase during stress. Aquaculture, 134 (I -2), 155-68.Olson, F .C.W. (1964) The survival value of fish schooling. J. Conseil, 29, 115-16.Olson, R.J. & Boggs, C.H. (1986) Apex predation by yellowfin tuna iThunnus albacares): Independent
estimates from gastric evacuation and stomach contents, bioenergetics, and cesium concentrations.Can. J. Fish. Aquat. Sci., 43 (9), 1760-75.
Olson, R.J. & Galvan-Magafia, F. (1995) Trophic relations of yellowfin tuna and dolphins in the easternPacific Ocean. 46th Tuna Conference, San Diego and LakeArrowhead (mimeo).
Omori, M. & Jo, S.G. (1989) Plankton sampling system with a new submersible vortex pump and its use toestimate small-scale vertical distribution of eggs and larvae of Sergia lucens. Bull. Plankton Soc. Jap.,36 (I), 19-26.
Ona, E. (1990) Physiological factors causing natural variations in acoustic target strength of fish. J. Mar.Bioi. Ass. (UK), 70, 107-21.
Ona, E. (1994) Recent development of acoustic instrumentation in connection with fish capture andabundance estimation. In: Marine Fish Behaviour in Capture and Abundance Estimation (eds Ferno, A.& Olsen, S.), pp. 200-16. Fishing News Books, Oxford.
Ona, E. & Beltestad, A.K. (1986) Use of acoustics in studies of fish reaction to imposed stimuli. Model.Identifi. Control, 7 (4), 219-26.

324 References
Ona, E. & Chruickshank, O.c. (1985) Haddock avoidance reactions during trawling. ICES CM 11986/B:36.
Ona, E. & God", O.R. (1990) Fish reactions to trawling noise: the significance for trawl sampling. Rapp. P.v. Reun. Cons. Int. Explor. Mer, 189, 159--66.
Ona, E. & Mitson, R.B. (1996) Acoustic sampling and signal processing near the seabed: the deadzonerevisited. ICES J. Mar. Sci., 53, 677-90.
Ona, E. & Toresen, R. (1988a) Avoidance reactions of herring to a survey vessel, studied by scanning sonar.ICES CM 1988/H:46.
Ona, E. & Toresen, R. (1988b) Reactions of herring to trawling noise. ICES CM 1988/B:36.Oxenford, H., Mahon, R. & Hunte, W. (eds) (1993) The eastern Caribbean flying fish project. OECS: Cane
Garden. OECS Fish Rep. Kingstown, 9.Paloheimo, J.E. (1958) A method of estimating natural and fishing mortalities. J. Fish. Res. Board Can., 18,
645--61.Paloheimo, J.E. & Dickie, L.M. (1964) Abundance and fishing success surveys: eggs, larvae and young fish.
ICES Rep., 155 (28), 152--63.Pankhurst, N:W. (1988) Spawning dynamics of orange roughy, Hoplostethus atlanticus, in mid-slope waters
of New Zealand. Environ. Bioi. Fish., 21 (2),101-16.Parin, N. V. & Fedoryako, RI. (1992) Pelagic fish communities around floating objects in the open ocean.
In: Fishing for Tunas Associated with Floating Objects. International Workshop (ed. Hall, M.). InterAmerican Tropical Tuna Commission Int. Rep., San Diego (mimeo).
Park, S.W. (1978) The fishing condition factors on the catch per set variation of the purse seine sets. Bull.Nat. Fish. Univ. Busan, 18 (I, 2), 1-11.
Parker, G.A. & Sutherland, WJ. (1986) Ideal free distributions when individuals differ in competitiveabilities: phenotype-limited ideal free models. Anim Behav., 34, 1222-42.
Parker, R.O. Jr .. (1972) An electric detector system for recovering internally tagged menhaden, genusBrevoortia. NO AA Technical Report, 65.
Parrnanne, R. & Sjoblom, V. (1988) Trends in the abundance, recruitment and mortality of Baltic herringand sprat off the coast of Finland according to exploratory fishing with a pelagic trawl in 1956-84.Finn. Fish. Res., 7, 18-23.
Parr, A.E. (1927) A contribution to the theoretical analysis of the schooling behaviour offishes. OccasionalPapers of the Bingham Oceanographic Collection, pp. 1-32.
Parrish, J.K. (l989a) Re-examining the selfish herd: are central fish safer? Anim. Behav., 38, 1048-53.Parrish, J.K. (l989b) Layering with depth in a heterospecific fish aggregation. Environ. Bioi. Fish., 26, 79
85.Parrish, J.K. (l992a) Levels of diurnal predation on a school of flat-iron herring. Harengula thrissina.
Environ. Bioi. Fish., 34, 257--63.Parrish, J.K. (l992b) Do predators 'shape' fish schools: interactions between predators and their schooling
prey. Netherlands Journal of Zoology, 42 (2-3), 358-70.Parrish, J.K. & Kroen, W.K. (1988) Sloughed mucus and drag-reduction in a school of Atlantic silversides,
Menidia menidia. Mar. Bioi., 97, 165-9.Parrish, R.A., Bakun, A., Husby, D.M. & Nelson, C.S. (1983) Comparative climatology of selected
environmental processes in relation to eastern boundary current pelagic fish reproduction. In: Proceedings of the expert consultation to examine changes in abundance and species composition ofneriticfish resources (eds Sharp, G. & Csirke, J.), pp. 731-77. FAO Fish. Rep., 291 (3).
Parrish, R.H., Nelson, C.S. & Bakun, A. (1981) Transport mechanisms and reproductive success of fishes inthe California current. Biolog. Oceanog., 1 (2), 175-203.
Partridge, B.L. (1980) The effect of school size on the structure and dynamics of minnow schools. Anim.Behav., 28, 67-77.
Partridge, B.L. (1981) Internal dynamics and interrelations of fish in schools. J. Comp. Physiol., 144, 313-25.
Partridge, B.L. (1982a) Rigid definitions of schooling behaviour are inadequate. Anim. Behav., 30, 298-9.Partridge, B.L. (1982b) Structure and functions of fish schools. Scient. Amer., 245, 114-23.Partridge, B.L. & Pitcher, T.J. (1980) The sensory basis of fish schools: relative roles of lateral lines and
vision. J. Comp. Physiol., 135, 315--25.Partridge, B.L., Johansson, J. & Kalish J. (1983) The structure of schools of giant bluefin tuna in Cape Cod
Bay. Environ. Bioi. Fish., 9, 253--62.

References 325
Partridge, B.L., Pitcher, TJ., Cullen, J.M. & Wilson, J. (1980) The three-dimensional structure of fishschools. Behav. Ecol. Sociobiol., 6, 277-88.
Partridge, L. (1978) Habitat selection. In: Behavioural Ecology (eds Krebs.T.R. & Davis, N.B.), pp. 351-76.Blackwell, Oxford.
Parzefall, J. (1986) Behavioural ecology of cave-dwelling fishes. In: The Behaviour of Teleost Fishes (ed.Pitcher, T.J.), pp. 433-58. Croom Helm, London.
Pati, S. (1981) Observations on the lunar and tidal influence on gill netting in the Bay of Bengal. Fish. Tech.,18,25-7.
Patten, G.G. (1977) Body size and learned avoidance as factors affecting predation on coho salmon,Oncorhynchus kisutch, fry by torrent sculpin, COitUS rhotheus. Fish. Bull. (US), 75, 457-59.
Patty, W. (1996) Determinisme de la repartition spatio-temporelle des populations de poissons pelagiques apartir d'observations acoustiques et environnementales. These de Doctorat, Universite de BretagneOccidentale, Brest (France).
Pauly, D. (1981) The relationships between gill surface area and growth performance in fish: a general:isation of von Bertalanffy's theory of growth. Meeresforschung] Rep. Mar. Res.,.28 (4), 251-82.
Pauly, D. (1995) Anecdotes and the shifting baseline syndrome of fisheries. Trends Ecol. Evol., 10, I·.Pauly, D. (I 997a) Methodes pour l'Evaluation des Ressources Halieutiques. ColI. Polytech, Cepadues-edi
tions, Toulouse.Pauly, D. (I997b) Points of view. Putting fisheries management back in places. Rev. Fish Bioi. Fisheries, 7,
125-7.Pauly, D. & Palomares,M.L. (1989) New estimates of monthly biomass, recruitmenjt and related statistics
of anchoveta (Engraulis rigens) off Peru (4-14°S), 1953-1985. In: The Peruvian Upwe//ing Ecosystem:Dynamics and Interactions (eds Pauly, D., Muck, P., Mendo, J. & Tsukayama, I.), pp. 189-206.ICLARM Conference Proceedings 18, Manila, Philippines.
Pauly, D. & Tsukayarna, I. (eds) (1987) The Peruvian anchoveta and its upwelling ecosystem; three decadesof change. ICLARM Studies and Reviews, 15.
Pauly, D., Christensen, v, Dalsgaard, J., Froese, R. & Torres Jr, F. (1997) Fishing down marine food webs.Science, 279, 860-3.
Pauly, D., Ingles, J. & Neal, R. (1984) Application to shrimp stocks of objective methods for the estimationof growth, mortality and recruitment-related parameters from length-frequency data (ELEFAN I andI1). In: Penaeid Shrimps - their Biology and Management (eds Gulland, J.A. &.Rotschild,BJ.), pp.220-:-:34. Fishing News Book, Oxford.
Pauly, D., Muck, P., Mendo, J. & Tsukayama, I. (eds) (1989) The Peruvian Upwelling Ecosystem:Dynamics and Interactions. ICLARM, Manila, Philippines.
Payne, A.LL., Brink, K.H.; Mann, K.H. & Hilborn, R. (eds) (1992) Benguela Trophic Functioning. S. Afr.J. Mar. Sci., 12.
Pella, J.J. & Tomlinson, P.K. (1969) A generalised stock production model. Bulletin of the Inter-AmericanTropical Tuna Commission,13, 419-96.
Pelletier, D. (1990) Sensitivity and variance estimators for virtual population analysis and the equilibriumyield per recruit model. Aquat. Living Resour., 3, 1-12.
Pelletier, D. & Panna, A.M. (1994) Spatial distribution of Pacific halibut (Hippoglossus stenolepis): anapplication of geostatistics to longline survey data. Can. J. Fish. Aquat, Sci., SI (7),1506--18.
Perrin, W.F. (1968) The porpoise and the tuna. Sea Frontiers, 14 (3),15-19.Perrin, W.F. (1969) Using porpoise and tuna. World Fish, 18 (6), 42-5.Petersen, C.H. (1976) Cruising speed-during migration of the striped mullet (Mugil cephalus L.): an evo
lutionary response to predation? Evolution, 30, 393-'-6.Petit, M. (1991) Contribution de la teledetection aerospatiale al'elaboration des bases de l'haleutique ope
rationnelle: l'exemple des pecheries thonieres tropicales de surface (aspect evaluatif), These de Doctorat,Universite Paris VI (France).
Petit, M., Stretta, J.-M. Simier, M. & Wadsworth, A. (1989) Anomalies de surface et peche thoniere: SPOTet la teledetection de zones de peche par l'inventaire des hauts-fonds. Mappe Monde, 89 (3), 13-19.
Petit, M., Stretta, J.-M., Farrugio, H. & Wadsworth, A. (1992) Synthetic aperture radar imaging of seasurface life and fishing activities. IEEE Trans. Geosci. Remote Sens., 30 (5), 1085-9.
Petit, M. Dagorn, L., Lena, P., Slepoukha, M., Ramos, A.G. & Stretta, J.-MdI995) Oceanic landscapeconcept and operational fisheries oceanography. In: Les Nouvelles Frontieres de la TeledetectionOceanique (eds Doumenge & Toulemont A.). Mem. Inst. Oceanogr. Monaco, 18,85-97.

326 References
Petitgas, P. (\ 993) Geostatistics for fish stock assessments: a review and acoustic application. ICES J, Mar.Sci., 50, 285-98.
Petitgas, P. (1994) Spatial strategy of fish populations. ICES CM 1994/D:14.Petitgas, P. (\ 996) Geostatistics and their applications to fisheries survey data. In: Computers in Fisheries
Research (eds Megrey, B.A. & Moksness, E.), pp. 113--42, Chapman and Hall, London.Petitgas, P. (\ 997) Sole egg distributions in space and time characterised by a geostatistical model and its
estimation variance. ICES J. Mar. Sci., 54, 213-25.Petitgas, P. & Levenez, J.J. (1996) Spatial organisations of pelagic fish: echogram structure, spatio
temporal condition, and biomass in Senegalese waters. ICES J. Mar. Sci., 53, 147-53.Pillar, S.C., Moloney, c.L., Payne, A.I.L& Shillington, F.A. (eds) (1997) Benguela dynamics. Impacts of
variability on shelf-sea environment and their living resources. S. Afr. J. Mar. Sci., 19.Pitcher, TJ. (1973) The three-dimensional structure of fish schools in the minnow, Phoxinus phoxinus.
Anim. Behav., 21, 673-86.Pitcher, TJ. (l979a) The role of schooling in fish capture. ICES CM 1979/B:5, pp. 1-12.Pitcher, TJ. (\979b) Sensory information and the organisation of behaviour in a schooling cyprinid fish.
Anim. Behav., 27, 126--49.Pitcher, TJ. (\980) Some ecological consequences of fish school volumes. Freshwater Biol., 10539--44.Pitcher, TJ. (\ 983) Heuristic definitions of shoaling behaviour. Anim. Behav., 31, 611-13.Pitcher, TJ. (\986) Functions of shoaling behaviour in teleosts. In: The Behaviour of Teleost Fishes (ed.
Pitcher, TJ.), pp. 294-337. Croom Helm, London and Sydney.Pitcher, T.J. (ed.) (\993) Behaviour of Teleost Fishes, 2nd edn. Chapman and Hall, London.Pitcher, TJ. (\ 997) Fish slioaling behaviour as a key factor in the resilience of fisheries: shoaling behaviour
alone can generate range collapse in fisheries. In: Developing and sustaining world fisheries resources.proceedings of the 2nd World Fisheries Congress, Brisbane, July 1996 (eds Hancock, D.A. & Beumer,J.P.), pp. 143-8. CSIRO, Collingwood, Australia.
Pitcher, T.J. & Magurran, A.E. (1983) Shoal size, patch profitability and information exchange in foraginggoldfish. Anim. Behav., 31, 546-55.
Pitcher, TJ. & Parrish, J.K. (\993) Functions of shoaling behaviour in teleosts. In: Behaviour of TeleostFishes, 2nd edn, (ed. Pitcher, TJ.), pp. 363--439. Chapman and Hall, London.
Pitcher, TJ. & Partridge, B.L. (1979) Fish school density and volume. Mar. Biol., 54, 383-94.Pitcher, T.J. & Turner, J.R. (1986) Danger at dawn: experimental support for the twilight hypothesis in
shoaling minnows. J. Fish. Biol., 29 (Supp. A), 59-70.Pitcher, T.J. & Wyche, CJ. (1983) Predator-avoidance behaviour of sand-eels schools: Why schools seldom
split. In: Predators and Prey in Fishes (eds Noakes, D.L.G., Lindquist, B.G. Helfrnan, G.S. & Ward,J.A., pp. 193-204. Junk, the Hague.
Pitcher, TJ., Green, D.A. & Magurran, A.E. (\986) Dicing with death: predator inspection behaviour inminnow shoals. J. Fish Bioi., 28, 439--48.
Pitcher, T.J., Magurran, A.E. & Edwards, J. L. (1985) Schooling mackerel and herring choose neighbours ofsimilar size. Mar. Biol., 86, 319-22. .
Pitcher, T.J., Magurran, A.E. & Winfield, I. (1982) Fish in larger shoals find food faster. Behav. .Ecol.Sociobiol., 10, 149-51.
Pitcher, T.J., Misund, O.A., Fern", A. Totland, B. & Melle, V. (1996) Adaptive behaviour ofherring schools in the Norwegian Sea as revealed by high resolution sonar. ICES J. Mar. Sci., 53, 44952.
Pitcher, TJ., Partridge, B.L. & Wardle, C.S.(1976) A blind fish can school. Science, 194,963-5.Plait, C. & Popper, A.N. (1981) Fine structure and function of the ear. In: Hearing and Sound Commu
nicationin Fishes (eds Tavolga, W.N., Popper, A.N. & Fay, R.R.), pp. 4-38. Springer-Verlag, NewYork.
Polovina, 1.1. (1984) Model of a coral reef ecosystem: I.: the ECOPATH model and its application toFrench frigate shoals. Coral Reefs;3, 3-11.
Polovina, J.J. (\ 989) A system of simultaneous dynamic production and forecast models for multi species ormultiarea applications. Can. J. Fish.Aquat. Sci., 46, 961-3.
Polovina, 1:1. (\ 996) Decadal variation in the trans-Pacific migration of northern bluefin tuna (Thunnusthynnus) coherent with climate-induced change in prey abundance. Fish. Oceanogr., 5 (2),114-19.
.Pope, J.G. (\977) Estimation of fishing mortality, its precision and implications for the management offisheries. In: Fisheries Mathematics (ed. Steele, J.H.), pp. 63-76. Academic Press, New York.

References 327
Pope, J.G. (1982) User requirements for acoustic surveys. International Symposium on Fisheries Acoustics,Bergen, Norway, 21-24 June, 1982, Doe. no. 84.
Pope, J.G. & Shepherd, J .G. (1982) A simple method for the consistent interpretation of cinch-at-age data.1. Cons. lnt, Explor. Mer, 40, 176-84.
Pope, J.G. & Shepherd, J:G. (1985) A comparison of the performance of various methods for tuning VPAsusing effort data. J. Cons. Int, Explor. Mer, 42, 129-51'.
Potier, M. & Sadhotomo, B. (1995) Seiners fisheries in Indonesia. In: BIOD YNEX: Biology, Dynamics,Exploitation of the Small Pelagic Fishes in the Java Sea (eds Potier, M. & Nurhakim, S.), pp. 49-66.Pelfish, Jakarta.
Potier, M., Petitgas, P. & Petit, D. (1997) Interaction between fish and fishing vessels in the Javanese purseI seine fishery. Aquat. Living Resour., 10 (4), 149-56.Potter, D.e., Lough, R.e.,.Perry, R.1. & Neilson, J.D. (1990) Comparison of the MOCNESS and IYGPTI pelagic samplers for the capture ofO-group cod (Gadus morhua) on Georges Bank. J. Cons. Ini. Expl., Mer, 46(2), 121-8. .: Powell, G.V.N. (1974) Experimental analysis of the social value of flocking by starlings tSturnus vulgaris) in
relation to predation and foraging. Anim. Behav., 23, 504-8.Priede, I.G. & Watson, JJ. (1993) An evaluation of the daily egg production method for estimating biornass
of Atlantic mackerel (Scomber scombrus ). In: Advances in the Early Life Historv of Fishes. PartZ,Ichthyoplankton Methodsfor Estimating Fish Biomass (eds Hunter, J.R., Lo, N.e.H. & Fuiman, L.A.),pp. 891-91 I. Bull. Mar. Sci. (US), 53 (2).
Priede,I.G., Raid, T. & Watson, JJ. (1995) Deep-water spawning of Atlantic mackerel Scomber scombrus,west of Ireland: J. Mar, Bioi. Assoc. (UK) 75(4), 849-55. .
Pristas, PJ. & Willis, T.D. (1973) Menhaden tagging and recovery: part 1- Field methods for taggingmenhaden, genus Brevoortia. Marine Fisheries Review (USA), 35 (5~), 31-5.
Pullen, G., Williams, H. & Jordan, A. (1992) Development and applicability of fishery independentmethods for assessment of the Tasmanian jack mackerel fishery. Newsl. Aust . Soc. Fish Bioi., 22 (2),48-9.
Pyanov, A.1. (1993) Fish learning in response to trawl fishing. ICES Mar. Sci. Symp., 196, 12-16.Pyanov, A.I. & Zhujkov, A. Yu. (1993) Conditioned reflex in fishes for avoidance of active fishing gear. J.
lchthyol.. 33 (8), 40-50.Quinn, TJ. 11, Deriso, R.B. & Neal, P.R. (1990) Migratory catch-age analysis. Can. 1. Fish. Aquat. Sci., 47
(12), 2315-27.Quinn, T.P., Brannon, E.L. & Dittman, A.H. (1989) Spatial aspectsof imprinting and homing incoho
salmon, Oncorhynchus kisutch. Fish. Bull. (US) 87 (4), 769-74.Radakov, D. V. (1973) Schooling in the Ecology of Fish. Israel Program for Scientific Translations, Jer
usalem. John Wiley and Sons; New York.Radovich, J. (1979) Managing pelagic schooling prey species. In: Predator-prey Systems in Fisheries
Management (ed. Clepper;E.), pp. 365-75. Sport Fish. Inst., Washington De.Raid, T. (1994) Structure of Estonian herring catches in the Gulf of Finland. ICES CM 1994/J:21.Ranta, E. & Kaitala, V. (1991) School size affects individual feeding success in three-spined sticklebacks
(Gasterosteus aculeatus L.). 1. Fish. Bioi., 39, 733-7.Ranta, E., Juvonen, S.-K. & Peuhkuri, N. (1992) Further evidence for size-assortative schooling in
sticklebacks. J. Fish. Bioi., 41, 627-'-30.Reid, D.G. (1995) Relationship between herring school distribution and sea bed substrate derived from
RoxAnn. Communication to ICES Int, Symp. on Fisheries andPlankton Acoustics, Aberdeen (UK), 1216 June 1995.
Reid, D.G. & Simmonds, EJ. (1993) Image analysis techniques for the study of fish school structure fromacoustic survey data. Can. J. Fish. Aquat. Sci., 50, 886-93.
Reid, G.R., Turrell, W.R., 'Walsh, M. & Corten, A. (1997) 'Cross-shelf processes north of Scotland inrelation to the southerly migration of western mackerel.lnt. Coun. Explor. Sea J. Mar. Sci., 54, 168-78.
Reiner, F. & Lacerda, M. (1989) Note on the presence of Pseudorca crassidens in Azoran waters. Bocagiana,Funchal, 130.
Reuter, H. & Breckling, B. (1994) Selforganisation of fish schools: an object-oriented model. Ecol. Model.,75/76, 147-59.
Revie, J., Weston, D.E., Harden Jones, FR. & Fox, G.P. (1990) Identification of fish echoes located at65 km range by shorebased sonar. 1. Cons. Int, Explor. Mer, 46 (3), 313-24.

328 References
Reynisson.P. (1993) In situ target strength measurements of Icelandic summer spawning herring in theperiod 1985-1992. Int . Coun. Explor. Sea, CM. 1993/B:40 Ref. H, pp. 1-15.
Reynolds, W.W. & Casterlin, M.E. (1980) The role of temperature in the environmental physiology offishes. In: Environmental Physiology of Fishes (ed. Ali, M.A.), pp. 497-518. NATO Advanced StudyInstitutes Series. Series A: Life Sci. Plenum Press, New York.
Richards, L.J. & Schnute, J.T. (1986) An experimental and statistical approach to the question: is CPUE anindex of abundance? Can. J. Fish. Aquat . Sci., 43,1214-27.
Richardson, LD. (1960) Observations on the size and numbers of herring taken by the herring trawl. J.Cons. Int . Explor. Mer, 25, 204-17.
Ricker, W.E. (1954) Stock and recruitment. J. Fish. Res. Board Can., 11, 559-623.Ricker, W.E. (1971) Derzavin's biostatistical method of population analysis. J. Fish. Res. Board Can., 28,
1666-72.Ricker, W.E. (1975) Computation and interpretation of biological statistics of fish populations. Fish. Res.
Board Can. Bull., 191.Rivard, D. & Bledsoe, LJ. (1978) Parameter estimation for the Pella-Tomlinson stock production model
under nonequilibrium conditions. Fish. Bull. (US) 76 (3), 523-34.Rivault, C & Cloarec, A. (1992) Foraging in Blattella germanica (L.) and aggregation pheromone. Etologia,
2, 33-9.Rivest, L.-P., Potvin, F., Crepeau, H. & Daigle, G. (1995) Statistical methods for aerial surveys using the
double-count technique to correct visibility bias. Biometrics, 51 (2). 461-70.Roberts, CM. (1995) Rapid build-up of fish biomass in a Caribbean marine reserve. Conserv. biol., 9 (4),
816-26.Roberts, CM. (1997) Ecological advice for the global fisheries crisis. TREE, 12, 35-8.Robertson, D.R., Sweatman, H.P.A., Fletcher, E.A. & Cleland, M.G. (1976) Schooling as a mechanism for
circumventing the territoriality of competitors. Ecology, 57, 1208-20.Robinson, CJ, & Pitcher, TJ. (1989a) The influence of hunger and ration level on shoal density, polar
isation and swimming speed of herring, Clupea harengus L. J. Fish. Bioi., 34, 631-3.Robinson, CJ. & Pitcher, TJ. (1989b) Hunger motivation as a promoter of different behaviours within a
shoal of herring: selection for homogenity in fish shoal? J. Fish. Biol., 35, 459-60.Robson, D.S. (1966) Estimation of the relative fishing power of individual ships.ICNAF Res. Bull., (3), 5-14.Rocha, CA.S., Stokes, T.K., Pope, J.G. & Kell, L.T. (1991) Defining species specific effort. ICES CM/
1991, Statistics Comm. (mimeo).Roepke, A. (1989) Day/night differences in determination of growth rate of mackerel Scomber scombrus
larvae during a patch-study in the Celtic Sea. Mar. Biol., 102 (4), 439-43.Roff, D.A. & Fairbairn, DJ. (1980) An evaluation of Gulland's method for fitting the Schaefer model. Can.
J. Fish. Aquat. Sci., 37, 1229-35.Roger, C (1993) On' feeding conditions for surface tunas (yellowfin, Thunnus albacares and skipjack,
Katsuwonus pelamisi in the Western Indian Ocean. Proceedings of the 5th Expert Consultation onIndian Ocean Tunas. FAO, 8,131-5. /
Rogers, P.H., Popper, A.N., Hastings, M.C & Saidel, W.N. (1988) Processing of acoustic signals in theauditory system of bony fish. J. Acoust . Soc. Am., 83, 338-49.
Romey, W.L. (1996) Individual differences make a diffe~ence in the trajectories of simulated schools of fish.Ecol. Model., 92 (1), 65-77.
Rose, G.A. & Leggett, W.C (1988) Atmosphere-ocean coupling and Atlantic cod migrations: effects ofwind-forced variations in sea temperature and currents on nearshore distributions and catch rates ofGadus morhua. Can. J. Fish. Aquat. Sci., 45, 1234-43.
Rose, G.A. & Leggett, W.C (1991) Effects of biomass-range interactions on catchability of migratorydemersalfish by mobile fisheries: an example of Atlantic cod (Gadus morhua). Can. J. Fish. Aquat. Sci.,48,843-8.
Rosenzweig, M.L. (1981) A theory of habitat selection. Ecology, 62, 327-35.Rosenzweig, M.L. (1985) Some theoretical aspects of habitat selection. In: Habitat selection in birds (ed.
Cody, M.L.), pp. 517-40. Academic Press, Orlando.
Ross, R.M. & Backman, T.W.H. (1992) Mechanisms and function of school formation in subyearlingAmerican shad (Alosa sapidissima). J. Appl. Ichthyol., 8, 143-53.
Rothschild, BJ. (1978) Fishing effort. In: Fish Population Dynamics (ed. Gulland, J .A.), pp. 96-115. JohnWiley and Sons, New York.
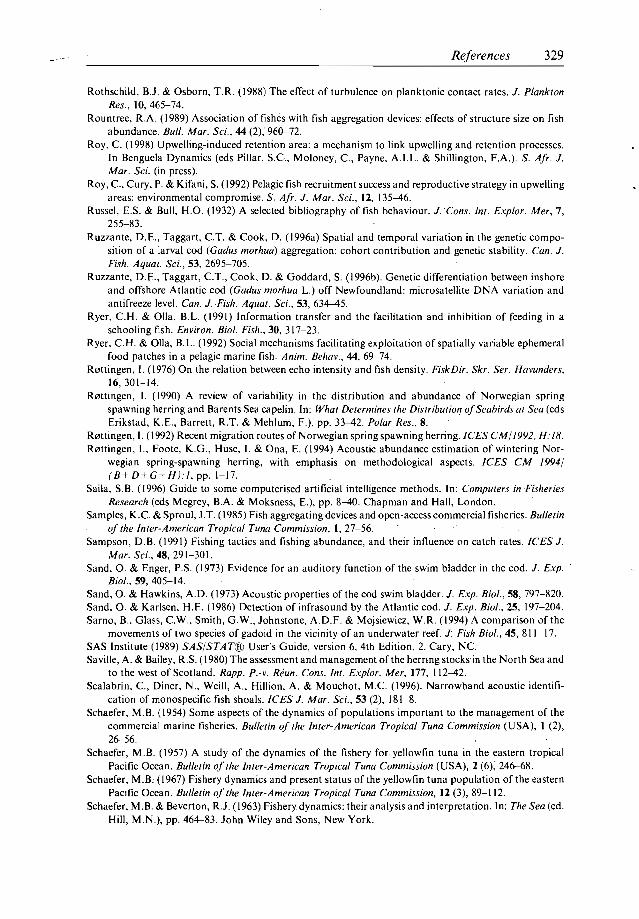
References 329
Rothschild, BJ. & Osborn, T.R. (1988) The effect of turbulence on planktonic contact rates. J. PlanktonRes., 10,465-74.
Rountree, R.A. (1989) Association of fishes with fish aggregation devices: effects of structure size on fishabundance. Bull. Mar. Sci., 44 (2),' 960-72.
Roy, C. (1998) Upwelling-induced retention area: a mechanism to link upwelling and retention processes.In Benguela Dynamics (eds Pillar, S.c., Moloney, C.; Payne, A.I.L. & Shillington, F.A.). S. Afr. J.Mar. Sci. (in press).
Roy, c., Cury, P. & Kifani, S. (1992) Pelagic fish recruitment success and reproductive strategy in upwellingareas: environmental compromise. S. Afr. J. Mar. Sci., 12, 135--46.
Russel, E.S. & Bull, H.O. (1932) A selected bibliography of fish behaviour. L'Cons. lnt. Explor. Mer, 7,255-83.
Ruzzante, D.E., Taggart, C.T. & Cook, D. (1996a) Spatial and temporal variation in the genetic composition of a larval cod (Gadus morhua) aggregation: cohort contribution and genetic stability. Can. J.Fish. Aquat. Sci., 53,2695-705.
Ruzzante, D.E., Taggart, C.']"; Cook, D. & Goddard, S. (l996b). Genetic differentiation between inshoreand offshore Atlantic cod (Gadus morhua L.) off Newfoundland: microsatellite DNA variation andantifreeze level. Can. J. Fish. Aquat, Sci., 53, 634--45.
Ryer, C.H. & Olla, B.L. (1991) Information transfer and the facilitation and inhibition of feeding in aschooling fish. Environ. Bioi. Fish., 30, 317-23.
Ryer, C.H. & Olla, B.L. (1992) Social mechanisms facilitating exploitation of spatially variable ephemeralfood patches in a pelagic marine fish. Anim. Behav., 44, 69-74.
Rettingen, I. (1976) On the relation between echo intensity and fish density. FiskDir. Skr . Ser. Havunders,16,301-14.
Rettingen, I. (1990) A review of variability in the distribution and abundance of Norwegian springspawning herring and Barents Sea capelin, In: What Determines the Distribution ofSeabirds at Sea (edsErikstad, K.E., Barrett, R.T. & Mehlum, F.), pp. 33--42. Polar Res., 8.
Rottingen, I. (1992) Recent migration routes of Norwegian spring spawning herring. ICES CM/ 1992. H·IB.Rettingen, I., Foote, K.G., Huse, I. & Ona, E. (1994) Acoustic abundance estimation of wintering Nor
wegian spring-spawning herring, with emphasis on methodological aspects. ICES CM 1994/(B+D+G+H):I, pp. 1-17.
Saila, S.B. (1996) Guide to some computerised artificial intelligence methods. In: Computers in FisheriesResearch (eds Megrey, B.A. & Moksness, E.), pp. 8--40. Chapman and Hall, London.
Samples, K.C. & Sproul, J.T. (1985) Fish aggregating devices and open-access commercial fisheries. Bulletinof the Inter-American Tropical Tuna Commission, I, 27-56.
Sampson, D.B. (1991) Fishing tactics and fishing abundance, and their influence on catch rates. ICES J.Mar. s«, 48, 291-301.
Sand, O. & Enger, P.S. (1973) Evidence for an auditory function of the swim bladder in the cod. J. Exp.BioI., 59, 405-14.
Sand, O. & Hawkins, A.D. (1973) Acoustic properties of the cod swim bladder. J. Exp. Biol., 58,797-820.Sand, O. & Karlsen, H.E. (1986) Detection of infrasound by the Atlantic cod. J. Exp. Biol., 25, 197-204.Sarno, B., Glass, C.W., Smith, G.W., Johnstone, A.D.F. & Mojsiewicz, W.R. (1994) A comparison of the
movements of two species of gadoid in the vicinity of an underwater reef. J: Fish Biol., 45,811-17.SAS Institute (1989) SAS/STAT@ User's Guide, version 6, 4th Edition, 2. Cary, NC.Saville, A. & Bailey, R.S. (1980) The assessment and management of the herring stocks in the North Sea and
to the west of Scotland. Rapp. P.-". Reun. Cons. Int. Explor. Mer, 177, 112--42.Scalabrin, c., Diner, N., Weill, A., Hillion, A. & Mouchot, M.C. (1996). Narrowband acoustic identifi
cation of monospecific fish shoals. ICES J. Mar. Sci., 53 (2),181-8.Schaefer, M.B. (1954) Some aspects of the dynamics of populations important to the management of the
commercial marine fisheries. Bulletin of the Inter-American Tropical Tuna Commission (USA), 1 (2),26--56.
Schaefer, M.B. (1957) A study of the dynamics of the fishery for yellowfin tuna in the eastern tropicalPacific Ocean. Bulletin of the Inter-American Tropical Tuna Commission (USA), 2 (6); 246--68.
Schaefer, M.B; (1967) Fishery dynamics and present status of the yellowfin tuna population of the easternPacific Ocean. Bulletin of the Inter-American Tropical Tuna Commission, 12 (3), 89-112.
Schaefer, M.B. & Beverton, RJ. (1963) Fishery.dynamics: their analysis and interpretation. In: The Sea (ed.Hill, M.N.), pp. 464-83. John Wiley and Sons, New York.

330 References
Schellart, N.A.M. & Buwalda, R.J.A. (1990) Directional variant and invariant hearing thresholds in therainbow trout (Salmo gairdnerii. J. Exp. Bioi., 149, 113-31.
Schellart, N.A.M. & Munck, J.e. de (1987) A model for directional and distance hearing in swim bladderbearing fish based on the displacement orbits of the hair cells. J. Acoust. Soc. Am., 82 (3), 822-9.
Schneider, D.e. (1989) Identifying the spatial scale of density-dependent interaction of predators withschooling fish in the southern Labrador current. J. Fish Bioi., 35 (Suppl. A); 109-15.
Schnute, JT. (1977) Improved estimates from the Schaefer production model: theoretical considerations. J.Fish. Res. Board Can., 34, 583-603.
Schnute, J.T. (1985) A general theory for analysis of catch and effort data. Can. J. Fish. Aquat, Sci., 42, 41429.
Schnute, JT. (1987) A general fishery model for a size-structured fish population. Can. J. Fish. Aquar. Sci.,44,924-40.
Schnute, J.T. (1989) The influence of statistical error on stock assessment: illustration from Schaefer'smodel. In: Effects of Ocean Variability on Recruitment and an Evaluation of Parameters used in StockAssessment Models (eds Beamish, R.J. & Mcf'arlane, G.A.), pp. 101-9. Can. Spec. Publ. Fish. Aquat.Sci., 108.
Schuijf, A. (1974) Field studies ofdirectional hearing in marine teleosts. PhD. Thesis, Univ. of Utrecht, TheNetherlands (unpublished). ...
Schuijf, A. (1975) Directional hearing of cod (Gadus morhua) under approximate free field conditions. J.Comp. Physiol., 98, 307-32.
Schuijf, A. (1976) The phase model of directionai hearing in fish. In: Sound Reception in Fish (eds Schuijf, A.. & Hawkins,.A.D.), pp. 63-86. Elsevier, Amsterdam.
Schuijf, A. & Buwalda, R.J.A. (1975) On the mechanism of directional hearing in cod (Gadus morhua L.). J.Comp. Physiol., 98, 333--43.
Schuijf, A. & Hawkins, A.D. (1983) Acoustic distance discrimination by the cod. Nature, 302,143--4.Schuijf, A. & Siemelink, M.E. (1974) The ability of cod (Gadus morhua) to orient towards a sound source.
.Experientia, 30, 773--4.Schwarz, A.L. (1985) The behaviour of fishes in their acoustic environment. Environ. Bioi. Fish., 13.(1),3
15.Schwarz, AL. & Greer, G.L. (1984) Responses of Pacific herring, Clupea harengus pallasi, to some
underwater sounds. Can. J. Fish. Aquai. Sci., 41, 1183-92.Schweigert, J.F. (1993) A review and evaluation of methodology for estimating Pacific herring egg
deposition. In: Advances in the Early Life History of Fishes. Part 2. /chthyoplankton Methods forEstimating Fish Biomass (eds. Hunter, J.R.,. Lo, N.e.H. & Fuiman, L.A.), pp. 818--41. Bull. Mar. Sci.(US), 53 (2).
Scott, J.M. & Flittner, G.A. (1972) Behaviour of blue fin tuna schools in the eastern north Pacific Ocean asinferred from fishermen's logbooks, 1960-67. Fish. Bull. (US), 70,915-27.
Scott, M., Loson, R., Chivers, S. & Holland, K. (1995) Tracking of spotted dolphins and yellowfin tuna inthe eastern tropical Pacific. 46th Tuna Conference. San Diego and Lake Arrowhead (mimeo).
Seghers, B.H. (I974a) Schooling behaviour in the guppy (Poecillia reticulata):an evolutionary response topredation. Evolution, 28, 486-9.
Seghers, B.H. (I 974b) Geographic variation in the response of guppies (Poecilia reticulata) to aerial predators. Oeceologia, 14, 93-8.
Serebrov, L.t. (1974) Relationship between school density and size of fish. J. Ichthyol., 16, 135--40.Serebrov, L.t. (1984) On the density ofdistribution and orientation of capelin schools. In: Proceedings ofthe
Soviet-Norwegian Symposium on The Barents Sea Capelin, Bergen, Norway, 14-17 August 1984, pp.157-69.
Serra, R. (1991) Important life history aspects of the Chilean jack mackerel, Trachurus symmetricus murphyi. Investigacion Pesquera, 36, 67-83.
Sette, O.E. (1943) Studies on the Pacific pilchard or sardine (Sardinops caerulea). I - Structure of a research. program to determine how fishing affects the resource. United States Department of the Interior, Fishand Wildlife Service. Special Scientific Reports, 19, 1-27.
Shackleton, L.Y. (1987) A comparative study of fossil fish scales from three upwelling regions. S. Afr. J.Mar. Sci., 5, 79-84.
Shackleton, L.Y.(I988) Scale shedding: an important factor in fossil fish scale studies. J: Cons.lnt. Explor.Mer, 44, 259-63.

References 331
Shapiro, D.Y. (1983) On the possibility of kin groups in coral reef fishes. NOAA Symp. Ser. UnderseaResearch, I, 39-45.
Sharp, G.D. (l978a) Colonization: modes of opportunism in the ocean. In: Workshop on the effect ofenvironmental variation on the survival of larval pelagic fishes, 20 April-5 May 1980, Lima, Peru. IOCWorkshop Report Series 28, pp. 125-48. IOC/UNESCO, Paris.
Sharp, G.D. (l978b) Behaviour and physiological properties of tunas and their effects on vulnerability tofishing gear. In: The Physiological Ecology of Tunas (eds Sharp. G.D. & Dizon, A.E.), pp. 397-449.Academic Press, New York.
Sharp, G.D. & Dizon, A.E. (eds) (1978) The Physiological Ecology of Tunas. Academic Press, New York.Shashar, N., Addessi, L. & Cronin, T.W. (1995) Polarization vision as a mechanism for detection of
transparent objects. In: Ultraviolet Radiation and Coral Reefs (eds Gulko, D. & Jokiel, P.L.), 'pp. 207I I. Proceedings of the Workshop on Measurement of Ultraviolet Radiation in Tropical CoastalEcosystems, Honolulu, HI (USA), 3-5 August 1994.
Shaw, E. (1960) The development of schooling behaviour in fishes L Physiol. Zool., 32, 79-86.Shaw, E. (1961) The development of schooling behaviour in fishes n. Physiol. Zool., 34, 263-72.:Shaw, E. (1969) Some new thoughts on the schooling of fishes. FAO Fisheries Report (ITA), 62 (2), 217-31.Shaw, E. (1970) Schooling in fishes: critique and review. In: Development and Evolution of Behaviour (eds
Aronsen, L.R., Tobach, E., Lehrman, D.S. & Rosenblat, J.S.), pp. 452-80. W.H. Freeman and Co.,San Francisco.
Shaw, E. (1978) Schooling fishes. Am. Scient., 66, 166-75.Shelton, P.A. & Armstrong, M.J. (1983) Variations in parent stock size and recruitment of pilchard and
anchovy populations in the southern Benguela system. In;.Proceedings of the Expert Consultation toExamine Changes in Abundance and Species Composition ofNeritic Fish Resources (eds Sharp, G.D. &Csirke, J.), pp. 1113-32. FAO Fish. Rep., 291 (3).
Shelton, P.A. & Hutchirigs, L. (1982) Transport of anchovy, Engrau!is capensis Gilchrist, eggs and earlylarvae by a frontal jet current. J. Cons. lnt. Explor. Mer, 40 (2), 185-98.
Shelton, P.A., Armstrong, MJ. & Roel, B.A. (1993). An overview of the application of the daily eggproduction method in the assessment and management of anchovy in the south-east Atlantic. In:Advances in the Early Life History of Fishes. Part 2. lchthyoplankton Methods for Estimating FishBiomass (eds Hunter, J.R., Lo, N.e.H. & Fuiman, L.A.), pp. 778-94. Bull. Mar. Sci. (US) 53 (2).
Shepherd, J.G. & Nicholson, M.D. (1986) Use and abuse of multiplicative models in the analysis of fishcatch-at-age data. Statistician, 35, 221-7.,
Sherwood, N.M., Kyle, A.L., Kreiberg, H., Warby, e.M., Magnus, T.H., Carolsfeld, J. & Price, W.S.(1991) Partial characterisation of a spawning pheromone in the herring Clupea harengus pallasi. Can. J.Zool., 69 (I), 91-103.
Shiohama, T. (1978)Overall fishing intensity and yield by the Atlantic longline fishery of albacore (Thunnusalalunga), 1956-1975.ICCAT Res. Doe. Sci., 7 (2),'217-24.
Shiraishi, M., Azuma, N. & Aoki, L (1996) Large schools of Japanese sardines, Sardinops melanostictus,mate in single pair units at night. Environ. Bioi. Fish., 45 (4), 405-9.
Sibly,: R.M. (1983) Optimal group size is unstable. Anim; Behav., 31, 947-8.Sigler, M.F. & Fujioka, J.T. (1988) Evaluation of variability in sablefish, Anoplopoma fimbria, abundance
indices in the Gulf of Alaska using the bootstrap method. Fish. Bull. (US) 86 (3), 445-52.Simmonds, J.E. & MacLennan, D.N. (eds) (1996) Fisheries and plankton acoustics. ICES J. Mar. Sci., 53
(2), 129-535.Simmonds, EJ., Armstrong, F. & Copland, P. (1996) Species identification using wideband backscatter
with neural network and discriminant analysis. ICES J. Mar, Sci., 53 (2), 189-95.Simmonds, E.J., Williamson, NJ., Gerlotto, F. & Aglen, A. (1992) Survey design and analysis procedures:
a comprehensive review of good practice. ICES Coop. Res. Rep., 187.Sivasubramaniam, K. (1961) Relation between soaking time and catch of tuna, in long line fisheries. Bull.
Japan. Soc. Sci. Fish., 27, 835-45.Slotte, A. & Johannessen, A. (1997) Exploitation of Norwegian spring-spawning herring (Clupea harengus
L.) before and after the stock decline;' towards a size selective fishery. In: Developing and sustainingworldjisheries. Proceedings of the 2nd World Fisheries Congress, Brisbane, Australia, July 1996 (edsHancock, D.A., Smith, D.e., Grant; A. & Beumer, J.P.), pp. 103-8. CSIRO, Collingwood, Australia.
Smith, G.W., Glass, C.W., Johnstone, A.D.F. & Mojsiewicz, W.R. (1993) Diurnal patterns in the spatialrelationships between saithe, Pollachius virens, schooling in the wild. J. Fish. Bioi., 43 (Suppl. A), 315-25.

332 References
Smith, M.F.L. & Warburton, K. (1992) Predator shoaling moderates the confusion effect in blue-greenchromis, Chromis viridis. Behav, Ecol. Sociobiol., 30, 103-7.
Smith, P.E. (1977) The effects of internal waves on fish school mapping with sonar in the California currentarea. Rapp. P.-v. Reun. Cons. lnt. Explor. Mer, 170,223-31.
Smith, P.E., Flerx, W. & Hewitt, R.P. (1985) The CalCOFI vertical egg tow (CaIVET) net. In: An eggproduction methodfor estimating spawning biomass ofpelagic fish: application to the Northern anchovy,Engraulix mordax. NOAA Tech. Rep. NMFS 36.
Smith, P.1., Francis, R.I.C.C. & McVeagh, M. (1991) Loss of genetic diversity due to fishing pressure. Fish.Res. (US) 10, 309-16.
Smith, R.1.F. (1992) Alarm signals in fishes. Rev. Fish Bioi. Fisheries, 2, 33-63.Smith, S.l. & Gavaris, S. (1993) Improving the precision of abundance estimates of Eastern Scotian Shelf
Atlantic cod from bottom trawl surveys. N. Amer. J. Fish. Manag., 13, 35-47.Smith, S.l. & Page, F.H. (1996) Association between Atlantic cod (Gadus morhua) and hydrographic
variables: implications for the management of the 4VsW cod stock. ICES J. Mar. Sci., 53, 597--614.Smith, T.D. (1988) Stock assessment methods: the first fifty years. In: Fish Population Dynamics (ed.
Gulland, 1.A.), pp. 1-33. John Wiley and Sons, New York.Smith, T.D. (1994) Scaling Fisheries: the Science of Measuring the Effects of Fishing, pp. 1855-955.
Cambridge University Press, Cambridge.Snyder, D.E. (1983) Fish eggs and larvae. In: Fisheries Techniques (eds Nielsen, L.A. & Johnson, D.L.), pp.
165-98. Am. Dish. Soc., Bethesda, MD, US.Soemarto (1960) Fish behaviour with special reference to pelagic schooling species: Lajang iDecapterus
spp.). 8th Proc. Indo-Pacific Fish. Coun., 3, 89-93.Soldal, A.V., Engas, A. & Isaksen, B. (1993) Survival of gadoids that escape from a demersal trawl. ICES
Mar. Sci. Sym., 196, 122-7.Somerton, D.A. & Kikkawa, B.S. (1995) A stock survey technique using the time to capture individual fish
on longlines. Can. J. Fish. Aquat: Sci., 52 (2),260-7.Soria, M. (1994) Structure et stabilite des banes et agregations de poissons pelagiques cotiers tropicaux:
application halieutique. These de Doctorat, Universite de Rennes (France).Soria, M. & Dagorn, L. (1992) Rappels sur le comportement gregaire. In: Action lncitative Comportement
Agregatif (AICA), Montpellier, lune 1992, (ed. Stretta, 1.-M.), pp. 5-9. Doe. Int. Centre, Orstom,.Montpellier.
Soria, M., Freon, P. & Gerlotto, F. (1996) Analysis of vessel influence on spatial behaviour of fish schoolsusing a multi-beam sonar and consequences for biomass estimates by echo-sounder. ICES J. Mar. Sci.,53 (2), 453-8.
Soria, M., Gerlotto, F. & Freon, P. (1993) Study of learning capability of a tropical c1upeoids using anartificial stimulus. ICES Mar. Sci. Symp., 196, 17-20.
Sorokin, M.A. (1987) Perception of sound by the eastern mackerel, Scomber japonicus. Voprosy lkhtiologii,2,329-35.
Sorokin, M.A. (1989) Directional hearing in c1upeidae. Soviet J. Mar. Biol., 14 (4),224-8.Souid, P. (1988) Automatisation de la description et de la classification des detections acoustiques de banes de
poissons pelagiques pour leur identification. These de Doctorat de l'Universite de banes de poissonspelagiques pour leur identification. These de Doctorat de l'Universite d'Aix-Marseille 11 (France)Specialite Ecologie..
Soutar, A. & Isaacs, 1.0. (1974) Abundance ofpelagic fish during the 19th and 20th centuries as recorded inanaerobic sediment off the Californias. Fish. Bull. (US) 72 (2), 257-73.
Squire, 1.L. (1972) Apparent abundance of some pelagic marine fishes off the southern and central California coast as surveyed by an airborne monitoring program. U.S. Fish. Wild. Serv. Fish. Bull., 70,1005-19.
Squire, 1.L. lr. (1978) Northern anchovy school shapes as related to problems in school size estimation.Fish. Bull. (US) 76, 443-8.
Stacey, N.E. (1987) Roles of hormones and pheromones in fish reproductive behaviour. In: Psychobiologyof Reproductive Behaviour. An Evolutionary Perspective (ed. Crews, D.), pp. 28--60. Prentice Hall,Englewood Cliffs.
Stacey, N.E. & Hourston, A.S. (1982) Spawning and feeding behavior of captive Pacific herring (Clupeaharengus pallasii. Can. J. Fish. Aquat. Sci., 39 (3), 489-98.
Stephens, D.W. & Krebs, 1.R. (1987) Foraging Theory. Princeton University Press, Princeton, Nl.

References 333
Stephenson, R.L. (1991) Comparisons of tuning methods used in herring stock assessments in the northeast and north-west Atlantic. ICES CM/1991/H:39.·
Stequert.B. & Marsac, F. (1989) Tropical-tuna surface fisheries in the Indian Ocean. FAO Fish. Tech. Pap.,282.
Stevens, J.D., Hansfield, H.F. & Davenport, S.R. (1984) Observations on the biology, distribution andabundance of Trachurus declivis, Sardinops neopilchardus and Scomber australasicus in The GreatAustralian Bight. Rep. CSIRO Mar. Lab. (Australia), 164.
Stokes, T.K. & Pope,.G. (1987) The detectability trends from catch-at-age and commercial effort data.ICES CMIl987/D:14.
Strand, S.W. & Hamner, W.N. (1990) Schooling behaviour of Antarctic krill (Euphausia superbai inlaboratory aquaria: reactions to chemical and visual stimuli. Mar. Bioi., 106; 355-9.
Strasburg, D.W. (1961) Diving behaviour of Hawaiian skipjacktuna. J. Cons.lnt. Explor. Mer, 26, 223-9.Strasburg, D.W. & Yuen, H.S. (1958) Preliminary results of underwater observations of tuna schools and
practical applications of these results. In: Proceedings ofthe Indo-Pacific Fisheries Council, 8th session,Colombo, Ceylon, 6-22 Dec. 1958 (Ill), pp. 84-9.
Stretta, J.-M. (1988) Environnement et peche thoniere en Atlantique tropical oriental. In: Ressources, pecheet biologie des thonides tropicaux de l'Atlantique centre-est (eds Fonteneau, A. & Marcille, J.), pp. 269316. FAO Fish. Tech. Pap., 292.
Stretta, J.-M. (1991) Contribution de la teledetection aerospatiale al'elaboration des bases de I'halieutiqueoperationnelle: I'exemple des pecheries thonieres tropicales de surface (aspect predictif). Doctoral dissertation, Paris VI, Grenoble (France).
Stretta, J.-M. & Petit, M. (1989) Relation capturabilite temperature de surface. Tech. Pap. FAO, 302, 49-50.Stretta, J.-M. & Petit, M. (1992) Thonides tropicaux: la synthese ecologique, ICCA T Collect. Vol. Sci. Pap.,
39 (1), 307-21.Stretta, J.-M. & Slepoukha, M. (1986) Analyse des facteurs biotiques et abiotiques associes aux banes de
thons. In: Proceedings of the ICCA T Conference on the International Skipjack Year Program (edsSymons, P.E.K., Miyake, P.M. &Sakagawa, G.T.), pp. 161-9. ICCAT, Madrid.
Stretta, J.-M., Delgado de Molina, A., Ariz, J., Domalain, G. & Santana, J.c. (1996) Les especes associeesaux peches thonieres tropicales. Orstom/If.O rapport scientifique (Zeme partie) + annexe. Europeancommunity project (mimeo).
Stremrne, T. & Ssetersdal, G. (1987) Consistency of acoustic biomass assessments tested by repeated surveycoverage. International Symposium on Fisheries Acoustics, Seattle, Washington, USA, 22-26 June.
Stuntz, W.E. (1981) The tuna-dolphin bond: a discussion of current hypotheses; Southwest FisheriesCenter, National Marine Fisheries Service, NOAA La Jolla, CA. Administrative Rep. LJ, 81-19.
Suboski, M.D. & Templeton, JJ. (1989) Life skills training for hatchery fish: sociaLlearning and survival.Fish. Res., 7, 343-52.
Sullivan, PJ. (1991) Stock abundance estimation using depth-dependent trends and spatially correlatedvariation. Can. J. Fish. Aquat. Sci., 48 (9), 1691-1703.
Sund, O. (1935) Echo sounding in fishery research. Nature, 135, 953.Sund, P.N., Blackbum.i M. & Williams, F. (1981) Tunas and their environment in the Pacific Ocean: a
review. Oceanogr. Mar. Bioi. Ann. Rev., 19,443-512.Suomala, J.B. (1981) Meeting on hydroacoustical methodsfor the estimation ofmarinefish populations, 25-29
June 1979.11: contributed papers, discussion, and comments. The Charles Stark Draper Laboratory,Cambridge, Mass., US.
Sutherland, WJ. (1983) Aggregation and the ideal free distribution. J. Anim. Ecol., 52, 821-8.Suuronen, P. (1995) Conservation of young fish by management of trawl selectivity-Fer. Fish. Res., 15,97
116.Suuronen, P. & Miller, R.B. (1992) Size selectivity of diamond and square mesh codends in pelagic herring
trawls: only small herring will notice the difference. Can. J. Fish. Aquat. Sci., 49 (10), 2104-17.Suuronen, P., Erickson, D.L. & Orrensalo, A. (1996a) Mortality of herring escaping from pelagic trawl
codends. Fish. Res. (US), 25, 305-21.Suuronen, P., Lehtonen, E. & Wallace, J. (1997) Avoidance and escape behaviour by herring encountering
midwater trawls. Fish. Res. (US) 29, 13-24.Suuronen, P., Lehtonen, E., Tschernij, V. & Orrensalo, A. (1993) Survival of Baltic herring (Clupea har
engus L.) escaping from a trawl codend and through a rigid sorting grid. ICES CM 1993/B:14.Suuronen, P., Perez-Comas, J., Lehtonen, E. & Tschernij, V. (l996b) Size-related mortality of herring

334 References
(Clupea harengus L.) escaping through a rigid sorting grid and trawl codend meshes. Int, Coun. Explor.Sea J. Mar. su.. 53, 691-700.
Suyehiro, Y. (1952) Textbook of Ichthyology (in Japanese). Iwanami Shoten, Tokyo.Suzuki, Z. (1992) General description on tuna biology related to fishing activities on floating objects by
Japanese purse seine boats in the western and the central Pacific. In: International Workshop on theEcology and Fisheriesfor Tunas Associated with Floating Objects and on Assessment Issues Arising fromthe Association of Tunas with Floating Objects (ed. Hal1, M). Inter-American Tropical Tuna Commission Int. Rep., San Diego (mimeo).
Suzuki, Z. (1994) A review of the biology and fisheries for yellowfin tuna (Thunnus albacares) in the westernand central Pacific Ocean. In: Interactions of Pacific Tuna Fisheries(eds Shornura, R.S., Majkowski, J.& Langi, S.), pp. 108-37. FAO Pap. Bioi. Fish., 2. ..
Swain, D.P. & Kramer, D.L. (1995) Annual variation in temperature selection by Atlantic cod Gadusmorhua in the southern Gulf of St. Lawrence, Canada, and its relation to population size. Mar. EcolProgr. Ser., 1I6, 11-23.
Swain, D.P. & Morin, R. (1996) Relationships between geographic distribution and abundance ofAmerican plaice (Hippoglossoides platessoides) in the southern Gulf of St. Lawrence. Can. J.Fish. Aquat.Sci., 53, 106--19.
Swain, D.P. & Sinclair, A.F. (1994) fish distribution and catchability: what is the appropriate measure ofdistribution? Can. J. Fish. Aquat. Sci., 51, 1046--54.
Swain, D.P. & Wade, E.1. (1993) Density-dependent geographic distribution of Atlantic cod (Gadusmorhua) in the southern Gulf of St. Lawrence. Can. J. Fish. Aquat. Sci., 50, 725-33.
Swain, D.P., Nielsen, G.A., Sinclair, A.F. & Chouinard, G.A. (1994) Changes in catchability of Atlanticcod (Gadusmorhuai to an otter-trawl fishery and research survey in the southern Gulf of St. Lawrence.ICES J. Mar. Sci., 51, 493-504.
Swartzman, G. (1997) Analysis of the summer distribution of fish schools in the Pacific Eastern BoundaryCurrent. ICES J. Mar. s«, 54, 105-16.
Swartzman, G., Silverrnan, E. & Williamson, N. (1995) Relating trends in walleye pollock (Theragrachalcogramma) abundance in the Bering Sea to environmental factors. Can. J. Fish. Aquat, Sci., 52 (2),369-80.
Swartzman, G., Stuetzle, W., Kulman, K. & Powojowski, M. (1994) Relating the distribution ofpollockschools in the Bering Sea to environmental factors. ICES J. Mar. Sci., 51 (4),481-92.
Sanre, R. & Gjesether, J. (1975) Ecological investigations on the spawning grounds of the Barents Seacapelin. FiskIrir. Skr. Ser. Havllnders., 16, 203-27.
Tamura, T. Hanyu, 1. & Niwa, H. (1972) Spectral sensitivity and color vision in skipjack tuna and relatedspecies. Bul/. Japan. Soc. Sci. Fish., 38, 799-802.
Thomas, R.M. & Schiilein, F.H. (1988) The shoaling behaviour of pelagic fish and the distribution of sealsand gannets off Namibia as deduced from routine fishing reports, 1982-1985. S. Afr. J. Mar. Sci., 7,179-91.
Thomson, W.F. & Bell, F.H. (1934) Biological statistics of the Pacific halibut fishery (2). Effect of changesin intensity upon total yield and yield per unit of gear. Rep. Int. Fish. Comm., 8, 1-49.
Thorne, R.E. & Thomas, G. L. (1990) Acoustic observations of gas bubble release by Pacific herring (Clupeaharengus pallasii. Can. J. Fish. Aquat. Sci., 47, 1920--28.
Tinbergen, N. (1950) The Study of Instinct. Clarendon Press Publishers, Oxford.Tinbergen, N. (1963) On aims and methods of ethology. Zeit. Tierpsychol., 20, 410--33.Tomlinson, P.K. (1970) A generalisation of the Murphy catch equation. J. Fish. Res. Board Can., 27, 821-5.Toresen, R. (1991) Absorption of acoustic energy in dense herring schools studied by attenuation in the
bottom echo signal. Fish. Res., 10, 317-27.Traynor, J.1. & Williamson, N.1. (1983) Target strength measurements of walleye pollock (Theragra
chalcogramma) and a simulation study of the dual beam method. FAO Fish. Rep., 300, 112-24.Tregenza, T. (1994)Common misconceptions in applying the ideal freedistribution. Anim. Behav., 47, 485-7.Treherne, J.E. & Foster, W.A'"(1981) Group transmission of predator avoidance in a marine insect: the
Trafalgar effect. Anim. Behav., 29, 911-17..Treschev, A.l., Efanov, S.F., Shevtsov, S.E. & Klavsons, U.A. (1975) Traumatism. and survivability of
Baltic herring whichpassed through the mesh of trawl cod end. ICES CM 1975(B:9.Troadec, J.-P., Clark, W.G. & Gulland, J.A. (1980) A review of some pelagic fish stocks in other areas.
Rapp. Pi-v. Reun Cons. Int, Explor. Mer, 177,252-77.

References 335
Trout, G.c., Lee, AJ., Richardson, LO. & Harden Jones, F.R. (1952) Recent echosounder studies. Nature,170 (4315), 71-2.
Tshernij, V. (1988) An investigation on the orientation of Baltic herring .towards artificial light. Thesis,Institute of Fisheries, Pargas, Finland (in Swedish, mimeo).
Tsukagoshi, T. (1983) Some peculiar phenomena on killer whale, Orcinus orca. Bull. Japan Soc. Sci. Fish.,44, 127-31.
Turner, G. (1986) Teleost mating: systems and strategies. In: The Behaviour of Teleost Fishes (ed. Pitcher,TJ.), pp. 253-74. Croom Helm, London.
Turner, G.F. & Huntingford, F.A. (1986) A problem for games theory analysis: assessment and intention inmale mouthbrooder contests. Anim. Behav., 34, 1961-70.
Turner, G.F. & Pitcher, TJ. (1986) Attack abatement: a model for group protection by combined avoidance and dilution. Am. Nat., 128,228-240.
Tyler, J.A. & Rose, K.A. (1994) Individual variability and spatial heterogeneity in fish population models.Rev. Fish Bioi. Fisheries, 4 (I), 91-123.
Tyler, J.E.(l969)The natural light. field underwater. FAO Fish.Rep. , 62 (3), 479-97.Uda, M. (1933) Types of skipjack schools and their fishing qualities. Bull. Japan Soc. Sci. Fish., 2 (3), 107
11.Uhler, R.S. (1980) Least squares regression estimates of the Schaefer production model: some Monte Carlo
simulation results. Can J. Fish. Aquat. Sci., 37, 249-60.Ulltang, 0. (1976) Catch per unit of effort in the Norwegian purse seine fishery for Atlanto-scandian
(Norwegian spring spawning) herring. FAO Series, F1RSjTl55. 91-101.Ulltang, 0. (1980) Factors affecting the reaction of pelagic fish stocks to exploitation and requiring a new
approach to assessment and management. Rapp P.-v. Reun. Cons. 1nt. Explor. Mer, 177,489-504.Uotani, I., Iwakawa, T. & Kawaguchi, K. (1994) Experimental study on the formation mechanisms of
shirasu (postlarval Japanese anchovy) fishing grounds with special reference to turbidity. Bull. Japan.Soc. Sci. Fish. Tokyo, 60 (1),73-8.
Uriarte, A., Prouzet, P: & Villamor, B. (1996) Bay of Biscay and Ibero Atlantic anchovy populations andtheir fisheries. Scientia Marina, 60 (Suppl. 2), 237-55.
Urick, RJ. (1983) Principles of Underwater Sound, 3rd edn. McGraw-Hill, New York.Vabe, R., Olsen, K. & Huse, L (in prep.) The effect of vessel avoidance of wintering Norwegian spring
spawning herring.Valdemarsen, lW. & Misund, O.A. (1995) Trawl designs and techniques used by Norwegian research
vessels to sample fish in the pelagic zone. In: Proceedings of the Sixth 1MR-P1NRO Symposium,Bergen, 14--17 June, 1994 (ed. Hylen, A.), pp. 135--44.
Valdes, S.E., Shelton, P.A., Armstrong, MJ. & Field, J.G. (1987) Cannibalism in South African anchovy:egg mortality and egg consumption rates. S. Afr. J. Mar. Sci., 5, 613-22.
Valdes, S.E. (1993) The energetics and evolution of intra specific predation (egg cannibalism) in the anchovyEngraulis capensis. Mar. Bioi., 115 (2), 301-8.
VanOlst, J.c. & Hunter, J.R. (1970) Some aspects of the organisation of fish schools. J. Fish. Res. BoardCan., 27, 1225-38.
Venema, S.c. & Nakken.O. (eds) (1983) Symposium on fisheries acoustics. ICES/FAO, FAO Fish. Rep.,300.
, Viedeler, JJ. & Wardle, C.S. (1991) Fish swimming stride by stride: speed limits and endurance. Rev. Fish.Bioi. Fisheries, 1, 23--40.
Vignaux, M. (1996) Analysis of spatialstructure in fish distribution using commercial catch and effort datafrom the New Zealand hoki fishery. Can. J. Fish. Aquat. Sci., 53, 963-73.
Vilhjalmsson, H. (1994) The Icelandic capelin stock. Rit Fisk., 13, 1-281.Vilhjalmsson, H;, Reynisson, P., Hamre, J. & Rettingen, L (1983) Acoustic abundance estimation of the
Icelandic stock of capelin ·1978-1982. FAO Fish. Rep., 300, 208~16.Villanueva, R. (1970) The Peruvian Eureka programme of rapid acoustic surveys using fishing vessels.
Technical Conference on Fish Finding, Purse Seining and Aimed Trawling. FAO. FII:FF/70/5.Voituriez, B. & Herbland, A. (1982) Comparaison des systemes productifs de l'atlantique tropical est:
domes therrniques, upwellings cotiers et upwelling equatorial. Rapp. Pi-v. Cons. 1nt. Explor. Mer, 180,114--30.
Wada, T. & Mutsumiya, Y. (1990) Abundance index in purse seine fishery with searching time. NipponSuisan Gakkaishi, 56 (5), 725-8.

336 References
Walker, M.M. (1984) Learned magnetic field discrimination in yellowfin tuna, Thunnus albacares. J. Comp.Physiol. A, 155, 673-9.
Walker, M.M., Dizon, A.E. & Kirschvink, J.L. (1982) Geomagnetic field detection by yellowfin tuna.Anonyme Oceans '82 Conference record, pp. 755-8. IEEE Press, New York.
Walsh, M. & Martin, J.H.A. (1986) Recent changes in the distribution and migrations of the westernmackerel stock in relation to hydrographic changes. ICES, CM /986/H:/7.
Walsh, M., Reid, D.G. & Turrell, W.R. (1995) Understanding mackerel migration off Scotland: trackingwith echosounders and commercial data and including environmental correlates and behaviour. ICESJ. Mar. Sci., 52, 925-39.
Walsh, SJ. (1991) Diel variation in availability and vulnerability of fish to a survey trawl. J. Appl. lchthyol.,7, 147-59.
Walsh, SJ. & Hickey, W.M. (1993) Behavioural reactions of demersal fish to bottom trawls at various lightconditions. ICES Mar. Sci. Symp., 196, 68-76.
Waiter, G.G. (1986) A robust approach to equilibrium yield curves. Can. J. Fish. Aquae. Sci., 43, 13329.
Waiters, C (1986) Adaptive Management of Renewable Resources. Macmillan, New York.Waiters, C, Christensen, V. & Pauly, D. (1997) Structuring dynamic models of exploited ecosystems from
trophic mass-balance assessments. ReI'. Fish. Bioi. Fish., 7, 139-72.Warburton, K. (1990) The use of local landmarks by foraging goldfish. Anim. Behav., 40 (3),500-5.Wardle, CS. (1980) Effects of temperature on the maximum swimming speed of fishes. In: Environmental
Physiology of Fishes (ed. Ali, M.A.), pp. 519-31. NATO Advanced Study Institutes Series. Series A.Plenum Press, New York.
Wardle, CS. (1983) Fish reactions to towed fishing gears. In: Experimental Biology at Sea (eds MacDonald,A.G. & Priede, I.G.), pp. 167-95. Academic Press, London.
Wardle, CS. (1993) Fish behaviour and fishing gear. In: Behaviour of Teleost Fishes, 2nd edn, (cd. Pitcher,T.J.), pp. 609-43. Chapman and Hall, London.
Wardle, CS. & Hollingworth, CE. (eds) (1993) Fish behaviour in relation to fishing operations. ICES.Mar. Sci. Symp., 196.
Ware, D.M. (1980) Bioenergetics of stock and recruitment. Can. J. Fish. Aquat. Sci., 37, 1012-24.Warren, W.G., Bohm, M. & Link, D. (1992) A statistical methodology for exploring elevation differences in
precipitation chemistry. Atmos. Environ .. 26A (I), 159-69.Wassersug, R.J., Lum, A.W. & Potel, MJ. (1981) An analysis of school structure for tadpoles (Anura:
Amphibia). Behav. Ecol. Sociobiol., 9, 15-22.Watanabe, Y., Yokouchi, K., Oozeki, Y. & Kikuchi, H. (l99l) Preliminary report on larval growth of the
Japanese sardine spawned in the dominant current area. ICES CM /99//L:33.Watanabe, Y., Zenitani, H. & Kirnura, R. (1996) Offshore expansion of spawning of the Japanese sardine,
Surdinops melanostictus, and its implication for egg and larval survival. Can. 1. Fish. Aquat. Sci., 53,55-61.
Webb, B.F. (1977) Moon's influence on schoaling ofpelagic fish species. Austr. Fish, Sept. 8-11.Weihs, D. (1973) Hydromechanics of fish schooling. Nature, 241, 290-1.Weihs, D. (1975) Some hydromechanical aspects of fish schooling. In: Symposium on Swimming and
Flying in Nature (eds Wu, T.Y., Broklaw, CJ. & Brennan, C), pp. 703-18. Plenum Press, NewYork.
Weill, A., Scalabrin, C & Diner, N. (1993) MOVIES-B: an acoustic detection description software .. Application to shoal species classification. Aquut. Liv. Resour., 6, 255-67.
Welch, C & Colgan, P. (1990) The effect of contrast and position on habituation to models of predators ineastern banded killifish (Fundulus diaphanusi. Behav.Process., 22, 61-71.
Wenz, G.M. (1962) Acoustic ambient noise in the ocean: spectra and sounds. J. Acoust. Soc. Am., 34 (12),1936--56. .
Werner, E.E. (1986) Ontogenic habitat shifts in the bluegill sunfish iLepomis macrochirusi the role of theforaging rate-predation risk tradeoff. In: The Behaviour of Fishes. The Fisheries Society of the BritishIsles, Bangor.
Werner, E.E. & Hall, DJ. (1974) Optimal foraging and the size selection of prey by the Bluegill sunfish(Lepomismacrochirus). Ecology, 55, 1042-52 ..
Werner, E.E.,Gilliam, J.F., Hall, DJ. & Mittelbach, G.G. (1983) An experimental test of the effects ofpredation risk on habitat use in fish. Ecology, 64, 1540-8.

References 337
Werner, R. (1977) A reasonableness algorithm for hydroacoustic estimation of biomass density. Rapp. P>v,Reun. Cons. Int, Explor. Mer, 170, 219~22.
Wespestad, V.G. & Megrey, B.A. (1990) Assessment of walleye pollock stocks in the eastern North PacificOcean: an integrated analysis using research survey and commercial fisheries data. Rapp. P.-v. Reun.Cons. Int . Explor. Mer, 189, 33--49.
Wickharn, D.A., Watson, l.W. Jr. & Ogren, L.H. (1973) The efficacy of mid water artificial structures forattracting pelagic sport fish. Trans. Am. Fish. Soc., 3, 563~72.
Wiebe, P.H., Burt, K.H., Boyd, S.H. & Morton, AW. (1976) A multiple opening/closing net and environmental sensing system for sampling zooplankton. J. Mar. Res., 34, 313-26.
Williams, H. (1981) Aerial survey of pelagic fish resources off South East Australia 1973-1977. Austr.CSIRO Div. Fish Oceanogr. Rep. 130.
Williams, H. & Pullen, G. (1993) Schooling behaviour of jack mackerel, Trachurus declivis (Jenyns),observed in the Tasmanian purse seine fishery. Ausl. J. Mar. Freshwater Res., 44, 577-87.
Williarns, K. (1981) Aerial survey of pelagic fish resources off south-east Australia 1973-1977. Rep. Div.Fish. Oceanogr. CSIRO, Cronulla, 130.
Wilson, E.O. (1975) Sociobiology: the New Synthesis. Harvard University Press, Cambridge, Mass.Winger, P.D., He, P. & Walsh, S.J. (1997) Preliminary analysis of the swimming endurance of Atlantic cod
(Gadus morhua) and American plaice (Hippoglossoides platessoides). ICES CM 1997/ W: 13.Winn, H.E. & Olla, B. (1972) Behaviour ofMarine Animals: Current Perspectives in Research. Plenum Press,
New York.Winters, G.H. & Wheeler, l.P. (1985) Interaction between stock area, stock abundance, and catchability
coefficient. Can. J. Fish. Aquat . s«, 42, 989-98.Wolf, N.G. (1985) Odd fish abandon mixed-species groups when threatened. Behav. Ecol. Sociobiol., 17,
47-52.Wolf, N.G. (1987) Schooling tendency and foraging benefit in the ocean surgeonfish. Behav, Ecol. Socio
biol., 21 (1),59-63.Woodhead, P.M.J. (1964) A change in the normal diurnal pattern of capture of soles during the severe
winter of 1963. Rapp. Cons. InT. Explor. Mer, 155 (8).Wootton. R.J. (1990) Ecology of Teleost Fishes. Chapman and Hall, London.Woznitza-Mendo, C & Espino, M. (1986) The impact of El Nino on recruitment in the Peruvian hake
i Merluccius gayi peruanus). Meeresforschung, 31, 47-51.Wyatt, T. & Larrafieta, M.G. (eds) (1988) Long term changes in marine fish populations. Symposium
International. Consejo Superior de Investigaciones Cienteficas, Vigo.Wyatt, T., Cushing, D.H. & Junquera, S. (1986) Stock distinctions and evolution of European sardine. In:
Long-term Variability of Pelagic Fish PopulaTions and Their Environment (eds Kawasaki, T., Toba, Y.,Tanaka, S. & Taniguchi, A.), pp. 135--45. Pergamon Press, Oxford.
Wysokinski, A. (1987) Catch per unit of effort in the pelagic trawl fishery as illustrated by the horsemackerel fishery off Namibia. Coli. Sci. Pap. ICSEAF/ Reel. Doe. Sci., 14 (2), 297-307.
Yafiez, E. R. (1998) Fluctuations des principaux stocks de poissonspelagiques exploites au Chili et leurs relationsavec les variations de l'environnement. These Doctorat, Universite de Bretagne Occidentale, Brest.
Yafiez, E.R., Canales, C, Barbieri, M.A., Gonzalez, A. & Catasti, V. (1993) Estandarizacion del esfuerzode pesca y distribucion espacial e interanual de la CPUE de anchoveta y de sardina en la zona norte deChile entre 1987-1992. Investigaciones Marinas, 21,111-32.
Yafiez, E.R., Gonzalez, A. & Barbieri, M.A. (1995) Estructura termica superficial del mar asociada a ladistribucion espacio-temporal de sardina y anchoveta en la zona norte de Chile entre 1987 y 1992.Investigaciones Marinas, 23, 123--47.
Yoshihara, T. (1954) Distribution of cath of tuna longline. IV. On the relation between k and q, with a tableand diagram. Bull. Japan Soc. Fish.. 19, 1012-14.
Vu, L.S. (1992) Characteristics of formation and behaviour of associated aggregations of tunas in theWestern Indian Ocean. In: International Workshop on The Ecology and Fisheriesfor Tunas Associatedwith Floating Objects andon Assessment Issues Arising from the Association of Tunas with FloatingObjects (ed. Hall, M.). Inter-American Tropical Tuna Commission Int. Rep., San Diego (mimeo).
Yuen, H.S. (1959) Variability of skipjack tuna (Katsuwonus pelamis) to live bait. Fish. Bull. (US) 60, 147-60.Yuen, H .S. (1969) Response of skipjack tuna iKatsuwonus pelamis) to experimental changes in pole and line
fishing operations. In: Proceedings of The FAO conference on fish behaviour in relation To fishingTechniques and tactics (eds Ben Tuvia, A. & Dickson, W.), pp. 607-18. FAO Fish. Rep. 62 (3).

338 References
Vuen, H.S. (1970) Behaviour of skipjack tuna, Katsuwonus pelamis, as determined by tracking withultrasonic devices. 1. Fish. Res. Board Can., 27 2071-9.
Zaferman, M.L. & Serebrov, L.1.(1989) On fish injuries when escaping through the trawl mesh. ICES, CM/989/B:/8.
Zavala-Carnin, L.A. (1986) Predadores y areas de occurrencia de listado iKatsuwonus pelamis L.): revisionde estudios sobre contenido estomacal. In: Proceedings of the ICCA T Conference on the InternationalSkipjack Year Program (eds Symons, P.E.K., Miyake, P.M. & Sakagawa, G.T.), pp. 291-5. ICCAT,Madrid.
Zhang, X.M. & Arimoto, T. (1993) Visual physiology of walley pollock (Theragra chalcogramma) inrelation to capture by trawl net. ICES Mar. Sci. Symp., 196, 113-16.
Zhujkov, A. Vu. (1995) Fast- and slow-learning individuals: an overflow in terms of behavioural ecologyand the theory of learning. Bioi. Adv. Current Bioi., 115 (4), 396-405.
Zhujkov, A. Vu. & Pyanov, A.I. (1993a) Differences in behaviour of fish with different learning ability asdemonstrated with a model of a trap net. J. Ichthyol., 33 (9), 141--6.
Zhujkov, A. Vu. & Pyanov, A.I. (1993b) Interaction of individuals with different learning abilities in theexploratory behaviour of Hemigrammus caudovittatus (Characinidae). Russ. J. Aquat. Ecol., 2 (2), 1314.
Zhujkov, A. Vu. & Trunov, V.L. (1994) Interspecific and intraspecific comparisons of motor activity andlearning in fish. J. Ichthyol., 34 (6), 152-3.
Zijlstra, J.1. & Boerema, L.K. (1964) Some remarks on effects of variations in fish density in time and spaceupon abundance estimates, with special reference to the Netherlands herring investigations. int. Coun.Explor. Sea Rep., 155,71-3. .
0stvedt, 0.1. (1965) The migration of Norwegian herring to Icelandic waters and the environmentalconditions in May-June, 1961-1964. FiskDir. Skr. Ser. Havunders., 13 (8), 29-47.

Index
abiotic factors 27-44, 86abundance estimates 257abundance indices 219
see also catch per unit of effortavoidance influence 235correction 193-5mixed-species schools 230-32
acoustic shadowing 256-7acoustic surveys 251-73, 278, 284acoustics, school organisation 71active space 49adaptive sampling 279-80aerial surveys 6, 276-9, 284age
catchability 214composition 5depth-dependent distribution 42floating object association 135, 143school structure 85
age-length key, aggregation influence 232-':5age-structured models 179-82, 286age-structured stock assessment (ASA) models
180-82,200,204,214-15,286aggregation 249
aerial surveys 278annual changes 227-30lunar phase influence 226-7pheromones 47population dynamic models 215-35target strength 255
aggregation curve 185Agulhas Bank horse mackerel 42, 214alarm substances 164Alaska pollock 13Alaskan walleye pollock 94albacore 14, 132, 168,202,242All-Union Conference 4ambient noise 102-3, 126American plaice 34, 45American shad 85amplitude discrimination 116
anaerobic metabolism 34anchoveta 101
catch 10depth 42dissolved oxygen 35mixed-species schools 89, 93school structure 86seasonal migration 23stock collapse 186, 188
anchovy .see also Northern anchovyaggregation 228-9Cape anchovy 281, 282circadian cycles 224European anchovy 12packing density 80predator effects 53salinity 33school shape 81schooling 59seasonal migration 24spawning grounds 32vessel avoidance 261world catch 13
annual changes; aggregation 227-30annual egg production method (AEPM) 280annual larval production method (ALPM) 280Arauchanian herring 12Arctic cod 27ASA see age-structured stock assessmentassociation 128-58associative behaviour 133-58, 236-9Atlantic cod 34, 275Atlantic herring
catch 11-12schooling 59seabed 42
Atlantic mackerelcatch 12tidal cycle 39
Atlantic menhaden

340 Index
schooling 59seasonal migration 23--4
Atlantic silverside 59, 63, 86attack abatement 61attraction 128-58,236-9auditory detection, floating objects association
153autocorrelation distance 94aversive learning 159, 169avoidance 102-27
abundance indices 235 'gear 3, 124-5, 169, 270instruments 269-70learning 159model 263stock assessment 258-70vessels 117-19, 168,258-67,272-3
baitattraction to 131-3, 236movemerit 133
Bali sardinella 13ball packing 84Baltic herring 240
dissolved oxygen 35light attraction 129spawning 64-5
basin approach 192basin model 46beach-seine surveys 276behaviour studies, history 1-5behavioural ecology 1-2,4-5Benguela pilchard 27big gulp hypothesis 41bigeye tuna 14, 50
bait attraction 132circadian variation 206-7dissolved oxygen 34floating object association 141night-time swimming depth 37seamounts 42
billfishes, catch 14biomass dynamic models 174biomass quantification 7biotic factors, habitat selection 44-53birds
predation 53tuna association 156
bivariate detection function 278blackchin shiners 95blue whiting 13, 18, 27, 235
blueback herring 116bluefin tuna 234, 244boat-log effect 222body length, floating objects association 141, 151body length-dependence 35bongo nets 280bonitos 14Bonneville ciscoes 37bottom depth 41--4bottom trawl 6bream 168brook sticklebacks 164bullet tuna \4
California Vertical Egg Tow (CaIVet) 280Californian sardines 89CalVet see California Vertical Egg TowCape anchovy 28 I, 282Cape horse mackerel 268-9capelin
catch 12Doppler shift 259, 263habitat selection 22packing density 79-80range excursion 26schools 47, 65-6seabed 42semelparity 57spawning grounds 30-31surveys 278vessel avoidance 263
capture-recapture 282--4cardiac conditioning 115, 117carp 66, 168catch per unit of effort (CPUE) 175-7, 193, 195,
212,215-17,248,286,287gLM 209light intensity 37mixed-species schools 230-31',sardine 23surplus models 202, 203--4tuna 223, 236-7weekly changes 225, 226
catch-effort models see surplus-productionmodels
catch-effort relationship 248catchability 6, 249
aggregation influence 215-30circadian variation 204-8habitat selection influence 183-215seasonal variability 200-204

spatial variability 208-14yearly variability 183-200
catching efficiency 121cavitation noise 104chemical stimuli 132, 171, 236Chilean jack mackerel 10-11, 17, 221chub mackerel 11.circadian habitat selection 23circadian migration 37circadian variation 235
catchability 204-8patchiness 224-6vessel avoidance 265
cleaning station hypothesis 146closed programmes 2clustering 94-5cod
acoustic surveys 253Arctic cod 27Atlantic cod 34, 275direction detection 110-11distance detection 112distribution 26frequency range 114, 115gear avoidance 270nearest neighbour distance 72Northern cod 188playback experiments 119-20reaction to noise 11 7school structure 75vessel avoidance 168,258,260,263,264,267,
268vessel noise 121
coho salmon 164, 171-2cohort analysis 180comfortability stipulation hypothesis 148-9, 154communication 95-9 .communities 48compact airborne spectrographic imager (CASI)
7, 278-9comparative psychology Icompetition
among fishing units 221--4interspecific 48intraspecific 67
competitive exclusion principle 48concentration of food supply hypothesis 146,
148, 158conditioning 159, 164confusion effect 61, 63, 93conspecifics 44-7
Index 341
contagious distribution hypothesis 155continuous plankton recorders (RPCs) 280continuous underway fish egg sampler (CUFES)
280cooperative fishing 221--4CPUE see catch per unit of effortcritical school biomass 151current, habitat selection 38--40
dace 48daily egg production method (DEPM) 280-81daily fecundity reduction method (DFRM) 280daily production method 5density
distribution function 254yearly changes 183~93 .
density-dependence 184,203,234density-dependent habitat selection (DDHS)
44-6depth
depth-dependent distribution 41-2habitat selection 40-1
diffusion models 45dilution effect 61direction detection 110-12dissolved oxygen
habitat selection 33-6school structure effects 86
distance detection 110-12distance discrimination 168distribution function 254diurnal predation 53 .diurnal variation
aerial surveys 278target strength 255
DNA fingerprinting 2dolphins 18, 91, 93, 154-6, 158Doppler shift 259double-oblique tow 280drag 64
echo integration 252, 253, 256echo sounders 8, 107echointegration 7ECOPATH model 52eels, lunar rhythms 23egg deposition method (EDM) 280egg surveys 5, 279-81emigration 24ethology IEuropean anchovy 12

342 Index
European minnow 58, 59,62, 163European pilchard 12extinction problem 256
facultative schoolers 57FADs see fish aggregating devicesFAD congress 3-4fathead minnow 160, 163-4feeding 3
see also foraging; preyconcentration of food supply hypothesis 146,
148, 158school size 66-7school structure 85schooling benefits 63
filtering mechanism 64Fish Acoustic Sciences Technology (FAST)
Group 4fish aggregating devices (FADs) 133-5, 137-9,
141-54, 157 . ~
attraction 237-8homing behaviour of tuna 285tuna 91
Fish Technology and Fish Behaviour (FTFB)Group 4
Fishing Gear Technology Working Group 4flash expansion 61, 84flat-bottom basin hypothesis 46-7flatiron. herring, mixed-species schools 89flight transmission speed 61floating objects 44,128
see also fish aggregating devicesassociation 18, 133-54attraction 237light attraction 128tuna 91; 93
flying fish 3, 15, 134following response 59food finding hypothesis 155, 158foraging 131
see also feedinginteractive learning 172DV photoreception 37
fountain effect 61, 84, 123fractal distribution 94-5French grunts 171frequency discrimination 116frequency range 113..:16frigate tuna 14front priority rule 77frontal gradients 29
Garland experiment 5gear
avoidance 3, 124-5, 169,270learning about 167-70saturation 236surveys 274-6, 284
general linear models (GLM) 177,207,209,236,239
generalised, additive models 52generalised linear models (GLM) 176-7gerieric-Iog hypothesis 149, 154, 157genetic basis for schooling 57-8geometric patterns 73-5geostatistical model 280gill net fisheries, circadian variation 207gilt sardine 43
mixed-species schools 89salinity 32seasonal migration 24
GLM see general linear modelsgoldfish 160, 171growth estimates
aggregation influence 232-5habitat selection influence 214
growth overfishing 6grunts 53, 171gudgeon 48Gulf Menhaden 12guppy
predator discrimination 162schooling behaviour 57-8, 59schooling preferences 78Trinidadian guppy 160
habitat, yearly changes 183-93habitat selection 3, 21-55, 183-215
acoustic surveys 252-4habituation 159haddock
amplitude discrimination 116bait attraction 132thermocIine 30vessel avoidance 258, 260, 264, 268
hearing 99, 108-16, 126-7, 153herring
abundance estimates 257acoustic surveys 253; 271-2aerial survey 276-7age 5Arauchanian herring 12Atlantic herring 11-12, 42, 59

avoidance 124, 125,235Baltic herring 35, 64-5, 129, 240blueback herring 116circadian variation 204-5direction detection 110feeding behaviour 49flatiron herring 89frequency range 114, 115fungal infection 78gear avoidance 270hearing 99learning 163light attraction 129-30nearest neighbour distance 72, 75net burst experiments 241North Sea herring 38, 269Pacific herring 33, 42, 47, 119packing density 79-80playback experiments 119-20prey 52purse seiners 100school shape 82-3school size 67-8seasonal migration 24-6shoals 60social facilitation 171sonar avoidance 269-70spatial distribution 75spawning grounds 31, 32, 64-5stock collapse 186swimbladders 41, 254thread herring 66, 168, 169vessel avoidance 258,260,261,263'--4,265,
267-8heterogeneous stimuli summation 166homing behaviour 32,147,171,172,173,244,
285homogeneity 87-9horizontal migration
dissolved oxygen 35prey selection 52
horse mackerel 29, 205, 206see also Cape horse mackerelAgulhas Bank 42, 214Cape horse mackerel 268-9circadian cycles 224cooperative fishing of 222depth-dependent distribution 42growth estimate 214mixed-species schools 231swept volume 275
Index 343
hydroacoustic assessment method 251-2hydroacoustic instruments 15-17hydroacoustic surveys 102hydroacoustics 7hydrodynamic advantage 63'--4, 88
IBM see individual-based modelsichthyoplankton surveys 279-82ideal free distribution (IFD) 3, 44-6, 48imaging LIDAR 277imprinting 32, 159, 171, 173individual preferences, within schools 77-8individual recognition 172individual-based models (IBM) 45, 71, 77innate schooling behaviour hypothesis 155inshore-offshore migration 202instantaneous habitat selection 22instrument avoidance 269-70Inter-American Tropical Tuna Commission
(lATTC) 136, 139,238interactive learning 167, 172International Commission for the Conservation
of Atlantic Tunas (lCCAT) 141International Council for the Exploration of the
Sea (ICES) 3, 4, 5International Fishing Technology Working
Group 4interspecific competition 48intraspecific competition 67intraspecific diversity, learning influence 244-7intrinsic aggregation rate 237iteroparity 57
jack mackerelChilean jack mackerel ID-ll, 17,221lunar phase 278schooling 59seasonal variability 202vessel avoidance 261, 265
Japanese arnberjack, catch 13Japanese anchovy 11, 36Japanese pilchard IIJapanese sardine 24, 52, 84, 192, 241Japanese Spanish mackerel 14
Kawakawa 14kernel smoothing method 278key stimuli 164-7killifish 61kin recognition 241

344 Index
larval surveys 279-81lateral eye-like spots 166lateral line 97,98, 101learning 159-73
in schools 66stock assessment influence 239-49
leks 66length-dependence relationship 29length-frequency distribution 232LIDAR see light detecting and ranginglight 122-3, 127
attraction to 17, 128-31, 236avoidance 266--7intensity 36--8,40, 96
light detecting and ranging (LIDAR) 6, 277, 284line fishing 19-20linear production model 230linearity principle 256lingcod 275log association see floating objects associationlog boat tactic 128-9, 148log fishing 139, 145longlining 19-20, 29
attraction influence 236bait attraction 132circadian variation 206--7saturation 216surveys 276
longtail tuna 14lunar influence 267lunar phase 37
aerial surveys 278aggregation influence 226--7
lunar rhythms 23lures 133
mackerelsee also horse mackerel; jack mackerel
.Atlantic mackerel 12, 39chub mackerel IIPacific mackerel 265spatial distribution 73spawning 66visual stimuli 124Western mackerel 26, 33, 39, 94world catch 14-15
Marquesan sardine 36maximum effort 174maximum surplus 174maximum sustainable yield (MSY) 174, 196--8,
230, 248
meeting point hypothesis 150---54, 157memory traces 167menhaden
Atlantic menhaden 23-4, 59circadian habitat selection 23Gulf Menhaden 12salinity 32schooling 64tagging 5
midwater trawling 6, 18-19, 275avoidance 124-5,235circadian variation 204-5fish escapes 240
migration 21-55, 64learning 171-2,173schooling 88
minimum approach distance 71minnow 48, 73
European minnow 58, 59,62, 163fathead minnow 160, 163-4
mixed-species schools 88, 89-93, 230---2MOCNESS see multiple opening-closing net
and environmental sensing systemmortality 6,28, 182,214-15,240motivational status 67, 88moving mass dynamic hypothesis 80MSY see maximum sustainable yieldmullet 270multiple-Slpening-closing net and environmental
sensing system (MOCN ESS) 280
naked goby 56narrow barred Spanish mackerel 14 .natal homing 32, 171, 173, 244natural selection 100---10 I .nearest neighbour distance 59, 71-2, 75, 78, 79,
88night
foraging 131light attraction 128trawling 124vessel avoidance 266--7
noiseambient 102-3,126fish reactions to 116--22fishing gear 168vessels 103-8
North Sea herringpassive transport 38vessel avoidance 269
Northern anchovy 43, 278

aerial surveys 278mixed-species schools 89prey 49school shape 82schooling 59vertical migration 36
Northern bluefin 28, 52Northern cod 188Northern sardine 186
object-oriented models 71,77,78obligate schoolers 57obstinate reproductive strategy hypothesis 32offshore sea ranching 128olfaction 160
coho salmon 172floating objects association 153odour of fishing gear 168prey detection 49-50
Olsen model 117-19omnidirectional multibeam sonar 8one-trial learning 163, 168, 239, 283ontogeny
antipredator behaviour 160schooling 58-9
open programmes 2, 54optical plankton counter (OPe) 280optimal foraging theory Ioptimalitytheory 2optimum effort 174optomotor response 124orange roughy 47, 247orientation 39--40; 255, 272otoliths 108-9, 126overexploitation 289overfishing 6,24,99-100, 186, 188,244,247
Pacific bonito 66Pacific herring
pheromones 47playback experiments 119salinity 33seabed 42
Pacific mackerel 265Pacific sardine 282Pacific whiting 269packing density 78-81, 85, 86, 101, 257packing patterns 73-5paradise fish 160, 161, 162-3, 166, 167, 168-9parasitism 2, 3passive avoidance 168-9
Index 345
passive gear, avoidance 169passive transport 38-9patchiness 216-21
circadian changes 224-6ichthyoplankton surveys 281-2
patchiness in distribution 94pelagic trawling see mid water trawlingPeruvian anchovy see anchovetaPeruvian hake 35pheromones 47, 164phototaxis 129physoclists 41, 253pilchard 27, 73, 224plasticity 2playback experiments 119-20, 268pole-and-line 19,20,29
attraction influence 236bait attraction 133cooperative fishing 222tuna fisheries 128
pollack 44, 253population modelling 174-250
associative behaviour 236-9attraction 236-9
population parameters, habitat selectioninfluence 183-215
predation/predatorsavoidance 3, 57,97-8, 155circadian 226floating objects association 135, 151habitat selection 52-3inspection visit 160, 163learning 159-70pressure 101school size 66-7school structure effects 84-5schooling effects 88-9schooling function 60-3shelter from predator hypothesis 146-7, 158
pressure 40prestratification 279prey, habitat selection 48-52production models see surplus-production
modelsproximate factors 22pumpkinseed sunfish 37purse seining 15-18, 20, 29, 275--fJ
avoidance 124circadian variation 205-6cooperative fishing 222fish escapes 240

346 Index
herring 100log association 145
radiometric LIDAR 277rainbow trout 37, IIIrandom sampling 279range collapse 46, 185, 186recruitment overfishing 6reefs 43--4replicability, acoustic survey estimates 271-2reproduction, schooling 64-6reproductive isolation 57Reynolds number 58rise and glide swimming strategy 41, 254rosy barb 168RPCs see continuous plankton.recordersrumpons 134
saithe 13, 43--4light attraction 129nearest neighbour distance 72, 78reefs 43--4spatial distribution 75subgroups 86vessel noise 121
salinity, habitat selection 32-3.salmon
circadian variation 207coho salmon 164, 171-2lunar rhythms 23
sampling gear avoidance 270sand goby 162sand lance 13, 60SAR 279sardine
gear avoidance 3gilt sardine 24, 32, 43, 89Japanese sardine 24, 52, 84, 192, 241learning 164Marquesan sardine 36migration 26Northern sardine 186Pacific sardine 282predator effects 53salinity 32seasonal migration 23southern Canary current 190Spanish sardine 42spawning grounds 22-3vessel avoidance 261
sardinella
Bali sallliinella 13catch 12circadian variation 205depth-related distribution 41-2floating objects 134light intensity 37salinity 32schooling 85temperature effects 28turbidity 36
saturation of fishing unit 215-16scads 12schooling I, 3, 56-101
age composition 5capelin 47companion hypothesis 146dissolved oxygen 35fidelity 241school definition 56-7school organisation 68-89school shape 81--4, 101school size 66-8school structure 84-9target strength 255
SCUBA egg deposition surveys 279sea bed 41--4seamounts 42, 149search model 218seasonal habitat selection 23--6seasonal migration 52, 54seasonal variation
avoidance 235catchability 200-204patchiness 224-6school structure 86
selectivity curve 184-5selfish herd principle 62-3semelparity 57semi-lunar rhythms 23sex, schools 47, 65--6shadow method 69-70sharks 112, 134, 135shelf platforms 43shelf-break 42shelter from predator hypothesis 146-7, 158shiner 63shoaling 59--60, 63, 163silversides 59, 63, 64, 86simulations 7size of fish .
mixed-species schools 91, 93

schools 47segregation 77, 88
skipjack tuna 14-15,68dissolved oxygen 34distribution- 33floating objects association 137, 139, 141, 143,
144-5,148,151-2migration 40night-time swimming depth 37seamounts 42tagging 283thermoeline 29upwelling 209
snowballing effect 150-51social aggregation 272social behaviour, acoustic surveys 254-7social facilitation 66,159,164,169,171. 172,
173,244sociobiology 2sonar 8,16-17,100,107,259,265,269-70sound intensity 263South American pilchard 10-11southern bluefin 28, 278, 283Spanish sardine 42spatial analysis 220-21spatial distribution 73-5, 94-5spatial habitat selection 22-7spatial reference hypothesis I54spatial references 147spatial variability, catchability 208-14spawning
habitat selection 30-32pheromones 47salinity 32-3
spawning groundscolonisation 247herring 64-5learning 171-2sardine 22-3
split-beam sounders 259-60sprat 39, 261sticklebacks 66, 76-7stochastic dynamic modelling 2stock abundance, fishing influence 183-93stockassessment 274-84
acoustic surveys 251-73history 5-8population dynamic models 174-250
stock identification, learning influence 244-7stock-recruitment relationship 182-3stout-body chrornis 171
Index 347
structural models 6, 247-8subgroups 77, 86substitute environment hypothesis 146substocks 244-5, 247sunfish 52surface temperature, aerial surveys 278surplus-production models 6, 174-9, 195-200,
230-31, 237, 239, 240-44, 247-8swept volume 275swept-area method 6swimbladder
acoustic surveys 253-4depth effects 40-41echoes 16sound sensing 109, J10, 113, 127
swordfish 37, 50, 132, 226, 236synchrony 76-7, 87-9
tagging 5, 260, 282-4target strength 254-5temperature
aerial surveys 278burst speed 34dissolved oxygen relationship 33, 35habitat selection 22, 27, 28-32, 54migration 39spawning 31,33thermoregulation 29·vertical distribution40
temporal habitat selection 22-7temporal structure of sound 116territoriality 2Itetra 168, 169thermocline 29-30, 266thermoregulation 29thread herring 66, 168, 169tilt angle 255topsmelt, spatial distribution 73Trafalgar effect 61, 97trawls, vessel avoidance 267-9trigger fish 191Trinidadian guppy 160tuna 249-50
see a/so bigeye tuna; skipjack tuna; yellowfintuna
attraction 237bait attraction 131, 132-3bird association 156bluefin tuna 234, 244chemical cues 49-50clustering 94

348 Index
cooperative fishing of 222, 223diffusion models 45dolphin association 18, 91, 93, 154-6lloating objects association 44, 133, 135,137-
54, 157-8, 239frigate tuna 14habitat selection 27, 54-5homing behaviour 147, 285light attraction 128, 130longlining 19longtail tuna 14migration 39-40mixed-species schools 91, 93, 231pole-and-line fishing 20prey 50purse seining 17-18salinity 33saturation 216seamounts 42temperature gradients 39temperature selection 28therrnocline 29upwellings 40vertical migration 41vessel noise 121whale association 156-7world catch 14-15
turbidity 36turbot 270turbulence 38-40
ultimate factors 22upwellings 35, 36, 38-40, 43, 209UV photoreception 37
vertical distribution/migration 40-41, 54aerial surveys 278body length-dependence 35circadian 23light attraction 129-30light intensity 36-8physoclists 41predator effects 53prey 50therrnocline 29-30walleye pollock 30
vesselsavoidance 117-19, 168,258-66,272-3
Compiled by Indexing Specialists, Hove, UK
light avoidance 266-7noise 103-8, 116-22
vigilance 63virtual population analysis (VPA) 180, 181,200,
212, 247viscosity 58vision 96-8, 101, 122-6visually elicited avoidance 122-6volumetric LIDAR 277
walleye pollock 30, 50, 94,123,125,172,255water transparency 36Weberian ossicles 113Western mackerel
clustering 94currents 39migration 26salinity 33
whale sharks 156-7whales 156-7white perch 61whitefish 23wind stress 27world catch
large mackerel 14-15small species 10-13tuna 14-15
wrasse 270
yellow perch 68, 86yellowfin tuna 14-15, 209
bait attraction 131-2cooperative fishing of 223dissolved oxygen 34dolphin association 154-6lloatingobjectsassociation 135, 137, 139, 141,
143-5, 149homing behaviour to FADs 147migration 40night-time swimming depth 37seabed 43seamounts 42therrnocline 29
yield per recruit 179-82
zebra danio 164zeitgeber 23