Identification of subpopulations in pelagic marine fish species using amino acid composition
11
ECOSYSTEMS AND SUSTAINABILITY Identification of subpopulations in pelagic marine fish species using amino acid composition Isabel Riveiro • Ca ´stor Guisande • Paula Iglesias • Gualtiero Basilone • Angela Cuttitta • Ana Gira ´ldez • Bernardo Patti • Salvatore Mazzola • Angelo Bonanno • Alba-Ruth Vergara • Isabel Maneiro Published online: 7 April 2011 Ó Springer Science+Business Media B.V. 2011 Abstract The spatial stock complexity of marine fish species requires that population structure is taken into account in fisheries management. The aim of this study was to determine whether the amino acid composition (AAC) of the adult fish allows the identification of subpopulations within the stock. During a cruise in November 2003 along the entire Mediterranean coast of Spain, individuals were collected of the following pelagic species: Sardina pilchardus, Sardinella aurita, Engraulis encrasico- lus, Trachurus trachurus, Trachurus mediterraneus, Scomber scombrus and Scomber colias. Individuals of S. pilchardus and E. encrasicolus were also collected from the waters of the Strait of Sicily in 2002 and 2003. The AAC of the fish eyes was seen to be species specific, and therefore, the differences in AAC among species may be based on inherited characters. Moreover, a clear differentiation was seen between the Spanish and Sicilian populations of S. pilchardus and E. encrasicolus. Furthermore, in the Spanish waters of the Mediterranean Sea, discrimi- nant analysis revealed a substantial separation between the northern and southern subpopulations of S. pilchardus, S. aurita and E. encrasicolus. Temporal variations in AAC within species in each area were lower than the spatial variations observed Guest editors: Graham J. Pierce, Vasilis D. Valavanis, M. Begon ˜a Santos & Julio M. Portela / Marine Ecosystems and Sustainability I. Riveiro (&) Instituto Espan ˜ol de Oceanografı ´a, Centro Oceanogra ´fico de Vigo, Subida a Radio Faro 50, 36390 Vigo, Spain e-mail: [email protected] C. Guisande Facultad de Ciencias del Mar, Universidad de Vigo, Lagoas-Marcosende, 36200 Vigo, Spain P. Iglesias Instituto Espan ˜ol de Oceanografı ´a, Centro Oceanogra ´fico de La Corun ˜a, Paseo Marı ´timo Alcalde Francisco Va ´zquez n° 10, Apdo. 130, 15001 La Corun ˜a, Spain G. Basilone Á A. Cuttitta Á B. Patti Á S. Mazzola Á A. Bonanno Consiglio Nazionale delle Ricerche, Istituto per l’Ambiente Marino Costiero, Sede di Mazara del Vallo, via L. Vaccara 61, Mazara del Vallo, Trapani, Italy A. Gira ´ldez Instituto Espan ˜ol de Oceanografı ´a, Centro Oceanogra ´fico de Ma ´laga, Puerto Pesquero s/n, Apdo. 285, Fuengirola, 29640 Ma ´laga, Spain A.-R. Vergara Instituto de Investigaciones Marinas (CSIC), Calle Eduardo Cabello 6, 36208 Vigo, Spain I. Maneiro Facultad de Ciencias, Universidad de A Corun ˜a, Campus da Zapateira, 15008 La Corun ˜a, Spain 123 Hydrobiologia (2011) 670:189–199 DOI 10.1007/s10750-011-0663-y
Transcript of Identification of subpopulations in pelagic marine fish species using amino acid composition

ECOSYSTEMS AND SUSTAINABILITY
Identification of subpopulations in pelagic marine fishspecies using amino acid composition
Isabel Riveiro • Castor Guisande • Paula Iglesias • Gualtiero Basilone •
Angela Cuttitta • Ana Giraldez • Bernardo Patti • Salvatore Mazzola •
Angelo Bonanno • Alba-Ruth Vergara • Isabel Maneiro
Published online: 7 April 2011
� Springer Science+Business Media B.V. 2011
Abstract The spatial stock complexity of marine
fish species requires that population structure is taken
into account in fisheries management. The aim of this
study was to determine whether the amino acid
composition (AAC) of the adult fish allows the
identification of subpopulations within the stock.
During a cruise in November 2003 along the entire
Mediterranean coast of Spain, individuals were
collected of the following pelagic species: Sardina
pilchardus, Sardinella aurita, Engraulis encrasico-
lus, Trachurus trachurus, Trachurus mediterraneus,
Scomber scombrus and Scomber colias. Individuals
of S. pilchardus and E. encrasicolus were also
collected from the waters of the Strait of Sicily in
2002 and 2003. The AAC of the fish eyes was seen to
be species specific, and therefore, the differences in
AAC among species may be based on inherited
characters. Moreover, a clear differentiation was seen
between the Spanish and Sicilian populations of
S. pilchardus and E. encrasicolus. Furthermore, in the
Spanish waters of the Mediterranean Sea, discrimi-
nant analysis revealed a substantial separation
between the northern and southern subpopulations
of S. pilchardus, S. aurita and E. encrasicolus.
Temporal variations in AAC within species in each
area were lower than the spatial variations observed
Guest editors: Graham J. Pierce, Vasilis D. Valavanis,
M. Begona Santos & Julio M. Portela / Marine Ecosystems
and Sustainability
I. Riveiro (&)
Instituto Espanol de Oceanografıa, Centro Oceanografico
de Vigo, Subida a Radio Faro 50, 36390 Vigo, Spain
e-mail: [email protected]
C. Guisande
Facultad de Ciencias del Mar, Universidad de Vigo,
Lagoas-Marcosende, 36200 Vigo, Spain
P. Iglesias
Instituto Espanol de Oceanografıa, Centro Oceanografico
de La Coruna, Paseo Marıtimo Alcalde Francisco
Vazquez n� 10, Apdo. 130, 15001 La Coruna, Spain
G. Basilone � A. Cuttitta � B. Patti �S. Mazzola � A. Bonanno
Consiglio Nazionale delle Ricerche, Istituto per
l’Ambiente Marino Costiero, Sede di Mazara del Vallo,
via L. Vaccara 61, Mazara del Vallo, Trapani, Italy
A. Giraldez
Instituto Espanol de Oceanografıa, Centro Oceanografico
de Malaga, Puerto Pesquero s/n, Apdo. 285, Fuengirola,
29640 Malaga, Spain
A.-R. Vergara
Instituto de Investigaciones Marinas (CSIC), Calle
Eduardo Cabello 6, 36208 Vigo, Spain
I. Maneiro
Facultad de Ciencias, Universidad de A Coruna, Campus
da Zapateira, 15008 La Coruna, Spain
123
Hydrobiologia (2011) 670:189–199
DOI 10.1007/s10750-011-0663-y

among areas for each species, probably reflecting the
influence on the AAC of the contrasting environ-
mental characteristics of each area. Our results
indicate that the ACC of the eyes in adult fish is a
good tool for discriminating among subpopulations in
pelagic marine fish species.
Keywords Pelagic fishes � Amino acid
composition � Population discrimination
Introduction
Fisheries management is usually based upon stock
units. A fish stock can be defined as a population
adapted to a particular environment, having genetic
differences from other stocks as a consequence of this
adaptation (MacLean & Evans, 1981).
Fish stock discrimination has been measured in a
number of ways (Pawson & Jennings, 1996; Cadrin
et al., 2005). Some of these stock identification
techniques have been questioned, as they reflect
environmental distinctiveness rather than reproduc-
tive isolation (see Swain & Foote, 1999). Genetic
studies often fail to support the stock differentiation
suggested by morphologic, meristic, physiologic and/
or ecologic variability (Ryman et al., 1984; Kinsey
et al., 1994; Turan et al., 1998). However, these
methods reveal that not all individuals within the
stock are affected by the same environmental condi-
tions and, therefore, failure to recognize or to account
for the spatial complexity of subpopulations within a
stock may lead to the erosion of subpopulation units,
with unknown consequences on stock viability
(Stephenson, 1999).
The recognition of this complex spatial structure
within areas, traditionally assumed to contain a single
stock, led to the ‘dynamic population structure
concept’ (Smith & Jamieson, 1986), which suggests
that most fish species exist as semi-independent but
not completely isolated breeding units. This concept
gained support among biologists against that of a pure
or discrete stock (Spanakis et al., 1989). This
dynamic population model is the equivalent to
considering the dynamic of marine fish populations
from a metapopulation perspective (MacQuinn, 1997;
Bailey et al., 1999; Stephenson, 1999; Thorrold et al.,
2001; Smedbol & Wroblewski, 2002).
Andrewartha & Birch (1954) suggested that pop-
ulations are structured in ‘local populations’ con-
nected by migration. Levins (1970) developed this
concept by coining the term metapopulation to
describe a population consisting of many local
populations.
In some marine fish species, such as herring
(MacQuinn, 1997) and sardine (Carrera & Porteiro,
2003), a new perspective of metapopulation, different
from the classical concept of Levins (1970), has been
proposed to explain population dynamics. Metapop-
ulation is a system of discrete local populations each
of which, to a large extent, determines its own
internal dynamics, but with a degree of identifiable
and nontrivial demographic influence from other
local populations through the dispersal of individuals,
according to the definition of Kritzer & Sale (2004).
These authors put less emphasis on the extinction
dynamics and defined metapopulation according to
spatial structure (and the role that interpopulation
exchange plays in local population size and stability).
A necessary condition for metapopulation persis-
tence in the face of unstable subpopulations is
asynchronous local dynamics (Hanski, 1999), which
means that subpopulations may experience different
environmental conditions. This indicates that the
factors structuring habitat suitability may vary among
subpopulations. Therefore, for a correct stock man-
agement it is necessary to identify subpopulations
within the stock that are affected by different
environmental conditions, and to manage these as
discrete groups.
The problem is to find a methodology that allows
the discrimination of subpopulations within the stock
(Waldman, 1999) and, for that reason, some ecolo-
gists may remain unimpressed by the metapopulation
concept (Hanski, 1999). Fish subpopulations are
difficult to define from traditional fisheries data, or
to discriminate by conventional stock identification
techniques (Stephenson, 1999). The methodology
must be based on inherited characters, which also
must reflect environmental distinctiveness and must
be species specific (Booke, 1999). To discriminate
stocks or subpopulations of fishes, the signal from
among-stock variation must exceed the noise of
within-stock variation (Waldman, 1999).
The amino acid composition (AAC) of the eggs
and larvae of marine fishes have been successfully
used to discriminate among species and spawning
190 Hydrobiologia (2011) 670:189–199
123

areas within species (Riveiro et al., 2003). One of the
main problems of the study of biochemical compo-
sition is the finding of correct part of the fish body to
analyse, as many fish change their biochemical
composition rapidly, depending on the characteristics
of the geographic area.
The aim of this study was to determine whether the
AAC of some of the tissues of adult fish allows the
identification of subpopulations in several pelagic fish
species in the Mediterranean Sea.
Materials and methods
Sampling collection
To determine the best part of the fish body for
discriminating among species, individuals of the
species Sardina pilchardus and Engraulis encrasicolus
were collected in the Sicilian Channel on-board fishing
vessels in March 2002 (Fig. 1). The liver, blood, heart
and eyes of males and females were extracted from the
fishes and transferred to ultracentrifuge plastic vials
and immediately frozen at -32�C. The number of
individuals analysed is shown in Table 1.
For the identification of subpopulations, individu-
als of the species Sardina pilchardus, Trachurus
trachurus, Trachurus mediterraneus, Scomber scom-
brus, Scomber colias, Engraulis encrasicolus and
Sardinella aurita were collected in November–
December 2003 during the ECOMED survey along
the Spanish Mediterranean coast (Fig. 1, Table 1).
Two areas were considered for collecting samples:
the northern and southern areas separated by San
Antonio Cape. Both areas have been shown to be
potentially favourable habitats for fish reproduction,
but with contrasting conditions (Agostini & Bakun,
2002).
Individuals of the species E. encrasicolus and S.
pilchardus were collected in December 2003, again
on-board fishing vessels in the same areas as in the
previous sampling in the Sicilian Channel (Fig. 1,
Table 1). The eyes of males and females were
extracted from the fishes and transferred to ultracen-
trifuge plastic vials and immediately frozen at
-32�C. The number of individuals analysed by
species and group origins is shown in Table 1.
Analyses of amino acids
Total amino acids were analysed by high-performance
liquid chromatography (HPLC) using a Waters Alli-
ance System, a Waters 474 scanning fluorescence
detector and a Waters 15 X 3.9 Nova-Pack C18 column
following the method described by Van Wandelen &
Cohen (1997). The AAC was analysed using the
Waters AccQ-Tag� Chemistry Package. For the
hydrolysis procedure for AAC, eyes were introduced
in HCl 6 N at 114�C for 24 h. Afterwards, vials were
introduced in a desiccator with NaOH at 55�C in order
to dry the samples. For the derivatization procedure,
Fig. 1 Mediterranean Sea divided in arbitrary areas for this study and the sampling locations of each area (squares)
Hydrobiologia (2011) 670:189–199 191
123
samples were redissolved in HCl 0.1 N and ACCQ-
Fluor� Borate Buffer and AccQ-Fluor� Reagent were
added and samples were placed for 10 min at 55�C.
Conditions for amino acid separation for the mobile
phase were as follows: A (Aqueous buffer, AccQ-Tag
Eluent), B (acetonitrile), C (bidistilled water). A total
of 15 amino acids were analysed: aspartic acid (ASP),
serine (SER), glutamic acid (GLU), glycine (GLY),
histidine (HIS), arginine (ARG), threonine (THR),
alanine (ALA), proline (PRO), tyrosine (TYR), valine
(VAL), lysine (LYS), isoleucine (ILE), leucine (LEU)
and phenylalanine (PHE). Cysteine and methionine
were destroyed during hydrolysis with 6 N HCl while
amino acid standard H NCI0180 Pierce H was used for
the identification and quantification of amino acids.
Discrimination among subpopulations
To determine whether it is possible to discriminate
among subpopulations within species according to
the AAC of the adult tissues, a standard multivariate
discriminant analysis was applied to the amino acid
percentages (Guisande et al., 2006). The variables
that contribute most to sample differentiation were
identified by their correlation to the discriminant
functions and by a one-way ANOVA. The resultant
discriminant functions were used to classify the
individuals into samples, and the percentage of
individuals correctly classified into the original
sample was used to evaluate the classification success
rate. All calculations were performed using SPSS
software (SPSS Inc.).
Discriminant analysis has become a powerful tool
in biological research and stock identification and has
been successfully used to discriminate among spe-
cies, stocks or spawning areas in pelagic fishes
according to the AAC of the larvae (Riveiro et al.,
2003; Cuttitta et al., 2006), elemental composition in
fish otoliths (Geffen et al., 2003), fish parasites (Timi
et al., 2005; Marques et al., 2006), etc.
Results
Table 2 shows the results of the discriminant analysis
applied to the AAC of the different parts of the body
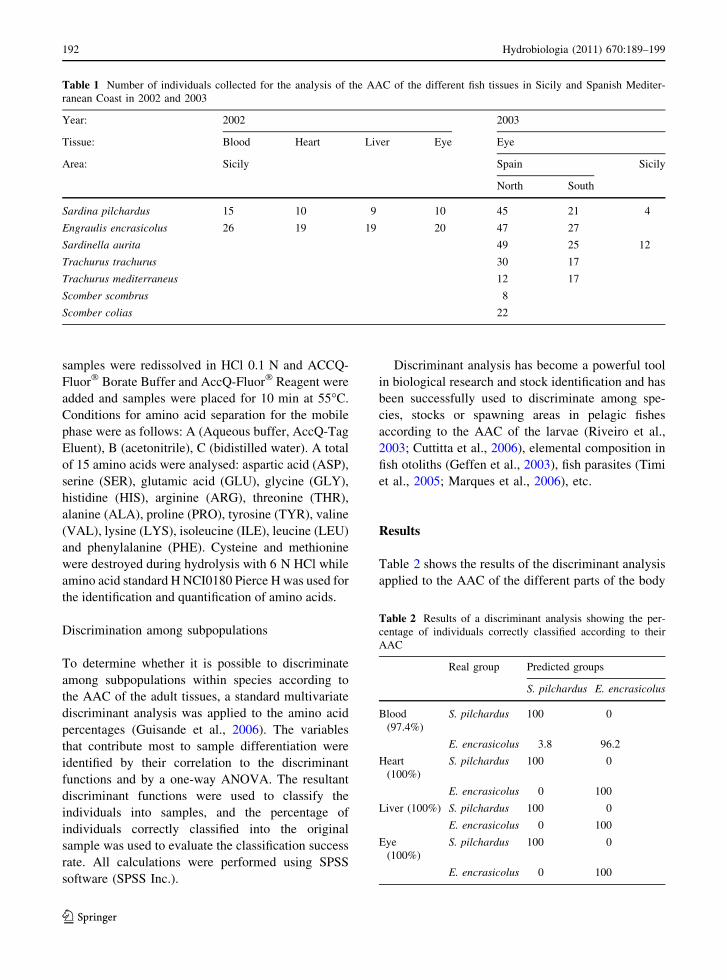
Table 1 Number of individuals collected for the analysis of the AAC of the different fish tissues in Sicily and Spanish Mediter-
ranean Coast in 2002 and 2003
Year: 2002 2003
Tissue: Blood Heart Liver Eye Eye
Area: Sicily Spain Sicily
North South
Sardina pilchardus 15 10 9 10 45 21 4
Engraulis encrasicolus 26 19 19 20 47 27
Sardinella aurita 49 25 12
Trachurus trachurus 30 17
Trachurus mediterraneus 12 17
Scomber scombrus 8
Scomber colias 22
Table 2 Results of a discriminant analysis showing the per-
centage of individuals correctly classified according to their
AAC
Real group Predicted groups
S. pilchardus E. encrasicolus
Blood
(97.4%)
S. pilchardus 100 0
E. encrasicolus 3.8 96.2
Heart
(100%)
S. pilchardus 100 0
E. encrasicolus 0 100
Liver (100%) S. pilchardus 100 0
E. encrasicolus 0 100
Eye
(100%)
S. pilchardus 100 0
E. encrasicolus 0 100
192 Hydrobiologia (2011) 670:189–199
123

of the adult fish from the Sicilian Channel in March
2002. It can be seen that the AAC of the blood was
not the best fish tissue for discriminating among
species, as the percentage of individuals correctly
classified for the sardine and the anchovy was not
100%. Nevertheless, the AAC of the liver, heart an
eyes were good indicators of the species, as they
allowed a perfect separation of the sardine and the
anchovy (Table 2).
Following these preliminary results, it was decided
that only fish eyes would be sampled, as this was the
easiest way to obtain samples without having to
dissect fish.
A discriminant analysis performed on the data of the
AAC of eyes collected in 2003 of S. pilchardus (S.p.),
S. aurita (S.a.), E. encrasicolus (E.e.), T. trachurus
(T.t.), T. mediterraneus (T.m.), S. scombrus (S.s.) and
S. colias (S.c.) from the Sicilian and Spanish coasts,
showed that it is possible to identify each fish species
according to their AAC (Fig. 2). The significant
functions were from 1 to 5 (Wilk’s lambda, P \0.005). The first two components of the discriminant
analysis explained 62.4 and 29.1% of variance,
respectively (Fig. 3). The percentage of fish correctly
classified according to their AAC represented 73.7% of
cases with cross validation (Fig. 3). Among the
different species studied, the major similarities were
found between T. trachurus and T. mediterraneus and
between S. pilchardus and S. aurita (Fig. 3). The AAC
of eyes mainly differs among species in the proportion
of histidine, glycine and valine.
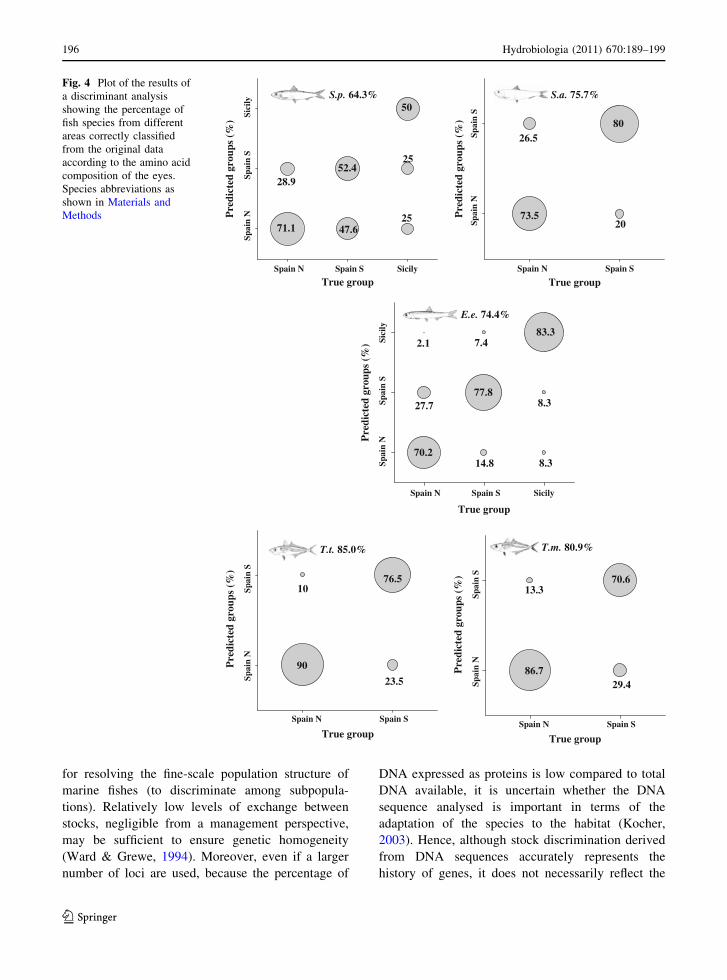
In a discriminant analysis performed on the AAC of
the eyes of adults collected in 2003 from different areas
of the Mediterranean coast of Spain (north and south)
and from the Sicilian coast (only S. pilchardus and E.
encrasicolus) (Table 3), the percentage of groups
correctly classified was 64.3% for S. pilchardus,
75.7% for S. aurita, 74.4% for E. encrasicolus, 85%
for T. trachurus and 86.9% for T. mediterraneus
(Fig. 4). It was not possible to perform discriminant
analysis for S. scombrus and S. colias, because
the samples of these species were only found in the
northern area of the Mediterranean coast of Spain. The
AAC of eyes mainly differs among species in the
proportion of glycine, proline and threonine for
S. pilchardus, serine, threonine and arginine for
S. aurita, tyrosine, serine and proline for E. encrasic-
olus, glycine, isoleucine and proline for T. trachurus
and tyrosine, serine and histidine for T. mediterraneus.
The use of AAC allows discriminating among
species and among areas within species: between the
species of the Sicilian and Spanish coasts (S.
pilchardus and E. encrasicolus), and also between
those of the northern and southern areas of the
Mediterranean Sea (Fig. 4). It is important to point
out that the results of the discrimination between the
Spanish and Sicilian coasts have to be interpreted
with caution, because of the differences in sample
True group (%)
Pre
dict
ed g
roup
s (%
)
S.p. S.a. E.e. T.t. T.m. S.s. S.c.
S.c.
S.s.
T.m
T.t.
E.e.
S.a.
S.p. 72.9
25.770.3
1.4
28.4
95.3
1.2
1.2
61.7
27.7
2.1
48.9
42.6
87.5
77.3
4.5
6.4 8.5
1.4
1.2
1.2
2.1
12.5
9.1
9.1
Fig. 2 Plot of the results of
a discriminant analysis
showing the percentage of
fish species correctly
classified from the original
data according to the amino
acid composition of the
eyes. Species abbreviations
as shown in Materials and
Methods
Hydrobiologia (2011) 670:189–199 193
123

size between the two areas, especially given the small
amount of data from the Sicilian coast (Table 1).
Furthermore, it was necessary to test whether there
is temporal variation in the AAC within species in
the same area. A discriminant analysis was performed
on the AAC of the eyes of adult fish collected in 2003
for the different distribution areas of the Mediterranean
coast of Spain (north and south) and for S. pilchardus
and E. encrasicolus on the Sicilian coast. However, for
Sicily, data from individuals collected in 2002 (without
assigned group) were also included. Eventually, all
data from Sicily in 2002 were assigned to the group for
Sicily in 2003 (Table 4).
Discussion
The starting point for using the AAC for stock
separation applications is that the habitat character-
istics from separate geographical areas could influ-
ence AAC for fish living in those areas. Although, to
our knowledge, it had never been used before, our
results reveal that the AAC of the eyes provides a
method for practical discrimination of fish subpopu-
lations, where the amount of exchanges between
subpopulations is low, but sufficient to prevent
genetic differentiation (see Lleonart & Maynou,
2003). Therefore, this method is useful for studying
the fine-scale population structure of marine fishes.
Our results show that it is possible to discriminate
pelagic fish species and fish distribution based on the
AAC of the eyes. A good differentiation was seen
between the Spanish and Sicilian populations of S.
pilchardus and E. encrasicolus, which concur with
previous studies that have shown the existence of
several subpopulations of both species in the Med-
iterranean Sea (Larraneta, 1968; Spanakis et al.,
1989; Bembo et al., 1996a, b; Tudela, 1999; Borsa,
2002). These observed differences could be a result
of the contrasting environmental conditions experi-
enced by fish in the studied areas (Agostini & Bakun,
2002).
In the Spanish Mediterranean Sea, discriminant
analysis also produced a good separation between
northern and southern subpopulations of S. pilchar-
dus, S. aurita and E. encrasicolus. Differences in
AAC are in agreement with genetic differences
(Ramon & Castro, 1997), with differences in growth
rates (Alemany & Alvarez, 1993) and with differ-
ences in biometric, physiologic and fisheries charac-
teristics (Larraneta, 1968), reported for northern and
southern subpopulations of S. pilchardus.
Genetic techniques cannot detect differences when
there are low levels of larval or adult mixing between
subpopulations (Edmonds et al., 1989; Hartl & Clark,
1989; Swan et al., 2006) and, therefore, are not useful
Discriminant function I-6 -4 -2 0 2 4 6
Dis
crim
inan
t fu
ncti
on I
I
-6
-4
-2
0
2
4
6
Discriminant function I-6 -4 -2 0 2 4 6
Dis
crim
inan
t fu
ncti
on I
I
-6
-4
-2
0
2
4
6
Fig. 3 Plot of the first two discriminant function scores
obtained from the discriminant analysis performed on the
amino acid composition of fish eyes. Sardina pilchardus(triangle), Sardinella aurita (inverted triangle), Engraulisencrasicolus (circle), Trachurus trachurus (hexagon), Trachu-rus mediterraneus (diamond), Scomber scombrus (filledsquare), Scomber colias (open square). a Plot of the
individuals. b Plot of the species centroids
194 Hydrobiologia (2011) 670:189–199
123
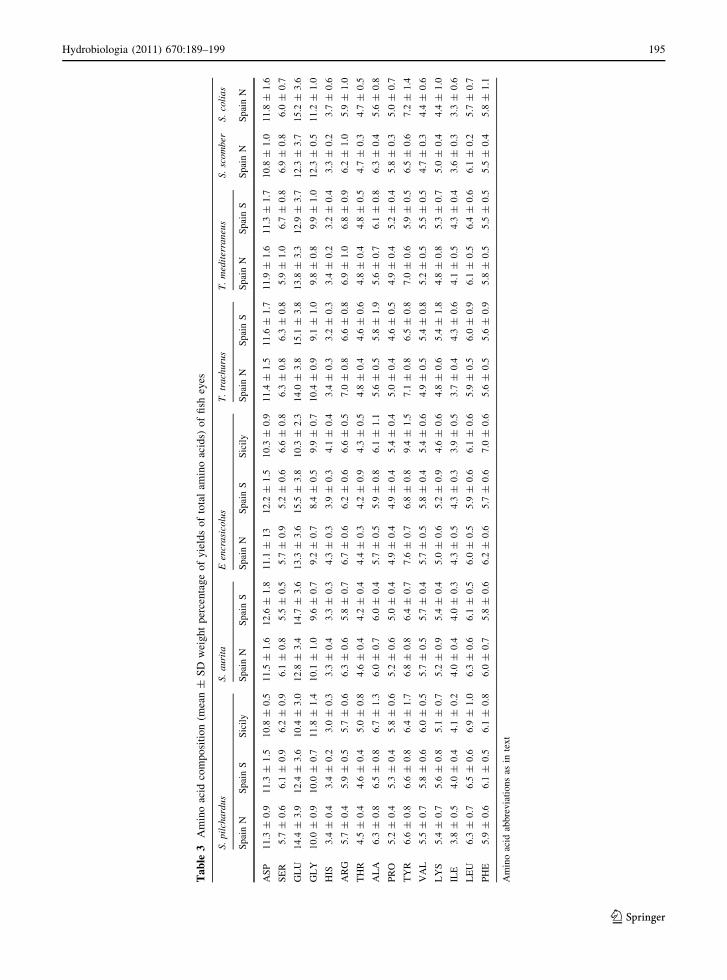
Ta
ble
3A
min
oac
idco
mp
osi
tio
n(m
ean
±S
Dw
eig
ht
per
cen
tag
eo
fy
ield
so
fto
tal
amin
oac
ids)
of
fish
eyes
S.
pil
chard
us
S.
auri
taE
encr
asi
colu
sT
.tr
ach
uru
sT
.m
edit
erra
neu
sS.
scom
ber
S.
coli
as
Spai
nN
Spai
nS
Sic
ily
Spai
nN
Spai
nS
Spai
nN
Spai
nS
Sic
ily
Spai
nN
Spai
nS
Spai
nN
Spai
nS
Spai
nN
Spai
nN
AS
P11.3
±0.9
11.3
±1.5
10.8
±0.5
11.5
±1.6
12.6
±1.8
11.1
±13
12.2
±1.5
10.3
±0.9
11.4
±1.5
11.6
±1.7
11.9
±1.6
11.3
±1.7
10.8
±1.0
11.8
±1.6
SE
R5.7
±0.6
6.1
±0.9
6.2
±0.9
6.1
±0.8
5.5
±0.5
5.7
±0.9
5.2
±0.6
6.6
±0.8
6.3
±0.8
6.3
±0.8
5.9
±1.0
6.7
±0.8
6.9
±0.8
6.0
±0.7
GL
U14.4
±3.9
12.4
±3.6
10.4
±3.0
12.8
±3.4
14.7
±3.6
13.3
±3.6
15.5
±3.8
10.3
±2.3
14.0
±3.8
15.1
±3.8
13.8
±3.3
12.9
±3.7
12.3
±3.7
15.2
±3.6
GL
Y10.0
±0.9
10.0
±0.7
11.8
±1.4
10.1
±1.0
9.6
±0.7
9.2
±0.7
8.4
±0.5
9.9
±0.7
10.4
±0.9
9.1
±1.0
9.8
±0.8
9.9
±1.0
12.3
±0.5
11.2
±1.0
HIS
3.4
±0.4
3.4
±0.2
3.0
±0.3
3.3
±0.4
3.3
±0.3
4.3
±0.3
3.9
±0.3
4.1
±0.4
3.4
±0.3
3.2
±0.3
3.4
±0.2
3.2
±0.4
3.3
±0.2
3.7
±0.6
AR
G5.7
±0.4
5.9
±0.5
5.7
±0.6
6.3
±0.6
5.8
±0.7
6.7
±0.6
6.2
±0.6
6.6
±0.5
7.0
±0.8
6.6
±0.8
6.9
±1.0
6.8
±0.9
6.2
±1.0
5.9
±1.0
TH
R4.5
±0.4
4.6
±0.4
5.0
±0.8
4.6
±0.4
4.2
±0.4
4.4
±0.3
4.2
±0.9
4.3
±0.5
4.8
±0.4
4.6
±0.6
4.8
±0.4
4.8
±0.5
4.7
±0.3
4.7
±0.5
AL
A6.3
±0.8
6.5
±0.8
6.7
±1.3
6.0
±0.7
6.0
±0.4
5.7
±0.5
5.9
±0.8
6.1
±1.1
5.6
±0.5
5.8
±1.9
5.6
±0.7
6.1
±0.8
6.3
±0.4
5.6
±0.8
PR
O5.2
±0.4
5.3
±0.4
5.8
±0.6
5.2
±0.6
5.0
±0.4
4.9
±0.4
4.9
±0.4
5.4
±0.4
5.0
±0.4
4.6
±0.5
4.9
±0.4
5.2
±0.4
5.8
±0.3
5.0
±0.7
TY
R6.6
±0.8
6.6
±0.8
6.4
±1.7
6.8
±0.8
6.4
±0.7
7.6
±0.7
6.8
±0.8
9.4
±1.5
7.1
±0.8
6.5
±0.8
7.0
±0.6
5.9
±0.5
6.5
±0.6
7.2
±1.4
VA
L5.5
±0.7
5.8
±0.6
6.0
±0.5
5.7
±0.5
5.7
±0.4
5.7
±0.5
5.8
±0.4
5.4
±0.6
4.9
±0.5
5.4
±0.8
5.2
±0.5
5.5
±0.5
4.7
±0.3
4.4
±0.6
LY
S5.4
±0.7
5.6
±0.8
5.1
±0.7
5.2
±0.9
5.4
±0.4
5.0
±0.6
5.2
±0.9
4.6
±0.6
4.8
±0.6
5.4
±1.8
4.8
±0.8
5.3
±0.7
5.0
±0.4
4.4
±1.0
ILE
3.8
±0.5
4.0
±0.4
4.1
±0.2
4.0
±0.4
4.0
±0.3
4.3
±0.5
4.3
±0.3
3.9
±0.5
3.7
±0.4
4.3
±0.6
4.1
±0.5
4.3
±0.4
3.6
±0.3
3.3
±0.6
LE
U6.3
±0.7
6.5
±0.6
6.9
±1.0
6.3
±0.6
6.1
±0.5
6.0
±0.5
5.9
±0.6
6.1
±0.6
5.9
±0.5
6.0
±0.9
6.1
±0.5
6.4
±0.6
6.1
±0.2
5.7
±0.7
PH
E5.9
±0.6
6.1
±0.5
6.1
±0.8
6.0
±0.7
5.8
±0.6
6.2
±0.6
5.7
±0.6
7.0
±0.6
5.6
±0.5
5.6
±0.9
5.8
±0.5
5.5
±0.5
5.5
±0.4
5.8
±1.1
Am
ino
acid
abbre
via
tions
asin
text
Hydrobiologia (2011) 670:189–199 195
123
for resolving the fine-scale population structure of
marine fishes (to discriminate among subpopula-
tions). Relatively low levels of exchange between
stocks, negligible from a management perspective,
may be sufficient to ensure genetic homogeneity
(Ward & Grewe, 1994). Moreover, even if a larger
number of loci are used, because the percentage of
DNA expressed as proteins is low compared to total
DNA available, it is uncertain whether the DNA
sequence analysed is important in terms of the
adaptation of the species to the habitat (Kocher,
2003). Hence, although stock discrimination derived
from DNA sequences accurately represents the
history of genes, it does not necessarily reflect the
True group
Pre
dict
ed g
roup
s (%
)
True group
Pre
dict
ed g
roup
s (%
)
True group
Pre
dict
ed g
roup
s (%
)
True group
Pre
dict
ed g
roup
s (%
)
True group
Pre
dict
ed g
roup
s (%
)
S.p. 64.3%50
47.671.1
28.952.4
S.a. 75.7%
26.5
73.5
80
20
83.3
77.8
7.4
14.8
2.1
27.7
70.2
E.e. 74.4%
T.t. 85.0% T.m. 80.9%
1076.5
90
23.5
70.613.3
86.7
Spain N Spain S Sicily
Spain N Spain S Sicily
Spain N Spain S
Spai
n N
Spa
in S
Si
cily
Spai
n N
Spa
in S
Spai
n N
Spa
in S
Si
cily
Spai
n N
Spa
in S
Spain N Spain S
Spai
n N
Spa
in S
Spain N Spain S
25
25
8.3
8.3
29.4
Fig. 4 Plot of the results of
a discriminant analysis
showing the percentage of
fish species from different
areas correctly classified
from the original data
according to the amino acid
composition of the eyes.
Species abbreviations as
shown in Materials and
Methods
196 Hydrobiologia (2011) 670:189–199
123
history of the population in which the variants are
found.
Differences in habitat conditions, due to adaptation
to different photic environments (spectral composi-
tion of shallow bodies of water is highly variable due
largely to differences in the quantity and identity of
the substances dissolved), may have consequences
upon eye pigments, tuned by the AAC within the
opsin (the protein that determines the spectral
absorption characteristics of the light) (see Douglas
et al., 1998).
Other methods, such as the elemental composition
of otoliths, have been used as a means for resolving
the fine-scale stock and population structures of
marine fishes (Thresher, 1999; Thorrold et al., 2001;
Geffen et al., 2003; Rooker et al., 2003; Swan et al.,
2006). One of the problems of otolith chemistry is
that it shows strong year-to-year variability and must
be used as a seasonally stable biological tracer
(Campana et al., 2000), as nursery fingerprints have
been shown to vary between years (Gillanders et al.,
2001; Gillanders, 2002).
Although intensive sampling is necessary for all
species and areas over a long period (more than
3–5 years), our preliminary results comparing differ-
ent sampling years for S. pilchardus and E. encra-
sicolus revealed that AAC may be used as a stable tag
in pelagic fishes.
It is not suggested that the definition of the
population structure of marine fishes should rely upon
this amino acid technique. There is still a need for a
holistic (multiple technique) approach for the study of
the population structure of marine fishes (Waldman
et al., 1997; Begg & Waldman, 1999; Murta, 2000), as
different methods may produce different results. The
information obtained from the analysis of amino acids
would be complementary information to that obtained
from other techniques.
Acknowledgments The authors would like to express their
gratitude to the Instituto Espanol de Oceanografıa for the
ECOMED cruise and to the officers and crew of the R/V
Cornide de Saavedra.
References
Agostini, V. N. & A. Bakun, 2002. ‘Ocean triads’ in the
Mediterranean Sea: physical mechanisms potentially
structuring reproductive habitat suitability (with example
application to European anchovy, Engraulis encrasico-lus). Fisheries Oceanography 11: 129–142.
Alemany, F. & F. Alvarez, 1993. Growth differences among
sardine (Sardina pilchardus Walb.) populations in western
Mediterranean. Scientia Marina 57: 229–234.
Andrewartha, H. & L. C. Birch, 1954. The Distribution and
Abundance of Animals. The University Chicago Press,
Chicago.
Bailey, K. M., T. J. Quinn, P. Bentzen & W. S. Grant, 1999.
Population structure and dynamics of walleye Pollock:
Theragra chalcogramma. Advances in Marine Biology
37: 179–255.
Begg, G. A. & J. R. Waldman, 1999. An holistic approach to
fish stock identification. Fisheries Research 43: 35–44.
Bembo, D. G., G. R. Carvalho, N. Cingolani & T. J. Pitcher,
1996a. Electrophoretic analysis of stock structure in
Northern Mediterranean anchovies, Engraulis encrasico-lus. ICES Journal of Marine Science 53: 115–128.
Bembo, D. G., G. R. Carvalho, N. Cingolani, E. Arneri, G.
Giannetti & T. J. Pitcher, 1996b. Allozymic and mor-
phometric evidence for two stocks of the European
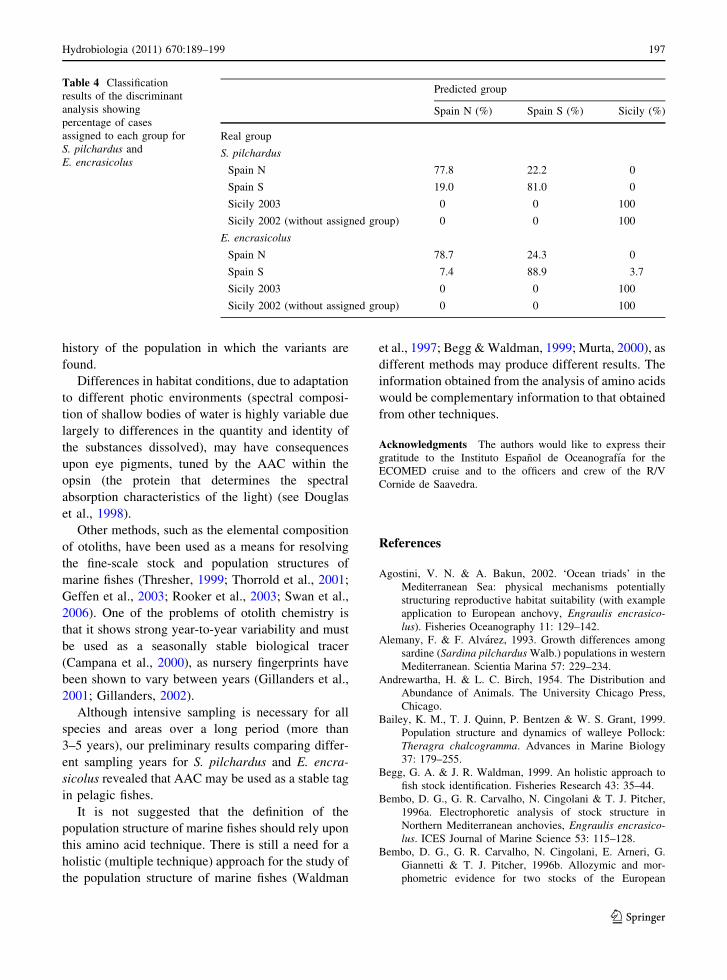
Table 4 Classification
results of the discriminant
analysis showing
percentage of cases
assigned to each group for
S. pilchardus and
E. encrasicolus
Predicted group
Spain N (%) Spain S (%) Sicily (%)
Real group
S. pilchardus
Spain N 77.8 22.2 0
Spain S 19.0 81.0 0
Sicily 2003 0 0 100
Sicily 2002 (without assigned group) 0 0 100
E. encrasicolus
Spain N 78.7 24.3 0
Spain S 7.4 88.9 3.7
Sicily 2003 0 0 100
Sicily 2002 (without assigned group) 0 0 100
Hydrobiologia (2011) 670:189–199 197
123
anchovy Engraulis encrasicolus in Adriatic waters. Mar-
ine Biology 126: 529–538.
Booke, H. E., 1999. The stock concept revisited: perspectives
on its history in fisheries. Fisheries Research 43: 9–11.
Borsa, P., 2002. Allozyme, mitochondrial-DNA, and morpho-
metric variability indicate cryptic species of anchovy
(Engraulis encrasicolus). Biological Journal of the Lin-
nean Society 75: 261–269.
Cadrin, S. X., K. D. Friedland & J. R. Waldman, 2005. Stock
Identification Methods. Applications in Fishery Science.
Elsevier Academic Press, London.
Campana, S. E., G. A. Chouinard, J. M. Hanson, A. Frechet &
J. Brattey, 2000. Otolith elemental fingerprints as bio-
logical tracers of fish stocks. Fisheries Research 46:
343–357.
Carrera, P. & C. Porteiro, 2003. Stock dynamic of the Iberian
sardine (Sardina pilchardus, W) and its implication on the
fishery off Galicia (NW Spain). Scientia Marina 67:
245–258.
Cuttitta, A., C. Guisande, I. Riveiro, I. Maneiro, B. Patti, A.
R. Vergara, G. Basilone, A. Bonanno & S. Mazzola, 2006.
Factors structuring reproductive habitat suitability of
Engraulis encrasicolus in the south coast of Sicily. Jour-
nal of Fish Biology 68: 264–275.
Douglas, R. H., J. C. Partridge & N. J. Marshall, 1998. The
eyes of deep-sea fish I: lens pigmentation, tapeta and
visual pigments. Progress in Retinal and Eye Research 17:
597–636.
Edmonds, J. S., M. Moran, N. Caputi & M. Morita, 1989. Trace
element analysis of fish sagittae as an aid to stock iden-
tification: Pink Snapper (Chrysophrys auratus) in western
Australian waters. Canadian Journal of Fisheries and
Aquatic Sciences 46: 50–54.
Geffen, A. J., K. Jarvis, J. P. Thorpe, R. T. Leah & R. D. M.
Nash, 2003. Spatial differences in the trace element con-
centrations of Iris Sea plaice Pleuronectes platessa and
whiting Merlagius merlagus otoliths. Journal of Sea
Research 50: 245–254.
Gillanders, B. M., 2002. Temporal and spatial variability in
elemental composition of otoliths: implications for
determining stock identity and connectivity of popula-
tions. Canadian Journal of Fisheries and Aquatic Sciences
59: 669–679.
Gillanders, B. M., P. Sanchez-Jerez, J. Bayle-Sempere & A.
Ramos-Espla, 2001. Trace elements in otoliths of the two-
banded bream from a coastal region in the south-west
Mediterranean: are there differences among locations?
Journal of Fish Biology 59: 350–363.
Guisande, C., A. Barreiro, I. Maneiro, I. Riveiro, A. R. Vergara
& A. Vaamonde, 2006. Tratamiento de datos. Diaz de
Santos, Spain.
Hanski, I., 1999. Metapopulation Ecology. Oxford University
Press, Oxford.
Hartl, D. L. & A. G. Clark, 1989. Principles of Population
Genetics. Sinauer Associates, Sunderland, MA.
Kinsey, S. T., T. Orsoy, T. M. Bert & B. Mahmoudi, 1994.
Population structure of the Spanish sardine Sardinellaaurita: natural morphological variation in a genetically
homogeneous population. Marine Biology 118: 309–317.
Kocher, T. D., 2003. Evolutionary biology: fractious phylog-
enies. Nature 423: 489–491.
Kritzer, J. P. & P. F. Sale, 2004. Metapopulation ecology in the
sea: from Levins’ model to marine ecology and fisheries
science. Fish and Fisheries 5: 131–140.
Larraneta, M. G., 1968. Unites de stock de la sardine de la
Mediterranee Occidentale et de l’Adriatic. Etudes et
Revues CGPM 33: 1–54.
Levins, R., 1970. Extinction. Lectures on Mathematics 2:
75–107.
Lleonart, J. & F. Maynou, 2003. Fish stock assessment in the
Mediterranean: state of the art. Scientia Marina 67: 37–49.
MacLean, J. A. & D. O. Evans, 1981. The stock concept,
discreteness of fish stocks, and fisheries management.
Canadian Journal of Fisheries and Aquatic Sciences 38:
1889–1898.
MacQuinn, I. H., 1997. Metapopulations and the Atlantic her-
ring. Reviews in Fish Biology and Fisheries 7: 297–329.
Marques, J. F., C. M. Teixeira & H. N. Cabral, 2006. Differ-
entiation of commercially important flatfish populations
along the Portuguese coast: evidence from morphology
and parasitology. Fisheries Research 81: 293–305.
Murta, A. G., 2000. Morphological variation of horse mackerel
(Trachurus trachurus) in the Iberian and North African
Atlantic: Implications for stock identification. ICES
Journal of Marine Science 57: 1240–1248.
Pawson, M. G. & S. Jennings, 1996. A critique of methods for
stock identification in marine capture fisheries. Fisheries
Research 25: 203–217.
Ramon, M. M. & J. A. Castro, 1997. Genetic variation in
natural stocks of Sardina pilchardus (sardines) from the
western Mediterranean Sea. Heredity 78: 520–528.
Riveiro, I., C. Guisande, C. Franco, A. Lago deLanzos, A.
Sola, I. Maneiro & A. R. Vergara, 2003. Egg and larval
amino acid composition as indicators of niche resource
partitioning in pelagic fish species. Marine Ecology Pro-
gress Series 260: 252–262.
Rooker, J. R., D. H. Secor, V. S. Zdanowicz, G. De Metrio &
L. O. Relini, 2003. Identification of Atlantic bluefin tuna
(Thunnus thynnus) stocks from putative nurseries using
otolith chemistry. Fisheries Oceanography 12: 75–84.
Ryman, N., U. Lagercrantz, L. Anderson, R. Chakraborty & R.
Rosenberg, 1984. Lack of correspondence between
genetic and morphologic variability patterns in Atlantic
herring (Clupea harengus). Heredity 53: 687–704.
Smedbol, R. K. & R. K. Wroblewski, 2002. Metapopulation
theory and northern cod population structure: interde-
pendency of subpopulations in recovery of a groundfish
population. Fisheries Research 55: 161–174.
Smith, P. J. & A. Jamieson, 1986. Stock discreteness in her-
rings: a conceptual revolution. Fisheries Research 4:
223–234.
Spanakis, E., N. Tsimedines & E. Zouros, 1989. Genetic dif-
ferences between populations of sardine, Sardina pil-chardus, and anchovy, Engraulis encrasicolus, in the
Aegean and Ionian seas. Journal of Fish Biology 35:
417–437.
Stephenson, R. L., 1999. Stock complexity in fisheries man-
agement: a perspective of emerging issues related to
population sub-units. Fisheries Research 43: 247–249.
Swain, D. P. & C. J. Foote, 1999. Stocks and chameleons: the
use of phenotypic variation in stock identification. Fish-
eries Research 43: 113–128.
198 Hydrobiologia (2011) 670:189–199
123

Swan, S. C., A. J. Geen, B. Morales-Nin, J. D. M. Gordon, T.
Shimmield, T. Sawyer & E. Massuty, 2006. Otolith
chemistry: an aid to stock separation of Helicolenusdactylopterus (bluemouth) and Merluccius merluccius(European hake) in the Northeast Atlantic and Mediter-
ranean. ICES Journal of Marine Science 63: 504–513.
Thorrold, S. R., C. Latkoczy, P. K. Swart & C. M. Jones, 2001.
Natal homing in a marine fish metapopulation. Science
291: 297–299.
Thresher, R. E., 1999. Elemental composition of otoliths as a
stock delineator in fishes. Fisheries Research 43: 165–204.
Timi, J. T., J. L. Luque & N. H. Sardella, 2005. Parasites of
Cynoscion guatucupa along South American Atlantic
coasts: evidence for stock discrimination. Journal of Fish
Biology 67: 1603–1618.
Tudela, S., 1999. Morphological variability in a Mediterranean,
genetically homogeneous population of the European
anchovy, Engraulis encrasicolus. Fisheries Research 42:
229–243.
Turan, C., G. R. Carvalho & J. Mork, 1998. Molecular genetic
analysis of Atlanto-Scandian herring (Clupea harengus)
populations using allozymes and mitochondrial DNA
markers. Journal of Marine Biology Association UK 78:
269–283.
Van Wandelen, C. H. & S. A. Cohen, 1997. Using quaternary
high-performance liquid chromatography eluent systems
for separating 6-aminoquinolyl-N-hydroxysuccinimidyl
carbamate-derivatized amino acid mixtures. Journal of
Chromatography 763: 11–22.
Waldman, J. R., 1999. The importance of comparative studies
in stock analysis. Fisheries Research 43: 237–246.
Waldman, J. R., R. A. Richards, W. B. Schill, I. Wirgin & M.
C. Fabrizio, 1997. An empirical comparison of stock
identification techniques applied to striped bass. Trans-
actions of the American Fisheries Society 126: 369–385.
Ward, R. D. & P. W. Grewe, 1994. Appraisal of molecular
genetic techniques in fisheries. Reviews of Fish Biology
and Fisheries 4: 300–325.
Hydrobiologia (2011) 670:189–199 199
123


![Self-assembly of extended Schiff base amino acetate skeletons, 2-{[(2 Z)-(3-hydroxy-1-methyl-2-butenylidene)]amino}phenylpropionate and 2-{[( E)-1-(2-hydroxyaryl)alkylidene]amino}phenylpropionate](https://static.fdokumen.com/doc/165x107/631bb3c5665120b3330b7ec0/self-assembly-of-extended-schiff-base-amino-acetate-skeletons-2-2-z-3-hydroxy-1-methyl-2-butenylideneaminophenylpropionate.jpg)