Genetic characterization of Iranian subpopulations using 15 ...
14
Eurasian Journal of Anthropology Euras J Anthropol 6(2):39−52, 2015 Genetic characterization of Iranian subpopulations using 15 forensic autosomal STR loci Mostafa Ghaderi-Zefrehei 1∗ , Amin Mortazavi 2 , Zohreh Baratieh 3 , Alireza Sabouri 4 , Reza Alaeddini 5 , Somayeh Heidari 6 , Elahe Foroughimanesh 1 1 Systems Biology, University of Yasuj, Yasuj, Iran 2 Breeding Genetics, University of Kurdistan, Kurdistan, Iran 3 Molecular Genetics, Isfahan Medical University, Isfahan, Iran 4 Molecular Genetic Center, Isfahan Forensic Center, Isfahan, Iran 5 Legal Medicine Research Center, Tehran, Iran 6 Systems Biology, University of Ferdowsi, Mashhad, Iran Received May 25, 2015 Accepted December 10, 2015 Abstract The objective of present study was to compare genetic structure of seven Iranian provinces and to understand the genetic relationship among these seven provinces (Isfahan, Fars, Hormozgan, Kerman, Chaharmahal & Bakhtiari, Kohgiluyeh & Boyer Ahmad, and Yazd). For this purpose, a set of 15 STR’s loci were investigated. This panel of STRs is standard forensic science genetic testing tool that we added some importance to them by putting them in genetic variation analysis. The results based upon Fisher exact test for Hardy-Weinberg equilibrium (HWE) indicated that the allele and genotype distributions were in accordance with Hardy- Weinberg expectations except for D16S539. From genetic diversity point of view, D2S1338 was among the best STR loci and Isfahan has the highest value in aspect of these indices. Our results indicated that high amount of gene flow have been from Isfahan to Fars, which should be further investigated. Also, we indirectly shown that those forensic motivated genetic markers could be used as reliable tool for genetic differentiation when sounds data are available. We did not mean to estimate forensic science specific measures e.g. probability match and etc. for current study. Keywords: STR’s loci, genetic relationship, genetic diversity, Iranian population Introduction Despite wide-range ethnic groups which have dwelled and still are living in Iran territory, the volume of genetic investigations in this population have been surpris- ingly so narrow. There are some reasons which would make genetic investigations in courtiers like Iran to be deeply compelling and spectacular e.g. Iran’s ethnic, religious ∗ Corresponding author: Systems Biology, University of Yasuj, Yasuj, Iran (e-mail: [email protected]) ISSN: 2166-7411 iser publication ©2015
-
Upload
khangminh22 -
Category
Documents
-
view
1 -
download
0
Transcript of Genetic characterization of Iranian subpopulations using 15 ...

Eurasian Journal of Anthropology Euras J Anthropol 6(2):39−52, 2015 Genetic characterization of Iranian subpopulations using 15 forensic autosomal STR loci Mostafa Ghaderi-Zefrehei1∗, Amin Mortazavi2, Zohreh Baratieh3, Alireza Sabouri4, Reza Alaeddini5, Somayeh Heidari6, Elahe Foroughimanesh1
1Systems Biology, University of Yasuj, Yasuj, Iran 2Breeding Genetics, University of Kurdistan, Kurdistan, Iran 3Molecular Genetics, Isfahan Medical University, Isfahan, Iran 4Molecular Genetic Center, Isfahan Forensic Center, Isfahan, Iran 5Legal Medicine Research Center, Tehran, Iran 6Systems Biology, University of Ferdowsi, Mashhad, Iran
Received May 25, 2015 Accepted December 10, 2015
Abstract The objective of present study was to compare genetic structure of seven Iranian provinces and to understand the genetic relationship among these seven provinces (Isfahan, Fars, Hormozgan, Kerman, Chaharmahal & Bakhtiari, Kohgiluyeh & Boyer Ahmad, and Yazd). For this purpose, a set of 15 STR’s loci were investigated. This panel of STRs is standard forensic science genetic testing tool that we added some importance to them by putting them in genetic variation analysis. The results based upon Fisher exact test for Hardy-Weinberg equilibrium (HWE) indicated that the allele and genotype distributions were in accordance with Hardy-Weinberg expectations except for D16S539. From genetic diversity point of view, D2S1338 was among the best STR loci and Isfahan has the highest value in aspect of these indices. Our results indicated that high amount of gene flow have been from Isfahan to Fars, which should be further investigated. Also, we indirectly shown that those forensic motivated genetic markers could be used as reliable tool for genetic differentiation when sounds data are available. We did not mean to estimate forensic science specific measures e.g. probability match and etc. for current study.
Keywords: STR’s loci, genetic relationship, genetic diversity, Iranian population Introduction
Despite wide-range ethnic groups which have dwelled and still are living in Iran territory, the volume of genetic investigations in this population have been surpris-ingly so narrow. There are some reasons which would make genetic investigations in courtiers like Iran to be deeply compelling and spectacular e.g. Iran’s ethnic, religious ∗ Corresponding author: Systems Biology, University of Yasuj, Yasuj, Iran (e-mail: [email protected])
ISSN: 2166-7411 iser publication ©2015

Ghaderi-Zefrehei et al. Euras J Anthropol 6(2):39-52, 2015
40
composition, geographic breakdown ethno-religious diversity, population growth rates in the Middle East, geographical non-uniform landscape to names a few sounds to be unique. Also based upon its historical and prehistorical facts, Iranian landscape and plateau, has been the core of multinational traders, invaders, from both Asia and European regions. Adding to this matter, the Iran’s central power hegemony across long history, either relocated own Iranian ethnic people within Iran for forever reasons or have brought up some many slaves and peoples from other countries to Iran.
In one of the first formal scientific study, Akbari et al. (1986) by help of different sort of diverse genetic markers (blood group antigens, serum proteins and red cell enzymes), studied four ethnically distinct populations of Iran. He has shown that the ethnic affiliation genetic structure and their breeding structure, besides disruptive selection are more likely the key of genetics difference among Iran ethnic groups. In his paper he cited many formal studies which have done in deciphering Iranian population genetically. Senemar et al. (2009) investigated south Iranian population using Cystathionine B-synthase 844INS 68 polymorphism. She concluded that south Iranian population, based upon aforementioned polymorphism gene, shows far distance from East Asian and African populations. Also he concluded that, south Iranian population shares much genetic background with other Caucasian popula-tions, though, high amount of admixture of Iranian population with the neighboring non-Caucasoid populations is expected.
In a forensic science-based study, Fakhrzar et al. (2008) compared different Iran-ian ethnic group based upon mitochondrial haplogroup. He shown that in Fars, Azari, Gilaks, Kurds and Sistani groups, west Eurasia haplogroup was dominant, but in Arab, Balouch, west Eurasia haplogroup was dominant. In a study, Mojtabavi-Naeini et al. (2013) investigated the informativeness of D7S2420 CA repeat STR marker in 5 end of SLC26A4 gene region in Iranian five ethnic groups (Fars, Azari, Turkmen, Gilaki, and Arabs). It was turned out that all ethnic groups investigated in his study were in equilibrium (P > 0.05) from Hardy-Weinberg point of view. In a very interesting study, Bahmanimehr et al. 2015 investigated genetically a random population of northwest of Iran using haplogroup G2-M406. This region is renowned to be as cradle of great civilizations like Mesopotamia and Elam and is surrounded by Zagros Mountain. It was calculated that the entrance of haplogroup G2-M406 to this region backed before 8800 years before present time. They highlighted that the gene flow from neighboring regions and free movements of the local people have been sharply restricted by geographic due to Zagros Mountains. Also they shown a westward migration of Iranian population dwelled in this plateau to the Europe through Turkey and Caucasus. By investigating D9S1837 within TMC1 gene in five different ethnic Iranian groups, the heterozygosity of all investigated ethnic groups obtained more that 70%, though in two ethnic groups (l Arab and Azeri) this measure of genetic variation was about 84.8% (Motamedi and Samira et al., 2015). Other study using HLA DRB1 polymorphism has shown high level of genetic diversity in Iranian population dwelled in Russia and Eastern and Southern European countries (Yari et al., 2007). It has been many studies which stressed the potential of STRs in human genetic variation analysis.
In Iran, the results population analysis using STR loci were published in 2006 and 2009 (Valianand et al., 2006; Lahmi et al., 2009). The human genome contains a large amount of polymorphic sequences, which are known as polymorphic markers (Valian et al., 2006). Tandem repeat DNA sequences, which are widespread throughout the human genome, show sufficient variability among individuals in a population (Lahmi et al., 2009). An important topic in DNA studies is the development of STR
Ghaderi-Zefrehei et al. Euras J Anthropol 6(2):39-52, 2015
41
databases and their detailed population-genetic analysis regarding the diversification and differentiation of subpopulations. Because of high level of polymorphism, STR have been recommended as optimal genetic markers to study genetic diversity in closely related populations (Bradley, 1997; Eding and Laval, 1999), thus the present study aimed at characterize these Iranian population and to investigate the genetic relatedness between seven districts using a set of 15 STR loci. In many studies under-taken human genetic analysis in Iran, the number of genetic markers, particularly STRs, have been quite low, after all, they didn’t include (south) central part of Iran plateau, which is dwelled by different ethnic and ethno-religious groups. Therefore, this study was designed to make some hidden genetic association across subpopula-tion visible. Material and methods
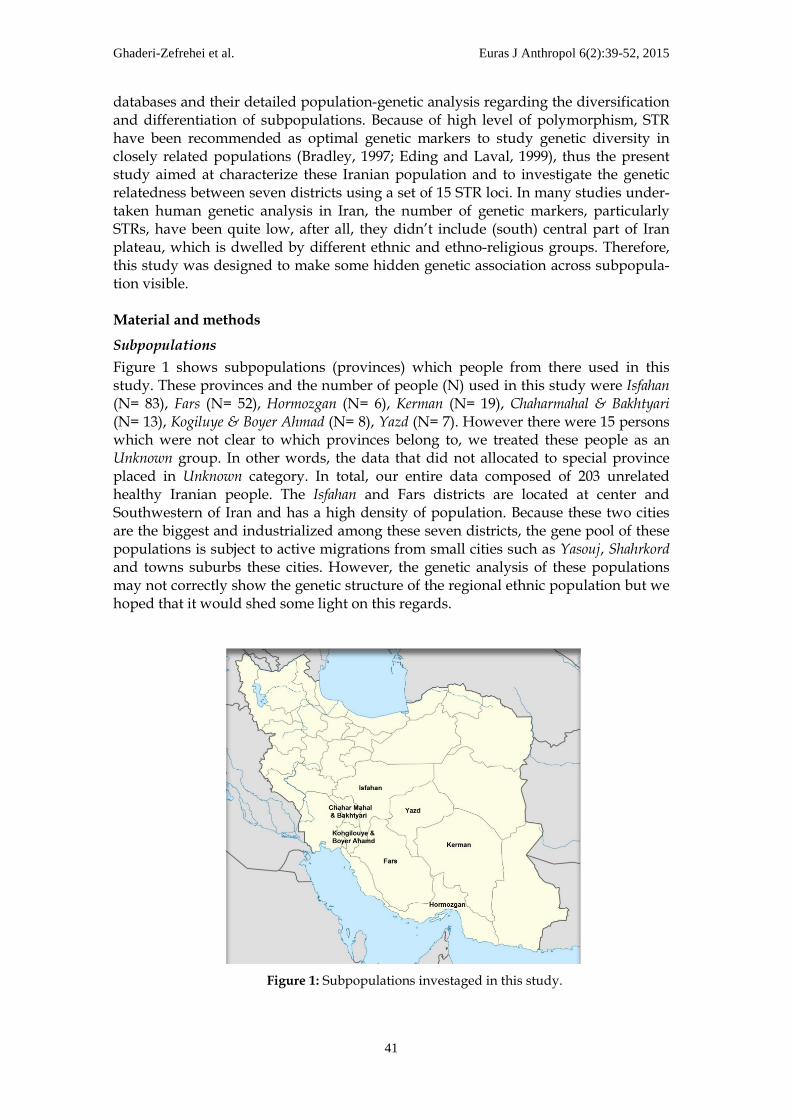
Subpopulations Figure 1 shows subpopulations (provinces) which people from there used in this study. These provinces and the number of people (N) used in this study were Isfahan (N= 83), Fars (N= 52), Hormozgan (N= 6), Kerman (N= 19), Chaharmahal & Bakhtyari (N= 13), Kogiluye & Boyer Ahmad (N= 8), Yazd (N= 7). However there were 15 persons which were not clear to which provinces belong to, we treated these people as an Unknown group. In other words, the data that did not allocated to special province placed in Unknown category. In total, our entire data composed of 203 unrelated healthy Iranian people. The Isfahan and Fars districts are located at center and Southwestern of Iran and has a high density of population. Because these two cities are the biggest and industrialized among these seven districts, the gene pool of these populations is subject to active migrations from small cities such as Yasouj, Shahrkord and towns suburbs these cities. However, the genetic analysis of these populations may not correctly show the genetic structure of the regional ethnic population but we hoped that it would shed some light on this regards.
Figure 1: Subpopulations investaged in this study.

Ghaderi-Zefrehei et al. Euras J Anthropol 6(2):39-52, 2015
42
DNA Experiment DNA extraction: DNA from 203 unrelated individuals (after removing suspected related people, gathered over 4 years, were used in this study samples was extracted using QIAmp1 DNA Mini Kit (QIAGEN, Hagen, Germany) according to manufac-turer’s instructions. DNA quantification: The total amount of human genomic extracted DNA was determined by using Quantifiler TM Human DNA Quantifica-tion Kit (Applied Biosystems, Foster City, CA ,USA), which employs a TaqMan1 MGB Probe-based technology (Applied Biosystems, Foster City, CA, USA) on ABI Prism1 7000 Sequence Detection System (Applied Biosystems, Foster City, CA, USA (PCR: Simultaneous amplifications of 16 STR loci (multiplexed PCR) were performed by using the AmpFlSTR1 Identifiler TM PCR Amplification Kit according to the user’s manual recommendations. The 16 loci amplified in this study are D3S1358, vWA, FGA, D8S1179, D21S11, D18S51, D5S818, D13S317, D7S820, TH01, TPOX, CSF1PO, D19S433, D2S1338, D16S539 and the gender determination marker, Amelogenin. Typing: The separation and detection of amplified products were conducted with the ABI Prism1 3100 Genetic Analyzer 4-capillary array system (Applied Biosystems, Foster City, CA, USA) following manufacturer’s protocols. Data collection was performed with Data Collection v. 2.0 software (Applied Biosystems, Foster City, CA, USA) and samples were analyzed by GeneMapper1 v. 3.2 software (Applied Biosystems, Foster City, CA, USA). Statistical analyses Test for Hardy-Weinberg equilibrium (HWE) was carried out for 8 subpopulations (including unknown group) and 15 loci. Two test for this purpose were done. Ordinary chi square test by PopGene (Yeh et al., 1997) and GeneAlex (Peakall et al., 2012) and Fisher Exact Test by Arlequin (Excoffier et al., 2005). Also P value for Global test of differentiation among sample and Pairwise FSTs differences were calculated using Arlequin. Genetic diversity parameters such as expected and observed heterozygosity, gene flow, Nei and Shannon indices were estimated by PopGene and GeneAlex. Pairwaise comparison of loci for Linkage Disequilibrium (LD) test was performed by GenePop (Raymond et al., 1995). Population assignment was carried out by GeneAlex program. Mean number of allele per locus, mean of heterozygosity, mean of Nei genetic diversity was performed by Gene Class 2 (Piry et al., 2004). Results and discussion
Hardy-Weinberg equilibrium The general assumption in estimating genetic studies for is that data should be independent (this assumptions sometimes hardly rarely fulfilled) and data should fit the assumption genetic testing measures. For example, the general Hardy–Weinberg measure/law is based on large sample size. In our study for some subpopulations, large-sample size data weren’t exist. For this reason two approaches were followed to evaluate Weinberg measure/law for STR loci. In Table 1 the loci were categorized on these two methods. The first one was ordinary chi square test, in this method only 6 out if 15 loci (D7S820, TH01, D13S317, D16S539, VWA, D5S818) didn’t placed in HWE. In fact because the low number of individual in 6 district except for Isfahan and Fars, the comparisons between expected and observed allele frequency could be bias and we were to use Fisher exact test method for these districts. Using fisher exact test it was indicated that all loci in exception of D16S539 (P = 0.05) were in equilibrium from Hardy-Weinberg point of view. Population genetic theory predicts the loss of

Ghaderi-Zefrehei et al. Euras J Anthropol 6(2):39-52, 2015
43
genetic diversity in population that remain small for several generations (genetic drift), in population that initiated from a low number of colonist (founder effect) and in population that suffer rapid decline in size (population bottleneck) (Barett and Cohn, 1991).
Table 1: Hardy-Weinberg equilibrium for total population Locus P by chi square P by Fisher exact test D8S1179 0.925 ns 0.1699 ns D21S11 0.42 ns 0.9724 ns D7S820 0 ** 0.2223 ns CSF1PO 0.132 ns 0.2151 ns D3S1358 0.331 ns 0.9351 ns TH01 0.038 * 0.0769 ns D13S317 0 ** 0.2434 ns D16S539 0 ** 0.0023 ** D2S1338 0.472 ns 0.2927 ns D19S433 0.647 ns 0.3535 ns VWA 0 ** 0.7792 ns TPOX 0.268 ns 0.4603 ns D18S51 0.556 ns 0.3838 ns D5S818 0 ** 0.5222 ns FGA 0.909 ns 0.1205 ns ns = non-significant * P<0.05 ** P<0.01
The result of Table 1 is kind of surprise in a way that it shows up there were'nt any Hardy–Weinberg distributing factcors (migration, selction etc) in the population (lumping the whole subpopulation togher). Genetic diversity Different genetic population parameters such as number of individual (N), average number of alleles (MNA), effective number of alleles (NE), allelic richness (AR), private alleles (PA), Shannon gene diversity index (I), Nei gene diversity (Nei), average heterozygosity (Ave H) and gene flow (GF) for each 15 loci across whole population and 8 subpopulations are illustrated in Tables 2 to 4. Genetic diversity in comparing different populations was expressed as heterozygosity. There are three ways that variation in population expressed. The first one is gene diversity that is the proportion of polymorphic loci across the genome. All loci in 8 subpopulations were 100% polymorphic (data hadn’t been shown). The second is fraction of individual that is heterozygous at a specific locus. The average heterozygosity as shown in Table 3 were high, the average Ho were 0.746 ranging from 0.668 (TPOX) to 0.832 (D18S51). The third is mean number of allele per locus. As seen in Table 2, number of alleles per all loci were high in 8 populations and ranged from 4.5 for TH01 to 14 for D18S51 with a mean of 9.2.
The allelic richness is an estimate of number of allele per locus corrected by sample size (Bi et al., 2003). The D2S1338 had the highest amount of allelic richness (6.098) and Isfahan had the most (8.37) among the other populations.

Ghaderi-Zefrehei et al. Euras J Anthropol 6(2):39-52, 2015
44
Table 2: Genetic diversity parameters for each locus Loci N MNA NE PA AR Ave H Nei I Gene Flow D8S1179 402 7 4.586 1 5.169 0.773 0.823 1.901 4.896 D21S11 406 6.75 5.234 1 5.250 0.808 0.823 1.821 9.097 D7S820 388 5.75 4.100 2 4.378 0.738 0.793 1.699 5.197 CSF1PO 390 4.5 3.140 2 3.561 0.671 0.712 1.367 5.741 D3S1358 402 5 3.780 1 4.160 0.728 0.763 1.534 5.143 TH01 404 4.25 3.190 0 3.623 0.682 0.718 1.347 4.167 D13S317 402 5.875 3.997 1 4.509 0.739 0.785 1.727 4.568 D16S539 402 5.625 4.007 1 4.338 0.716 0.801 1.749 2.891 D2S1338 386 8.625 6.449 1 6.098 0.827 0.881 2.222 4.470 D19S433 398 5.125 3.646 1 4.036 0.716 0.753 1.526 4.780 VWA 404 6.125 4.139 3 4.721 0.753 0.781 1.717 7.117 TPOX 400 4.75 3.040 3 3.661 0.668 0.700 1.393 3.870 D18S51 388 8.625 6.087 2 5.859 0.832 0.867 2.154 5.051 D5S818 402 5.625 3.645 5 4.029 0.720 0.745 1.559 8.962 FGA 392 7.750 5.515 2 5.522 0.814 0.847 2.006 5.465 Mean 398 9.2 4.586 1.733 4.594 0.746 0.786 1.715 5.016
Table 3: Genetic diversity parameters for each districts Districts MNA NE PA AR I F He Ho Isfahan 8.4 5.03 1.267 8.37 1.716 -0.008 0.786 0.793 Fars 7.333 4.849 0.2 7.359 1.678 0.032 0.780 0.756 Hormozgan 4.533 3.416 0 4.283 1.299 -0.120 0.671 0.758 Kerman 6.133 4.306 0 6.071 1.564 0.077 0.753 0.697 CH.B 5.533 3.996 0 5.511 1.480 -0.090 0.731 0.798 Unknown 5.933 4.496 0.2 5.801 1.570 0.112 0.761 0.676 K.B 5.333 3.984 0 5.172 1.477 -0.048 0.733 0.765 Yazd 5.533 4.354 0.067 5.329 1.531 -0.016 0.749 0.760 MNA: mean number of alleles- NE: number of effective alleles- PA: private alleles- HO: heterozygosity observed- he: heterozygosity expected- AR: allelic richness- I: Shannon index- F: fixation index
Private alleles are alleles that are found only in a single population among a broader collection of populations. These alleles have proven to be informative for diverse types of population-genetic studies, in such areas as molecular ecology and conservation genetics (Kalinowski, 2004) and human evolutionary genetics (Szpiech et al., 2008). Private alleles were observed in 4 out of 8 populations (Isfahan, Fars, Unknown and Yazd) and in all loci except for TH01. Frequency of private alleles for each loci haven’t been shown. Also for each locus the Nei and Shannon gene diversity were depicted in Table 3. According to Nei and Shannon indices, the TPOX and TH01, respectively had the lowest and D2S1338 for both indices had the highest gene diversity index (see Table 4). However, the amount of allelic richness and private allele depends on sampling errors due to finite sample size.
As Fis suggest the mean inbreeding was close to zero (Fit= 0.059, Fis= 0.016) indicating that marriage in these 8 population isn’t based upon familial relationship. Fst was the interpolation genetic differentiation based on fisher equation ranging from 0.027 to 0.061 with a mean of 0.048. As Gst showed in Table 5, only slight variation assigned between populations and most of the diversity allocated to within

Ghaderi-Zefrehei et al. Euras J Anthropol 6(2):39-52, 2015
45
Table 4: Nei’s estimation of heterozygosity and F statistics He Ho Ht Dst Gst Fis Fit Fst D8S117 0.772 0.811 0.812 0.01 0.013 -0.05 0.001 0.049 D21S11 0.808 0.837 0.83 -0.009 -0.011 -0.006 0.021 0.027 D7S820 0.738 0.699 0.773 0.002 0.002 0.053 0.097 0.046 CSF1PO 0.671 0.661 0.7 0.001 0.002 0.014 0.055 0.042 D3S135 0.728 0.774 0.763 0.008 0.011 -0.063 -0.014 0.046 TH01 0.682 0.685 0.723 0.013 0.017 0.04 0.094 0.057 D13S31 0.739 0.768 0.78 0.012 0.015 -0.038 0.016 0.052 D16S53 0.716 0.610 0.778 0.029 0.037 0.148 0.216 0.08 D2S133 0.827 0.838 0.873 0.012 0.013 -0.014 0.039 0.053 D19S43 0.716 0.829 0.753 0.008 0.011 -0.026 0.025 0.05 VWA 0.753 0.767 0.779 -0.003 -0.004 -0.018 0.016 0.034 TPOX 0.668 0.581 0.711 0.013 0.018 0.13 0.182 0.061 D18S51 0.832 0.832 0.873 0.005 0.005 0 0.047 0.047 D5S818 0.720 0.753 0.74 -0.008 -0.01 -0.046 -0.017 0.027 FGA 0.814 0.812 0.851 0.004 0.005 0.016 0.059 0.044 Overall 0.787 0.74 0.787 0.006 0.008 0.008 0.055 0.048 Ho=Observed, Ht = Total Expected Heterozygosity, Gst = Analog of Fst, adjusted for bias, Dst=the genetic diversity among populations
population differences. According to Fst there are little and negligible differentiation between populations (for 10 loci Fst < 0.05). This phenomenon is relatively attributed to high rate of migration between these populations as earlier mentioned in the introduction section that said Isfahan and Fars are the two big cities in Iran and absorb people of surrounded cities and towns. Genetic relationship Results of Nei genetic identity and Nei genetic distance are presented in Table 5. Elements above and below diagonal are Nei genetic identity and NEI genetic distance, respectively. In most comparison a high identity was observed for all sets except for the Kerman-Unknown (0.006), KB-Yazd (0.045) and Kerman-Yazd (0.056). As seen in Table 5, identity of unknown probably was more similar to Isfahan and CH.B. Thus we think that the most of Unknown population were belongs to these two provinces. While the most genetic identity values were obtained for Isfahan-Yazd (1.023), Fars-Yazd (1.022) and Isfahan-Fars (1.005).
Table 5: Nei genetic identity & Nei genetic distance Isfahan Fars Hormozgan Kerman CH.B Unknown K.B Yazd Isfahan ---- 1.003 0.844 1.005 0.949 1.001 0.990 1.023 Fars -0.004 ---- 0.868 0.980 0.943 0.996 0.981 1.022 Hormozgan 0.169 0.142 ---- 0.820 0.820 0.851 0.881 0.825 Kerman 0.006 0.020 0.199 ---- 0.953 0.006 0.992 0.056 CH.B 0.052 0.058 0.199 0.048 ---- 0.925 0.964 0.944 Unknown -0.001 0.004 0.161 -0.006 0.712 ---- 0.946 0.083 K.B 0.010 0.019 0.127 0.008 0.037 0.055 ---- 0.045 Yazd -0.023 -0.022 0.193 -0.054 0.058 -0.080 -0.044 ---- Elements above diagonal are Nei genetic identity and elements below diagonal are Nei genetic distance

Ghaderi-Zefrehei et al. Euras J Anthropol 6(2):39-52, 2015
46
This result indicates that because of special geographic and ease trip between
Fars, Isfahan and CH.B, there are more migration between these cities. Surprisingly, between the Provinces with most Nei identity values (As mentioned above) had the lowest Nei distance indices. Unknown-Isfahan (-0.001) and Fars-Isfahan (-0.004) were the comparisons with the lowest Nei distance values. The most genetic distance was pertained to Hormozgan, that it had the large genetic distance value in comparison to other cities (Hormozgan in comparison to other cities was almost 0.1). Besides, in Table 6, the results of FST genetic distance are below diagonal elements. By pair-wise Fst comparison, also we determined significance status for each comparison. Among these, total Hormozgan comparison with other cities were significant (P < 0.05). Result of differentiation test shows that Hormozgan relative to other cities had a different genetic structure. Peoples living in adjacent provinces around Hormozgan are less tended to live in Hormozgan, and most of the Hormozgan population constitute of native and people from other cities. Also K.B with Isfahan, Fars and Unknown had significant differences (P < 0.05). Above diagonal elements in Table 6 are P-values for global test among these 8 populations. As presented in this table, none of the comparison were significant.
Table 6: Global test of differentiation among sample (P-value) (Above diagonal), Distance method: Pairwise FSTs differences (Below diagonal)
Isfahan Fars Hormozgan Kerman CH.B Unknown K.B Yazd Isfahan 0 0.137 0.865 0.696 0.87 0.836 0.834 0.847 Fars -0.002 0 0.65 0.657 0.307 0.259 0.58 0.609 Hormozgan 0.037* 0.035* 0 1 0.545 0.569 1 1 Kerman -0.005 0.004 0.054* 0 0.505 0.488 1 1 CH.B 0.010* 0.014* 0.055* 0.012 0 0.232 0.501 0.515 Unknown -0.005 -0.002 0.042* -0.004 0.020* 0 0.529 0.545 K.B 0.001 0.005 0.032* 0.002 0.010 0.013 0 1 Yazd -0.006 -0.005 0.046* -0.014 0.016 -0.020 -0.011 0
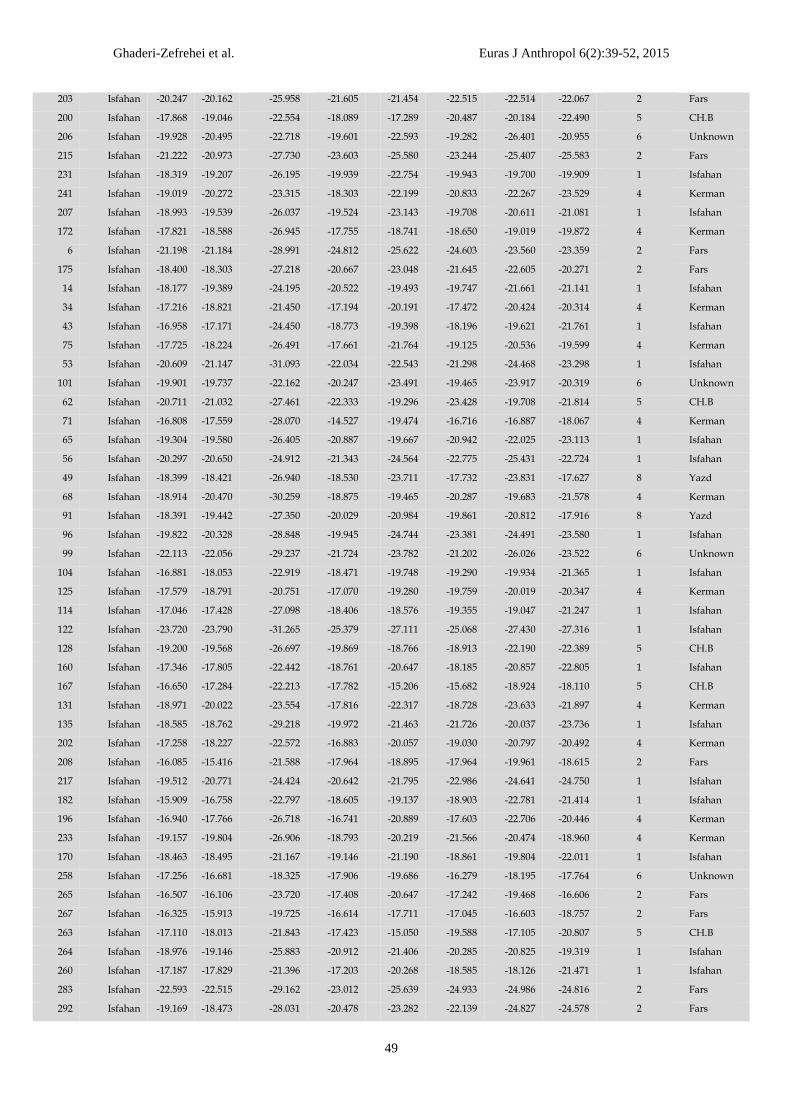
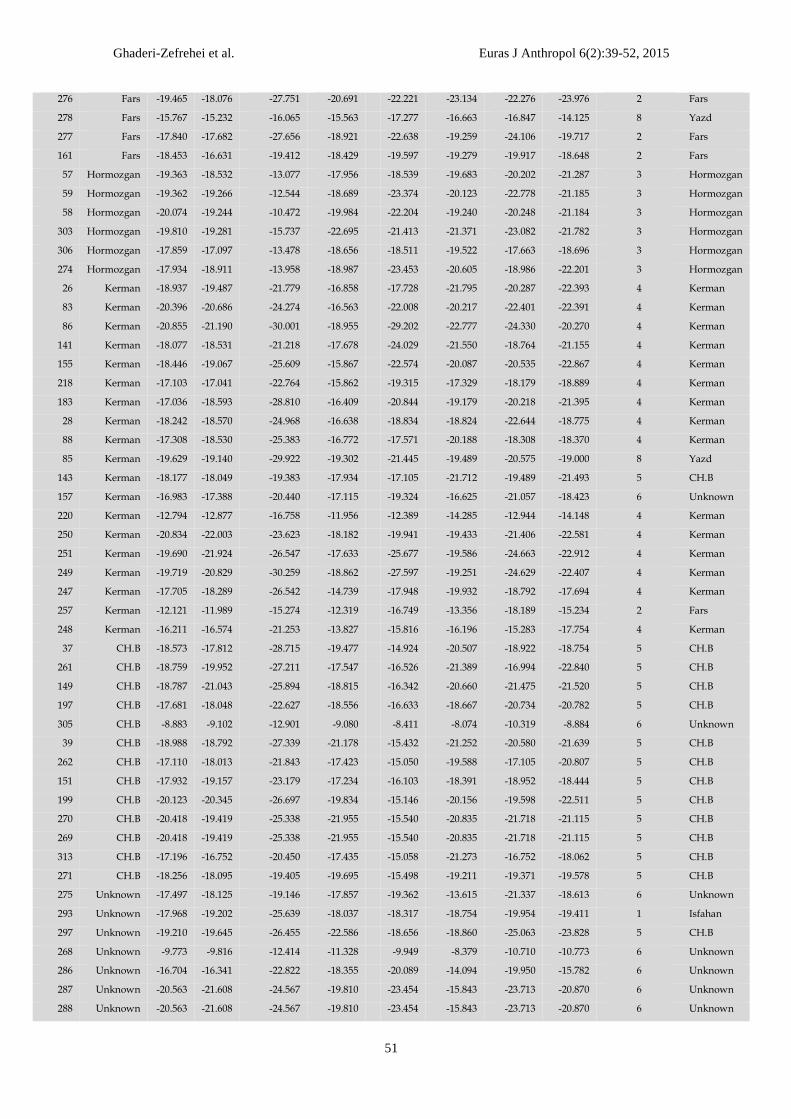
Population assignment Brief results of Iranian population assignment are depicted in Table 7. From 88 Isfahan Population samples, only 33 of them originally pertaining to Isfahan and the rest of them was from Kerman (17), Fars (15), CH.B (6) and Yazd (5). Extended population assignment table was in Appendix 1.
Table 7: Number of assignment pertaining to each district
Pop N Isfahan Fars Hormozgan Kerman CH.B. Unknown K.B. Yazd Isfahan 83 32 15 0 17 6 8 0 5 Fars 52 7 33 1 2 2 1 1 5 Hormozgan 6 0 0 6 0 0 0 0 0 Kerman 19 0 1 0 15 1 1 0 1 CH.B 13 0 0 0 0 12 1 0 0 Unknown 15 1 0 0 1 1 12 0 0 K.B 8 1 0 0 0 0 0 7 0 Yazd 7 0 0 0 0 0 0 0 7

Ghaderi-Zefrehei et al. Euras J Anthropol 6(2):39-52, 2015
47
Conclusion
Iranian population is an admixture of different ethnic ethno-religious groups (Persians, Lorish, Muslim, Jews, and Christians etc). Because Iranian population wasn’t studied thoroughly previously, thus we intended to characterize Iranian population in aspect of genetic diversity, genetic relationship and population assignment to have clear understanding about these Iranian subpopulation. Loci was in HWE equilibrium except for the D16S539. Different genetic diversity parameters such as mean number of alleles (MNA), number of effective allele (NE), private alleles (PA), allelic richness (AR), Shannon index (I), Fisher test (F), heterozygosity expected (He), heterozygosity observed (Ho) for each loci and each population. From genetic relationship point of view, different test was performed on the population (Nei genetic identity & Nei genetic distance, global test of differentiation among sample, Pairwise FSTs differences). In assignment test result showed that expect for big cities such as Fars and Isfahan, samples from each provinces pertained to themselves. The most immigrants were to Isfahan and Fars. The STR data of Iranian population from this study is available (sending a request e-mail to author). We strongly recommend that the genetic population test was performed on Iran’s capital (Tehran) and in the availability of instruments, STR information from the other important provinces of Iran (Tabriz, Sistan & Baluchistan, Mashhad, Kermanshah , …) would be gather to reveal the genetic background beyond total Iranian population.
Bibliography Akbari MT, Papiha SS, Roberts DF, Farhud DD. (1986) Population genetics of the Persians and
other peoples in Iran. Z Morphol Anthropol 76:197-217. Bahmanimehr A, Nikmanesh F, Yepiskoposyan L. (2014) Paternal genetic landscape of Zagros
region of Iran and its role in the gene flow in the populations of the region. Iran J Epidemiol 10(3):43-53.
Bi IZ, Maquet A, Baudoin J-P. (2003) Population genetic structure of wild Phaseolus lunatus (Fabaceae), with special reference to population sizes. Am J Bot 90(6):897-904.
Excoffier L, Laval G, Schneider S. (2005) Arlequin (version 3.0): an integrated software package for population genetics data analysis. Evol Bioinform 1-47.
Kalinowski ST. (2004) Counting alleles with rarefaction: private alleles and hierarchical sampling designs. Conserv Genet 5(4):539-543.
Kummee P, Tangkijvanich P, Poovorawan Y, Hirankarn N. (2007) Association of HLA‐DRB1* 13 and TNF‐α gene polymorphisms with clearance of chronic hepatitis B infection and risk of hepatocellular carcinoma in Thai population. J Viral Hepatitis 14(12):841-848.
Lahmi R, Vallian S. (2009) Genetic variation of informative short tandem repeat (STR) loci in an Iranian population. Iran J Biotechnol 7(3):137-141.
Mojtabavi NM, Vallian BS, Hashemzadeh Chaleshtori M. (2013) Genetic variation of D7S2420 Marker in five ethnic groups of the Iranian Population: A highly informative marker for molecular diagnosis of ARNSHL. Genetics in the 3rd millennium 11(1):2960-2969.
Moritz C, Dowling TE, Brown WM. (1987) Evolution of animal mitochondrial DNA: relevance for population biology and systematics. Annu Rev Ecol Syst 18:269-292.
Motamedi S, Hashemzadeh-Chaleshtori M, Mojtabavi NM, Teimori H. (2015) Genetic variation of D9S1837 Marker located at TMC1 gene in Iranian population. Journal of Shahrekord University of Medical Sciences 16(6):75-83.
Peakall R, Smouse PE. (2012) GenAlEx 6.5: genetic analysis in Excel. Population genetic software for teaching and research—an update. Bioinformatics 28(19):2537-2539.
Piry S, Alapetite A, Cornuet JM, Paetkau D, Baudouin L, Estoup A. (2004) GENECLASS2: a software for genetic assignment and first-generation migrant detection. J Hered 95(6):536-539.
Raymond M, Rousset F. (1995) GENEPOP (version 1.2): population genetics software for exact

Ghaderi-Zefrehei et al. Euras J Anthropol 6(2):39-52, 2015
48
tests and ecumenicism. J Hered 86(3):248-249. Senemar S, Doroudchi M, Pezeshki AM, Bazrgar M, Torab-Jahromi, Ghaderi A, (2009)
Frequency of cystathionine β-synthase 844INS68 polymorphism in Southern Iran. Mol Biol Rep 36:353-356.
Szpiech ZA, Jakobsson M, Rosenberg NA. (2008) ADZE: a rarefaction approach for counting alleles private to combinations of populations. Bioinformatics 24(21):2498-2504.
Vallian S, Moeini H. (2006) Genotyping of five polymorphic STR loci in Iranian province of Isfahan. Journal of Sciences, Islamic Republic of Iran 17(2):113-117.
Yeh FC, Yang RC, Boyle TB, Ye ZH, Mao JX. (1997) POPGENE, the user-friendly shareware for population genetic analysis. Canada: University of Alberta 10.
Appendix Table 1: Assignment values Sample Pop Isfahan Fars Hormozgan Kerman CH.B Unknown K.B Yazd Assigned
Population
4 Isfahan -21.089 -20.926 -28.276 -24.810 -25.284 -22.972 -26.820 -21.812 2 Fars
173 Isfahan -21.353 -21.088 -27.308 -24.553 -21.919 -22.117 -23.674 -21.247 2 Fars
12 Isfahan -18.568 -20.379 -27.709 -19.303 -22.806 -19.630 -20.308 -21.555 1 Isfahan
18 Isfahan -17.877 -18.662 -20.526 -18.348 -18.473 -22.093 -18.904 -22.493 1 Isfahan
20 Isfahan -18.798 -19.616 -22.769 -20.487 -22.588 -23.410 -25.181 -25.231 1 Isfahan
35 Isfahan -20.144 -19.937 -23.052 -19.281 -24.673 -22.259 -22.524 -23.284 4 Kerman
47 Isfahan -16.772 -16.850 -27.317 -18.152 -16.489 -16.358 -18.320 -16.492 6 Unknown
32 Isfahan -17.059 -16.572 -25.861 -18.537 -19.305 -17.944 -19.780 -18.055 2 Fars
40 Isfahan -17.445 -17.925 -18.121 -20.082 -21.233 -20.366 -19.973 -20.620 1 Isfahan
50 Isfahan -16.875 -17.323 -28.465 -17.811 -17.989 -18.706 -19.356 -20.474 1 Isfahan
72 Isfahan -19.831 -19.342 -29.128 -21.699 -19.095 -22.611 -21.201 -21.715 5 CH.B
60 Isfahan -18.929 -19.816 -25.246 -22.371 -22.721 -22.971 -22.820 -22.872 1 Isfahan
69 Isfahan -18.929 -19.816 -25.246 -22.371 -22.721 -22.971 -22.820 -22.872 1 Isfahan
63 Isfahan -20.441 -20.656 -24.098 -21.694 -21.587 -20.170 -23.729 -21.441 6 Unknown
54 Isfahan -18.826 -20.111 -22.179 -22.121 -20.839 -22.417 -22.848 -25.897 1 Isfahan
66 Isfahan -16.310 -17.079 -26.700 -15.961 -18.579 -16.592 -16.239 -14.432 8 Yazd
89 Isfahan -17.515 -17.569 -20.156 -18.284 -21.884 -17.047 -23.087 -22.238 6 Unknown
92 Isfahan -18.733 -18.898 -22.623 -19.454 -22.272 -20.295 -18.780 -18.515 8 Yazd
97 Isfahan -18.438 -18.479 -27.843 -19.612 -21.384 -19.445 -25.207 -19.513 1 Isfahan
102 Isfahan -19.160 -18.658 -22.473 -17.792 -22.061 -18.453 -26.054 -19.796 4 Kerman
123 Isfahan -17.068 -17.704 -27.690 -18.824 -18.281 -18.658 -19.156 -18.224 1 Isfahan
112 Isfahan -19.001 -19.266 -20.697 -20.411 -21.937 -23.653 -23.225 -26.744 1 Isfahan
115 Isfahan -20.138 -20.276 -27.859 -18.873 -22.646 -20.184 -24.326 -21.219 4 Kerman
126 Isfahan -18.716 -18.430 -25.934 -20.230 -22.601 -18.511 -21.503 -20.703 2 Fars
132 Isfahan -18.722 -20.257 -23.891 -20.870 -21.697 -22.463 -22.294 -24.479 1 Isfahan
144 Isfahan -18.277 -18.762 -23.611 -23.013 -21.717 -20.979 -22.908 -21.344 1 Isfahan
168 Isfahan -17.150 -17.114 -21.656 -18.780 -19.835 -18.336 -21.894 -20.374 2 Fars
158 Isfahan -19.380 -18.744 -26.190 -17.996 -20.984 -20.350 -21.093 -19.939 4 Kerman
165 Isfahan -20.947 -22.240 -27.474 -20.919 -25.205 -20.825 -24.350 -23.961 6 Unknown
129 Isfahan -20.080 -19.971 -28.547 -22.114 -21.231 -24.762 -21.785 -26.013 2 Fars
136 Isfahan -20.126 -21.043 -28.782 -21.781 -20.853 -22.533 -20.463 -21.703 1 Isfahan
194 Isfahan -18.980 -19.797 -22.517 -18.775 -20.711 -19.950 -19.220 -22.344 4 Kerman
189 Isfahan -18.048 -19.325 -28.308 -17.938 -18.171 -20.147 -20.001 -19.627 4 Kerman
Ghaderi-Zefrehei et al. Euras J Anthropol 6(2):39-52, 2015
49
203 Isfahan -20.247 -20.162 -25.958 -21.605 -21.454 -22.515 -22.514 -22.067 2 Fars
200 Isfahan -17.868 -19.046 -22.554 -18.089 -17.289 -20.487 -20.184 -22.490 5 CH.B
206 Isfahan -19.928 -20.495 -22.718 -19.601 -22.593 -19.282 -26.401 -20.955 6 Unknown
215 Isfahan -21.222 -20.973 -27.730 -23.603 -25.580 -23.244 -25.407 -25.583 2 Fars
231 Isfahan -18.319 -19.207 -26.195 -19.939 -22.754 -19.943 -19.700 -19.909 1 Isfahan
241 Isfahan -19.019 -20.272 -23.315 -18.303 -22.199 -20.833 -22.267 -23.529 4 Kerman
207 Isfahan -18.993 -19.539 -26.037 -19.524 -23.143 -19.708 -20.611 -21.081 1 Isfahan
172 Isfahan -17.821 -18.588 -26.945 -17.755 -18.741 -18.650 -19.019 -19.872 4 Kerman
6 Isfahan -21.198 -21.184 -28.991 -24.812 -25.622 -24.603 -23.560 -23.359 2 Fars
175 Isfahan -18.400 -18.303 -27.218 -20.667 -23.048 -21.645 -22.605 -20.271 2 Fars
14 Isfahan -18.177 -19.389 -24.195 -20.522 -19.493 -19.747 -21.661 -21.141 1 Isfahan
34 Isfahan -17.216 -18.821 -21.450 -17.194 -20.191 -17.472 -20.424 -20.314 4 Kerman
43 Isfahan -16.958 -17.171 -24.450 -18.773 -19.398 -18.196 -19.621 -21.761 1 Isfahan
75 Isfahan -17.725 -18.224 -26.491 -17.661 -21.764 -19.125 -20.536 -19.599 4 Kerman
53 Isfahan -20.609 -21.147 -31.093 -22.034 -22.543 -21.298 -24.468 -23.298 1 Isfahan
101 Isfahan -19.901 -19.737 -22.162 -20.247 -23.491 -19.465 -23.917 -20.319 6 Unknown
62 Isfahan -20.711 -21.032 -27.461 -22.333 -19.296 -23.428 -19.708 -21.814 5 CH.B
71 Isfahan -16.808 -17.559 -28.070 -14.527 -19.474 -16.716 -16.887 -18.067 4 Kerman
65 Isfahan -19.304 -19.580 -26.405 -20.887 -19.667 -20.942 -22.025 -23.113 1 Isfahan
56 Isfahan -20.297 -20.650 -24.912 -21.343 -24.564 -22.775 -25.431 -22.724 1 Isfahan
49 Isfahan -18.399 -18.421 -26.940 -18.530 -23.711 -17.732 -23.831 -17.627 8 Yazd
68 Isfahan -18.914 -20.470 -30.259 -18.875 -19.465 -20.287 -19.683 -21.578 4 Kerman
91 Isfahan -18.391 -19.442 -27.350 -20.029 -20.984 -19.861 -20.812 -17.916 8 Yazd
96 Isfahan -19.822 -20.328 -28.848 -19.945 -24.744 -23.381 -24.491 -23.580 1 Isfahan
99 Isfahan -22.113 -22.056 -29.237 -21.724 -23.782 -21.202 -26.026 -23.522 6 Unknown
104 Isfahan -16.881 -18.053 -22.919 -18.471 -19.748 -19.290 -19.934 -21.365 1 Isfahan
125 Isfahan -17.579 -18.791 -20.751 -17.070 -19.280 -19.759 -20.019 -20.347 4 Kerman
114 Isfahan -17.046 -17.428 -27.098 -18.406 -18.576 -19.355 -19.047 -21.247 1 Isfahan
122 Isfahan -23.720 -23.790 -31.265 -25.379 -27.111 -25.068 -27.430 -27.316 1 Isfahan
128 Isfahan -19.200 -19.568 -26.697 -19.869 -18.766 -18.913 -22.190 -22.389 5 CH.B
160 Isfahan -17.346 -17.805 -22.442 -18.761 -20.647 -18.185 -20.857 -22.805 1 Isfahan
167 Isfahan -16.650 -17.284 -22.213 -17.782 -15.206 -15.682 -18.924 -18.110 5 CH.B
131 Isfahan -18.971 -20.022 -23.554 -17.816 -22.317 -18.728 -23.633 -21.897 4 Kerman
135 Isfahan -18.585 -18.762 -29.218 -19.972 -21.463 -21.726 -20.037 -23.736 1 Isfahan
202 Isfahan -17.258 -18.227 -22.572 -16.883 -20.057 -19.030 -20.797 -20.492 4 Kerman
208 Isfahan -16.085 -15.416 -21.588 -17.964 -18.895 -17.964 -19.961 -18.615 2 Fars
217 Isfahan -19.512 -20.771 -24.424 -20.642 -21.795 -22.986 -24.641 -24.750 1 Isfahan
182 Isfahan -15.909 -16.758 -22.797 -18.605 -19.137 -18.903 -22.781 -21.414 1 Isfahan
196 Isfahan -16.940 -17.766 -26.718 -16.741 -20.889 -17.603 -22.706 -20.446 4 Kerman
233 Isfahan -19.157 -19.804 -26.906 -18.793 -20.219 -21.566 -20.474 -18.960 4 Kerman
170 Isfahan -18.463 -18.495 -21.167 -19.146 -21.190 -18.861 -19.804 -22.011 1 Isfahan
258 Isfahan -17.256 -16.681 -18.325 -17.906 -19.686 -16.279 -18.195 -17.764 6 Unknown
265 Isfahan -16.507 -16.106 -23.720 -17.408 -20.647 -17.242 -19.468 -16.606 2 Fars
267 Isfahan -16.325 -15.913 -19.725 -16.614 -17.711 -17.045 -16.603 -18.757 2 Fars
263 Isfahan -17.110 -18.013 -21.843 -17.423 -15.050 -19.588 -17.105 -20.807 5 CH.B
264 Isfahan -18.976 -19.146 -25.883 -20.912 -21.406 -20.285 -20.825 -19.319 1 Isfahan
260 Isfahan -17.187 -17.829 -21.396 -17.203 -20.268 -18.585 -18.126 -21.471 1 Isfahan
283 Isfahan -22.593 -22.515 -29.162 -23.012 -25.639 -24.933 -24.986 -24.816 2 Fars
292 Isfahan -19.169 -18.473 -28.031 -20.478 -23.282 -22.139 -24.827 -24.578 2 Fars

Ghaderi-Zefrehei et al. Euras J Anthropol 6(2):39-52, 2015
50
266 Isfahan -19.279 -19.709 -25.478 -19.954 -21.614 -20.674 -22.876 -18.065 8 Yazd
186 Fars -18.013 -17.246 -26.332 -18.457 -19.573 -20.262 -20.752 -18.939 2 Fars
1 Fars -18.197 -17.147 -24.572 -20.484 -17.652 -18.700 -21.963 -19.335 2 Fars
7 Fars -21.305 -21.268 -26.162 -23.667 -19.570 -21.426 -21.496 -22.937 5 CH.B
29 Fars -18.014 -17.737 -20.973 -23.010 -21.139 -19.435 -21.415 -23.660 2 Fars
10 Fars -17.164 -16.930 -22.878 -17.349 -20.211 -20.026 -18.447 -21.009 2 Fars
76 Fars -16.770 -15.375 -22.723 -17.721 -19.775 -18.820 -20.708 -18.654 2 Fars
80 Fars -19.148 -19.218 -21.445 -17.265 -20.389 -21.289 -23.973 -22.566 4 Kerman
108 Fars -21.822 -20.497 -27.299 -23.818 -24.863 -23.596 -23.514 -24.469 2 Fars
105 Fars -17.593 -17.615 -27.833 -19.168 -21.162 -20.516 -22.271 -19.511 1 Isfahan
138 Fars -16.772 -16.150 -21.940 -19.247 -16.159 -17.413 -18.399 -20.141 2 Fars
146 Fars -18.892 -18.452 -25.817 -20.118 -19.814 -20.464 -19.371 -19.617 2 Fars
152 Fars -19.402 -19.742 -22.070 -20.543 -21.033 -20.975 -22.657 -23.006 1 Isfahan
209 Fars -18.889 -18.665 -27.827 -19.211 -22.306 -19.007 -20.843 -22.650 2 Fars
212 Fars -17.027 -16.560 -22.748 -17.660 -20.940 -15.672 -18.945 -18.599 6 Unknown
238 Fars -16.869 -16.286 -21.806 -18.097 -17.816 -17.524 -19.192 -19.046 2 Fars
243 Fars -19.030 -18.831 -23.751 -18.894 -21.934 -18.711 -21.702 -16.310 8 Yazd
188 Fars -17.760 -16.986 -23.299 -18.416 -22.081 -18.776 -24.190 -19.136 2 Fars
3 Fars -16.811 -16.765 -24.424 -16.767 -19.704 -18.294 -19.206 -21.173 2 Fars
9 Fars -19.000 -17.486 -23.970 -19.993 -22.283 -19.849 -20.639 -22.217 2 Fars
31 Fars -19.200 -18.379 -26.213 -19.226 -23.022 -20.319 -22.736 -22.152 2 Fars
11 Fars -20.993 -19.802 -25.253 -23.487 -19.971 -19.855 -22.267 -19.229 8 Yazd
25 Fars -17.275 -16.936 -24.924 -17.856 -19.382 -20.495 -17.603 -17.812 2 Fars
79 Fars -18.874 -17.870 -30.799 -21.395 -20.227 -19.224 -18.956 -22.553 2 Fars
82 Fars -20.001 -19.674 -25.128 -22.382 -20.172 -20.994 -20.984 -20.190 2 Fars
111 Fars -18.471 -17.733 -19.461 -18.712 -21.346 -17.773 -24.237 -17.491 8 Yazd
107 Fars -19.728 -19.270 -23.769 -21.432 -24.442 -21.144 -21.053 -23.271 2 Fars
140 Fars -18.340 -17.428 -21.292 -20.452 -21.609 -18.368 -22.866 -20.435 2 Fars
164 Fars -20.935 -21.516 -24.973 -22.218 -21.137 -23.175 -21.269 -23.014 1 Isfahan
148 Fars -24.463 -22.890 -31.788 -26.872 -28.226 -24.145 -27.723 -26.918 2 Fars
154 Fars -19.266 -18.324 -14.399 -19.889 -20.988 -20.999 -20.508 -20.085 3 Hormozgan
211 Fars -23.325 -22.639 -27.873 -23.869 -26.882 -24.672 -24.491 -27.375 2 Fars
214 Fars -17.357 -18.011 -20.463 -18.851 -20.045 -20.832 -23.007 -24.772 1 Isfahan
227 Fars -18.600 -17.740 -24.572 -18.874 -26.043 -21.059 -21.259 -22.173 2 Fars
240 Fars -16.372 -16.516 -24.366 -17.724 -19.742 -18.125 -21.906 -17.025 1 Isfahan
245 Fars -18.095 -17.522 -21.956 -19.780 -17.284 -20.786 -18.780 -20.889 5 CH.B
255 Fars -17.285 -16.265 -28.192 -18.847 -18.445 -17.605 -19.639 -17.462 2 Fars
256 Fars -19.329 -18.501 -26.357 -20.490 -20.540 -18.834 -22.565 -20.386 2 Fars
273 Fars -19.674 -18.867 -23.132 -20.483 -23.213 -19.328 -24.338 -22.770 2 Fars
254 Fars -17.285 -16.265 -28.192 -18.847 -18.445 -17.605 -19.639 -17.462 2 Fars
252 Fars -20.063 -18.574 -25.340 -20.728 -24.332 -22.911 -23.963 -22.359 2 Fars
272 Fars -20.910 -19.623 -26.065 -24.031 -25.194 -24.499 -26.975 -26.578 2 Fars
284 Fars -20.910 -19.623 -26.065 -24.031 -25.194 -24.499 -26.975 -26.578 2 Fars
295 Fars -17.705 -18.289 -26.542 -14.739 -17.948 -19.932 -18.792 -17.694 4 Kerman
290 Fars -19.041 -19.730 -32.621 -21.583 -23.656 -23.073 -22.866 -23.125 1 Isfahan
296 Fars -20.065 -18.654 -25.144 -20.626 -19.655 -21.880 -21.603 -21.083 2 Fars
301 Fars -20.533 -19.390 -28.672 -22.020 -24.179 -19.811 -24.498 -19.321 8 Yazd
224 Fars -16.597 -17.365 -22.195 -18.360 -20.567 -17.341 -18.612 -18.696 1 Isfahan
309 Fars -6.353 -6.002 -6.896 -6.398 -6.449 -8.715 -4.867 -6.321 7 K.B
Ghaderi-Zefrehei et al. Euras J Anthropol 6(2):39-52, 2015
51
276 Fars -19.465 -18.076 -27.751 -20.691 -22.221 -23.134 -22.276 -23.976 2 Fars
278 Fars -15.767 -15.232 -16.065 -15.563 -17.277 -16.663 -16.847 -14.125 8 Yazd
277 Fars -17.840 -17.682 -27.656 -18.921 -22.638 -19.259 -24.106 -19.717 2 Fars
161 Fars -18.453 -16.631 -19.412 -18.429 -19.597 -19.279 -19.917 -18.648 2 Fars
57 Hormozgan -19.363 -18.532 -13.077 -17.956 -18.539 -19.683 -20.202 -21.287 3 Hormozgan
59 Hormozgan -19.362 -19.266 -12.544 -18.689 -23.374 -20.123 -22.778 -21.185 3 Hormozgan
58 Hormozgan -20.074 -19.244 -10.472 -19.984 -22.204 -19.240 -20.248 -21.184 3 Hormozgan
303 Hormozgan -19.810 -19.281 -15.737 -22.695 -21.413 -21.371 -23.082 -21.782 3 Hormozgan
306 Hormozgan -17.859 -17.097 -13.478 -18.656 -18.511 -19.522 -17.663 -18.696 3 Hormozgan
274 Hormozgan -17.934 -18.911 -13.958 -18.987 -23.453 -20.605 -18.986 -22.201 3 Hormozgan
26 Kerman -18.937 -19.487 -21.779 -16.858 -17.728 -21.795 -20.287 -22.393 4 Kerman
83 Kerman -20.396 -20.686 -24.274 -16.563 -22.008 -20.217 -22.401 -22.391 4 Kerman
86 Kerman -20.855 -21.190 -30.001 -18.955 -29.202 -22.777 -24.330 -20.270 4 Kerman
141 Kerman -18.077 -18.531 -21.218 -17.678 -24.029 -21.550 -18.764 -21.155 4 Kerman
155 Kerman -18.446 -19.067 -25.609 -15.867 -22.574 -20.087 -20.535 -22.867 4 Kerman
218 Kerman -17.103 -17.041 -22.764 -15.862 -19.315 -17.329 -18.179 -18.889 4 Kerman
183 Kerman -17.036 -18.593 -28.810 -16.409 -20.844 -19.179 -20.218 -21.395 4 Kerman
28 Kerman -18.242 -18.570 -24.968 -16.638 -18.834 -18.824 -22.644 -18.775 4 Kerman
88 Kerman -17.308 -18.530 -25.383 -16.772 -17.571 -20.188 -18.308 -18.370 4 Kerman
85 Kerman -19.629 -19.140 -29.922 -19.302 -21.445 -19.489 -20.575 -19.000 8 Yazd
143 Kerman -18.177 -18.049 -19.383 -17.934 -17.105 -21.712 -19.489 -21.493 5 CH.B
157 Kerman -16.983 -17.388 -20.440 -17.115 -19.324 -16.625 -21.057 -18.423 6 Unknown
220 Kerman -12.794 -12.877 -16.758 -11.956 -12.389 -14.285 -12.944 -14.148 4 Kerman
250 Kerman -20.834 -22.003 -23.623 -18.182 -19.941 -19.433 -21.406 -22.581 4 Kerman
251 Kerman -19.690 -21.924 -26.547 -17.633 -25.677 -19.586 -24.663 -22.912 4 Kerman
249 Kerman -19.719 -20.829 -30.259 -18.862 -27.597 -19.251 -24.629 -22.407 4 Kerman
247 Kerman -17.705 -18.289 -26.542 -14.739 -17.948 -19.932 -18.792 -17.694 4 Kerman
257 Kerman -12.121 -11.989 -15.274 -12.319 -16.749 -13.356 -18.189 -15.234 2 Fars
248 Kerman -16.211 -16.574 -21.253 -13.827 -15.816 -16.196 -15.283 -17.754 4 Kerman
37 CH.B -18.573 -17.812 -28.715 -19.477 -14.924 -20.507 -18.922 -18.754 5 CH.B
261 CH.B -18.759 -19.952 -27.211 -17.547 -16.526 -21.389 -16.994 -22.840 5 CH.B
149 CH.B -18.787 -21.043 -25.894 -18.815 -16.342 -20.660 -21.475 -21.520 5 CH.B
197 CH.B -17.681 -18.048 -22.627 -18.556 -16.633 -18.667 -20.734 -20.782 5 CH.B
305 CH.B -8.883 -9.102 -12.901 -9.080 -8.411 -8.074 -10.319 -8.884 6 Unknown
39 CH.B -18.988 -18.792 -27.339 -21.178 -15.432 -21.252 -20.580 -21.639 5 CH.B
262 CH.B -17.110 -18.013 -21.843 -17.423 -15.050 -19.588 -17.105 -20.807 5 CH.B
151 CH.B -17.932 -19.157 -23.179 -17.234 -16.103 -18.391 -18.952 -18.444 5 CH.B
199 CH.B -20.123 -20.345 -26.697 -19.834 -15.146 -20.156 -19.598 -22.511 5 CH.B
270 CH.B -20.418 -19.419 -25.338 -21.955 -15.540 -20.835 -21.718 -21.115 5 CH.B
269 CH.B -20.418 -19.419 -25.338 -21.955 -15.540 -20.835 -21.718 -21.115 5 CH.B
313 CH.B -17.196 -16.752 -20.450 -17.435 -15.058 -21.273 -16.752 -18.062 5 CH.B
271 CH.B -18.256 -18.095 -19.405 -19.695 -15.498 -19.211 -19.371 -19.578 5 CH.B
275 Unknown -17.497 -18.125 -19.146 -17.857 -19.362 -13.615 -21.337 -18.613 6 Unknown
293 Unknown -17.968 -19.202 -25.639 -18.037 -18.317 -18.754 -19.954 -19.411 1 Isfahan
297 Unknown -19.210 -19.645 -26.455 -22.586 -18.656 -18.860 -25.063 -23.828 5 CH.B
268 Unknown -9.773 -9.816 -12.414 -11.328 -9.949 -8.379 -10.710 -10.773 6 Unknown
286 Unknown -16.704 -16.341 -22.822 -18.355 -20.089 -14.094 -19.950 -15.782 6 Unknown
287 Unknown -20.563 -21.608 -24.567 -19.810 -23.454 -15.843 -23.713 -20.870 6 Unknown
288 Unknown -20.563 -21.608 -24.567 -19.810 -23.454 -15.843 -23.713 -20.870 6 Unknown

Ghaderi-Zefrehei et al. Euras J Anthropol 6(2):39-52, 2015
52
314 Unknown -15.677 -16.966 -17.621 -16.343 -18.904 -13.861 -15.025 -17.055 6 Unknown
304 Unknown -17.256 -16.681 -18.325 -17.906 -19.686 -16.279 -18.195 -17.764 6 Unknown
282 Unknown -18.940 -19.250 -25.059 -18.724 -23.149 -18.465 -25.924 -19.560 6 Unknown
281 Unknown -18.993 -17.969 -29.644 -19.675 -19.944 -15.911 -18.904 -17.213 6 Unknown
280 Unknown -18.567 -19.200 -25.272 -16.792 -21.117 -19.026 -23.381 -21.824 4 Kerman
289 Unknown -21.683 -21.613 -29.019 -23.502 -25.678 -19.193 -27.700 -21.298 6 Unknown
291 Unknown -19.548 -18.476 -26.468 -21.759 -24.249 -16.667 -23.207 -19.622 6 Unknown
308 Unknown -19.079 -19.189 -23.605 -19.754 -22.446 -17.521 -23.843 -22.712 6 Unknown
15 K.B -17.393 -17.113 -17.503 -17.621 -17.460 -17.104 -15.006 -18.430 7 K.B
221 K.B -21.478 -22.134 -29.098 -21.819 -22.056 -22.080 -17.410 -25.034 7 K.B
235 K.B -20.107 -19.009 -23.424 -19.901 -22.840 -21.844 -16.649 -20.673 7 K.B
17 K.B -19.577 -19.456 -26.185 -19.996 -19.569 -21.505 -15.542 -18.678 7 K.B
223 K.B -15.734 -16.330 -23.225 -19.000 -17.285 -19.037 -15.743 -20.909 1 Isfahan
237 K.B -19.385 -20.798 -28.745 -18.104 -19.308 -21.063 -15.552 -19.127 7 K.B
302 K.B -18.505 -19.578 -27.246 -18.207 -18.096 -22.337 -14.746 -19.967 7 K.B
300 K.B -20.442 -20.116 -22.082 -20.500 -19.279 -23.183 -14.330 -20.840 7 K.B
44 Yazd -20.223 -20.269 -28.845 -20.851 -23.928 -21.249 -21.827 -16.861 8 Yazd
191 Yazd -16.734 -16.794 -22.991 -16.569 -16.103 -17.364 -17.195 -15.930 8 Yazd
228 Yazd -23.179 -22.570 -25.401 -25.344 -26.782 -23.524 -28.919 -18.177 8 Yazd
46 Yazd -19.096 -18.450 -30.928 -21.825 -21.558 -19.631 -22.844 -16.863 8 Yazd
193 Yazd -18.923 -19.580 -23.603 -16.909 -19.623 -19.081 -19.182 -15.576 8 Yazd
230 Yazd -19.333 -18.830 -25.491 -19.858 -22.568 -18.283 -21.053 -16.953 8 Yazd
246 Yazd -16.649 -17.803 -22.644 -15.198 -15.762 -17.795 -15.738 -12.551 8 Yazd